Wall Lane, AZ Map & Demographics
Wall Lane Map
Wall Lane Overview
$17,145
PER CAPITA INCOME
$90,357
AVG FAMILY INCOME
$44,091
AVG HOUSEHOLD INCOME
0.33
INEQUALITY / GINI INDEX
312
TOTAL POPULATION
140
MALE POPULATION
172
FEMALE POPULATION
81.40
MALES / 100 FEMALES
122.86
FEMALES / 100 MALES
26.3
MEDIAN AGE
4.7
AVG FAMILY SIZE
3.2
AVG HOUSEHOLD SIZE
125
LABOR FORCE [ PEOPLE ]
65.8%
PERCENT IN LABOR FORCE
13.6%
UNEMPLOYMENT RATE
Income in Wall Lane
Income Overview in Wall Lane
Per Capita Income in Wall Lane is $17,145, while median incomes of families and households are $90,357 and $44,091 respectively.
| Characteristic | Number | Measure |
| Per Capita Income | 312 | $17,145 |
| Median Family Income | 58 | $90,357 |
| Mean Family Income | 58 | $70,598 |
| Median Household Income | 96 | $44,091 |
| Mean Household Income | 96 | $56,057 |
| Income Deficit | 58 | $0 |
| Wage / Income Gap (%) | 312 | 0.00% |
| Wage / Income Gap ($) | 312 | 100.00¢ per $1 |
| Gini / Inequality Index | 312 | 0.33 |
Earnings by Sex in Wall Lane
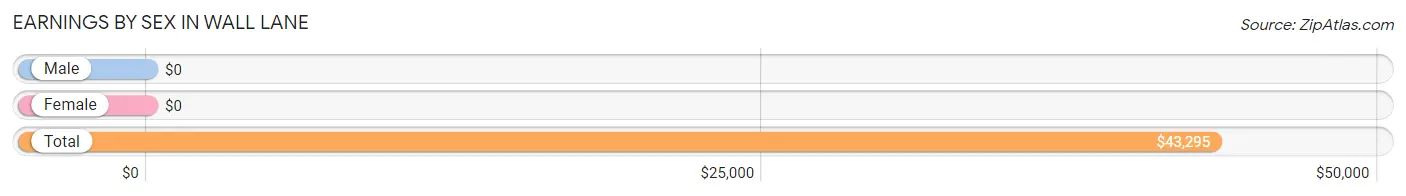
| Sex | Number | Average Earnings |
| Male | 72 (65.4%) | $0 |
| Female | 38 (34.5%) | $0 |
| Total | 110 (100.0%) | $43,295 |
Earnings by Sex by Income Bracket in Wall Lane
The most common earnings brackets in Wall Lane are $10,000 to $12,499 for men (25 | 34.7%) and $65,000 to $74,999 for women (22 | 57.9%).
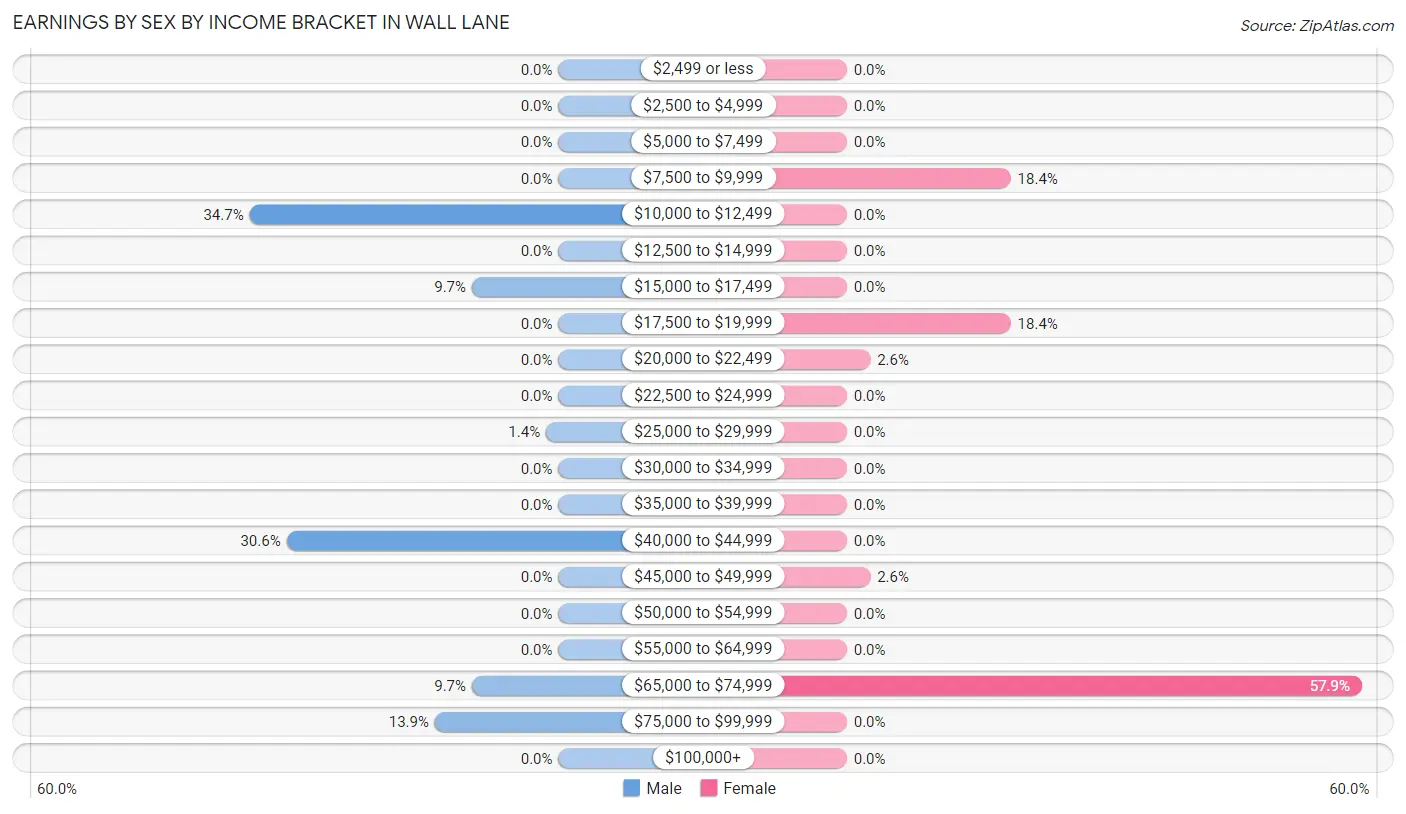
| Income | Male | Female |
| $2,499 or less | 0 (0.0%) | 0 (0.0%) |
| $2,500 to $4,999 | 0 (0.0%) | 0 (0.0%) |
| $5,000 to $7,499 | 0 (0.0%) | 0 (0.0%) |
| $7,500 to $9,999 | 0 (0.0%) | 7 (18.4%) |
| $10,000 to $12,499 | 25 (34.7%) | 0 (0.0%) |
| $12,500 to $14,999 | 0 (0.0%) | 0 (0.0%) |
| $15,000 to $17,499 | 7 (9.7%) | 0 (0.0%) |
| $17,500 to $19,999 | 0 (0.0%) | 7 (18.4%) |
| $20,000 to $22,499 | 0 (0.0%) | 1 (2.6%) |
| $22,500 to $24,999 | 0 (0.0%) | 0 (0.0%) |
| $25,000 to $29,999 | 1 (1.4%) | 0 (0.0%) |
| $30,000 to $34,999 | 0 (0.0%) | 0 (0.0%) |
| $35,000 to $39,999 | 0 (0.0%) | 0 (0.0%) |
| $40,000 to $44,999 | 22 (30.6%) | 0 (0.0%) |
| $45,000 to $49,999 | 0 (0.0%) | 1 (2.6%) |
| $50,000 to $54,999 | 0 (0.0%) | 0 (0.0%) |
| $55,000 to $64,999 | 0 (0.0%) | 0 (0.0%) |
| $65,000 to $74,999 | 7 (9.7%) | 22 (57.9%) |
| $75,000 to $99,999 | 10 (13.9%) | 0 (0.0%) |
| $100,000+ | 0 (0.0%) | 0 (0.0%) |
| Total | 72 (100.0%) | 38 (100.0%) |
Earnings by Sex by Educational Attainment in Wall Lane
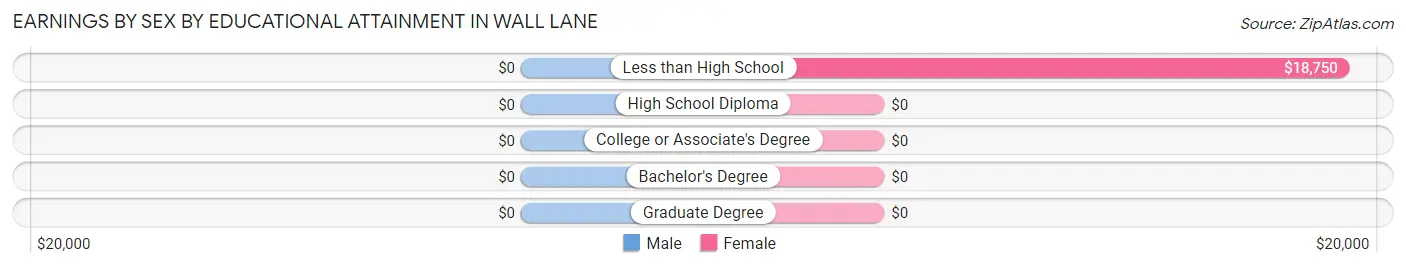
| Educational Attainment | Male Income | Female Income |
| Less than High School | - | - |
| High School Diploma | - | - |
| College or Associate's Degree | - | - |
| Bachelor's Degree | - | - |
| Graduate Degree | - | - |
| Total | - | - |
Family Income in Wall Lane
Family Income Brackets in Wall Lane
According to the Wall Lane family income data, there are 23 families falling into the $100,000 to $149,999 income range, which is the most common income bracket and makes up 39.7% of all families.
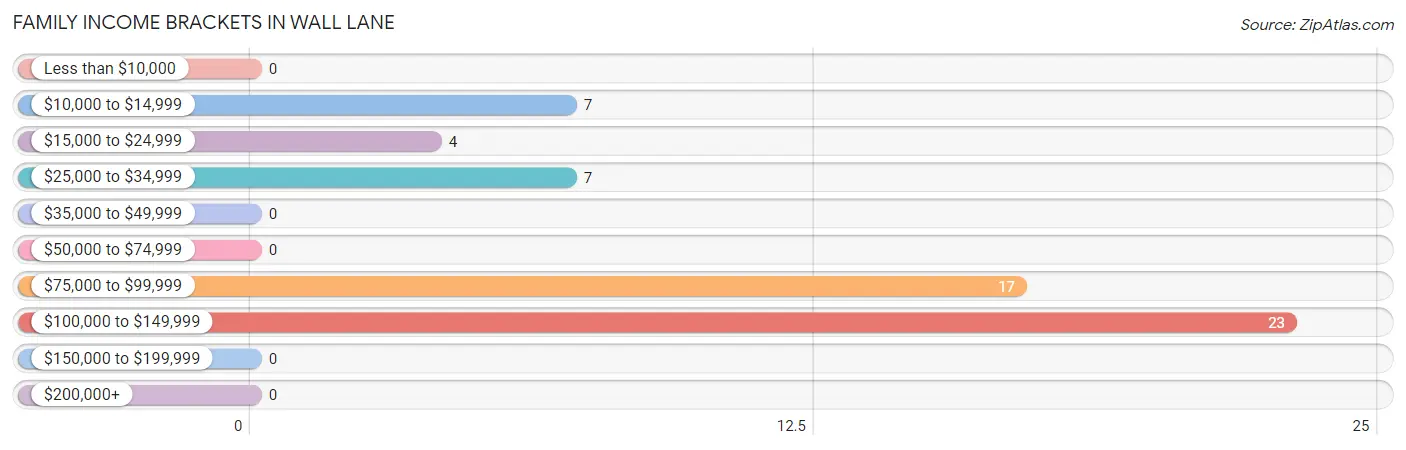
| Income Bracket | # Families | % Families |
| Less than $10,000 | 0 | 0.0% |
| $10,000 to $14,999 | 7 | 12.1% |
| $15,000 to $24,999 | 4 | 6.9% |
| $25,000 to $34,999 | 7 | 12.1% |
| $35,000 to $49,999 | 0 | 0.0% |
| $50,000 to $74,999 | 0 | 0.0% |
| $75,000 to $99,999 | 17 | 29.3% |
| $100,000 to $149,999 | 23 | 39.7% |
| $150,000 to $199,999 | 0 | 0.0% |
| $200,000+ | 0 | 0.0% |
Family Income by Famaliy Size in Wall Lane
2-person families (21 | 36.2%) account for the highest median family income in Wall Lane with $76,625 per family, while 2-person families (21 | 36.2%) have the highest median income of $38,312 per family member.
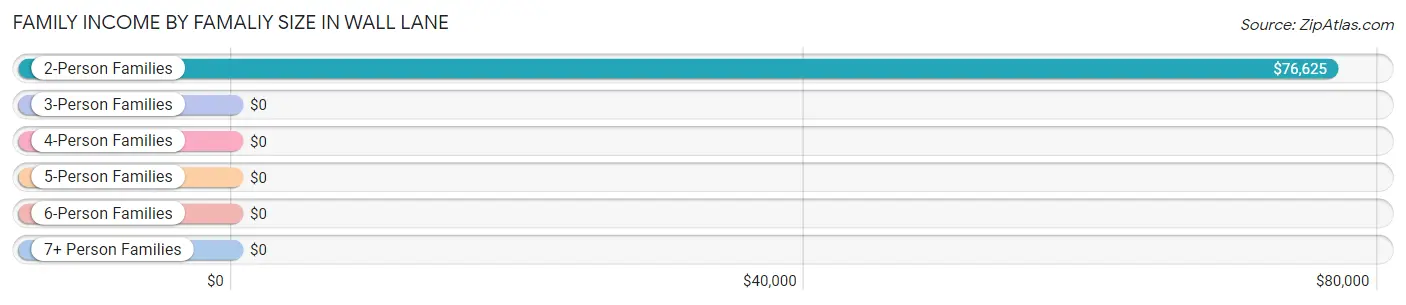
| Income Bracket | # Families | Median Income |
| 2-Person Families | 21 (36.2%) | $76,625 |
| 3-Person Families | 7 (12.1%) | $0 |
| 4-Person Families | 0 (0.0%) | $0 |
| 5-Person Families | 7 (12.1%) | $0 |
| 6-Person Families | 0 (0.0%) | $0 |
| 7+ Person Families | 23 (39.7%) | $0 |
| Total | 58 (100.0%) | $90,357 |
Family Income by Number of Earners in Wall Lane
| Number of Earners | # Families | Median Income |
| No Earners | 11 (19.0%) | $0 |
| 1 Earner | 17 (29.3%) | $0 |
| 2 Earners | 29 (50.0%) | $0 |
| 3+ Earners | 1 (1.7%) | $0 |
| Total | 58 (100.0%) | $90,357 |
Household Income in Wall Lane
Household Income Brackets in Wall Lane
With 23 households falling in the category, the $100,000 to $149,999 income range is the most frequent in Wall Lane, accounting for 24.0% of all households.
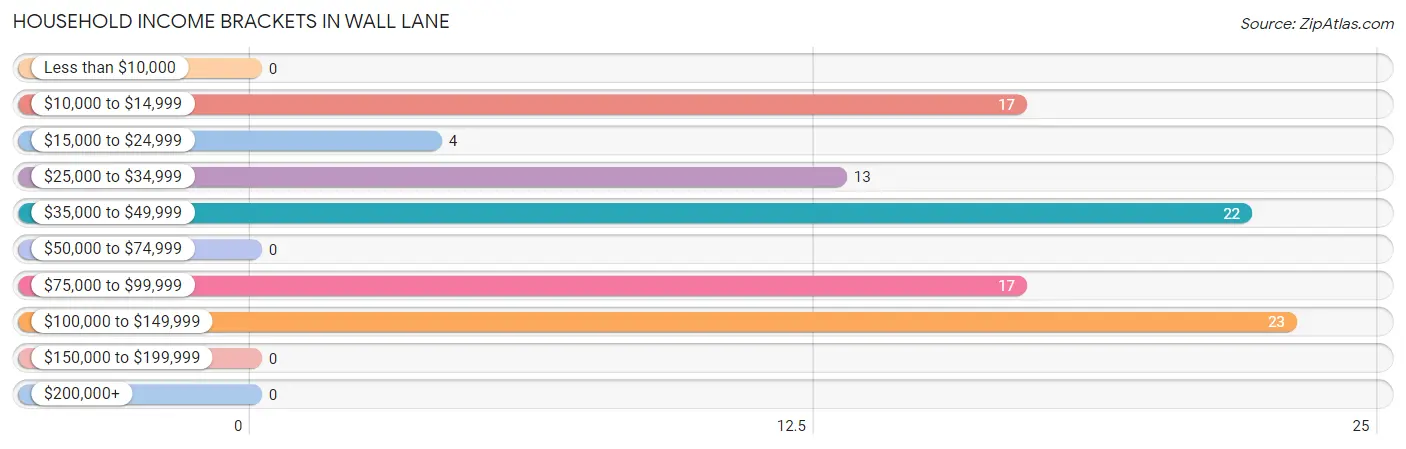
| Income Bracket | # Households | % Households |
| Less than $10,000 | 0 | 0.0% |
| $10,000 to $14,999 | 17 | 17.7% |
| $15,000 to $24,999 | 4 | 4.2% |
| $25,000 to $34,999 | 13 | 13.5% |
| $35,000 to $49,999 | 22 | 22.9% |
| $50,000 to $74,999 | 0 | 0.0% |
| $75,000 to $99,999 | 17 | 17.7% |
| $100,000 to $149,999 | 23 | 24.0% |
| $150,000 to $199,999 | 0 | 0.0% |
| $200,000+ | 0 | 0.0% |
Household Income by Householder Age in Wall Lane
The median household income in Wall Lane is $44,091, with the highest median household income of $76,250 found in the 45 to 64 years age bracket for the primary householder. A total of 24 households (25.0%) fall into this category.
| Income Bracket | # Households | Median Income |
| 15 to 24 Years | 0 (0.0%) | $0 |
| 25 to 44 Years | 45 (46.9%) | $0 |
| 45 to 64 Years | 24 (25.0%) | $76,250 |
| 65+ Years | 27 (28.1%) | $14,485 |
| Total | 96 (100.0%) | $44,091 |
Poverty in Wall Lane
Income Below Poverty by Sex and Age in Wall Lane
| Age Bracket | Male | Female |
| Under 5 Years | 0 (0.0%) | 10 (90.9%) |
| 5 Years | 0 (0.0%) | 0 (0.0%) |
| 6 to 11 Years | 0 (0.0%) | 9 (30.0%) |
| 12 to 14 Years | 0 (0.0%) | 0 (0.0%) |
| 15 Years | 0 (0.0%) | 0 (0.0%) |
| 16 and 17 Years | 0 (0.0%) | 0 (0.0%) |
| 18 to 24 Years | 0 (0.0%) | 10 (37.0%) |
| 25 to 34 Years | 0 (0.0%) | 0 (0.0%) |
| 35 to 44 Years | 0 (0.0%) | 0 (0.0%) |
| 45 to 54 Years | 0 (0.0%) | 0 (0.0%) |
| 55 to 64 Years | 0 (0.0%) | 4 (14.3%) |
| 65 to 74 Years | 0 (0.0%) | 7 (41.2%) |
| 75 Years and over | 0 (0.0%) | 0 (0.0%) |
| Total | 0 (0.0%) | 40 (23.3%) |
Income Above Poverty by Sex and Age in Wall Lane
According to the poverty statistics in Wall Lane, males aged under 5 years and females aged 12 to 14 years are the age groups that are most secure financially, with 100.0% of males and 100.0% of females in these age groups living above the poverty line.
| Age Bracket | Male | Female |
| Under 5 Years | 1 (100.0%) | 1 (9.1%) |
| 5 Years | 0 (0.0%) | 0 (0.0%) |
| 6 to 11 Years | 29 (100.0%) | 21 (70.0%) |
| 12 to 14 Years | 0 (0.0%) | 19 (100.0%) |
| 15 Years | 32 (100.0%) | 0 (0.0%) |
| 16 and 17 Years | 0 (0.0%) | 0 (0.0%) |
| 18 to 24 Years | 0 (0.0%) | 17 (63.0%) |
| 25 to 34 Years | 23 (100.0%) | 7 (100.0%) |
| 35 to 44 Years | 39 (100.0%) | 22 (100.0%) |
| 45 to 54 Years | 0 (0.0%) | 1 (100.0%) |
| 55 to 64 Years | 10 (100.0%) | 24 (85.7%) |
| 65 to 74 Years | 6 (100.0%) | 10 (58.8%) |
| 75 Years and over | 0 (0.0%) | 10 (100.0%) |
| Total | 140 (100.0%) | 132 (76.7%) |
Income Below Poverty Among Married-Couple Families in Wall Lane
| Children | Above Poverty | Below Poverty |
| No Children | 14 (100.0%) | 0 (0.0%) |
| 1 or 2 Children | 0 (0.0%) | 0 (0.0%) |
| 3 or 4 Children | 23 (100.0%) | 0 (0.0%) |
| 5 or more Children | 0 (0.0%) | 0 (0.0%) |
| Total | 37 (100.0%) | 0 (0.0%) |
Income Below Poverty Among Single-Parent Households in Wall Lane
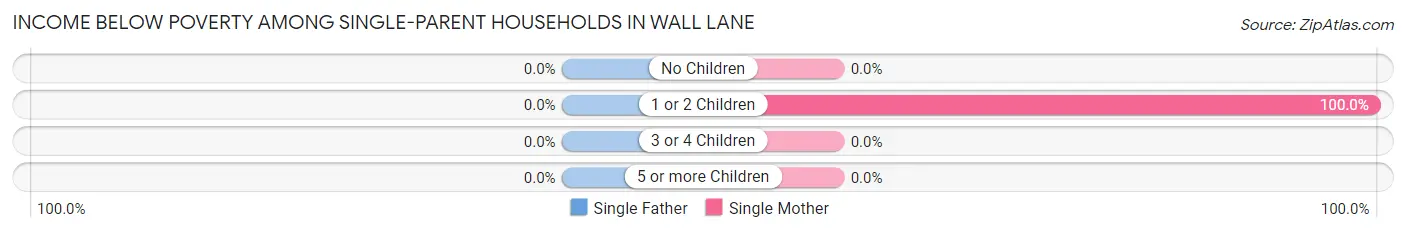
| Children | Single Father | Single Mother |
| No Children | 0 (0.0%) | 0 (0.0%) |
| 1 or 2 Children | 0 (0.0%) | 7 (100.0%) |
| 3 or 4 Children | 0 (0.0%) | 0 (0.0%) |
| 5 or more Children | 0 (0.0%) | 0 (0.0%) |
| Total | 0 (0.0%) | 7 (33.3%) |
Income Below Poverty Among Married-Couple vs Single-Parent Households in Wall Lane
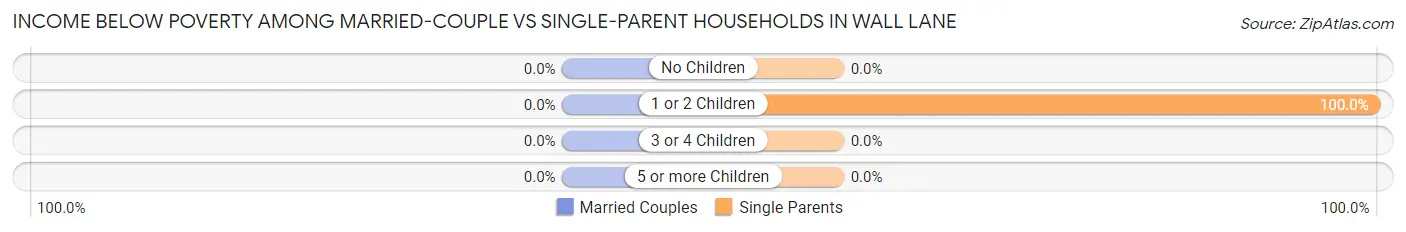
| Children | Married-Couple Families | Single-Parent Households |
| No Children | 0 (0.0%) | 0 (0.0%) |
| 1 or 2 Children | 0 (0.0%) | 7 (100.0%) |
| 3 or 4 Children | 0 (0.0%) | 0 (0.0%) |
| 5 or more Children | 0 (0.0%) | 0 (0.0%) |
| Total | 0 (0.0%) | 7 (33.3%) |
Race in Wall Lane
The most populous races in Wall Lane are Hispanic or Latino (306 | 98.1%), White / Caucasian (185 | 59.3%), and Two or more Races (100 | 32.1%).
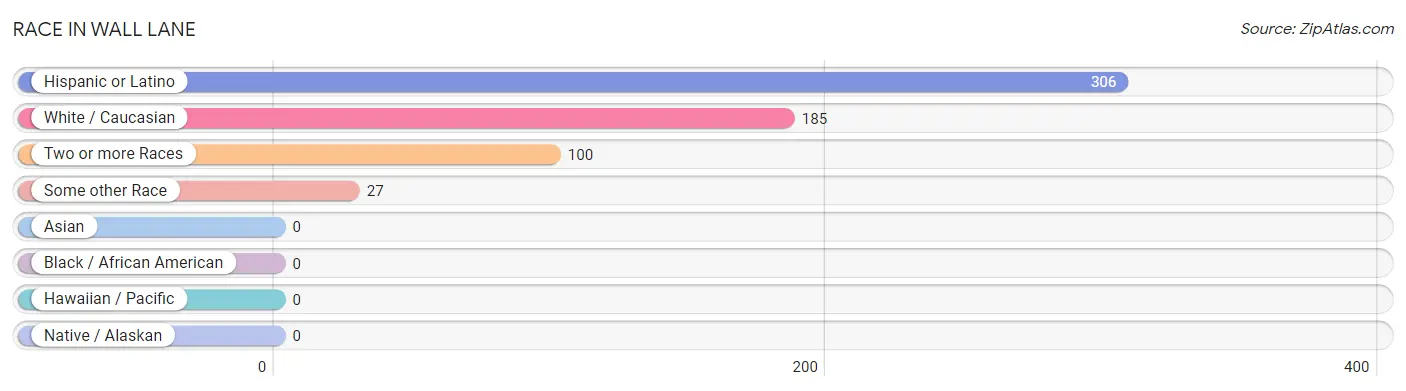
| Race | # Population | % Population |
| Asian | 0 | 0.0% |
| Black / African American | 0 | 0.0% |
| Hawaiian / Pacific | 0 | 0.0% |
| Hispanic or Latino | 306 | 98.1% |
| Native / Alaskan | 0 | 0.0% |
| White / Caucasian | 185 | 59.3% |
| Two or more Races | 100 | 32.1% |
| Some other Race | 27 | 8.6% |
| Total | 312 | 100.0% |
Ancestry in Wall Lane
The most populous ancestries reported in Wall Lane are Mexican (306 | 98.1%), and German (6 | 1.9%), together accounting for 100.0% of all Wall Lane residents.
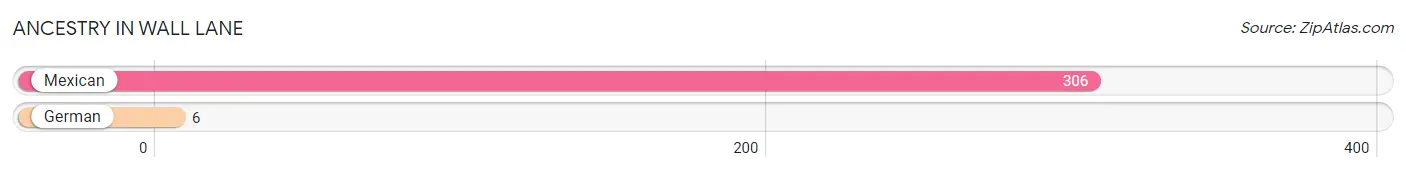
| Ancestry | # Population | % Population |
| German | 6 | 1.9% |
| Mexican | 306 | 98.1% | View All 2 Rows |
Immigrants in Wall Lane
The most numerous immigrant groups reported in Wall Lane came from Central America (129 | 41.3%), Latin America (129 | 41.3%), and Mexico (129 | 41.3%), together accounting for 124.0% of all Wall Lane residents.
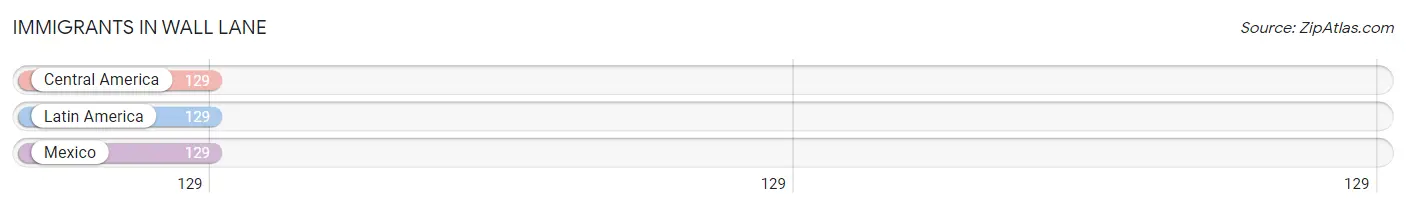
| Immigration Origin | # Population | % Population |
| Central America | 129 | 41.3% |
| Latin America | 129 | 41.3% |
| Mexico | 129 | 41.3% | View All 3 Rows |
Sex and Age in Wall Lane
Sex and Age in Wall Lane
The most populous age groups in Wall Lane are 35 to 39 Years (39 | 27.9%) for men and 10 to 14 Years (28 | 16.3%) for women.
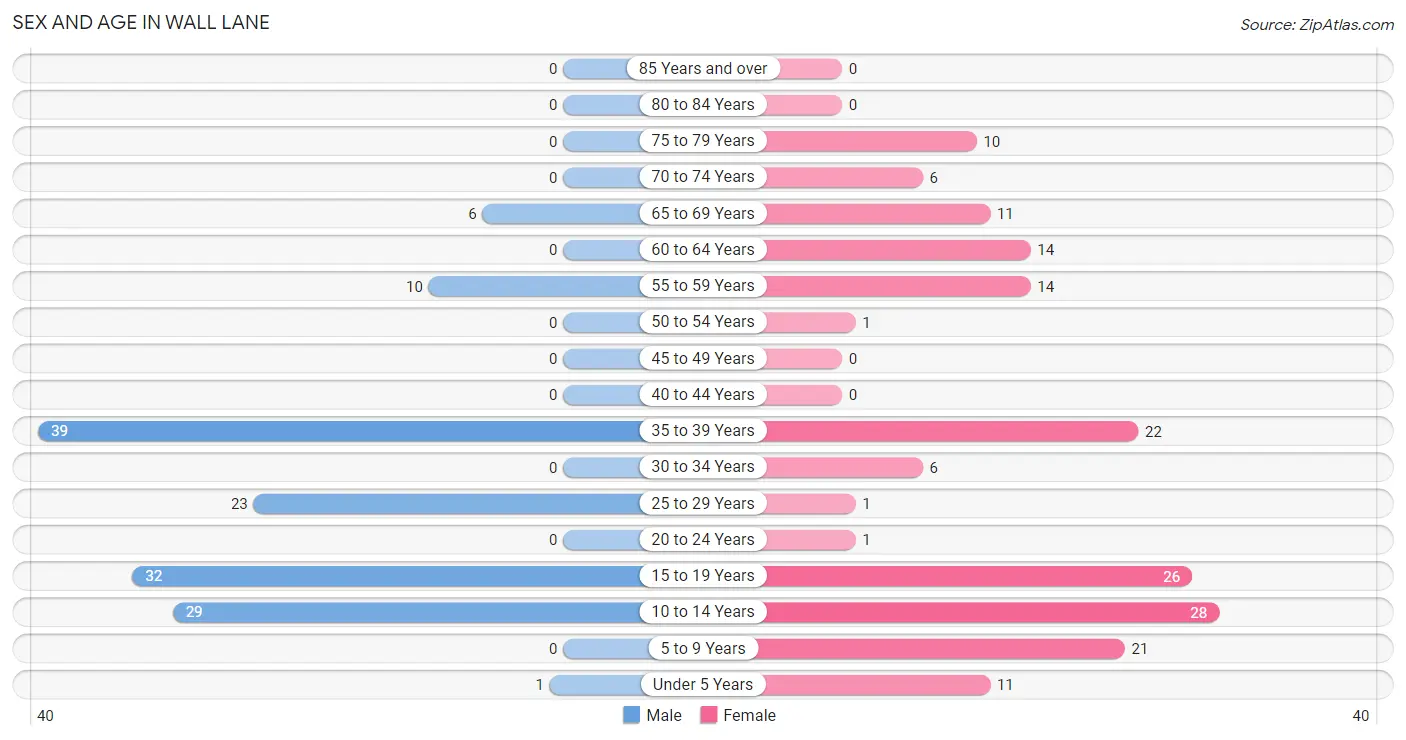
| Age Bracket | Male | Female |
| Under 5 Years | 1 (0.7%) | 11 (6.4%) |
| 5 to 9 Years | 0 (0.0%) | 21 (12.2%) |
| 10 to 14 Years | 29 (20.7%) | 28 (16.3%) |
| 15 to 19 Years | 32 (22.9%) | 26 (15.1%) |
| 20 to 24 Years | 0 (0.0%) | 1 (0.6%) |
| 25 to 29 Years | 23 (16.4%) | 1 (0.6%) |
| 30 to 34 Years | 0 (0.0%) | 6 (3.5%) |
| 35 to 39 Years | 39 (27.9%) | 22 (12.8%) |
| 40 to 44 Years | 0 (0.0%) | 0 (0.0%) |
| 45 to 49 Years | 0 (0.0%) | 0 (0.0%) |
| 50 to 54 Years | 0 (0.0%) | 1 (0.6%) |
| 55 to 59 Years | 10 (7.1%) | 14 (8.1%) |
| 60 to 64 Years | 0 (0.0%) | 14 (8.1%) |
| 65 to 69 Years | 6 (4.3%) | 11 (6.4%) |
| 70 to 74 Years | 0 (0.0%) | 6 (3.5%) |
| 75 to 79 Years | 0 (0.0%) | 10 (5.8%) |
| 80 to 84 Years | 0 (0.0%) | 0 (0.0%) |
| 85 Years and over | 0 (0.0%) | 0 (0.0%) |
| Total | 140 (100.0%) | 172 (100.0%) |
Families and Households in Wall Lane
Median Family Size in Wall Lane
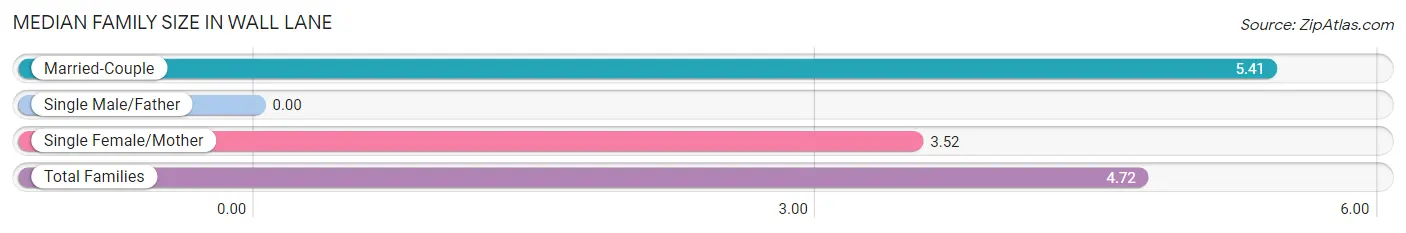
| Family Type | # Families | Family Size |
| Married-Couple | 37 (63.8%) | 5.41 |
| Single Male/Father | 0 (0.0%) | - |
| Single Female/Mother | 21 (36.2%) | 3.52 |
| Total Families | 58 (100.0%) | 4.72 |
Median Household Size in Wall Lane
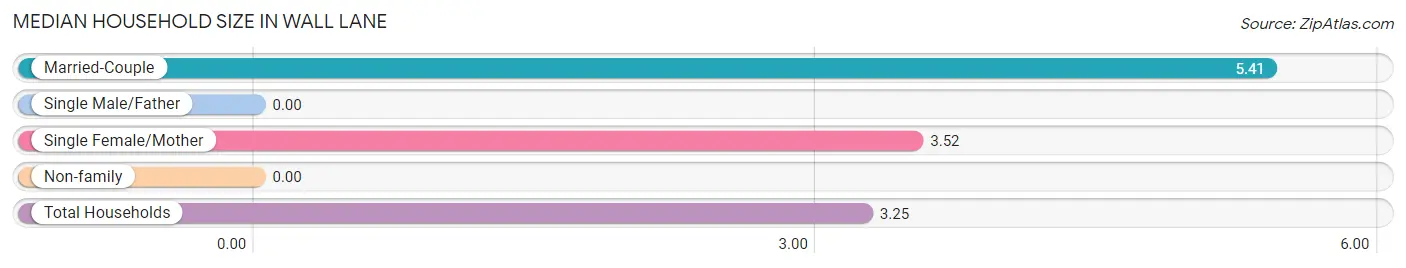
| Household Type | # Households | Household Size |
| Married-Couple | 37 (38.5%) | 5.41 |
| Single Male/Father | 0 (0.0%) | - |
| Single Female/Mother | 21 (21.9%) | 3.52 |
| Non-family | 38 (39.6%) | - |
| Total Households | 96 (100.0%) | 3.25 |
Household Size by Marriage Status in Wall Lane
Out of a total of 96 households in Wall Lane, 58 (60.4%) are family households, while 38 (39.6%) are nonfamily households. The most numerous type of family households are 7+ person households, comprising 23, and the most common type of nonfamily households are 1-person households, comprising 38.
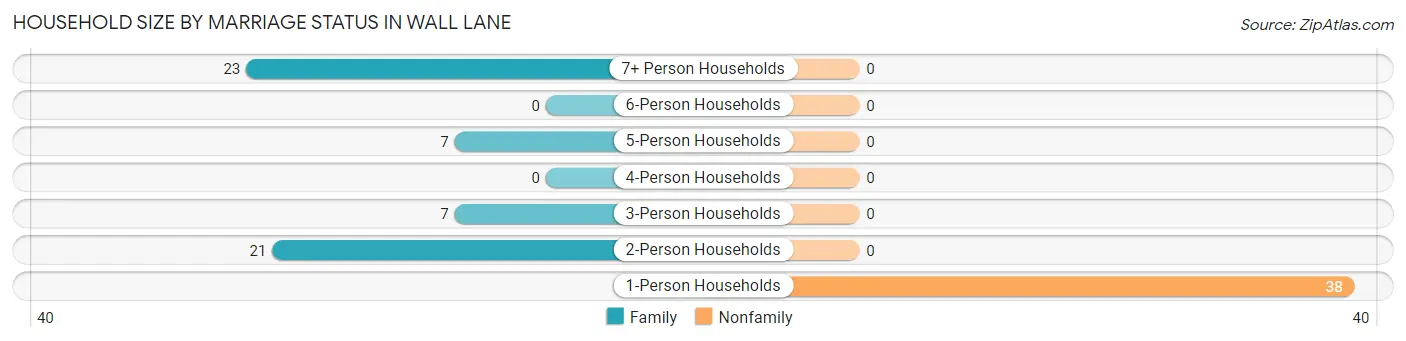
| Household Size | Family Households | Nonfamily Households |
| 1-Person Households | - | 38 (39.6%) |
| 2-Person Households | 21 (21.9%) | 0 (0.0%) |
| 3-Person Households | 7 (7.3%) | 0 (0.0%) |
| 4-Person Households | 0 (0.0%) | 0 (0.0%) |
| 5-Person Households | 7 (7.3%) | 0 (0.0%) |
| 6-Person Households | 0 (0.0%) | 0 (0.0%) |
| 7+ Person Households | 23 (24.0%) | 0 (0.0%) |
| Total | 58 (60.4%) | 38 (39.6%) |
Female Fertility in Wall Lane
Fertility by Age in Wall Lane
Average fertility rate in Wall Lane is 196.0 births per 1,000 women. Women in the age bracket of 15 to 19 years have the highest fertility rate with 385.0 births per 1,000 women. Women in the age bracket of 15 to 19 years acount for 90.9% of all women with births.
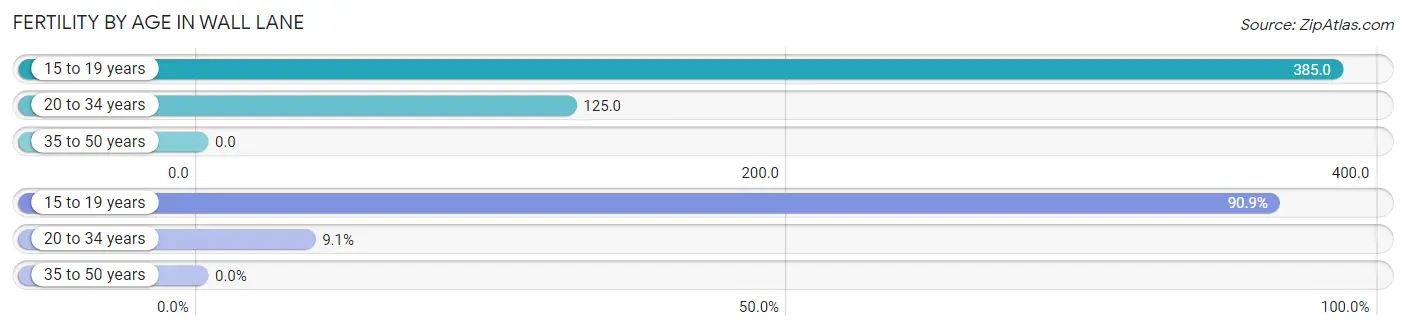
| Age Bracket | Women with Births | Births / 1,000 Women |
| 15 to 19 years | 10 (90.9%) | 385.0 |
| 20 to 34 years | 1 (9.1%) | 125.0 |
| 35 to 50 years | 0 (0.0%) | 0.0 |
| Total | 11 (100.0%) | 196.0 |
Fertility by Age by Marriage Status in Wall Lane
9.1% of women with births (11) in Wall Lane are married. The highest percentage of unmarried women with births falls into 15 to 19 years age bracket with 100.0% of them unmarried at the time of birth, while the lowest percentage of unmarried women with births belong to 20 to 34 years age bracket with 0.0% of them unmarried.
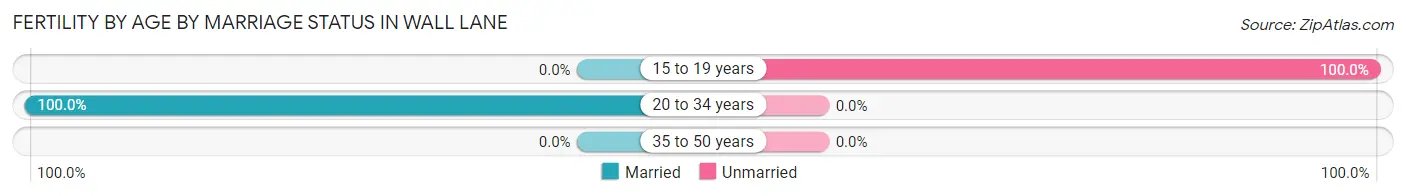
| Age Bracket | Married | Unmarried |
| 15 to 19 years | 0 (0.0%) | 10 (100.0%) |
| 20 to 34 years | 1 (100.0%) | 0 (0.0%) |
| 35 to 50 years | 0 (0.0%) | 0 (0.0%) |
| Total | 1 (9.1%) | 10 (90.9%) |
Fertility by Education in Wall Lane
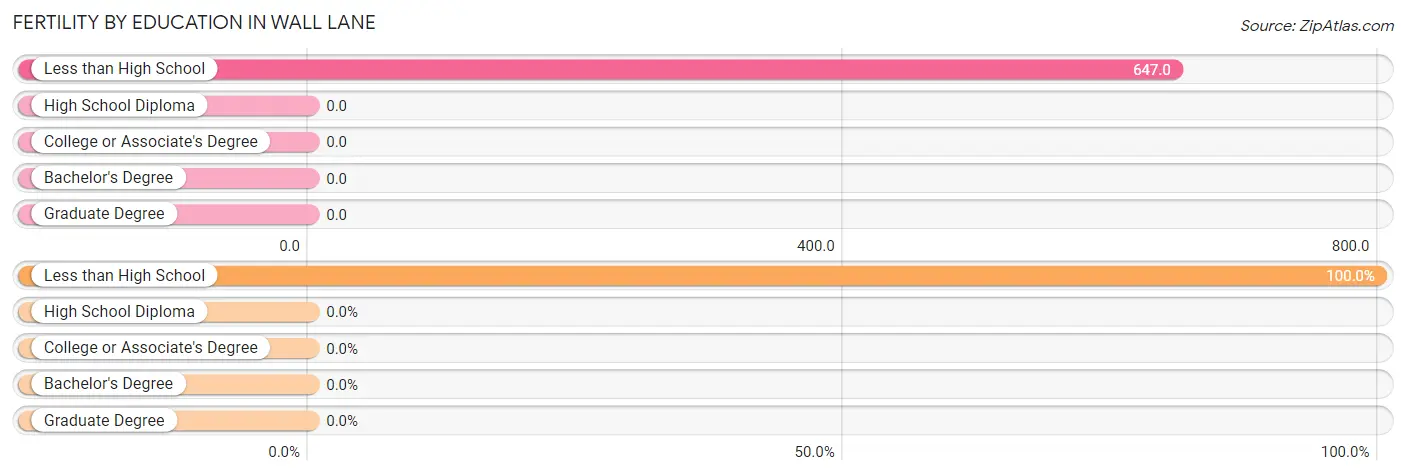
| Educational Attainment | Women with Births | Births / 1,000 Women |
| Less than High School | 11 (100.0%) | 647.0 |
| High School Diploma | 0 (0.0%) | 0.0 |
| College or Associate's Degree | 0 (0.0%) | 0.0 |
| Bachelor's Degree | 0 (0.0%) | 0.0 |
| Graduate Degree | 0 (0.0%) | 0.0 |
| Total | 11 (100.0%) | 196.0 |
Fertility by Education by Marriage Status in Wall Lane
90.9% of women with births in Wall Lane are unmarried. Women with the educational attainment of less than high school are most likely to be married with 9.1% of them married at childbirth, while women with the educational attainment of less than high school are least likely to be married with 90.9% of them unmarried at childbirth.
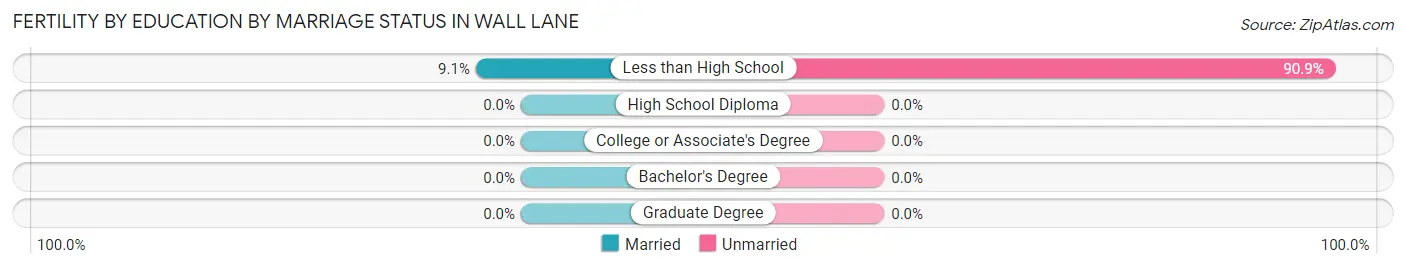
| Educational Attainment | Married | Unmarried |
| Less than High School | 1 (9.1%) | 10 (90.9%) |
| High School Diploma | 0 (0.0%) | 0 (0.0%) |
| College or Associate's Degree | 0 (0.0%) | 0 (0.0%) |
| Bachelor's Degree | 0 (0.0%) | 0 (0.0%) |
| Graduate Degree | 0 (0.0%) | 0 (0.0%) |
| Total | 1 (9.1%) | 10 (90.9%) |
Employment Characteristics in Wall Lane
Employment by Class of Employer in Wall Lane
Among the 101 employed individuals in Wall Lane, private company employees (58 | 57.4%), state government employees (22 | 21.8%), and local government employees (8 | 7.9%) make up the most common classes of employment.
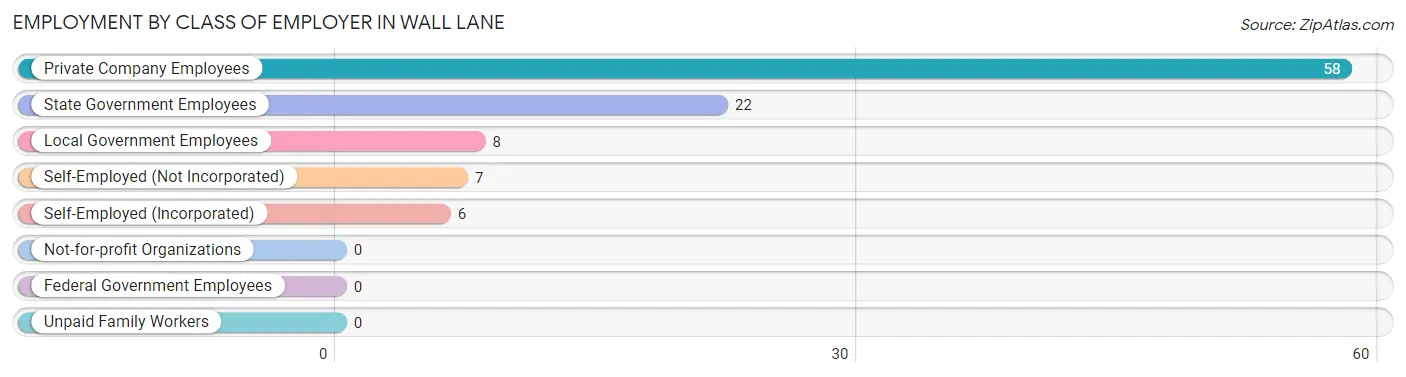
| Employer Class | # Employees | % Employees |
| Private Company Employees | 58 | 57.4% |
| Self-Employed (Incorporated) | 6 | 5.9% |
| Self-Employed (Not Incorporated) | 7 | 6.9% |
| Not-for-profit Organizations | 0 | 0.0% |
| Local Government Employees | 8 | 7.9% |
| State Government Employees | 22 | 21.8% |
| Federal Government Employees | 0 | 0.0% |
| Unpaid Family Workers | 0 | 0.0% |
| Total | 101 | 100.0% |
Employment Status by Age in Wall Lane
According to the labor force statistics for Wall Lane, out of the total population over 16 years of age (190), 65.8% or 125 individuals are in the labor force, with 13.6% or 17 of them unemployed. The age group with the highest labor force participation rate is 20 to 24 years, with 100.0% or 1 individuals in the labor force. Within the labor force, the 16 to 19 years age range has the highest percentage of unemployed individuals, with 100.0% or 16 of them being unemployed.
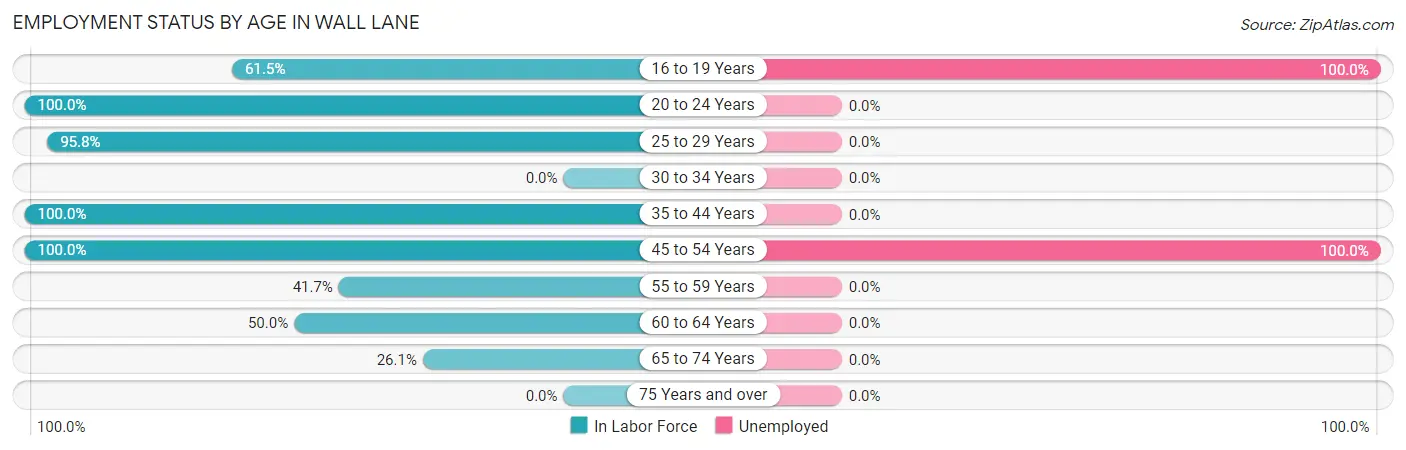
| Age Bracket | In Labor Force | Unemployed |
| 16 to 19 Years | 16 (61.5%) | 16 (100.0%) |
| 20 to 24 Years | 1 (100.0%) | 0 (0.0%) |
| 25 to 29 Years | 23 (95.8%) | 0 (0.0%) |
| 30 to 34 Years | 0 (0.0%) | 0 (0.0%) |
| 35 to 44 Years | 61 (100.0%) | 0 (0.0%) |
| 45 to 54 Years | 1 (100.0%) | 1 (100.0%) |
| 55 to 59 Years | 10 (41.7%) | 0 (0.0%) |
| 60 to 64 Years | 7 (50.0%) | 0 (0.0%) |
| 65 to 74 Years | 6 (26.1%) | 0 (0.0%) |
| 75 Years and over | 0 (0.0%) | 0 (0.0%) |
| Total | 125 (65.8%) | 17 (13.6%) |
Employment Status by Educational Attainment in Wall Lane
According to labor force statistics for Wall Lane, 78.5% of individuals (102) out of the total population between 25 and 64 years of age (130) are in the labor force, with 1.0% or 1 of them being unemployed. The group with the highest labor force participation rate are those with the educational attainment of high school diploma, with 100.0% or 54 individuals in the labor force. Within the labor force, individuals with less than high school education have the highest percentage of unemployment, with 3.2% or 1 of them being unemployed.
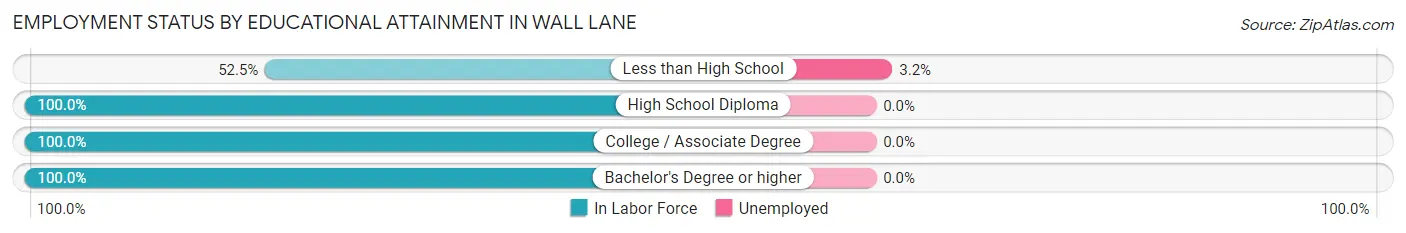
| Educational Attainment | In Labor Force | Unemployed |
| Less than High School | 31 (52.5%) | 2 (3.2%) |
| High School Diploma | 54 (100.0%) | 0 (0.0%) |
| College / Associate Degree | 7 (100.0%) | 0 (0.0%) |
| Bachelor's Degree or higher | 10 (100.0%) | 0 (0.0%) |
| Total | 102 (78.5%) | 1 (1.0%) |
Employment Occupations by Sex in Wall Lane
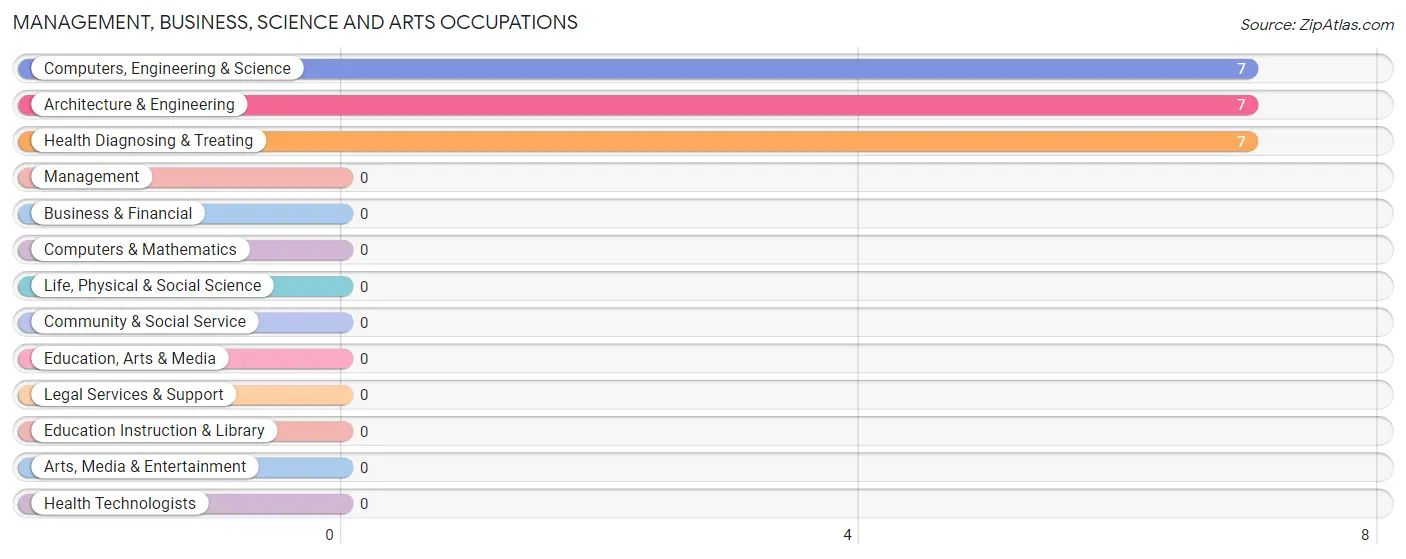
Management, Business, Science and Arts Occupations
The most common Management, Business, Science and Arts occupations in Wall Lane are Computers, Engineering & Science (7 | 6.5%), Architecture & Engineering (7 | 6.5%), and Health Diagnosing & Treating (7 | 6.5%).
Management, Business, Science and Arts Occupations by Sex
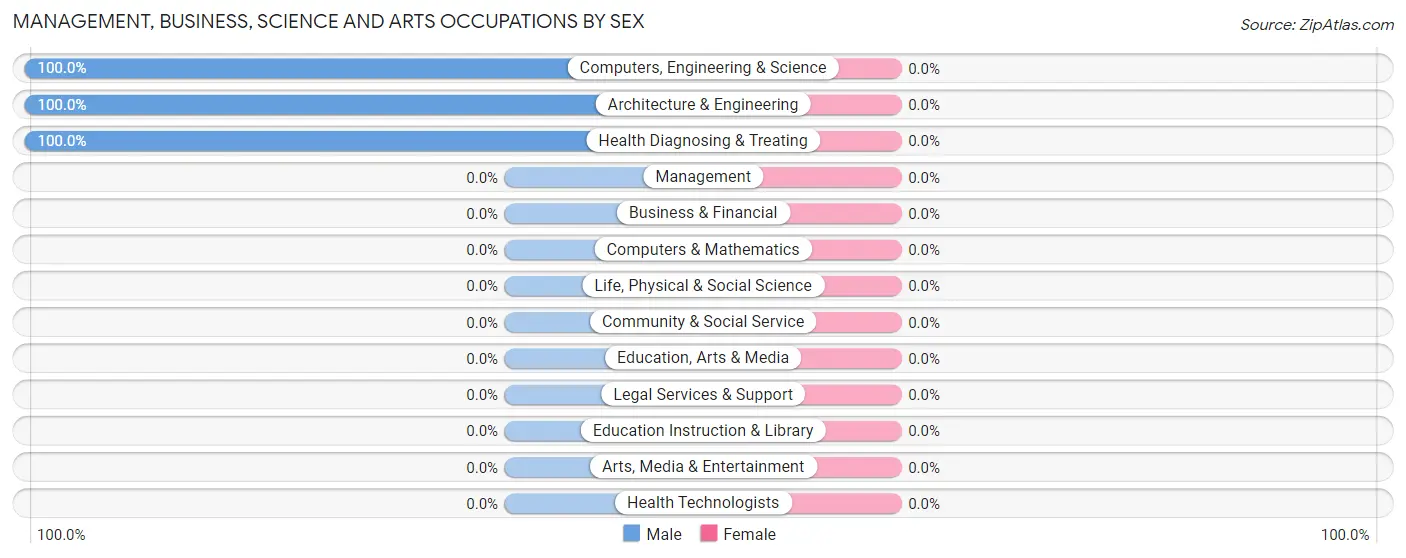
| Occupation | Male | Female |
| Management | 0 (0.0%) | 0 (0.0%) |
| Business & Financial | 0 (0.0%) | 0 (0.0%) |
| Computers, Engineering & Science | 7 (100.0%) | 0 (0.0%) |
| Computers & Mathematics | 0 (0.0%) | 0 (0.0%) |
| Architecture & Engineering | 7 (100.0%) | 0 (0.0%) |
| Life, Physical & Social Science | 0 (0.0%) | 0 (0.0%) |
| Community & Social Service | 0 (0.0%) | 0 (0.0%) |
| Education, Arts & Media | 0 (0.0%) | 0 (0.0%) |
| Legal Services & Support | 0 (0.0%) | 0 (0.0%) |
| Education Instruction & Library | 0 (0.0%) | 0 (0.0%) |
| Arts, Media & Entertainment | 0 (0.0%) | 0 (0.0%) |
| Health Diagnosing & Treating | 7 (100.0%) | 0 (0.0%) |
| Health Technologists | 0 (0.0%) | 0 (0.0%) |
| Total (Category) | 14 (100.0%) | 0 (0.0%) |
| Total (Overall) | 72 (66.7%) | 36 (33.3%) |
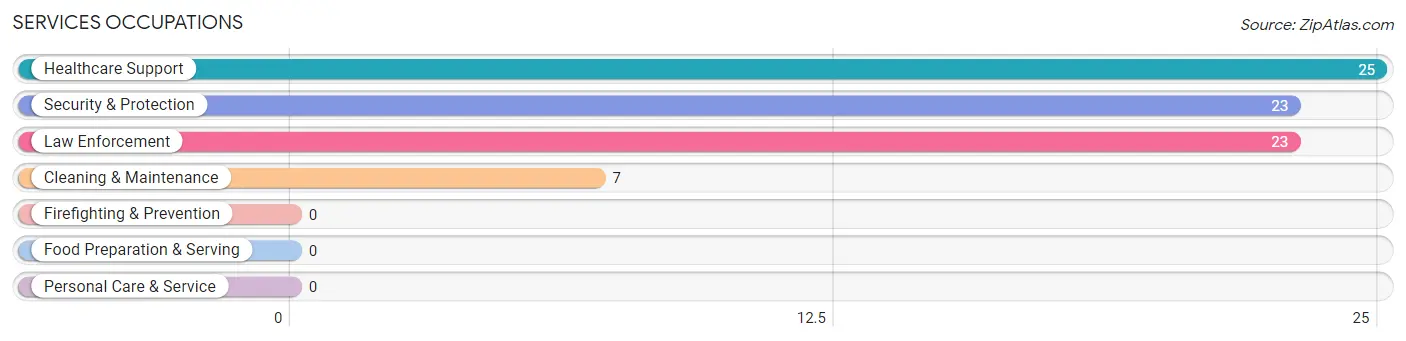
Services Occupations
The most common Services occupations in Wall Lane are Healthcare Support (25 | 23.2%), Security & Protection (23 | 21.3%), Law Enforcement (23 | 21.3%), and Cleaning & Maintenance (7 | 6.5%).
Services Occupations by Sex
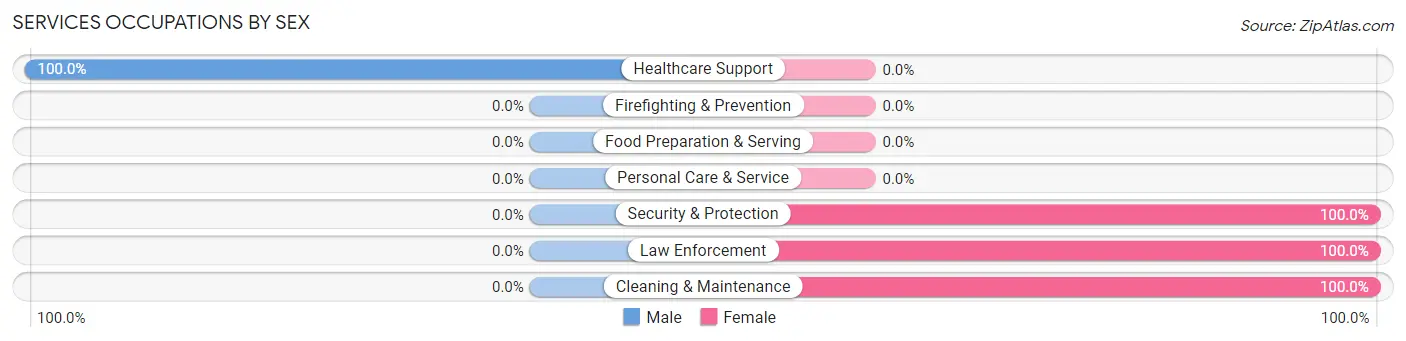
| Occupation | Male | Female |
| Healthcare Support | 25 (100.0%) | 0 (0.0%) |
| Security & Protection | 0 (0.0%) | 23 (100.0%) |
| Firefighting & Prevention | 0 (0.0%) | 0 (0.0%) |
| Law Enforcement | 0 (0.0%) | 23 (100.0%) |
| Food Preparation & Serving | 0 (0.0%) | 0 (0.0%) |
| Cleaning & Maintenance | 0 (0.0%) | 7 (100.0%) |
| Personal Care & Service | 0 (0.0%) | 0 (0.0%) |
| Total (Category) | 25 (45.5%) | 30 (54.5%) |
| Total (Overall) | 72 (66.7%) | 36 (33.3%) |
Sales and Office Occupations
The most common Sales and Office occupations in Wall Lane are , and Office & Administration (6 | 5.6%).
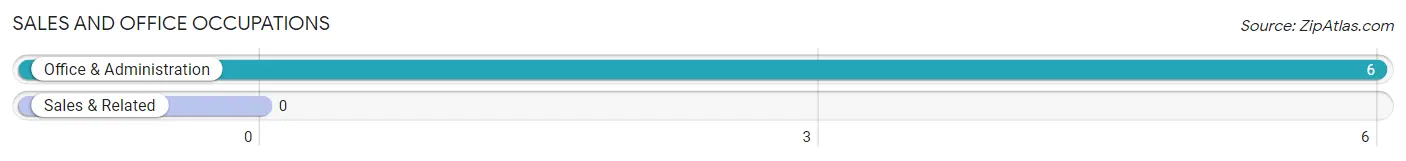
Sales and Office Occupations by Sex
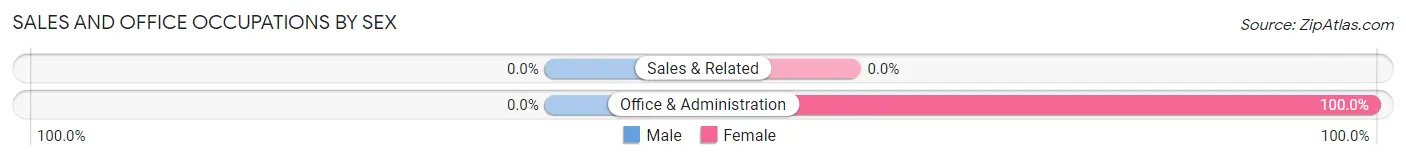
| Occupation | Male | Female |
| Sales & Related | 0 (0.0%) | 0 (0.0%) |
| Office & Administration | 0 (0.0%) | 6 (100.0%) |
| Total (Category) | 0 (0.0%) | 6 (100.0%) |
| Total (Overall) | 72 (66.7%) | 36 (33.3%) |
Natural Resources, Construction and Maintenance Occupations
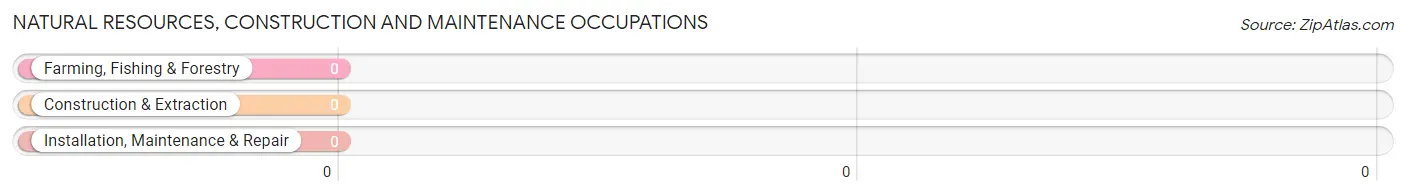
Natural Resources, Construction and Maintenance Occupations by Sex
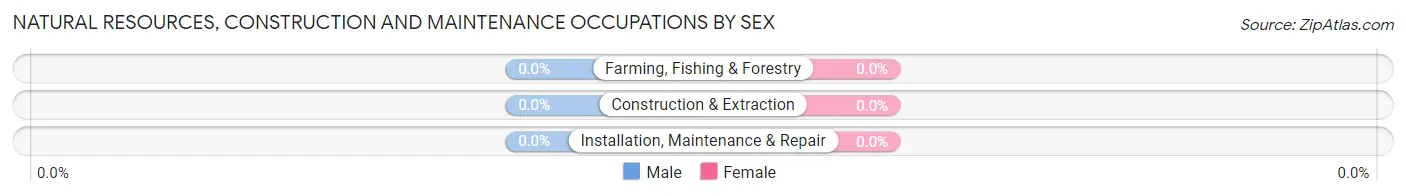
| Occupation | Male | Female |
| Farming, Fishing & Forestry | 0 (0.0%) | 0 (0.0%) |
| Construction & Extraction | 0 (0.0%) | 0 (0.0%) |
| Installation, Maintenance & Repair | 0 (0.0%) | 0 (0.0%) |
| Total (Category) | 0 (0.0%) | 0 (0.0%) |
| Total (Overall) | 72 (66.7%) | 36 (33.3%) |
Production, Transportation and Moving Occupations
The most common Production, Transportation and Moving occupations in Wall Lane are Material Moving (23 | 21.3%), and Transportation (10 | 9.3%).
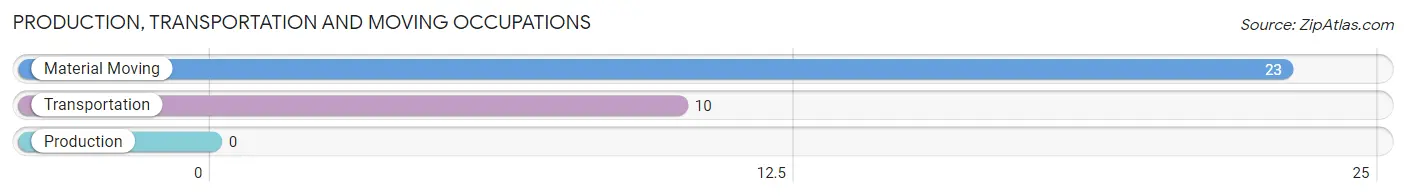
Production, Transportation and Moving Occupations by Sex
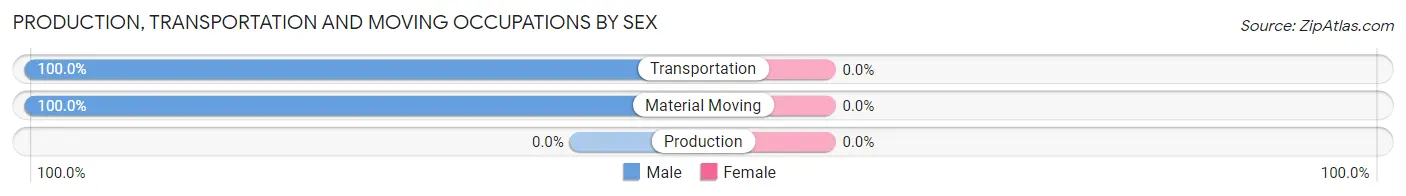
| Occupation | Male | Female |
| Production | 0 (0.0%) | 0 (0.0%) |
| Transportation | 10 (100.0%) | 0 (0.0%) |
| Material Moving | 23 (100.0%) | 0 (0.0%) |
| Total (Category) | 33 (100.0%) | 0 (0.0%) |
| Total (Overall) | 72 (66.7%) | 36 (33.3%) |
Employment Industries by Sex in Wall Lane
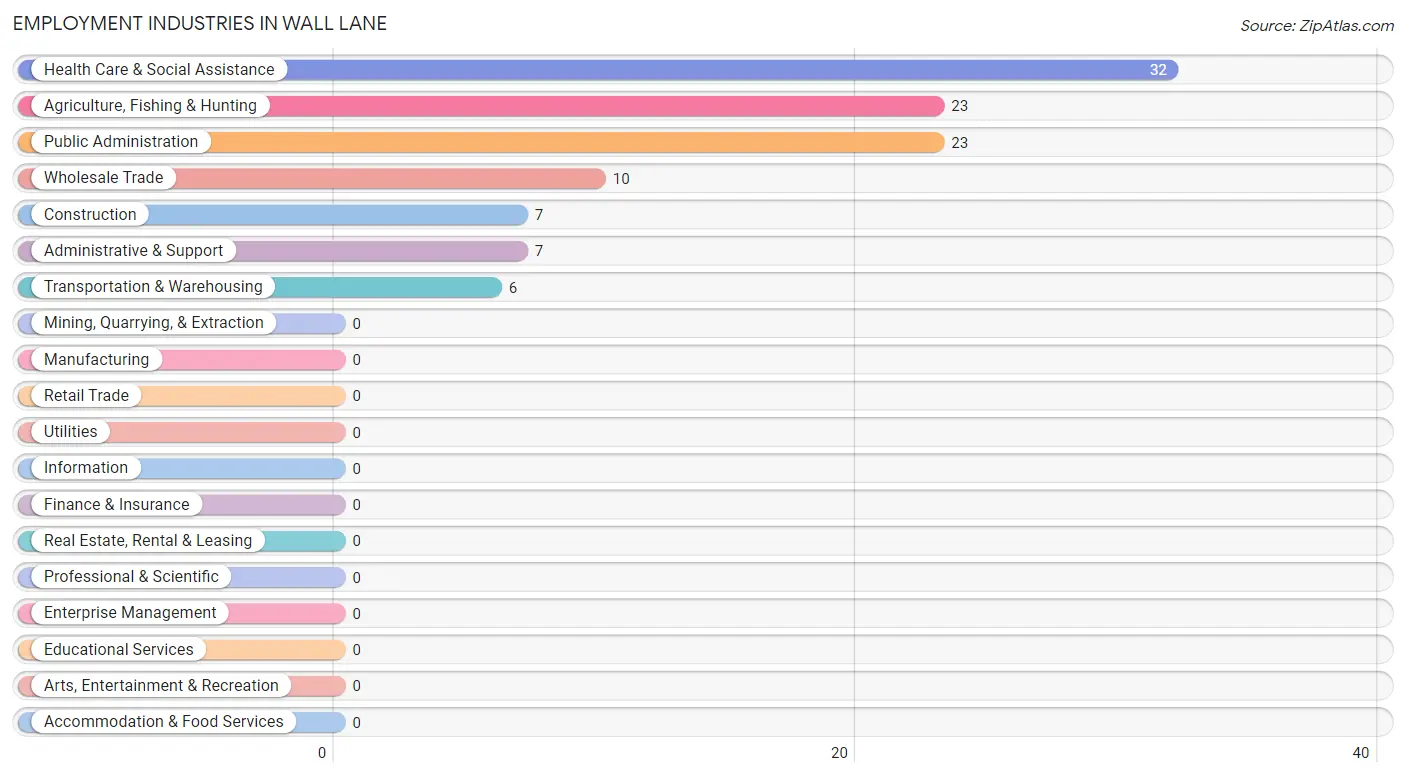
Employment Industries in Wall Lane
The major employment industries in Wall Lane include Health Care & Social Assistance (32 | 29.6%), Agriculture, Fishing & Hunting (23 | 21.3%), Public Administration (23 | 21.3%), Wholesale Trade (10 | 9.3%), and Construction (7 | 6.5%).
Employment Industries by Sex in Wall Lane
The Wall Lane industries that see more men than women are Agriculture, Fishing & Hunting (100.0%), Construction (100.0%), and Wholesale Trade (100.0%), whereas the industries that tend to have a higher number of women are Transportation & Warehousing (100.0%), Administrative & Support (100.0%), and Public Administration (100.0%).
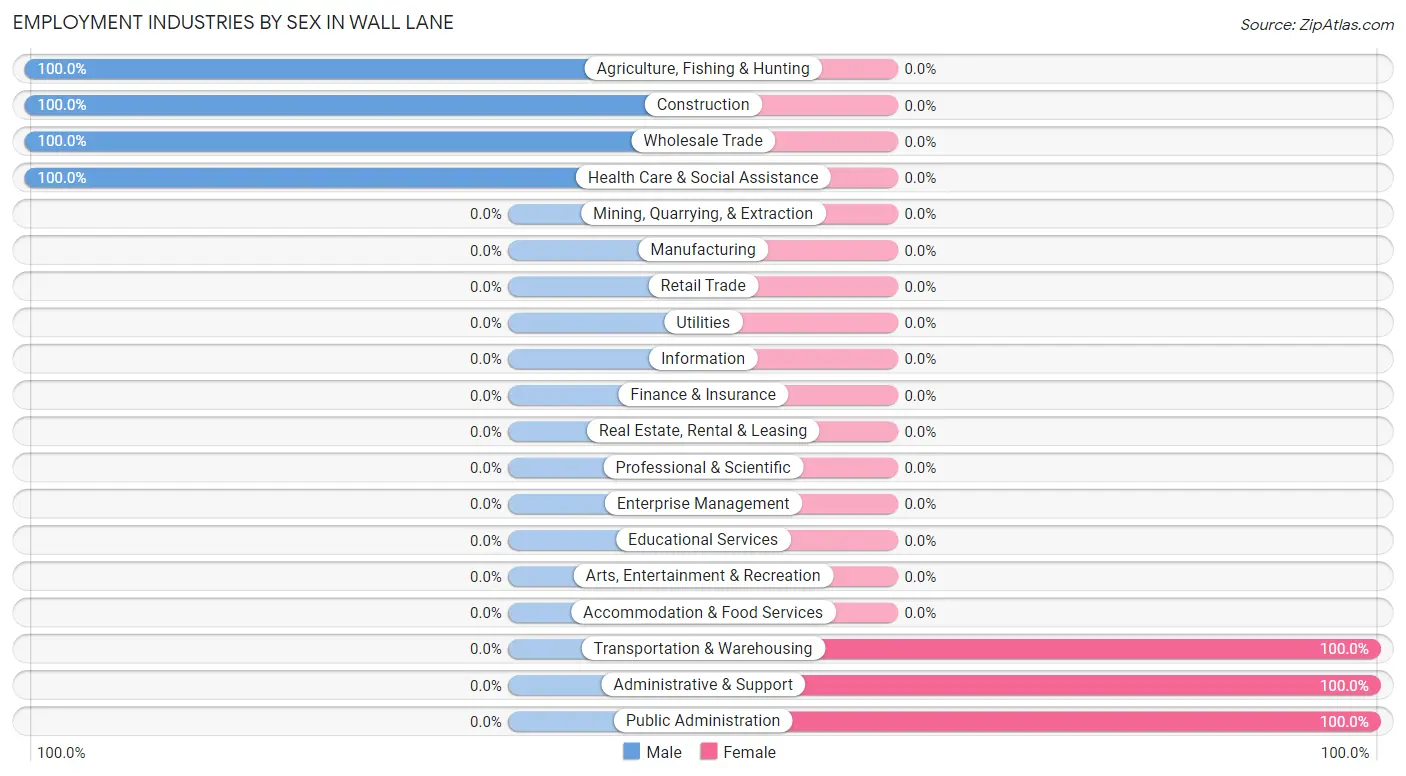
| Industry | Male | Female |
| Agriculture, Fishing & Hunting | 23 (100.0%) | 0 (0.0%) |
| Mining, Quarrying, & Extraction | 0 (0.0%) | 0 (0.0%) |
| Construction | 7 (100.0%) | 0 (0.0%) |
| Manufacturing | 0 (0.0%) | 0 (0.0%) |
| Wholesale Trade | 10 (100.0%) | 0 (0.0%) |
| Retail Trade | 0 (0.0%) | 0 (0.0%) |
| Transportation & Warehousing | 0 (0.0%) | 6 (100.0%) |
| Utilities | 0 (0.0%) | 0 (0.0%) |
| Information | 0 (0.0%) | 0 (0.0%) |
| Finance & Insurance | 0 (0.0%) | 0 (0.0%) |
| Real Estate, Rental & Leasing | 0 (0.0%) | 0 (0.0%) |
| Professional & Scientific | 0 (0.0%) | 0 (0.0%) |
| Enterprise Management | 0 (0.0%) | 0 (0.0%) |
| Administrative & Support | 0 (0.0%) | 7 (100.0%) |
| Educational Services | 0 (0.0%) | 0 (0.0%) |
| Health Care & Social Assistance | 32 (100.0%) | 0 (0.0%) |
| Arts, Entertainment & Recreation | 0 (0.0%) | 0 (0.0%) |
| Accommodation & Food Services | 0 (0.0%) | 0 (0.0%) |
| Public Administration | 0 (0.0%) | 23 (100.0%) |
| Total | 72 (66.7%) | 36 (33.3%) |
Education in Wall Lane
School Enrollment in Wall Lane
The most common levels of schooling among the 111 students in Wall Lane are middle school (48 | 43.2%), high school (32 | 28.8%), and kindergarten (20 | 18.0%).
| School Level | # Students | % Students |
| Nursery / Preschool | 1 | 0.9% |
| Kindergarten | 20 | 18.0% |
| Elementary School | 10 | 9.0% |
| Middle School | 48 | 43.2% |
| High School | 32 | 28.8% |
| College / Undergraduate | 0 | 0.0% |
| Graduate / Professional | 0 | 0.0% |
| Total | 111 | 100.0% |
School Enrollment by Age by Funding Source in Wall Lane
Out of a total of 111 students who are enrolled in schools in Wall Lane, 19 (17.1%) attend a private institution, while the remaining 92 (82.9%) are enrolled in public schools. The age group of 10 to 14 year olds has the highest likelihood of being enrolled in private schools, with 19 (33.3% in the age bracket) enrolled. Conversely, the age group of 3 to 4 year olds has the lowest likelihood of being enrolled in a private school, with 1 (100.0% in the age bracket) attending a public institution.
| Age Bracket | Public School | Private School |
| 3 to 4 Year Olds | 1 (100.0%) | 0 (0.0%) |
| 5 to 9 Year Old | 21 (100.0%) | 0 (0.0%) |
| 10 to 14 Year Olds | 38 (66.7%) | 19 (33.3%) |
| 15 to 17 Year Olds | 32 (100.0%) | 0 (0.0%) |
| 18 to 19 Year Olds | 0 (0.0%) | 0 (0.0%) |
| 20 to 24 Year Olds | 0 (0.0%) | 0 (0.0%) |
| 25 to 34 Year Olds | 0 (0.0%) | 0 (0.0%) |
| 35 Years and over | 0 (0.0%) | 0 (0.0%) |
| Total | 92 (82.9%) | 19 (17.1%) |
Educational Attainment by Field of Study in Wall Lane
, and engineering (10 | 100.0%) are the most common fields of study among 10 individuals in Wall Lane who have obtained a bachelor's degree or higher.
| Field of Study | # Graduates | % Graduates |
| Computers & Mathematics | 0 | 0.0% |
| Bio, Nature & Agricultural | 0 | 0.0% |
| Physical & Health Sciences | 0 | 0.0% |
| Psychology | 0 | 0.0% |
| Social Sciences | 0 | 0.0% |
| Engineering | 10 | 100.0% |
| Multidisciplinary Studies | 0 | 0.0% |
| Science & Technology | 0 | 0.0% |
| Business | 0 | 0.0% |
| Education | 0 | 0.0% |
| Literature & Languages | 0 | 0.0% |
| Liberal Arts & History | 0 | 0.0% |
| Visual & Performing Arts | 0 | 0.0% |
| Communications | 0 | 0.0% |
| Arts & Humanities | 0 | 0.0% |
| Total | 10 | 100.0% |
Transportation & Commute in Wall Lane
Vehicle Availability by Sex in Wall Lane
The most prevalent vehicle ownership categories in Wall Lane are males with 2 vehicles (39, accounting for 60.0%) and females with 2 vehicles (7, making up 108.3%).
| Vehicles Available | Male | Female |
| No Vehicle | 0 (0.0%) | 0 (0.0%) |
| 1 Vehicle | 0 (0.0%) | 6 (16.7%) |
| 2 Vehicles | 39 (60.0%) | 7 (19.4%) |
| 3 Vehicles | 25 (38.5%) | 22 (61.1%) |
| 4 Vehicles | 1 (1.5%) | 1 (2.8%) |
| 5 or more Vehicles | 0 (0.0%) | 0 (0.0%) |
| Total | 65 (100.0%) | 36 (100.0%) |
Commute Time in Wall Lane
The most frequently occuring commute durations in Wall Lane are 45 to 59 minutes (32 commuters, 33.7%), 10 to 14 minutes (22 commuters, 23.2%), and 25 to 29 minutes (22 commuters, 23.2%).
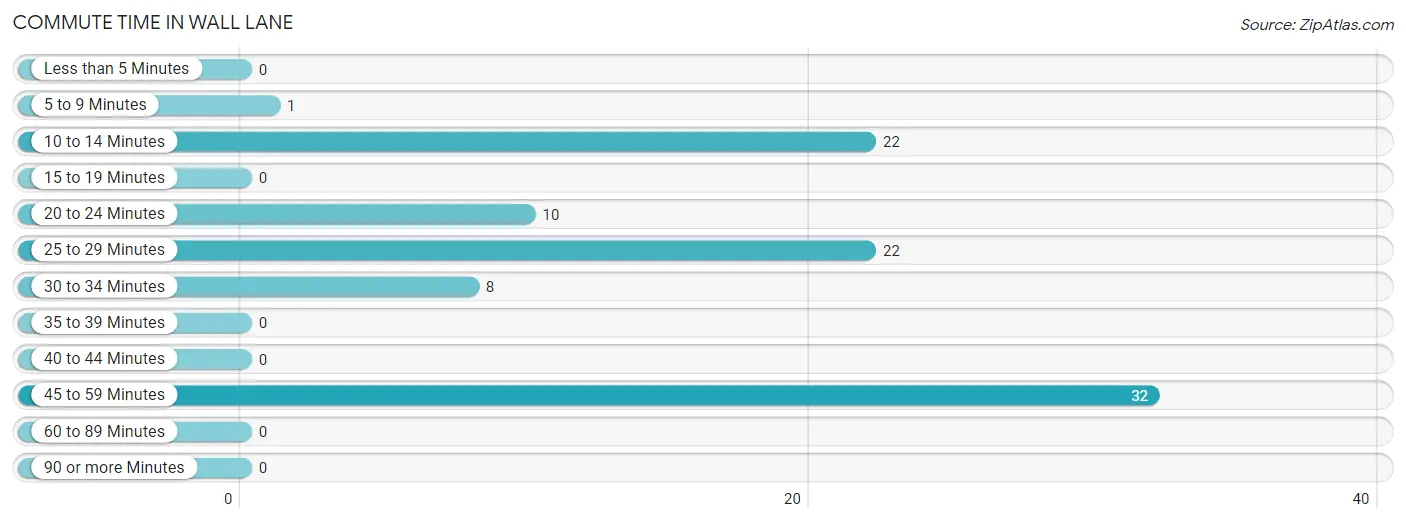
| Commute Time | # Commuters | % Commuters |
| Less than 5 Minutes | 0 | 0.0% |
| 5 to 9 Minutes | 1 | 1.1% |
| 10 to 14 Minutes | 22 | 23.2% |
| 15 to 19 Minutes | 0 | 0.0% |
| 20 to 24 Minutes | 10 | 10.5% |
| 25 to 29 Minutes | 22 | 23.2% |
| 30 to 34 Minutes | 8 | 8.4% |
| 35 to 39 Minutes | 0 | 0.0% |
| 40 to 44 Minutes | 0 | 0.0% |
| 45 to 59 Minutes | 32 | 33.7% |
| 60 to 89 Minutes | 0 | 0.0% |
| 90 or more Minutes | 0 | 0.0% |
Commute Time by Sex in Wall Lane
The most common commute times in Wall Lane are 45 to 59 minutes (25 commuters, 38.5%) for males and 25 to 29 minutes (22 commuters, 73.3%) for females.
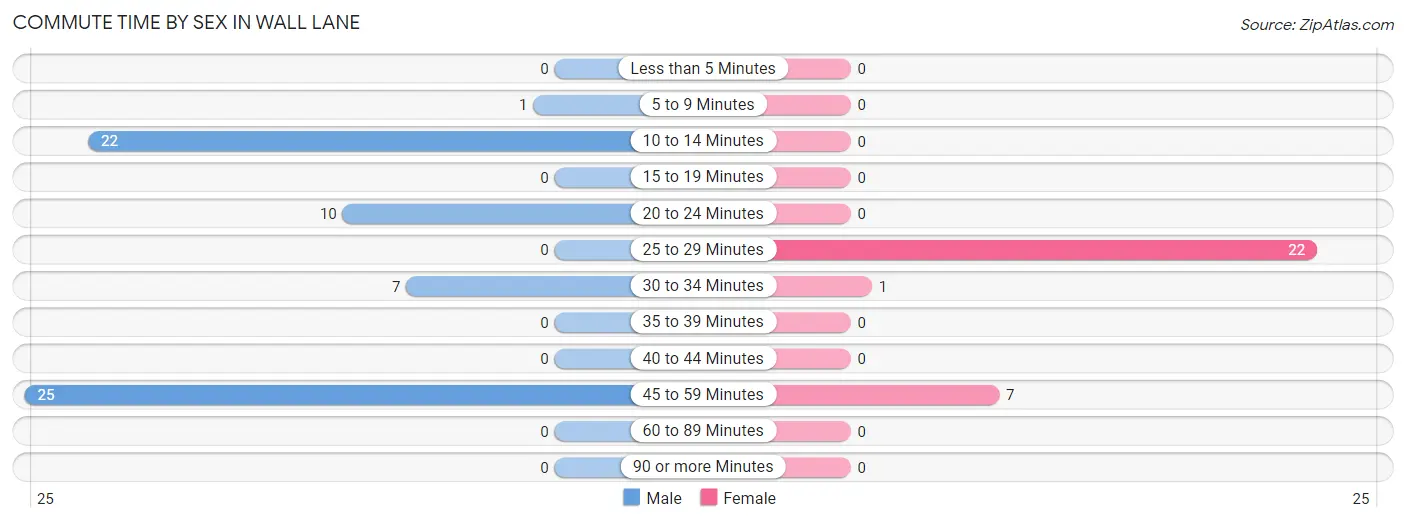
| Commute Time | Male | Female |
| Less than 5 Minutes | 0 (0.0%) | 0 (0.0%) |
| 5 to 9 Minutes | 1 (1.5%) | 0 (0.0%) |
| 10 to 14 Minutes | 22 (33.9%) | 0 (0.0%) |
| 15 to 19 Minutes | 0 (0.0%) | 0 (0.0%) |
| 20 to 24 Minutes | 10 (15.4%) | 0 (0.0%) |
| 25 to 29 Minutes | 0 (0.0%) | 22 (73.3%) |
| 30 to 34 Minutes | 7 (10.8%) | 1 (3.3%) |
| 35 to 39 Minutes | 0 (0.0%) | 0 (0.0%) |
| 40 to 44 Minutes | 0 (0.0%) | 0 (0.0%) |
| 45 to 59 Minutes | 25 (38.5%) | 7 (23.3%) |
| 60 to 89 Minutes | 0 (0.0%) | 0 (0.0%) |
| 90 or more Minutes | 0 (0.0%) | 0 (0.0%) |
Time of Departure to Work by Sex in Wall Lane
The most frequent times of departure to work in Wall Lane are 9:00 AM to 9:59 AM (25, 38.5%) for males and 8:30 AM to 8:59 AM (22, 73.3%) for females.
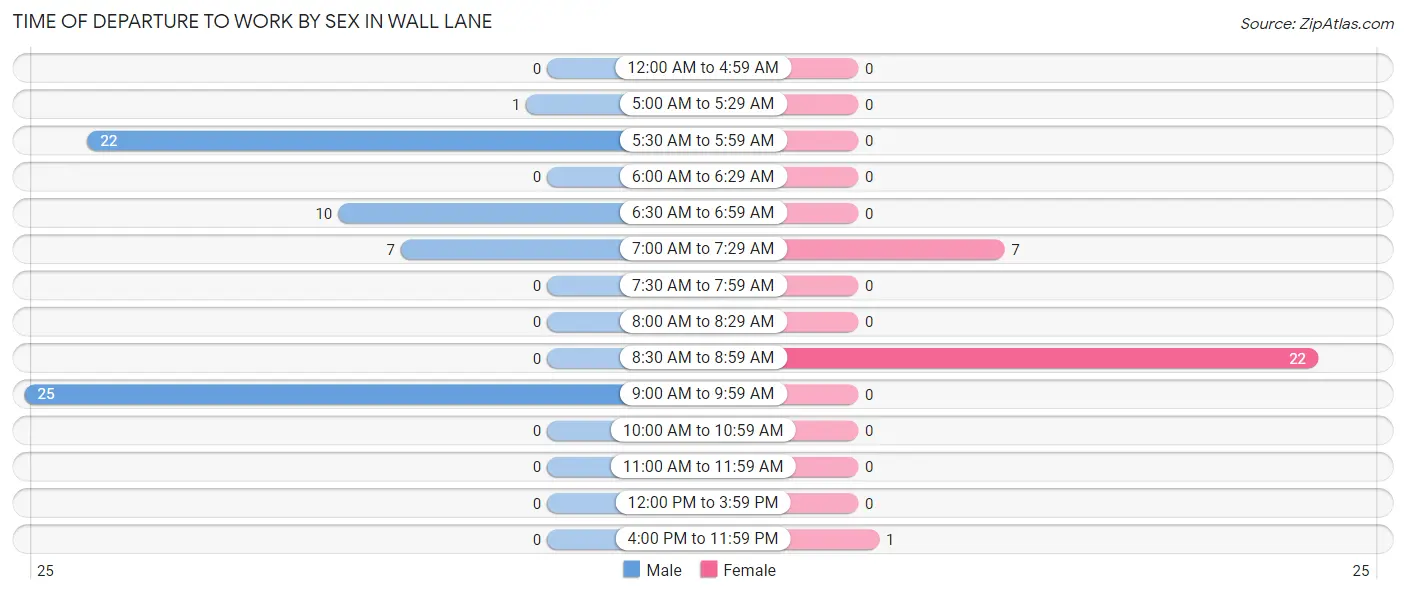
| Time of Departure | Male | Female |
| 12:00 AM to 4:59 AM | 0 (0.0%) | 0 (0.0%) |
| 5:00 AM to 5:29 AM | 1 (1.5%) | 0 (0.0%) |
| 5:30 AM to 5:59 AM | 22 (33.9%) | 0 (0.0%) |
| 6:00 AM to 6:29 AM | 0 (0.0%) | 0 (0.0%) |
| 6:30 AM to 6:59 AM | 10 (15.4%) | 0 (0.0%) |
| 7:00 AM to 7:29 AM | 7 (10.8%) | 7 (23.3%) |
| 7:30 AM to 7:59 AM | 0 (0.0%) | 0 (0.0%) |
| 8:00 AM to 8:29 AM | 0 (0.0%) | 0 (0.0%) |
| 8:30 AM to 8:59 AM | 0 (0.0%) | 22 (73.3%) |
| 9:00 AM to 9:59 AM | 25 (38.5%) | 0 (0.0%) |
| 10:00 AM to 10:59 AM | 0 (0.0%) | 0 (0.0%) |
| 11:00 AM to 11:59 AM | 0 (0.0%) | 0 (0.0%) |
| 12:00 PM to 3:59 PM | 0 (0.0%) | 0 (0.0%) |
| 4:00 PM to 11:59 PM | 0 (0.0%) | 1 (3.3%) |
| Total | 65 (100.0%) | 30 (100.0%) |
Housing Occupancy in Wall Lane
Occupancy by Ownership in Wall Lane
Of the total 96 dwellings in Wall Lane, owner-occupied units account for 51 (53.1%), while renter-occupied units make up 45 (46.9%).
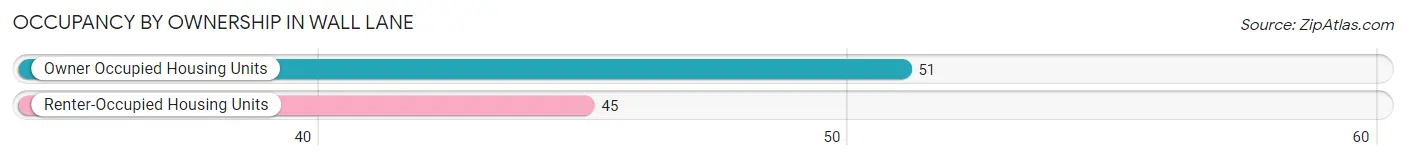
| Occupancy | # Housing Units | % Housing Units |
| Owner Occupied Housing Units | 51 | 53.1% |
| Renter-Occupied Housing Units | 45 | 46.9% |
| Total Occupied Housing Units | 96 | 100.0% |
Occupancy by Household Size in Wall Lane
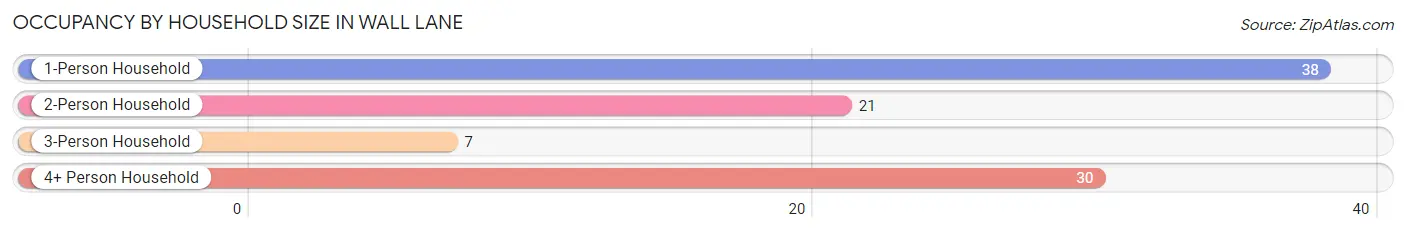
| Household Size | # Housing Units | % Housing Units |
| 1-Person Household | 38 | 39.6% |
| 2-Person Household | 21 | 21.9% |
| 3-Person Household | 7 | 7.3% |
| 4+ Person Household | 30 | 31.2% |
| Total Housing Units | 96 | 100.0% |
Occupancy by Ownership by Household Size in Wall Lane
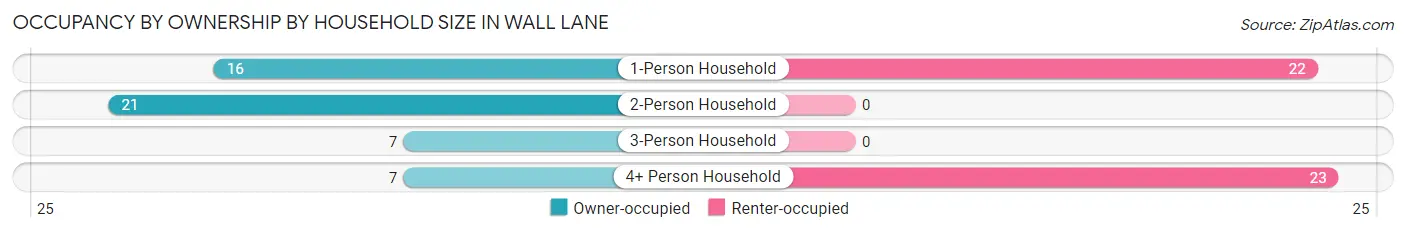
| Household Size | Owner-occupied | Renter-occupied |
| 1-Person Household | 16 (42.1%) | 22 (57.9%) |
| 2-Person Household | 21 (100.0%) | 0 (0.0%) |
| 3-Person Household | 7 (100.0%) | 0 (0.0%) |
| 4+ Person Household | 7 (23.3%) | 23 (76.7%) |
| Total Housing Units | 51 (53.1%) | 45 (46.9%) |
Occupancy by Educational Attainment in Wall Lane
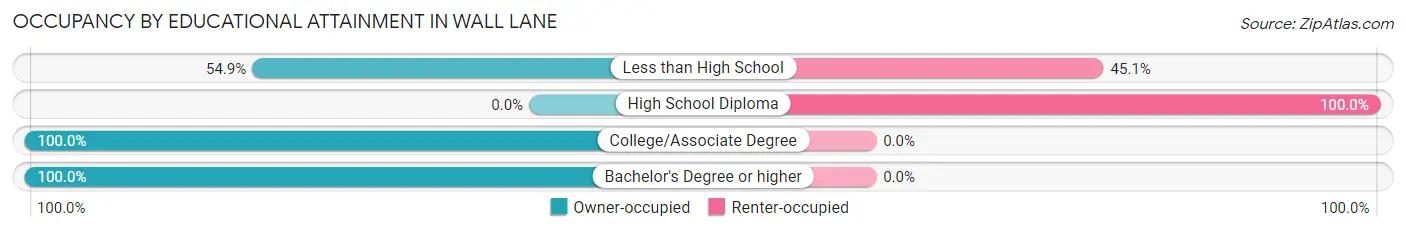
| Household Size | Owner-occupied | Renter-occupied |
| Less than High School | 28 (54.9%) | 23 (45.1%) |
| High School Diploma | 0 (0.0%) | 22 (100.0%) |
| College/Associate Degree | 13 (100.0%) | 0 (0.0%) |
| Bachelor's Degree or higher | 10 (100.0%) | 0 (0.0%) |
Occupancy by Age of Householder in Wall Lane
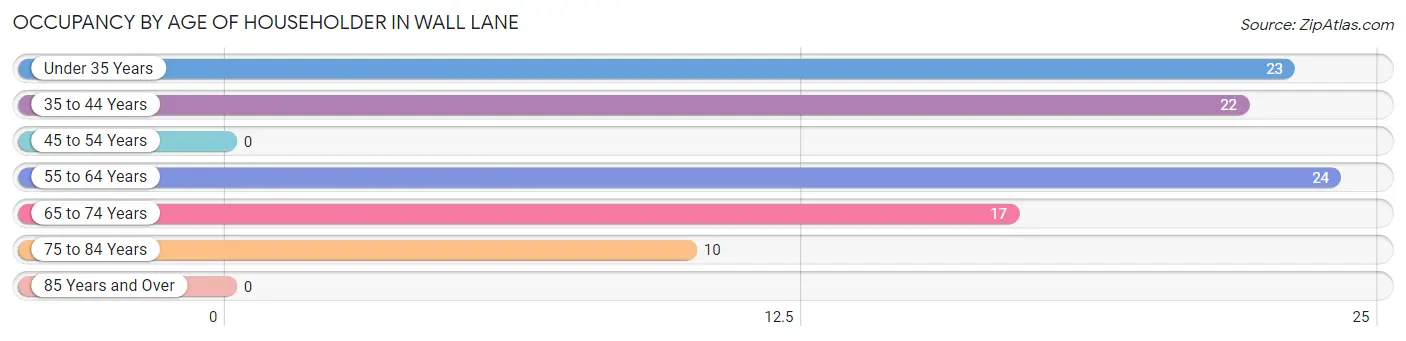
| Age Bracket | # Households | % Households |
| Under 35 Years | 23 | 24.0% |
| 35 to 44 Years | 22 | 22.9% |
| 45 to 54 Years | 0 | 0.0% |
| 55 to 64 Years | 24 | 25.0% |
| 65 to 74 Years | 17 | 17.7% |
| 75 to 84 Years | 10 | 10.4% |
| 85 Years and Over | 0 | 0.0% |
| Total | 96 | 100.0% |
Housing Finances in Wall Lane
Median Income by Occupancy in Wall Lane
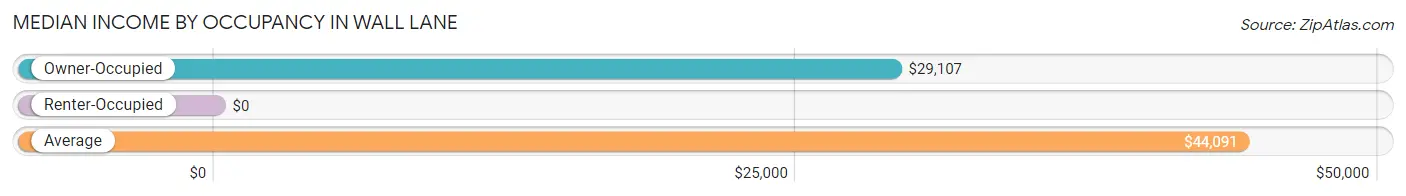
| Occupancy Type | # Households | Median Income |
| Owner-Occupied | 51 (53.1%) | $29,107 |
| Renter-Occupied | 45 (46.9%) | $0 |
| Average | 96 (100.0%) | $44,091 |
Occupancy by Householder Income Bracket in Wall Lane
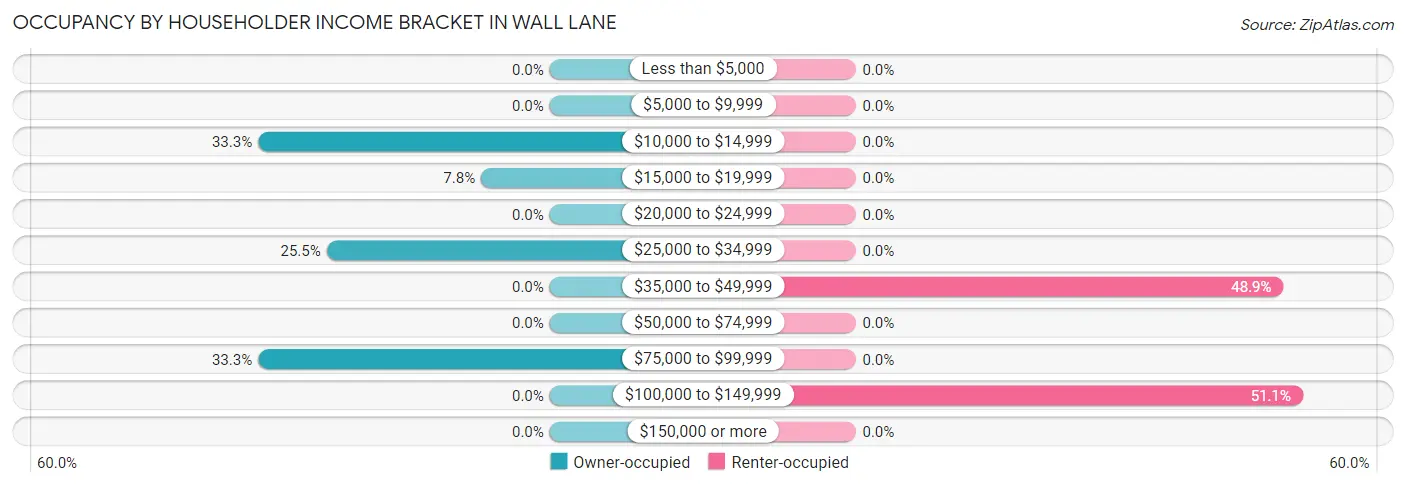
| Income Bracket | Owner-occupied | Renter-occupied |
| Less than $5,000 | 0 (0.0%) | 0 (0.0%) |
| $5,000 to $9,999 | 0 (0.0%) | 0 (0.0%) |
| $10,000 to $14,999 | 17 (33.3%) | 0 (0.0%) |
| $15,000 to $19,999 | 4 (7.8%) | 0 (0.0%) |
| $20,000 to $24,999 | 0 (0.0%) | 0 (0.0%) |
| $25,000 to $34,999 | 13 (25.5%) | 0 (0.0%) |
| $35,000 to $49,999 | 0 (0.0%) | 22 (48.9%) |
| $50,000 to $74,999 | 0 (0.0%) | 0 (0.0%) |
| $75,000 to $99,999 | 17 (33.3%) | 0 (0.0%) |
| $100,000 to $149,999 | 0 (0.0%) | 23 (51.1%) |
| $150,000 or more | 0 (0.0%) | 0 (0.0%) |
| Total | 51 (100.0%) | 45 (100.0%) |
Monthly Housing Cost Tiers in Wall Lane
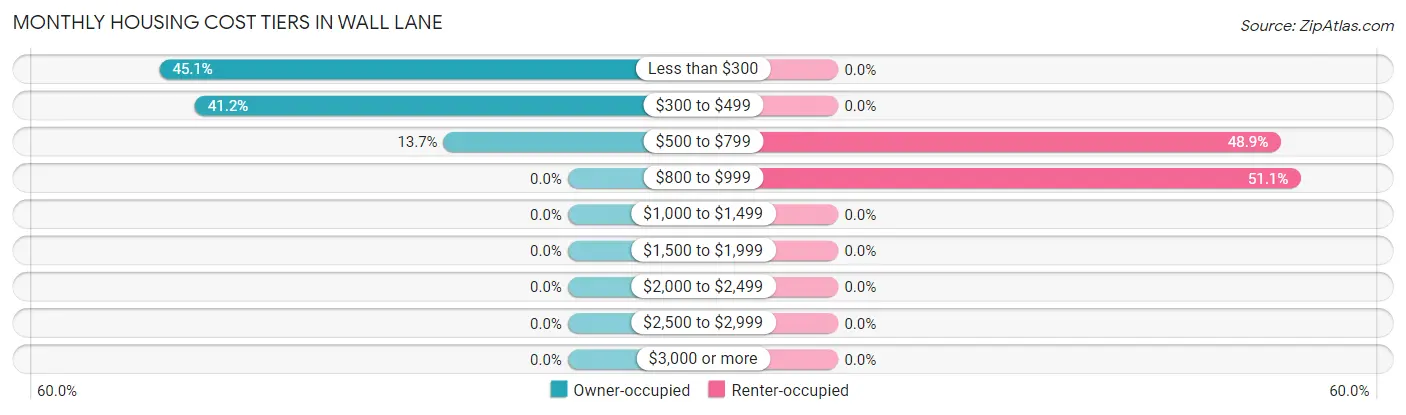
| Monthly Cost | Owner-occupied | Renter-occupied |
| Less than $300 | 23 (45.1%) | 0 (0.0%) |
| $300 to $499 | 21 (41.2%) | 0 (0.0%) |
| $500 to $799 | 7 (13.7%) | 22 (48.9%) |
| $800 to $999 | 0 (0.0%) | 23 (51.1%) |
| $1,000 to $1,499 | 0 (0.0%) | 0 (0.0%) |
| $1,500 to $1,999 | 0 (0.0%) | 0 (0.0%) |
| $2,000 to $2,499 | 0 (0.0%) | 0 (0.0%) |
| $2,500 to $2,999 | 0 (0.0%) | 0 (0.0%) |
| $3,000 or more | 0 (0.0%) | 0 (0.0%) |
| Total | 51 (100.0%) | 45 (100.0%) |
Physical Housing Characteristics in Wall Lane
Housing Structures in Wall Lane
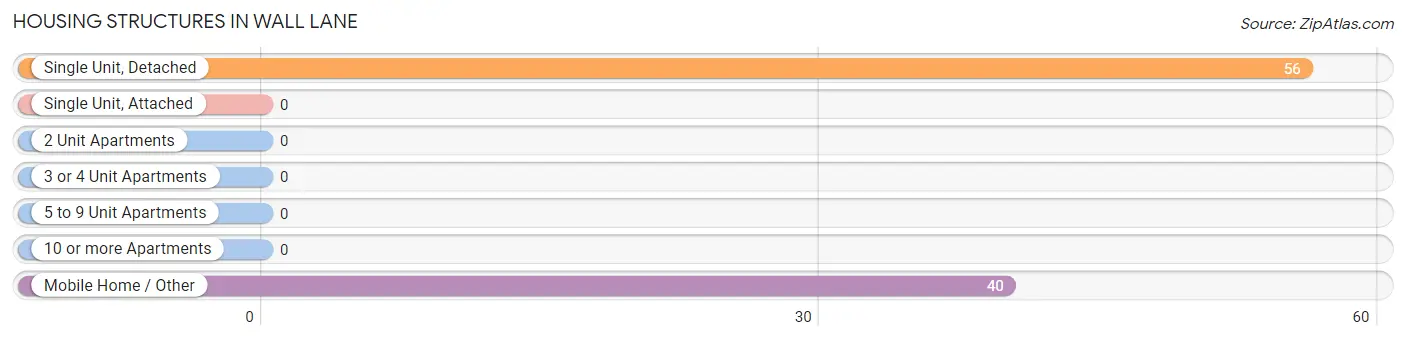
| Structure Type | # Housing Units | % Housing Units |
| Single Unit, Detached | 56 | 58.3% |
| Single Unit, Attached | 0 | 0.0% |
| 2 Unit Apartments | 0 | 0.0% |
| 3 or 4 Unit Apartments | 0 | 0.0% |
| 5 to 9 Unit Apartments | 0 | 0.0% |
| 10 or more Apartments | 0 | 0.0% |
| Mobile Home / Other | 40 | 41.7% |
| Total | 96 | 100.0% |
Housing Structures by Occupancy in Wall Lane
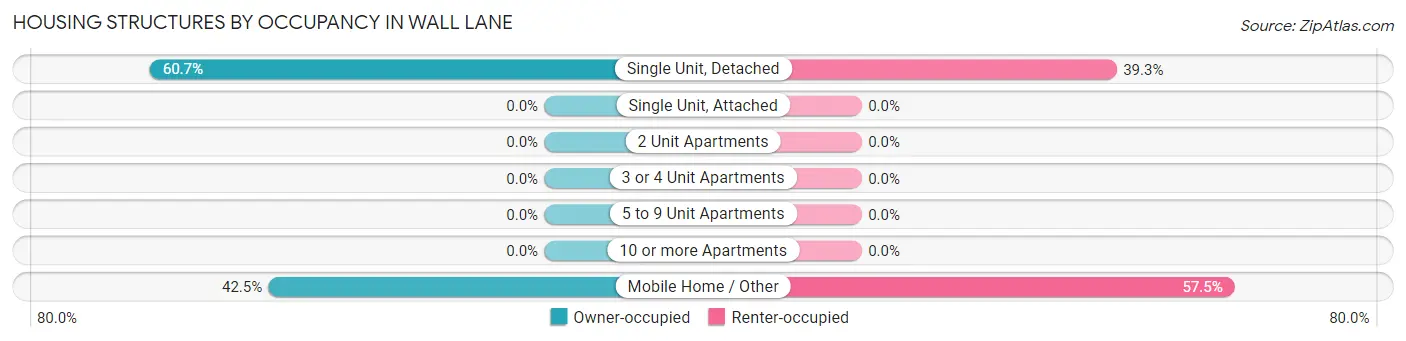
| Structure Type | Owner-occupied | Renter-occupied |
| Single Unit, Detached | 34 (60.7%) | 22 (39.3%) |
| Single Unit, Attached | 0 (0.0%) | 0 (0.0%) |
| 2 Unit Apartments | 0 (0.0%) | 0 (0.0%) |
| 3 or 4 Unit Apartments | 0 (0.0%) | 0 (0.0%) |
| 5 to 9 Unit Apartments | 0 (0.0%) | 0 (0.0%) |
| 10 or more Apartments | 0 (0.0%) | 0 (0.0%) |
| Mobile Home / Other | 17 (42.5%) | 23 (57.5%) |
| Total | 51 (53.1%) | 45 (46.9%) |
Housing Structures by Number of Rooms in Wall Lane
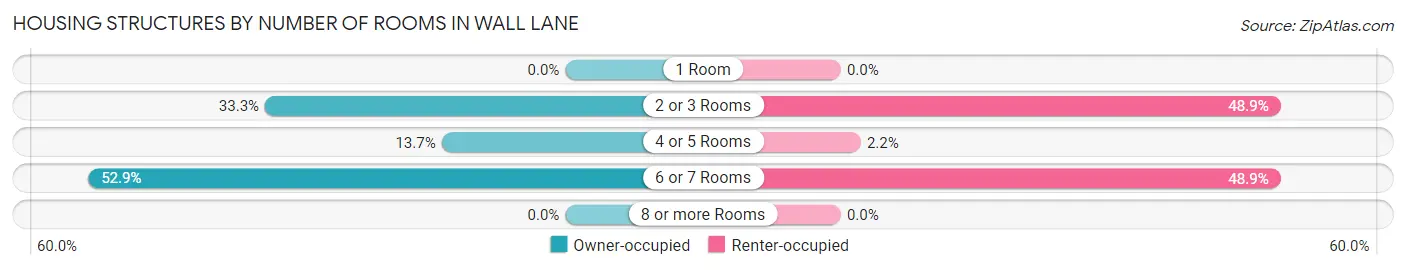
| Number of Rooms | Owner-occupied | Renter-occupied |
| 1 Room | 0 (0.0%) | 0 (0.0%) |
| 2 or 3 Rooms | 17 (33.3%) | 22 (48.9%) |
| 4 or 5 Rooms | 7 (13.7%) | 1 (2.2%) |
| 6 or 7 Rooms | 27 (52.9%) | 22 (48.9%) |
| 8 or more Rooms | 0 (0.0%) | 0 (0.0%) |
| Total | 51 (100.0%) | 45 (100.0%) |
Housing Structure by Heating Type in Wall Lane
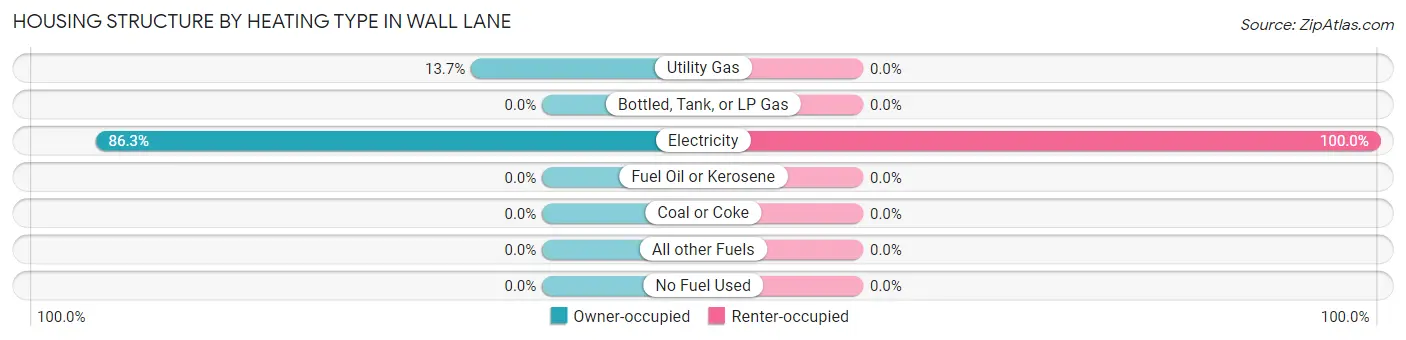
| Heating Type | Owner-occupied | Renter-occupied |
| Utility Gas | 7 (13.7%) | 0 (0.0%) |
| Bottled, Tank, or LP Gas | 0 (0.0%) | 0 (0.0%) |
| Electricity | 44 (86.3%) | 45 (100.0%) |
| Fuel Oil or Kerosene | 0 (0.0%) | 0 (0.0%) |
| Coal or Coke | 0 (0.0%) | 0 (0.0%) |
| All other Fuels | 0 (0.0%) | 0 (0.0%) |
| No Fuel Used | 0 (0.0%) | 0 (0.0%) |
| Total | 51 (100.0%) | 45 (100.0%) |
Household Vehicle Usage in Wall Lane
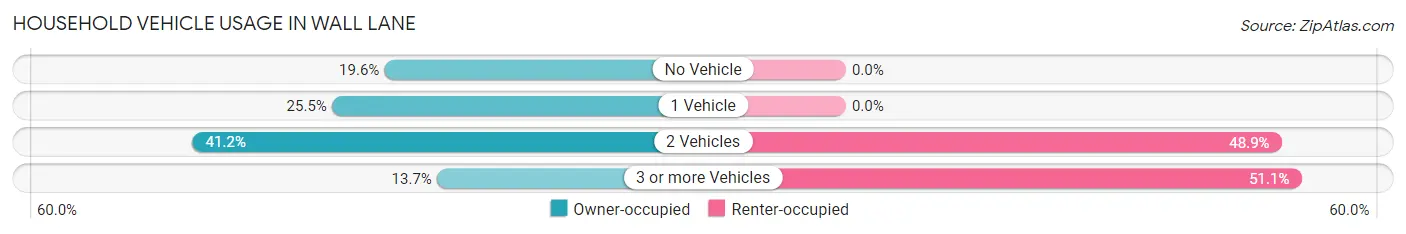
| Vehicles per Household | Owner-occupied | Renter-occupied |
| No Vehicle | 10 (19.6%) | 0 (0.0%) |
| 1 Vehicle | 13 (25.5%) | 0 (0.0%) |
| 2 Vehicles | 21 (41.2%) | 22 (48.9%) |
| 3 or more Vehicles | 7 (13.7%) | 23 (51.1%) |
| Total | 51 (100.0%) | 45 (100.0%) |
Real Estate & Mortgages in Wall Lane
Real Estate and Mortgage Overview in Wall Lane
| Characteristic | Without Mortgage | With Mortgage |
| Housing Units | 34 | 17 |
| Median Property Value | - | - |
| Median Household Income | - | - |
| Monthly Housing Costs | $231 | $0 |
| Real Estate Taxes | $1,078 | $10 |
Property Value by Mortgage Status in Wall Lane
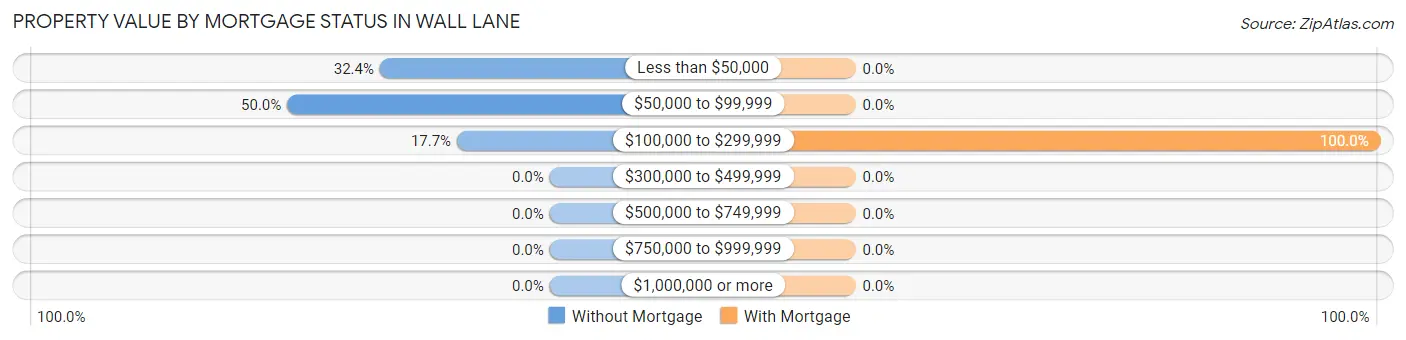
| Property Value | Without Mortgage | With Mortgage |
| Less than $50,000 | 11 (32.4%) | 0 (0.0%) |
| $50,000 to $99,999 | 17 (50.0%) | 0 (0.0%) |
| $100,000 to $299,999 | 6 (17.6%) | 17 (100.0%) |
| $300,000 to $499,999 | 0 (0.0%) | 0 (0.0%) |
| $500,000 to $749,999 | 0 (0.0%) | 0 (0.0%) |
| $750,000 to $999,999 | 0 (0.0%) | 0 (0.0%) |
| $1,000,000 or more | 0 (0.0%) | 0 (0.0%) |
| Total | 34 (100.0%) | 17 (100.0%) |
Household Income by Mortgage Status in Wall Lane
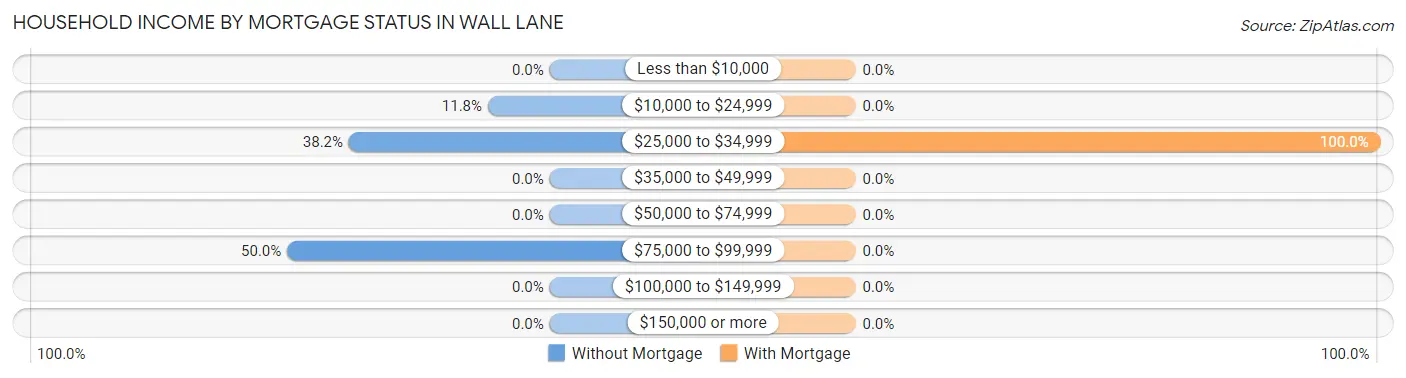
| Household Income | Without Mortgage | With Mortgage |
| Less than $10,000 | 0 (0.0%) | 0 (0.0%) |
| $10,000 to $24,999 | 4 (11.8%) | 0 (0.0%) |
| $25,000 to $34,999 | 13 (38.2%) | 17 (100.0%) |
| $35,000 to $49,999 | 0 (0.0%) | 0 (0.0%) |
| $50,000 to $74,999 | 0 (0.0%) | 0 (0.0%) |
| $75,000 to $99,999 | 17 (50.0%) | 0 (0.0%) |
| $100,000 to $149,999 | 0 (0.0%) | 0 (0.0%) |
| $150,000 or more | 0 (0.0%) | 0 (0.0%) |
| Total | 34 (100.0%) | 17 (100.0%) |
Property Value to Household Income Ratio in Wall Lane
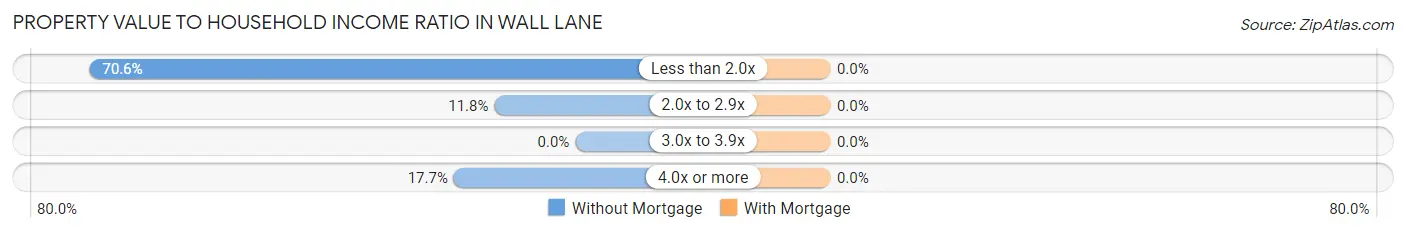
| Value-to-Income Ratio | Without Mortgage | With Mortgage |
| Less than 2.0x | 24 (70.6%) | 0 (0.0%) |
| 2.0x to 2.9x | 4 (11.8%) | 0 (0.0%) |
| 3.0x to 3.9x | 0 (0.0%) | 0 (0.0%) |
| 4.0x or more | 6 (17.6%) | 0 (0.0%) |
| Total | 34 (100.0%) | 17 (100.0%) |
Real Estate Taxes by Mortgage Status in Wall Lane
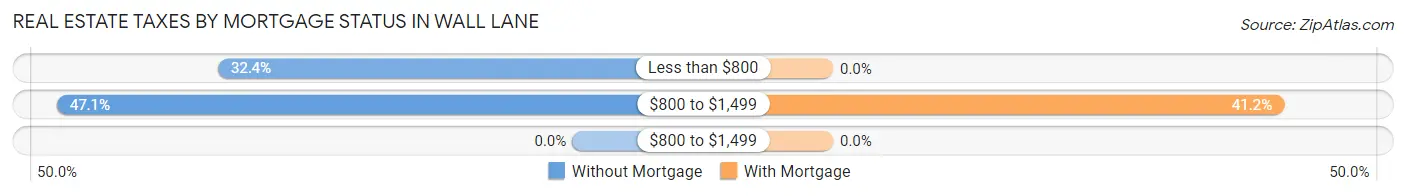
| Property Taxes | Without Mortgage | With Mortgage |
| Less than $800 | 11 (32.4%) | 0 (0.0%) |
| $800 to $1,499 | 16 (47.1%) | 7 (41.2%) |
| $800 to $1,499 | 0 (0.0%) | 0 (0.0%) |
| Total | 34 (100.0%) | 17 (100.0%) |
Health & Disability in Wall Lane
Health Insurance Coverage by Age in Wall Lane
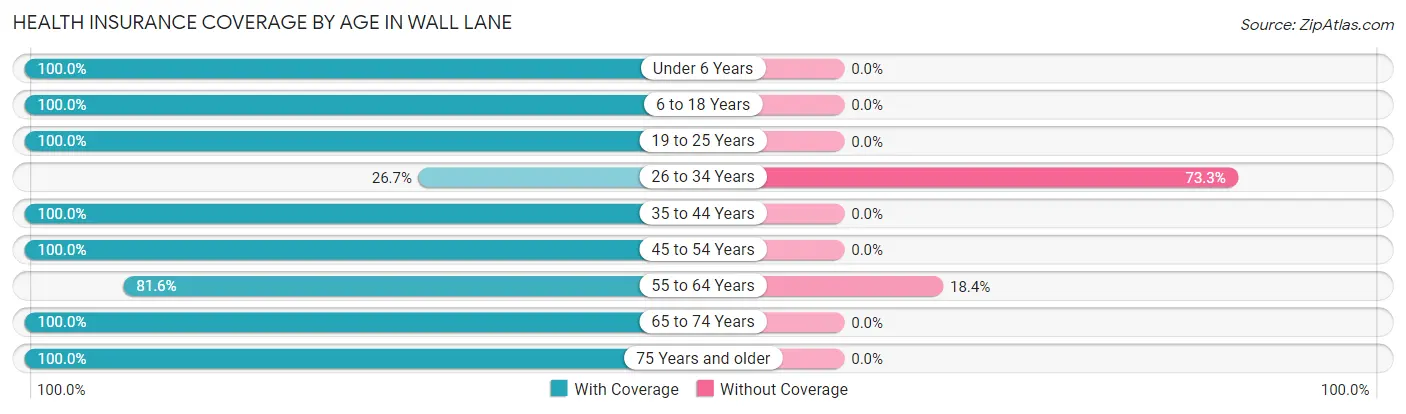
| Age Bracket | With Coverage | Without Coverage |
| Under 6 Years | 12 (100.0%) | 0 (0.0%) |
| 6 to 18 Years | 110 (100.0%) | 0 (0.0%) |
| 19 to 25 Years | 27 (100.0%) | 0 (0.0%) |
| 26 to 34 Years | 8 (26.7%) | 22 (73.3%) |
| 35 to 44 Years | 61 (100.0%) | 0 (0.0%) |
| 45 to 54 Years | 1 (100.0%) | 0 (0.0%) |
| 55 to 64 Years | 31 (81.6%) | 7 (18.4%) |
| 65 to 74 Years | 23 (100.0%) | 0 (0.0%) |
| 75 Years and older | 10 (100.0%) | 0 (0.0%) |
| Total | 283 (90.7%) | 29 (9.3%) |
Health Insurance Coverage by Citizenship Status in Wall Lane
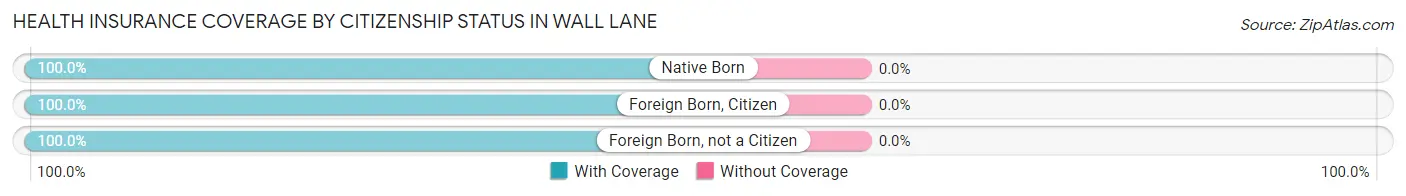
| Citizenship Status | With Coverage | Without Coverage |
| Native Born | 12 (100.0%) | 0 (0.0%) |
| Foreign Born, Citizen | 110 (100.0%) | 0 (0.0%) |
| Foreign Born, not a Citizen | 27 (100.0%) | 0 (0.0%) |
Health Insurance Coverage by Household Income in Wall Lane
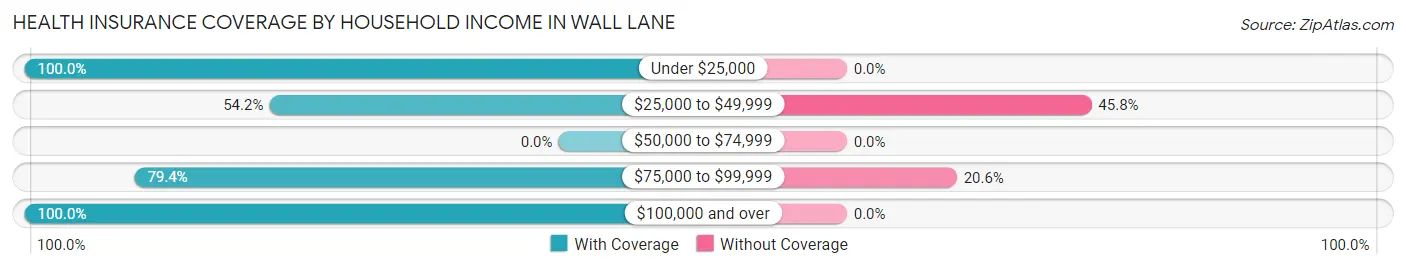
| Household Income | With Coverage | Without Coverage |
| Under $25,000 | 60 (100.0%) | 0 (0.0%) |
| $25,000 to $49,999 | 26 (54.2%) | 22 (45.8%) |
| $50,000 to $74,999 | 0 (0.0%) | 0 (0.0%) |
| $75,000 to $99,999 | 27 (79.4%) | 7 (20.6%) |
| $100,000 and over | 170 (100.0%) | 0 (0.0%) |
Public vs Private Health Insurance Coverage by Age in Wall Lane
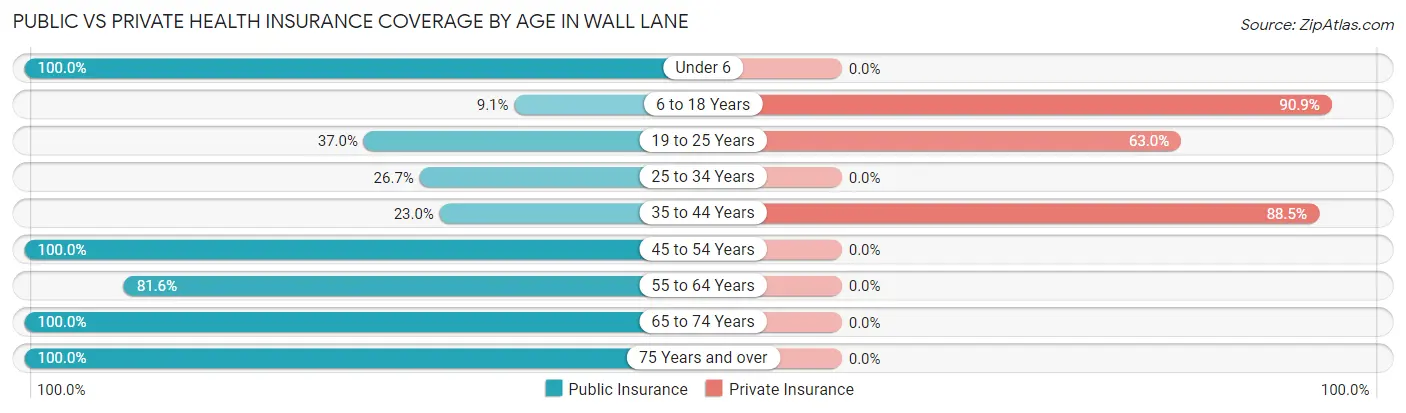
| Age Bracket | Public Insurance | Private Insurance |
| Under 6 | 12 (100.0%) | 0 (0.0%) |
| 6 to 18 Years | 10 (9.1%) | 100 (90.9%) |
| 19 to 25 Years | 10 (37.0%) | 17 (63.0%) |
| 25 to 34 Years | 8 (26.7%) | 0 (0.0%) |
| 35 to 44 Years | 14 (23.0%) | 54 (88.5%) |
| 45 to 54 Years | 1 (100.0%) | 0 (0.0%) |
| 55 to 64 Years | 31 (81.6%) | 0 (0.0%) |
| 65 to 74 Years | 23 (100.0%) | 0 (0.0%) |
| 75 Years and over | 10 (100.0%) | 0 (0.0%) |
| Total | 119 (38.1%) | 171 (54.8%) |
Disability Status by Sex by Age in Wall Lane
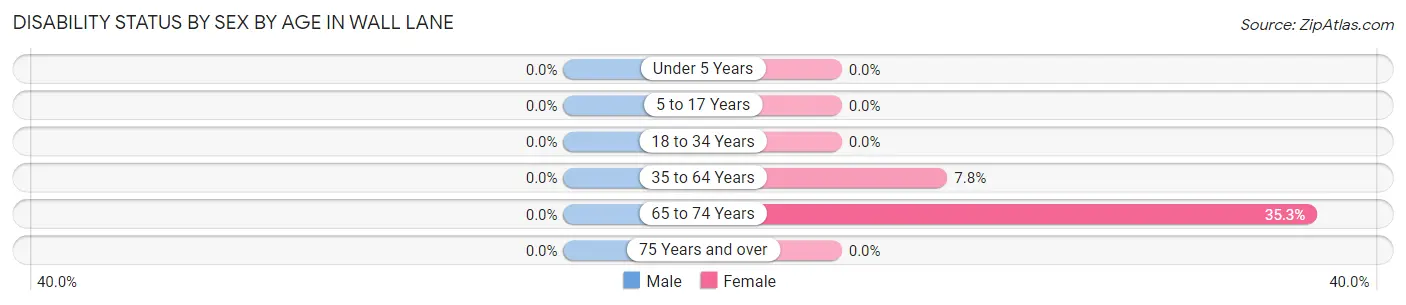
| Age Bracket | Male | Female |
| Under 5 Years | 0 (0.0%) | 0 (0.0%) |
| 5 to 17 Years | 0 (0.0%) | 0 (0.0%) |
| 18 to 34 Years | 0 (0.0%) | 0 (0.0%) |
| 35 to 64 Years | 0 (0.0%) | 4 (7.8%) |
| 65 to 74 Years | 0 (0.0%) | 6 (35.3%) |
| 75 Years and over | 0 (0.0%) | 0 (0.0%) |
Disability Class by Sex by Age in Wall Lane
Disability Class: Hearing Difficulty
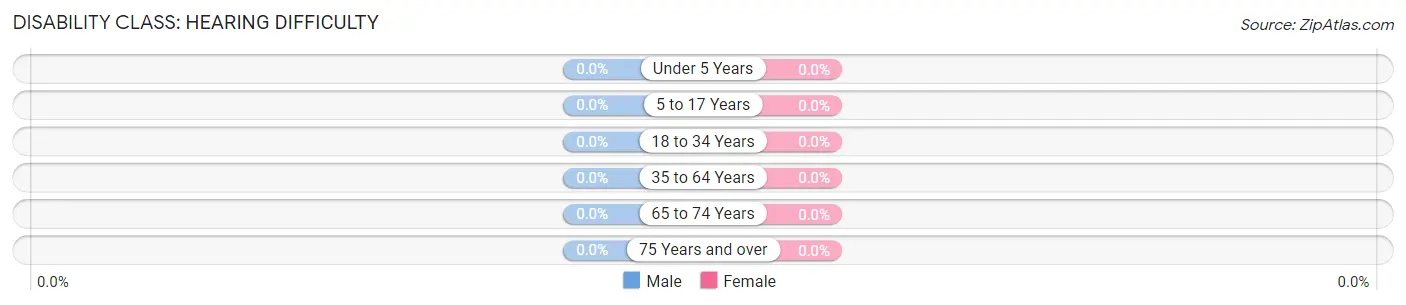
| Age Bracket | Male | Female |
| Under 5 Years | 0 (0.0%) | 0 (0.0%) |
| 5 to 17 Years | 0 (0.0%) | 0 (0.0%) |
| 18 to 34 Years | 0 (0.0%) | 0 (0.0%) |
| 35 to 64 Years | 0 (0.0%) | 0 (0.0%) |
| 65 to 74 Years | 0 (0.0%) | 0 (0.0%) |
| 75 Years and over | 0 (0.0%) | 0 (0.0%) |
Disability Class: Vision Difficulty
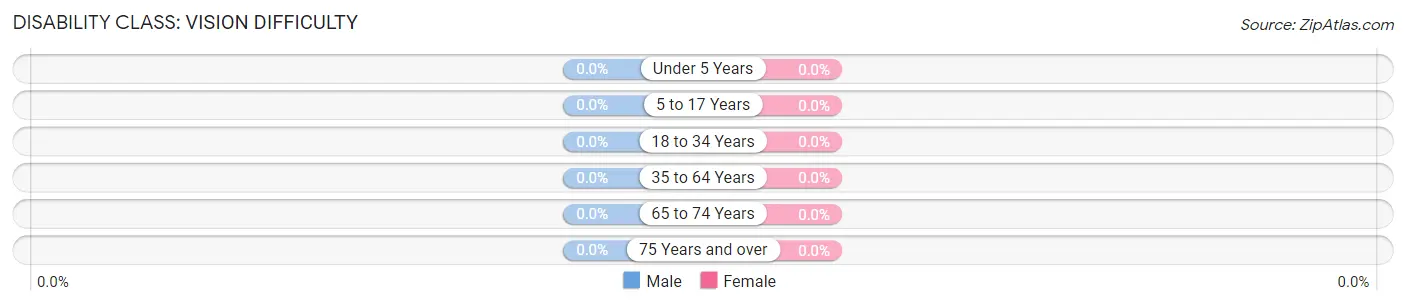
| Age Bracket | Male | Female |
| Under 5 Years | 0 (0.0%) | 0 (0.0%) |
| 5 to 17 Years | 0 (0.0%) | 0 (0.0%) |
| 18 to 34 Years | 0 (0.0%) | 0 (0.0%) |
| 35 to 64 Years | 0 (0.0%) | 0 (0.0%) |
| 65 to 74 Years | 0 (0.0%) | 0 (0.0%) |
| 75 Years and over | 0 (0.0%) | 0 (0.0%) |
Disability Class: Cognitive Difficulty

| Age Bracket | Male | Female |
| 5 to 17 Years | 0 (0.0%) | 0 (0.0%) |
| 18 to 34 Years | 0 (0.0%) | 0 (0.0%) |
| 35 to 64 Years | 0 (0.0%) | 0 (0.0%) |
| 65 to 74 Years | 0 (0.0%) | 0 (0.0%) |
| 75 Years and over | 0 (0.0%) | 0 (0.0%) |
Disability Class: Ambulatory Difficulty
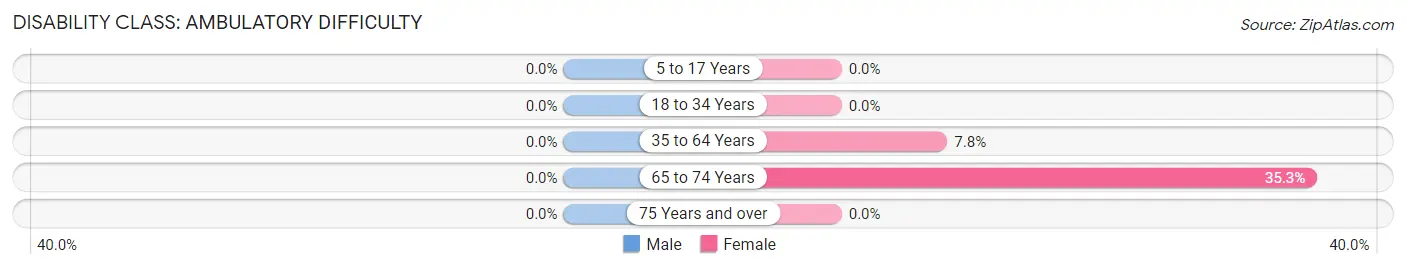
| Age Bracket | Male | Female |
| 5 to 17 Years | 0 (0.0%) | 0 (0.0%) |
| 18 to 34 Years | 0 (0.0%) | 0 (0.0%) |
| 35 to 64 Years | 0 (0.0%) | 4 (7.8%) |
| 65 to 74 Years | 0 (0.0%) | 6 (35.3%) |
| 75 Years and over | 0 (0.0%) | 0 (0.0%) |
Disability Class: Self-Care Difficulty
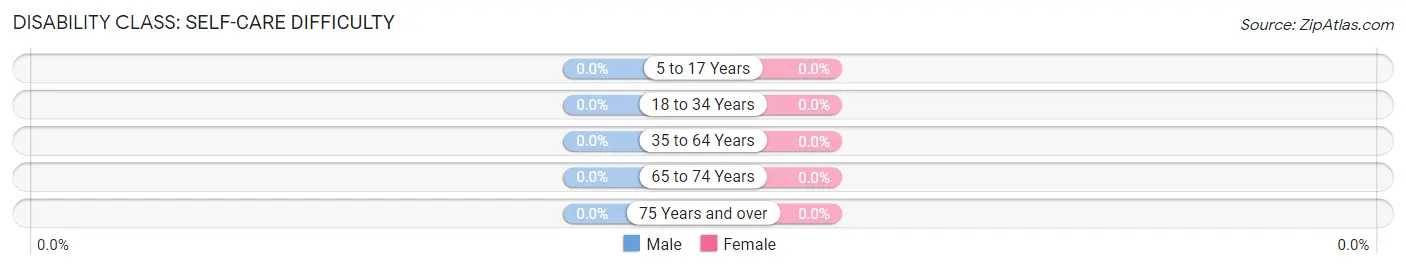
| Age Bracket | Male | Female |
| 5 to 17 Years | 0 (0.0%) | 0 (0.0%) |
| 18 to 34 Years | 0 (0.0%) | 0 (0.0%) |
| 35 to 64 Years | 0 (0.0%) | 0 (0.0%) |
| 65 to 74 Years | 0 (0.0%) | 0 (0.0%) |
| 75 Years and over | 0 (0.0%) | 0 (0.0%) |
Technology Access in Wall Lane
Computing Device Access in Wall Lane
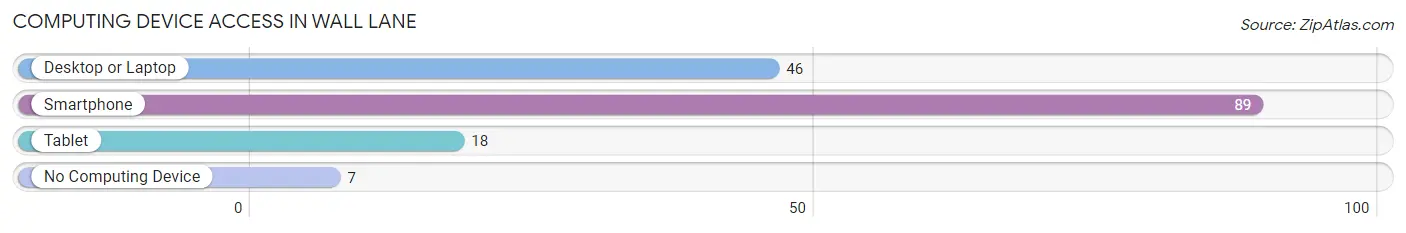
| Device Type | # Households | % Households |
| Desktop or Laptop | 46 | 47.9% |
| Smartphone | 89 | 92.7% |
| Tablet | 18 | 18.8% |
| No Computing Device | 7 | 7.3% |
| Total | 96 | 100.0% |
Internet Access in Wall Lane
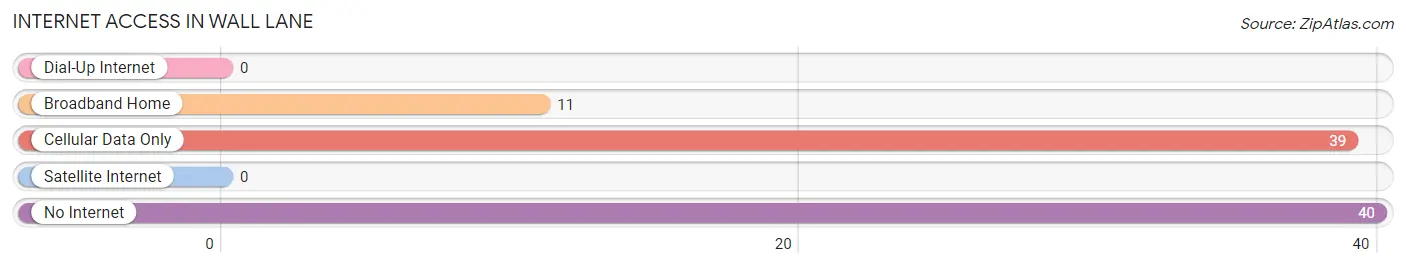
| Internet Type | # Households | % Households |
| Dial-Up Internet | 0 | 0.0% |
| Broadband Home | 11 | 11.5% |
| Cellular Data Only | 39 | 40.6% |
| Satellite Internet | 0 | 0.0% |
| No Internet | 40 | 41.7% |
| Total | 96 | 100.0% |
Wall Lane Summary
Wall Lane is a small town located in the state of Arizona, in the United States of America. It is situated in the northern part of the state, in the county of Coconino. The town is located in a rural area, surrounded by mountains and forests. The population of Wall Lane was estimated to be around 1,000 people in 2020.
Geography
Wall Lane is located in the northern part of Arizona, in the county of Coconino. The town is situated in a rural area, surrounded by mountains and forests. The town is located at an elevation of 5,000 feet above sea level. The climate in Wall Lane is semi-arid, with hot summers and cold winters. The average annual temperature is around 60 degrees Fahrenheit. The town receives an average of 12 inches of precipitation per year.
Economy
The economy of Wall Lane is largely based on agriculture and tourism. The town is home to several farms, which produce a variety of crops, including corn, wheat, and hay. The town also has a few small businesses, such as restaurants, stores, and gas stations. Tourism is also an important part of the local economy, as the town is located near several popular tourist attractions, such as the Grand Canyon and the Petrified Forest National Park.
Demographics
The population of Wall Lane was estimated to be around 1,000 people in 2020. The majority of the population is white, with a small percentage of African Americans, Native Americans, and Hispanics. The median household income in Wall Lane is around $50,000 per year. The town has a high rate of poverty, with around 25% of the population living below the poverty line.
History
Wall Lane was founded in the late 1800s by a group of settlers from the Midwest. The town was originally called Wall Street, but the name was changed to Wall Lane in the early 1900s. The town was a popular stop for travelers on their way to the Grand Canyon and other nearby attractions. In the early 1900s, the town was home to several businesses, including a hotel, a general store, and a post office.
In the late 1900s, the town began to decline as the population moved away to larger cities. The town was eventually abandoned in the early 2000s. In recent years, the town has seen a resurgence in population, as people have moved back to the area to take advantage of the rural lifestyle and the nearby attractions.
Wall Lane is a small town with a rich history and a unique culture. The town is home to a diverse population and a variety of businesses. The town is also located near some of the most beautiful natural attractions in the state of Arizona. Wall Lane is a great place to visit and explore, and it is sure to provide an unforgettable experience.
Common Questions
What is Per Capita Income in Wall Lane?
Per Capita income in Wall Lane is $17,145.
What is the Median Family Income in Wall Lane?
Median Family Income in Wall Lane is $90,357.
What is the Median Household income in Wall Lane?
Median Household Income in Wall Lane is $44,091.
What is Inequality or Gini Index in Wall Lane?
Inequality or Gini Index in Wall Lane is 0.33.
What is the Total Population of Wall Lane?
Total Population of Wall Lane is 312.
What is the Total Male Population of Wall Lane?
Total Male Population of Wall Lane is 140.
What is the Total Female Population of Wall Lane?
Total Female Population of Wall Lane is 172.
What is the Ratio of Males per 100 Females in Wall Lane?
There are 81.40 Males per 100 Females in Wall Lane.
What is the Ratio of Females per 100 Males in Wall Lane?
There are 122.86 Females per 100 Males in Wall Lane.
What is the Median Population Age in Wall Lane?
Median Population Age in Wall Lane is 26.3 Years.
What is the Average Family Size in Wall Lane
Average Family Size in Wall Lane is 4.7 People.
What is the Average Household Size in Wall Lane
Average Household Size in Wall Lane is 3.2 People.
How Large is the Labor Force in Wall Lane?
There are 125 People in the Labor Forcein in Wall Lane.
What is the Percentage of People in the Labor Force in Wall Lane?
65.8% of People are in the Labor Force in Wall Lane.
What is the Unemployment Rate in Wall Lane?
Unemployment Rate in Wall Lane is 13.6%.