Silver Peak, NV Map & Demographics
Silver Peak Map
Silver Peak Overview
$35,061
PER CAPITA INCOME
$102,917
AVG FAMILY INCOME
$80,208
AVG HOUSEHOLD INCOME
80.6%
WAGE / INCOME GAP [ % ]
19.4¢/ $1
WAGE / INCOME GAP [ $ ]
0.20
INEQUALITY / GINI INDEX
213
TOTAL POPULATION
71
MALE POPULATION
142
FEMALE POPULATION
50.00
MALES / 100 FEMALES
200.00
FEMALES / 100 MALES
51.9
MEDIAN AGE
4.0
AVG FAMILY SIZE
2.9
AVG HOUSEHOLD SIZE
156
LABOR FORCE [ PEOPLE ]
75.0%
PERCENT IN LABOR FORCE
3.2%
UNEMPLOYMENT RATE
Income in Silver Peak
Income Overview in Silver Peak
Per Capita Income in Silver Peak is $35,061, while median incomes of families and households are $102,917 and $80,208 respectively.
| Characteristic | Number | Measure |
| Per Capita Income | 213 | $35,061 |
| Median Family Income | 41 | $102,917 |
| Mean Family Income | 41 | $98,963 |
| Median Household Income | 73 | $80,208 |
| Mean Household Income | 73 | $85,340 |
| Income Deficit | 41 | $0 |
| Wage / Income Gap (%) | 213 | 80.55% |
| Wage / Income Gap ($) | 213 | 19.45¢ per $1 |
| Gini / Inequality Index | 213 | 0.20 |
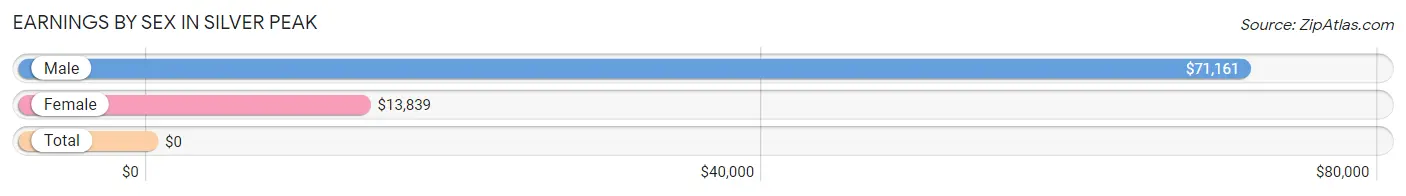
Earnings by Sex in Silver Peak
| Sex | Number | Average Earnings |
| Male | 61 (39.1%) | $71,161 |
| Female | 95 (60.9%) | $13,839 |
| Total | 156 (100.0%) | $0 |
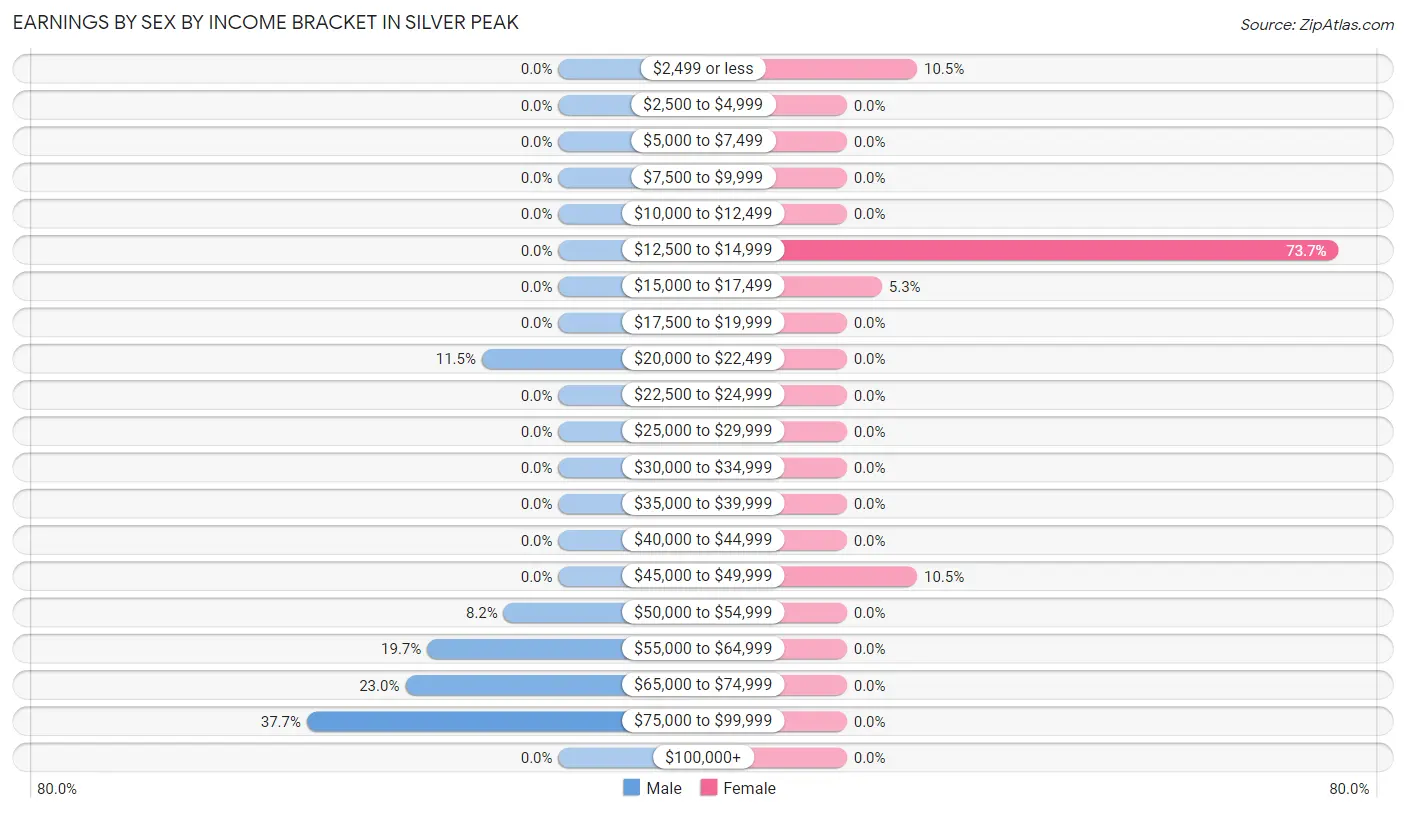
Earnings by Sex by Income Bracket in Silver Peak
The most common earnings brackets in Silver Peak are $75,000 to $99,999 for men (23 | 37.7%) and $12,500 to $14,999 for women (70 | 73.7%).
| Income | Male | Female |
| $2,499 or less | 0 (0.0%) | 10 (10.5%) |
| $2,500 to $4,999 | 0 (0.0%) | 0 (0.0%) |
| $5,000 to $7,499 | 0 (0.0%) | 0 (0.0%) |
| $7,500 to $9,999 | 0 (0.0%) | 0 (0.0%) |
| $10,000 to $12,499 | 0 (0.0%) | 0 (0.0%) |
| $12,500 to $14,999 | 0 (0.0%) | 70 (73.7%) |
| $15,000 to $17,499 | 0 (0.0%) | 5 (5.3%) |
| $17,500 to $19,999 | 0 (0.0%) | 0 (0.0%) |
| $20,000 to $22,499 | 7 (11.5%) | 0 (0.0%) |
| $22,500 to $24,999 | 0 (0.0%) | 0 (0.0%) |
| $25,000 to $29,999 | 0 (0.0%) | 0 (0.0%) |
| $30,000 to $34,999 | 0 (0.0%) | 0 (0.0%) |
| $35,000 to $39,999 | 0 (0.0%) | 0 (0.0%) |
| $40,000 to $44,999 | 0 (0.0%) | 0 (0.0%) |
| $45,000 to $49,999 | 0 (0.0%) | 10 (10.5%) |
| $50,000 to $54,999 | 5 (8.2%) | 0 (0.0%) |
| $55,000 to $64,999 | 12 (19.7%) | 0 (0.0%) |
| $65,000 to $74,999 | 14 (23.0%) | 0 (0.0%) |
| $75,000 to $99,999 | 23 (37.7%) | 0 (0.0%) |
| $100,000+ | 0 (0.0%) | 0 (0.0%) |
| Total | 61 (100.0%) | 95 (100.0%) |
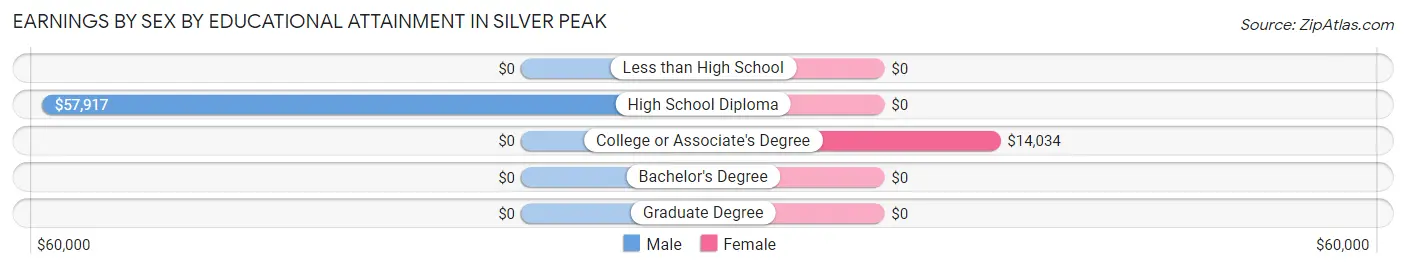
Earnings by Sex by Educational Attainment in Silver Peak
Average earnings in Silver Peak are $71,161 for men and $14,018 for women, a difference of 80.3%. Men with an educational attainment of high school diploma enjoy the highest average annual earnings of $57,917, while those with high school diploma education earn the least with $57,917. Women with an educational attainment of college or associate's degree earn the most with the average annual earnings of $14,034, while those with college or associate's degree education have the smallest earnings of $14,034.
| Educational Attainment | Male Income | Female Income |
| Less than High School | - | - |
| High School Diploma | $57,917 | $0 |
| College or Associate's Degree | - | - |
| Bachelor's Degree | - | - |
| Graduate Degree | - | - |
| Total | $71,161 | $14,018 |
Family Income in Silver Peak
Family Income Brackets in Silver Peak
According to the Silver Peak family income data, there are 15 families falling into the $100,000 to $149,999 income range, which is the most common income bracket and makes up 36.6% of all families.
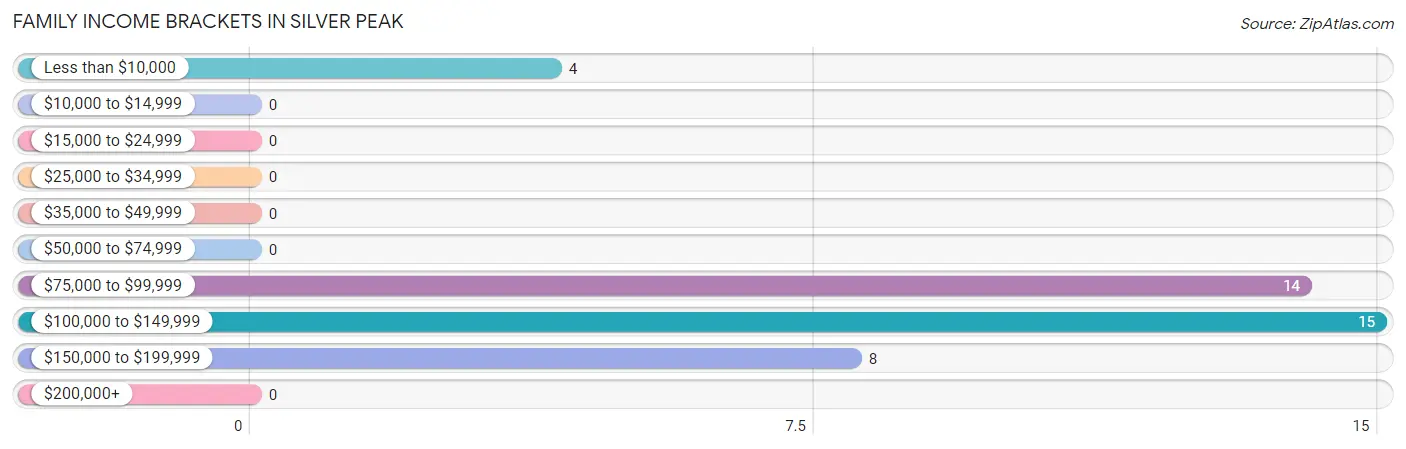
| Income Bracket | # Families | % Families |
| Less than $10,000 | 4 | 9.8% |
| $10,000 to $14,999 | 0 | 0.0% |
| $15,000 to $24,999 | 0 | 0.0% |
| $25,000 to $34,999 | 0 | 0.0% |
| $35,000 to $49,999 | 0 | 0.0% |
| $50,000 to $74,999 | 0 | 0.0% |
| $75,000 to $99,999 | 14 | 34.1% |
| $100,000 to $149,999 | 15 | 36.6% |
| $150,000 to $199,999 | 8 | 19.5% |
| $200,000+ | 0 | 0.0% |
Family Income by Famaliy Size in Silver Peak
2-person families (26 | 63.4%) account for the highest median family income in Silver Peak with $98,438 per family, while 2-person families (26 | 63.4%) have the highest median income of $49,219 per family member.
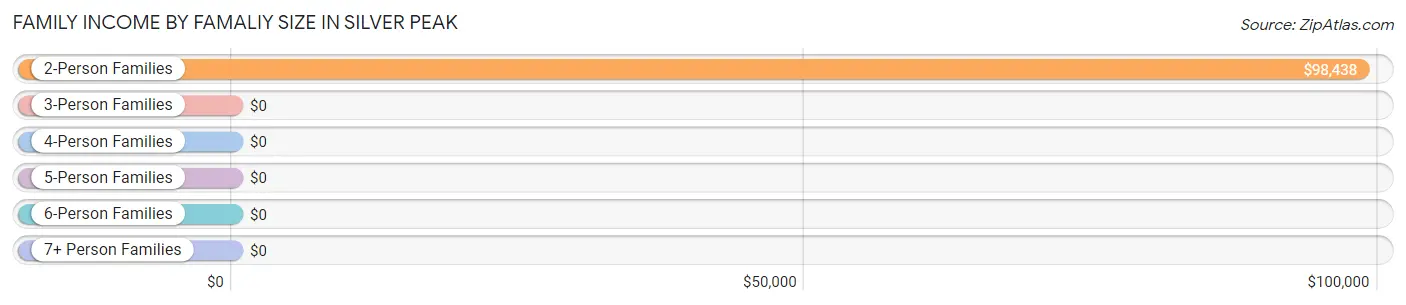
| Income Bracket | # Families | Median Income |
| 2-Person Families | 26 (63.4%) | $98,438 |
| 3-Person Families | 0 (0.0%) | $0 |
| 4-Person Families | 15 (36.6%) | $0 |
| 5-Person Families | 0 (0.0%) | $0 |
| 6-Person Families | 0 (0.0%) | $0 |
| 7+ Person Families | 0 (0.0%) | $0 |
| Total | 41 (100.0%) | $102,917 |
Family Income by Number of Earners in Silver Peak
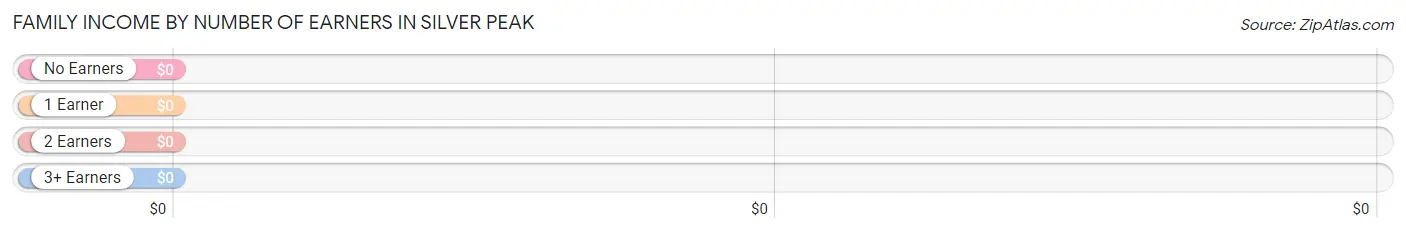
| Number of Earners | # Families | Median Income |
| No Earners | 12 (29.3%) | $0 |
| 1 Earner | 14 (34.2%) | $0 |
| 2 Earners | 0 (0.0%) | $0 |
| 3+ Earners | 15 (36.6%) | $0 |
| Total | 41 (100.0%) | $102,917 |
Household Income in Silver Peak
Household Income Brackets in Silver Peak
With 29 households falling in the category, the $50,000 to $74,999 income range is the most frequent in Silver Peak, accounting for 39.7% of all households.
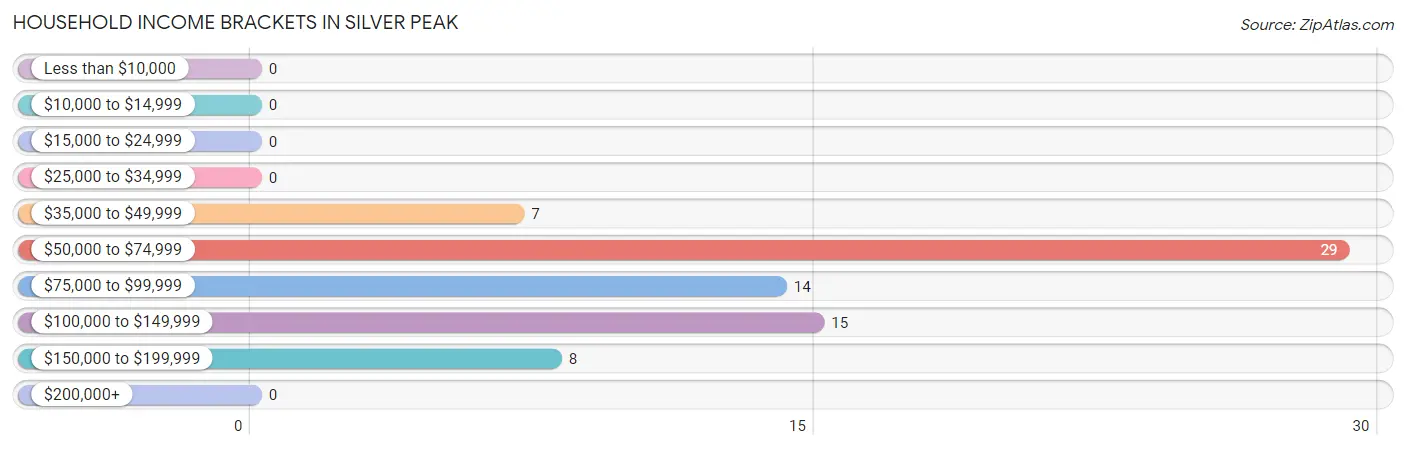
| Income Bracket | # Households | % Households |
| Less than $10,000 | 0 | 0.0% |
| $10,000 to $14,999 | 0 | 0.0% |
| $15,000 to $24,999 | 0 | 0.0% |
| $25,000 to $34,999 | 0 | 0.0% |
| $35,000 to $49,999 | 7 | 9.6% |
| $50,000 to $74,999 | 29 | 39.7% |
| $75,000 to $99,999 | 14 | 19.2% |
| $100,000 to $149,999 | 15 | 20.5% |
| $150,000 to $199,999 | 8 | 11.0% |
| $200,000+ | 0 | 0.0% |
Household Income by Householder Age in Silver Peak
The median household income in Silver Peak is $80,208, with the highest median household income of $72,105 found in the 25 to 44 years age bracket for the primary householder. A total of 52 households (71.2%) fall into this category.
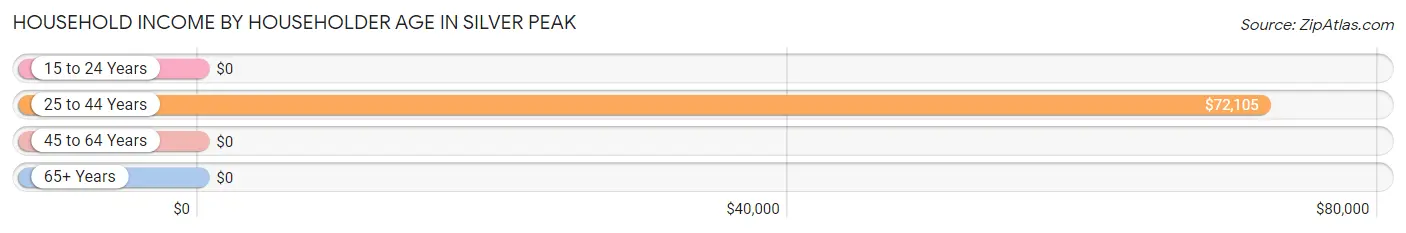
| Income Bracket | # Households | Median Income |
| 15 to 24 Years | 0 (0.0%) | $0 |
| 25 to 44 Years | 52 (71.2%) | $72,105 |
| 45 to 64 Years | 7 (9.6%) | $0 |
| 65+ Years | 14 (19.2%) | $0 |
| Total | 73 (100.0%) | $80,208 |
Poverty in Silver Peak
Income Below Poverty by Sex and Age in Silver Peak
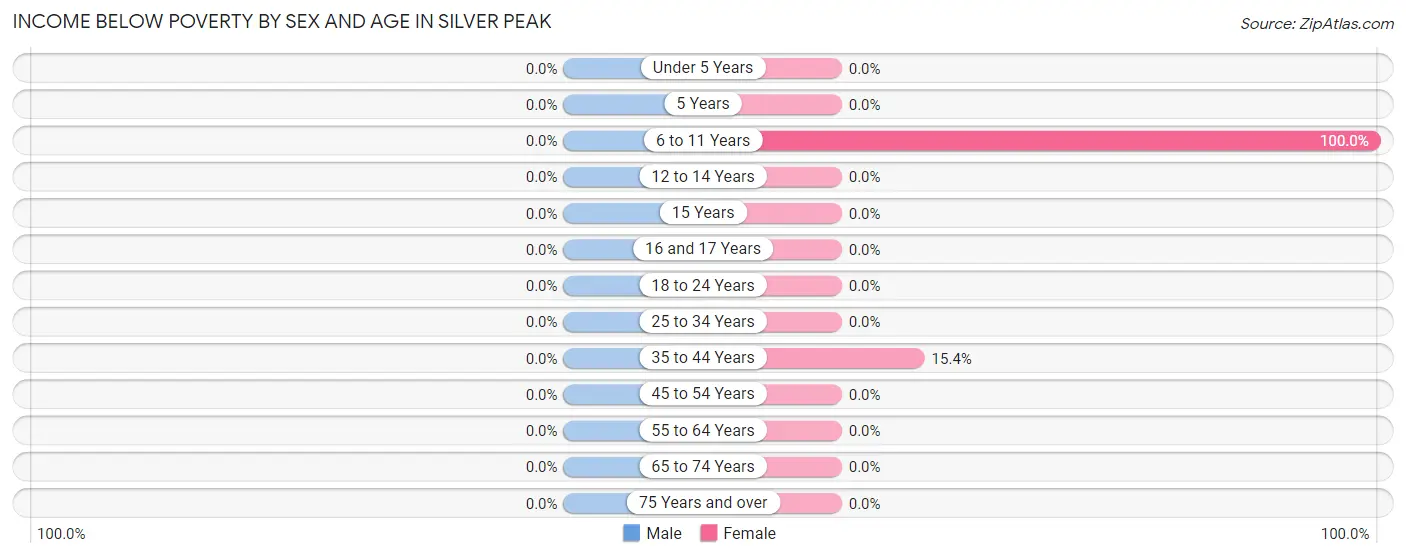
| Age Bracket | Male | Female |
| Under 5 Years | 0 (0.0%) | 0 (0.0%) |
| 5 Years | 0 (0.0%) | 0 (0.0%) |
| 6 to 11 Years | 0 (0.0%) | 5 (100.0%) |
| 12 to 14 Years | 0 (0.0%) | 0 (0.0%) |
| 15 Years | 0 (0.0%) | 0 (0.0%) |
| 16 and 17 Years | 0 (0.0%) | 0 (0.0%) |
| 18 to 24 Years | 0 (0.0%) | 0 (0.0%) |
| 25 to 34 Years | 0 (0.0%) | 0 (0.0%) |
| 35 to 44 Years | 0 (0.0%) | 4 (15.4%) |
| 45 to 54 Years | 0 (0.0%) | 0 (0.0%) |
| 55 to 64 Years | 0 (0.0%) | 0 (0.0%) |
| 65 to 74 Years | 0 (0.0%) | 0 (0.0%) |
| 75 Years and over | 0 (0.0%) | 0 (0.0%) |
| Total | 0 (0.0%) | 9 (6.3%) |
Income Above Poverty by Sex and Age in Silver Peak
According to the poverty statistics in Silver Peak, males aged 25 to 34 years and females aged 16 and 17 years are the age groups that are most secure financially, with 100.0% of males and 100.0% of females in these age groups living above the poverty line.
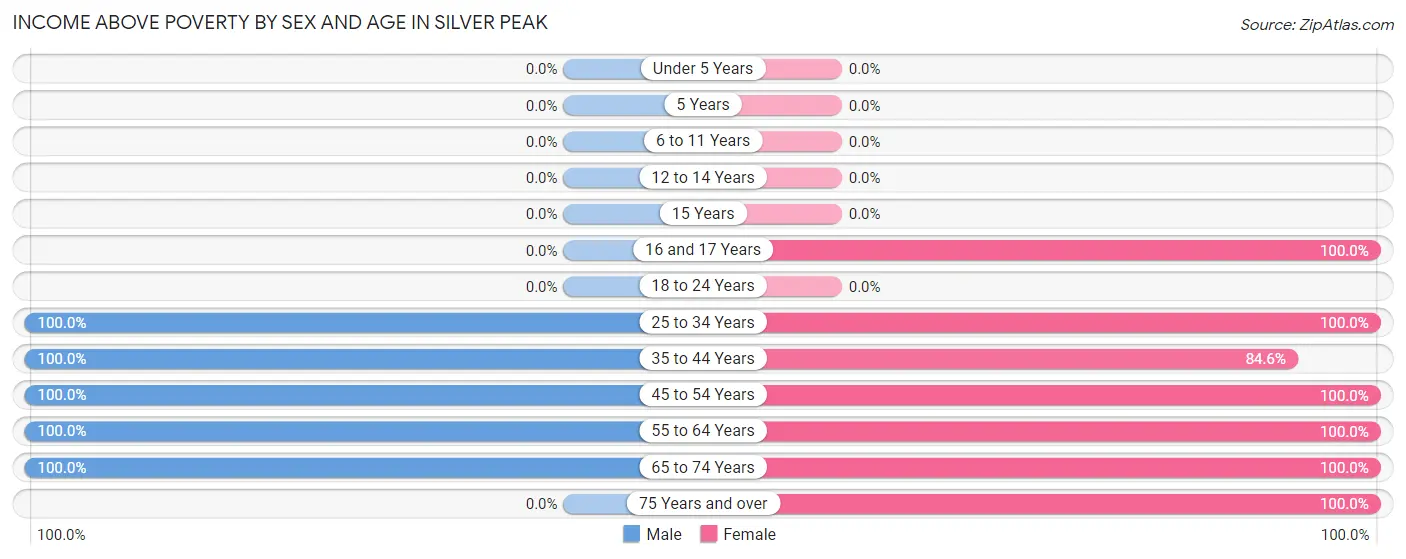
| Age Bracket | Male | Female |
| Under 5 Years | 0 (0.0%) | 0 (0.0%) |
| 5 Years | 0 (0.0%) | 0 (0.0%) |
| 6 to 11 Years | 0 (0.0%) | 0 (0.0%) |
| 12 to 14 Years | 0 (0.0%) | 0 (0.0%) |
| 15 Years | 0 (0.0%) | 0 (0.0%) |
| 16 and 17 Years | 0 (0.0%) | 10 (100.0%) |
| 18 to 24 Years | 0 (0.0%) | 0 (0.0%) |
| 25 to 34 Years | 20 (100.0%) | 11 (100.0%) |
| 35 to 44 Years | 28 (100.0%) | 22 (84.6%) |
| 45 to 54 Years | 7 (100.0%) | 66 (100.0%) |
| 55 to 64 Years | 6 (100.0%) | 10 (100.0%) |
| 65 to 74 Years | 10 (100.0%) | 8 (100.0%) |
| 75 Years and over | 0 (0.0%) | 6 (100.0%) |
| Total | 71 (100.0%) | 133 (93.7%) |
Income Below Poverty Among Married-Couple Families in Silver Peak
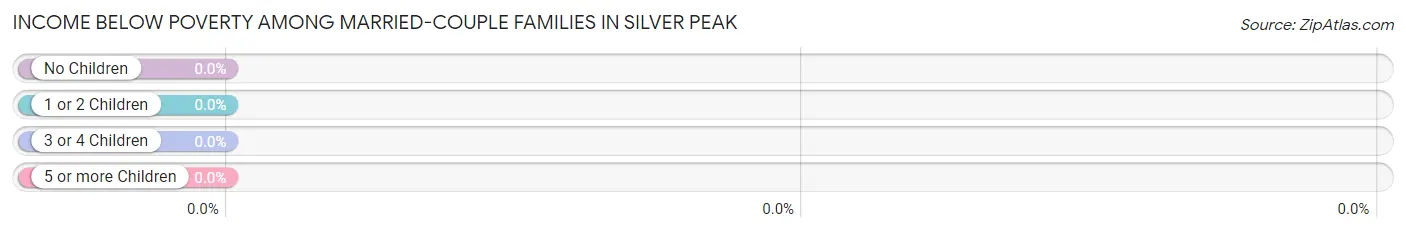
| Children | Above Poverty | Below Poverty |
| No Children | 16 (100.0%) | 0 (0.0%) |
| 1 or 2 Children | 15 (100.0%) | 0 (0.0%) |
| 3 or 4 Children | 0 (0.0%) | 0 (0.0%) |
| 5 or more Children | 0 (0.0%) | 0 (0.0%) |
| Total | 31 (100.0%) | 0 (0.0%) |
Income Below Poverty Among Single-Parent Households in Silver Peak
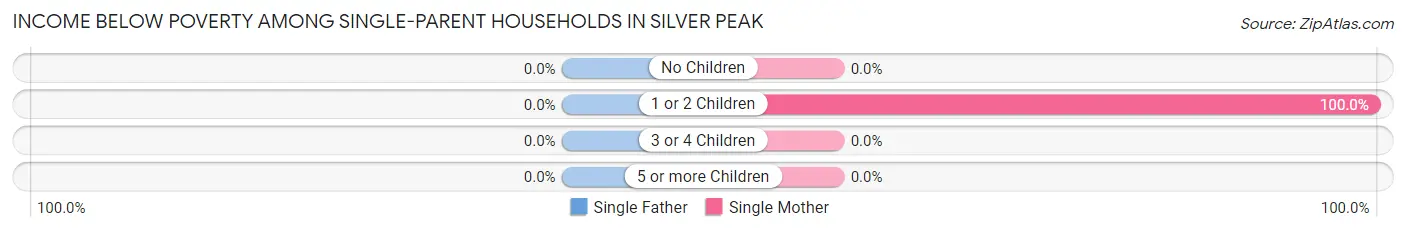
| Children | Single Father | Single Mother |
| No Children | 0 (0.0%) | 0 (0.0%) |
| 1 or 2 Children | 0 (0.0%) | 4 (100.0%) |
| 3 or 4 Children | 0 (0.0%) | 0 (0.0%) |
| 5 or more Children | 0 (0.0%) | 0 (0.0%) |
| Total | 0 (0.0%) | 4 (40.0%) |
Income Below Poverty Among Married-Couple vs Single-Parent Households in Silver Peak
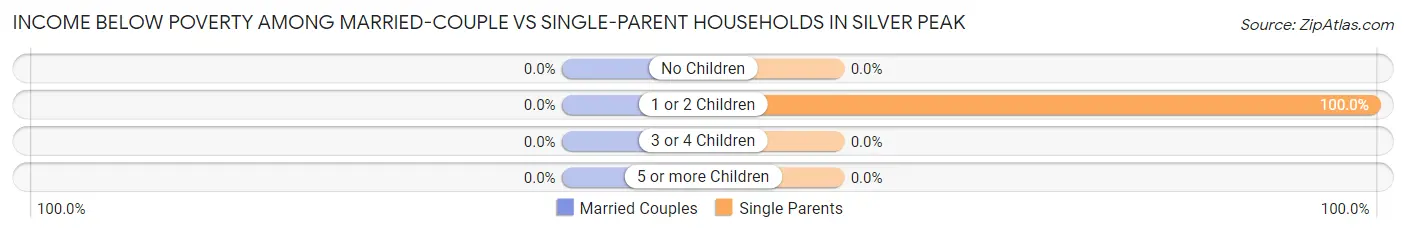
| Children | Married-Couple Families | Single-Parent Households |
| No Children | 0 (0.0%) | 0 (0.0%) |
| 1 or 2 Children | 0 (0.0%) | 4 (100.0%) |
| 3 or 4 Children | 0 (0.0%) | 0 (0.0%) |
| 5 or more Children | 0 (0.0%) | 0 (0.0%) |
| Total | 0 (0.0%) | 4 (40.0%) |
Race in Silver Peak
The most populous races in Silver Peak are , and White / Caucasian (213 | 100.0%).
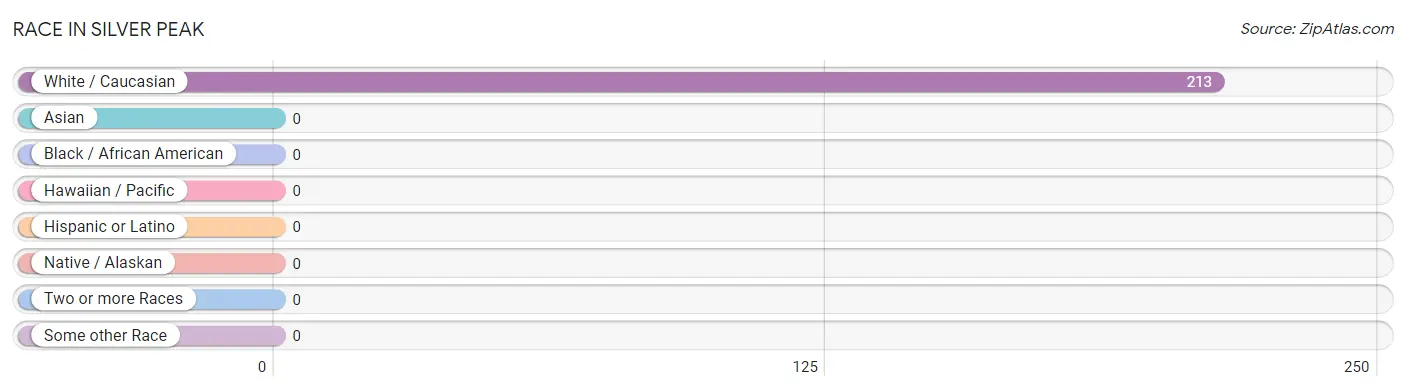
| Race | # Population | % Population |
| Asian | 0 | 0.0% |
| Black / African American | 0 | 0.0% |
| Hawaiian / Pacific | 0 | 0.0% |
| Hispanic or Latino | 0 | 0.0% |
| Native / Alaskan | 0 | 0.0% |
| White / Caucasian | 213 | 100.0% |
| Two or more Races | 0 | 0.0% |
| Some other Race | 0 | 0.0% |
| Total | 213 | 100.0% |
Ancestry in Silver Peak
The most populous ancestries reported in Silver Peak are German (99 | 46.5%), Swedish (91 | 42.7%), Scottish (24 | 11.3%), Portuguese (14 | 6.6%), and English (10 | 4.7%), together accounting for 111.7% of all Silver Peak residents.
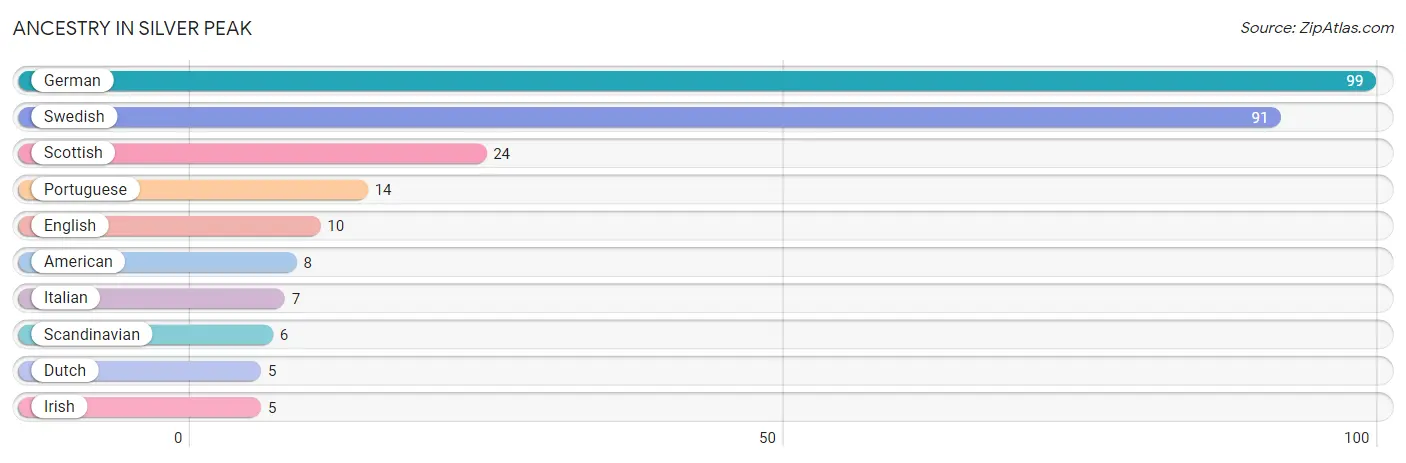
| Ancestry | # Population | % Population |
| American | 8 | 3.8% |
| Dutch | 5 | 2.4% |
| English | 10 | 4.7% |
| German | 99 | 46.5% |
| Irish | 5 | 2.4% |
| Italian | 7 | 3.3% |
| Portuguese | 14 | 6.6% |
| Scandinavian | 6 | 2.8% |
| Scottish | 24 | 11.3% |
| Swedish | 91 | 42.7% | View All 10 Rows |
Immigrants in Silver Peak

| Immigration Origin | # Population | % Population | View All 0 Rows |
Sex and Age in Silver Peak
Sex and Age in Silver Peak
The most populous age groups in Silver Peak are 40 to 44 Years (22 | 31.0%) for men and 50 to 54 Years (66 | 46.5%) for women.
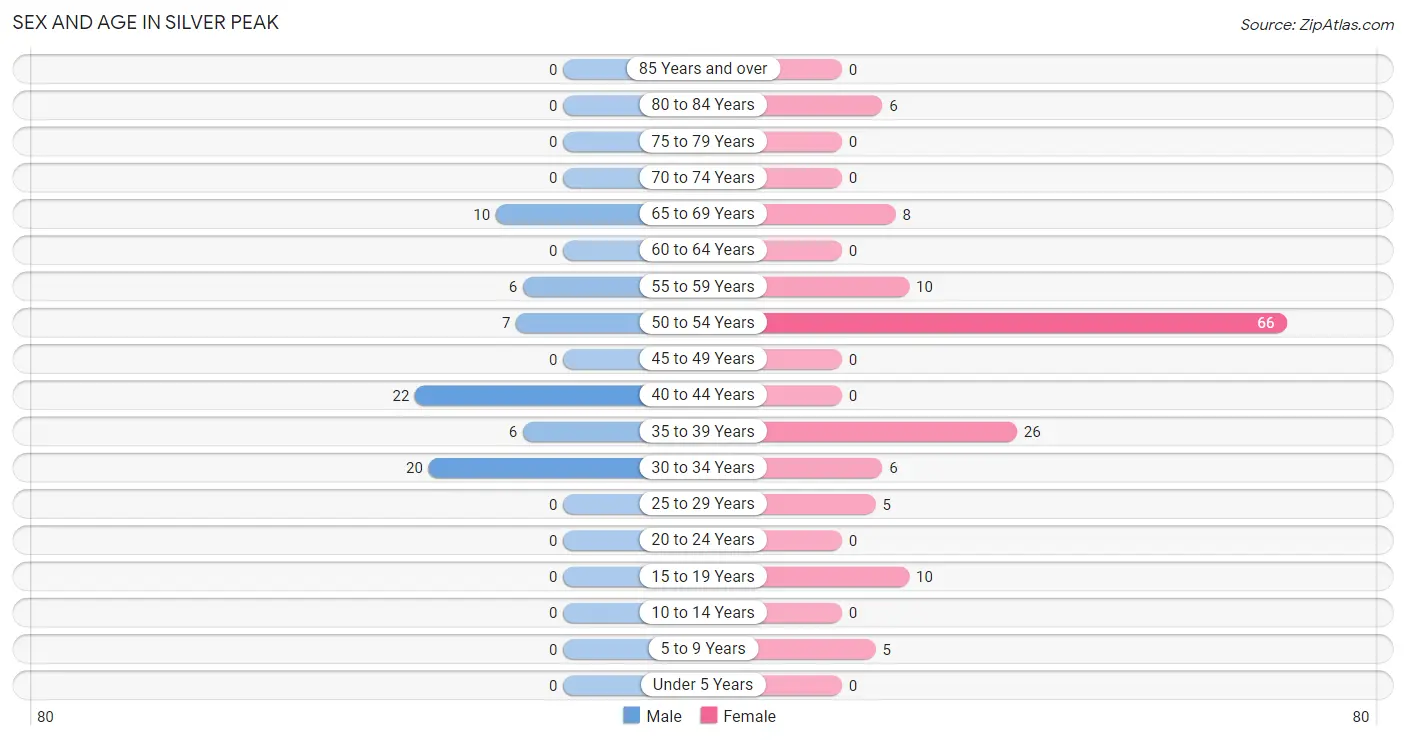
| Age Bracket | Male | Female |
| Under 5 Years | 0 (0.0%) | 0 (0.0%) |
| 5 to 9 Years | 0 (0.0%) | 5 (3.5%) |
| 10 to 14 Years | 0 (0.0%) | 0 (0.0%) |
| 15 to 19 Years | 0 (0.0%) | 10 (7.0%) |
| 20 to 24 Years | 0 (0.0%) | 0 (0.0%) |
| 25 to 29 Years | 0 (0.0%) | 5 (3.5%) |
| 30 to 34 Years | 20 (28.2%) | 6 (4.2%) |
| 35 to 39 Years | 6 (8.5%) | 26 (18.3%) |
| 40 to 44 Years | 22 (31.0%) | 0 (0.0%) |
| 45 to 49 Years | 0 (0.0%) | 0 (0.0%) |
| 50 to 54 Years | 7 (9.9%) | 66 (46.5%) |
| 55 to 59 Years | 6 (8.5%) | 10 (7.0%) |
| 60 to 64 Years | 0 (0.0%) | 0 (0.0%) |
| 65 to 69 Years | 10 (14.1%) | 8 (5.6%) |
| 70 to 74 Years | 0 (0.0%) | 0 (0.0%) |
| 75 to 79 Years | 0 (0.0%) | 0 (0.0%) |
| 80 to 84 Years | 0 (0.0%) | 6 (4.2%) |
| 85 Years and over | 0 (0.0%) | 0 (0.0%) |
| Total | 71 (100.0%) | 142 (100.0%) |
Families and Households in Silver Peak
Median Family Size in Silver Peak
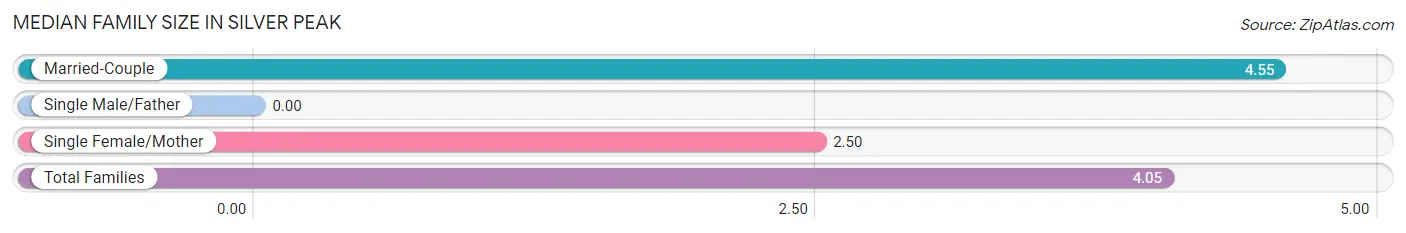
| Family Type | # Families | Family Size |
| Married-Couple | 31 (75.6%) | 4.55 |
| Single Male/Father | 0 (0.0%) | - |
| Single Female/Mother | 10 (24.4%) | 2.50 |
| Total Families | 41 (100.0%) | 4.05 |
Median Household Size in Silver Peak
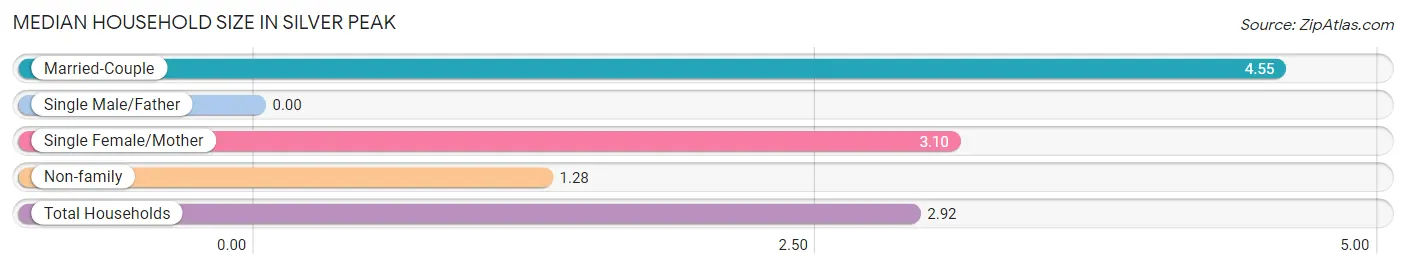
| Household Type | # Households | Household Size |
| Married-Couple | 31 (42.5%) | 4.55 |
| Single Male/Father | 0 (0.0%) | - |
| Single Female/Mother | 10 (13.7%) | 3.10 |
| Non-family | 32 (43.8%) | 1.28 |
| Total Households | 73 (100.0%) | 2.92 |
Household Size by Marriage Status in Silver Peak
Out of a total of 73 households in Silver Peak, 41 (56.2%) are family households, while 32 (43.8%) are nonfamily households. The most numerous type of family households are 2-person households, comprising 22, and the most common type of nonfamily households are 1-person households, comprising 20.
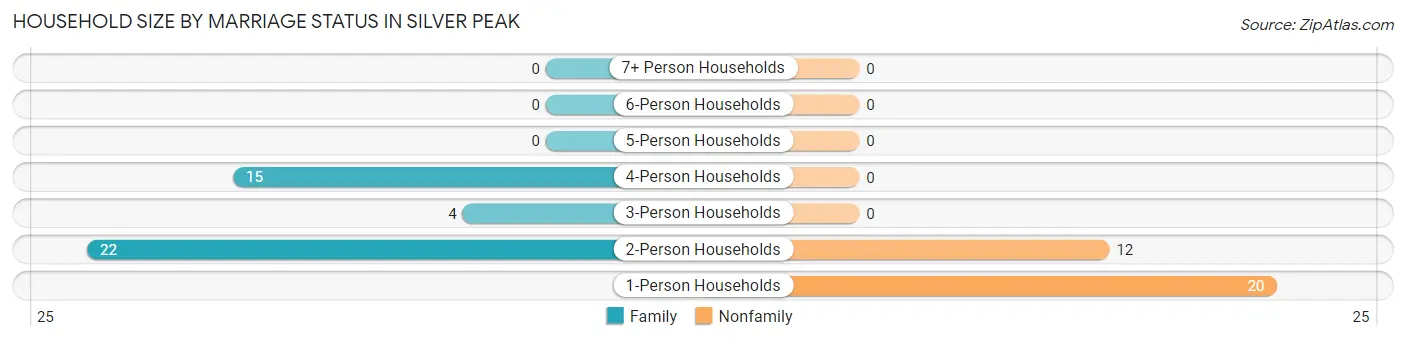
| Household Size | Family Households | Nonfamily Households |
| 1-Person Households | - | 20 (27.4%) |
| 2-Person Households | 22 (30.1%) | 12 (16.4%) |
| 3-Person Households | 4 (5.5%) | 0 (0.0%) |
| 4-Person Households | 15 (20.5%) | 0 (0.0%) |
| 5-Person Households | 0 (0.0%) | 0 (0.0%) |
| 6-Person Households | 0 (0.0%) | 0 (0.0%) |
| 7+ Person Households | 0 (0.0%) | 0 (0.0%) |
| Total | 41 (56.2%) | 32 (43.8%) |
Female Fertility in Silver Peak
Fertility by Age in Silver Peak
| Age Bracket | Women with Births | Births / 1,000 Women |
| 15 to 19 years | 0 (0.0%) | 0.0 |
| 20 to 34 years | 0 (0.0%) | 0.0 |
| 35 to 50 years | 0 (0.0%) | 0.0 |
| Total | 0 (0.0%) | 0.0 |
Fertility by Age by Marriage Status in Silver Peak
| Age Bracket | Married | Unmarried |
| 15 to 19 years | 0 (0.0%) | 0 (0.0%) |
| 20 to 34 years | 0 (0.0%) | 0 (0.0%) |
| 35 to 50 years | 0 (0.0%) | 0 (0.0%) |
| Total | 0 (0.0%) | 0 (0.0%) |
Fertility by Education in Silver Peak
| Educational Attainment | Women with Births | Births / 1,000 Women |
| Less than High School | 0 (0.0%) | 0.0 |
| High School Diploma | 0 (0.0%) | 0.0 |
| College or Associate's Degree | 0 (0.0%) | 0.0 |
| Bachelor's Degree | 0 (0.0%) | 0.0 |
| Graduate Degree | 0 (0.0%) | 0.0 |
| Total | 0 (0.0%) | 0.0 |
Fertility by Education by Marriage Status in Silver Peak
| Educational Attainment | Married | Unmarried |
| Less than High School | 0 (0.0%) | 0 (0.0%) |
| High School Diploma | 0 (0.0%) | 0 (0.0%) |
| College or Associate's Degree | 0 (0.0%) | 0 (0.0%) |
| Bachelor's Degree | 0 (0.0%) | 0 (0.0%) |
| Graduate Degree | 0 (0.0%) | 0 (0.0%) |
| Total | 0 (0.0%) | 0 (0.0%) |
Employment Characteristics in Silver Peak
Employment by Class of Employer in Silver Peak
Among the 151 employed individuals in Silver Peak, private company employees (85 | 56.3%), and self-employed (not incorporated) (66 | 43.7%) make up the most common classes of employment.
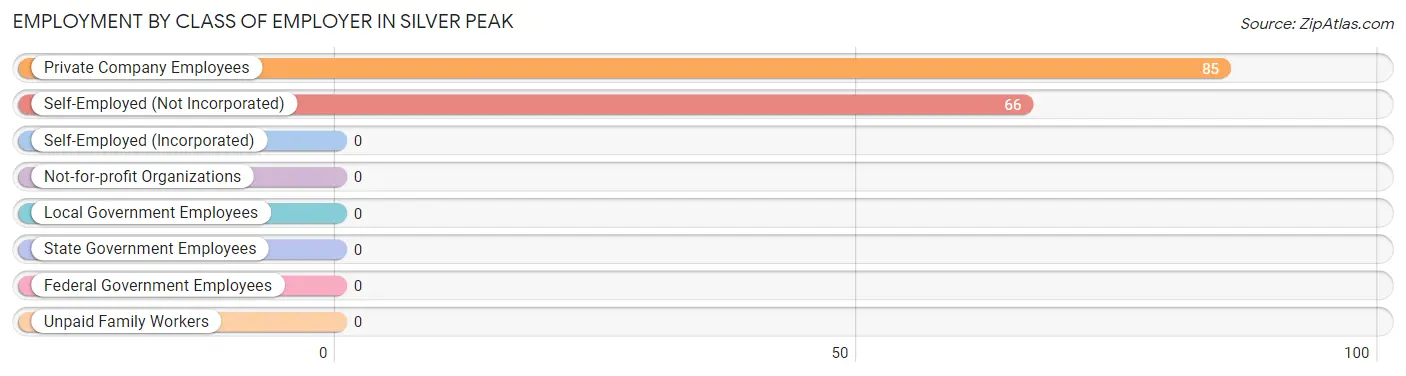
| Employer Class | # Employees | % Employees |
| Private Company Employees | 85 | 56.3% |
| Self-Employed (Incorporated) | 0 | 0.0% |
| Self-Employed (Not Incorporated) | 66 | 43.7% |
| Not-for-profit Organizations | 0 | 0.0% |
| Local Government Employees | 0 | 0.0% |
| State Government Employees | 0 | 0.0% |
| Federal Government Employees | 0 | 0.0% |
| Unpaid Family Workers | 0 | 0.0% |
| Total | 151 | 100.0% |
Employment Status by Age in Silver Peak
According to the labor force statistics for Silver Peak, out of the total population over 16 years of age (208), 75.0% or 156 individuals are in the labor force, with 3.2% or 5 of them unemployed. The age group with the highest labor force participation rate is 16 to 19 years, with 100.0% or 10 individuals in the labor force. Within the labor force, the 25 to 29 years age range has the highest percentage of unemployed individuals, with 100.0% or 5 of them being unemployed.
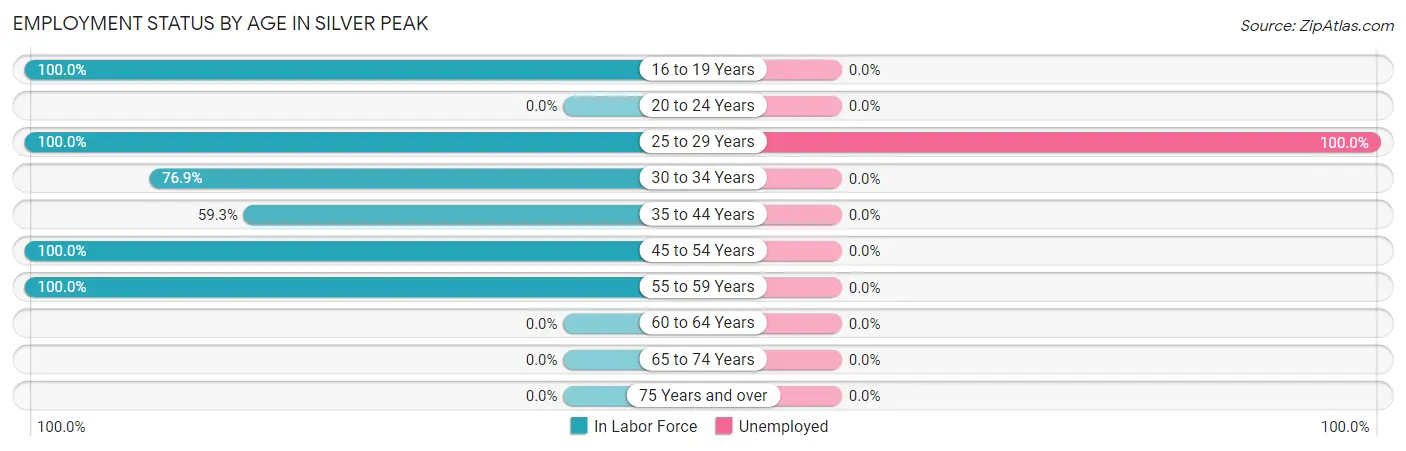
| Age Bracket | In Labor Force | Unemployed |
| 16 to 19 Years | 10 (100.0%) | 0 (0.0%) |
| 20 to 24 Years | 0 (0.0%) | 0 (0.0%) |
| 25 to 29 Years | 5 (100.0%) | 5 (100.0%) |
| 30 to 34 Years | 20 (76.9%) | 0 (0.0%) |
| 35 to 44 Years | 32 (59.3%) | 0 (0.0%) |
| 45 to 54 Years | 73 (100.0%) | 0 (0.0%) |
| 55 to 59 Years | 16 (100.0%) | 0 (0.0%) |
| 60 to 64 Years | 0 (0.0%) | 0 (0.0%) |
| 65 to 74 Years | 0 (0.0%) | 0 (0.0%) |
| 75 Years and over | 0 (0.0%) | 0 (0.0%) |
| Total | 156 (75.0%) | 5 (3.2%) |
Employment Status by Educational Attainment in Silver Peak
According to labor force statistics for Silver Peak, 83.9% of individuals (146) out of the total population between 25 and 64 years of age (174) are in the labor force, with 3.4% or 5 of them being unemployed. The group with the highest labor force participation rate are those with the educational attainment of less than high school, with 100.0% or 6 individuals in the labor force. Within the labor force, individuals with college / associate degree education have the highest percentage of unemployment, with 5.3% or 5 of them being unemployed.
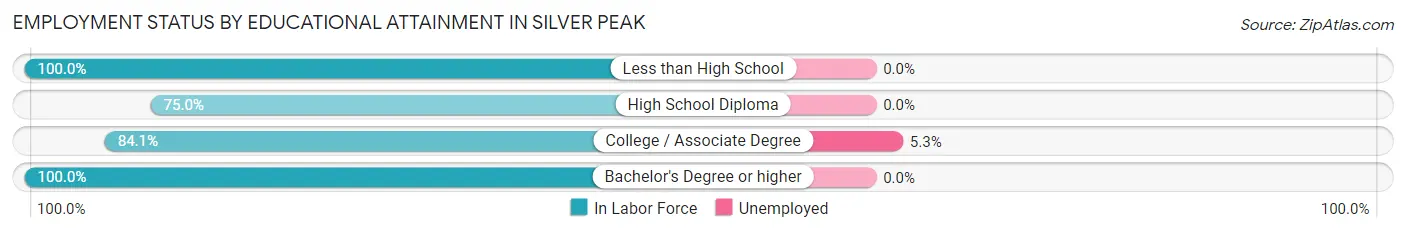
| Educational Attainment | In Labor Force | Unemployed |
| Less than High School | 6 (100.0%) | 0 (0.0%) |
| High School Diploma | 30 (75.0%) | 0 (0.0%) |
| College / Associate Degree | 95 (84.1%) | 6 (5.3%) |
| Bachelor's Degree or higher | 15 (100.0%) | 0 (0.0%) |
| Total | 146 (83.9%) | 6 (3.4%) |
Employment Occupations by Sex in Silver Peak
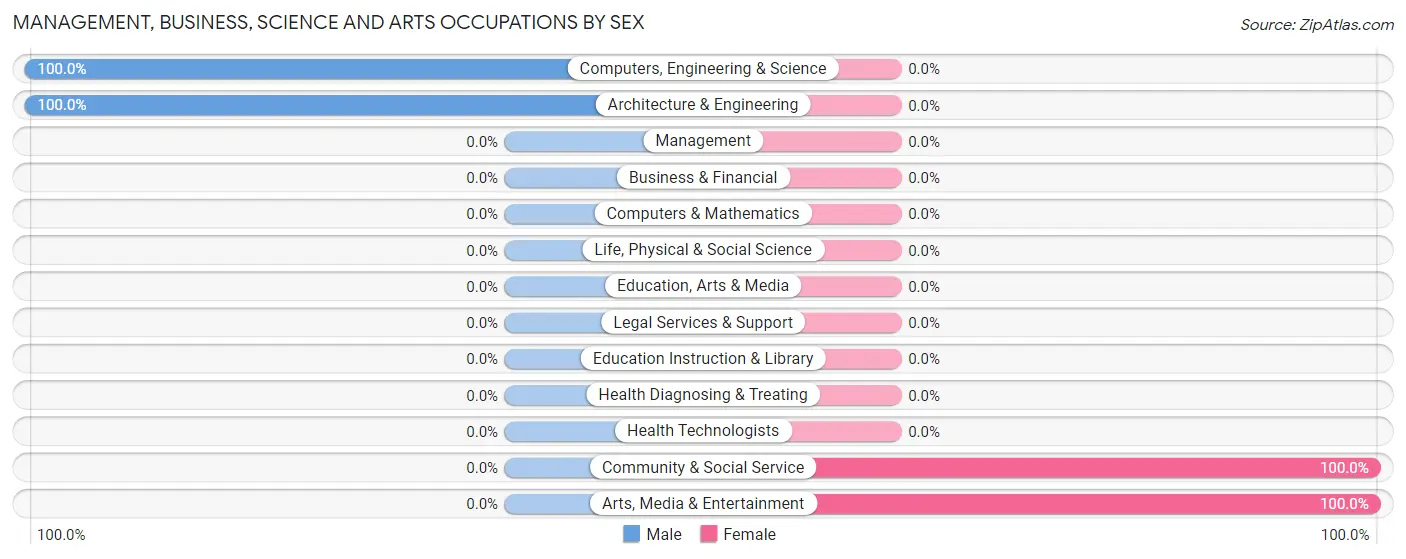
Management, Business, Science and Arts Occupations
The most common Management, Business, Science and Arts occupations in Silver Peak are Computers, Engineering & Science (15 | 9.9%), Architecture & Engineering (15 | 9.9%), Community & Social Service (10 | 6.6%), and Arts, Media & Entertainment (10 | 6.6%).
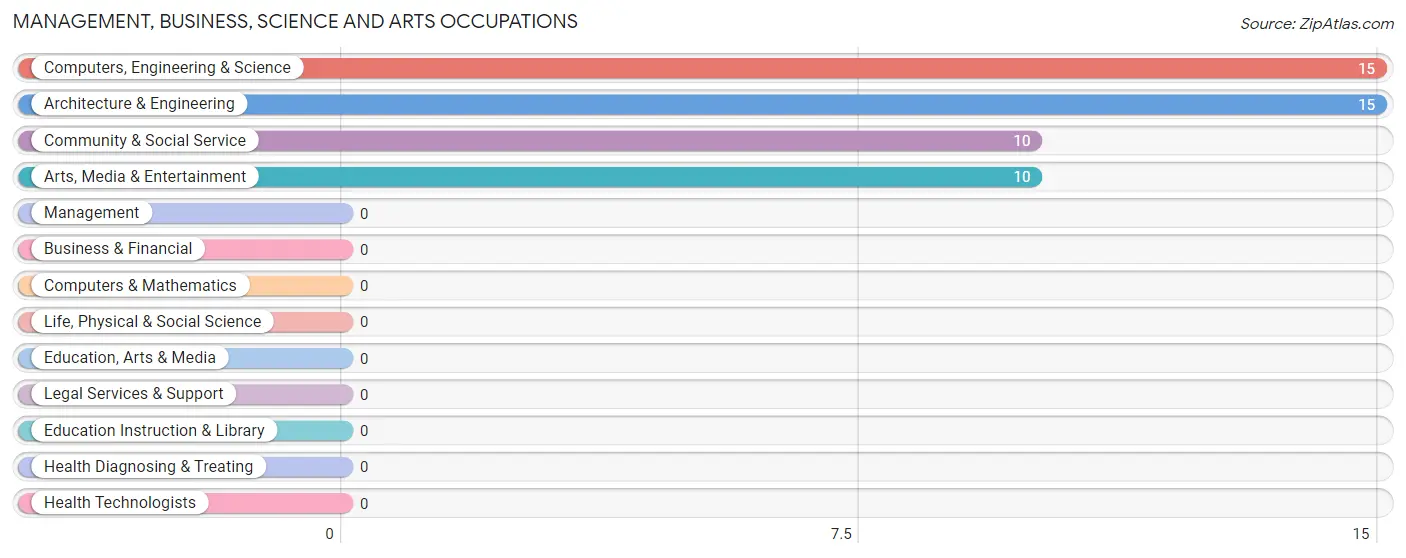
Management, Business, Science and Arts Occupations by Sex
Within the Management, Business, Science and Arts occupations in Silver Peak, the most male-oriented occupations are Computers, Engineering & Science (100.0%), and Architecture & Engineering (100.0%), while the most female-oriented occupations are Community & Social Service (100.0%), and Arts, Media & Entertainment (100.0%).
| Occupation | Male | Female |
| Management | 0 (0.0%) | 0 (0.0%) |
| Business & Financial | 0 (0.0%) | 0 (0.0%) |
| Computers, Engineering & Science | 15 (100.0%) | 0 (0.0%) |
| Computers & Mathematics | 0 (0.0%) | 0 (0.0%) |
| Architecture & Engineering | 15 (100.0%) | 0 (0.0%) |
| Life, Physical & Social Science | 0 (0.0%) | 0 (0.0%) |
| Community & Social Service | 0 (0.0%) | 10 (100.0%) |
| Education, Arts & Media | 0 (0.0%) | 0 (0.0%) |
| Legal Services & Support | 0 (0.0%) | 0 (0.0%) |
| Education Instruction & Library | 0 (0.0%) | 0 (0.0%) |
| Arts, Media & Entertainment | 0 (0.0%) | 10 (100.0%) |
| Health Diagnosing & Treating | 0 (0.0%) | 0 (0.0%) |
| Health Technologists | 0 (0.0%) | 0 (0.0%) |
| Total (Category) | 15 (60.0%) | 10 (40.0%) |
| Total (Overall) | 61 (40.4%) | 90 (59.6%) |
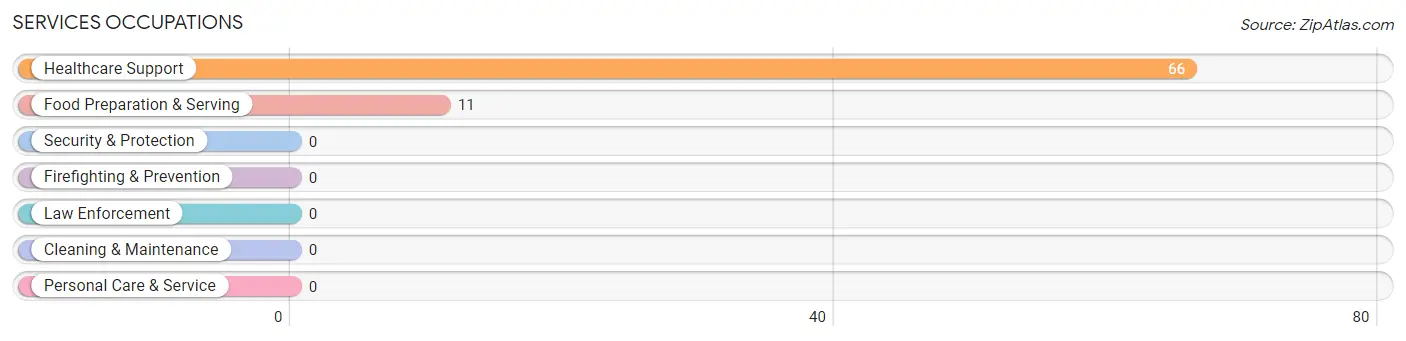
Services Occupations
The most common Services occupations in Silver Peak are Healthcare Support (66 | 43.7%), and Food Preparation & Serving (11 | 7.3%).
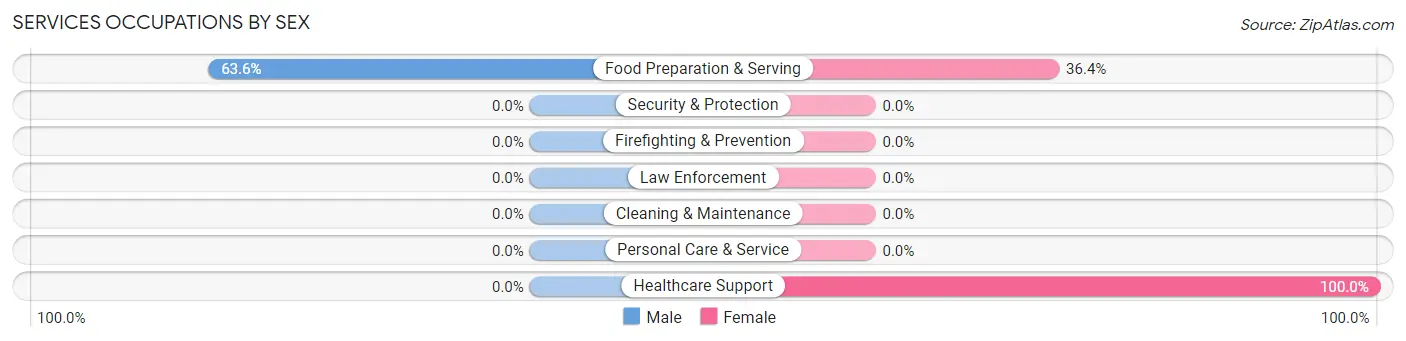
Services Occupations by Sex
| Occupation | Male | Female |
| Healthcare Support | 0 (0.0%) | 66 (100.0%) |
| Security & Protection | 0 (0.0%) | 0 (0.0%) |
| Firefighting & Prevention | 0 (0.0%) | 0 (0.0%) |
| Law Enforcement | 0 (0.0%) | 0 (0.0%) |
| Food Preparation & Serving | 7 (63.6%) | 4 (36.4%) |
| Cleaning & Maintenance | 0 (0.0%) | 0 (0.0%) |
| Personal Care & Service | 0 (0.0%) | 0 (0.0%) |
| Total (Category) | 7 (9.1%) | 70 (90.9%) |
| Total (Overall) | 61 (40.4%) | 90 (59.6%) |
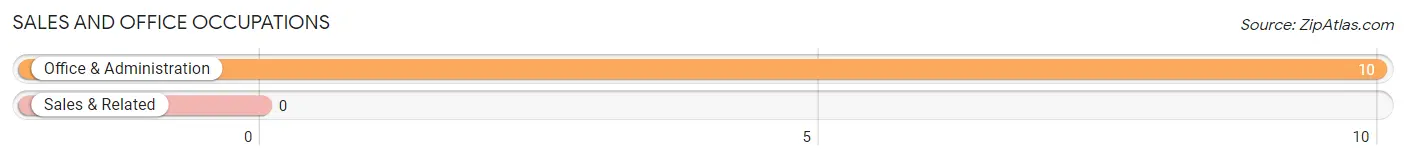
Sales and Office Occupations
The most common Sales and Office occupations in Silver Peak are , and Office & Administration (10 | 6.6%).
Sales and Office Occupations by Sex
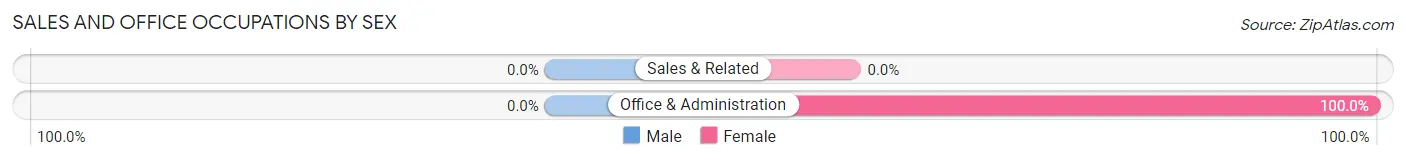
| Occupation | Male | Female |
| Sales & Related | 0 (0.0%) | 0 (0.0%) |
| Office & Administration | 0 (0.0%) | 10 (100.0%) |
| Total (Category) | 0 (0.0%) | 10 (100.0%) |
| Total (Overall) | 61 (40.4%) | 90 (59.6%) |
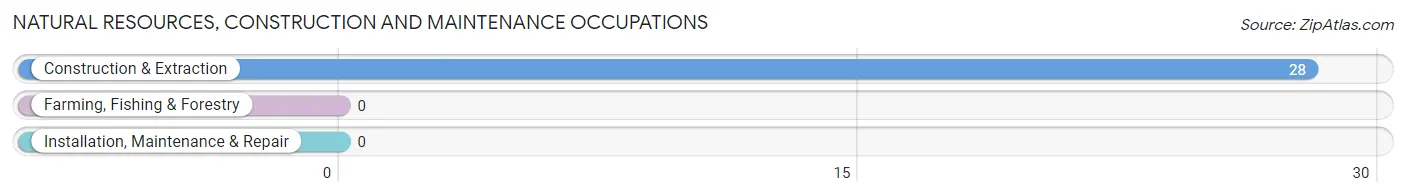
Natural Resources, Construction and Maintenance Occupations
The most common Natural Resources, Construction and Maintenance occupations in Silver Peak are , and Construction & Extraction (28 | 18.5%).
Natural Resources, Construction and Maintenance Occupations by Sex
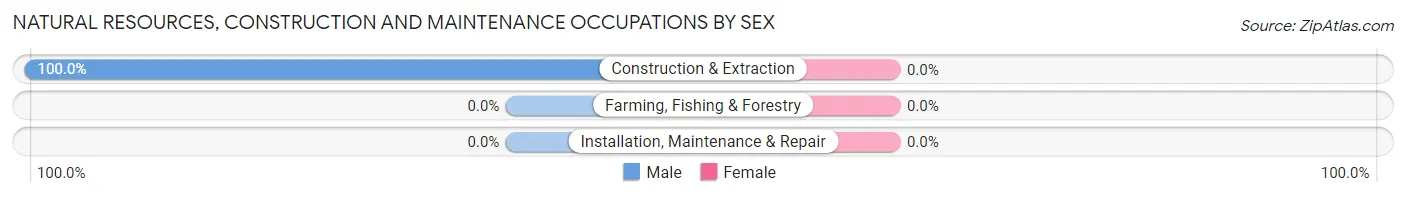
| Occupation | Male | Female |
| Farming, Fishing & Forestry | 0 (0.0%) | 0 (0.0%) |
| Construction & Extraction | 28 (100.0%) | 0 (0.0%) |
| Installation, Maintenance & Repair | 0 (0.0%) | 0 (0.0%) |
| Total (Category) | 28 (100.0%) | 0 (0.0%) |
| Total (Overall) | 61 (40.4%) | 90 (59.6%) |
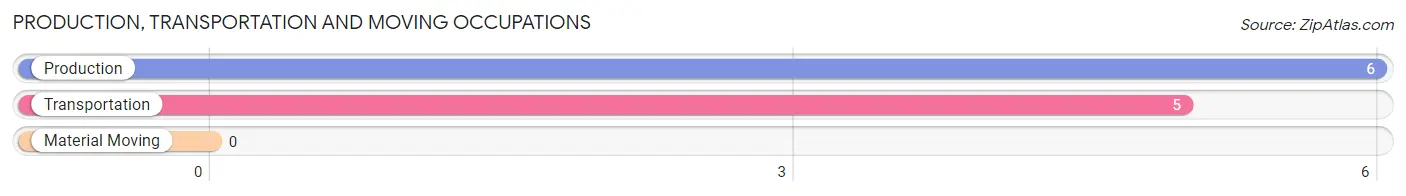
Production, Transportation and Moving Occupations
The most common Production, Transportation and Moving occupations in Silver Peak are Production (6 | 4.0%), and Transportation (5 | 3.3%).
Production, Transportation and Moving Occupations by Sex
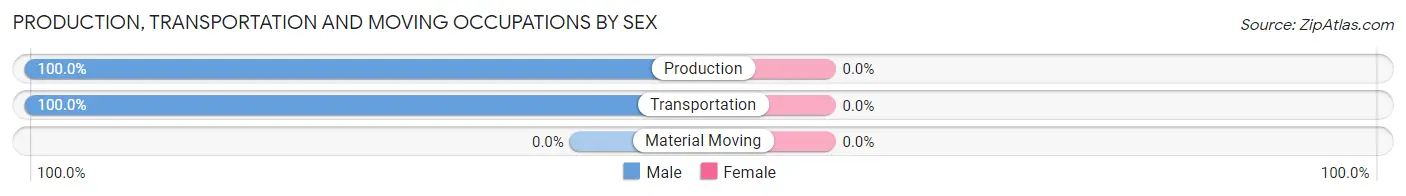
| Occupation | Male | Female |
| Production | 6 (100.0%) | 0 (0.0%) |
| Transportation | 5 (100.0%) | 0 (0.0%) |
| Material Moving | 0 (0.0%) | 0 (0.0%) |
| Total (Category) | 11 (100.0%) | 0 (0.0%) |
| Total (Overall) | 61 (40.4%) | 90 (59.6%) |
Employment Industries by Sex in Silver Peak
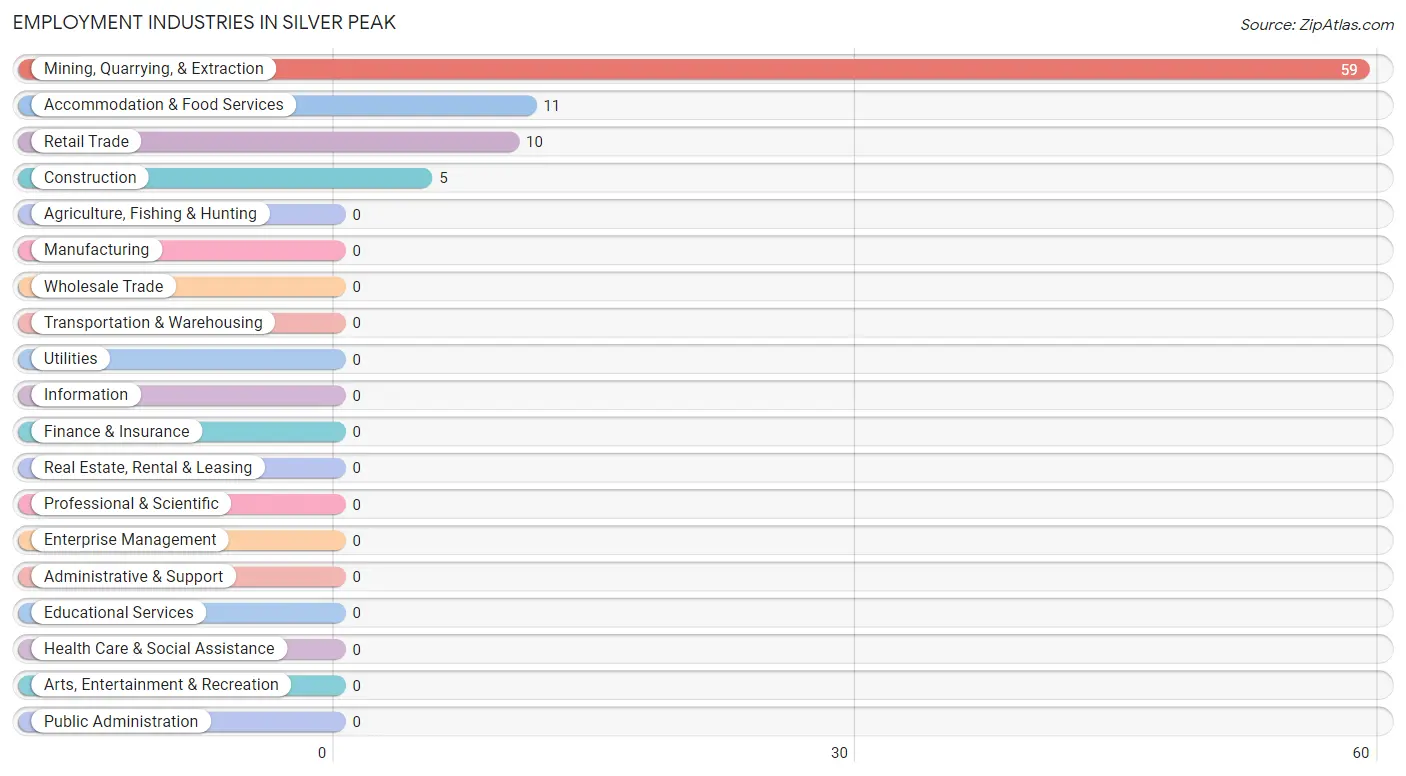
Employment Industries in Silver Peak
The major employment industries in Silver Peak include Mining, Quarrying, & Extraction (59 | 39.1%), Accommodation & Food Services (11 | 7.3%), Retail Trade (10 | 6.6%), and Construction (5 | 3.3%).
Employment Industries by Sex in Silver Peak
The Silver Peak industries that see more men than women are Construction (100.0%), Mining, Quarrying, & Extraction (83.1%), and Accommodation & Food Services (63.6%), whereas the industries that tend to have a higher number of women are Retail Trade (100.0%), Accommodation & Food Services (36.4%), and Mining, Quarrying, & Extraction (17.0%).
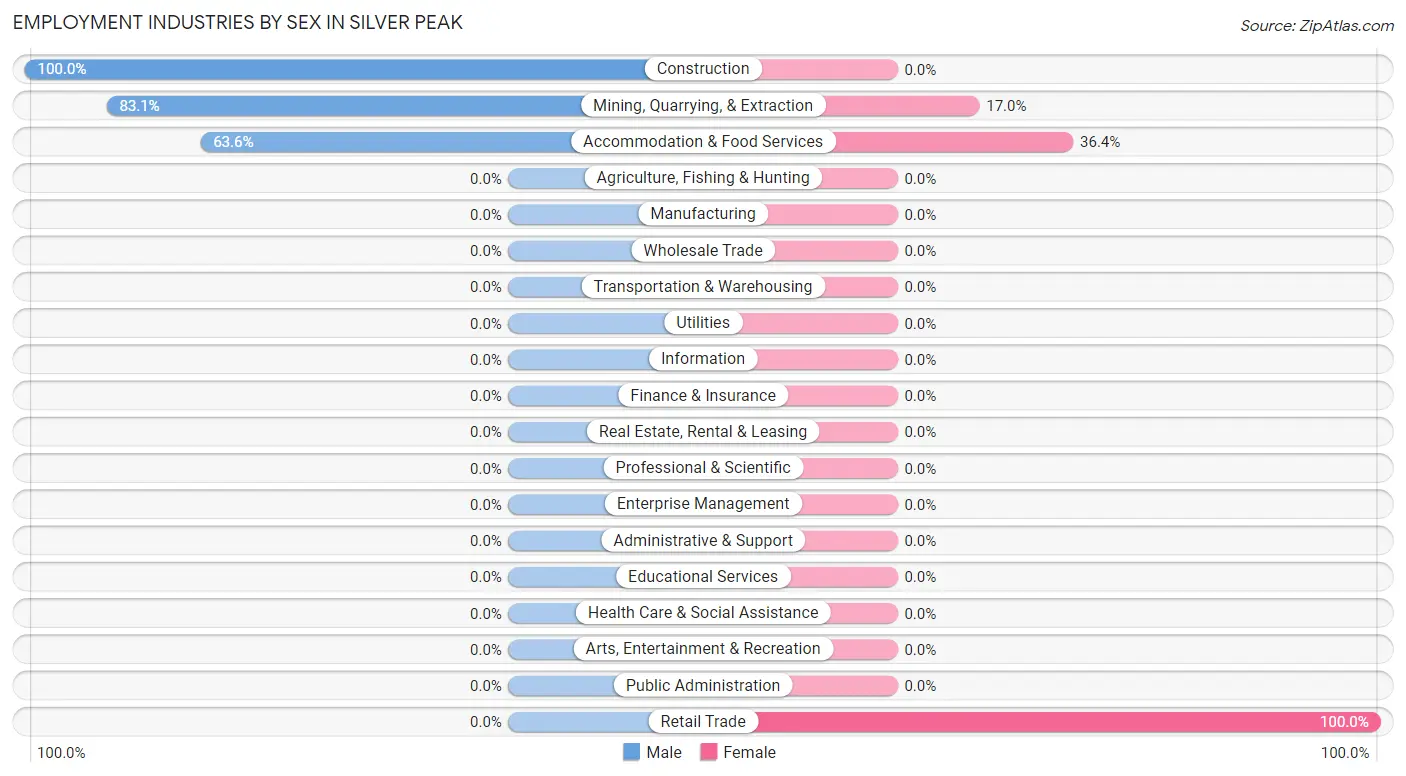
| Industry | Male | Female |
| Agriculture, Fishing & Hunting | 0 (0.0%) | 0 (0.0%) |
| Mining, Quarrying, & Extraction | 49 (83.1%) | 10 (17.0%) |
| Construction | 5 (100.0%) | 0 (0.0%) |
| Manufacturing | 0 (0.0%) | 0 (0.0%) |
| Wholesale Trade | 0 (0.0%) | 0 (0.0%) |
| Retail Trade | 0 (0.0%) | 10 (100.0%) |
| Transportation & Warehousing | 0 (0.0%) | 0 (0.0%) |
| Utilities | 0 (0.0%) | 0 (0.0%) |
| Information | 0 (0.0%) | 0 (0.0%) |
| Finance & Insurance | 0 (0.0%) | 0 (0.0%) |
| Real Estate, Rental & Leasing | 0 (0.0%) | 0 (0.0%) |
| Professional & Scientific | 0 (0.0%) | 0 (0.0%) |
| Enterprise Management | 0 (0.0%) | 0 (0.0%) |
| Administrative & Support | 0 (0.0%) | 0 (0.0%) |
| Educational Services | 0 (0.0%) | 0 (0.0%) |
| Health Care & Social Assistance | 0 (0.0%) | 0 (0.0%) |
| Arts, Entertainment & Recreation | 0 (0.0%) | 0 (0.0%) |
| Accommodation & Food Services | 7 (63.6%) | 4 (36.4%) |
| Public Administration | 0 (0.0%) | 0 (0.0%) |
| Total | 61 (40.4%) | 90 (59.6%) |
Education in Silver Peak
School Enrollment in Silver Peak
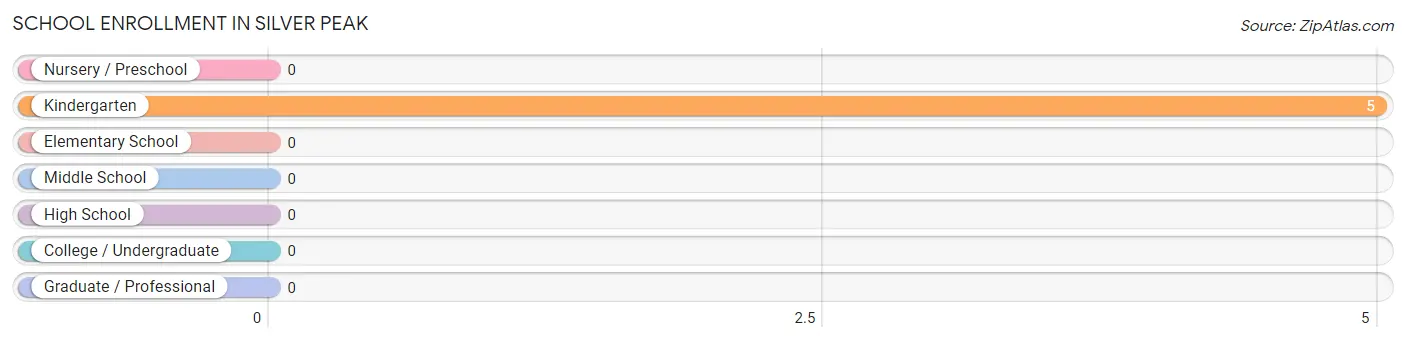
| School Level | # Students | % Students |
| Nursery / Preschool | 0 | 0.0% |
| Kindergarten | 5 | 100.0% |
| Elementary School | 0 | 0.0% |
| Middle School | 0 | 0.0% |
| High School | 0 | 0.0% |
| College / Undergraduate | 0 | 0.0% |
| Graduate / Professional | 0 | 0.0% |
| Total | 5 | 100.0% |
School Enrollment by Age by Funding Source in Silver Peak
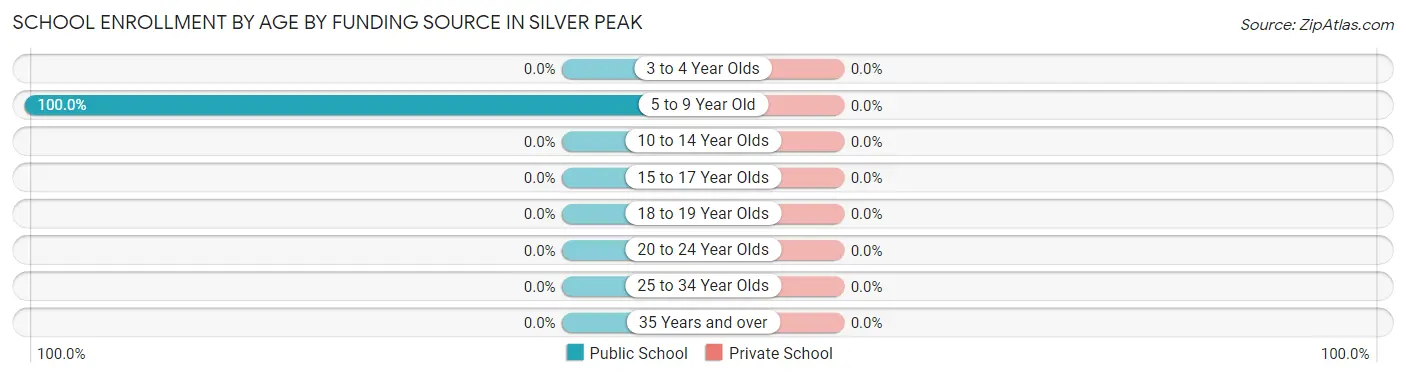
| Age Bracket | Public School | Private School |
| 3 to 4 Year Olds | 0 (0.0%) | 0 (0.0%) |
| 5 to 9 Year Old | 5 (100.0%) | 0 (0.0%) |
| 10 to 14 Year Olds | 0 (0.0%) | 0 (0.0%) |
| 15 to 17 Year Olds | 0 (0.0%) | 0 (0.0%) |
| 18 to 19 Year Olds | 0 (0.0%) | 0 (0.0%) |
| 20 to 24 Year Olds | 0 (0.0%) | 0 (0.0%) |
| 25 to 34 Year Olds | 0 (0.0%) | 0 (0.0%) |
| 35 Years and over | 0 (0.0%) | 0 (0.0%) |
| Total | 5 (100.0%) | 0 (0.0%) |
Educational Attainment by Field of Study in Silver Peak
, and engineering (15 | 100.0%) are the most common fields of study among 15 individuals in Silver Peak who have obtained a bachelor's degree or higher.
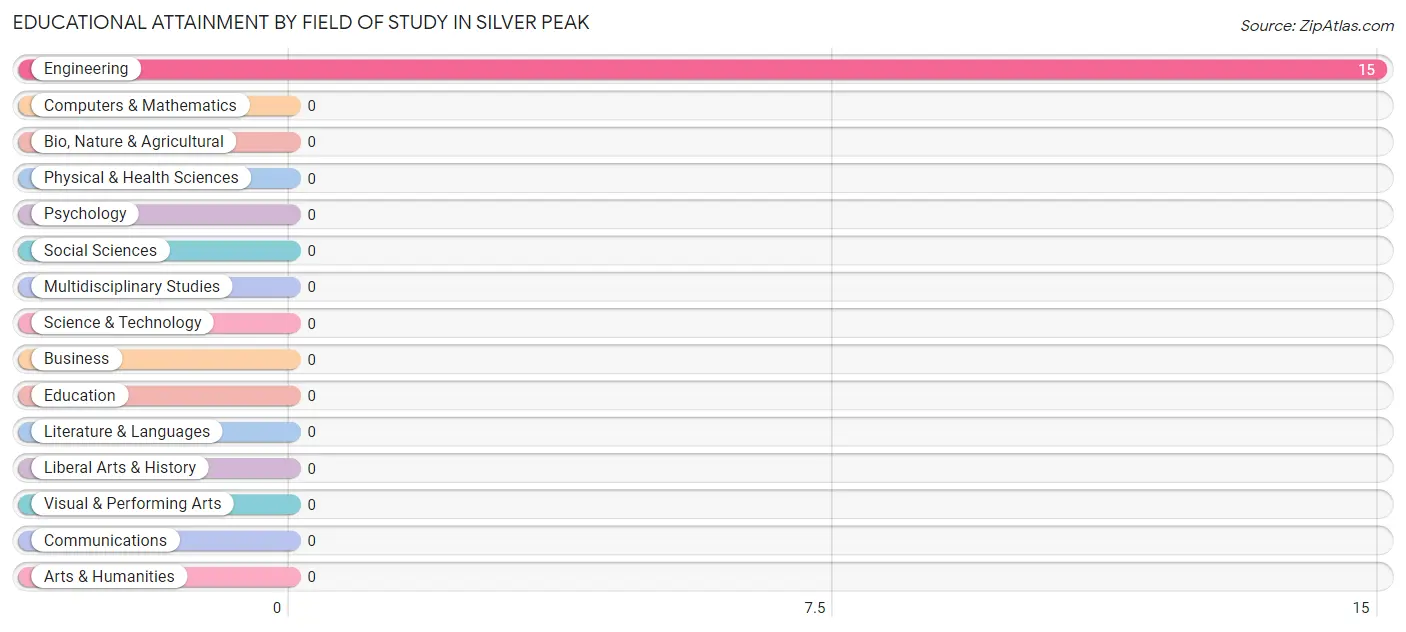
| Field of Study | # Graduates | % Graduates |
| Computers & Mathematics | 0 | 0.0% |
| Bio, Nature & Agricultural | 0 | 0.0% |
| Physical & Health Sciences | 0 | 0.0% |
| Psychology | 0 | 0.0% |
| Social Sciences | 0 | 0.0% |
| Engineering | 15 | 100.0% |
| Multidisciplinary Studies | 0 | 0.0% |
| Science & Technology | 0 | 0.0% |
| Business | 0 | 0.0% |
| Education | 0 | 0.0% |
| Literature & Languages | 0 | 0.0% |
| Liberal Arts & History | 0 | 0.0% |
| Visual & Performing Arts | 0 | 0.0% |
| Communications | 0 | 0.0% |
| Arts & Humanities | 0 | 0.0% |
| Total | 15 | 100.0% |
Transportation & Commute in Silver Peak
Vehicle Availability by Sex in Silver Peak
The most prevalent vehicle ownership categories in Silver Peak are males with 2 vehicles (29, accounting for 47.5%) and females with 2 vehicles (14, making up 32.2%).
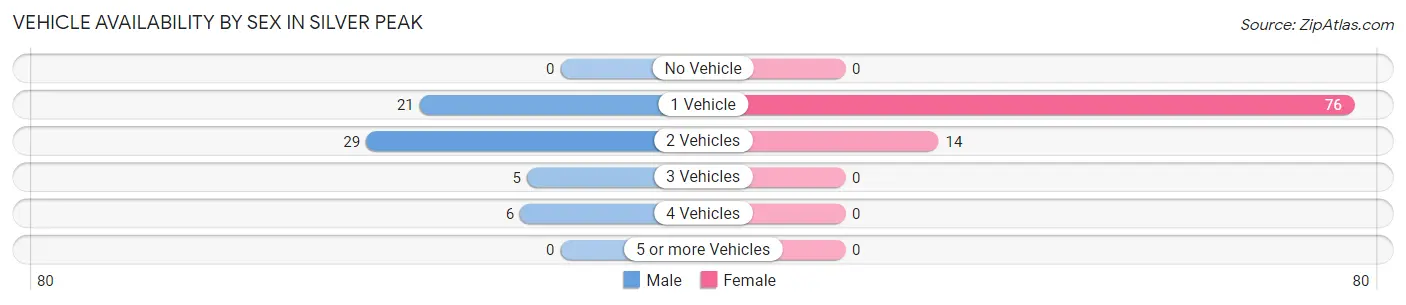
| Vehicles Available | Male | Female |
| No Vehicle | 0 (0.0%) | 0 (0.0%) |
| 1 Vehicle | 21 (34.4%) | 76 (84.4%) |
| 2 Vehicles | 29 (47.5%) | 14 (15.6%) |
| 3 Vehicles | 5 (8.2%) | 0 (0.0%) |
| 4 Vehicles | 6 (9.8%) | 0 (0.0%) |
| 5 or more Vehicles | 0 (0.0%) | 0 (0.0%) |
| Total | 61 (100.0%) | 90 (100.0%) |
Commute Time in Silver Peak
The most frequently occuring commute durations in Silver Peak are 10 to 14 minutes (66 commuters, 43.7%), less than 5 minutes (54 commuters, 35.8%), and 20 to 24 minutes (14 commuters, 9.3%).
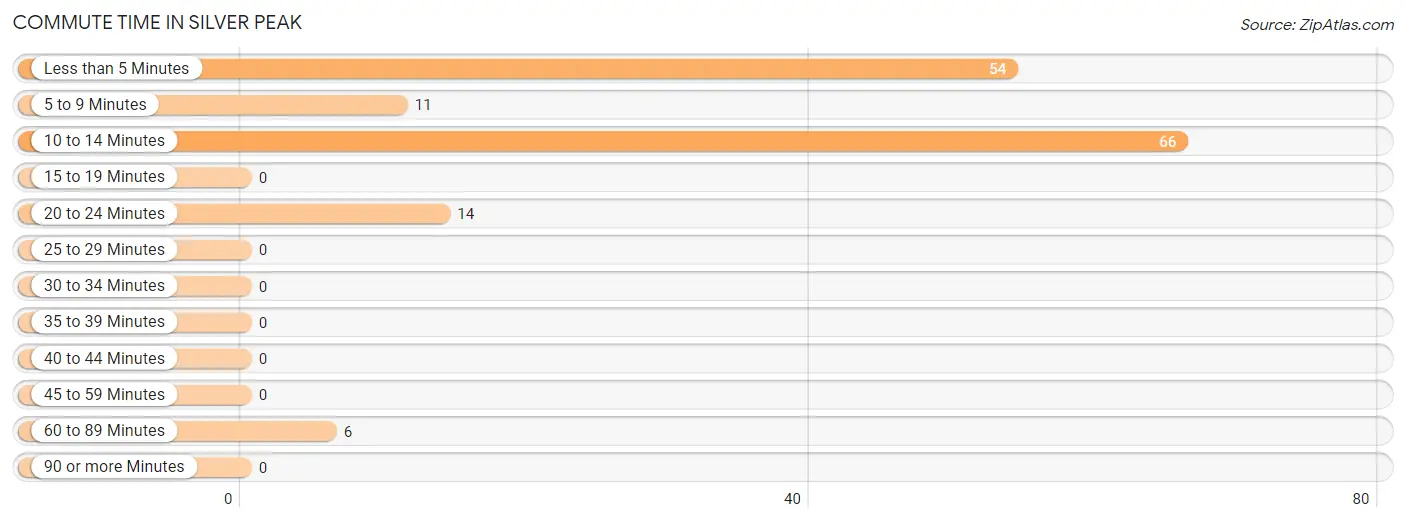
| Commute Time | # Commuters | % Commuters |
| Less than 5 Minutes | 54 | 35.8% |
| 5 to 9 Minutes | 11 | 7.3% |
| 10 to 14 Minutes | 66 | 43.7% |
| 15 to 19 Minutes | 0 | 0.0% |
| 20 to 24 Minutes | 14 | 9.3% |
| 25 to 29 Minutes | 0 | 0.0% |
| 30 to 34 Minutes | 0 | 0.0% |
| 35 to 39 Minutes | 0 | 0.0% |
| 40 to 44 Minutes | 0 | 0.0% |
| 45 to 59 Minutes | 0 | 0.0% |
| 60 to 89 Minutes | 6 | 4.0% |
| 90 or more Minutes | 0 | 0.0% |
Commute Time by Sex in Silver Peak
The most common commute times in Silver Peak are less than 5 minutes (30 commuters, 49.2%) for males and 10 to 14 minutes (66 commuters, 73.3%) for females.
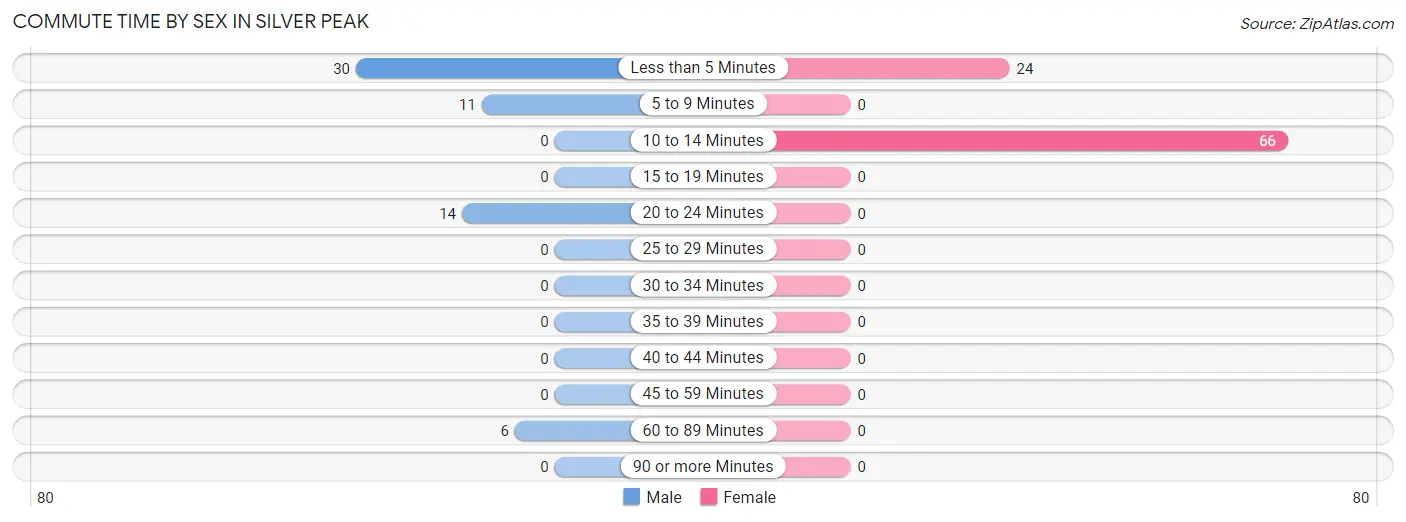
| Commute Time | Male | Female |
| Less than 5 Minutes | 30 (49.2%) | 24 (26.7%) |
| 5 to 9 Minutes | 11 (18.0%) | 0 (0.0%) |
| 10 to 14 Minutes | 0 (0.0%) | 66 (73.3%) |
| 15 to 19 Minutes | 0 (0.0%) | 0 (0.0%) |
| 20 to 24 Minutes | 14 (23.0%) | 0 (0.0%) |
| 25 to 29 Minutes | 0 (0.0%) | 0 (0.0%) |
| 30 to 34 Minutes | 0 (0.0%) | 0 (0.0%) |
| 35 to 39 Minutes | 0 (0.0%) | 0 (0.0%) |
| 40 to 44 Minutes | 0 (0.0%) | 0 (0.0%) |
| 45 to 59 Minutes | 0 (0.0%) | 0 (0.0%) |
| 60 to 89 Minutes | 6 (9.8%) | 0 (0.0%) |
| 90 or more Minutes | 0 (0.0%) | 0 (0.0%) |
Time of Departure to Work by Sex in Silver Peak
The most frequent times of departure to work in Silver Peak are 7:00 AM to 7:29 AM (15, 24.6%) for males and 7:30 AM to 7:59 AM (66, 73.3%) for females.
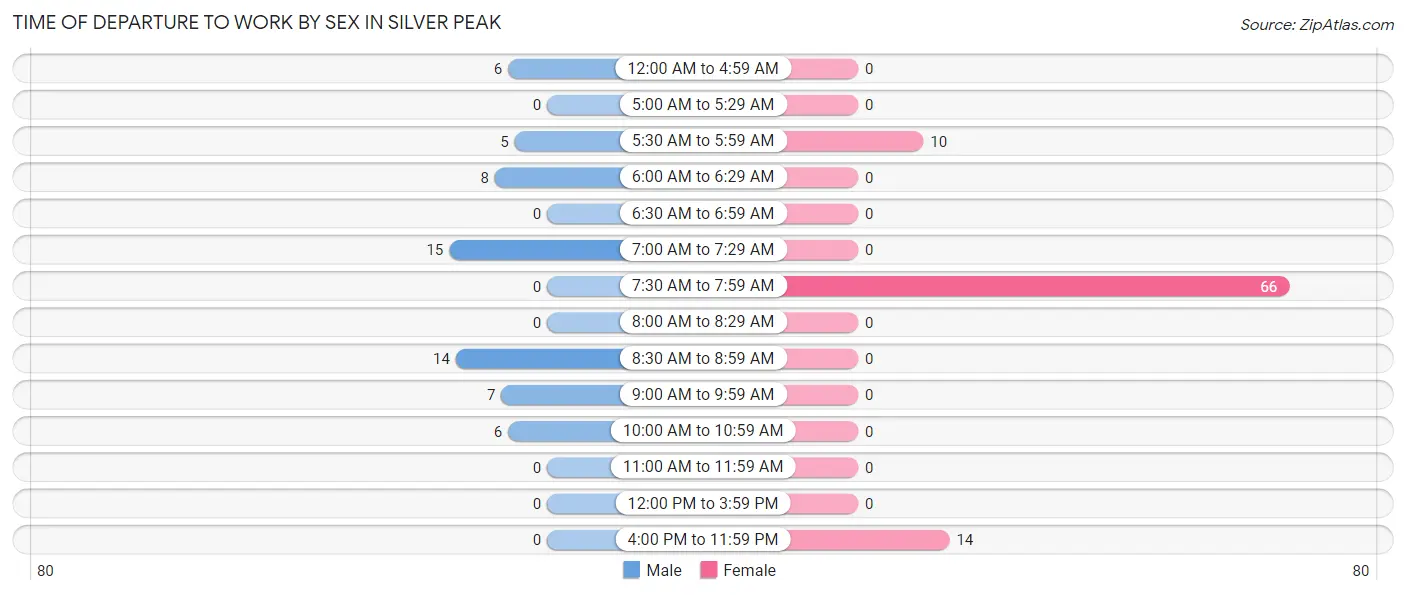
| Time of Departure | Male | Female |
| 12:00 AM to 4:59 AM | 6 (9.8%) | 0 (0.0%) |
| 5:00 AM to 5:29 AM | 0 (0.0%) | 0 (0.0%) |
| 5:30 AM to 5:59 AM | 5 (8.2%) | 10 (11.1%) |
| 6:00 AM to 6:29 AM | 8 (13.1%) | 0 (0.0%) |
| 6:30 AM to 6:59 AM | 0 (0.0%) | 0 (0.0%) |
| 7:00 AM to 7:29 AM | 15 (24.6%) | 0 (0.0%) |
| 7:30 AM to 7:59 AM | 0 (0.0%) | 66 (73.3%) |
| 8:00 AM to 8:29 AM | 0 (0.0%) | 0 (0.0%) |
| 8:30 AM to 8:59 AM | 14 (23.0%) | 0 (0.0%) |
| 9:00 AM to 9:59 AM | 7 (11.5%) | 0 (0.0%) |
| 10:00 AM to 10:59 AM | 6 (9.8%) | 0 (0.0%) |
| 11:00 AM to 11:59 AM | 0 (0.0%) | 0 (0.0%) |
| 12:00 PM to 3:59 PM | 0 (0.0%) | 0 (0.0%) |
| 4:00 PM to 11:59 PM | 0 (0.0%) | 14 (15.6%) |
| Total | 61 (100.0%) | 90 (100.0%) |
Housing Occupancy in Silver Peak
Occupancy by Ownership in Silver Peak
Of the total 73 dwellings in Silver Peak, owner-occupied units account for 34 (46.6%), while renter-occupied units make up 39 (53.4%).
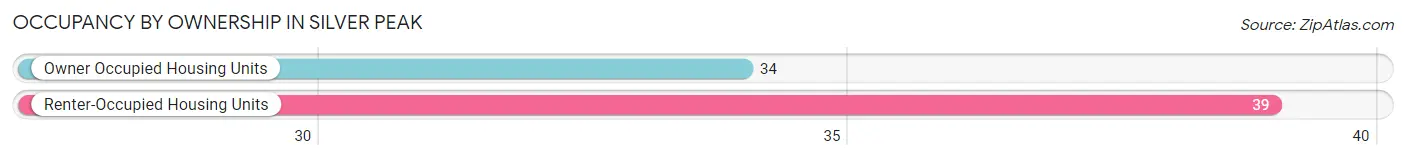
| Occupancy | # Housing Units | % Housing Units |
| Owner Occupied Housing Units | 34 | 46.6% |
| Renter-Occupied Housing Units | 39 | 53.4% |
| Total Occupied Housing Units | 73 | 100.0% |
Occupancy by Household Size in Silver Peak
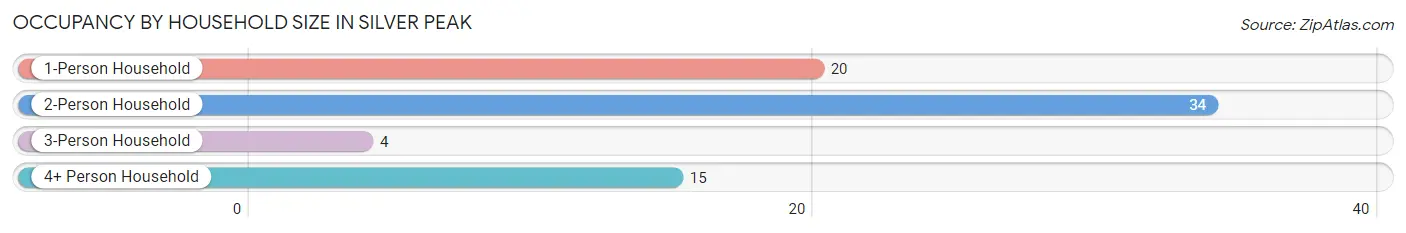
| Household Size | # Housing Units | % Housing Units |
| 1-Person Household | 20 | 27.4% |
| 2-Person Household | 34 | 46.6% |
| 3-Person Household | 4 | 5.5% |
| 4+ Person Household | 15 | 20.5% |
| Total Housing Units | 73 | 100.0% |
Occupancy by Ownership by Household Size in Silver Peak
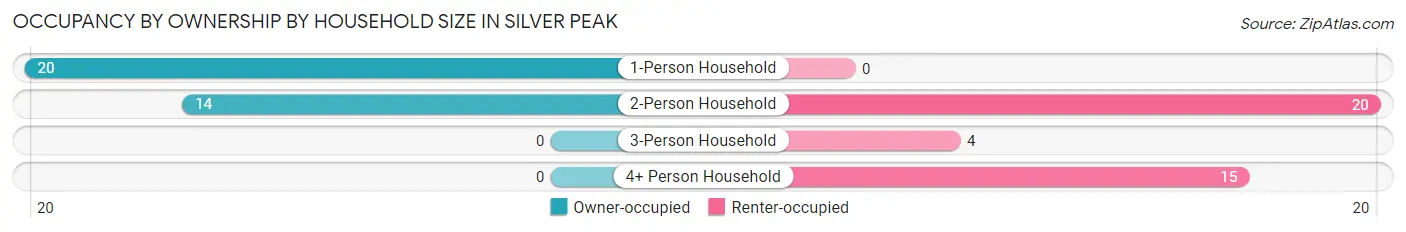
| Household Size | Owner-occupied | Renter-occupied |
| 1-Person Household | 20 (100.0%) | 0 (0.0%) |
| 2-Person Household | 14 (41.2%) | 20 (58.8%) |
| 3-Person Household | 0 (0.0%) | 4 (100.0%) |
| 4+ Person Household | 0 (0.0%) | 15 (100.0%) |
| Total Housing Units | 34 (46.6%) | 39 (53.4%) |
Occupancy by Educational Attainment in Silver Peak
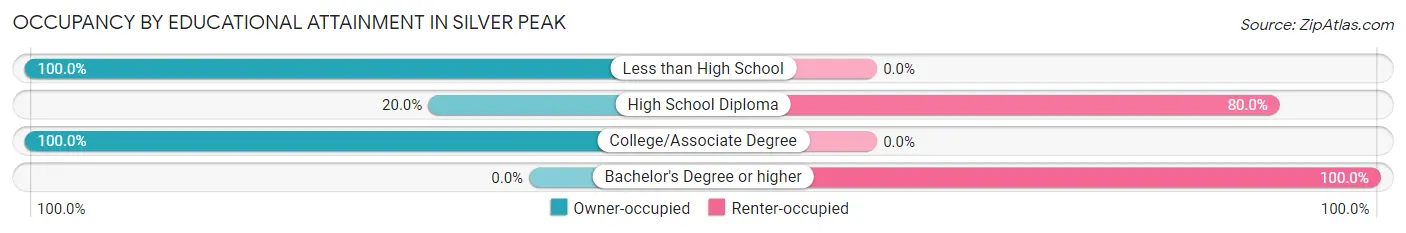
| Household Size | Owner-occupied | Renter-occupied |
| Less than High School | 6 (100.0%) | 0 (0.0%) |
| High School Diploma | 6 (20.0%) | 24 (80.0%) |
| College/Associate Degree | 22 (100.0%) | 0 (0.0%) |
| Bachelor's Degree or higher | 0 (0.0%) | 15 (100.0%) |
Occupancy by Age of Householder in Silver Peak
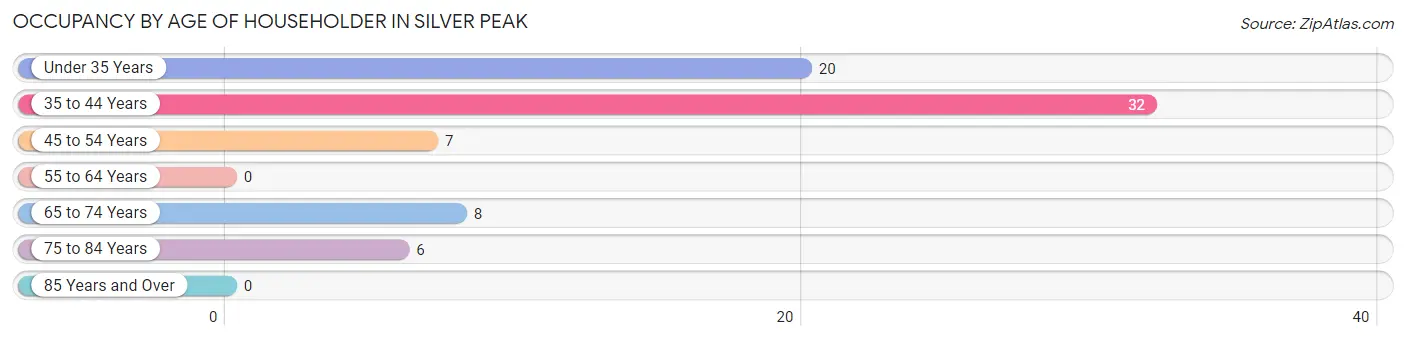
| Age Bracket | # Households | % Households |
| Under 35 Years | 20 | 27.4% |
| 35 to 44 Years | 32 | 43.8% |
| 45 to 54 Years | 7 | 9.6% |
| 55 to 64 Years | 0 | 0.0% |
| 65 to 74 Years | 8 | 11.0% |
| 75 to 84 Years | 6 | 8.2% |
| 85 Years and Over | 0 | 0.0% |
| Total | 73 | 100.0% |
Housing Finances in Silver Peak
Median Income by Occupancy in Silver Peak
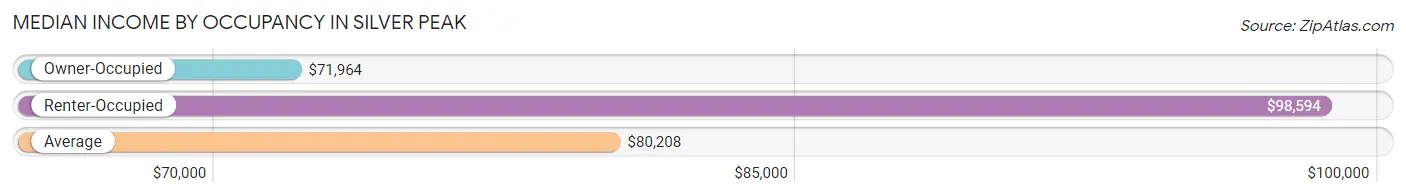
| Occupancy Type | # Households | Median Income |
| Owner-Occupied | 34 (46.6%) | $71,964 |
| Renter-Occupied | 39 (53.4%) | $98,594 |
| Average | 73 (100.0%) | $80,208 |
Occupancy by Householder Income Bracket in Silver Peak
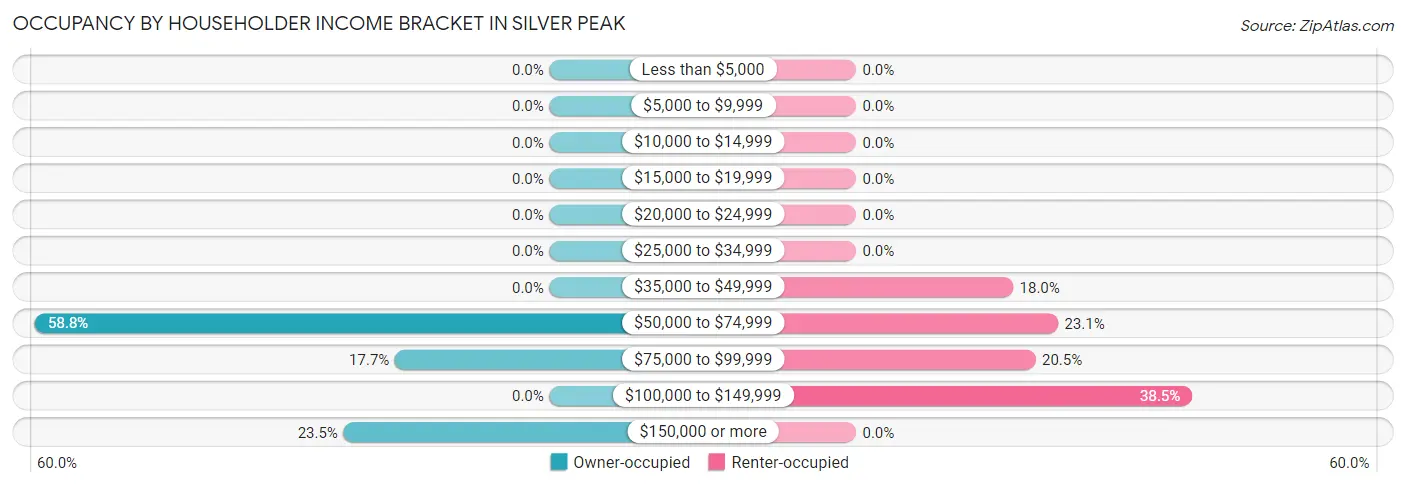
| Income Bracket | Owner-occupied | Renter-occupied |
| Less than $5,000 | 0 (0.0%) | 0 (0.0%) |
| $5,000 to $9,999 | 0 (0.0%) | 0 (0.0%) |
| $10,000 to $14,999 | 0 (0.0%) | 0 (0.0%) |
| $15,000 to $19,999 | 0 (0.0%) | 0 (0.0%) |
| $20,000 to $24,999 | 0 (0.0%) | 0 (0.0%) |
| $25,000 to $34,999 | 0 (0.0%) | 0 (0.0%) |
| $35,000 to $49,999 | 0 (0.0%) | 7 (17.9%) |
| $50,000 to $74,999 | 20 (58.8%) | 9 (23.1%) |
| $75,000 to $99,999 | 6 (17.6%) | 8 (20.5%) |
| $100,000 to $149,999 | 0 (0.0%) | 15 (38.5%) |
| $150,000 or more | 8 (23.5%) | 0 (0.0%) |
| Total | 34 (100.0%) | 39 (100.0%) |
Monthly Housing Cost Tiers in Silver Peak
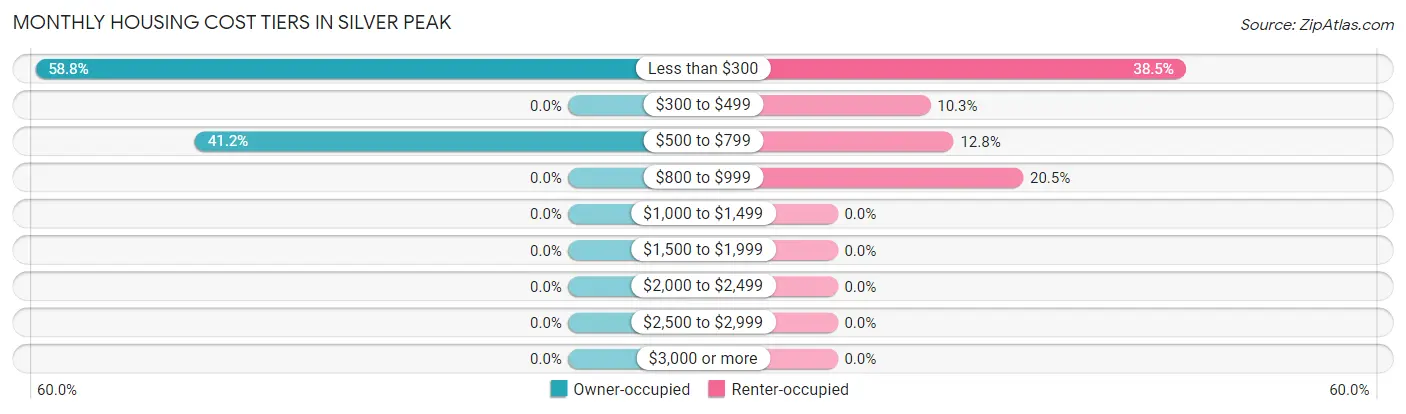
| Monthly Cost | Owner-occupied | Renter-occupied |
| Less than $300 | 20 (58.8%) | 15 (38.5%) |
| $300 to $499 | 0 (0.0%) | 4 (10.3%) |
| $500 to $799 | 14 (41.2%) | 5 (12.8%) |
| $800 to $999 | 0 (0.0%) | 8 (20.5%) |
| $1,000 to $1,499 | 0 (0.0%) | 0 (0.0%) |
| $1,500 to $1,999 | 0 (0.0%) | 0 (0.0%) |
| $2,000 to $2,499 | 0 (0.0%) | 0 (0.0%) |
| $2,500 to $2,999 | 0 (0.0%) | 0 (0.0%) |
| $3,000 or more | 0 (0.0%) | 0 (0.0%) |
| Total | 34 (100.0%) | 39 (100.0%) |
Physical Housing Characteristics in Silver Peak
Housing Structures in Silver Peak
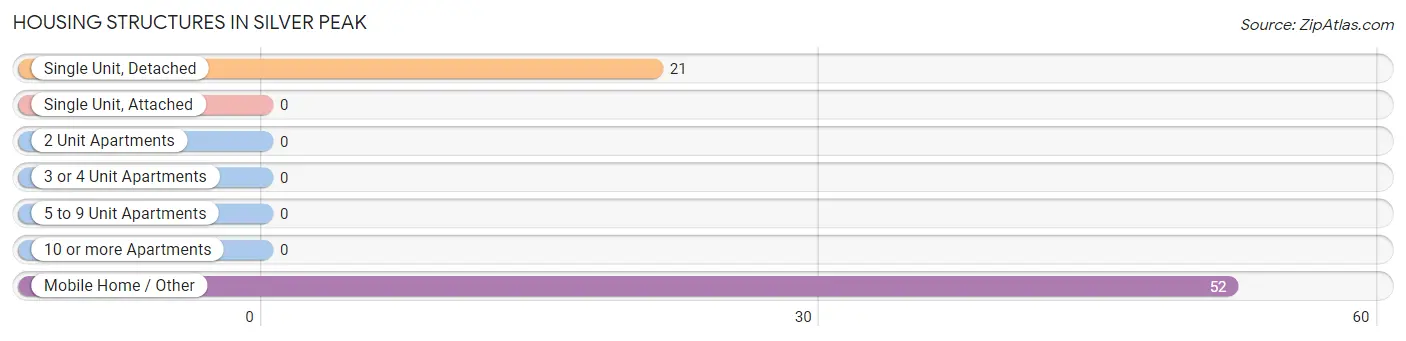
| Structure Type | # Housing Units | % Housing Units |
| Single Unit, Detached | 21 | 28.8% |
| Single Unit, Attached | 0 | 0.0% |
| 2 Unit Apartments | 0 | 0.0% |
| 3 or 4 Unit Apartments | 0 | 0.0% |
| 5 to 9 Unit Apartments | 0 | 0.0% |
| 10 or more Apartments | 0 | 0.0% |
| Mobile Home / Other | 52 | 71.2% |
| Total | 73 | 100.0% |
Housing Structures by Occupancy in Silver Peak
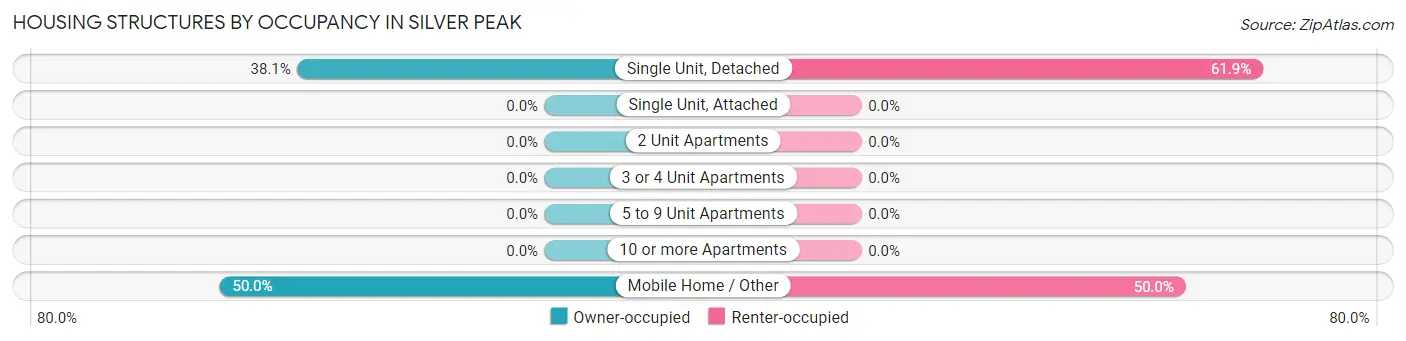
| Structure Type | Owner-occupied | Renter-occupied |
| Single Unit, Detached | 8 (38.1%) | 13 (61.9%) |
| Single Unit, Attached | 0 (0.0%) | 0 (0.0%) |
| 2 Unit Apartments | 0 (0.0%) | 0 (0.0%) |
| 3 or 4 Unit Apartments | 0 (0.0%) | 0 (0.0%) |
| 5 to 9 Unit Apartments | 0 (0.0%) | 0 (0.0%) |
| 10 or more Apartments | 0 (0.0%) | 0 (0.0%) |
| Mobile Home / Other | 26 (50.0%) | 26 (50.0%) |
| Total | 34 (46.6%) | 39 (53.4%) |
Housing Structures by Number of Rooms in Silver Peak
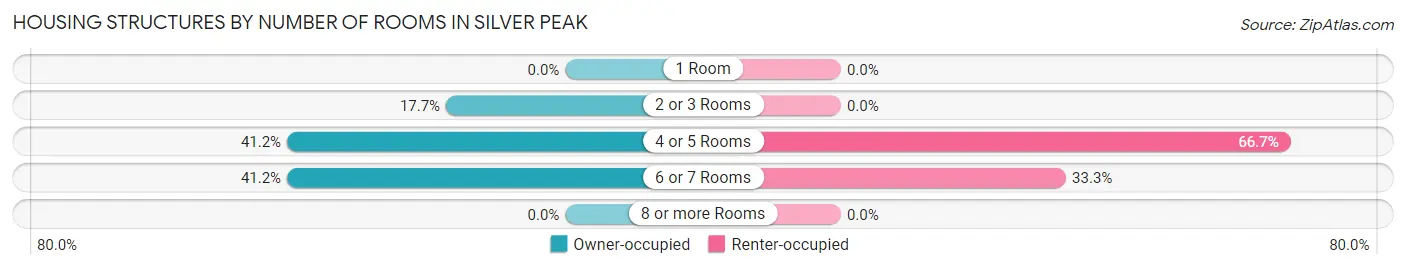
| Number of Rooms | Owner-occupied | Renter-occupied |
| 1 Room | 0 (0.0%) | 0 (0.0%) |
| 2 or 3 Rooms | 6 (17.6%) | 0 (0.0%) |
| 4 or 5 Rooms | 14 (41.2%) | 26 (66.7%) |
| 6 or 7 Rooms | 14 (41.2%) | 13 (33.3%) |
| 8 or more Rooms | 0 (0.0%) | 0 (0.0%) |
| Total | 34 (100.0%) | 39 (100.0%) |
Housing Structure by Heating Type in Silver Peak

| Heating Type | Owner-occupied | Renter-occupied |
| Utility Gas | 0 (0.0%) | 0 (0.0%) |
| Bottled, Tank, or LP Gas | 12 (35.3%) | 0 (0.0%) |
| Electricity | 0 (0.0%) | 19 (48.7%) |
| Fuel Oil or Kerosene | 0 (0.0%) | 0 (0.0%) |
| Coal or Coke | 0 (0.0%) | 0 (0.0%) |
| All other Fuels | 22 (64.7%) | 20 (51.3%) |
| No Fuel Used | 0 (0.0%) | 0 (0.0%) |
| Total | 34 (100.0%) | 39 (100.0%) |
Household Vehicle Usage in Silver Peak
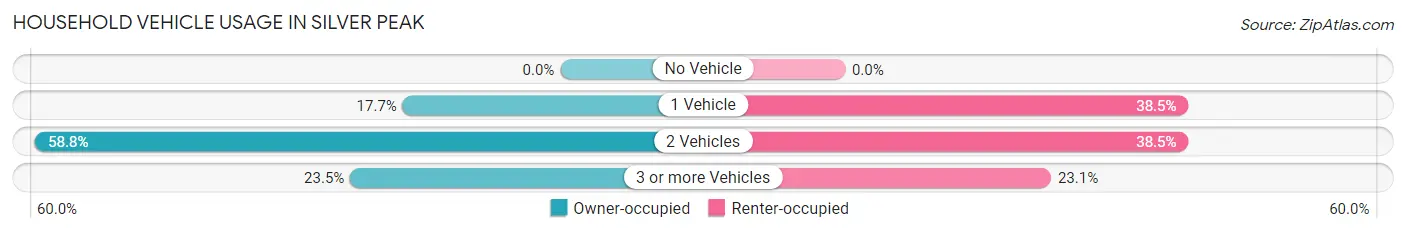
| Vehicles per Household | Owner-occupied | Renter-occupied |
| No Vehicle | 0 (0.0%) | 0 (0.0%) |
| 1 Vehicle | 6 (17.6%) | 15 (38.5%) |
| 2 Vehicles | 20 (58.8%) | 15 (38.5%) |
| 3 or more Vehicles | 8 (23.5%) | 9 (23.1%) |
| Total | 34 (100.0%) | 39 (100.0%) |
Real Estate & Mortgages in Silver Peak
Real Estate and Mortgage Overview in Silver Peak
| Characteristic | Without Mortgage | With Mortgage |
| Housing Units | 28 | 6 |
| Median Property Value | - | - |
| Median Household Income | - | - |
| Monthly Housing Costs | - | - |
| Real Estate Taxes | - | - |
Property Value by Mortgage Status in Silver Peak
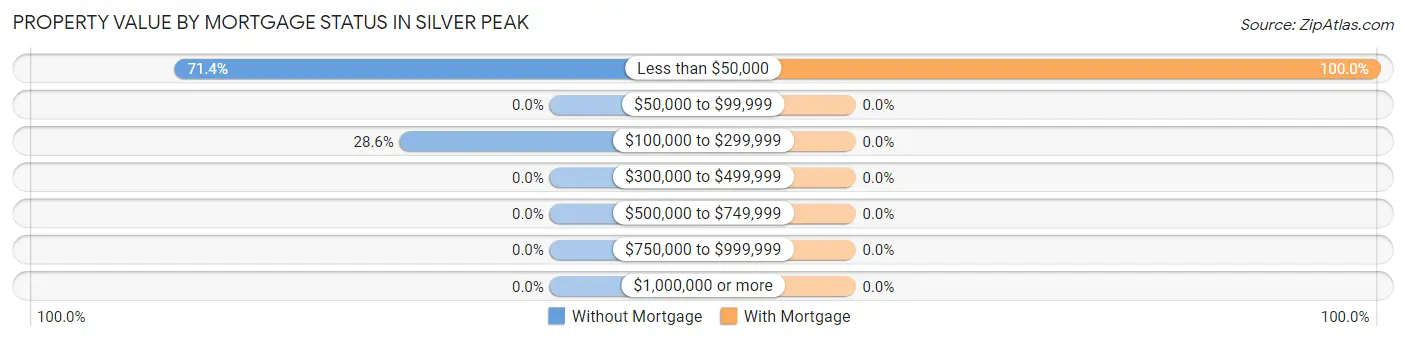
| Property Value | Without Mortgage | With Mortgage |
| Less than $50,000 | 20 (71.4%) | 6 (100.0%) |
| $50,000 to $99,999 | 0 (0.0%) | 0 (0.0%) |
| $100,000 to $299,999 | 8 (28.6%) | 0 (0.0%) |
| $300,000 to $499,999 | 0 (0.0%) | 0 (0.0%) |
| $500,000 to $749,999 | 0 (0.0%) | 0 (0.0%) |
| $750,000 to $999,999 | 0 (0.0%) | 0 (0.0%) |
| $1,000,000 or more | 0 (0.0%) | 0 (0.0%) |
| Total | 28 (100.0%) | 6 (100.0%) |
Household Income by Mortgage Status in Silver Peak
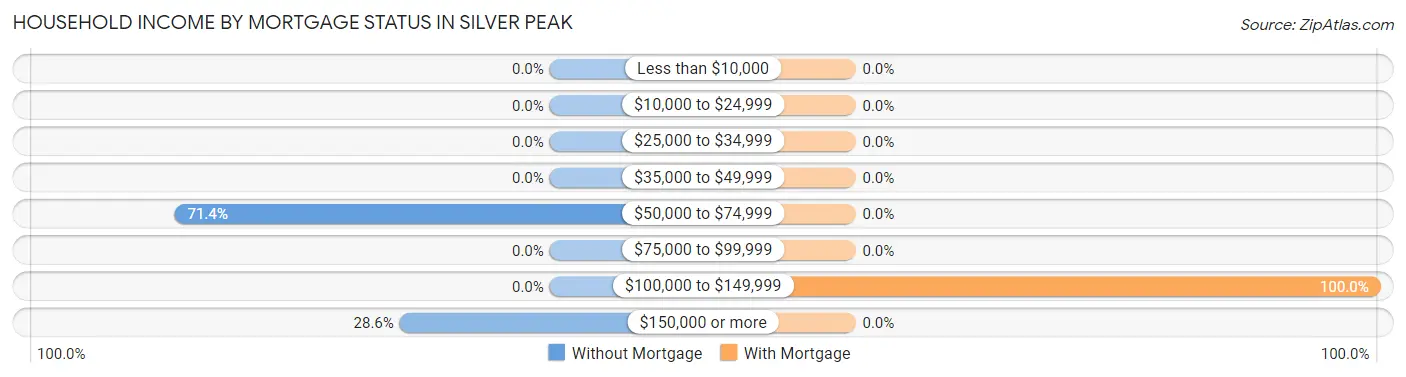
| Household Income | Without Mortgage | With Mortgage |
| Less than $10,000 | 0 (0.0%) | 0 (0.0%) |
| $10,000 to $24,999 | 0 (0.0%) | 0 (0.0%) |
| $25,000 to $34,999 | 0 (0.0%) | 0 (0.0%) |
| $35,000 to $49,999 | 0 (0.0%) | 0 (0.0%) |
| $50,000 to $74,999 | 20 (71.4%) | 0 (0.0%) |
| $75,000 to $99,999 | 0 (0.0%) | 0 (0.0%) |
| $100,000 to $149,999 | 0 (0.0%) | 6 (100.0%) |
| $150,000 or more | 8 (28.6%) | 0 (0.0%) |
| Total | 28 (100.0%) | 6 (100.0%) |
Property Value to Household Income Ratio in Silver Peak
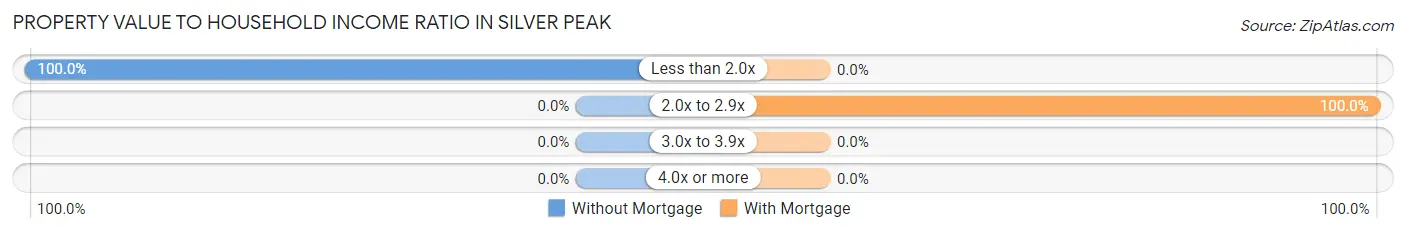
| Value-to-Income Ratio | Without Mortgage | With Mortgage |
| Less than 2.0x | 28 (100.0%) | 0 (0.0%) |
| 2.0x to 2.9x | 0 (0.0%) | 6 (100.0%) |
| 3.0x to 3.9x | 0 (0.0%) | 0 (0.0%) |
| 4.0x or more | 0 (0.0%) | 0 (0.0%) |
| Total | 28 (100.0%) | 6 (100.0%) |
Real Estate Taxes by Mortgage Status in Silver Peak
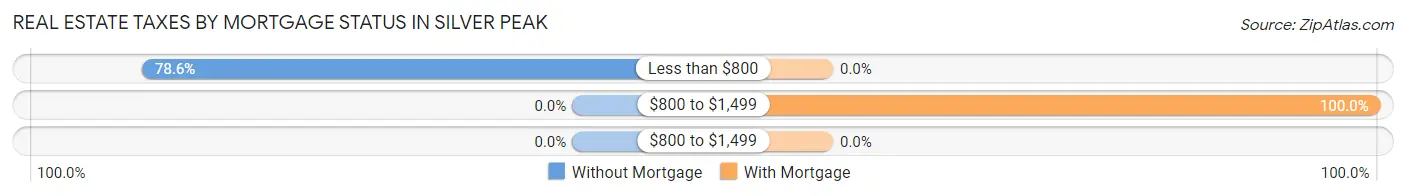
| Property Taxes | Without Mortgage | With Mortgage |
| Less than $800 | 22 (78.6%) | 0 (0.0%) |
| $800 to $1,499 | 0 (0.0%) | 6 (100.0%) |
| $800 to $1,499 | 0 (0.0%) | 0 (0.0%) |
| Total | 28 (100.0%) | 6 (100.0%) |
Health & Disability in Silver Peak
Health Insurance Coverage by Age in Silver Peak
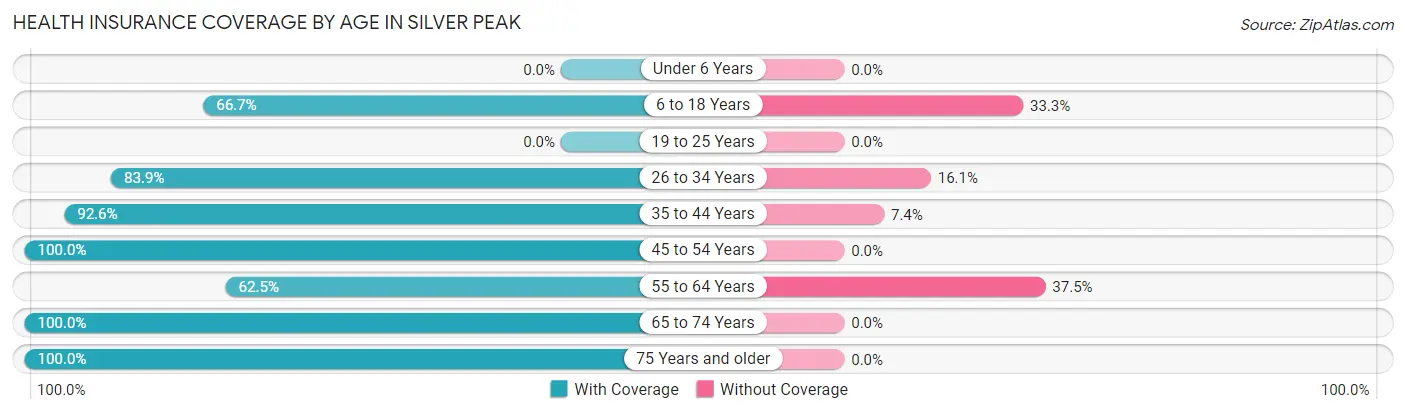
| Age Bracket | With Coverage | Without Coverage |
| Under 6 Years | 0 (0.0%) | 0 (0.0%) |
| 6 to 18 Years | 10 (66.7%) | 5 (33.3%) |
| 19 to 25 Years | 0 (0.0%) | 0 (0.0%) |
| 26 to 34 Years | 26 (83.9%) | 5 (16.1%) |
| 35 to 44 Years | 50 (92.6%) | 4 (7.4%) |
| 45 to 54 Years | 73 (100.0%) | 0 (0.0%) |
| 55 to 64 Years | 10 (62.5%) | 6 (37.5%) |
| 65 to 74 Years | 18 (100.0%) | 0 (0.0%) |
| 75 Years and older | 6 (100.0%) | 0 (0.0%) |
| Total | 193 (90.6%) | 20 (9.4%) |
Health Insurance Coverage by Citizenship Status in Silver Peak
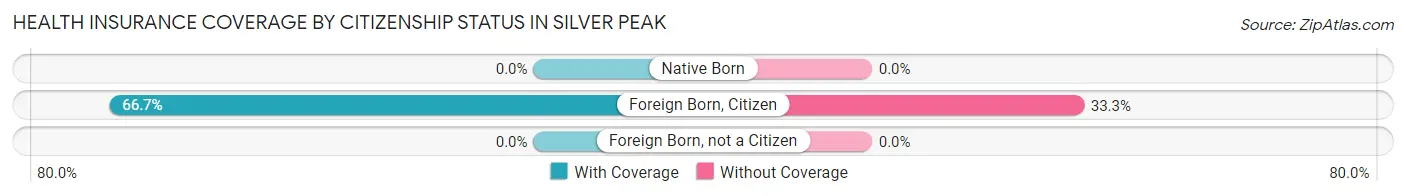
| Citizenship Status | With Coverage | Without Coverage |
| Native Born | 0 (0.0%) | 0 (0.0%) |
| Foreign Born, Citizen | 10 (66.7%) | 5 (33.3%) |
| Foreign Born, not a Citizen | 0 (0.0%) | 0 (0.0%) |
Health Insurance Coverage by Household Income in Silver Peak
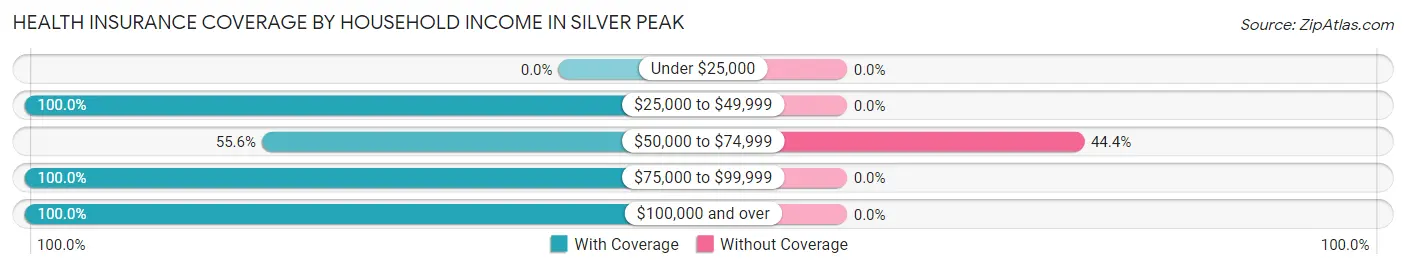
| Household Income | With Coverage | Without Coverage |
| Under $25,000 | 0 (0.0%) | 0 (0.0%) |
| $25,000 to $49,999 | 11 (100.0%) | 0 (0.0%) |
| $50,000 to $74,999 | 25 (55.6%) | 20 (44.4%) |
| $75,000 to $99,999 | 30 (100.0%) | 0 (0.0%) |
| $100,000 and over | 127 (100.0%) | 0 (0.0%) |
Public vs Private Health Insurance Coverage by Age in Silver Peak
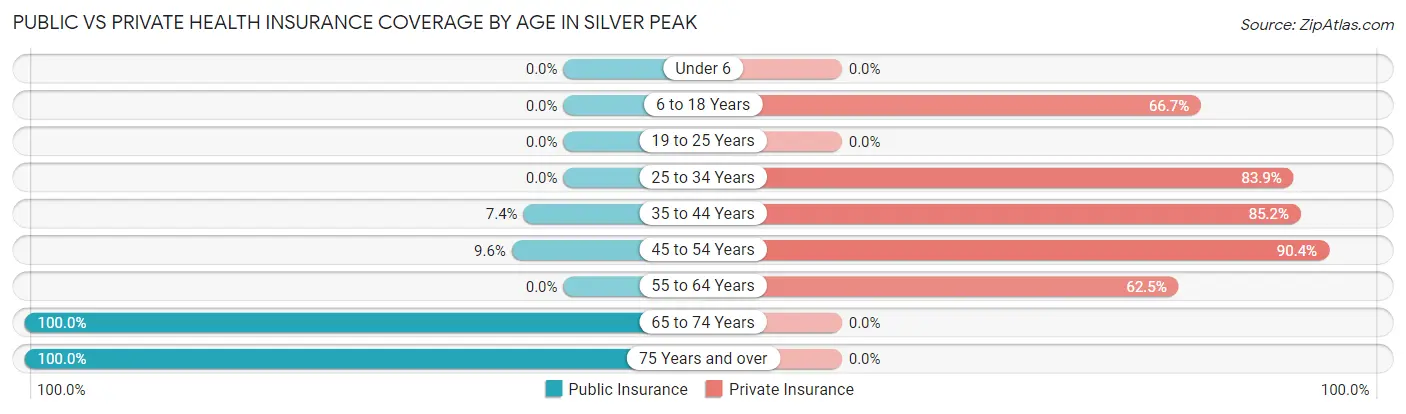
| Age Bracket | Public Insurance | Private Insurance |
| Under 6 | 0 (0.0%) | 0 (0.0%) |
| 6 to 18 Years | 0 (0.0%) | 10 (66.7%) |
| 19 to 25 Years | 0 (0.0%) | 0 (0.0%) |
| 25 to 34 Years | 0 (0.0%) | 26 (83.9%) |
| 35 to 44 Years | 4 (7.4%) | 46 (85.2%) |
| 45 to 54 Years | 7 (9.6%) | 66 (90.4%) |
| 55 to 64 Years | 0 (0.0%) | 10 (62.5%) |
| 65 to 74 Years | 18 (100.0%) | 0 (0.0%) |
| 75 Years and over | 6 (100.0%) | 0 (0.0%) |
| Total | 35 (16.4%) | 158 (74.2%) |
Disability Status by Sex by Age in Silver Peak
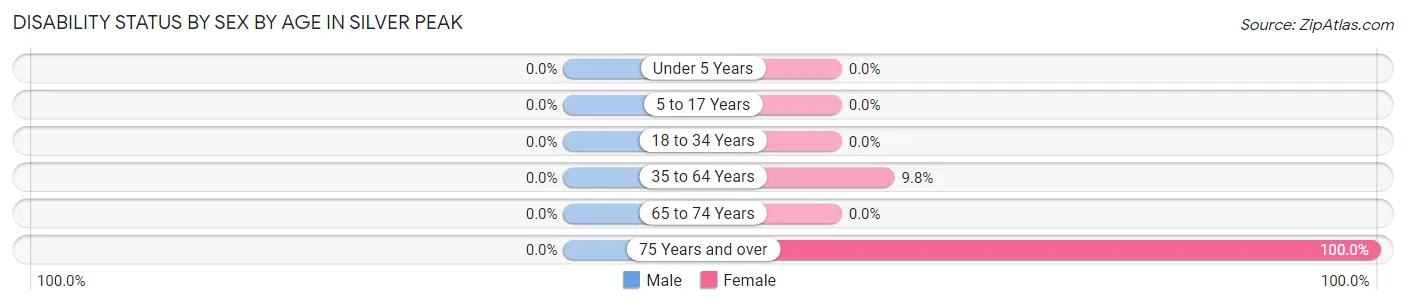
| Age Bracket | Male | Female |
| Under 5 Years | 0 (0.0%) | 0 (0.0%) |
| 5 to 17 Years | 0 (0.0%) | 0 (0.0%) |
| 18 to 34 Years | 0 (0.0%) | 0 (0.0%) |
| 35 to 64 Years | 0 (0.0%) | 10 (9.8%) |
| 65 to 74 Years | 0 (0.0%) | 0 (0.0%) |
| 75 Years and over | 0 (0.0%) | 6 (100.0%) |
Disability Class by Sex by Age in Silver Peak
Disability Class: Hearing Difficulty
| Age Bracket | Male | Female |
| Under 5 Years | 0 (0.0%) | 0 (0.0%) |
| 5 to 17 Years | 0 (0.0%) | 0 (0.0%) |
| 18 to 34 Years | 0 (0.0%) | 0 (0.0%) |
| 35 to 64 Years | 0 (0.0%) | 0 (0.0%) |
| 65 to 74 Years | 0 (0.0%) | 0 (0.0%) |
| 75 Years and over | 0 (0.0%) | 0 (0.0%) |
Disability Class: Vision Difficulty
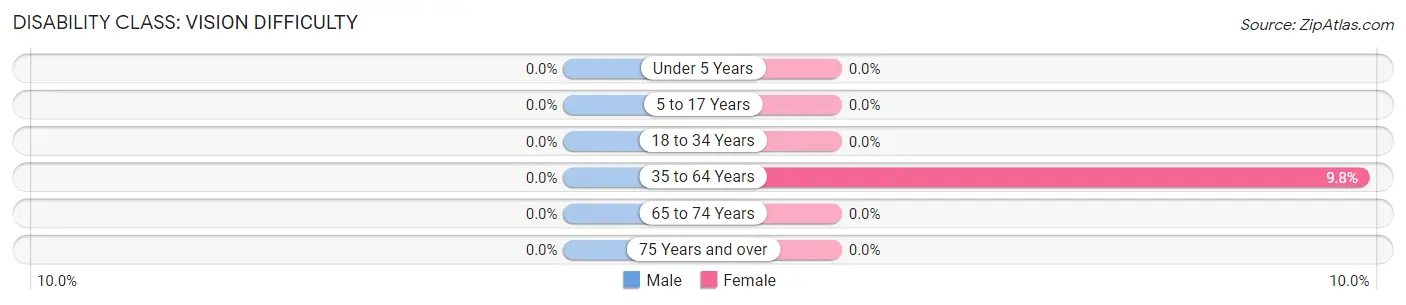
| Age Bracket | Male | Female |
| Under 5 Years | 0 (0.0%) | 0 (0.0%) |
| 5 to 17 Years | 0 (0.0%) | 0 (0.0%) |
| 18 to 34 Years | 0 (0.0%) | 0 (0.0%) |
| 35 to 64 Years | 0 (0.0%) | 10 (9.8%) |
| 65 to 74 Years | 0 (0.0%) | 0 (0.0%) |
| 75 Years and over | 0 (0.0%) | 0 (0.0%) |
Disability Class: Cognitive Difficulty
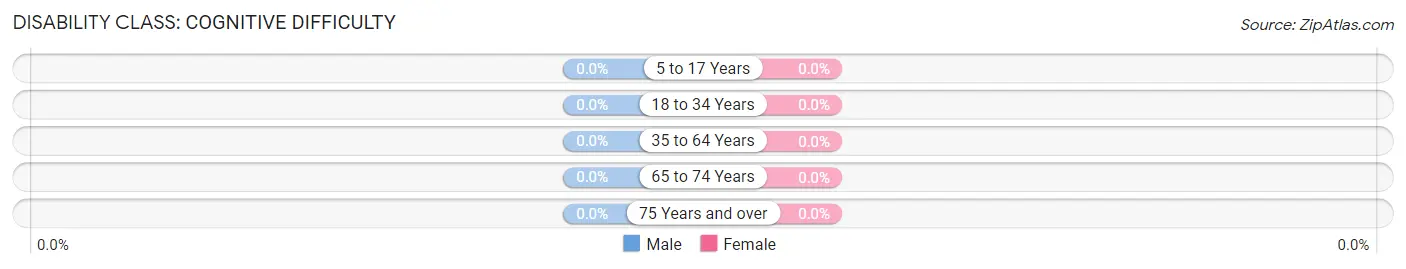
| Age Bracket | Male | Female |
| 5 to 17 Years | 0 (0.0%) | 0 (0.0%) |
| 18 to 34 Years | 0 (0.0%) | 0 (0.0%) |
| 35 to 64 Years | 0 (0.0%) | 0 (0.0%) |
| 65 to 74 Years | 0 (0.0%) | 0 (0.0%) |
| 75 Years and over | 0 (0.0%) | 0 (0.0%) |
Disability Class: Ambulatory Difficulty
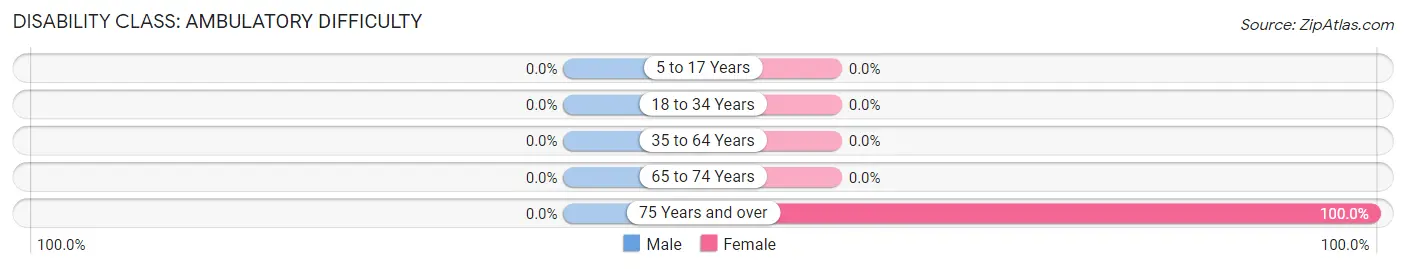
| Age Bracket | Male | Female |
| 5 to 17 Years | 0 (0.0%) | 0 (0.0%) |
| 18 to 34 Years | 0 (0.0%) | 0 (0.0%) |
| 35 to 64 Years | 0 (0.0%) | 0 (0.0%) |
| 65 to 74 Years | 0 (0.0%) | 0 (0.0%) |
| 75 Years and over | 0 (0.0%) | 6 (100.0%) |
Disability Class: Self-Care Difficulty
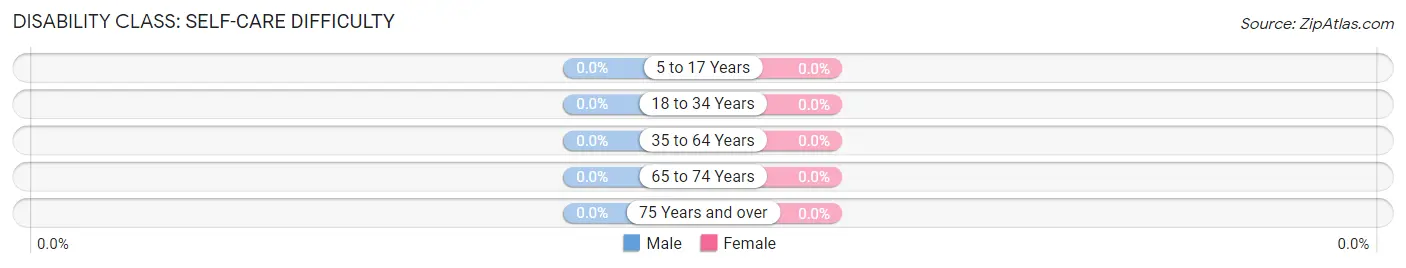
| Age Bracket | Male | Female |
| 5 to 17 Years | 0 (0.0%) | 0 (0.0%) |
| 18 to 34 Years | 0 (0.0%) | 0 (0.0%) |
| 35 to 64 Years | 0 (0.0%) | 0 (0.0%) |
| 65 to 74 Years | 0 (0.0%) | 0 (0.0%) |
| 75 Years and over | 0 (0.0%) | 0 (0.0%) |
Technology Access in Silver Peak
Computing Device Access in Silver Peak
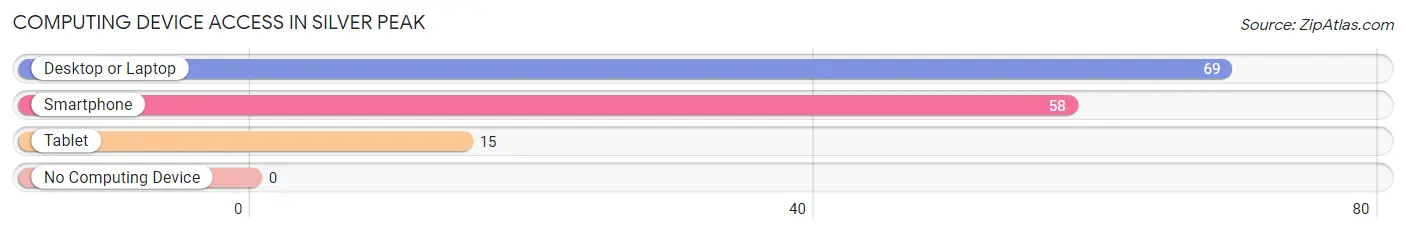
| Device Type | # Households | % Households |
| Desktop or Laptop | 69 | 94.5% |
| Smartphone | 58 | 79.4% |
| Tablet | 15 | 20.5% |
| No Computing Device | 0 | 0.0% |
| Total | 73 | 100.0% |
Internet Access in Silver Peak
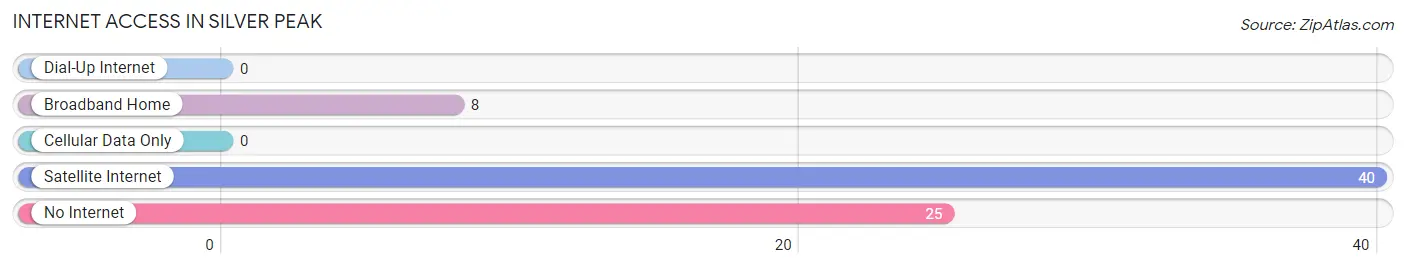
| Internet Type | # Households | % Households |
| Dial-Up Internet | 0 | 0.0% |
| Broadband Home | 8 | 11.0% |
| Cellular Data Only | 0 | 0.0% |
| Satellite Internet | 40 | 54.8% |
| No Internet | 25 | 34.3% |
| Total | 73 | 100.0% |
Silver Peak Summary
History
Silver Peak is a small town located in Esmeralda County, Nevada. It is situated in the northern part of the state, near the border with California. The town was founded in 1864 by prospectors who were searching for silver in the area. The town was named after the nearby Silver Peak mountain range, which was named for the silver ore that was found in the area.
The town quickly grew in size and by the late 1800s, it had become a bustling mining town. The town was home to several saloons, hotels, and stores. The town also had a post office, a school, and a newspaper.
In the early 1900s, the town began to decline as the silver mines began to run dry. The town was nearly abandoned by the 1930s, but it was revived in the 1950s when a new gold mine was discovered in the area. The town has since become a popular tourist destination, with many visitors coming to explore the old mining town and its surrounding area.
Geography
Silver Peak is located in the northern part of Nevada, near the border with California. The town is situated in the Silver Peak mountain range, which is part of the Great Basin Desert. The town is located at an elevation of 4,890 feet (1,490 m).
The town is surrounded by desert and mountains, with the nearest major city being Las Vegas, which is located about 150 miles (240 km) to the south. The town is located in a semi-arid climate, with hot summers and cold winters.
Economy
The economy of Silver Peak is largely based on tourism. The town is a popular destination for visitors who come to explore the old mining town and its surrounding area. The town is also home to several small businesses, including restaurants, hotels, and stores.
The town is also home to several mining operations, including gold and silver mines. The town is also home to a large solar energy plant, which provides power to the surrounding area.
Demographics
As of the 2010 census, the population of Silver Peak was 1,087. The town is predominantly white, with the majority of the population being of European descent. The town also has a small Hispanic population, as well as a small Native American population.
The median household income in Silver Peak is $41,250, and the median home value is $125,000. The town has a poverty rate of 16.3%, which is higher than the national average.
Conclusion
Silver Peak is a small town located in Esmeralda County, Nevada. It was founded in 1864 by prospectors who were searching for silver in the area. The town has since become a popular tourist destination, with many visitors coming to explore the old mining town and its surrounding area. The town is also home to several small businesses, mining operations, and a large solar energy plant. The population of Silver Peak is predominantly white, with the majority of the population being of European descent. The town has a median household income of $41,250 and a median home value of $125,000.
Common Questions
What is Per Capita Income in Silver Peak?
Per Capita income in Silver Peak is $35,061.
What is the Median Family Income in Silver Peak?
Median Family Income in Silver Peak is $102,917.
What is the Median Household income in Silver Peak?
Median Household Income in Silver Peak is $80,208.
What is Income or Wage Gap in Silver Peak?
Income or Wage Gap in Silver Peak is 80.6%.
Women in Silver Peak earn 19.4 cents for every dollar earned by a man.
What is Inequality or Gini Index in Silver Peak?
Inequality or Gini Index in Silver Peak is 0.20.
What is the Total Population of Silver Peak?
Total Population of Silver Peak is 213.
What is the Total Male Population of Silver Peak?
Total Male Population of Silver Peak is 71.
What is the Total Female Population of Silver Peak?
Total Female Population of Silver Peak is 142.
What is the Ratio of Males per 100 Females in Silver Peak?
There are 50.00 Males per 100 Females in Silver Peak.
What is the Ratio of Females per 100 Males in Silver Peak?
There are 200.00 Females per 100 Males in Silver Peak.
What is the Median Population Age in Silver Peak?
Median Population Age in Silver Peak is 51.9 Years.
What is the Average Family Size in Silver Peak
Average Family Size in Silver Peak is 4.0 People.
What is the Average Household Size in Silver Peak
Average Household Size in Silver Peak is 2.9 People.
How Large is the Labor Force in Silver Peak?
There are 156 People in the Labor Forcein in Silver Peak.
What is the Percentage of People in the Labor Force in Silver Peak?
75.0% of People are in the Labor Force in Silver Peak.
What is the Unemployment Rate in Silver Peak?
Unemployment Rate in Silver Peak is 3.2%.