Drowning Creek, OK Map & Demographics
Drowning Creek Map
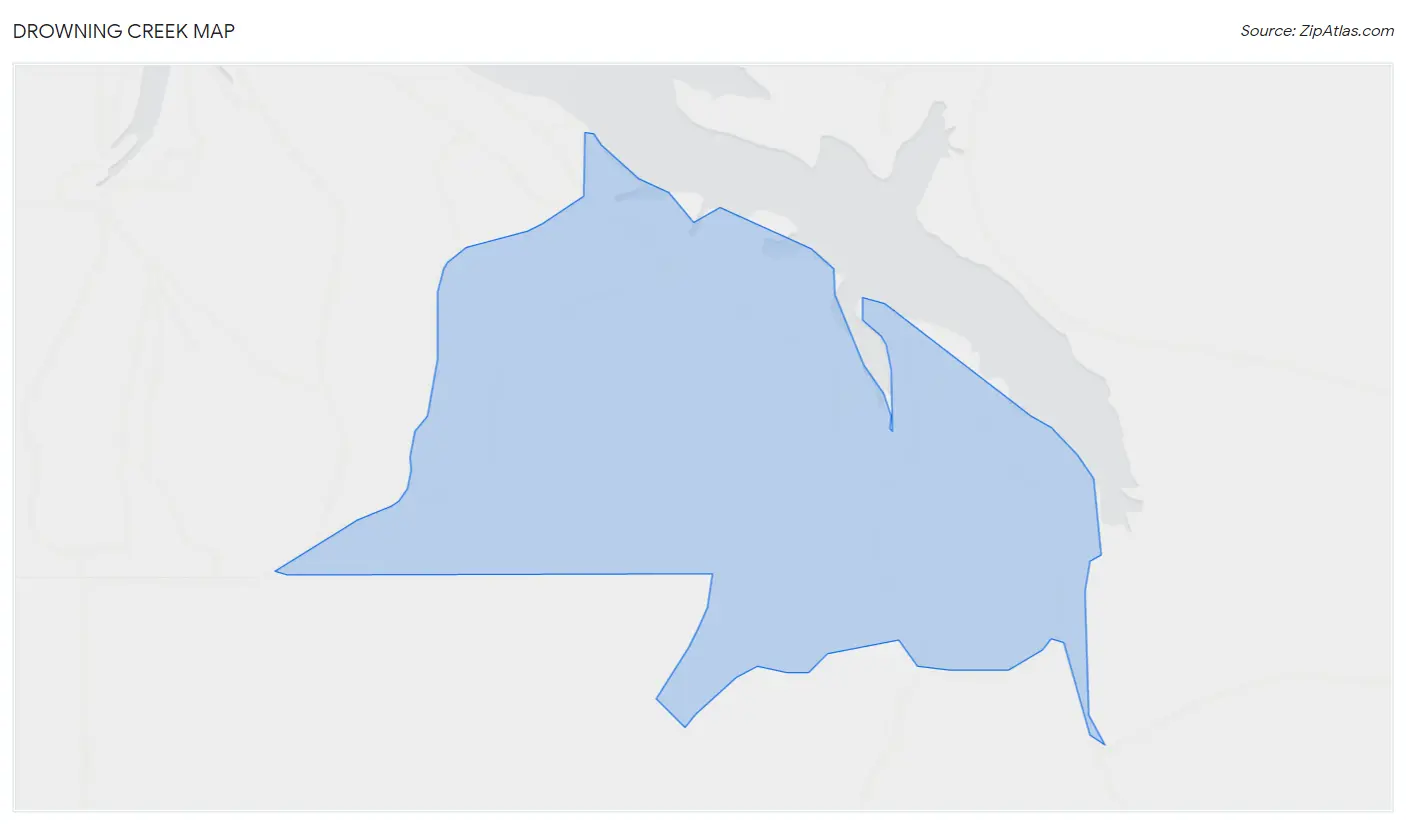
Drowning Creek Overview
$28,295
PER CAPITA INCOME
$41,250
AVG FAMILY INCOME
$36,989
AVG HOUSEHOLD INCOME
0.31
INEQUALITY / GINI INDEX
129
TOTAL POPULATION
87
MALE POPULATION
42
FEMALE POPULATION
207.14
MALES / 100 FEMALES
48.28
FEMALES / 100 MALES
70.1
MEDIAN AGE
1.9
AVG FAMILY SIZE
1.4
AVG HOUSEHOLD SIZE
11
LABOR FORCE [ PEOPLE ]
8.5%
PERCENT IN LABOR FORCE
Income in Drowning Creek
Income Overview in Drowning Creek
Per Capita Income in Drowning Creek is $28,295, while median incomes of families and households are $41,250 and $36,989 respectively.
| Characteristic | Number | Measure |
| Per Capita Income | 129 | $28,295 |
| Median Family Income | 37 | $41,250 |
| Mean Family Income | 37 | $53,830 |
| Median Household Income | 95 | $36,989 |
| Mean Household Income | 95 | $39,806 |
| Income Deficit | 37 | $0 |
| Wage / Income Gap (%) | 129 | 0.00% |
| Wage / Income Gap ($) | 129 | 100.00¢ per $1 |
| Gini / Inequality Index | 129 | 0.31 |
Earnings by Sex in Drowning Creek
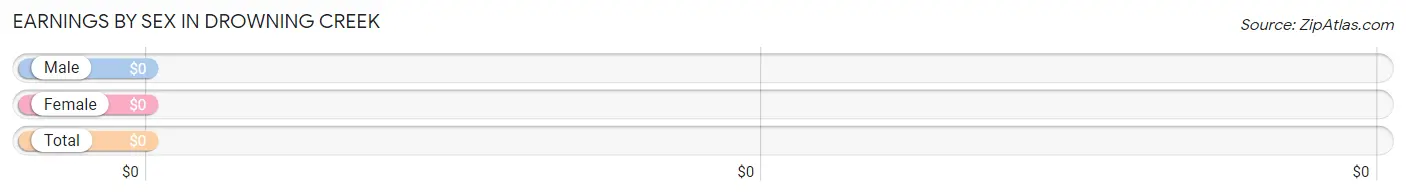
| Sex | Number | Average Earnings |
| Male | 11 (100.0%) | $0 |
| Female | 0 (0.0%) | $0 |
| Total | 11 (100.0%) | $0 |
Earnings by Sex by Income Bracket in Drowning Creek
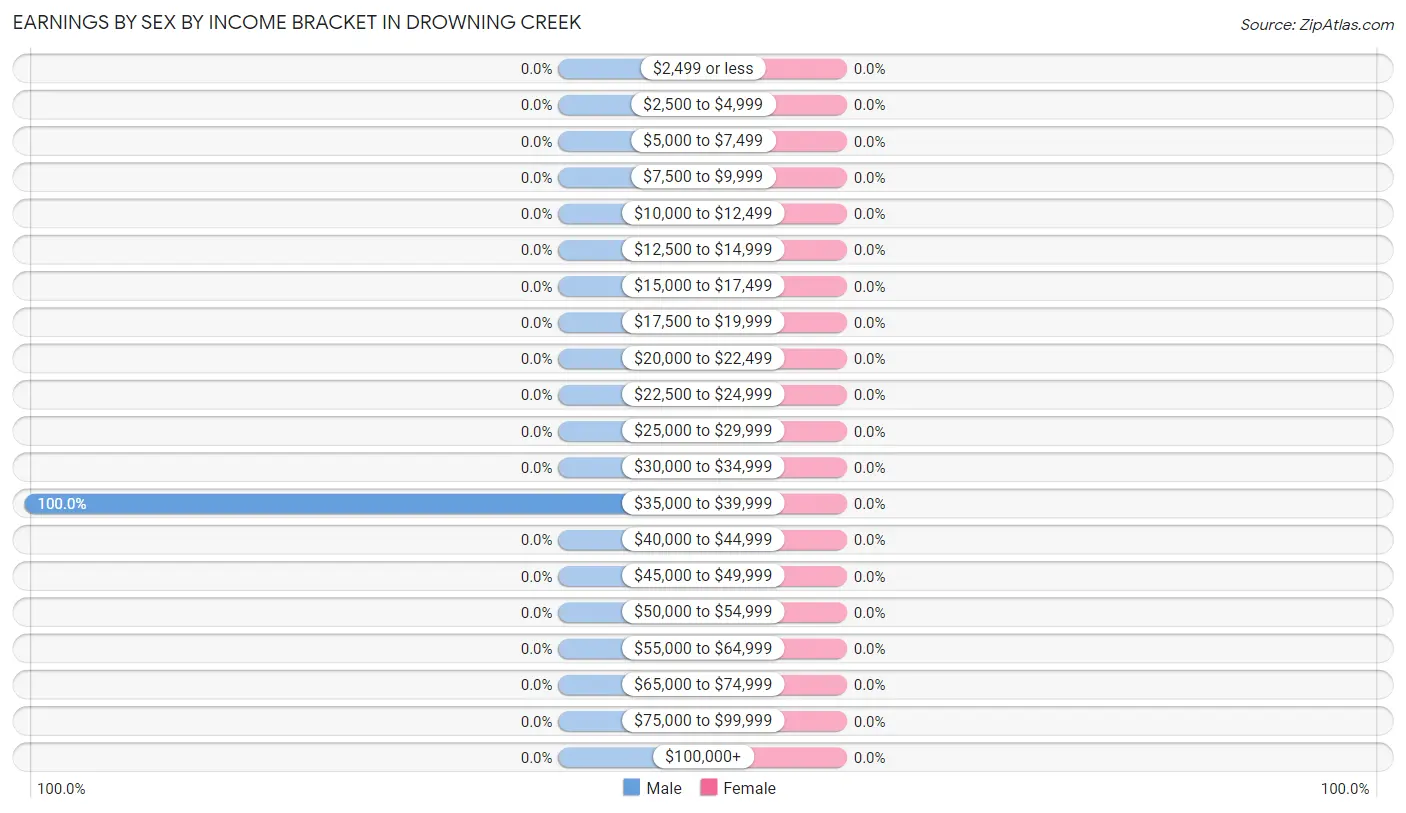
| Income | Male | Female |
| $2,499 or less | 0 (0.0%) | 0 (0.0%) |
| $2,500 to $4,999 | 0 (0.0%) | 0 (0.0%) |
| $5,000 to $7,499 | 0 (0.0%) | 0 (0.0%) |
| $7,500 to $9,999 | 0 (0.0%) | 0 (0.0%) |
| $10,000 to $12,499 | 0 (0.0%) | 0 (0.0%) |
| $12,500 to $14,999 | 0 (0.0%) | 0 (0.0%) |
| $15,000 to $17,499 | 0 (0.0%) | 0 (0.0%) |
| $17,500 to $19,999 | 0 (0.0%) | 0 (0.0%) |
| $20,000 to $22,499 | 0 (0.0%) | 0 (0.0%) |
| $22,500 to $24,999 | 0 (0.0%) | 0 (0.0%) |
| $25,000 to $29,999 | 0 (0.0%) | 0 (0.0%) |
| $30,000 to $34,999 | 0 (0.0%) | 0 (0.0%) |
| $35,000 to $39,999 | 11 (100.0%) | 0 (0.0%) |
| $40,000 to $44,999 | 0 (0.0%) | 0 (0.0%) |
| $45,000 to $49,999 | 0 (0.0%) | 0 (0.0%) |
| $50,000 to $54,999 | 0 (0.0%) | 0 (0.0%) |
| $55,000 to $64,999 | 0 (0.0%) | 0 (0.0%) |
| $65,000 to $74,999 | 0 (0.0%) | 0 (0.0%) |
| $75,000 to $99,999 | 0 (0.0%) | 0 (0.0%) |
| $100,000+ | 0 (0.0%) | 0 (0.0%) |
| Total | 11 (100.0%) | 0 (0.0%) |
Earnings by Sex by Educational Attainment in Drowning Creek
| Educational Attainment | Male Income | Female Income |
| Less than High School | - | - |
| High School Diploma | - | - |
| College or Associate's Degree | - | - |
| Bachelor's Degree | - | - |
| Graduate Degree | - | - |
| Total | - | - |
Family Income in Drowning Creek
Family Income Brackets in Drowning Creek
According to the Drowning Creek family income data, there are 26 families falling into the $35,000 to $49,999 income range, which is the most common income bracket and makes up 70.3% of all families.
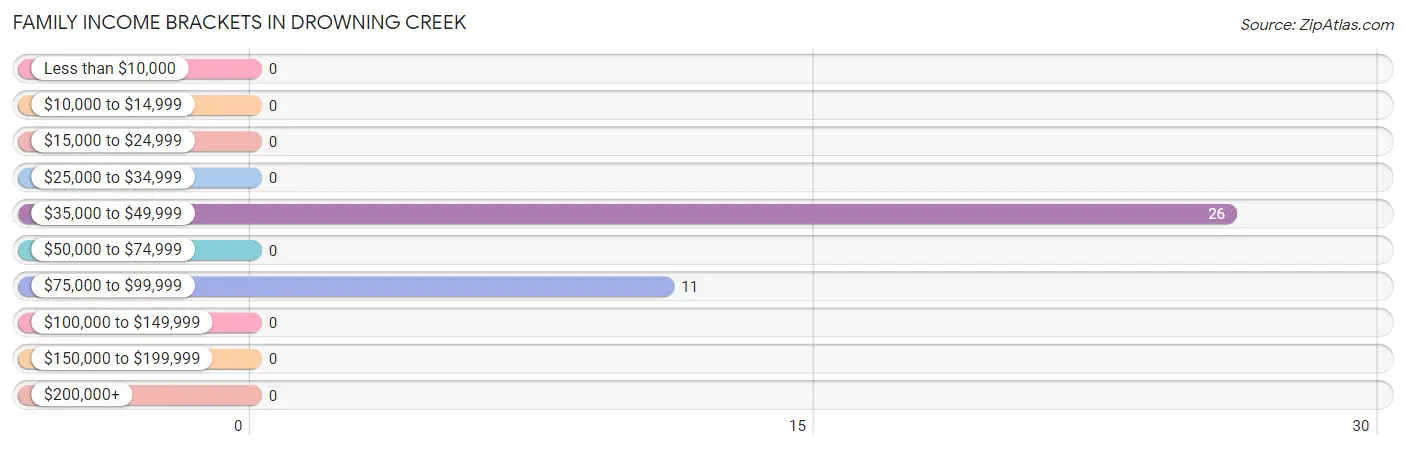
| Income Bracket | # Families | % Families |
| Less than $10,000 | 0 | 0.0% |
| $10,000 to $14,999 | 0 | 0.0% |
| $15,000 to $24,999 | 0 | 0.0% |
| $25,000 to $34,999 | 0 | 0.0% |
| $35,000 to $49,999 | 26 | 70.3% |
| $50,000 to $74,999 | 0 | 0.0% |
| $75,000 to $99,999 | 11 | 29.7% |
| $100,000 to $149,999 | 0 | 0.0% |
| $150,000 to $199,999 | 0 | 0.0% |
| $200,000+ | 0 | 0.0% |
Family Income by Famaliy Size in Drowning Creek
2-person families (37 | 100.0%) account for the highest median family income in Drowning Creek with $41,250 per family, while 2-person families (37 | 100.0%) have the highest median income of $20,625 per family member.
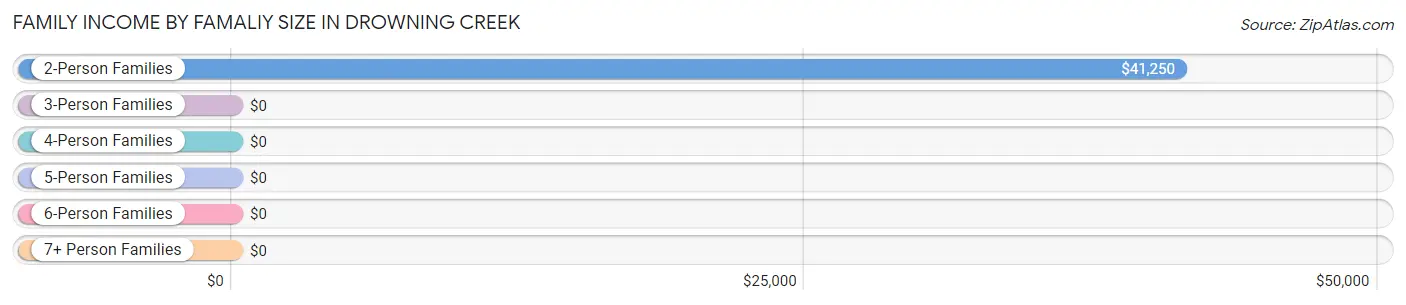
| Income Bracket | # Families | Median Income |
| 2-Person Families | 37 (100.0%) | $41,250 |
| 3-Person Families | 0 (0.0%) | $0 |
| 4-Person Families | 0 (0.0%) | $0 |
| 5-Person Families | 0 (0.0%) | $0 |
| 6-Person Families | 0 (0.0%) | $0 |
| 7+ Person Families | 0 (0.0%) | $0 |
| Total | 37 (100.0%) | $41,250 |
Family Income by Number of Earners in Drowning Creek
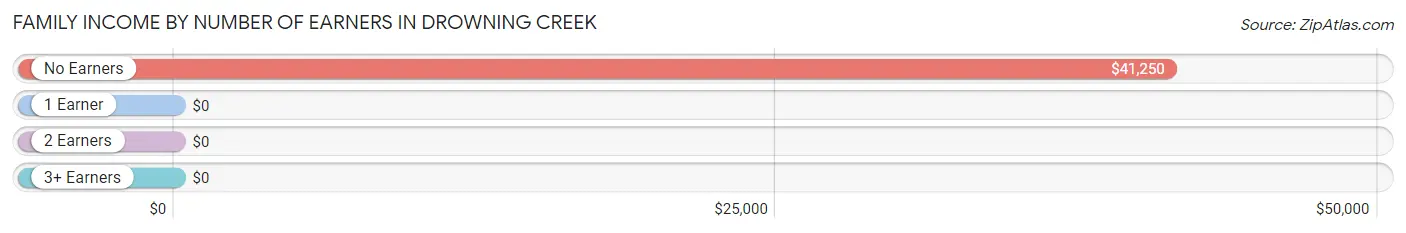
| Number of Earners | # Families | Median Income |
| No Earners | 37 (100.0%) | $41,250 |
| 1 Earner | 0 (0.0%) | $0 |
| 2 Earners | 0 (0.0%) | $0 |
| 3+ Earners | 0 (0.0%) | $0 |
| Total | 37 (100.0%) | $41,250 |
Household Income in Drowning Creek
Household Income Brackets in Drowning Creek
With 46 households falling in the category, the $35,000 to $49,999 income range is the most frequent in Drowning Creek, accounting for 48.4% of all households.
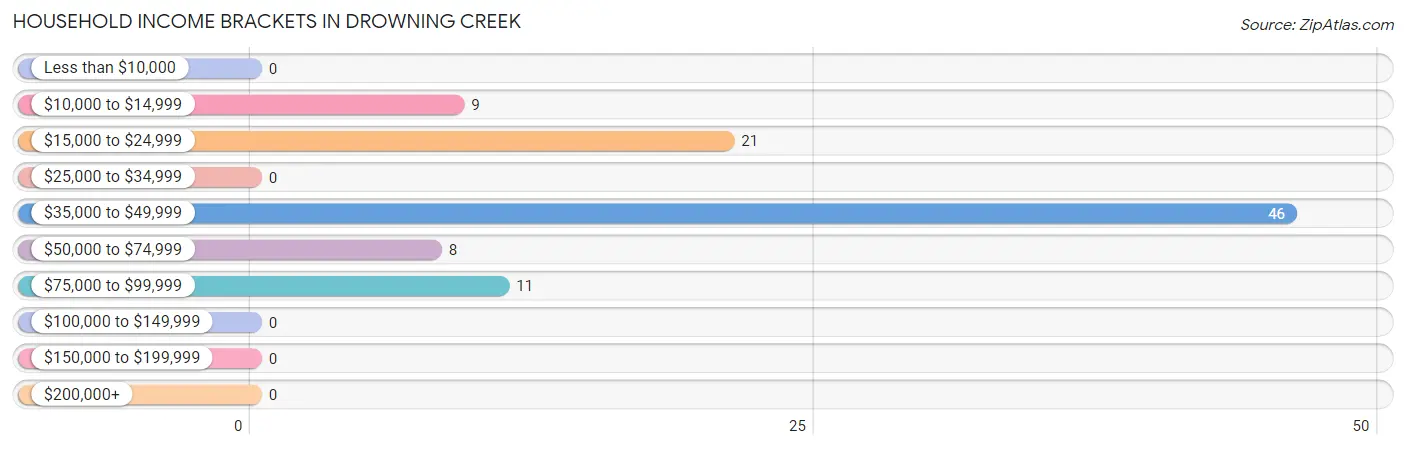
| Income Bracket | # Households | % Households |
| Less than $10,000 | 0 | 0.0% |
| $10,000 to $14,999 | 9 | 9.5% |
| $15,000 to $24,999 | 21 | 22.1% |
| $25,000 to $34,999 | 0 | 0.0% |
| $35,000 to $49,999 | 46 | 48.4% |
| $50,000 to $74,999 | 8 | 8.4% |
| $75,000 to $99,999 | 11 | 11.6% |
| $100,000 to $149,999 | 0 | 0.0% |
| $150,000 to $199,999 | 0 | 0.0% |
| $200,000+ | 0 | 0.0% |
Household Income by Householder Age in Drowning Creek
The median household income in Drowning Creek is $36,989, with the highest median household income of $41,167 found in the 65+ years age bracket for the primary householder. A total of 54 households (56.8%) fall into this category.
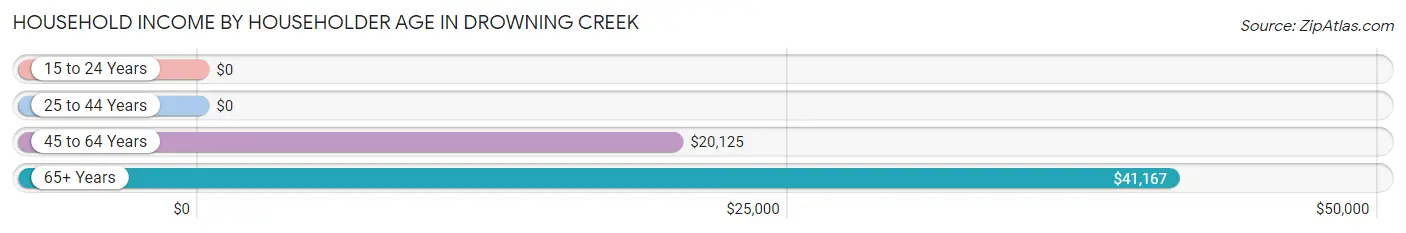
| Income Bracket | # Households | Median Income |
| 15 to 24 Years | 0 (0.0%) | $0 |
| 25 to 44 Years | 0 (0.0%) | $0 |
| 45 to 64 Years | 41 (43.2%) | $20,125 |
| 65+ Years | 54 (56.8%) | $41,167 |
| Total | 95 (100.0%) | $36,989 |
Poverty in Drowning Creek
Income Below Poverty by Sex and Age in Drowning Creek
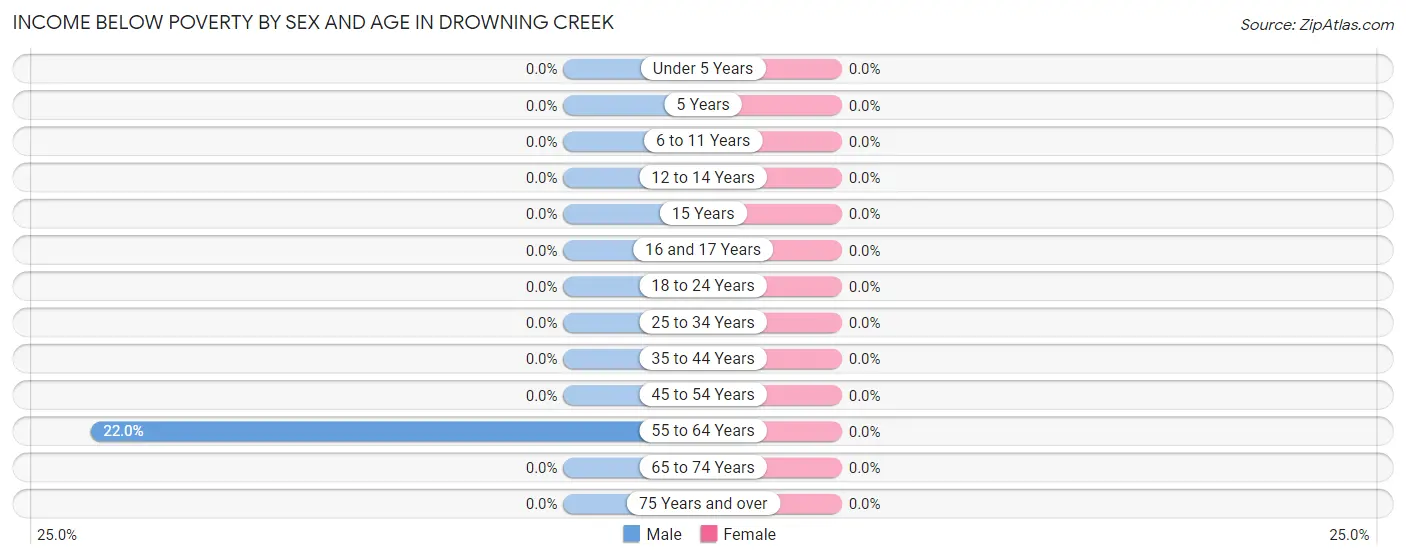
| Age Bracket | Male | Female |
| Under 5 Years | 0 (0.0%) | 0 (0.0%) |
| 5 Years | 0 (0.0%) | 0 (0.0%) |
| 6 to 11 Years | 0 (0.0%) | 0 (0.0%) |
| 12 to 14 Years | 0 (0.0%) | 0 (0.0%) |
| 15 Years | 0 (0.0%) | 0 (0.0%) |
| 16 and 17 Years | 0 (0.0%) | 0 (0.0%) |
| 18 to 24 Years | 0 (0.0%) | 0 (0.0%) |
| 25 to 34 Years | 0 (0.0%) | 0 (0.0%) |
| 35 to 44 Years | 0 (0.0%) | 0 (0.0%) |
| 45 to 54 Years | 0 (0.0%) | 0 (0.0%) |
| 55 to 64 Years | 9 (22.0%) | 0 (0.0%) |
| 65 to 74 Years | 0 (0.0%) | 0 (0.0%) |
| 75 Years and over | 0 (0.0%) | 0 (0.0%) |
| Total | 9 (10.3%) | 0 (0.0%) |
Income Above Poverty by Sex and Age in Drowning Creek
According to the poverty statistics in Drowning Creek, males aged 65 to 74 years and females aged 65 to 74 years are the age groups that are most secure financially, with 100.0% of males and 100.0% of females in these age groups living above the poverty line.

| Age Bracket | Male | Female |
| Under 5 Years | 0 (0.0%) | 0 (0.0%) |
| 5 Years | 0 (0.0%) | 0 (0.0%) |
| 6 to 11 Years | 0 (0.0%) | 0 (0.0%) |
| 12 to 14 Years | 0 (0.0%) | 0 (0.0%) |
| 15 Years | 0 (0.0%) | 0 (0.0%) |
| 16 and 17 Years | 0 (0.0%) | 0 (0.0%) |
| 18 to 24 Years | 0 (0.0%) | 0 (0.0%) |
| 25 to 34 Years | 0 (0.0%) | 0 (0.0%) |
| 35 to 44 Years | 0 (0.0%) | 0 (0.0%) |
| 45 to 54 Years | 0 (0.0%) | 0 (0.0%) |
| 55 to 64 Years | 32 (78.0%) | 0 (0.0%) |
| 65 to 74 Years | 35 (100.0%) | 26 (100.0%) |
| 75 Years and over | 11 (100.0%) | 16 (100.0%) |
| Total | 78 (89.7%) | 42 (100.0%) |
Income Below Poverty Among Married-Couple Families in Drowning Creek
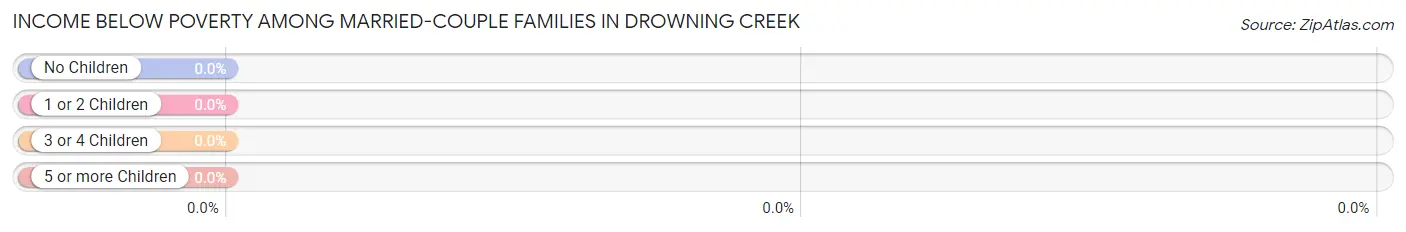
| Children | Above Poverty | Below Poverty |
| No Children | 37 (100.0%) | 0 (0.0%) |
| 1 or 2 Children | 0 (0.0%) | 0 (0.0%) |
| 3 or 4 Children | 0 (0.0%) | 0 (0.0%) |
| 5 or more Children | 0 (0.0%) | 0 (0.0%) |
| Total | 37 (100.0%) | 0 (0.0%) |
Income Below Poverty Among Single-Parent Households in Drowning Creek
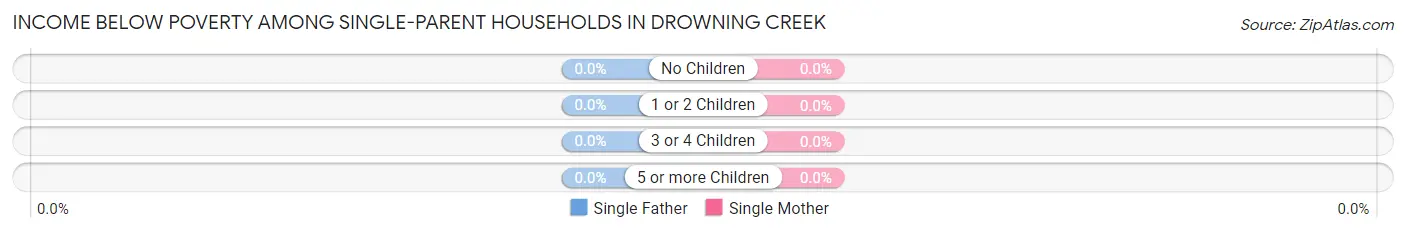
| Children | Single Father | Single Mother |
| No Children | 0 (0.0%) | 0 (0.0%) |
| 1 or 2 Children | 0 (0.0%) | 0 (0.0%) |
| 3 or 4 Children | 0 (0.0%) | 0 (0.0%) |
| 5 or more Children | 0 (0.0%) | 0 (0.0%) |
| Total | 0 (0.0%) | 0 (0.0%) |
Income Below Poverty Among Married-Couple vs Single-Parent Households in Drowning Creek
| Children | Married-Couple Families | Single-Parent Households |
| No Children | 0 (0.0%) | 0 (0.0%) |
| 1 or 2 Children | 0 (0.0%) | 0 (0.0%) |
| 3 or 4 Children | 0 (0.0%) | 0 (0.0%) |
| 5 or more Children | 0 (0.0%) | 0 (0.0%) |
| Total | 0 (0.0%) | 0 (0.0%) |
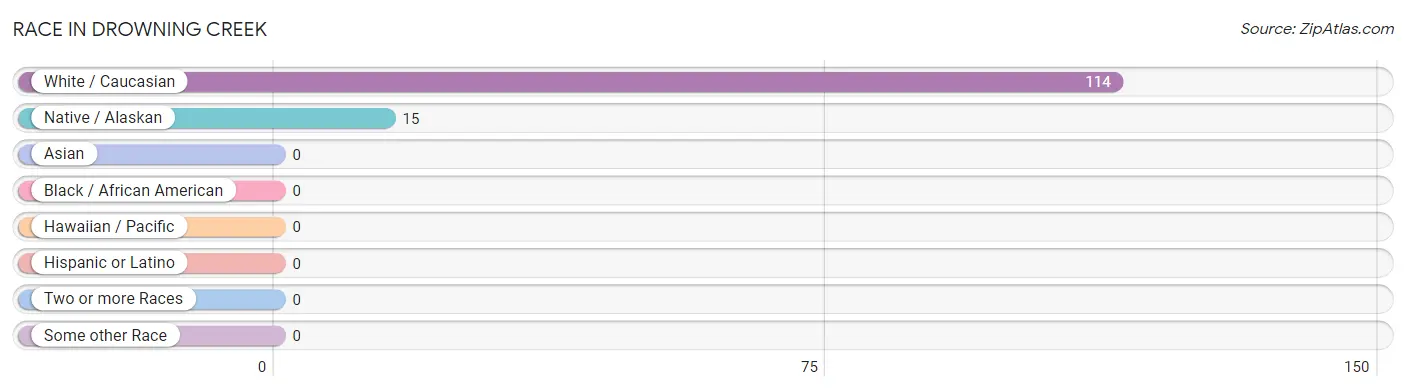
Race in Drowning Creek
The most populous races in Drowning Creek are White / Caucasian (114 | 88.4%), and Native / Alaskan (15 | 11.6%).
| Race | # Population | % Population |
| Asian | 0 | 0.0% |
| Black / African American | 0 | 0.0% |
| Hawaiian / Pacific | 0 | 0.0% |
| Hispanic or Latino | 0 | 0.0% |
| Native / Alaskan | 15 | 11.6% |
| White / Caucasian | 114 | 88.4% |
| Two or more Races | 0 | 0.0% |
| Some other Race | 0 | 0.0% |
| Total | 129 | 100.0% |
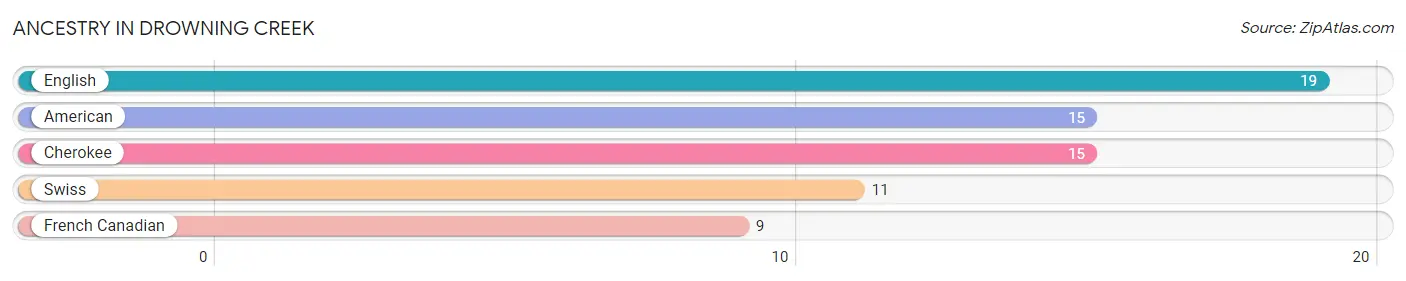
Ancestry in Drowning Creek
The most populous ancestries reported in Drowning Creek are English (19 | 14.7%), American (15 | 11.6%), Cherokee (15 | 11.6%), Swiss (11 | 8.5%), and French Canadian (9 | 7.0%), together accounting for 53.5% of all Drowning Creek residents.
| Ancestry | # Population | % Population |
| American | 15 | 11.6% |
| Cherokee | 15 | 11.6% |
| English | 19 | 14.7% |
| French Canadian | 9 | 7.0% |
| Swiss | 11 | 8.5% | View All 5 Rows |
Immigrants in Drowning Creek

| Immigration Origin | # Population | % Population | View All 0 Rows |
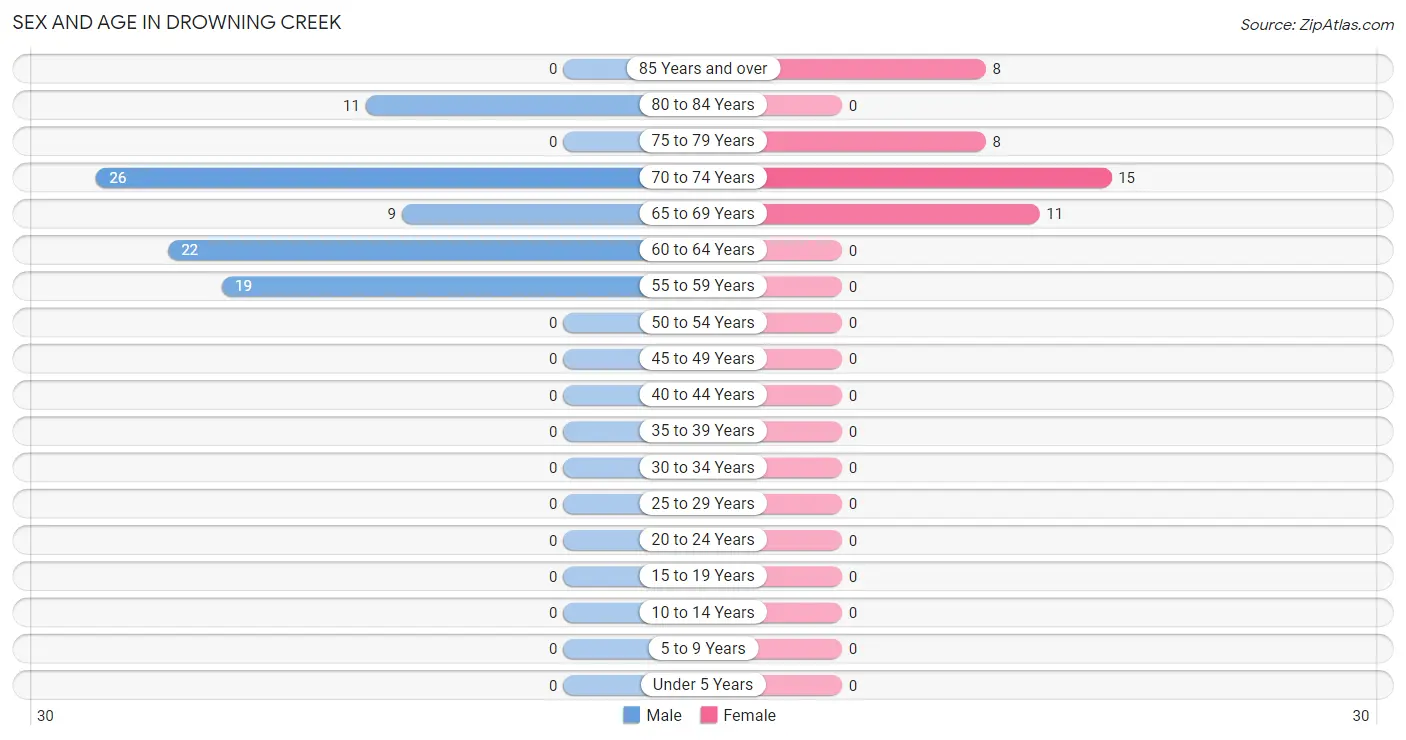
Sex and Age in Drowning Creek
Sex and Age in Drowning Creek
The most populous age groups in Drowning Creek are 70 to 74 Years (26 | 29.9%) for men and 70 to 74 Years (15 | 35.7%) for women.
| Age Bracket | Male | Female |
| Under 5 Years | 0 (0.0%) | 0 (0.0%) |
| 5 to 9 Years | 0 (0.0%) | 0 (0.0%) |
| 10 to 14 Years | 0 (0.0%) | 0 (0.0%) |
| 15 to 19 Years | 0 (0.0%) | 0 (0.0%) |
| 20 to 24 Years | 0 (0.0%) | 0 (0.0%) |
| 25 to 29 Years | 0 (0.0%) | 0 (0.0%) |
| 30 to 34 Years | 0 (0.0%) | 0 (0.0%) |
| 35 to 39 Years | 0 (0.0%) | 0 (0.0%) |
| 40 to 44 Years | 0 (0.0%) | 0 (0.0%) |
| 45 to 49 Years | 0 (0.0%) | 0 (0.0%) |
| 50 to 54 Years | 0 (0.0%) | 0 (0.0%) |
| 55 to 59 Years | 19 (21.8%) | 0 (0.0%) |
| 60 to 64 Years | 22 (25.3%) | 0 (0.0%) |
| 65 to 69 Years | 9 (10.3%) | 11 (26.2%) |
| 70 to 74 Years | 26 (29.9%) | 15 (35.7%) |
| 75 to 79 Years | 0 (0.0%) | 8 (19.1%) |
| 80 to 84 Years | 11 (12.6%) | 0 (0.0%) |
| 85 Years and over | 0 (0.0%) | 8 (19.1%) |
| Total | 87 (100.0%) | 42 (100.0%) |
Families and Households in Drowning Creek
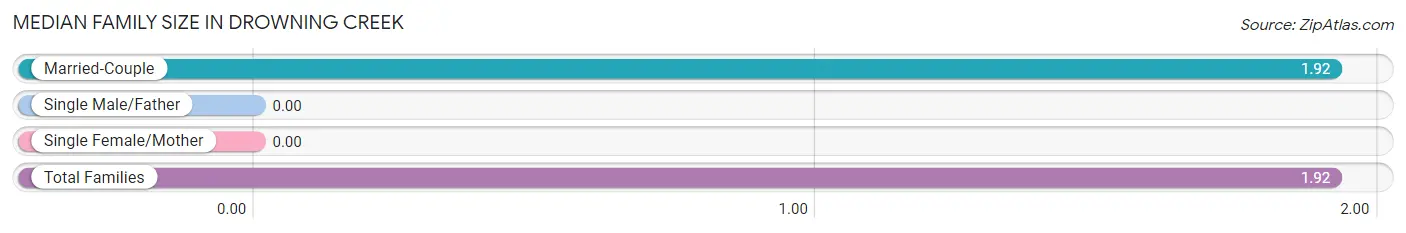
Median Family Size in Drowning Creek
| Family Type | # Families | Family Size |
| Married-Couple | 37 (100.0%) | 1.92 |
| Single Male/Father | 0 (0.0%) | - |
| Single Female/Mother | 0 (0.0%) | - |
| Total Families | 37 (100.0%) | 1.92 |
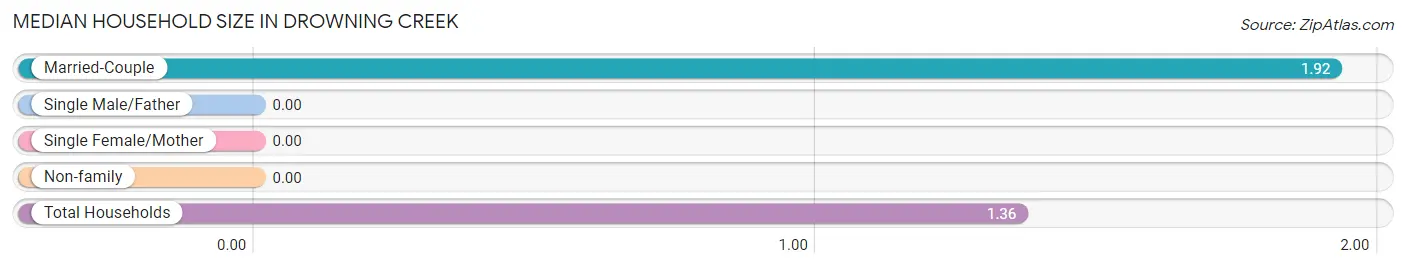
Median Household Size in Drowning Creek
| Household Type | # Households | Household Size |
| Married-Couple | 37 (39.0%) | 1.92 |
| Single Male/Father | 0 (0.0%) | - |
| Single Female/Mother | 0 (0.0%) | - |
| Non-family | 58 (61.1%) | - |
| Total Households | 95 (100.0%) | 1.36 |
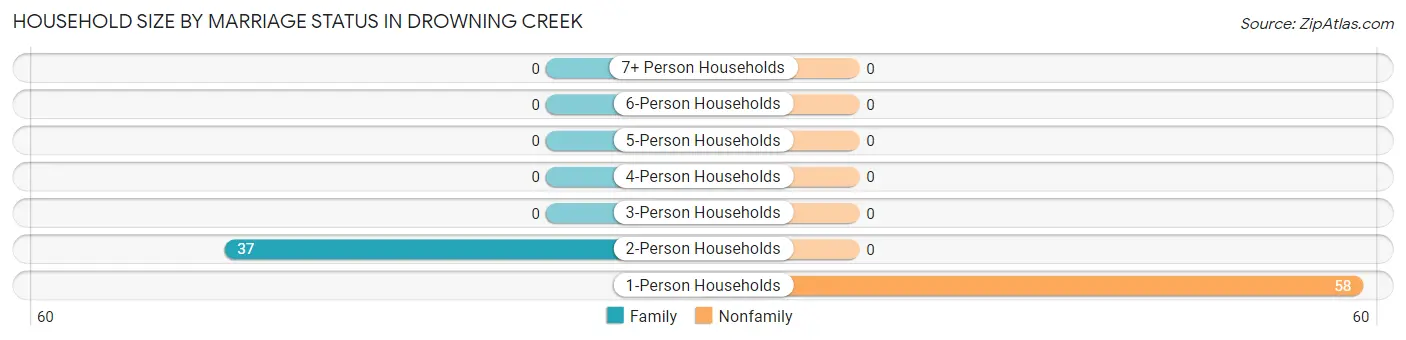
Household Size by Marriage Status in Drowning Creek
Out of a total of 95 households in Drowning Creek, 37 (39.0%) are family households, while 58 (61.1%) are nonfamily households. The most numerous type of family households are 2-person households, comprising 37, and the most common type of nonfamily households are 1-person households, comprising 58.
| Household Size | Family Households | Nonfamily Households |
| 1-Person Households | - | 58 (61.1%) |
| 2-Person Households | 37 (39.0%) | 0 (0.0%) |
| 3-Person Households | 0 (0.0%) | 0 (0.0%) |
| 4-Person Households | 0 (0.0%) | 0 (0.0%) |
| 5-Person Households | 0 (0.0%) | 0 (0.0%) |
| 6-Person Households | 0 (0.0%) | 0 (0.0%) |
| 7+ Person Households | 0 (0.0%) | 0 (0.0%) |
| Total | 37 (39.0%) | 58 (61.1%) |
Female Fertility in Drowning Creek
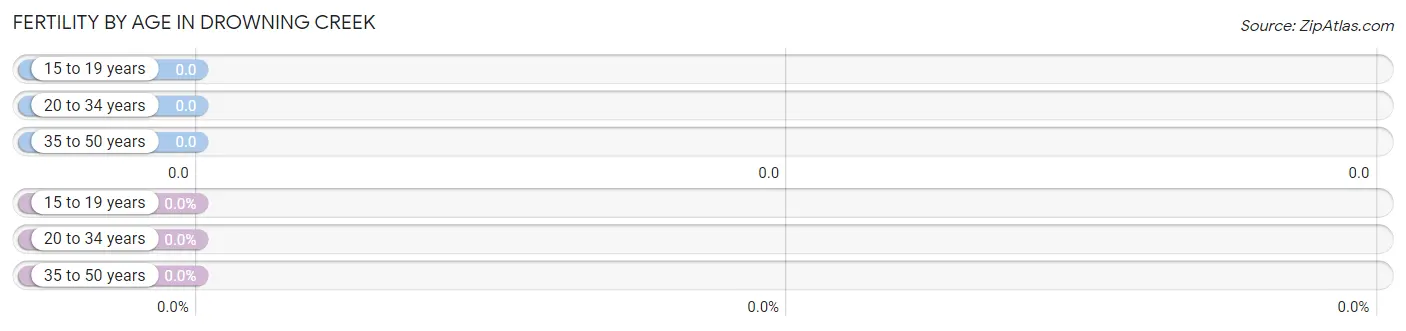
Fertility by Age in Drowning Creek
| Age Bracket | Women with Births | Births / 1,000 Women |
| 15 to 19 years | 0 (0.0%) | 0.0 |
| 20 to 34 years | 0 (0.0%) | 0.0 |
| 35 to 50 years | 0 (0.0%) | 0.0 |
| Total | 0 (0.0%) | 0.0 |
Fertility by Age by Marriage Status in Drowning Creek
| Age Bracket | Married | Unmarried |
| 15 to 19 years | 0 (0.0%) | 0 (0.0%) |
| 20 to 34 years | 0 (0.0%) | 0 (0.0%) |
| 35 to 50 years | 0 (0.0%) | 0 (0.0%) |
| Total | 0 (0.0%) | 0 (0.0%) |
Fertility by Education in Drowning Creek
| Educational Attainment | Women with Births | Births / 1,000 Women |
| Less than High School | 0 (0.0%) | 0.0 |
| High School Diploma | 0 (0.0%) | 0.0 |
| College or Associate's Degree | 0 (0.0%) | 0.0 |
| Bachelor's Degree | 0 (0.0%) | 0.0 |
| Graduate Degree | 0 (0.0%) | 0.0 |
| Total | 0 (0.0%) | 0.0 |
Fertility by Education by Marriage Status in Drowning Creek
| Educational Attainment | Married | Unmarried |
| Less than High School | 0 (0.0%) | 0 (0.0%) |
| High School Diploma | 0 (0.0%) | 0 (0.0%) |
| College or Associate's Degree | 0 (0.0%) | 0 (0.0%) |
| Bachelor's Degree | 0 (0.0%) | 0 (0.0%) |
| Graduate Degree | 0 (0.0%) | 0 (0.0%) |
| Total | 0 (0.0%) | 0 (0.0%) |
Employment Characteristics in Drowning Creek
Employment by Class of Employer in Drowning Creek
Among the 11 employed individuals in Drowning Creek, , and private company employees (11 | 100.0%) make up the most common classes of employment.
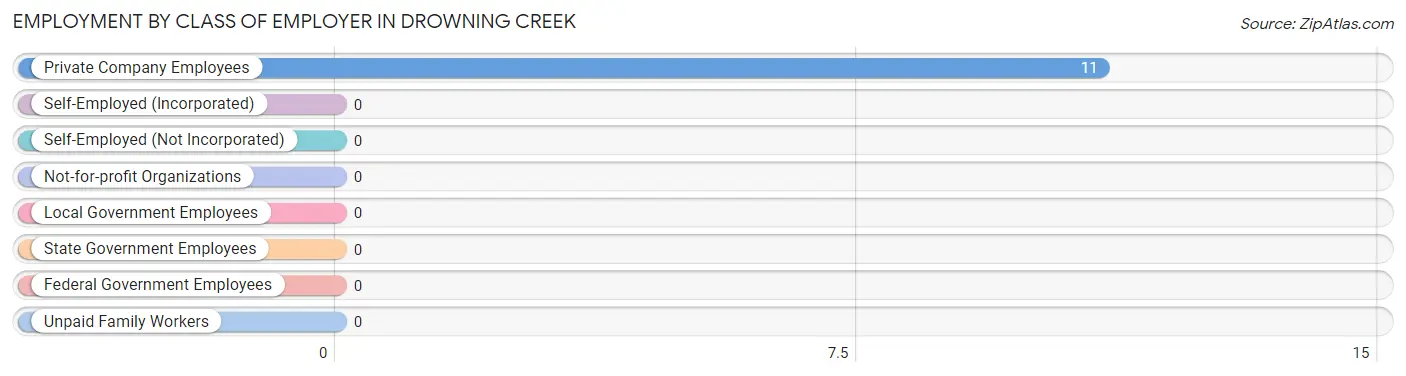
| Employer Class | # Employees | % Employees |
| Private Company Employees | 11 | 100.0% |
| Self-Employed (Incorporated) | 0 | 0.0% |
| Self-Employed (Not Incorporated) | 0 | 0.0% |
| Not-for-profit Organizations | 0 | 0.0% |
| Local Government Employees | 0 | 0.0% |
| State Government Employees | 0 | 0.0% |
| Federal Government Employees | 0 | 0.0% |
| Unpaid Family Workers | 0 | 0.0% |
| Total | 11 | 100.0% |
Employment Status by Age in Drowning Creek
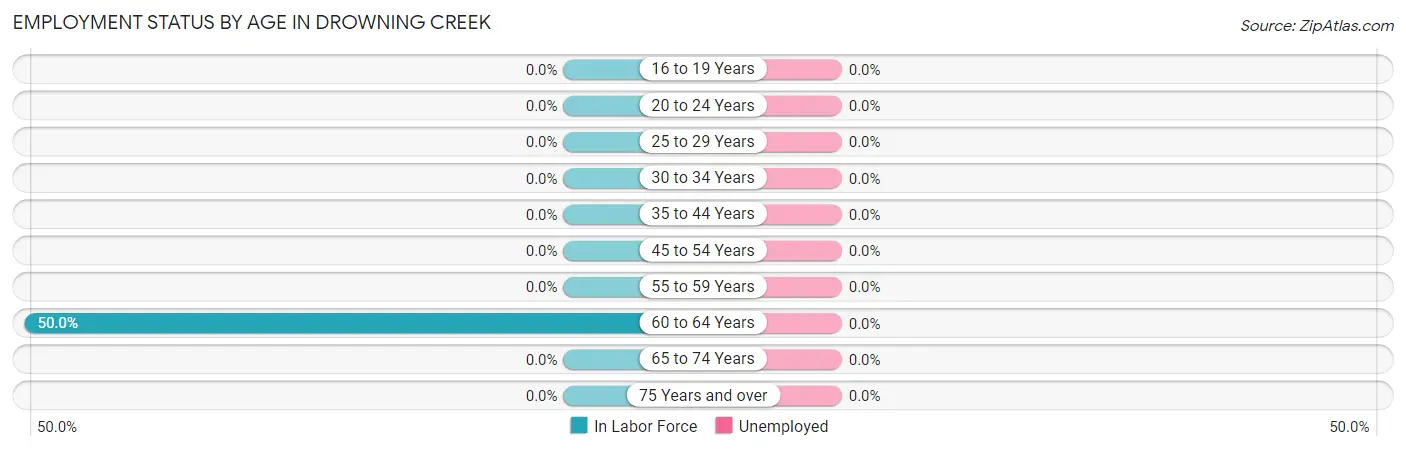
| Age Bracket | In Labor Force | Unemployed |
| 16 to 19 Years | 0 (0.0%) | 0 (0.0%) |
| 20 to 24 Years | 0 (0.0%) | 0 (0.0%) |
| 25 to 29 Years | 0 (0.0%) | 0 (0.0%) |
| 30 to 34 Years | 0 (0.0%) | 0 (0.0%) |
| 35 to 44 Years | 0 (0.0%) | 0 (0.0%) |
| 45 to 54 Years | 0 (0.0%) | 0 (0.0%) |
| 55 to 59 Years | 0 (0.0%) | 0 (0.0%) |
| 60 to 64 Years | 11 (50.0%) | 0 (0.0%) |
| 65 to 74 Years | 0 (0.0%) | 0 (0.0%) |
| 75 Years and over | 0 (0.0%) | 0 (0.0%) |
| Total | 11 (8.5%) | 0 (0.0%) |
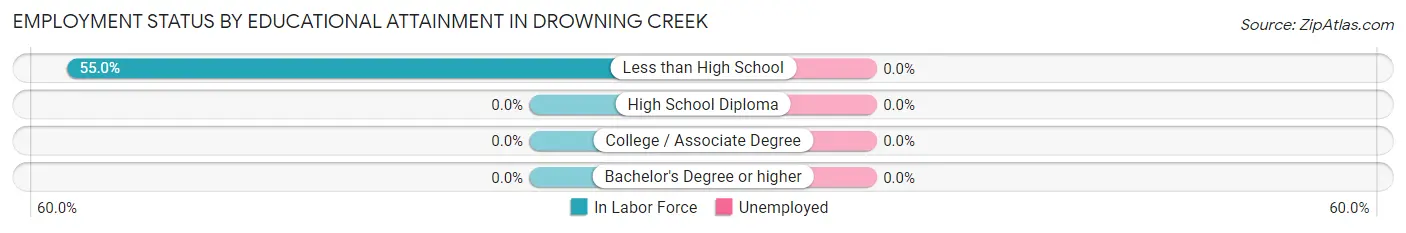
Employment Status by Educational Attainment in Drowning Creek
| Educational Attainment | In Labor Force | Unemployed |
| Less than High School | 11 (55.0%) | 0 (0.0%) |
| High School Diploma | 0 (0.0%) | 0 (0.0%) |
| College / Associate Degree | 0 (0.0%) | 0 (0.0%) |
| Bachelor's Degree or higher | 0 (0.0%) | 0 (0.0%) |
| Total | 11 (26.8%) | 0 (0.0%) |
Employment Occupations by Sex in Drowning Creek
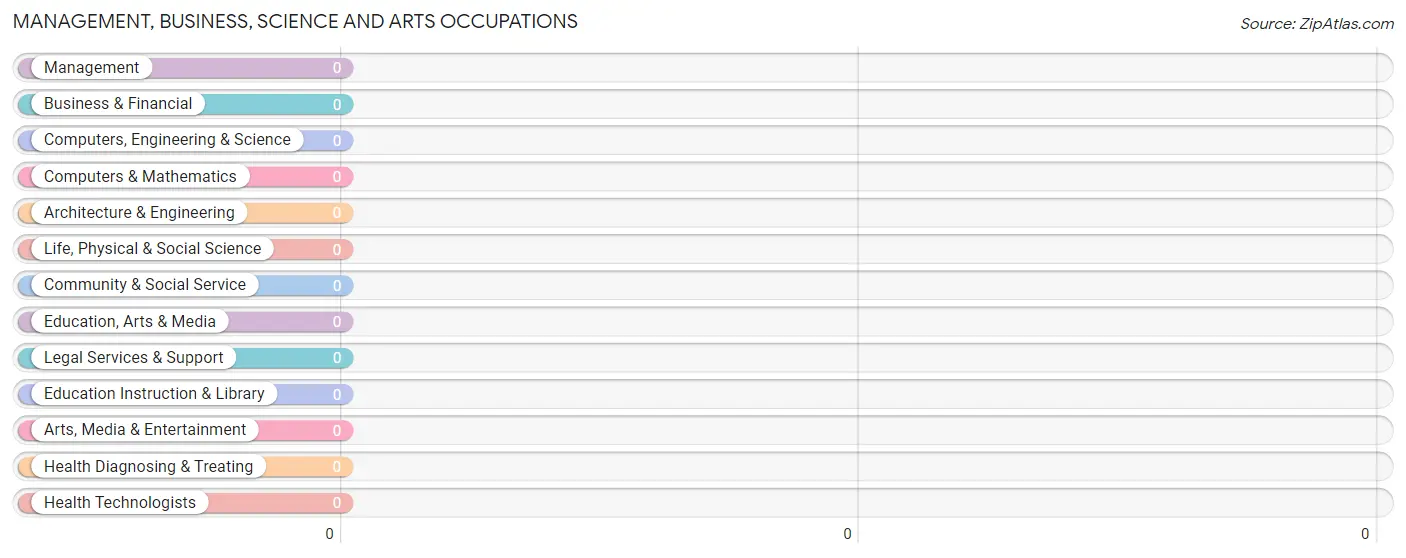
Management, Business, Science and Arts Occupations
Management, Business, Science and Arts Occupations by Sex
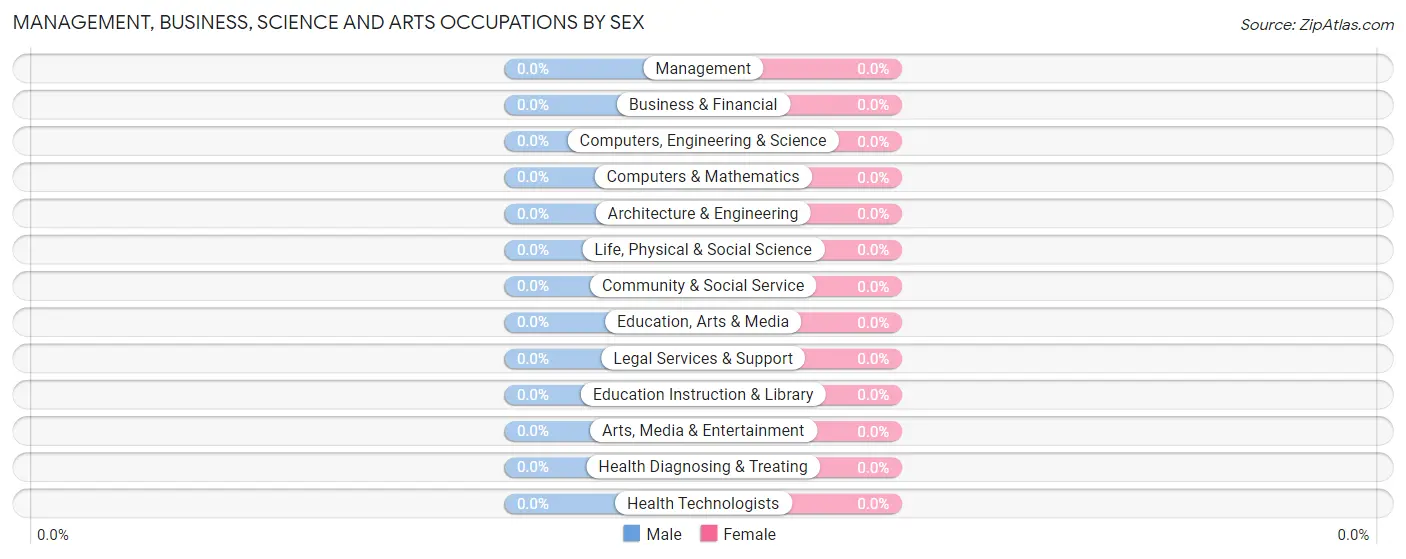
| Occupation | Male | Female |
| Management | 0 (0.0%) | 0 (0.0%) |
| Business & Financial | 0 (0.0%) | 0 (0.0%) |
| Computers, Engineering & Science | 0 (0.0%) | 0 (0.0%) |
| Computers & Mathematics | 0 (0.0%) | 0 (0.0%) |
| Architecture & Engineering | 0 (0.0%) | 0 (0.0%) |
| Life, Physical & Social Science | 0 (0.0%) | 0 (0.0%) |
| Community & Social Service | 0 (0.0%) | 0 (0.0%) |
| Education, Arts & Media | 0 (0.0%) | 0 (0.0%) |
| Legal Services & Support | 0 (0.0%) | 0 (0.0%) |
| Education Instruction & Library | 0 (0.0%) | 0 (0.0%) |
| Arts, Media & Entertainment | 0 (0.0%) | 0 (0.0%) |
| Health Diagnosing & Treating | 0 (0.0%) | 0 (0.0%) |
| Health Technologists | 0 (0.0%) | 0 (0.0%) |
| Total (Category) | 0 (0.0%) | 0 (0.0%) |
| Total (Overall) | 11 (100.0%) | 0 (0.0%) |
Services Occupations
Services Occupations by Sex
| Occupation | Male | Female |
| Healthcare Support | 0 (0.0%) | 0 (0.0%) |
| Security & Protection | 0 (0.0%) | 0 (0.0%) |
| Firefighting & Prevention | 0 (0.0%) | 0 (0.0%) |
| Law Enforcement | 0 (0.0%) | 0 (0.0%) |
| Food Preparation & Serving | 0 (0.0%) | 0 (0.0%) |
| Cleaning & Maintenance | 0 (0.0%) | 0 (0.0%) |
| Personal Care & Service | 0 (0.0%) | 0 (0.0%) |
| Total (Category) | 0 (0.0%) | 0 (0.0%) |
| Total (Overall) | 11 (100.0%) | 0 (0.0%) |
Sales and Office Occupations
Sales and Office Occupations by Sex
| Occupation | Male | Female |
| Sales & Related | 0 (0.0%) | 0 (0.0%) |
| Office & Administration | 0 (0.0%) | 0 (0.0%) |
| Total (Category) | 0 (0.0%) | 0 (0.0%) |
| Total (Overall) | 11 (100.0%) | 0 (0.0%) |
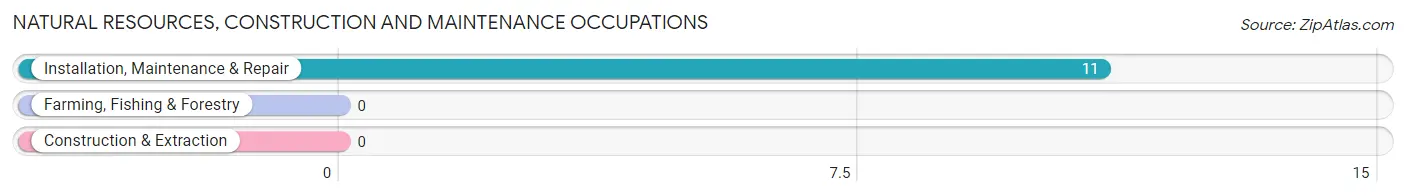
Natural Resources, Construction and Maintenance Occupations
The most common Natural Resources, Construction and Maintenance occupations in Drowning Creek are , and Installation, Maintenance & Repair (11 | 100.0%).
Natural Resources, Construction and Maintenance Occupations by Sex
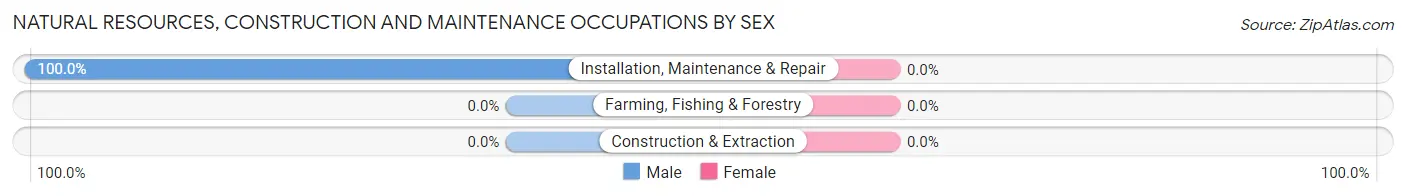
| Occupation | Male | Female |
| Farming, Fishing & Forestry | 0 (0.0%) | 0 (0.0%) |
| Construction & Extraction | 0 (0.0%) | 0 (0.0%) |
| Installation, Maintenance & Repair | 11 (100.0%) | 0 (0.0%) |
| Total (Category) | 11 (100.0%) | 0 (0.0%) |
| Total (Overall) | 11 (100.0%) | 0 (0.0%) |
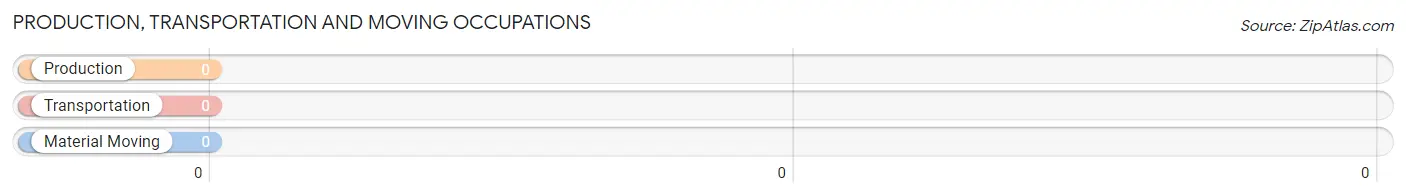
Production, Transportation and Moving Occupations
Production, Transportation and Moving Occupations by Sex
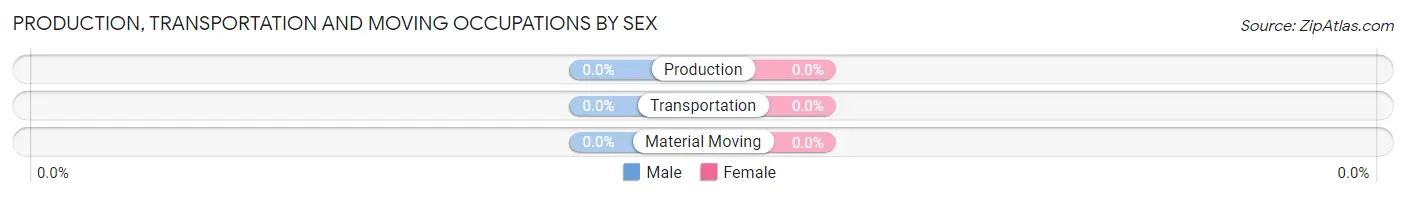
| Occupation | Male | Female |
| Production | 0 (0.0%) | 0 (0.0%) |
| Transportation | 0 (0.0%) | 0 (0.0%) |
| Material Moving | 0 (0.0%) | 0 (0.0%) |
| Total (Category) | 0 (0.0%) | 0 (0.0%) |
| Total (Overall) | 11 (100.0%) | 0 (0.0%) |
Employment Industries by Sex in Drowning Creek
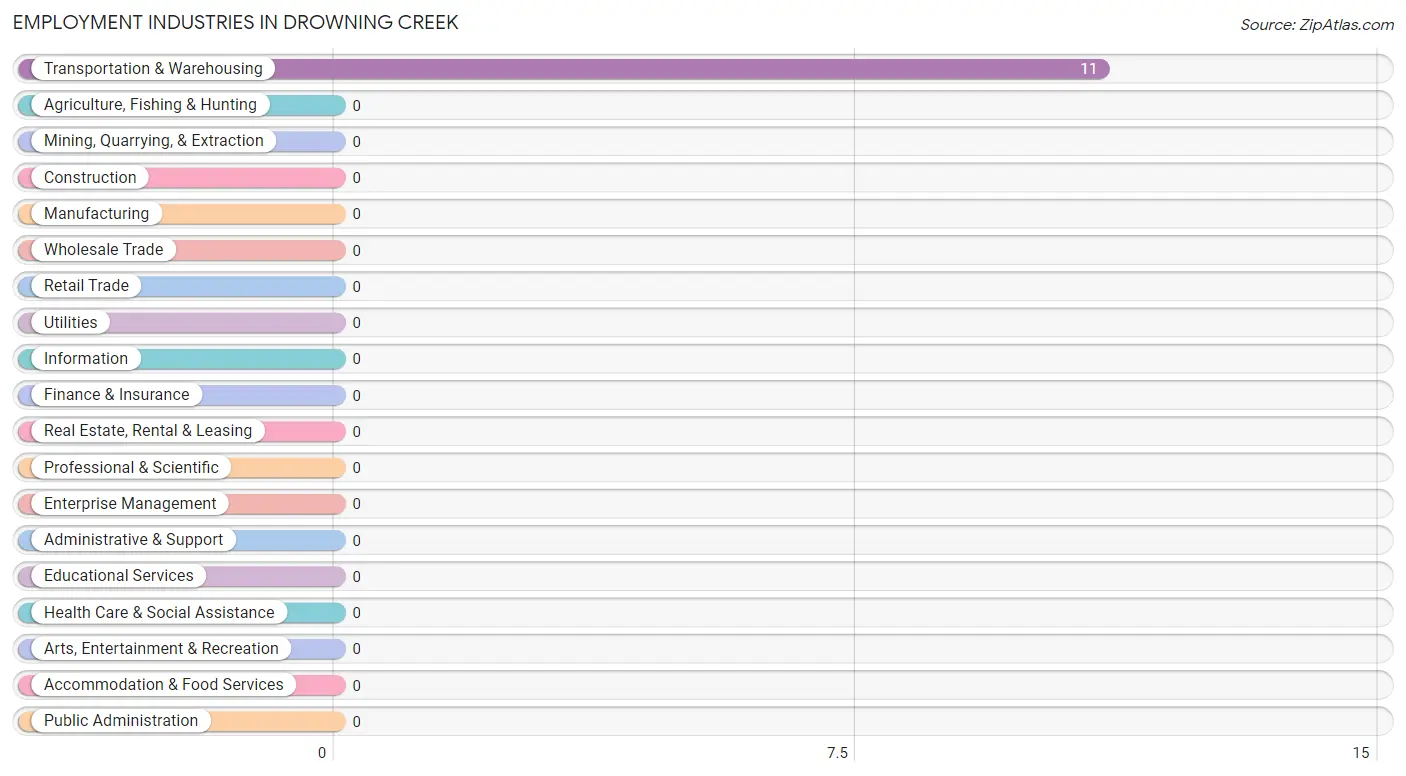
Employment Industries in Drowning Creek
The major employment industries in Drowning Creek include , and Transportation & Warehousing (11 | 100.0%).
Employment Industries by Sex in Drowning Creek
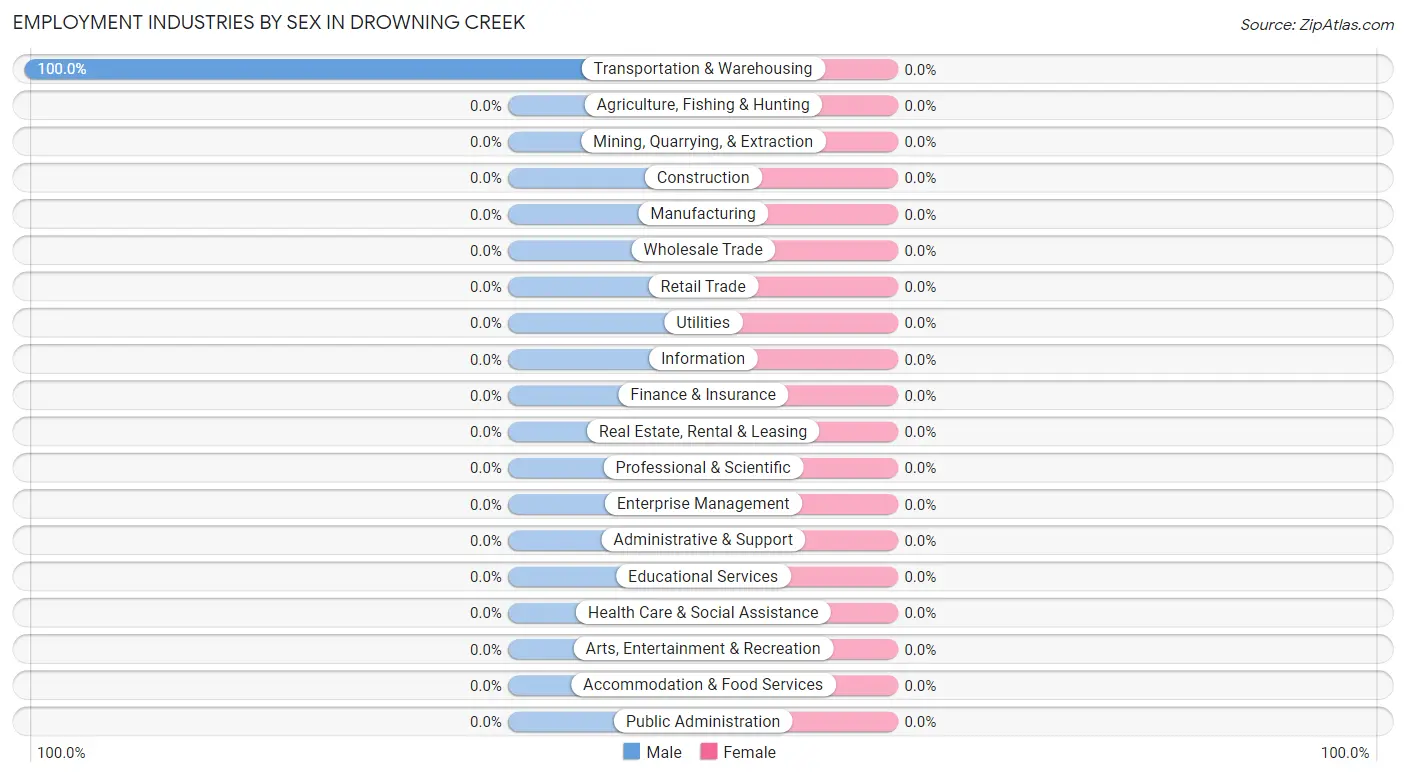
| Industry | Male | Female |
| Agriculture, Fishing & Hunting | 0 (0.0%) | 0 (0.0%) |
| Mining, Quarrying, & Extraction | 0 (0.0%) | 0 (0.0%) |
| Construction | 0 (0.0%) | 0 (0.0%) |
| Manufacturing | 0 (0.0%) | 0 (0.0%) |
| Wholesale Trade | 0 (0.0%) | 0 (0.0%) |
| Retail Trade | 0 (0.0%) | 0 (0.0%) |
| Transportation & Warehousing | 11 (100.0%) | 0 (0.0%) |
| Utilities | 0 (0.0%) | 0 (0.0%) |
| Information | 0 (0.0%) | 0 (0.0%) |
| Finance & Insurance | 0 (0.0%) | 0 (0.0%) |
| Real Estate, Rental & Leasing | 0 (0.0%) | 0 (0.0%) |
| Professional & Scientific | 0 (0.0%) | 0 (0.0%) |
| Enterprise Management | 0 (0.0%) | 0 (0.0%) |
| Administrative & Support | 0 (0.0%) | 0 (0.0%) |
| Educational Services | 0 (0.0%) | 0 (0.0%) |
| Health Care & Social Assistance | 0 (0.0%) | 0 (0.0%) |
| Arts, Entertainment & Recreation | 0 (0.0%) | 0 (0.0%) |
| Accommodation & Food Services | 0 (0.0%) | 0 (0.0%) |
| Public Administration | 0 (0.0%) | 0 (0.0%) |
| Total | 11 (100.0%) | 0 (0.0%) |
Education in Drowning Creek
School Enrollment in Drowning Creek
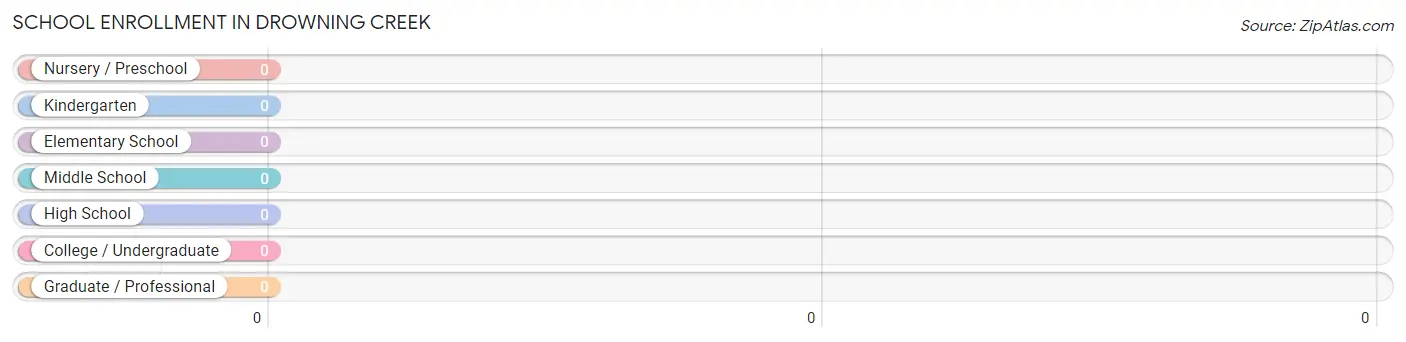
| School Level | # Students | % Students |
| Nursery / Preschool | 0 | 0.0% |
| Kindergarten | 0 | 0.0% |
| Elementary School | 0 | 0.0% |
| Middle School | 0 | 0.0% |
| High School | 0 | 0.0% |
| College / Undergraduate | 0 | 0.0% |
| Graduate / Professional | 0 | 0.0% |
| Total | 0 | 0.0% |
School Enrollment by Age by Funding Source in Drowning Creek
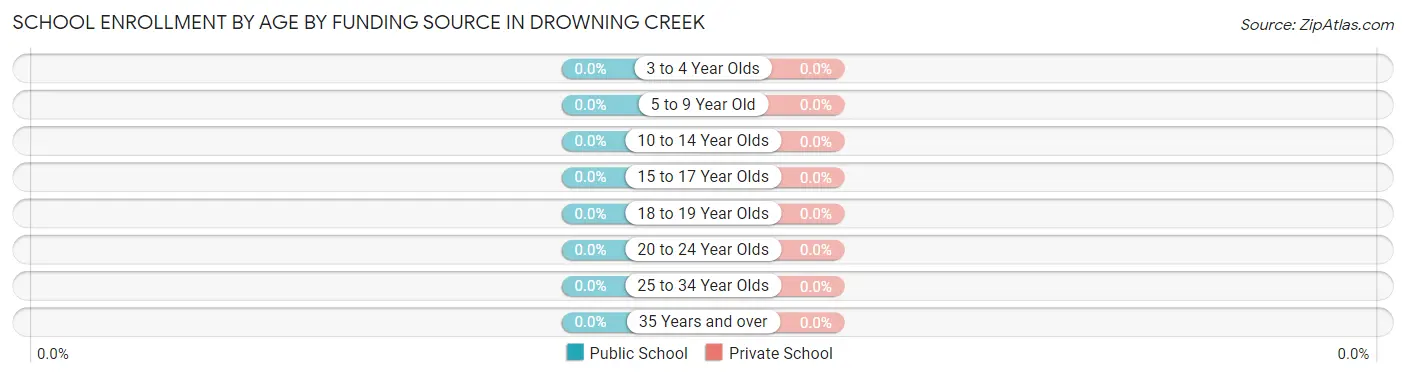
| Age Bracket | Public School | Private School |
| 3 to 4 Year Olds | 0 (0.0%) | 0 (0.0%) |
| 5 to 9 Year Old | 0 (0.0%) | 0 (0.0%) |
| 10 to 14 Year Olds | 0 (0.0%) | 0 (0.0%) |
| 15 to 17 Year Olds | 0 (0.0%) | 0 (0.0%) |
| 18 to 19 Year Olds | 0 (0.0%) | 0 (0.0%) |
| 20 to 24 Year Olds | 0 (0.0%) | 0 (0.0%) |
| 25 to 34 Year Olds | 0 (0.0%) | 0 (0.0%) |
| 35 Years and over | 0 (0.0%) | 0 (0.0%) |
| Total | 0 (0.0%) | 0 (0.0%) |
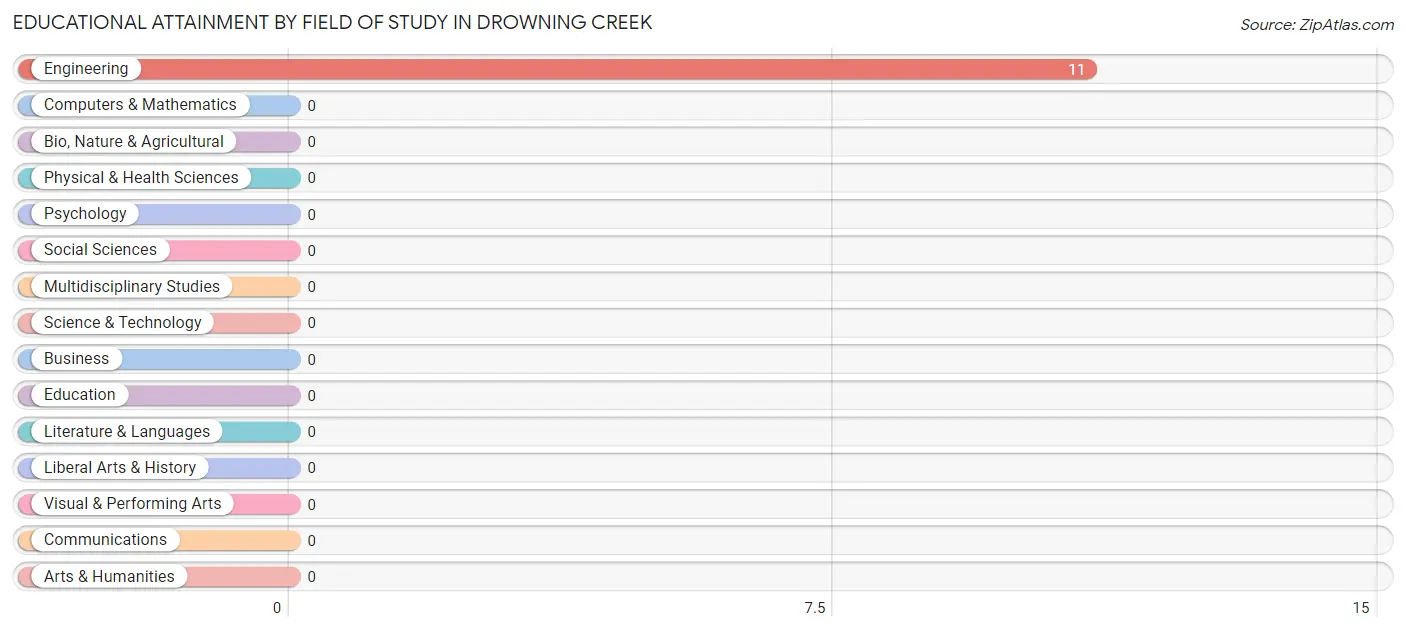
Educational Attainment by Field of Study in Drowning Creek
, and engineering (11 | 100.0%) are the most common fields of study among 11 individuals in Drowning Creek who have obtained a bachelor's degree or higher.
| Field of Study | # Graduates | % Graduates |
| Computers & Mathematics | 0 | 0.0% |
| Bio, Nature & Agricultural | 0 | 0.0% |
| Physical & Health Sciences | 0 | 0.0% |
| Psychology | 0 | 0.0% |
| Social Sciences | 0 | 0.0% |
| Engineering | 11 | 100.0% |
| Multidisciplinary Studies | 0 | 0.0% |
| Science & Technology | 0 | 0.0% |
| Business | 0 | 0.0% |
| Education | 0 | 0.0% |
| Literature & Languages | 0 | 0.0% |
| Liberal Arts & History | 0 | 0.0% |
| Visual & Performing Arts | 0 | 0.0% |
| Communications | 0 | 0.0% |
| Arts & Humanities | 0 | 0.0% |
| Total | 11 | 100.0% |
Transportation & Commute in Drowning Creek
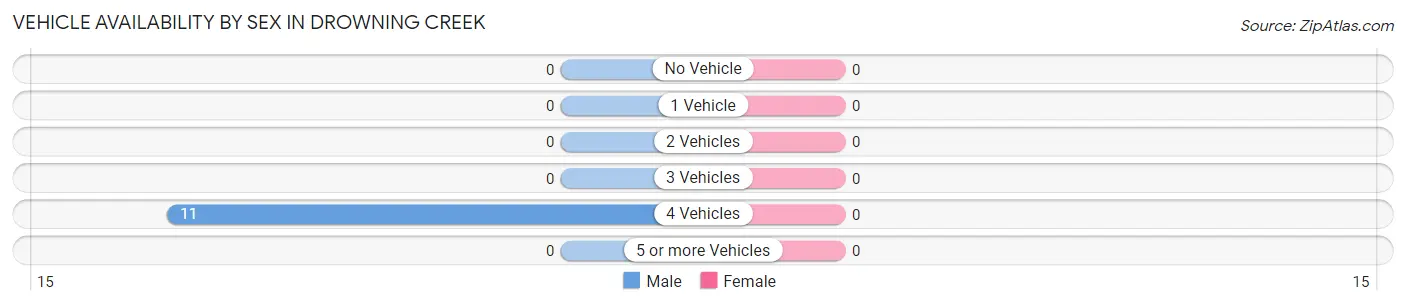
Vehicle Availability by Sex in Drowning Creek
| Vehicles Available | Male | Female |
| No Vehicle | 0 (0.0%) | 0 (0.0%) |
| 1 Vehicle | 0 (0.0%) | 0 (0.0%) |
| 2 Vehicles | 0 (0.0%) | 0 (0.0%) |
| 3 Vehicles | 0 (0.0%) | 0 (0.0%) |
| 4 Vehicles | 11 (100.0%) | 0 (0.0%) |
| 5 or more Vehicles | 0 (0.0%) | 0 (0.0%) |
| Total | 11 (100.0%) | 0 (0.0%) |
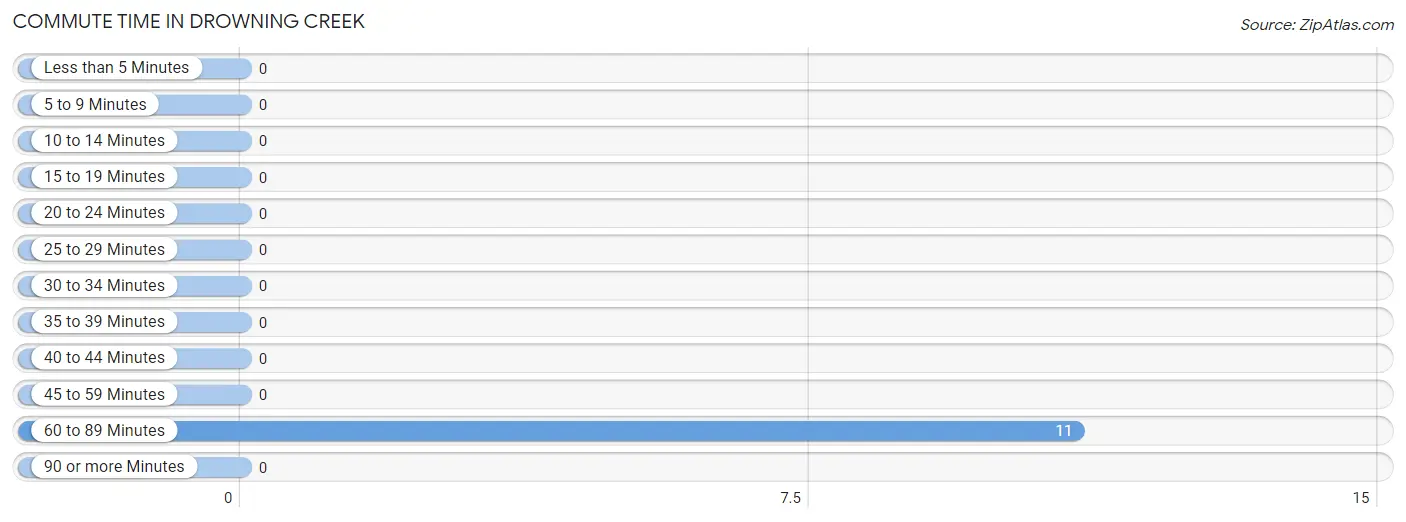
Commute Time in Drowning Creek
The most frequently occuring commute durations in Drowning Creek are 60 to 89 minutes (11 commuters, 100.0%), less than 5 minutes (0 commuters, 0.0%), and 5 to 9 minutes (0 commuters, 0.0%).
| Commute Time | # Commuters | % Commuters |
| Less than 5 Minutes | 0 | 0.0% |
| 5 to 9 Minutes | 0 | 0.0% |
| 10 to 14 Minutes | 0 | 0.0% |
| 15 to 19 Minutes | 0 | 0.0% |
| 20 to 24 Minutes | 0 | 0.0% |
| 25 to 29 Minutes | 0 | 0.0% |
| 30 to 34 Minutes | 0 | 0.0% |
| 35 to 39 Minutes | 0 | 0.0% |
| 40 to 44 Minutes | 0 | 0.0% |
| 45 to 59 Minutes | 0 | 0.0% |
| 60 to 89 Minutes | 11 | 100.0% |
| 90 or more Minutes | 0 | 0.0% |
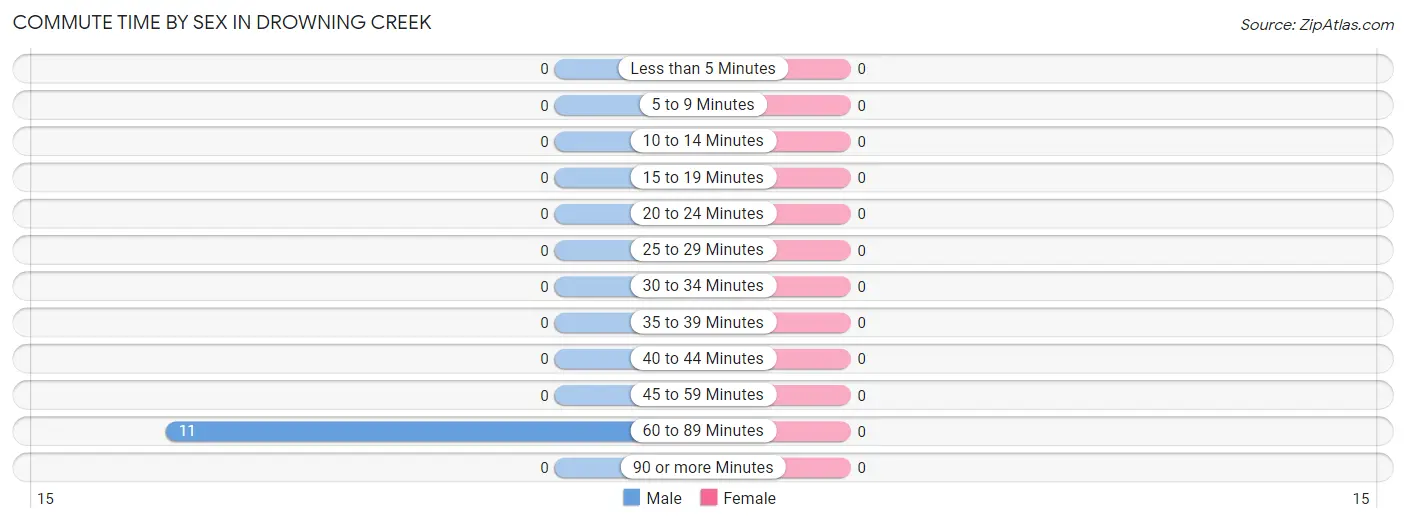
Commute Time by Sex in Drowning Creek
| Commute Time | Male | Female |
| Less than 5 Minutes | 0 (0.0%) | 0 (0.0%) |
| 5 to 9 Minutes | 0 (0.0%) | 0 (0.0%) |
| 10 to 14 Minutes | 0 (0.0%) | 0 (0.0%) |
| 15 to 19 Minutes | 0 (0.0%) | 0 (0.0%) |
| 20 to 24 Minutes | 0 (0.0%) | 0 (0.0%) |
| 25 to 29 Minutes | 0 (0.0%) | 0 (0.0%) |
| 30 to 34 Minutes | 0 (0.0%) | 0 (0.0%) |
| 35 to 39 Minutes | 0 (0.0%) | 0 (0.0%) |
| 40 to 44 Minutes | 0 (0.0%) | 0 (0.0%) |
| 45 to 59 Minutes | 0 (0.0%) | 0 (0.0%) |
| 60 to 89 Minutes | 11 (100.0%) | 0 (0.0%) |
| 90 or more Minutes | 0 (0.0%) | 0 (0.0%) |
Time of Departure to Work by Sex in Drowning Creek
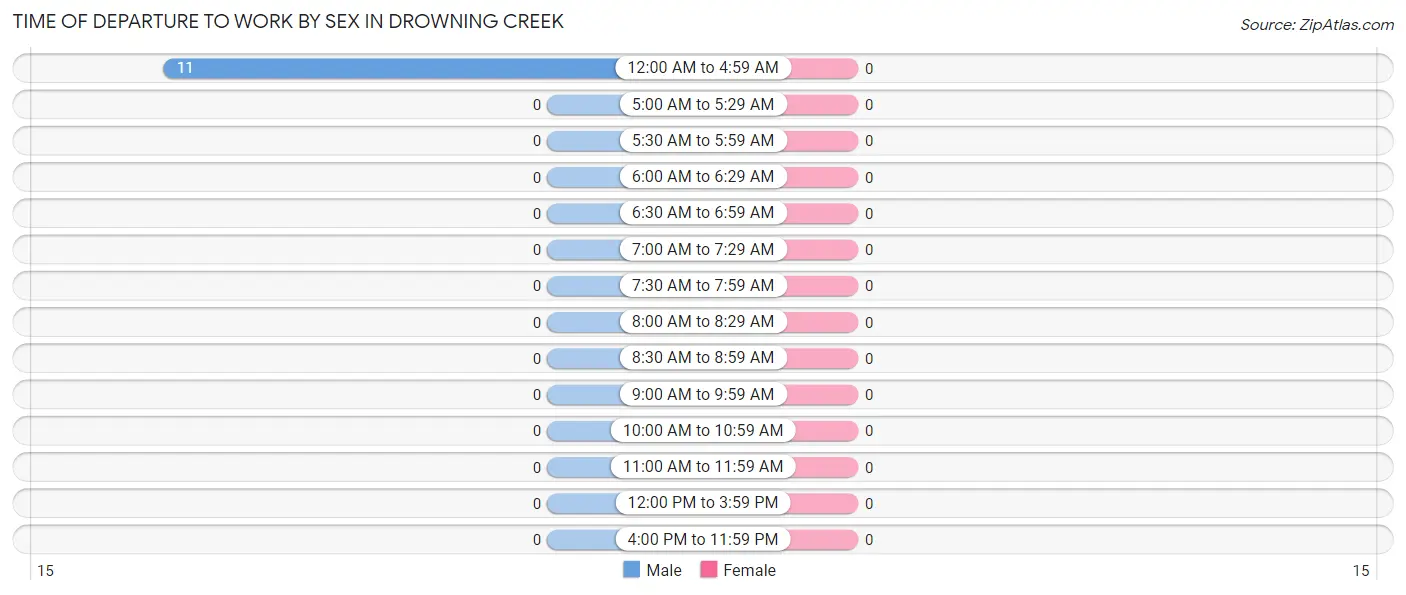
| Time of Departure | Male | Female |
| 12:00 AM to 4:59 AM | 11 (100.0%) | 0 (0.0%) |
| 5:00 AM to 5:29 AM | 0 (0.0%) | 0 (0.0%) |
| 5:30 AM to 5:59 AM | 0 (0.0%) | 0 (0.0%) |
| 6:00 AM to 6:29 AM | 0 (0.0%) | 0 (0.0%) |
| 6:30 AM to 6:59 AM | 0 (0.0%) | 0 (0.0%) |
| 7:00 AM to 7:29 AM | 0 (0.0%) | 0 (0.0%) |
| 7:30 AM to 7:59 AM | 0 (0.0%) | 0 (0.0%) |
| 8:00 AM to 8:29 AM | 0 (0.0%) | 0 (0.0%) |
| 8:30 AM to 8:59 AM | 0 (0.0%) | 0 (0.0%) |
| 9:00 AM to 9:59 AM | 0 (0.0%) | 0 (0.0%) |
| 10:00 AM to 10:59 AM | 0 (0.0%) | 0 (0.0%) |
| 11:00 AM to 11:59 AM | 0 (0.0%) | 0 (0.0%) |
| 12:00 PM to 3:59 PM | 0 (0.0%) | 0 (0.0%) |
| 4:00 PM to 11:59 PM | 0 (0.0%) | 0 (0.0%) |
| Total | 11 (100.0%) | 0 (0.0%) |
Housing Occupancy in Drowning Creek
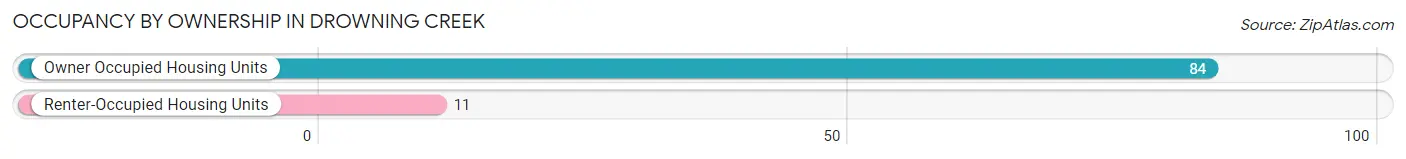
Occupancy by Ownership in Drowning Creek
Of the total 95 dwellings in Drowning Creek, owner-occupied units account for 84 (88.4%), while renter-occupied units make up 11 (11.6%).
| Occupancy | # Housing Units | % Housing Units |
| Owner Occupied Housing Units | 84 | 88.4% |
| Renter-Occupied Housing Units | 11 | 11.6% |
| Total Occupied Housing Units | 95 | 100.0% |
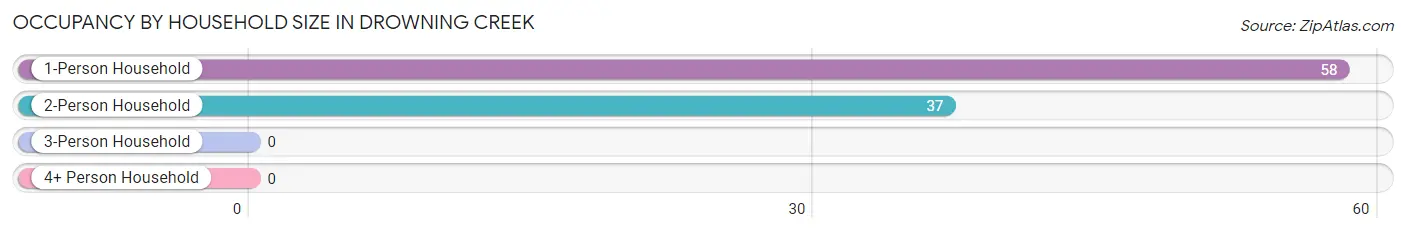
Occupancy by Household Size in Drowning Creek
| Household Size | # Housing Units | % Housing Units |
| 1-Person Household | 58 | 61.1% |
| 2-Person Household | 37 | 39.0% |
| 3-Person Household | 0 | 0.0% |
| 4+ Person Household | 0 | 0.0% |
| Total Housing Units | 95 | 100.0% |
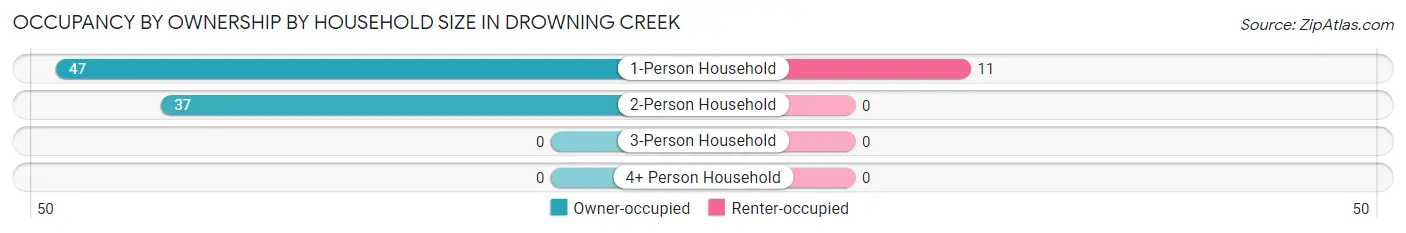
Occupancy by Ownership by Household Size in Drowning Creek
| Household Size | Owner-occupied | Renter-occupied |
| 1-Person Household | 47 (81.0%) | 11 (19.0%) |
| 2-Person Household | 37 (100.0%) | 0 (0.0%) |
| 3-Person Household | 0 (0.0%) | 0 (0.0%) |
| 4+ Person Household | 0 (0.0%) | 0 (0.0%) |
| Total Housing Units | 84 (88.4%) | 11 (11.6%) |
Occupancy by Educational Attainment in Drowning Creek
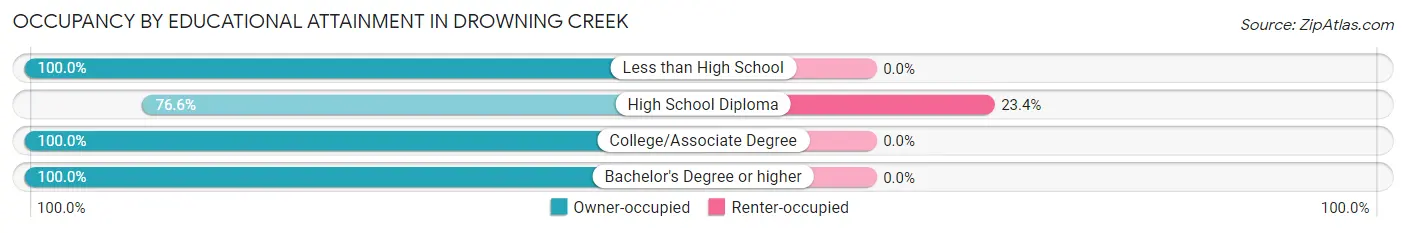
| Household Size | Owner-occupied | Renter-occupied |
| Less than High School | 29 (100.0%) | 0 (0.0%) |
| High School Diploma | 36 (76.6%) | 11 (23.4%) |
| College/Associate Degree | 8 (100.0%) | 0 (0.0%) |
| Bachelor's Degree or higher | 11 (100.0%) | 0 (0.0%) |
Occupancy by Age of Householder in Drowning Creek
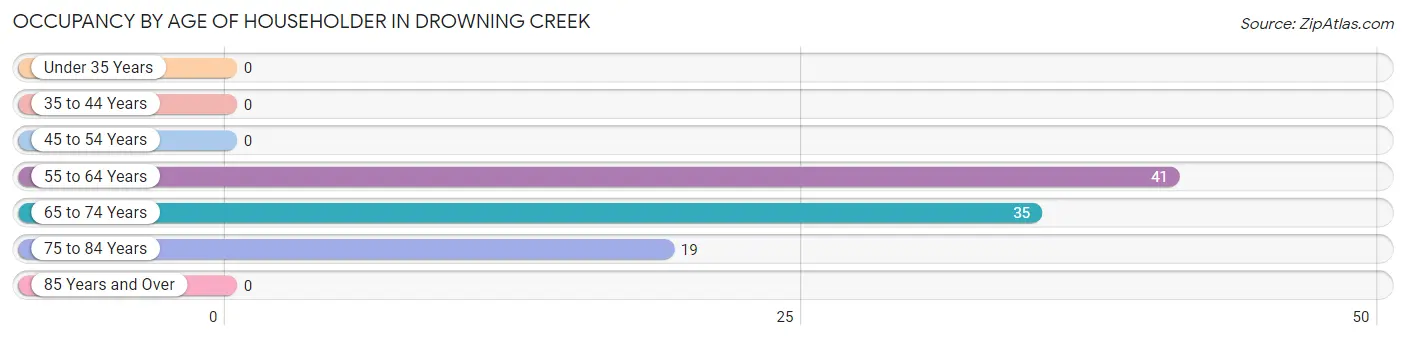
| Age Bracket | # Households | % Households |
| Under 35 Years | 0 | 0.0% |
| 35 to 44 Years | 0 | 0.0% |
| 45 to 54 Years | 0 | 0.0% |
| 55 to 64 Years | 41 | 43.2% |
| 65 to 74 Years | 35 | 36.8% |
| 75 to 84 Years | 19 | 20.0% |
| 85 Years and Over | 0 | 0.0% |
| Total | 95 | 100.0% |
Housing Finances in Drowning Creek
Median Income by Occupancy in Drowning Creek
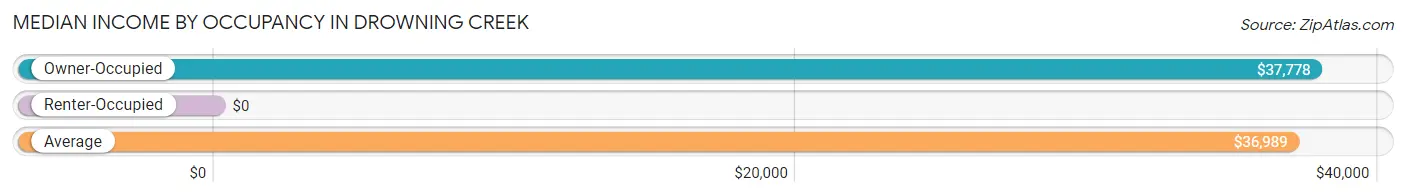
| Occupancy Type | # Households | Median Income |
| Owner-Occupied | 84 (88.4%) | $37,778 |
| Renter-Occupied | 11 (11.6%) | $0 |
| Average | 95 (100.0%) | $36,989 |
Occupancy by Householder Income Bracket in Drowning Creek
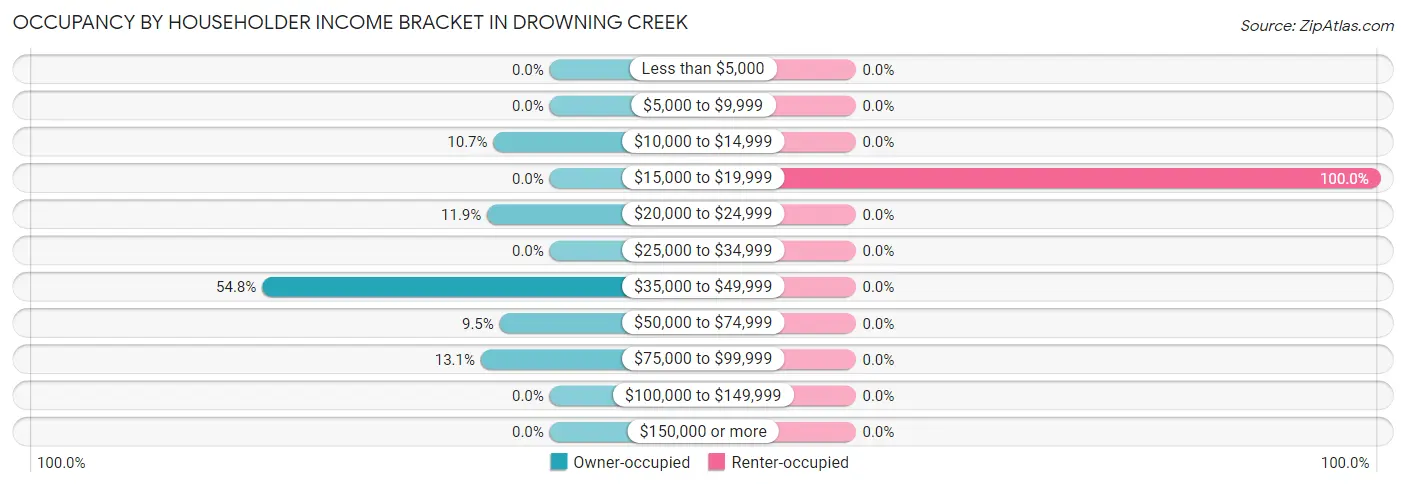
| Income Bracket | Owner-occupied | Renter-occupied |
| Less than $5,000 | 0 (0.0%) | 0 (0.0%) |
| $5,000 to $9,999 | 0 (0.0%) | 0 (0.0%) |
| $10,000 to $14,999 | 9 (10.7%) | 0 (0.0%) |
| $15,000 to $19,999 | 0 (0.0%) | 11 (100.0%) |
| $20,000 to $24,999 | 10 (11.9%) | 0 (0.0%) |
| $25,000 to $34,999 | 0 (0.0%) | 0 (0.0%) |
| $35,000 to $49,999 | 46 (54.8%) | 0 (0.0%) |
| $50,000 to $74,999 | 8 (9.5%) | 0 (0.0%) |
| $75,000 to $99,999 | 11 (13.1%) | 0 (0.0%) |
| $100,000 to $149,999 | 0 (0.0%) | 0 (0.0%) |
| $150,000 or more | 0 (0.0%) | 0 (0.0%) |
| Total | 84 (100.0%) | 11 (100.0%) |
Monthly Housing Cost Tiers in Drowning Creek
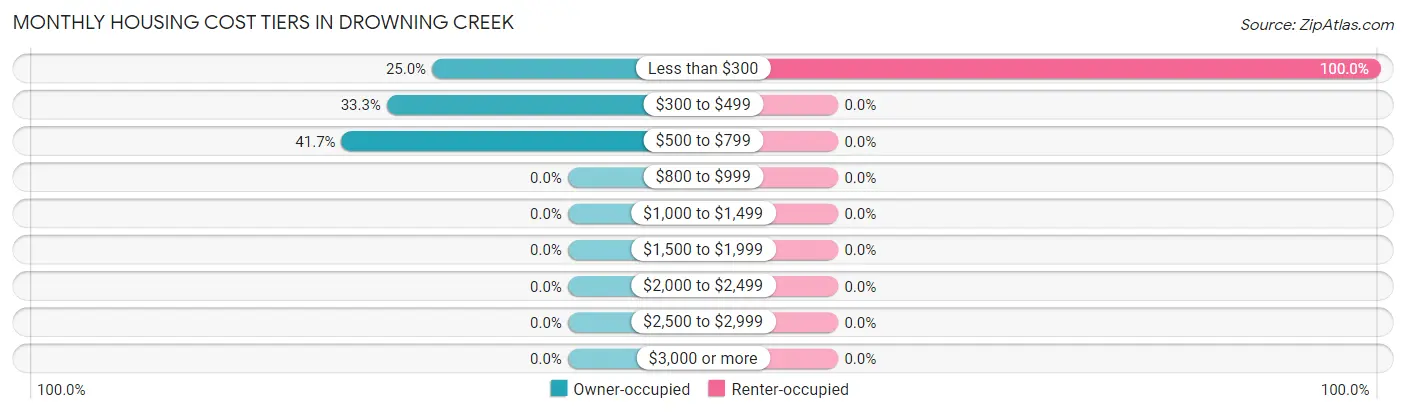
| Monthly Cost | Owner-occupied | Renter-occupied |
| Less than $300 | 21 (25.0%) | 11 (100.0%) |
| $300 to $499 | 28 (33.3%) | 0 (0.0%) |
| $500 to $799 | 35 (41.7%) | 0 (0.0%) |
| $800 to $999 | 0 (0.0%) | 0 (0.0%) |
| $1,000 to $1,499 | 0 (0.0%) | 0 (0.0%) |
| $1,500 to $1,999 | 0 (0.0%) | 0 (0.0%) |
| $2,000 to $2,499 | 0 (0.0%) | 0 (0.0%) |
| $2,500 to $2,999 | 0 (0.0%) | 0 (0.0%) |
| $3,000 or more | 0 (0.0%) | 0 (0.0%) |
| Total | 84 (100.0%) | 11 (100.0%) |
Physical Housing Characteristics in Drowning Creek
Housing Structures in Drowning Creek
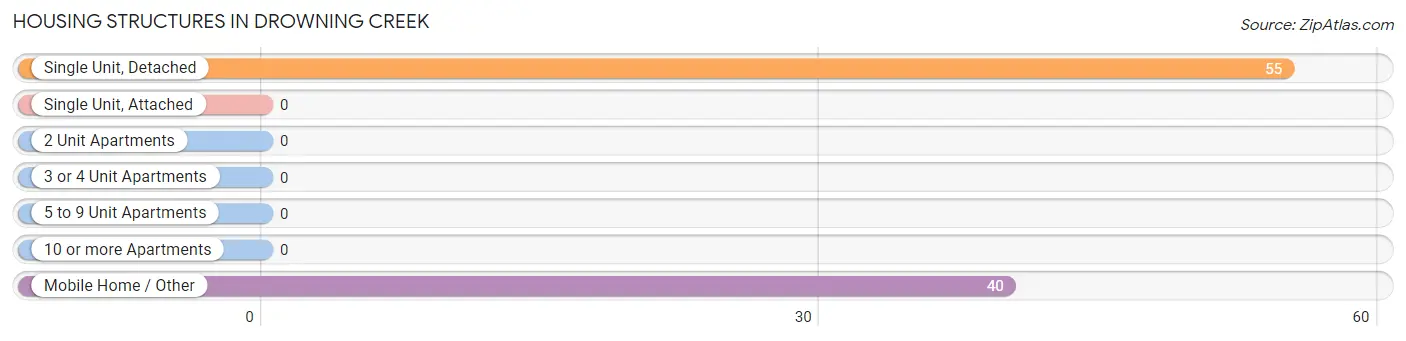
| Structure Type | # Housing Units | % Housing Units |
| Single Unit, Detached | 55 | 57.9% |
| Single Unit, Attached | 0 | 0.0% |
| 2 Unit Apartments | 0 | 0.0% |
| 3 or 4 Unit Apartments | 0 | 0.0% |
| 5 to 9 Unit Apartments | 0 | 0.0% |
| 10 or more Apartments | 0 | 0.0% |
| Mobile Home / Other | 40 | 42.1% |
| Total | 95 | 100.0% |
Housing Structures by Occupancy in Drowning Creek
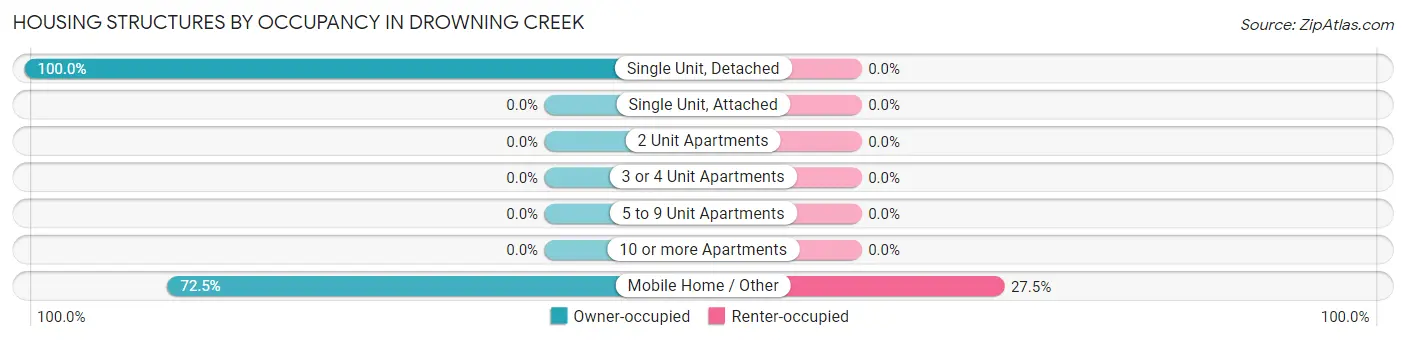
| Structure Type | Owner-occupied | Renter-occupied |
| Single Unit, Detached | 55 (100.0%) | 0 (0.0%) |
| Single Unit, Attached | 0 (0.0%) | 0 (0.0%) |
| 2 Unit Apartments | 0 (0.0%) | 0 (0.0%) |
| 3 or 4 Unit Apartments | 0 (0.0%) | 0 (0.0%) |
| 5 to 9 Unit Apartments | 0 (0.0%) | 0 (0.0%) |
| 10 or more Apartments | 0 (0.0%) | 0 (0.0%) |
| Mobile Home / Other | 29 (72.5%) | 11 (27.5%) |
| Total | 84 (88.4%) | 11 (11.6%) |
Housing Structures by Number of Rooms in Drowning Creek
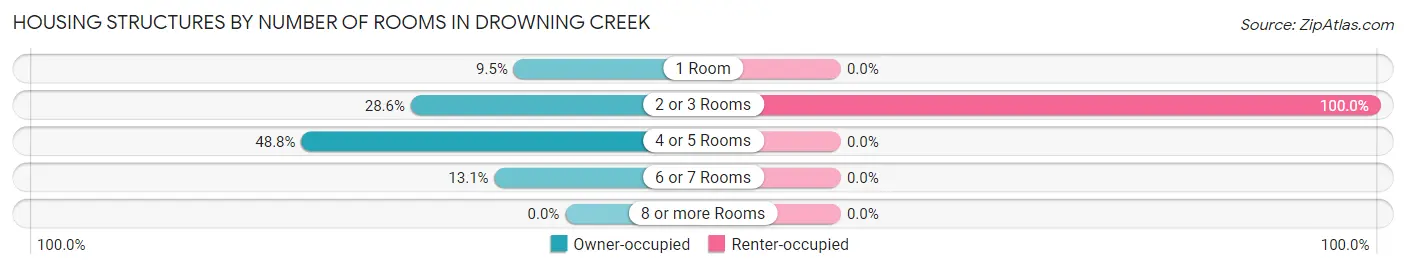
| Number of Rooms | Owner-occupied | Renter-occupied |
| 1 Room | 8 (9.5%) | 0 (0.0%) |
| 2 or 3 Rooms | 24 (28.6%) | 11 (100.0%) |
| 4 or 5 Rooms | 41 (48.8%) | 0 (0.0%) |
| 6 or 7 Rooms | 11 (13.1%) | 0 (0.0%) |
| 8 or more Rooms | 0 (0.0%) | 0 (0.0%) |
| Total | 84 (100.0%) | 11 (100.0%) |
Housing Structure by Heating Type in Drowning Creek
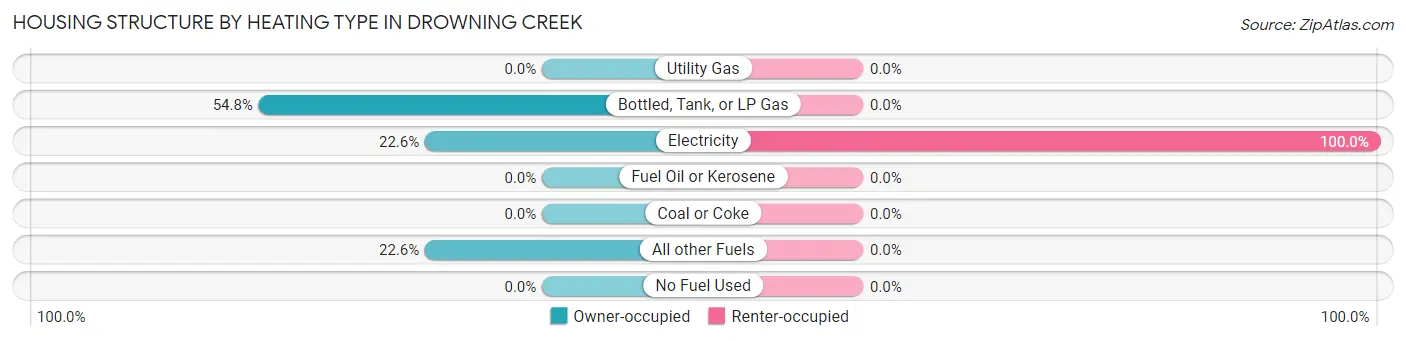
| Heating Type | Owner-occupied | Renter-occupied |
| Utility Gas | 0 (0.0%) | 0 (0.0%) |
| Bottled, Tank, or LP Gas | 46 (54.8%) | 0 (0.0%) |
| Electricity | 19 (22.6%) | 11 (100.0%) |
| Fuel Oil or Kerosene | 0 (0.0%) | 0 (0.0%) |
| Coal or Coke | 0 (0.0%) | 0 (0.0%) |
| All other Fuels | 19 (22.6%) | 0 (0.0%) |
| No Fuel Used | 0 (0.0%) | 0 (0.0%) |
| Total | 84 (100.0%) | 11 (100.0%) |
Household Vehicle Usage in Drowning Creek
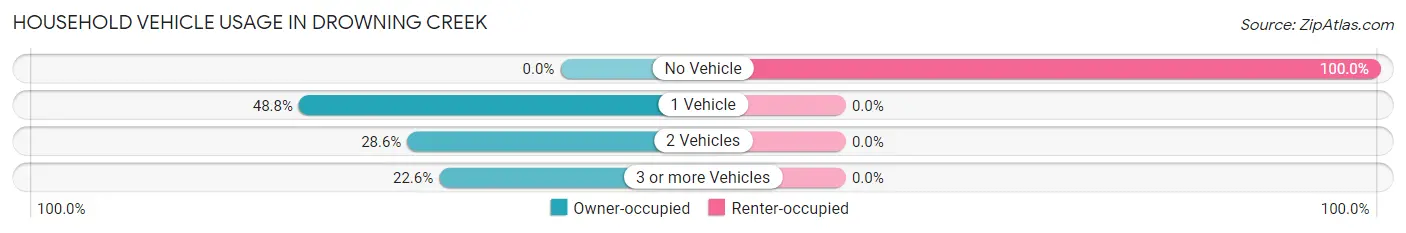
| Vehicles per Household | Owner-occupied | Renter-occupied |
| No Vehicle | 0 (0.0%) | 11 (100.0%) |
| 1 Vehicle | 41 (48.8%) | 0 (0.0%) |
| 2 Vehicles | 24 (28.6%) | 0 (0.0%) |
| 3 or more Vehicles | 19 (22.6%) | 0 (0.0%) |
| Total | 84 (100.0%) | 11 (100.0%) |
Real Estate & Mortgages in Drowning Creek
Real Estate and Mortgage Overview in Drowning Creek
| Characteristic | Without Mortgage | With Mortgage |
| Housing Units | 75 | 9 |
| Median Property Value | - | - |
| Median Household Income | $37,102 | $0 |
| Monthly Housing Costs | $397 | $0 |
| Real Estate Taxes | $199 | $0 |
Property Value by Mortgage Status in Drowning Creek
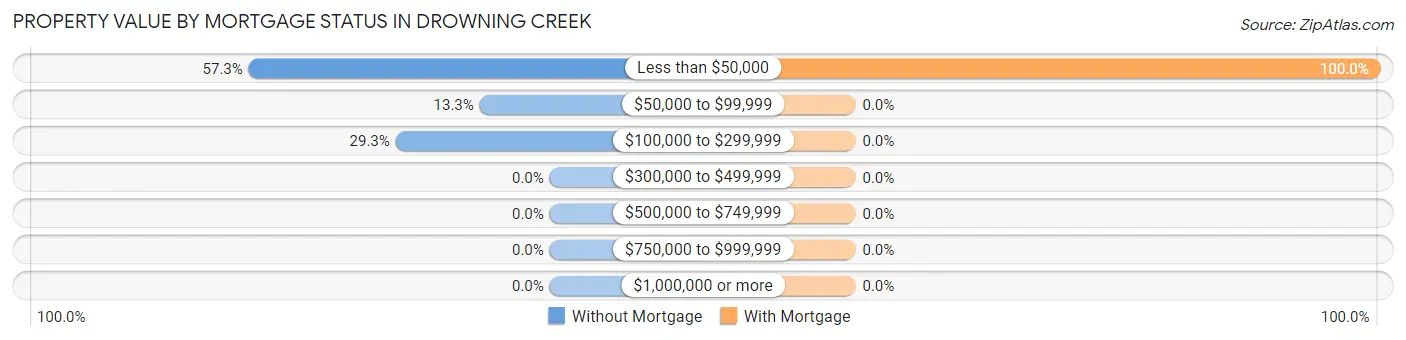
| Property Value | Without Mortgage | With Mortgage |
| Less than $50,000 | 43 (57.3%) | 9 (100.0%) |
| $50,000 to $99,999 | 10 (13.3%) | 0 (0.0%) |
| $100,000 to $299,999 | 22 (29.3%) | 0 (0.0%) |
| $300,000 to $499,999 | 0 (0.0%) | 0 (0.0%) |
| $500,000 to $749,999 | 0 (0.0%) | 0 (0.0%) |
| $750,000 to $999,999 | 0 (0.0%) | 0 (0.0%) |
| $1,000,000 or more | 0 (0.0%) | 0 (0.0%) |
| Total | 75 (100.0%) | 9 (100.0%) |
Household Income by Mortgage Status in Drowning Creek
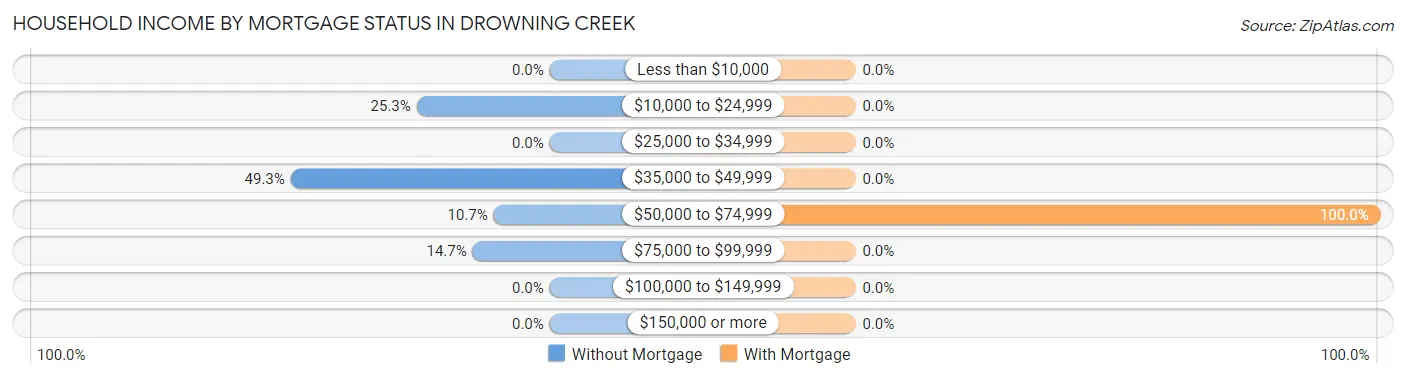
| Household Income | Without Mortgage | With Mortgage |
| Less than $10,000 | 0 (0.0%) | 0 (0.0%) |
| $10,000 to $24,999 | 19 (25.3%) | 0 (0.0%) |
| $25,000 to $34,999 | 0 (0.0%) | 0 (0.0%) |
| $35,000 to $49,999 | 37 (49.3%) | 0 (0.0%) |
| $50,000 to $74,999 | 8 (10.7%) | 9 (100.0%) |
| $75,000 to $99,999 | 11 (14.7%) | 0 (0.0%) |
| $100,000 to $149,999 | 0 (0.0%) | 0 (0.0%) |
| $150,000 or more | 0 (0.0%) | 0 (0.0%) |
| Total | 75 (100.0%) | 9 (100.0%) |
Property Value to Household Income Ratio in Drowning Creek
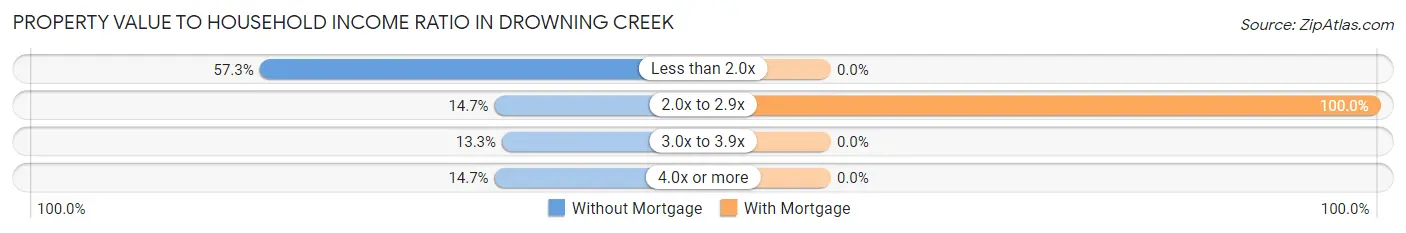
| Value-to-Income Ratio | Without Mortgage | With Mortgage |
| Less than 2.0x | 43 (57.3%) | 0 (0.0%) |
| 2.0x to 2.9x | 11 (14.7%) | 9 (100.0%) |
| 3.0x to 3.9x | 10 (13.3%) | 0 (0.0%) |
| 4.0x or more | 11 (14.7%) | 0 (0.0%) |
| Total | 75 (100.0%) | 9 (100.0%) |
Real Estate Taxes by Mortgage Status in Drowning Creek
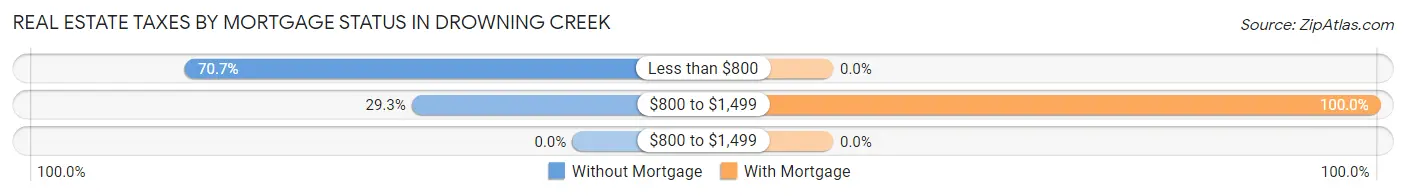
| Property Taxes | Without Mortgage | With Mortgage |
| Less than $800 | 53 (70.7%) | 0 (0.0%) |
| $800 to $1,499 | 22 (29.3%) | 9 (100.0%) |
| $800 to $1,499 | 0 (0.0%) | 0 (0.0%) |
| Total | 75 (100.0%) | 9 (100.0%) |
Health & Disability in Drowning Creek
Health Insurance Coverage by Age in Drowning Creek
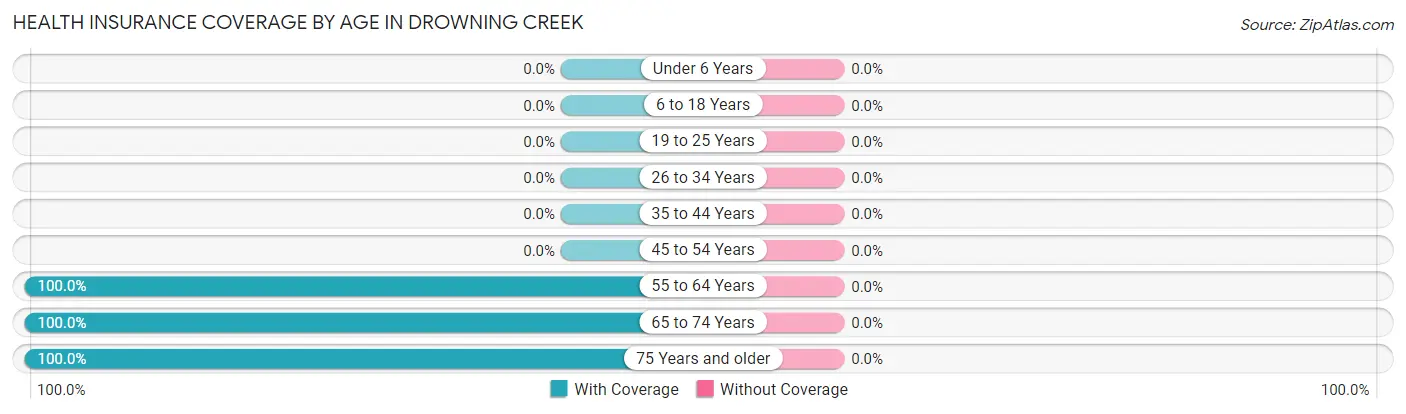
| Age Bracket | With Coverage | Without Coverage |
| Under 6 Years | 0 (0.0%) | 0 (0.0%) |
| 6 to 18 Years | 0 (0.0%) | 0 (0.0%) |
| 19 to 25 Years | 0 (0.0%) | 0 (0.0%) |
| 26 to 34 Years | 0 (0.0%) | 0 (0.0%) |
| 35 to 44 Years | 0 (0.0%) | 0 (0.0%) |
| 45 to 54 Years | 0 (0.0%) | 0 (0.0%) |
| 55 to 64 Years | 41 (100.0%) | 0 (0.0%) |
| 65 to 74 Years | 61 (100.0%) | 0 (0.0%) |
| 75 Years and older | 27 (100.0%) | 0 (0.0%) |
| Total | 129 (100.0%) | 0 (0.0%) |
Health Insurance Coverage by Citizenship Status in Drowning Creek
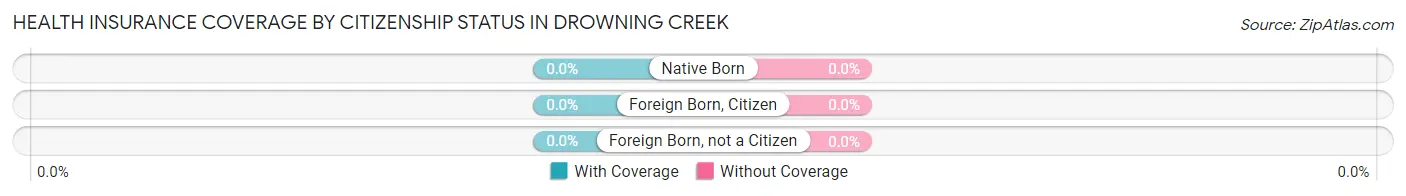
| Citizenship Status | With Coverage | Without Coverage |
| Native Born | 0 (0.0%) | 0 (0.0%) |
| Foreign Born, Citizen | 0 (0.0%) | 0 (0.0%) |
| Foreign Born, not a Citizen | 0 (0.0%) | 0 (0.0%) |
Health Insurance Coverage by Household Income in Drowning Creek
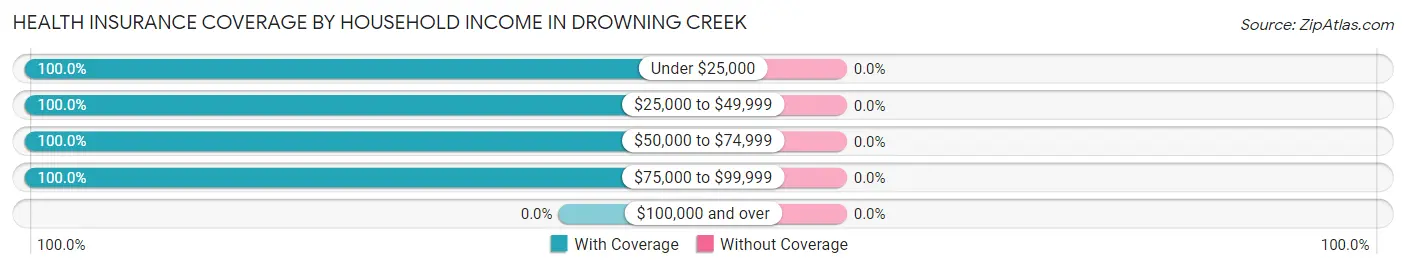
| Household Income | With Coverage | Without Coverage |
| Under $25,000 | 30 (100.0%) | 0 (0.0%) |
| $25,000 to $49,999 | 72 (100.0%) | 0 (0.0%) |
| $50,000 to $74,999 | 8 (100.0%) | 0 (0.0%) |
| $75,000 to $99,999 | 19 (100.0%) | 0 (0.0%) |
| $100,000 and over | 0 (0.0%) | 0 (0.0%) |
Public vs Private Health Insurance Coverage by Age in Drowning Creek
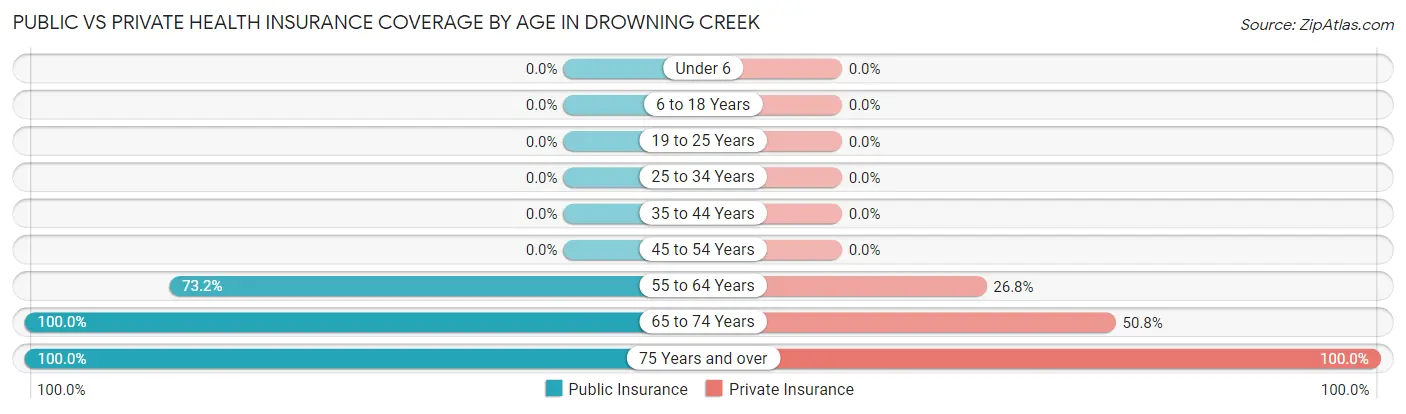
| Age Bracket | Public Insurance | Private Insurance |
| Under 6 | 0 (0.0%) | 0 (0.0%) |
| 6 to 18 Years | 0 (0.0%) | 0 (0.0%) |
| 19 to 25 Years | 0 (0.0%) | 0 (0.0%) |
| 25 to 34 Years | 0 (0.0%) | 0 (0.0%) |
| 35 to 44 Years | 0 (0.0%) | 0 (0.0%) |
| 45 to 54 Years | 0 (0.0%) | 0 (0.0%) |
| 55 to 64 Years | 30 (73.2%) | 11 (26.8%) |
| 65 to 74 Years | 61 (100.0%) | 31 (50.8%) |
| 75 Years and over | 27 (100.0%) | 27 (100.0%) |
| Total | 118 (91.5%) | 69 (53.5%) |
Disability Status by Sex by Age in Drowning Creek
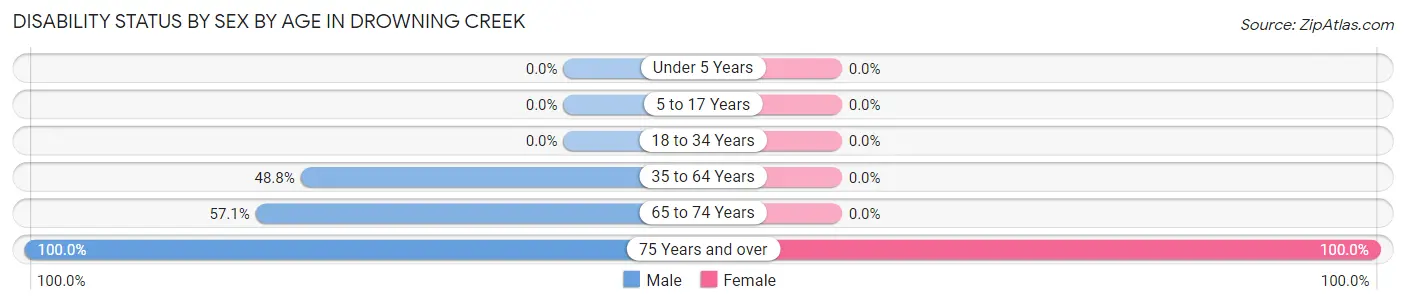
| Age Bracket | Male | Female |
| Under 5 Years | 0 (0.0%) | 0 (0.0%) |
| 5 to 17 Years | 0 (0.0%) | 0 (0.0%) |
| 18 to 34 Years | 0 (0.0%) | 0 (0.0%) |
| 35 to 64 Years | 20 (48.8%) | 0 (0.0%) |
| 65 to 74 Years | 20 (57.1%) | 0 (0.0%) |
| 75 Years and over | 11 (100.0%) | 16 (100.0%) |
Disability Class by Sex by Age in Drowning Creek
Disability Class: Hearing Difficulty
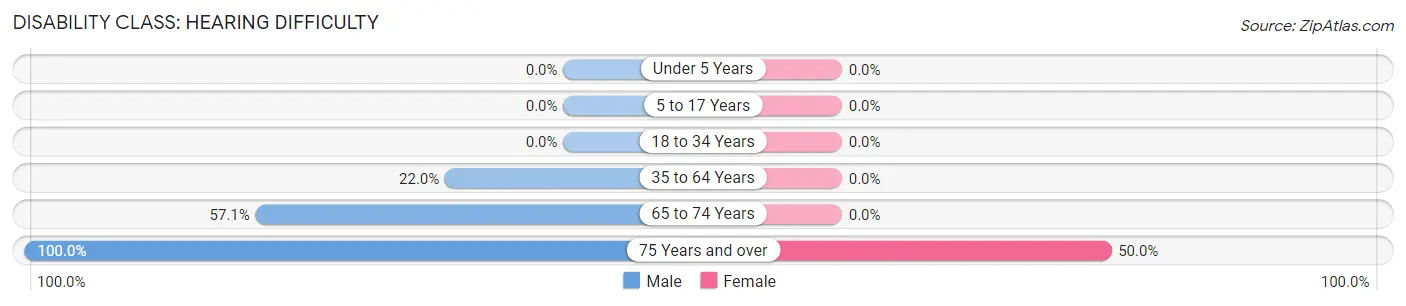
| Age Bracket | Male | Female |
| Under 5 Years | 0 (0.0%) | 0 (0.0%) |
| 5 to 17 Years | 0 (0.0%) | 0 (0.0%) |
| 18 to 34 Years | 0 (0.0%) | 0 (0.0%) |
| 35 to 64 Years | 9 (22.0%) | 0 (0.0%) |
| 65 to 74 Years | 20 (57.1%) | 0 (0.0%) |
| 75 Years and over | 11 (100.0%) | 8 (50.0%) |
Disability Class: Vision Difficulty
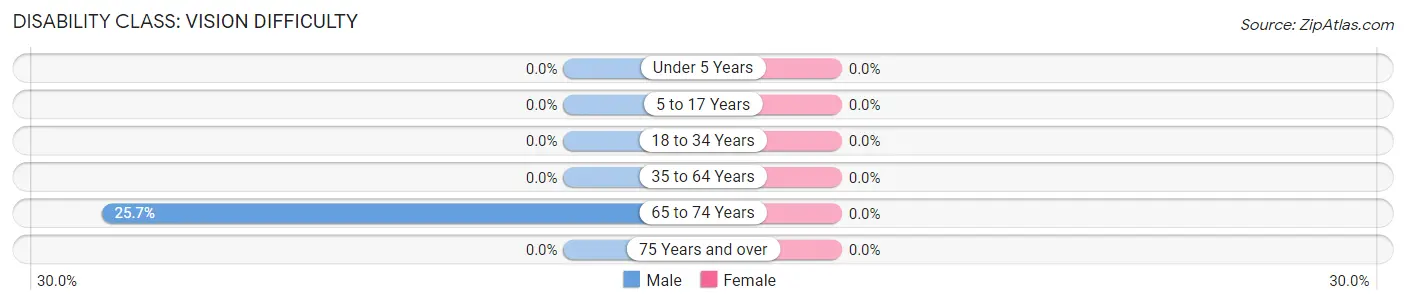
| Age Bracket | Male | Female |
| Under 5 Years | 0 (0.0%) | 0 (0.0%) |
| 5 to 17 Years | 0 (0.0%) | 0 (0.0%) |
| 18 to 34 Years | 0 (0.0%) | 0 (0.0%) |
| 35 to 64 Years | 0 (0.0%) | 0 (0.0%) |
| 65 to 74 Years | 9 (25.7%) | 0 (0.0%) |
| 75 Years and over | 0 (0.0%) | 0 (0.0%) |
Disability Class: Cognitive Difficulty
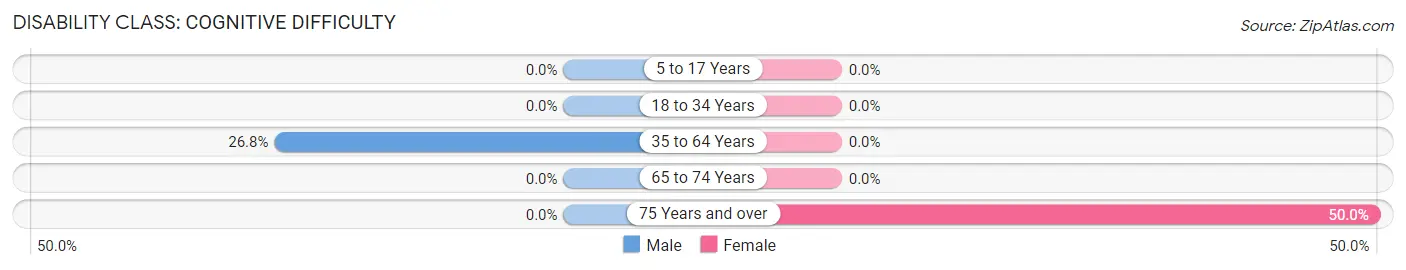
| Age Bracket | Male | Female |
| 5 to 17 Years | 0 (0.0%) | 0 (0.0%) |
| 18 to 34 Years | 0 (0.0%) | 0 (0.0%) |
| 35 to 64 Years | 11 (26.8%) | 0 (0.0%) |
| 65 to 74 Years | 0 (0.0%) | 0 (0.0%) |
| 75 Years and over | 0 (0.0%) | 8 (50.0%) |
Disability Class: Ambulatory Difficulty
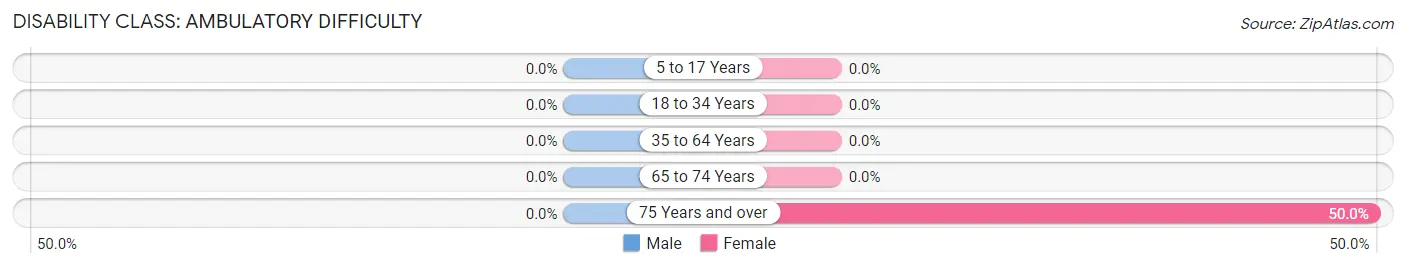
| Age Bracket | Male | Female |
| 5 to 17 Years | 0 (0.0%) | 0 (0.0%) |
| 18 to 34 Years | 0 (0.0%) | 0 (0.0%) |
| 35 to 64 Years | 0 (0.0%) | 0 (0.0%) |
| 65 to 74 Years | 0 (0.0%) | 0 (0.0%) |
| 75 Years and over | 0 (0.0%) | 8 (50.0%) |
Disability Class: Self-Care Difficulty
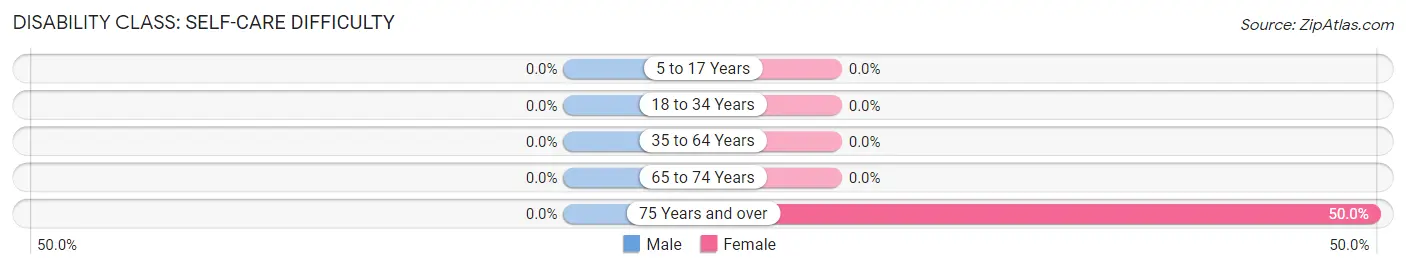
| Age Bracket | Male | Female |
| 5 to 17 Years | 0 (0.0%) | 0 (0.0%) |
| 18 to 34 Years | 0 (0.0%) | 0 (0.0%) |
| 35 to 64 Years | 0 (0.0%) | 0 (0.0%) |
| 65 to 74 Years | 0 (0.0%) | 0 (0.0%) |
| 75 Years and over | 0 (0.0%) | 8 (50.0%) |
Technology Access in Drowning Creek
Computing Device Access in Drowning Creek
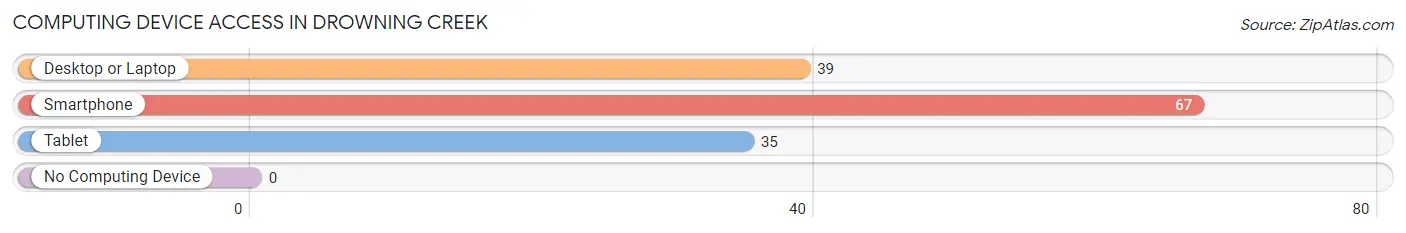
| Device Type | # Households | % Households |
| Desktop or Laptop | 39 | 41.0% |
| Smartphone | 67 | 70.5% |
| Tablet | 35 | 36.8% |
| No Computing Device | 0 | 0.0% |
| Total | 95 | 100.0% |
Internet Access in Drowning Creek
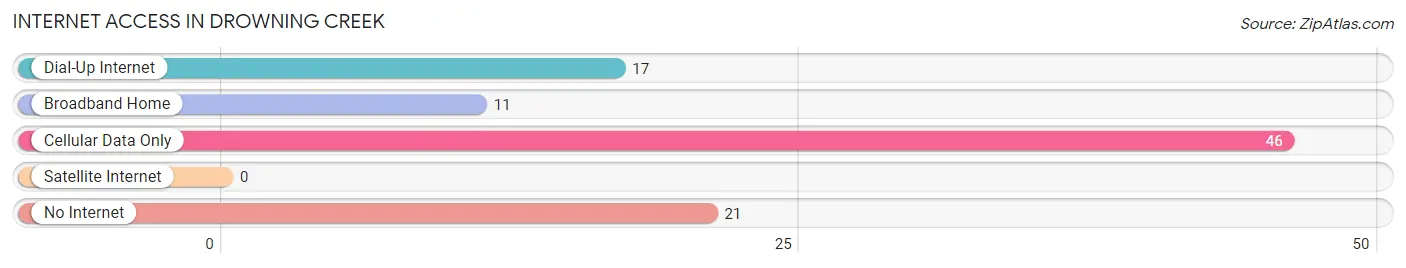
| Internet Type | # Households | % Households |
| Dial-Up Internet | 17 | 17.9% |
| Broadband Home | 11 | 11.6% |
| Cellular Data Only | 46 | 48.4% |
| Satellite Internet | 0 | 0.0% |
| No Internet | 21 | 22.1% |
| Total | 95 | 100.0% |
Drowning Creek Summary
Drowning Creek is a small unincorporated community located in the southeastern corner of Oklahoma, in the United States. It is situated in the foothills of the Ouachita Mountains, in the foothills of the Kiamichi Mountains. The town is located in Pushmataha County, and is approximately 10 miles south of the county seat, Antlers.
History
The area around Drowning Creek was first settled in the late 1800s by settlers from the Choctaw Nation. The town was originally known as “Drowning Creek Settlement”, and was named after the nearby creek. The creek was so named because of the frequent flooding that occurred in the area.
In the early 1900s, the town was home to a number of businesses, including a general store, a blacksmith shop, a cotton gin, and a sawmill. The town also had a post office, which was established in 1906.
In the 1920s, the town began to decline as the local economy shifted away from agriculture and towards oil and gas production. By the 1940s, the town had become a ghost town, with only a few residents remaining.
Geography
Drowning Creek is located in the southeastern corner of Oklahoma, in the foothills of the Ouachita Mountains. The town is situated in Pushmataha County, and is approximately 10 miles south of the county seat, Antlers.
The town is located at the intersection of State Highway 3 and County Road E-14. The nearest major city is Tulsa, which is located approximately 90 miles to the north.
The climate in Drowning Creek is humid subtropical, with hot summers and mild winters. The average annual temperature is around 65°F, and the average annual precipitation is around 40 inches.
Economy
The economy of Drowning Creek is largely based on agriculture and forestry. The town is home to a number of farms, which produce a variety of crops, including corn, soybeans, wheat, and hay. The town is also home to a number of timber companies, which harvest timber from the surrounding forests.
In addition to agriculture and forestry, the town is also home to a number of small businesses, including a general store, a gas station, and a restaurant.
Demographics
As of the 2010 census, the population of Drowning Creek was 545. The racial makeup of the town was 97.3% White, 0.7% Native American, 0.2% Asian, and 1.8% from other races.
The median household income in Drowning Creek was $30,000, and the median family income was $35,000. The per capita income was $14,000. Approximately 17.5% of the population was below the poverty line.
Common Questions
What is Per Capita Income in Drowning Creek?
Per Capita income in Drowning Creek is $28,295.
What is the Median Family Income in Drowning Creek?
Median Family Income in Drowning Creek is $41,250.
What is the Median Household income in Drowning Creek?
Median Household Income in Drowning Creek is $36,989.
What is Inequality or Gini Index in Drowning Creek?
Inequality or Gini Index in Drowning Creek is 0.31.
What is the Total Population of Drowning Creek?
Total Population of Drowning Creek is 129.
What is the Total Male Population of Drowning Creek?
Total Male Population of Drowning Creek is 87.
What is the Total Female Population of Drowning Creek?
Total Female Population of Drowning Creek is 42.
What is the Ratio of Males per 100 Females in Drowning Creek?
There are 207.14 Males per 100 Females in Drowning Creek.
What is the Ratio of Females per 100 Males in Drowning Creek?
There are 48.28 Females per 100 Males in Drowning Creek.
What is the Median Population Age in Drowning Creek?
Median Population Age in Drowning Creek is 70.1 Years.
What is the Average Family Size in Drowning Creek
Average Family Size in Drowning Creek is 1.9 People.
What is the Average Household Size in Drowning Creek
Average Household Size in Drowning Creek is 1.4 People.
How Large is the Labor Force in Drowning Creek?
There are 11 People in the Labor Forcein in Drowning Creek.
What is the Percentage of People in the Labor Force in Drowning Creek?
8.5% of People are in the Labor Force in Drowning Creek.