Freedom Acres, AZ Map & Demographics
Freedom Acres Map
Freedom Acres Overview
$37,980
PER CAPITA INCOME
$152,798
AVG FAMILY INCOME
0.25
INEQUALITY / GINI INDEX
133
TOTAL POPULATION
71
MALE POPULATION
62
FEMALE POPULATION
114.52
MALES / 100 FEMALES
87.32
FEMALES / 100 MALES
51.5
MEDIAN AGE
3.3
AVG FAMILY SIZE
2.8
AVG HOUSEHOLD SIZE
113
LABOR FORCE [ PEOPLE ]
89.7%
PERCENT IN LABOR FORCE
Income in Freedom Acres
Income Overview in Freedom Acres
| Characteristic | Number | Measure |
| Per Capita Income | 133 | $37,980 |
| Median Family Income | 37 | $152,798 |
| Mean Family Income | 37 | $108,162 |
| Median Household Income | 47 | $0 |
| Mean Household Income | 47 | $103,949 |
| Income Deficit | 37 | $0 |
| Wage / Income Gap (%) | 133 | 0.00% |
| Wage / Income Gap ($) | 133 | 100.00¢ per $1 |
| Gini / Inequality Index | 133 | 0.25 |
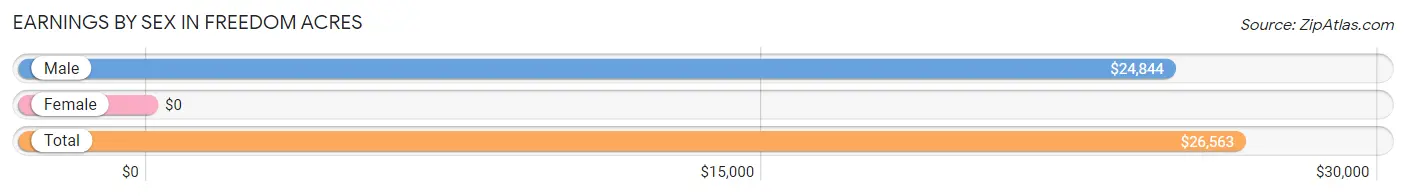
Earnings by Sex in Freedom Acres
| Sex | Number | Average Earnings |
| Male | 63 (55.7%) | $24,844 |
| Female | 50 (44.3%) | $0 |
| Total | 113 (100.0%) | $26,563 |
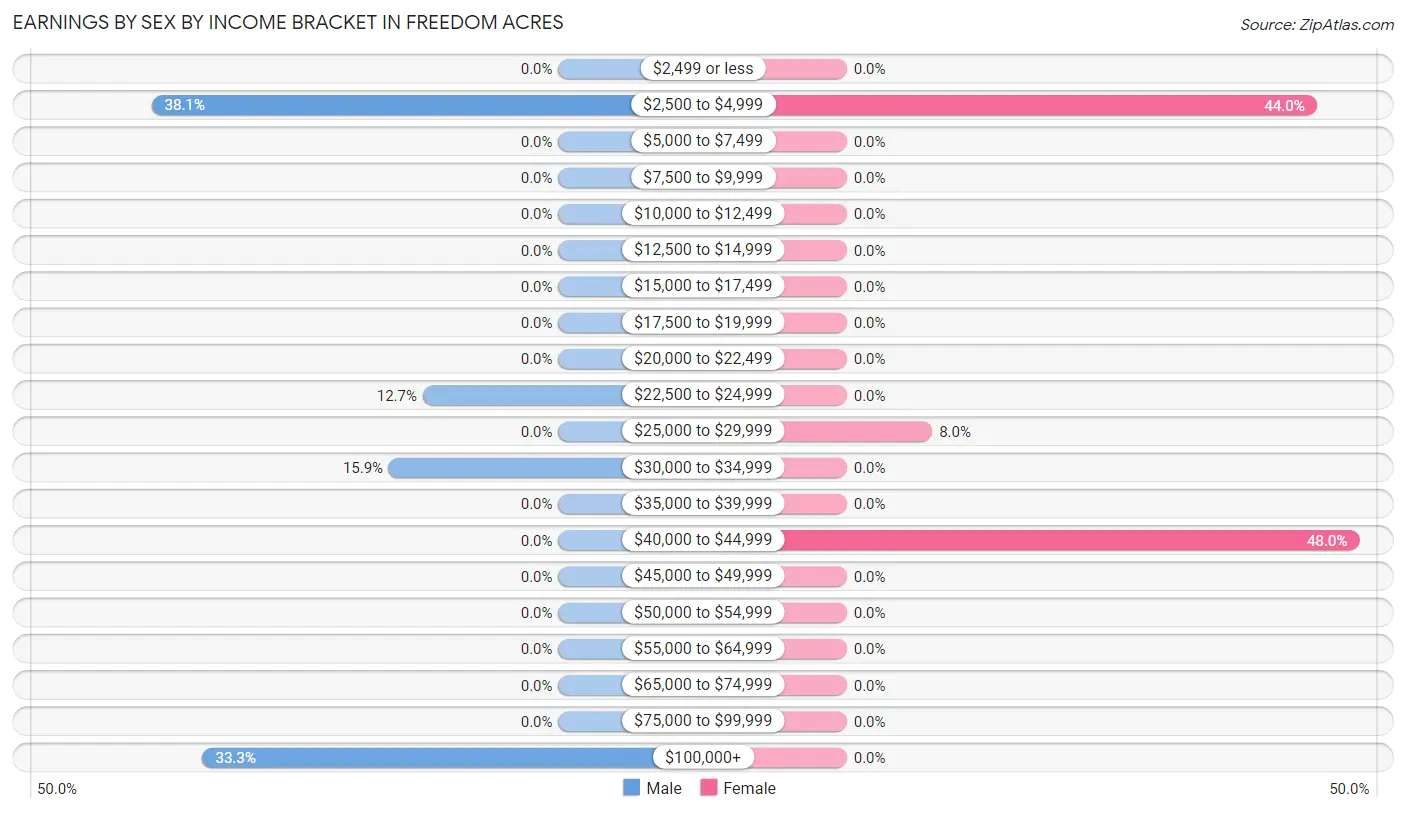
Earnings by Sex by Income Bracket in Freedom Acres
The most common earnings brackets in Freedom Acres are $2,500 to $4,999 for men (24 | 38.1%) and $40,000 to $44,999 for women (24 | 48.0%).
| Income | Male | Female |
| $2,499 or less | 0 (0.0%) | 0 (0.0%) |
| $2,500 to $4,999 | 24 (38.1%) | 22 (44.0%) |
| $5,000 to $7,499 | 0 (0.0%) | 0 (0.0%) |
| $7,500 to $9,999 | 0 (0.0%) | 0 (0.0%) |
| $10,000 to $12,499 | 0 (0.0%) | 0 (0.0%) |
| $12,500 to $14,999 | 0 (0.0%) | 0 (0.0%) |
| $15,000 to $17,499 | 0 (0.0%) | 0 (0.0%) |
| $17,500 to $19,999 | 0 (0.0%) | 0 (0.0%) |
| $20,000 to $22,499 | 0 (0.0%) | 0 (0.0%) |
| $22,500 to $24,999 | 8 (12.7%) | 0 (0.0%) |
| $25,000 to $29,999 | 0 (0.0%) | 4 (8.0%) |
| $30,000 to $34,999 | 10 (15.9%) | 0 (0.0%) |
| $35,000 to $39,999 | 0 (0.0%) | 0 (0.0%) |
| $40,000 to $44,999 | 0 (0.0%) | 24 (48.0%) |
| $45,000 to $49,999 | 0 (0.0%) | 0 (0.0%) |
| $50,000 to $54,999 | 0 (0.0%) | 0 (0.0%) |
| $55,000 to $64,999 | 0 (0.0%) | 0 (0.0%) |
| $65,000 to $74,999 | 0 (0.0%) | 0 (0.0%) |
| $75,000 to $99,999 | 0 (0.0%) | 0 (0.0%) |
| $100,000+ | 21 (33.3%) | 0 (0.0%) |
| Total | 63 (100.0%) | 50 (100.0%) |
Earnings by Sex by Educational Attainment in Freedom Acres
| Educational Attainment | Male Income | Female Income |
| Less than High School | - | - |
| High School Diploma | - | - |
| College or Associate's Degree | - | - |
| Bachelor's Degree | - | - |
| Graduate Degree | - | - |
| Total | $24,844 | $0 |
Family Income in Freedom Acres
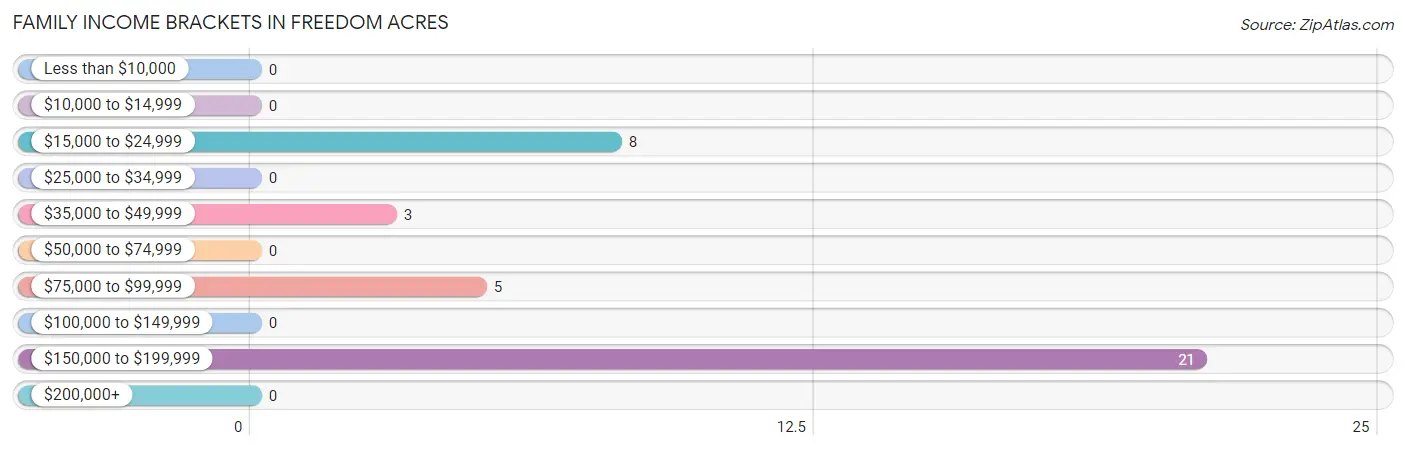
Family Income Brackets in Freedom Acres
According to the Freedom Acres family income data, there are 21 families falling into the $150,000 to $199,999 income range, which is the most common income bracket and makes up 56.8% of all families.
| Income Bracket | # Families | % Families |
| Less than $10,000 | 0 | 0.0% |
| $10,000 to $14,999 | 0 | 0.0% |
| $15,000 to $24,999 | 8 | 21.6% |
| $25,000 to $34,999 | 0 | 0.0% |
| $35,000 to $49,999 | 3 | 8.1% |
| $50,000 to $74,999 | 0 | 0.0% |
| $75,000 to $99,999 | 5 | 13.5% |
| $100,000 to $149,999 | 0 | 0.0% |
| $150,000 to $199,999 | 21 | 56.8% |
| $200,000+ | 0 | 0.0% |
Family Income by Famaliy Size in Freedom Acres
| Income Bracket | # Families | Median Income |
| 2-Person Families | 16 (43.2%) | $0 |
| 3-Person Families | 0 (0.0%) | $0 |
| 4-Person Families | 21 (56.8%) | $0 |
| 5-Person Families | 0 (0.0%) | $0 |
| 6-Person Families | 0 (0.0%) | $0 |
| 7+ Person Families | 0 (0.0%) | $0 |
| Total | 37 (100.0%) | $152,798 |
Family Income by Number of Earners in Freedom Acres
| Number of Earners | # Families | Median Income |
| No Earners | 5 (13.5%) | $0 |
| 1 Earner | 11 (29.7%) | $0 |
| 2 Earners | 0 (0.0%) | $0 |
| 3+ Earners | 21 (56.8%) | $0 |
| Total | 37 (100.0%) | $152,798 |
Household Income in Freedom Acres
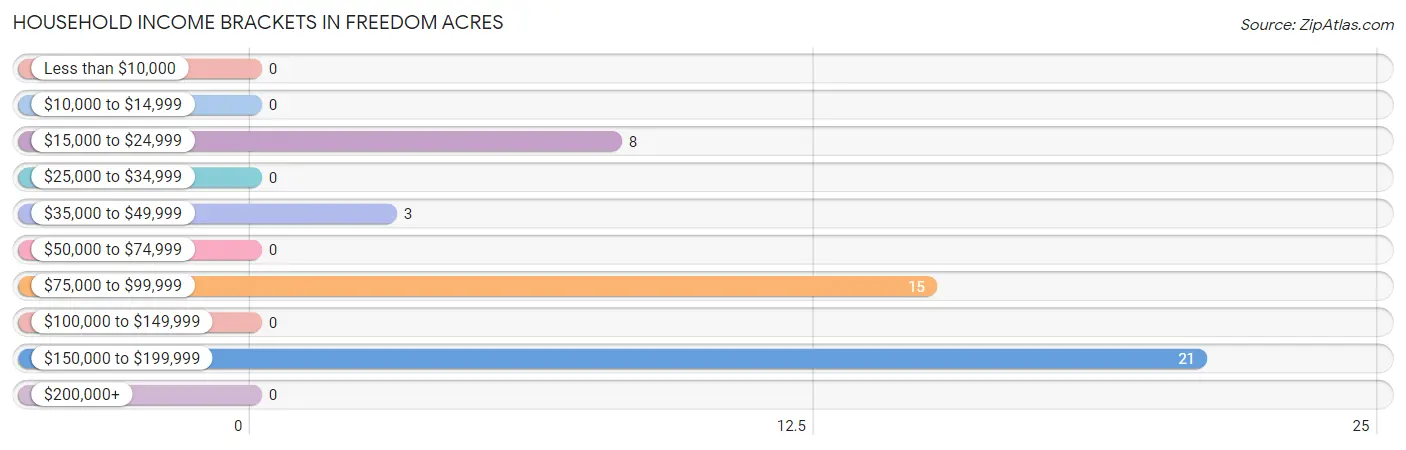
Household Income Brackets in Freedom Acres
With 21 households falling in the category, the $150,000 to $199,999 income range is the most frequent in Freedom Acres, accounting for 44.7% of all households.
| Income Bracket | # Households | % Households |
| Less than $10,000 | 0 | 0.0% |
| $10,000 to $14,999 | 0 | 0.0% |
| $15,000 to $24,999 | 8 | 17.0% |
| $25,000 to $34,999 | 0 | 0.0% |
| $35,000 to $49,999 | 3 | 6.4% |
| $50,000 to $74,999 | 0 | 0.0% |
| $75,000 to $99,999 | 15 | 31.9% |
| $100,000 to $149,999 | 0 | 0.0% |
| $150,000 to $199,999 | 21 | 44.7% |
| $200,000+ | 0 | 0.0% |
Household Income by Householder Age in Freedom Acres
The median household income in Freedom Acres is $0, with the highest median household income of $152,679 found in the 45 to 64 years age bracket for the primary householder. A total of 39 households (83.0%) fall into this category.
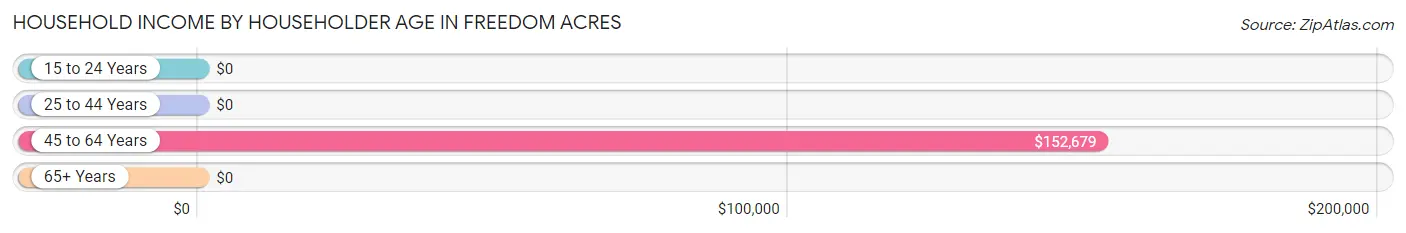
| Income Bracket | # Households | Median Income |
| 15 to 24 Years | 0 (0.0%) | $0 |
| 25 to 44 Years | 0 (0.0%) | $0 |
| 45 to 64 Years | 39 (83.0%) | $152,679 |
| 65+ Years | 8 (17.0%) | $0 |
| Total | 47 (100.0%) | $0 |
Poverty in Freedom Acres
Income Below Poverty by Sex and Age in Freedom Acres
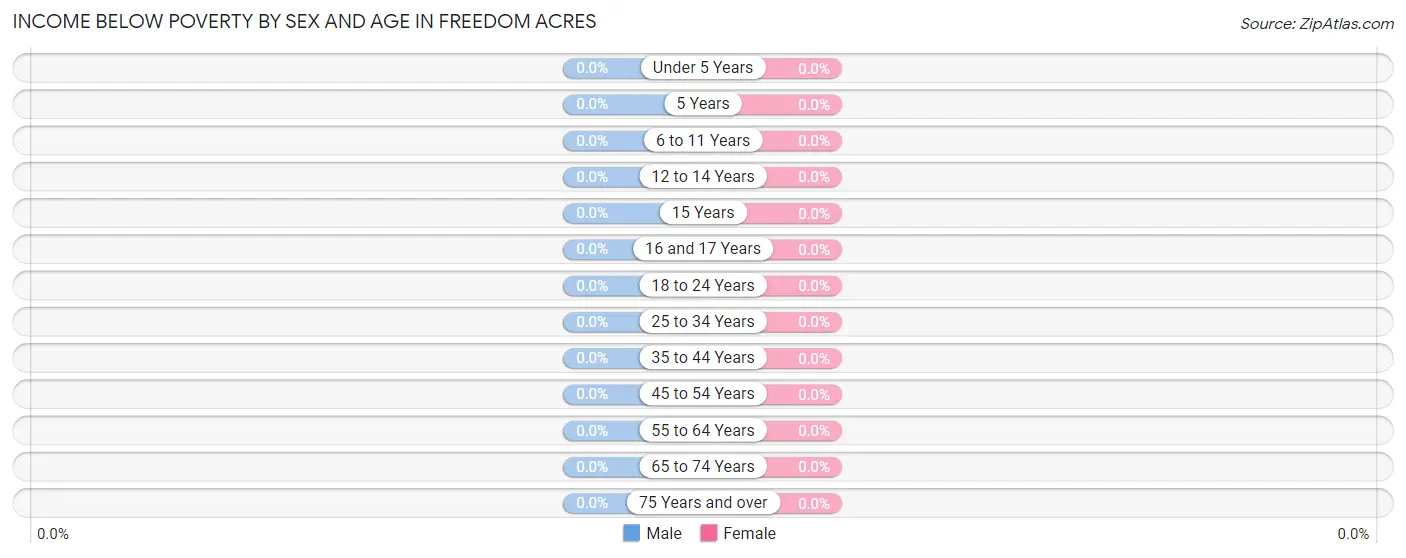
| Age Bracket | Male | Female |
| Under 5 Years | 0 (0.0%) | 0 (0.0%) |
| 5 Years | 0 (0.0%) | 0 (0.0%) |
| 6 to 11 Years | 0 (0.0%) | 0 (0.0%) |
| 12 to 14 Years | 0 (0.0%) | 0 (0.0%) |
| 15 Years | 0 (0.0%) | 0 (0.0%) |
| 16 and 17 Years | 0 (0.0%) | 0 (0.0%) |
| 18 to 24 Years | 0 (0.0%) | 0 (0.0%) |
| 25 to 34 Years | 0 (0.0%) | 0 (0.0%) |
| 35 to 44 Years | 0 (0.0%) | 0 (0.0%) |
| 45 to 54 Years | 0 (0.0%) | 0 (0.0%) |
| 55 to 64 Years | 0 (0.0%) | 0 (0.0%) |
| 65 to 74 Years | 0 (0.0%) | 0 (0.0%) |
| 75 Years and over | 0 (0.0%) | 0 (0.0%) |
| Total | 0 (0.0%) | 0 (0.0%) |
Income Above Poverty by Sex and Age in Freedom Acres
According to the poverty statistics in Freedom Acres, males aged 25 to 34 years and females aged 15 years are the age groups that are most secure financially, with 100.0% of males and 100.0% of females in these age groups living above the poverty line.
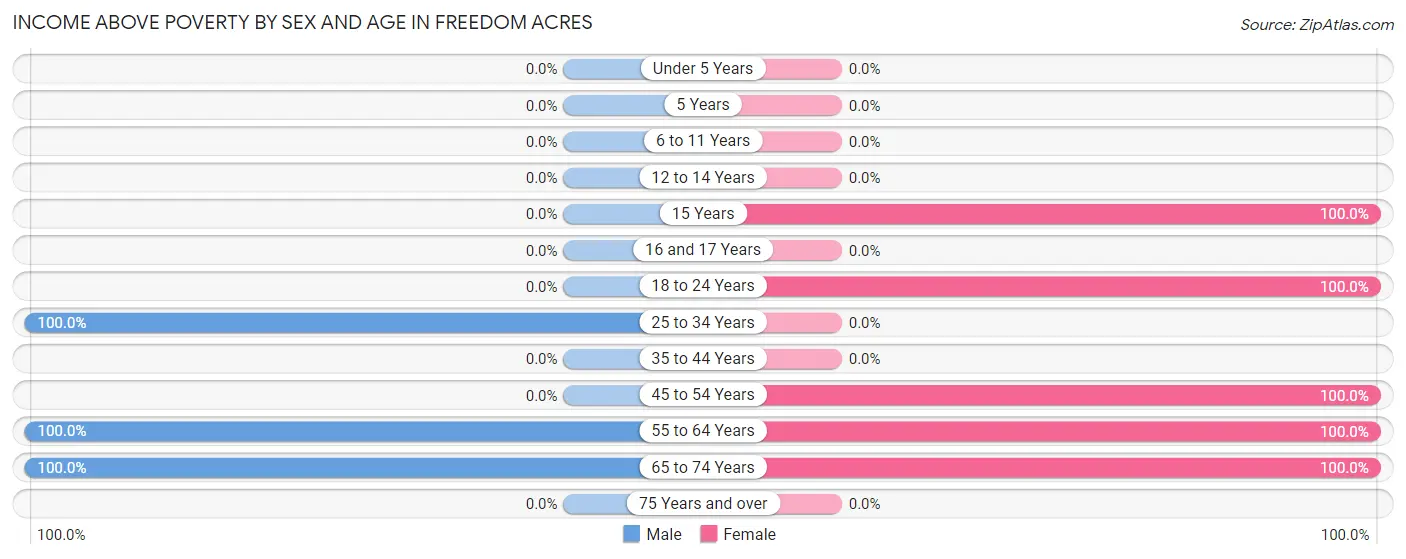
| Age Bracket | Male | Female |
| Under 5 Years | 0 (0.0%) | 0 (0.0%) |
| 5 Years | 0 (0.0%) | 0 (0.0%) |
| 6 to 11 Years | 0 (0.0%) | 0 (0.0%) |
| 12 to 14 Years | 0 (0.0%) | 0 (0.0%) |
| 15 Years | 0 (0.0%) | 7 (100.0%) |
| 16 and 17 Years | 0 (0.0%) | 0 (0.0%) |
| 18 to 24 Years | 0 (0.0%) | 24 (100.0%) |
| 25 to 34 Years | 24 (100.0%) | 0 (0.0%) |
| 35 to 44 Years | 0 (0.0%) | 0 (0.0%) |
| 45 to 54 Years | 0 (0.0%) | 22 (100.0%) |
| 55 to 64 Years | 39 (100.0%) | 4 (100.0%) |
| 65 to 74 Years | 8 (100.0%) | 5 (100.0%) |
| 75 Years and over | 0 (0.0%) | 0 (0.0%) |
| Total | 71 (100.0%) | 62 (100.0%) |
Income Below Poverty Among Married-Couple Families in Freedom Acres
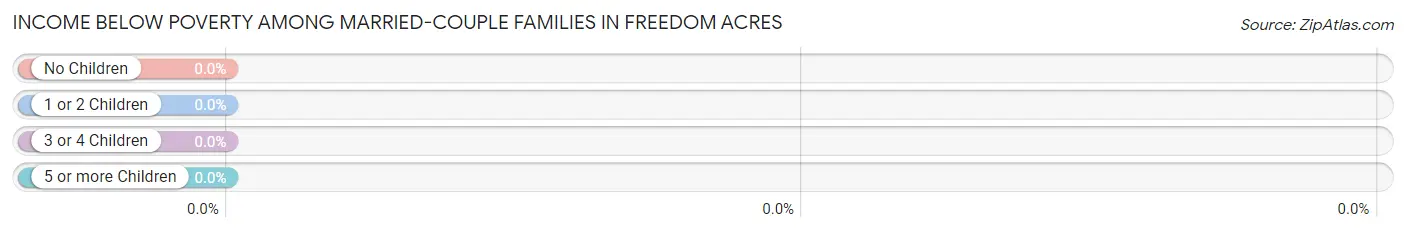
| Children | Above Poverty | Below Poverty |
| No Children | 29 (100.0%) | 0 (0.0%) |
| 1 or 2 Children | 0 (0.0%) | 0 (0.0%) |
| 3 or 4 Children | 0 (0.0%) | 0 (0.0%) |
| 5 or more Children | 0 (0.0%) | 0 (0.0%) |
| Total | 29 (100.0%) | 0 (0.0%) |
Income Below Poverty Among Single-Parent Households in Freedom Acres
| Children | Single Father | Single Mother |
| No Children | 0 (0.0%) | 0 (0.0%) |
| 1 or 2 Children | 0 (0.0%) | 0 (0.0%) |
| 3 or 4 Children | 0 (0.0%) | 0 (0.0%) |
| 5 or more Children | 0 (0.0%) | 0 (0.0%) |
| Total | 0 (0.0%) | 0 (0.0%) |
Income Below Poverty Among Married-Couple vs Single-Parent Households in Freedom Acres
| Children | Married-Couple Families | Single-Parent Households |
| No Children | 0 (0.0%) | 0 (0.0%) |
| 1 or 2 Children | 0 (0.0%) | 0 (0.0%) |
| 3 or 4 Children | 0 (0.0%) | 0 (0.0%) |
| 5 or more Children | 0 (0.0%) | 0 (0.0%) |
| Total | 0 (0.0%) | 0 (0.0%) |
Race in Freedom Acres
The most populous races in Freedom Acres are , and White / Caucasian (133 | 100.0%).
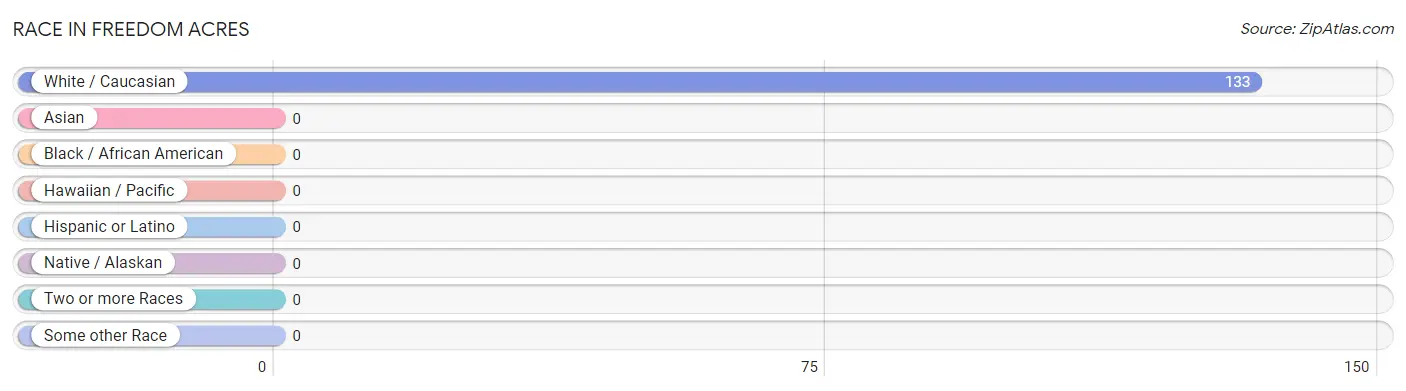
| Race | # Population | % Population |
| Asian | 0 | 0.0% |
| Black / African American | 0 | 0.0% |
| Hawaiian / Pacific | 0 | 0.0% |
| Hispanic or Latino | 0 | 0.0% |
| Native / Alaskan | 0 | 0.0% |
| White / Caucasian | 133 | 100.0% |
| Two or more Races | 0 | 0.0% |
| Some other Race | 0 | 0.0% |
| Total | 133 | 100.0% |
Ancestry in Freedom Acres
The most populous ancestries reported in Freedom Acres are German (80 | 60.2%), Irish (49 | 36.8%), Dutch (45 | 33.8%), Ukrainian (22 | 16.5%), and English (10 | 7.5%), together accounting for 154.9% of all Freedom Acres residents.
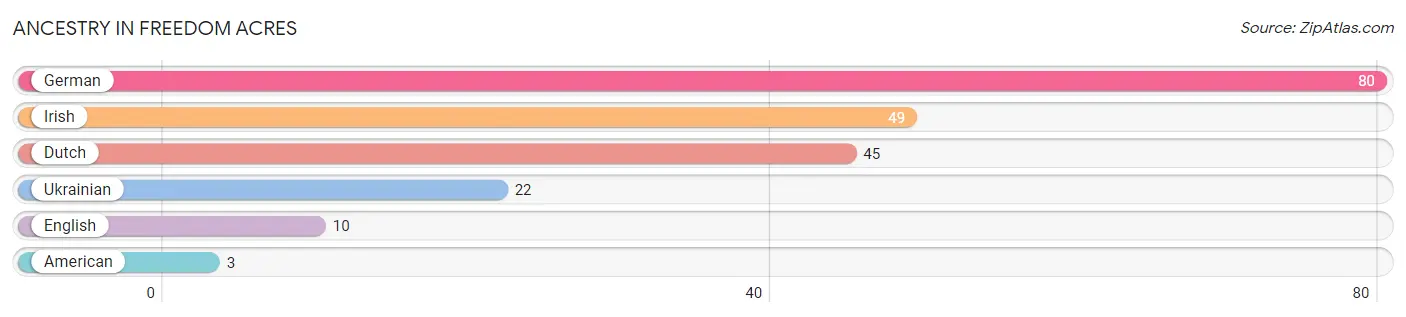
| Ancestry | # Population | % Population |
| American | 3 | 2.3% |
| Dutch | 45 | 33.8% |
| English | 10 | 7.5% |
| German | 80 | 60.2% |
| Irish | 49 | 36.8% |
| Ukrainian | 22 | 16.5% | View All 6 Rows |
Immigrants in Freedom Acres

| Immigration Origin | # Population | % Population | View All 0 Rows |
Sex and Age in Freedom Acres
Sex and Age in Freedom Acres
The most populous age groups in Freedom Acres are 60 to 64 Years (29 | 40.8%) for men and 20 to 24 Years (24 | 38.7%) for women.
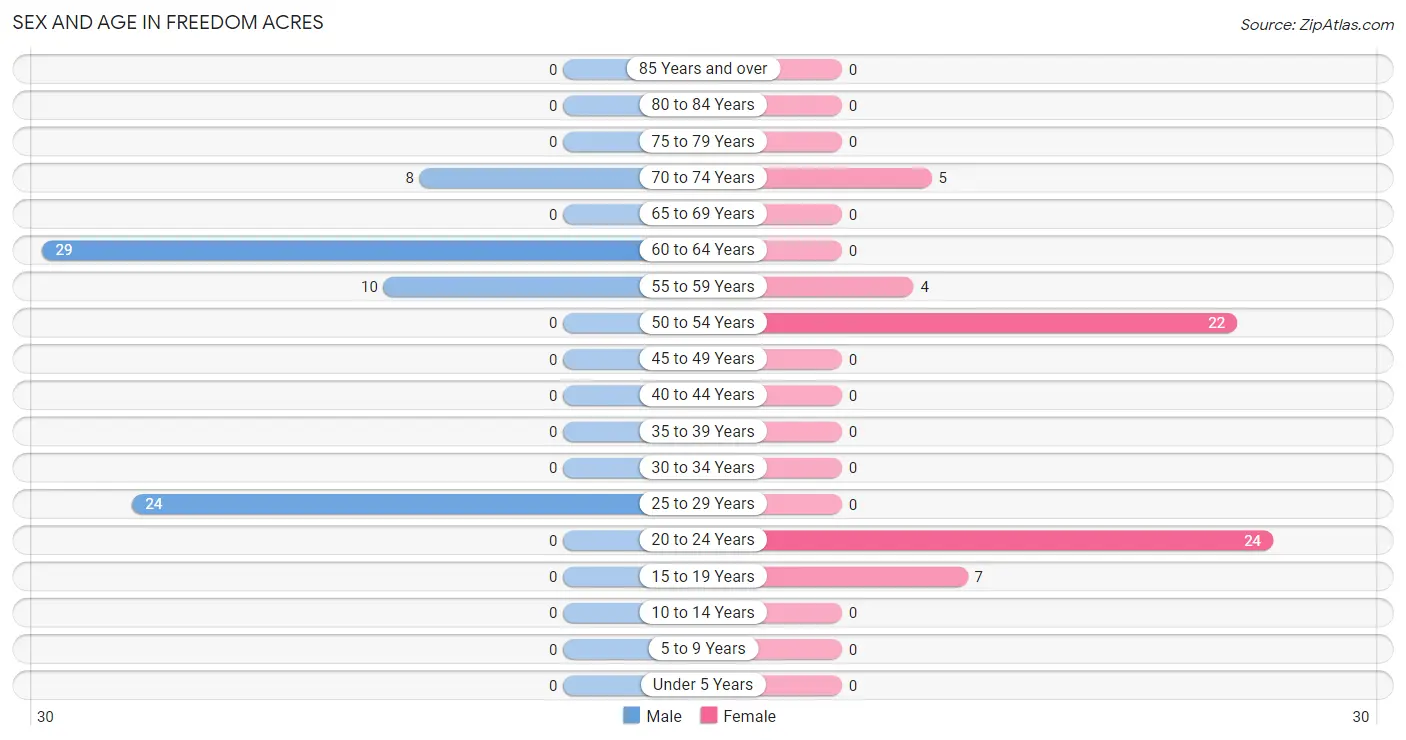
| Age Bracket | Male | Female |
| Under 5 Years | 0 (0.0%) | 0 (0.0%) |
| 5 to 9 Years | 0 (0.0%) | 0 (0.0%) |
| 10 to 14 Years | 0 (0.0%) | 0 (0.0%) |
| 15 to 19 Years | 0 (0.0%) | 7 (11.3%) |
| 20 to 24 Years | 0 (0.0%) | 24 (38.7%) |
| 25 to 29 Years | 24 (33.8%) | 0 (0.0%) |
| 30 to 34 Years | 0 (0.0%) | 0 (0.0%) |
| 35 to 39 Years | 0 (0.0%) | 0 (0.0%) |
| 40 to 44 Years | 0 (0.0%) | 0 (0.0%) |
| 45 to 49 Years | 0 (0.0%) | 0 (0.0%) |
| 50 to 54 Years | 0 (0.0%) | 22 (35.5%) |
| 55 to 59 Years | 10 (14.1%) | 4 (6.5%) |
| 60 to 64 Years | 29 (40.8%) | 0 (0.0%) |
| 65 to 69 Years | 0 (0.0%) | 0 (0.0%) |
| 70 to 74 Years | 8 (11.3%) | 5 (8.1%) |
| 75 to 79 Years | 0 (0.0%) | 0 (0.0%) |
| 80 to 84 Years | 0 (0.0%) | 0 (0.0%) |
| 85 Years and over | 0 (0.0%) | 0 (0.0%) |
| Total | 71 (100.0%) | 62 (100.0%) |
Families and Households in Freedom Acres
Median Family Size in Freedom Acres
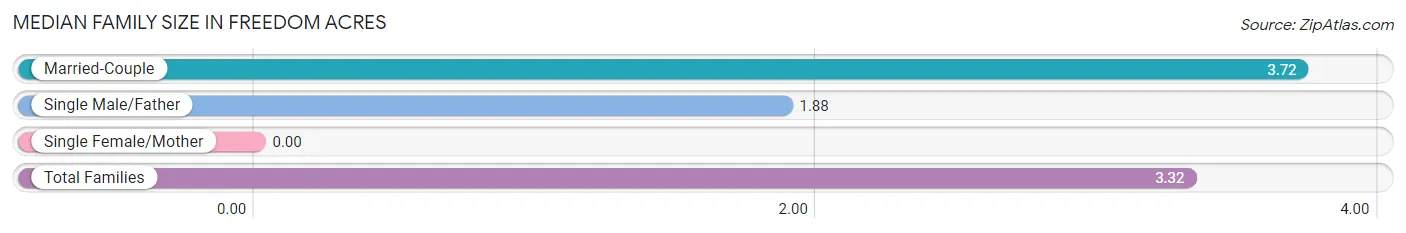
| Family Type | # Families | Family Size |
| Married-Couple | 29 (78.4%) | 3.72 |
| Single Male/Father | 8 (21.6%) | 1.88 |
| Single Female/Mother | 0 (0.0%) | - |
| Total Families | 37 (100.0%) | 3.32 |
Median Household Size in Freedom Acres
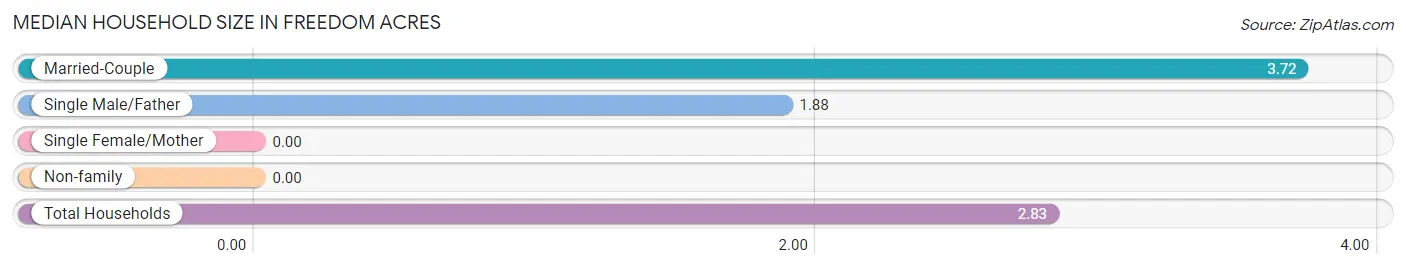
| Household Type | # Households | Household Size |
| Married-Couple | 29 (61.7%) | 3.72 |
| Single Male/Father | 8 (17.0%) | 1.88 |
| Single Female/Mother | 0 (0.0%) | - |
| Non-family | 10 (21.3%) | - |
| Total Households | 47 (100.0%) | 2.83 |
Household Size by Marriage Status in Freedom Acres
Out of a total of 47 households in Freedom Acres, 37 (78.7%) are family households, while 10 (21.3%) are nonfamily households. The most numerous type of family households are 4-person households, comprising 21, and the most common type of nonfamily households are 1-person households, comprising 10.
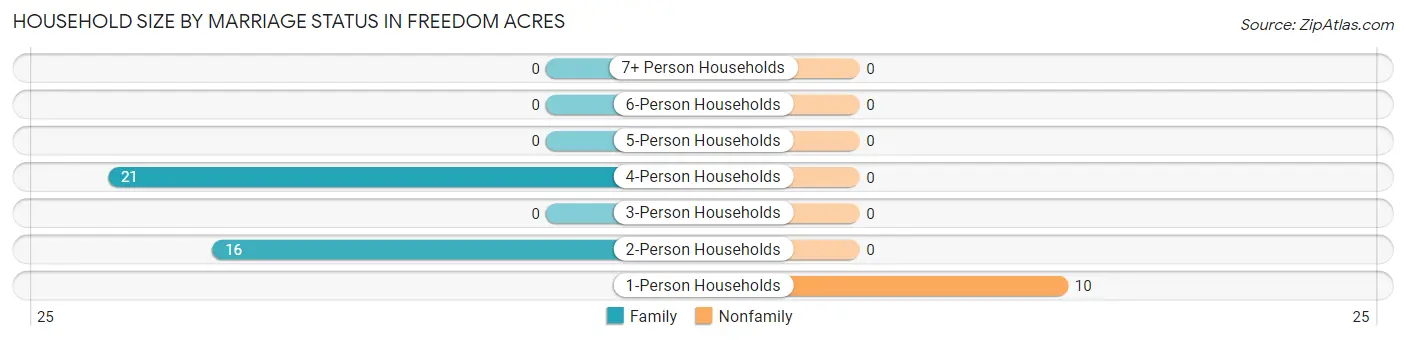
| Household Size | Family Households | Nonfamily Households |
| 1-Person Households | - | 10 (21.3%) |
| 2-Person Households | 16 (34.0%) | 0 (0.0%) |
| 3-Person Households | 0 (0.0%) | 0 (0.0%) |
| 4-Person Households | 21 (44.7%) | 0 (0.0%) |
| 5-Person Households | 0 (0.0%) | 0 (0.0%) |
| 6-Person Households | 0 (0.0%) | 0 (0.0%) |
| 7+ Person Households | 0 (0.0%) | 0 (0.0%) |
| Total | 37 (78.7%) | 10 (21.3%) |
Female Fertility in Freedom Acres
Fertility by Age in Freedom Acres
| Age Bracket | Women with Births | Births / 1,000 Women |
| 15 to 19 years | 0 (0.0%) | 0.0 |
| 20 to 34 years | 0 (0.0%) | 0.0 |
| 35 to 50 years | 0 (0.0%) | 0.0 |
| Total | 0 (0.0%) | 0.0 |
Fertility by Age by Marriage Status in Freedom Acres
| Age Bracket | Married | Unmarried |
| 15 to 19 years | 0 (0.0%) | 0 (0.0%) |
| 20 to 34 years | 0 (0.0%) | 0 (0.0%) |
| 35 to 50 years | 0 (0.0%) | 0 (0.0%) |
| Total | 0 (0.0%) | 0 (0.0%) |
Fertility by Education in Freedom Acres
| Educational Attainment | Women with Births | Births / 1,000 Women |
| Less than High School | 0 (0.0%) | 0.0 |
| High School Diploma | 0 (0.0%) | 0.0 |
| College or Associate's Degree | 0 (0.0%) | 0.0 |
| Bachelor's Degree | 0 (0.0%) | 0.0 |
| Graduate Degree | 0 (0.0%) | 0.0 |
| Total | 0 (0.0%) | 0.0 |
Fertility by Education by Marriage Status in Freedom Acres
| Educational Attainment | Married | Unmarried |
| Less than High School | 0 (0.0%) | 0 (0.0%) |
| High School Diploma | 0 (0.0%) | 0 (0.0%) |
| College or Associate's Degree | 0 (0.0%) | 0 (0.0%) |
| Bachelor's Degree | 0 (0.0%) | 0 (0.0%) |
| Graduate Degree | 0 (0.0%) | 0 (0.0%) |
| Total | 0 (0.0%) | 0 (0.0%) |
Employment Characteristics in Freedom Acres
Employment by Class of Employer in Freedom Acres
Among the 113 employed individuals in Freedom Acres, private company employees (52 | 46.0%), self-employed (incorporated) (43 | 38.1%), and state government employees (10 | 8.8%) make up the most common classes of employment.
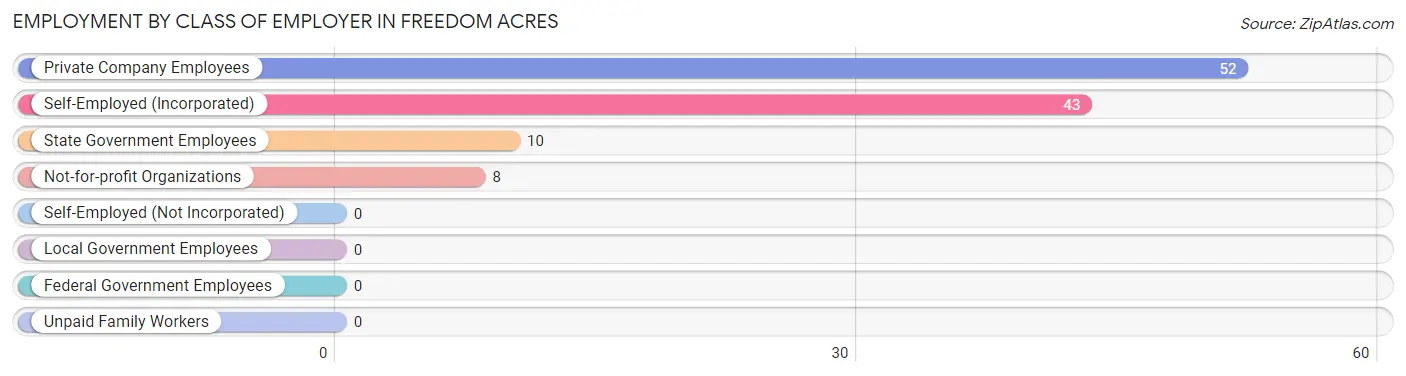
| Employer Class | # Employees | % Employees |
| Private Company Employees | 52 | 46.0% |
| Self-Employed (Incorporated) | 43 | 38.1% |
| Self-Employed (Not Incorporated) | 0 | 0.0% |
| Not-for-profit Organizations | 8 | 7.1% |
| Local Government Employees | 0 | 0.0% |
| State Government Employees | 10 | 8.8% |
| Federal Government Employees | 0 | 0.0% |
| Unpaid Family Workers | 0 | 0.0% |
| Total | 113 | 100.0% |
Employment Status by Age in Freedom Acres
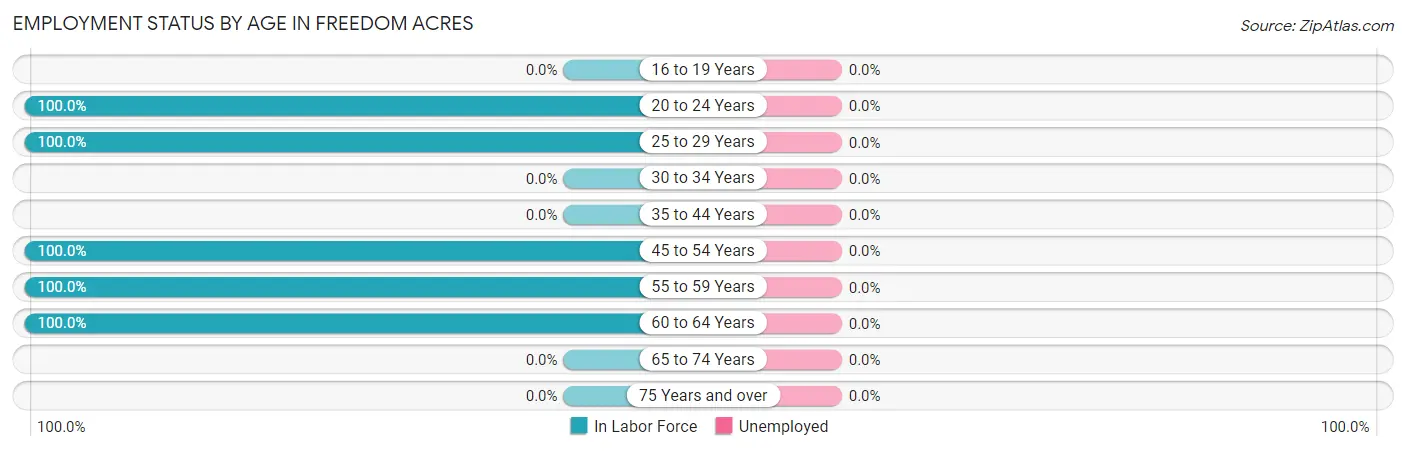
| Age Bracket | In Labor Force | Unemployed |
| 16 to 19 Years | 0 (0.0%) | 0 (0.0%) |
| 20 to 24 Years | 24 (100.0%) | 0 (0.0%) |
| 25 to 29 Years | 24 (100.0%) | 0 (0.0%) |
| 30 to 34 Years | 0 (0.0%) | 0 (0.0%) |
| 35 to 44 Years | 0 (0.0%) | 0 (0.0%) |
| 45 to 54 Years | 22 (100.0%) | 0 (0.0%) |
| 55 to 59 Years | 14 (100.0%) | 0 (0.0%) |
| 60 to 64 Years | 29 (100.0%) | 0 (0.0%) |
| 65 to 74 Years | 0 (0.0%) | 0 (0.0%) |
| 75 Years and over | 0 (0.0%) | 0 (0.0%) |
| Total | 113 (89.7%) | 0 (0.0%) |
Employment Status by Educational Attainment in Freedom Acres
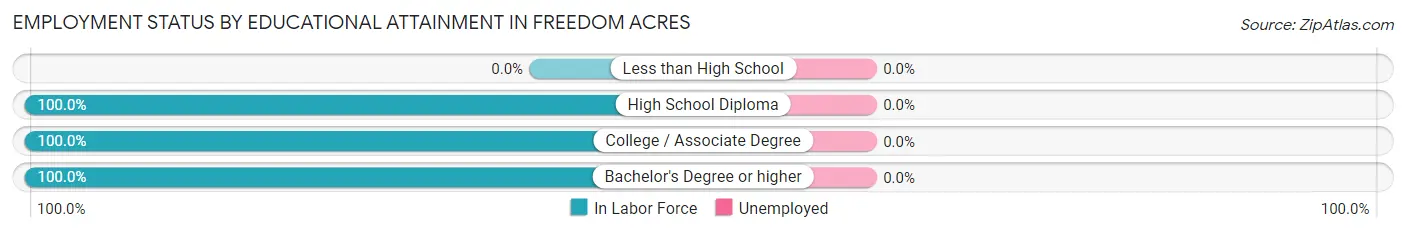
| Educational Attainment | In Labor Force | Unemployed |
| Less than High School | 0 (0.0%) | 0 (0.0%) |
| High School Diploma | 26 (100.0%) | 0 (0.0%) |
| College / Associate Degree | 29 (100.0%) | 0 (0.0%) |
| Bachelor's Degree or higher | 34 (100.0%) | 0 (0.0%) |
| Total | 89 (100.0%) | 0 (0.0%) |
Employment Occupations by Sex in Freedom Acres
Management, Business, Science and Arts Occupations
The most common Management, Business, Science and Arts occupations in Freedom Acres are Management (43 | 38.1%), Computers, Engineering & Science (24 | 21.2%), Architecture & Engineering (24 | 21.2%), Community & Social Service (10 | 8.8%), and Education, Arts & Media (10 | 8.8%).
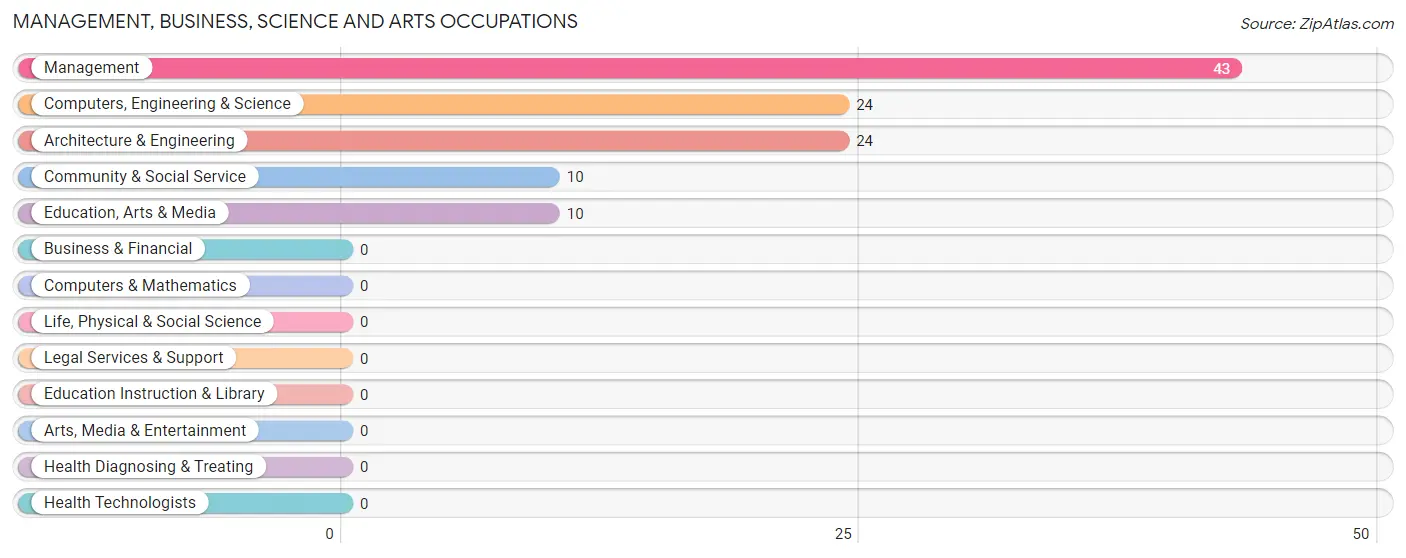
Management, Business, Science and Arts Occupations by Sex
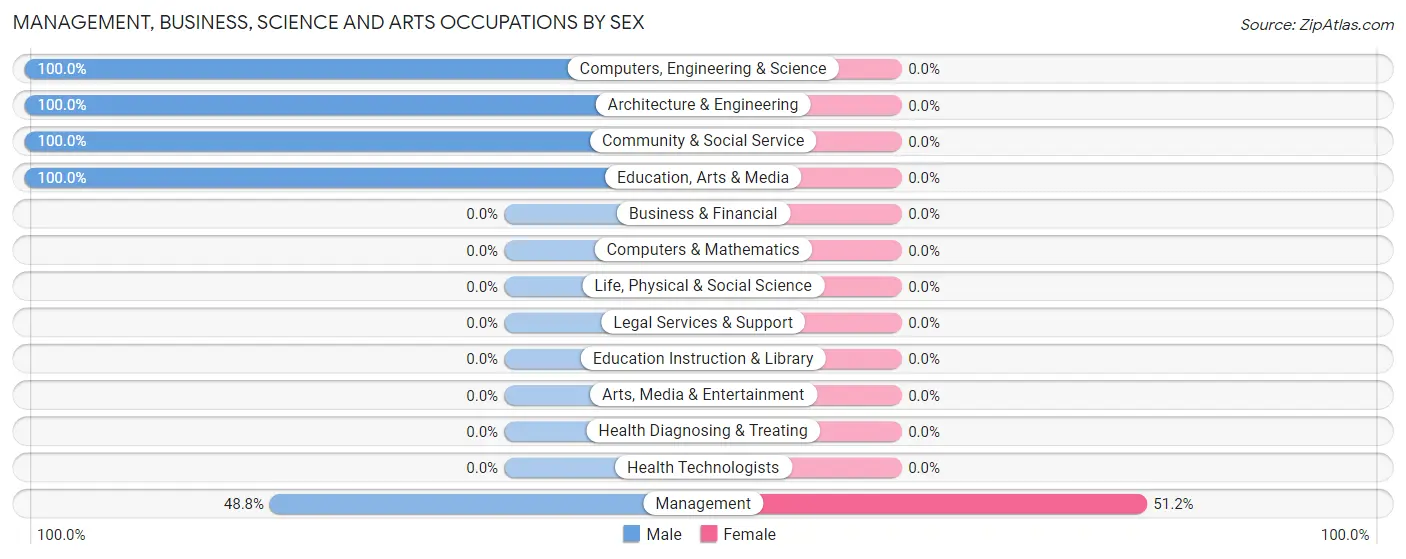
| Occupation | Male | Female |
| Management | 21 (48.8%) | 22 (51.2%) |
| Business & Financial | 0 (0.0%) | 0 (0.0%) |
| Computers, Engineering & Science | 24 (100.0%) | 0 (0.0%) |
| Computers & Mathematics | 0 (0.0%) | 0 (0.0%) |
| Architecture & Engineering | 24 (100.0%) | 0 (0.0%) |
| Life, Physical & Social Science | 0 (0.0%) | 0 (0.0%) |
| Community & Social Service | 10 (100.0%) | 0 (0.0%) |
| Education, Arts & Media | 10 (100.0%) | 0 (0.0%) |
| Legal Services & Support | 0 (0.0%) | 0 (0.0%) |
| Education Instruction & Library | 0 (0.0%) | 0 (0.0%) |
| Arts, Media & Entertainment | 0 (0.0%) | 0 (0.0%) |
| Health Diagnosing & Treating | 0 (0.0%) | 0 (0.0%) |
| Health Technologists | 0 (0.0%) | 0 (0.0%) |
| Total (Category) | 55 (71.4%) | 22 (28.6%) |
| Total (Overall) | 63 (55.7%) | 50 (44.3%) |
Services Occupations
The most common Services occupations in Freedom Acres are , and Personal Care & Service (4 | 3.5%).
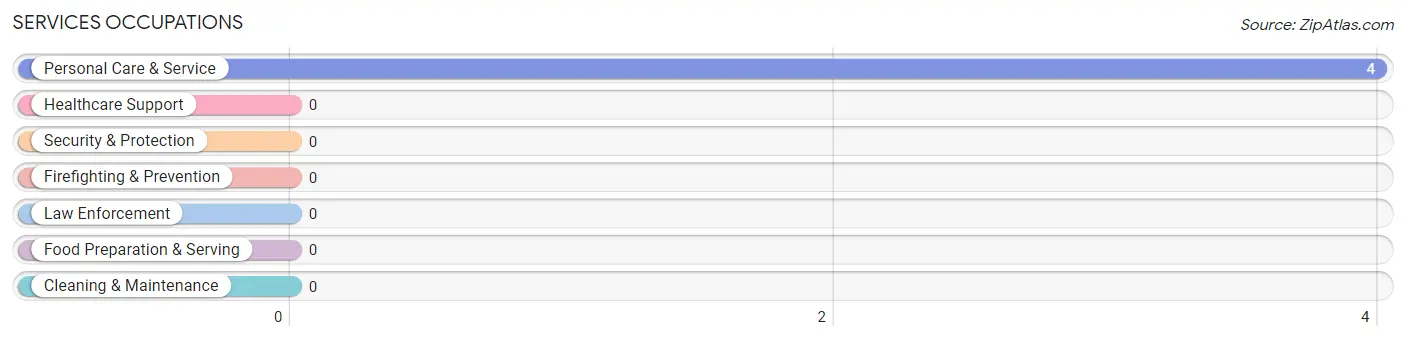
Services Occupations by Sex
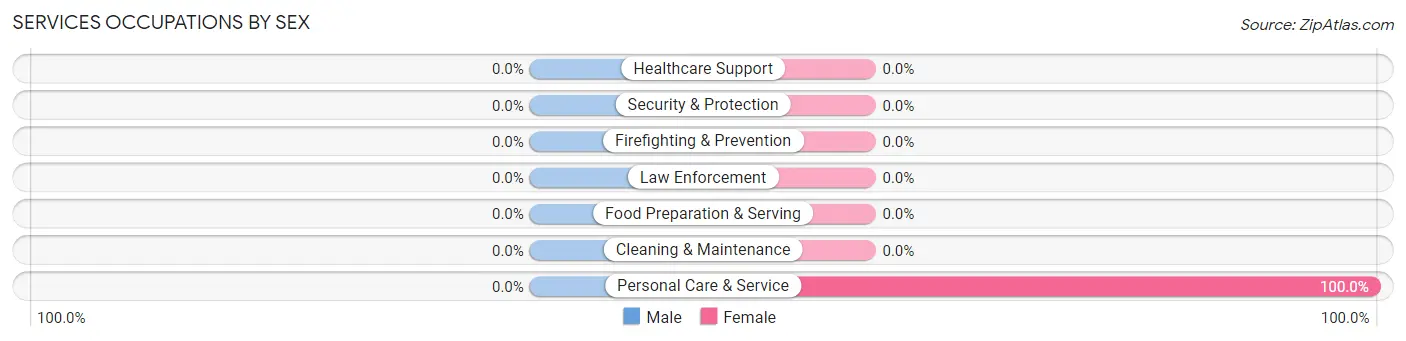
| Occupation | Male | Female |
| Healthcare Support | 0 (0.0%) | 0 (0.0%) |
| Security & Protection | 0 (0.0%) | 0 (0.0%) |
| Firefighting & Prevention | 0 (0.0%) | 0 (0.0%) |
| Law Enforcement | 0 (0.0%) | 0 (0.0%) |
| Food Preparation & Serving | 0 (0.0%) | 0 (0.0%) |
| Cleaning & Maintenance | 0 (0.0%) | 0 (0.0%) |
| Personal Care & Service | 0 (0.0%) | 4 (100.0%) |
| Total (Category) | 0 (0.0%) | 4 (100.0%) |
| Total (Overall) | 63 (55.7%) | 50 (44.3%) |
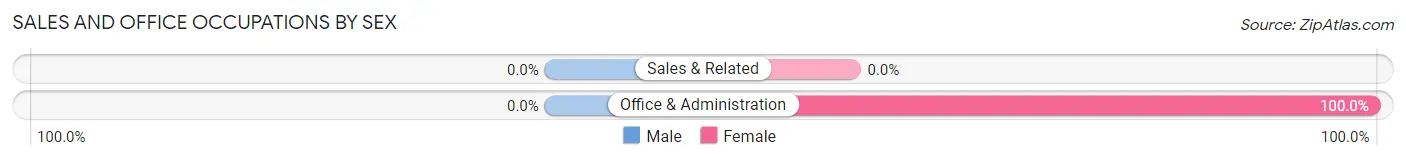
Sales and Office Occupations
The most common Sales and Office occupations in Freedom Acres are , and Office & Administration (24 | 21.2%).
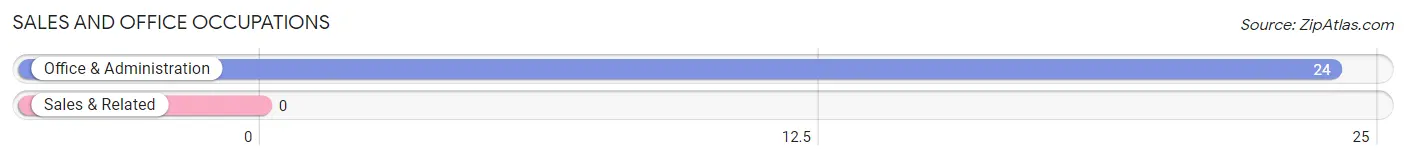
Sales and Office Occupations by Sex
| Occupation | Male | Female |
| Sales & Related | 0 (0.0%) | 0 (0.0%) |
| Office & Administration | 0 (0.0%) | 24 (100.0%) |
| Total (Category) | 0 (0.0%) | 24 (100.0%) |
| Total (Overall) | 63 (55.7%) | 50 (44.3%) |
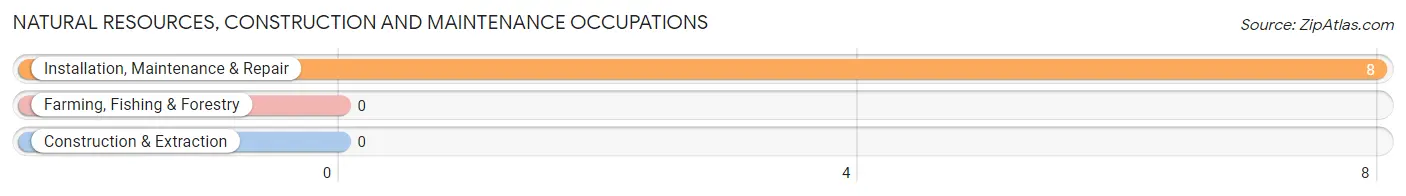
Natural Resources, Construction and Maintenance Occupations
The most common Natural Resources, Construction and Maintenance occupations in Freedom Acres are , and Installation, Maintenance & Repair (8 | 7.1%).
Natural Resources, Construction and Maintenance Occupations by Sex
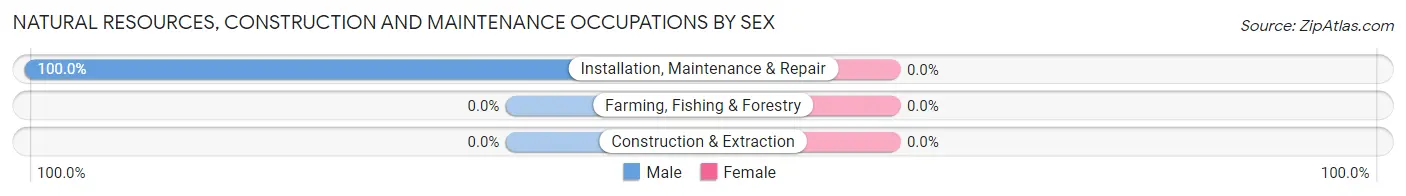
| Occupation | Male | Female |
| Farming, Fishing & Forestry | 0 (0.0%) | 0 (0.0%) |
| Construction & Extraction | 0 (0.0%) | 0 (0.0%) |
| Installation, Maintenance & Repair | 8 (100.0%) | 0 (0.0%) |
| Total (Category) | 8 (100.0%) | 0 (0.0%) |
| Total (Overall) | 63 (55.7%) | 50 (44.3%) |
Production, Transportation and Moving Occupations
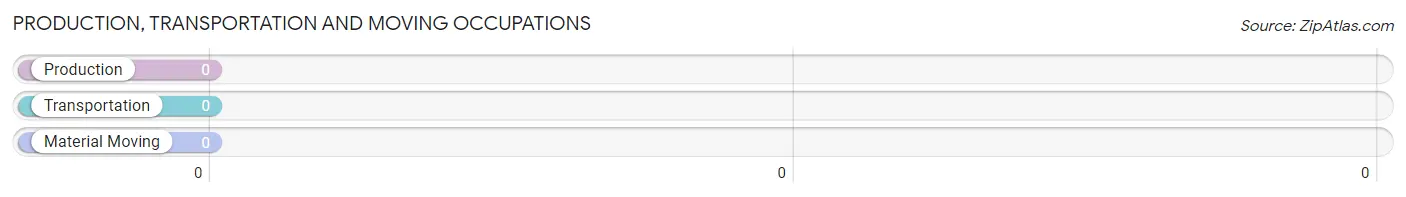
Production, Transportation and Moving Occupations by Sex
| Occupation | Male | Female |
| Production | 0 (0.0%) | 0 (0.0%) |
| Transportation | 0 (0.0%) | 0 (0.0%) |
| Material Moving | 0 (0.0%) | 0 (0.0%) |
| Total (Category) | 0 (0.0%) | 0 (0.0%) |
| Total (Overall) | 63 (55.7%) | 50 (44.3%) |
Employment Industries by Sex in Freedom Acres
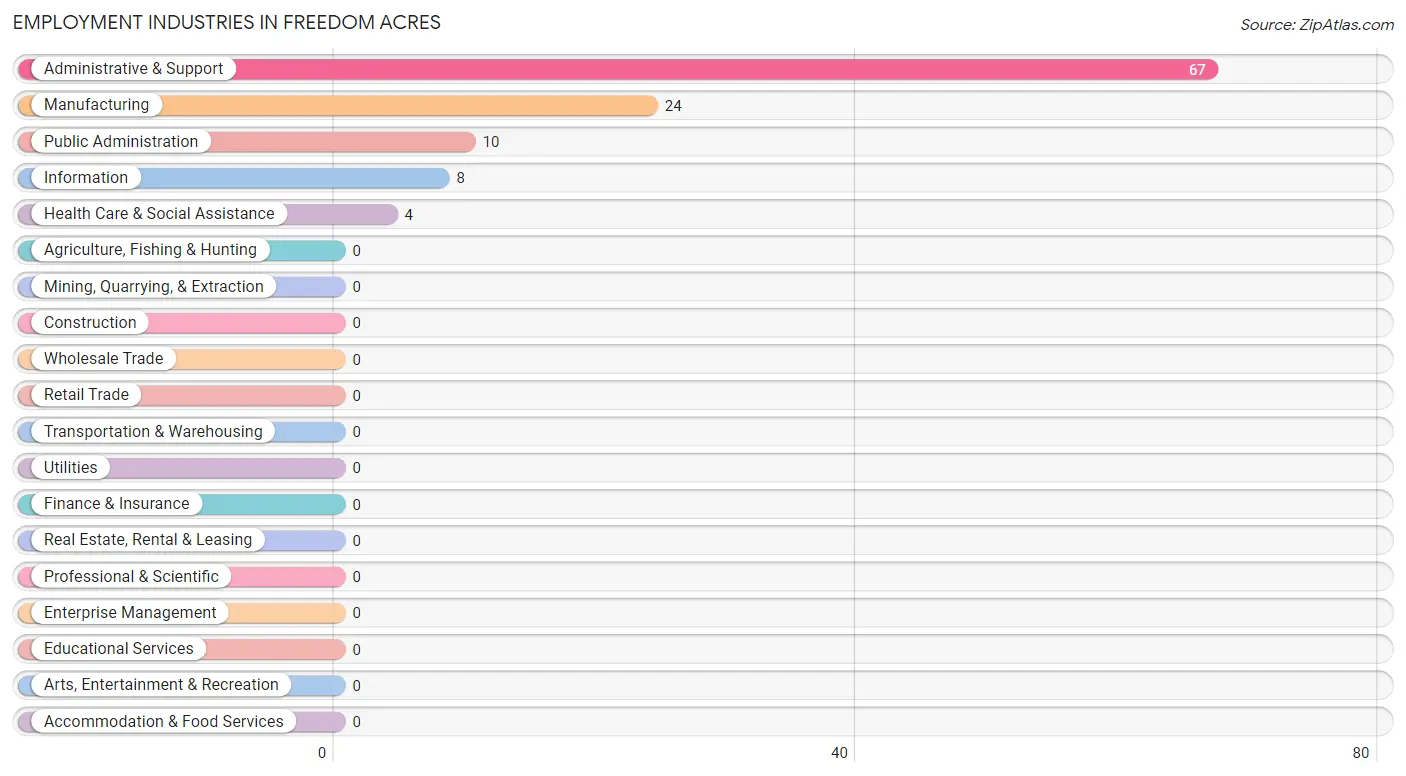
Employment Industries in Freedom Acres
The major employment industries in Freedom Acres include Administrative & Support (67 | 59.3%), Manufacturing (24 | 21.2%), Public Administration (10 | 8.8%), Information (8 | 7.1%), and Health Care & Social Assistance (4 | 3.5%).
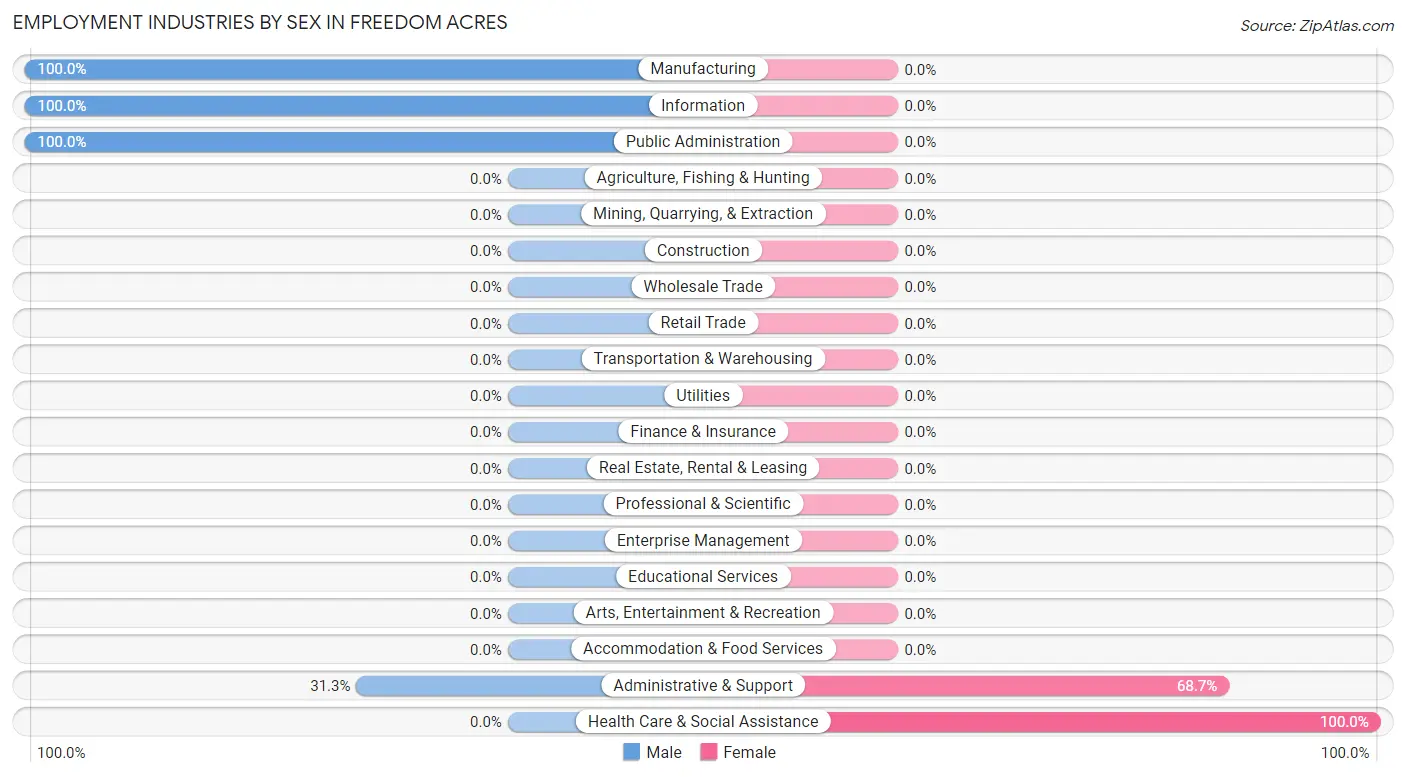
Employment Industries by Sex in Freedom Acres
The Freedom Acres industries that see more men than women are Manufacturing (100.0%), Information (100.0%), and Public Administration (100.0%), whereas the industries that tend to have a higher number of women are Health Care & Social Assistance (100.0%), and Administrative & Support (68.7%).
| Industry | Male | Female |
| Agriculture, Fishing & Hunting | 0 (0.0%) | 0 (0.0%) |
| Mining, Quarrying, & Extraction | 0 (0.0%) | 0 (0.0%) |
| Construction | 0 (0.0%) | 0 (0.0%) |
| Manufacturing | 24 (100.0%) | 0 (0.0%) |
| Wholesale Trade | 0 (0.0%) | 0 (0.0%) |
| Retail Trade | 0 (0.0%) | 0 (0.0%) |
| Transportation & Warehousing | 0 (0.0%) | 0 (0.0%) |
| Utilities | 0 (0.0%) | 0 (0.0%) |
| Information | 8 (100.0%) | 0 (0.0%) |
| Finance & Insurance | 0 (0.0%) | 0 (0.0%) |
| Real Estate, Rental & Leasing | 0 (0.0%) | 0 (0.0%) |
| Professional & Scientific | 0 (0.0%) | 0 (0.0%) |
| Enterprise Management | 0 (0.0%) | 0 (0.0%) |
| Administrative & Support | 21 (31.3%) | 46 (68.7%) |
| Educational Services | 0 (0.0%) | 0 (0.0%) |
| Health Care & Social Assistance | 0 (0.0%) | 4 (100.0%) |
| Arts, Entertainment & Recreation | 0 (0.0%) | 0 (0.0%) |
| Accommodation & Food Services | 0 (0.0%) | 0 (0.0%) |
| Public Administration | 10 (100.0%) | 0 (0.0%) |
| Total | 63 (55.7%) | 50 (44.3%) |
Education in Freedom Acres
School Enrollment in Freedom Acres
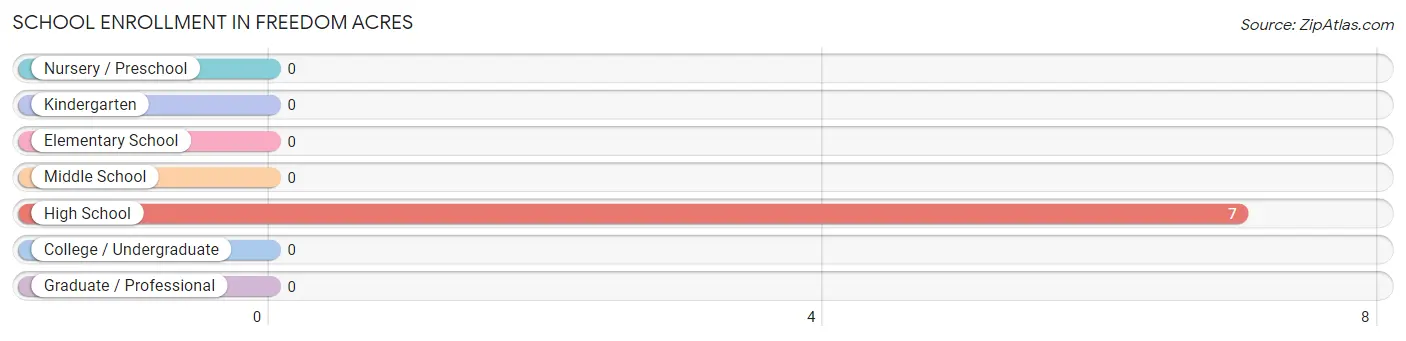
| School Level | # Students | % Students |
| Nursery / Preschool | 0 | 0.0% |
| Kindergarten | 0 | 0.0% |
| Elementary School | 0 | 0.0% |
| Middle School | 0 | 0.0% |
| High School | 7 | 100.0% |
| College / Undergraduate | 0 | 0.0% |
| Graduate / Professional | 0 | 0.0% |
| Total | 7 | 100.0% |
School Enrollment by Age by Funding Source in Freedom Acres
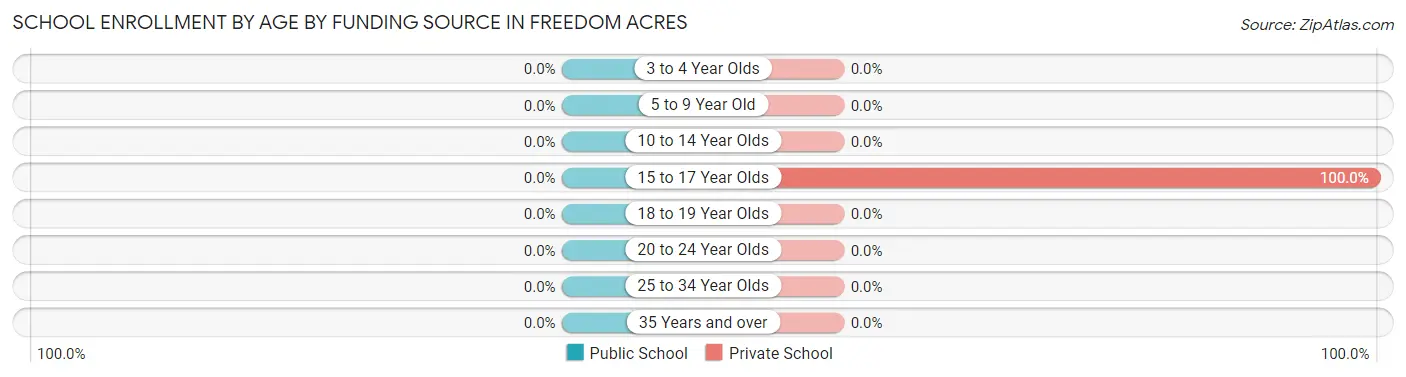
| Age Bracket | Public School | Private School |
| 3 to 4 Year Olds | 0 (0.0%) | 0 (0.0%) |
| 5 to 9 Year Old | 0 (0.0%) | 0 (0.0%) |
| 10 to 14 Year Olds | 0 (0.0%) | 0 (0.0%) |
| 15 to 17 Year Olds | 0 (0.0%) | 7 (100.0%) |
| 18 to 19 Year Olds | 0 (0.0%) | 0 (0.0%) |
| 20 to 24 Year Olds | 0 (0.0%) | 0 (0.0%) |
| 25 to 34 Year Olds | 0 (0.0%) | 0 (0.0%) |
| 35 Years and over | 0 (0.0%) | 0 (0.0%) |
| Total | 0 (0.0%) | 7 (100.0%) |
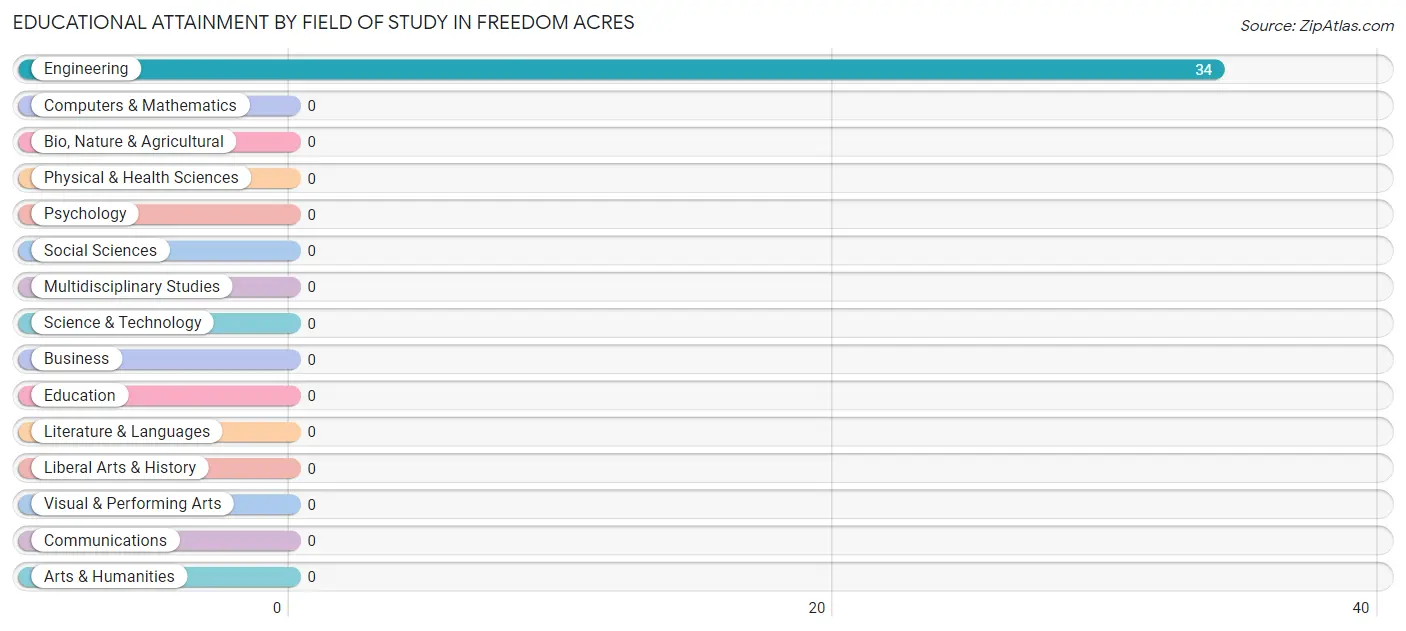
Educational Attainment by Field of Study in Freedom Acres
, and engineering (34 | 100.0%) are the most common fields of study among 34 individuals in Freedom Acres who have obtained a bachelor's degree or higher.
| Field of Study | # Graduates | % Graduates |
| Computers & Mathematics | 0 | 0.0% |
| Bio, Nature & Agricultural | 0 | 0.0% |
| Physical & Health Sciences | 0 | 0.0% |
| Psychology | 0 | 0.0% |
| Social Sciences | 0 | 0.0% |
| Engineering | 34 | 100.0% |
| Multidisciplinary Studies | 0 | 0.0% |
| Science & Technology | 0 | 0.0% |
| Business | 0 | 0.0% |
| Education | 0 | 0.0% |
| Literature & Languages | 0 | 0.0% |
| Liberal Arts & History | 0 | 0.0% |
| Visual & Performing Arts | 0 | 0.0% |
| Communications | 0 | 0.0% |
| Arts & Humanities | 0 | 0.0% |
| Total | 34 | 100.0% |
Transportation & Commute in Freedom Acres
Vehicle Availability by Sex in Freedom Acres
The most prevalent vehicle ownership categories in Freedom Acres are males with 5 or more vehicles (45, accounting for 71.4%) and females with 5 or more vehicles (46, making up 90.0%).
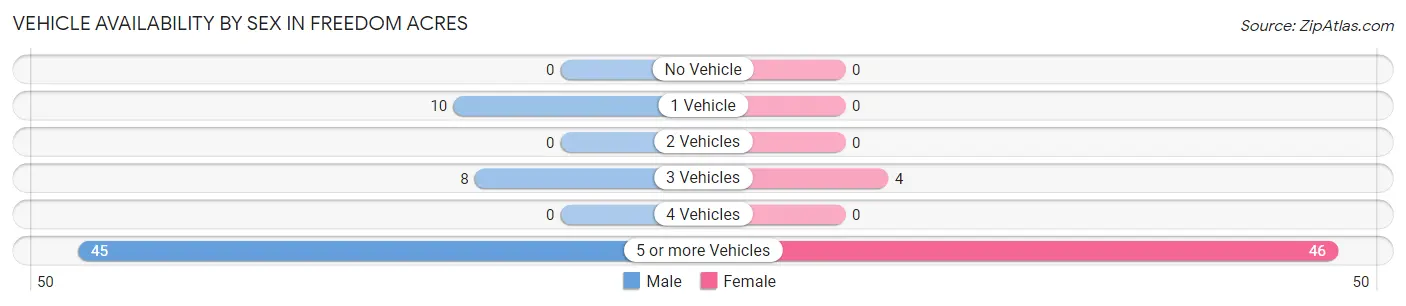
| Vehicles Available | Male | Female |
| No Vehicle | 0 (0.0%) | 0 (0.0%) |
| 1 Vehicle | 10 (15.9%) | 0 (0.0%) |
| 2 Vehicles | 0 (0.0%) | 0 (0.0%) |
| 3 Vehicles | 8 (12.7%) | 4 (8.0%) |
| 4 Vehicles | 0 (0.0%) | 0 (0.0%) |
| 5 or more Vehicles | 45 (71.4%) | 46 (92.0%) |
| Total | 63 (100.0%) | 50 (100.0%) |
Commute Time in Freedom Acres
The most frequently occuring commute durations in Freedom Acres are 90 or more minutes (91 commuters, 80.5%), 15 to 19 minutes (10 commuters, 8.8%), and 20 to 24 minutes (8 commuters, 7.1%).
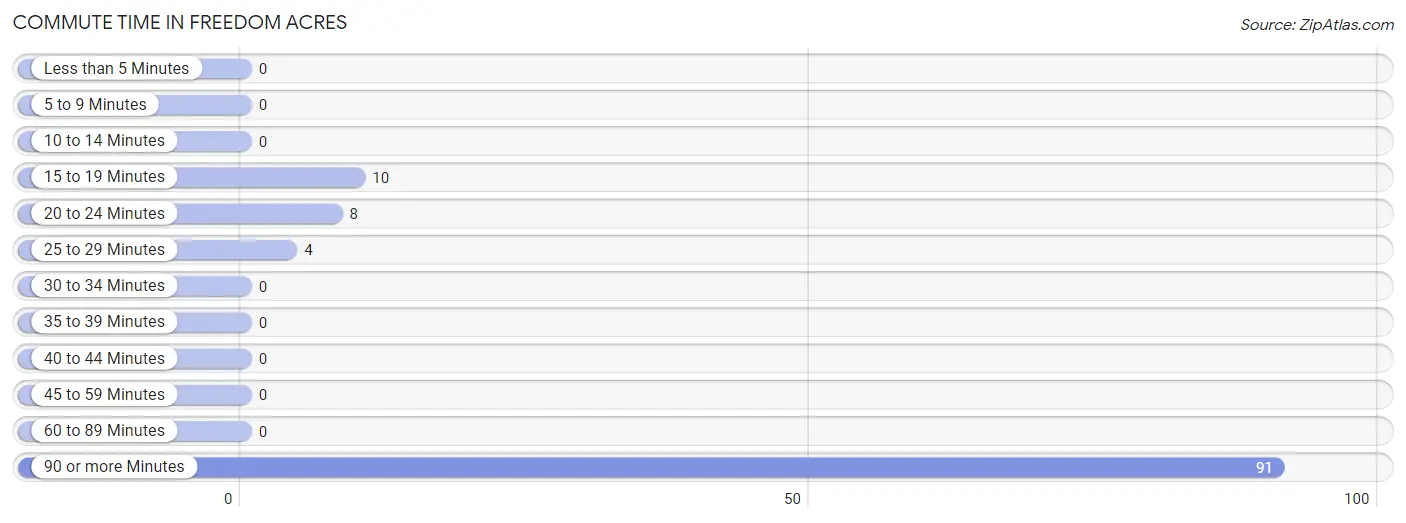
| Commute Time | # Commuters | % Commuters |
| Less than 5 Minutes | 0 | 0.0% |
| 5 to 9 Minutes | 0 | 0.0% |
| 10 to 14 Minutes | 0 | 0.0% |
| 15 to 19 Minutes | 10 | 8.8% |
| 20 to 24 Minutes | 8 | 7.1% |
| 25 to 29 Minutes | 4 | 3.5% |
| 30 to 34 Minutes | 0 | 0.0% |
| 35 to 39 Minutes | 0 | 0.0% |
| 40 to 44 Minutes | 0 | 0.0% |
| 45 to 59 Minutes | 0 | 0.0% |
| 60 to 89 Minutes | 0 | 0.0% |
| 90 or more Minutes | 91 | 80.5% |
Commute Time by Sex in Freedom Acres
The most common commute times in Freedom Acres are 90 or more minutes (45 commuters, 71.4%) for males and 90 or more minutes (46 commuters, 92.0%) for females.
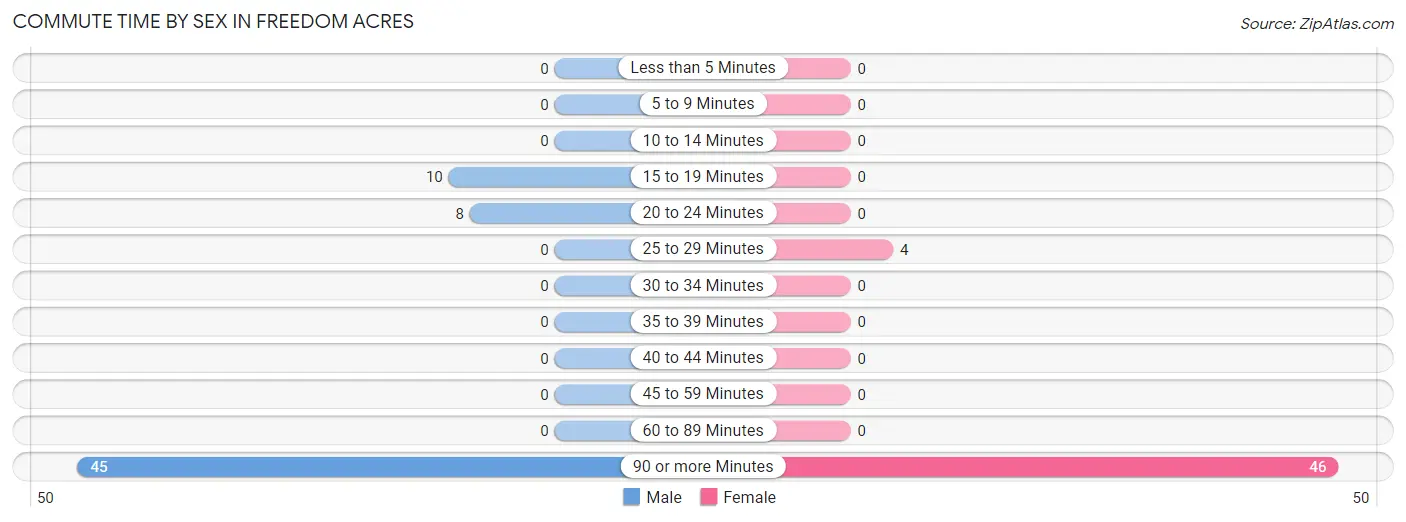
| Commute Time | Male | Female |
| Less than 5 Minutes | 0 (0.0%) | 0 (0.0%) |
| 5 to 9 Minutes | 0 (0.0%) | 0 (0.0%) |
| 10 to 14 Minutes | 0 (0.0%) | 0 (0.0%) |
| 15 to 19 Minutes | 10 (15.9%) | 0 (0.0%) |
| 20 to 24 Minutes | 8 (12.7%) | 0 (0.0%) |
| 25 to 29 Minutes | 0 (0.0%) | 4 (8.0%) |
| 30 to 34 Minutes | 0 (0.0%) | 0 (0.0%) |
| 35 to 39 Minutes | 0 (0.0%) | 0 (0.0%) |
| 40 to 44 Minutes | 0 (0.0%) | 0 (0.0%) |
| 45 to 59 Minutes | 0 (0.0%) | 0 (0.0%) |
| 60 to 89 Minutes | 0 (0.0%) | 0 (0.0%) |
| 90 or more Minutes | 45 (71.4%) | 46 (92.0%) |
Time of Departure to Work by Sex in Freedom Acres
The most frequent times of departure to work in Freedom Acres are 7:00 AM to 7:29 AM (32, 50.8%) for males and 7:00 AM to 7:29 AM (26, 52.0%) for females.
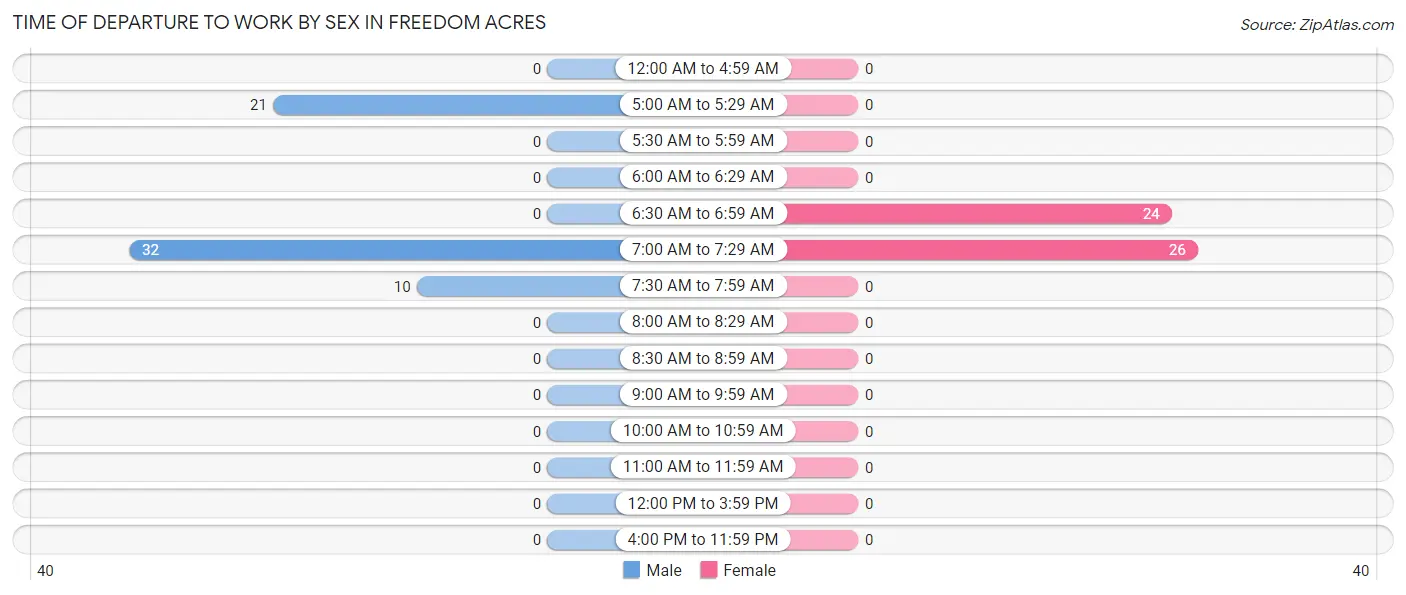
| Time of Departure | Male | Female |
| 12:00 AM to 4:59 AM | 0 (0.0%) | 0 (0.0%) |
| 5:00 AM to 5:29 AM | 21 (33.3%) | 0 (0.0%) |
| 5:30 AM to 5:59 AM | 0 (0.0%) | 0 (0.0%) |
| 6:00 AM to 6:29 AM | 0 (0.0%) | 0 (0.0%) |
| 6:30 AM to 6:59 AM | 0 (0.0%) | 24 (48.0%) |
| 7:00 AM to 7:29 AM | 32 (50.8%) | 26 (52.0%) |
| 7:30 AM to 7:59 AM | 10 (15.9%) | 0 (0.0%) |
| 8:00 AM to 8:29 AM | 0 (0.0%) | 0 (0.0%) |
| 8:30 AM to 8:59 AM | 0 (0.0%) | 0 (0.0%) |
| 9:00 AM to 9:59 AM | 0 (0.0%) | 0 (0.0%) |
| 10:00 AM to 10:59 AM | 0 (0.0%) | 0 (0.0%) |
| 11:00 AM to 11:59 AM | 0 (0.0%) | 0 (0.0%) |
| 12:00 PM to 3:59 PM | 0 (0.0%) | 0 (0.0%) |
| 4:00 PM to 11:59 PM | 0 (0.0%) | 0 (0.0%) |
| Total | 63 (100.0%) | 50 (100.0%) |
Housing Occupancy in Freedom Acres
Occupancy by Ownership in Freedom Acres
Of the total 47 dwellings in Freedom Acres, owner-occupied units account for 47 (100.0%), while renter-occupied units make up 0 (0.0%).
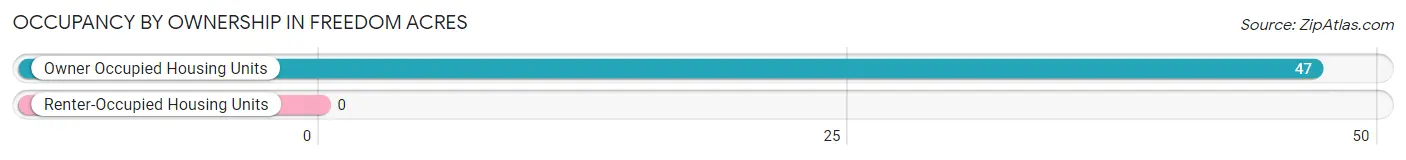
| Occupancy | # Housing Units | % Housing Units |
| Owner Occupied Housing Units | 47 | 100.0% |
| Renter-Occupied Housing Units | 0 | 0.0% |
| Total Occupied Housing Units | 47 | 100.0% |
Occupancy by Household Size in Freedom Acres
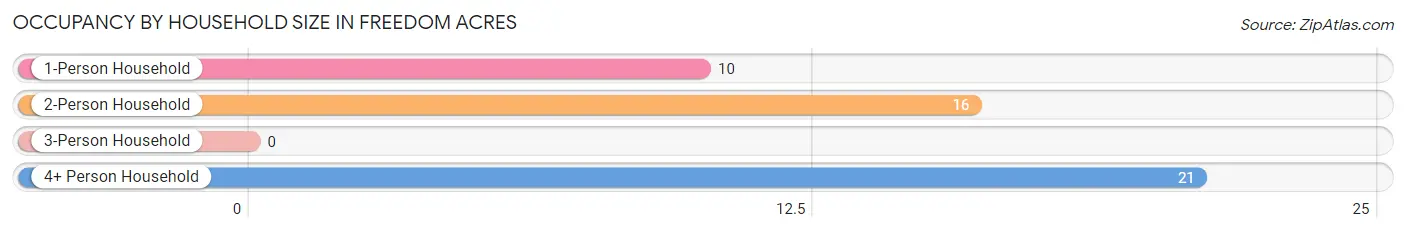
| Household Size | # Housing Units | % Housing Units |
| 1-Person Household | 10 | 21.3% |
| 2-Person Household | 16 | 34.0% |
| 3-Person Household | 0 | 0.0% |
| 4+ Person Household | 21 | 44.7% |
| Total Housing Units | 47 | 100.0% |
Occupancy by Ownership by Household Size in Freedom Acres
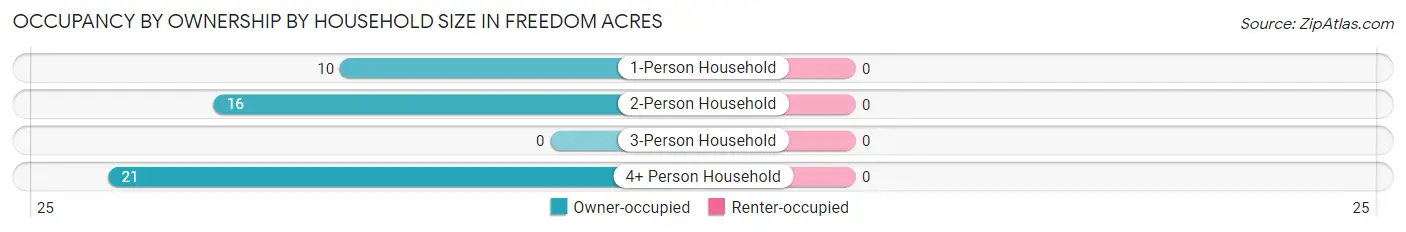
| Household Size | Owner-occupied | Renter-occupied |
| 1-Person Household | 10 (100.0%) | 0 (0.0%) |
| 2-Person Household | 16 (100.0%) | 0 (0.0%) |
| 3-Person Household | 0 (0.0%) | 0 (0.0%) |
| 4+ Person Household | 21 (100.0%) | 0 (0.0%) |
| Total Housing Units | 47 (100.0%) | 0 (0.0%) |
Occupancy by Educational Attainment in Freedom Acres
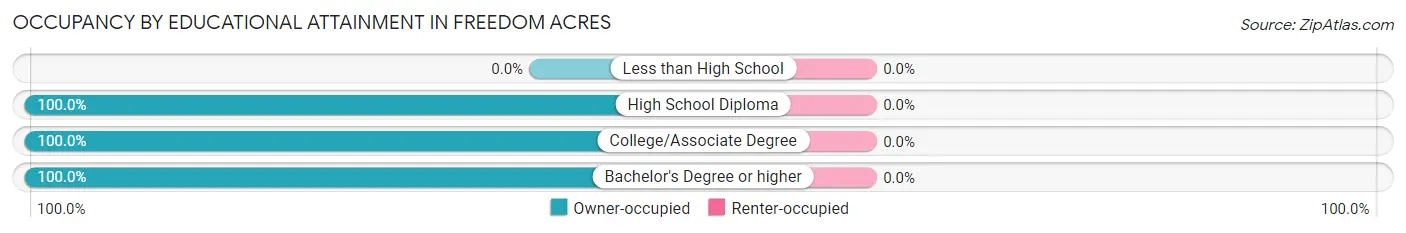
| Household Size | Owner-occupied | Renter-occupied |
| Less than High School | 0 (0.0%) | 0 (0.0%) |
| High School Diploma | 3 (100.0%) | 0 (0.0%) |
| College/Associate Degree | 34 (100.0%) | 0 (0.0%) |
| Bachelor's Degree or higher | 10 (100.0%) | 0 (0.0%) |
Occupancy by Age of Householder in Freedom Acres
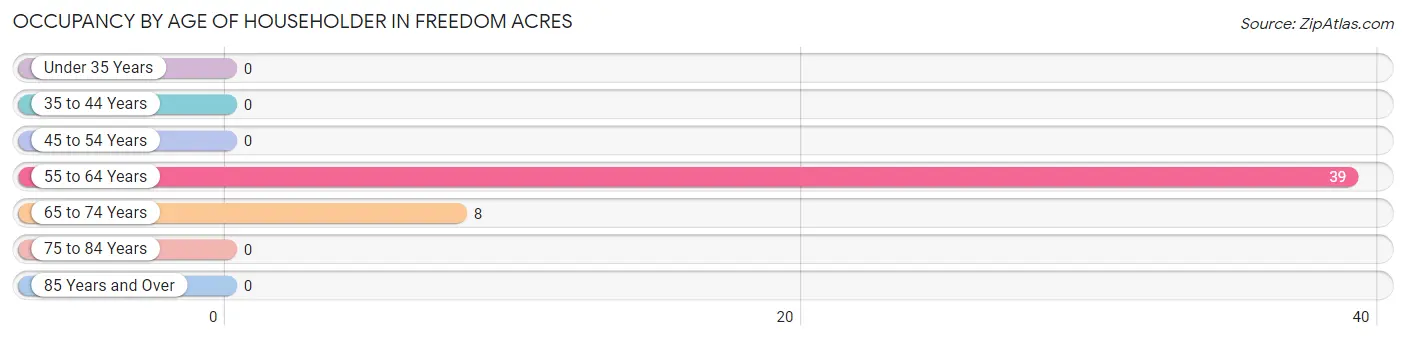
| Age Bracket | # Households | % Households |
| Under 35 Years | 0 | 0.0% |
| 35 to 44 Years | 0 | 0.0% |
| 45 to 54 Years | 0 | 0.0% |
| 55 to 64 Years | 39 | 83.0% |
| 65 to 74 Years | 8 | 17.0% |
| 75 to 84 Years | 0 | 0.0% |
| 85 Years and Over | 0 | 0.0% |
| Total | 47 | 100.0% |
Housing Finances in Freedom Acres
Median Income by Occupancy in Freedom Acres
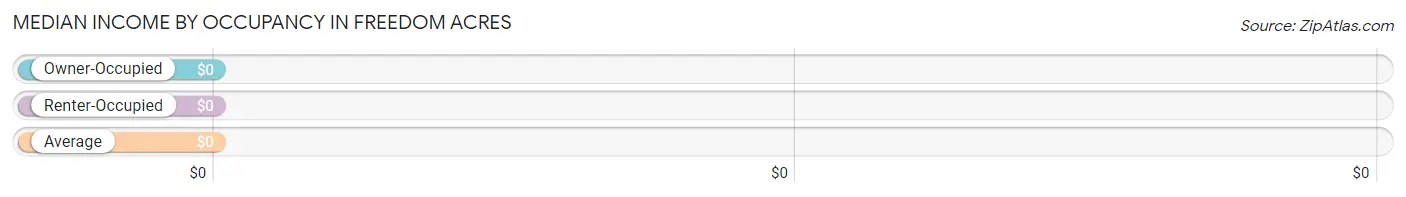
| Occupancy Type | # Households | Median Income |
| Owner-Occupied | 47 (100.0%) | $0 |
| Renter-Occupied | 0 (0.0%) | $0 |
| Average | 47 (100.0%) | $0 |
Occupancy by Householder Income Bracket in Freedom Acres
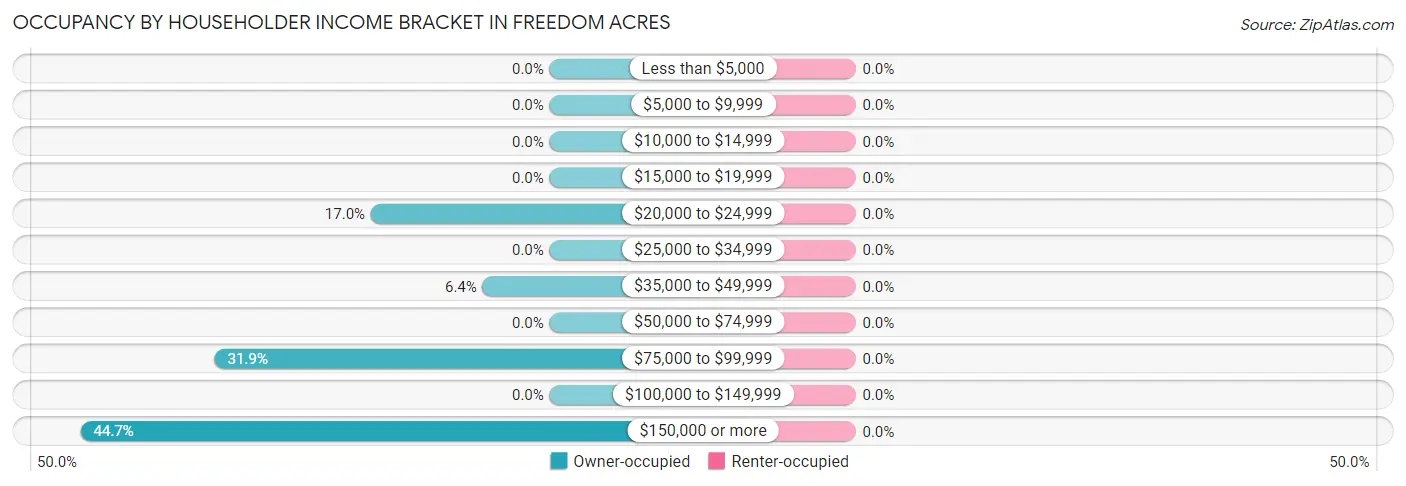
| Income Bracket | Owner-occupied | Renter-occupied |
| Less than $5,000 | 0 (0.0%) | 0 (0.0%) |
| $5,000 to $9,999 | 0 (0.0%) | 0 (0.0%) |
| $10,000 to $14,999 | 0 (0.0%) | 0 (0.0%) |
| $15,000 to $19,999 | 0 (0.0%) | 0 (0.0%) |
| $20,000 to $24,999 | 8 (17.0%) | 0 (0.0%) |
| $25,000 to $34,999 | 0 (0.0%) | 0 (0.0%) |
| $35,000 to $49,999 | 3 (6.4%) | 0 (0.0%) |
| $50,000 to $74,999 | 0 (0.0%) | 0 (0.0%) |
| $75,000 to $99,999 | 15 (31.9%) | 0 (0.0%) |
| $100,000 to $149,999 | 0 (0.0%) | 0 (0.0%) |
| $150,000 or more | 21 (44.7%) | 0 (0.0%) |
| Total | 47 (100.0%) | 0 (0.0%) |
Monthly Housing Cost Tiers in Freedom Acres
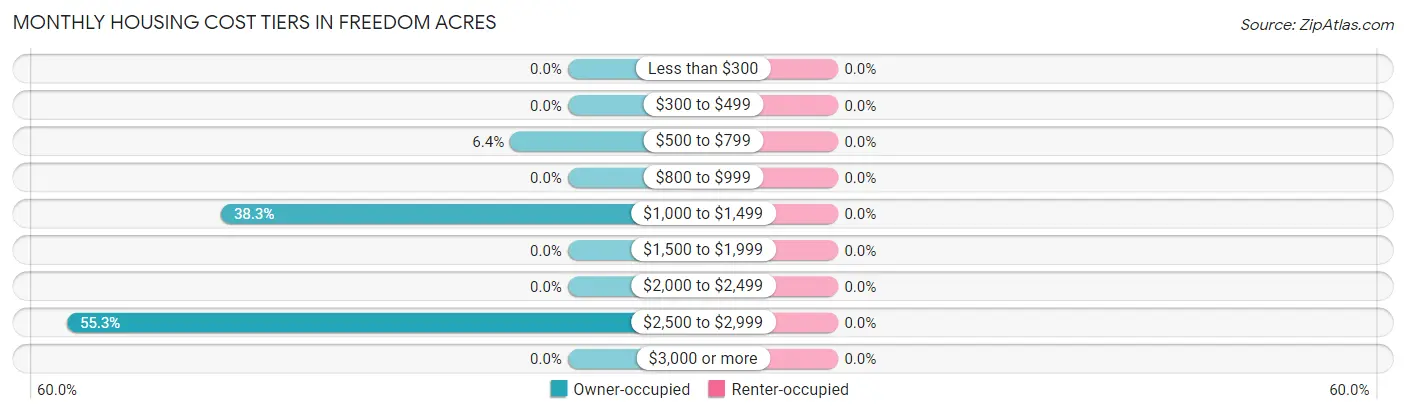
| Monthly Cost | Owner-occupied | Renter-occupied |
| Less than $300 | 0 (0.0%) | 0 (0.0%) |
| $300 to $499 | 0 (0.0%) | 0 (0.0%) |
| $500 to $799 | 3 (6.4%) | 0 (0.0%) |
| $800 to $999 | 0 (0.0%) | 0 (0.0%) |
| $1,000 to $1,499 | 18 (38.3%) | 0 (0.0%) |
| $1,500 to $1,999 | 0 (0.0%) | 0 (0.0%) |
| $2,000 to $2,499 | 0 (0.0%) | 0 (0.0%) |
| $2,500 to $2,999 | 26 (55.3%) | 0 (0.0%) |
| $3,000 or more | 0 (0.0%) | 0 (0.0%) |
| Total | 47 (100.0%) | 0 (0.0%) |
Physical Housing Characteristics in Freedom Acres
Housing Structures in Freedom Acres
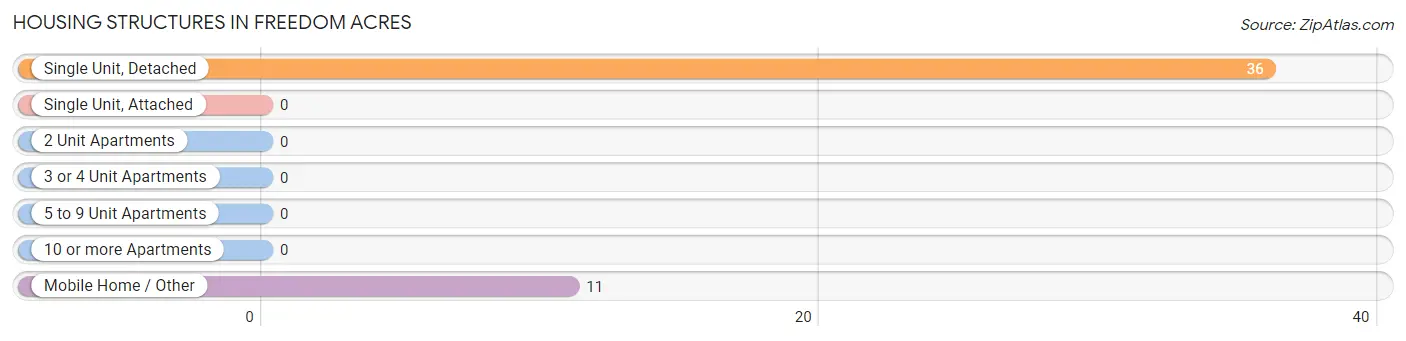
| Structure Type | # Housing Units | % Housing Units |
| Single Unit, Detached | 36 | 76.6% |
| Single Unit, Attached | 0 | 0.0% |
| 2 Unit Apartments | 0 | 0.0% |
| 3 or 4 Unit Apartments | 0 | 0.0% |
| 5 to 9 Unit Apartments | 0 | 0.0% |
| 10 or more Apartments | 0 | 0.0% |
| Mobile Home / Other | 11 | 23.4% |
| Total | 47 | 100.0% |
Housing Structures by Occupancy in Freedom Acres
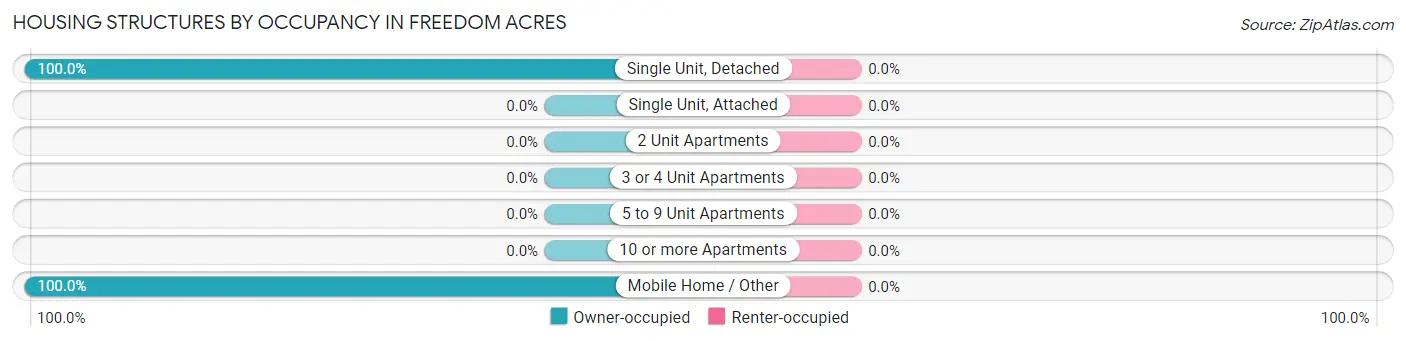
| Structure Type | Owner-occupied | Renter-occupied |
| Single Unit, Detached | 36 (100.0%) | 0 (0.0%) |
| Single Unit, Attached | 0 (0.0%) | 0 (0.0%) |
| 2 Unit Apartments | 0 (0.0%) | 0 (0.0%) |
| 3 or 4 Unit Apartments | 0 (0.0%) | 0 (0.0%) |
| 5 to 9 Unit Apartments | 0 (0.0%) | 0 (0.0%) |
| 10 or more Apartments | 0 (0.0%) | 0 (0.0%) |
| Mobile Home / Other | 11 (100.0%) | 0 (0.0%) |
| Total | 47 (100.0%) | 0 (0.0%) |
Housing Structures by Number of Rooms in Freedom Acres
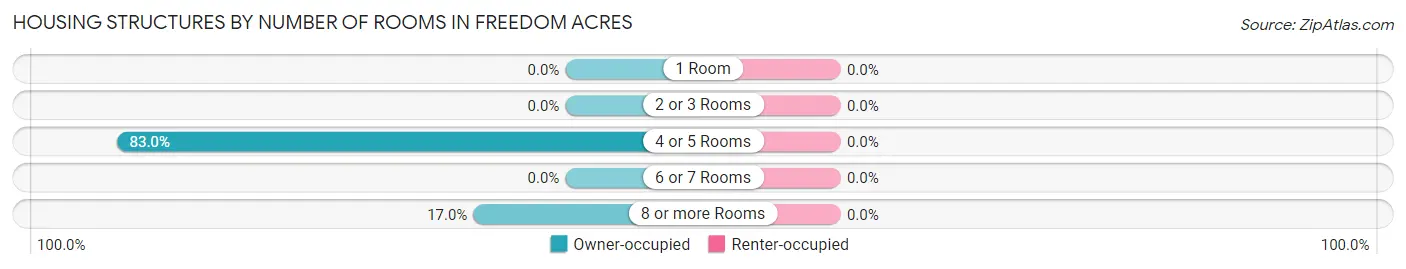
| Number of Rooms | Owner-occupied | Renter-occupied |
| 1 Room | 0 (0.0%) | 0 (0.0%) |
| 2 or 3 Rooms | 0 (0.0%) | 0 (0.0%) |
| 4 or 5 Rooms | 39 (83.0%) | 0 (0.0%) |
| 6 or 7 Rooms | 0 (0.0%) | 0 (0.0%) |
| 8 or more Rooms | 8 (17.0%) | 0 (0.0%) |
| Total | 47 (100.0%) | 0 (0.0%) |
Housing Structure by Heating Type in Freedom Acres
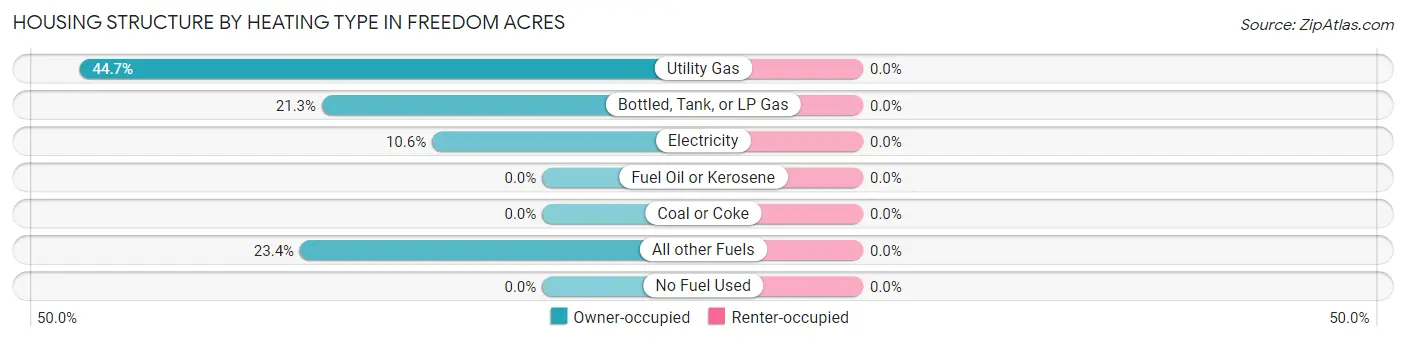
| Heating Type | Owner-occupied | Renter-occupied |
| Utility Gas | 21 (44.7%) | 0 (0.0%) |
| Bottled, Tank, or LP Gas | 10 (21.3%) | 0 (0.0%) |
| Electricity | 5 (10.6%) | 0 (0.0%) |
| Fuel Oil or Kerosene | 0 (0.0%) | 0 (0.0%) |
| Coal or Coke | 0 (0.0%) | 0 (0.0%) |
| All other Fuels | 11 (23.4%) | 0 (0.0%) |
| No Fuel Used | 0 (0.0%) | 0 (0.0%) |
| Total | 47 (100.0%) | 0 (0.0%) |
Household Vehicle Usage in Freedom Acres
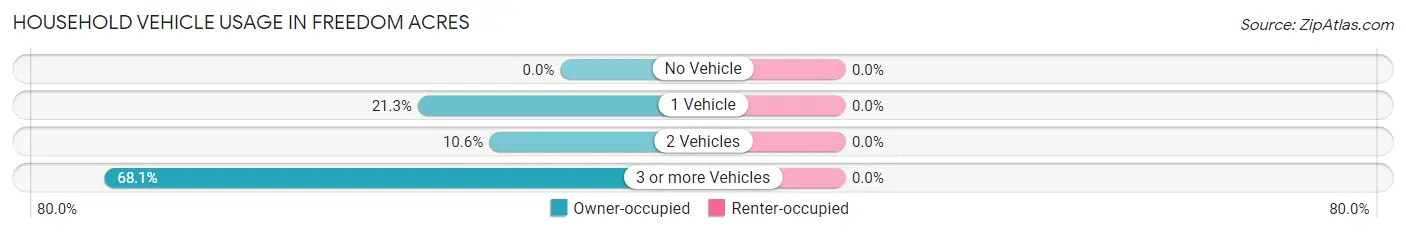
| Vehicles per Household | Owner-occupied | Renter-occupied |
| No Vehicle | 0 (0.0%) | 0 (0.0%) |
| 1 Vehicle | 10 (21.3%) | 0 (0.0%) |
| 2 Vehicles | 5 (10.6%) | 0 (0.0%) |
| 3 or more Vehicles | 32 (68.1%) | 0 (0.0%) |
| Total | 47 (100.0%) | 0 (0.0%) |
Real Estate & Mortgages in Freedom Acres
Real Estate and Mortgage Overview in Freedom Acres
| Characteristic | Without Mortgage | With Mortgage |
| Housing Units | 3 | 44 |
| Median Property Value | - | - |
| Median Household Income | - | - |
| Monthly Housing Costs | - | - |
| Real Estate Taxes | - | - |
Property Value by Mortgage Status in Freedom Acres
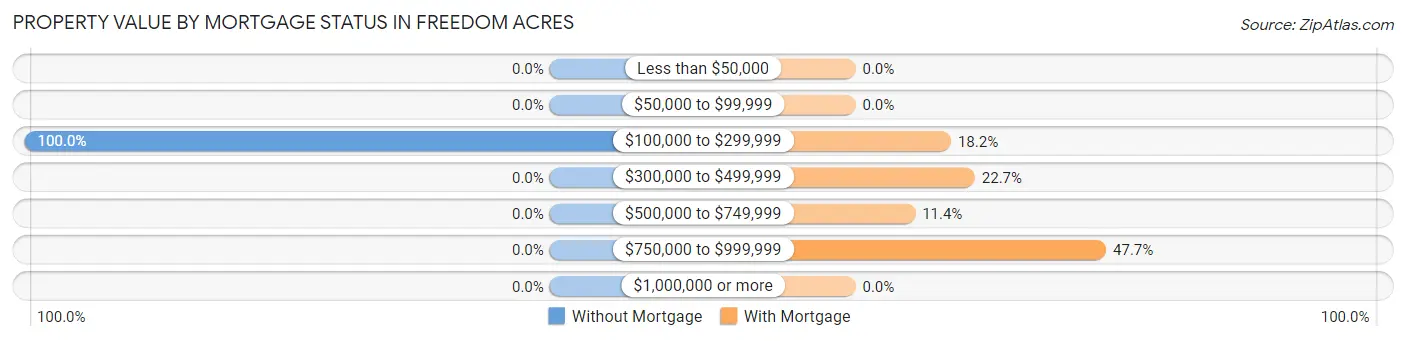
| Property Value | Without Mortgage | With Mortgage |
| Less than $50,000 | 0 (0.0%) | 0 (0.0%) |
| $50,000 to $99,999 | 0 (0.0%) | 0 (0.0%) |
| $100,000 to $299,999 | 3 (100.0%) | 8 (18.2%) |
| $300,000 to $499,999 | 0 (0.0%) | 10 (22.7%) |
| $500,000 to $749,999 | 0 (0.0%) | 5 (11.4%) |
| $750,000 to $999,999 | 0 (0.0%) | 21 (47.7%) |
| $1,000,000 or more | 0 (0.0%) | 0 (0.0%) |
| Total | 3 (100.0%) | 44 (100.0%) |
Household Income by Mortgage Status in Freedom Acres
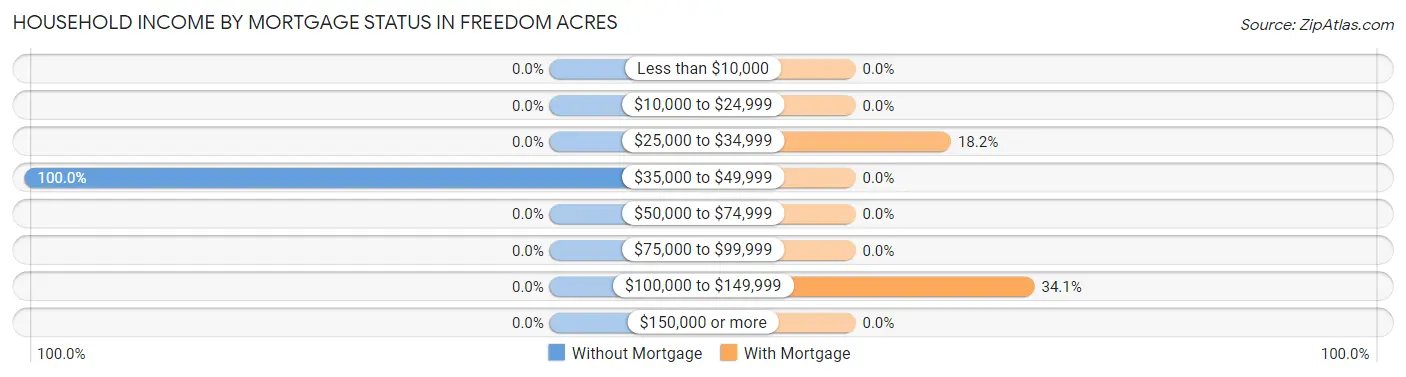
| Household Income | Without Mortgage | With Mortgage |
| Less than $10,000 | 0 (0.0%) | 0 (0.0%) |
| $10,000 to $24,999 | 0 (0.0%) | 0 (0.0%) |
| $25,000 to $34,999 | 0 (0.0%) | 8 (18.2%) |
| $35,000 to $49,999 | 3 (100.0%) | 0 (0.0%) |
| $50,000 to $74,999 | 0 (0.0%) | 0 (0.0%) |
| $75,000 to $99,999 | 0 (0.0%) | 0 (0.0%) |
| $100,000 to $149,999 | 0 (0.0%) | 15 (34.1%) |
| $150,000 or more | 0 (0.0%) | 0 (0.0%) |
| Total | 3 (100.0%) | 44 (100.0%) |
Property Value to Household Income Ratio in Freedom Acres
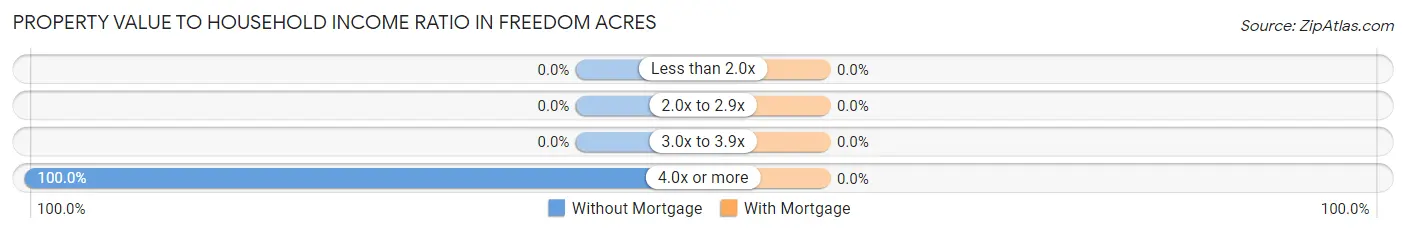
| Value-to-Income Ratio | Without Mortgage | With Mortgage |
| Less than 2.0x | 0 (0.0%) | 0 (0.0%) |
| 2.0x to 2.9x | 0 (0.0%) | 0 (0.0%) |
| 3.0x to 3.9x | 0 (0.0%) | 0 (0.0%) |
| 4.0x or more | 3 (100.0%) | 0 (0.0%) |
| Total | 3 (100.0%) | 44 (100.0%) |
Real Estate Taxes by Mortgage Status in Freedom Acres
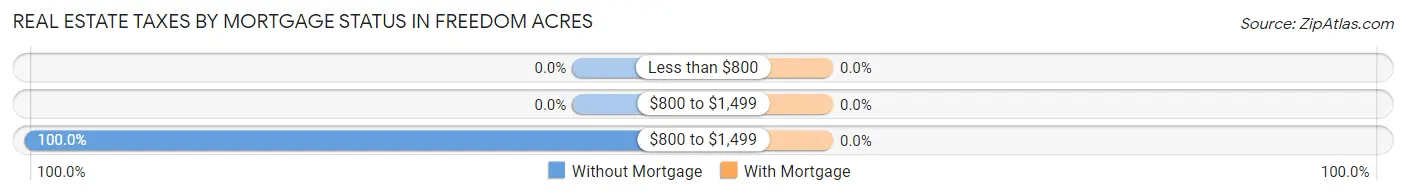
| Property Taxes | Without Mortgage | With Mortgage |
| Less than $800 | 0 (0.0%) | 0 (0.0%) |
| $800 to $1,499 | 0 (0.0%) | 0 (0.0%) |
| $800 to $1,499 | 3 (100.0%) | 0 (0.0%) |
| Total | 3 (100.0%) | 44 (100.0%) |
Health & Disability in Freedom Acres
Health Insurance Coverage by Age in Freedom Acres
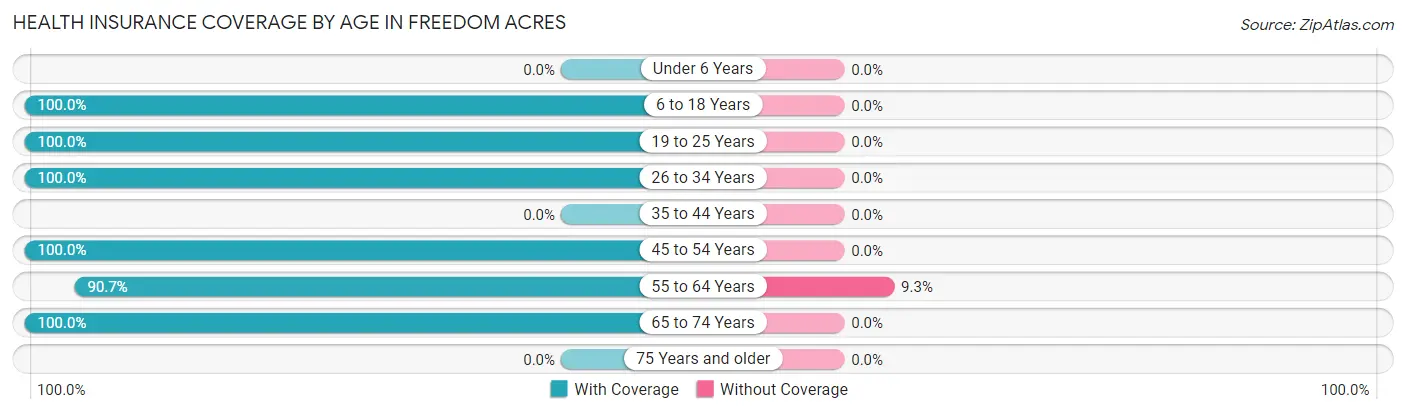
| Age Bracket | With Coverage | Without Coverage |
| Under 6 Years | 0 (0.0%) | 0 (0.0%) |
| 6 to 18 Years | 7 (100.0%) | 0 (0.0%) |
| 19 to 25 Years | 24 (100.0%) | 0 (0.0%) |
| 26 to 34 Years | 24 (100.0%) | 0 (0.0%) |
| 35 to 44 Years | 0 (0.0%) | 0 (0.0%) |
| 45 to 54 Years | 22 (100.0%) | 0 (0.0%) |
| 55 to 64 Years | 39 (90.7%) | 4 (9.3%) |
| 65 to 74 Years | 13 (100.0%) | 0 (0.0%) |
| 75 Years and older | 0 (0.0%) | 0 (0.0%) |
| Total | 129 (97.0%) | 4 (3.0%) |
Health Insurance Coverage by Citizenship Status in Freedom Acres
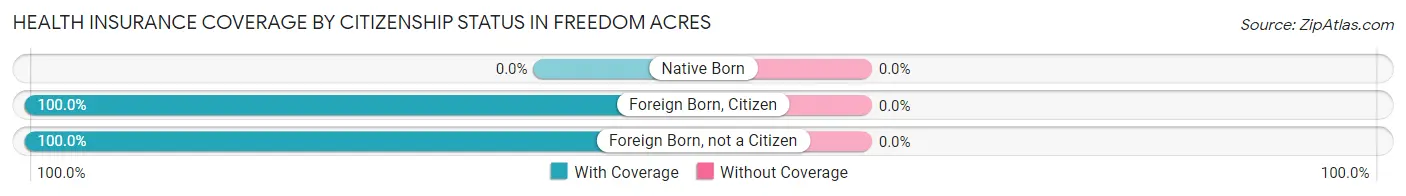
| Citizenship Status | With Coverage | Without Coverage |
| Native Born | 0 (0.0%) | 0 (0.0%) |
| Foreign Born, Citizen | 7 (100.0%) | 0 (0.0%) |
| Foreign Born, not a Citizen | 24 (100.0%) | 0 (0.0%) |
Health Insurance Coverage by Household Income in Freedom Acres
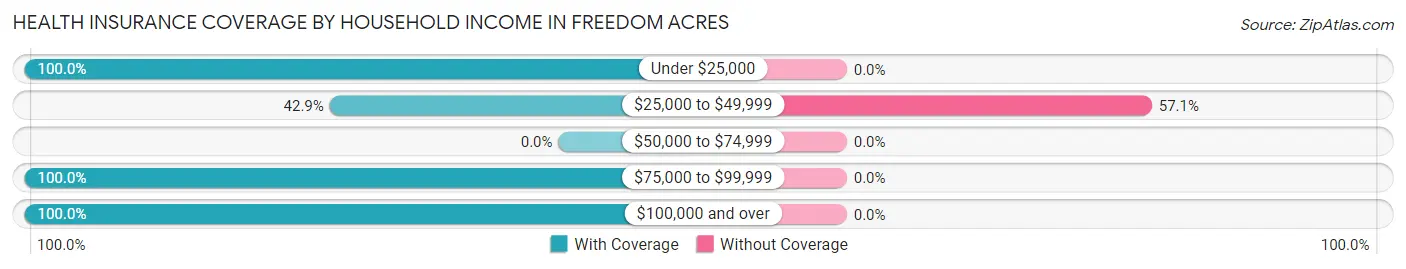
| Household Income | With Coverage | Without Coverage |
| Under $25,000 | 15 (100.0%) | 0 (0.0%) |
| $25,000 to $49,999 | 3 (42.9%) | 4 (57.1%) |
| $50,000 to $74,999 | 0 (0.0%) | 0 (0.0%) |
| $75,000 to $99,999 | 20 (100.0%) | 0 (0.0%) |
| $100,000 and over | 91 (100.0%) | 0 (0.0%) |
Public vs Private Health Insurance Coverage by Age in Freedom Acres
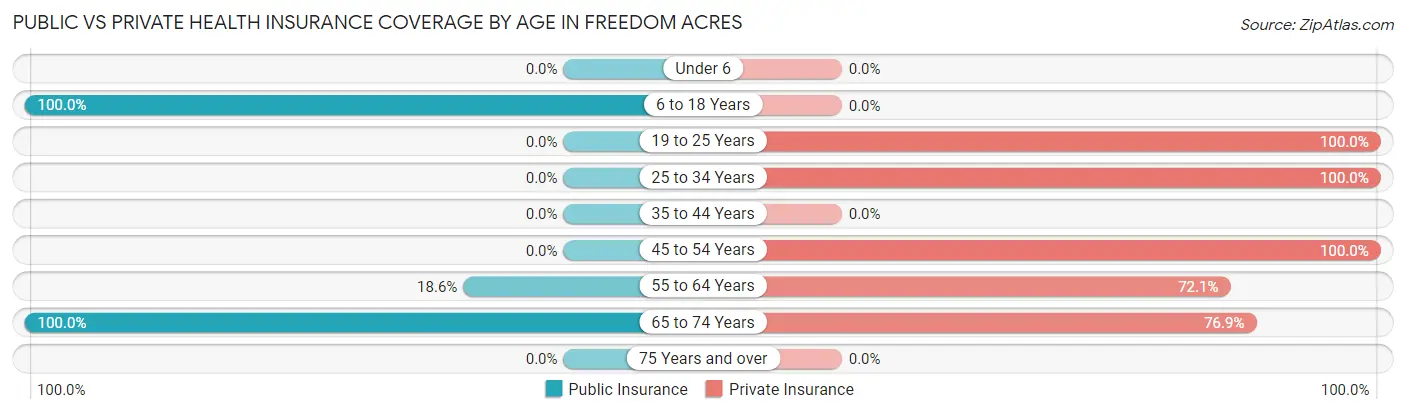
| Age Bracket | Public Insurance | Private Insurance |
| Under 6 | 0 (0.0%) | 0 (0.0%) |
| 6 to 18 Years | 7 (100.0%) | 0 (0.0%) |
| 19 to 25 Years | 0 (0.0%) | 24 (100.0%) |
| 25 to 34 Years | 0 (0.0%) | 24 (100.0%) |
| 35 to 44 Years | 0 (0.0%) | 0 (0.0%) |
| 45 to 54 Years | 0 (0.0%) | 22 (100.0%) |
| 55 to 64 Years | 8 (18.6%) | 31 (72.1%) |
| 65 to 74 Years | 13 (100.0%) | 10 (76.9%) |
| 75 Years and over | 0 (0.0%) | 0 (0.0%) |
| Total | 28 (21.0%) | 111 (83.5%) |
Disability Status by Sex by Age in Freedom Acres
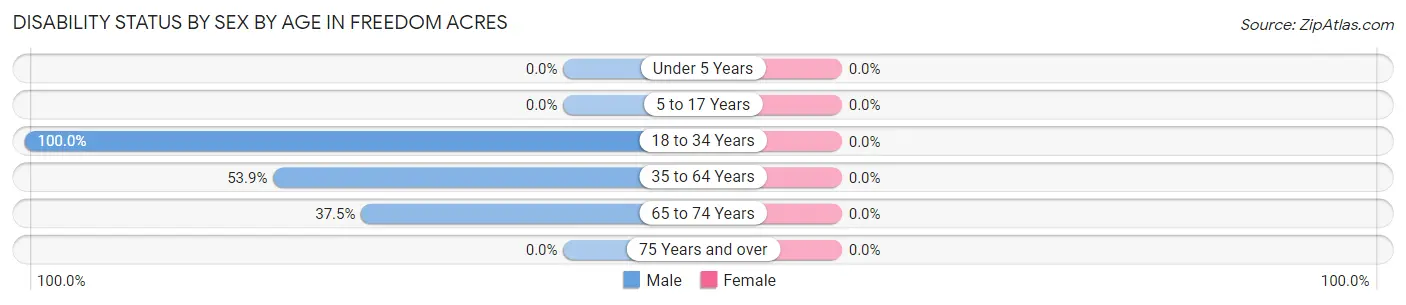
| Age Bracket | Male | Female |
| Under 5 Years | 0 (0.0%) | 0 (0.0%) |
| 5 to 17 Years | 0 (0.0%) | 0 (0.0%) |
| 18 to 34 Years | 24 (100.0%) | 0 (0.0%) |
| 35 to 64 Years | 21 (53.8%) | 0 (0.0%) |
| 65 to 74 Years | 3 (37.5%) | 0 (0.0%) |
| 75 Years and over | 0 (0.0%) | 0 (0.0%) |
Disability Class by Sex by Age in Freedom Acres
Disability Class: Hearing Difficulty

| Age Bracket | Male | Female |
| Under 5 Years | 0 (0.0%) | 0 (0.0%) |
| 5 to 17 Years | 0 (0.0%) | 0 (0.0%) |
| 18 to 34 Years | 24 (100.0%) | 0 (0.0%) |
| 35 to 64 Years | 0 (0.0%) | 0 (0.0%) |
| 65 to 74 Years | 0 (0.0%) | 0 (0.0%) |
| 75 Years and over | 0 (0.0%) | 0 (0.0%) |
Disability Class: Vision Difficulty
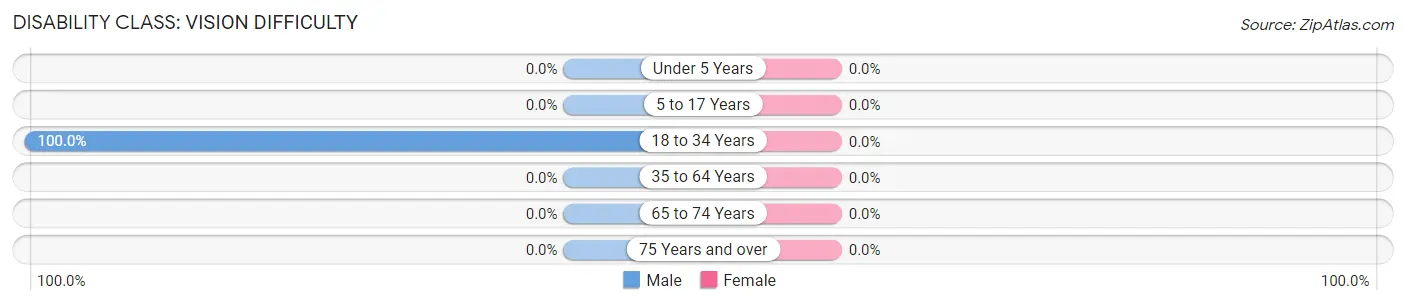
| Age Bracket | Male | Female |
| Under 5 Years | 0 (0.0%) | 0 (0.0%) |
| 5 to 17 Years | 0 (0.0%) | 0 (0.0%) |
| 18 to 34 Years | 24 (100.0%) | 0 (0.0%) |
| 35 to 64 Years | 0 (0.0%) | 0 (0.0%) |
| 65 to 74 Years | 0 (0.0%) | 0 (0.0%) |
| 75 Years and over | 0 (0.0%) | 0 (0.0%) |
Disability Class: Cognitive Difficulty

| Age Bracket | Male | Female |
| 5 to 17 Years | 0 (0.0%) | 0 (0.0%) |
| 18 to 34 Years | 24 (100.0%) | 0 (0.0%) |
| 35 to 64 Years | 0 (0.0%) | 0 (0.0%) |
| 65 to 74 Years | 0 (0.0%) | 0 (0.0%) |
| 75 Years and over | 0 (0.0%) | 0 (0.0%) |
Disability Class: Ambulatory Difficulty
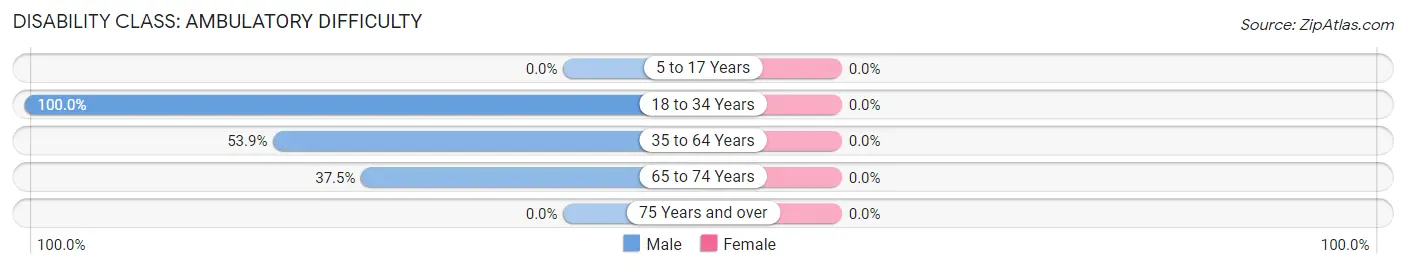
| Age Bracket | Male | Female |
| 5 to 17 Years | 0 (0.0%) | 0 (0.0%) |
| 18 to 34 Years | 24 (100.0%) | 0 (0.0%) |
| 35 to 64 Years | 21 (53.8%) | 0 (0.0%) |
| 65 to 74 Years | 3 (37.5%) | 0 (0.0%) |
| 75 Years and over | 0 (0.0%) | 0 (0.0%) |
Disability Class: Self-Care Difficulty
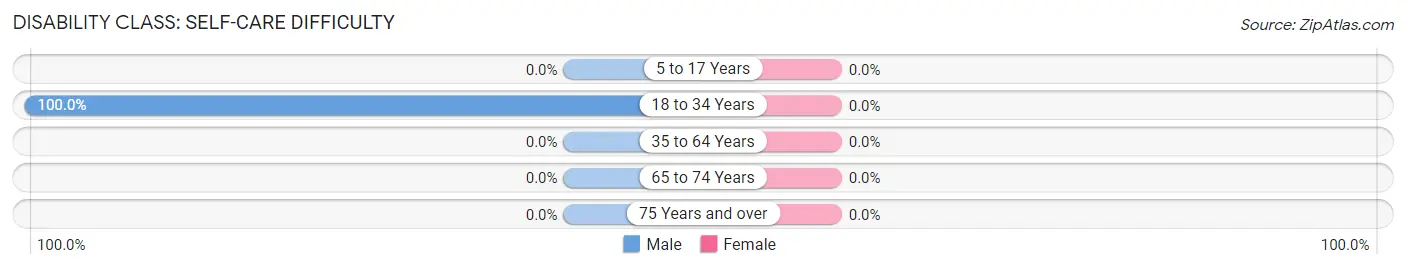
| Age Bracket | Male | Female |
| 5 to 17 Years | 0 (0.0%) | 0 (0.0%) |
| 18 to 34 Years | 24 (100.0%) | 0 (0.0%) |
| 35 to 64 Years | 0 (0.0%) | 0 (0.0%) |
| 65 to 74 Years | 0 (0.0%) | 0 (0.0%) |
| 75 Years and over | 0 (0.0%) | 0 (0.0%) |
Technology Access in Freedom Acres
Computing Device Access in Freedom Acres
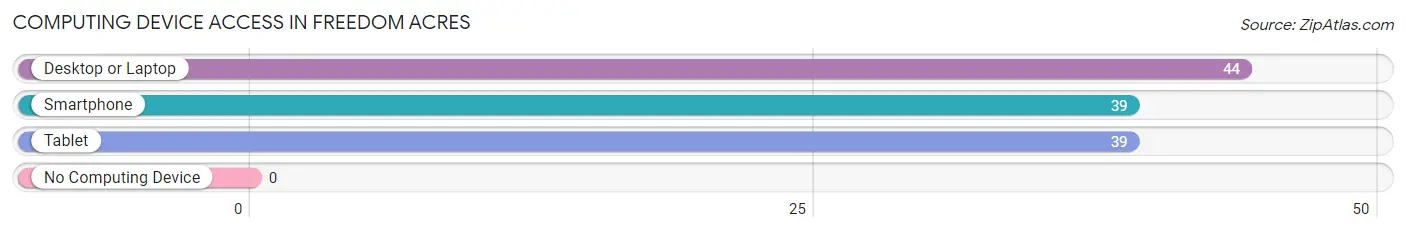
| Device Type | # Households | % Households |
| Desktop or Laptop | 44 | 93.6% |
| Smartphone | 39 | 83.0% |
| Tablet | 39 | 83.0% |
| No Computing Device | 0 | 0.0% |
| Total | 47 | 100.0% |
Internet Access in Freedom Acres
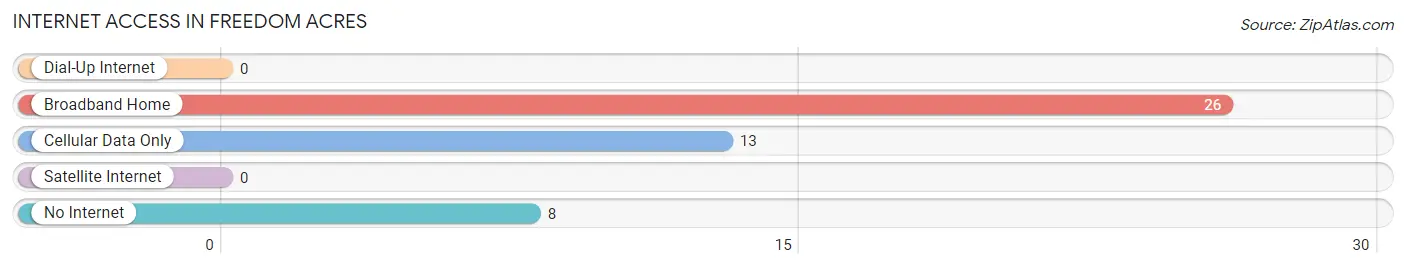
| Internet Type | # Households | % Households |
| Dial-Up Internet | 0 | 0.0% |
| Broadband Home | 26 | 55.3% |
| Cellular Data Only | 13 | 27.7% |
| Satellite Internet | 0 | 0.0% |
| No Internet | 8 | 17.0% |
| Total | 47 | 100.0% |
Freedom Acres Summary
Freedom Acres, Arizona is a small unincorporated community located in the far northwest corner of the state, near the Utah border. It is situated in the high desert of the Colorado Plateau, at an elevation of 5,400 feet. The area is sparsely populated, with a population of just over 200 people as of the 2010 census.
History
The area that is now Freedom Acres was first settled in the late 1800s by Mormon pioneers. The town was originally known as Freedom, and was founded in 1891 by a group of settlers from Utah. The town was named after the freedom of religion that the settlers enjoyed in the area.
In the early 1900s, the town began to grow and prosper. The town was home to a number of businesses, including a general store, a blacksmith shop, a hotel, and a post office. The town also had a school, which was attended by children from the surrounding area.
In the 1950s, the town began to decline as the population moved away to larger cities. By the 1970s, the town had become a virtual ghost town. In the 1980s, the town was renamed Freedom Acres, and the population began to slowly increase.
Geography
Freedom Acres is located in the far northwest corner of Arizona, near the Utah border. It is situated in the high desert of the Colorado Plateau, at an elevation of 5,400 feet. The area is sparsely populated, with a population of just over 200 people as of the 2010 census.
The town is located in a remote area, surrounded by vast expanses of desert and mountains. The nearest major city is St. George, Utah, which is about 50 miles away. The nearest airport is located in Flagstaff, Arizona, which is about 150 miles away.
The climate in Freedom Acres is arid and semi-arid, with hot summers and cold winters. The average annual temperature is around 60 degrees Fahrenheit. The area receives an average of 8 inches of precipitation per year.
Economy
The economy of Freedom Acres is largely based on agriculture and tourism. The town is home to a number of small farms, which produce a variety of crops, including alfalfa, hay, and wheat. The town also has a number of small businesses, including a general store, a gas station, and a restaurant.
The town is also a popular tourist destination, due to its remote location and scenic beauty. The area is home to a number of outdoor activities, including hiking, camping, and fishing. The town also hosts a number of festivals and events throughout the year, including the Freedom Acres Music Festival and the Freedom Acres Rodeo.
Demographics
As of the 2010 census, the population of Freedom Acres was just over 200 people. The racial makeup of the town was 95.5% White, 0.5% African American, 0.5% Native American, 0.5% Asian, and 3% from other races. The median household income was $35,000, and the median age was 44 years.
Conclusion
Freedom Acres, Arizona is a small unincorporated community located in the far northwest corner of the state, near the Utah border. It is situated in the high desert of the Colorado Plateau, at an elevation of 5,400 feet. The area is sparsely populated, with a population of just over 200 people as of the 2010 census. The town was originally founded in 1891 by Mormon pioneers, and was named after the freedom of religion that the settlers enjoyed in the area. The economy of Freedom Acres is largely based on agriculture and tourism, and the town is a popular tourist destination due to its remote location and scenic beauty. The population of Freedom Acres is predominantly White, with a median household income of $35,000 and a median age of 44 years.
Common Questions
What is Per Capita Income in Freedom Acres?
Per Capita income in Freedom Acres is $37,980.
What is the Median Family Income in Freedom Acres?
Median Family Income in Freedom Acres is $152,798.
What is Inequality or Gini Index in Freedom Acres?
Inequality or Gini Index in Freedom Acres is 0.25.
What is the Total Population of Freedom Acres?
Total Population of Freedom Acres is 133.
What is the Total Male Population of Freedom Acres?
Total Male Population of Freedom Acres is 71.
What is the Total Female Population of Freedom Acres?
Total Female Population of Freedom Acres is 62.
What is the Ratio of Males per 100 Females in Freedom Acres?
There are 114.52 Males per 100 Females in Freedom Acres.
What is the Ratio of Females per 100 Males in Freedom Acres?
There are 87.32 Females per 100 Males in Freedom Acres.
What is the Median Population Age in Freedom Acres?
Median Population Age in Freedom Acres is 51.5 Years.
What is the Average Family Size in Freedom Acres
Average Family Size in Freedom Acres is 3.3 People.
What is the Average Household Size in Freedom Acres
Average Household Size in Freedom Acres is 2.8 People.
How Large is the Labor Force in Freedom Acres?
There are 113 People in the Labor Forcein in Freedom Acres.
What is the Percentage of People in the Labor Force in Freedom Acres?
89.7% of People are in the Labor Force in Freedom Acres.