Zip Codes with the Highest Percentage of Population with a Degree in Engineering in the United States
RELATED REPORTS & OPTIONS
Engineering
United States
Compare Zip Codes
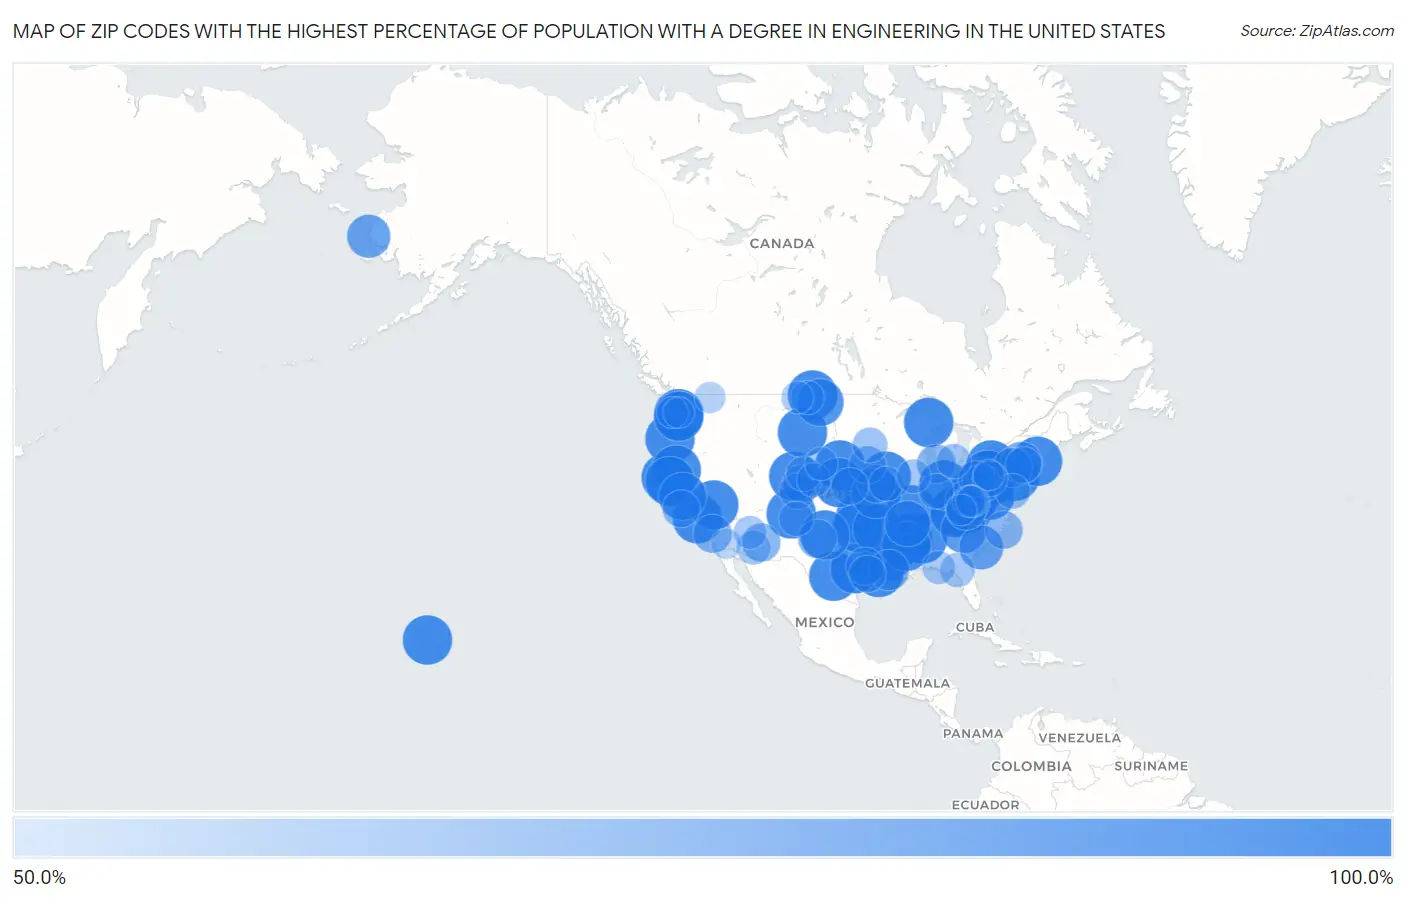
Map of Zip Codes with the Highest Percentage of Population with a Degree in Engineering in the United States
50.0%
100.0%
Zip Codes with the Highest Percentage of Population with a Degree in Engineering in the United States
| Zip Code | % Graduates | vs State | vs National | |
| 1. | 93266 | 100.0% | 9.9%(+90.1)#1 | 7.6%(+92.4)#1 |
| 2. | 71497 | 100.0% | 6.2%(+93.8)#1 | 7.6%(+92.4)#2 |
| 3. | 98447 | 100.0% | 9.8%(+90.2)#1 | 7.6%(+92.4)#3 |
| 4. | 26137 | 100.0% | 5.0%(+95.0)#1 | 7.6%(+92.4)#4 |
| 5. | 25185 | 100.0% | 5.0%(+95.0)#2 | 7.6%(+92.4)#5 |
| 6. | 95537 | 100.0% | 9.9%(+90.1)#2 | 7.6%(+92.4)#6 |
| 7. | 15951 | 100.0% | 6.7%(+93.3)#1 | 7.6%(+92.4)#7 |
| 8. | 78843 | 100.0% | 9.5%(+90.5)#1 | 7.6%(+92.4)#8 |
| 9. | 74078 | 100.0% | 5.4%(+94.6)#1 | 7.6%(+92.4)#9 |
| 10. | 77661 | 100.0% | 9.5%(+90.5)#2 | 7.6%(+92.4)#10 |
| 11. | 16843 | 100.0% | 6.7%(+93.3)#2 | 7.6%(+92.4)#11 |
| 12. | 26422 | 100.0% | 5.0%(+95.0)#3 | 7.6%(+92.4)#12 |
| 13. | 87551 | 100.0% | 7.6%(+92.4)#1 | 7.6%(+92.4)#13 |
| 14. | 96858 | 100.0% | 6.5%(+93.5)#1 | 7.6%(+92.4)#14 |
| 15. | 38928 | 100.0% | 4.7%(+95.3)#1 | 7.6%(+92.4)#15 |
| 16. | 18063 | 100.0% | 6.7%(+93.3)#3 | 7.6%(+92.4)#16 |
| 17. | 38844 | 100.0% | 4.7%(+95.3)#2 | 7.6%(+92.4)#17 |
| 18. | 41775 | 100.0% | 5.5%(+94.5)#1 | 7.6%(+92.4)#18 |
| 19. | 16727 | 100.0% | 6.7%(+93.3)#4 | 7.6%(+92.4)#19 |
| 20. | 89047 | 100.0% | 6.9%(+93.1)#1 | 7.6%(+92.4)#20 |
| 21. | 78712 | 100.0% | 9.5%(+90.5)#3 | 7.6%(+92.4)#21 |
| 22. | 25048 | 100.0% | 5.0%(+95.0)#4 | 7.6%(+92.4)#22 |
| 23. | 63774 | 100.0% | 5.6%(+94.4)#1 | 7.6%(+92.4)#23 |
| 24. | 97357 | 100.0% | 7.0%(+93.0)#1 | 7.6%(+92.4)#24 |
| 25. | 73070 | 100.0% | 5.4%(+94.6)#2 | 7.6%(+92.4)#25 |
| 26. | 24881 | 100.0% | 5.0%(+95.0)#5 | 7.6%(+92.4)#26 |
| 27. | 15492 | 100.0% | 6.7%(+93.3)#5 | 7.6%(+92.4)#27 |
| 28. | 40939 | 100.0% | 5.5%(+94.5)#2 | 7.6%(+92.4)#28 |
| 29. | 96037 | 100.0% | 9.9%(+90.1)#3 | 7.6%(+92.4)#29 |
| 30. | 49833 | 100.0% | 10.0%(+90.0)#1 | 7.6%(+92.4)#30 |
| 31. | 95514 | 100.0% | 9.9%(+90.1)#4 | 7.6%(+92.4)#31 |
| 32. | 74947 | 100.0% | 5.4%(+94.6)#3 | 7.6%(+92.4)#32 |
| 33. | 79032 | 100.0% | 9.5%(+90.5)#4 | 7.6%(+92.4)#33 |
| 34. | 39115 | 100.0% | 4.7%(+95.3)#3 | 7.6%(+92.4)#34 |
| 35. | 58844 | 100.0% | 5.2%(+94.8)#1 | 7.6%(+92.4)#35 |
| 36. | 68821 | 100.0% | 4.2%(+95.8)#1 | 7.6%(+92.4)#36 |
| 37. | 15689 | 100.0% | 6.7%(+93.3)#6 | 7.6%(+92.4)#37 |
| 38. | 15780 | 100.0% | 6.7%(+93.3)#7 | 7.6%(+92.4)#38 |
| 39. | 98558 | 100.0% | 9.8%(+90.2)#2 | 7.6%(+92.4)#39 |
| 40. | 22845 | 100.0% | 7.9%(+92.1)#1 | 7.6%(+92.4)#40 |
| 41. | 80434 | 100.0% | 8.3%(+91.7)#1 | 7.6%(+92.4)#41 |
| 42. | 01094 | 100.0% | 8.7%(+91.3)#1 | 7.6%(+92.4)#42 |
| 43. | 47366 | 100.0% | 6.6%(+93.4)#1 | 7.6%(+92.4)#43 |
| 44. | 50165 | 100.0% | 5.6%(+94.4)#1 | 7.6%(+92.4)#44 |
| 45. | 59316 | 100.0% | 5.5%(+94.5)#1 | 7.6%(+92.4)#45 |
| 46. | 68946 | 100.0% | 4.2%(+95.8)#2 | 7.6%(+92.4)#46 |
| 47. | 66251 | 100.0% | 5.8%(+94.2)#1 | 7.6%(+92.4)#47 |
| 48. | 95653 | 95.7% | 9.9%(+85.7)#5 | 7.6%(+88.0)#48 |
| 49. | 58776 | 94.7% | 5.2%(+89.5)#2 | 7.6%(+87.1)#49 |
| 50. | 29613 | 91.5% | 7.0%(+84.5)#1 | 7.6%(+83.8)#50 |
| 51. | 72391 | 90.9% | 4.7%(+86.2)#1 | 7.6%(+83.3)#51 |
| 52. | 25108 | 89.2% | 5.0%(+84.2)#6 | 7.6%(+81.6)#52 |
| 53. | 29424 | 87.5% | 7.0%(+80.5)#2 | 7.6%(+79.9)#53 |
| 54. | 99604 | 85.7% | 7.2%(+78.5)#1 | 7.6%(+78.1)#54 |
| 55. | 12452 | 81.2% | 5.6%(+75.6)#1 | 7.6%(+73.6)#55 |
| 56. | 70646 | 80.0% | 6.2%(+73.8)#2 | 7.6%(+72.4)#56 |
| 57. | 24646 | 78.4% | 7.9%(+70.4)#2 | 7.6%(+70.7)#57 |
| 58. | 18820 | 76.9% | 6.7%(+70.2)#8 | 7.6%(+69.3)#58 |
| 59. | 88113 | 75.0% | 7.6%(+67.4)#2 | 7.6%(+67.4)#59 |
| 60. | 49084 | 75.0% | 10.0%(+65.0)#2 | 7.6%(+67.4)#60 |
| 61. | 93563 | 74.5% | 9.9%(+64.6)#6 | 7.6%(+66.9)#61 |
| 62. | 85532 | 74.3% | 8.0%(+66.3)#1 | 7.6%(+66.6)#62 |
| 63. | 15450 | 74.2% | 6.7%(+67.5)#9 | 7.6%(+66.6)#63 |
| 64. | 64480 | 73.6% | 5.6%(+68.0)#2 | 7.6%(+65.9)#64 |
| 65. | 28533 | 73.3% | 6.7%(+66.6)#1 | 7.6%(+65.7)#65 |
| 66. | 77843 | 73.3% | 9.5%(+63.7)#5 | 7.6%(+65.6)#66 |
| 67. | 80310 | 72.7% | 8.3%(+64.5)#2 | 7.6%(+65.1)#67 |
| 68. | 51010 | 72.0% | 5.6%(+66.4)#2 | 7.6%(+64.4)#68 |
| 69. | 94021 | 71.8% | 9.9%(+61.9)#7 | 7.6%(+64.1)#69 |
| 70. | 66941 | 71.4% | 5.8%(+65.6)#2 | 7.6%(+63.8)#70 |
| 71. | 77464 | 70.6% | 9.5%(+61.0)#6 | 7.6%(+62.9)#71 |
| 72. | 12453 | 69.2% | 5.6%(+63.5)#2 | 7.6%(+61.5)#72 |
| 73. | 80432 | 68.9% | 8.3%(+60.6)#3 | 7.6%(+61.2)#73 |
| 74. | 43961 | 68.4% | 7.4%(+61.0)#1 | 7.6%(+60.8)#74 |
| 75. | 82005 | 66.7% | 6.9%(+59.8)#1 | 7.6%(+59.0)#75 |
| 76. | 19936 | 66.7% | 6.8%(+59.8)#1 | 7.6%(+59.0)#76 |
| 77. | 47435 | 66.7% | 6.6%(+60.0)#2 | 7.6%(+59.0)#77 |
| 78. | 15760 | 66.7% | 6.7%(+59.9)#10 | 7.6%(+59.0)#78 |
| 79. | 56125 | 66.7% | 6.3%(+60.4)#1 | 7.6%(+59.0)#79 |
| 80. | 87582 | 66.0% | 7.6%(+58.5)#3 | 7.6%(+58.4)#80 |
| 81. | 64646 | 65.5% | 5.6%(+59.9)#3 | 7.6%(+57.9)#81 |
| 82. | 48143 | 65.5% | 10.0%(+55.5)#3 | 7.6%(+57.8)#82 |
| 83. | 32013 | 65.2% | 7.7%(+57.5)#1 | 7.6%(+57.6)#83 |
| 84. | 85172 | 64.9% | 8.0%(+56.9)#2 | 7.6%(+57.2)#84 |
| 85. | 61562 | 64.3% | 7.1%(+57.2)#1 | 7.6%(+56.6)#85 |
| 86. | 80750 | 63.9% | 8.3%(+55.6)#4 | 7.6%(+56.2)#86 |
| 87. | 59211 | 63.2% | 5.5%(+57.7)#2 | 7.6%(+55.5)#87 |
| 88. | 32437 | 62.5% | 7.7%(+54.8)#2 | 7.6%(+54.9)#88 |
| 89. | 86313 | 62.1% | 8.0%(+54.1)#3 | 7.6%(+54.4)#89 |
| 90. | 69351 | 62.1% | 4.2%(+57.9)#3 | 7.6%(+54.4)#90 |
| 91. | 25173 | 60.9% | 5.0%(+55.8)#7 | 7.6%(+53.2)#91 |
| 92. | 59253 | 60.0% | 5.5%(+54.5)#3 | 7.6%(+52.4)#92 |
| 93. | 25529 | 59.1% | 5.0%(+54.1)#8 | 7.6%(+51.4)#93 |
| 94. | 98560 | 58.3% | 9.8%(+48.5)#3 | 7.6%(+50.7)#94 |
| 95. | 25061 | 57.9% | 5.0%(+52.9)#9 | 7.6%(+50.2)#95 |
| 96. | 99151 | 57.7% | 9.8%(+47.9)#4 | 7.6%(+50.0)#96 |
| 97. | 98416 | 57.1% | 9.8%(+47.3)#5 | 7.6%(+49.5)#97 |
| 98. | 41825 | 57.1% | 5.5%(+51.6)#3 | 7.6%(+49.5)#98 |
| 99. | 15863 | 57.1% | 6.7%(+50.4)#11 | 7.6%(+49.5)#99 |
| 100. | 92275 | 56.2% | 9.9%(+46.3)#8 | 7.6%(+48.6)#100 |
Common Questions
What are the Top 10 Zip Codes with the Highest Percentage of Population with a Degree in Engineering in the United States?
Top 10 Zip Codes with the Highest Percentage of Population with a Degree in Engineering in the United States are:
#1
100.0%
#2
100.0%
#3
100.0%
#4
100.0%
#5
100.0%
#6
100.0%
#7
100.0%
#8
100.0%
#9
100.0%
#10
100.0%
What zip code has the Highest Percentage of Population with a Degree in Engineering in the United States?
93266 has the Highest Percentage of Population with a Degree in Engineering in the United States with 100.0%.
What is the Percentage of Population with a Degree in Engineering in the United States?
Percentage of Population with a Degree in Engineering in the United States is 7.6%.