Hunters Creek, FL Map & Demographics
Hunters Creek Map
Hunters Creek Overview
$39,396
PER CAPITA INCOME
$96,544
AVG FAMILY INCOME
$92,053
AVG HOUSEHOLD INCOME
37.5%
WAGE / INCOME GAP [ % ]
62.5¢/ $1
WAGE / INCOME GAP [ $ ]
$12,162
FAMILY INCOME DEFICIT
0.39
INEQUALITY / GINI INDEX
19,895
TOTAL POPULATION
9,640
MALE POPULATION
10,255
FEMALE POPULATION
94.00
MALES / 100 FEMALES
106.38
FEMALES / 100 MALES
39.0
MEDIAN AGE
3.4
AVG FAMILY SIZE
3.0
AVG HOUSEHOLD SIZE
11,592
LABOR FORCE [ PEOPLE ]
71.5%
PERCENT IN LABOR FORCE
4.4%
UNEMPLOYMENT RATE
Income in Hunters Creek
Income Overview in Hunters Creek
Per Capita Income in Hunters Creek is $39,396, while median incomes of families and households are $96,544 and $92,053 respectively.
| Characteristic | Number | Measure |
| Per Capita Income | 19,895 | $39,396 |
| Median Family Income | 5,142 | $96,544 |
| Mean Family Income | 5,142 | $114,270 |
| Median Household Income | 6,620 | $92,053 |
| Mean Household Income | 6,620 | $113,185 |
| Income Deficit | 5,142 | $12,162 |
| Wage / Income Gap (%) | 19,895 | 37.50% |
| Wage / Income Gap ($) | 19,895 | 62.50¢ per $1 |
| Gini / Inequality Index | 19,895 | 0.39 |
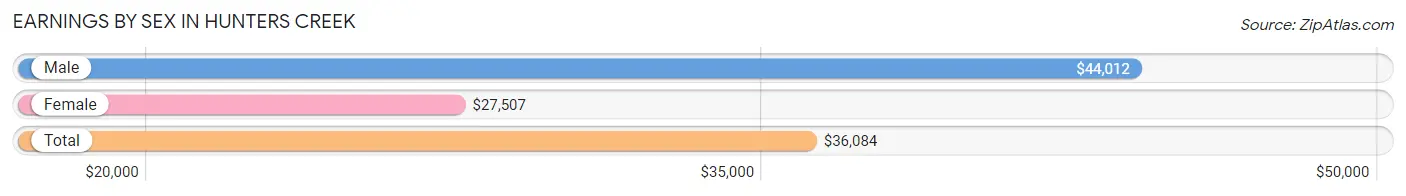
Earnings by Sex in Hunters Creek
Average Earnings in Hunters Creek are $36,084, $44,012 for men and $27,507 for women, a difference of 37.5%.
| Sex | Number | Average Earnings |
| Male | 6,278 (51.3%) | $44,012 |
| Female | 5,953 (48.7%) | $27,507 |
| Total | 12,231 (100.0%) | $36,084 |
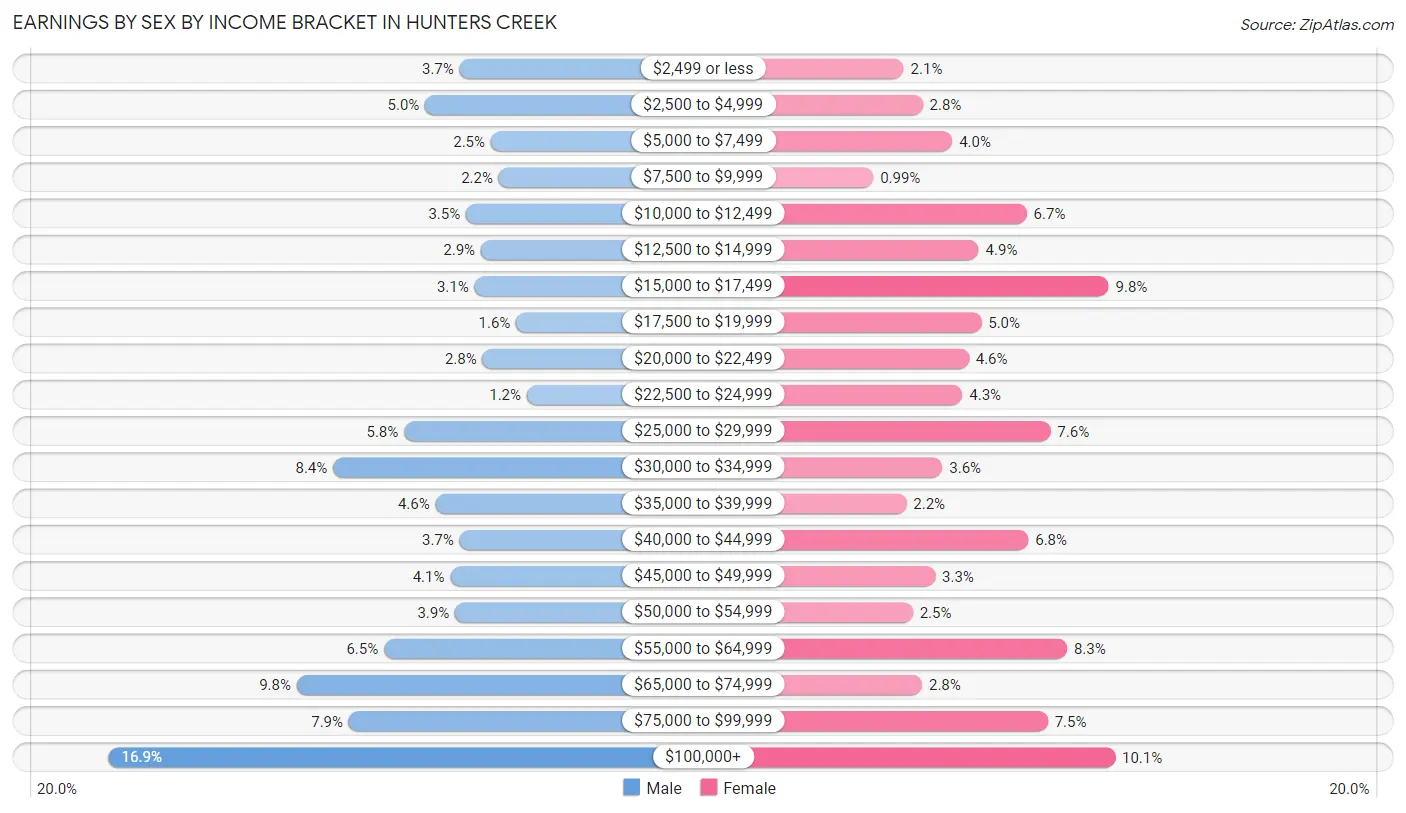
Earnings by Sex by Income Bracket in Hunters Creek
The most common earnings brackets in Hunters Creek are $100,000+ for men (1,058 | 16.9%) and $100,000+ for women (598 | 10.1%).
| Income | Male | Female |
| $2,499 or less | 232 (3.7%) | 127 (2.1%) |
| $2,500 to $4,999 | 313 (5.0%) | 169 (2.8%) |
| $5,000 to $7,499 | 159 (2.5%) | 235 (4.0%) |
| $7,500 to $9,999 | 140 (2.2%) | 59 (1.0%) |
| $10,000 to $12,499 | 217 (3.5%) | 401 (6.7%) |
| $12,500 to $14,999 | 182 (2.9%) | 294 (4.9%) |
| $15,000 to $17,499 | 197 (3.1%) | 584 (9.8%) |
| $17,500 to $19,999 | 99 (1.6%) | 300 (5.0%) |
| $20,000 to $22,499 | 178 (2.8%) | 272 (4.6%) |
| $22,500 to $24,999 | 74 (1.2%) | 258 (4.3%) |
| $25,000 to $29,999 | 363 (5.8%) | 454 (7.6%) |
| $30,000 to $34,999 | 530 (8.4%) | 213 (3.6%) |
| $35,000 to $39,999 | 289 (4.6%) | 133 (2.2%) |
| $40,000 to $44,999 | 232 (3.7%) | 405 (6.8%) |
| $45,000 to $49,999 | 254 (4.1%) | 197 (3.3%) |
| $50,000 to $54,999 | 243 (3.9%) | 147 (2.5%) |
| $55,000 to $64,999 | 410 (6.5%) | 491 (8.3%) |
| $65,000 to $74,999 | 615 (9.8%) | 168 (2.8%) |
| $75,000 to $99,999 | 493 (7.9%) | 448 (7.5%) |
| $100,000+ | 1,058 (16.9%) | 598 (10.1%) |
| Total | 6,278 (100.0%) | 5,953 (100.0%) |
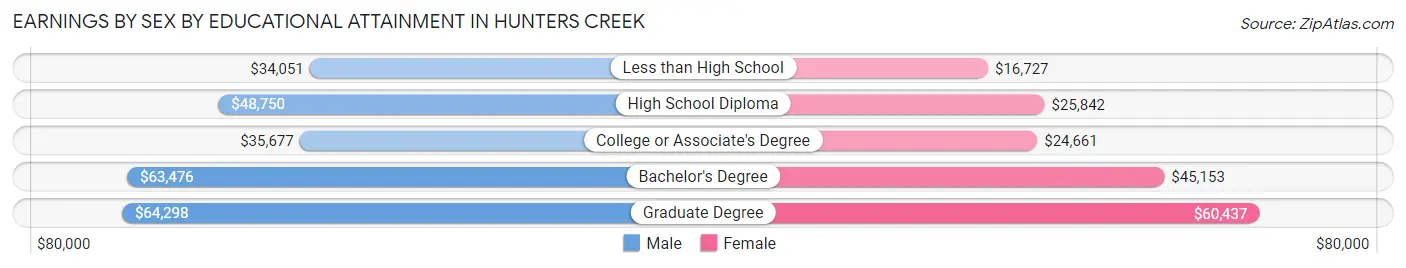
Earnings by Sex by Educational Attainment in Hunters Creek
Average earnings in Hunters Creek are $50,357 for men and $34,092 for women, a difference of 32.3%. Men with an educational attainment of graduate degree enjoy the highest average annual earnings of $64,298, while those with less than high school education earn the least with $34,051. Women with an educational attainment of graduate degree earn the most with the average annual earnings of $60,437, while those with less than high school education have the smallest earnings of $16,727.
| Educational Attainment | Male Income | Female Income |
| Less than High School | $34,051 | $16,727 |
| High School Diploma | $48,750 | $25,842 |
| College or Associate's Degree | $35,677 | $24,661 |
| Bachelor's Degree | $63,476 | $45,153 |
| Graduate Degree | $64,298 | $60,437 |
| Total | $50,357 | $34,092 |
Family Income in Hunters Creek
Family Income Brackets in Hunters Creek
According to the Hunters Creek family income data, there are 1,064 families falling into the $100,000 to $149,999 income range, which is the most common income bracket and makes up 20.7% of all families. Conversely, the $10,000 to $14,999 income bracket is the least frequent group with only 26 families (0.5%) belonging to this category.
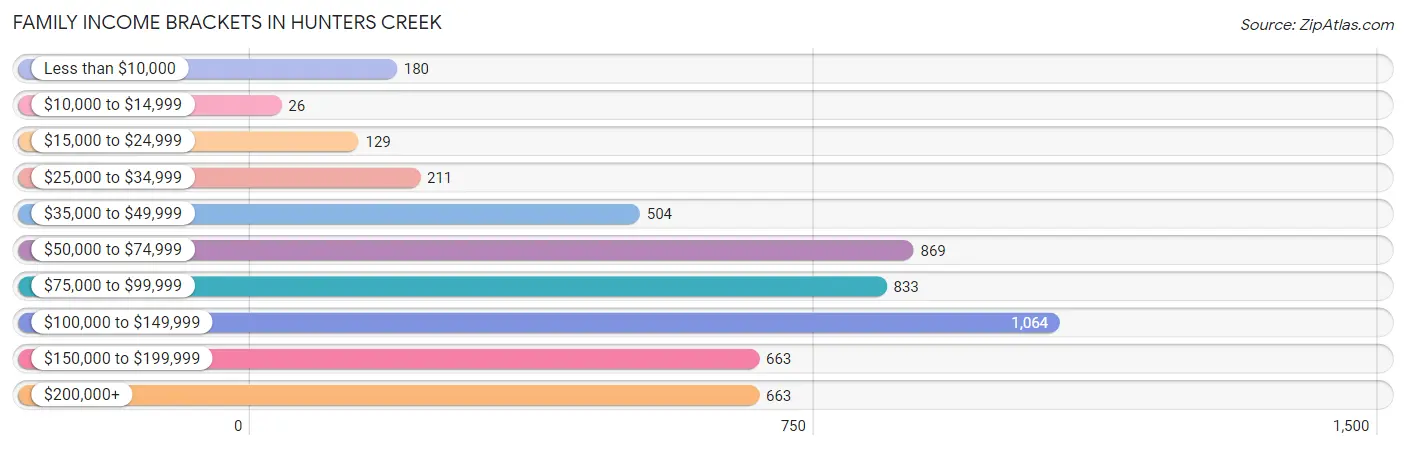
| Income Bracket | # Families | % Families |
| Less than $10,000 | 180 | 3.5% |
| $10,000 to $14,999 | 26 | 0.5% |
| $15,000 to $24,999 | 129 | 2.5% |
| $25,000 to $34,999 | 211 | 4.1% |
| $35,000 to $49,999 | 504 | 9.8% |
| $50,000 to $74,999 | 869 | 16.9% |
| $75,000 to $99,999 | 833 | 16.2% |
| $100,000 to $149,999 | 1,064 | 20.7% |
| $150,000 to $199,999 | 663 | 12.9% |
| $200,000+ | 663 | 12.9% |
Family Income by Famaliy Size in Hunters Creek
6-person families (261 | 5.1%) account for the highest median family income in Hunters Creek with $185,313 per family, while 2-person families (2,171 | 42.2%) have the highest median income of $46,280 per family member.
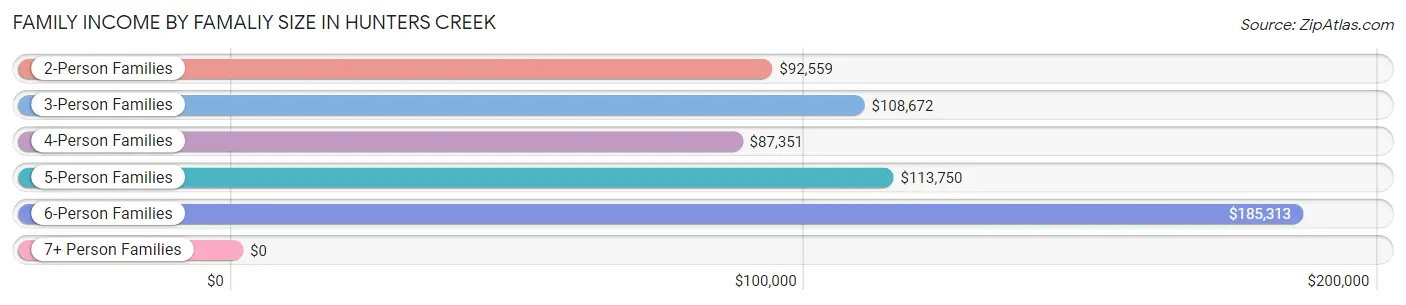
| Income Bracket | # Families | Median Income |
| 2-Person Families | 2,171 (42.2%) | $92,559 |
| 3-Person Families | 1,265 (24.6%) | $108,672 |
| 4-Person Families | 1,029 (20.0%) | $87,351 |
| 5-Person Families | 386 (7.5%) | $113,750 |
| 6-Person Families | 261 (5.1%) | $185,313 |
| 7+ Person Families | 30 (0.6%) | $0 |
| Total | 5,142 (100.0%) | $96,544 |
Family Income by Number of Earners in Hunters Creek
The median family income in Hunters Creek is $96,544, with families comprising 3+ earners (887) having the highest median family income of $110,341, while families with no earners (393) have the lowest median family income of $60,841, accounting for 17.2% and 7.6% of families, respectively.
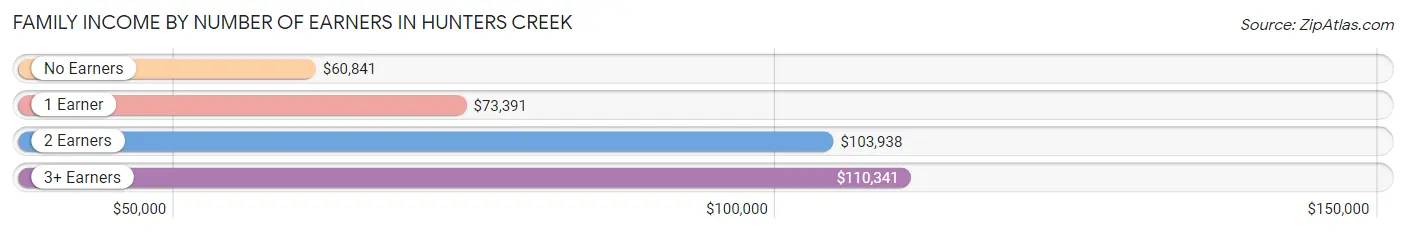
| Number of Earners | # Families | Median Income |
| No Earners | 393 (7.6%) | $60,841 |
| 1 Earner | 1,274 (24.8%) | $73,391 |
| 2 Earners | 2,588 (50.3%) | $103,938 |
| 3+ Earners | 887 (17.2%) | $110,341 |
| Total | 5,142 (100.0%) | $96,544 |
Household Income in Hunters Creek
Household Income Brackets in Hunters Creek
With 1,370 households falling in the category, the $100,000 to $149,999 income range is the most frequent in Hunters Creek, accounting for 20.7% of all households. In contrast, only 40 households (0.6%) fall into the $10,000 to $14,999 income bracket, making it the least populous group.
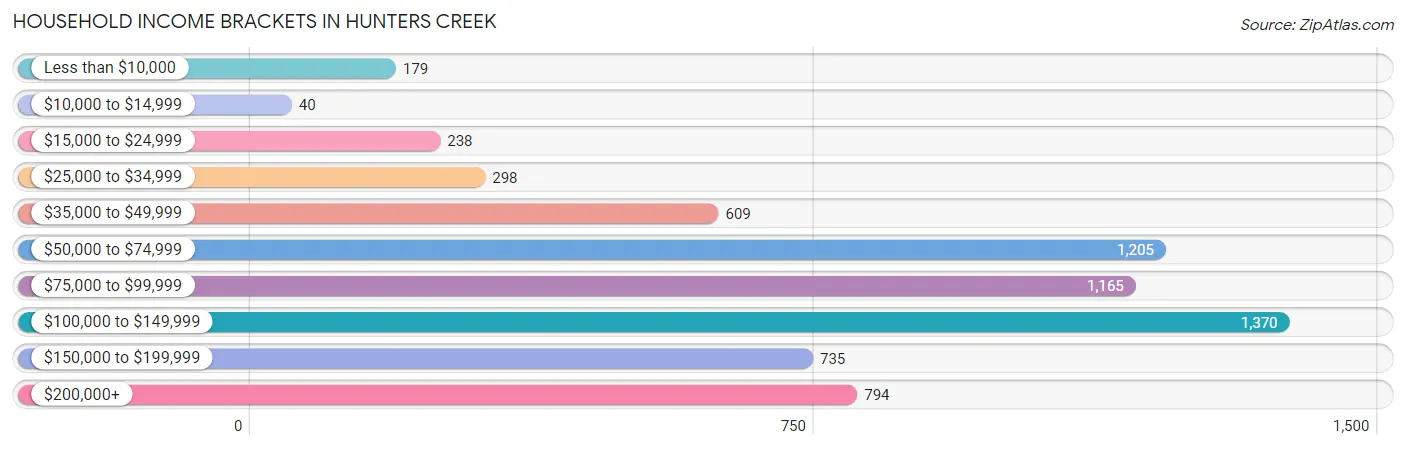
| Income Bracket | # Households | % Households |
| Less than $10,000 | 179 | 2.7% |
| $10,000 to $14,999 | 40 | 0.6% |
| $15,000 to $24,999 | 238 | 3.6% |
| $25,000 to $34,999 | 298 | 4.5% |
| $35,000 to $49,999 | 609 | 9.2% |
| $50,000 to $74,999 | 1,205 | 18.2% |
| $75,000 to $99,999 | 1,165 | 17.6% |
| $100,000 to $149,999 | 1,370 | 20.7% |
| $150,000 to $199,999 | 735 | 11.1% |
| $200,000+ | 794 | 12.0% |
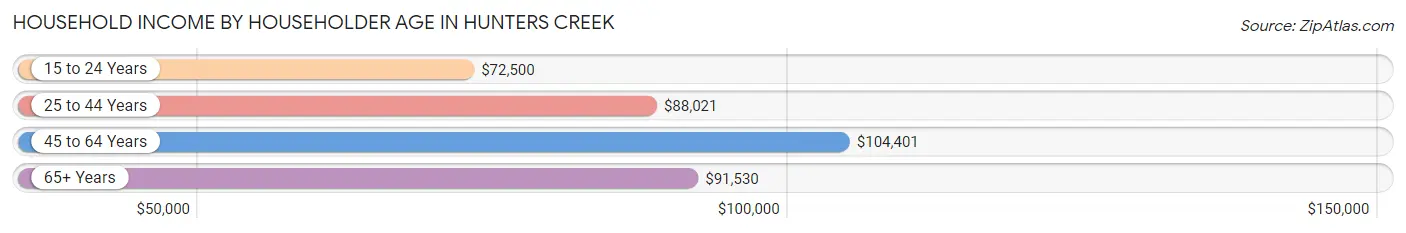
Household Income by Householder Age in Hunters Creek
The median household income in Hunters Creek is $92,053, with the highest median household income of $104,401 found in the 45 to 64 years age bracket for the primary householder. A total of 2,745 households (41.5%) fall into this category. Meanwhile, the 15 to 24 years age bracket for the primary householder has the lowest median household income of $72,500, with 58 households (0.9%) in this group.
| Income Bracket | # Households | Median Income |
| 15 to 24 Years | 58 (0.9%) | $72,500 |
| 25 to 44 Years | 2,347 (35.4%) | $88,021 |
| 45 to 64 Years | 2,745 (41.5%) | $104,401 |
| 65+ Years | 1,470 (22.2%) | $91,530 |
| Total | 6,620 (100.0%) | $92,053 |
Poverty in Hunters Creek
Income Below Poverty by Sex and Age in Hunters Creek
With 7.1% poverty level for males and 7.8% for females among the residents of Hunters Creek, 5 year old males and 16 and 17 year old females are the most vulnerable to poverty, with 39 males (17.6%) and 64 females (32.8%) in their respective age groups living below the poverty level.
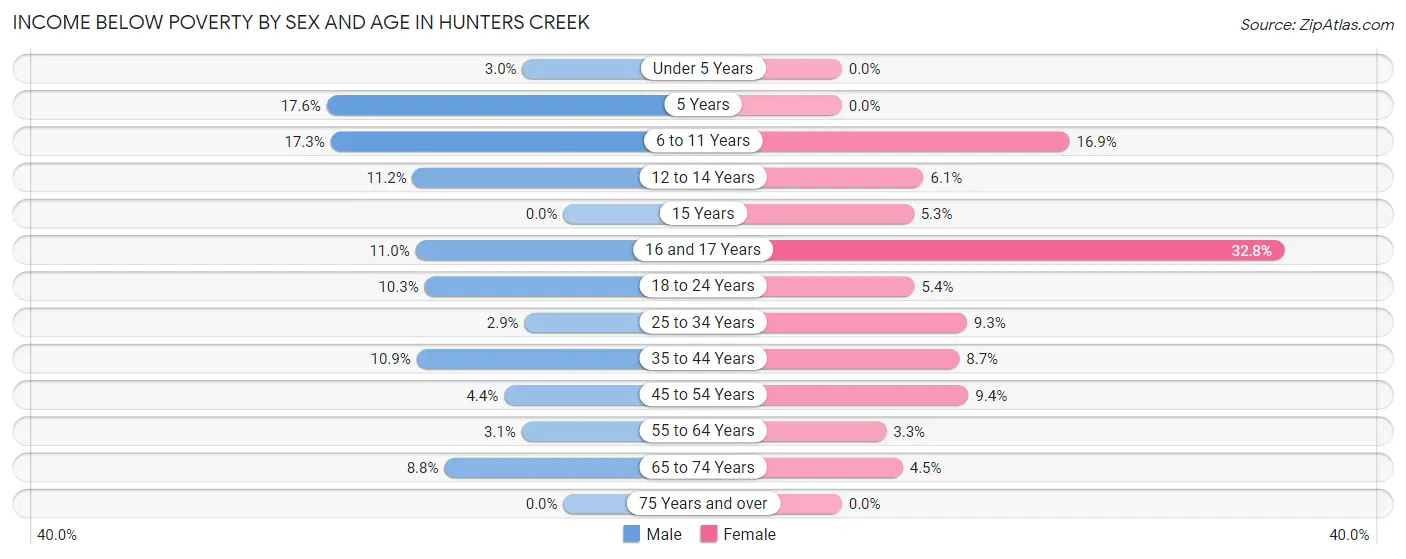
| Age Bracket | Male | Female |
| Under 5 Years | 16 (3.0%) | 0 (0.0%) |
| 5 Years | 39 (17.6%) | 0 (0.0%) |
| 6 to 11 Years | 120 (17.3%) | 114 (16.9%) |
| 12 to 14 Years | 29 (11.2%) | 41 (6.1%) |
| 15 Years | 0 (0.0%) | 14 (5.3%) |
| 16 and 17 Years | 19 (11.0%) | 64 (32.8%) |
| 18 to 24 Years | 99 (10.3%) | 40 (5.4%) |
| 25 to 34 Years | 42 (2.9%) | 147 (9.3%) |
| 35 to 44 Years | 132 (10.9%) | 145 (8.7%) |
| 45 to 54 Years | 63 (4.4%) | 131 (9.4%) |
| 55 to 64 Years | 42 (3.1%) | 42 (3.3%) |
| 65 to 74 Years | 77 (8.8%) | 52 (4.5%) |
| 75 Years and over | 0 (0.0%) | 0 (0.0%) |
| Total | 678 (7.1%) | 790 (7.8%) |
Income Above Poverty by Sex and Age in Hunters Creek
According to the poverty statistics in Hunters Creek, males aged 15 years and females aged under 5 years are the age groups that are most secure financially, with 100.0% of males and 100.0% of females in these age groups living above the poverty line.
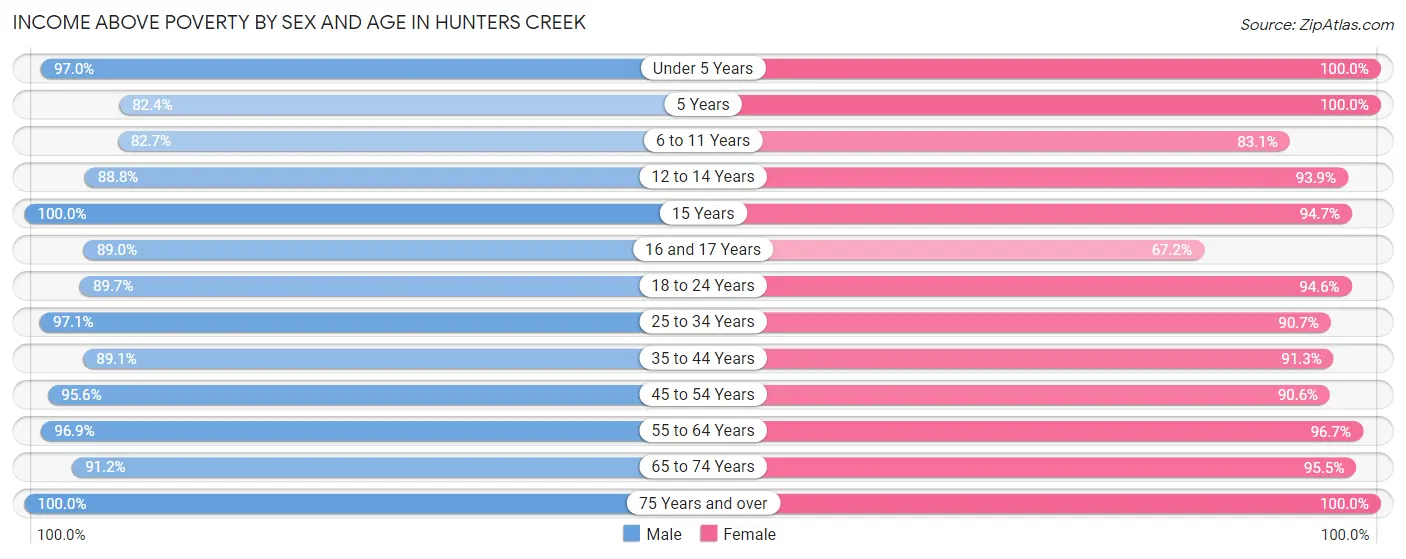
| Age Bracket | Male | Female |
| Under 5 Years | 511 (97.0%) | 226 (100.0%) |
| 5 Years | 183 (82.4%) | 64 (100.0%) |
| 6 to 11 Years | 574 (82.7%) | 560 (83.1%) |
| 12 to 14 Years | 230 (88.8%) | 635 (93.9%) |
| 15 Years | 78 (100.0%) | 248 (94.7%) |
| 16 and 17 Years | 154 (89.0%) | 131 (67.2%) |
| 18 to 24 Years | 861 (89.7%) | 699 (94.6%) |
| 25 to 34 Years | 1,411 (97.1%) | 1,435 (90.7%) |
| 35 to 44 Years | 1,079 (89.1%) | 1,516 (91.3%) |
| 45 to 54 Years | 1,369 (95.6%) | 1,262 (90.6%) |
| 55 to 64 Years | 1,313 (96.9%) | 1,225 (96.7%) |
| 65 to 74 Years | 794 (91.2%) | 1,097 (95.5%) |
| 75 Years and over | 340 (100.0%) | 273 (100.0%) |
| Total | 8,897 (92.9%) | 9,371 (92.2%) |
Income Below Poverty Among Married-Couple Families in Hunters Creek
The poverty statistics for married-couple families in Hunters Creek show that 6.8% or 275 of the total 4,072 families live below the poverty line. Families with 3 or 4 children have the highest poverty rate of 29.2%, comprising of 62 families. On the other hand, families with no children have the lowest poverty rate of 5.2%, which includes 123 families.
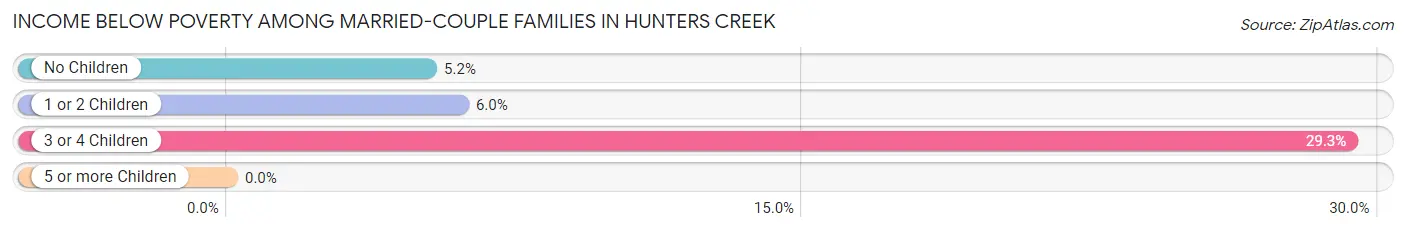
| Children | Above Poverty | Below Poverty |
| No Children | 2,244 (94.8%) | 123 (5.2%) |
| 1 or 2 Children | 1,403 (94.0%) | 90 (6.0%) |
| 3 or 4 Children | 150 (70.8%) | 62 (29.2%) |
| 5 or more Children | 0 (0.0%) | 0 (0.0%) |
| Total | 3,797 (93.2%) | 275 (6.8%) |
Income Below Poverty Among Single-Parent Households in Hunters Creek
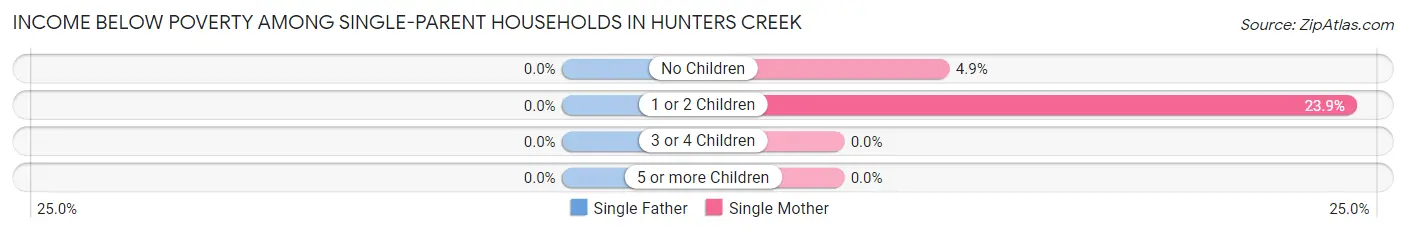
| Children | Single Father | Single Mother |
| No Children | 0 (0.0%) | 18 (4.9%) |
| 1 or 2 Children | 0 (0.0%) | 102 (23.9%) |
| 3 or 4 Children | 0 (0.0%) | 0 (0.0%) |
| 5 or more Children | 0 (0.0%) | 0 (0.0%) |
| Total | 0 (0.0%) | 120 (14.6%) |
Income Below Poverty Among Married-Couple vs Single-Parent Households in Hunters Creek
The poverty data for Hunters Creek shows that 275 of the married-couple family households (6.8%) and 120 of the single-parent households (11.2%) are living below the poverty level. Within the married-couple family households, those with 3 or 4 children have the highest poverty rate, with 62 households (29.2%) falling below the poverty line. Among the single-parent households, those with 1 or 2 children have the highest poverty rate, with 102 household (18.0%) living below poverty.
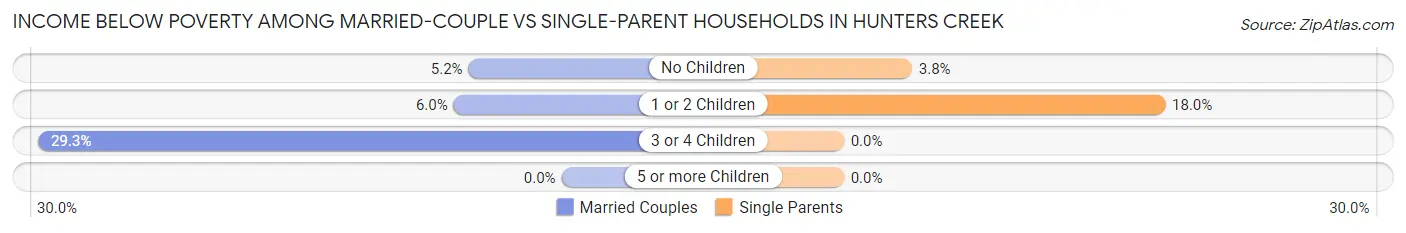
| Children | Married-Couple Families | Single-Parent Households |
| No Children | 123 (5.2%) | 18 (3.8%) |
| 1 or 2 Children | 90 (6.0%) | 102 (18.0%) |
| 3 or 4 Children | 62 (29.2%) | 0 (0.0%) |
| 5 or more Children | 0 (0.0%) | 0 (0.0%) |
| Total | 275 (6.8%) | 120 (11.2%) |
Race in Hunters Creek
The most populous races in Hunters Creek are White / Caucasian (10,865 | 54.6%), Hispanic or Latino (9,614 | 48.3%), and Two or more Races (3,357 | 16.9%).
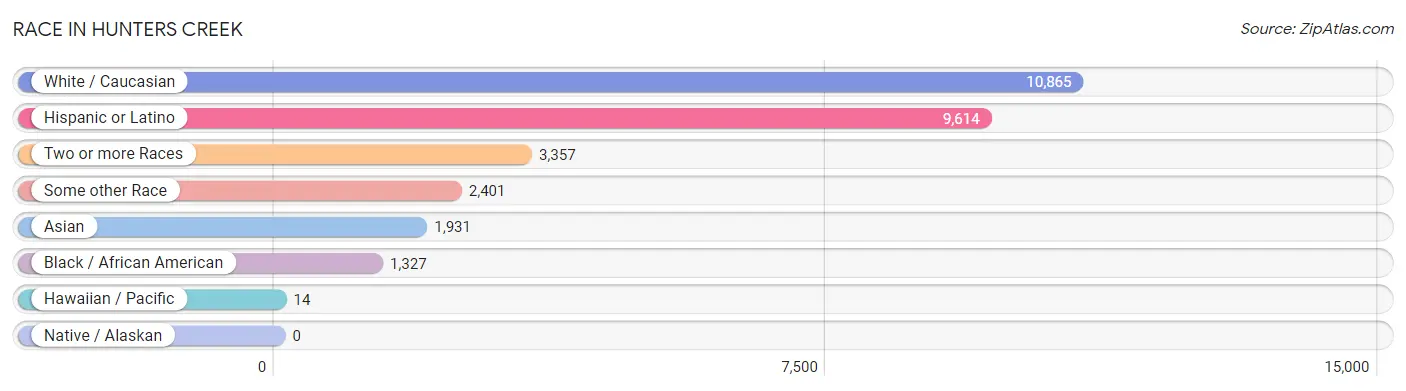
| Race | # Population | % Population |
| Asian | 1,931 | 9.7% |
| Black / African American | 1,327 | 6.7% |
| Hawaiian / Pacific | 14 | 0.1% |
| Hispanic or Latino | 9,614 | 48.3% |
| Native / Alaskan | 0 | 0.0% |
| White / Caucasian | 10,865 | 54.6% |
| Two or more Races | 3,357 | 16.9% |
| Some other Race | 2,401 | 12.1% |
| Total | 19,895 | 100.0% |
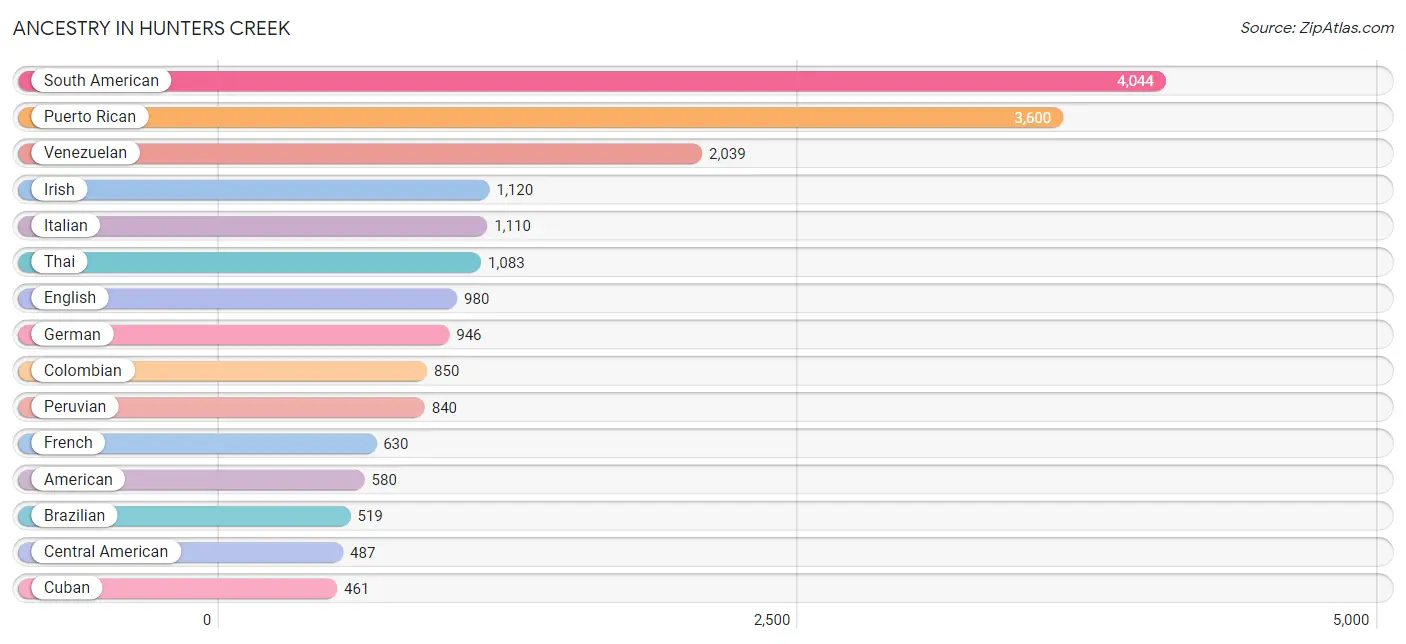
Ancestry in Hunters Creek
The most populous ancestries reported in Hunters Creek are South American (4,044 | 20.3%), Puerto Rican (3,600 | 18.1%), Venezuelan (2,039 | 10.2%), Irish (1,120 | 5.6%), and Italian (1,110 | 5.6%), together accounting for 59.9% of all Hunters Creek residents.
| Ancestry | # Population | % Population |
| African | 203 | 1.0% |
| American | 580 | 2.9% |
| Arab | 291 | 1.5% |
| Argentinean | 41 | 0.2% |
| Armenian | 29 | 0.2% |
| Austrian | 31 | 0.2% |
| Bahamian | 3 | 0.0% |
| Belgian | 15 | 0.1% |
| Bhutanese | 96 | 0.5% |
| Bolivian | 15 | 0.1% |
| Brazilian | 519 | 2.6% |
| British | 111 | 0.6% |
| Canadian | 33 | 0.2% |
| Central American | 487 | 2.5% |
| Cherokee | 44 | 0.2% |
| Chilean | 9 | 0.1% |
| Colombian | 850 | 4.3% |
| Costa Rican | 46 | 0.2% |
| Croatian | 20 | 0.1% |
| Cuban | 461 | 2.3% |
| Czech | 18 | 0.1% |
| Danish | 34 | 0.2% |
| Dominican | 136 | 0.7% |
| Dutch | 59 | 0.3% |
| Eastern European | 22 | 0.1% |
| Ecuadorian | 250 | 1.3% |
| Egyptian | 170 | 0.9% |
| English | 980 | 4.9% |
| European | 235 | 1.2% |
| Filipino | 12 | 0.1% |
| French | 630 | 3.2% |
| French Canadian | 96 | 0.5% |
| German | 946 | 4.8% |
| Greek | 20 | 0.1% |
| Guamanian / Chamorro | 14 | 0.1% |
| Guatemalan | 152 | 0.8% |
| Haitian | 33 | 0.2% |
| Honduran | 140 | 0.7% |
| Hungarian | 7 | 0.0% |
| Icelander | 19 | 0.1% |
| Indian (Asian) | 280 | 1.4% |
| Irish | 1,120 | 5.6% |
| Israeli | 15 | 0.1% |
| Italian | 1,110 | 5.6% |
| Jamaican | 38 | 0.2% |
| Korean | 422 | 2.1% |
| Lebanese | 39 | 0.2% |
| Lithuanian | 23 | 0.1% |
| Mexican | 340 | 1.7% |
| Moroccan | 39 | 0.2% |
| Nicaraguan | 130 | 0.6% |
| Norwegian | 134 | 0.7% |
| Pakistani | 45 | 0.2% |
| Panamanian | 19 | 0.1% |
| Peruvian | 840 | 4.2% |
| Polish | 219 | 1.1% |
| Portuguese | 182 | 0.9% |
| Puerto Rican | 3,600 | 18.1% |
| Romanian | 66 | 0.3% |
| Russian | 175 | 0.9% |
| Scandinavian | 27 | 0.1% |
| Scotch-Irish | 53 | 0.3% |
| Scottish | 109 | 0.5% |
| Serbian | 11 | 0.1% |
| Slavic | 23 | 0.1% |
| Slovene | 16 | 0.1% |
| South African | 79 | 0.4% |
| South American | 4,044 | 20.3% |
| Spaniard | 92 | 0.5% |
| Spanish American | 17 | 0.1% |
| Sri Lankan | 101 | 0.5% |
| Subsaharan African | 282 | 1.4% |
| Swedish | 48 | 0.2% |
| Syrian | 23 | 0.1% |
| Thai | 1,083 | 5.4% |
| Turkish | 82 | 0.4% |
| Venezuelan | 2,039 | 10.2% |
| Welsh | 116 | 0.6% |
| West Indian | 61 | 0.3% | View All 79 Rows |
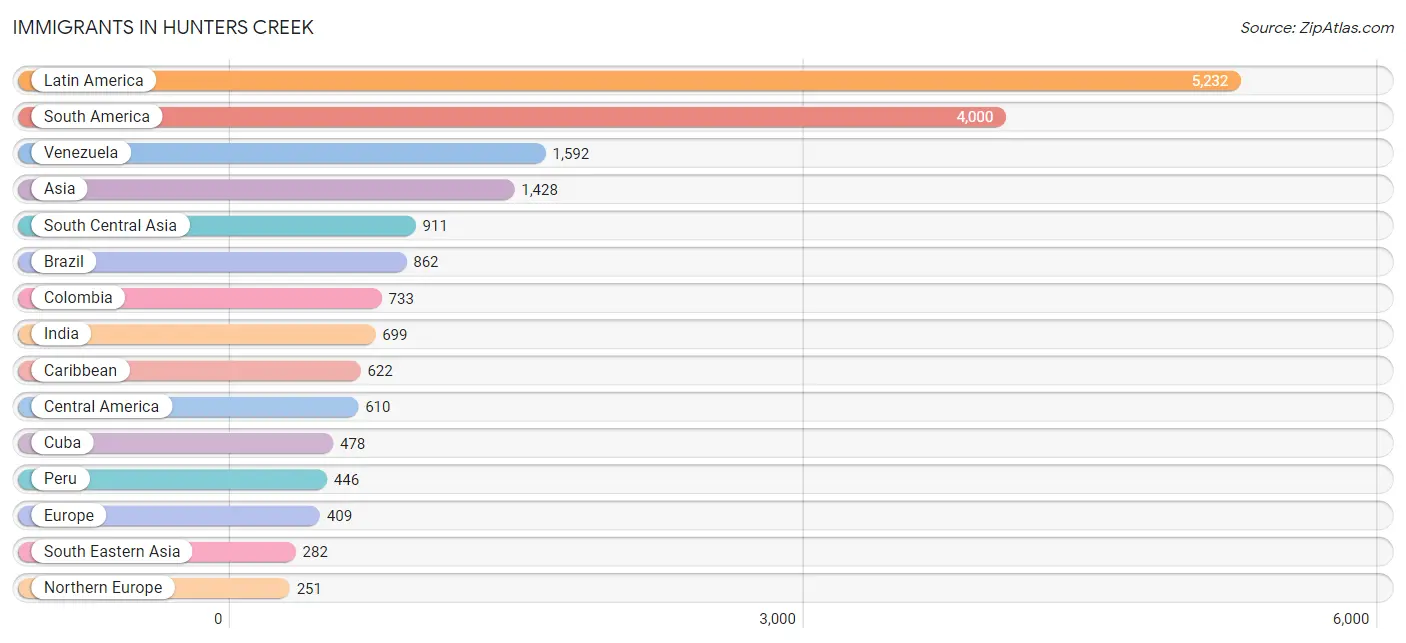
Immigrants in Hunters Creek
The most numerous immigrant groups reported in Hunters Creek came from Latin America (5,232 | 26.3%), South America (4,000 | 20.1%), Venezuela (1,592 | 8.0%), Asia (1,428 | 7.2%), and South Central Asia (911 | 4.6%), together accounting for 66.2% of all Hunters Creek residents.
| Immigration Origin | # Population | % Population |
| Africa | 174 | 0.9% |
| Argentina | 14 | 0.1% |
| Asia | 1,428 | 7.2% |
| Bahamas | 3 | 0.0% |
| Bangladesh | 17 | 0.1% |
| Belize | 20 | 0.1% |
| Brazil | 862 | 4.3% |
| Cambodia | 14 | 0.1% |
| Canada | 88 | 0.4% |
| Caribbean | 622 | 3.1% |
| Central America | 610 | 3.1% |
| China | 112 | 0.6% |
| Colombia | 733 | 3.7% |
| Costa Rica | 22 | 0.1% |
| Cuba | 478 | 2.4% |
| Dominican Republic | 117 | 0.6% |
| Eastern Asia | 162 | 0.8% |
| Eastern Europe | 62 | 0.3% |
| Ecuador | 192 | 1.0% |
| Egypt | 85 | 0.4% |
| England | 39 | 0.2% |
| Europe | 409 | 2.1% |
| Germany | 39 | 0.2% |
| Guatemala | 146 | 0.7% |
| Guyana | 146 | 0.7% |
| Haiti | 4 | 0.0% |
| Honduras | 126 | 0.6% |
| India | 699 | 3.5% |
| Israel | 15 | 0.1% |
| Italy | 36 | 0.2% |
| Japan | 50 | 0.3% |
| Latin America | 5,232 | 26.3% |
| Mexico | 118 | 0.6% |
| Morocco | 31 | 0.2% |
| Netherlands | 21 | 0.1% |
| Nicaragua | 159 | 0.8% |
| Northern Africa | 116 | 0.6% |
| Northern Europe | 251 | 1.3% |
| Pakistan | 187 | 0.9% |
| Panama | 19 | 0.1% |
| Peru | 446 | 2.2% |
| Philippines | 145 | 0.7% |
| Romania | 39 | 0.2% |
| Russia | 23 | 0.1% |
| Scotland | 31 | 0.2% |
| South Africa | 58 | 0.3% |
| South America | 4,000 | 20.1% |
| South Central Asia | 911 | 4.6% |
| South Eastern Asia | 282 | 1.4% |
| Southern Europe | 36 | 0.2% |
| Syria | 25 | 0.1% |
| Taiwan | 23 | 0.1% |
| Thailand | 8 | 0.0% |
| Trinidad and Tobago | 20 | 0.1% |
| Turkey | 33 | 0.2% |
| Venezuela | 1,592 | 8.0% |
| Vietnam | 115 | 0.6% |
| Western Asia | 73 | 0.4% |
| Western Europe | 60 | 0.3% | View All 59 Rows |
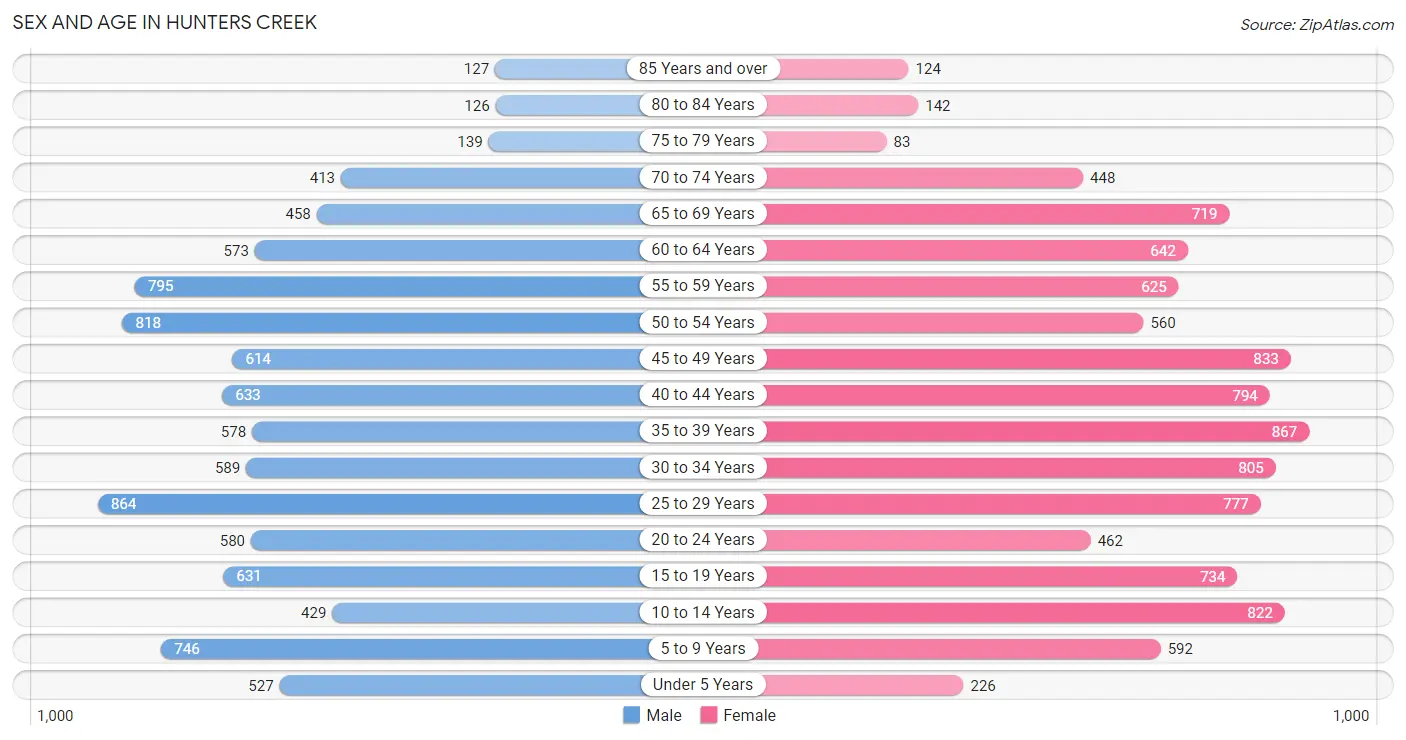
Sex and Age in Hunters Creek
Sex and Age in Hunters Creek
The most populous age groups in Hunters Creek are 25 to 29 Years (864 | 9.0%) for men and 35 to 39 Years (867 | 8.5%) for women.
| Age Bracket | Male | Female |
| Under 5 Years | 527 (5.5%) | 226 (2.2%) |
| 5 to 9 Years | 746 (7.7%) | 592 (5.8%) |
| 10 to 14 Years | 429 (4.4%) | 822 (8.0%) |
| 15 to 19 Years | 631 (6.6%) | 734 (7.2%) |
| 20 to 24 Years | 580 (6.0%) | 462 (4.5%) |
| 25 to 29 Years | 864 (9.0%) | 777 (7.6%) |
| 30 to 34 Years | 589 (6.1%) | 805 (7.9%) |
| 35 to 39 Years | 578 (6.0%) | 867 (8.5%) |
| 40 to 44 Years | 633 (6.6%) | 794 (7.7%) |
| 45 to 49 Years | 614 (6.4%) | 833 (8.1%) |
| 50 to 54 Years | 818 (8.5%) | 560 (5.5%) |
| 55 to 59 Years | 795 (8.3%) | 625 (6.1%) |
| 60 to 64 Years | 573 (5.9%) | 642 (6.3%) |
| 65 to 69 Years | 458 (4.8%) | 719 (7.0%) |
| 70 to 74 Years | 413 (4.3%) | 448 (4.4%) |
| 75 to 79 Years | 139 (1.4%) | 83 (0.8%) |
| 80 to 84 Years | 126 (1.3%) | 142 (1.4%) |
| 85 Years and over | 127 (1.3%) | 124 (1.2%) |
| Total | 9,640 (100.0%) | 10,255 (100.0%) |
Families and Households in Hunters Creek
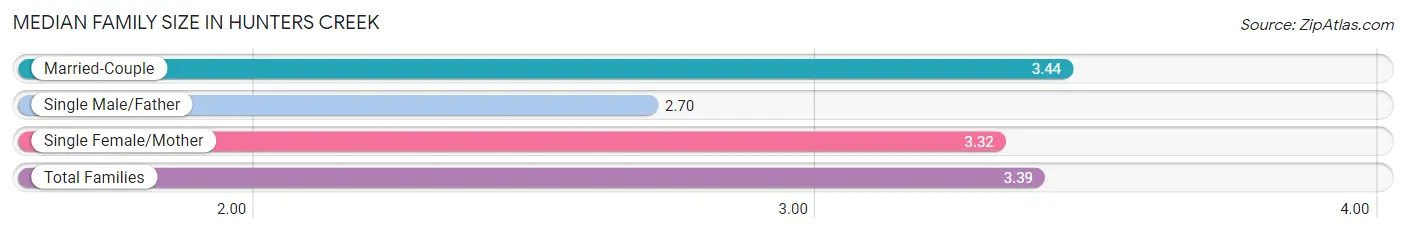
Median Family Size in Hunters Creek
The median family size in Hunters Creek is 3.39 persons per family, with married-couple families (4,072 | 79.2%) accounting for the largest median family size of 3.44 persons per family. On the other hand, single male/father families (247 | 4.8%) represent the smallest median family size with 2.70 persons per family.
| Family Type | # Families | Family Size |
| Married-Couple | 4,072 (79.2%) | 3.44 |
| Single Male/Father | 247 (4.8%) | 2.70 |
| Single Female/Mother | 823 (16.0%) | 3.32 |
| Total Families | 5,142 (100.0%) | 3.39 |
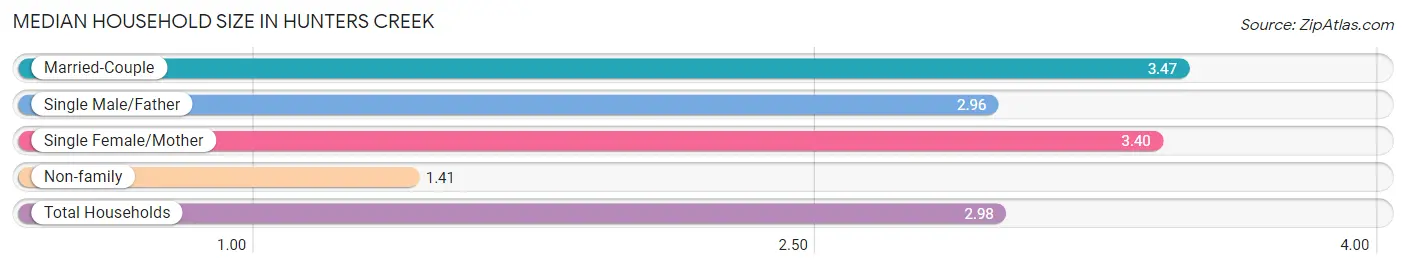
Median Household Size in Hunters Creek
The median household size in Hunters Creek is 2.98 persons per household, with married-couple households (4,072 | 61.5%) accounting for the largest median household size of 3.47 persons per household. non-family households (1,478 | 22.3%) represent the smallest median household size with 1.41 persons per household.
| Household Type | # Households | Household Size |
| Married-Couple | 4,072 (61.5%) | 3.47 |
| Single Male/Father | 247 (3.7%) | 2.96 |
| Single Female/Mother | 823 (12.4%) | 3.40 |
| Non-family | 1,478 (22.3%) | 1.41 |
| Total Households | 6,620 (100.0%) | 2.98 |
Household Size by Marriage Status in Hunters Creek
Out of a total of 6,620 households in Hunters Creek, 5,142 (77.7%) are family households, while 1,478 (22.3%) are nonfamily households. The most numerous type of family households are 2-person households, comprising 2,114, and the most common type of nonfamily households are 1-person households, comprising 1,134.
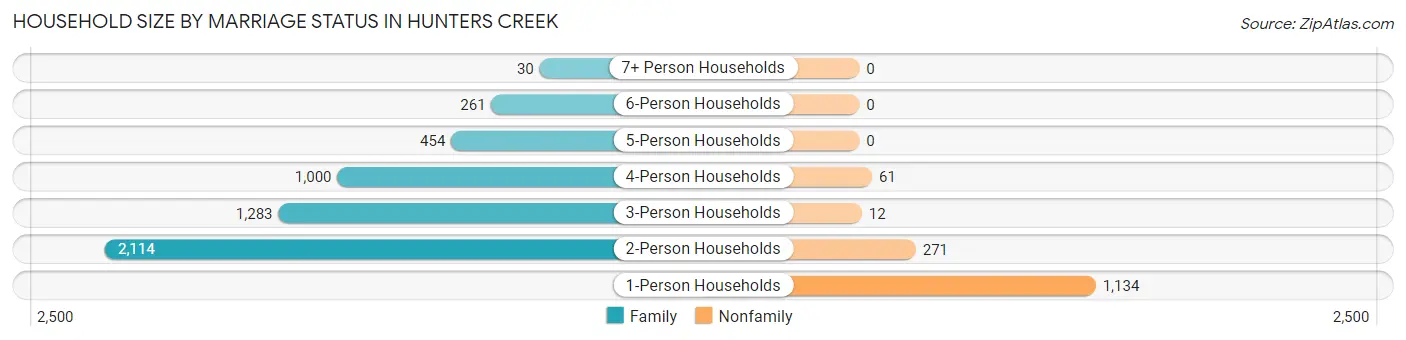
| Household Size | Family Households | Nonfamily Households |
| 1-Person Households | - | 1,134 (17.1%) |
| 2-Person Households | 2,114 (31.9%) | 271 (4.1%) |
| 3-Person Households | 1,283 (19.4%) | 12 (0.2%) |
| 4-Person Households | 1,000 (15.1%) | 61 (0.9%) |
| 5-Person Households | 454 (6.9%) | 0 (0.0%) |
| 6-Person Households | 261 (3.9%) | 0 (0.0%) |
| 7+ Person Households | 30 (0.4%) | 0 (0.0%) |
| Total | 5,142 (77.7%) | 1,478 (22.3%) |
Female Fertility in Hunters Creek
Fertility by Age in Hunters Creek
Average fertility rate in Hunters Creek is 39.0 births per 1,000 women. Women in the age bracket of 35 to 50 years have the highest fertility rate with 67.0 births per 1,000 women. Women in the age bracket of 35 to 50 years acount for 82.1% of all women with births.
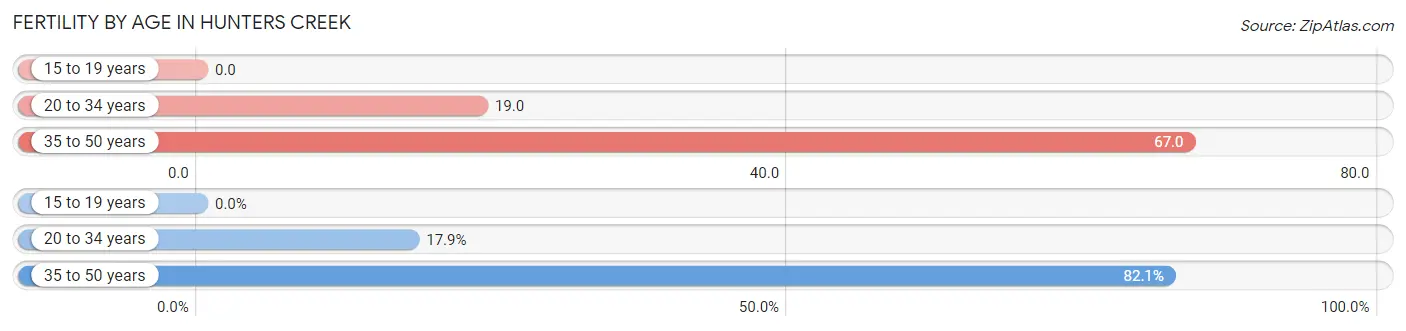
| Age Bracket | Women with Births | Births / 1,000 Women |
| 15 to 19 years | 0 (0.0%) | 0.0 |
| 20 to 34 years | 38 (17.9%) | 19.0 |
| 35 to 50 years | 174 (82.1%) | 67.0 |
| Total | 212 (100.0%) | 39.0 |
Fertility by Age by Marriage Status in Hunters Creek
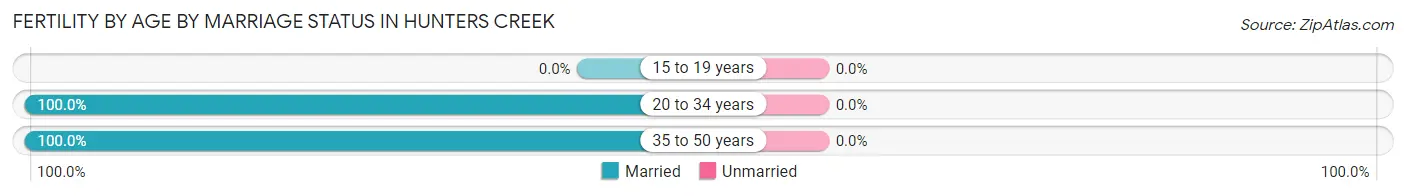
| Age Bracket | Married | Unmarried |
| 15 to 19 years | 0 (0.0%) | 0 (0.0%) |
| 20 to 34 years | 38 (100.0%) | 0 (0.0%) |
| 35 to 50 years | 174 (100.0%) | 0 (0.0%) |
| Total | 212 (100.0%) | 0 (0.0%) |
Fertility by Education in Hunters Creek
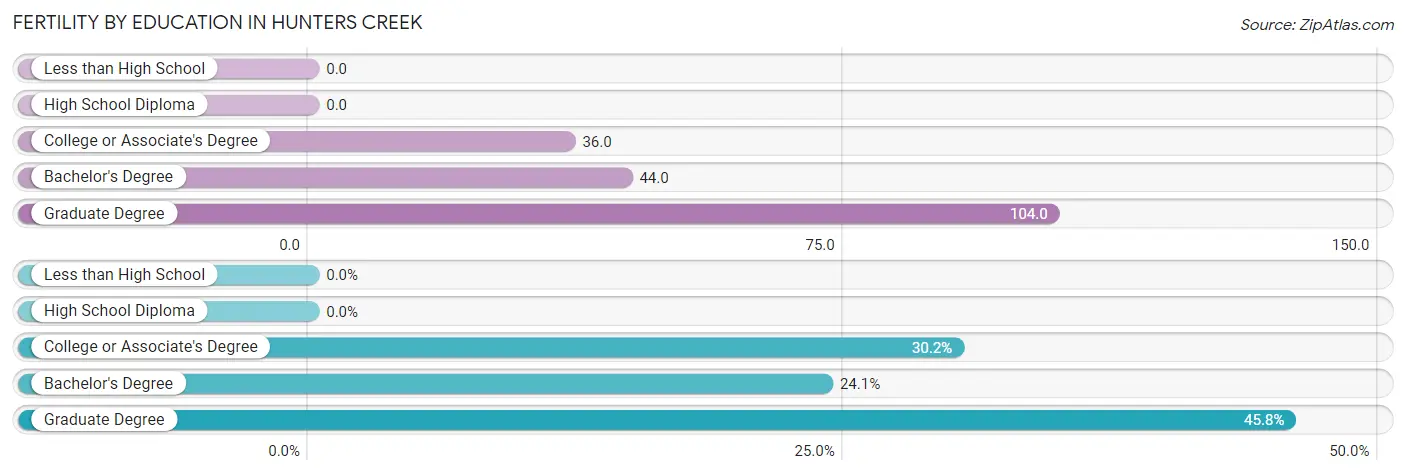
| Educational Attainment | Women with Births | Births / 1,000 Women |
| Less than High School | 0 (0.0%) | 0.0 |
| High School Diploma | 0 (0.0%) | 0.0 |
| College or Associate's Degree | 64 (30.2%) | 36.0 |
| Bachelor's Degree | 51 (24.1%) | 44.0 |
| Graduate Degree | 97 (45.8%) | 104.0 |
| Total | 212 (100.0%) | 39.0 |
Fertility by Education by Marriage Status in Hunters Creek
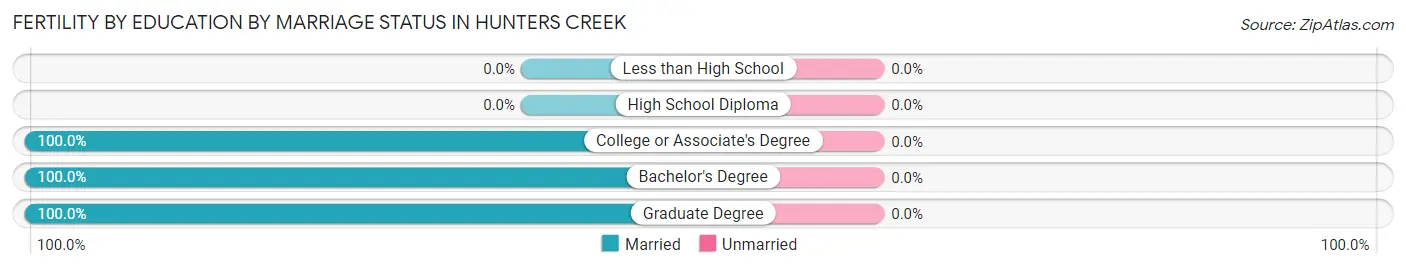
| Educational Attainment | Married | Unmarried |
| Less than High School | 0 (0.0%) | 0 (0.0%) |
| High School Diploma | 0 (0.0%) | 0 (0.0%) |
| College or Associate's Degree | 64 (100.0%) | 0 (0.0%) |
| Bachelor's Degree | 51 (100.0%) | 0 (0.0%) |
| Graduate Degree | 97 (100.0%) | 0 (0.0%) |
| Total | 212 (100.0%) | 0 (0.0%) |
Employment Characteristics in Hunters Creek
Employment by Class of Employer in Hunters Creek
Among the 10,880 employed individuals in Hunters Creek, private company employees (8,150 | 74.9%), local government employees (747 | 6.9%), and self-employed (not incorporated) (662 | 6.1%) make up the most common classes of employment.
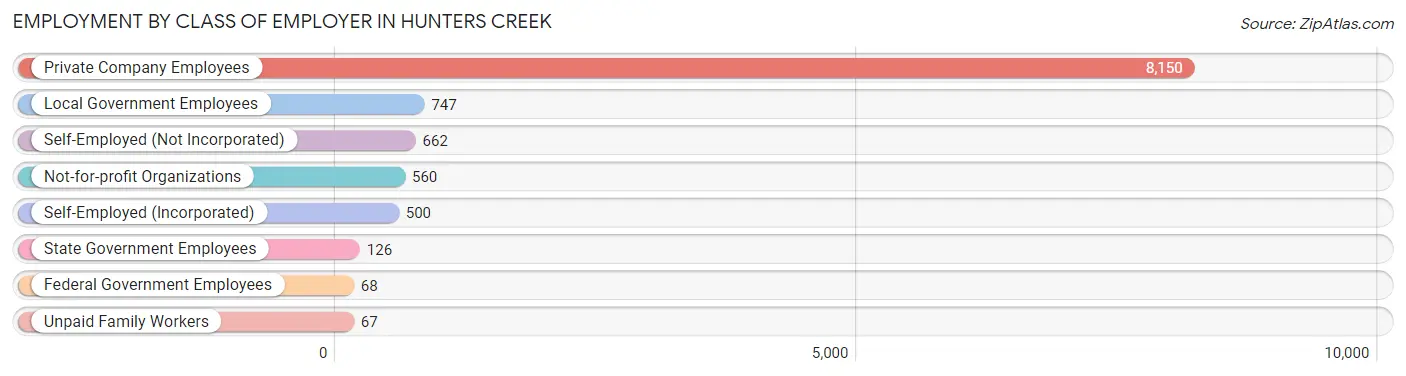
| Employer Class | # Employees | % Employees |
| Private Company Employees | 8,150 | 74.9% |
| Self-Employed (Incorporated) | 500 | 4.6% |
| Self-Employed (Not Incorporated) | 662 | 6.1% |
| Not-for-profit Organizations | 560 | 5.1% |
| Local Government Employees | 747 | 6.9% |
| State Government Employees | 126 | 1.2% |
| Federal Government Employees | 68 | 0.6% |
| Unpaid Family Workers | 67 | 0.6% |
| Total | 10,880 | 100.0% |
Employment Status by Age in Hunters Creek
According to the labor force statistics for Hunters Creek, out of the total population over 16 years of age (16,213), 71.5% or 11,592 individuals are in the labor force, with 4.4% or 510 of them unemployed. The age group with the highest labor force participation rate is 30 to 34 years, with 93.4% or 1,302 individuals in the labor force. Within the labor force, the 16 to 19 years age range has the highest percentage of unemployed individuals, with 19.9% or 103 of them being unemployed.
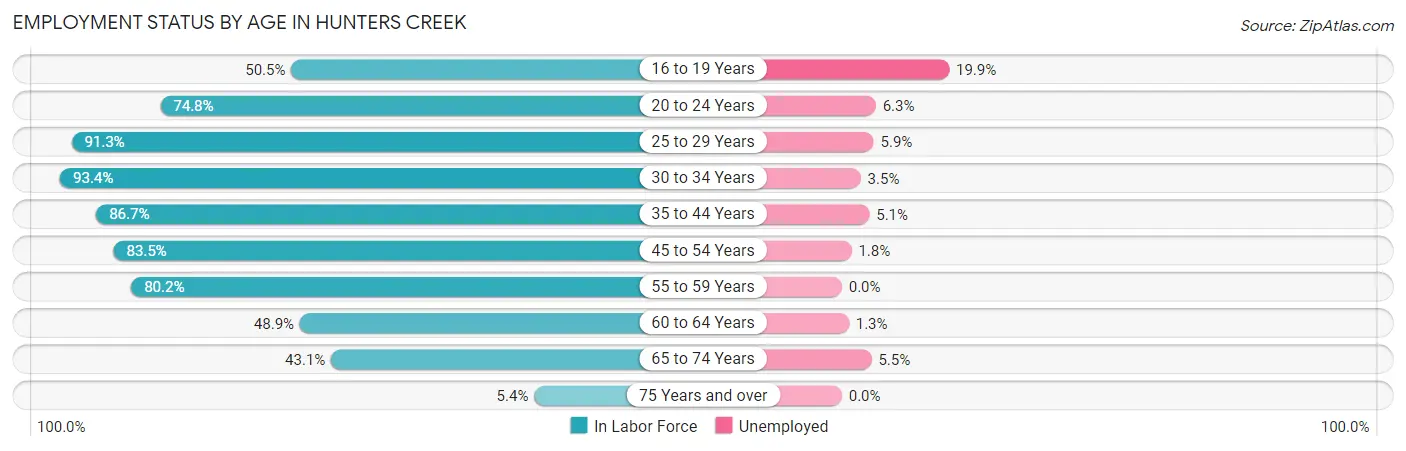
| Age Bracket | In Labor Force | Unemployed |
| 16 to 19 Years | 518 (50.5%) | 103 (19.9%) |
| 20 to 24 Years | 779 (74.8%) | 49 (6.3%) |
| 25 to 29 Years | 1,498 (91.3%) | 88 (5.9%) |
| 30 to 34 Years | 1,302 (93.4%) | 46 (3.5%) |
| 35 to 44 Years | 2,490 (86.7%) | 127 (5.1%) |
| 45 to 54 Years | 2,359 (83.5%) | 42 (1.8%) |
| 55 to 59 Years | 1,139 (80.2%) | 0 (0.0%) |
| 60 to 64 Years | 594 (48.9%) | 8 (1.3%) |
| 65 to 74 Years | 878 (43.1%) | 48 (5.5%) |
| 75 Years and over | 40 (5.4%) | 0 (0.0%) |
| Total | 11,592 (71.5%) | 510 (4.4%) |
Employment Status by Educational Attainment in Hunters Creek
According to labor force statistics for Hunters Creek, 82.5% of individuals (9,378) out of the total population between 25 and 64 years of age (11,367) are in the labor force, with 3.3% or 309 of them being unemployed. The group with the highest labor force participation rate are those with the educational attainment of bachelor's degree or higher, with 85.5% or 4,949 individuals in the labor force. Within the labor force, individuals with less than high school education have the highest percentage of unemployment, with 7.3% or 34 of them being unemployed.
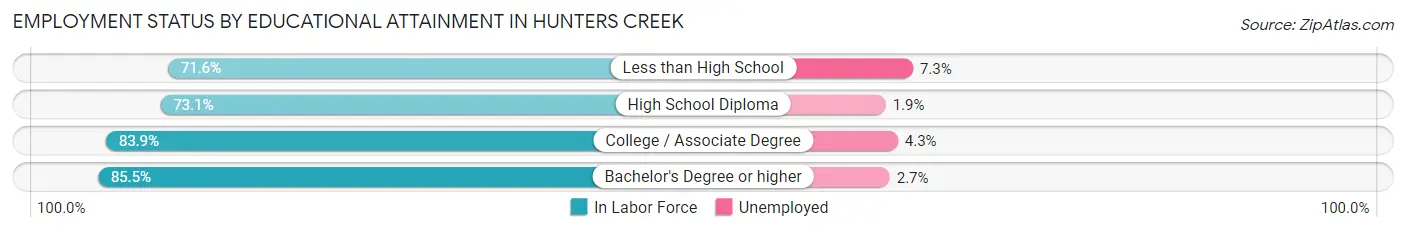
| Educational Attainment | In Labor Force | Unemployed |
| Less than High School | 468 (71.6%) | 48 (7.3%) |
| High School Diploma | 1,132 (73.1%) | 29 (1.9%) |
| College / Associate Degree | 2,833 (83.9%) | 145 (4.3%) |
| Bachelor's Degree or higher | 4,949 (85.5%) | 156 (2.7%) |
| Total | 9,378 (82.5%) | 375 (3.3%) |
Employment Occupations by Sex in Hunters Creek
Management, Business, Science and Arts Occupations
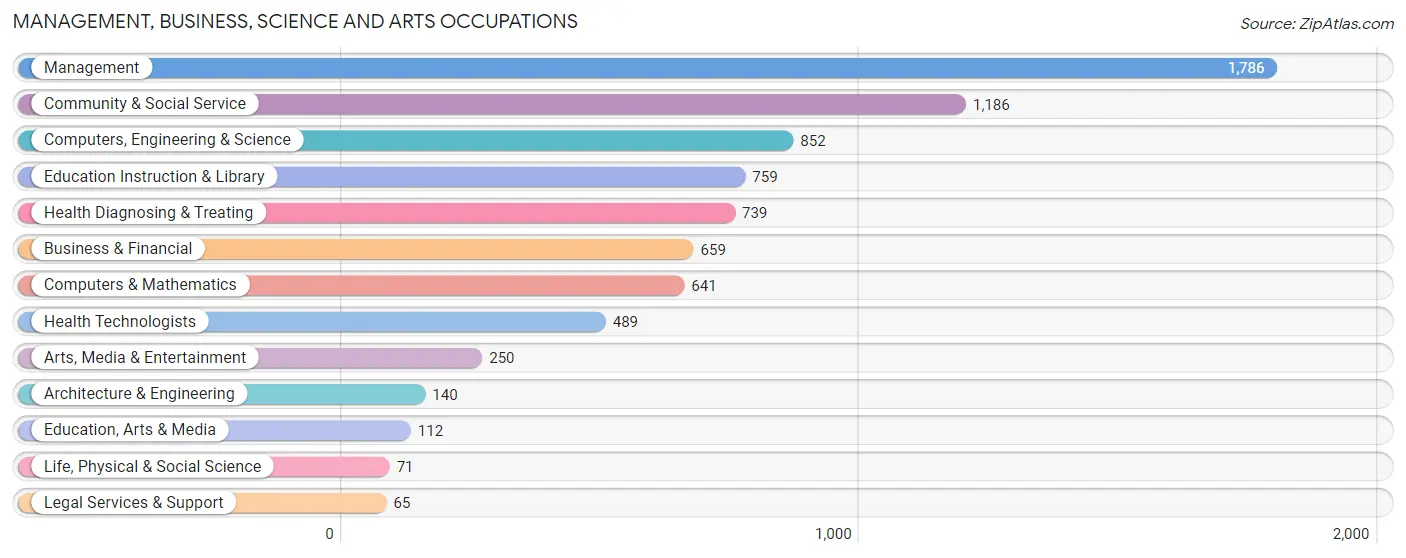
The most common Management, Business, Science and Arts occupations in Hunters Creek are Management (1,786 | 16.1%), Community & Social Service (1,186 | 10.7%), Computers, Engineering & Science (852 | 7.7%), Education Instruction & Library (759 | 6.9%), and Health Diagnosing & Treating (739 | 6.7%).
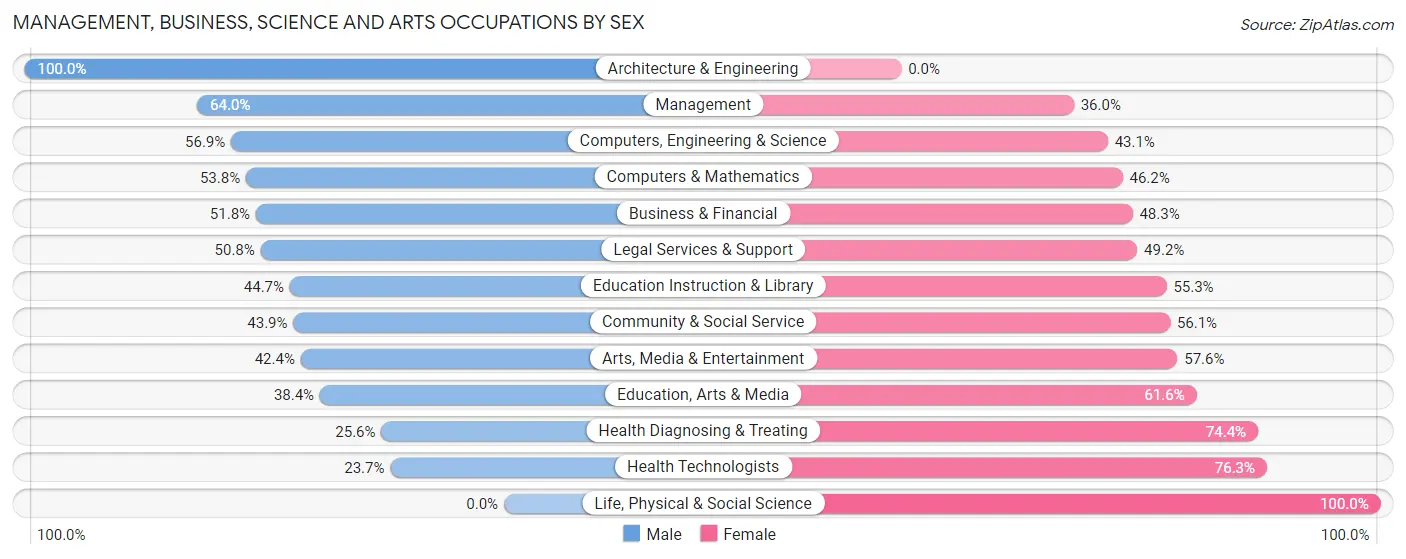
Management, Business, Science and Arts Occupations by Sex
Within the Management, Business, Science and Arts occupations in Hunters Creek, the most male-oriented occupations are Architecture & Engineering (100.0%), Management (64.0%), and Computers, Engineering & Science (56.9%), while the most female-oriented occupations are Life, Physical & Social Science (100.0%), Health Technologists (76.3%), and Health Diagnosing & Treating (74.4%).
| Occupation | Male | Female |
| Management | 1,143 (64.0%) | 643 (36.0%) |
| Business & Financial | 341 (51.7%) | 318 (48.2%) |
| Computers, Engineering & Science | 485 (56.9%) | 367 (43.1%) |
| Computers & Mathematics | 345 (53.8%) | 296 (46.2%) |
| Architecture & Engineering | 140 (100.0%) | 0 (0.0%) |
| Life, Physical & Social Science | 0 (0.0%) | 71 (100.0%) |
| Community & Social Service | 521 (43.9%) | 665 (56.1%) |
| Education, Arts & Media | 43 (38.4%) | 69 (61.6%) |
| Legal Services & Support | 33 (50.8%) | 32 (49.2%) |
| Education Instruction & Library | 339 (44.7%) | 420 (55.3%) |
| Arts, Media & Entertainment | 106 (42.4%) | 144 (57.6%) |
| Health Diagnosing & Treating | 189 (25.6%) | 550 (74.4%) |
| Health Technologists | 116 (23.7%) | 373 (76.3%) |
| Total (Category) | 2,679 (51.3%) | 2,543 (48.7%) |
| Total (Overall) | 5,665 (51.1%) | 5,421 (48.9%) |
Services Occupations
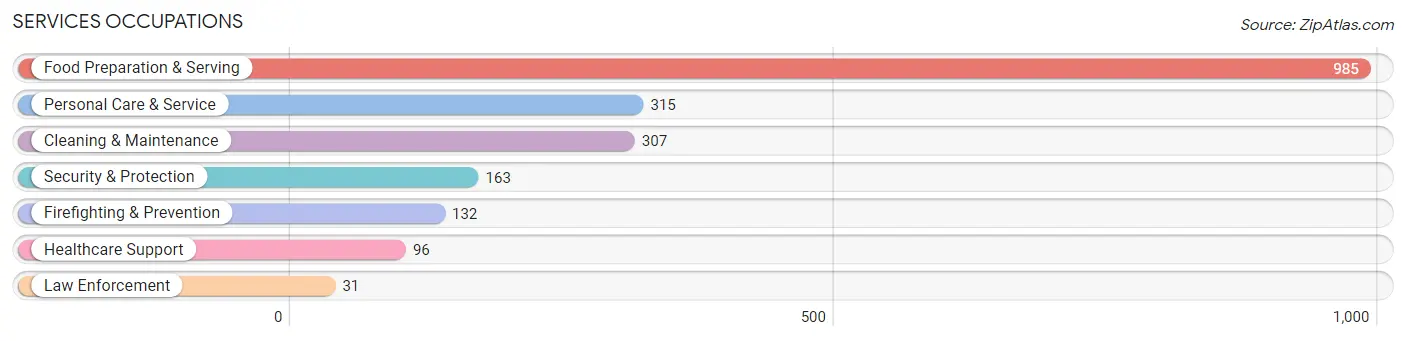
The most common Services occupations in Hunters Creek are Food Preparation & Serving (985 | 8.9%), Personal Care & Service (315 | 2.8%), Cleaning & Maintenance (307 | 2.8%), Security & Protection (163 | 1.5%), and Firefighting & Prevention (132 | 1.2%).
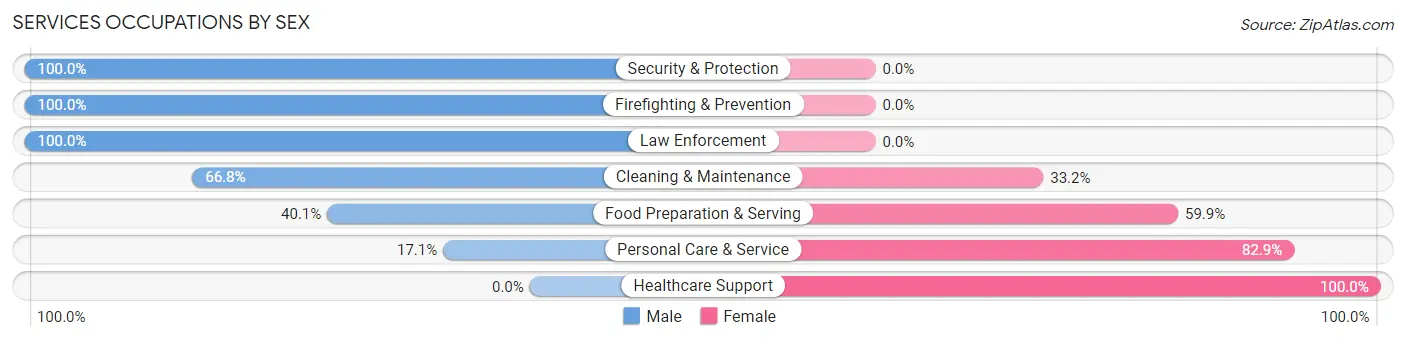
Services Occupations by Sex
Within the Services occupations in Hunters Creek, the most male-oriented occupations are Security & Protection (100.0%), Firefighting & Prevention (100.0%), and Law Enforcement (100.0%), while the most female-oriented occupations are Healthcare Support (100.0%), Personal Care & Service (82.9%), and Food Preparation & Serving (59.9%).
| Occupation | Male | Female |
| Healthcare Support | 0 (0.0%) | 96 (100.0%) |
| Security & Protection | 163 (100.0%) | 0 (0.0%) |
| Firefighting & Prevention | 132 (100.0%) | 0 (0.0%) |
| Law Enforcement | 31 (100.0%) | 0 (0.0%) |
| Food Preparation & Serving | 395 (40.1%) | 590 (59.9%) |
| Cleaning & Maintenance | 205 (66.8%) | 102 (33.2%) |
| Personal Care & Service | 54 (17.1%) | 261 (82.9%) |
| Total (Category) | 817 (43.8%) | 1,049 (56.2%) |
| Total (Overall) | 5,665 (51.1%) | 5,421 (48.9%) |
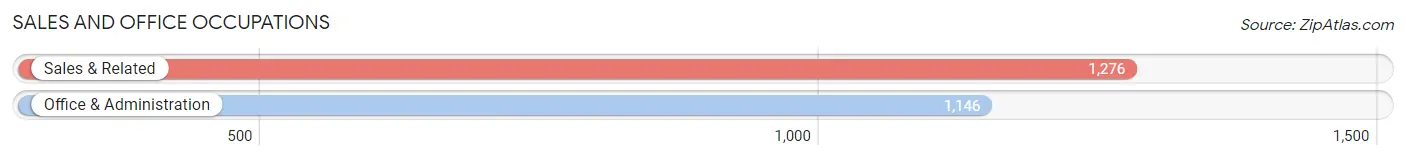
Sales and Office Occupations
The most common Sales and Office occupations in Hunters Creek are Sales & Related (1,276 | 11.5%), and Office & Administration (1,146 | 10.3%).
Sales and Office Occupations by Sex
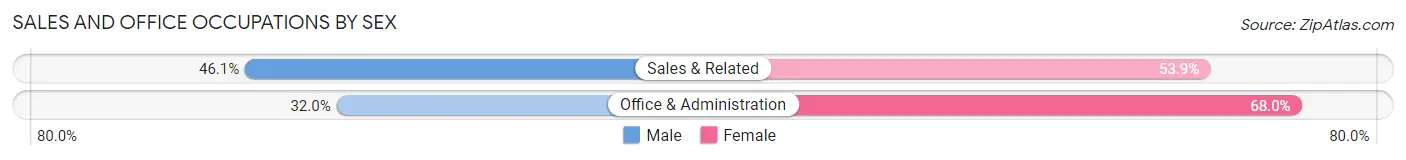
| Occupation | Male | Female |
| Sales & Related | 588 (46.1%) | 688 (53.9%) |
| Office & Administration | 367 (32.0%) | 779 (68.0%) |
| Total (Category) | 955 (39.4%) | 1,467 (60.6%) |
| Total (Overall) | 5,665 (51.1%) | 5,421 (48.9%) |
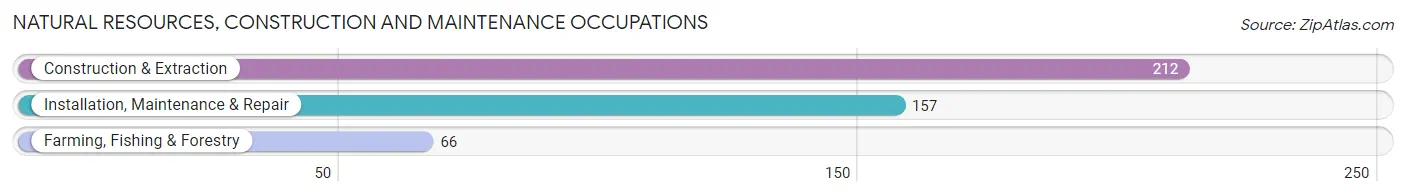
Natural Resources, Construction and Maintenance Occupations
The most common Natural Resources, Construction and Maintenance occupations in Hunters Creek are Construction & Extraction (212 | 1.9%), Installation, Maintenance & Repair (157 | 1.4%), and Farming, Fishing & Forestry (66 | 0.6%).
Natural Resources, Construction and Maintenance Occupations by Sex
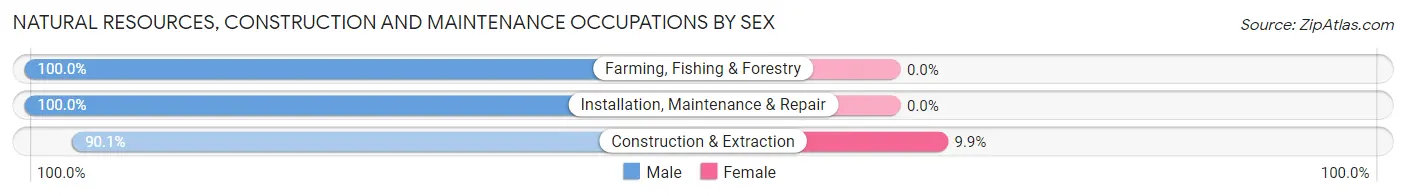
| Occupation | Male | Female |
| Farming, Fishing & Forestry | 66 (100.0%) | 0 (0.0%) |
| Construction & Extraction | 191 (90.1%) | 21 (9.9%) |
| Installation, Maintenance & Repair | 157 (100.0%) | 0 (0.0%) |
| Total (Category) | 414 (95.2%) | 21 (4.8%) |
| Total (Overall) | 5,665 (51.1%) | 5,421 (48.9%) |
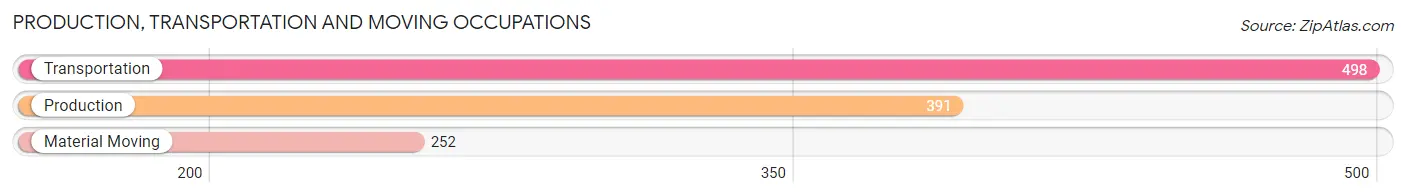
Production, Transportation and Moving Occupations
The most common Production, Transportation and Moving occupations in Hunters Creek are Transportation (498 | 4.5%), Production (391 | 3.5%), and Material Moving (252 | 2.3%).
Production, Transportation and Moving Occupations by Sex
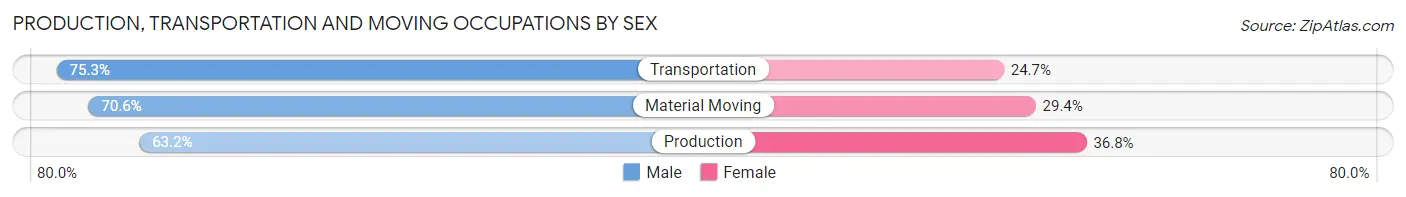
| Occupation | Male | Female |
| Production | 247 (63.2%) | 144 (36.8%) |
| Transportation | 375 (75.3%) | 123 (24.7%) |
| Material Moving | 178 (70.6%) | 74 (29.4%) |
| Total (Category) | 800 (70.1%) | 341 (29.9%) |
| Total (Overall) | 5,665 (51.1%) | 5,421 (48.9%) |
Employment Industries by Sex in Hunters Creek
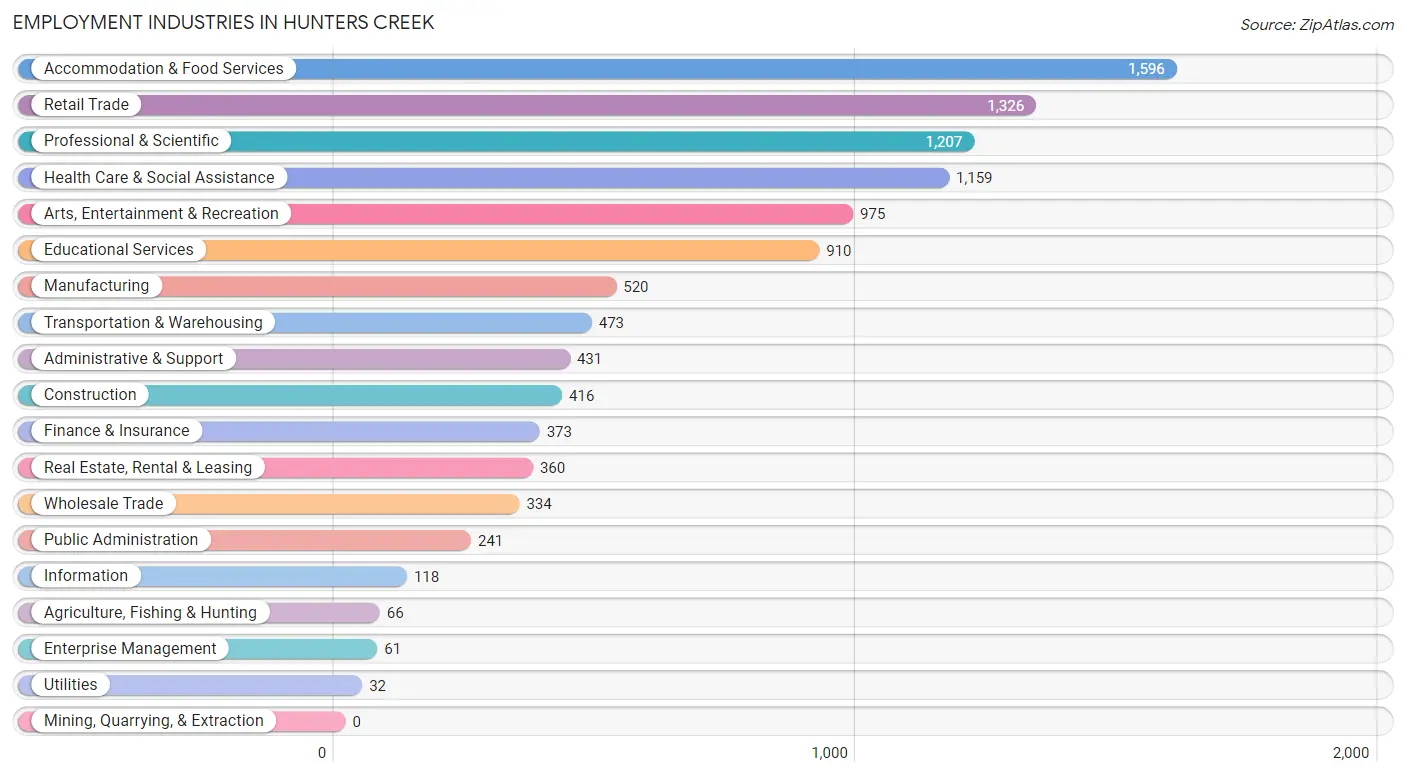
Employment Industries in Hunters Creek
The major employment industries in Hunters Creek include Accommodation & Food Services (1,596 | 14.4%), Retail Trade (1,326 | 12.0%), Professional & Scientific (1,207 | 10.9%), Health Care & Social Assistance (1,159 | 10.4%), and Arts, Entertainment & Recreation (975 | 8.8%).
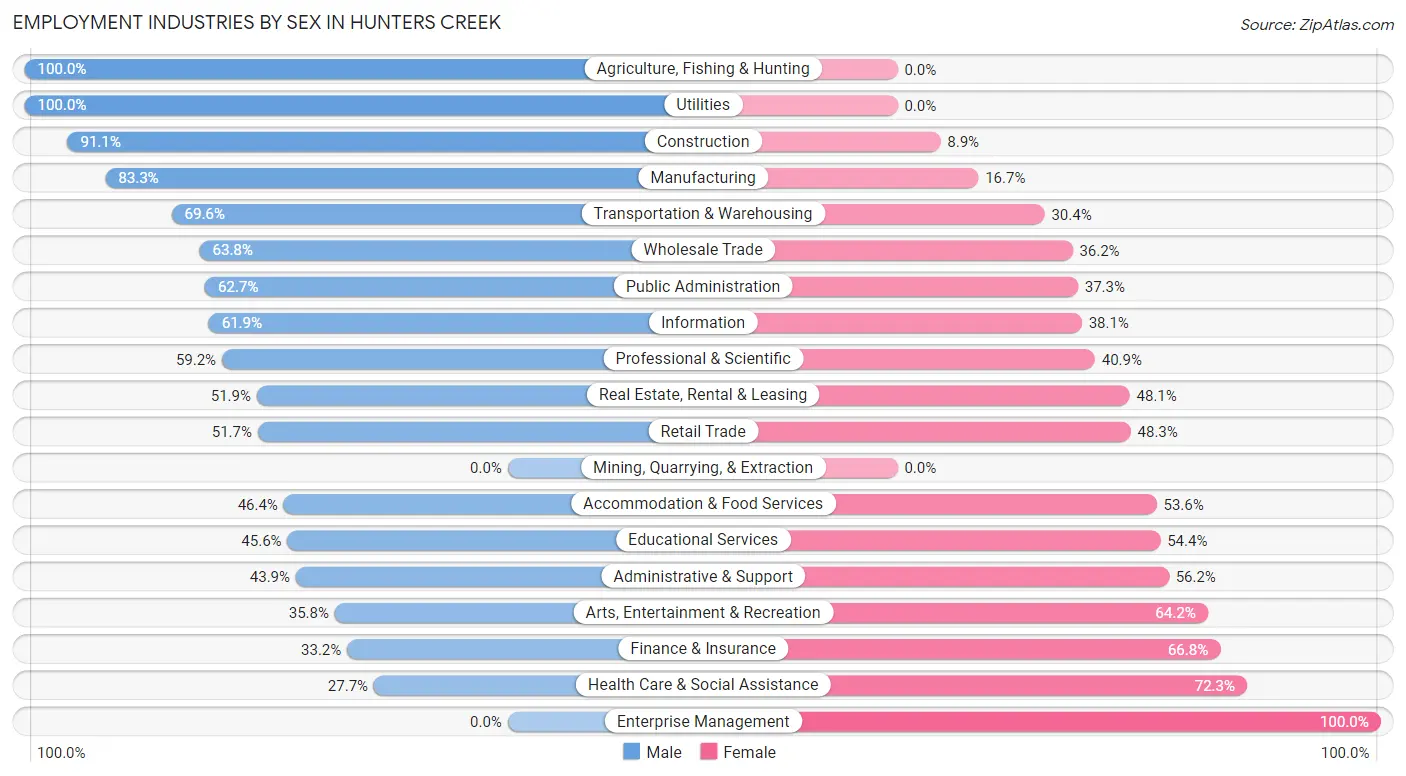
Employment Industries by Sex in Hunters Creek
The Hunters Creek industries that see more men than women are Agriculture, Fishing & Hunting (100.0%), Utilities (100.0%), and Construction (91.1%), whereas the industries that tend to have a higher number of women are Enterprise Management (100.0%), Health Care & Social Assistance (72.3%), and Finance & Insurance (66.8%).
| Industry | Male | Female |
| Agriculture, Fishing & Hunting | 66 (100.0%) | 0 (0.0%) |
| Mining, Quarrying, & Extraction | 0 (0.0%) | 0 (0.0%) |
| Construction | 379 (91.1%) | 37 (8.9%) |
| Manufacturing | 433 (83.3%) | 87 (16.7%) |
| Wholesale Trade | 213 (63.8%) | 121 (36.2%) |
| Retail Trade | 686 (51.7%) | 640 (48.3%) |
| Transportation & Warehousing | 329 (69.6%) | 144 (30.4%) |
| Utilities | 32 (100.0%) | 0 (0.0%) |
| Information | 73 (61.9%) | 45 (38.1%) |
| Finance & Insurance | 124 (33.2%) | 249 (66.8%) |
| Real Estate, Rental & Leasing | 187 (51.9%) | 173 (48.1%) |
| Professional & Scientific | 714 (59.2%) | 493 (40.8%) |
| Enterprise Management | 0 (0.0%) | 61 (100.0%) |
| Administrative & Support | 189 (43.9%) | 242 (56.1%) |
| Educational Services | 415 (45.6%) | 495 (54.4%) |
| Health Care & Social Assistance | 321 (27.7%) | 838 (72.3%) |
| Arts, Entertainment & Recreation | 349 (35.8%) | 626 (64.2%) |
| Accommodation & Food Services | 740 (46.4%) | 856 (53.6%) |
| Public Administration | 151 (62.7%) | 90 (37.3%) |
| Total | 5,665 (51.1%) | 5,421 (48.9%) |
Education in Hunters Creek
School Enrollment in Hunters Creek
The most common levels of schooling among the 5,261 students in Hunters Creek are high school (1,344 | 25.6%), college / undergraduate (1,165 | 22.1%), and elementary school (1,039 | 19.8%).
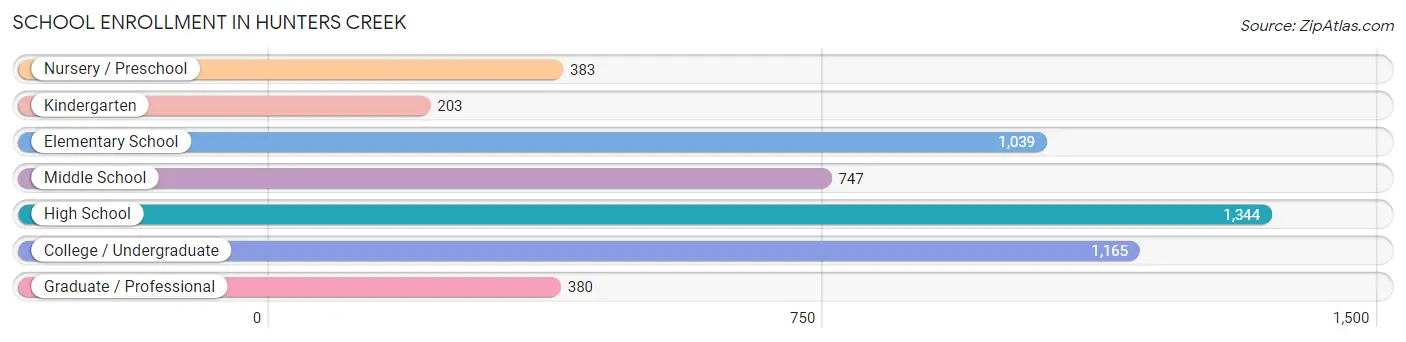
| School Level | # Students | % Students |
| Nursery / Preschool | 383 | 7.3% |
| Kindergarten | 203 | 3.9% |
| Elementary School | 1,039 | 19.8% |
| Middle School | 747 | 14.2% |
| High School | 1,344 | 25.6% |
| College / Undergraduate | 1,165 | 22.1% |
| Graduate / Professional | 380 | 7.2% |
| Total | 5,261 | 100.0% |
School Enrollment by Age by Funding Source in Hunters Creek
Out of a total of 5,261 students who are enrolled in schools in Hunters Creek, 936 (17.8%) attend a private institution, while the remaining 4,325 (82.2%) are enrolled in public schools. The age group of 3 to 4 year olds has the highest likelihood of being enrolled in private schools, with 184 (81.8% in the age bracket) enrolled. Conversely, the age group of 10 to 14 year olds has the lowest likelihood of being enrolled in a private school, with 1,206 (97.1% in the age bracket) attending a public institution.
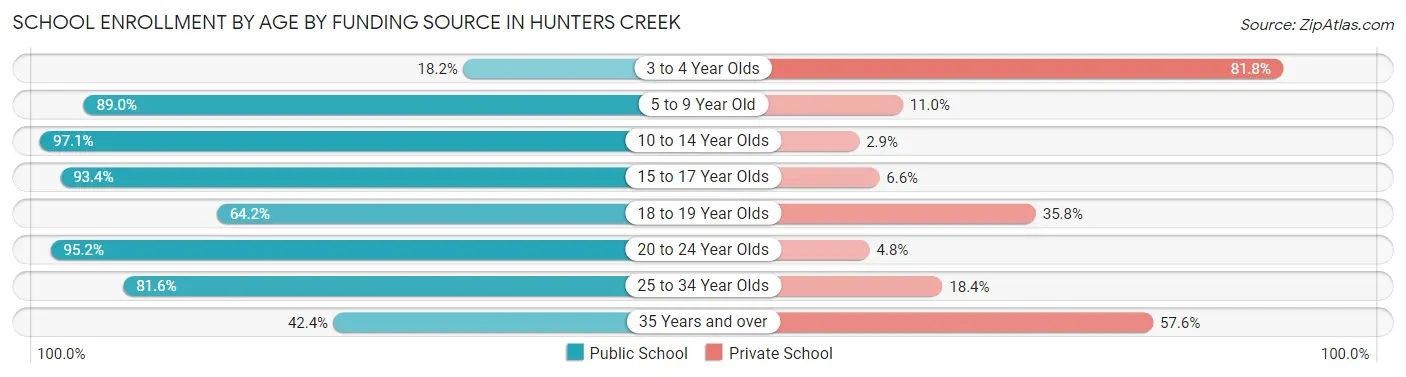
| Age Bracket | Public School | Private School |
| 3 to 4 Year Olds | 41 (18.2%) | 184 (81.8%) |
| 5 to 9 Year Old | 1,164 (89.0%) | 144 (11.0%) |
| 10 to 14 Year Olds | 1,206 (97.1%) | 36 (2.9%) |
| 15 to 17 Year Olds | 661 (93.4%) | 47 (6.6%) |
| 18 to 19 Year Olds | 348 (64.2%) | 194 (35.8%) |
| 20 to 24 Year Olds | 493 (95.2%) | 25 (4.8%) |
| 25 to 34 Year Olds | 222 (81.6%) | 50 (18.4%) |
| 35 Years and over | 189 (42.4%) | 257 (57.6%) |
| Total | 4,325 (82.2%) | 936 (17.8%) |
Educational Attainment by Field of Study in Hunters Creek
Business (2,070 | 28.4%), engineering (896 | 12.3%), computers & mathematics (716 | 9.8%), science & technology (694 | 9.5%), and education (588 | 8.1%) are the most common fields of study among 7,289 individuals in Hunters Creek who have obtained a bachelor's degree or higher.
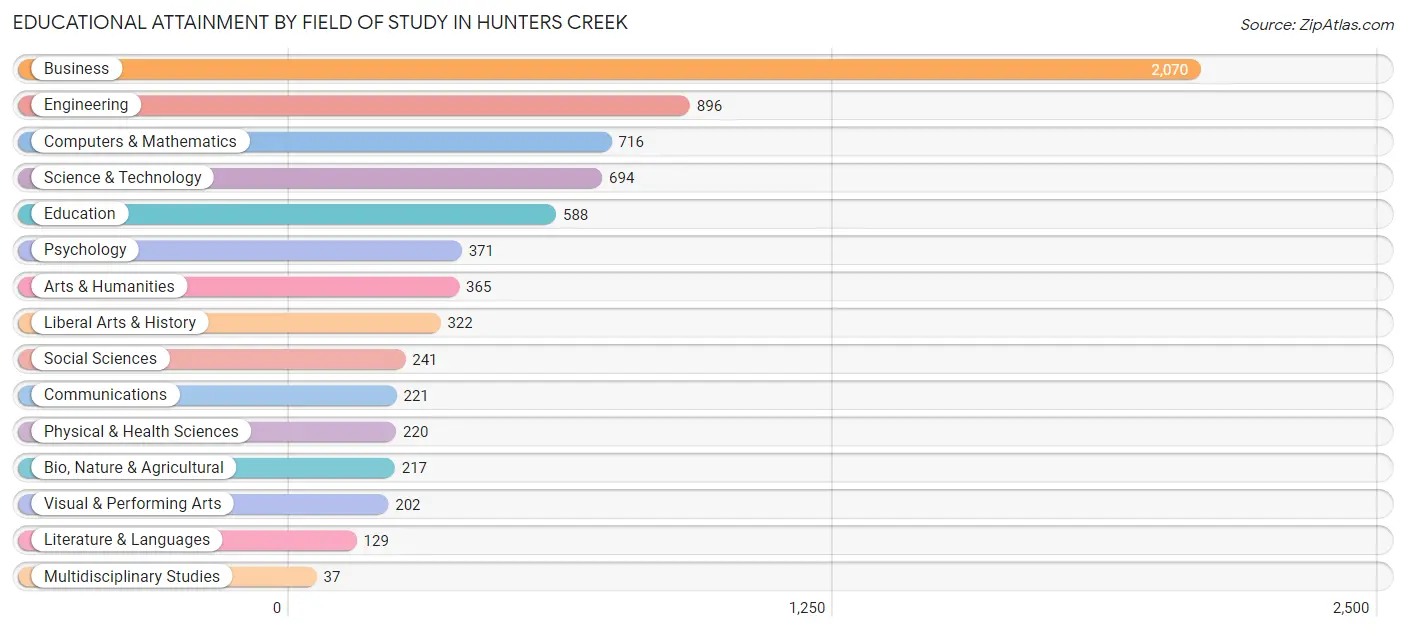
| Field of Study | # Graduates | % Graduates |
| Computers & Mathematics | 716 | 9.8% |
| Bio, Nature & Agricultural | 217 | 3.0% |
| Physical & Health Sciences | 220 | 3.0% |
| Psychology | 371 | 5.1% |
| Social Sciences | 241 | 3.3% |
| Engineering | 896 | 12.3% |
| Multidisciplinary Studies | 37 | 0.5% |
| Science & Technology | 694 | 9.5% |
| Business | 2,070 | 28.4% |
| Education | 588 | 8.1% |
| Literature & Languages | 129 | 1.8% |
| Liberal Arts & History | 322 | 4.4% |
| Visual & Performing Arts | 202 | 2.8% |
| Communications | 221 | 3.0% |
| Arts & Humanities | 365 | 5.0% |
| Total | 7,289 | 100.0% |
Transportation & Commute in Hunters Creek
Vehicle Availability by Sex in Hunters Creek
The most prevalent vehicle ownership categories in Hunters Creek are males with 2 vehicles (2,852, accounting for 51.0%) and females with 2 vehicles (2,092, making up 53.9%).
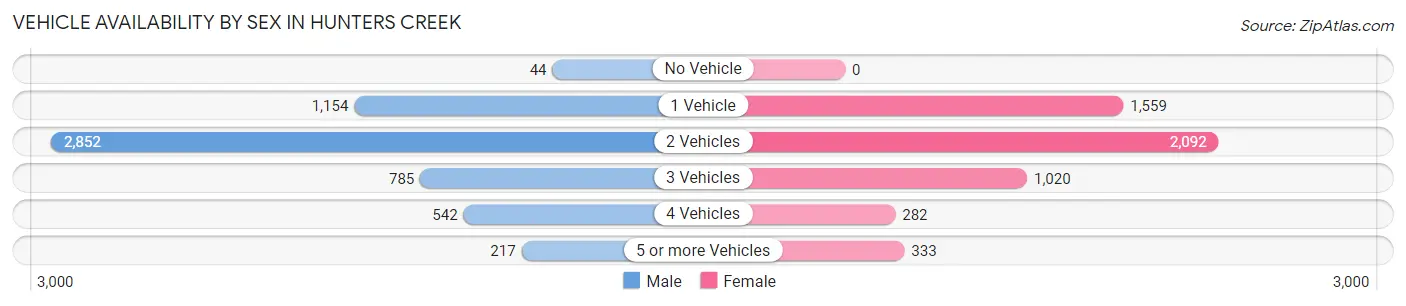
| Vehicles Available | Male | Female |
| No Vehicle | 44 (0.8%) | 0 (0.0%) |
| 1 Vehicle | 1,154 (20.6%) | 1,559 (29.5%) |
| 2 Vehicles | 2,852 (51.0%) | 2,092 (39.6%) |
| 3 Vehicles | 785 (14.0%) | 1,020 (19.3%) |
| 4 Vehicles | 542 (9.7%) | 282 (5.3%) |
| 5 or more Vehicles | 217 (3.9%) | 333 (6.3%) |
| Total | 5,594 (100.0%) | 5,286 (100.0%) |
Commute Time in Hunters Creek
The most frequently occuring commute durations in Hunters Creek are 20 to 24 minutes (2,207 commuters, 23.8%), 30 to 34 minutes (1,578 commuters, 17.0%), and 15 to 19 minutes (1,454 commuters, 15.7%).
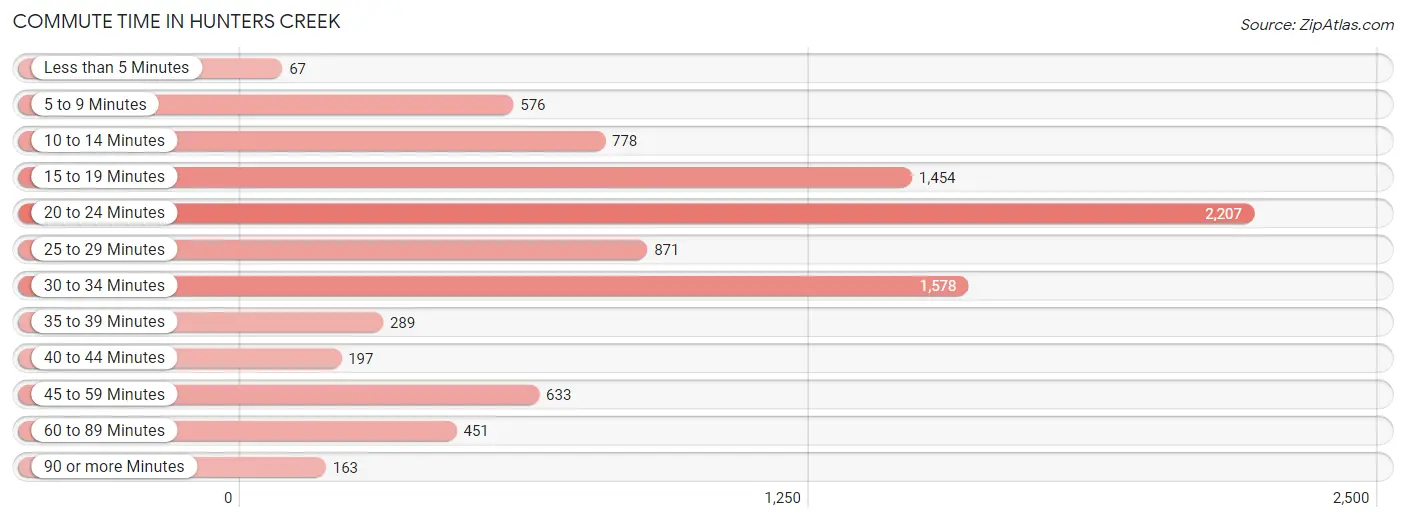
| Commute Time | # Commuters | % Commuters |
| Less than 5 Minutes | 67 | 0.7% |
| 5 to 9 Minutes | 576 | 6.2% |
| 10 to 14 Minutes | 778 | 8.4% |
| 15 to 19 Minutes | 1,454 | 15.7% |
| 20 to 24 Minutes | 2,207 | 23.8% |
| 25 to 29 Minutes | 871 | 9.4% |
| 30 to 34 Minutes | 1,578 | 17.0% |
| 35 to 39 Minutes | 289 | 3.1% |
| 40 to 44 Minutes | 197 | 2.1% |
| 45 to 59 Minutes | 633 | 6.8% |
| 60 to 89 Minutes | 451 | 4.9% |
| 90 or more Minutes | 163 | 1.8% |
Commute Time by Sex in Hunters Creek
The most common commute times in Hunters Creek are 20 to 24 minutes (1,021 commuters, 21.3%) for males and 20 to 24 minutes (1,186 commuters, 26.5%) for females.
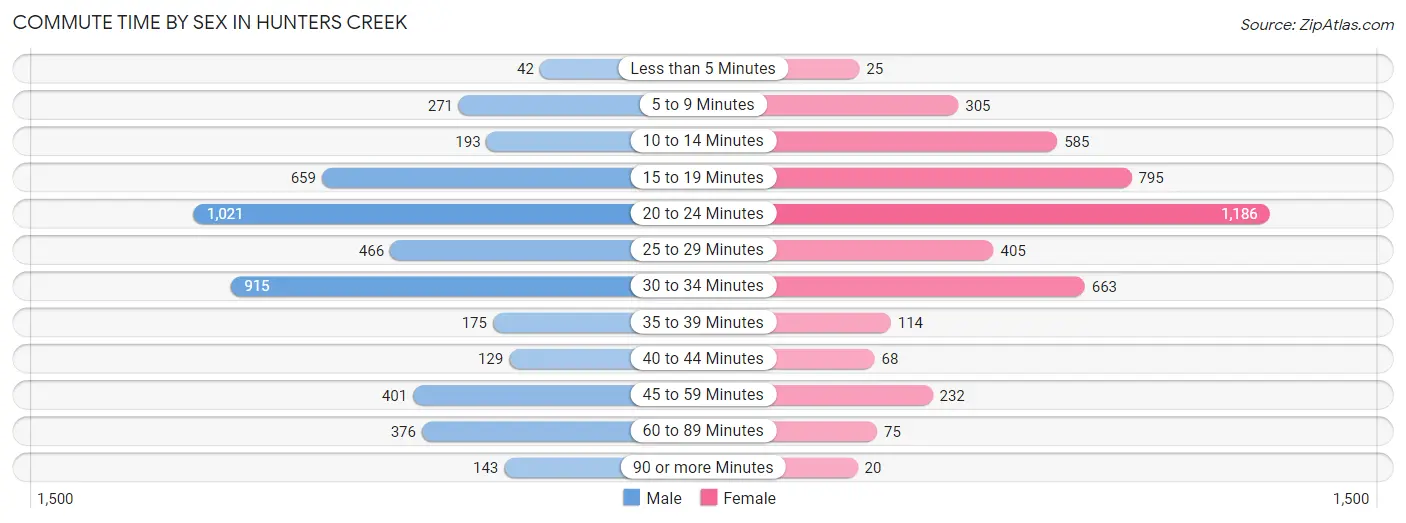
| Commute Time | Male | Female |
| Less than 5 Minutes | 42 (0.9%) | 25 (0.6%) |
| 5 to 9 Minutes | 271 (5.7%) | 305 (6.8%) |
| 10 to 14 Minutes | 193 (4.0%) | 585 (13.1%) |
| 15 to 19 Minutes | 659 (13.8%) | 795 (17.8%) |
| 20 to 24 Minutes | 1,021 (21.3%) | 1,186 (26.5%) |
| 25 to 29 Minutes | 466 (9.7%) | 405 (9.0%) |
| 30 to 34 Minutes | 915 (19.1%) | 663 (14.8%) |
| 35 to 39 Minutes | 175 (3.6%) | 114 (2.5%) |
| 40 to 44 Minutes | 129 (2.7%) | 68 (1.5%) |
| 45 to 59 Minutes | 401 (8.4%) | 232 (5.2%) |
| 60 to 89 Minutes | 376 (7.9%) | 75 (1.7%) |
| 90 or more Minutes | 143 (3.0%) | 20 (0.4%) |
Time of Departure to Work by Sex in Hunters Creek
The most frequent times of departure to work in Hunters Creek are 8:00 AM to 8:29 AM (885, 18.5%) for males and 9:00 AM to 9:59 AM (732, 16.4%) for females.
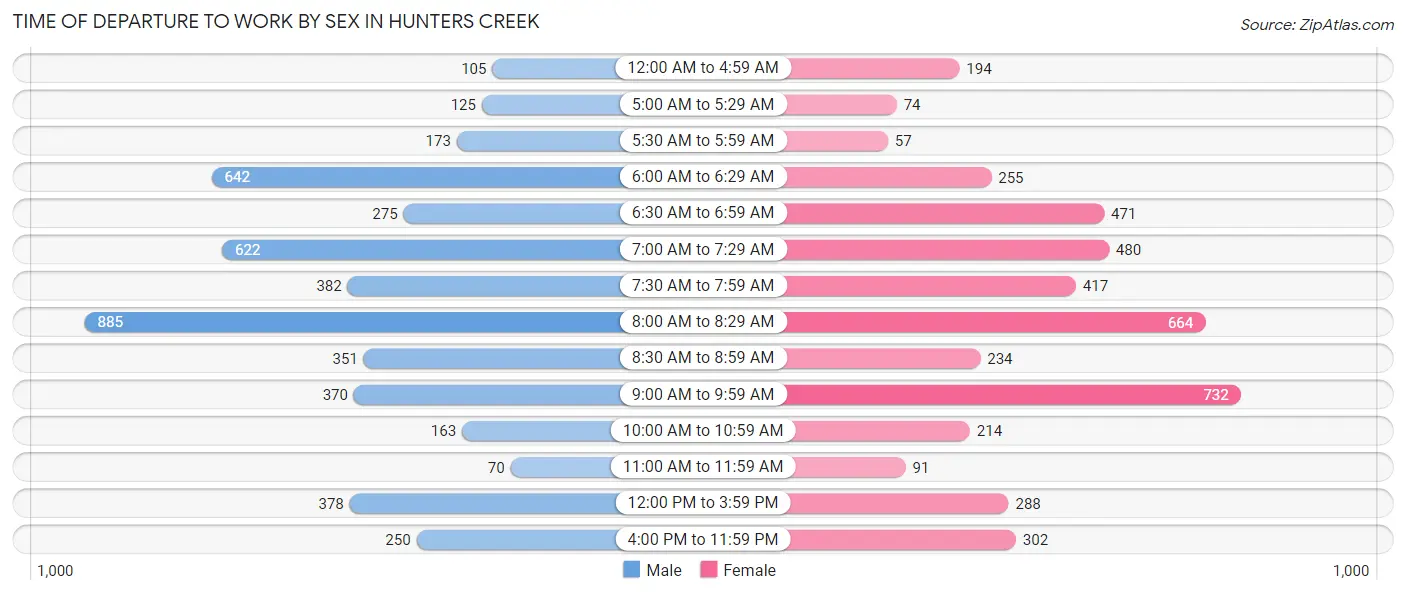
| Time of Departure | Male | Female |
| 12:00 AM to 4:59 AM | 105 (2.2%) | 194 (4.3%) |
| 5:00 AM to 5:29 AM | 125 (2.6%) | 74 (1.7%) |
| 5:30 AM to 5:59 AM | 173 (3.6%) | 57 (1.3%) |
| 6:00 AM to 6:29 AM | 642 (13.4%) | 255 (5.7%) |
| 6:30 AM to 6:59 AM | 275 (5.7%) | 471 (10.5%) |
| 7:00 AM to 7:29 AM | 622 (13.0%) | 480 (10.7%) |
| 7:30 AM to 7:59 AM | 382 (8.0%) | 417 (9.3%) |
| 8:00 AM to 8:29 AM | 885 (18.5%) | 664 (14.8%) |
| 8:30 AM to 8:59 AM | 351 (7.3%) | 234 (5.2%) |
| 9:00 AM to 9:59 AM | 370 (7.7%) | 732 (16.4%) |
| 10:00 AM to 10:59 AM | 163 (3.4%) | 214 (4.8%) |
| 11:00 AM to 11:59 AM | 70 (1.5%) | 91 (2.0%) |
| 12:00 PM to 3:59 PM | 378 (7.9%) | 288 (6.4%) |
| 4:00 PM to 11:59 PM | 250 (5.2%) | 302 (6.8%) |
| Total | 4,791 (100.0%) | 4,473 (100.0%) |
Housing Occupancy in Hunters Creek
Occupancy by Ownership in Hunters Creek
Of the total 6,620 dwellings in Hunters Creek, owner-occupied units account for 3,728 (56.3%), while renter-occupied units make up 2,892 (43.7%).
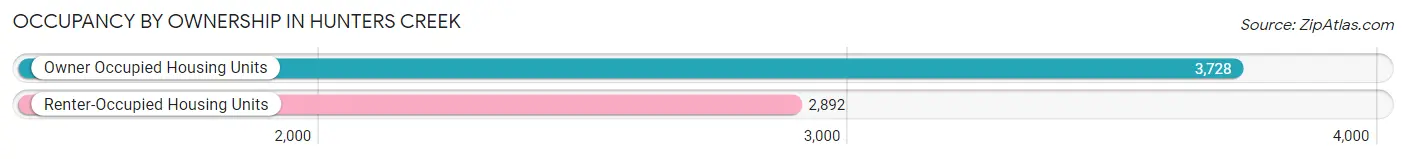
| Occupancy | # Housing Units | % Housing Units |
| Owner Occupied Housing Units | 3,728 | 56.3% |
| Renter-Occupied Housing Units | 2,892 | 43.7% |
| Total Occupied Housing Units | 6,620 | 100.0% |
Occupancy by Household Size in Hunters Creek
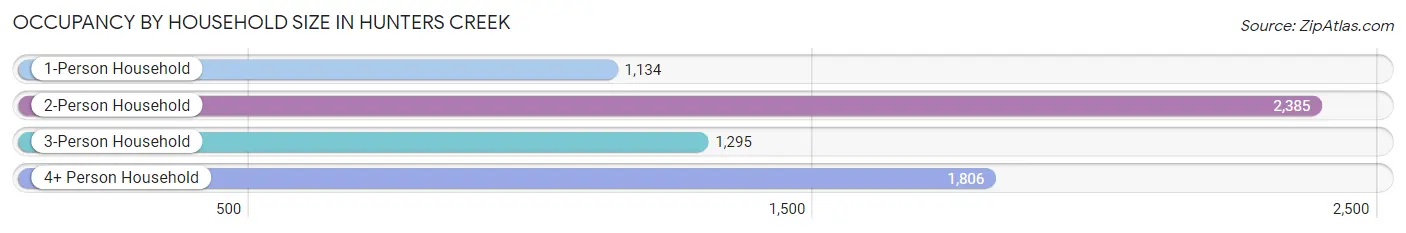
| Household Size | # Housing Units | % Housing Units |
| 1-Person Household | 1,134 | 17.1% |
| 2-Person Household | 2,385 | 36.0% |
| 3-Person Household | 1,295 | 19.6% |
| 4+ Person Household | 1,806 | 27.3% |
| Total Housing Units | 6,620 | 100.0% |
Occupancy by Ownership by Household Size in Hunters Creek
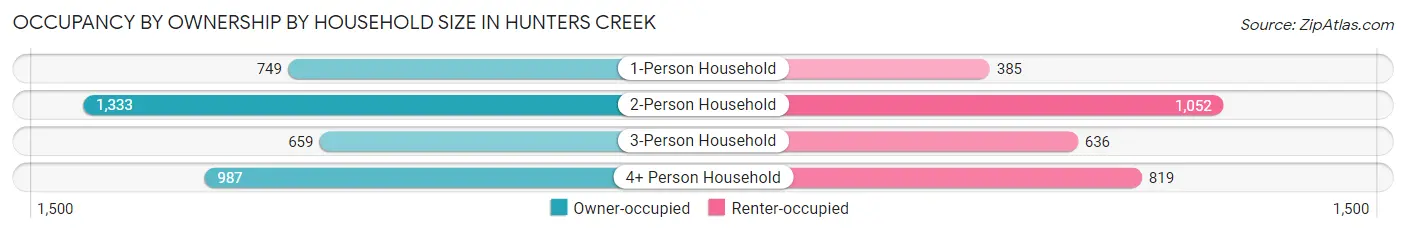
| Household Size | Owner-occupied | Renter-occupied |
| 1-Person Household | 749 (66.0%) | 385 (34.0%) |
| 2-Person Household | 1,333 (55.9%) | 1,052 (44.1%) |
| 3-Person Household | 659 (50.9%) | 636 (49.1%) |
| 4+ Person Household | 987 (54.6%) | 819 (45.4%) |
| Total Housing Units | 3,728 (56.3%) | 2,892 (43.7%) |
Occupancy by Educational Attainment in Hunters Creek
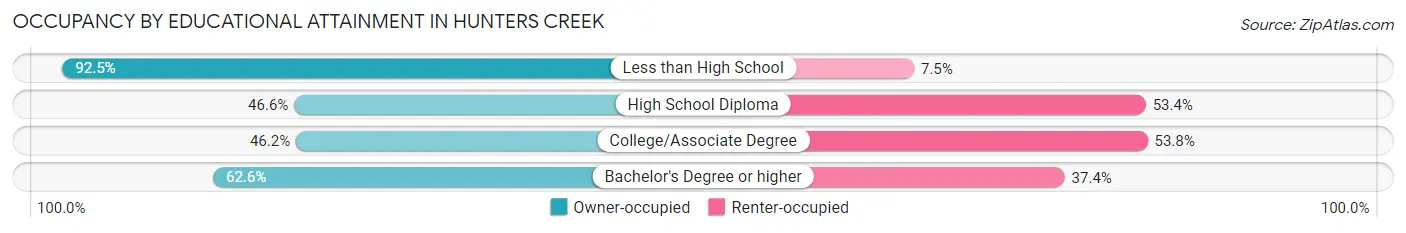
| Household Size | Owner-occupied | Renter-occupied |
| Less than High School | 148 (92.5%) | 12 (7.5%) |
| High School Diploma | 393 (46.6%) | 451 (53.4%) |
| College/Associate Degree | 928 (46.2%) | 1,081 (53.8%) |
| Bachelor's Degree or higher | 2,259 (62.6%) | 1,348 (37.4%) |
Occupancy by Age of Householder in Hunters Creek
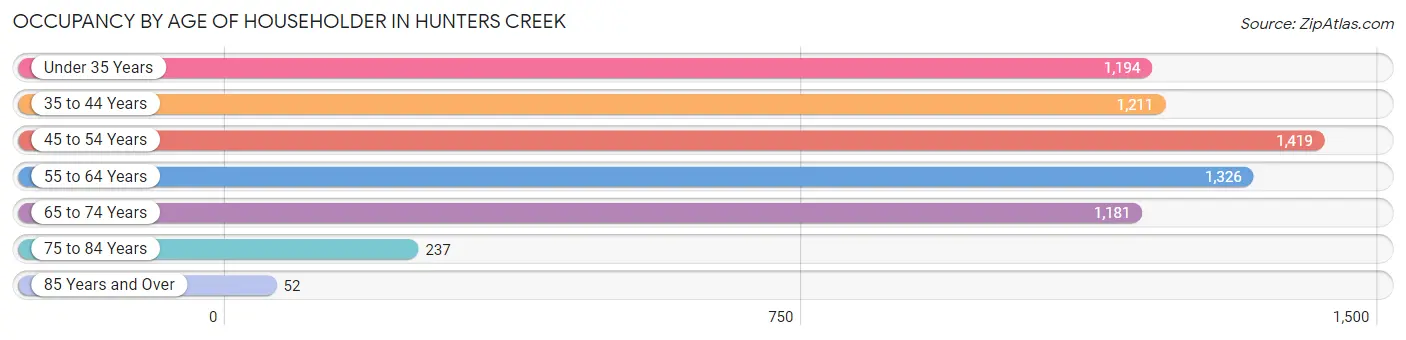
| Age Bracket | # Households | % Households |
| Under 35 Years | 1,194 | 18.0% |
| 35 to 44 Years | 1,211 | 18.3% |
| 45 to 54 Years | 1,419 | 21.4% |
| 55 to 64 Years | 1,326 | 20.0% |
| 65 to 74 Years | 1,181 | 17.8% |
| 75 to 84 Years | 237 | 3.6% |
| 85 Years and Over | 52 | 0.8% |
| Total | 6,620 | 100.0% |
Housing Finances in Hunters Creek
Median Income by Occupancy in Hunters Creek
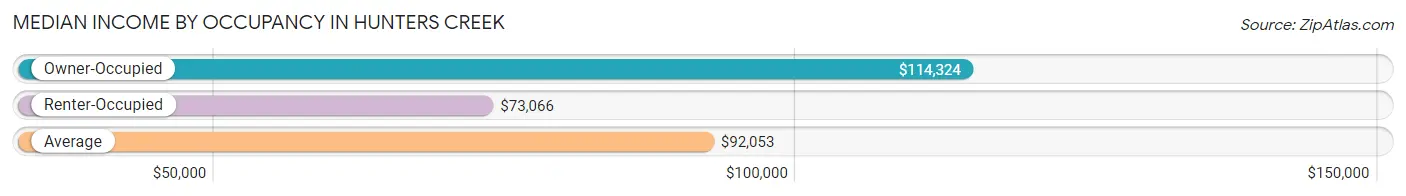
| Occupancy Type | # Households | Median Income |
| Owner-Occupied | 3,728 (56.3%) | $114,324 |
| Renter-Occupied | 2,892 (43.7%) | $73,066 |
| Average | 6,620 (100.0%) | $92,053 |
Occupancy by Householder Income Bracket in Hunters Creek
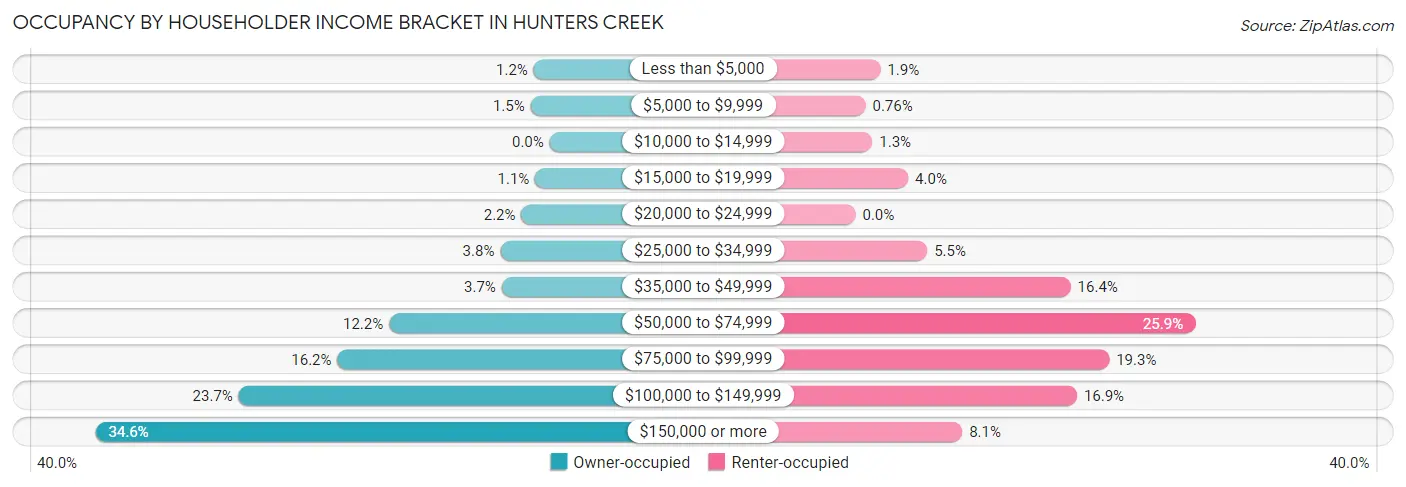
| Income Bracket | Owner-occupied | Renter-occupied |
| Less than $5,000 | 45 (1.2%) | 55 (1.9%) |
| $5,000 to $9,999 | 54 (1.5%) | 22 (0.8%) |
| $10,000 to $14,999 | 0 (0.0%) | 37 (1.3%) |
| $15,000 to $19,999 | 41 (1.1%) | 116 (4.0%) |
| $20,000 to $24,999 | 80 (2.1%) | 0 (0.0%) |
| $25,000 to $34,999 | 140 (3.8%) | 158 (5.5%) |
| $35,000 to $49,999 | 136 (3.6%) | 474 (16.4%) |
| $50,000 to $74,999 | 456 (12.2%) | 748 (25.9%) |
| $75,000 to $99,999 | 603 (16.2%) | 559 (19.3%) |
| $100,000 to $149,999 | 883 (23.7%) | 488 (16.9%) |
| $150,000 or more | 1,290 (34.6%) | 235 (8.1%) |
| Total | 3,728 (100.0%) | 2,892 (100.0%) |
Monthly Housing Cost Tiers in Hunters Creek
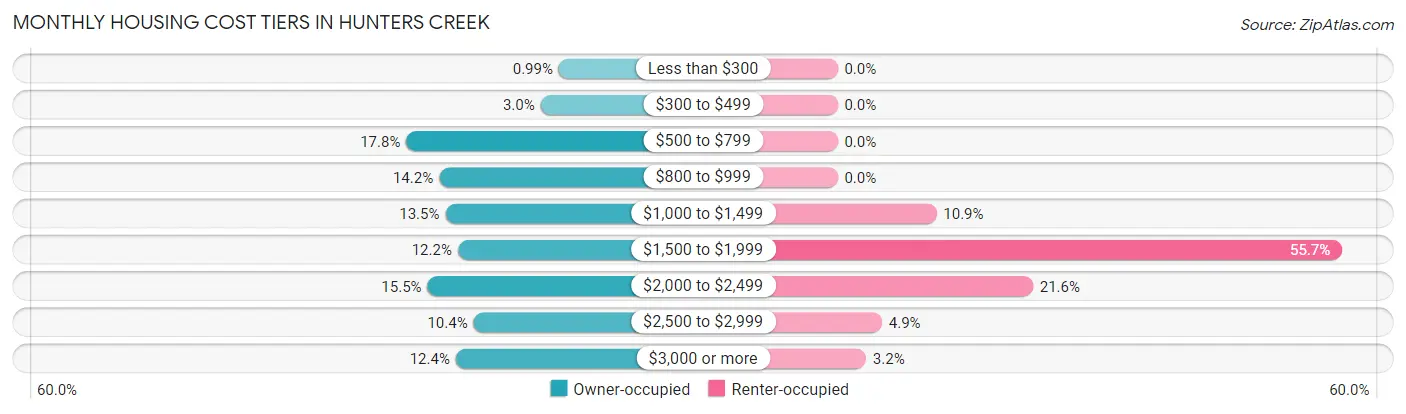
| Monthly Cost | Owner-occupied | Renter-occupied |
| Less than $300 | 37 (1.0%) | 0 (0.0%) |
| $300 to $499 | 112 (3.0%) | 0 (0.0%) |
| $500 to $799 | 665 (17.8%) | 0 (0.0%) |
| $800 to $999 | 530 (14.2%) | 0 (0.0%) |
| $1,000 to $1,499 | 504 (13.5%) | 316 (10.9%) |
| $1,500 to $1,999 | 453 (12.1%) | 1,612 (55.7%) |
| $2,000 to $2,499 | 578 (15.5%) | 624 (21.6%) |
| $2,500 to $2,999 | 388 (10.4%) | 142 (4.9%) |
| $3,000 or more | 461 (12.4%) | 91 (3.2%) |
| Total | 3,728 (100.0%) | 2,892 (100.0%) |
Physical Housing Characteristics in Hunters Creek
Housing Structures in Hunters Creek
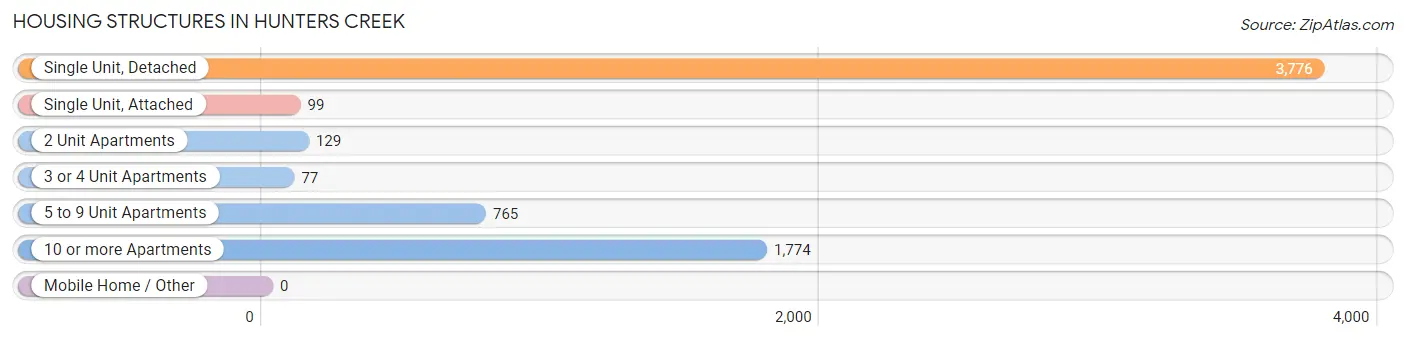
| Structure Type | # Housing Units | % Housing Units |
| Single Unit, Detached | 3,776 | 57.0% |
| Single Unit, Attached | 99 | 1.5% |
| 2 Unit Apartments | 129 | 1.9% |
| 3 or 4 Unit Apartments | 77 | 1.2% |
| 5 to 9 Unit Apartments | 765 | 11.6% |
| 10 or more Apartments | 1,774 | 26.8% |
| Mobile Home / Other | 0 | 0.0% |
| Total | 6,620 | 100.0% |
Housing Structures by Occupancy in Hunters Creek
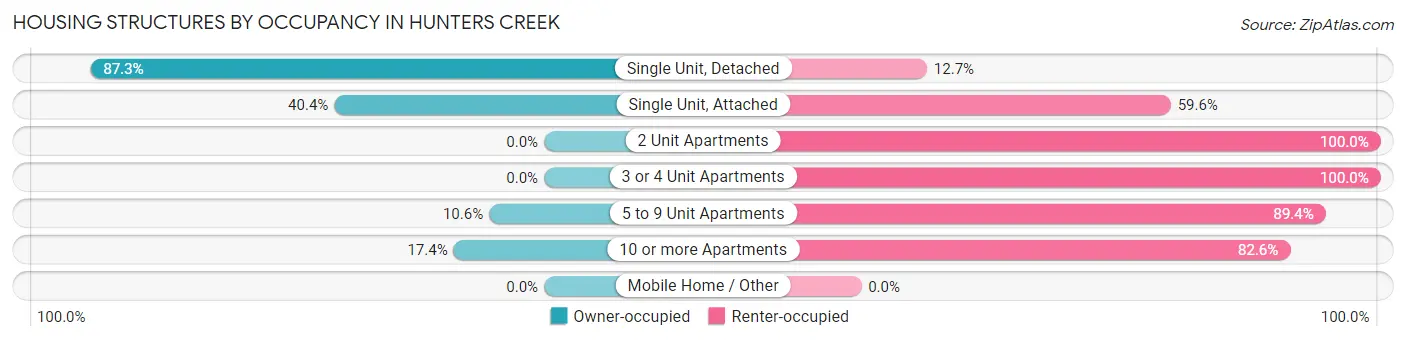
| Structure Type | Owner-occupied | Renter-occupied |
| Single Unit, Detached | 3,298 (87.3%) | 478 (12.7%) |
| Single Unit, Attached | 40 (40.4%) | 59 (59.6%) |
| 2 Unit Apartments | 0 (0.0%) | 129 (100.0%) |
| 3 or 4 Unit Apartments | 0 (0.0%) | 77 (100.0%) |
| 5 to 9 Unit Apartments | 81 (10.6%) | 684 (89.4%) |
| 10 or more Apartments | 309 (17.4%) | 1,465 (82.6%) |
| Mobile Home / Other | 0 (0.0%) | 0 (0.0%) |
| Total | 3,728 (56.3%) | 2,892 (43.7%) |
Housing Structures by Number of Rooms in Hunters Creek
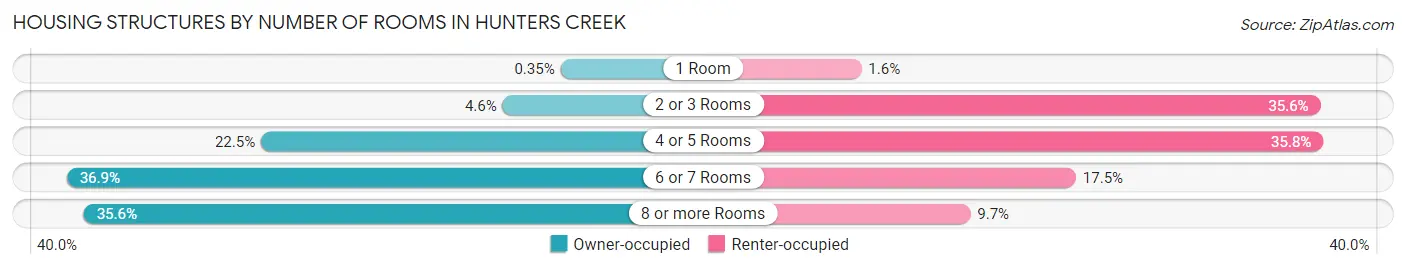
| Number of Rooms | Owner-occupied | Renter-occupied |
| 1 Room | 13 (0.4%) | 46 (1.6%) |
| 2 or 3 Rooms | 173 (4.6%) | 1,028 (35.5%) |
| 4 or 5 Rooms | 839 (22.5%) | 1,034 (35.7%) |
| 6 or 7 Rooms | 1,375 (36.9%) | 505 (17.5%) |
| 8 or more Rooms | 1,328 (35.6%) | 279 (9.7%) |
| Total | 3,728 (100.0%) | 2,892 (100.0%) |
Housing Structure by Heating Type in Hunters Creek
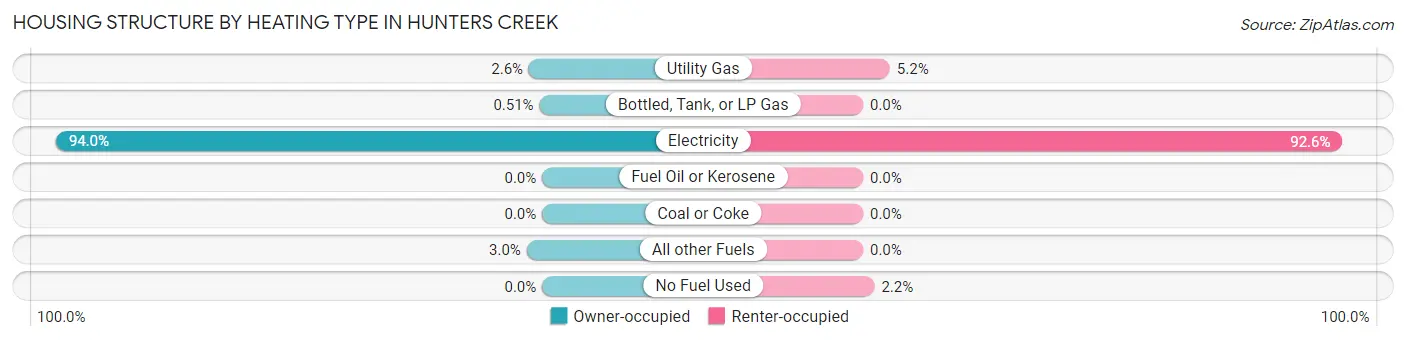
| Heating Type | Owner-occupied | Renter-occupied |
| Utility Gas | 95 (2.5%) | 150 (5.2%) |
| Bottled, Tank, or LP Gas | 19 (0.5%) | 0 (0.0%) |
| Electricity | 3,503 (94.0%) | 2,678 (92.6%) |
| Fuel Oil or Kerosene | 0 (0.0%) | 0 (0.0%) |
| Coal or Coke | 0 (0.0%) | 0 (0.0%) |
| All other Fuels | 111 (3.0%) | 0 (0.0%) |
| No Fuel Used | 0 (0.0%) | 64 (2.2%) |
| Total | 3,728 (100.0%) | 2,892 (100.0%) |
Household Vehicle Usage in Hunters Creek
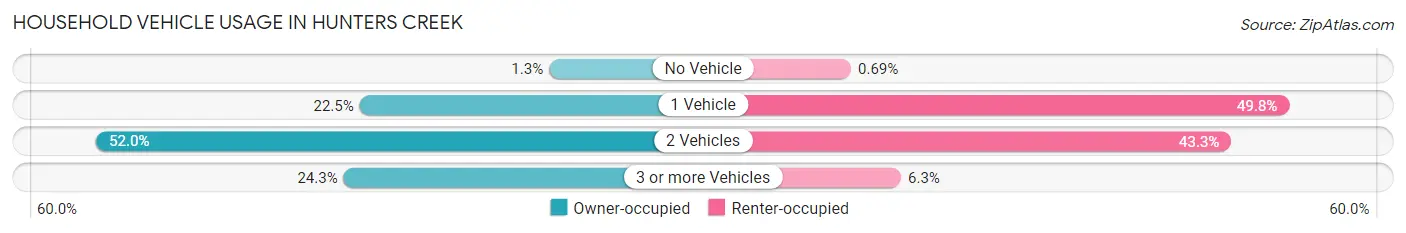
| Vehicles per Household | Owner-occupied | Renter-occupied |
| No Vehicle | 47 (1.3%) | 20 (0.7%) |
| 1 Vehicle | 838 (22.5%) | 1,439 (49.8%) |
| 2 Vehicles | 1,938 (52.0%) | 1,251 (43.3%) |
| 3 or more Vehicles | 905 (24.3%) | 182 (6.3%) |
| Total | 3,728 (100.0%) | 2,892 (100.0%) |
Real Estate & Mortgages in Hunters Creek
Real Estate and Mortgage Overview in Hunters Creek
| Characteristic | Without Mortgage | With Mortgage |
| Housing Units | 1,274 | 2,454 |
| Median Property Value | $368,400 | $399,300 |
| Median Household Income | $84,176 | $907 |
| Monthly Housing Costs | $760 | $461 |
| Real Estate Taxes | $3,109 | $46 |
Property Value by Mortgage Status in Hunters Creek
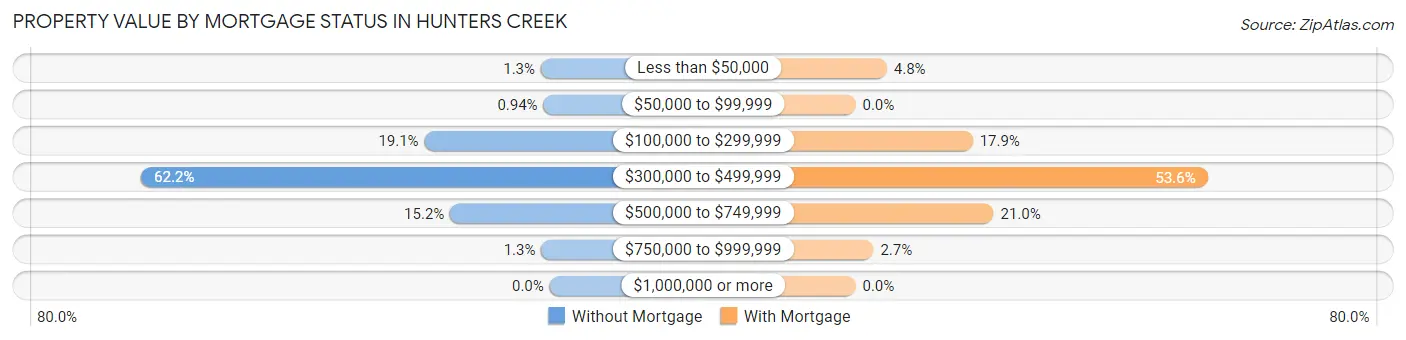
| Property Value | Without Mortgage | With Mortgage |
| Less than $50,000 | 17 (1.3%) | 117 (4.8%) |
| $50,000 to $99,999 | 12 (0.9%) | 0 (0.0%) |
| $100,000 to $299,999 | 243 (19.1%) | 438 (17.8%) |
| $300,000 to $499,999 | 793 (62.2%) | 1,316 (53.6%) |
| $500,000 to $749,999 | 193 (15.1%) | 516 (21.0%) |
| $750,000 to $999,999 | 16 (1.3%) | 67 (2.7%) |
| $1,000,000 or more | 0 (0.0%) | 0 (0.0%) |
| Total | 1,274 (100.0%) | 2,454 (100.0%) |
Household Income by Mortgage Status in Hunters Creek
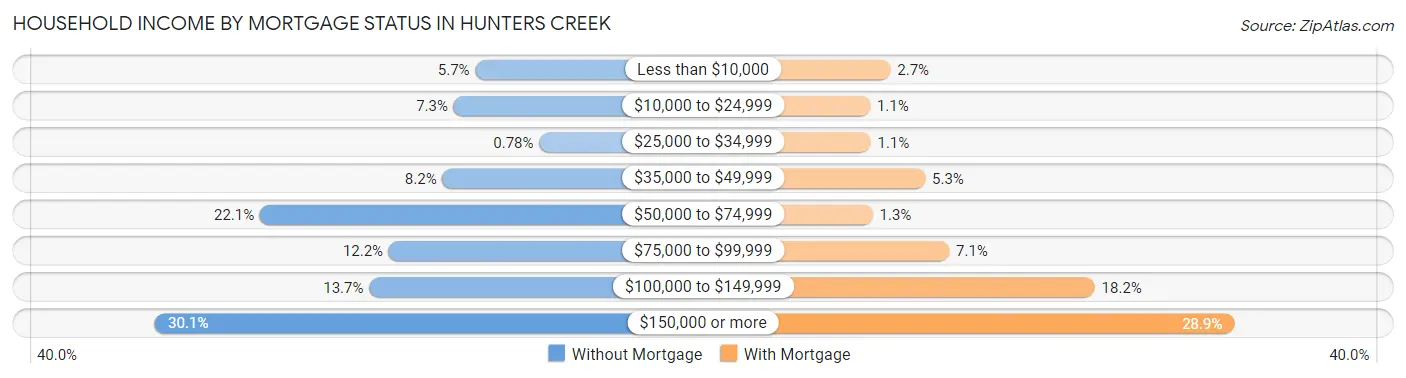
| Household Income | Without Mortgage | With Mortgage |
| Less than $10,000 | 72 (5.7%) | 65 (2.6%) |
| $10,000 to $24,999 | 93 (7.3%) | 27 (1.1%) |
| $25,000 to $34,999 | 10 (0.8%) | 28 (1.1%) |
| $35,000 to $49,999 | 104 (8.2%) | 130 (5.3%) |
| $50,000 to $74,999 | 281 (22.1%) | 32 (1.3%) |
| $75,000 to $99,999 | 156 (12.2%) | 175 (7.1%) |
| $100,000 to $149,999 | 175 (13.7%) | 447 (18.2%) |
| $150,000 or more | 383 (30.1%) | 708 (28.8%) |
| Total | 1,274 (100.0%) | 2,454 (100.0%) |
Property Value to Household Income Ratio in Hunters Creek
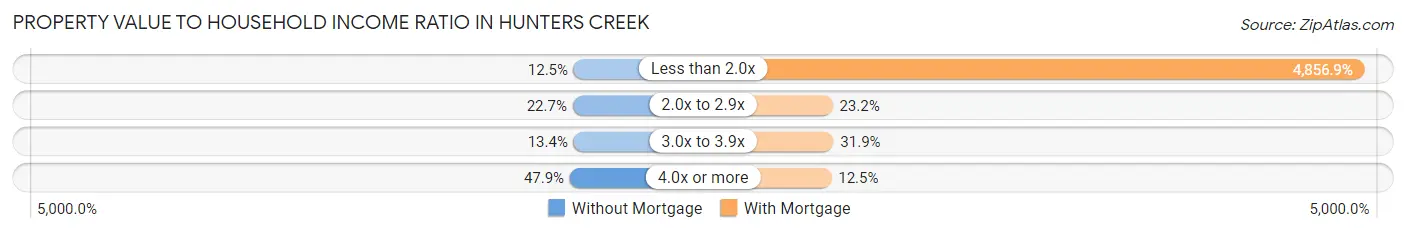
| Value-to-Income Ratio | Without Mortgage | With Mortgage |
| Less than 2.0x | 159 (12.5%) | 119,189 (4,856.9%) |
| 2.0x to 2.9x | 289 (22.7%) | 568 (23.2%) |
| 3.0x to 3.9x | 171 (13.4%) | 782 (31.9%) |
| 4.0x or more | 610 (47.9%) | 307 (12.5%) |
| Total | 1,274 (100.0%) | 2,454 (100.0%) |
Real Estate Taxes by Mortgage Status in Hunters Creek
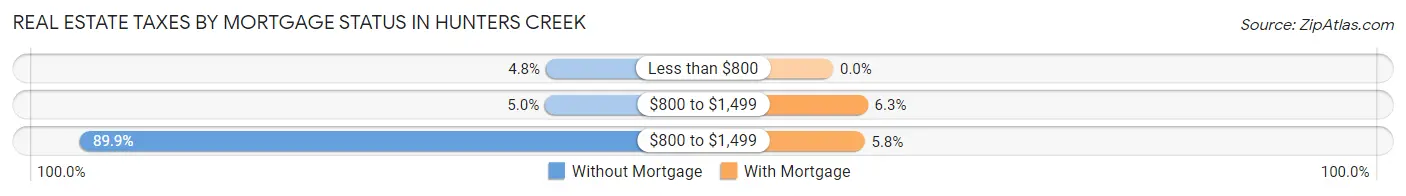
| Property Taxes | Without Mortgage | With Mortgage |
| Less than $800 | 61 (4.8%) | 0 (0.0%) |
| $800 to $1,499 | 63 (5.0%) | 155 (6.3%) |
| $800 to $1,499 | 1,145 (89.9%) | 141 (5.8%) |
| Total | 1,274 (100.0%) | 2,454 (100.0%) |
Health & Disability in Hunters Creek
Health Insurance Coverage by Age in Hunters Creek
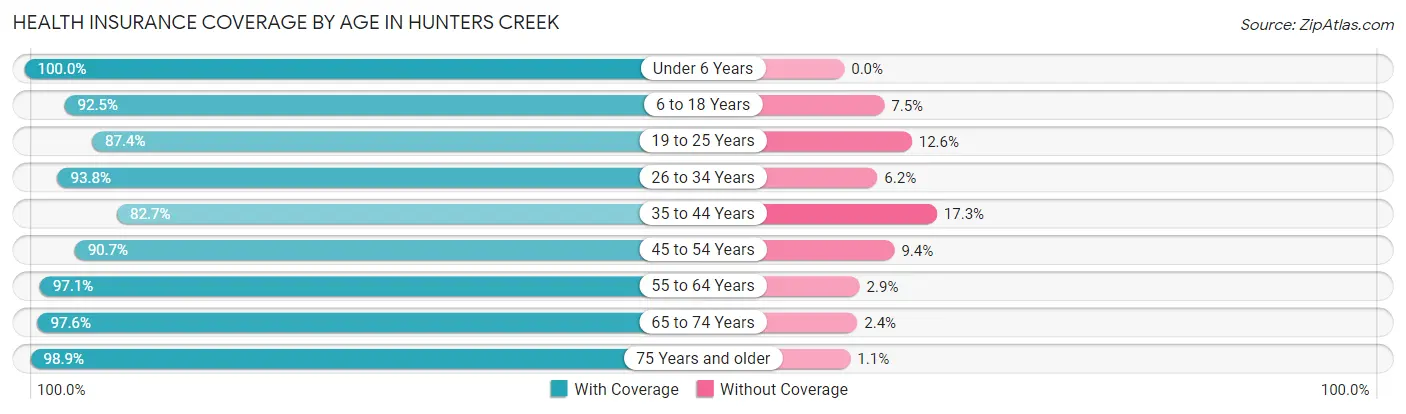
| Age Bracket | With Coverage | Without Coverage |
| Under 6 Years | 1,039 (100.0%) | 0 (0.0%) |
| 6 to 18 Years | 3,270 (92.5%) | 264 (7.5%) |
| 19 to 25 Years | 1,528 (87.4%) | 220 (12.6%) |
| 26 to 34 Years | 2,311 (93.8%) | 152 (6.2%) |
| 35 to 44 Years | 2,376 (82.7%) | 496 (17.3%) |
| 45 to 54 Years | 2,561 (90.6%) | 264 (9.3%) |
| 55 to 64 Years | 2,547 (97.1%) | 75 (2.9%) |
| 65 to 74 Years | 1,971 (97.6%) | 49 (2.4%) |
| 75 Years and older | 606 (98.9%) | 7 (1.1%) |
| Total | 18,209 (92.3%) | 1,527 (7.7%) |
Health Insurance Coverage by Citizenship Status in Hunters Creek
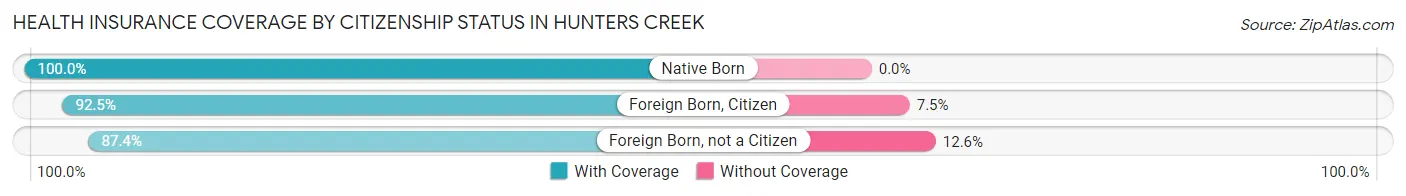
| Citizenship Status | With Coverage | Without Coverage |
| Native Born | 1,039 (100.0%) | 0 (0.0%) |
| Foreign Born, Citizen | 3,270 (92.5%) | 264 (7.5%) |
| Foreign Born, not a Citizen | 1,528 (87.4%) | 220 (12.6%) |
Health Insurance Coverage by Household Income in Hunters Creek
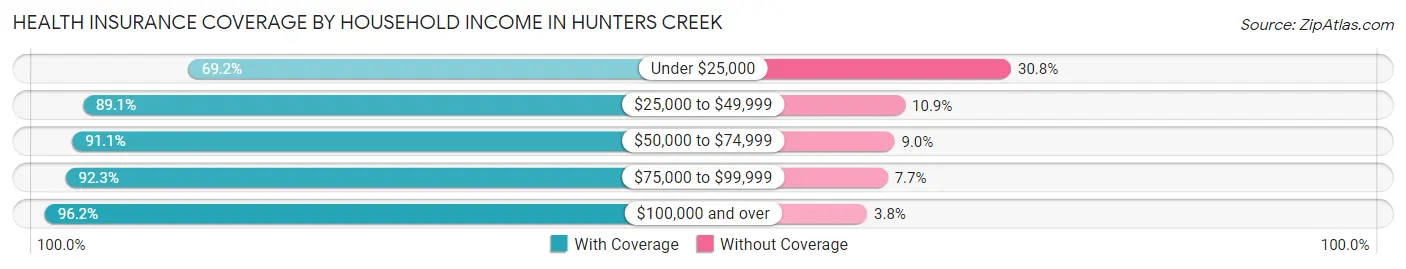
| Household Income | With Coverage | Without Coverage |
| Under $25,000 | 675 (69.2%) | 300 (30.8%) |
| $25,000 to $49,999 | 2,848 (89.1%) | 349 (10.9%) |
| $50,000 to $74,999 | 2,868 (91.0%) | 282 (8.9%) |
| $75,000 to $99,999 | 2,972 (92.3%) | 247 (7.7%) |
| $100,000 and over | 8,846 (96.2%) | 349 (3.8%) |
Public vs Private Health Insurance Coverage by Age in Hunters Creek
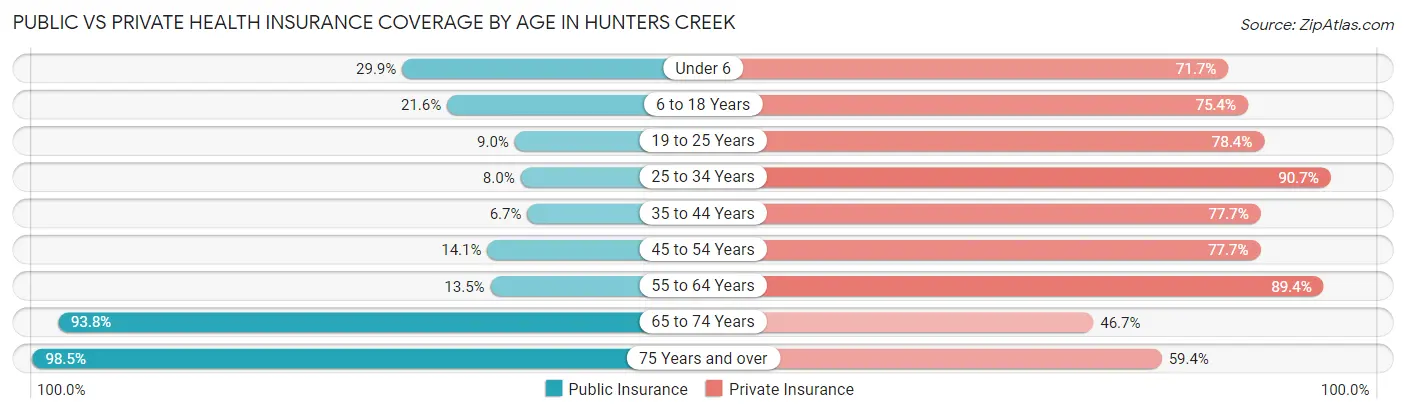
| Age Bracket | Public Insurance | Private Insurance |
| Under 6 | 311 (29.9%) | 745 (71.7%) |
| 6 to 18 Years | 763 (21.6%) | 2,663 (75.3%) |
| 19 to 25 Years | 158 (9.0%) | 1,370 (78.4%) |
| 25 to 34 Years | 196 (8.0%) | 2,234 (90.7%) |
| 35 to 44 Years | 192 (6.7%) | 2,232 (77.7%) |
| 45 to 54 Years | 399 (14.1%) | 2,194 (77.7%) |
| 55 to 64 Years | 355 (13.5%) | 2,344 (89.4%) |
| 65 to 74 Years | 1,895 (93.8%) | 943 (46.7%) |
| 75 Years and over | 604 (98.5%) | 364 (59.4%) |
| Total | 4,873 (24.7%) | 15,089 (76.4%) |
Disability Status by Sex by Age in Hunters Creek
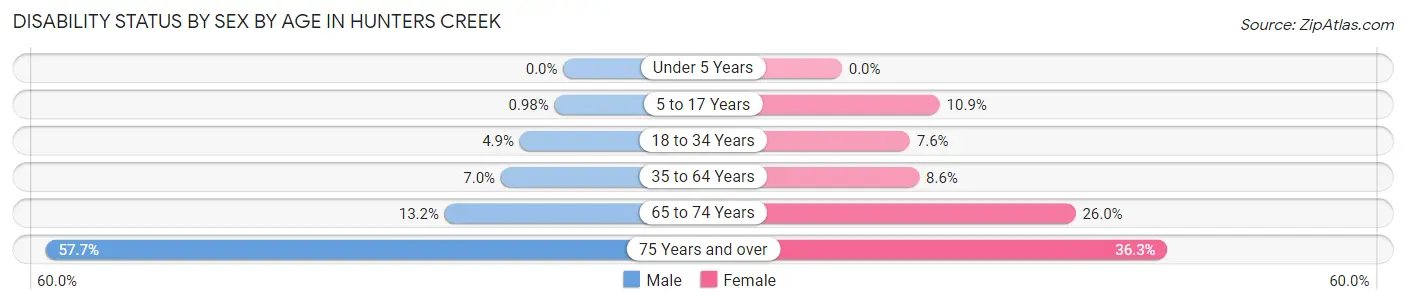
| Age Bracket | Male | Female |
| Under 5 Years | 0 (0.0%) | 0 (0.0%) |
| 5 to 17 Years | 14 (1.0%) | 204 (10.9%) |
| 18 to 34 Years | 117 (4.9%) | 176 (7.6%) |
| 35 to 64 Years | 278 (7.0%) | 372 (8.6%) |
| 65 to 74 Years | 115 (13.2%) | 299 (26.0%) |
| 75 Years and over | 196 (57.7%) | 99 (36.3%) |
Disability Class by Sex by Age in Hunters Creek
Disability Class: Hearing Difficulty
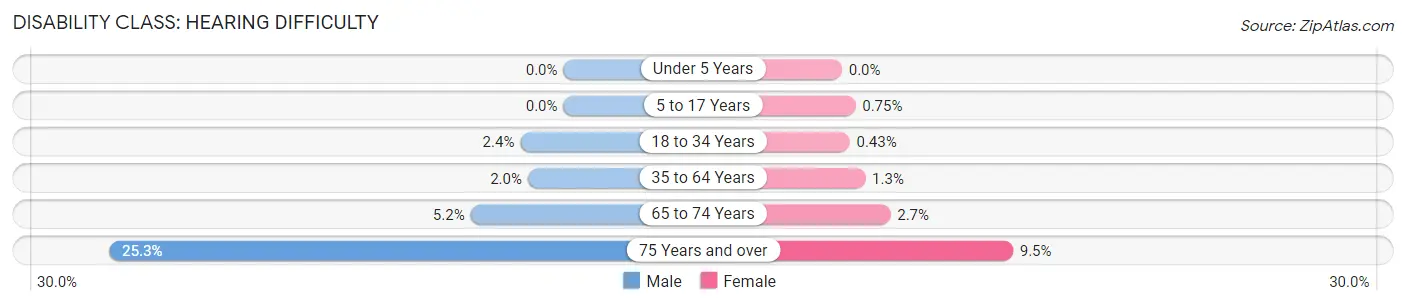
| Age Bracket | Male | Female |
| Under 5 Years | 0 (0.0%) | 0 (0.0%) |
| 5 to 17 Years | 0 (0.0%) | 14 (0.7%) |
| 18 to 34 Years | 58 (2.4%) | 10 (0.4%) |
| 35 to 64 Years | 79 (2.0%) | 56 (1.3%) |
| 65 to 74 Years | 45 (5.2%) | 31 (2.7%) |
| 75 Years and over | 86 (25.3%) | 26 (9.5%) |
Disability Class: Vision Difficulty
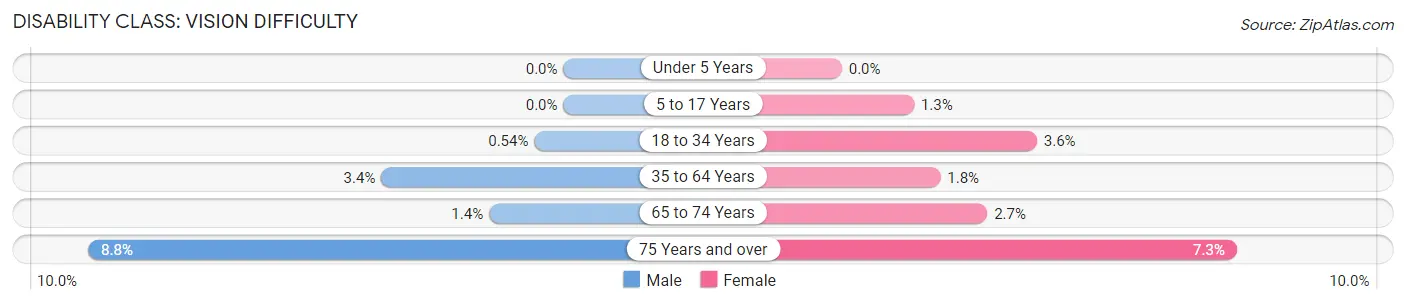
| Age Bracket | Male | Female |
| Under 5 Years | 0 (0.0%) | 0 (0.0%) |
| 5 to 17 Years | 0 (0.0%) | 25 (1.3%) |
| 18 to 34 Years | 13 (0.5%) | 84 (3.6%) |
| 35 to 64 Years | 135 (3.4%) | 79 (1.8%) |
| 65 to 74 Years | 12 (1.4%) | 31 (2.7%) |
| 75 Years and over | 30 (8.8%) | 20 (7.3%) |
Disability Class: Cognitive Difficulty
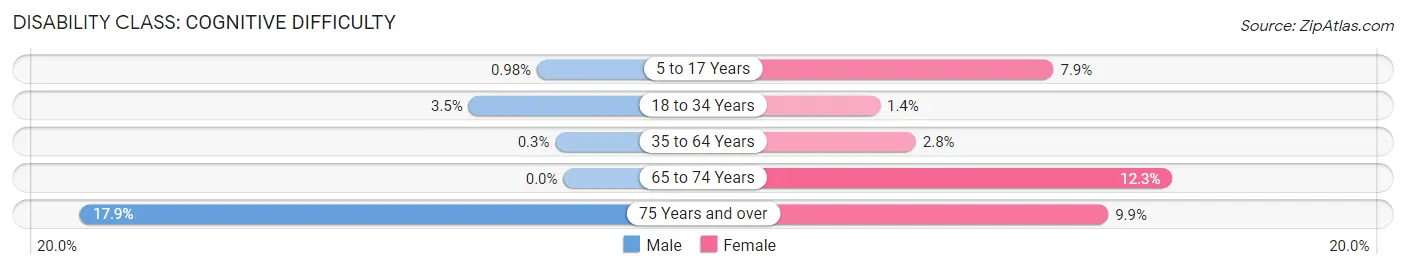
| Age Bracket | Male | Female |
| 5 to 17 Years | 14 (1.0%) | 147 (7.9%) |
| 18 to 34 Years | 85 (3.5%) | 33 (1.4%) |
| 35 to 64 Years | 12 (0.3%) | 119 (2.8%) |
| 65 to 74 Years | 0 (0.0%) | 141 (12.3%) |
| 75 Years and over | 61 (17.9%) | 27 (9.9%) |
Disability Class: Ambulatory Difficulty
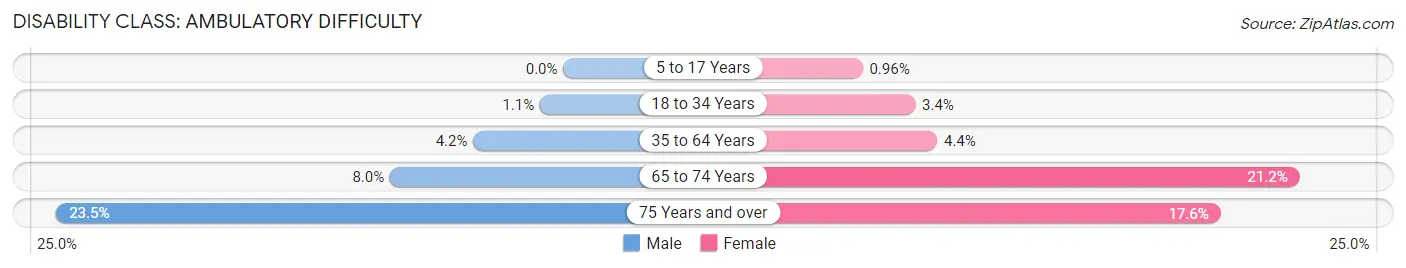
| Age Bracket | Male | Female |
| 5 to 17 Years | 0 (0.0%) | 18 (1.0%) |
| 18 to 34 Years | 26 (1.1%) | 79 (3.4%) |
| 35 to 64 Years | 167 (4.2%) | 191 (4.4%) |
| 65 to 74 Years | 70 (8.0%) | 244 (21.2%) |
| 75 Years and over | 80 (23.5%) | 48 (17.6%) |
Disability Class: Self-Care Difficulty
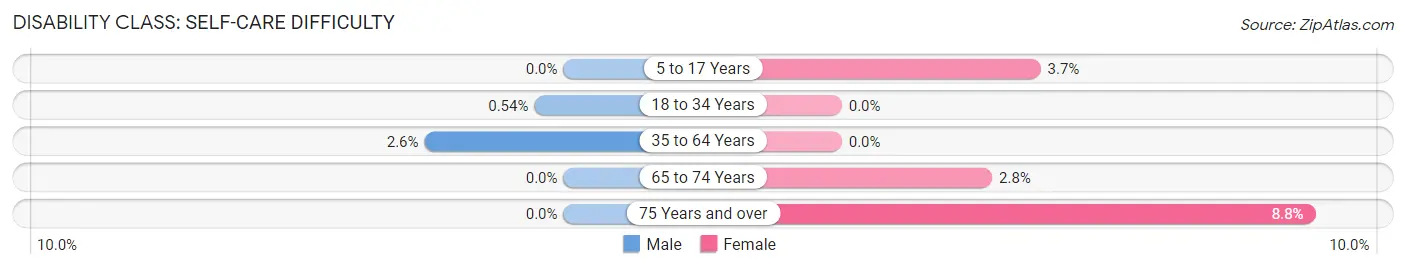
| Age Bracket | Male | Female |
| 5 to 17 Years | 0 (0.0%) | 69 (3.7%) |
| 18 to 34 Years | 13 (0.5%) | 0 (0.0%) |
| 35 to 64 Years | 103 (2.6%) | 0 (0.0%) |
| 65 to 74 Years | 0 (0.0%) | 32 (2.8%) |
| 75 Years and over | 0 (0.0%) | 24 (8.8%) |
Technology Access in Hunters Creek
Computing Device Access in Hunters Creek
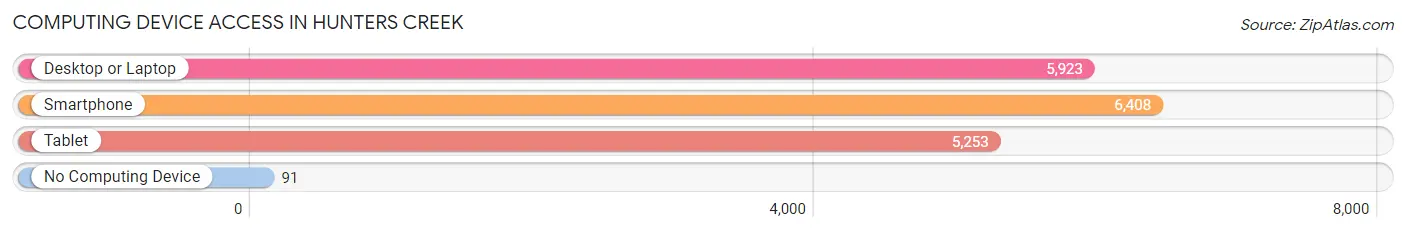
| Device Type | # Households | % Households |
| Desktop or Laptop | 5,923 | 89.5% |
| Smartphone | 6,408 | 96.8% |
| Tablet | 5,253 | 79.3% |
| No Computing Device | 91 | 1.4% |
| Total | 6,620 | 100.0% |
Internet Access in Hunters Creek
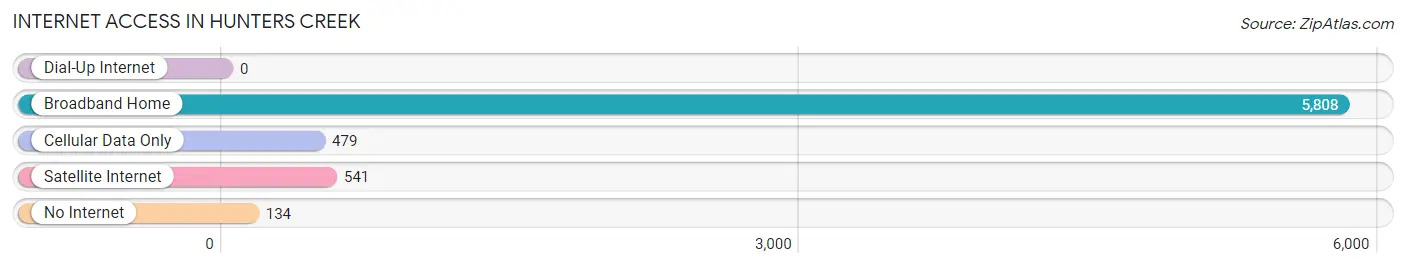
| Internet Type | # Households | % Households |
| Dial-Up Internet | 0 | 0.0% |
| Broadband Home | 5,808 | 87.7% |
| Cellular Data Only | 479 | 7.2% |
| Satellite Internet | 541 | 8.2% |
| No Internet | 134 | 2.0% |
| Total | 6,620 | 100.0% |
Hunters Creek Summary
Hunters Creek, Florida is a census-designated place located in Orange County, Florida. It is part of the Orlando-Kissimmee-Sanford Metropolitan Statistical Area. The population was 13,722 at the 2010 census.
History
Hunters Creek was originally part of the land grant given to William and Mary Burch in 1845. The land was used for cattle ranching and citrus farming. In the 1950s, the area was developed as a residential community. The first homes were built in the area in 1956. The community was named after the creek that runs through it, which was named after the local Native American tribe, the Creek Indians.
Geography
Hunters Creek is located at 28°20'25" North, 81°25'45" West (28.340278, -81.429167). It is bordered by the cities of Orlando, Kissimmee, and St. Cloud. The total area of Hunters Creek is 8.3 square miles, of which 8.2 square miles is land and 0.1 square miles is water.
Economy
Hunters Creek is a primarily residential community, with most of its residents employed in the nearby cities of Orlando, Kissimmee, and St. Cloud. The area is home to several corporate headquarters, including Darden Restaurants, Tupperware Brands, and Wyndham Vacation Ownership. The area also has several shopping centers, including the Hunters Creek Town Center and the Loop Shopping Center.
Demographics
As of the 2010 census, there were 13,722 people, 5,845 households, and 3,845 families residing in Hunters Creek. The population density was 1,664.7 people per square mile. The racial makeup of the CDP was 77.2% White, 8.2% African American, 0.3% Native American, 8.2% Asian, 0.1% Pacific Islander, 2.7% from other races, and 3.3% from two or more races. Hispanic or Latino of any race were 11.2% of the population.
The median income for a household in Hunters Creek was $76,945, and the median income for a family was $90,945. Males had a median income of $60,945 versus $41,945 for females. The per capita income for the CDP was $37,945. About 3.2% of families and 4.7% of the population were below the poverty line, including 5.3% of those under age 18 and 4.2% of those age 65 or over.
Common Questions
What is Per Capita Income in Hunters Creek?
Per Capita income in Hunters Creek is $39,396.
What is the Median Family Income in Hunters Creek?
Median Family Income in Hunters Creek is $96,544.
What is the Median Household income in Hunters Creek?
Median Household Income in Hunters Creek is $92,053.
What is Income or Wage Gap in Hunters Creek?
Income or Wage Gap in Hunters Creek is 37.5%.
Women in Hunters Creek earn 62.5 cents for every dollar earned by a man.
What is Family Income Deficit in Hunters Creek?
Family Income Deficit in Hunters Creek is $12,162.
Families that are below poverty line in Hunters Creek earn $12,162 less on average than the poverty threshold level.
What is Inequality or Gini Index in Hunters Creek?
Inequality or Gini Index in Hunters Creek is 0.39.
What is the Total Population of Hunters Creek?
Total Population of Hunters Creek is 19,895.
What is the Total Male Population of Hunters Creek?
Total Male Population of Hunters Creek is 9,640.
What is the Total Female Population of Hunters Creek?
Total Female Population of Hunters Creek is 10,255.
What is the Ratio of Males per 100 Females in Hunters Creek?
There are 94.00 Males per 100 Females in Hunters Creek.
What is the Ratio of Females per 100 Males in Hunters Creek?
There are 106.38 Females per 100 Males in Hunters Creek.
What is the Median Population Age in Hunters Creek?
Median Population Age in Hunters Creek is 39.0 Years.
What is the Average Family Size in Hunters Creek
Average Family Size in Hunters Creek is 3.4 People.
What is the Average Household Size in Hunters Creek
Average Household Size in Hunters Creek is 3.0 People.
How Large is the Labor Force in Hunters Creek?
There are 11,592 People in the Labor Forcein in Hunters Creek.
What is the Percentage of People in the Labor Force in Hunters Creek?
71.5% of People are in the Labor Force in Hunters Creek.
What is the Unemployment Rate in Hunters Creek?
Unemployment Rate in Hunters Creek is 4.4%.