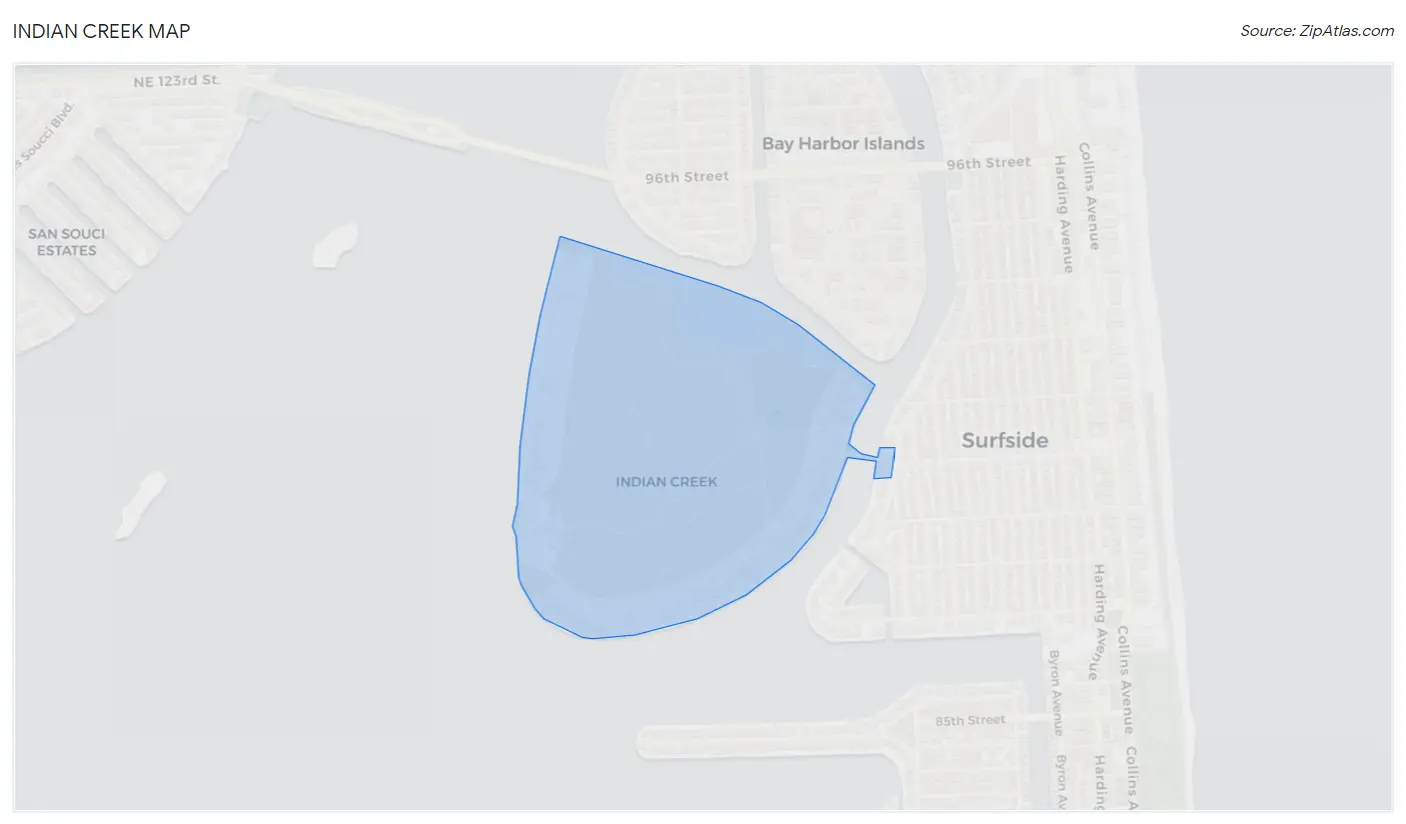
Indian Creek, FL Map & Demographics
Indian Creek Map
Indian Creek Overview
$40,437
PER CAPITA INCOME
$111,875
AVG FAMILY INCOME
0.49
INEQUALITY / GINI INDEX
54
TOTAL POPULATION
28
MALE POPULATION
26
FEMALE POPULATION
107.69
MALES / 100 FEMALES
92.86
FEMALES / 100 MALES
54.3
MEDIAN AGE
2.9
AVG FAMILY SIZE
1.9
AVG HOUSEHOLD SIZE
24
LABOR FORCE [ PEOPLE ]
46.2%
PERCENT IN LABOR FORCE
Income in Indian Creek
Income Overview in Indian Creek
| Characteristic | Number | Measure |
| Per Capita Income | 54 | $40,437 |
| Median Family Income | 13 | $111,875 |
| Mean Family Income | 13 | $107,277 |
| Median Household Income | 28 | $0 |
| Mean Household Income | 28 | $77,986 |
| Income Deficit | 13 | $0 |
| Wage / Income Gap (%) | 54 | 0.00% |
| Wage / Income Gap ($) | 54 | 100.00¢ per $1 |
| Gini / Inequality Index | 54 | 0.49 |
Earnings by Sex in Indian Creek
| Sex | Number | Average Earnings |
| Male | 21 (77.8%) | $0 |
| Female | 6 (22.2%) | $0 |
| Total | 27 (100.0%) | $0 |
Earnings by Sex by Income Bracket in Indian Creek
The most common earnings brackets in Indian Creek are $25,000 to $29,999 for men (12 | 57.1%) and $100,000+ for women (3 | 50.0%).
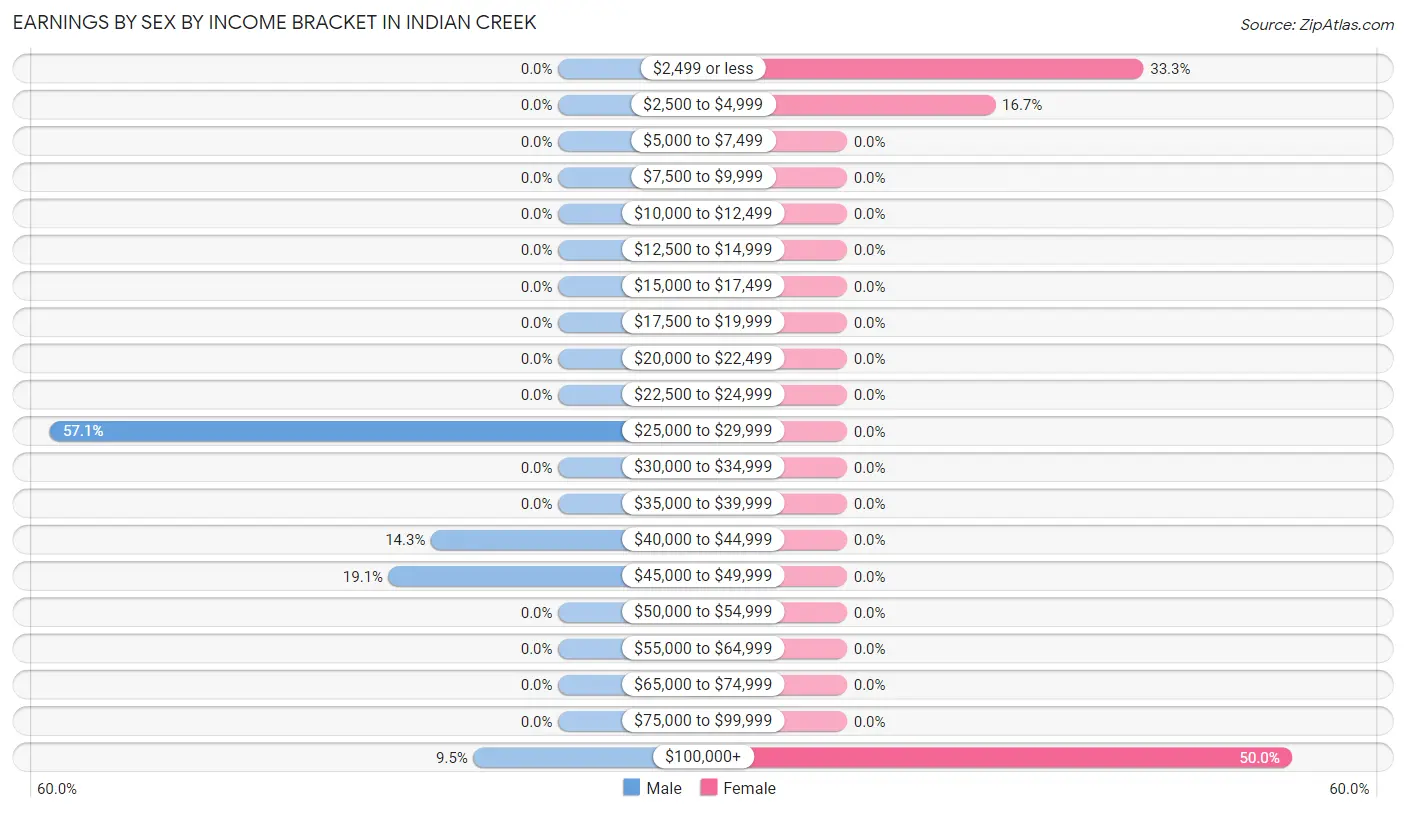
| Income | Male | Female |
| $2,499 or less | 0 (0.0%) | 2 (33.3%) |
| $2,500 to $4,999 | 0 (0.0%) | 1 (16.7%) |
| $5,000 to $7,499 | 0 (0.0%) | 0 (0.0%) |
| $7,500 to $9,999 | 0 (0.0%) | 0 (0.0%) |
| $10,000 to $12,499 | 0 (0.0%) | 0 (0.0%) |
| $12,500 to $14,999 | 0 (0.0%) | 0 (0.0%) |
| $15,000 to $17,499 | 0 (0.0%) | 0 (0.0%) |
| $17,500 to $19,999 | 0 (0.0%) | 0 (0.0%) |
| $20,000 to $22,499 | 0 (0.0%) | 0 (0.0%) |
| $22,500 to $24,999 | 0 (0.0%) | 0 (0.0%) |
| $25,000 to $29,999 | 12 (57.1%) | 0 (0.0%) |
| $30,000 to $34,999 | 0 (0.0%) | 0 (0.0%) |
| $35,000 to $39,999 | 0 (0.0%) | 0 (0.0%) |
| $40,000 to $44,999 | 3 (14.3%) | 0 (0.0%) |
| $45,000 to $49,999 | 4 (19.1%) | 0 (0.0%) |
| $50,000 to $54,999 | 0 (0.0%) | 0 (0.0%) |
| $55,000 to $64,999 | 0 (0.0%) | 0 (0.0%) |
| $65,000 to $74,999 | 0 (0.0%) | 0 (0.0%) |
| $75,000 to $99,999 | 0 (0.0%) | 0 (0.0%) |
| $100,000+ | 2 (9.5%) | 3 (50.0%) |
| Total | 21 (100.0%) | 6 (100.0%) |
Earnings by Sex by Educational Attainment in Indian Creek
| Educational Attainment | Male Income | Female Income |
| Less than High School | - | - |
| High School Diploma | - | - |
| College or Associate's Degree | - | - |
| Bachelor's Degree | - | - |
| Graduate Degree | - | - |
| Total | - | - |
Family Income in Indian Creek
Family Income Brackets in Indian Creek
According to the Indian Creek family income data, there are 6 families falling into the $100,000 to $149,999 income range, which is the most common income bracket and makes up 46.2% of all families.
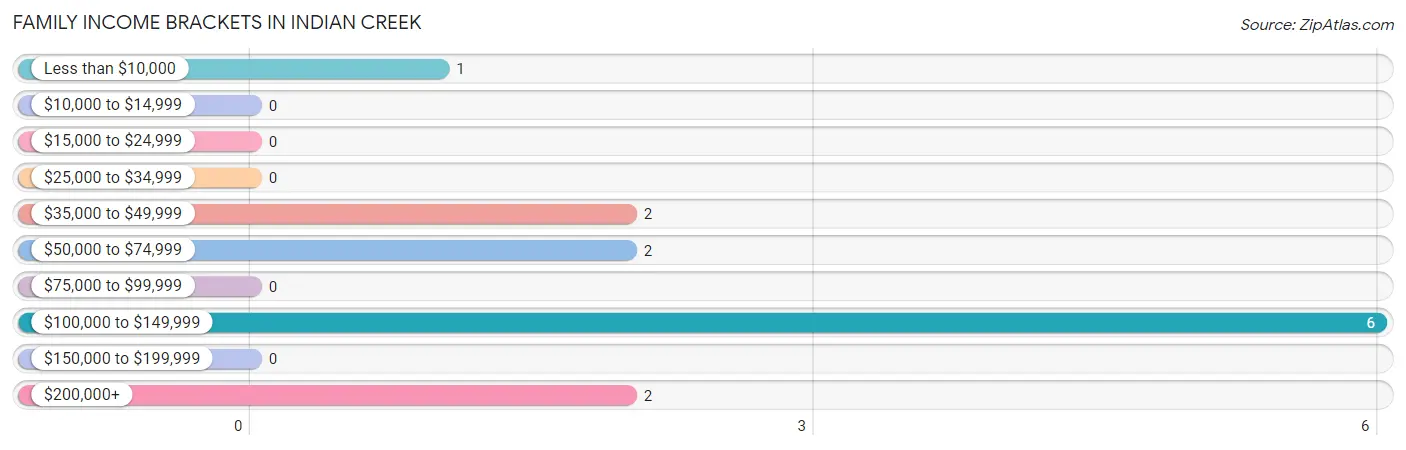
| Income Bracket | # Families | % Families |
| Less than $10,000 | 1 | 7.7% |
| $10,000 to $14,999 | 0 | 0.0% |
| $15,000 to $24,999 | 0 | 0.0% |
| $25,000 to $34,999 | 0 | 0.0% |
| $35,000 to $49,999 | 2 | 15.4% |
| $50,000 to $74,999 | 2 | 15.4% |
| $75,000 to $99,999 | 0 | 0.0% |
| $100,000 to $149,999 | 6 | 46.2% |
| $150,000 to $199,999 | 0 | 0.0% |
| $200,000+ | 2 | 15.4% |
Family Income by Famaliy Size in Indian Creek
2-person families (5 | 38.5%) account for the highest median family income in Indian Creek with $74,375 per family, while 2-person families (5 | 38.5%) have the highest median income of $37,188 per family member.
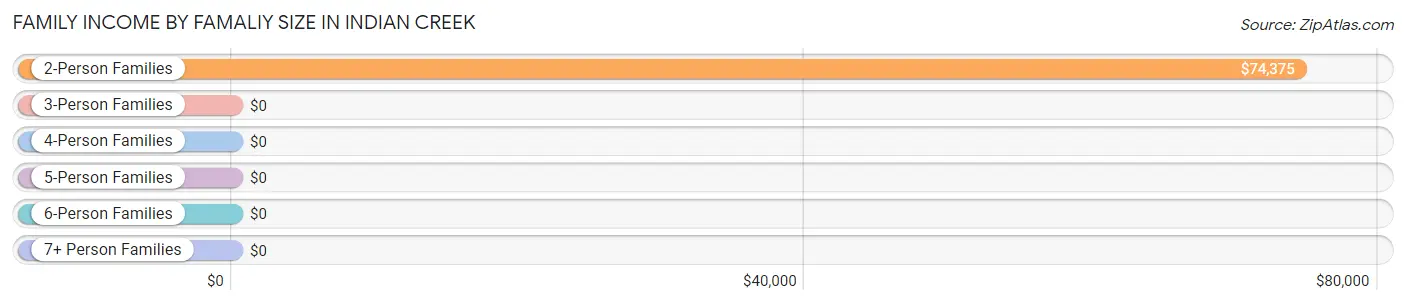
| Income Bracket | # Families | Median Income |
| 2-Person Families | 5 (38.5%) | $74,375 |
| 3-Person Families | 6 (46.2%) | $0 |
| 4-Person Families | 2 (15.4%) | $0 |
| 5-Person Families | 0 (0.0%) | $0 |
| 6-Person Families | 0 (0.0%) | $0 |
| 7+ Person Families | 0 (0.0%) | $0 |
| Total | 13 (100.0%) | $111,875 |
Family Income by Number of Earners in Indian Creek
| Number of Earners | # Families | Median Income |
| No Earners | 4 (30.8%) | $0 |
| 1 Earner | 6 (46.2%) | $0 |
| 2 Earners | 3 (23.1%) | $0 |
| 3+ Earners | 0 (0.0%) | $0 |
| Total | 13 (100.0%) | $111,875 |
Household Income in Indian Creek
Household Income Brackets in Indian Creek
With 12 households falling in the category, the $25,000 to $34,999 income range is the most frequent in Indian Creek, accounting for 42.9% of all households.
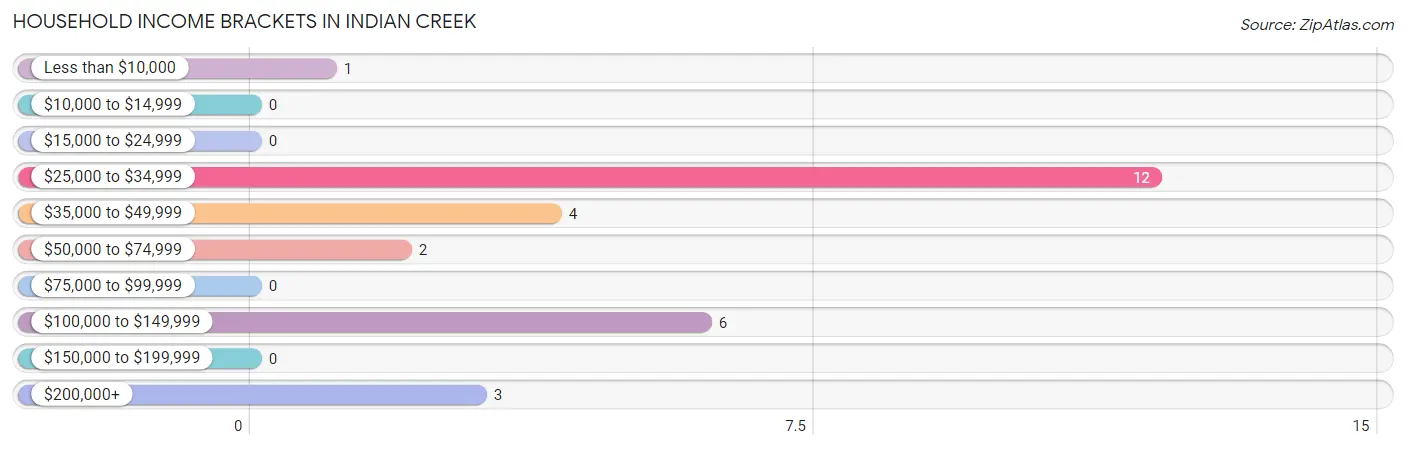
| Income Bracket | # Households | % Households |
| Less than $10,000 | 1 | 3.6% |
| $10,000 to $14,999 | 0 | 0.0% |
| $15,000 to $24,999 | 0 | 0.0% |
| $25,000 to $34,999 | 12 | 42.9% |
| $35,000 to $49,999 | 4 | 14.3% |
| $50,000 to $74,999 | 2 | 7.1% |
| $75,000 to $99,999 | 0 | 0.0% |
| $100,000 to $149,999 | 6 | 21.4% |
| $150,000 to $199,999 | 0 | 0.0% |
| $200,000+ | 3 | 10.7% |
Household Income by Householder Age in Indian Creek
The median household income in Indian Creek is $0, with the highest median household income of $73,125 found in the 65+ years age bracket for the primary householder. A total of 5 households (17.9%) fall into this category.
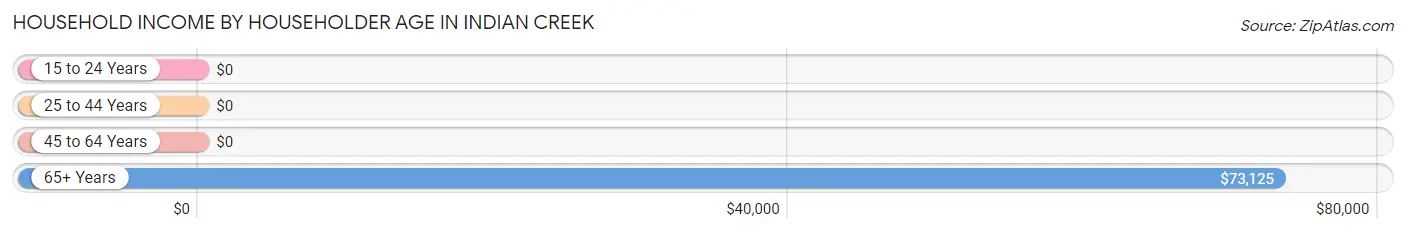
| Income Bracket | # Households | Median Income |
| 15 to 24 Years | 0 (0.0%) | $0 |
| 25 to 44 Years | 0 (0.0%) | $0 |
| 45 to 64 Years | 23 (82.1%) | $0 |
| 65+ Years | 5 (17.9%) | $73,125 |
| Total | 28 (100.0%) | $0 |
Poverty in Indian Creek
Income Below Poverty by Sex and Age in Indian Creek
With 3.6% poverty level for males and 19.2% for females among the residents of Indian Creek, 65 to 74 year old males and 55 to 64 year old females are the most vulnerable to poverty, with 1 males (33.3%) and 1 females (100.0%) in their respective age groups living below the poverty level.
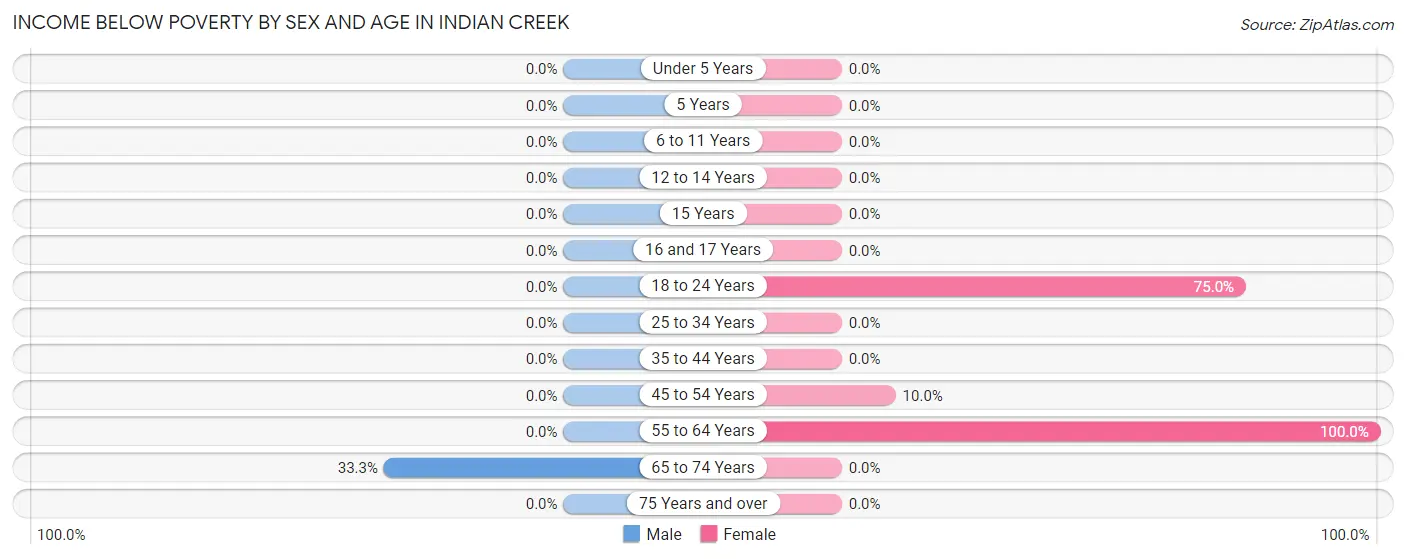
| Age Bracket | Male | Female |
| Under 5 Years | 0 (0.0%) | 0 (0.0%) |
| 5 Years | 0 (0.0%) | 0 (0.0%) |
| 6 to 11 Years | 0 (0.0%) | 0 (0.0%) |
| 12 to 14 Years | 0 (0.0%) | 0 (0.0%) |
| 15 Years | 0 (0.0%) | 0 (0.0%) |
| 16 and 17 Years | 0 (0.0%) | 0 (0.0%) |
| 18 to 24 Years | 0 (0.0%) | 3 (75.0%) |
| 25 to 34 Years | 0 (0.0%) | 0 (0.0%) |
| 35 to 44 Years | 0 (0.0%) | 0 (0.0%) |
| 45 to 54 Years | 0 (0.0%) | 1 (10.0%) |
| 55 to 64 Years | 0 (0.0%) | 1 (100.0%) |
| 65 to 74 Years | 1 (33.3%) | 0 (0.0%) |
| 75 Years and over | 0 (0.0%) | 0 (0.0%) |
| Total | 1 (3.6%) | 5 (19.2%) |
Income Above Poverty by Sex and Age in Indian Creek
According to the poverty statistics in Indian Creek, males aged 6 to 11 years and females aged 16 and 17 years are the age groups that are most secure financially, with 100.0% of males and 100.0% of females in these age groups living above the poverty line.
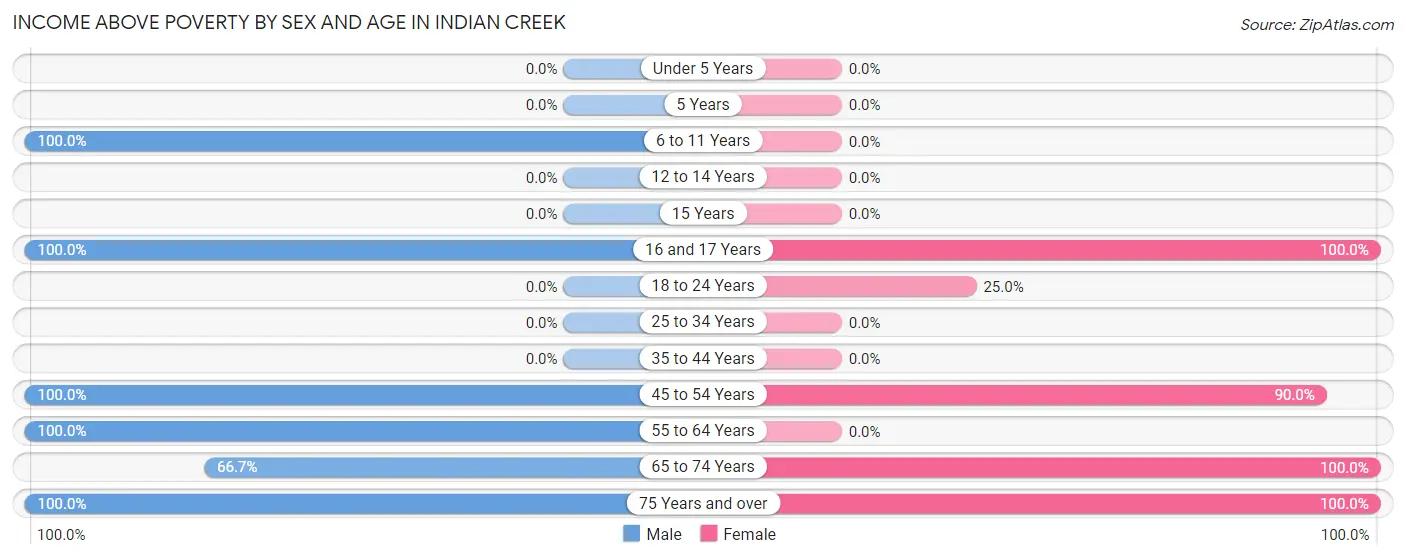
| Age Bracket | Male | Female |
| Under 5 Years | 0 (0.0%) | 0 (0.0%) |
| 5 Years | 0 (0.0%) | 0 (0.0%) |
| 6 to 11 Years | 2 (100.0%) | 0 (0.0%) |
| 12 to 14 Years | 0 (0.0%) | 0 (0.0%) |
| 15 Years | 0 (0.0%) | 0 (0.0%) |
| 16 and 17 Years | 1 (100.0%) | 7 (100.0%) |
| 18 to 24 Years | 0 (0.0%) | 1 (25.0%) |
| 25 to 34 Years | 0 (0.0%) | 0 (0.0%) |
| 35 to 44 Years | 0 (0.0%) | 0 (0.0%) |
| 45 to 54 Years | 12 (100.0%) | 9 (90.0%) |
| 55 to 64 Years | 9 (100.0%) | 0 (0.0%) |
| 65 to 74 Years | 2 (66.7%) | 3 (100.0%) |
| 75 Years and over | 1 (100.0%) | 1 (100.0%) |
| Total | 27 (96.4%) | 21 (80.8%) |
Income Below Poverty Among Married-Couple Families in Indian Creek
The poverty statistics for married-couple families in Indian Creek show that 9.1% or 1 of the total 11 families live below the poverty line. Families with no children have the highest poverty rate of 25.0%, comprising of 1 families. On the other hand, families with 1 or 2 children have the lowest poverty rate of 0.0%, which includes 0 families.
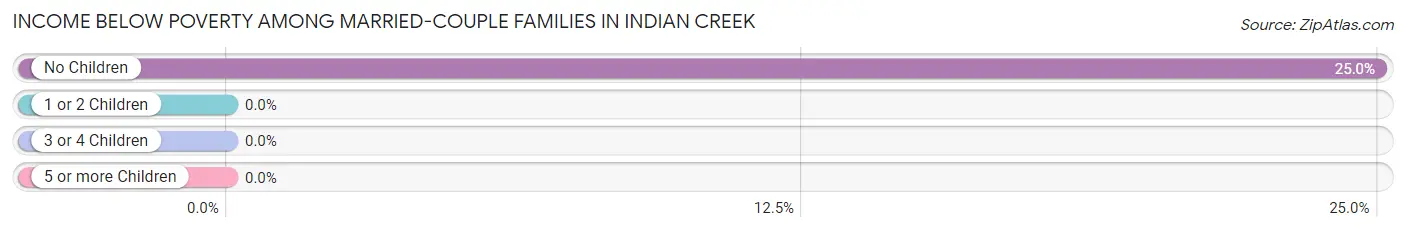
| Children | Above Poverty | Below Poverty |
| No Children | 3 (75.0%) | 1 (25.0%) |
| 1 or 2 Children | 7 (100.0%) | 0 (0.0%) |
| 3 or 4 Children | 0 (0.0%) | 0 (0.0%) |
| 5 or more Children | 0 (0.0%) | 0 (0.0%) |
| Total | 10 (90.9%) | 1 (9.1%) |
Income Below Poverty Among Single-Parent Households in Indian Creek
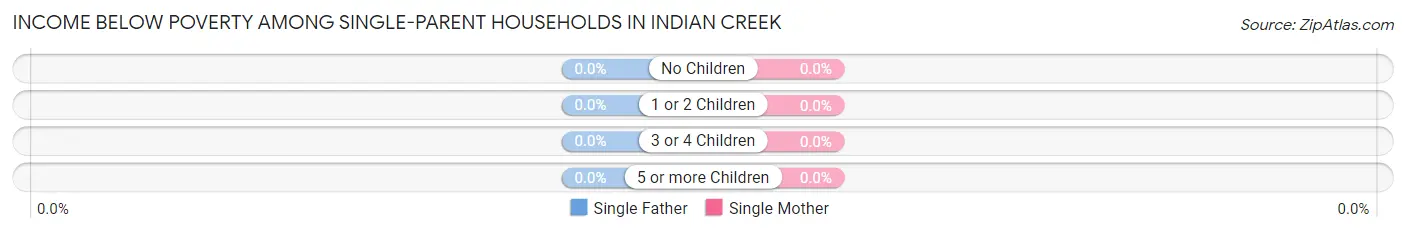
| Children | Single Father | Single Mother |
| No Children | 0 (0.0%) | 0 (0.0%) |
| 1 or 2 Children | 0 (0.0%) | 0 (0.0%) |
| 3 or 4 Children | 0 (0.0%) | 0 (0.0%) |
| 5 or more Children | 0 (0.0%) | 0 (0.0%) |
| Total | 0 (0.0%) | 0 (0.0%) |
Income Below Poverty Among Married-Couple vs Single-Parent Households in Indian Creek
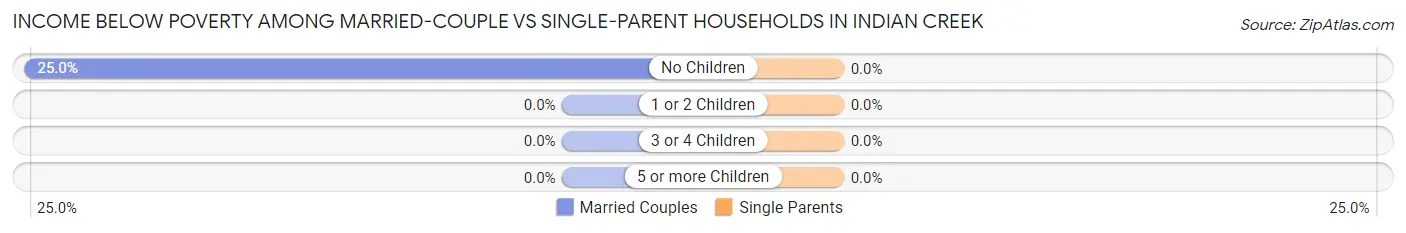
| Children | Married-Couple Families | Single-Parent Households |
| No Children | 1 (25.0%) | 0 (0.0%) |
| 1 or 2 Children | 0 (0.0%) | 0 (0.0%) |
| 3 or 4 Children | 0 (0.0%) | 0 (0.0%) |
| 5 or more Children | 0 (0.0%) | 0 (0.0%) |
| Total | 1 (9.1%) | 0 (0.0%) |
Race in Indian Creek
The most populous races in Indian Creek are White / Caucasian (34 | 63.0%), Hispanic or Latino (19 | 35.2%), and Native / Alaskan (12 | 22.2%).
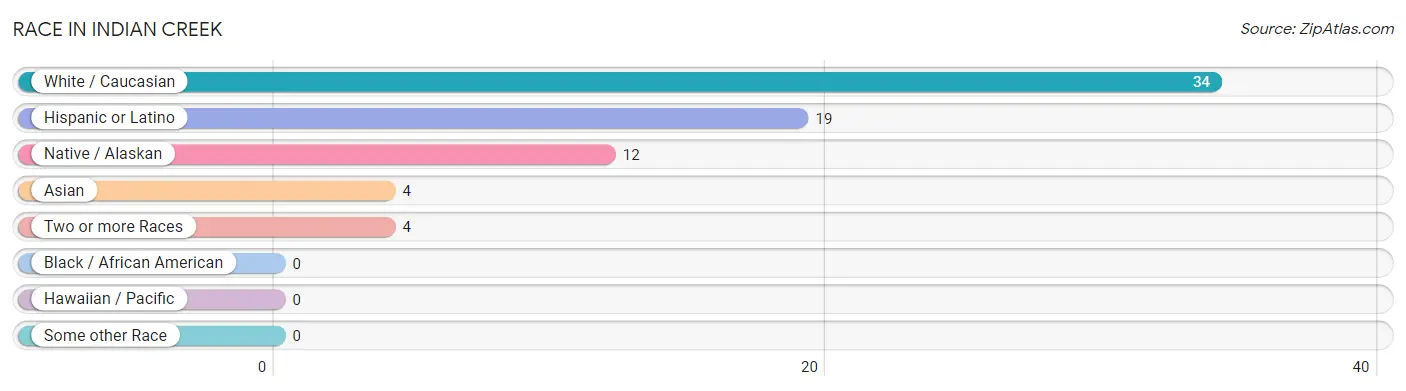
| Race | # Population | % Population |
| Asian | 4 | 7.4% |
| Black / African American | 0 | 0.0% |
| Hawaiian / Pacific | 0 | 0.0% |
| Hispanic or Latino | 19 | 35.2% |
| Native / Alaskan | 12 | 22.2% |
| White / Caucasian | 34 | 63.0% |
| Two or more Races | 4 | 7.4% |
| Some other Race | 0 | 0.0% |
| Total | 54 | 100.0% |
Ancestry in Indian Creek
The most populous ancestries reported in Indian Creek are Mexican (12 | 22.2%), Mexican American Indian (12 | 22.2%), Hungarian (8 | 14.8%), Russian (6 | 11.1%), and Brazilian (4 | 7.4%), together accounting for 77.8% of all Indian Creek residents.
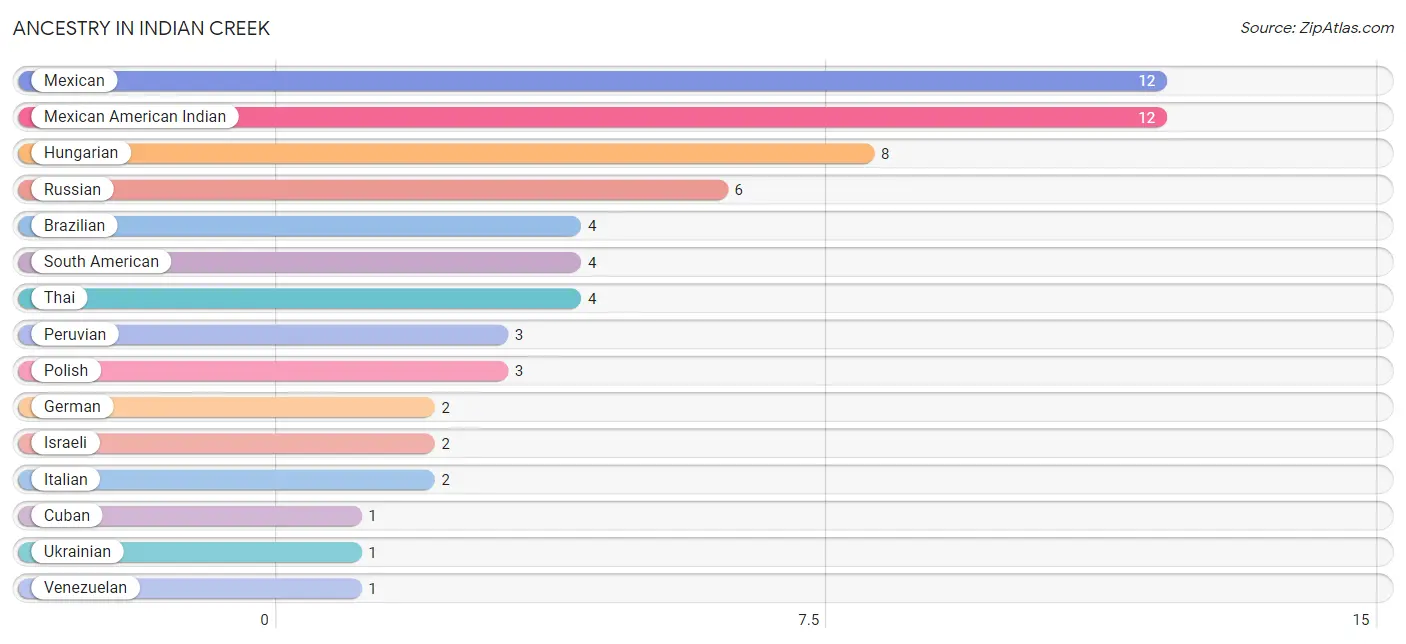
| Ancestry | # Population | % Population |
| Brazilian | 4 | 7.4% |
| Cuban | 1 | 1.8% |
| German | 2 | 3.7% |
| Hungarian | 8 | 14.8% |
| Israeli | 2 | 3.7% |
| Italian | 2 | 3.7% |
| Mexican | 12 | 22.2% |
| Mexican American Indian | 12 | 22.2% |
| Peruvian | 3 | 5.6% |
| Polish | 3 | 5.6% |
| Russian | 6 | 11.1% |
| South American | 4 | 7.4% |
| Thai | 4 | 7.4% |
| Ukrainian | 1 | 1.8% |
| Venezuelan | 1 | 1.8% | View All 15 Rows |
Immigrants in Indian Creek
The most numerous immigrant groups reported in Indian Creek came from Latin America (18 | 33.3%), Central America (12 | 22.2%), Mexico (12 | 22.2%), Asia (6 | 11.1%), and South America (6 | 11.1%), together accounting for 100.0% of all Indian Creek residents.
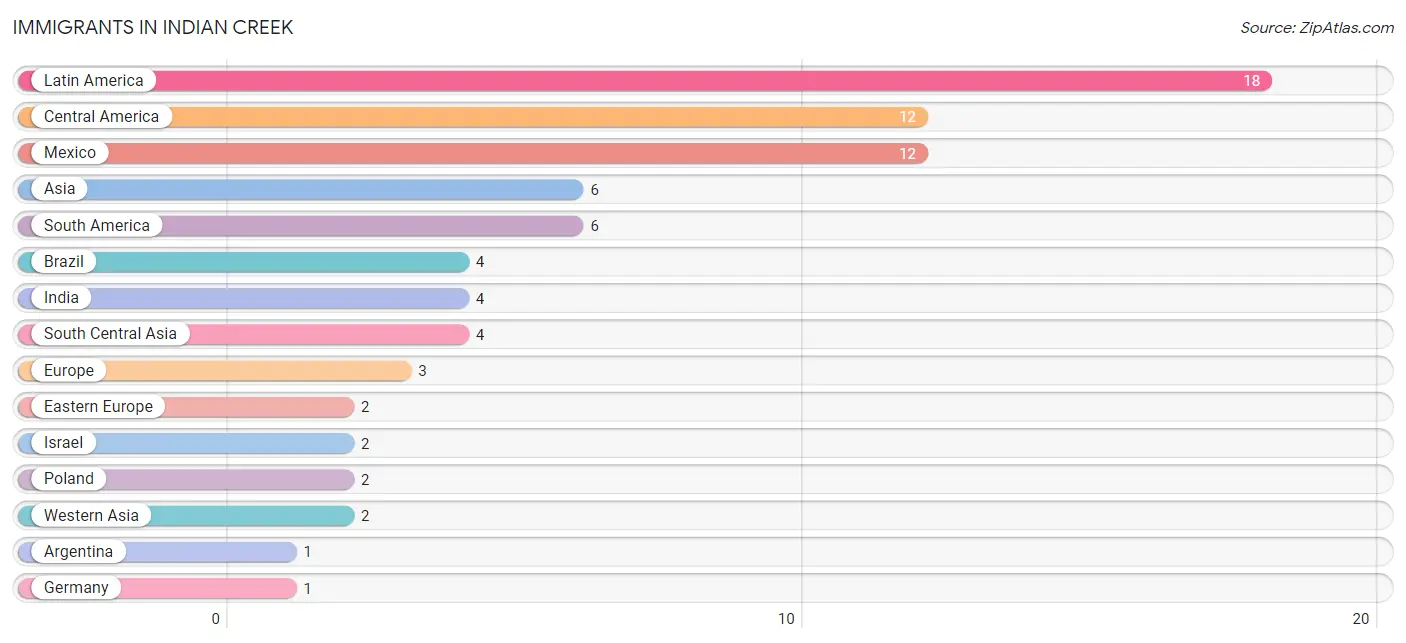
| Immigration Origin | # Population | % Population |
| Argentina | 1 | 1.8% |
| Asia | 6 | 11.1% |
| Brazil | 4 | 7.4% |
| Central America | 12 | 22.2% |
| Eastern Europe | 2 | 3.7% |
| Europe | 3 | 5.6% |
| Germany | 1 | 1.8% |
| India | 4 | 7.4% |
| Israel | 2 | 3.7% |
| Latin America | 18 | 33.3% |
| Mexico | 12 | 22.2% |
| Peru | 1 | 1.8% |
| Poland | 2 | 3.7% |
| South America | 6 | 11.1% |
| South Central Asia | 4 | 7.4% |
| Western Asia | 2 | 3.7% |
| Western Europe | 1 | 1.8% | View All 17 Rows |
Sex and Age in Indian Creek
Sex and Age in Indian Creek
The most populous age groups in Indian Creek are 50 to 54 Years (12 | 42.9%) for men and 15 to 19 Years (7 | 26.9%) for women.
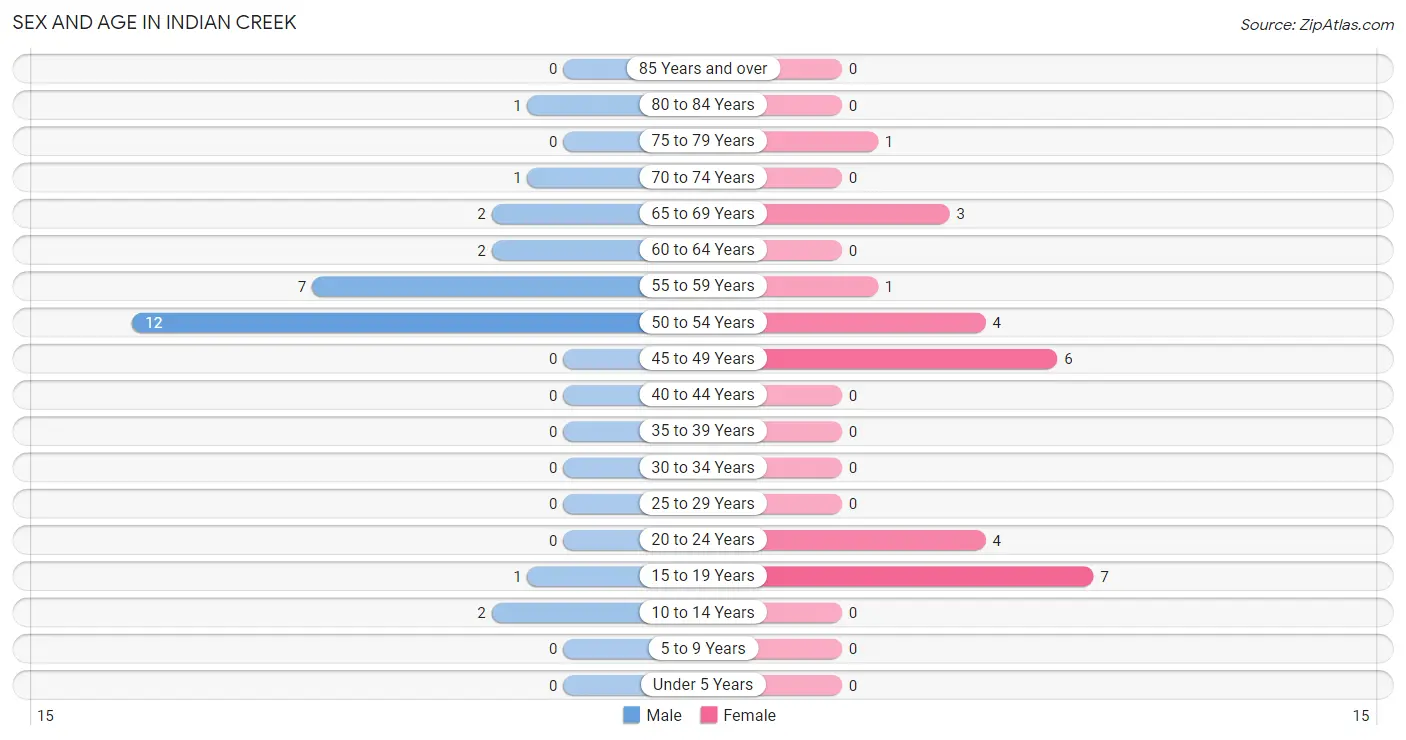
| Age Bracket | Male | Female |
| Under 5 Years | 0 (0.0%) | 0 (0.0%) |
| 5 to 9 Years | 0 (0.0%) | 0 (0.0%) |
| 10 to 14 Years | 2 (7.1%) | 0 (0.0%) |
| 15 to 19 Years | 1 (3.6%) | 7 (26.9%) |
| 20 to 24 Years | 0 (0.0%) | 4 (15.4%) |
| 25 to 29 Years | 0 (0.0%) | 0 (0.0%) |
| 30 to 34 Years | 0 (0.0%) | 0 (0.0%) |
| 35 to 39 Years | 0 (0.0%) | 0 (0.0%) |
| 40 to 44 Years | 0 (0.0%) | 0 (0.0%) |
| 45 to 49 Years | 0 (0.0%) | 6 (23.1%) |
| 50 to 54 Years | 12 (42.9%) | 4 (15.4%) |
| 55 to 59 Years | 7 (25.0%) | 1 (3.8%) |
| 60 to 64 Years | 2 (7.1%) | 0 (0.0%) |
| 65 to 69 Years | 2 (7.1%) | 3 (11.5%) |
| 70 to 74 Years | 1 (3.6%) | 0 (0.0%) |
| 75 to 79 Years | 0 (0.0%) | 1 (3.8%) |
| 80 to 84 Years | 1 (3.6%) | 0 (0.0%) |
| 85 Years and over | 0 (0.0%) | 0 (0.0%) |
| Total | 28 (100.0%) | 26 (100.0%) |
Families and Households in Indian Creek
Median Family Size in Indian Creek
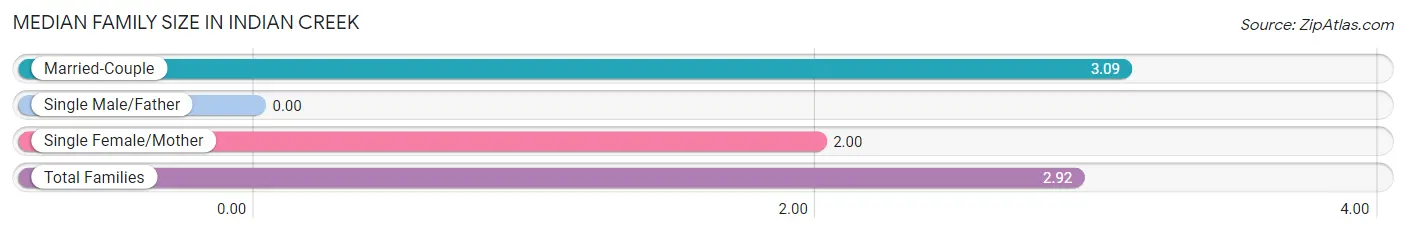
| Family Type | # Families | Family Size |
| Married-Couple | 11 (84.6%) | 3.09 |
| Single Male/Father | 0 (0.0%) | - |
| Single Female/Mother | 2 (15.4%) | 2.00 |
| Total Families | 13 (100.0%) | 2.92 |
Median Household Size in Indian Creek
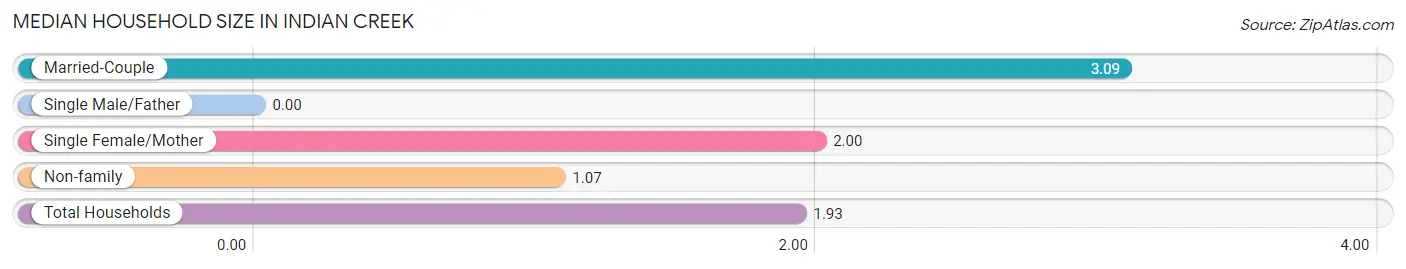
| Household Type | # Households | Household Size |
| Married-Couple | 11 (39.3%) | 3.09 |
| Single Male/Father | 0 (0.0%) | - |
| Single Female/Mother | 2 (7.1%) | 2.00 |
| Non-family | 15 (53.6%) | 1.07 |
| Total Households | 28 (100.0%) | 1.93 |
Household Size by Marriage Status in Indian Creek
Out of a total of 28 households in Indian Creek, 13 (46.4%) are family households, while 15 (53.6%) are nonfamily households. The most numerous type of family households are 3-person households, comprising 6, and the most common type of nonfamily households are 1-person households, comprising 13.
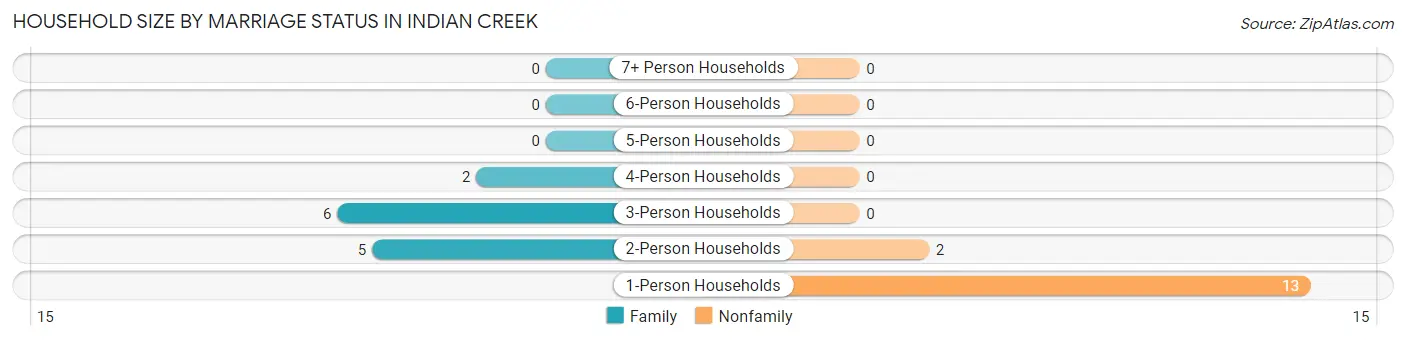
| Household Size | Family Households | Nonfamily Households |
| 1-Person Households | - | 13 (46.4%) |
| 2-Person Households | 5 (17.9%) | 2 (7.1%) |
| 3-Person Households | 6 (21.4%) | 0 (0.0%) |
| 4-Person Households | 2 (7.1%) | 0 (0.0%) |
| 5-Person Households | 0 (0.0%) | 0 (0.0%) |
| 6-Person Households | 0 (0.0%) | 0 (0.0%) |
| 7+ Person Households | 0 (0.0%) | 0 (0.0%) |
| Total | 13 (46.4%) | 15 (53.6%) |
Female Fertility in Indian Creek
Fertility by Age in Indian Creek
| Age Bracket | Women with Births | Births / 1,000 Women |
| 15 to 19 years | 0 (0.0%) | 0.0 |
| 20 to 34 years | 0 (0.0%) | 0.0 |
| 35 to 50 years | 0 (0.0%) | 0.0 |
| Total | 0 (0.0%) | 0.0 |
Fertility by Age by Marriage Status in Indian Creek
| Age Bracket | Married | Unmarried |
| 15 to 19 years | 0 (0.0%) | 0 (0.0%) |
| 20 to 34 years | 0 (0.0%) | 0 (0.0%) |
| 35 to 50 years | 0 (0.0%) | 0 (0.0%) |
| Total | 0 (0.0%) | 0 (0.0%) |
Fertility by Education in Indian Creek
| Educational Attainment | Women with Births | Births / 1,000 Women |
| Less than High School | 0 (0.0%) | 0.0 |
| High School Diploma | 0 (0.0%) | 0.0 |
| College or Associate's Degree | 0 (0.0%) | 0.0 |
| Bachelor's Degree | 0 (0.0%) | 0.0 |
| Graduate Degree | 0 (0.0%) | 0.0 |
| Total | 0 (0.0%) | 0.0 |
Fertility by Education by Marriage Status in Indian Creek
| Educational Attainment | Married | Unmarried |
| Less than High School | 0 (0.0%) | 0 (0.0%) |
| High School Diploma | 0 (0.0%) | 0 (0.0%) |
| College or Associate's Degree | 0 (0.0%) | 0 (0.0%) |
| Bachelor's Degree | 0 (0.0%) | 0 (0.0%) |
| Graduate Degree | 0 (0.0%) | 0 (0.0%) |
| Total | 0 (0.0%) | 0 (0.0%) |
Employment Characteristics in Indian Creek
Employment by Class of Employer in Indian Creek
Among the 24 employed individuals in Indian Creek, private company employees (19 | 79.2%), and self-employed (incorporated) (5 | 20.8%) make up the most common classes of employment.
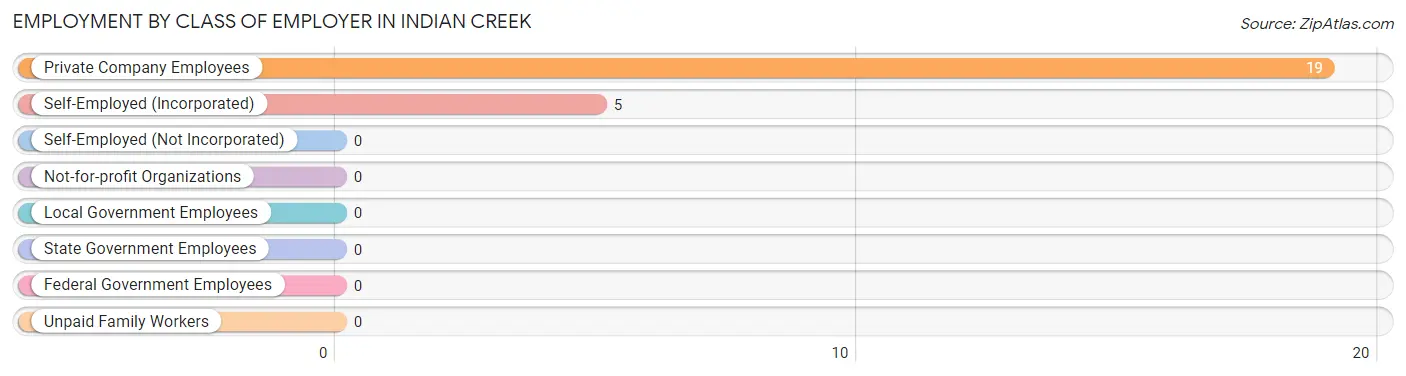
| Employer Class | # Employees | % Employees |
| Private Company Employees | 19 | 79.2% |
| Self-Employed (Incorporated) | 5 | 20.8% |
| Self-Employed (Not Incorporated) | 0 | 0.0% |
| Not-for-profit Organizations | 0 | 0.0% |
| Local Government Employees | 0 | 0.0% |
| State Government Employees | 0 | 0.0% |
| Federal Government Employees | 0 | 0.0% |
| Unpaid Family Workers | 0 | 0.0% |
| Total | 24 | 100.0% |
Employment Status by Age in Indian Creek
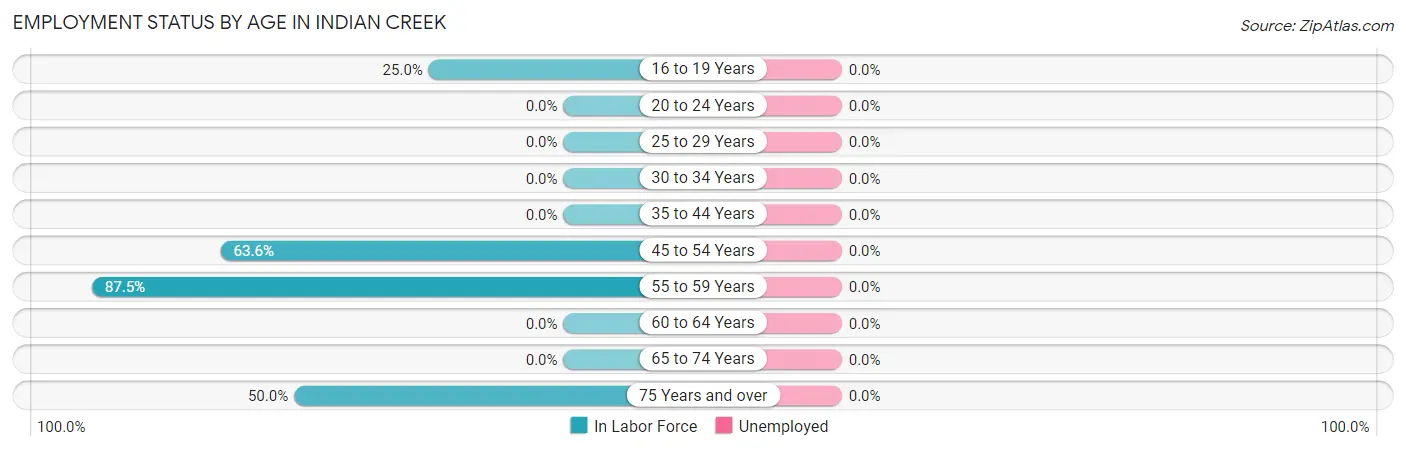
| Age Bracket | In Labor Force | Unemployed |
| 16 to 19 Years | 2 (25.0%) | 0 (0.0%) |
| 20 to 24 Years | 0 (0.0%) | 0 (0.0%) |
| 25 to 29 Years | 0 (0.0%) | 0 (0.0%) |
| 30 to 34 Years | 0 (0.0%) | 0 (0.0%) |
| 35 to 44 Years | 0 (0.0%) | 0 (0.0%) |
| 45 to 54 Years | 14 (63.6%) | 0 (0.0%) |
| 55 to 59 Years | 7 (87.5%) | 0 (0.0%) |
| 60 to 64 Years | 0 (0.0%) | 0 (0.0%) |
| 65 to 74 Years | 0 (0.0%) | 0 (0.0%) |
| 75 Years and over | 1 (50.0%) | 0 (0.0%) |
| Total | 24 (46.2%) | 0 (0.0%) |
Employment Status by Educational Attainment in Indian Creek
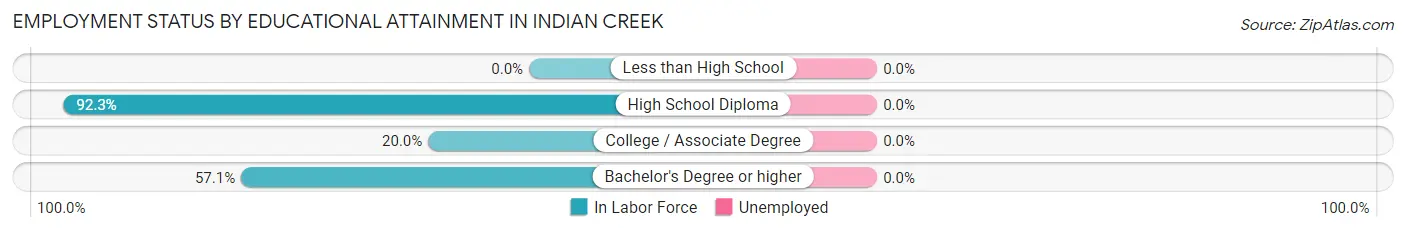
| Educational Attainment | In Labor Force | Unemployed |
| Less than High School | 0 (0.0%) | 0 (0.0%) |
| High School Diploma | 12 (92.3%) | 0 (0.0%) |
| College / Associate Degree | 1 (20.0%) | 0 (0.0%) |
| Bachelor's Degree or higher | 8 (57.1%) | 0 (0.0%) |
| Total | 21 (65.6%) | 0 (0.0%) |
Employment Occupations by Sex in Indian Creek
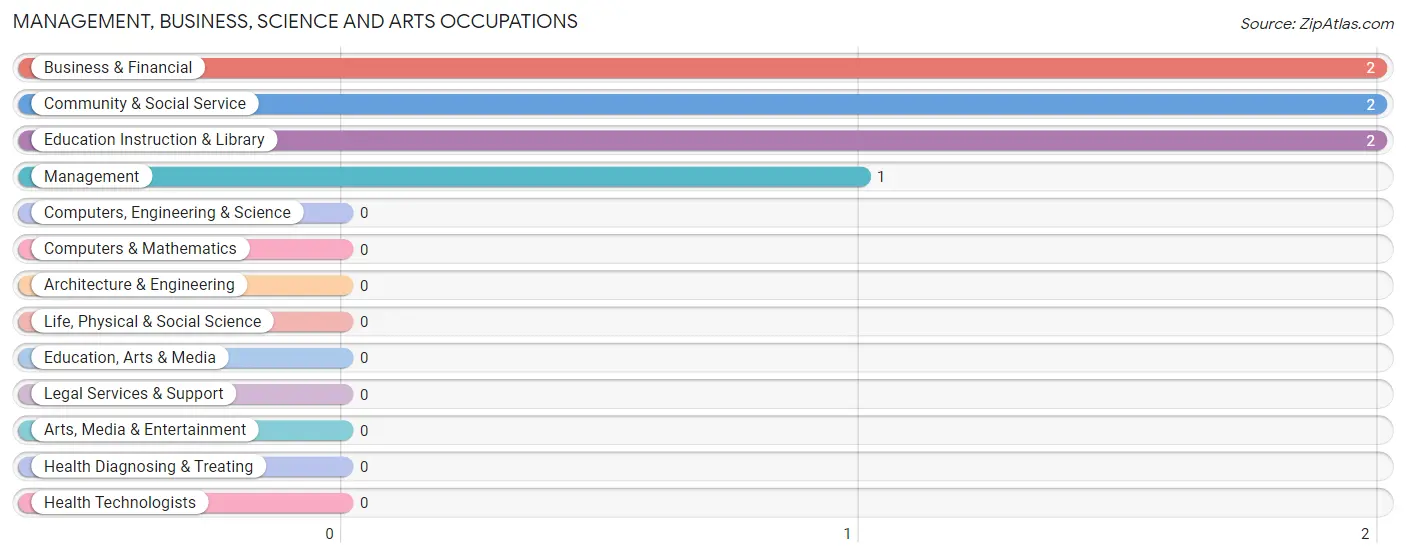
Management, Business, Science and Arts Occupations
The most common Management, Business, Science and Arts occupations in Indian Creek are Business & Financial (2 | 8.3%), Community & Social Service (2 | 8.3%), Education Instruction & Library (2 | 8.3%), and Management (1 | 4.2%).
Management, Business, Science and Arts Occupations by Sex
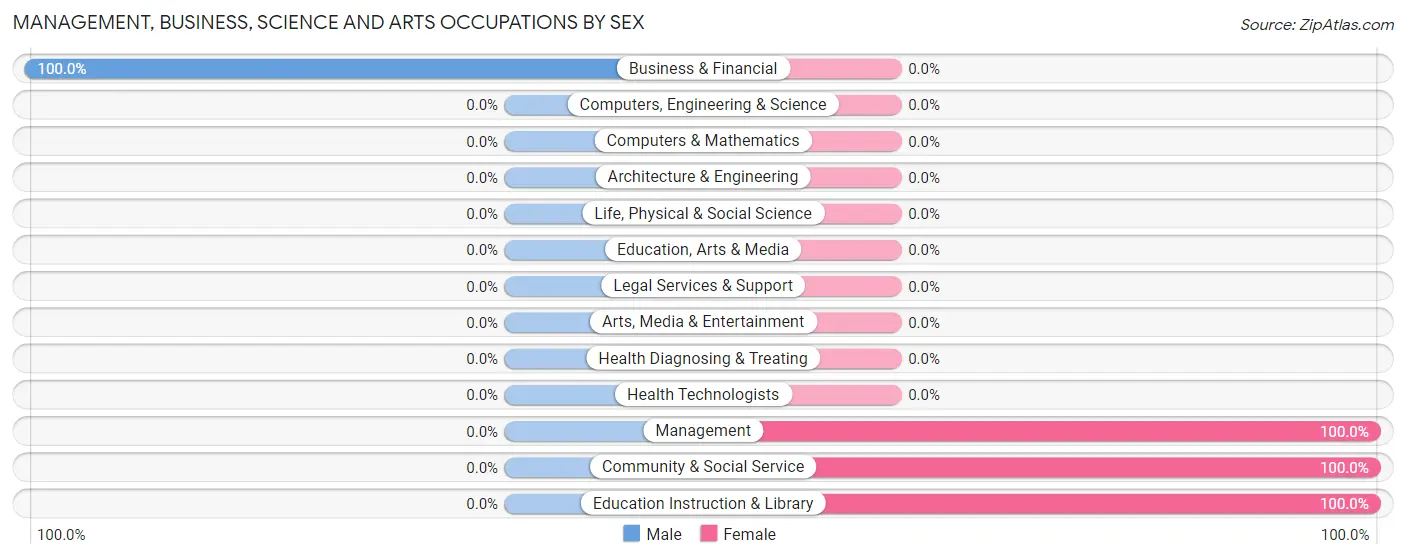
| Occupation | Male | Female |
| Management | 0 (0.0%) | 1 (100.0%) |
| Business & Financial | 2 (100.0%) | 0 (0.0%) |
| Computers, Engineering & Science | 0 (0.0%) | 0 (0.0%) |
| Computers & Mathematics | 0 (0.0%) | 0 (0.0%) |
| Architecture & Engineering | 0 (0.0%) | 0 (0.0%) |
| Life, Physical & Social Science | 0 (0.0%) | 0 (0.0%) |
| Community & Social Service | 0 (0.0%) | 2 (100.0%) |
| Education, Arts & Media | 0 (0.0%) | 0 (0.0%) |
| Legal Services & Support | 0 (0.0%) | 0 (0.0%) |
| Education Instruction & Library | 0 (0.0%) | 2 (100.0%) |
| Arts, Media & Entertainment | 0 (0.0%) | 0 (0.0%) |
| Health Diagnosing & Treating | 0 (0.0%) | 0 (0.0%) |
| Health Technologists | 0 (0.0%) | 0 (0.0%) |
| Total (Category) | 2 (40.0%) | 3 (60.0%) |
| Total (Overall) | 19 (79.2%) | 5 (20.8%) |
Services Occupations
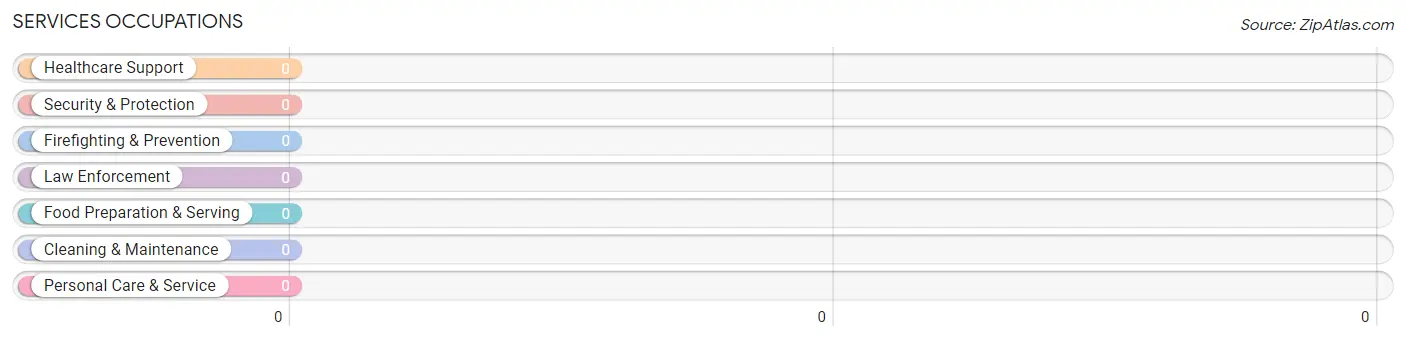
Services Occupations by Sex
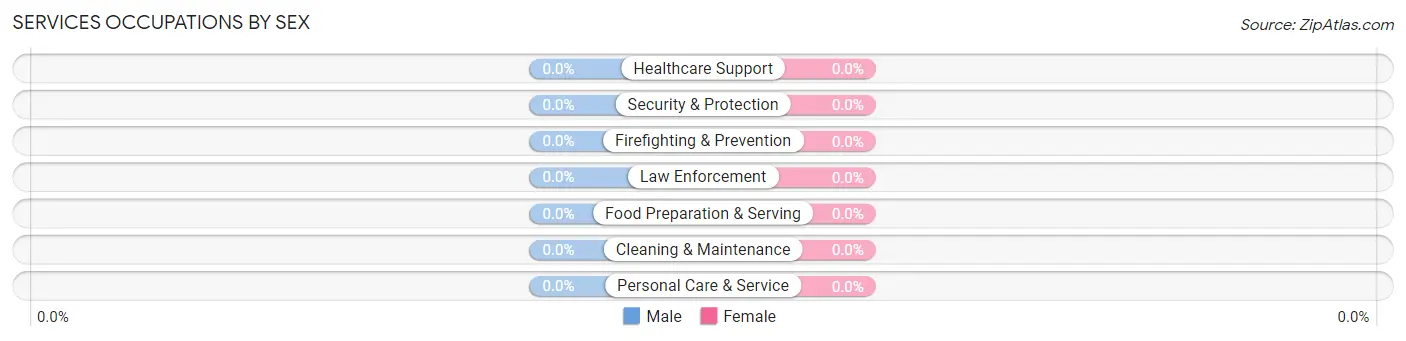
| Occupation | Male | Female |
| Healthcare Support | 0 (0.0%) | 0 (0.0%) |
| Security & Protection | 0 (0.0%) | 0 (0.0%) |
| Firefighting & Prevention | 0 (0.0%) | 0 (0.0%) |
| Law Enforcement | 0 (0.0%) | 0 (0.0%) |
| Food Preparation & Serving | 0 (0.0%) | 0 (0.0%) |
| Cleaning & Maintenance | 0 (0.0%) | 0 (0.0%) |
| Personal Care & Service | 0 (0.0%) | 0 (0.0%) |
| Total (Category) | 0 (0.0%) | 0 (0.0%) |
| Total (Overall) | 19 (79.2%) | 5 (20.8%) |
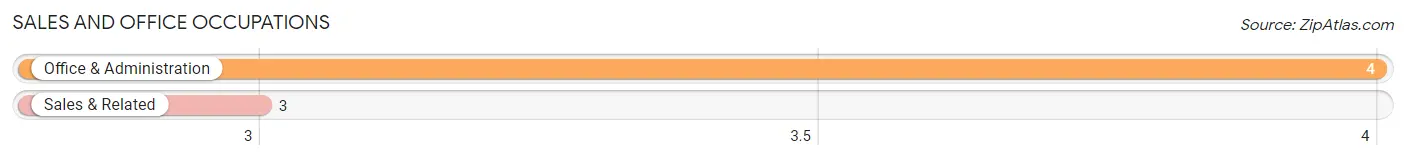
Sales and Office Occupations
The most common Sales and Office occupations in Indian Creek are Office & Administration (4 | 16.7%), and Sales & Related (3 | 12.5%).
Sales and Office Occupations by Sex
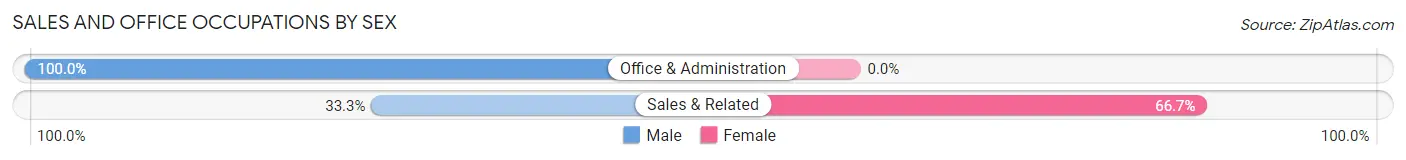
| Occupation | Male | Female |
| Sales & Related | 1 (33.3%) | 2 (66.7%) |
| Office & Administration | 4 (100.0%) | 0 (0.0%) |
| Total (Category) | 5 (71.4%) | 2 (28.6%) |
| Total (Overall) | 19 (79.2%) | 5 (20.8%) |
Natural Resources, Construction and Maintenance Occupations
Natural Resources, Construction and Maintenance Occupations by Sex
| Occupation | Male | Female |
| Farming, Fishing & Forestry | 0 (0.0%) | 0 (0.0%) |
| Construction & Extraction | 0 (0.0%) | 0 (0.0%) |
| Installation, Maintenance & Repair | 0 (0.0%) | 0 (0.0%) |
| Total (Category) | 0 (0.0%) | 0 (0.0%) |
| Total (Overall) | 19 (79.2%) | 5 (20.8%) |
Production, Transportation and Moving Occupations
The most common Production, Transportation and Moving occupations in Indian Creek are , and Production (12 | 50.0%).
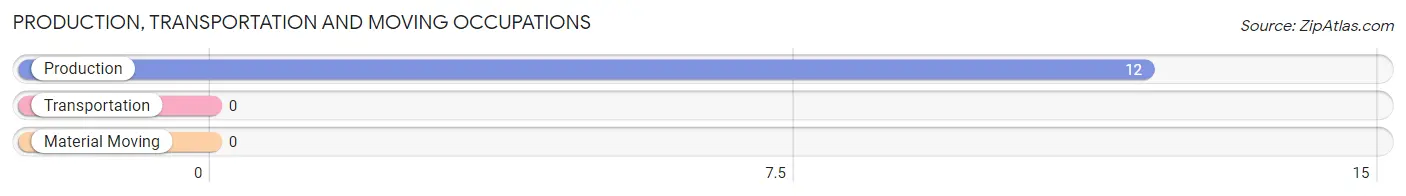
Production, Transportation and Moving Occupations by Sex
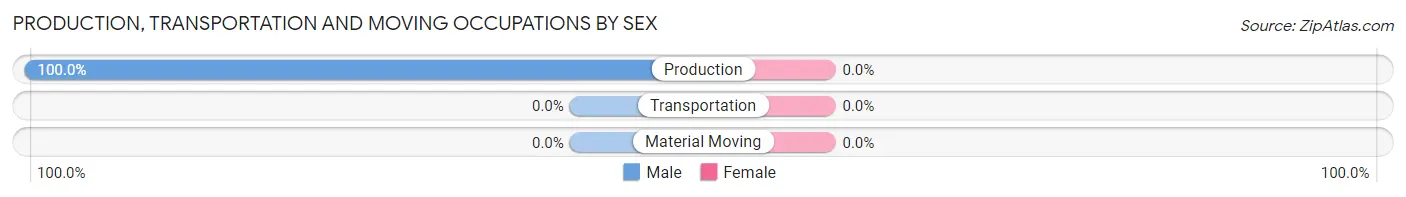
| Occupation | Male | Female |
| Production | 12 (100.0%) | 0 (0.0%) |
| Transportation | 0 (0.0%) | 0 (0.0%) |
| Material Moving | 0 (0.0%) | 0 (0.0%) |
| Total (Category) | 12 (100.0%) | 0 (0.0%) |
| Total (Overall) | 19 (79.2%) | 5 (20.8%) |
Employment Industries by Sex in Indian Creek
Employment Industries in Indian Creek
The major employment industries in Indian Creek include Retail Trade (13 | 54.2%), Finance & Insurance (6 | 25.0%), Accommodation & Food Services (3 | 12.5%), and Educational Services (2 | 8.3%).
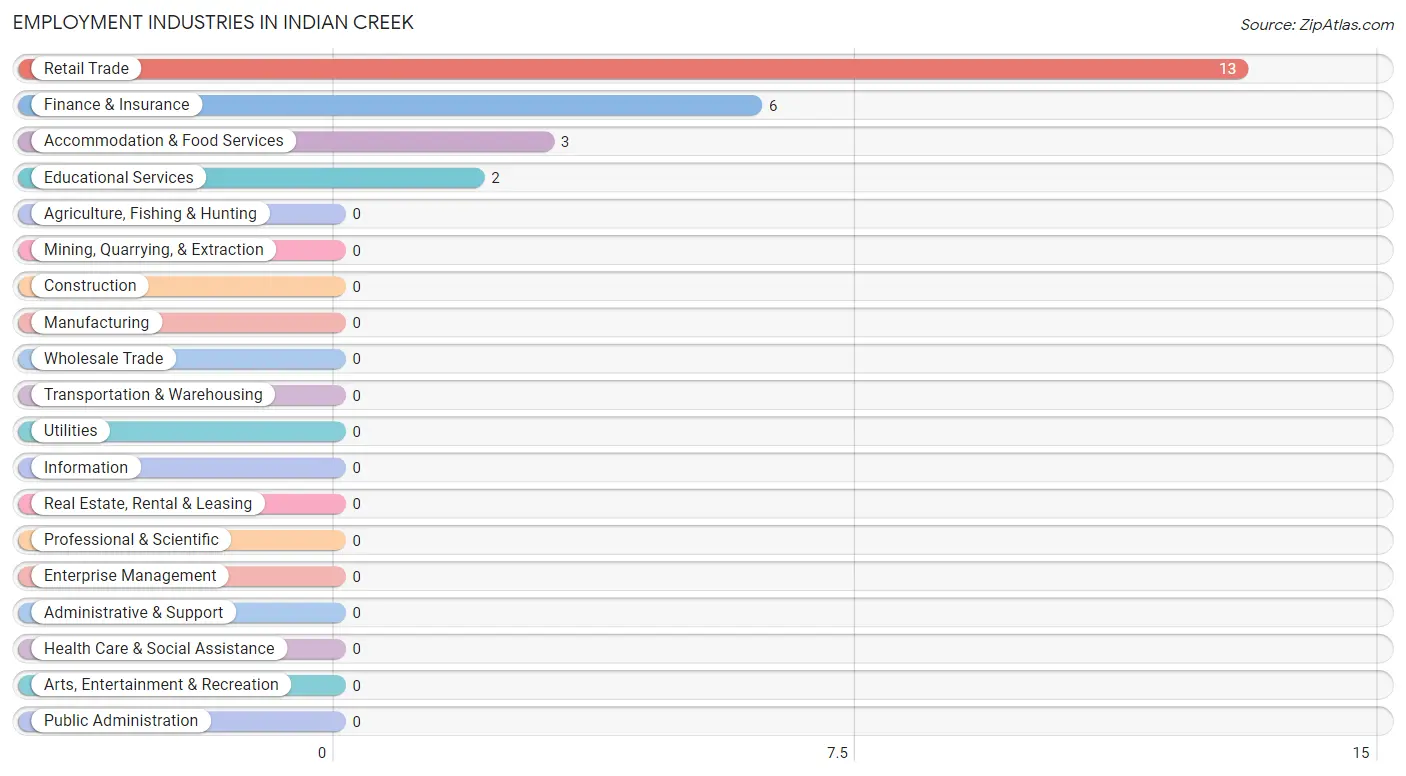
Employment Industries by Sex in Indian Creek
The Indian Creek industries that see more men than women are Retail Trade (100.0%), and Finance & Insurance (100.0%), whereas the industries that tend to have a higher number of women are Educational Services (100.0%), and Accommodation & Food Services (100.0%).
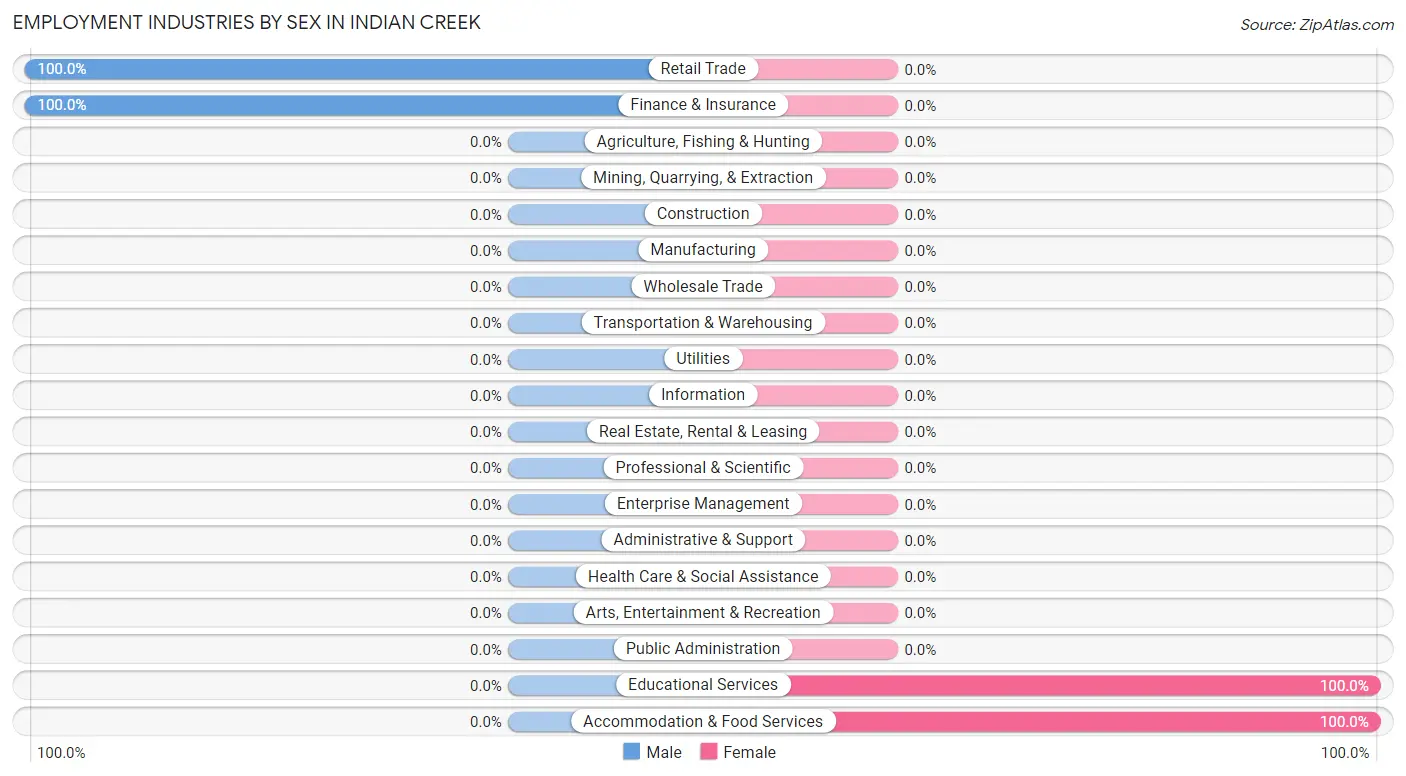
| Industry | Male | Female |
| Agriculture, Fishing & Hunting | 0 (0.0%) | 0 (0.0%) |
| Mining, Quarrying, & Extraction | 0 (0.0%) | 0 (0.0%) |
| Construction | 0 (0.0%) | 0 (0.0%) |
| Manufacturing | 0 (0.0%) | 0 (0.0%) |
| Wholesale Trade | 0 (0.0%) | 0 (0.0%) |
| Retail Trade | 13 (100.0%) | 0 (0.0%) |
| Transportation & Warehousing | 0 (0.0%) | 0 (0.0%) |
| Utilities | 0 (0.0%) | 0 (0.0%) |
| Information | 0 (0.0%) | 0 (0.0%) |
| Finance & Insurance | 6 (100.0%) | 0 (0.0%) |
| Real Estate, Rental & Leasing | 0 (0.0%) | 0 (0.0%) |
| Professional & Scientific | 0 (0.0%) | 0 (0.0%) |
| Enterprise Management | 0 (0.0%) | 0 (0.0%) |
| Administrative & Support | 0 (0.0%) | 0 (0.0%) |
| Educational Services | 0 (0.0%) | 2 (100.0%) |
| Health Care & Social Assistance | 0 (0.0%) | 0 (0.0%) |
| Arts, Entertainment & Recreation | 0 (0.0%) | 0 (0.0%) |
| Accommodation & Food Services | 0 (0.0%) | 3 (100.0%) |
| Public Administration | 0 (0.0%) | 0 (0.0%) |
| Total | 19 (79.2%) | 5 (20.8%) |
Education in Indian Creek
School Enrollment in Indian Creek
The most common levels of schooling among the 17 students in Indian Creek are high school (8 | 47.1%), graduate / professional (4 | 23.5%), and college / undergraduate (3 | 17.6%).
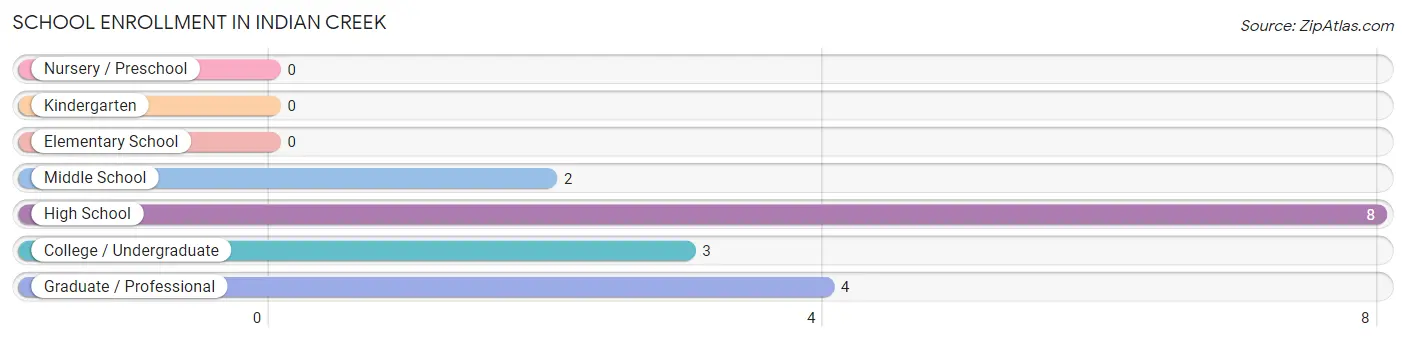
| School Level | # Students | % Students |
| Nursery / Preschool | 0 | 0.0% |
| Kindergarten | 0 | 0.0% |
| Elementary School | 0 | 0.0% |
| Middle School | 2 | 11.8% |
| High School | 8 | 47.1% |
| College / Undergraduate | 3 | 17.6% |
| Graduate / Professional | 4 | 23.5% |
| Total | 17 | 100.0% |
School Enrollment by Age by Funding Source in Indian Creek
Out of a total of 17 students who are enrolled in schools in Indian Creek, 15 (88.2%) attend a private institution, while the remaining 2 (11.8%) are enrolled in public schools. The age group of 15 to 17 year olds has the highest likelihood of being enrolled in private schools, with 8 (100.0% in the age bracket) enrolled. Conversely, the age group of 10 to 14 year olds has the lowest likelihood of being enrolled in a private school, with 2 (100.0% in the age bracket) attending a public institution.
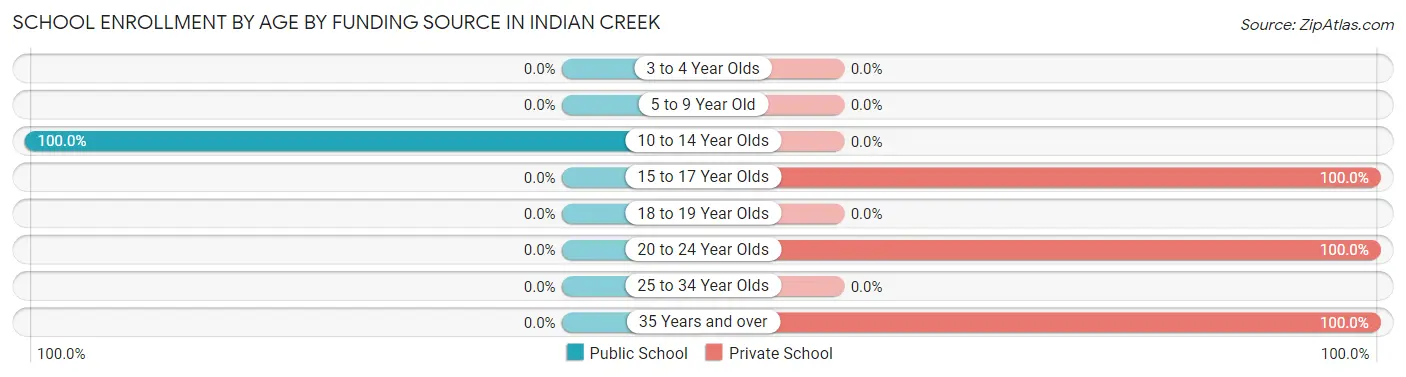
| Age Bracket | Public School | Private School |
| 3 to 4 Year Olds | 0 (0.0%) | 0 (0.0%) |
| 5 to 9 Year Old | 0 (0.0%) | 0 (0.0%) |
| 10 to 14 Year Olds | 2 (100.0%) | 0 (0.0%) |
| 15 to 17 Year Olds | 0 (0.0%) | 8 (100.0%) |
| 18 to 19 Year Olds | 0 (0.0%) | 0 (0.0%) |
| 20 to 24 Year Olds | 0 (0.0%) | 4 (100.0%) |
| 25 to 34 Year Olds | 0 (0.0%) | 0 (0.0%) |
| 35 Years and over | 0 (0.0%) | 3 (100.0%) |
| Total | 2 (11.8%) | 15 (88.2%) |
Educational Attainment by Field of Study in Indian Creek
Business (7 | 30.4%), social sciences (4 | 17.4%), science & technology (3 | 13.0%), arts & humanities (3 | 13.0%), and psychology (2 | 8.7%) are the most common fields of study among 23 individuals in Indian Creek who have obtained a bachelor's degree or higher.
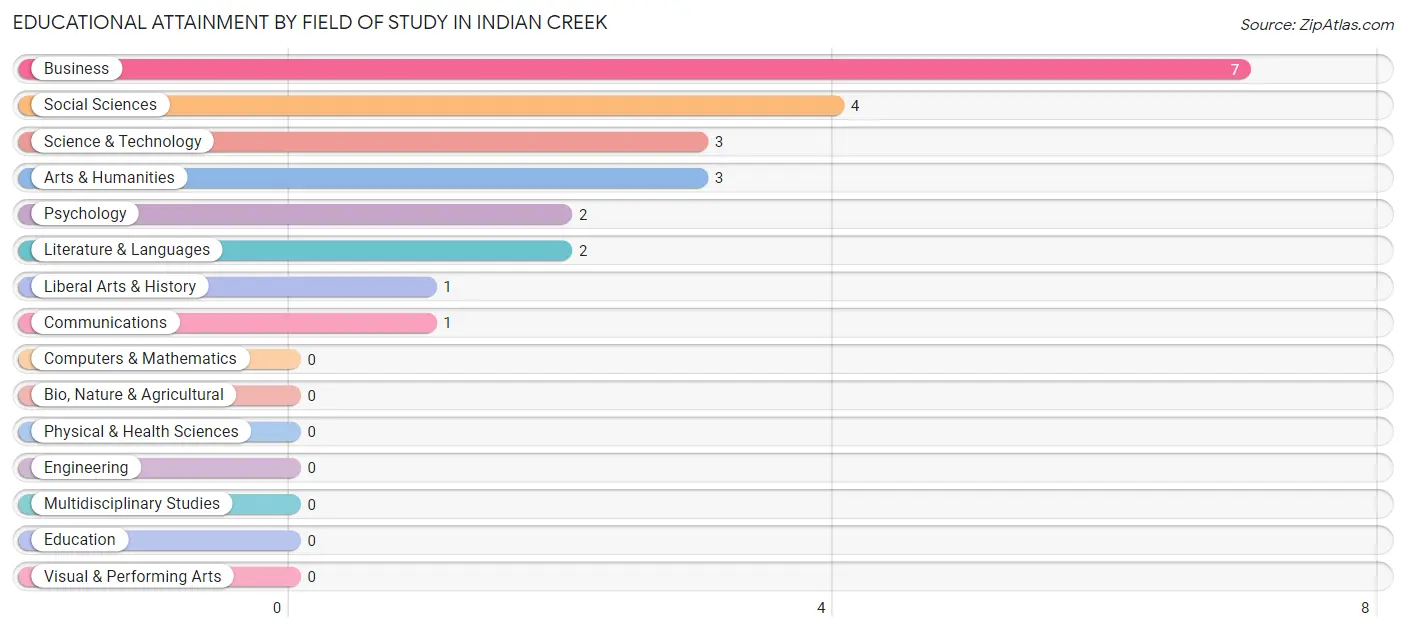
| Field of Study | # Graduates | % Graduates |
| Computers & Mathematics | 0 | 0.0% |
| Bio, Nature & Agricultural | 0 | 0.0% |
| Physical & Health Sciences | 0 | 0.0% |
| Psychology | 2 | 8.7% |
| Social Sciences | 4 | 17.4% |
| Engineering | 0 | 0.0% |
| Multidisciplinary Studies | 0 | 0.0% |
| Science & Technology | 3 | 13.0% |
| Business | 7 | 30.4% |
| Education | 0 | 0.0% |
| Literature & Languages | 2 | 8.7% |
| Liberal Arts & History | 1 | 4.3% |
| Visual & Performing Arts | 0 | 0.0% |
| Communications | 1 | 4.3% |
| Arts & Humanities | 3 | 13.0% |
| Total | 23 | 100.0% |
Transportation & Commute in Indian Creek
Vehicle Availability by Sex in Indian Creek
The most prevalent vehicle ownership categories in Indian Creek are males with 1 vehicle (12, accounting for 63.2%) and females with 1 vehicle (2, making up 240.0%).
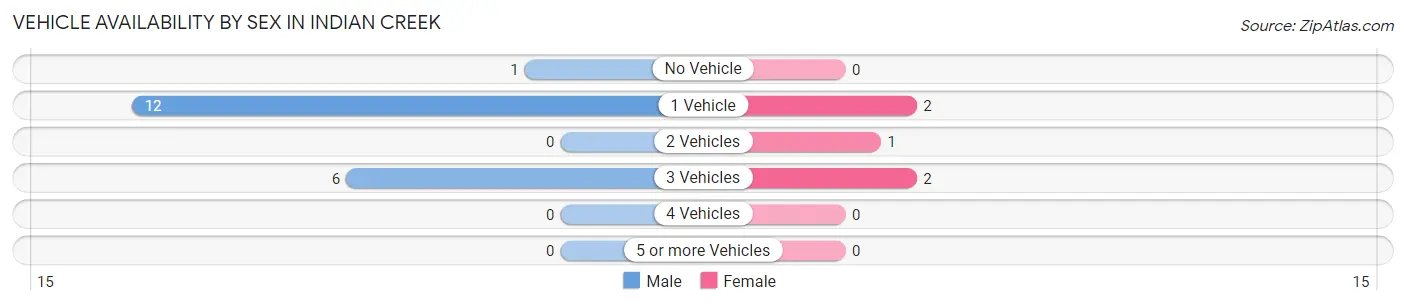
| Vehicles Available | Male | Female |
| No Vehicle | 1 (5.3%) | 0 (0.0%) |
| 1 Vehicle | 12 (63.2%) | 2 (40.0%) |
| 2 Vehicles | 0 (0.0%) | 1 (20.0%) |
| 3 Vehicles | 6 (31.6%) | 2 (40.0%) |
| 4 Vehicles | 0 (0.0%) | 0 (0.0%) |
| 5 or more Vehicles | 0 (0.0%) | 0 (0.0%) |
| Total | 19 (100.0%) | 5 (100.0%) |
Commute Time in Indian Creek
The most frequently occuring commute durations in Indian Creek are 5 to 9 minutes (4 commuters, 33.3%), 15 to 19 minutes (4 commuters, 33.3%), and 30 to 34 minutes (2 commuters, 16.7%).
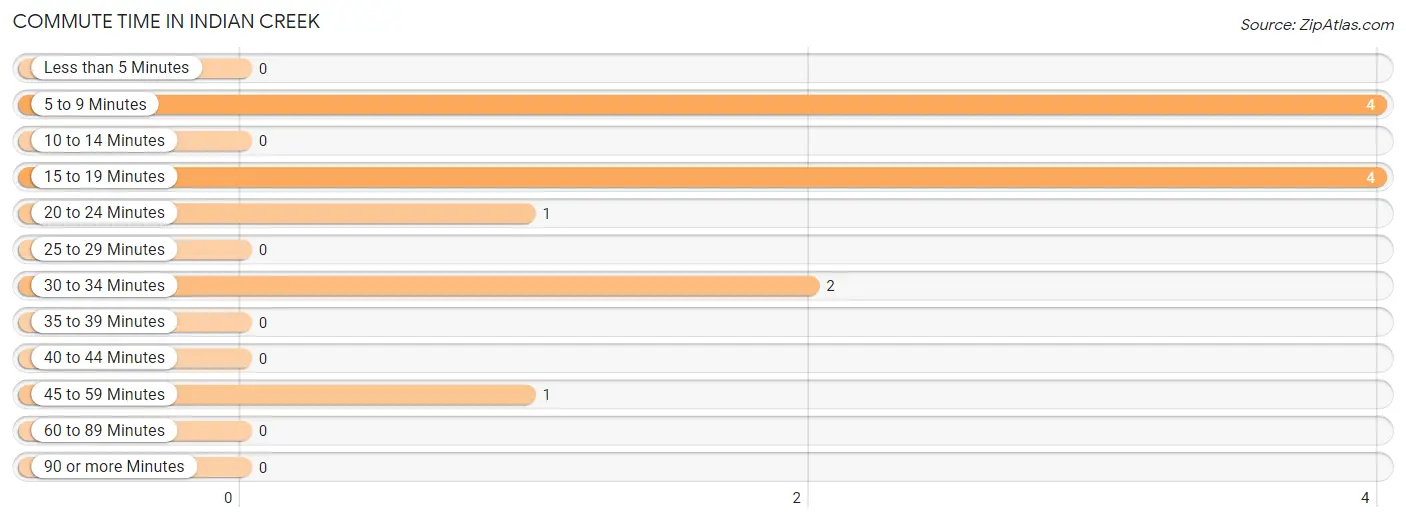
| Commute Time | # Commuters | % Commuters |
| Less than 5 Minutes | 0 | 0.0% |
| 5 to 9 Minutes | 4 | 33.3% |
| 10 to 14 Minutes | 0 | 0.0% |
| 15 to 19 Minutes | 4 | 33.3% |
| 20 to 24 Minutes | 1 | 8.3% |
| 25 to 29 Minutes | 0 | 0.0% |
| 30 to 34 Minutes | 2 | 16.7% |
| 35 to 39 Minutes | 0 | 0.0% |
| 40 to 44 Minutes | 0 | 0.0% |
| 45 to 59 Minutes | 1 | 8.3% |
| 60 to 89 Minutes | 0 | 0.0% |
| 90 or more Minutes | 0 | 0.0% |
Commute Time by Sex in Indian Creek
The most common commute times in Indian Creek are 5 to 9 minutes (4 commuters, 57.1%) for males and 15 to 19 minutes (2 commuters, 40.0%) for females.
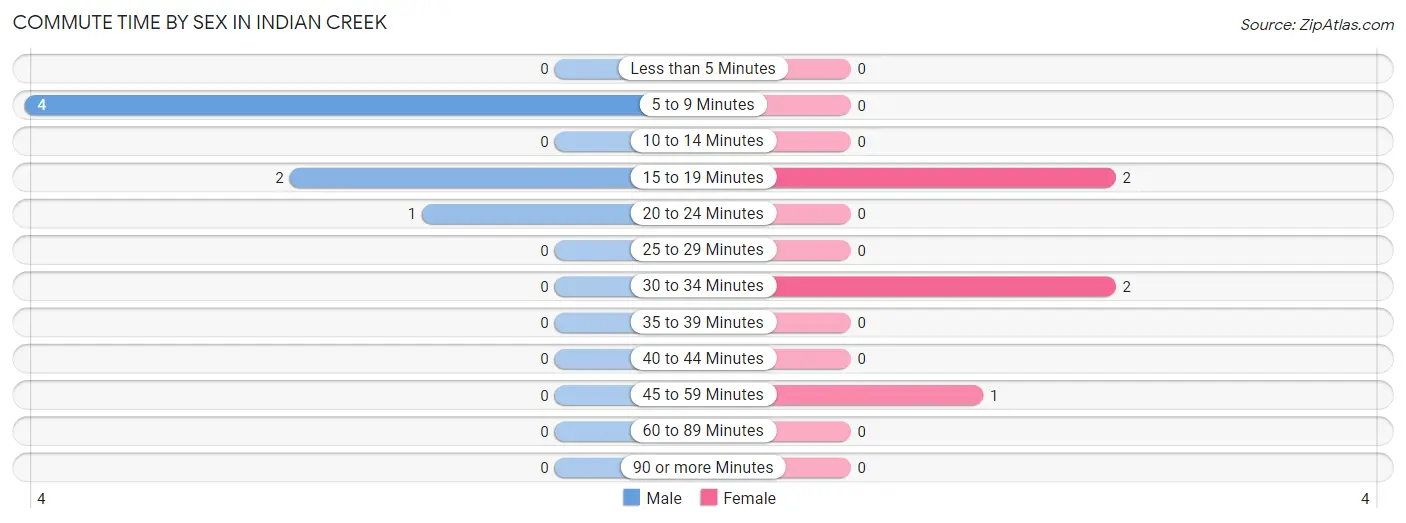
| Commute Time | Male | Female |
| Less than 5 Minutes | 0 (0.0%) | 0 (0.0%) |
| 5 to 9 Minutes | 4 (57.1%) | 0 (0.0%) |
| 10 to 14 Minutes | 0 (0.0%) | 0 (0.0%) |
| 15 to 19 Minutes | 2 (28.6%) | 2 (40.0%) |
| 20 to 24 Minutes | 1 (14.3%) | 0 (0.0%) |
| 25 to 29 Minutes | 0 (0.0%) | 0 (0.0%) |
| 30 to 34 Minutes | 0 (0.0%) | 2 (40.0%) |
| 35 to 39 Minutes | 0 (0.0%) | 0 (0.0%) |
| 40 to 44 Minutes | 0 (0.0%) | 0 (0.0%) |
| 45 to 59 Minutes | 0 (0.0%) | 1 (20.0%) |
| 60 to 89 Minutes | 0 (0.0%) | 0 (0.0%) |
| 90 or more Minutes | 0 (0.0%) | 0 (0.0%) |
Time of Departure to Work by Sex in Indian Creek
The most frequent times of departure to work in Indian Creek are 9:00 AM to 9:59 AM (4, 57.1%) for males and 12:00 PM to 3:59 PM (2, 40.0%) for females.
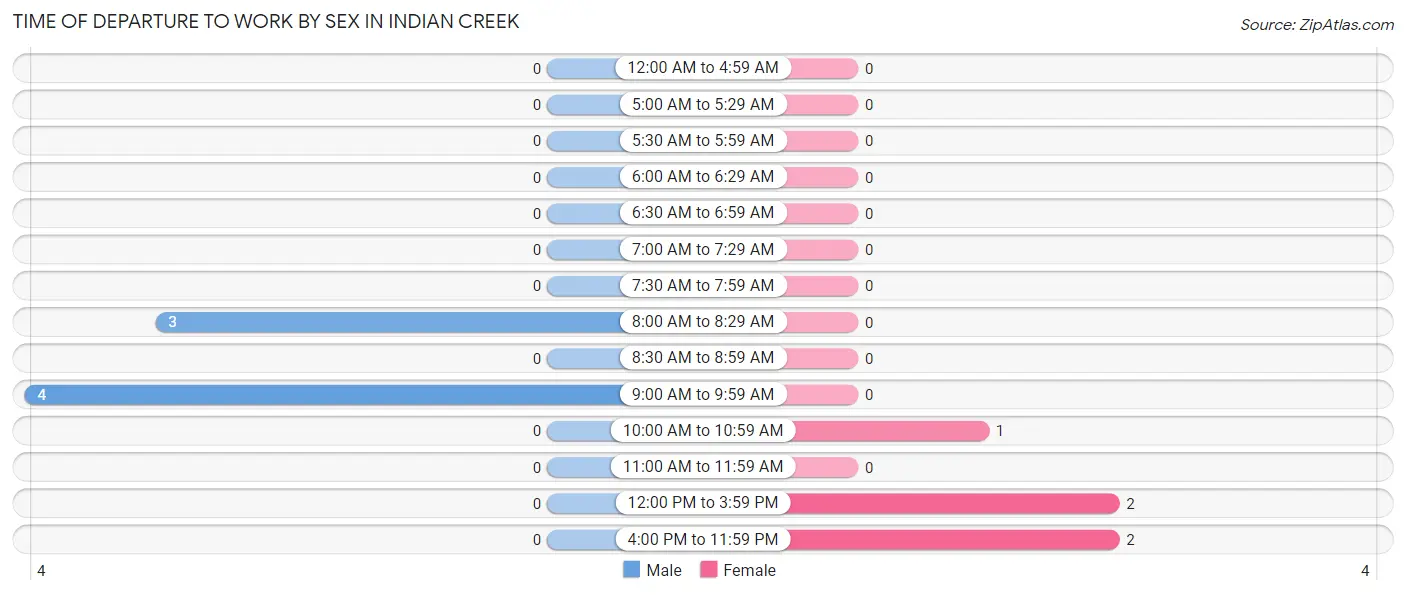
| Time of Departure | Male | Female |
| 12:00 AM to 4:59 AM | 0 (0.0%) | 0 (0.0%) |
| 5:00 AM to 5:29 AM | 0 (0.0%) | 0 (0.0%) |
| 5:30 AM to 5:59 AM | 0 (0.0%) | 0 (0.0%) |
| 6:00 AM to 6:29 AM | 0 (0.0%) | 0 (0.0%) |
| 6:30 AM to 6:59 AM | 0 (0.0%) | 0 (0.0%) |
| 7:00 AM to 7:29 AM | 0 (0.0%) | 0 (0.0%) |
| 7:30 AM to 7:59 AM | 0 (0.0%) | 0 (0.0%) |
| 8:00 AM to 8:29 AM | 3 (42.9%) | 0 (0.0%) |
| 8:30 AM to 8:59 AM | 0 (0.0%) | 0 (0.0%) |
| 9:00 AM to 9:59 AM | 4 (57.1%) | 0 (0.0%) |
| 10:00 AM to 10:59 AM | 0 (0.0%) | 1 (20.0%) |
| 11:00 AM to 11:59 AM | 0 (0.0%) | 0 (0.0%) |
| 12:00 PM to 3:59 PM | 0 (0.0%) | 2 (40.0%) |
| 4:00 PM to 11:59 PM | 0 (0.0%) | 2 (40.0%) |
| Total | 7 (100.0%) | 5 (100.0%) |
Housing Occupancy in Indian Creek
Occupancy by Ownership in Indian Creek
Of the total 28 dwellings in Indian Creek, owner-occupied units account for 16 (57.1%), while renter-occupied units make up 12 (42.9%).
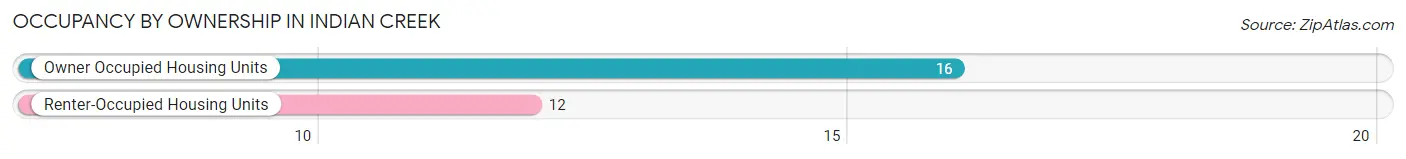
| Occupancy | # Housing Units | % Housing Units |
| Owner Occupied Housing Units | 16 | 57.1% |
| Renter-Occupied Housing Units | 12 | 42.9% |
| Total Occupied Housing Units | 28 | 100.0% |
Occupancy by Household Size in Indian Creek
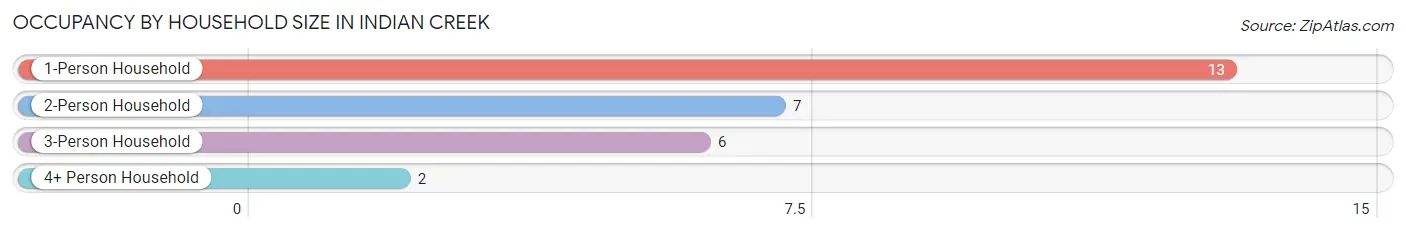
| Household Size | # Housing Units | % Housing Units |
| 1-Person Household | 13 | 46.4% |
| 2-Person Household | 7 | 25.0% |
| 3-Person Household | 6 | 21.4% |
| 4+ Person Household | 2 | 7.1% |
| Total Housing Units | 28 | 100.0% |
Occupancy by Ownership by Household Size in Indian Creek
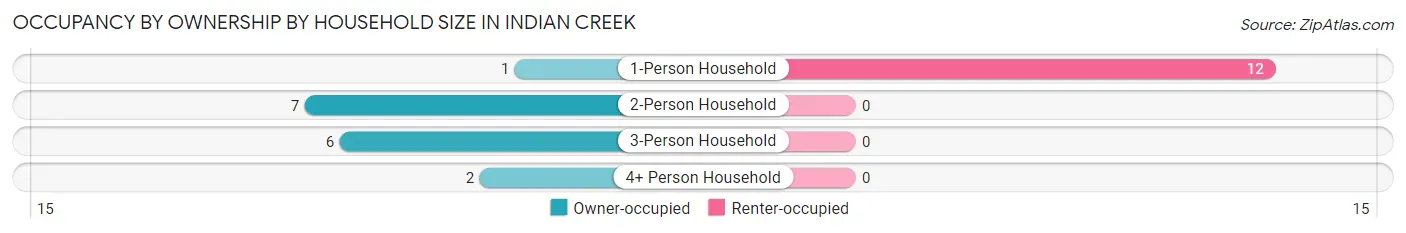
| Household Size | Owner-occupied | Renter-occupied |
| 1-Person Household | 1 (7.7%) | 12 (92.3%) |
| 2-Person Household | 7 (100.0%) | 0 (0.0%) |
| 3-Person Household | 6 (100.0%) | 0 (0.0%) |
| 4+ Person Household | 2 (100.0%) | 0 (0.0%) |
| Total Housing Units | 16 (57.1%) | 12 (42.9%) |
Occupancy by Educational Attainment in Indian Creek
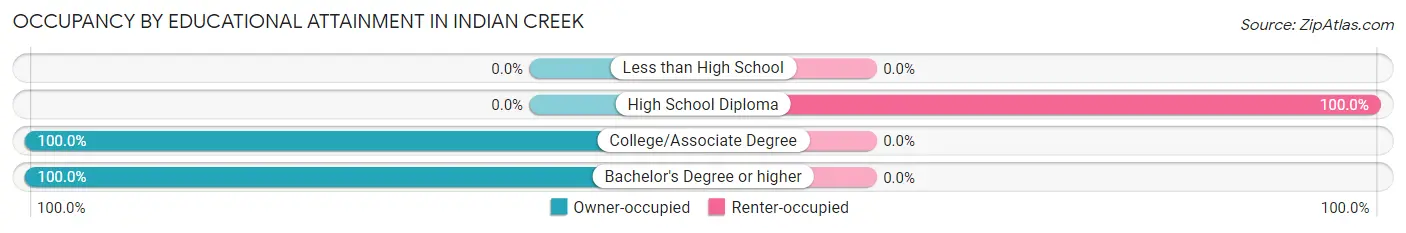
| Household Size | Owner-occupied | Renter-occupied |
| Less than High School | 0 (0.0%) | 0 (0.0%) |
| High School Diploma | 0 (0.0%) | 12 (100.0%) |
| College/Associate Degree | 6 (100.0%) | 0 (0.0%) |
| Bachelor's Degree or higher | 10 (100.0%) | 0 (0.0%) |
Occupancy by Age of Householder in Indian Creek
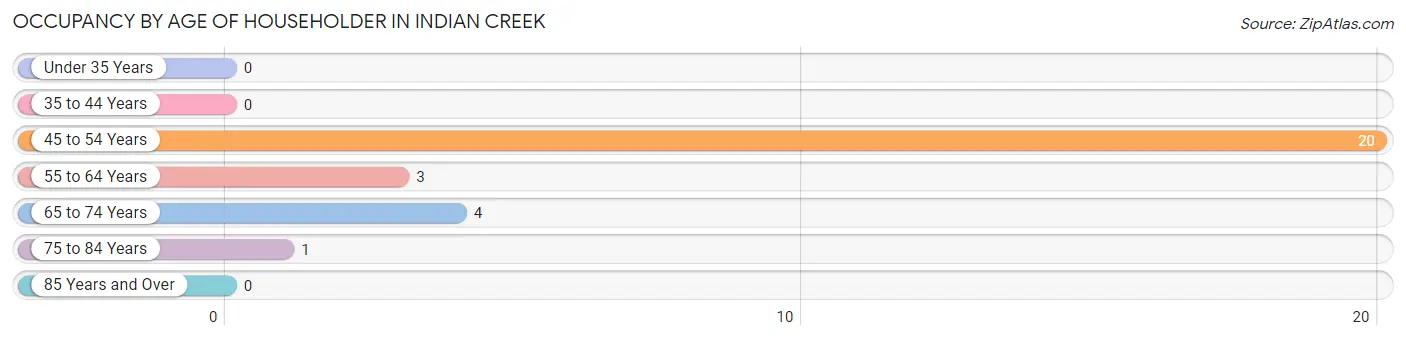
| Age Bracket | # Households | % Households |
| Under 35 Years | 0 | 0.0% |
| 35 to 44 Years | 0 | 0.0% |
| 45 to 54 Years | 20 | 71.4% |
| 55 to 64 Years | 3 | 10.7% |
| 65 to 74 Years | 4 | 14.3% |
| 75 to 84 Years | 1 | 3.6% |
| 85 Years and Over | 0 | 0.0% |
| Total | 28 | 100.0% |
Housing Finances in Indian Creek
Median Income by Occupancy in Indian Creek
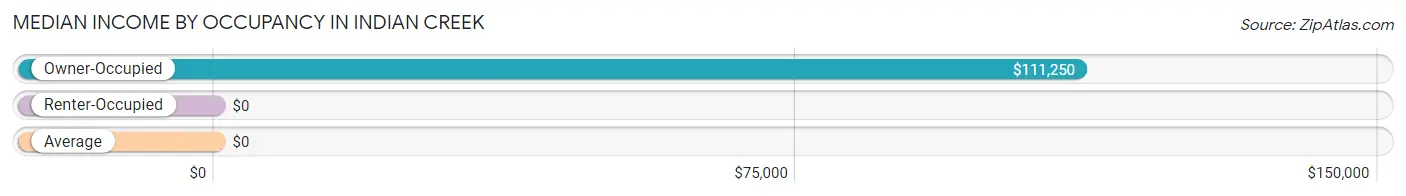
| Occupancy Type | # Households | Median Income |
| Owner-Occupied | 16 (57.1%) | $111,250 |
| Renter-Occupied | 12 (42.9%) | $0 |
| Average | 28 (100.0%) | $0 |
Occupancy by Householder Income Bracket in Indian Creek
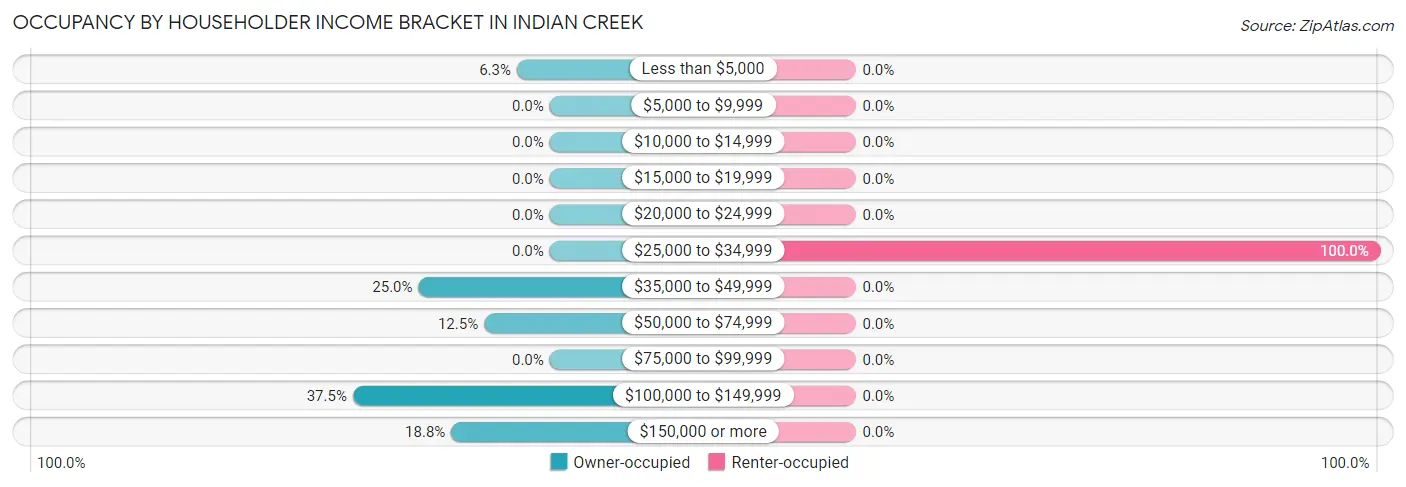
| Income Bracket | Owner-occupied | Renter-occupied |
| Less than $5,000 | 1 (6.2%) | 0 (0.0%) |
| $5,000 to $9,999 | 0 (0.0%) | 0 (0.0%) |
| $10,000 to $14,999 | 0 (0.0%) | 0 (0.0%) |
| $15,000 to $19,999 | 0 (0.0%) | 0 (0.0%) |
| $20,000 to $24,999 | 0 (0.0%) | 0 (0.0%) |
| $25,000 to $34,999 | 0 (0.0%) | 12 (100.0%) |
| $35,000 to $49,999 | 4 (25.0%) | 0 (0.0%) |
| $50,000 to $74,999 | 2 (12.5%) | 0 (0.0%) |
| $75,000 to $99,999 | 0 (0.0%) | 0 (0.0%) |
| $100,000 to $149,999 | 6 (37.5%) | 0 (0.0%) |
| $150,000 or more | 3 (18.8%) | 0 (0.0%) |
| Total | 16 (100.0%) | 12 (100.0%) |
Monthly Housing Cost Tiers in Indian Creek
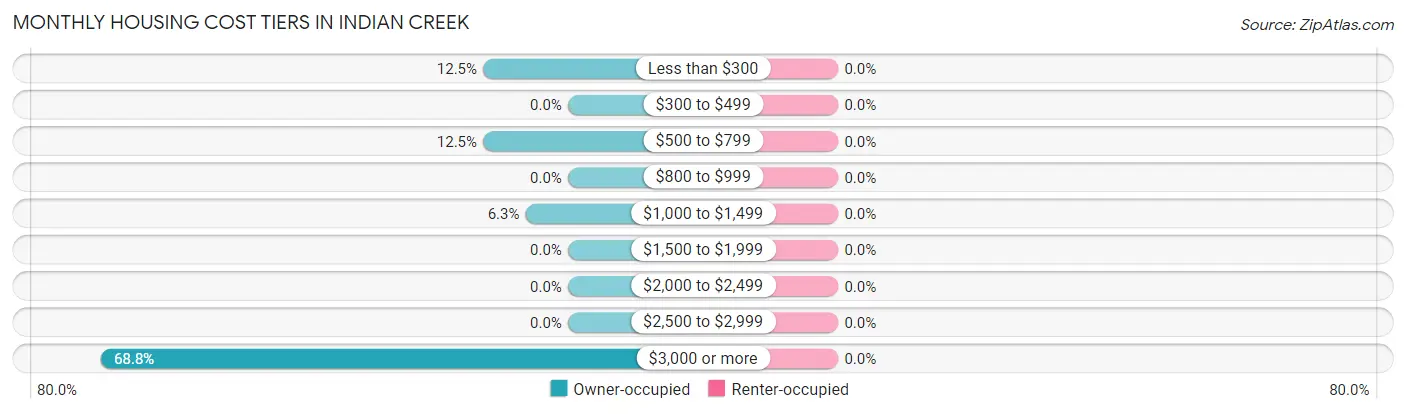
| Monthly Cost | Owner-occupied | Renter-occupied |
| Less than $300 | 2 (12.5%) | 0 (0.0%) |
| $300 to $499 | 0 (0.0%) | 0 (0.0%) |
| $500 to $799 | 2 (12.5%) | 0 (0.0%) |
| $800 to $999 | 0 (0.0%) | 0 (0.0%) |
| $1,000 to $1,499 | 1 (6.2%) | 0 (0.0%) |
| $1,500 to $1,999 | 0 (0.0%) | 0 (0.0%) |
| $2,000 to $2,499 | 0 (0.0%) | 0 (0.0%) |
| $2,500 to $2,999 | 0 (0.0%) | 0 (0.0%) |
| $3,000 or more | 11 (68.8%) | 0 (0.0%) |
| Total | 16 (100.0%) | 12 (100.0%) |
Physical Housing Characteristics in Indian Creek
Housing Structures in Indian Creek
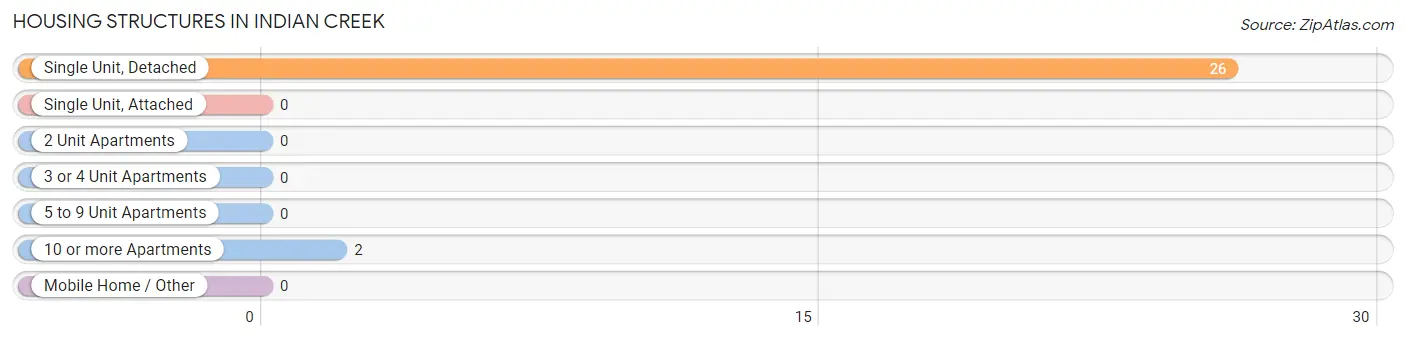
| Structure Type | # Housing Units | % Housing Units |
| Single Unit, Detached | 26 | 92.9% |
| Single Unit, Attached | 0 | 0.0% |
| 2 Unit Apartments | 0 | 0.0% |
| 3 or 4 Unit Apartments | 0 | 0.0% |
| 5 to 9 Unit Apartments | 0 | 0.0% |
| 10 or more Apartments | 2 | 7.1% |
| Mobile Home / Other | 0 | 0.0% |
| Total | 28 | 100.0% |
Housing Structures by Occupancy in Indian Creek
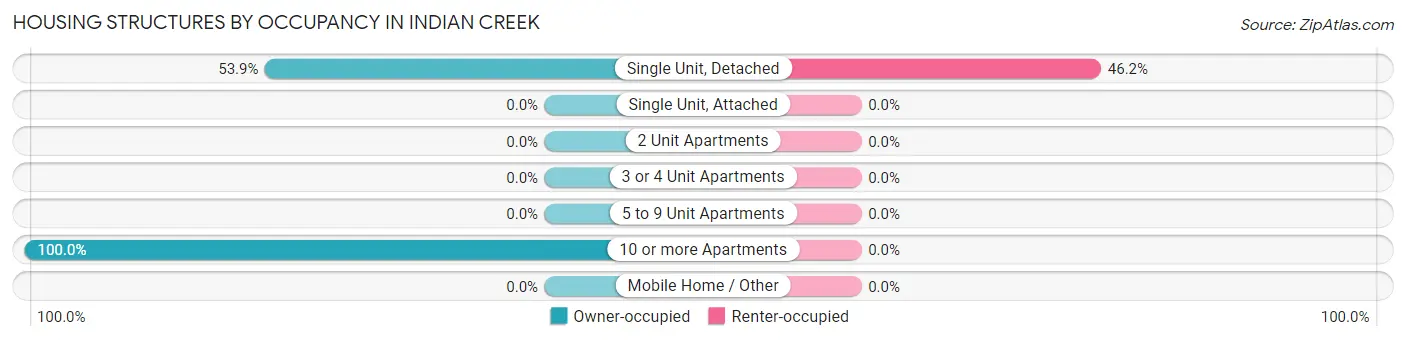
| Structure Type | Owner-occupied | Renter-occupied |
| Single Unit, Detached | 14 (53.8%) | 12 (46.2%) |
| Single Unit, Attached | 0 (0.0%) | 0 (0.0%) |
| 2 Unit Apartments | 0 (0.0%) | 0 (0.0%) |
| 3 or 4 Unit Apartments | 0 (0.0%) | 0 (0.0%) |
| 5 to 9 Unit Apartments | 0 (0.0%) | 0 (0.0%) |
| 10 or more Apartments | 2 (100.0%) | 0 (0.0%) |
| Mobile Home / Other | 0 (0.0%) | 0 (0.0%) |
| Total | 16 (57.1%) | 12 (42.9%) |
Housing Structures by Number of Rooms in Indian Creek
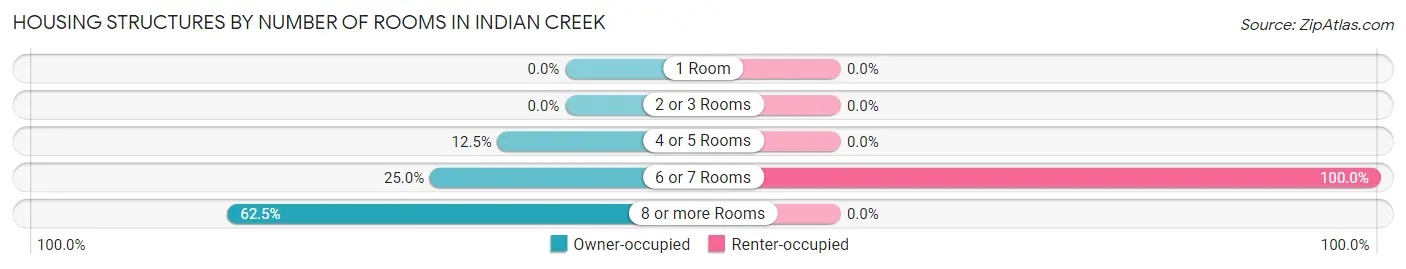
| Number of Rooms | Owner-occupied | Renter-occupied |
| 1 Room | 0 (0.0%) | 0 (0.0%) |
| 2 or 3 Rooms | 0 (0.0%) | 0 (0.0%) |
| 4 or 5 Rooms | 2 (12.5%) | 0 (0.0%) |
| 6 or 7 Rooms | 4 (25.0%) | 12 (100.0%) |
| 8 or more Rooms | 10 (62.5%) | 0 (0.0%) |
| Total | 16 (100.0%) | 12 (100.0%) |
Housing Structure by Heating Type in Indian Creek
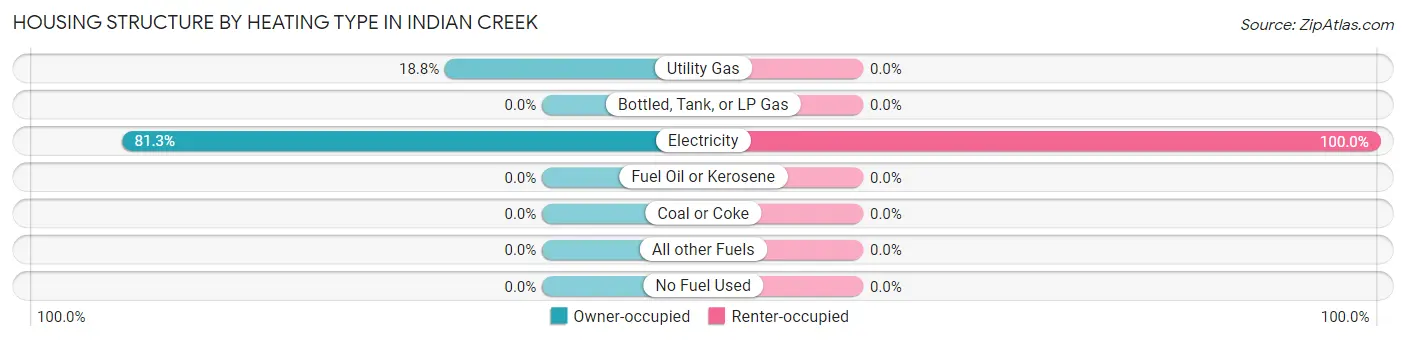
| Heating Type | Owner-occupied | Renter-occupied |
| Utility Gas | 3 (18.8%) | 0 (0.0%) |
| Bottled, Tank, or LP Gas | 0 (0.0%) | 0 (0.0%) |
| Electricity | 13 (81.2%) | 12 (100.0%) |
| Fuel Oil or Kerosene | 0 (0.0%) | 0 (0.0%) |
| Coal or Coke | 0 (0.0%) | 0 (0.0%) |
| All other Fuels | 0 (0.0%) | 0 (0.0%) |
| No Fuel Used | 0 (0.0%) | 0 (0.0%) |
| Total | 16 (100.0%) | 12 (100.0%) |
Household Vehicle Usage in Indian Creek
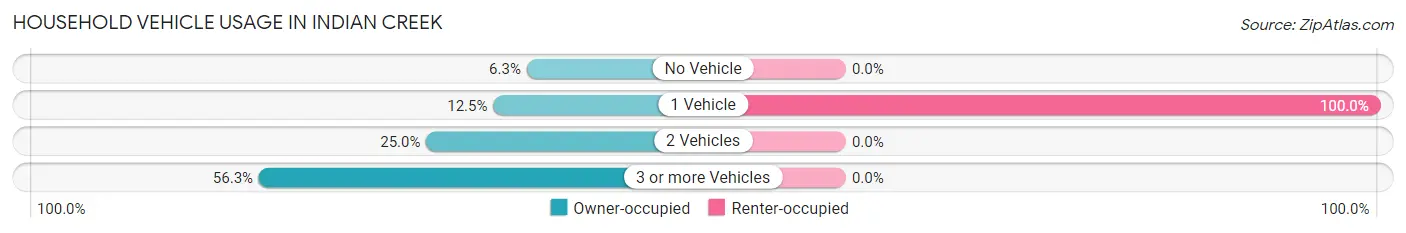
| Vehicles per Household | Owner-occupied | Renter-occupied |
| No Vehicle | 1 (6.2%) | 0 (0.0%) |
| 1 Vehicle | 2 (12.5%) | 12 (100.0%) |
| 2 Vehicles | 4 (25.0%) | 0 (0.0%) |
| 3 or more Vehicles | 9 (56.2%) | 0 (0.0%) |
| Total | 16 (100.0%) | 12 (100.0%) |
Real Estate & Mortgages in Indian Creek
Real Estate and Mortgage Overview in Indian Creek
| Characteristic | Without Mortgage | With Mortgage |
| Housing Units | 10 | 6 |
| Median Property Value | - | - |
| Median Household Income | - | - |
| Monthly Housing Costs | $1,350 | $6 |
| Real Estate Taxes | - | - |
Property Value by Mortgage Status in Indian Creek
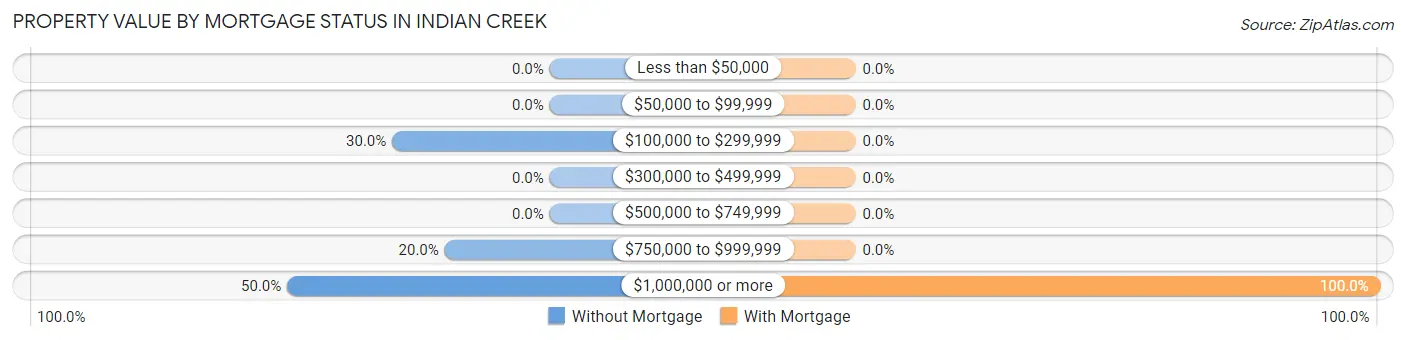
| Property Value | Without Mortgage | With Mortgage |
| Less than $50,000 | 0 (0.0%) | 0 (0.0%) |
| $50,000 to $99,999 | 0 (0.0%) | 0 (0.0%) |
| $100,000 to $299,999 | 3 (30.0%) | 0 (0.0%) |
| $300,000 to $499,999 | 0 (0.0%) | 0 (0.0%) |
| $500,000 to $749,999 | 0 (0.0%) | 0 (0.0%) |
| $750,000 to $999,999 | 2 (20.0%) | 0 (0.0%) |
| $1,000,000 or more | 5 (50.0%) | 6 (100.0%) |
| Total | 10 (100.0%) | 6 (100.0%) |
Household Income by Mortgage Status in Indian Creek
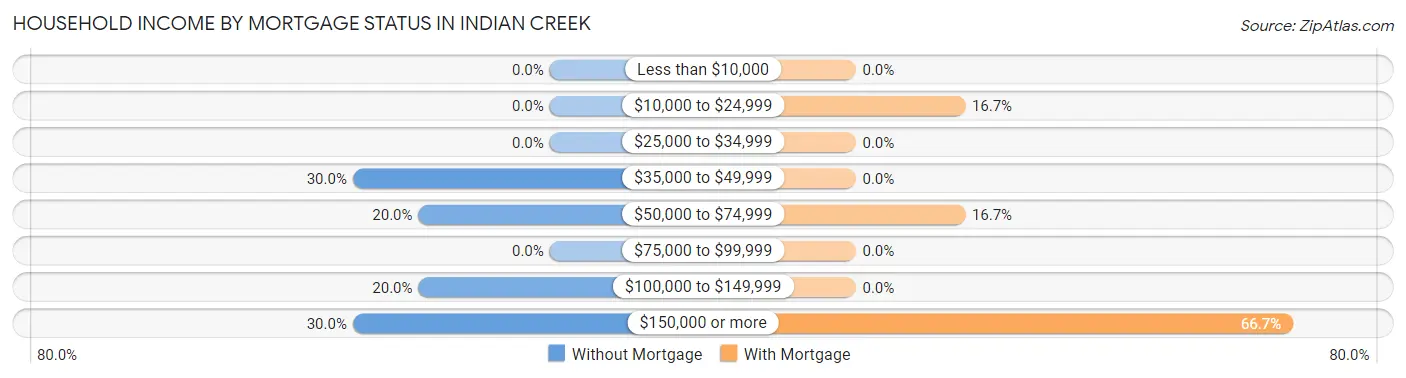
| Household Income | Without Mortgage | With Mortgage |
| Less than $10,000 | 0 (0.0%) | 0 (0.0%) |
| $10,000 to $24,999 | 0 (0.0%) | 1 (16.7%) |
| $25,000 to $34,999 | 0 (0.0%) | 0 (0.0%) |
| $35,000 to $49,999 | 3 (30.0%) | 0 (0.0%) |
| $50,000 to $74,999 | 2 (20.0%) | 1 (16.7%) |
| $75,000 to $99,999 | 0 (0.0%) | 0 (0.0%) |
| $100,000 to $149,999 | 2 (20.0%) | 0 (0.0%) |
| $150,000 or more | 3 (30.0%) | 4 (66.7%) |
| Total | 10 (100.0%) | 6 (100.0%) |
Property Value to Household Income Ratio in Indian Creek
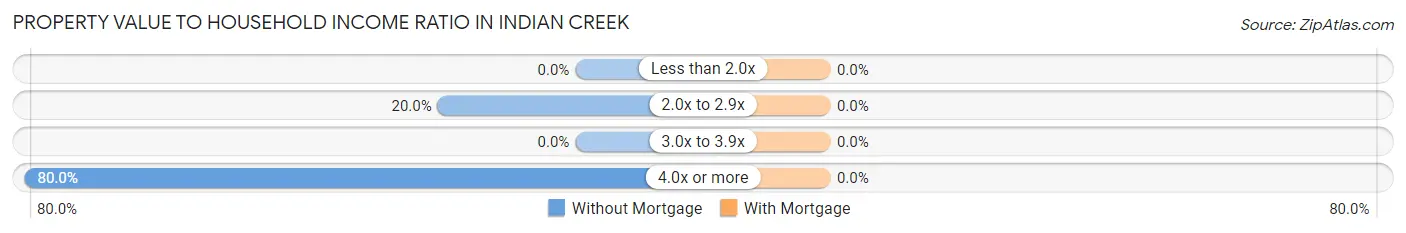
| Value-to-Income Ratio | Without Mortgage | With Mortgage |
| Less than 2.0x | 0 (0.0%) | 0 (0.0%) |
| 2.0x to 2.9x | 2 (20.0%) | 0 (0.0%) |
| 3.0x to 3.9x | 0 (0.0%) | 0 (0.0%) |
| 4.0x or more | 8 (80.0%) | 0 (0.0%) |
| Total | 10 (100.0%) | 6 (100.0%) |
Real Estate Taxes by Mortgage Status in Indian Creek
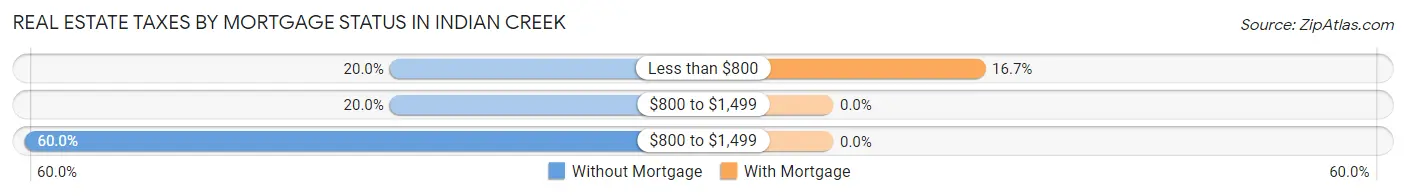
| Property Taxes | Without Mortgage | With Mortgage |
| Less than $800 | 2 (20.0%) | 1 (16.7%) |
| $800 to $1,499 | 2 (20.0%) | 0 (0.0%) |
| $800 to $1,499 | 6 (60.0%) | 0 (0.0%) |
| Total | 10 (100.0%) | 6 (100.0%) |
Health & Disability in Indian Creek
Health Insurance Coverage by Age in Indian Creek
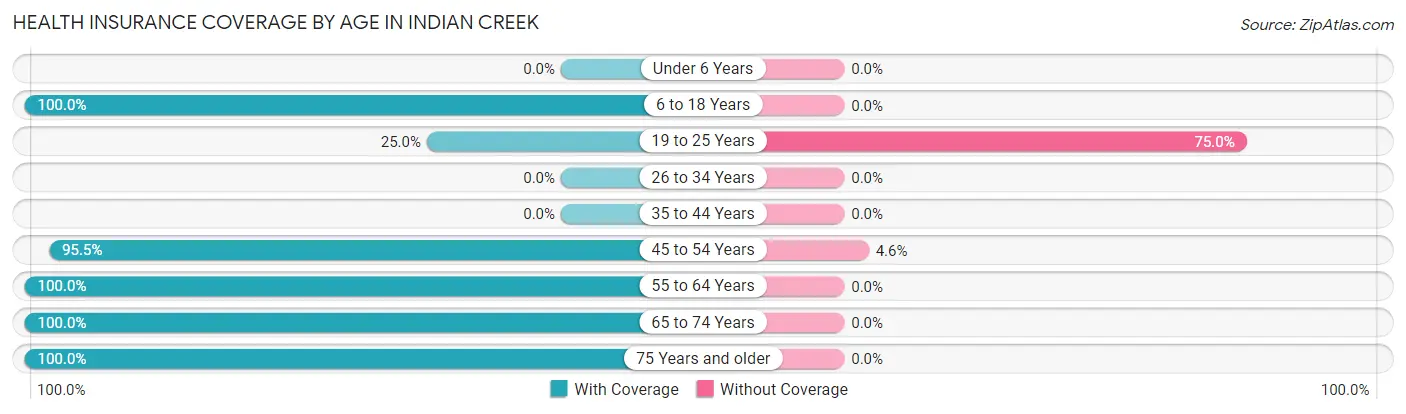
| Age Bracket | With Coverage | Without Coverage |
| Under 6 Years | 0 (0.0%) | 0 (0.0%) |
| 6 to 18 Years | 10 (100.0%) | 0 (0.0%) |
| 19 to 25 Years | 1 (25.0%) | 3 (75.0%) |
| 26 to 34 Years | 0 (0.0%) | 0 (0.0%) |
| 35 to 44 Years | 0 (0.0%) | 0 (0.0%) |
| 45 to 54 Years | 21 (95.5%) | 1 (4.5%) |
| 55 to 64 Years | 10 (100.0%) | 0 (0.0%) |
| 65 to 74 Years | 6 (100.0%) | 0 (0.0%) |
| 75 Years and older | 2 (100.0%) | 0 (0.0%) |
| Total | 50 (92.6%) | 4 (7.4%) |
Health Insurance Coverage by Citizenship Status in Indian Creek
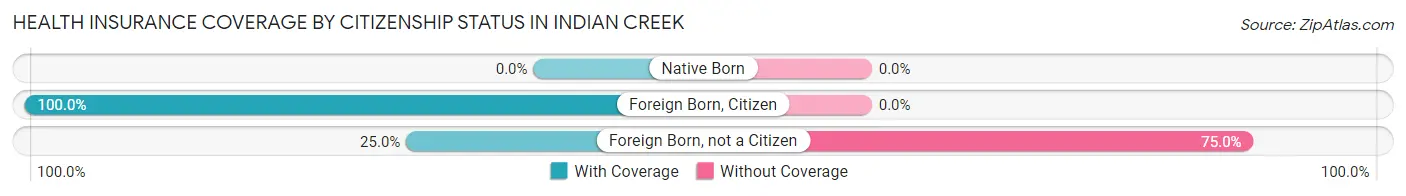
| Citizenship Status | With Coverage | Without Coverage |
| Native Born | 0 (0.0%) | 0 (0.0%) |
| Foreign Born, Citizen | 10 (100.0%) | 0 (0.0%) |
| Foreign Born, not a Citizen | 1 (25.0%) | 3 (75.0%) |
Health Insurance Coverage by Household Income in Indian Creek
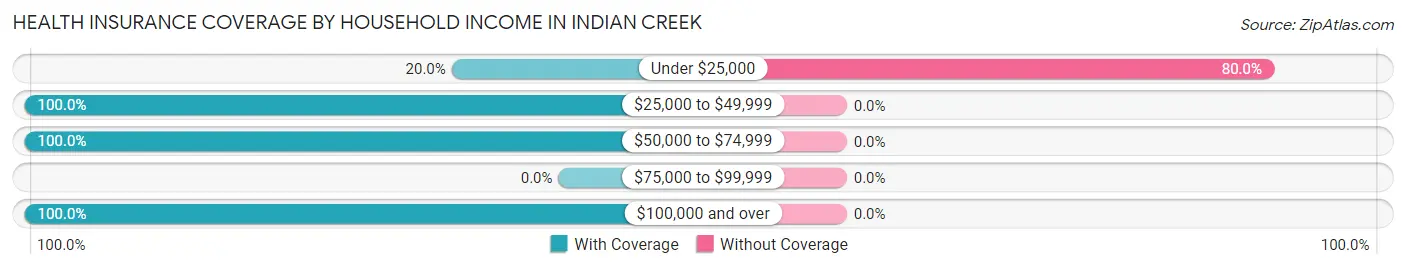
| Household Income | With Coverage | Without Coverage |
| Under $25,000 | 1 (20.0%) | 4 (80.0%) |
| $25,000 to $49,999 | 21 (100.0%) | 0 (0.0%) |
| $50,000 to $74,999 | 4 (100.0%) | 0 (0.0%) |
| $75,000 to $99,999 | 0 (0.0%) | 0 (0.0%) |
| $100,000 and over | 24 (100.0%) | 0 (0.0%) |
Public vs Private Health Insurance Coverage by Age in Indian Creek
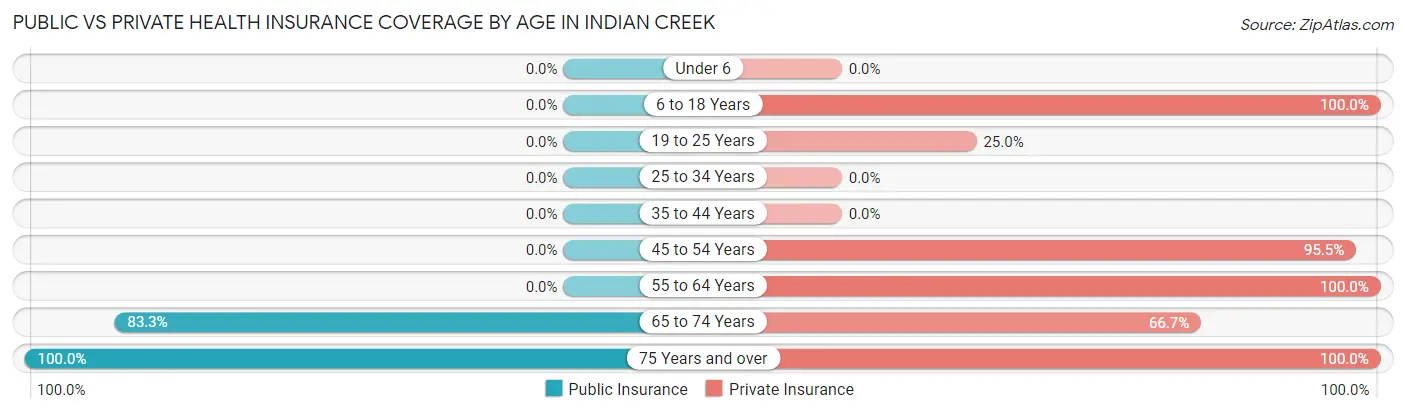
| Age Bracket | Public Insurance | Private Insurance |
| Under 6 | 0 (0.0%) | 0 (0.0%) |
| 6 to 18 Years | 0 (0.0%) | 10 (100.0%) |
| 19 to 25 Years | 0 (0.0%) | 1 (25.0%) |
| 25 to 34 Years | 0 (0.0%) | 0 (0.0%) |
| 35 to 44 Years | 0 (0.0%) | 0 (0.0%) |
| 45 to 54 Years | 0 (0.0%) | 21 (95.5%) |
| 55 to 64 Years | 0 (0.0%) | 10 (100.0%) |
| 65 to 74 Years | 5 (83.3%) | 4 (66.7%) |
| 75 Years and over | 2 (100.0%) | 2 (100.0%) |
| Total | 7 (13.0%) | 48 (88.9%) |
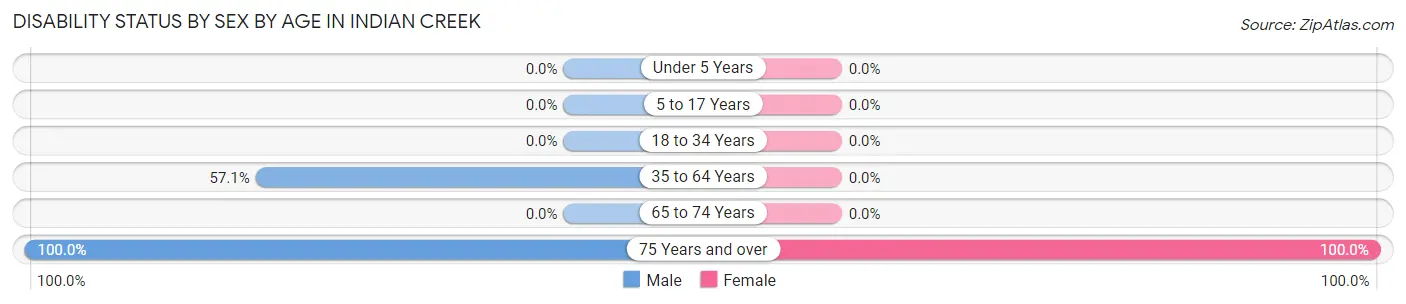
Disability Status by Sex by Age in Indian Creek
| Age Bracket | Male | Female |
| Under 5 Years | 0 (0.0%) | 0 (0.0%) |
| 5 to 17 Years | 0 (0.0%) | 0 (0.0%) |
| 18 to 34 Years | 0 (0.0%) | 0 (0.0%) |
| 35 to 64 Years | 12 (57.1%) | 0 (0.0%) |
| 65 to 74 Years | 0 (0.0%) | 0 (0.0%) |
| 75 Years and over | 1 (100.0%) | 1 (100.0%) |
Disability Class by Sex by Age in Indian Creek
Disability Class: Hearing Difficulty
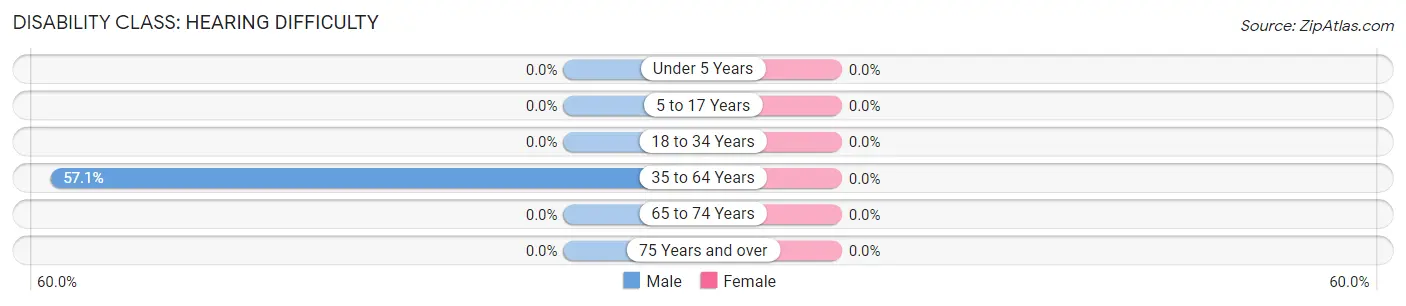
| Age Bracket | Male | Female |
| Under 5 Years | 0 (0.0%) | 0 (0.0%) |
| 5 to 17 Years | 0 (0.0%) | 0 (0.0%) |
| 18 to 34 Years | 0 (0.0%) | 0 (0.0%) |
| 35 to 64 Years | 12 (57.1%) | 0 (0.0%) |
| 65 to 74 Years | 0 (0.0%) | 0 (0.0%) |
| 75 Years and over | 0 (0.0%) | 0 (0.0%) |
Disability Class: Vision Difficulty
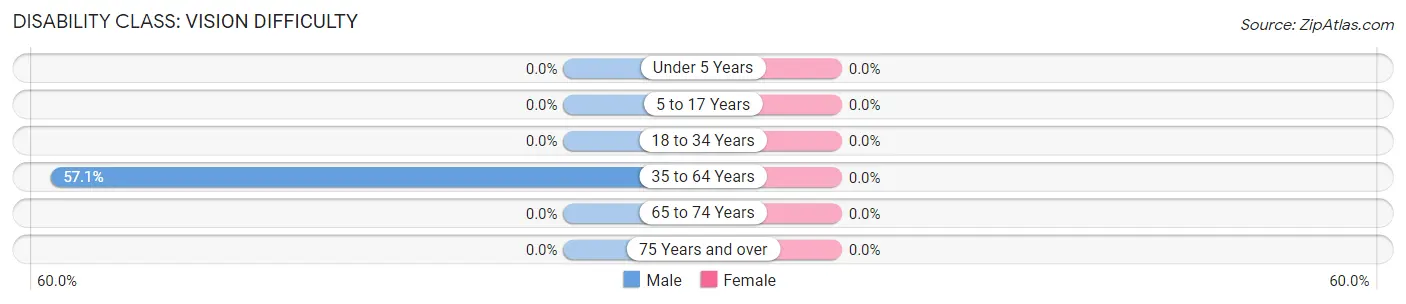
| Age Bracket | Male | Female |
| Under 5 Years | 0 (0.0%) | 0 (0.0%) |
| 5 to 17 Years | 0 (0.0%) | 0 (0.0%) |
| 18 to 34 Years | 0 (0.0%) | 0 (0.0%) |
| 35 to 64 Years | 12 (57.1%) | 0 (0.0%) |
| 65 to 74 Years | 0 (0.0%) | 0 (0.0%) |
| 75 Years and over | 0 (0.0%) | 0 (0.0%) |
Disability Class: Cognitive Difficulty
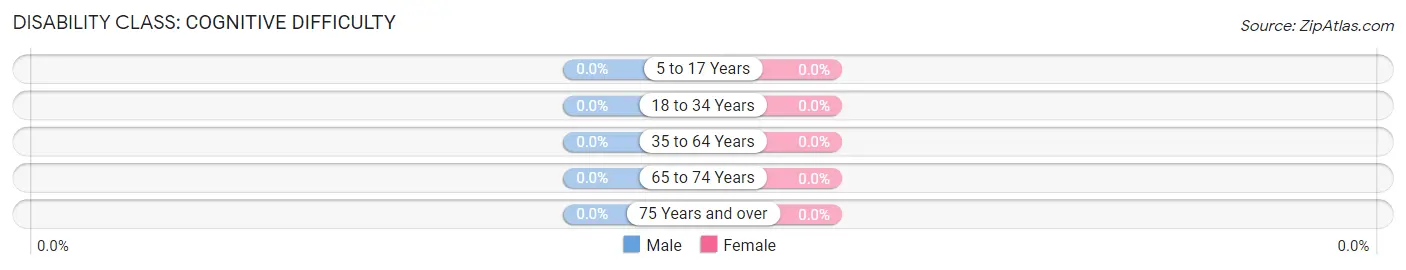
| Age Bracket | Male | Female |
| 5 to 17 Years | 0 (0.0%) | 0 (0.0%) |
| 18 to 34 Years | 0 (0.0%) | 0 (0.0%) |
| 35 to 64 Years | 0 (0.0%) | 0 (0.0%) |
| 65 to 74 Years | 0 (0.0%) | 0 (0.0%) |
| 75 Years and over | 0 (0.0%) | 0 (0.0%) |
Disability Class: Ambulatory Difficulty
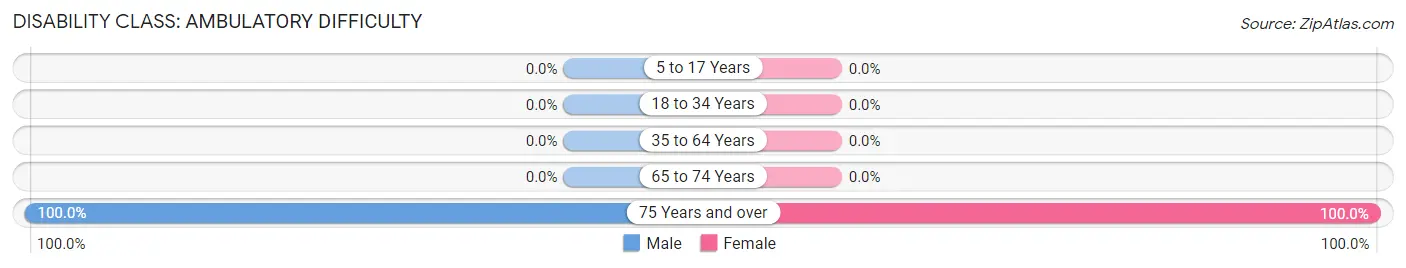
| Age Bracket | Male | Female |
| 5 to 17 Years | 0 (0.0%) | 0 (0.0%) |
| 18 to 34 Years | 0 (0.0%) | 0 (0.0%) |
| 35 to 64 Years | 0 (0.0%) | 0 (0.0%) |
| 65 to 74 Years | 0 (0.0%) | 0 (0.0%) |
| 75 Years and over | 1 (100.0%) | 1 (100.0%) |
Disability Class: Self-Care Difficulty
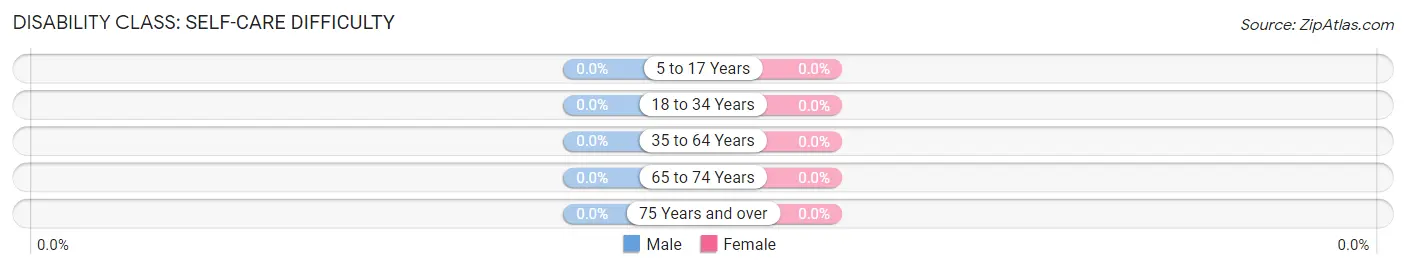
| Age Bracket | Male | Female |
| 5 to 17 Years | 0 (0.0%) | 0 (0.0%) |
| 18 to 34 Years | 0 (0.0%) | 0 (0.0%) |
| 35 to 64 Years | 0 (0.0%) | 0 (0.0%) |
| 65 to 74 Years | 0 (0.0%) | 0 (0.0%) |
| 75 Years and over | 0 (0.0%) | 0 (0.0%) |
Technology Access in Indian Creek
Computing Device Access in Indian Creek
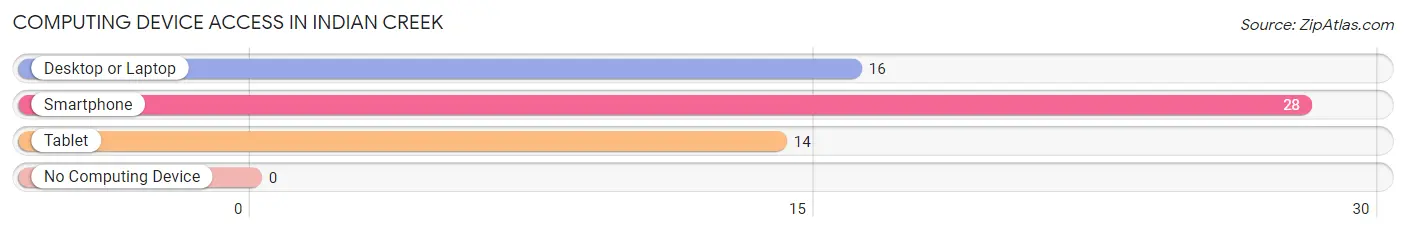
| Device Type | # Households | % Households |
| Desktop or Laptop | 16 | 57.1% |
| Smartphone | 28 | 100.0% |
| Tablet | 14 | 50.0% |
| No Computing Device | 0 | 0.0% |
| Total | 28 | 100.0% |
Internet Access in Indian Creek
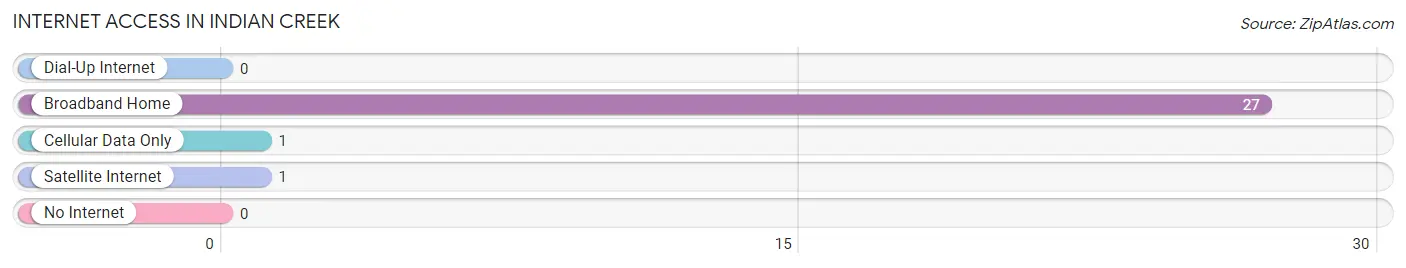
| Internet Type | # Households | % Households |
| Dial-Up Internet | 0 | 0.0% |
| Broadband Home | 27 | 96.4% |
| Cellular Data Only | 1 | 3.6% |
| Satellite Internet | 1 | 3.6% |
| No Internet | 0 | 0.0% |
| Total | 28 | 100.0% |
Indian Creek Summary
Indian Creek is a village located in Miami-Dade County, Florida, United States. It is located on an island of the same name in Biscayne Bay, between Miami Beach and Miami. The village is bordered on the north by the city of Miami Beach, on the south by the city of Miami, on the east by Biscayne Bay, and on the west by the Atlantic Ocean. The village has a population of about 86 people, according to the 2010 census.
History
The area now known as Indian Creek was originally inhabited by the Tequesta Indians, who lived in the area for thousands of years before the arrival of Europeans. The Tequesta were a peaceful tribe, and their presence in the area was largely unrecorded until the arrival of the Spanish in the 16th century. The Spanish explorer Ponce de Leon was the first European to visit the area, and he named the island “Cayo de los Indios”, or “Island of the Indians”.
In the late 19th century, the island was purchased by William and Mary Brickell, who built a large home on the island. The Brickells named the island “Indian Creek”, and it became a popular destination for wealthy Miamians. In the early 20th century, the island was developed as a residential community, and the village of Indian Creek was incorporated in 1939.
Geography
Indian Creek is located on an island of the same name in Biscayne Bay, between Miami Beach and Miami. The island is approximately 1.5 miles long and 0.5 miles wide, and is bordered on the north by the city of Miami Beach, on the south by the city of Miami, on the east by Biscayne Bay, and on the west by the Atlantic Ocean. The island is connected to the mainland by a bridge, and is accessible by car or boat.
The island is mostly residential, with a few small businesses. The village is home to a private golf course, a yacht club, and a marina. The island is also home to a number of luxury homes, many of which are owned by celebrities and other wealthy individuals.
Economy
The economy of Indian Creek is largely based on tourism and real estate. The village is home to a number of luxury hotels, restaurants, and shops, which attract visitors from around the world. The village is also home to a number of luxury homes, many of which are owned by celebrities and other wealthy individuals.
The village is also home to a number of businesses, including a yacht club, a marina, and a private golf course. The village is also home to a number of financial institutions, including banks and investment firms.
Demographics
According to the 2010 census, the village of Indian Creek has a population of about 86 people. The population is predominantly white (90.7%), with a small percentage of African Americans (4.7%) and Hispanics (4.7%). The median household income is $1,072,857, and the median home value is $3,845,000. The village has a low crime rate, and is considered to be one of the safest places to live in Miami-Dade County.
Common Questions
What is Per Capita Income in Indian Creek?
Per Capita income in Indian Creek is $40,437.
What is the Median Family Income in Indian Creek?
Median Family Income in Indian Creek is $111,875.
What is Inequality or Gini Index in Indian Creek?
Inequality or Gini Index in Indian Creek is 0.49.
What is the Total Population of Indian Creek?
Total Population of Indian Creek is 54.
What is the Total Male Population of Indian Creek?
Total Male Population of Indian Creek is 28.
What is the Total Female Population of Indian Creek?
Total Female Population of Indian Creek is 26.
What is the Ratio of Males per 100 Females in Indian Creek?
There are 107.69 Males per 100 Females in Indian Creek.
What is the Ratio of Females per 100 Males in Indian Creek?
There are 92.86 Females per 100 Males in Indian Creek.
What is the Median Population Age in Indian Creek?
Median Population Age in Indian Creek is 54.3 Years.
What is the Average Family Size in Indian Creek
Average Family Size in Indian Creek is 2.9 People.
What is the Average Household Size in Indian Creek
Average Household Size in Indian Creek is 1.9 People.
How Large is the Labor Force in Indian Creek?
There are 24 People in the Labor Forcein in Indian Creek.
What is the Percentage of People in the Labor Force in Indian Creek?
46.2% of People are in the Labor Force in Indian Creek.