Salt Creek, CO Map & Demographics
Salt Creek Map
Salt Creek Overview
$27,771
PER CAPITA INCOME
$51,731
AVG HOUSEHOLD INCOME
64.1%
WAGE / INCOME GAP [ % ]
35.9¢/ $1
WAGE / INCOME GAP [ $ ]
0.35
INEQUALITY / GINI INDEX
790
TOTAL POPULATION
457
MALE POPULATION
333
FEMALE POPULATION
137.24
MALES / 100 FEMALES
72.87
FEMALES / 100 MALES
38.5
MEDIAN AGE
3.1
AVG FAMILY SIZE
2.5
AVG HOUSEHOLD SIZE
481
LABOR FORCE [ PEOPLE ]
75.2%
PERCENT IN LABOR FORCE
12.3%
UNEMPLOYMENT RATE
Income in Salt Creek
Income Overview in Salt Creek
| Characteristic | Number | Measure |
| Per Capita Income | 790 | $27,771 |
| Median Family Income | 205 | $0 |
| Mean Family Income | 205 | $71,893 |
| Median Household Income | 320 | $51,731 |
| Mean Household Income | 320 | $67,602 |
| Income Deficit | 205 | $0 |
| Wage / Income Gap (%) | 790 | 64.13% |
| Wage / Income Gap ($) | 790 | 35.87¢ per $1 |
| Gini / Inequality Index | 790 | 0.35 |
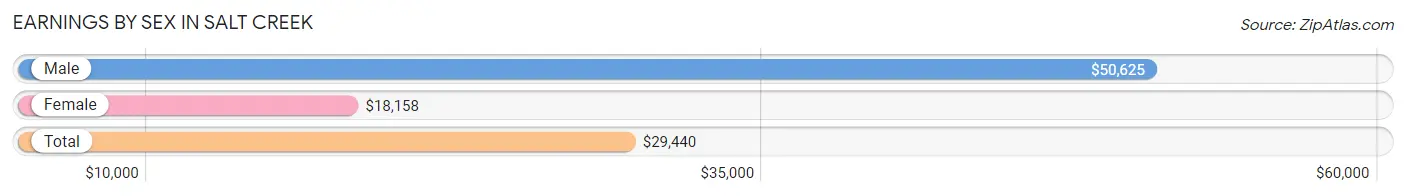
Earnings by Sex in Salt Creek
Average Earnings in Salt Creek are $29,440, $50,625 for men and $18,158 for women, a difference of 64.1%.
| Sex | Number | Average Earnings |
| Male | 279 (58.0%) | $50,625 |
| Female | 202 (42.0%) | $18,158 |
| Total | 481 (100.0%) | $29,440 |
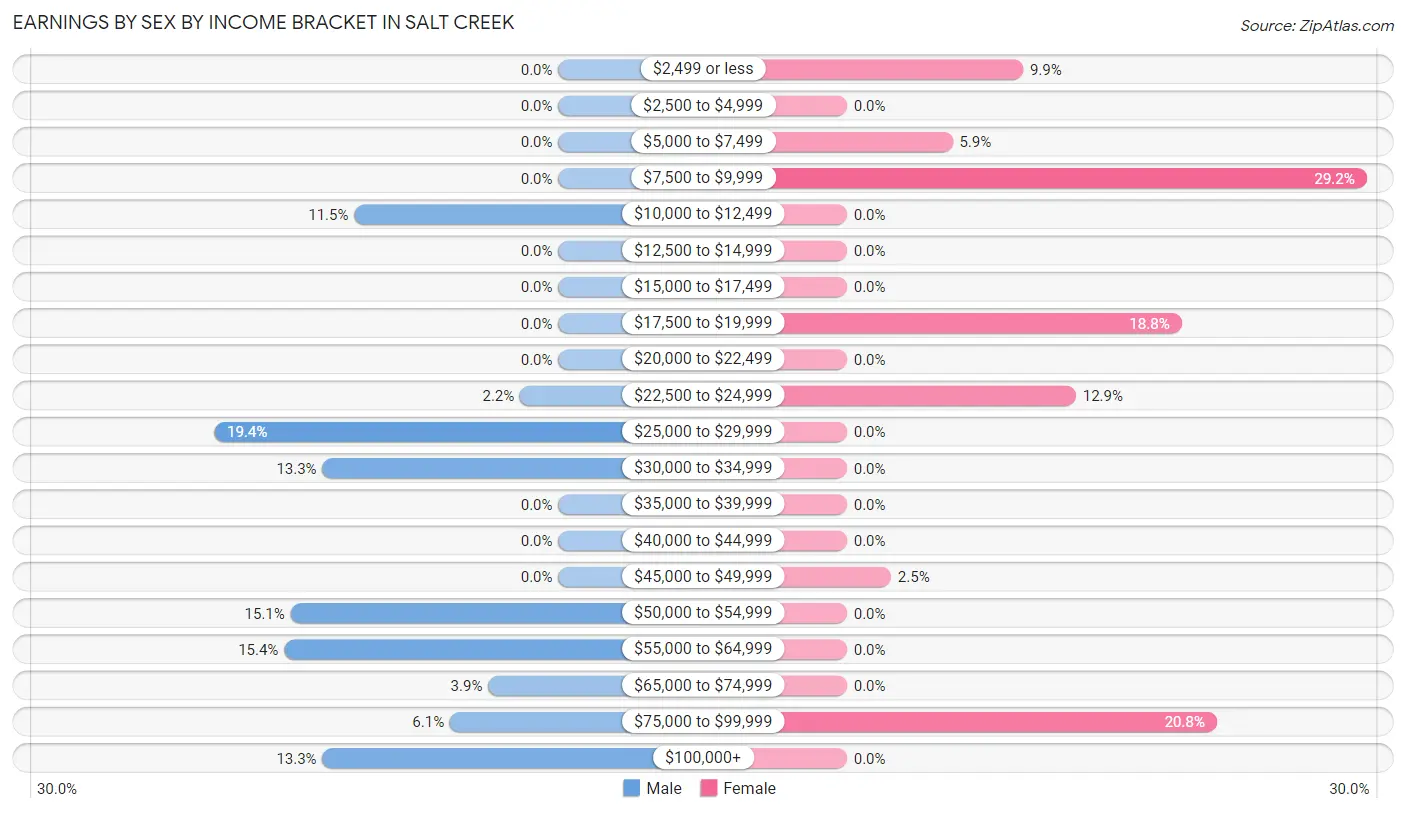
Earnings by Sex by Income Bracket in Salt Creek
The most common earnings brackets in Salt Creek are $25,000 to $29,999 for men (54 | 19.4%) and $7,500 to $9,999 for women (59 | 29.2%).
| Income | Male | Female |
| $2,499 or less | 0 (0.0%) | 20 (9.9%) |
| $2,500 to $4,999 | 0 (0.0%) | 0 (0.0%) |
| $5,000 to $7,499 | 0 (0.0%) | 12 (5.9%) |
| $7,500 to $9,999 | 0 (0.0%) | 59 (29.2%) |
| $10,000 to $12,499 | 32 (11.5%) | 0 (0.0%) |
| $12,500 to $14,999 | 0 (0.0%) | 0 (0.0%) |
| $15,000 to $17,499 | 0 (0.0%) | 0 (0.0%) |
| $17,500 to $19,999 | 0 (0.0%) | 38 (18.8%) |
| $20,000 to $22,499 | 0 (0.0%) | 0 (0.0%) |
| $22,500 to $24,999 | 6 (2.1%) | 26 (12.9%) |
| $25,000 to $29,999 | 54 (19.4%) | 0 (0.0%) |
| $30,000 to $34,999 | 37 (13.3%) | 0 (0.0%) |
| $35,000 to $39,999 | 0 (0.0%) | 0 (0.0%) |
| $40,000 to $44,999 | 0 (0.0%) | 0 (0.0%) |
| $45,000 to $49,999 | 0 (0.0%) | 5 (2.5%) |
| $50,000 to $54,999 | 42 (15.0%) | 0 (0.0%) |
| $55,000 to $64,999 | 43 (15.4%) | 0 (0.0%) |
| $65,000 to $74,999 | 11 (3.9%) | 0 (0.0%) |
| $75,000 to $99,999 | 17 (6.1%) | 42 (20.8%) |
| $100,000+ | 37 (13.3%) | 0 (0.0%) |
| Total | 279 (100.0%) | 202 (100.0%) |
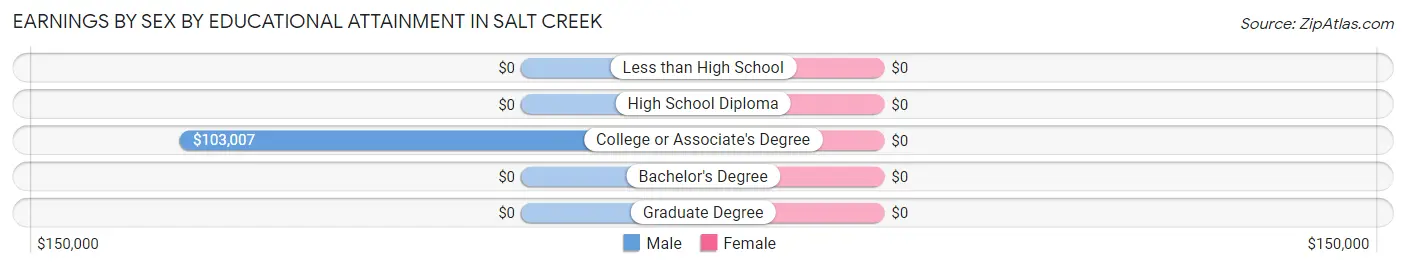
Earnings by Sex by Educational Attainment in Salt Creek
| Educational Attainment | Male Income | Female Income |
| Less than High School | - | - |
| High School Diploma | - | - |
| College or Associate's Degree | $103,007 | $0 |
| Bachelor's Degree | - | - |
| Graduate Degree | - | - |
| Total | $51,756 | $18,816 |
Family Income in Salt Creek
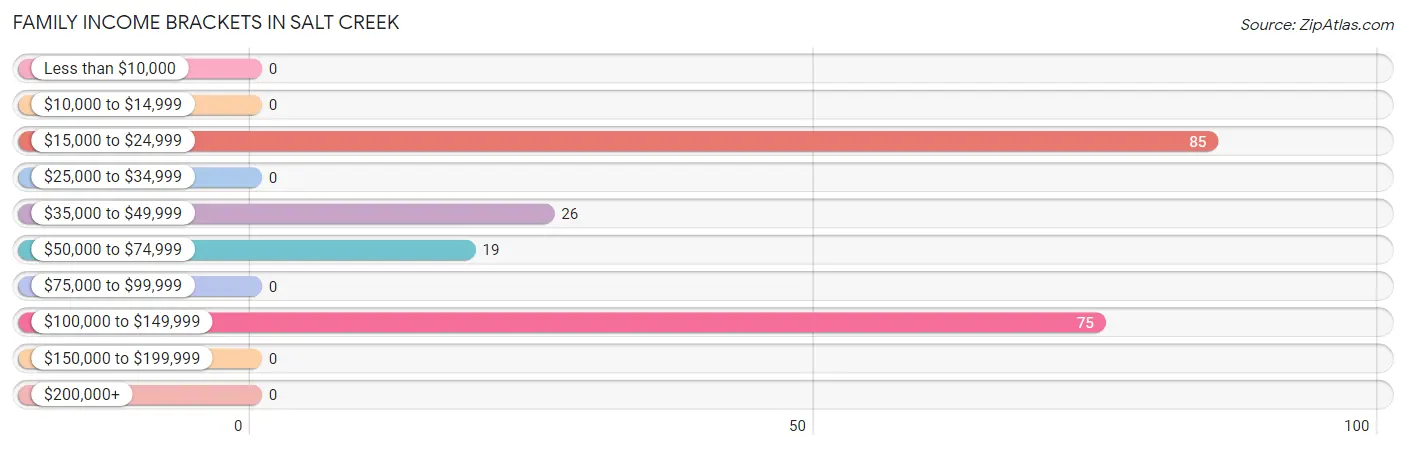
Family Income Brackets in Salt Creek
According to the Salt Creek family income data, there are 85 families falling into the $15,000 to $24,999 income range, which is the most common income bracket and makes up 41.5% of all families.
| Income Bracket | # Families | % Families |
| Less than $10,000 | 0 | 0.0% |
| $10,000 to $14,999 | 0 | 0.0% |
| $15,000 to $24,999 | 85 | 41.5% |
| $25,000 to $34,999 | 0 | 0.0% |
| $35,000 to $49,999 | 26 | 12.7% |
| $50,000 to $74,999 | 19 | 9.3% |
| $75,000 to $99,999 | 0 | 0.0% |
| $100,000 to $149,999 | 75 | 36.6% |
| $150,000 to $199,999 | 0 | 0.0% |
| $200,000+ | 0 | 0.0% |
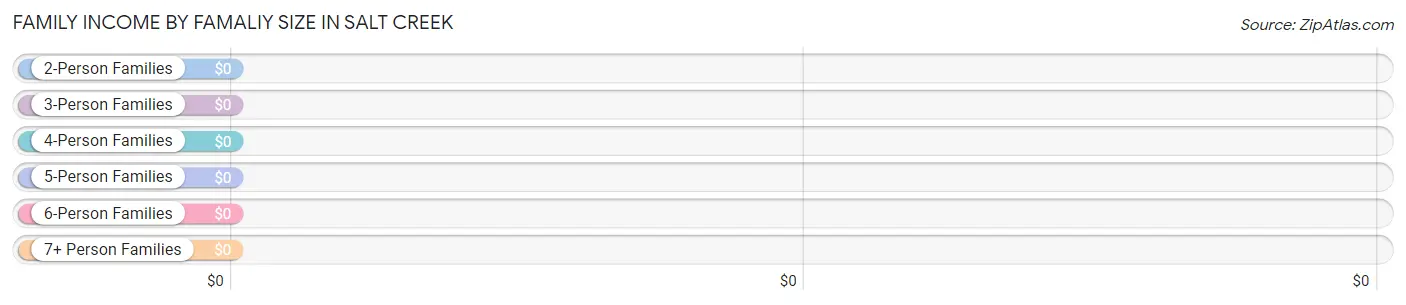
Family Income by Famaliy Size in Salt Creek
| Income Bracket | # Families | Median Income |
| 2-Person Families | 86 (41.9%) | $0 |
| 3-Person Families | 5 (2.4%) | $0 |
| 4-Person Families | 114 (55.6%) | $0 |
| 5-Person Families | 0 (0.0%) | $0 |
| 6-Person Families | 0 (0.0%) | $0 |
| 7+ Person Families | 0 (0.0%) | $0 |
| Total | 205 (100.0%) | $0 |
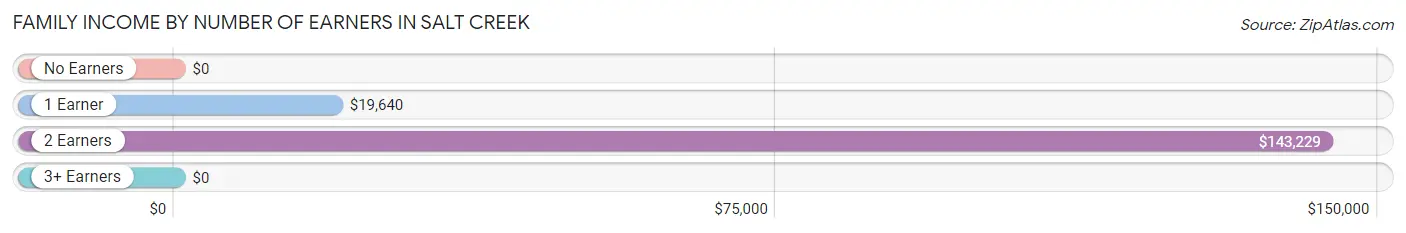
Family Income by Number of Earners in Salt Creek
| Number of Earners | # Families | Median Income |
| No Earners | 15 (7.3%) | $0 |
| 1 Earner | 101 (49.3%) | $19,640 |
| 2 Earners | 51 (24.9%) | $143,229 |
| 3+ Earners | 38 (18.5%) | $0 |
| Total | 205 (100.0%) | $0 |
Household Income in Salt Creek
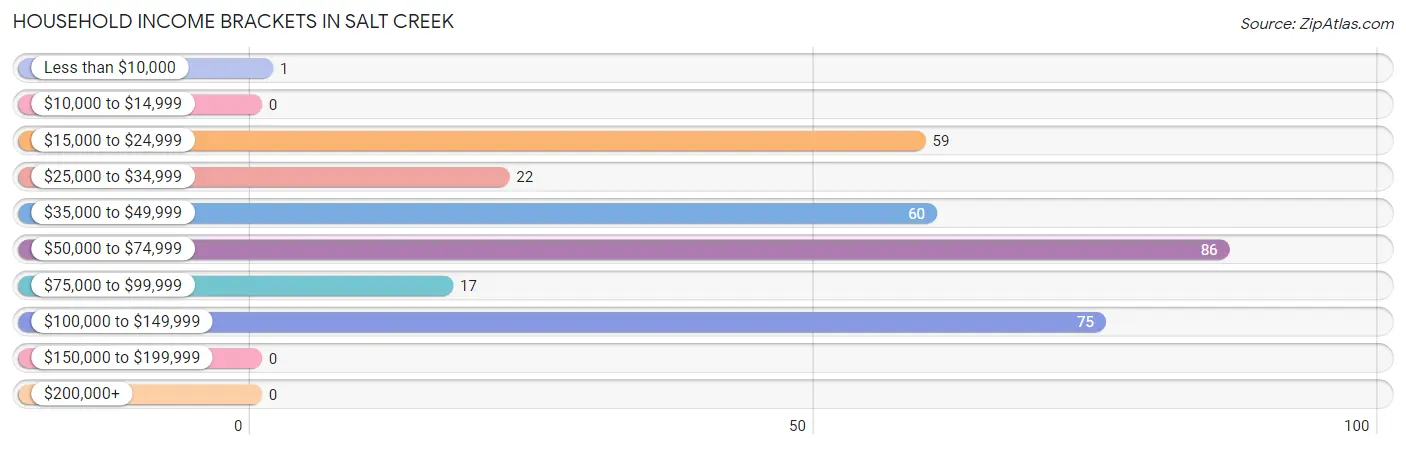
Household Income Brackets in Salt Creek
With 86 households falling in the category, the $50,000 to $74,999 income range is the most frequent in Salt Creek, accounting for 26.9% of all households.
| Income Bracket | # Households | % Households |
| Less than $10,000 | 1 | 0.3% |
| $10,000 to $14,999 | 0 | 0.0% |
| $15,000 to $24,999 | 59 | 18.4% |
| $25,000 to $34,999 | 22 | 6.9% |
| $35,000 to $49,999 | 60 | 18.8% |
| $50,000 to $74,999 | 86 | 26.9% |
| $75,000 to $99,999 | 17 | 5.3% |
| $100,000 to $149,999 | 75 | 23.4% |
| $150,000 to $199,999 | 0 | 0.0% |
| $200,000+ | 0 | 0.0% |
Household Income by Householder Age in Salt Creek
The median household income in Salt Creek is $51,731, with the highest median household income of $57,431 found in the 45 to 64 years age bracket for the primary householder. A total of 135 households (42.2%) fall into this category.
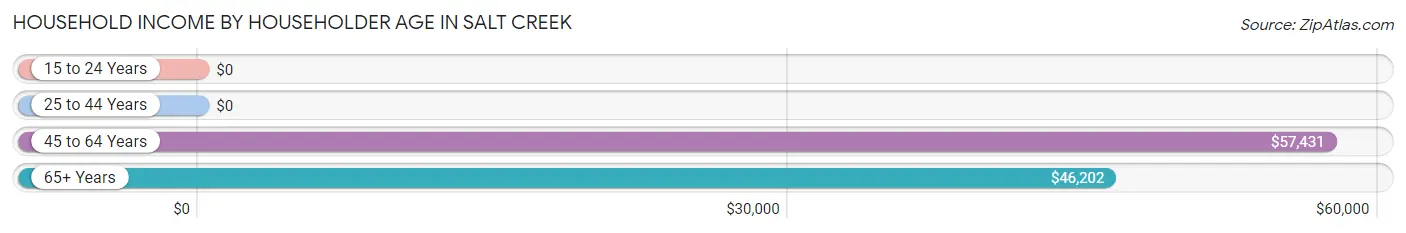
| Income Bracket | # Households | Median Income |
| 15 to 24 Years | 0 (0.0%) | $0 |
| 25 to 44 Years | 146 (45.6%) | $0 |
| 45 to 64 Years | 135 (42.2%) | $57,431 |
| 65+ Years | 39 (12.2%) | $46,202 |
| Total | 320 (100.0%) | $51,731 |
Poverty in Salt Creek
Income Below Poverty by Sex and Age in Salt Creek
With 21.4% poverty level for males and 37.5% for females among the residents of Salt Creek, 6 to 11 year old males and under 5 year old females are the most vulnerable to poverty, with 74 males (100.0%) and 54 females (100.0%) in their respective age groups living below the poverty level.
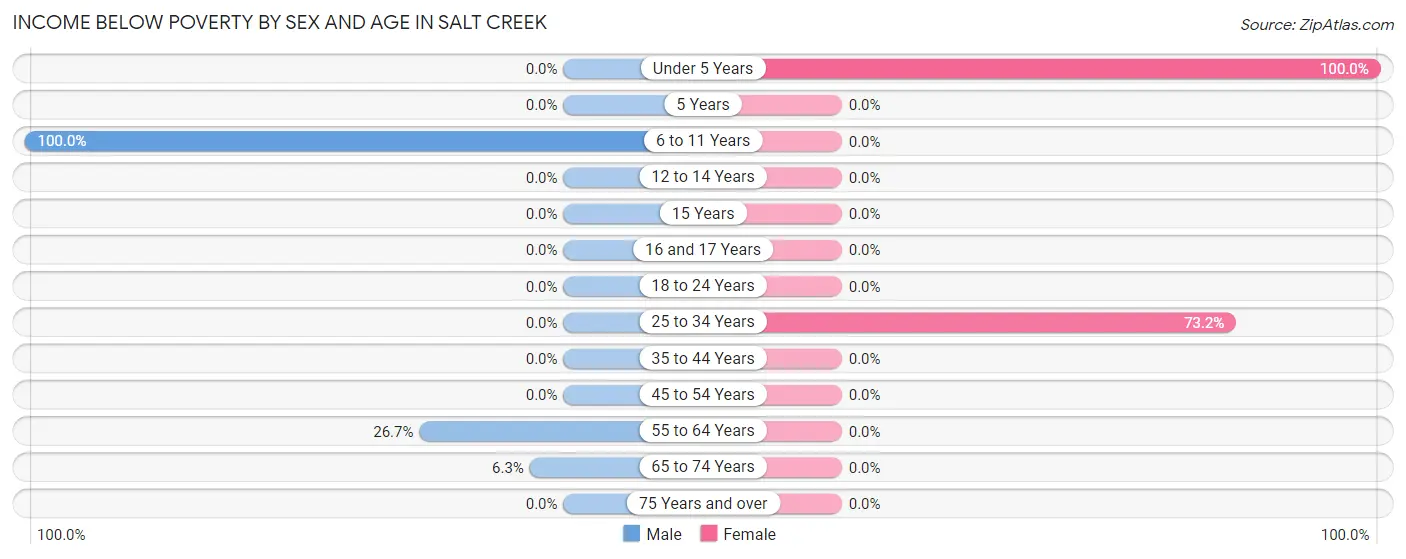
| Age Bracket | Male | Female |
| Under 5 Years | 0 (0.0%) | 54 (100.0%) |
| 5 Years | 0 (0.0%) | 0 (0.0%) |
| 6 to 11 Years | 74 (100.0%) | 0 (0.0%) |
| 12 to 14 Years | 0 (0.0%) | 0 (0.0%) |
| 15 Years | 0 (0.0%) | 0 (0.0%) |
| 16 and 17 Years | 0 (0.0%) | 0 (0.0%) |
| 18 to 24 Years | 0 (0.0%) | 0 (0.0%) |
| 25 to 34 Years | 0 (0.0%) | 71 (73.2%) |
| 35 to 44 Years | 0 (0.0%) | 0 (0.0%) |
| 45 to 54 Years | 0 (0.0%) | 0 (0.0%) |
| 55 to 64 Years | 23 (26.7%) | 0 (0.0%) |
| 65 to 74 Years | 1 (6.2%) | 0 (0.0%) |
| 75 Years and over | 0 (0.0%) | 0 (0.0%) |
| Total | 98 (21.4%) | 125 (37.5%) |
Income Above Poverty by Sex and Age in Salt Creek
According to the poverty statistics in Salt Creek, males aged 16 and 17 years and females aged 6 to 11 years are the age groups that are most secure financially, with 100.0% of males and 100.0% of females in these age groups living above the poverty line.
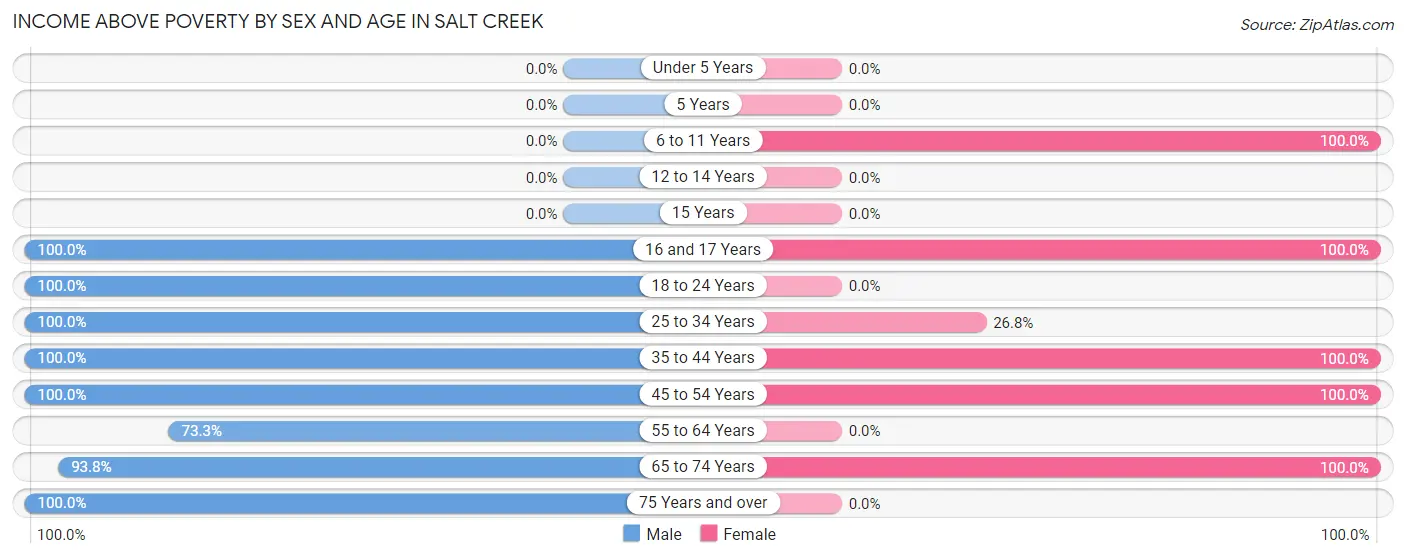
| Age Bracket | Male | Female |
| Under 5 Years | 0 (0.0%) | 0 (0.0%) |
| 5 Years | 0 (0.0%) | 0 (0.0%) |
| 6 to 11 Years | 0 (0.0%) | 22 (100.0%) |
| 12 to 14 Years | 0 (0.0%) | 0 (0.0%) |
| 15 Years | 0 (0.0%) | 0 (0.0%) |
| 16 and 17 Years | 6 (100.0%) | 53 (100.0%) |
| 18 to 24 Years | 38 (100.0%) | 0 (0.0%) |
| 25 to 34 Years | 25 (100.0%) | 26 (26.8%) |
| 35 to 44 Years | 65 (100.0%) | 44 (100.0%) |
| 45 to 54 Years | 115 (100.0%) | 41 (100.0%) |
| 55 to 64 Years | 63 (73.3%) | 0 (0.0%) |
| 65 to 74 Years | 15 (93.8%) | 22 (100.0%) |
| 75 Years and over | 32 (100.0%) | 0 (0.0%) |
| Total | 359 (78.6%) | 208 (62.5%) |
Income Below Poverty Among Married-Couple Families in Salt Creek
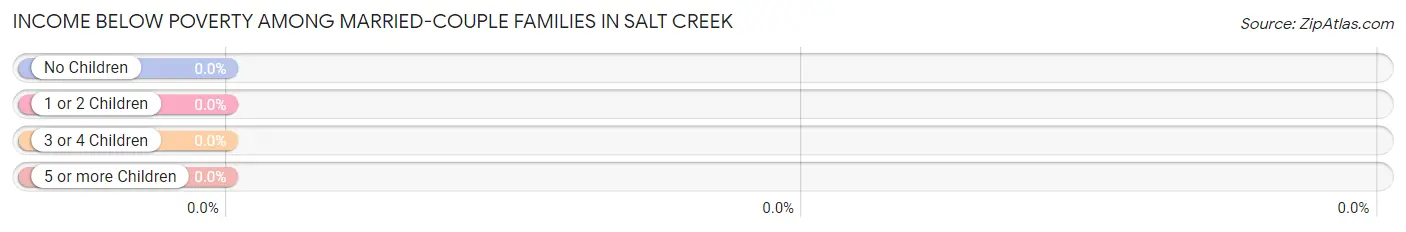
| Children | Above Poverty | Below Poverty |
| No Children | 52 (100.0%) | 0 (0.0%) |
| 1 or 2 Children | 43 (100.0%) | 0 (0.0%) |
| 3 or 4 Children | 0 (0.0%) | 0 (0.0%) |
| 5 or more Children | 0 (0.0%) | 0 (0.0%) |
| Total | 95 (100.0%) | 0 (0.0%) |
Income Below Poverty Among Single-Parent Households in Salt Creek
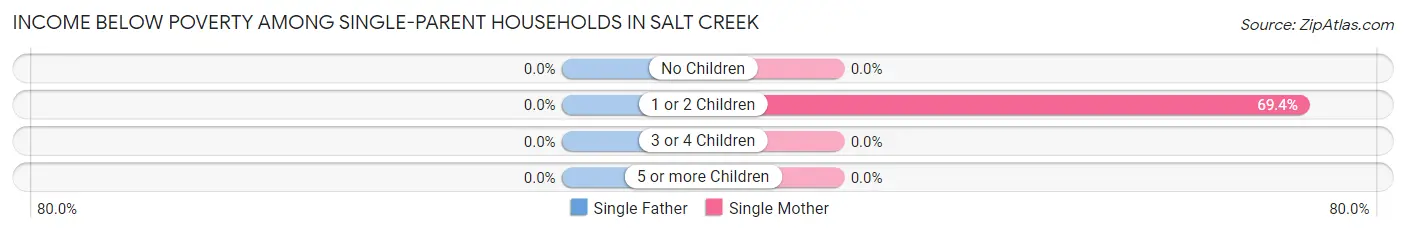
| Children | Single Father | Single Mother |
| No Children | 0 (0.0%) | 0 (0.0%) |
| 1 or 2 Children | 0 (0.0%) | 59 (69.4%) |
| 3 or 4 Children | 0 (0.0%) | 0 (0.0%) |
| 5 or more Children | 0 (0.0%) | 0 (0.0%) |
| Total | 0 (0.0%) | 59 (69.4%) |
Income Below Poverty Among Married-Couple vs Single-Parent Households in Salt Creek
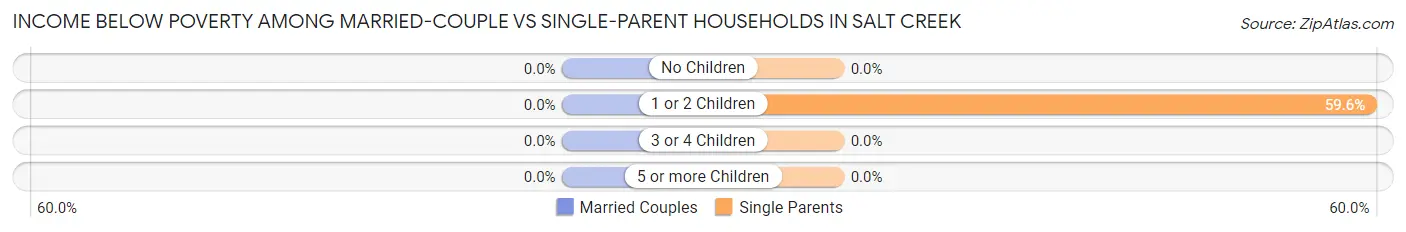
| Children | Married-Couple Families | Single-Parent Households |
| No Children | 0 (0.0%) | 0 (0.0%) |
| 1 or 2 Children | 0 (0.0%) | 59 (59.6%) |
| 3 or 4 Children | 0 (0.0%) | 0 (0.0%) |
| 5 or more Children | 0 (0.0%) | 0 (0.0%) |
| Total | 0 (0.0%) | 59 (53.6%) |
Race in Salt Creek
The most populous races in Salt Creek are Hispanic or Latino (649 | 82.2%), White / Caucasian (533 | 67.5%), and Two or more Races (164 | 20.8%).
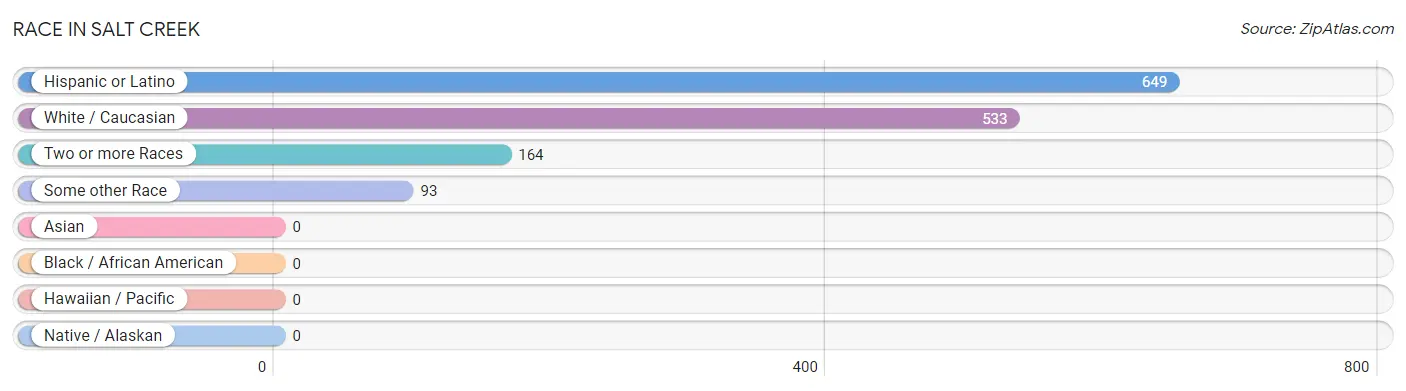
| Race | # Population | % Population |
| Asian | 0 | 0.0% |
| Black / African American | 0 | 0.0% |
| Hawaiian / Pacific | 0 | 0.0% |
| Hispanic or Latino | 649 | 82.2% |
| Native / Alaskan | 0 | 0.0% |
| White / Caucasian | 533 | 67.5% |
| Two or more Races | 164 | 20.8% |
| Some other Race | 93 | 11.8% |
| Total | 790 | 100.0% |
Ancestry in Salt Creek
The most populous ancestries reported in Salt Creek are Mexican (388 | 49.1%), Puerto Rican (210 | 26.6%), German (152 | 19.2%), Peruvian (34 | 4.3%), and South American (34 | 4.3%), together accounting for 103.5% of all Salt Creek residents.
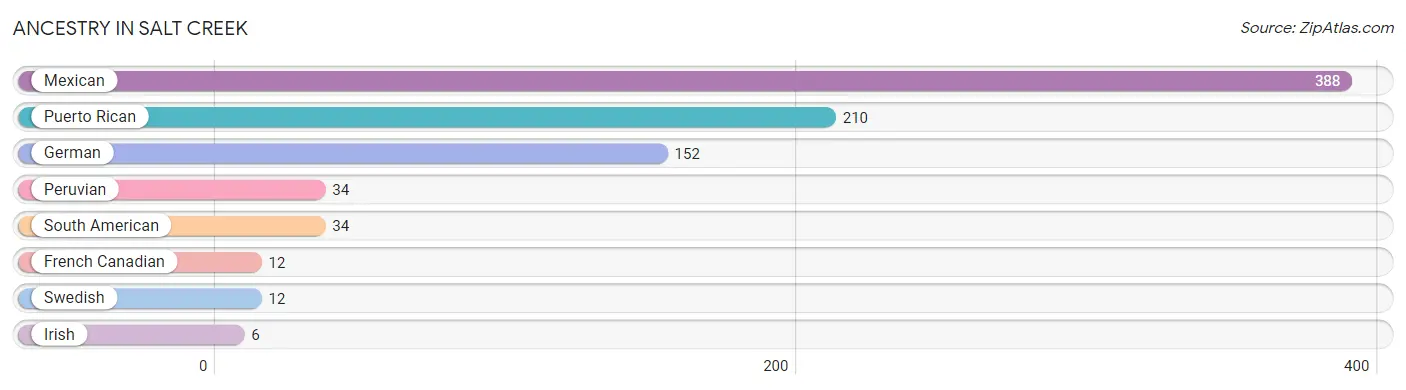
| Ancestry | # Population | % Population |
| French Canadian | 12 | 1.5% |
| German | 152 | 19.2% |
| Irish | 6 | 0.8% |
| Mexican | 388 | 49.1% |
| Peruvian | 34 | 4.3% |
| Puerto Rican | 210 | 26.6% |
| South American | 34 | 4.3% |
| Swedish | 12 | 1.5% | View All 8 Rows |
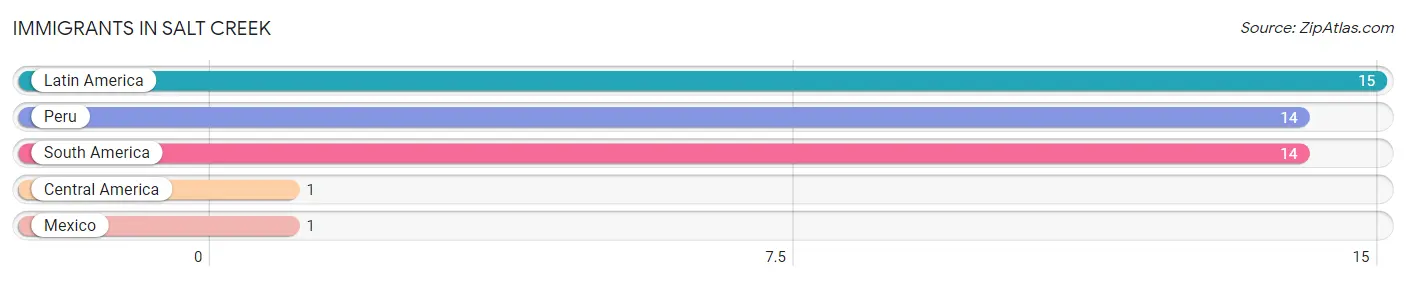
Immigrants in Salt Creek
The most numerous immigrant groups reported in Salt Creek came from Latin America (15 | 1.9%), Peru (14 | 1.8%), South America (14 | 1.8%), Central America (1 | 0.1%), and Mexico (1 | 0.1%), together accounting for 5.7% of all Salt Creek residents.
| Immigration Origin | # Population | % Population |
| Central America | 1 | 0.1% |
| Latin America | 15 | 1.9% |
| Mexico | 1 | 0.1% |
| Peru | 14 | 1.8% |
| South America | 14 | 1.8% | View All 5 Rows |
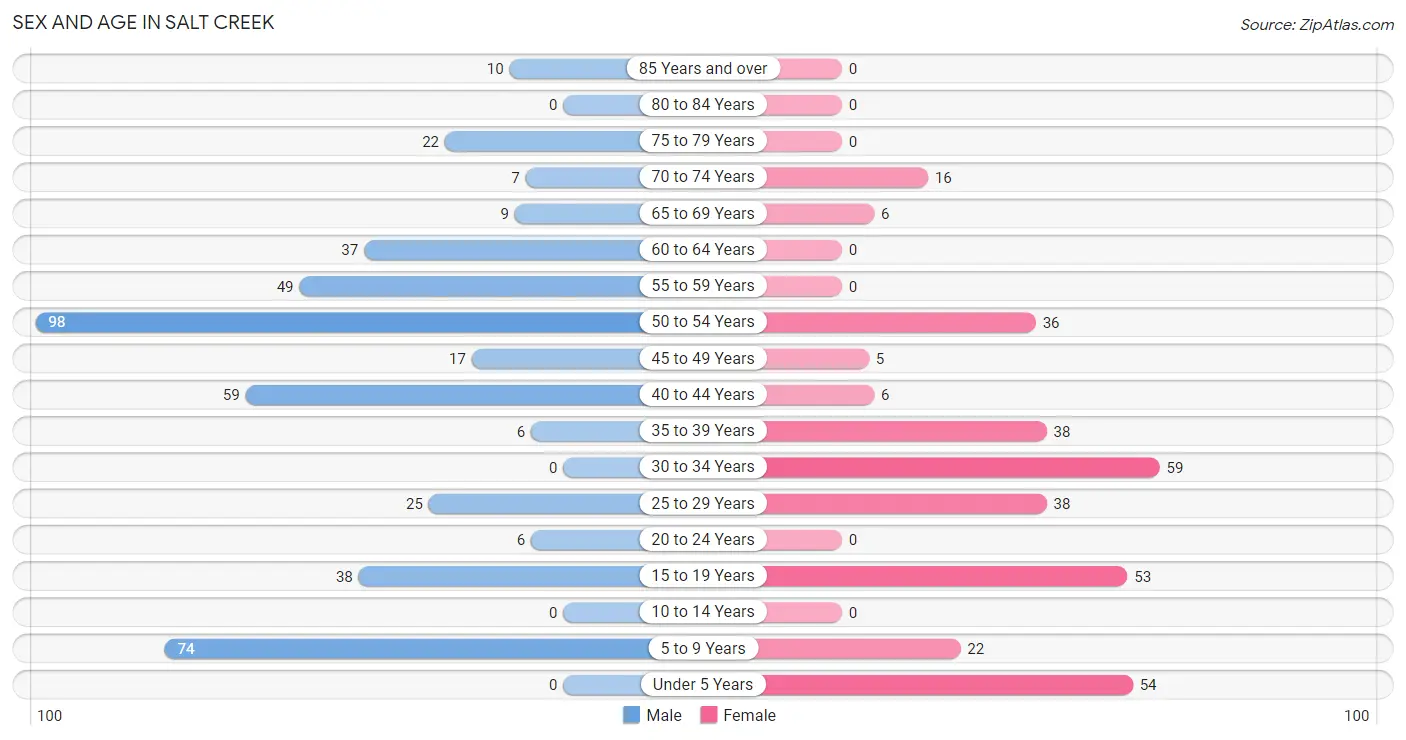
Sex and Age in Salt Creek
Sex and Age in Salt Creek
The most populous age groups in Salt Creek are 50 to 54 Years (98 | 21.4%) for men and 30 to 34 Years (59 | 17.7%) for women.
| Age Bracket | Male | Female |
| Under 5 Years | 0 (0.0%) | 54 (16.2%) |
| 5 to 9 Years | 74 (16.2%) | 22 (6.6%) |
| 10 to 14 Years | 0 (0.0%) | 0 (0.0%) |
| 15 to 19 Years | 38 (8.3%) | 53 (15.9%) |
| 20 to 24 Years | 6 (1.3%) | 0 (0.0%) |
| 25 to 29 Years | 25 (5.5%) | 38 (11.4%) |
| 30 to 34 Years | 0 (0.0%) | 59 (17.7%) |
| 35 to 39 Years | 6 (1.3%) | 38 (11.4%) |
| 40 to 44 Years | 59 (12.9%) | 6 (1.8%) |
| 45 to 49 Years | 17 (3.7%) | 5 (1.5%) |
| 50 to 54 Years | 98 (21.4%) | 36 (10.8%) |
| 55 to 59 Years | 49 (10.7%) | 0 (0.0%) |
| 60 to 64 Years | 37 (8.1%) | 0 (0.0%) |
| 65 to 69 Years | 9 (2.0%) | 6 (1.8%) |
| 70 to 74 Years | 7 (1.5%) | 16 (4.8%) |
| 75 to 79 Years | 22 (4.8%) | 0 (0.0%) |
| 80 to 84 Years | 0 (0.0%) | 0 (0.0%) |
| 85 Years and over | 10 (2.2%) | 0 (0.0%) |
| Total | 457 (100.0%) | 333 (100.0%) |
Families and Households in Salt Creek
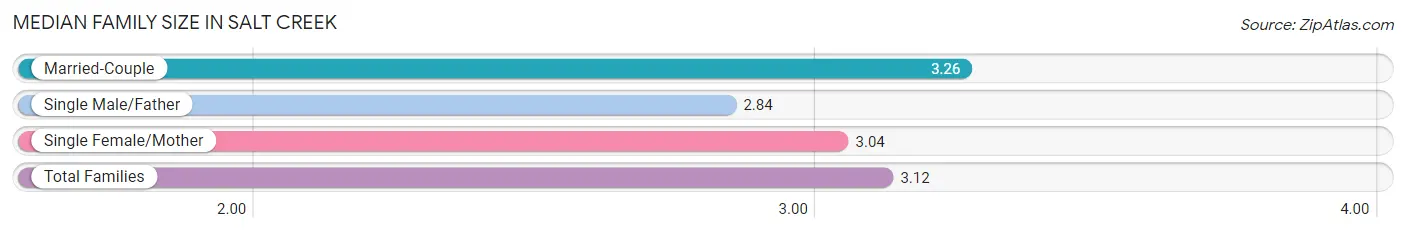
Median Family Size in Salt Creek
The median family size in Salt Creek is 3.12 persons per family, with married-couple families (95 | 46.3%) accounting for the largest median family size of 3.26 persons per family. On the other hand, single male/father families (25 | 12.2%) represent the smallest median family size with 2.84 persons per family.
| Family Type | # Families | Family Size |
| Married-Couple | 95 (46.3%) | 3.26 |
| Single Male/Father | 25 (12.2%) | 2.84 |
| Single Female/Mother | 85 (41.5%) | 3.04 |
| Total Families | 205 (100.0%) | 3.12 |
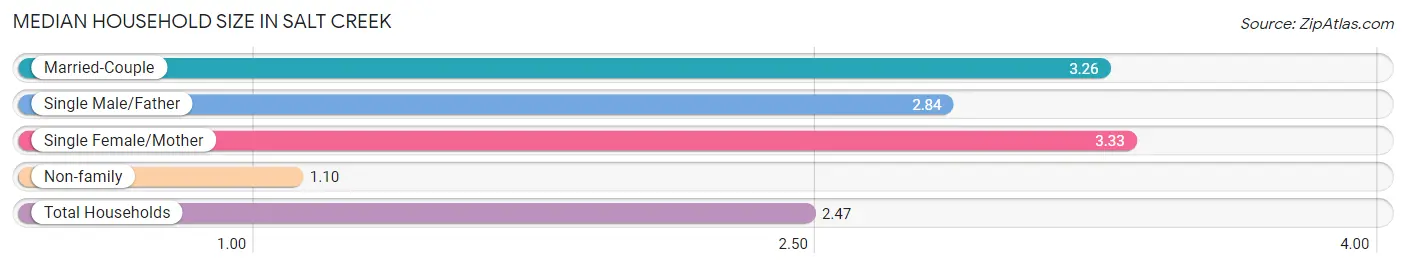
Median Household Size in Salt Creek
The median household size in Salt Creek is 2.47 persons per household, with single female/mother households (85 | 26.6%) accounting for the largest median household size of 3.33 persons per household. non-family households (115 | 35.9%) represent the smallest median household size with 1.10 persons per household.
| Household Type | # Households | Household Size |
| Married-Couple | 95 (29.7%) | 3.26 |
| Single Male/Father | 25 (7.8%) | 2.84 |
| Single Female/Mother | 85 (26.6%) | 3.33 |
| Non-family | 115 (35.9%) | 1.10 |
| Total Households | 320 (100.0%) | 2.47 |
Household Size by Marriage Status in Salt Creek
Out of a total of 320 households in Salt Creek, 205 (64.1%) are family households, while 115 (35.9%) are nonfamily households. The most numerous type of family households are 4-person households, comprising 114, and the most common type of nonfamily households are 1-person households, comprising 103.
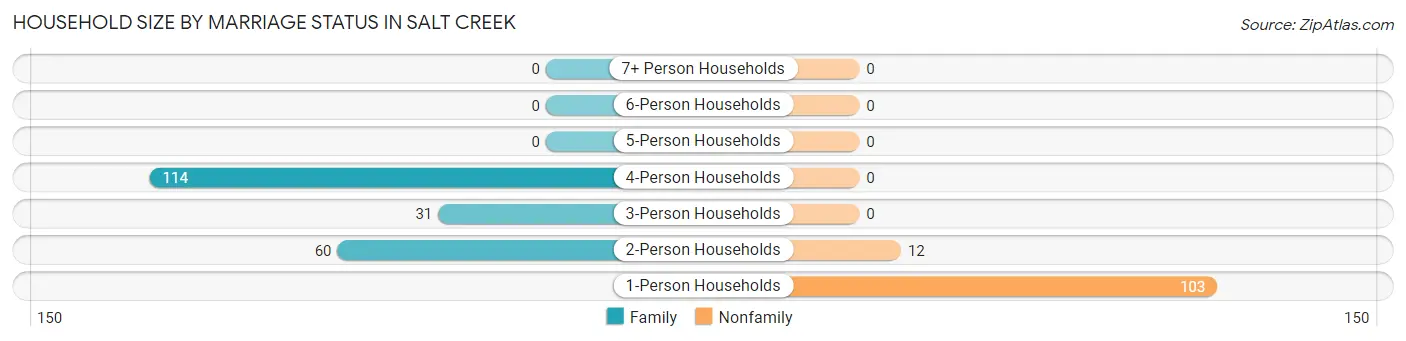
| Household Size | Family Households | Nonfamily Households |
| 1-Person Households | - | 103 (32.2%) |
| 2-Person Households | 60 (18.8%) | 12 (3.7%) |
| 3-Person Households | 31 (9.7%) | 0 (0.0%) |
| 4-Person Households | 114 (35.6%) | 0 (0.0%) |
| 5-Person Households | 0 (0.0%) | 0 (0.0%) |
| 6-Person Households | 0 (0.0%) | 0 (0.0%) |
| 7+ Person Households | 0 (0.0%) | 0 (0.0%) |
| Total | 205 (64.1%) | 115 (35.9%) |
Female Fertility in Salt Creek
Fertility by Age in Salt Creek
| Age Bracket | Women with Births | Births / 1,000 Women |
| 15 to 19 years | 0 (0.0%) | 0.0 |
| 20 to 34 years | 0 (0.0%) | 0.0 |
| 35 to 50 years | 0 (0.0%) | 0.0 |
| Total | 0 (0.0%) | 0.0 |
Fertility by Age by Marriage Status in Salt Creek
| Age Bracket | Married | Unmarried |
| 15 to 19 years | 0 (0.0%) | 0 (0.0%) |
| 20 to 34 years | 0 (0.0%) | 0 (0.0%) |
| 35 to 50 years | 0 (0.0%) | 0 (0.0%) |
| Total | 0 (0.0%) | 0 (0.0%) |
Fertility by Education in Salt Creek
| Educational Attainment | Women with Births | Births / 1,000 Women |
| Less than High School | 0 (0.0%) | 0.0 |
| High School Diploma | 0 (0.0%) | 0.0 |
| College or Associate's Degree | 0 (0.0%) | 0.0 |
| Bachelor's Degree | 0 (0.0%) | 0.0 |
| Graduate Degree | 0 (0.0%) | 0.0 |
| Total | 0 (0.0%) | 0.0 |
Fertility by Education by Marriage Status in Salt Creek
| Educational Attainment | Married | Unmarried |
| Less than High School | 0 (0.0%) | 0 (0.0%) |
| High School Diploma | 0 (0.0%) | 0 (0.0%) |
| College or Associate's Degree | 0 (0.0%) | 0 (0.0%) |
| Bachelor's Degree | 0 (0.0%) | 0 (0.0%) |
| Graduate Degree | 0 (0.0%) | 0 (0.0%) |
| Total | 0 (0.0%) | 0 (0.0%) |
Employment Characteristics in Salt Creek
Employment by Class of Employer in Salt Creek
Among the 422 employed individuals in Salt Creek, private company employees (301 | 71.3%), local government employees (78 | 18.5%), and self-employed (not incorporated) (37 | 8.8%) make up the most common classes of employment.
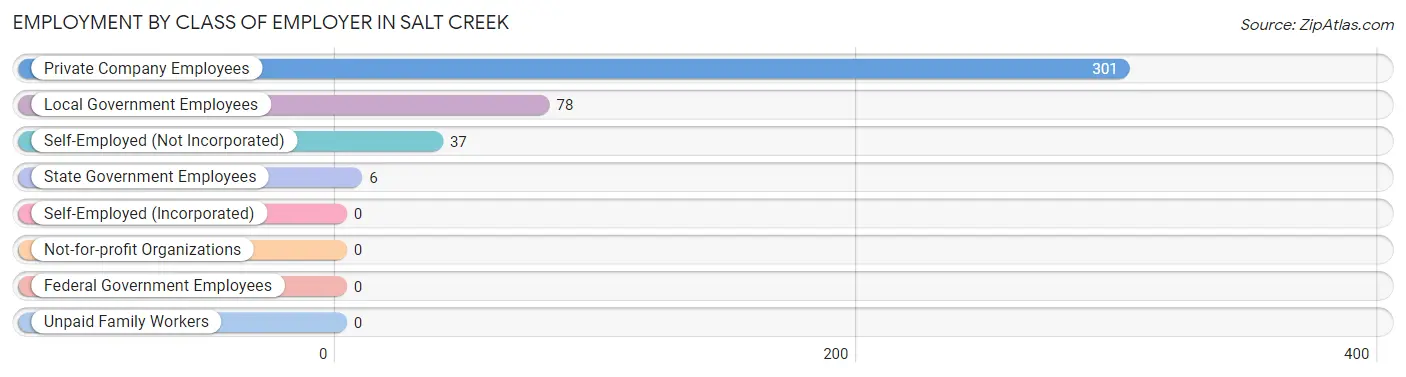
| Employer Class | # Employees | % Employees |
| Private Company Employees | 301 | 71.3% |
| Self-Employed (Incorporated) | 0 | 0.0% |
| Self-Employed (Not Incorporated) | 37 | 8.8% |
| Not-for-profit Organizations | 0 | 0.0% |
| Local Government Employees | 78 | 18.5% |
| State Government Employees | 6 | 1.4% |
| Federal Government Employees | 0 | 0.0% |
| Unpaid Family Workers | 0 | 0.0% |
| Total | 422 | 100.0% |
Employment Status by Age in Salt Creek
According to the labor force statistics for Salt Creek, out of the total population over 16 years of age (640), 75.2% or 481 individuals are in the labor force, with 12.3% or 59 of them unemployed. The age group with the highest labor force participation rate is 20 to 24 years, with 100.0% or 6 individuals in the labor force. Within the labor force, the 30 to 34 years age range has the highest percentage of unemployed individuals, with 100.0% or 59 of them being unemployed.
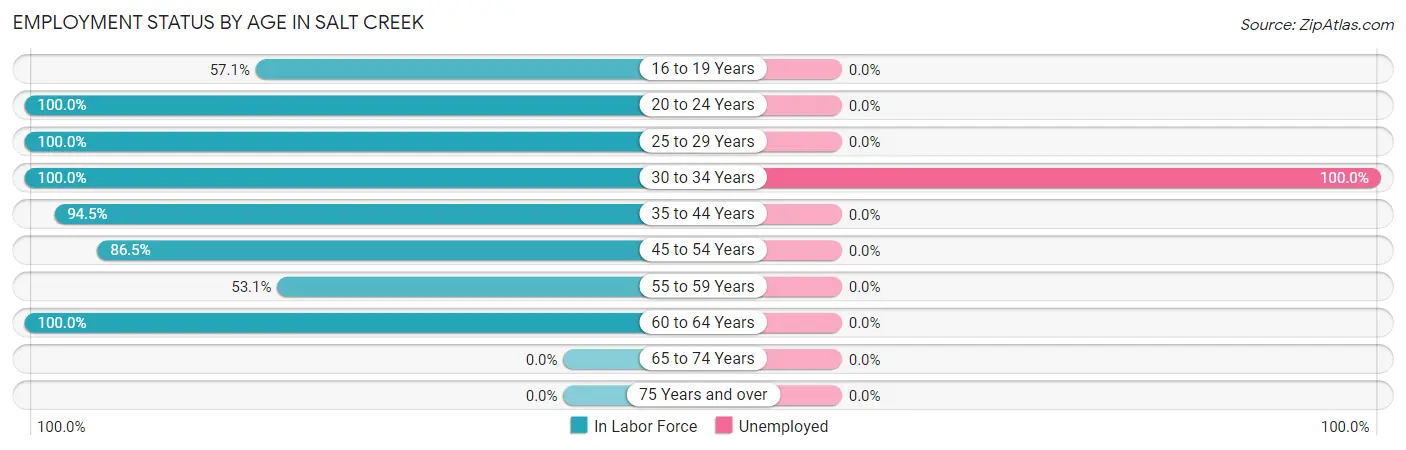
| Age Bracket | In Labor Force | Unemployed |
| 16 to 19 Years | 52 (57.1%) | 0 (0.0%) |
| 20 to 24 Years | 6 (100.0%) | 0 (0.0%) |
| 25 to 29 Years | 63 (100.0%) | 0 (0.0%) |
| 30 to 34 Years | 59 (100.0%) | 59 (100.0%) |
| 35 to 44 Years | 103 (94.5%) | 0 (0.0%) |
| 45 to 54 Years | 135 (86.5%) | 0 (0.0%) |
| 55 to 59 Years | 26 (53.1%) | 0 (0.0%) |
| 60 to 64 Years | 37 (100.0%) | 0 (0.0%) |
| 65 to 74 Years | 0 (0.0%) | 0 (0.0%) |
| 75 Years and over | 0 (0.0%) | 0 (0.0%) |
| Total | 481 (75.2%) | 59 (12.3%) |
Employment Status by Educational Attainment in Salt Creek
According to labor force statistics for Salt Creek, 89.4% of individuals (423) out of the total population between 25 and 64 years of age (473) are in the labor force, with 13.9% or 59 of them being unemployed. The group with the highest labor force participation rate are those with the educational attainment of high school diploma, with 100.0% or 183 individuals in the labor force. Within the labor force, individuals with bachelor's degree or higher education have the highest percentage of unemployment, with 44.7% or 59 of them being unemployed.
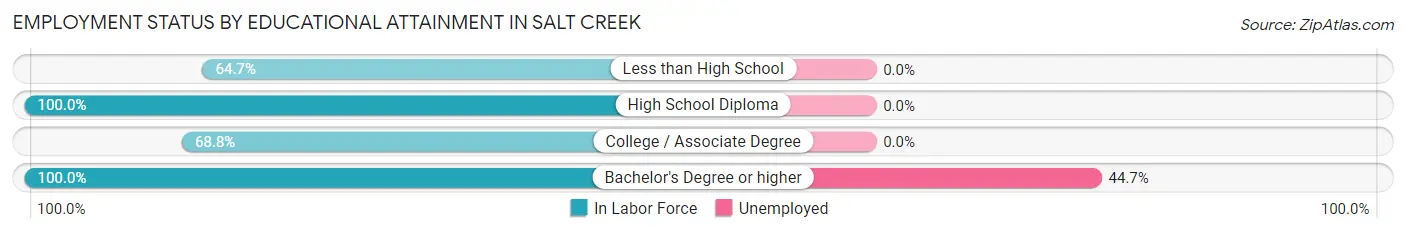
| Educational Attainment | In Labor Force | Unemployed |
| Less than High School | 11 (64.7%) | 0 (0.0%) |
| High School Diploma | 183 (100.0%) | 0 (0.0%) |
| College / Associate Degree | 97 (68.8%) | 0 (0.0%) |
| Bachelor's Degree or higher | 132 (100.0%) | 59 (44.7%) |
| Total | 423 (89.4%) | 66 (13.9%) |
Employment Occupations by Sex in Salt Creek
Management, Business, Science and Arts Occupations
The most common Management, Business, Science and Arts occupations in Salt Creek are , and Business & Financial (36 | 8.5%).
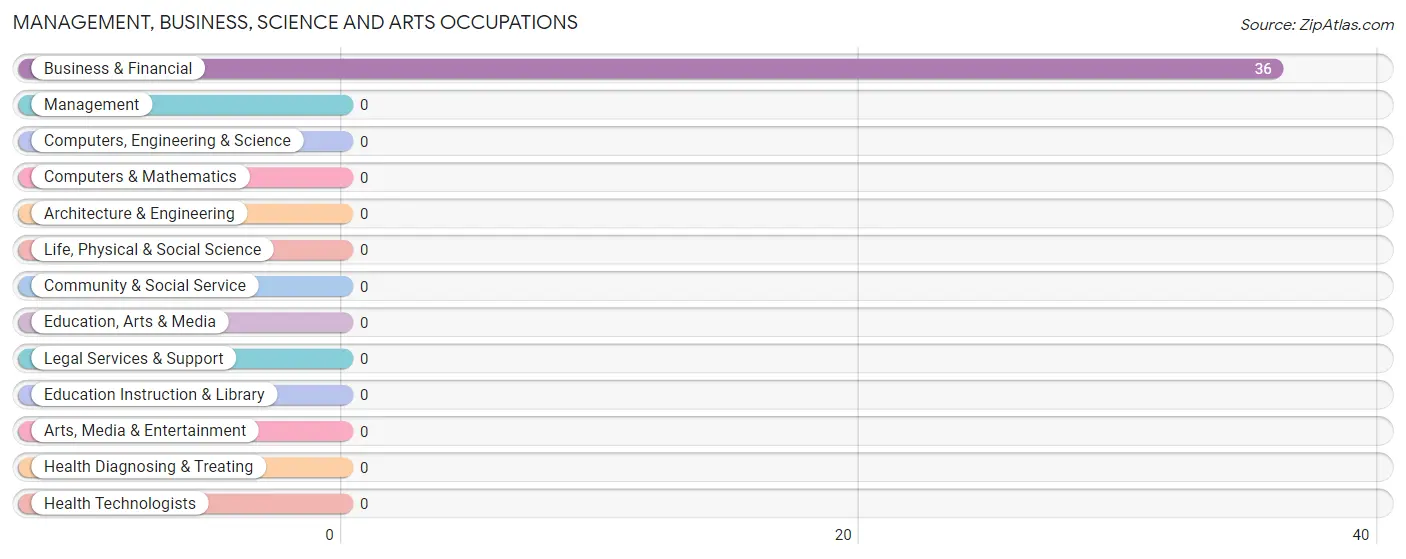
Management, Business, Science and Arts Occupations by Sex
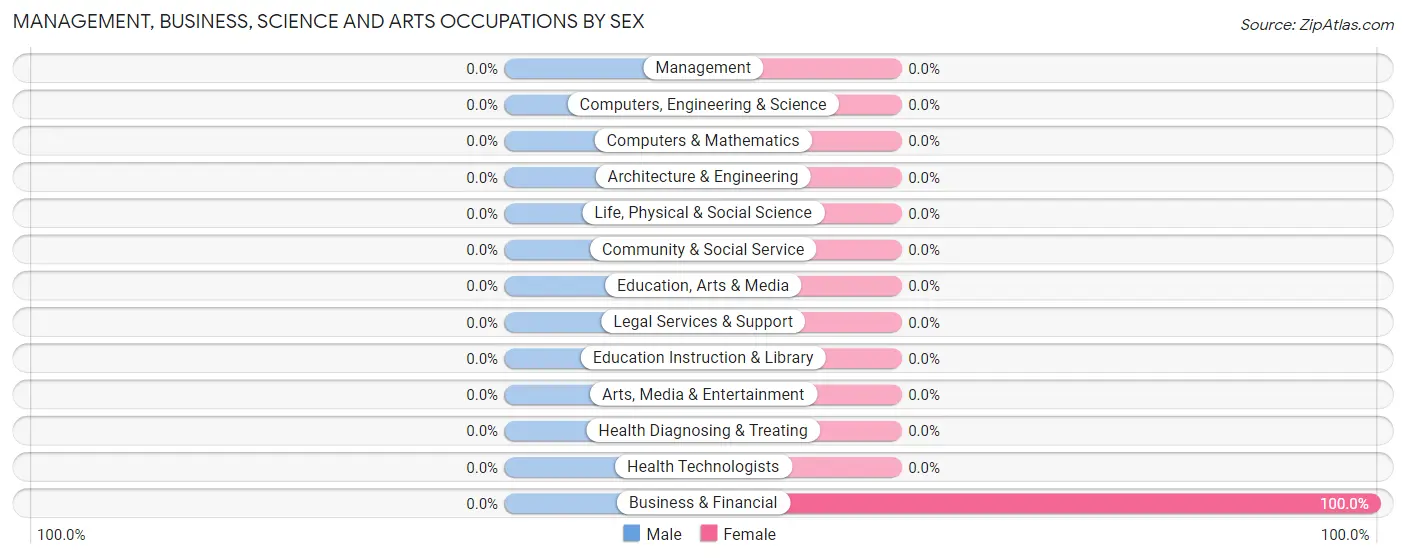
| Occupation | Male | Female |
| Management | 0 (0.0%) | 0 (0.0%) |
| Business & Financial | 0 (0.0%) | 36 (100.0%) |
| Computers, Engineering & Science | 0 (0.0%) | 0 (0.0%) |
| Computers & Mathematics | 0 (0.0%) | 0 (0.0%) |
| Architecture & Engineering | 0 (0.0%) | 0 (0.0%) |
| Life, Physical & Social Science | 0 (0.0%) | 0 (0.0%) |
| Community & Social Service | 0 (0.0%) | 0 (0.0%) |
| Education, Arts & Media | 0 (0.0%) | 0 (0.0%) |
| Legal Services & Support | 0 (0.0%) | 0 (0.0%) |
| Education Instruction & Library | 0 (0.0%) | 0 (0.0%) |
| Arts, Media & Entertainment | 0 (0.0%) | 0 (0.0%) |
| Health Diagnosing & Treating | 0 (0.0%) | 0 (0.0%) |
| Health Technologists | 0 (0.0%) | 0 (0.0%) |
| Total (Category) | 0 (0.0%) | 36 (100.0%) |
| Total (Overall) | 279 (66.1%) | 143 (33.9%) |
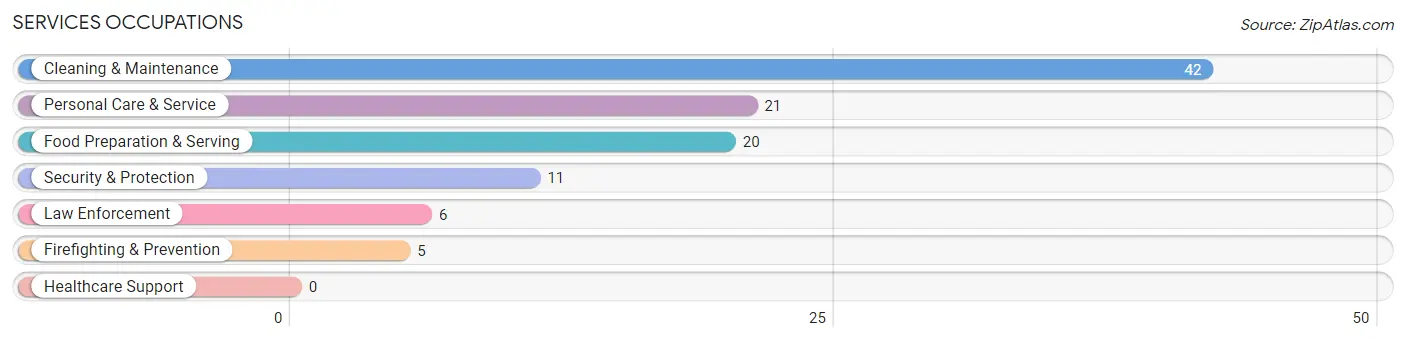
Services Occupations
The most common Services occupations in Salt Creek are Cleaning & Maintenance (42 | 10.0%), Personal Care & Service (21 | 5.0%), Food Preparation & Serving (20 | 4.7%), Security & Protection (11 | 2.6%), and Law Enforcement (6 | 1.4%).
Services Occupations by Sex
Within the Services occupations in Salt Creek, the most male-oriented occupations are Cleaning & Maintenance (100.0%), and Personal Care & Service (100.0%), while the most female-oriented occupations are Security & Protection (100.0%), Firefighting & Prevention (100.0%), and Law Enforcement (100.0%).
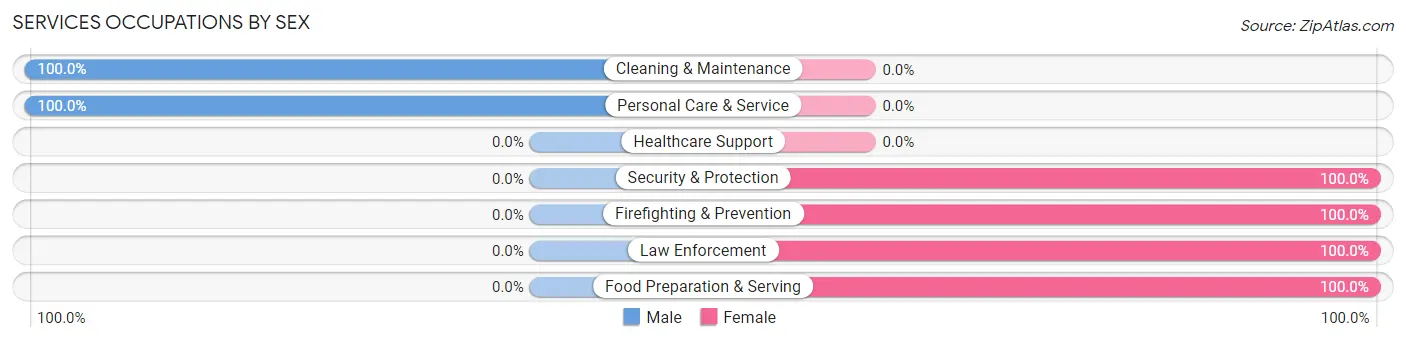
| Occupation | Male | Female |
| Healthcare Support | 0 (0.0%) | 0 (0.0%) |
| Security & Protection | 0 (0.0%) | 11 (100.0%) |
| Firefighting & Prevention | 0 (0.0%) | 5 (100.0%) |
| Law Enforcement | 0 (0.0%) | 6 (100.0%) |
| Food Preparation & Serving | 0 (0.0%) | 20 (100.0%) |
| Cleaning & Maintenance | 42 (100.0%) | 0 (0.0%) |
| Personal Care & Service | 21 (100.0%) | 0 (0.0%) |
| Total (Category) | 63 (67.0%) | 31 (33.0%) |
| Total (Overall) | 279 (66.1%) | 143 (33.9%) |
Sales and Office Occupations
The most common Sales and Office occupations in Salt Creek are Sales & Related (50 | 11.8%), and Office & Administration (18 | 4.3%).
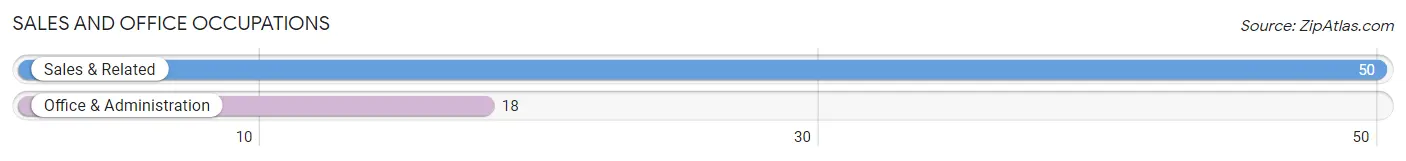
Sales and Office Occupations by Sex

| Occupation | Male | Female |
| Sales & Related | 0 (0.0%) | 50 (100.0%) |
| Office & Administration | 18 (100.0%) | 0 (0.0%) |
| Total (Category) | 18 (26.5%) | 50 (73.5%) |
| Total (Overall) | 279 (66.1%) | 143 (33.9%) |
Natural Resources, Construction and Maintenance Occupations
The most common Natural Resources, Construction and Maintenance occupations in Salt Creek are Construction & Extraction (121 | 28.7%), and Installation, Maintenance & Repair (25 | 5.9%).
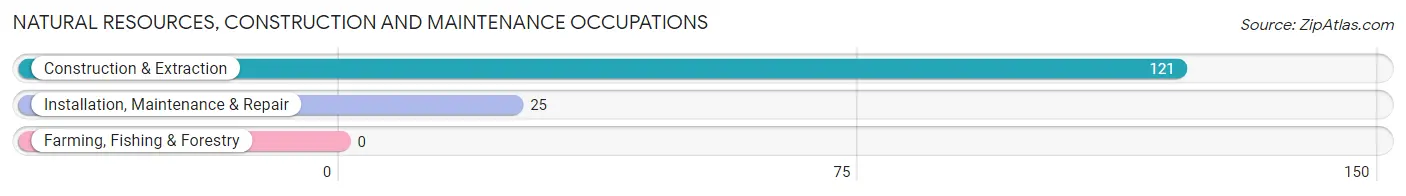
Natural Resources, Construction and Maintenance Occupations by Sex
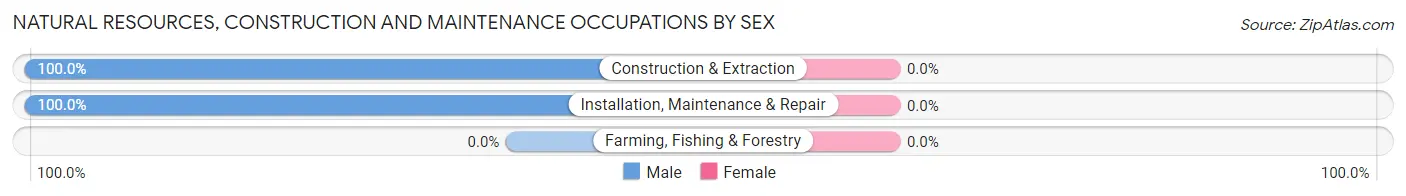
| Occupation | Male | Female |
| Farming, Fishing & Forestry | 0 (0.0%) | 0 (0.0%) |
| Construction & Extraction | 121 (100.0%) | 0 (0.0%) |
| Installation, Maintenance & Repair | 25 (100.0%) | 0 (0.0%) |
| Total (Category) | 146 (100.0%) | 0 (0.0%) |
| Total (Overall) | 279 (66.1%) | 143 (33.9%) |
Production, Transportation and Moving Occupations
The most common Production, Transportation and Moving occupations in Salt Creek are Material Moving (62 | 14.7%), Production (8 | 1.9%), and Transportation (8 | 1.9%).
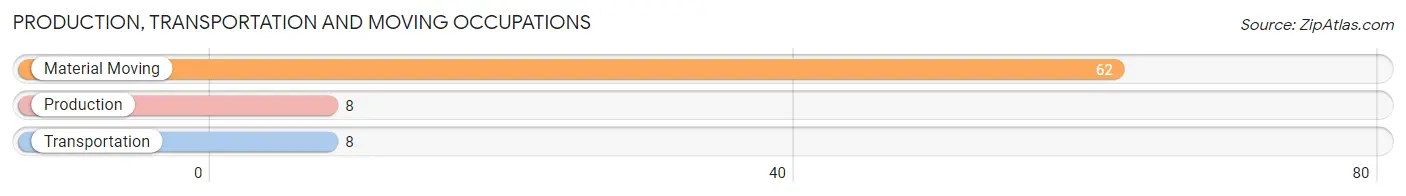
Production, Transportation and Moving Occupations by Sex
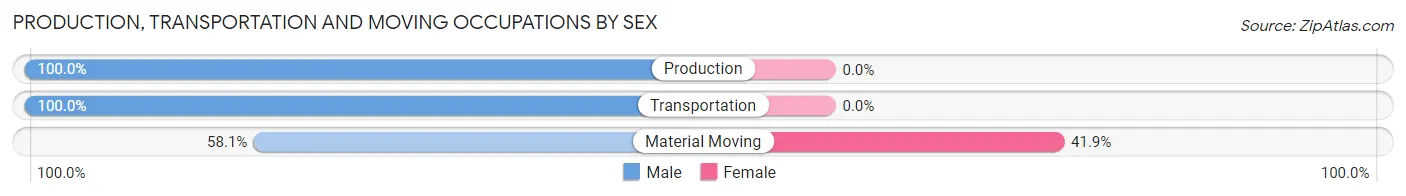
| Occupation | Male | Female |
| Production | 8 (100.0%) | 0 (0.0%) |
| Transportation | 8 (100.0%) | 0 (0.0%) |
| Material Moving | 36 (58.1%) | 26 (41.9%) |
| Total (Category) | 52 (66.7%) | 26 (33.3%) |
| Total (Overall) | 279 (66.1%) | 143 (33.9%) |
Employment Industries by Sex in Salt Creek
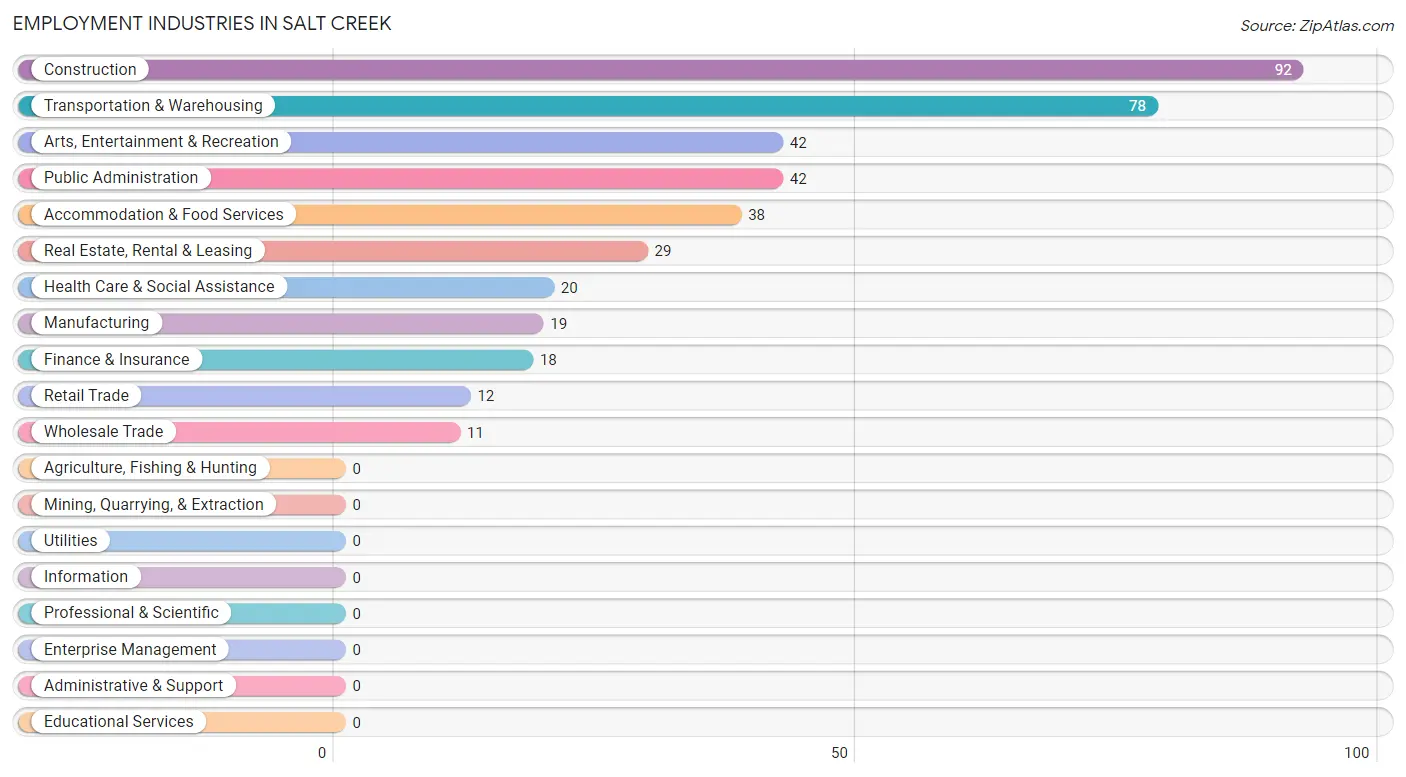
Employment Industries in Salt Creek
The major employment industries in Salt Creek include Construction (92 | 21.8%), Transportation & Warehousing (78 | 18.5%), Arts, Entertainment & Recreation (42 | 10.0%), Public Administration (42 | 10.0%), and Accommodation & Food Services (38 | 9.0%).
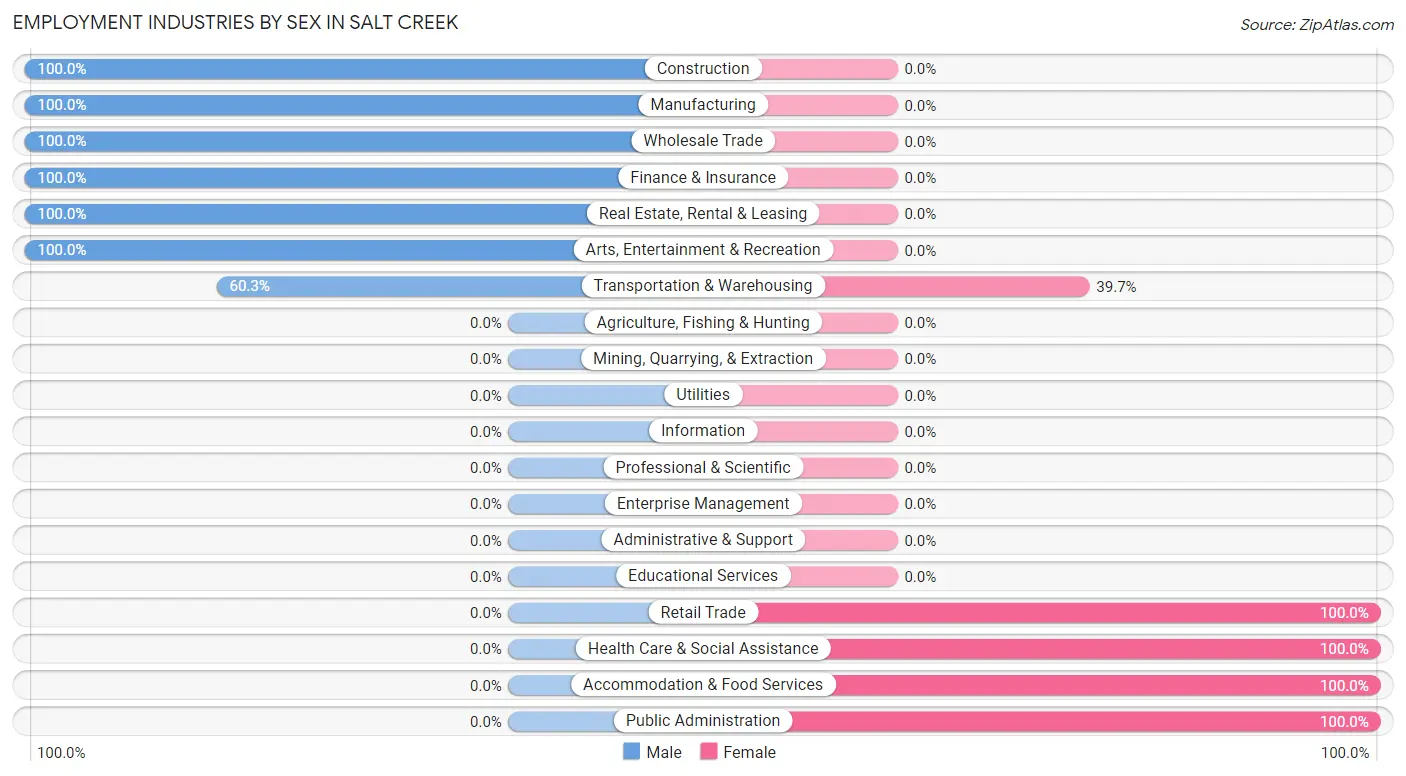
Employment Industries by Sex in Salt Creek
The Salt Creek industries that see more men than women are Construction (100.0%), Manufacturing (100.0%), and Wholesale Trade (100.0%), whereas the industries that tend to have a higher number of women are Retail Trade (100.0%), Health Care & Social Assistance (100.0%), and Accommodation & Food Services (100.0%).
| Industry | Male | Female |
| Agriculture, Fishing & Hunting | 0 (0.0%) | 0 (0.0%) |
| Mining, Quarrying, & Extraction | 0 (0.0%) | 0 (0.0%) |
| Construction | 92 (100.0%) | 0 (0.0%) |
| Manufacturing | 19 (100.0%) | 0 (0.0%) |
| Wholesale Trade | 11 (100.0%) | 0 (0.0%) |
| Retail Trade | 0 (0.0%) | 12 (100.0%) |
| Transportation & Warehousing | 47 (60.3%) | 31 (39.7%) |
| Utilities | 0 (0.0%) | 0 (0.0%) |
| Information | 0 (0.0%) | 0 (0.0%) |
| Finance & Insurance | 18 (100.0%) | 0 (0.0%) |
| Real Estate, Rental & Leasing | 29 (100.0%) | 0 (0.0%) |
| Professional & Scientific | 0 (0.0%) | 0 (0.0%) |
| Enterprise Management | 0 (0.0%) | 0 (0.0%) |
| Administrative & Support | 0 (0.0%) | 0 (0.0%) |
| Educational Services | 0 (0.0%) | 0 (0.0%) |
| Health Care & Social Assistance | 0 (0.0%) | 20 (100.0%) |
| Arts, Entertainment & Recreation | 42 (100.0%) | 0 (0.0%) |
| Accommodation & Food Services | 0 (0.0%) | 38 (100.0%) |
| Public Administration | 0 (0.0%) | 42 (100.0%) |
| Total | 279 (66.1%) | 143 (33.9%) |
Education in Salt Creek
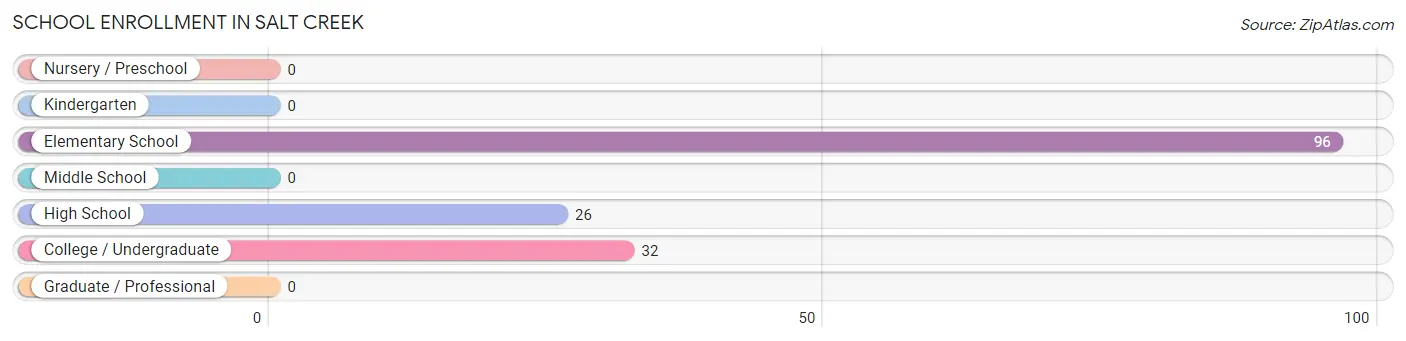
School Enrollment in Salt Creek
The most common levels of schooling among the 154 students in Salt Creek are elementary school (96 | 62.3%), college / undergraduate (32 | 20.8%), and high school (26 | 16.9%).
| School Level | # Students | % Students |
| Nursery / Preschool | 0 | 0.0% |
| Kindergarten | 0 | 0.0% |
| Elementary School | 96 | 62.3% |
| Middle School | 0 | 0.0% |
| High School | 26 | 16.9% |
| College / Undergraduate | 32 | 20.8% |
| Graduate / Professional | 0 | 0.0% |
| Total | 154 | 100.0% |
School Enrollment by Age by Funding Source in Salt Creek
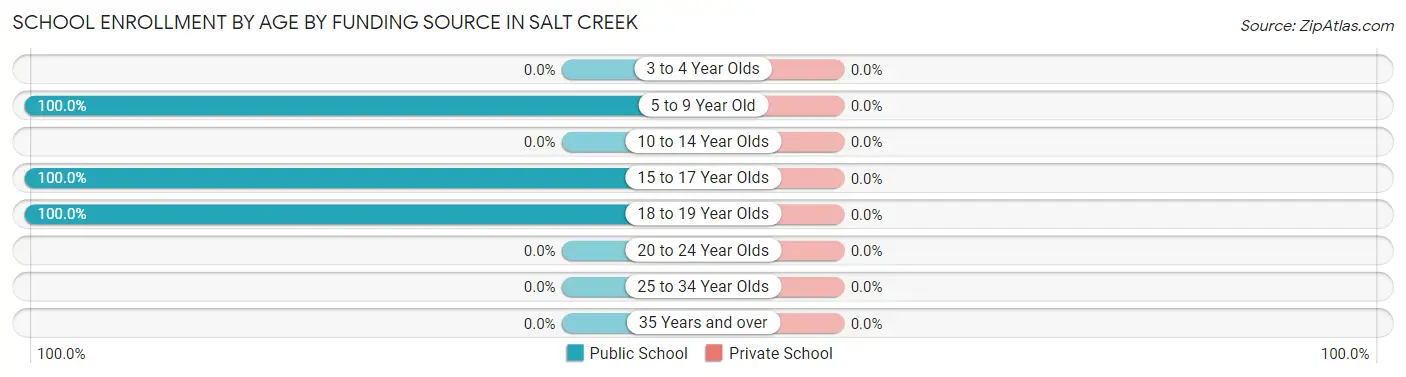
| Age Bracket | Public School | Private School |
| 3 to 4 Year Olds | 0 (0.0%) | 0 (0.0%) |
| 5 to 9 Year Old | 96 (100.0%) | 0 (0.0%) |
| 10 to 14 Year Olds | 0 (0.0%) | 0 (0.0%) |
| 15 to 17 Year Olds | 26 (100.0%) | 0 (0.0%) |
| 18 to 19 Year Olds | 32 (100.0%) | 0 (0.0%) |
| 20 to 24 Year Olds | 0 (0.0%) | 0 (0.0%) |
| 25 to 34 Year Olds | 0 (0.0%) | 0 (0.0%) |
| 35 Years and over | 0 (0.0%) | 0 (0.0%) |
| Total | 154 (100.0%) | 0 (0.0%) |
Educational Attainment by Field of Study in Salt Creek
Science & technology (59 | 44.7%), business (44 | 33.3%), education (18 | 13.6%), social sciences (6 | 4.5%), and arts & humanities (5 | 3.8%) are the most common fields of study among 132 individuals in Salt Creek who have obtained a bachelor's degree or higher.
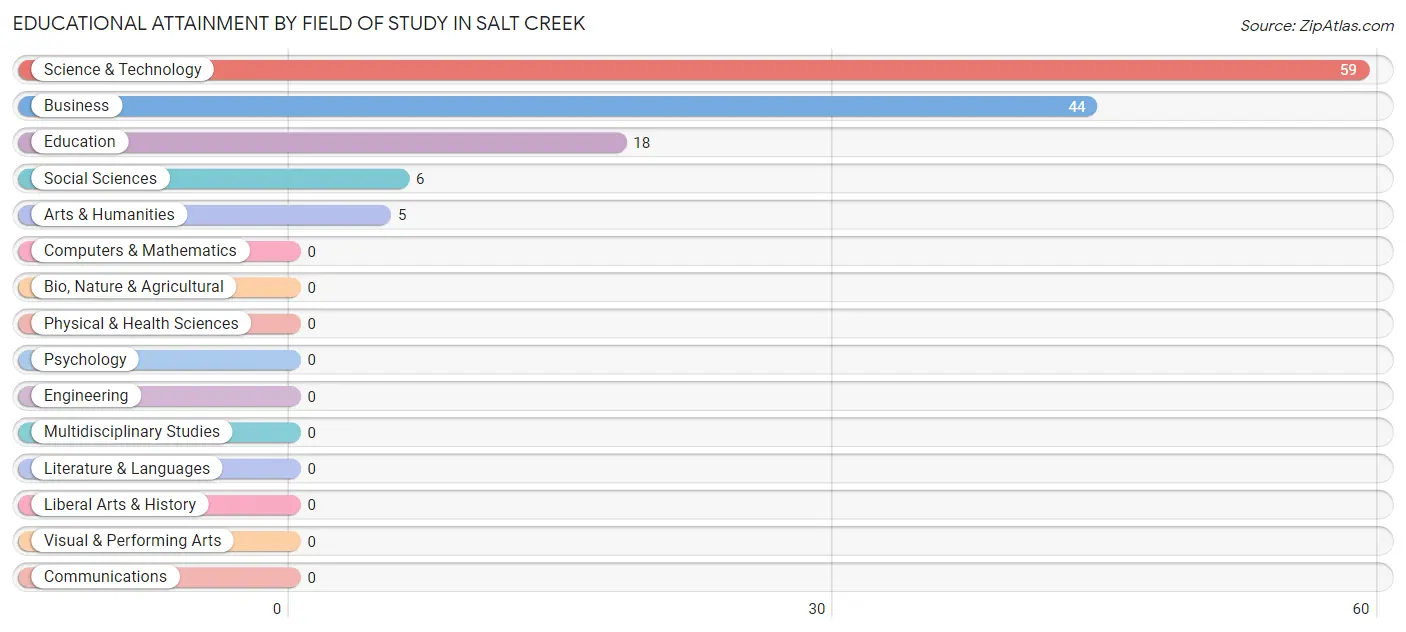
| Field of Study | # Graduates | % Graduates |
| Computers & Mathematics | 0 | 0.0% |
| Bio, Nature & Agricultural | 0 | 0.0% |
| Physical & Health Sciences | 0 | 0.0% |
| Psychology | 0 | 0.0% |
| Social Sciences | 6 | 4.5% |
| Engineering | 0 | 0.0% |
| Multidisciplinary Studies | 0 | 0.0% |
| Science & Technology | 59 | 44.7% |
| Business | 44 | 33.3% |
| Education | 18 | 13.6% |
| Literature & Languages | 0 | 0.0% |
| Liberal Arts & History | 0 | 0.0% |
| Visual & Performing Arts | 0 | 0.0% |
| Communications | 0 | 0.0% |
| Arts & Humanities | 5 | 3.8% |
| Total | 132 | 100.0% |
Transportation & Commute in Salt Creek
Vehicle Availability by Sex in Salt Creek
The most prevalent vehicle ownership categories in Salt Creek are males with 4 vehicles (75, accounting for 26.9%) and females with 4 vehicles (44, making up 52.4%).
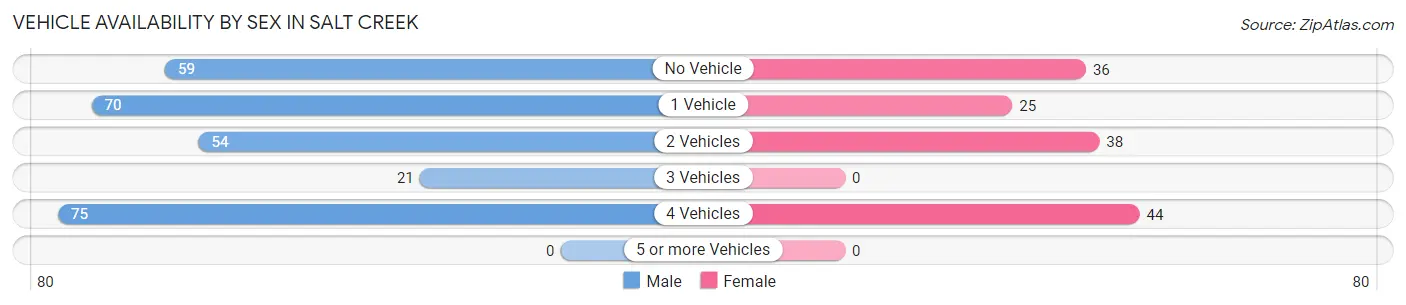
| Vehicles Available | Male | Female |
| No Vehicle | 59 (21.1%) | 36 (25.2%) |
| 1 Vehicle | 70 (25.1%) | 25 (17.5%) |
| 2 Vehicles | 54 (19.4%) | 38 (26.6%) |
| 3 Vehicles | 21 (7.5%) | 0 (0.0%) |
| 4 Vehicles | 75 (26.9%) | 44 (30.8%) |
| 5 or more Vehicles | 0 (0.0%) | 0 (0.0%) |
| Total | 279 (100.0%) | 143 (100.0%) |
Commute Time in Salt Creek
The most frequently occuring commute durations in Salt Creek are 10 to 14 minutes (144 commuters, 38.4%), 15 to 19 minutes (121 commuters, 32.3%), and 90 or more minutes (38 commuters, 10.1%).
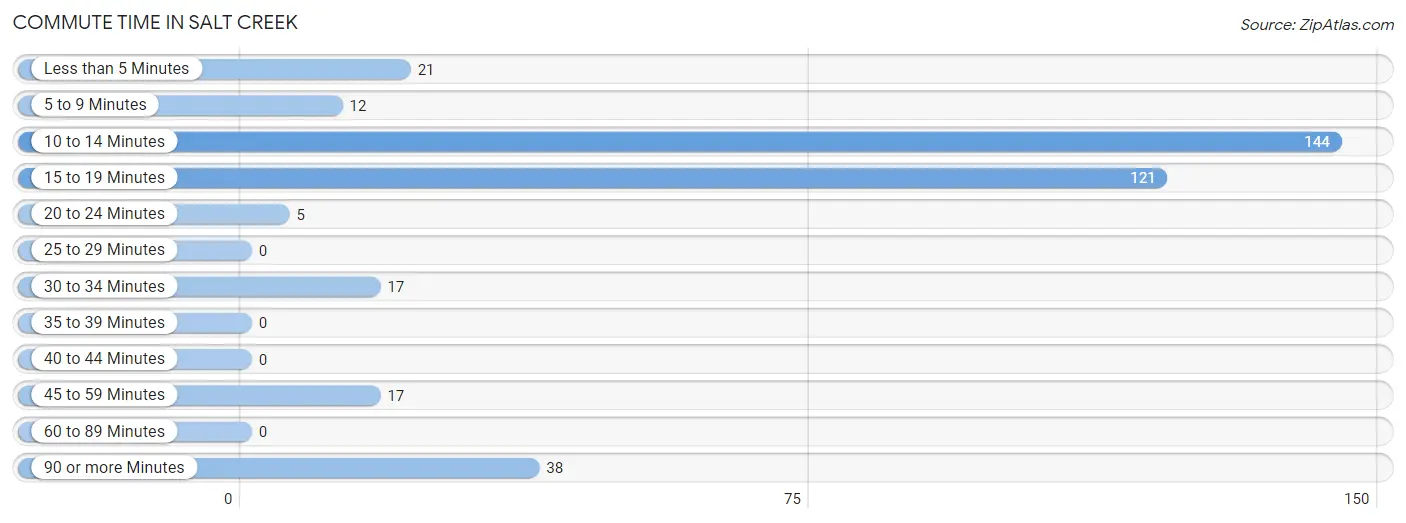
| Commute Time | # Commuters | % Commuters |
| Less than 5 Minutes | 21 | 5.6% |
| 5 to 9 Minutes | 12 | 3.2% |
| 10 to 14 Minutes | 144 | 38.4% |
| 15 to 19 Minutes | 121 | 32.3% |
| 20 to 24 Minutes | 5 | 1.3% |
| 25 to 29 Minutes | 0 | 0.0% |
| 30 to 34 Minutes | 17 | 4.5% |
| 35 to 39 Minutes | 0 | 0.0% |
| 40 to 44 Minutes | 0 | 0.0% |
| 45 to 59 Minutes | 17 | 4.5% |
| 60 to 89 Minutes | 0 | 0.0% |
| 90 or more Minutes | 38 | 10.1% |
Commute Time by Sex in Salt Creek
The most common commute times in Salt Creek are 15 to 19 minutes (89 commuters, 38.4%) for males and 10 to 14 minutes (56 commuters, 39.2%) for females.
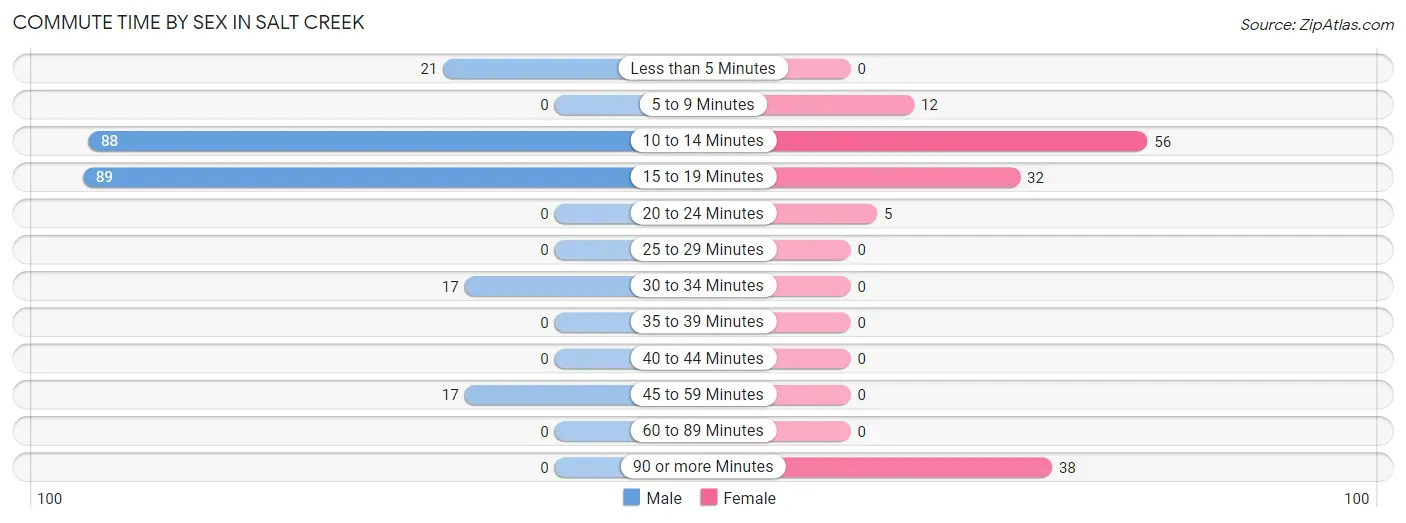
| Commute Time | Male | Female |
| Less than 5 Minutes | 21 (9.0%) | 0 (0.0%) |
| 5 to 9 Minutes | 0 (0.0%) | 12 (8.4%) |
| 10 to 14 Minutes | 88 (37.9%) | 56 (39.2%) |
| 15 to 19 Minutes | 89 (38.4%) | 32 (22.4%) |
| 20 to 24 Minutes | 0 (0.0%) | 5 (3.5%) |
| 25 to 29 Minutes | 0 (0.0%) | 0 (0.0%) |
| 30 to 34 Minutes | 17 (7.3%) | 0 (0.0%) |
| 35 to 39 Minutes | 0 (0.0%) | 0 (0.0%) |
| 40 to 44 Minutes | 0 (0.0%) | 0 (0.0%) |
| 45 to 59 Minutes | 17 (7.3%) | 0 (0.0%) |
| 60 to 89 Minutes | 0 (0.0%) | 0 (0.0%) |
| 90 or more Minutes | 0 (0.0%) | 38 (26.6%) |
Time of Departure to Work by Sex in Salt Creek
The most frequent times of departure to work in Salt Creek are 5:30 AM to 5:59 AM (122, 52.6%) for males and 7:00 AM to 7:29 AM (38, 26.6%) for females.
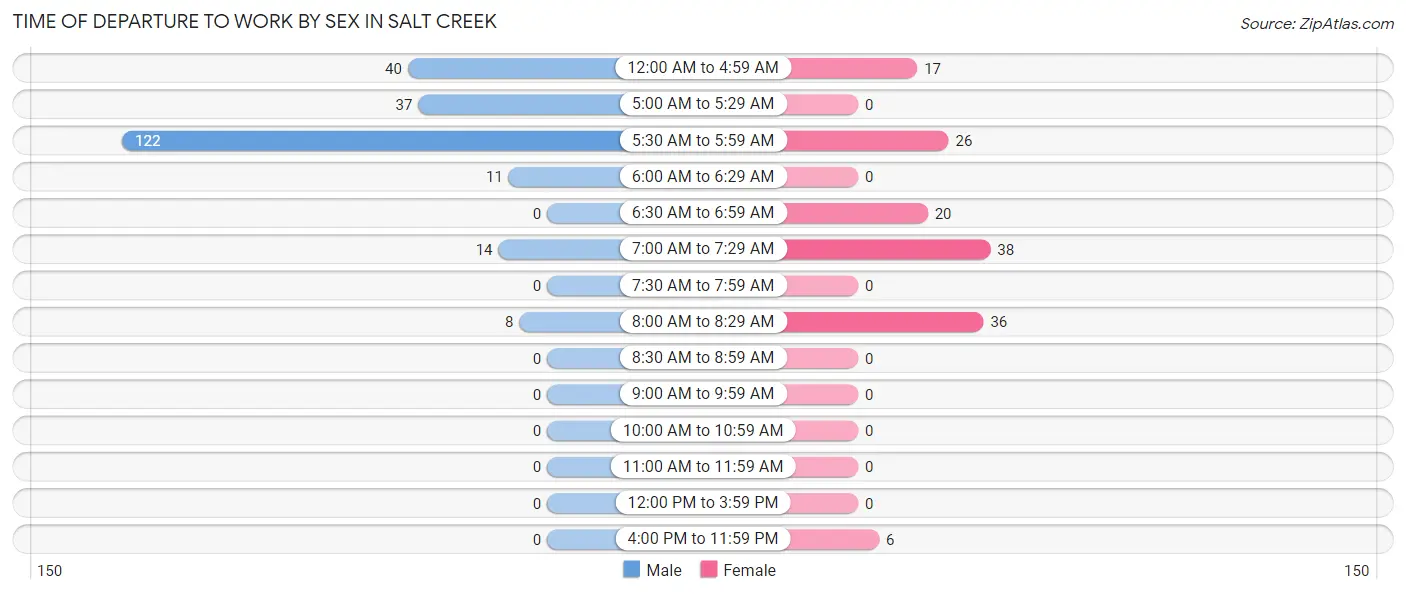
| Time of Departure | Male | Female |
| 12:00 AM to 4:59 AM | 40 (17.2%) | 17 (11.9%) |
| 5:00 AM to 5:29 AM | 37 (16.0%) | 0 (0.0%) |
| 5:30 AM to 5:59 AM | 122 (52.6%) | 26 (18.2%) |
| 6:00 AM to 6:29 AM | 11 (4.7%) | 0 (0.0%) |
| 6:30 AM to 6:59 AM | 0 (0.0%) | 20 (14.0%) |
| 7:00 AM to 7:29 AM | 14 (6.0%) | 38 (26.6%) |
| 7:30 AM to 7:59 AM | 0 (0.0%) | 0 (0.0%) |
| 8:00 AM to 8:29 AM | 8 (3.5%) | 36 (25.2%) |
| 8:30 AM to 8:59 AM | 0 (0.0%) | 0 (0.0%) |
| 9:00 AM to 9:59 AM | 0 (0.0%) | 0 (0.0%) |
| 10:00 AM to 10:59 AM | 0 (0.0%) | 0 (0.0%) |
| 11:00 AM to 11:59 AM | 0 (0.0%) | 0 (0.0%) |
| 12:00 PM to 3:59 PM | 0 (0.0%) | 0 (0.0%) |
| 4:00 PM to 11:59 PM | 0 (0.0%) | 6 (4.2%) |
| Total | 232 (100.0%) | 143 (100.0%) |
Housing Occupancy in Salt Creek
Occupancy by Ownership in Salt Creek
Of the total 320 dwellings in Salt Creek, owner-occupied units account for 186 (58.1%), while renter-occupied units make up 134 (41.9%).
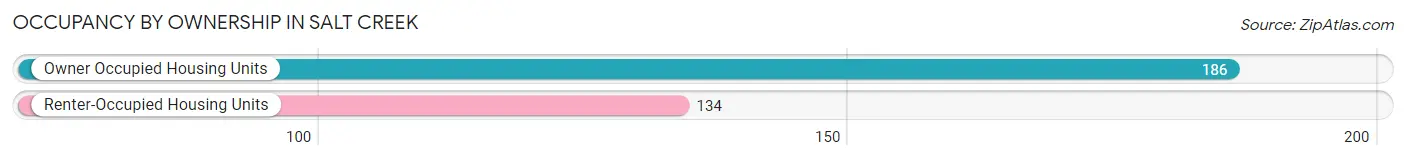
| Occupancy | # Housing Units | % Housing Units |
| Owner Occupied Housing Units | 186 | 58.1% |
| Renter-Occupied Housing Units | 134 | 41.9% |
| Total Occupied Housing Units | 320 | 100.0% |
Occupancy by Household Size in Salt Creek
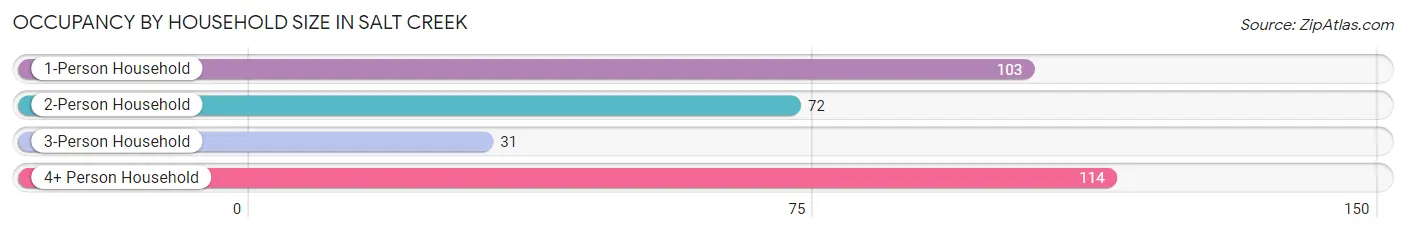
| Household Size | # Housing Units | % Housing Units |
| 1-Person Household | 103 | 32.2% |
| 2-Person Household | 72 | 22.5% |
| 3-Person Household | 31 | 9.7% |
| 4+ Person Household | 114 | 35.6% |
| Total Housing Units | 320 | 100.0% |
Occupancy by Ownership by Household Size in Salt Creek
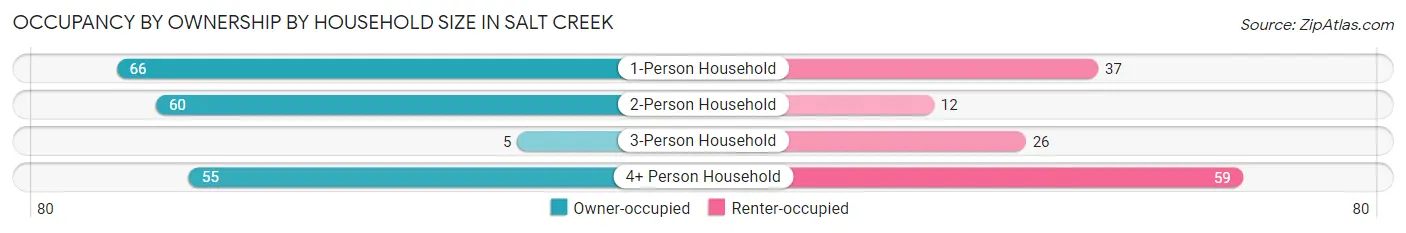
| Household Size | Owner-occupied | Renter-occupied |
| 1-Person Household | 66 (64.1%) | 37 (35.9%) |
| 2-Person Household | 60 (83.3%) | 12 (16.7%) |
| 3-Person Household | 5 (16.1%) | 26 (83.9%) |
| 4+ Person Household | 55 (48.2%) | 59 (51.7%) |
| Total Housing Units | 186 (58.1%) | 134 (41.9%) |
Occupancy by Educational Attainment in Salt Creek
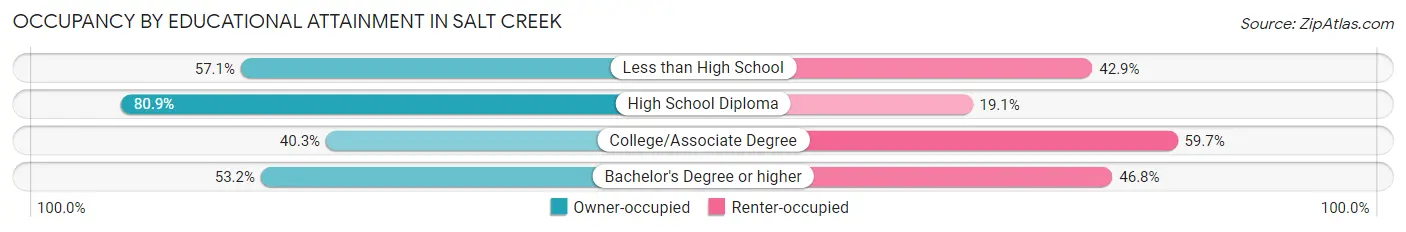
| Household Size | Owner-occupied | Renter-occupied |
| Less than High School | 16 (57.1%) | 12 (42.9%) |
| High School Diploma | 72 (80.9%) | 17 (19.1%) |
| College/Associate Degree | 31 (40.3%) | 46 (59.7%) |
| Bachelor's Degree or higher | 67 (53.2%) | 59 (46.8%) |
Occupancy by Age of Householder in Salt Creek
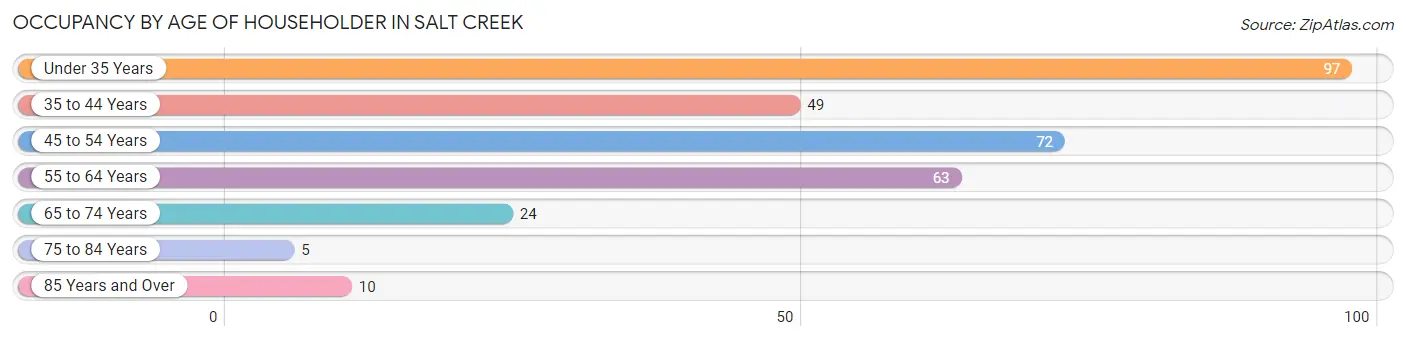
| Age Bracket | # Households | % Households |
| Under 35 Years | 97 | 30.3% |
| 35 to 44 Years | 49 | 15.3% |
| 45 to 54 Years | 72 | 22.5% |
| 55 to 64 Years | 63 | 19.7% |
| 65 to 74 Years | 24 | 7.5% |
| 75 to 84 Years | 5 | 1.6% |
| 85 Years and Over | 10 | 3.1% |
| Total | 320 | 100.0% |
Housing Finances in Salt Creek
Median Income by Occupancy in Salt Creek
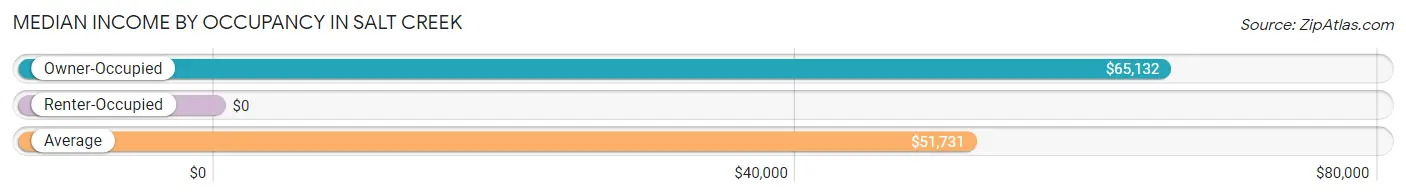
| Occupancy Type | # Households | Median Income |
| Owner-Occupied | 186 (58.1%) | $65,132 |
| Renter-Occupied | 134 (41.9%) | $0 |
| Average | 320 (100.0%) | $51,731 |
Occupancy by Householder Income Bracket in Salt Creek
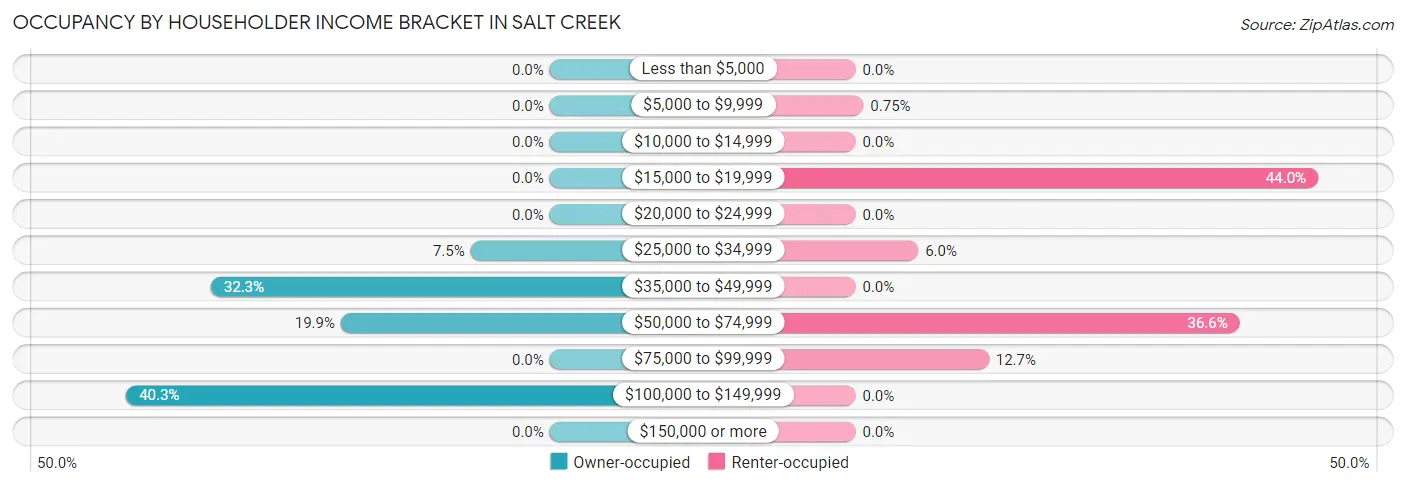
| Income Bracket | Owner-occupied | Renter-occupied |
| Less than $5,000 | 0 (0.0%) | 0 (0.0%) |
| $5,000 to $9,999 | 0 (0.0%) | 1 (0.7%) |
| $10,000 to $14,999 | 0 (0.0%) | 0 (0.0%) |
| $15,000 to $19,999 | 0 (0.0%) | 59 (44.0%) |
| $20,000 to $24,999 | 0 (0.0%) | 0 (0.0%) |
| $25,000 to $34,999 | 14 (7.5%) | 8 (6.0%) |
| $35,000 to $49,999 | 60 (32.3%) | 0 (0.0%) |
| $50,000 to $74,999 | 37 (19.9%) | 49 (36.6%) |
| $75,000 to $99,999 | 0 (0.0%) | 17 (12.7%) |
| $100,000 to $149,999 | 75 (40.3%) | 0 (0.0%) |
| $150,000 or more | 0 (0.0%) | 0 (0.0%) |
| Total | 186 (100.0%) | 134 (100.0%) |
Monthly Housing Cost Tiers in Salt Creek
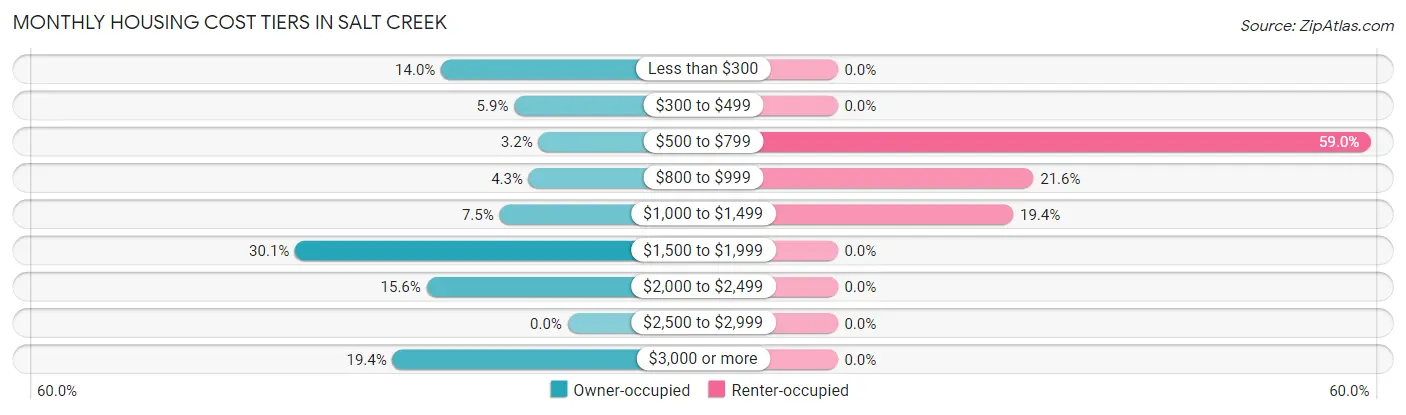
| Monthly Cost | Owner-occupied | Renter-occupied |
| Less than $300 | 26 (14.0%) | 0 (0.0%) |
| $300 to $499 | 11 (5.9%) | 0 (0.0%) |
| $500 to $799 | 6 (3.2%) | 79 (59.0%) |
| $800 to $999 | 8 (4.3%) | 29 (21.6%) |
| $1,000 to $1,499 | 14 (7.5%) | 26 (19.4%) |
| $1,500 to $1,999 | 56 (30.1%) | 0 (0.0%) |
| $2,000 to $2,499 | 29 (15.6%) | 0 (0.0%) |
| $2,500 to $2,999 | 0 (0.0%) | 0 (0.0%) |
| $3,000 or more | 36 (19.4%) | 0 (0.0%) |
| Total | 186 (100.0%) | 134 (100.0%) |
Physical Housing Characteristics in Salt Creek
Housing Structures in Salt Creek
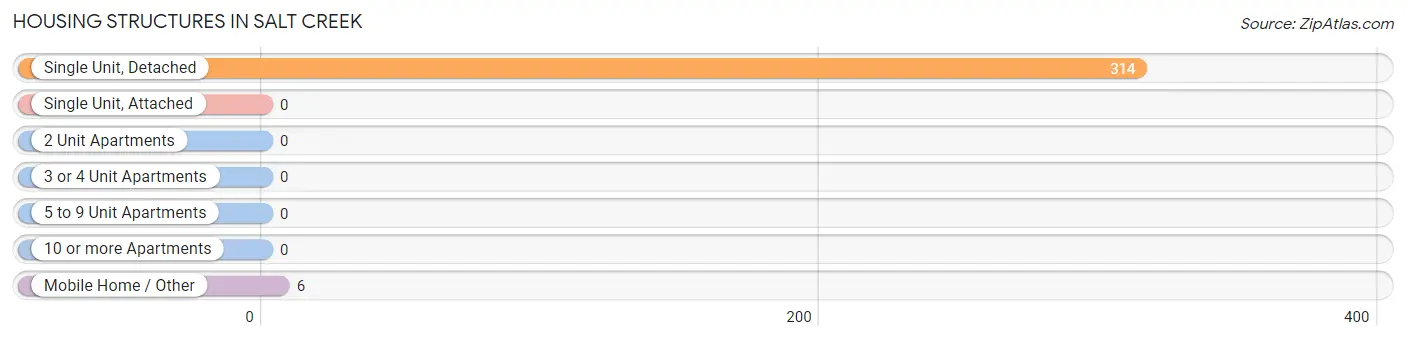
| Structure Type | # Housing Units | % Housing Units |
| Single Unit, Detached | 314 | 98.1% |
| Single Unit, Attached | 0 | 0.0% |
| 2 Unit Apartments | 0 | 0.0% |
| 3 or 4 Unit Apartments | 0 | 0.0% |
| 5 to 9 Unit Apartments | 0 | 0.0% |
| 10 or more Apartments | 0 | 0.0% |
| Mobile Home / Other | 6 | 1.9% |
| Total | 320 | 100.0% |
Housing Structures by Occupancy in Salt Creek
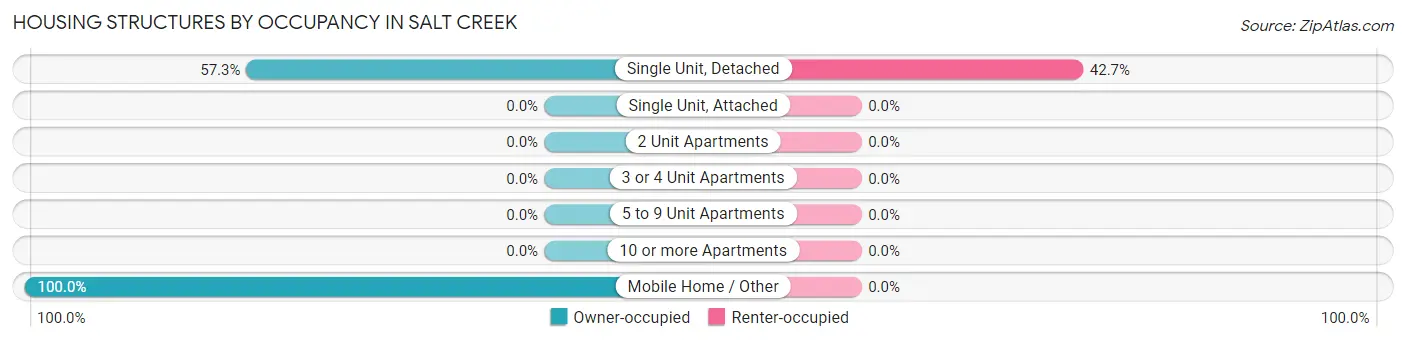
| Structure Type | Owner-occupied | Renter-occupied |
| Single Unit, Detached | 180 (57.3%) | 134 (42.7%) |
| Single Unit, Attached | 0 (0.0%) | 0 (0.0%) |
| 2 Unit Apartments | 0 (0.0%) | 0 (0.0%) |
| 3 or 4 Unit Apartments | 0 (0.0%) | 0 (0.0%) |
| 5 to 9 Unit Apartments | 0 (0.0%) | 0 (0.0%) |
| 10 or more Apartments | 0 (0.0%) | 0 (0.0%) |
| Mobile Home / Other | 6 (100.0%) | 0 (0.0%) |
| Total | 186 (58.1%) | 134 (41.9%) |
Housing Structures by Number of Rooms in Salt Creek
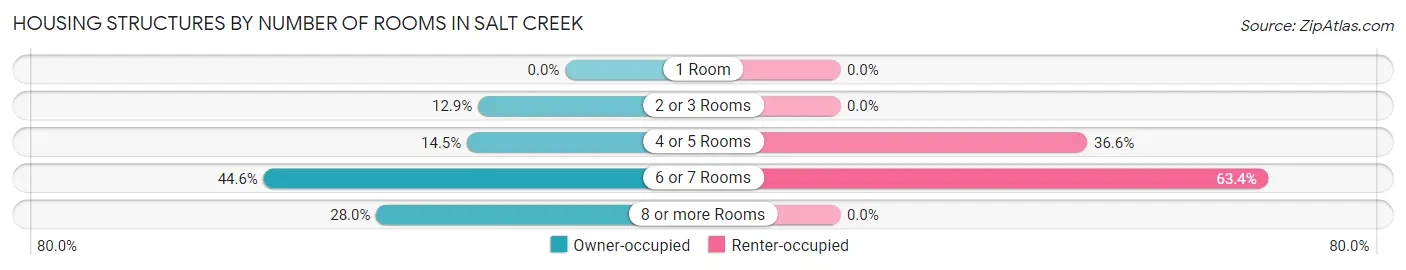
| Number of Rooms | Owner-occupied | Renter-occupied |
| 1 Room | 0 (0.0%) | 0 (0.0%) |
| 2 or 3 Rooms | 24 (12.9%) | 0 (0.0%) |
| 4 or 5 Rooms | 27 (14.5%) | 49 (36.6%) |
| 6 or 7 Rooms | 83 (44.6%) | 85 (63.4%) |
| 8 or more Rooms | 52 (28.0%) | 0 (0.0%) |
| Total | 186 (100.0%) | 134 (100.0%) |
Housing Structure by Heating Type in Salt Creek
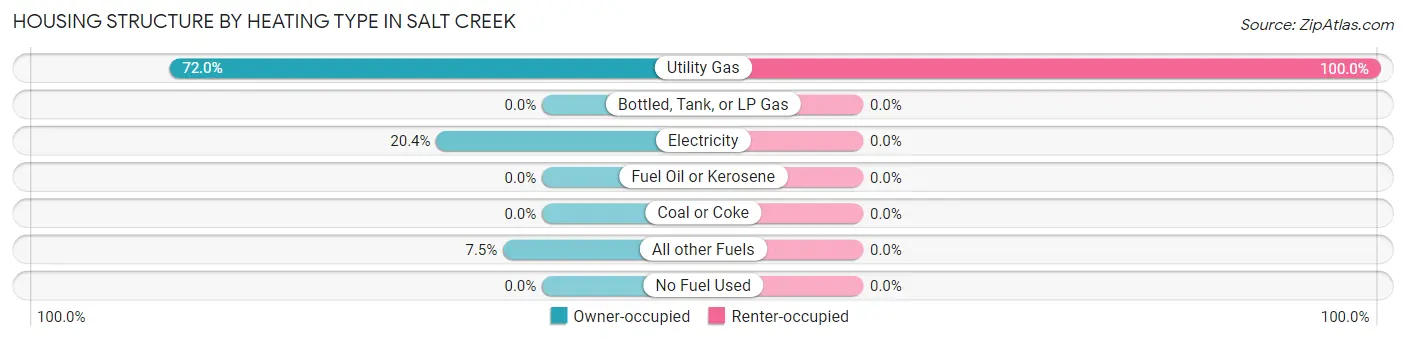
| Heating Type | Owner-occupied | Renter-occupied |
| Utility Gas | 134 (72.0%) | 134 (100.0%) |
| Bottled, Tank, or LP Gas | 0 (0.0%) | 0 (0.0%) |
| Electricity | 38 (20.4%) | 0 (0.0%) |
| Fuel Oil or Kerosene | 0 (0.0%) | 0 (0.0%) |
| Coal or Coke | 0 (0.0%) | 0 (0.0%) |
| All other Fuels | 14 (7.5%) | 0 (0.0%) |
| No Fuel Used | 0 (0.0%) | 0 (0.0%) |
| Total | 186 (100.0%) | 134 (100.0%) |
Household Vehicle Usage in Salt Creek
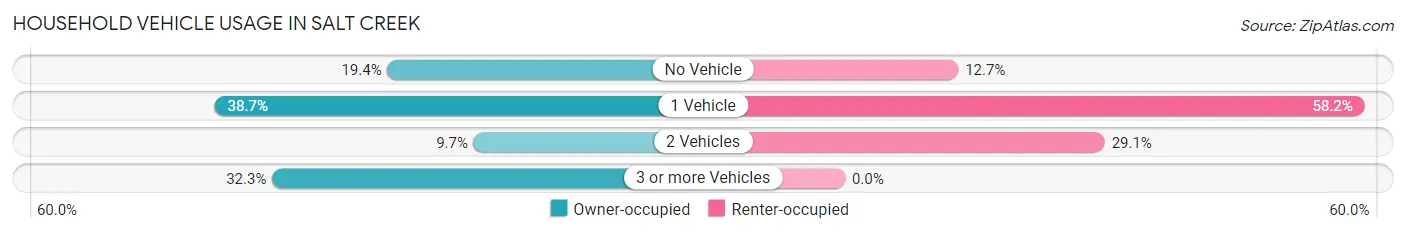
| Vehicles per Household | Owner-occupied | Renter-occupied |
| No Vehicle | 36 (19.4%) | 17 (12.7%) |
| 1 Vehicle | 72 (38.7%) | 78 (58.2%) |
| 2 Vehicles | 18 (9.7%) | 39 (29.1%) |
| 3 or more Vehicles | 60 (32.3%) | 0 (0.0%) |
| Total | 186 (100.0%) | 134 (100.0%) |
Real Estate & Mortgages in Salt Creek
Real Estate and Mortgage Overview in Salt Creek
| Characteristic | Without Mortgage | With Mortgage |
| Housing Units | 38 | 148 |
| Median Property Value | $117,600 | $267,900 |
| Median Household Income | $46,250 | $0 |
| Monthly Housing Costs | $265 | $36 |
| Real Estate Taxes | $538 | $0 |
Property Value by Mortgage Status in Salt Creek
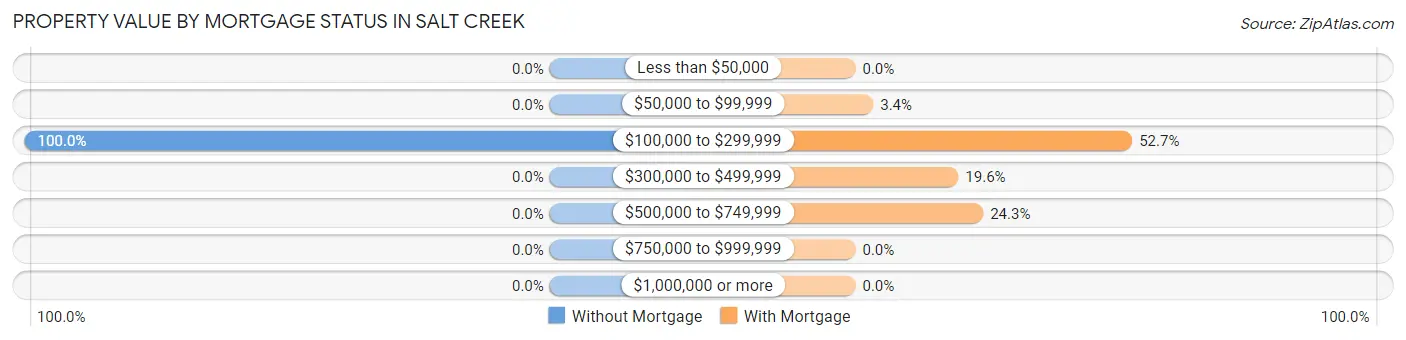
| Property Value | Without Mortgage | With Mortgage |
| Less than $50,000 | 0 (0.0%) | 0 (0.0%) |
| $50,000 to $99,999 | 0 (0.0%) | 5 (3.4%) |
| $100,000 to $299,999 | 38 (100.0%) | 78 (52.7%) |
| $300,000 to $499,999 | 0 (0.0%) | 29 (19.6%) |
| $500,000 to $749,999 | 0 (0.0%) | 36 (24.3%) |
| $750,000 to $999,999 | 0 (0.0%) | 0 (0.0%) |
| $1,000,000 or more | 0 (0.0%) | 0 (0.0%) |
| Total | 38 (100.0%) | 148 (100.0%) |
Household Income by Mortgage Status in Salt Creek
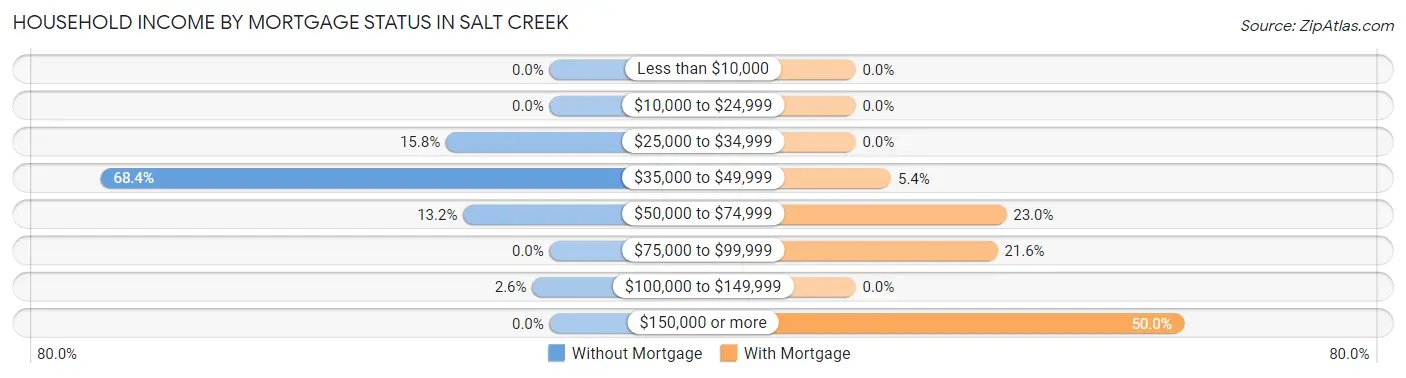
| Household Income | Without Mortgage | With Mortgage |
| Less than $10,000 | 0 (0.0%) | 0 (0.0%) |
| $10,000 to $24,999 | 0 (0.0%) | 0 (0.0%) |
| $25,000 to $34,999 | 6 (15.8%) | 0 (0.0%) |
| $35,000 to $49,999 | 26 (68.4%) | 8 (5.4%) |
| $50,000 to $74,999 | 5 (13.2%) | 34 (23.0%) |
| $75,000 to $99,999 | 0 (0.0%) | 32 (21.6%) |
| $100,000 to $149,999 | 1 (2.6%) | 0 (0.0%) |
| $150,000 or more | 0 (0.0%) | 74 (50.0%) |
| Total | 38 (100.0%) | 148 (100.0%) |
Property Value to Household Income Ratio in Salt Creek
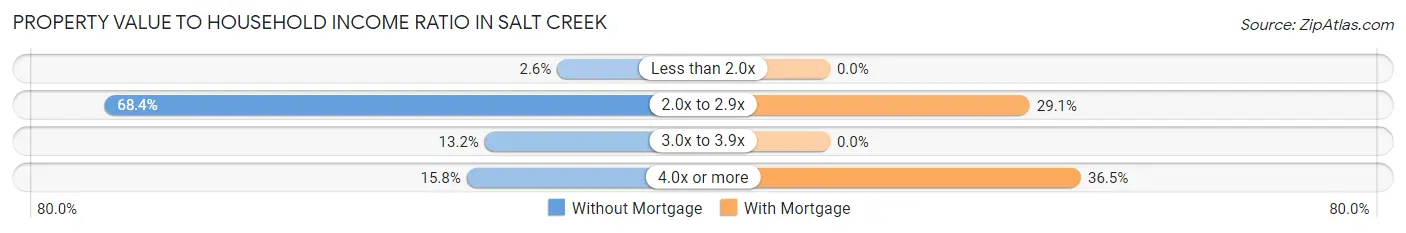
| Value-to-Income Ratio | Without Mortgage | With Mortgage |
| Less than 2.0x | 1 (2.6%) | 0 (0.0%) |
| 2.0x to 2.9x | 26 (68.4%) | 43 (29.0%) |
| 3.0x to 3.9x | 5 (13.2%) | 0 (0.0%) |
| 4.0x or more | 6 (15.8%) | 54 (36.5%) |
| Total | 38 (100.0%) | 148 (100.0%) |
Real Estate Taxes by Mortgage Status in Salt Creek
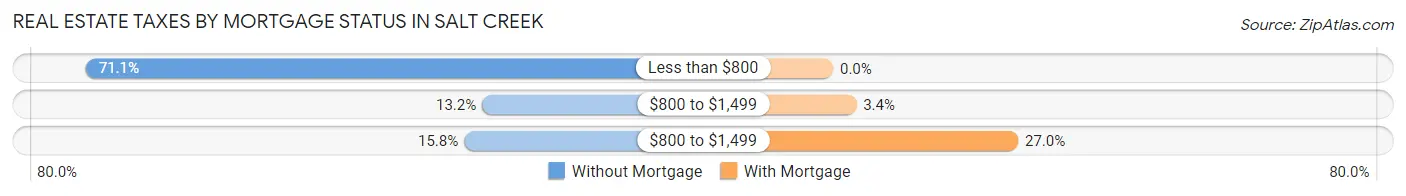
| Property Taxes | Without Mortgage | With Mortgage |
| Less than $800 | 27 (71.1%) | 0 (0.0%) |
| $800 to $1,499 | 5 (13.2%) | 5 (3.4%) |
| $800 to $1,499 | 6 (15.8%) | 40 (27.0%) |
| Total | 38 (100.0%) | 148 (100.0%) |
Health & Disability in Salt Creek
Health Insurance Coverage by Age in Salt Creek
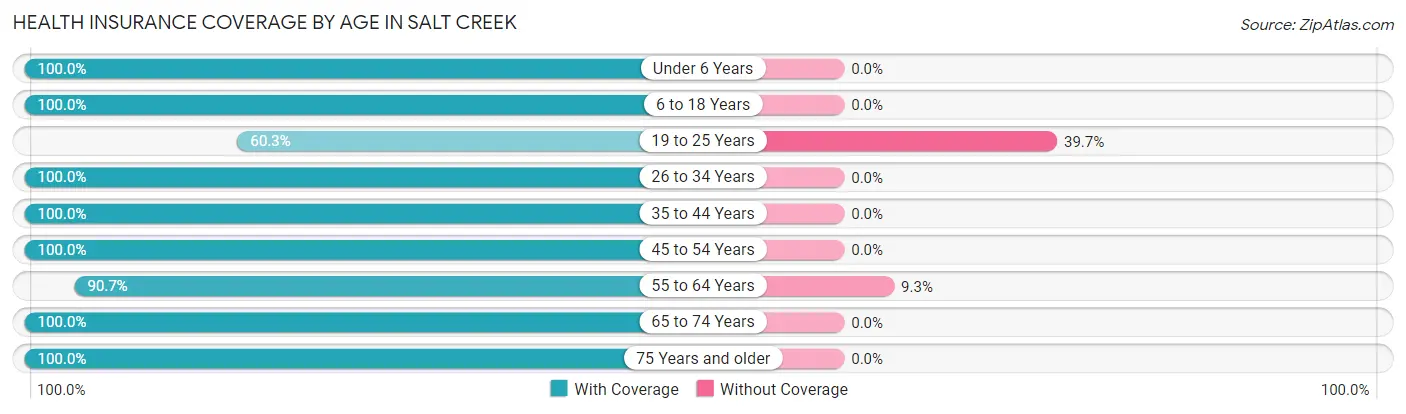
| Age Bracket | With Coverage | Without Coverage |
| Under 6 Years | 54 (100.0%) | 0 (0.0%) |
| 6 to 18 Years | 155 (100.0%) | 0 (0.0%) |
| 19 to 25 Years | 38 (60.3%) | 25 (39.7%) |
| 26 to 34 Years | 97 (100.0%) | 0 (0.0%) |
| 35 to 44 Years | 109 (100.0%) | 0 (0.0%) |
| 45 to 54 Years | 156 (100.0%) | 0 (0.0%) |
| 55 to 64 Years | 78 (90.7%) | 8 (9.3%) |
| 65 to 74 Years | 38 (100.0%) | 0 (0.0%) |
| 75 Years and older | 32 (100.0%) | 0 (0.0%) |
| Total | 757 (95.8%) | 33 (4.2%) |
Health Insurance Coverage by Citizenship Status in Salt Creek

| Citizenship Status | With Coverage | Without Coverage |
| Native Born | 54 (100.0%) | 0 (0.0%) |
| Foreign Born, Citizen | 155 (100.0%) | 0 (0.0%) |
| Foreign Born, not a Citizen | 38 (60.3%) | 25 (39.7%) |
Health Insurance Coverage by Household Income in Salt Creek
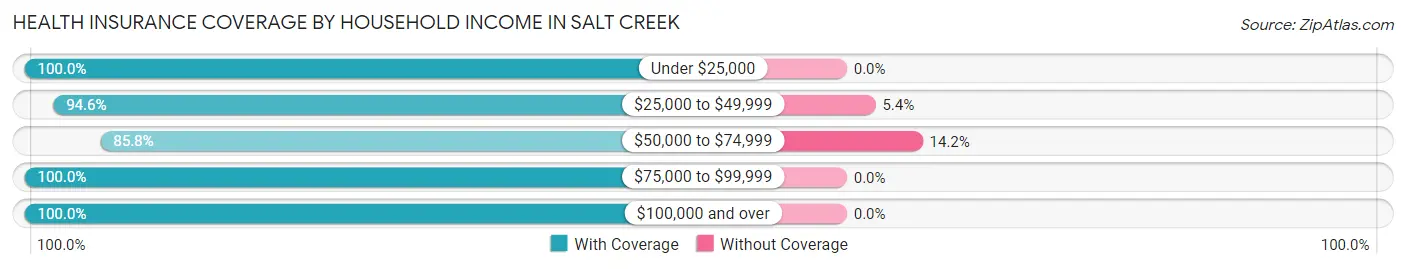
| Household Income | With Coverage | Without Coverage |
| Under $25,000 | 211 (100.0%) | 0 (0.0%) |
| $25,000 to $49,999 | 141 (94.6%) | 8 (5.4%) |
| $50,000 to $74,999 | 151 (85.8%) | 25 (14.2%) |
| $75,000 to $99,999 | 17 (100.0%) | 0 (0.0%) |
| $100,000 and over | 237 (100.0%) | 0 (0.0%) |
Public vs Private Health Insurance Coverage by Age in Salt Creek
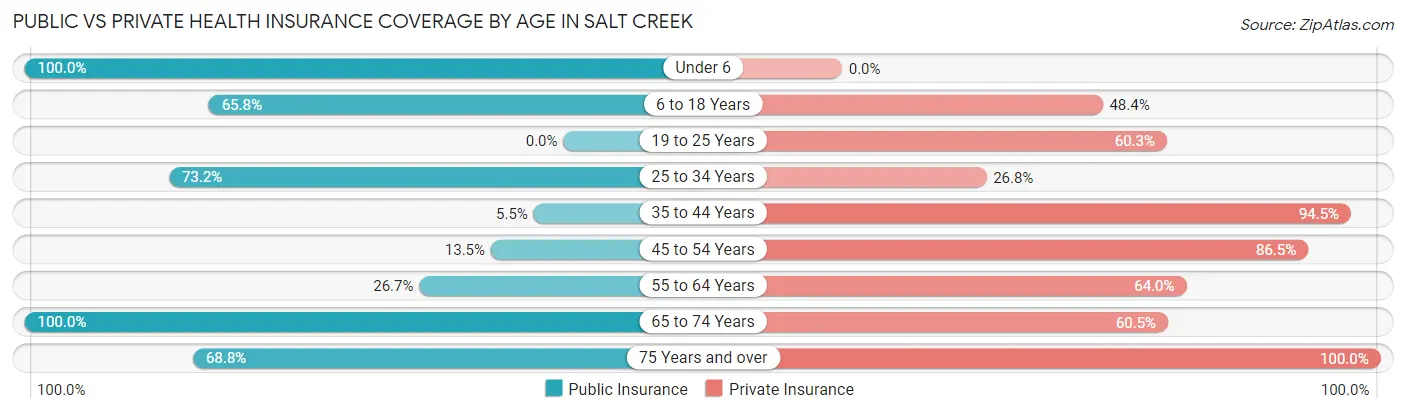
| Age Bracket | Public Insurance | Private Insurance |
| Under 6 | 54 (100.0%) | 0 (0.0%) |
| 6 to 18 Years | 102 (65.8%) | 75 (48.4%) |
| 19 to 25 Years | 0 (0.0%) | 38 (60.3%) |
| 25 to 34 Years | 71 (73.2%) | 26 (26.8%) |
| 35 to 44 Years | 6 (5.5%) | 103 (94.5%) |
| 45 to 54 Years | 21 (13.5%) | 135 (86.5%) |
| 55 to 64 Years | 23 (26.7%) | 55 (63.9%) |
| 65 to 74 Years | 38 (100.0%) | 23 (60.5%) |
| 75 Years and over | 22 (68.8%) | 32 (100.0%) |
| Total | 337 (42.7%) | 487 (61.7%) |
Disability Status by Sex by Age in Salt Creek
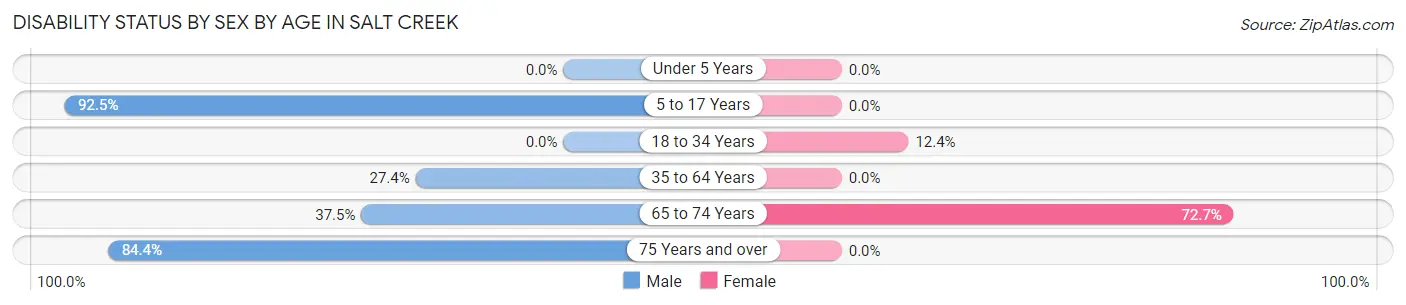
| Age Bracket | Male | Female |
| Under 5 Years | 0 (0.0%) | 0 (0.0%) |
| 5 to 17 Years | 74 (92.5%) | 0 (0.0%) |
| 18 to 34 Years | 0 (0.0%) | 12 (12.4%) |
| 35 to 64 Years | 73 (27.4%) | 0 (0.0%) |
| 65 to 74 Years | 6 (37.5%) | 16 (72.7%) |
| 75 Years and over | 27 (84.4%) | 0 (0.0%) |
Disability Class by Sex by Age in Salt Creek
Disability Class: Hearing Difficulty
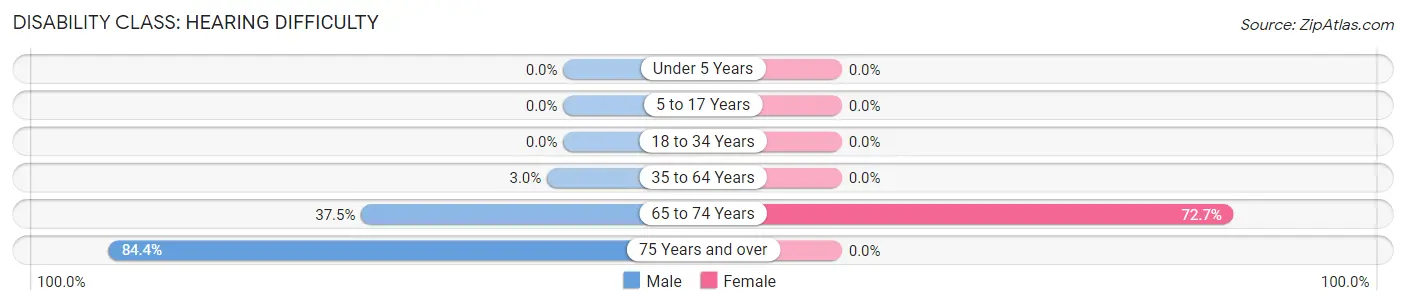
| Age Bracket | Male | Female |
| Under 5 Years | 0 (0.0%) | 0 (0.0%) |
| 5 to 17 Years | 0 (0.0%) | 0 (0.0%) |
| 18 to 34 Years | 0 (0.0%) | 0 (0.0%) |
| 35 to 64 Years | 8 (3.0%) | 0 (0.0%) |
| 65 to 74 Years | 6 (37.5%) | 16 (72.7%) |
| 75 Years and over | 27 (84.4%) | 0 (0.0%) |
Disability Class: Vision Difficulty
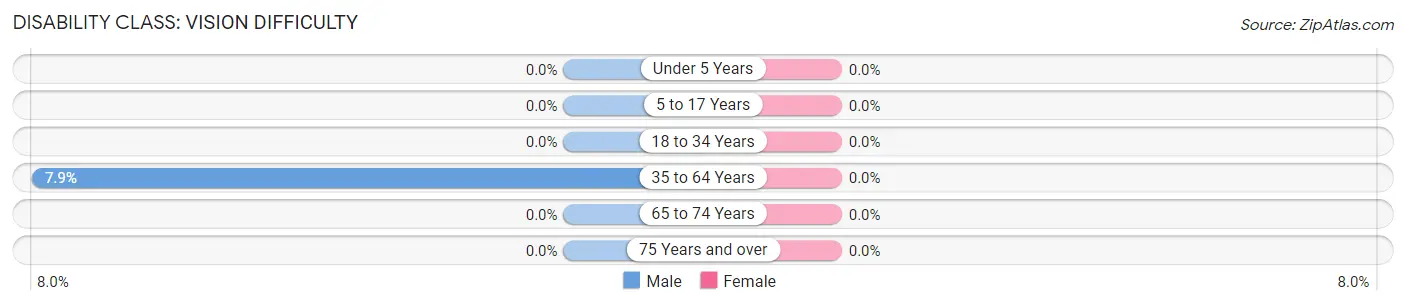
| Age Bracket | Male | Female |
| Under 5 Years | 0 (0.0%) | 0 (0.0%) |
| 5 to 17 Years | 0 (0.0%) | 0 (0.0%) |
| 18 to 34 Years | 0 (0.0%) | 0 (0.0%) |
| 35 to 64 Years | 21 (7.9%) | 0 (0.0%) |
| 65 to 74 Years | 0 (0.0%) | 0 (0.0%) |
| 75 Years and over | 0 (0.0%) | 0 (0.0%) |
Disability Class: Cognitive Difficulty
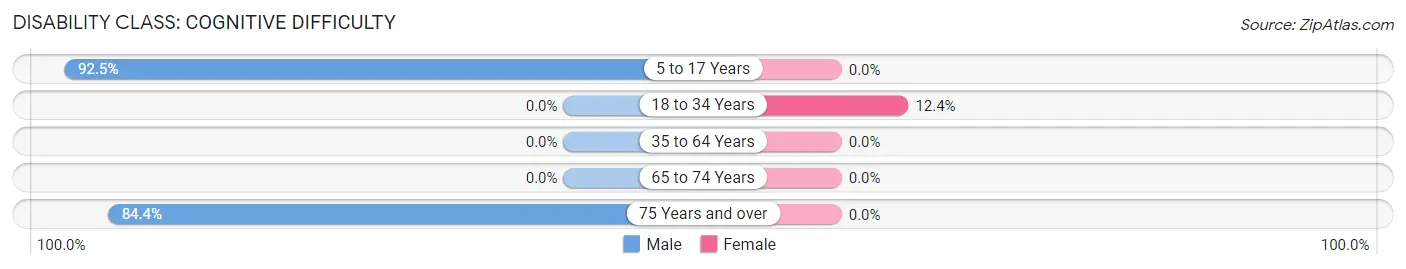
| Age Bracket | Male | Female |
| 5 to 17 Years | 74 (92.5%) | 0 (0.0%) |
| 18 to 34 Years | 0 (0.0%) | 12 (12.4%) |
| 35 to 64 Years | 0 (0.0%) | 0 (0.0%) |
| 65 to 74 Years | 0 (0.0%) | 0 (0.0%) |
| 75 Years and over | 27 (84.4%) | 0 (0.0%) |
Disability Class: Ambulatory Difficulty
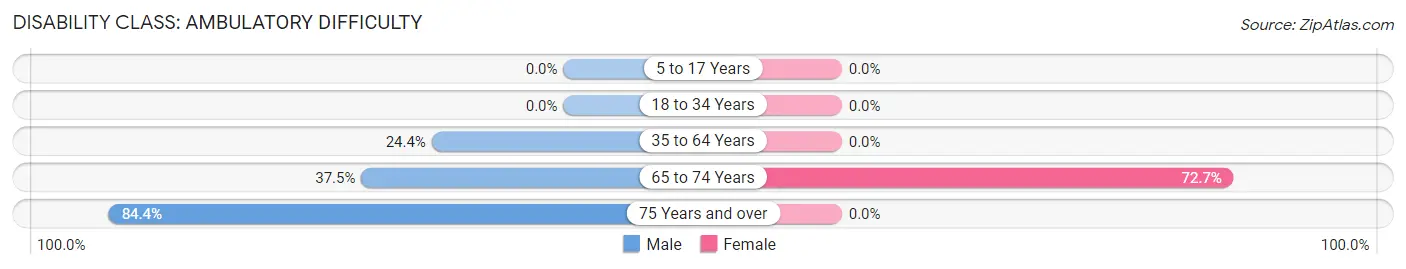
| Age Bracket | Male | Female |
| 5 to 17 Years | 0 (0.0%) | 0 (0.0%) |
| 18 to 34 Years | 0 (0.0%) | 0 (0.0%) |
| 35 to 64 Years | 65 (24.4%) | 0 (0.0%) |
| 65 to 74 Years | 6 (37.5%) | 16 (72.7%) |
| 75 Years and over | 27 (84.4%) | 0 (0.0%) |
Disability Class: Self-Care Difficulty
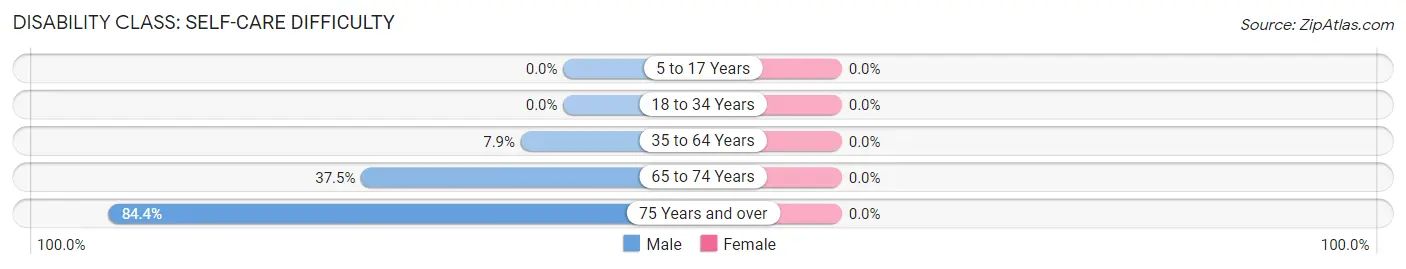
| Age Bracket | Male | Female |
| 5 to 17 Years | 0 (0.0%) | 0 (0.0%) |
| 18 to 34 Years | 0 (0.0%) | 0 (0.0%) |
| 35 to 64 Years | 21 (7.9%) | 0 (0.0%) |
| 65 to 74 Years | 6 (37.5%) | 0 (0.0%) |
| 75 Years and over | 27 (84.4%) | 0 (0.0%) |
Technology Access in Salt Creek
Computing Device Access in Salt Creek
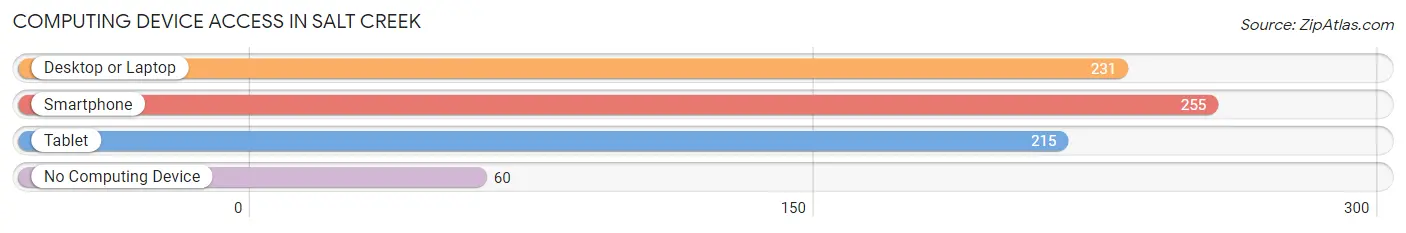
| Device Type | # Households | % Households |
| Desktop or Laptop | 231 | 72.2% |
| Smartphone | 255 | 79.7% |
| Tablet | 215 | 67.2% |
| No Computing Device | 60 | 18.8% |
| Total | 320 | 100.0% |
Internet Access in Salt Creek
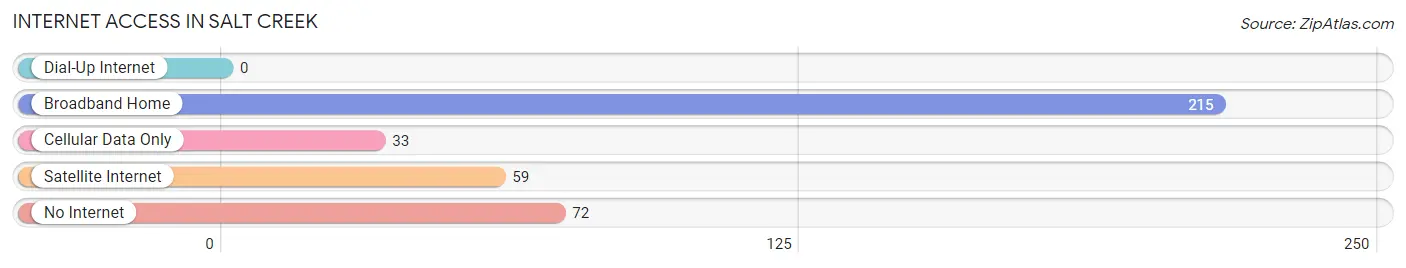
| Internet Type | # Households | % Households |
| Dial-Up Internet | 0 | 0.0% |
| Broadband Home | 215 | 67.2% |
| Cellular Data Only | 33 | 10.3% |
| Satellite Internet | 59 | 18.4% |
| No Internet | 72 | 22.5% |
| Total | 320 | 100.0% |
Salt Creek Summary
Creek History
Salt Creek is a small unincorporated community located in the San Luis Valley of Colorado. It is situated in the northern part of the valley, near the town of Del Norte. The area was first settled in the late 1800s by homesteaders who were attracted to the area by its abundant natural resources. The first settlers were mostly of Spanish descent, and the area was known as “El Rito de los Salitres” or “The Salt Creek.”
The area was originally used for grazing cattle and sheep, and the first settlers built small adobe homes and dug irrigation ditches to water their crops. The area was also known for its abundant wildlife, including deer, elk, and antelope.
In the early 1900s, the area began to attract more settlers, and the town of Salt Creek was established in 1910. The town was named after the creek that ran through it, and it quickly became a popular destination for tourists and outdoor enthusiasts.
The town was home to a variety of businesses, including a general store, a post office, a hotel, and a saloon. The town also had a school, a church, and a cemetery.
In the 1920s, the area began to experience a population boom, and the town of Salt Creek grew rapidly. The town was home to a variety of businesses, including a bank, a movie theater, a bowling alley, and a variety of restaurants.
The town also had a variety of recreational activities, including fishing, hunting, and camping. The area was also known for its natural beauty, and it was a popular destination for photographers and artists.
In the 1950s, the town began to decline in population, and many of the businesses closed. The town was eventually abandoned in the 1970s, and it has remained largely unchanged since then.
Geography
Salt Creek is located in the San Luis Valley of Colorado, in the northern part of the valley. The area is surrounded by mountains, including the Sangre de Cristo Mountains to the east and the San Juan Mountains to the west.
The area is known for its dry climate, with hot summers and cold winters. The average annual temperature is around 50 degrees Fahrenheit, and the average annual precipitation is around 10 inches.
The area is also known for its abundant wildlife, including deer, elk, antelope, and bighorn sheep. The area is also home to a variety of birds, including eagles, hawks, and owls.
Economy
The economy of Salt Creek is largely based on agriculture and tourism. The area is known for its abundant natural resources, including timber, water, and minerals.
The area is also home to a variety of businesses, including a general store, a post office, a hotel, and a saloon. The area is also home to a variety of recreational activities, including fishing, hunting, and camping.
The area is also known for its natural beauty, and it is a popular destination for photographers and artists.
Demographics
As of the 2010 census, the population of Salt Creek was 545. The population is largely of Hispanic or Latino descent, with a small percentage of other ethnicities. The median age of the population is 37.7 years, and the median household income is $31,250.
The area is largely rural, with a few small towns and villages scattered throughout the area. The area is known for its natural beauty, and it is a popular destination for tourists and outdoor enthusiasts.
Conclusion
Salt Creek is a small unincorporated community located in the San Luis Valley of Colorado. It is situated in the northern part of the valley, near the town of Del Norte. The area was first settled in the late 1800s by homesteaders who were attracted to the area by its abundant natural resources. The area is known for its dry climate, with hot summers and cold winters, and its abundant wildlife. The economy of Salt Creek is largely based on agriculture and tourism, and the population is largely of Hispanic or Latino descent. The area is also known for its natural beauty, and it is a popular destination for tourists and outdoor enthusiasts.
Common Questions
What is Per Capita Income in Salt Creek?
Per Capita income in Salt Creek is $27,771.
What is the Median Household income in Salt Creek?
Median Household Income in Salt Creek is $51,731.
What is Income or Wage Gap in Salt Creek?
Income or Wage Gap in Salt Creek is 64.1%.
Women in Salt Creek earn 35.9 cents for every dollar earned by a man.
What is Inequality or Gini Index in Salt Creek?
Inequality or Gini Index in Salt Creek is 0.35.
What is the Total Population of Salt Creek?
Total Population of Salt Creek is 790.
What is the Total Male Population of Salt Creek?
Total Male Population of Salt Creek is 457.
What is the Total Female Population of Salt Creek?
Total Female Population of Salt Creek is 333.
What is the Ratio of Males per 100 Females in Salt Creek?
There are 137.24 Males per 100 Females in Salt Creek.
What is the Ratio of Females per 100 Males in Salt Creek?
There are 72.87 Females per 100 Males in Salt Creek.
What is the Median Population Age in Salt Creek?
Median Population Age in Salt Creek is 38.5 Years.
What is the Average Family Size in Salt Creek
Average Family Size in Salt Creek is 3.1 People.
What is the Average Household Size in Salt Creek
Average Household Size in Salt Creek is 2.5 People.
How Large is the Labor Force in Salt Creek?
There are 481 People in the Labor Forcein in Salt Creek.
What is the Percentage of People in the Labor Force in Salt Creek?
75.2% of People are in the Labor Force in Salt Creek.
What is the Unemployment Rate in Salt Creek?
Unemployment Rate in Salt Creek is 12.3%.