Teton Village, WY Map & Demographics
Teton Village Map
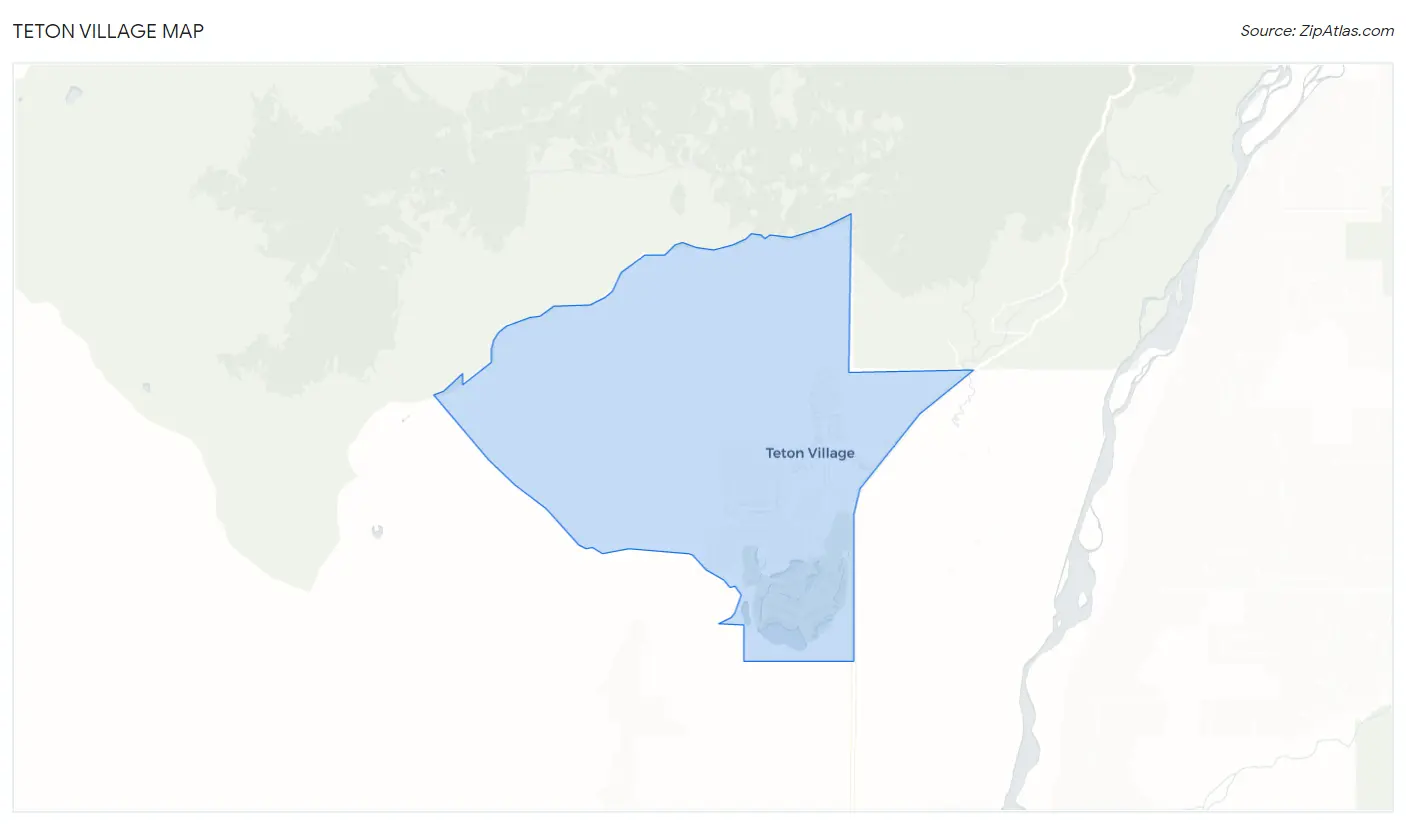
Teton Village Overview
$99,319
PER CAPITA INCOME
$94,132
AVG HOUSEHOLD INCOME
0.61
INEQUALITY / GINI INDEX
906
TOTAL POPULATION
407
MALE POPULATION
499
FEMALE POPULATION
81.56
MALES / 100 FEMALES
122.60
FEMALES / 100 MALES
51.7
MEDIAN AGE
2.8
AVG FAMILY SIZE
1.9
AVG HOUSEHOLD SIZE
583
LABOR FORCE [ PEOPLE ]
70.4%
PERCENT IN LABOR FORCE
0.9%
UNEMPLOYMENT RATE
Teton Village Zip Codes
Teton Village Area Codes
Income in Teton Village
Income Overview in Teton Village
| Characteristic | Number | Measure |
| Per Capita Income | 906 | $99,319 |
| Median Family Income | 224 | $0 |
| Mean Family Income | 224 | $142,320 |
| Median Household Income | 440 | $94,132 |
| Mean Household Income | 440 | $199,792 |
| Income Deficit | 224 | $0 |
| Wage / Income Gap (%) | 906 | 0.00% |
| Wage / Income Gap ($) | 906 | 100.00¢ per $1 |
| Gini / Inequality Index | 906 | 0.61 |
Earnings by Sex in Teton Village
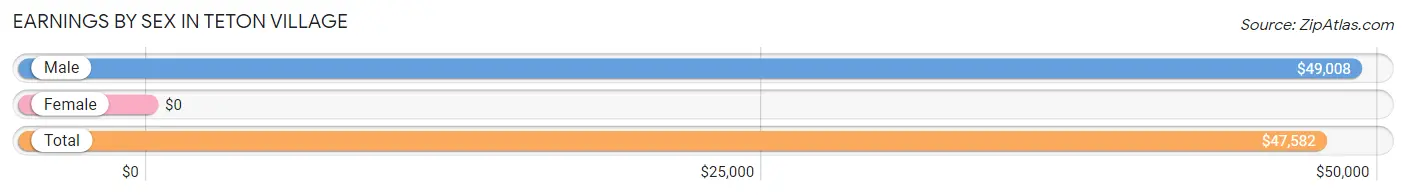
| Sex | Number | Average Earnings |
| Male | 277 (47.1%) | $49,008 |
| Female | 311 (52.9%) | $0 |
| Total | 588 (100.0%) | $47,582 |
Earnings by Sex by Income Bracket in Teton Village
The most common earnings brackets in Teton Village are $45,000 to $49,999 for men (92 | 33.2%) and $22,500 to $24,999 for women (175 | 56.3%).
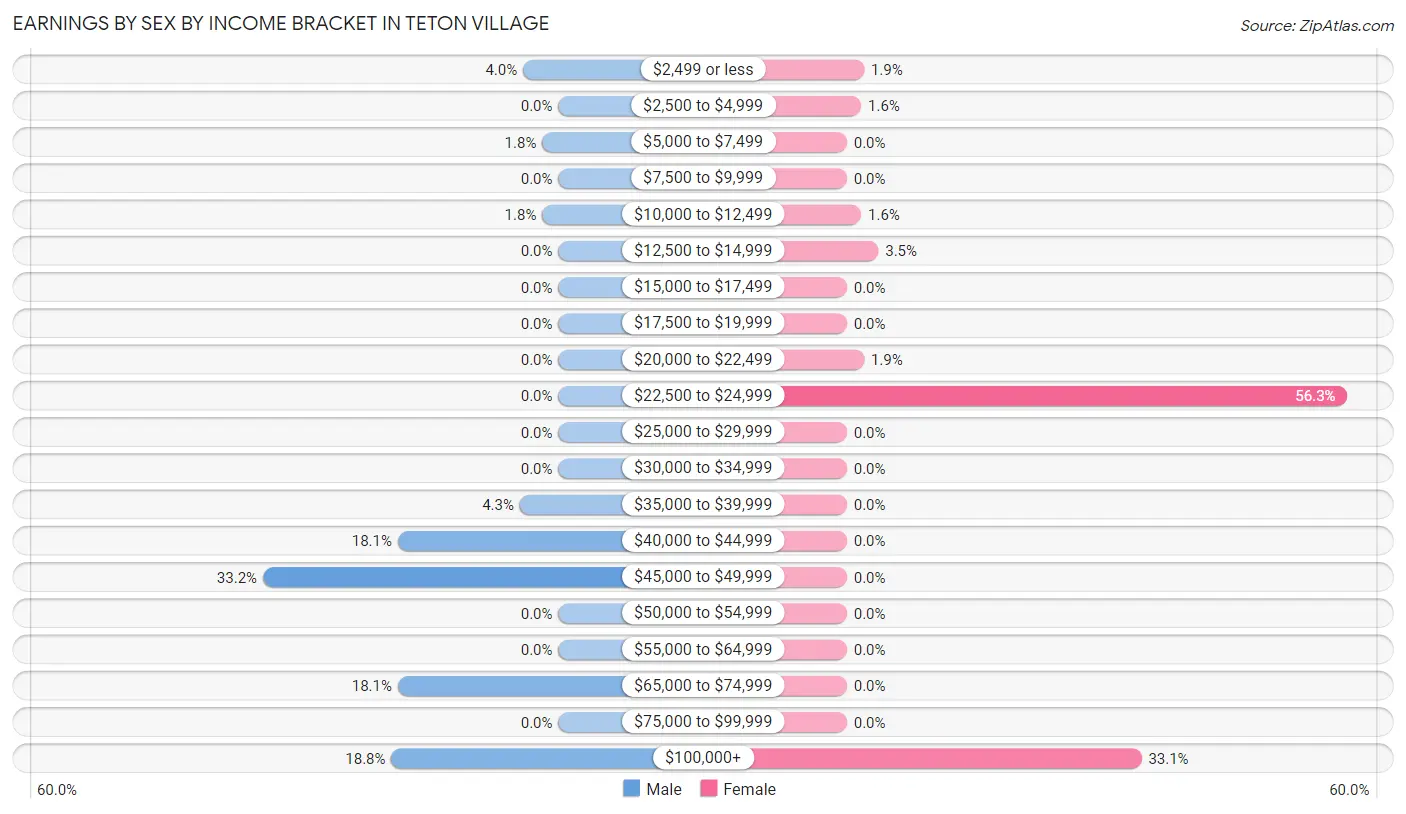
| Income | Male | Female |
| $2,499 or less | 11 (4.0%) | 6 (1.9%) |
| $2,500 to $4,999 | 0 (0.0%) | 5 (1.6%) |
| $5,000 to $7,499 | 5 (1.8%) | 0 (0.0%) |
| $7,500 to $9,999 | 0 (0.0%) | 0 (0.0%) |
| $10,000 to $12,499 | 5 (1.8%) | 5 (1.6%) |
| $12,500 to $14,999 | 0 (0.0%) | 11 (3.5%) |
| $15,000 to $17,499 | 0 (0.0%) | 0 (0.0%) |
| $17,500 to $19,999 | 0 (0.0%) | 0 (0.0%) |
| $20,000 to $22,499 | 0 (0.0%) | 6 (1.9%) |
| $22,500 to $24,999 | 0 (0.0%) | 175 (56.3%) |
| $25,000 to $29,999 | 0 (0.0%) | 0 (0.0%) |
| $30,000 to $34,999 | 0 (0.0%) | 0 (0.0%) |
| $35,000 to $39,999 | 12 (4.3%) | 0 (0.0%) |
| $40,000 to $44,999 | 50 (18.0%) | 0 (0.0%) |
| $45,000 to $49,999 | 92 (33.2%) | 0 (0.0%) |
| $50,000 to $54,999 | 0 (0.0%) | 0 (0.0%) |
| $55,000 to $64,999 | 0 (0.0%) | 0 (0.0%) |
| $65,000 to $74,999 | 50 (18.0%) | 0 (0.0%) |
| $75,000 to $99,999 | 0 (0.0%) | 0 (0.0%) |
| $100,000+ | 52 (18.8%) | 103 (33.1%) |
| Total | 277 (100.0%) | 311 (100.0%) |
Earnings by Sex by Educational Attainment in Teton Village
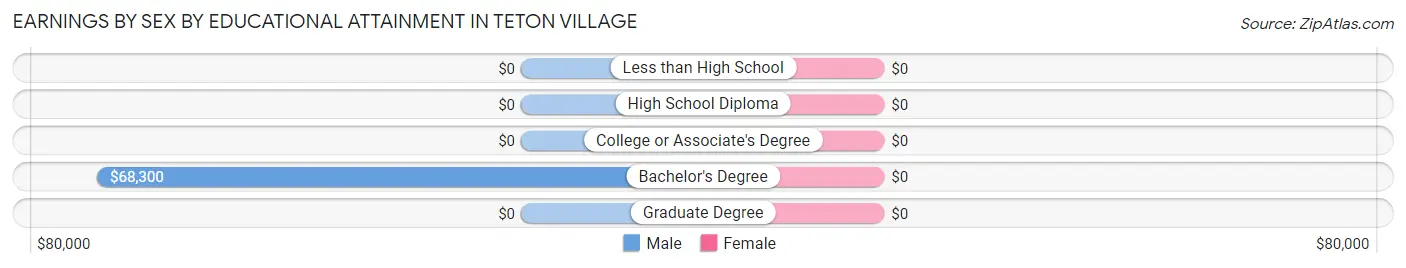
| Educational Attainment | Male Income | Female Income |
| Less than High School | - | - |
| High School Diploma | - | - |
| College or Associate's Degree | - | - |
| Bachelor's Degree | $68,300 | $0 |
| Graduate Degree | - | - |
| Total | $49,457 | $0 |
Family Income in Teton Village
Family Income Brackets in Teton Village
According to the Teton Village family income data, there are 72 families falling into the $75,000 to $99,999 income range, which is the most common income bracket and makes up 32.1% of all families.
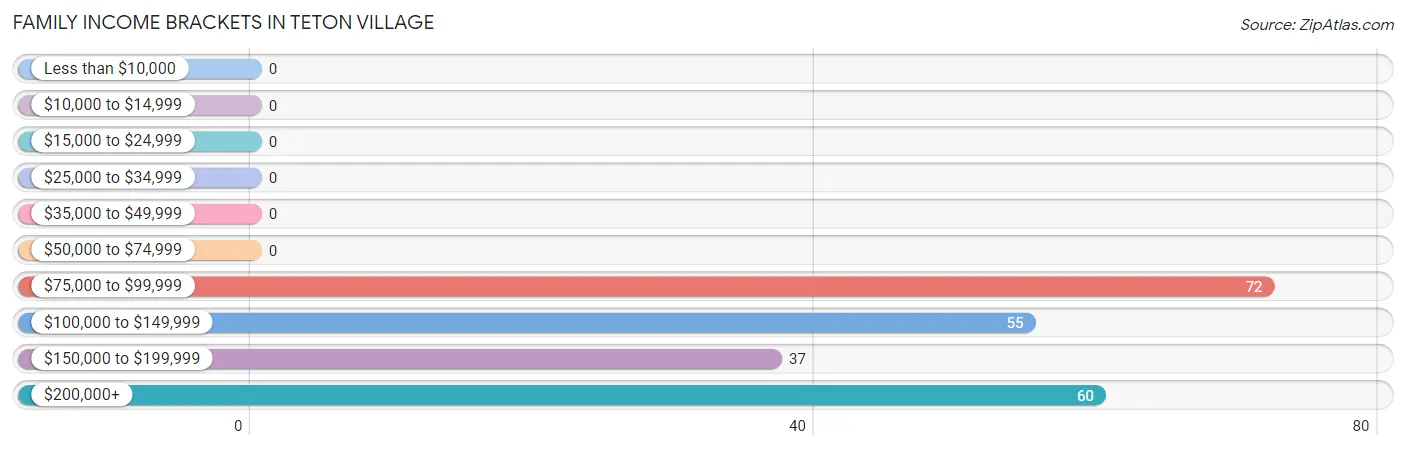
| Income Bracket | # Families | % Families |
| Less than $10,000 | 0 | 0.0% |
| $10,000 to $14,999 | 0 | 0.0% |
| $15,000 to $24,999 | 0 | 0.0% |
| $25,000 to $34,999 | 0 | 0.0% |
| $35,000 to $49,999 | 0 | 0.0% |
| $50,000 to $74,999 | 0 | 0.0% |
| $75,000 to $99,999 | 72 | 32.1% |
| $100,000 to $149,999 | 55 | 24.6% |
| $150,000 to $199,999 | 37 | 16.5% |
| $200,000+ | 60 | 26.8% |
Family Income by Famaliy Size in Teton Village
2-person families (164 | 73.2%) account for the highest median family income in Teton Village with $107,955 per family, while 2-person families (164 | 73.2%) have the highest median income of $53,978 per family member.
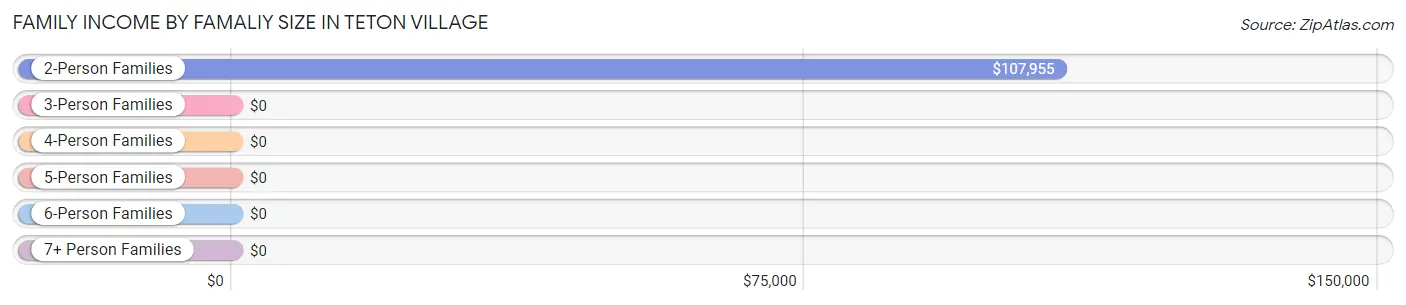
| Income Bracket | # Families | Median Income |
| 2-Person Families | 164 (73.2%) | $107,955 |
| 3-Person Families | 0 (0.0%) | $0 |
| 4-Person Families | 60 (26.8%) | $0 |
| 5-Person Families | 0 (0.0%) | $0 |
| 6-Person Families | 0 (0.0%) | $0 |
| 7+ Person Families | 0 (0.0%) | $0 |
| Total | 224 (100.0%) | $0 |
Family Income by Number of Earners in Teton Village
| Number of Earners | # Families | Median Income |
| No Earners | 92 (41.1%) | $0 |
| 1 Earner | 0 (0.0%) | $0 |
| 2 Earners | 132 (58.9%) | $0 |
| 3+ Earners | 0 (0.0%) | $0 |
| Total | 224 (100.0%) | $0 |
Household Income in Teton Village
Household Income Brackets in Teton Village
With 103 households falling in the category, the $200,000+ income range is the most frequent in Teton Village, accounting for 23.4% of all households.
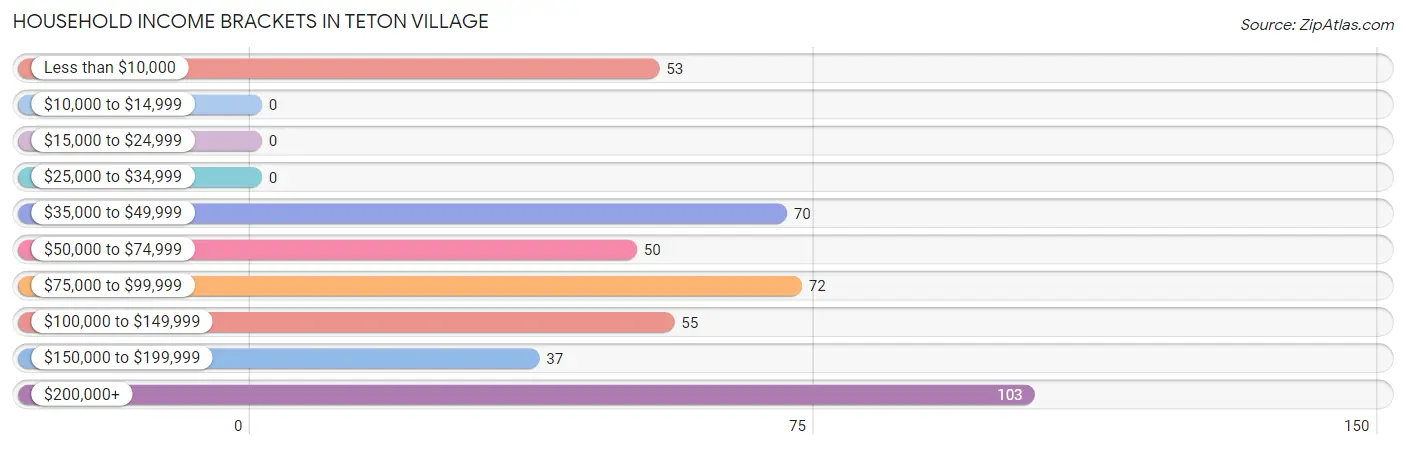
| Income Bracket | # Households | % Households |
| Less than $10,000 | 53 | 12.0% |
| $10,000 to $14,999 | 0 | 0.0% |
| $15,000 to $24,999 | 0 | 0.0% |
| $25,000 to $34,999 | 0 | 0.0% |
| $35,000 to $49,999 | 70 | 15.9% |
| $50,000 to $74,999 | 50 | 11.4% |
| $75,000 to $99,999 | 72 | 16.4% |
| $100,000 to $149,999 | 55 | 12.5% |
| $150,000 to $199,999 | 37 | 8.4% |
| $200,000+ | 103 | 23.4% |
Household Income by Householder Age in Teton Village
| Income Bracket | # Households | Median Income |
| 15 to 24 Years | 43 (9.8%) | $0 |
| 25 to 44 Years | 50 (11.4%) | $0 |
| 45 to 64 Years | 255 (58.0%) | $0 |
| 65+ Years | 92 (20.9%) | $0 |
| Total | 440 (100.0%) | $94,132 |
Poverty in Teton Village
Income Below Poverty by Sex and Age in Teton Village
With 6.6% poverty level for males and 16.0% for females among the residents of Teton Village, 18 to 24 year old males and 55 to 64 year old females are the most vulnerable to poverty, with 27 males (69.2%) and 53 females (100.0%) in their respective age groups living below the poverty level.
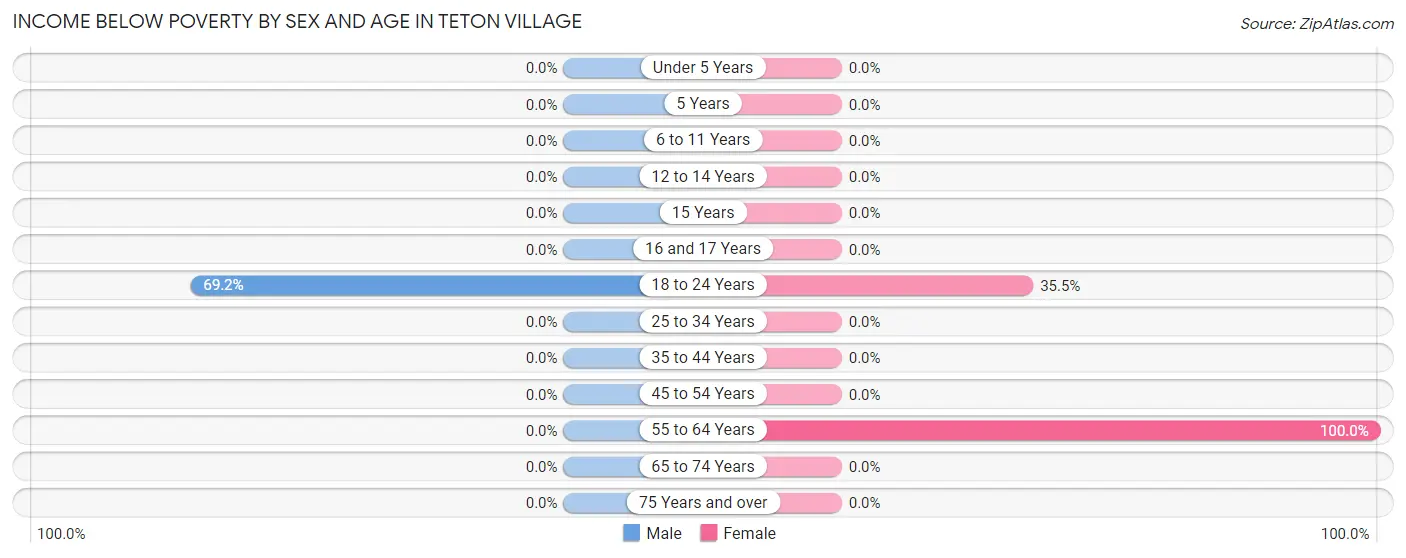
| Age Bracket | Male | Female |
| Under 5 Years | 0 (0.0%) | 0 (0.0%) |
| 5 Years | 0 (0.0%) | 0 (0.0%) |
| 6 to 11 Years | 0 (0.0%) | 0 (0.0%) |
| 12 to 14 Years | 0 (0.0%) | 0 (0.0%) |
| 15 Years | 0 (0.0%) | 0 (0.0%) |
| 16 and 17 Years | 0 (0.0%) | 0 (0.0%) |
| 18 to 24 Years | 27 (69.2%) | 27 (35.5%) |
| 25 to 34 Years | 0 (0.0%) | 0 (0.0%) |
| 35 to 44 Years | 0 (0.0%) | 0 (0.0%) |
| 45 to 54 Years | 0 (0.0%) | 0 (0.0%) |
| 55 to 64 Years | 0 (0.0%) | 53 (100.0%) |
| 65 to 74 Years | 0 (0.0%) | 0 (0.0%) |
| 75 Years and over | 0 (0.0%) | 0 (0.0%) |
| Total | 27 (6.6%) | 80 (16.0%) |
Income Above Poverty by Sex and Age in Teton Village
According to the poverty statistics in Teton Village, males aged 6 to 11 years and females aged 12 to 14 years are the age groups that are most secure financially, with 100.0% of males and 100.0% of females in these age groups living above the poverty line.
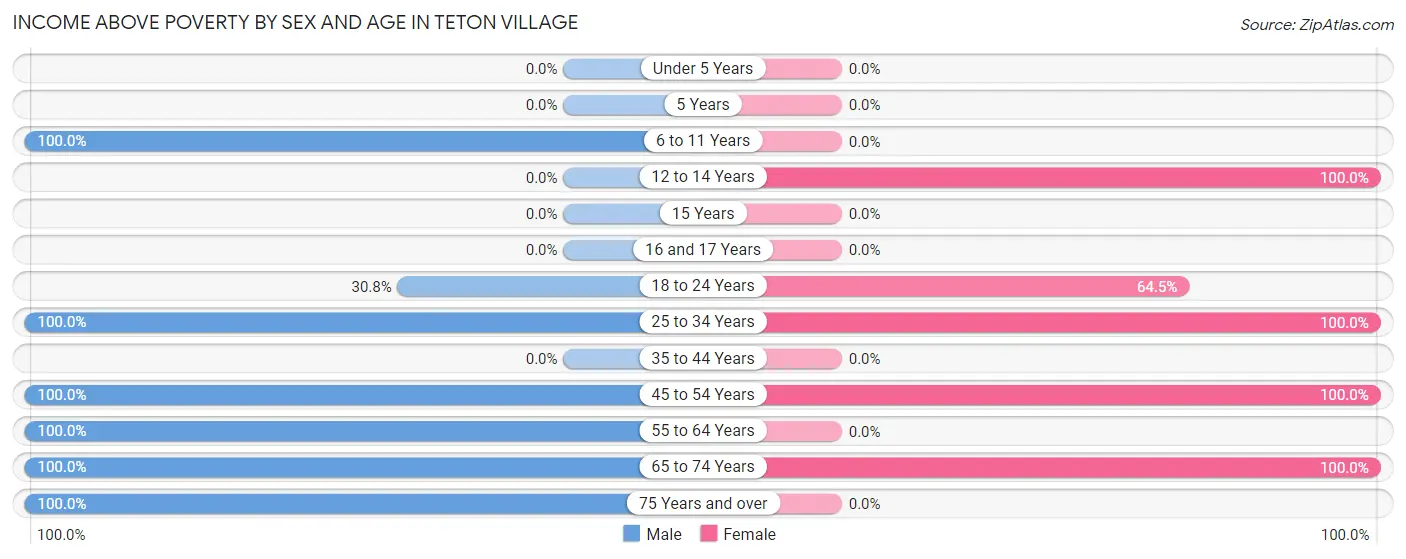
| Age Bracket | Male | Female |
| Under 5 Years | 0 (0.0%) | 0 (0.0%) |
| 5 Years | 0 (0.0%) | 0 (0.0%) |
| 6 to 11 Years | 32 (100.0%) | 0 (0.0%) |
| 12 to 14 Years | 0 (0.0%) | 46 (100.0%) |
| 15 Years | 0 (0.0%) | 0 (0.0%) |
| 16 and 17 Years | 0 (0.0%) | 0 (0.0%) |
| 18 to 24 Years | 12 (30.8%) | 49 (64.5%) |
| 25 to 34 Years | 50 (100.0%) | 175 (100.0%) |
| 35 to 44 Years | 0 (0.0%) | 0 (0.0%) |
| 45 to 54 Years | 102 (100.0%) | 60 (100.0%) |
| 55 to 64 Years | 92 (100.0%) | 0 (0.0%) |
| 65 to 74 Years | 55 (100.0%) | 89 (100.0%) |
| 75 Years and over | 37 (100.0%) | 0 (0.0%) |
| Total | 380 (93.4%) | 419 (84.0%) |
Income Below Poverty Among Married-Couple Families in Teton Village
| Children | Above Poverty | Below Poverty |
| No Children | 92 (100.0%) | 0 (0.0%) |
| 1 or 2 Children | 60 (100.0%) | 0 (0.0%) |
| 3 or 4 Children | 0 (0.0%) | 0 (0.0%) |
| 5 or more Children | 0 (0.0%) | 0 (0.0%) |
| Total | 152 (100.0%) | 0 (0.0%) |
Income Below Poverty Among Single-Parent Households in Teton Village
| Children | Single Father | Single Mother |
| No Children | 0 (0.0%) | 0 (0.0%) |
| 1 or 2 Children | 0 (0.0%) | 0 (0.0%) |
| 3 or 4 Children | 0 (0.0%) | 0 (0.0%) |
| 5 or more Children | 0 (0.0%) | 0 (0.0%) |
| Total | 0 (0.0%) | 0 (0.0%) |
Income Below Poverty Among Married-Couple vs Single-Parent Households in Teton Village
| Children | Married-Couple Families | Single-Parent Households |
| No Children | 0 (0.0%) | 0 (0.0%) |
| 1 or 2 Children | 0 (0.0%) | 0 (0.0%) |
| 3 or 4 Children | 0 (0.0%) | 0 (0.0%) |
| 5 or more Children | 0 (0.0%) | 0 (0.0%) |
| Total | 0 (0.0%) | 0 (0.0%) |
Race in Teton Village
The most populous races in Teton Village are White / Caucasian (858 | 94.7%), Hispanic or Latino (54 | 6.0%), and Some other Race (48 | 5.3%).
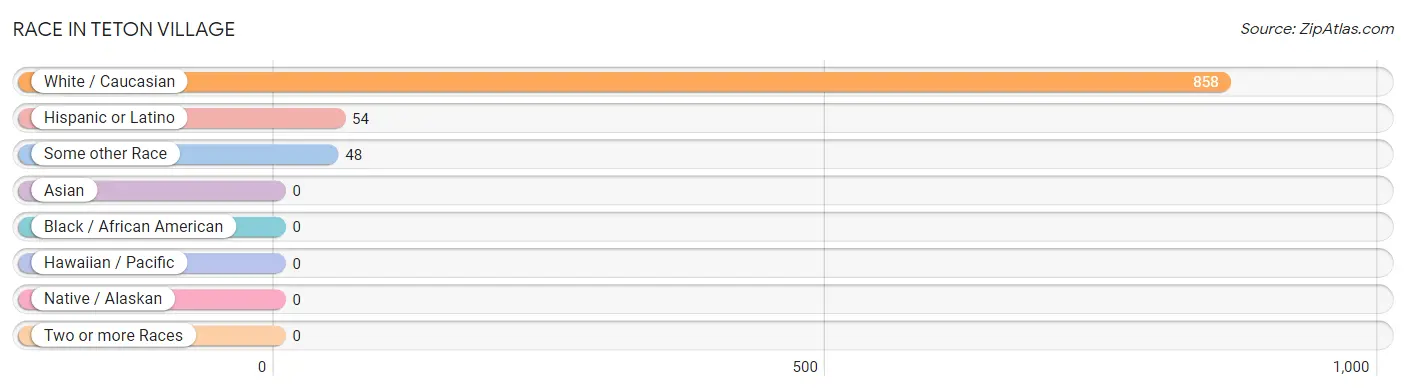
| Race | # Population | % Population |
| Asian | 0 | 0.0% |
| Black / African American | 0 | 0.0% |
| Hawaiian / Pacific | 0 | 0.0% |
| Hispanic or Latino | 54 | 6.0% |
| Native / Alaskan | 0 | 0.0% |
| White / Caucasian | 858 | 94.7% |
| Two or more Races | 0 | 0.0% |
| Some other Race | 48 | 5.3% |
| Total | 906 | 100.0% |
Ancestry in Teton Village
The most populous ancestries reported in Teton Village are English (346 | 38.2%), Irish (256 | 28.3%), Scottish (144 | 15.9%), German (139 | 15.3%), and Italian (70 | 7.7%), together accounting for 105.4% of all Teton Village residents.
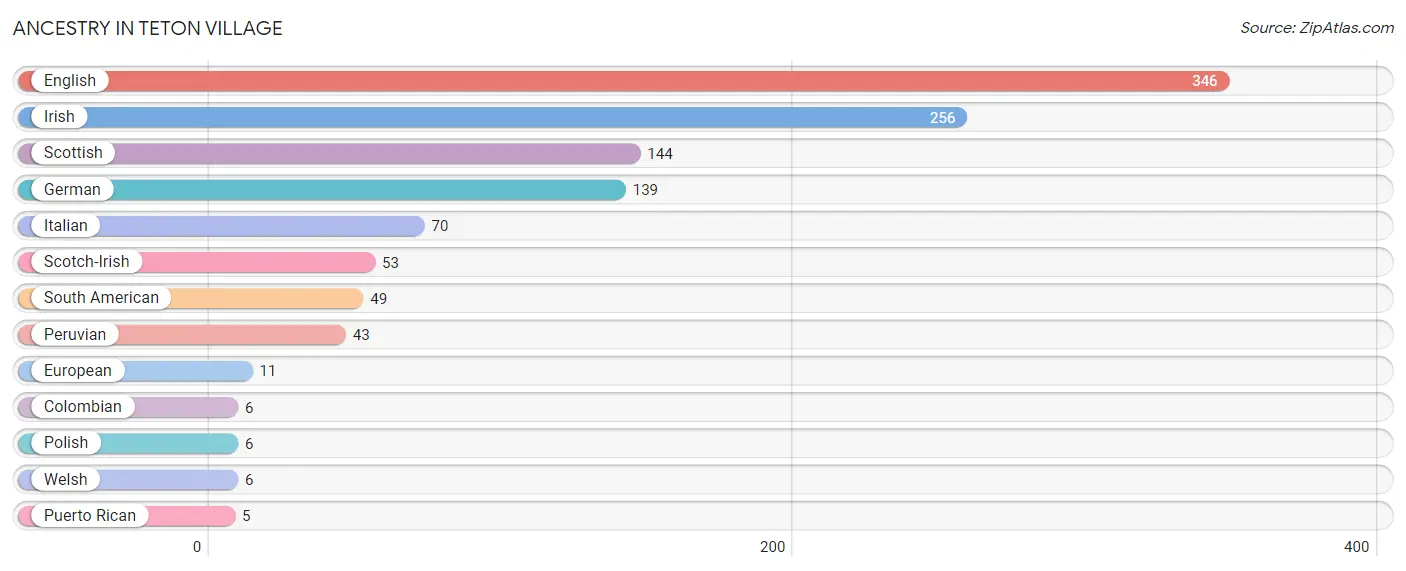
| Ancestry | # Population | % Population |
| Colombian | 6 | 0.7% |
| English | 346 | 38.2% |
| European | 11 | 1.2% |
| German | 139 | 15.3% |
| Irish | 256 | 28.3% |
| Italian | 70 | 7.7% |
| Peruvian | 43 | 4.8% |
| Polish | 6 | 0.7% |
| Puerto Rican | 5 | 0.5% |
| Scotch-Irish | 53 | 5.9% |
| Scottish | 144 | 15.9% |
| South American | 49 | 5.4% |
| Welsh | 6 | 0.7% | View All 13 Rows |
Immigrants in Teton Village
The most numerous immigrant groups reported in Teton Village came from Latin America (48 | 5.3%), Peru (43 | 4.8%), South America (43 | 4.8%), Central America (5 | 0.5%), and Mexico (5 | 0.5%), together accounting for 15.9% of all Teton Village residents.
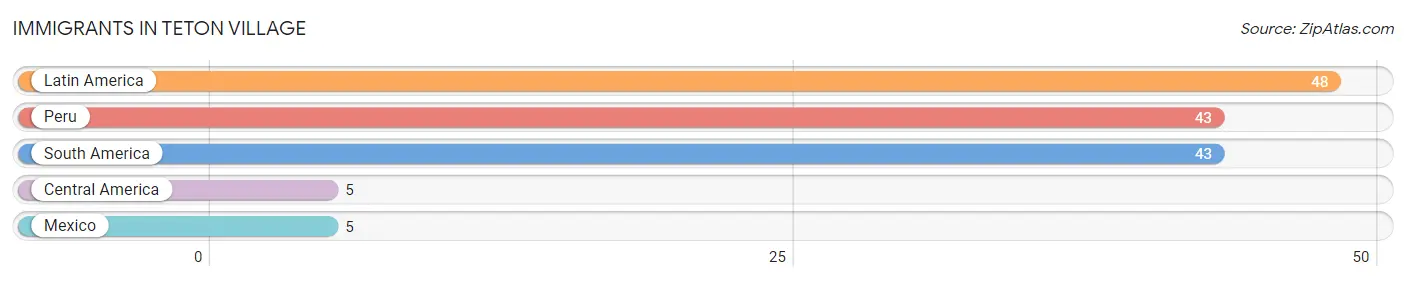
| Immigration Origin | # Population | % Population |
| Central America | 5 | 0.5% |
| Latin America | 48 | 5.3% |
| Mexico | 5 | 0.5% |
| Peru | 43 | 4.8% |
| South America | 43 | 4.8% | View All 5 Rows |
Sex and Age in Teton Village
Sex and Age in Teton Village
The most populous age groups in Teton Village are 50 to 54 Years (102 | 25.1%) for men and 25 to 29 Years (175 | 35.1%) for women.
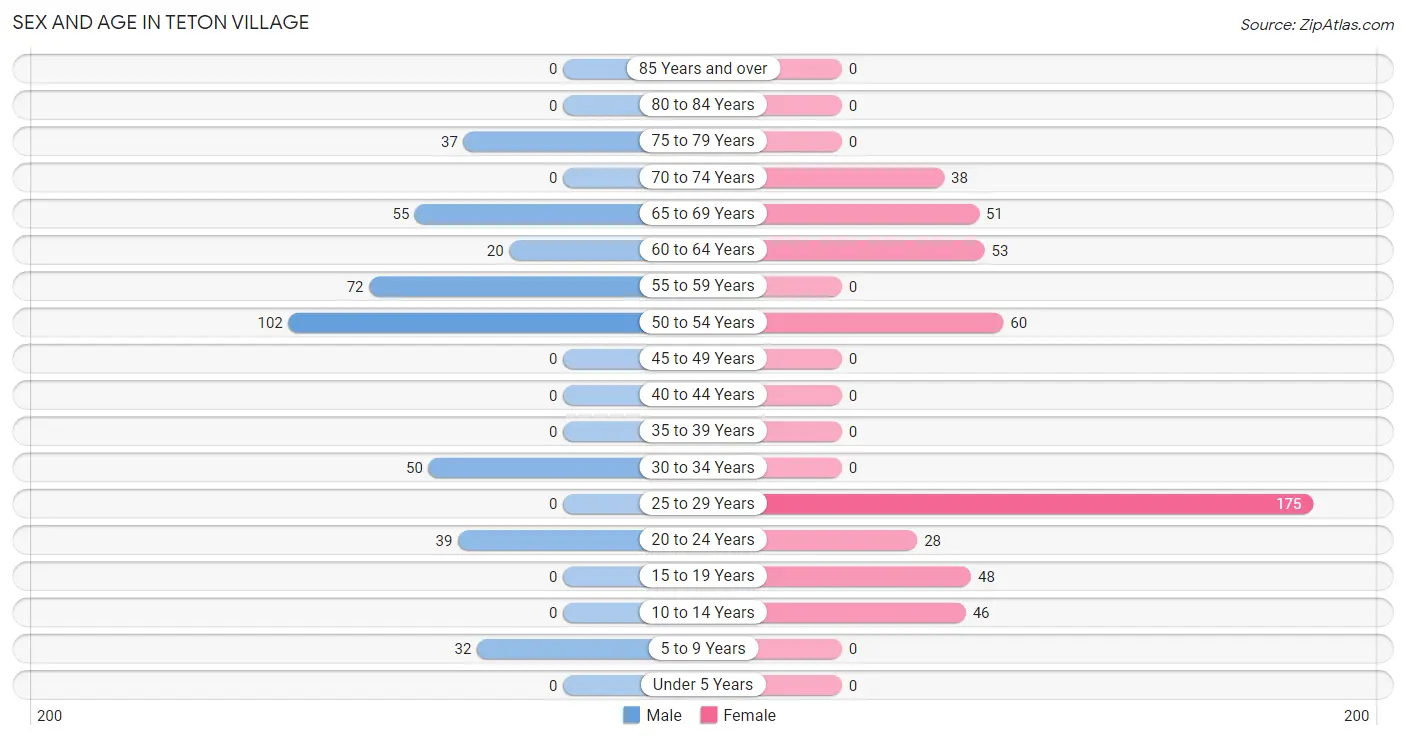
| Age Bracket | Male | Female |
| Under 5 Years | 0 (0.0%) | 0 (0.0%) |
| 5 to 9 Years | 32 (7.9%) | 0 (0.0%) |
| 10 to 14 Years | 0 (0.0%) | 46 (9.2%) |
| 15 to 19 Years | 0 (0.0%) | 48 (9.6%) |
| 20 to 24 Years | 39 (9.6%) | 28 (5.6%) |
| 25 to 29 Years | 0 (0.0%) | 175 (35.1%) |
| 30 to 34 Years | 50 (12.3%) | 0 (0.0%) |
| 35 to 39 Years | 0 (0.0%) | 0 (0.0%) |
| 40 to 44 Years | 0 (0.0%) | 0 (0.0%) |
| 45 to 49 Years | 0 (0.0%) | 0 (0.0%) |
| 50 to 54 Years | 102 (25.1%) | 60 (12.0%) |
| 55 to 59 Years | 72 (17.7%) | 0 (0.0%) |
| 60 to 64 Years | 20 (4.9%) | 53 (10.6%) |
| 65 to 69 Years | 55 (13.5%) | 51 (10.2%) |
| 70 to 74 Years | 0 (0.0%) | 38 (7.6%) |
| 75 to 79 Years | 37 (9.1%) | 0 (0.0%) |
| 80 to 84 Years | 0 (0.0%) | 0 (0.0%) |
| 85 Years and over | 0 (0.0%) | 0 (0.0%) |
| Total | 407 (100.0%) | 499 (100.0%) |
Families and Households in Teton Village
Median Family Size in Teton Village
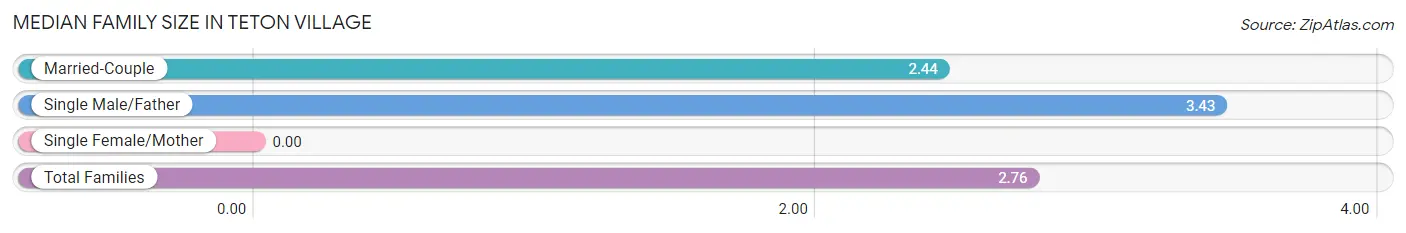
| Family Type | # Families | Family Size |
| Married-Couple | 152 (67.9%) | 2.44 |
| Single Male/Father | 72 (32.1%) | 3.43 |
| Single Female/Mother | 0 (0.0%) | - |
| Total Families | 224 (100.0%) | 2.76 |
Median Household Size in Teton Village
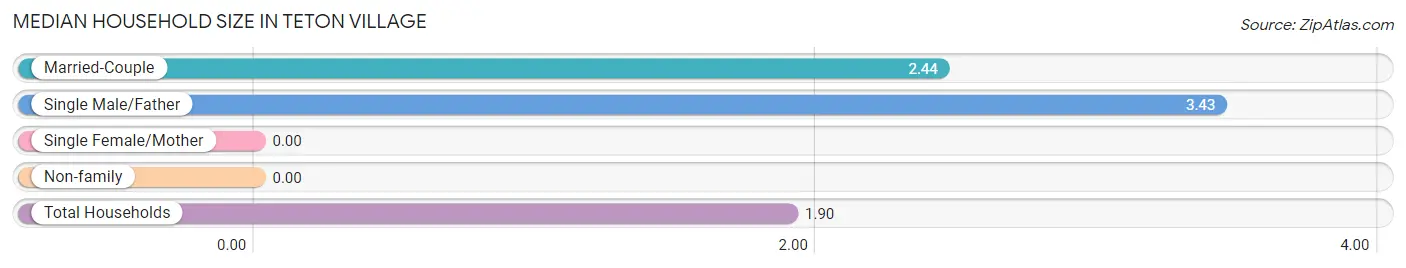
| Household Type | # Households | Household Size |
| Married-Couple | 152 (34.5%) | 2.44 |
| Single Male/Father | 72 (16.4%) | 3.43 |
| Single Female/Mother | 0 (0.0%) | - |
| Non-family | 216 (49.1%) | - |
| Total Households | 440 (100.0%) | 1.90 |
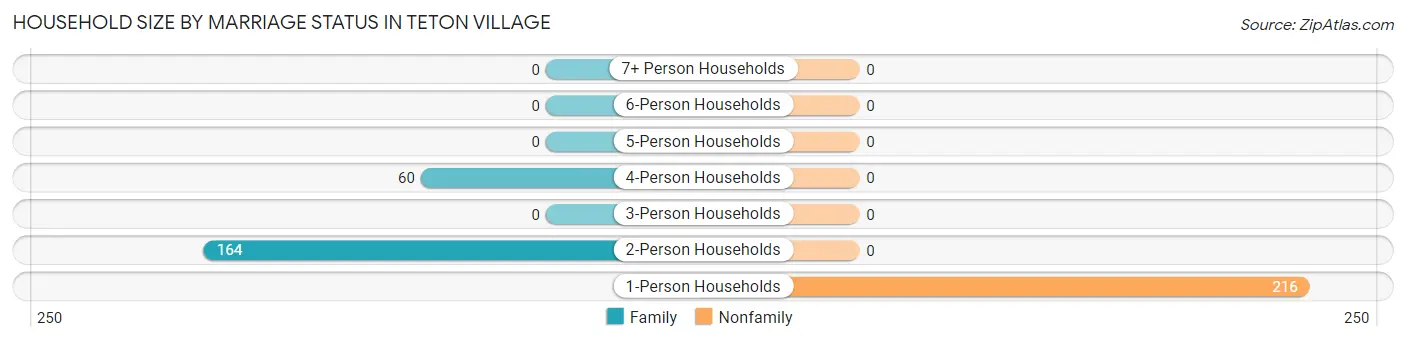
Household Size by Marriage Status in Teton Village
Out of a total of 440 households in Teton Village, 224 (50.9%) are family households, while 216 (49.1%) are nonfamily households. The most numerous type of family households are 2-person households, comprising 164, and the most common type of nonfamily households are 1-person households, comprising 216.
| Household Size | Family Households | Nonfamily Households |
| 1-Person Households | - | 216 (49.1%) |
| 2-Person Households | 164 (37.3%) | 0 (0.0%) |
| 3-Person Households | 0 (0.0%) | 0 (0.0%) |
| 4-Person Households | 60 (13.6%) | 0 (0.0%) |
| 5-Person Households | 0 (0.0%) | 0 (0.0%) |
| 6-Person Households | 0 (0.0%) | 0 (0.0%) |
| 7+ Person Households | 0 (0.0%) | 0 (0.0%) |
| Total | 224 (50.9%) | 216 (49.1%) |
Female Fertility in Teton Village
Fertility by Age in Teton Village
| Age Bracket | Women with Births | Births / 1,000 Women |
| 15 to 19 years | 0 (0.0%) | 0.0 |
| 20 to 34 years | 0 (0.0%) | 0.0 |
| 35 to 50 years | 0 (0.0%) | 0.0 |
| Total | 0 (0.0%) | 0.0 |
Fertility by Age by Marriage Status in Teton Village
| Age Bracket | Married | Unmarried |
| 15 to 19 years | 0 (0.0%) | 0 (0.0%) |
| 20 to 34 years | 0 (0.0%) | 0 (0.0%) |
| 35 to 50 years | 0 (0.0%) | 0 (0.0%) |
| Total | 0 (0.0%) | 0 (0.0%) |
Fertility by Education in Teton Village
| Educational Attainment | Women with Births | Births / 1,000 Women |
| Less than High School | 0 (0.0%) | 0.0 |
| High School Diploma | 0 (0.0%) | 0.0 |
| College or Associate's Degree | 0 (0.0%) | 0.0 |
| Bachelor's Degree | 0 (0.0%) | 0.0 |
| Graduate Degree | 0 (0.0%) | 0.0 |
| Total | 0 (0.0%) | 0.0 |
Fertility by Education by Marriage Status in Teton Village
| Educational Attainment | Married | Unmarried |
| Less than High School | 0 (0.0%) | 0 (0.0%) |
| High School Diploma | 0 (0.0%) | 0 (0.0%) |
| College or Associate's Degree | 0 (0.0%) | 0 (0.0%) |
| Bachelor's Degree | 0 (0.0%) | 0 (0.0%) |
| Graduate Degree | 0 (0.0%) | 0 (0.0%) |
| Total | 0 (0.0%) | 0 (0.0%) |
Employment Characteristics in Teton Village
Employment by Class of Employer in Teton Village
Among the 578 employed individuals in Teton Village, private company employees (231 | 40.0%), not-for-profit organizations (175 | 30.3%), and self-employed (incorporated) (102 | 17.6%) make up the most common classes of employment.
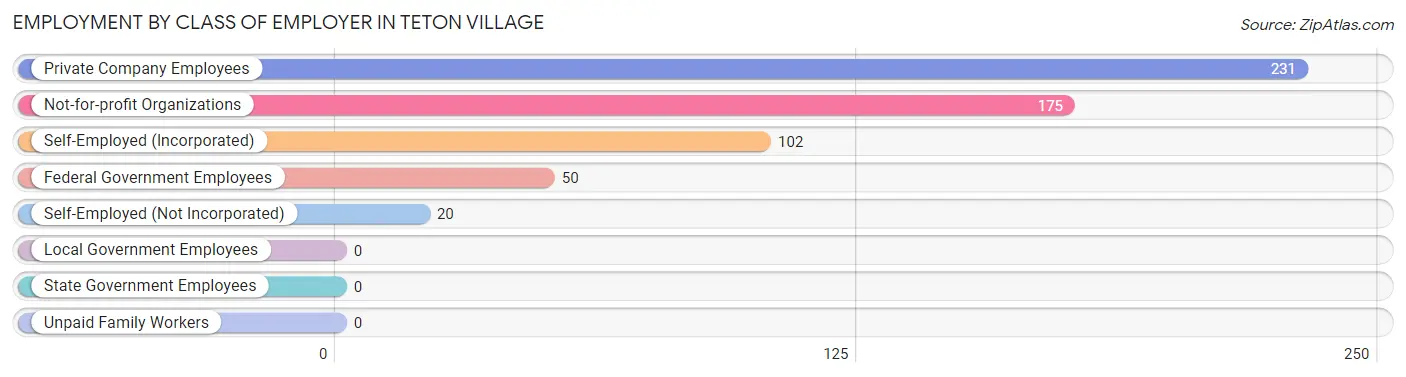
| Employer Class | # Employees | % Employees |
| Private Company Employees | 231 | 40.0% |
| Self-Employed (Incorporated) | 102 | 17.6% |
| Self-Employed (Not Incorporated) | 20 | 3.5% |
| Not-for-profit Organizations | 175 | 30.3% |
| Local Government Employees | 0 | 0.0% |
| State Government Employees | 0 | 0.0% |
| Federal Government Employees | 50 | 8.6% |
| Unpaid Family Workers | 0 | 0.0% |
| Total | 578 | 100.0% |
Employment Status by Age in Teton Village
According to the labor force statistics for Teton Village, out of the total population over 16 years of age (828), 70.4% or 583 individuals are in the labor force, with 0.9% or 5 of them unemployed. The age group with the highest labor force participation rate is 16 to 19 years, with 100.0% or 48 individuals in the labor force. Within the labor force, the 20 to 24 years age range has the highest percentage of unemployed individuals, with 8.9% or 5 of them being unemployed.
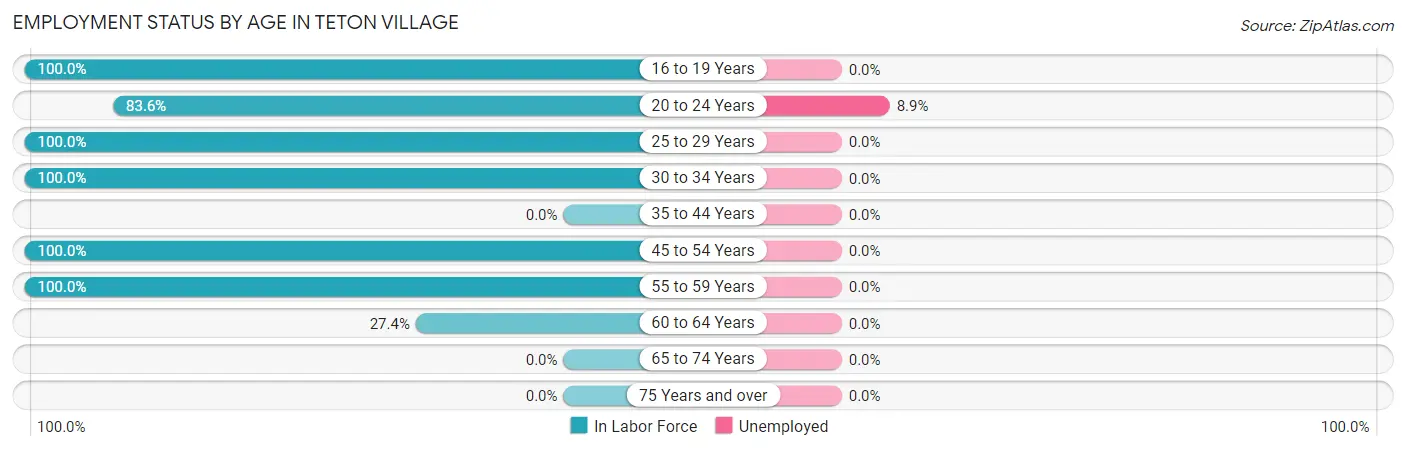
| Age Bracket | In Labor Force | Unemployed |
| 16 to 19 Years | 48 (100.0%) | 0 (0.0%) |
| 20 to 24 Years | 56 (83.6%) | 5 (8.9%) |
| 25 to 29 Years | 175 (100.0%) | 0 (0.0%) |
| 30 to 34 Years | 50 (100.0%) | 0 (0.0%) |
| 35 to 44 Years | 0 (0.0%) | 0 (0.0%) |
| 45 to 54 Years | 162 (100.0%) | 0 (0.0%) |
| 55 to 59 Years | 72 (100.0%) | 0 (0.0%) |
| 60 to 64 Years | 20 (27.4%) | 0 (0.0%) |
| 65 to 74 Years | 0 (0.0%) | 0 (0.0%) |
| 75 Years and over | 0 (0.0%) | 0 (0.0%) |
| Total | 583 (70.4%) | 5 (0.9%) |
Employment Status by Educational Attainment in Teton Village
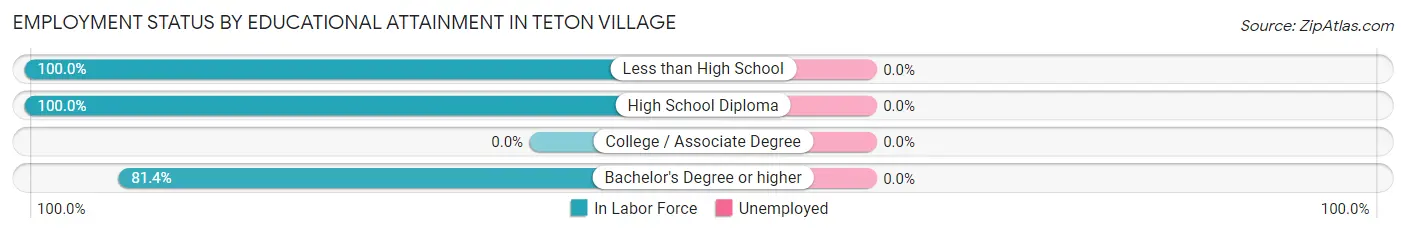
| Educational Attainment | In Labor Force | Unemployed |
| Less than High School | 72 (100.0%) | 0 (0.0%) |
| High School Diploma | 175 (100.0%) | 0 (0.0%) |
| College / Associate Degree | 0 (0.0%) | 0 (0.0%) |
| Bachelor's Degree or higher | 232 (81.4%) | 0 (0.0%) |
| Total | 479 (90.0%) | 0 (0.0%) |
Employment Occupations by Sex in Teton Village
Management, Business, Science and Arts Occupations
The most common Management, Business, Science and Arts occupations in Teton Village are Management (275 | 47.6%), Computers, Engineering & Science (60 | 10.4%), and Architecture & Engineering (60 | 10.4%).
Management, Business, Science and Arts Occupations by Sex
| Occupation | Male | Female |
| Management | 100 (36.4%) | 175 (63.6%) |
| Business & Financial | 0 (0.0%) | 0 (0.0%) |
| Computers, Engineering & Science | 0 (0.0%) | 60 (100.0%) |
| Computers & Mathematics | 0 (0.0%) | 0 (0.0%) |
| Architecture & Engineering | 0 (0.0%) | 60 (100.0%) |
| Life, Physical & Social Science | 0 (0.0%) | 0 (0.0%) |
| Community & Social Service | 0 (0.0%) | 0 (0.0%) |
| Education, Arts & Media | 0 (0.0%) | 0 (0.0%) |
| Legal Services & Support | 0 (0.0%) | 0 (0.0%) |
| Education Instruction & Library | 0 (0.0%) | 0 (0.0%) |
| Arts, Media & Entertainment | 0 (0.0%) | 0 (0.0%) |
| Health Diagnosing & Treating | 0 (0.0%) | 0 (0.0%) |
| Health Technologists | 0 (0.0%) | 0 (0.0%) |
| Total (Category) | 100 (29.8%) | 235 (70.2%) |
| Total (Overall) | 272 (47.1%) | 306 (52.9%) |
Services Occupations
The most common Services occupations in Teton Village are Cleaning & Maintenance (84 | 14.5%), and Food Preparation & Serving (35 | 6.1%).
Services Occupations by Sex
Within the Services occupations in Teton Village, the most male-oriented occupations are Cleaning & Maintenance (42.9%), and Food Preparation & Serving (34.3%), while the most female-oriented occupations are Food Preparation & Serving (65.7%), and Cleaning & Maintenance (57.1%).
| Occupation | Male | Female |
| Healthcare Support | 0 (0.0%) | 0 (0.0%) |
| Security & Protection | 0 (0.0%) | 0 (0.0%) |
| Firefighting & Prevention | 0 (0.0%) | 0 (0.0%) |
| Law Enforcement | 0 (0.0%) | 0 (0.0%) |
| Food Preparation & Serving | 12 (34.3%) | 23 (65.7%) |
| Cleaning & Maintenance | 36 (42.9%) | 48 (57.1%) |
| Personal Care & Service | 0 (0.0%) | 0 (0.0%) |
| Total (Category) | 48 (40.3%) | 71 (59.7%) |
| Total (Overall) | 272 (47.1%) | 306 (52.9%) |
Sales and Office Occupations
The most common Sales and Office occupations in Teton Village are , and Sales & Related (124 | 21.4%).
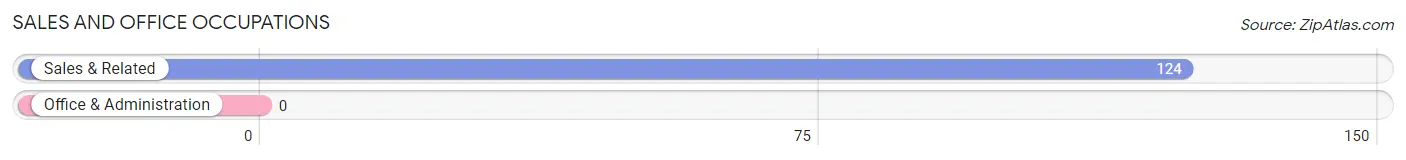
Sales and Office Occupations by Sex

| Occupation | Male | Female |
| Sales & Related | 124 (100.0%) | 0 (0.0%) |
| Office & Administration | 0 (0.0%) | 0 (0.0%) |
| Total (Category) | 124 (100.0%) | 0 (0.0%) |
| Total (Overall) | 272 (47.1%) | 306 (52.9%) |
Natural Resources, Construction and Maintenance Occupations
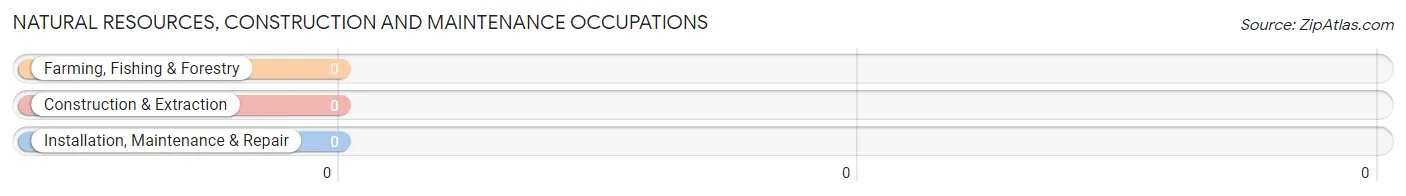
Natural Resources, Construction and Maintenance Occupations by Sex
| Occupation | Male | Female |
| Farming, Fishing & Forestry | 0 (0.0%) | 0 (0.0%) |
| Construction & Extraction | 0 (0.0%) | 0 (0.0%) |
| Installation, Maintenance & Repair | 0 (0.0%) | 0 (0.0%) |
| Total (Category) | 0 (0.0%) | 0 (0.0%) |
| Total (Overall) | 272 (47.1%) | 306 (52.9%) |
Production, Transportation and Moving Occupations
Production, Transportation and Moving Occupations by Sex
| Occupation | Male | Female |
| Production | 0 (0.0%) | 0 (0.0%) |
| Transportation | 0 (0.0%) | 0 (0.0%) |
| Material Moving | 0 (0.0%) | 0 (0.0%) |
| Total (Category) | 0 (0.0%) | 0 (0.0%) |
| Total (Overall) | 272 (47.1%) | 306 (52.9%) |
Employment Industries by Sex in Teton Village
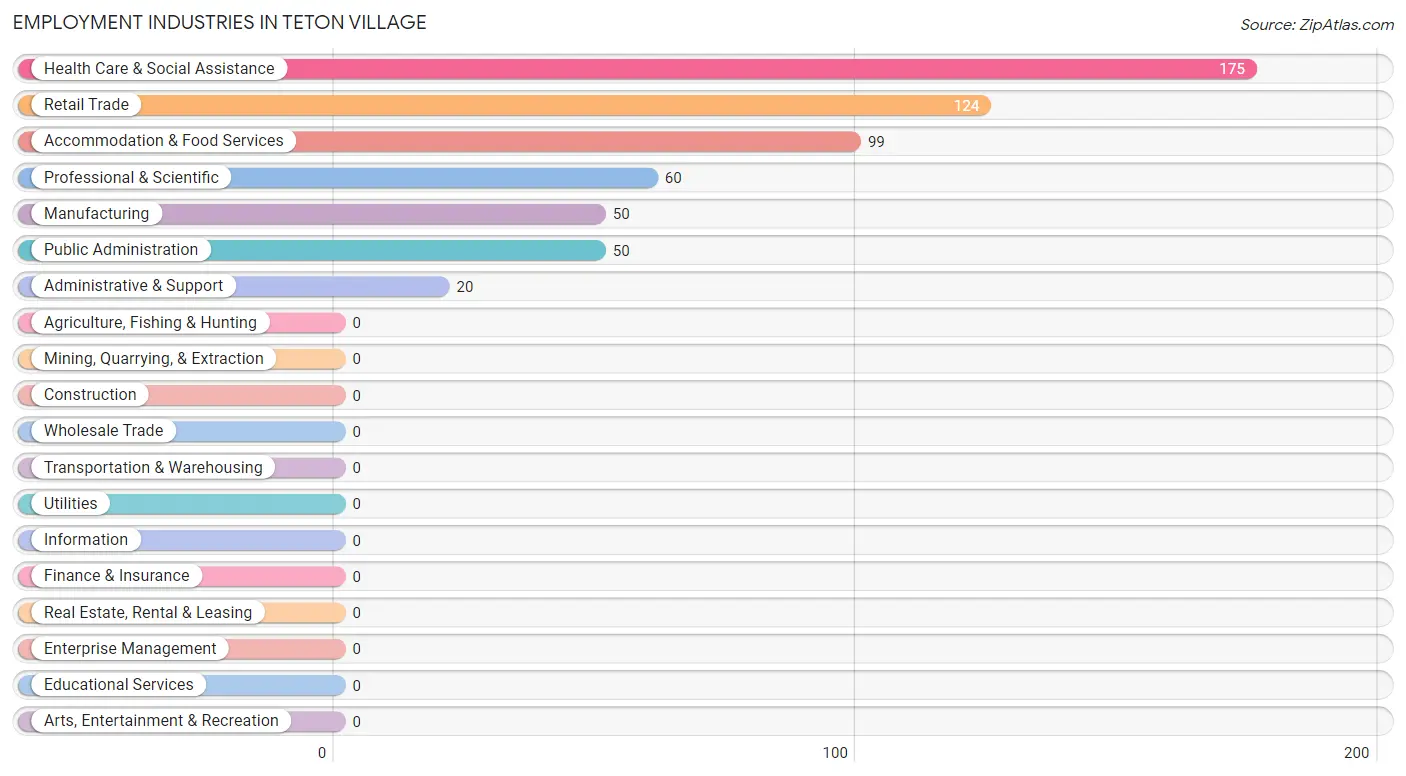
Employment Industries in Teton Village
The major employment industries in Teton Village include Health Care & Social Assistance (175 | 30.3%), Retail Trade (124 | 21.4%), Accommodation & Food Services (99 | 17.1%), Professional & Scientific (60 | 10.4%), and Manufacturing (50 | 8.6%).
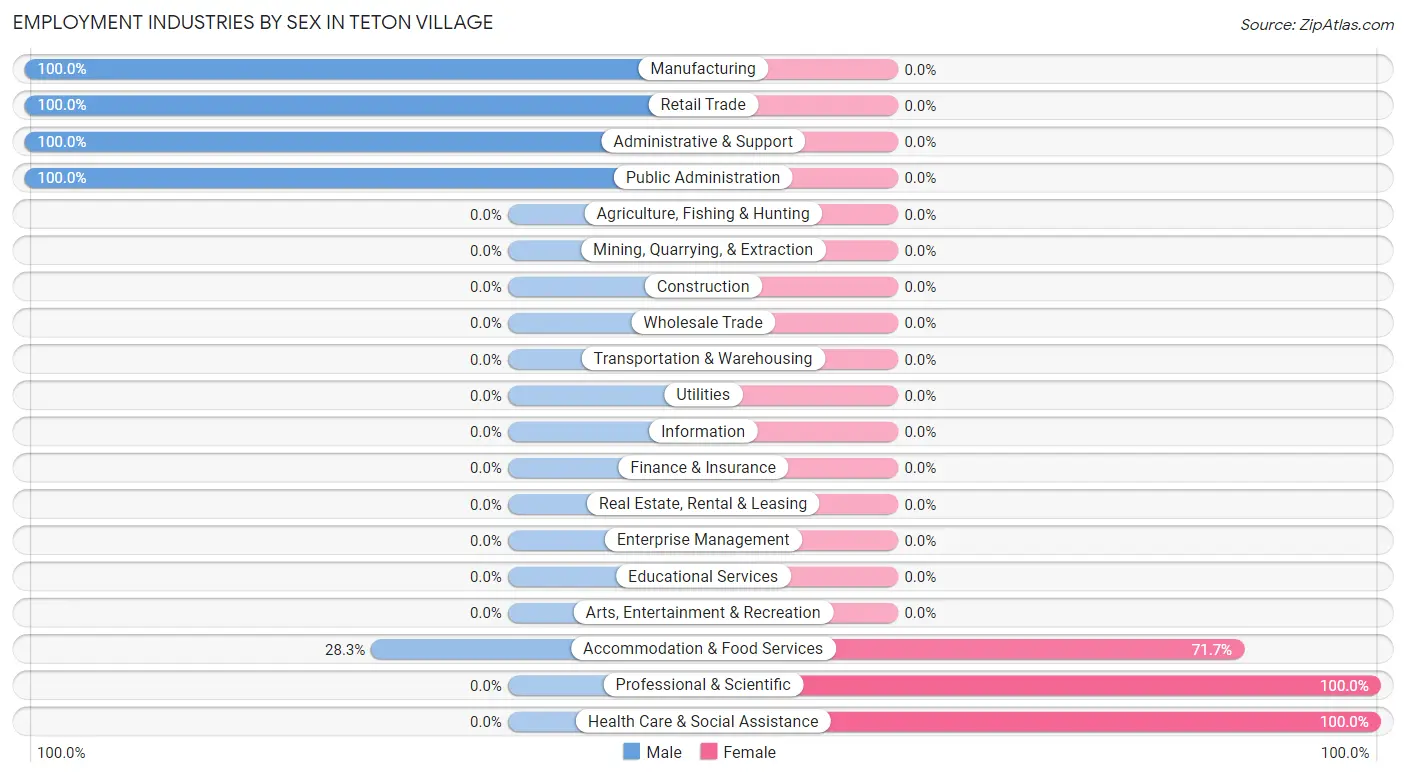
Employment Industries by Sex in Teton Village
The Teton Village industries that see more men than women are Manufacturing (100.0%), Retail Trade (100.0%), and Administrative & Support (100.0%), whereas the industries that tend to have a higher number of women are Professional & Scientific (100.0%), Health Care & Social Assistance (100.0%), and Accommodation & Food Services (71.7%).
| Industry | Male | Female |
| Agriculture, Fishing & Hunting | 0 (0.0%) | 0 (0.0%) |
| Mining, Quarrying, & Extraction | 0 (0.0%) | 0 (0.0%) |
| Construction | 0 (0.0%) | 0 (0.0%) |
| Manufacturing | 50 (100.0%) | 0 (0.0%) |
| Wholesale Trade | 0 (0.0%) | 0 (0.0%) |
| Retail Trade | 124 (100.0%) | 0 (0.0%) |
| Transportation & Warehousing | 0 (0.0%) | 0 (0.0%) |
| Utilities | 0 (0.0%) | 0 (0.0%) |
| Information | 0 (0.0%) | 0 (0.0%) |
| Finance & Insurance | 0 (0.0%) | 0 (0.0%) |
| Real Estate, Rental & Leasing | 0 (0.0%) | 0 (0.0%) |
| Professional & Scientific | 0 (0.0%) | 60 (100.0%) |
| Enterprise Management | 0 (0.0%) | 0 (0.0%) |
| Administrative & Support | 20 (100.0%) | 0 (0.0%) |
| Educational Services | 0 (0.0%) | 0 (0.0%) |
| Health Care & Social Assistance | 0 (0.0%) | 175 (100.0%) |
| Arts, Entertainment & Recreation | 0 (0.0%) | 0 (0.0%) |
| Accommodation & Food Services | 28 (28.3%) | 71 (71.7%) |
| Public Administration | 50 (100.0%) | 0 (0.0%) |
| Total | 272 (47.1%) | 306 (52.9%) |
Education in Teton Village
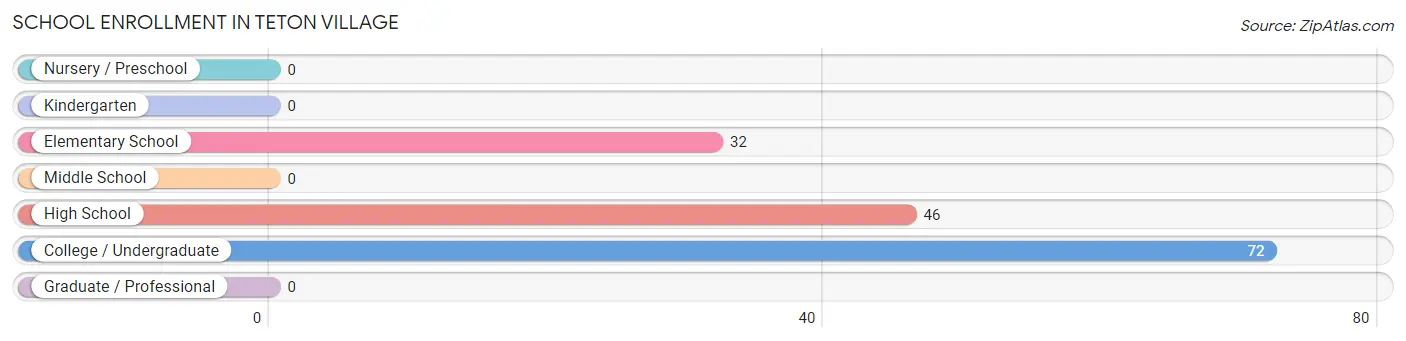
School Enrollment in Teton Village
The most common levels of schooling among the 150 students in Teton Village are college / undergraduate (72 | 48.0%), high school (46 | 30.7%), and elementary school (32 | 21.3%).
| School Level | # Students | % Students |
| Nursery / Preschool | 0 | 0.0% |
| Kindergarten | 0 | 0.0% |
| Elementary School | 32 | 21.3% |
| Middle School | 0 | 0.0% |
| High School | 46 | 30.7% |
| College / Undergraduate | 72 | 48.0% |
| Graduate / Professional | 0 | 0.0% |
| Total | 150 | 100.0% |
School Enrollment by Age by Funding Source in Teton Village
Out of a total of 150 students who are enrolled in schools in Teton Village, 22 (14.7%) attend a private institution, while the remaining 128 (85.3%) are enrolled in public schools. The age group of 18 to 19 year olds has the highest likelihood of being enrolled in private schools, with 5 (100.0% in the age bracket) enrolled. Conversely, the age group of 5 to 9 year old has the lowest likelihood of being enrolled in a private school, with 32 (100.0% in the age bracket) attending a public institution.
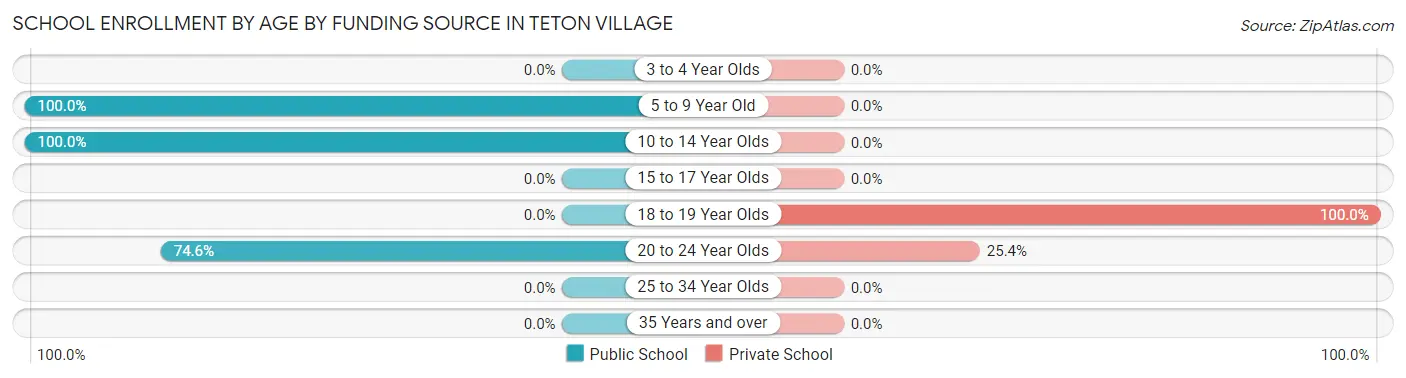
| Age Bracket | Public School | Private School |
| 3 to 4 Year Olds | 0 (0.0%) | 0 (0.0%) |
| 5 to 9 Year Old | 32 (100.0%) | 0 (0.0%) |
| 10 to 14 Year Olds | 46 (100.0%) | 0 (0.0%) |
| 15 to 17 Year Olds | 0 (0.0%) | 0 (0.0%) |
| 18 to 19 Year Olds | 0 (0.0%) | 5 (100.0%) |
| 20 to 24 Year Olds | 50 (74.6%) | 17 (25.4%) |
| 25 to 34 Year Olds | 0 (0.0%) | 0 (0.0%) |
| 35 Years and over | 0 (0.0%) | 0 (0.0%) |
| Total | 128 (85.3%) | 22 (14.7%) |
Educational Attainment by Field of Study in Teton Village
Science & technology (148 | 28.6%), physical & health sciences (121 | 23.4%), social sciences (89 | 17.2%), engineering (55 | 10.6%), and psychology (53 | 10.2%) are the most common fields of study among 518 individuals in Teton Village who have obtained a bachelor's degree or higher.
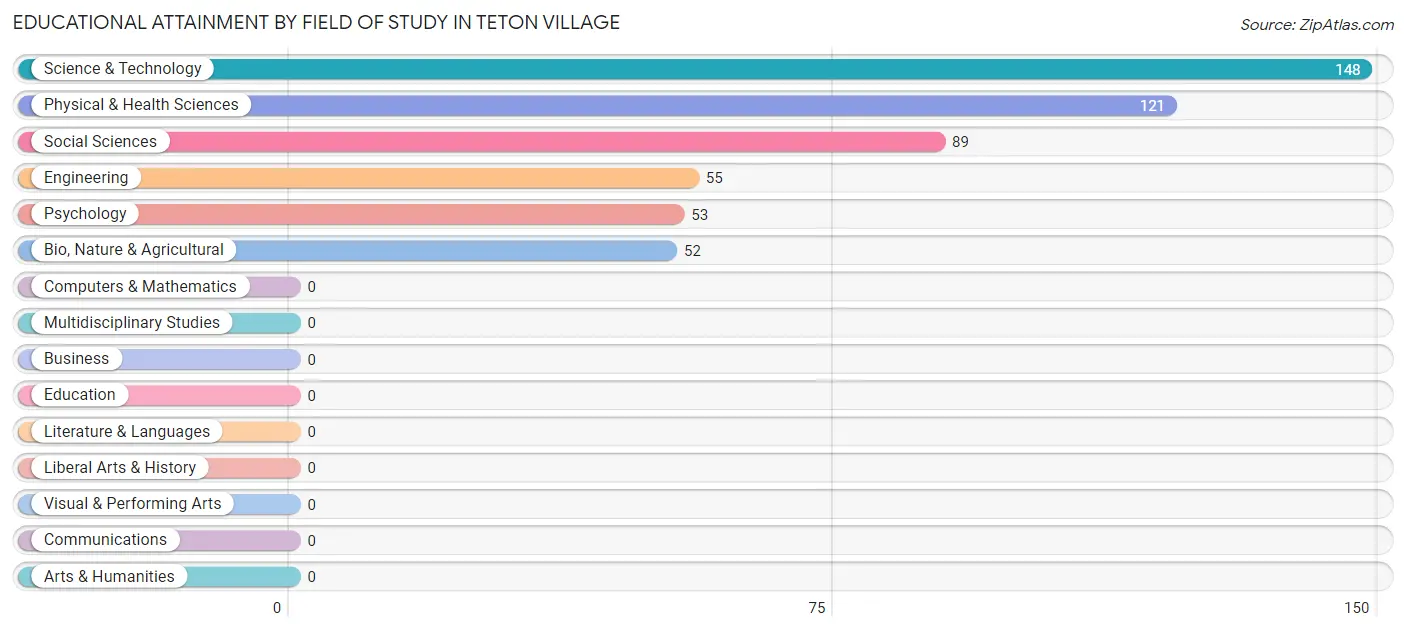
| Field of Study | # Graduates | % Graduates |
| Computers & Mathematics | 0 | 0.0% |
| Bio, Nature & Agricultural | 52 | 10.0% |
| Physical & Health Sciences | 121 | 23.4% |
| Psychology | 53 | 10.2% |
| Social Sciences | 89 | 17.2% |
| Engineering | 55 | 10.6% |
| Multidisciplinary Studies | 0 | 0.0% |
| Science & Technology | 148 | 28.6% |
| Business | 0 | 0.0% |
| Education | 0 | 0.0% |
| Literature & Languages | 0 | 0.0% |
| Liberal Arts & History | 0 | 0.0% |
| Visual & Performing Arts | 0 | 0.0% |
| Communications | 0 | 0.0% |
| Arts & Humanities | 0 | 0.0% |
| Total | 518 | 100.0% |
Transportation & Commute in Teton Village
Vehicle Availability by Sex in Teton Village
The most prevalent vehicle ownership categories in Teton Village are males with 1 vehicle (152, accounting for 62.3%) and females with 1 vehicle (60, making up 54.7%).
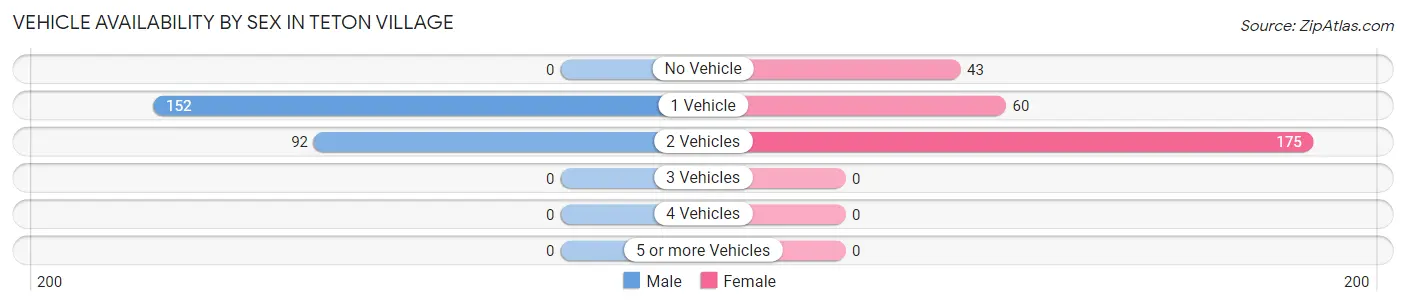
| Vehicles Available | Male | Female |
| No Vehicle | 0 (0.0%) | 43 (15.5%) |
| 1 Vehicle | 152 (62.3%) | 60 (21.6%) |
| 2 Vehicles | 92 (37.7%) | 175 (62.9%) |
| 3 Vehicles | 0 (0.0%) | 0 (0.0%) |
| 4 Vehicles | 0 (0.0%) | 0 (0.0%) |
| 5 or more Vehicles | 0 (0.0%) | 0 (0.0%) |
| Total | 244 (100.0%) | 278 (100.0%) |
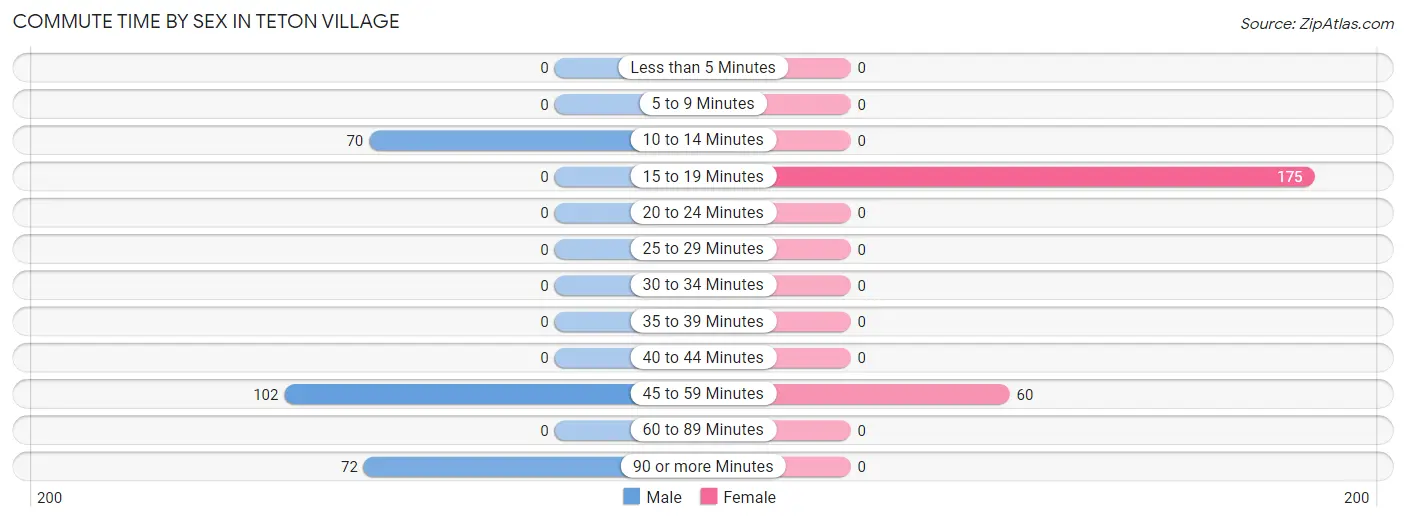
Commute Time in Teton Village
The most frequently occuring commute durations in Teton Village are 15 to 19 minutes (175 commuters, 36.5%), 45 to 59 minutes (162 commuters, 33.8%), and 90 or more minutes (72 commuters, 15.0%).
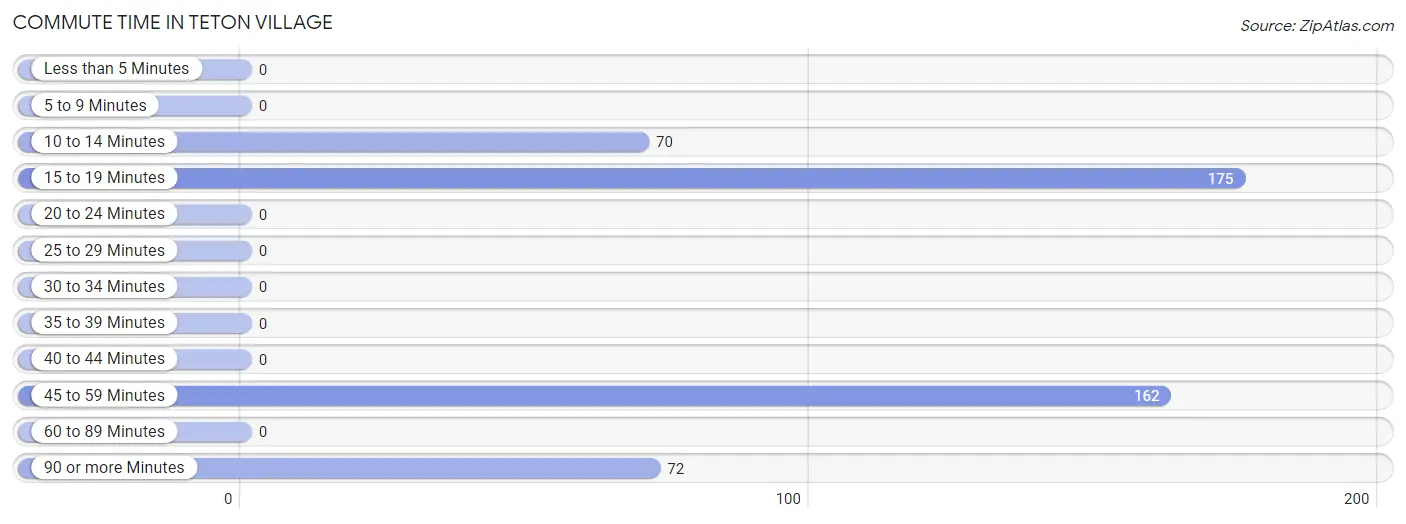
| Commute Time | # Commuters | % Commuters |
| Less than 5 Minutes | 0 | 0.0% |
| 5 to 9 Minutes | 0 | 0.0% |
| 10 to 14 Minutes | 70 | 14.6% |
| 15 to 19 Minutes | 175 | 36.5% |
| 20 to 24 Minutes | 0 | 0.0% |
| 25 to 29 Minutes | 0 | 0.0% |
| 30 to 34 Minutes | 0 | 0.0% |
| 35 to 39 Minutes | 0 | 0.0% |
| 40 to 44 Minutes | 0 | 0.0% |
| 45 to 59 Minutes | 162 | 33.8% |
| 60 to 89 Minutes | 0 | 0.0% |
| 90 or more Minutes | 72 | 15.0% |
Commute Time by Sex in Teton Village
The most common commute times in Teton Village are 45 to 59 minutes (102 commuters, 41.8%) for males and 15 to 19 minutes (175 commuters, 74.5%) for females.
| Commute Time | Male | Female |
| Less than 5 Minutes | 0 (0.0%) | 0 (0.0%) |
| 5 to 9 Minutes | 0 (0.0%) | 0 (0.0%) |
| 10 to 14 Minutes | 70 (28.7%) | 0 (0.0%) |
| 15 to 19 Minutes | 0 (0.0%) | 175 (74.5%) |
| 20 to 24 Minutes | 0 (0.0%) | 0 (0.0%) |
| 25 to 29 Minutes | 0 (0.0%) | 0 (0.0%) |
| 30 to 34 Minutes | 0 (0.0%) | 0 (0.0%) |
| 35 to 39 Minutes | 0 (0.0%) | 0 (0.0%) |
| 40 to 44 Minutes | 0 (0.0%) | 0 (0.0%) |
| 45 to 59 Minutes | 102 (41.8%) | 60 (25.5%) |
| 60 to 89 Minutes | 0 (0.0%) | 0 (0.0%) |
| 90 or more Minutes | 72 (29.5%) | 0 (0.0%) |
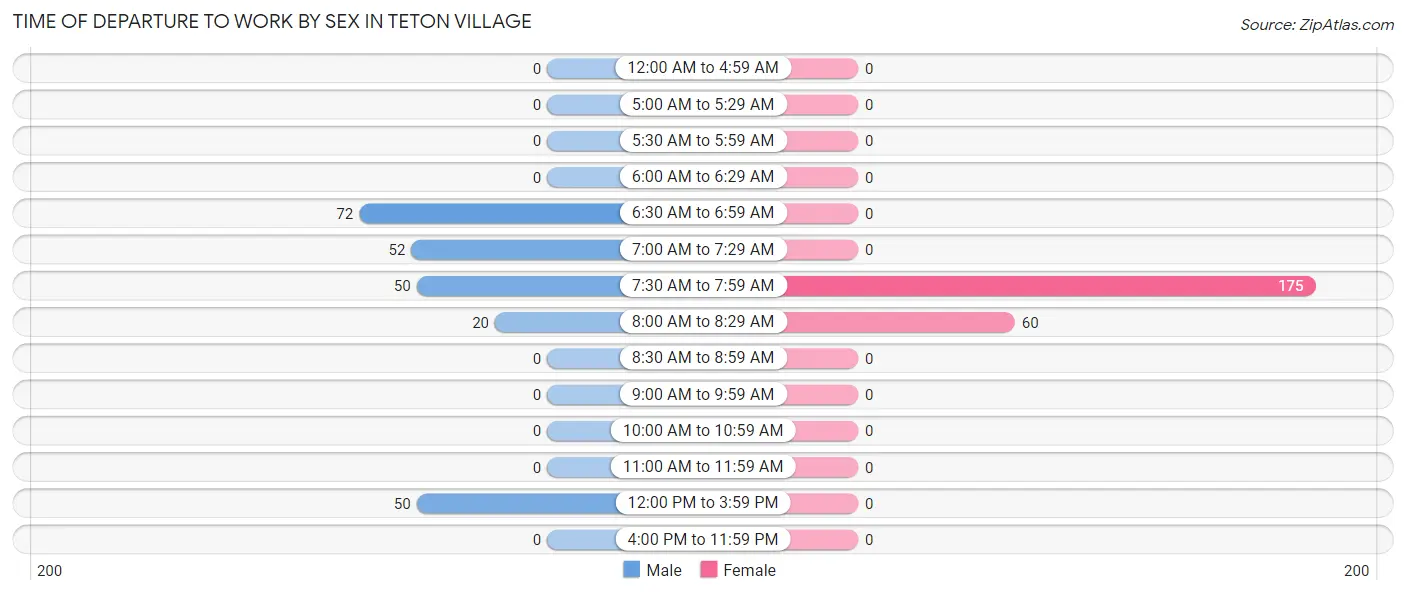
Time of Departure to Work by Sex in Teton Village
The most frequent times of departure to work in Teton Village are 6:30 AM to 6:59 AM (72, 29.5%) for males and 7:30 AM to 7:59 AM (175, 74.5%) for females.
| Time of Departure | Male | Female |
| 12:00 AM to 4:59 AM | 0 (0.0%) | 0 (0.0%) |
| 5:00 AM to 5:29 AM | 0 (0.0%) | 0 (0.0%) |
| 5:30 AM to 5:59 AM | 0 (0.0%) | 0 (0.0%) |
| 6:00 AM to 6:29 AM | 0 (0.0%) | 0 (0.0%) |
| 6:30 AM to 6:59 AM | 72 (29.5%) | 0 (0.0%) |
| 7:00 AM to 7:29 AM | 52 (21.3%) | 0 (0.0%) |
| 7:30 AM to 7:59 AM | 50 (20.5%) | 175 (74.5%) |
| 8:00 AM to 8:29 AM | 20 (8.2%) | 60 (25.5%) |
| 8:30 AM to 8:59 AM | 0 (0.0%) | 0 (0.0%) |
| 9:00 AM to 9:59 AM | 0 (0.0%) | 0 (0.0%) |
| 10:00 AM to 10:59 AM | 0 (0.0%) | 0 (0.0%) |
| 11:00 AM to 11:59 AM | 0 (0.0%) | 0 (0.0%) |
| 12:00 PM to 3:59 PM | 50 (20.5%) | 0 (0.0%) |
| 4:00 PM to 11:59 PM | 0 (0.0%) | 0 (0.0%) |
| Total | 244 (100.0%) | 235 (100.0%) |
Housing Occupancy in Teton Village
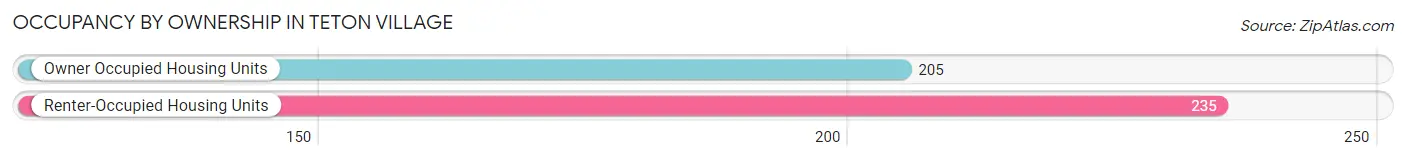
Occupancy by Ownership in Teton Village
Of the total 440 dwellings in Teton Village, owner-occupied units account for 205 (46.6%), while renter-occupied units make up 235 (53.4%).
| Occupancy | # Housing Units | % Housing Units |
| Owner Occupied Housing Units | 205 | 46.6% |
| Renter-Occupied Housing Units | 235 | 53.4% |
| Total Occupied Housing Units | 440 | 100.0% |
Occupancy by Household Size in Teton Village
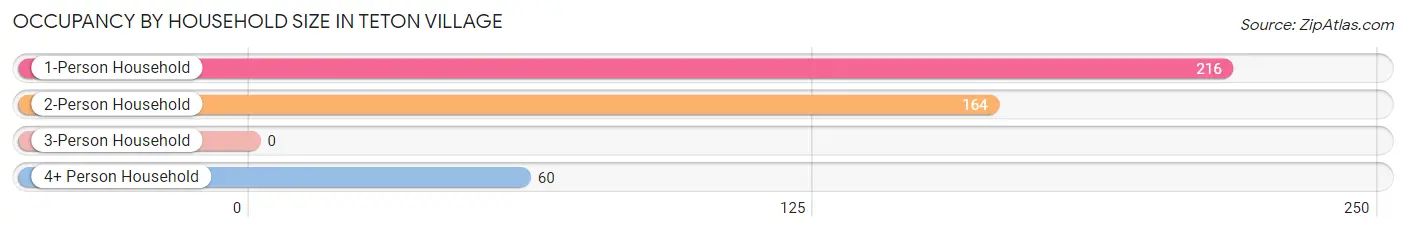
| Household Size | # Housing Units | % Housing Units |
| 1-Person Household | 216 | 49.1% |
| 2-Person Household | 164 | 37.3% |
| 3-Person Household | 0 | 0.0% |
| 4+ Person Household | 60 | 13.6% |
| Total Housing Units | 440 | 100.0% |
Occupancy by Ownership by Household Size in Teton Village
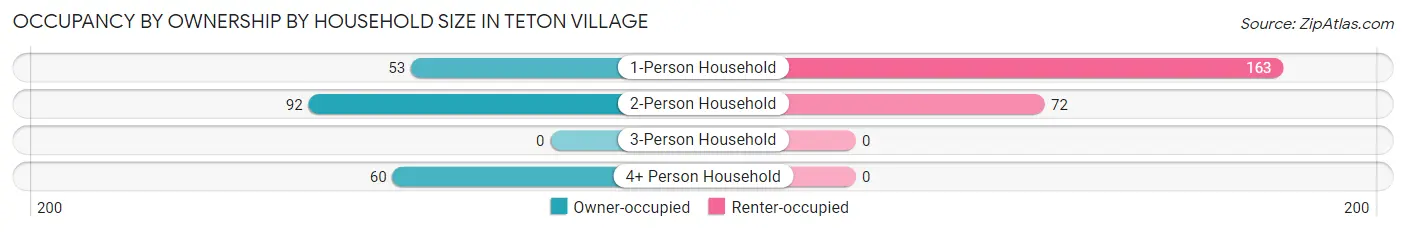
| Household Size | Owner-occupied | Renter-occupied |
| 1-Person Household | 53 (24.5%) | 163 (75.5%) |
| 2-Person Household | 92 (56.1%) | 72 (43.9%) |
| 3-Person Household | 0 (0.0%) | 0 (0.0%) |
| 4+ Person Household | 60 (100.0%) | 0 (0.0%) |
| Total Housing Units | 205 (46.6%) | 235 (53.4%) |
Occupancy by Educational Attainment in Teton Village
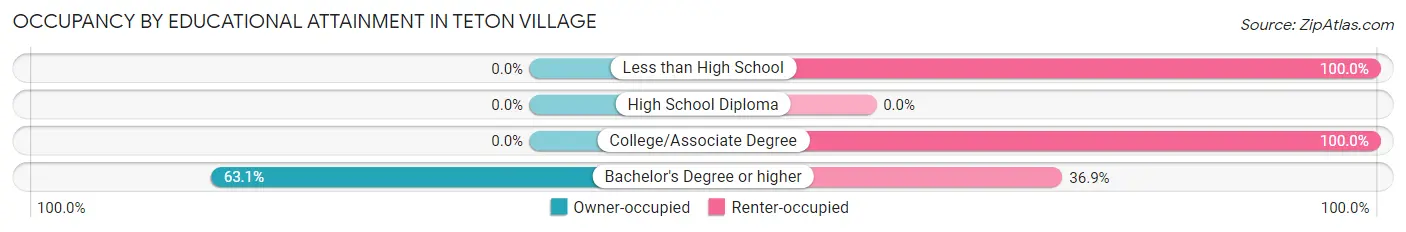
| Household Size | Owner-occupied | Renter-occupied |
| Less than High School | 0 (0.0%) | 72 (100.0%) |
| High School Diploma | 0 (0.0%) | 0 (0.0%) |
| College/Associate Degree | 0 (0.0%) | 43 (100.0%) |
| Bachelor's Degree or higher | 205 (63.1%) | 120 (36.9%) |
Occupancy by Age of Householder in Teton Village
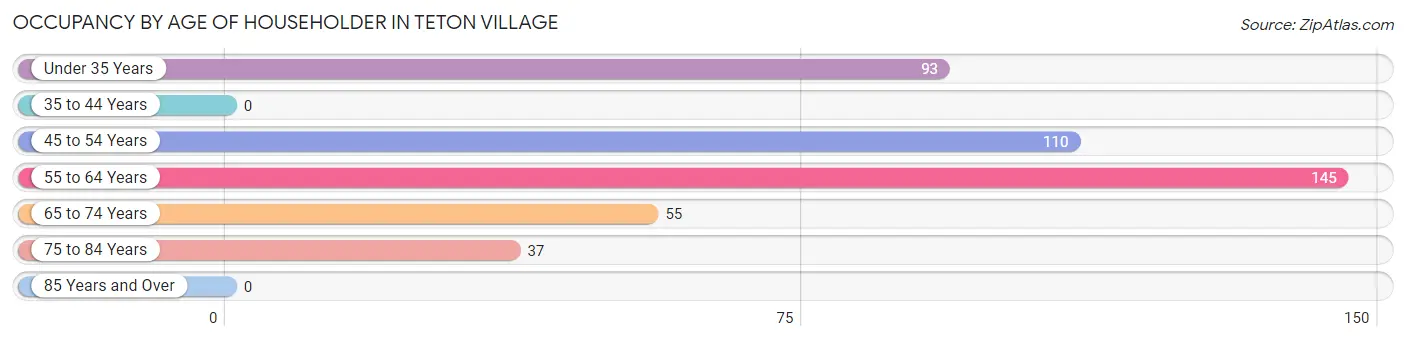
| Age Bracket | # Households | % Households |
| Under 35 Years | 93 | 21.1% |
| 35 to 44 Years | 0 | 0.0% |
| 45 to 54 Years | 110 | 25.0% |
| 55 to 64 Years | 145 | 33.0% |
| 65 to 74 Years | 55 | 12.5% |
| 75 to 84 Years | 37 | 8.4% |
| 85 Years and Over | 0 | 0.0% |
| Total | 440 | 100.0% |
Housing Finances in Teton Village
Median Income by Occupancy in Teton Village
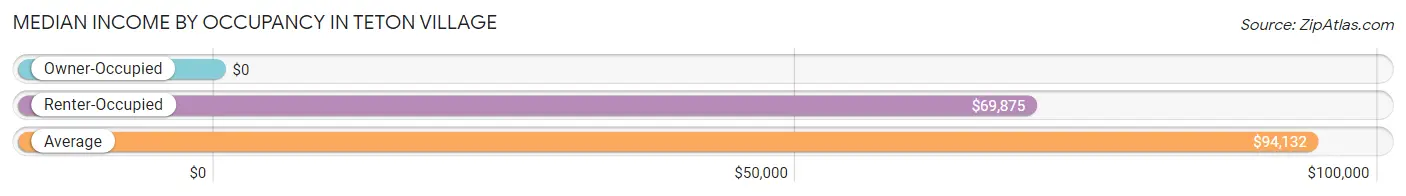
| Occupancy Type | # Households | Median Income |
| Owner-Occupied | 205 (46.6%) | $0 |
| Renter-Occupied | 235 (53.4%) | $69,875 |
| Average | 440 (100.0%) | $94,132 |
Occupancy by Householder Income Bracket in Teton Village
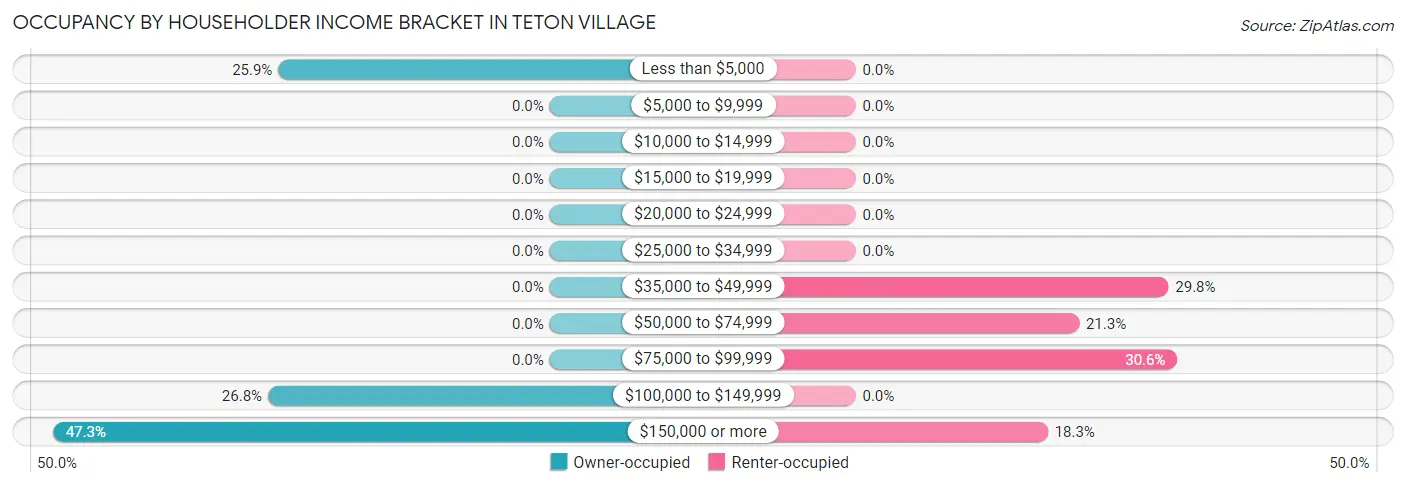
| Income Bracket | Owner-occupied | Renter-occupied |
| Less than $5,000 | 53 (25.9%) | 0 (0.0%) |
| $5,000 to $9,999 | 0 (0.0%) | 0 (0.0%) |
| $10,000 to $14,999 | 0 (0.0%) | 0 (0.0%) |
| $15,000 to $19,999 | 0 (0.0%) | 0 (0.0%) |
| $20,000 to $24,999 | 0 (0.0%) | 0 (0.0%) |
| $25,000 to $34,999 | 0 (0.0%) | 0 (0.0%) |
| $35,000 to $49,999 | 0 (0.0%) | 70 (29.8%) |
| $50,000 to $74,999 | 0 (0.0%) | 50 (21.3%) |
| $75,000 to $99,999 | 0 (0.0%) | 72 (30.6%) |
| $100,000 to $149,999 | 55 (26.8%) | 0 (0.0%) |
| $150,000 or more | 97 (47.3%) | 43 (18.3%) |
| Total | 205 (100.0%) | 235 (100.0%) |
Monthly Housing Cost Tiers in Teton Village
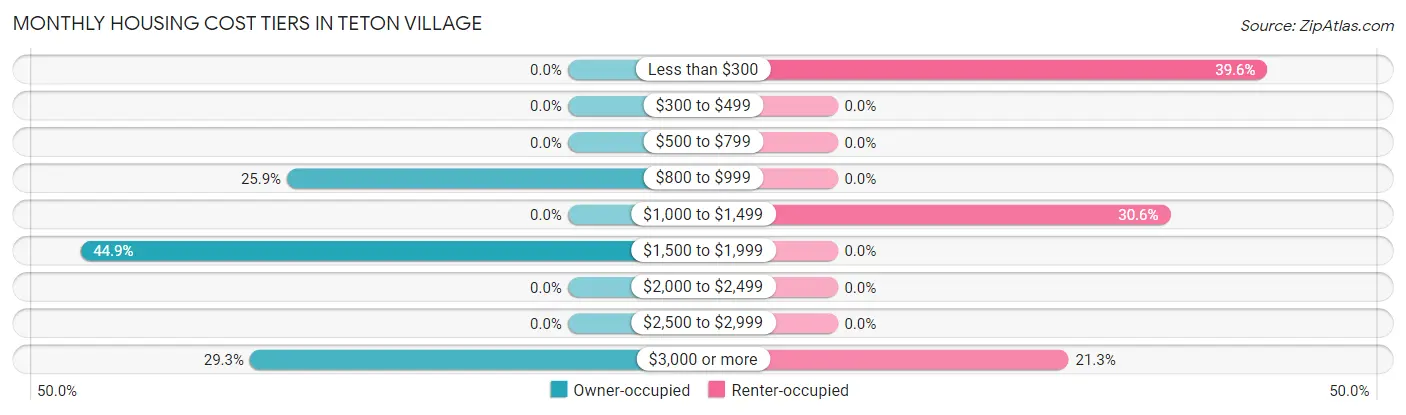
| Monthly Cost | Owner-occupied | Renter-occupied |
| Less than $300 | 0 (0.0%) | 93 (39.6%) |
| $300 to $499 | 0 (0.0%) | 0 (0.0%) |
| $500 to $799 | 0 (0.0%) | 0 (0.0%) |
| $800 to $999 | 53 (25.9%) | 0 (0.0%) |
| $1,000 to $1,499 | 0 (0.0%) | 72 (30.6%) |
| $1,500 to $1,999 | 92 (44.9%) | 0 (0.0%) |
| $2,000 to $2,499 | 0 (0.0%) | 0 (0.0%) |
| $2,500 to $2,999 | 0 (0.0%) | 0 (0.0%) |
| $3,000 or more | 60 (29.3%) | 50 (21.3%) |
| Total | 205 (100.0%) | 235 (100.0%) |
Physical Housing Characteristics in Teton Village
Housing Structures in Teton Village
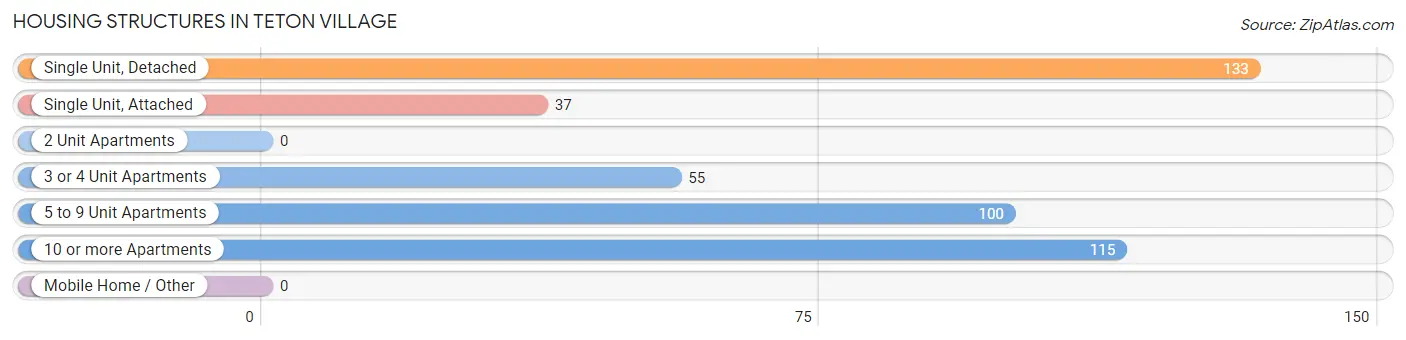
| Structure Type | # Housing Units | % Housing Units |
| Single Unit, Detached | 133 | 30.2% |
| Single Unit, Attached | 37 | 8.4% |
| 2 Unit Apartments | 0 | 0.0% |
| 3 or 4 Unit Apartments | 55 | 12.5% |
| 5 to 9 Unit Apartments | 100 | 22.7% |
| 10 or more Apartments | 115 | 26.1% |
| Mobile Home / Other | 0 | 0.0% |
| Total | 440 | 100.0% |
Housing Structures by Occupancy in Teton Village
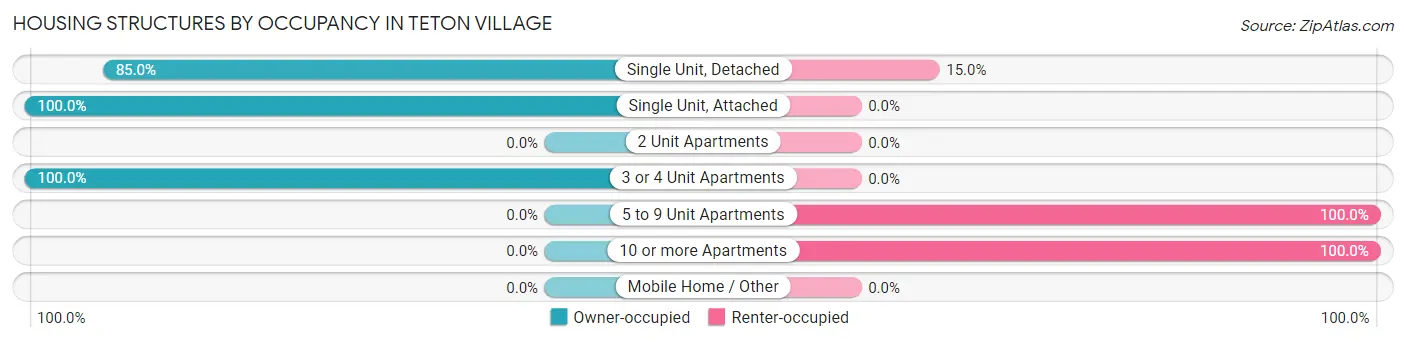
| Structure Type | Owner-occupied | Renter-occupied |
| Single Unit, Detached | 113 (85.0%) | 20 (15.0%) |
| Single Unit, Attached | 37 (100.0%) | 0 (0.0%) |
| 2 Unit Apartments | 0 (0.0%) | 0 (0.0%) |
| 3 or 4 Unit Apartments | 55 (100.0%) | 0 (0.0%) |
| 5 to 9 Unit Apartments | 0 (0.0%) | 100 (100.0%) |
| 10 or more Apartments | 0 (0.0%) | 115 (100.0%) |
| Mobile Home / Other | 0 (0.0%) | 0 (0.0%) |
| Total | 205 (46.6%) | 235 (53.4%) |
Housing Structures by Number of Rooms in Teton Village
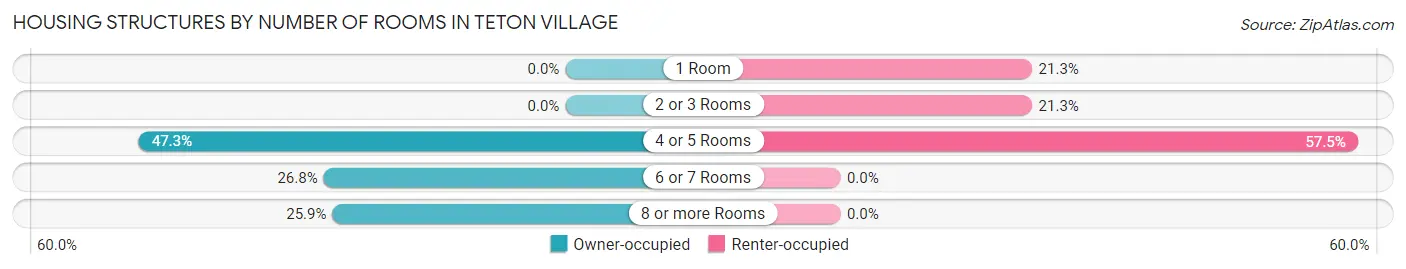
| Number of Rooms | Owner-occupied | Renter-occupied |
| 1 Room | 0 (0.0%) | 50 (21.3%) |
| 2 or 3 Rooms | 0 (0.0%) | 50 (21.3%) |
| 4 or 5 Rooms | 97 (47.3%) | 135 (57.5%) |
| 6 or 7 Rooms | 55 (26.8%) | 0 (0.0%) |
| 8 or more Rooms | 53 (25.9%) | 0 (0.0%) |
| Total | 205 (100.0%) | 235 (100.0%) |
Housing Structure by Heating Type in Teton Village
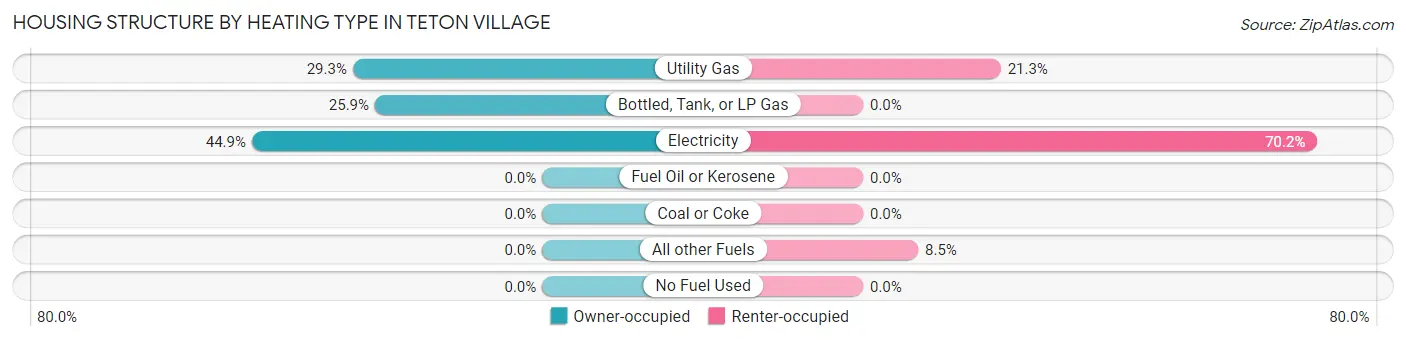
| Heating Type | Owner-occupied | Renter-occupied |
| Utility Gas | 60 (29.3%) | 50 (21.3%) |
| Bottled, Tank, or LP Gas | 53 (25.9%) | 0 (0.0%) |
| Electricity | 92 (44.9%) | 165 (70.2%) |
| Fuel Oil or Kerosene | 0 (0.0%) | 0 (0.0%) |
| Coal or Coke | 0 (0.0%) | 0 (0.0%) |
| All other Fuels | 0 (0.0%) | 20 (8.5%) |
| No Fuel Used | 0 (0.0%) | 0 (0.0%) |
| Total | 205 (100.0%) | 235 (100.0%) |
Household Vehicle Usage in Teton Village
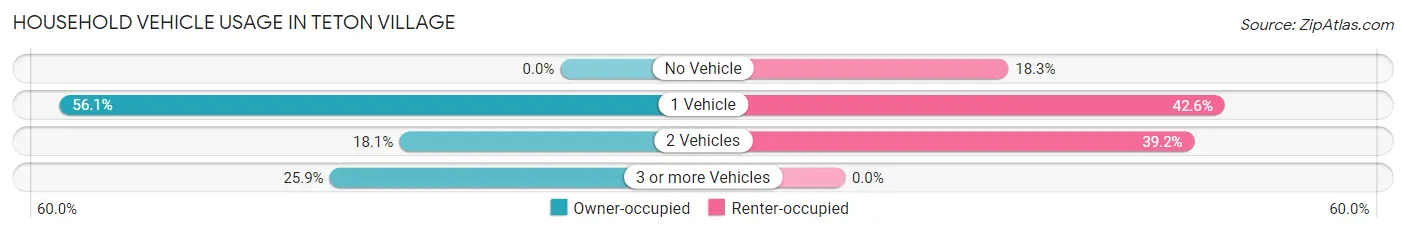
| Vehicles per Household | Owner-occupied | Renter-occupied |
| No Vehicle | 0 (0.0%) | 43 (18.3%) |
| 1 Vehicle | 115 (56.1%) | 100 (42.5%) |
| 2 Vehicles | 37 (18.0%) | 92 (39.2%) |
| 3 or more Vehicles | 53 (25.9%) | 0 (0.0%) |
| Total | 205 (100.0%) | 235 (100.0%) |
Real Estate & Mortgages in Teton Village
Real Estate and Mortgage Overview in Teton Village
| Characteristic | Without Mortgage | With Mortgage |
| Housing Units | 92 | 113 |
| Median Property Value | - | - |
| Median Household Income | - | - |
| Monthly Housing Costs | - | - |
| Real Estate Taxes | - | - |
Property Value by Mortgage Status in Teton Village
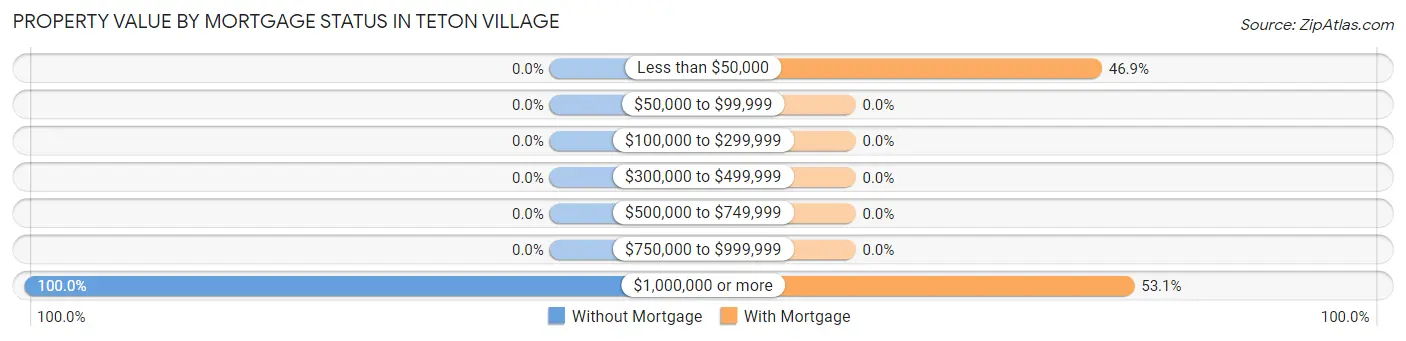
| Property Value | Without Mortgage | With Mortgage |
| Less than $50,000 | 0 (0.0%) | 53 (46.9%) |
| $50,000 to $99,999 | 0 (0.0%) | 0 (0.0%) |
| $100,000 to $299,999 | 0 (0.0%) | 0 (0.0%) |
| $300,000 to $499,999 | 0 (0.0%) | 0 (0.0%) |
| $500,000 to $749,999 | 0 (0.0%) | 0 (0.0%) |
| $750,000 to $999,999 | 0 (0.0%) | 0 (0.0%) |
| $1,000,000 or more | 92 (100.0%) | 60 (53.1%) |
| Total | 92 (100.0%) | 113 (100.0%) |
Household Income by Mortgage Status in Teton Village
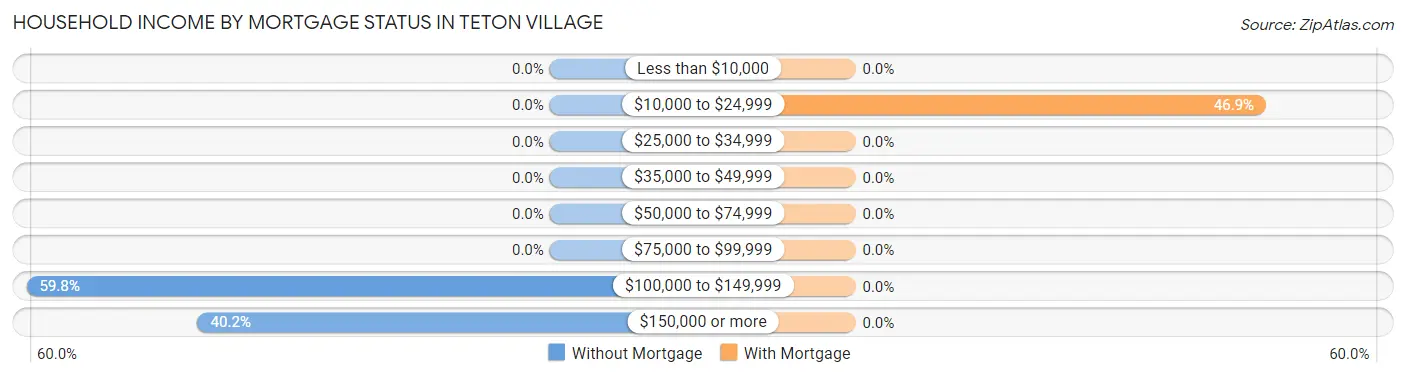
| Household Income | Without Mortgage | With Mortgage |
| Less than $10,000 | 0 (0.0%) | 0 (0.0%) |
| $10,000 to $24,999 | 0 (0.0%) | 53 (46.9%) |
| $25,000 to $34,999 | 0 (0.0%) | 0 (0.0%) |
| $35,000 to $49,999 | 0 (0.0%) | 0 (0.0%) |
| $50,000 to $74,999 | 0 (0.0%) | 0 (0.0%) |
| $75,000 to $99,999 | 0 (0.0%) | 0 (0.0%) |
| $100,000 to $149,999 | 55 (59.8%) | 0 (0.0%) |
| $150,000 or more | 37 (40.2%) | 0 (0.0%) |
| Total | 92 (100.0%) | 113 (100.0%) |
Property Value to Household Income Ratio in Teton Village
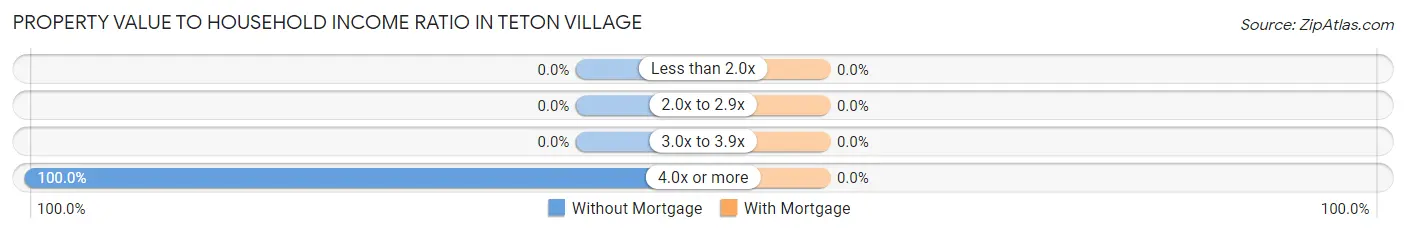
| Value-to-Income Ratio | Without Mortgage | With Mortgage |
| Less than 2.0x | 0 (0.0%) | 0 (0.0%) |
| 2.0x to 2.9x | 0 (0.0%) | 0 (0.0%) |
| 3.0x to 3.9x | 0 (0.0%) | 0 (0.0%) |
| 4.0x or more | 92 (100.0%) | 0 (0.0%) |
| Total | 92 (100.0%) | 113 (100.0%) |
Real Estate Taxes by Mortgage Status in Teton Village
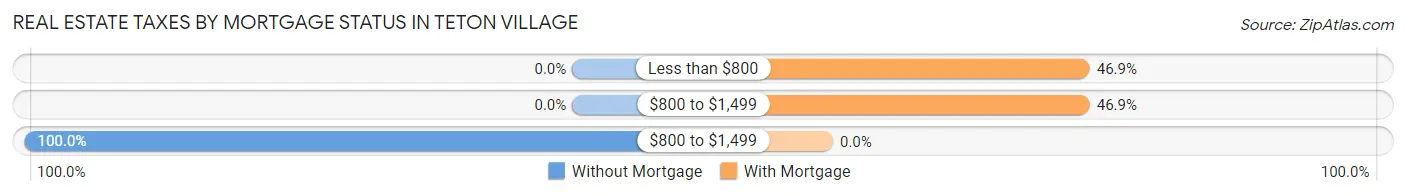
| Property Taxes | Without Mortgage | With Mortgage |
| Less than $800 | 0 (0.0%) | 53 (46.9%) |
| $800 to $1,499 | 0 (0.0%) | 53 (46.9%) |
| $800 to $1,499 | 92 (100.0%) | 0 (0.0%) |
| Total | 92 (100.0%) | 113 (100.0%) |
Health & Disability in Teton Village
Health Insurance Coverage by Age in Teton Village
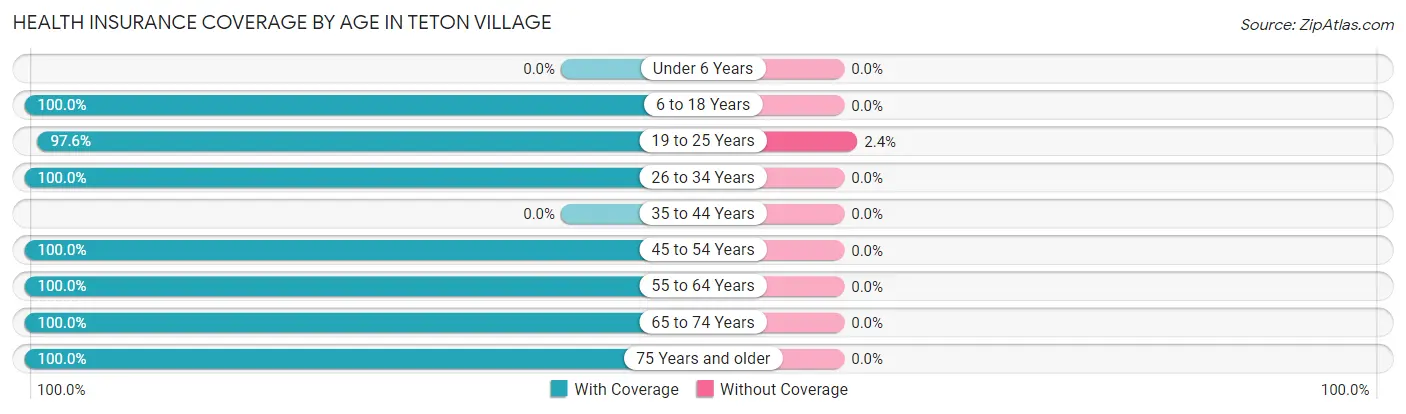
| Age Bracket | With Coverage | Without Coverage |
| Under 6 Years | 0 (0.0%) | 0 (0.0%) |
| 6 to 18 Years | 121 (100.0%) | 0 (0.0%) |
| 19 to 25 Years | 241 (97.6%) | 6 (2.4%) |
| 26 to 34 Years | 50 (100.0%) | 0 (0.0%) |
| 35 to 44 Years | 0 (0.0%) | 0 (0.0%) |
| 45 to 54 Years | 162 (100.0%) | 0 (0.0%) |
| 55 to 64 Years | 145 (100.0%) | 0 (0.0%) |
| 65 to 74 Years | 144 (100.0%) | 0 (0.0%) |
| 75 Years and older | 37 (100.0%) | 0 (0.0%) |
| Total | 900 (99.3%) | 6 (0.7%) |
Health Insurance Coverage by Citizenship Status in Teton Village
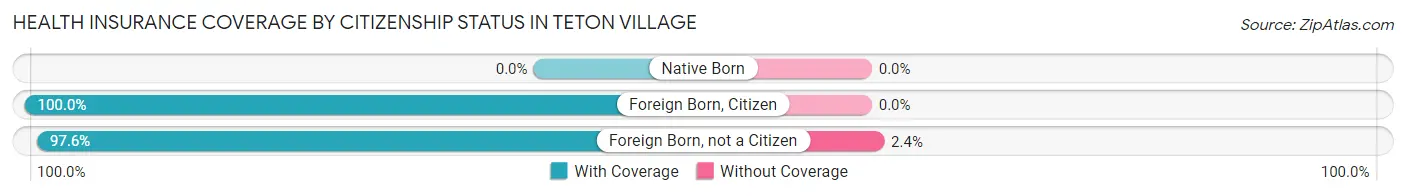
| Citizenship Status | With Coverage | Without Coverage |
| Native Born | 0 (0.0%) | 0 (0.0%) |
| Foreign Born, Citizen | 121 (100.0%) | 0 (0.0%) |
| Foreign Born, not a Citizen | 241 (97.6%) | 6 (2.4%) |
Health Insurance Coverage by Household Income in Teton Village
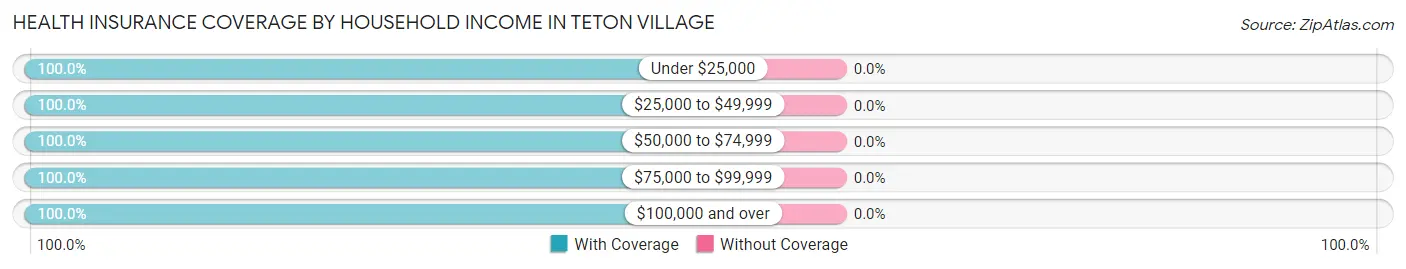
| Household Income | With Coverage | Without Coverage |
| Under $25,000 | 53 (100.0%) | 0 (0.0%) |
| $25,000 to $49,999 | 70 (100.0%) | 0 (0.0%) |
| $50,000 to $74,999 | 50 (100.0%) | 0 (0.0%) |
| $75,000 to $99,999 | 247 (100.0%) | 0 (0.0%) |
| $100,000 and over | 414 (100.0%) | 0 (0.0%) |
Public vs Private Health Insurance Coverage by Age in Teton Village
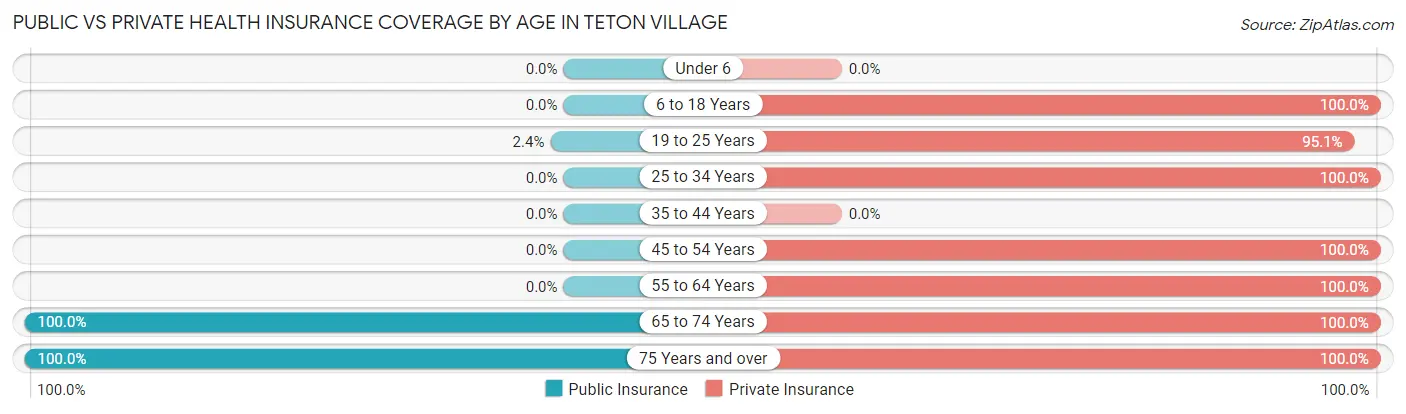
| Age Bracket | Public Insurance | Private Insurance |
| Under 6 | 0 (0.0%) | 0 (0.0%) |
| 6 to 18 Years | 0 (0.0%) | 121 (100.0%) |
| 19 to 25 Years | 6 (2.4%) | 235 (95.1%) |
| 25 to 34 Years | 0 (0.0%) | 50 (100.0%) |
| 35 to 44 Years | 0 (0.0%) | 0 (0.0%) |
| 45 to 54 Years | 0 (0.0%) | 162 (100.0%) |
| 55 to 64 Years | 0 (0.0%) | 145 (100.0%) |
| 65 to 74 Years | 144 (100.0%) | 144 (100.0%) |
| 75 Years and over | 37 (100.0%) | 37 (100.0%) |
| Total | 187 (20.6%) | 894 (98.7%) |
Disability Status by Sex by Age in Teton Village
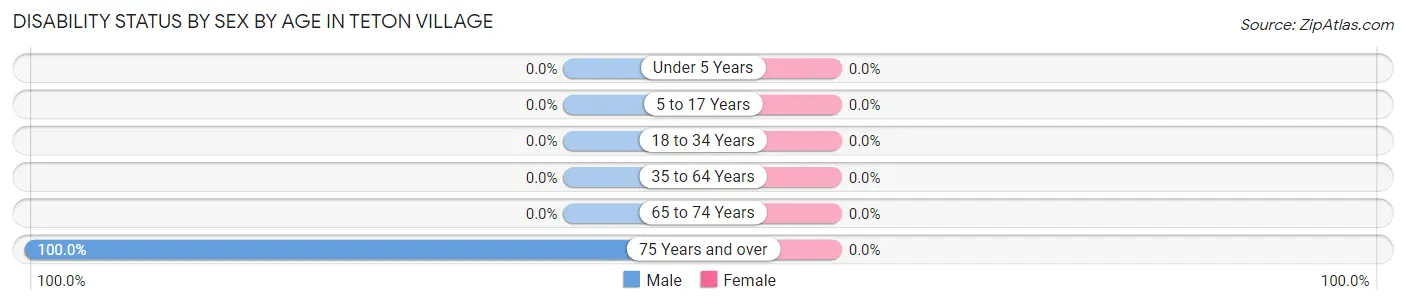
| Age Bracket | Male | Female |
| Under 5 Years | 0 (0.0%) | 0 (0.0%) |
| 5 to 17 Years | 0 (0.0%) | 0 (0.0%) |
| 18 to 34 Years | 0 (0.0%) | 0 (0.0%) |
| 35 to 64 Years | 0 (0.0%) | 0 (0.0%) |
| 65 to 74 Years | 0 (0.0%) | 0 (0.0%) |
| 75 Years and over | 37 (100.0%) | 0 (0.0%) |
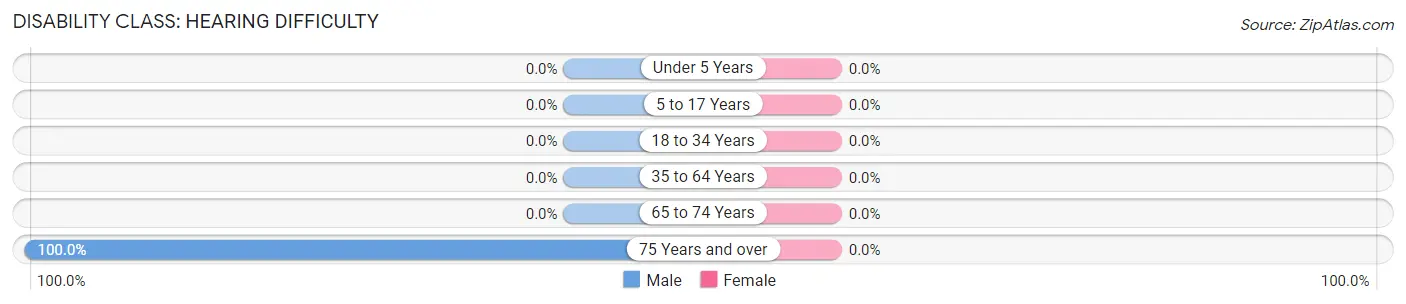
Disability Class by Sex by Age in Teton Village
Disability Class: Hearing Difficulty
| Age Bracket | Male | Female |
| Under 5 Years | 0 (0.0%) | 0 (0.0%) |
| 5 to 17 Years | 0 (0.0%) | 0 (0.0%) |
| 18 to 34 Years | 0 (0.0%) | 0 (0.0%) |
| 35 to 64 Years | 0 (0.0%) | 0 (0.0%) |
| 65 to 74 Years | 0 (0.0%) | 0 (0.0%) |
| 75 Years and over | 37 (100.0%) | 0 (0.0%) |
Disability Class: Vision Difficulty
| Age Bracket | Male | Female |
| Under 5 Years | 0 (0.0%) | 0 (0.0%) |
| 5 to 17 Years | 0 (0.0%) | 0 (0.0%) |
| 18 to 34 Years | 0 (0.0%) | 0 (0.0%) |
| 35 to 64 Years | 0 (0.0%) | 0 (0.0%) |
| 65 to 74 Years | 0 (0.0%) | 0 (0.0%) |
| 75 Years and over | 0 (0.0%) | 0 (0.0%) |
Disability Class: Cognitive Difficulty
| Age Bracket | Male | Female |
| 5 to 17 Years | 0 (0.0%) | 0 (0.0%) |
| 18 to 34 Years | 0 (0.0%) | 0 (0.0%) |
| 35 to 64 Years | 0 (0.0%) | 0 (0.0%) |
| 65 to 74 Years | 0 (0.0%) | 0 (0.0%) |
| 75 Years and over | 0 (0.0%) | 0 (0.0%) |
Disability Class: Ambulatory Difficulty
| Age Bracket | Male | Female |
| 5 to 17 Years | 0 (0.0%) | 0 (0.0%) |
| 18 to 34 Years | 0 (0.0%) | 0 (0.0%) |
| 35 to 64 Years | 0 (0.0%) | 0 (0.0%) |
| 65 to 74 Years | 0 (0.0%) | 0 (0.0%) |
| 75 Years and over | 0 (0.0%) | 0 (0.0%) |
Disability Class: Self-Care Difficulty
| Age Bracket | Male | Female |
| 5 to 17 Years | 0 (0.0%) | 0 (0.0%) |
| 18 to 34 Years | 0 (0.0%) | 0 (0.0%) |
| 35 to 64 Years | 0 (0.0%) | 0 (0.0%) |
| 65 to 74 Years | 0 (0.0%) | 0 (0.0%) |
| 75 Years and over | 0 (0.0%) | 0 (0.0%) |
Technology Access in Teton Village
Computing Device Access in Teton Village
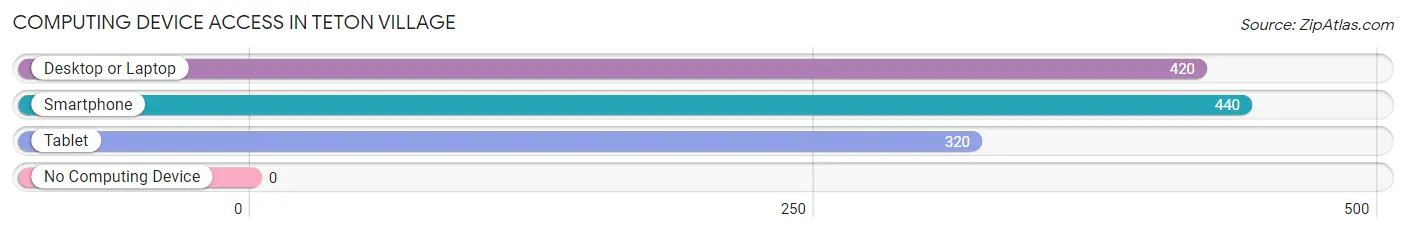
| Device Type | # Households | % Households |
| Desktop or Laptop | 420 | 95.5% |
| Smartphone | 440 | 100.0% |
| Tablet | 320 | 72.7% |
| No Computing Device | 0 | 0.0% |
| Total | 440 | 100.0% |
Internet Access in Teton Village
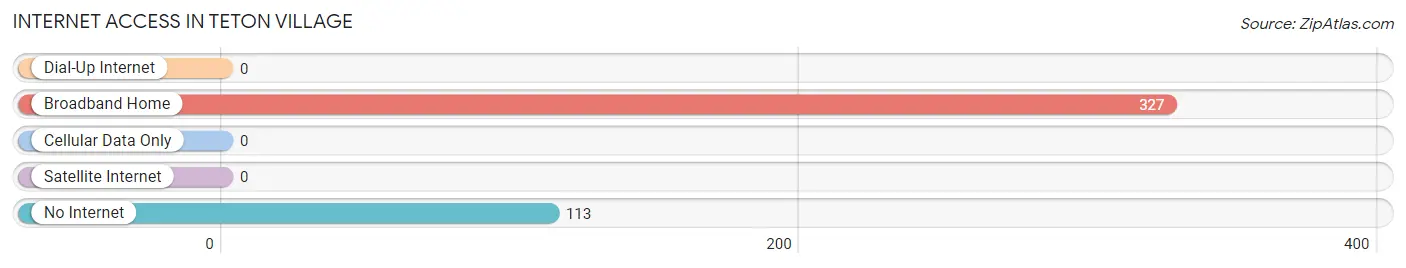
| Internet Type | # Households | % Households |
| Dial-Up Internet | 0 | 0.0% |
| Broadband Home | 327 | 74.3% |
| Cellular Data Only | 0 | 0.0% |
| Satellite Internet | 0 | 0.0% |
| No Internet | 113 | 25.7% |
| Total | 440 | 100.0% |
Teton Village Summary
Teton Village, Wyoming is a small unincorporated community located in the Jackson Hole valley of Teton County, Wyoming. It is situated at the base of the Jackson Hole Mountain Resort, one of the premier ski resorts in the United States. The village is home to a variety of businesses, including restaurants, lodging, and retail stores. It is also a popular destination for outdoor recreation, such as skiing, snowboarding, hiking, and mountain biking.
History
Teton Village was first settled in the late 1800s by homesteaders who were drawn to the area by its abundant natural resources. The first ski resort in the area, the Jackson Hole Ski Resort, was established in the 1930s. The resort quickly became a popular destination for skiers and snowboarders from around the world. In the 1950s, the area began to develop into a small community, with the construction of a post office, a general store, and a few other businesses.
In the 1960s, the Jackson Hole Mountain Resort was developed, and the area began to grow rapidly. The resort was expanded in the 1970s and 1980s, and the village began to attract more visitors. In the 1990s, the village was incorporated as an unincorporated community, and the population began to grow.
Geography
Teton Village is located in the Jackson Hole valley of Teton County, Wyoming. It is situated at the base of the Jackson Hole Mountain Resort, which is located in the Teton Range of the Rocky Mountains. The village is surrounded by the Bridger-Teton National Forest and is close to Grand Teton National Park. The village is located at an elevation of 6,200 feet (1,890 m).
Economy
Teton Village is primarily a tourist destination, with the Jackson Hole Mountain Resort being the main attraction. The resort offers a variety of activities, including skiing, snowboarding, hiking, and mountain biking. The village also has a variety of restaurants, lodging, and retail stores. Other businesses in the village include a post office, a general store, and a few other businesses.
Demographics
As of the 2010 census, the population of Teton Village was 1,717. The racial makeup of the village was 97.2% White, 0.2% African American, 0.3% Native American, 0.7% Asian, 0.1% Pacific Islander, 0.3% from other races, and 1.3% from two or more races. The median household income was $75,000, and the median family income was $87,000. The per capita income was $41,000. The village has a population density of 1,717 people per square mile (665/km2).
Common Questions
What is Per Capita Income in Teton Village?
Per Capita income in Teton Village is $99,319.
What is the Median Household income in Teton Village?
Median Household Income in Teton Village is $94,132.
What is Inequality or Gini Index in Teton Village?
Inequality or Gini Index in Teton Village is 0.61.
What is the Total Population of Teton Village?
Total Population of Teton Village is 906.
What is the Total Male Population of Teton Village?
Total Male Population of Teton Village is 407.
What is the Total Female Population of Teton Village?
Total Female Population of Teton Village is 499.
What is the Ratio of Males per 100 Females in Teton Village?
There are 81.56 Males per 100 Females in Teton Village.
What is the Ratio of Females per 100 Males in Teton Village?
There are 122.60 Females per 100 Males in Teton Village.
What is the Median Population Age in Teton Village?
Median Population Age in Teton Village is 51.7 Years.
What is the Average Family Size in Teton Village
Average Family Size in Teton Village is 2.8 People.
What is the Average Household Size in Teton Village
Average Household Size in Teton Village is 1.9 People.
How Large is the Labor Force in Teton Village?
There are 583 People in the Labor Forcein in Teton Village.
What is the Percentage of People in the Labor Force in Teton Village?
70.4% of People are in the Labor Force in Teton Village.
What is the Unemployment Rate in Teton Village?
Unemployment Rate in Teton Village is 0.9%.