Frenchburg, KY Map & Demographics
Frenchburg Map
Frenchburg Overview
$19,440
PER CAPITA INCOME
$29,028
AVG HOUSEHOLD INCOME
0.9%
WAGE / INCOME GAP [ % ]
99.1¢/ $1
WAGE / INCOME GAP [ $ ]
0.50
INEQUALITY / GINI INDEX
757
TOTAL POPULATION
464
MALE POPULATION
293
FEMALE POPULATION
158.36
MALES / 100 FEMALES
63.15
FEMALES / 100 MALES
30.6
MEDIAN AGE
3.8
AVG FAMILY SIZE
3.1
AVG HOUSEHOLD SIZE
304
LABOR FORCE [ PEOPLE ]
56.5%
PERCENT IN LABOR FORCE
4.3%
UNEMPLOYMENT RATE
Frenchburg Zip Codes
Frenchburg Area Codes
Income in Frenchburg
Income Overview in Frenchburg
| Characteristic | Number | Measure |
| Per Capita Income | 757 | $19,440 |
| Median Family Income | 164 | $0 |
| Mean Family Income | 164 | $66,729 |
| Median Household Income | 247 | $29,028 |
| Mean Household Income | 247 | $52,470 |
| Income Deficit | 164 | $0 |
| Wage / Income Gap (%) | 757 | 0.93% |
| Wage / Income Gap ($) | 757 | 99.07¢ per $1 |
| Gini / Inequality Index | 757 | 0.50 |
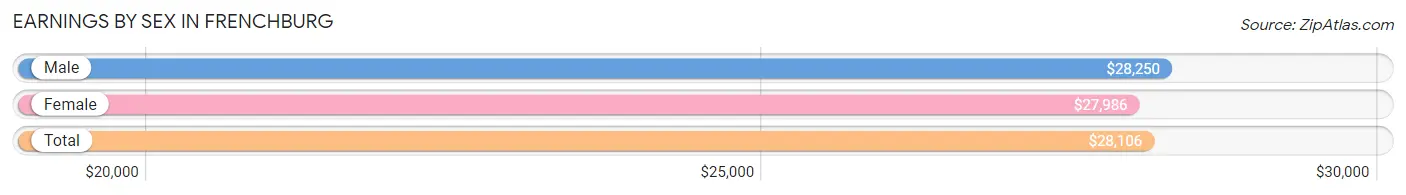
Earnings by Sex in Frenchburg
Average Earnings in Frenchburg are $28,106, $28,250 for men and $27,986 for women, a difference of 0.9%.
| Sex | Number | Average Earnings |
| Male | 173 (57.3%) | $28,250 |
| Female | 129 (42.7%) | $27,986 |
| Total | 302 (100.0%) | $28,106 |
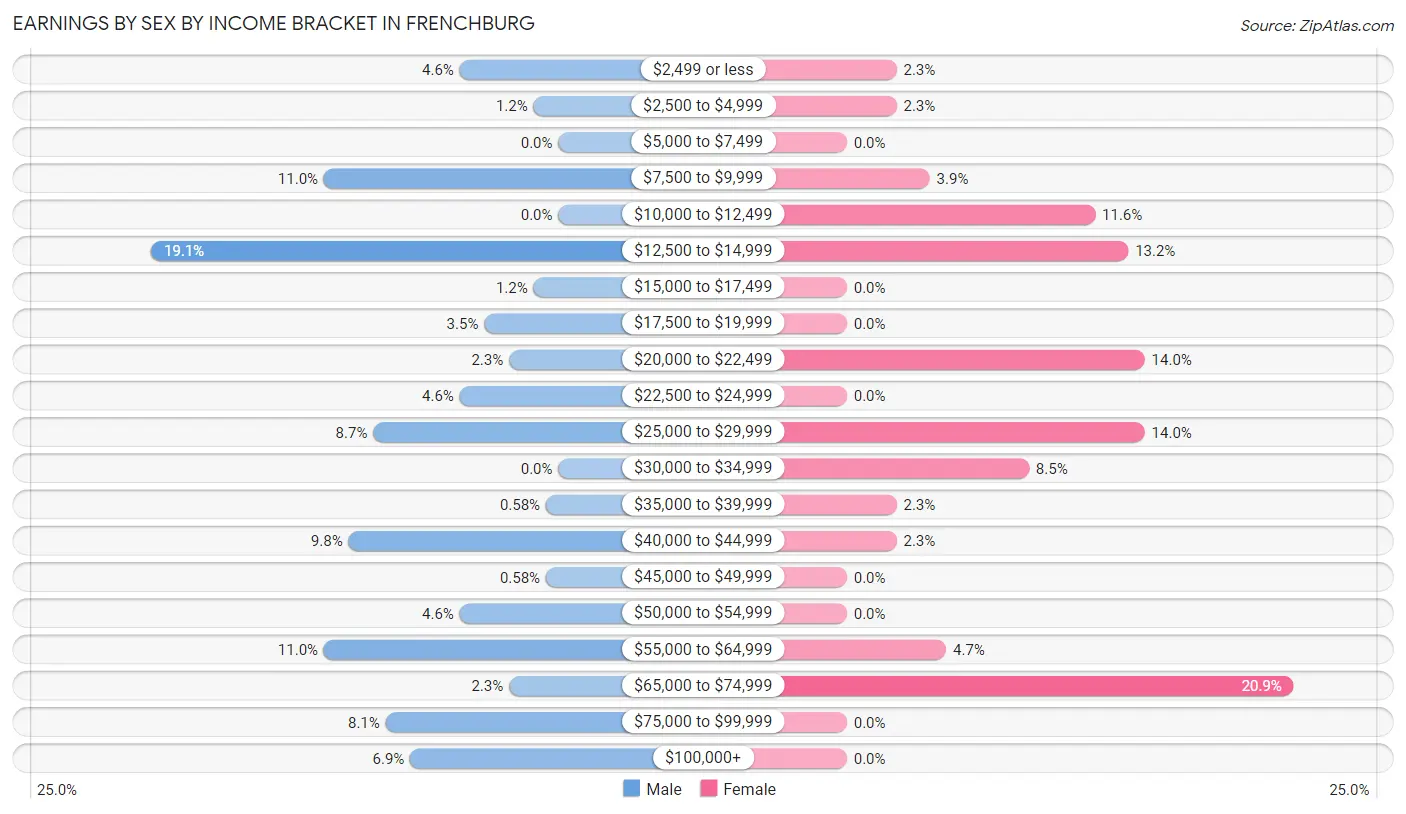
Earnings by Sex by Income Bracket in Frenchburg
The most common earnings brackets in Frenchburg are $12,500 to $14,999 for men (33 | 19.1%) and $65,000 to $74,999 for women (27 | 20.9%).
| Income | Male | Female |
| $2,499 or less | 8 (4.6%) | 3 (2.3%) |
| $2,500 to $4,999 | 2 (1.2%) | 3 (2.3%) |
| $5,000 to $7,499 | 0 (0.0%) | 0 (0.0%) |
| $7,500 to $9,999 | 19 (11.0%) | 5 (3.9%) |
| $10,000 to $12,499 | 0 (0.0%) | 15 (11.6%) |
| $12,500 to $14,999 | 33 (19.1%) | 17 (13.2%) |
| $15,000 to $17,499 | 2 (1.2%) | 0 (0.0%) |
| $17,500 to $19,999 | 6 (3.5%) | 0 (0.0%) |
| $20,000 to $22,499 | 4 (2.3%) | 18 (14.0%) |
| $22,500 to $24,999 | 8 (4.6%) | 0 (0.0%) |
| $25,000 to $29,999 | 15 (8.7%) | 18 (14.0%) |
| $30,000 to $34,999 | 0 (0.0%) | 11 (8.5%) |
| $35,000 to $39,999 | 1 (0.6%) | 3 (2.3%) |
| $40,000 to $44,999 | 17 (9.8%) | 3 (2.3%) |
| $45,000 to $49,999 | 1 (0.6%) | 0 (0.0%) |
| $50,000 to $54,999 | 8 (4.6%) | 0 (0.0%) |
| $55,000 to $64,999 | 19 (11.0%) | 6 (4.6%) |
| $65,000 to $74,999 | 4 (2.3%) | 27 (20.9%) |
| $75,000 to $99,999 | 14 (8.1%) | 0 (0.0%) |
| $100,000+ | 12 (6.9%) | 0 (0.0%) |
| Total | 173 (100.0%) | 129 (100.0%) |
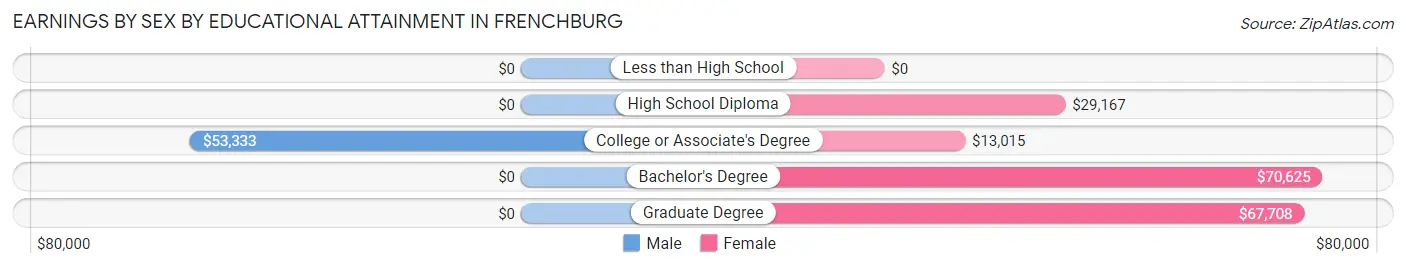
Earnings by Sex by Educational Attainment in Frenchburg
Average earnings in Frenchburg are $28,583 for men and $28,889 for women, a difference of 1.1%. Men with an educational attainment of college or associate's degree enjoy the highest average annual earnings of $53,333, while those with college or associate's degree education earn the least with $53,333. Women with an educational attainment of bachelor's degree earn the most with the average annual earnings of $70,625, while those with college or associate's degree education have the smallest earnings of $13,015.
| Educational Attainment | Male Income | Female Income |
| Less than High School | - | - |
| High School Diploma | - | - |
| College or Associate's Degree | $53,333 | $13,015 |
| Bachelor's Degree | - | - |
| Graduate Degree | - | - |
| Total | $28,583 | $28,889 |
Family Income in Frenchburg
Family Income Brackets in Frenchburg
According to the Frenchburg family income data, there are 34 families falling into the $100,000 to $149,999 income range, which is the most common income bracket and makes up 20.7% of all families.
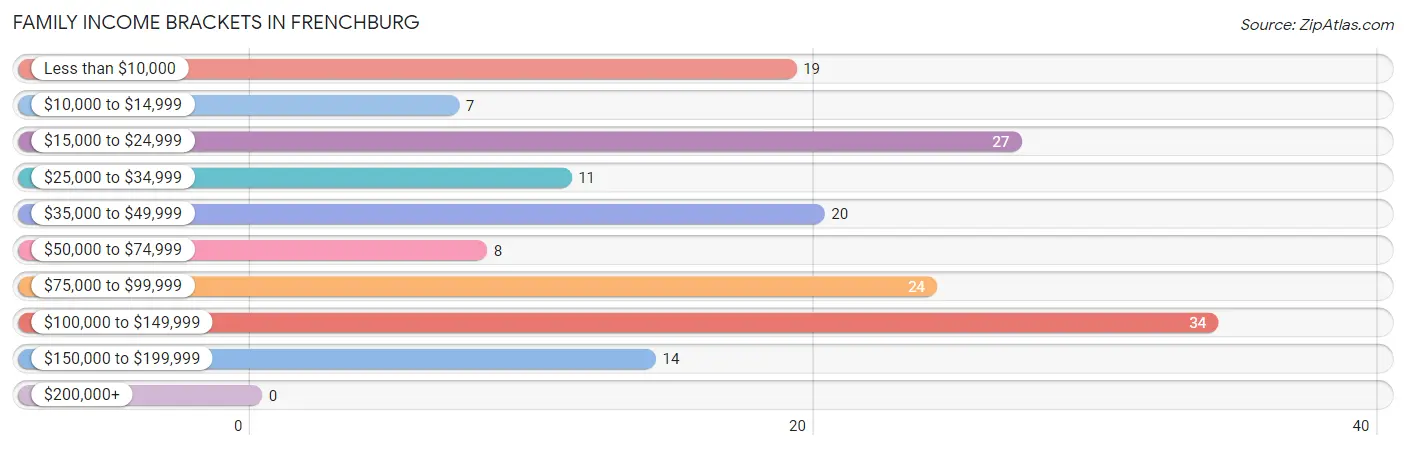
| Income Bracket | # Families | % Families |
| Less than $10,000 | 19 | 11.6% |
| $10,000 to $14,999 | 7 | 4.3% |
| $15,000 to $24,999 | 27 | 16.5% |
| $25,000 to $34,999 | 11 | 6.7% |
| $35,000 to $49,999 | 20 | 12.2% |
| $50,000 to $74,999 | 8 | 4.9% |
| $75,000 to $99,999 | 24 | 14.6% |
| $100,000 to $149,999 | 34 | 20.7% |
| $150,000 to $199,999 | 14 | 8.5% |
| $200,000+ | 0 | 0.0% |
Family Income by Famaliy Size in Frenchburg
3-person families (50 | 30.5%) account for the highest median family income in Frenchburg with $87,500 per family, while 3-person families (50 | 30.5%) have the highest median income of $29,167 per family member.
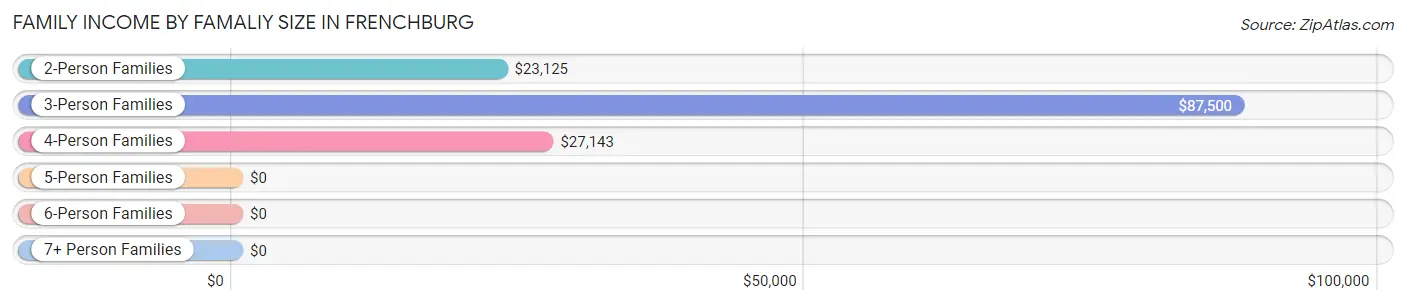
| Income Bracket | # Families | Median Income |
| 2-Person Families | 74 (45.1%) | $23,125 |
| 3-Person Families | 50 (30.5%) | $87,500 |
| 4-Person Families | 26 (15.9%) | $27,143 |
| 5-Person Families | 14 (8.5%) | $0 |
| 6-Person Families | 0 (0.0%) | $0 |
| 7+ Person Families | 0 (0.0%) | $0 |
| Total | 164 (100.0%) | $0 |
Family Income by Number of Earners in Frenchburg
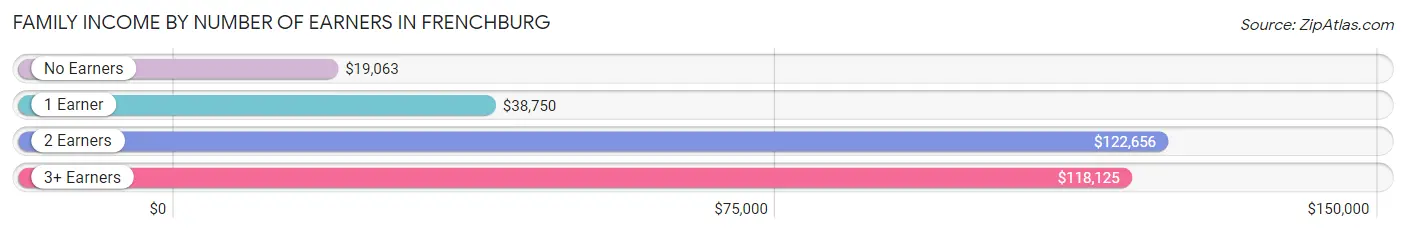
| Number of Earners | # Families | Median Income |
| No Earners | 51 (31.1%) | $19,063 |
| 1 Earner | 54 (32.9%) | $38,750 |
| 2 Earners | 41 (25.0%) | $122,656 |
| 3+ Earners | 18 (11.0%) | $118,125 |
| Total | 164 (100.0%) | $0 |
Household Income in Frenchburg
Household Income Brackets in Frenchburg
With 41 households falling in the category, the $15,000 to $24,999 income range is the most frequent in Frenchburg, accounting for 16.6% of all households.
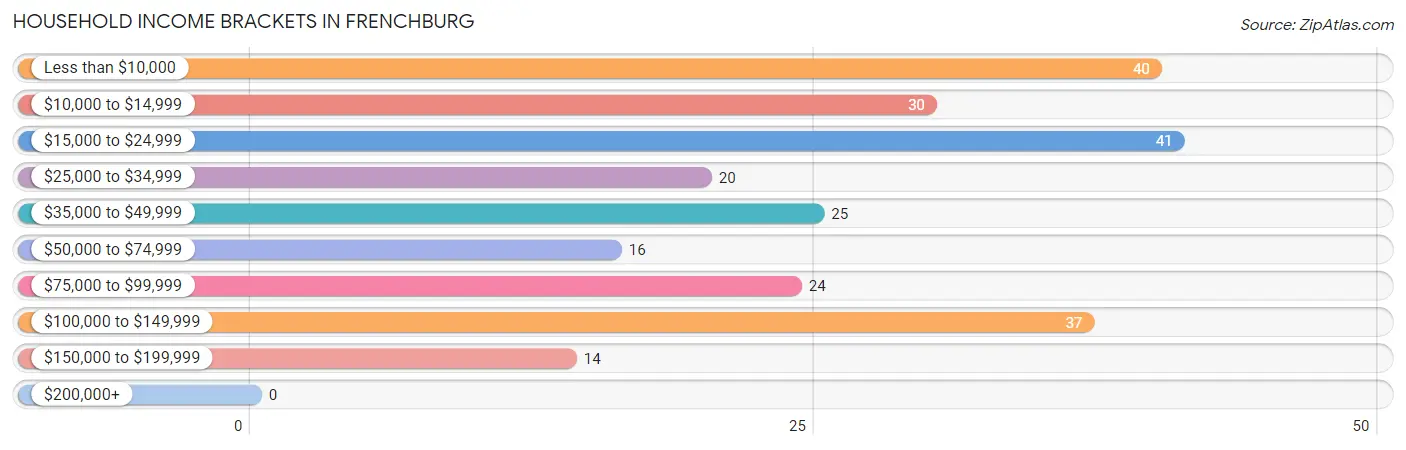
| Income Bracket | # Households | % Households |
| Less than $10,000 | 40 | 16.2% |
| $10,000 to $14,999 | 30 | 12.1% |
| $15,000 to $24,999 | 41 | 16.6% |
| $25,000 to $34,999 | 20 | 8.1% |
| $35,000 to $49,999 | 25 | 10.1% |
| $50,000 to $74,999 | 16 | 6.5% |
| $75,000 to $99,999 | 24 | 9.7% |
| $100,000 to $149,999 | 37 | 15.0% |
| $150,000 to $199,999 | 14 | 5.7% |
| $200,000+ | 0 | 0.0% |
Household Income by Householder Age in Frenchburg
The median household income in Frenchburg is $29,028, with the highest median household income of $77,679 found in the 45 to 64 years age bracket for the primary householder. A total of 63 households (25.5%) fall into this category. Meanwhile, the 15 to 24 years age bracket for the primary householder has the lowest median household income of $0, with 3 households (1.2%) in this group.
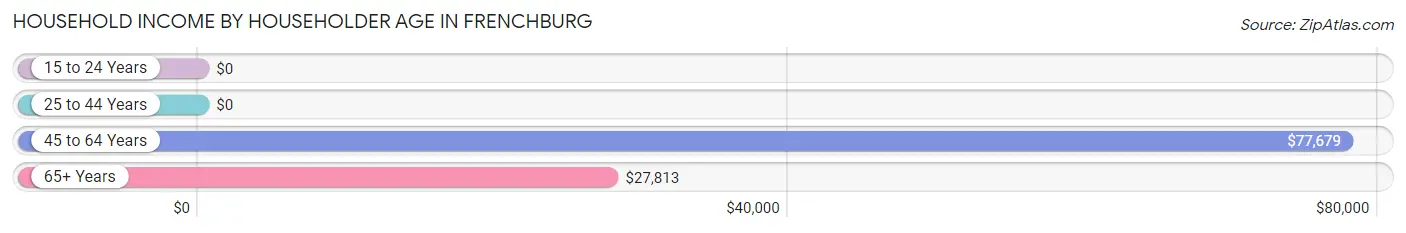
| Income Bracket | # Households | Median Income |
| 15 to 24 Years | 3 (1.2%) | $0 |
| 25 to 44 Years | 97 (39.3%) | $0 |
| 45 to 64 Years | 63 (25.5%) | $77,679 |
| 65+ Years | 84 (34.0%) | $27,813 |
| Total | 247 (100.0%) | $29,028 |
Poverty in Frenchburg
Income Below Poverty by Sex and Age in Frenchburg
With 36.0% poverty level for males and 27.7% for females among the residents of Frenchburg, 12 to 14 year old males and 5 year old females are the most vulnerable to poverty, with 60 males (78.9%) and 1 females (100.0%) in their respective age groups living below the poverty level.
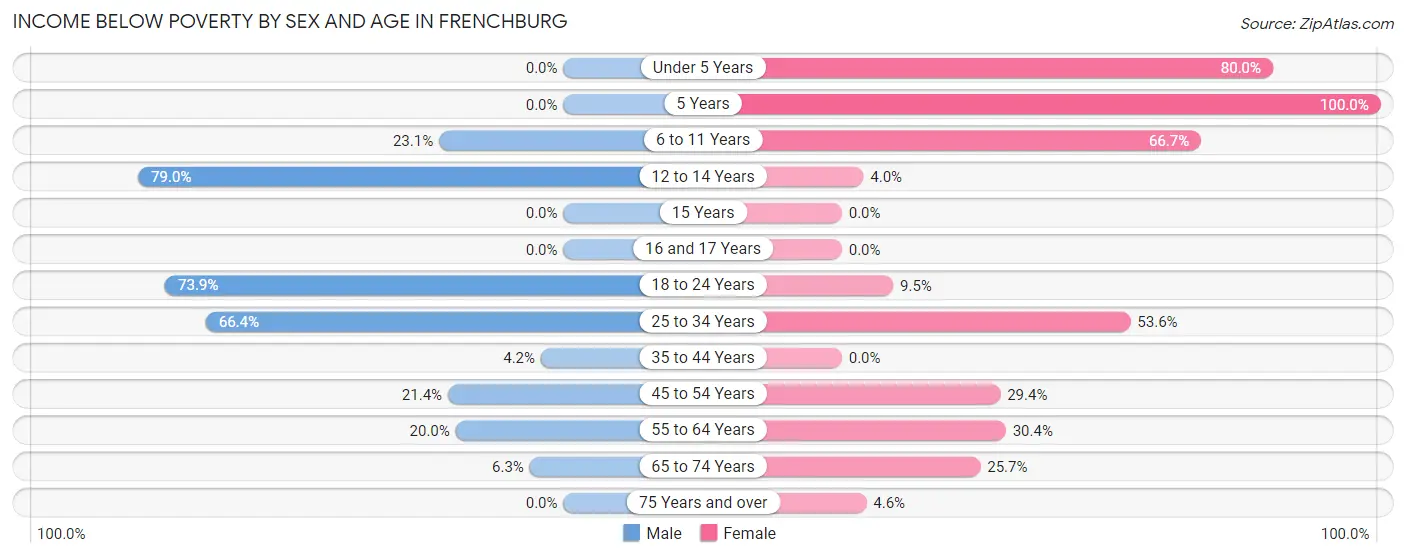
| Age Bracket | Male | Female |
| Under 5 Years | 0 (0.0%) | 4 (80.0%) |
| 5 Years | 0 (0.0%) | 1 (100.0%) |
| 6 to 11 Years | 3 (23.1%) | 16 (66.7%) |
| 12 to 14 Years | 60 (78.9%) | 1 (4.0%) |
| 15 Years | 0 (0.0%) | 0 (0.0%) |
| 16 and 17 Years | 0 (0.0%) | 0 (0.0%) |
| 18 to 24 Years | 17 (73.9%) | 2 (9.5%) |
| 25 to 34 Years | 71 (66.4%) | 30 (53.6%) |
| 35 to 44 Years | 2 (4.2%) | 0 (0.0%) |
| 45 to 54 Years | 3 (21.4%) | 10 (29.4%) |
| 55 to 64 Years | 9 (20.0%) | 7 (30.4%) |
| 65 to 74 Years | 2 (6.2%) | 9 (25.7%) |
| 75 Years and over | 0 (0.0%) | 1 (4.5%) |
| Total | 167 (36.0%) | 81 (27.7%) |
Income Above Poverty by Sex and Age in Frenchburg
According to the poverty statistics in Frenchburg, males aged under 5 years and females aged 16 and 17 years are the age groups that are most secure financially, with 100.0% of males and 100.0% of females in these age groups living above the poverty line.
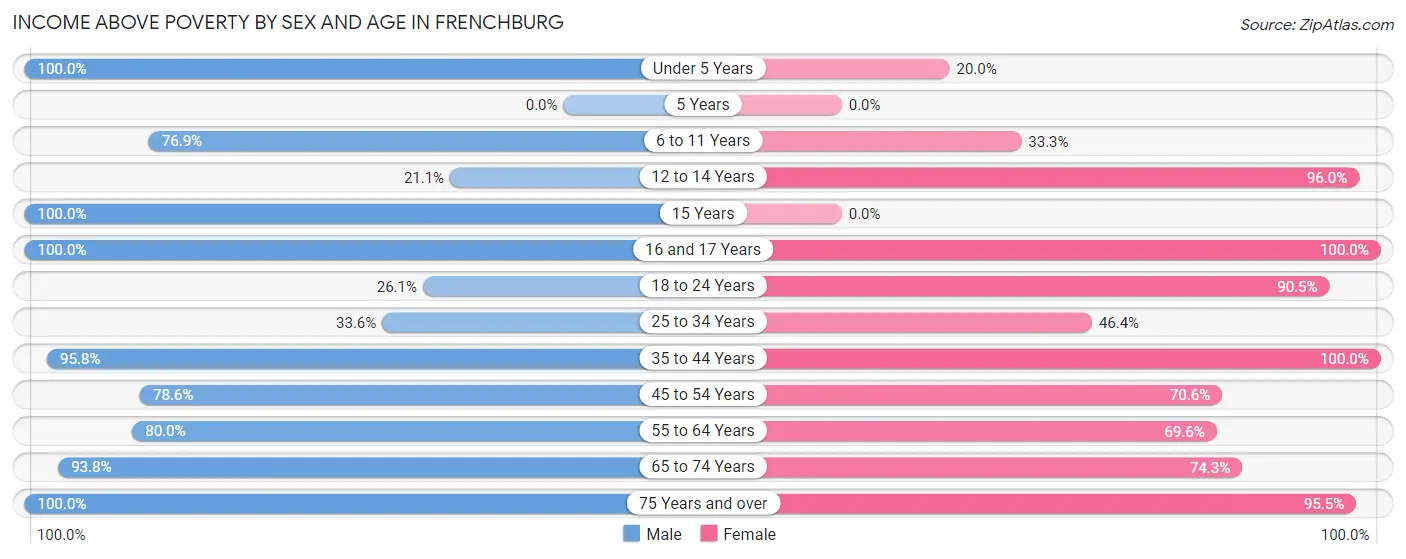
| Age Bracket | Male | Female |
| Under 5 Years | 71 (100.0%) | 1 (20.0%) |
| 5 Years | 0 (0.0%) | 0 (0.0%) |
| 6 to 11 Years | 10 (76.9%) | 8 (33.3%) |
| 12 to 14 Years | 16 (21.0%) | 24 (96.0%) |
| 15 Years | 4 (100.0%) | 0 (0.0%) |
| 16 and 17 Years | 2 (100.0%) | 9 (100.0%) |
| 18 to 24 Years | 6 (26.1%) | 19 (90.5%) |
| 25 to 34 Years | 36 (33.6%) | 26 (46.4%) |
| 35 to 44 Years | 46 (95.8%) | 38 (100.0%) |
| 45 to 54 Years | 11 (78.6%) | 24 (70.6%) |
| 55 to 64 Years | 36 (80.0%) | 16 (69.6%) |
| 65 to 74 Years | 30 (93.8%) | 26 (74.3%) |
| 75 Years and over | 29 (100.0%) | 21 (95.5%) |
| Total | 297 (64.0%) | 212 (72.4%) |
Income Below Poverty Among Married-Couple Families in Frenchburg
The poverty statistics for married-couple families in Frenchburg show that 15.0% or 18 of the total 120 families live below the poverty line. Families with 1 or 2 children have the highest poverty rate of 43.8%, comprising of 14 families. On the other hand, families with no children have the lowest poverty rate of 1.3%, which includes 1 families.
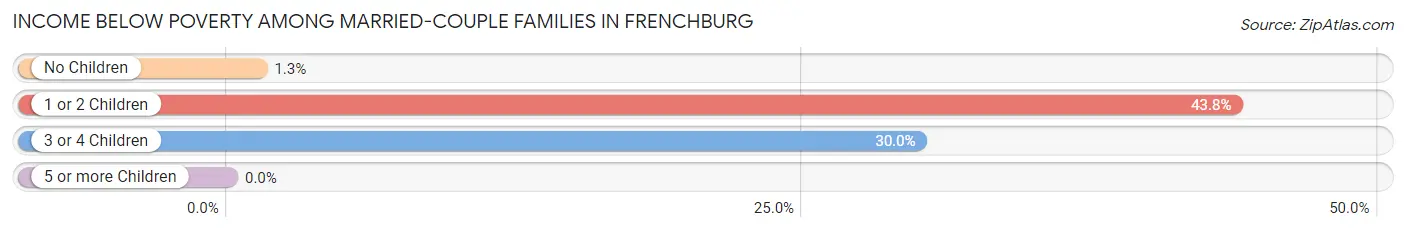
| Children | Above Poverty | Below Poverty |
| No Children | 77 (98.7%) | 1 (1.3%) |
| 1 or 2 Children | 18 (56.2%) | 14 (43.8%) |
| 3 or 4 Children | 7 (70.0%) | 3 (30.0%) |
| 5 or more Children | 0 (0.0%) | 0 (0.0%) |
| Total | 102 (85.0%) | 18 (15.0%) |
Income Below Poverty Among Single-Parent Households in Frenchburg
According to the poverty data in Frenchburg, 63.2% or 12 single-father households and 44.0% or 11 single-mother households are living below the poverty line. Among single-father households, those with 1 or 2 children have the highest poverty rate, with 12 households (100.0%) experiencing poverty. Likewise, among single-mother households, those with no children have the highest poverty rate, with 4 households (100.0%) falling below the poverty line.
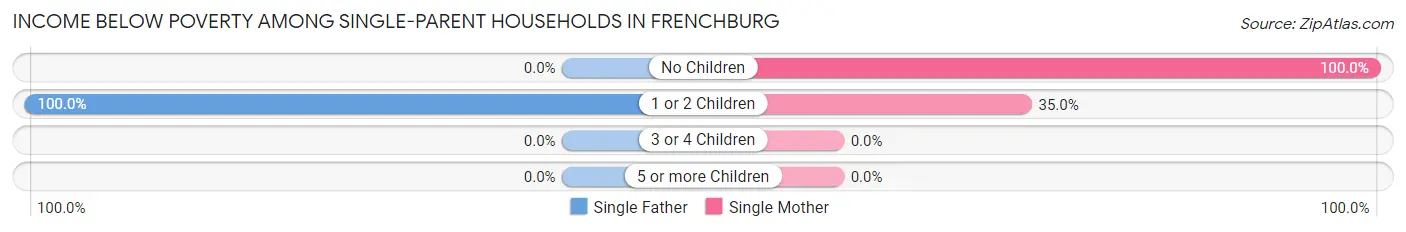
| Children | Single Father | Single Mother |
| No Children | 0 (0.0%) | 4 (100.0%) |
| 1 or 2 Children | 12 (100.0%) | 7 (35.0%) |
| 3 or 4 Children | 0 (0.0%) | 0 (0.0%) |
| 5 or more Children | 0 (0.0%) | 0 (0.0%) |
| Total | 12 (63.2%) | 11 (44.0%) |
Income Below Poverty Among Married-Couple vs Single-Parent Households in Frenchburg
The poverty data for Frenchburg shows that 18 of the married-couple family households (15.0%) and 23 of the single-parent households (52.3%) are living below the poverty level. Within the married-couple family households, those with 1 or 2 children have the highest poverty rate, with 14 households (43.8%) falling below the poverty line. Among the single-parent households, those with 1 or 2 children have the highest poverty rate, with 19 household (59.4%) living below poverty.
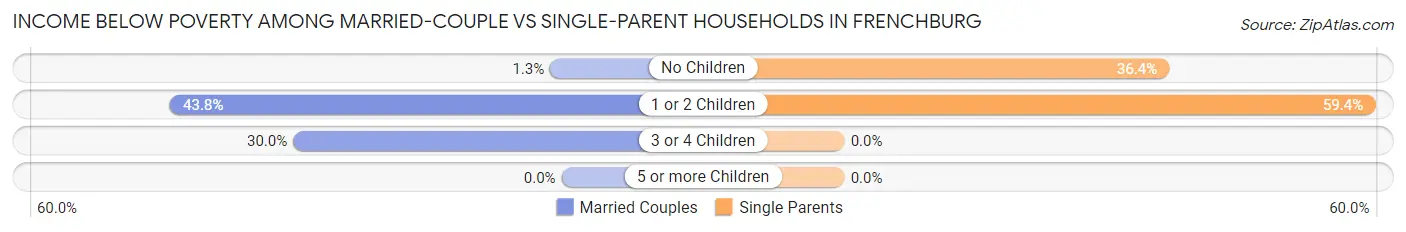
| Children | Married-Couple Families | Single-Parent Households |
| No Children | 1 (1.3%) | 4 (36.4%) |
| 1 or 2 Children | 14 (43.8%) | 19 (59.4%) |
| 3 or 4 Children | 3 (30.0%) | 0 (0.0%) |
| 5 or more Children | 0 (0.0%) | 0 (0.0%) |
| Total | 18 (15.0%) | 23 (52.3%) |
Race in Frenchburg
The most populous races in Frenchburg are White / Caucasian (756 | 99.9%), Hispanic or Latino (81 | 10.7%), and Two or more Races (1 | 0.1%).
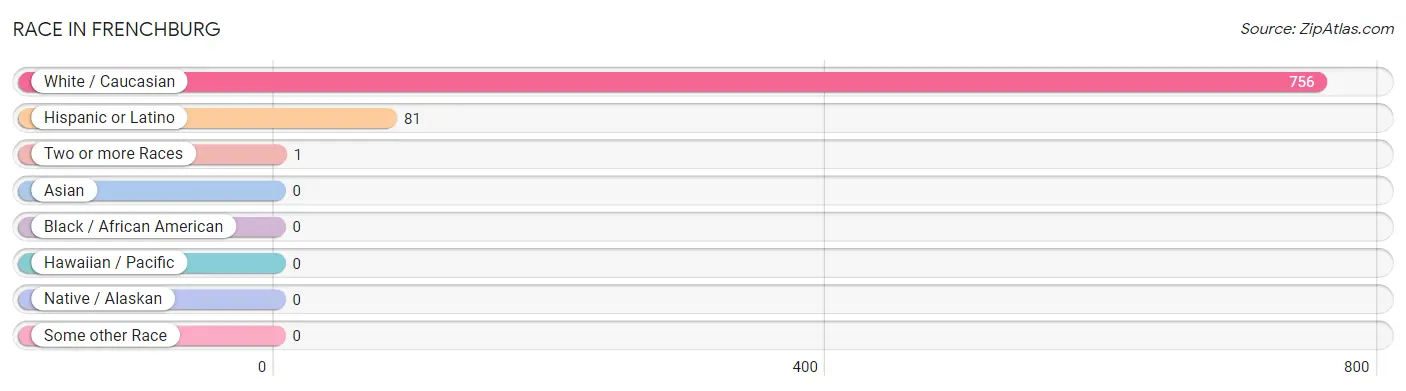
| Race | # Population | % Population |
| Asian | 0 | 0.0% |
| Black / African American | 0 | 0.0% |
| Hawaiian / Pacific | 0 | 0.0% |
| Hispanic or Latino | 81 | 10.7% |
| Native / Alaskan | 0 | 0.0% |
| White / Caucasian | 756 | 99.9% |
| Two or more Races | 1 | 0.1% |
| Some other Race | 0 | 0.0% |
| Total | 757 | 100.0% |
Ancestry in Frenchburg
The most populous ancestries reported in Frenchburg are American (325 | 42.9%), English (51 | 6.7%), Peruvian (49 | 6.5%), South American (49 | 6.5%), and Irish (40 | 5.3%), together accounting for 67.9% of all Frenchburg residents.
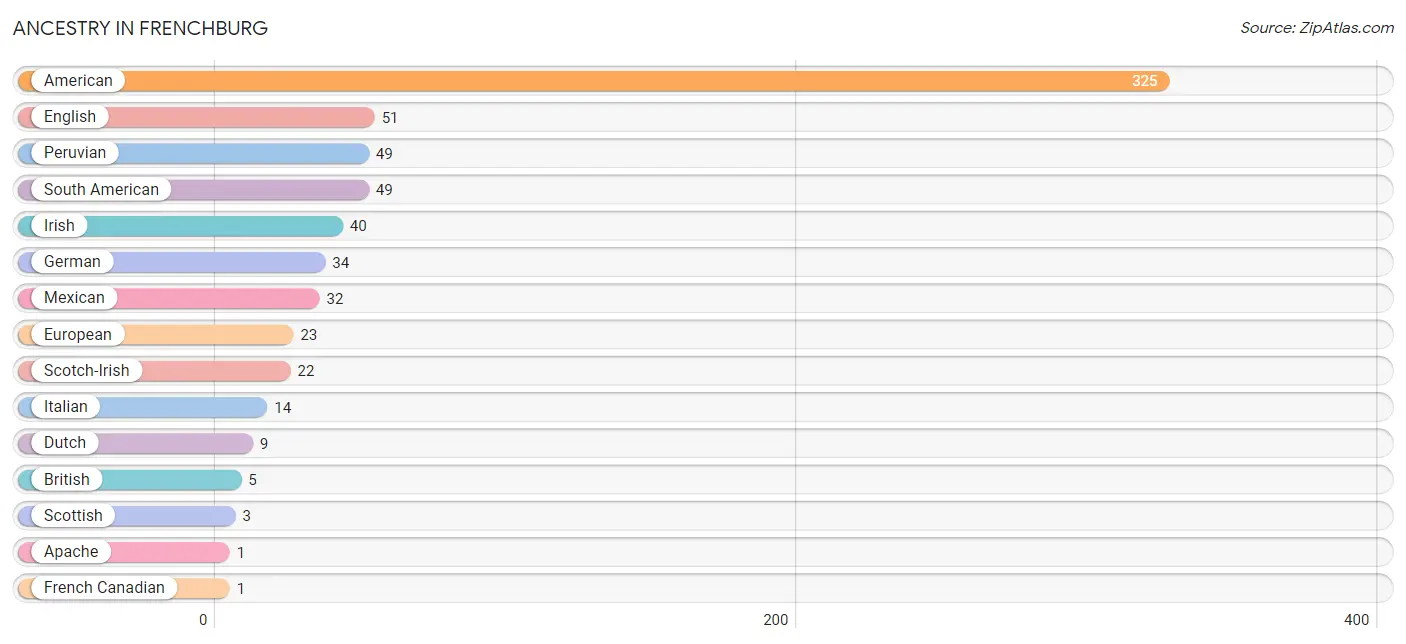
| Ancestry | # Population | % Population |
| American | 325 | 42.9% |
| Apache | 1 | 0.1% |
| British | 5 | 0.7% |
| Dutch | 9 | 1.2% |
| English | 51 | 6.7% |
| European | 23 | 3.0% |
| French Canadian | 1 | 0.1% |
| German | 34 | 4.5% |
| Irish | 40 | 5.3% |
| Iroquois | 1 | 0.1% |
| Italian | 14 | 1.8% |
| Mexican | 32 | 4.2% |
| Peruvian | 49 | 6.5% |
| Scotch-Irish | 22 | 2.9% |
| Scottish | 3 | 0.4% |
| South American | 49 | 6.5% | View All 16 Rows |
Immigrants in Frenchburg
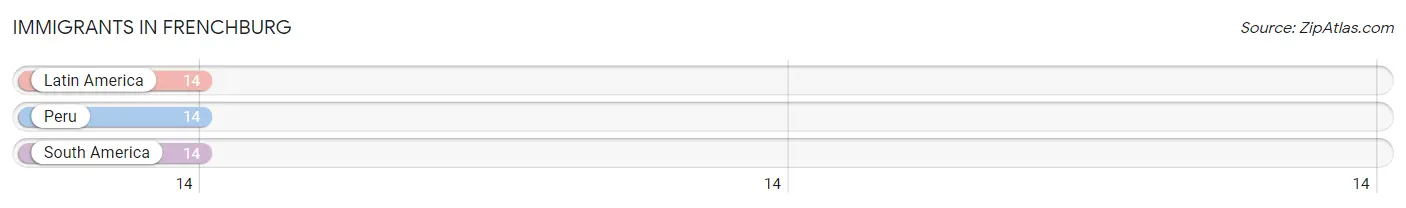
The most numerous immigrant groups reported in Frenchburg came from Latin America (14 | 1.8%), Peru (14 | 1.8%), and South America (14 | 1.8%), together accounting for 5.5% of all Frenchburg residents.
| Immigration Origin | # Population | % Population |
| Latin America | 14 | 1.8% |
| Peru | 14 | 1.8% |
| South America | 14 | 1.8% | View All 3 Rows |
Sex and Age in Frenchburg
Sex and Age in Frenchburg
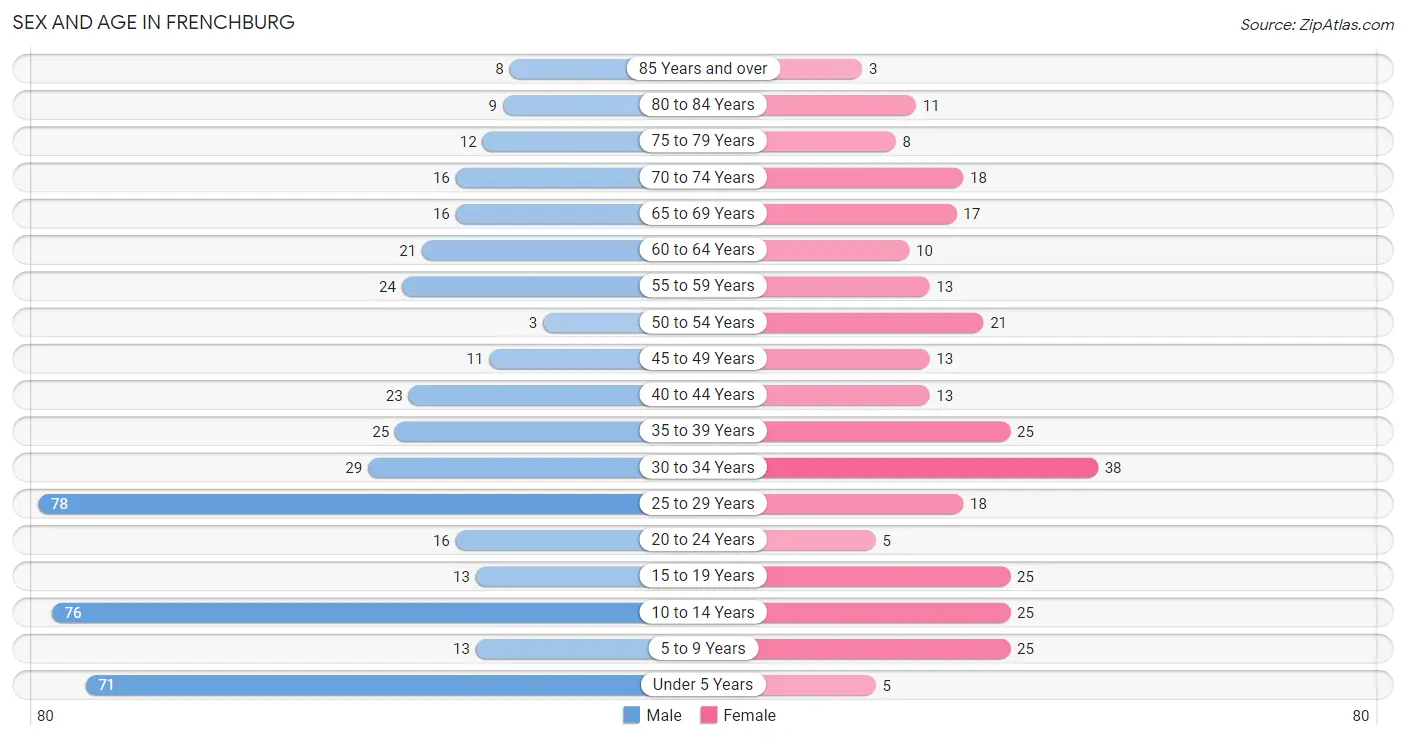
The most populous age groups in Frenchburg are 25 to 29 Years (78 | 16.8%) for men and 30 to 34 Years (38 | 13.0%) for women.
| Age Bracket | Male | Female |
| Under 5 Years | 71 (15.3%) | 5 (1.7%) |
| 5 to 9 Years | 13 (2.8%) | 25 (8.5%) |
| 10 to 14 Years | 76 (16.4%) | 25 (8.5%) |
| 15 to 19 Years | 13 (2.8%) | 25 (8.5%) |
| 20 to 24 Years | 16 (3.5%) | 5 (1.7%) |
| 25 to 29 Years | 78 (16.8%) | 18 (6.1%) |
| 30 to 34 Years | 29 (6.2%) | 38 (13.0%) |
| 35 to 39 Years | 25 (5.4%) | 25 (8.5%) |
| 40 to 44 Years | 23 (5.0%) | 13 (4.4%) |
| 45 to 49 Years | 11 (2.4%) | 13 (4.4%) |
| 50 to 54 Years | 3 (0.6%) | 21 (7.2%) |
| 55 to 59 Years | 24 (5.2%) | 13 (4.4%) |
| 60 to 64 Years | 21 (4.5%) | 10 (3.4%) |
| 65 to 69 Years | 16 (3.5%) | 17 (5.8%) |
| 70 to 74 Years | 16 (3.5%) | 18 (6.1%) |
| 75 to 79 Years | 12 (2.6%) | 8 (2.7%) |
| 80 to 84 Years | 9 (1.9%) | 11 (3.7%) |
| 85 Years and over | 8 (1.7%) | 3 (1.0%) |
| Total | 464 (100.0%) | 293 (100.0%) |
Families and Households in Frenchburg
Median Family Size in Frenchburg
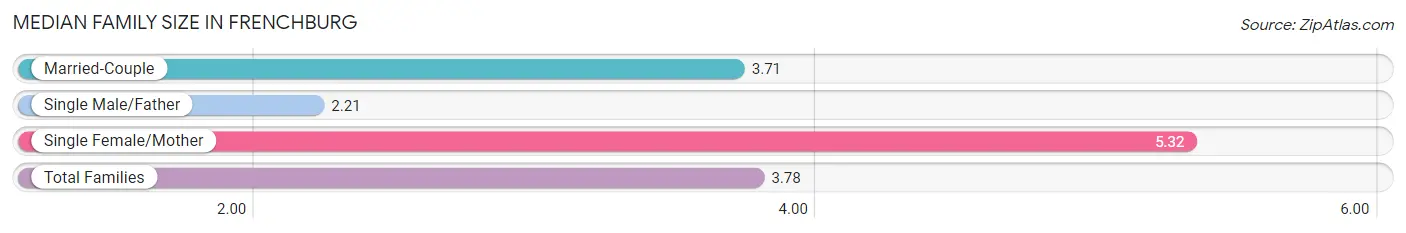
The median family size in Frenchburg is 3.78 persons per family, with single female/mother families (25 | 15.2%) accounting for the largest median family size of 5.32 persons per family. On the other hand, single male/father families (19 | 11.6%) represent the smallest median family size with 2.21 persons per family.
| Family Type | # Families | Family Size |
| Married-Couple | 120 (73.2%) | 3.71 |
| Single Male/Father | 19 (11.6%) | 2.21 |
| Single Female/Mother | 25 (15.2%) | 5.32 |
| Total Families | 164 (100.0%) | 3.78 |
Median Household Size in Frenchburg
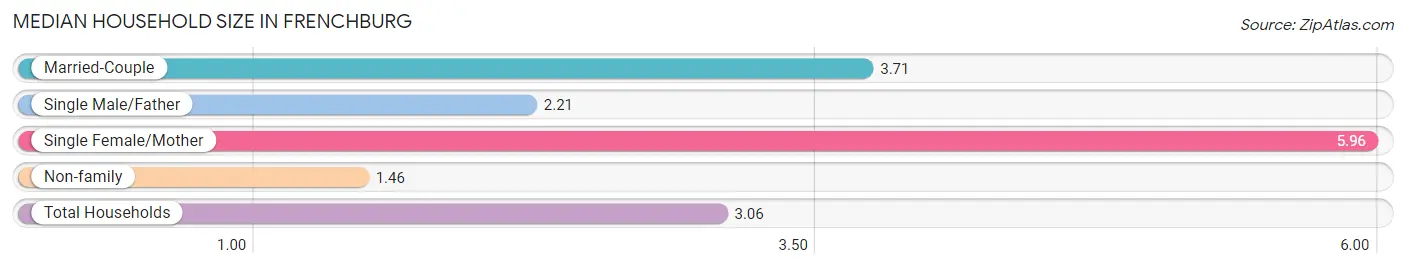
The median household size in Frenchburg is 3.06 persons per household, with single female/mother households (25 | 10.1%) accounting for the largest median household size of 5.96 persons per household. non-family households (83 | 33.6%) represent the smallest median household size with 1.46 persons per household.
| Household Type | # Households | Household Size |
| Married-Couple | 120 (48.6%) | 3.71 |
| Single Male/Father | 19 (7.7%) | 2.21 |
| Single Female/Mother | 25 (10.1%) | 5.96 |
| Non-family | 83 (33.6%) | 1.46 |
| Total Households | 247 (100.0%) | 3.06 |
Household Size by Marriage Status in Frenchburg
Out of a total of 247 households in Frenchburg, 164 (66.4%) are family households, while 83 (33.6%) are nonfamily households. The most numerous type of family households are 2-person households, comprising 74, and the most common type of nonfamily households are 1-person households, comprising 71.
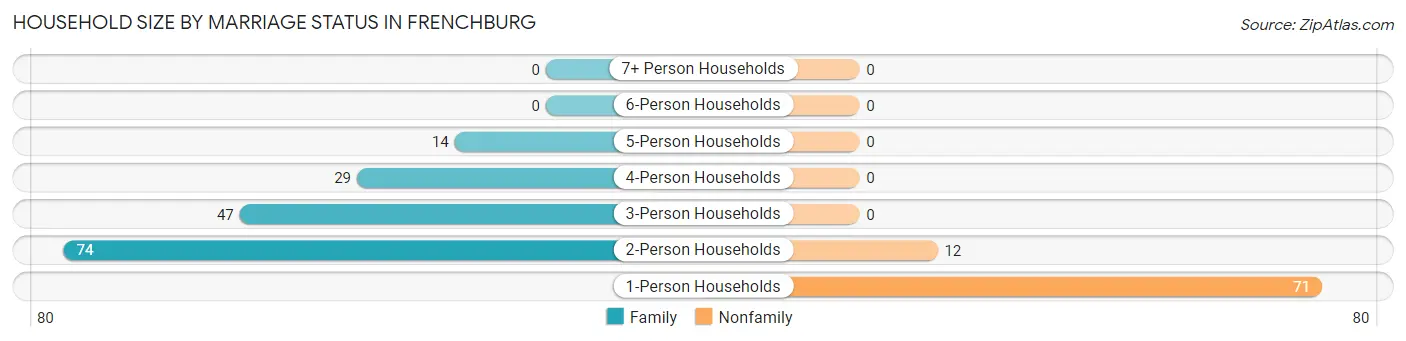
| Household Size | Family Households | Nonfamily Households |
| 1-Person Households | - | 71 (28.7%) |
| 2-Person Households | 74 (30.0%) | 12 (4.9%) |
| 3-Person Households | 47 (19.0%) | 0 (0.0%) |
| 4-Person Households | 29 (11.7%) | 0 (0.0%) |
| 5-Person Households | 14 (5.7%) | 0 (0.0%) |
| 6-Person Households | 0 (0.0%) | 0 (0.0%) |
| 7+ Person Households | 0 (0.0%) | 0 (0.0%) |
| Total | 164 (66.4%) | 83 (33.6%) |
Female Fertility in Frenchburg
Fertility by Age in Frenchburg
| Age Bracket | Women with Births | Births / 1,000 Women |
| 15 to 19 years | 0 (0.0%) | 0.0 |
| 20 to 34 years | 0 (0.0%) | 0.0 |
| 35 to 50 years | 0 (0.0%) | 0.0 |
| Total | 0 (0.0%) | 0.0 |
Fertility by Age by Marriage Status in Frenchburg
| Age Bracket | Married | Unmarried |
| 15 to 19 years | 0 (0.0%) | 0 (0.0%) |
| 20 to 34 years | 0 (0.0%) | 0 (0.0%) |
| 35 to 50 years | 0 (0.0%) | 0 (0.0%) |
| Total | 0 (0.0%) | 0 (0.0%) |
Fertility by Education in Frenchburg
| Educational Attainment | Women with Births | Births / 1,000 Women |
| Less than High School | 0 (0.0%) | 0.0 |
| High School Diploma | 0 (0.0%) | 0.0 |
| College or Associate's Degree | 0 (0.0%) | 0.0 |
| Bachelor's Degree | 0 (0.0%) | 0.0 |
| Graduate Degree | 0 (0.0%) | 0.0 |
| Total | 0 (0.0%) | 0.0 |
Fertility by Education by Marriage Status in Frenchburg
| Educational Attainment | Married | Unmarried |
| Less than High School | 0 (0.0%) | 0 (0.0%) |
| High School Diploma | 0 (0.0%) | 0 (0.0%) |
| College or Associate's Degree | 0 (0.0%) | 0 (0.0%) |
| Bachelor's Degree | 0 (0.0%) | 0 (0.0%) |
| Graduate Degree | 0 (0.0%) | 0 (0.0%) |
| Total | 0 (0.0%) | 0 (0.0%) |
Employment Characteristics in Frenchburg
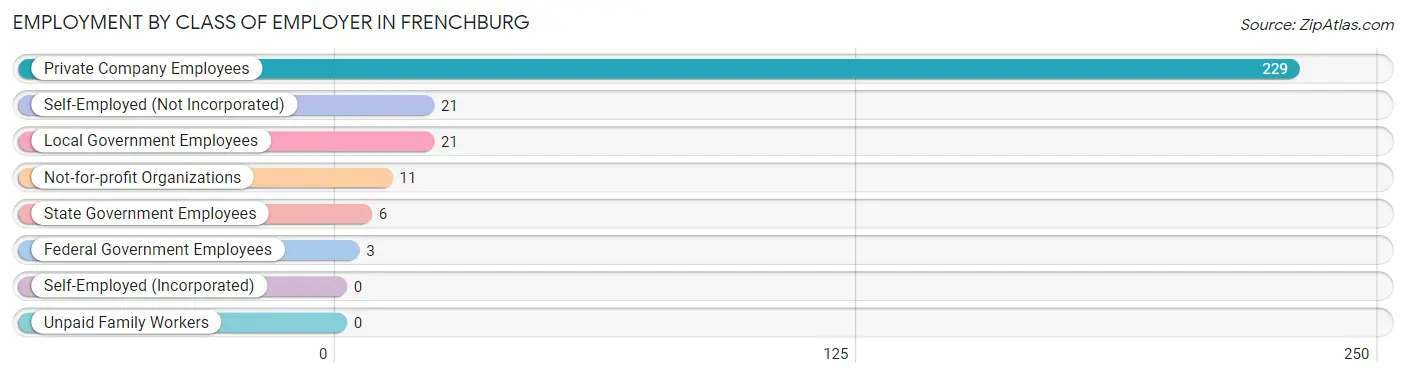
Employment by Class of Employer in Frenchburg
Among the 291 employed individuals in Frenchburg, private company employees (229 | 78.7%), self-employed (not incorporated) (21 | 7.2%), and local government employees (21 | 7.2%) make up the most common classes of employment.
| Employer Class | # Employees | % Employees |
| Private Company Employees | 229 | 78.7% |
| Self-Employed (Incorporated) | 0 | 0.0% |
| Self-Employed (Not Incorporated) | 21 | 7.2% |
| Not-for-profit Organizations | 11 | 3.8% |
| Local Government Employees | 21 | 7.2% |
| State Government Employees | 6 | 2.1% |
| Federal Government Employees | 3 | 1.0% |
| Unpaid Family Workers | 0 | 0.0% |
| Total | 291 | 100.0% |
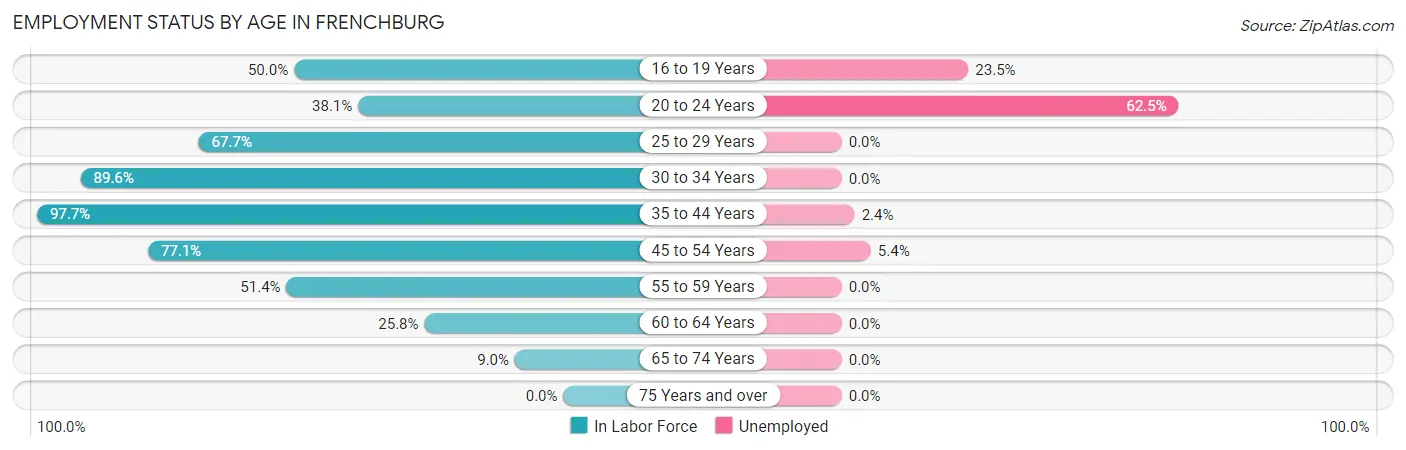
Employment Status by Age in Frenchburg
According to the labor force statistics for Frenchburg, out of the total population over 16 years of age (538), 56.5% or 304 individuals are in the labor force, with 4.3% or 13 of them unemployed. The age group with the highest labor force participation rate is 35 to 44 years, with 97.7% or 84 individuals in the labor force. Within the labor force, the 20 to 24 years age range has the highest percentage of unemployed individuals, with 62.5% or 5 of them being unemployed.
| Age Bracket | In Labor Force | Unemployed |
| 16 to 19 Years | 17 (50.0%) | 4 (23.5%) |
| 20 to 24 Years | 8 (38.1%) | 5 (62.5%) |
| 25 to 29 Years | 65 (67.7%) | 0 (0.0%) |
| 30 to 34 Years | 60 (89.6%) | 0 (0.0%) |
| 35 to 44 Years | 84 (97.7%) | 2 (2.4%) |
| 45 to 54 Years | 37 (77.1%) | 2 (5.4%) |
| 55 to 59 Years | 19 (51.4%) | 0 (0.0%) |
| 60 to 64 Years | 8 (25.8%) | 0 (0.0%) |
| 65 to 74 Years | 6 (9.0%) | 0 (0.0%) |
| 75 Years and over | 0 (0.0%) | 0 (0.0%) |
| Total | 304 (56.5%) | 13 (4.3%) |
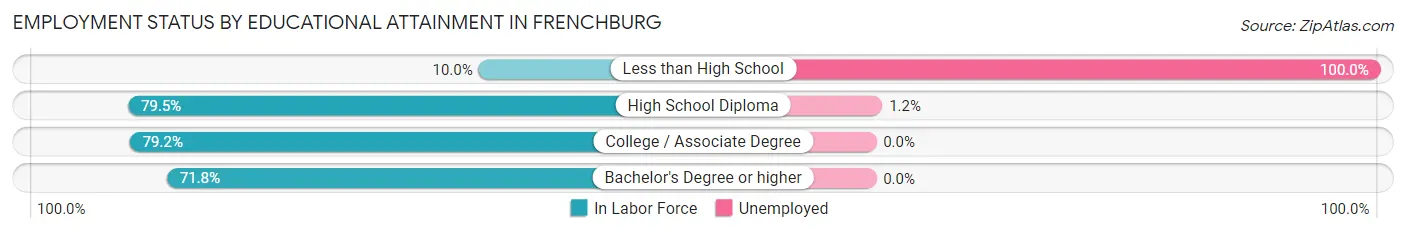
Employment Status by Educational Attainment in Frenchburg
According to labor force statistics for Frenchburg, 74.8% of individuals (273) out of the total population between 25 and 64 years of age (365) are in the labor force, with 1.5% or 4 of them being unemployed. The group with the highest labor force participation rate are those with the educational attainment of high school diploma, with 79.5% or 167 individuals in the labor force. Within the labor force, individuals with less than high school education have the highest percentage of unemployment, with 100.0% or 2 of them being unemployed.
| Educational Attainment | In Labor Force | Unemployed |
| Less than High School | 2 (10.0%) | 20 (100.0%) |
| High School Diploma | 167 (79.5%) | 3 (1.2%) |
| College / Associate Degree | 76 (79.2%) | 0 (0.0%) |
| Bachelor's Degree or higher | 28 (71.8%) | 0 (0.0%) |
| Total | 273 (74.8%) | 5 (1.5%) |
Employment Occupations by Sex in Frenchburg
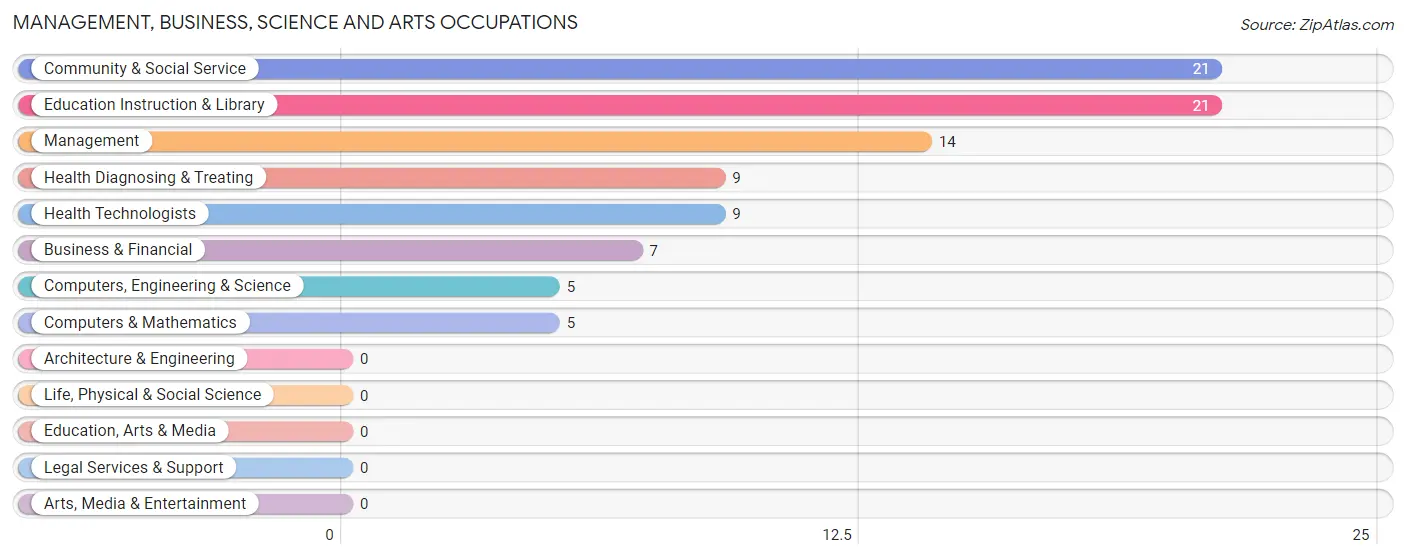
Management, Business, Science and Arts Occupations
The most common Management, Business, Science and Arts occupations in Frenchburg are Community & Social Service (21 | 7.2%), Education Instruction & Library (21 | 7.2%), Management (14 | 4.8%), Health Diagnosing & Treating (9 | 3.1%), and Health Technologists (9 | 3.1%).
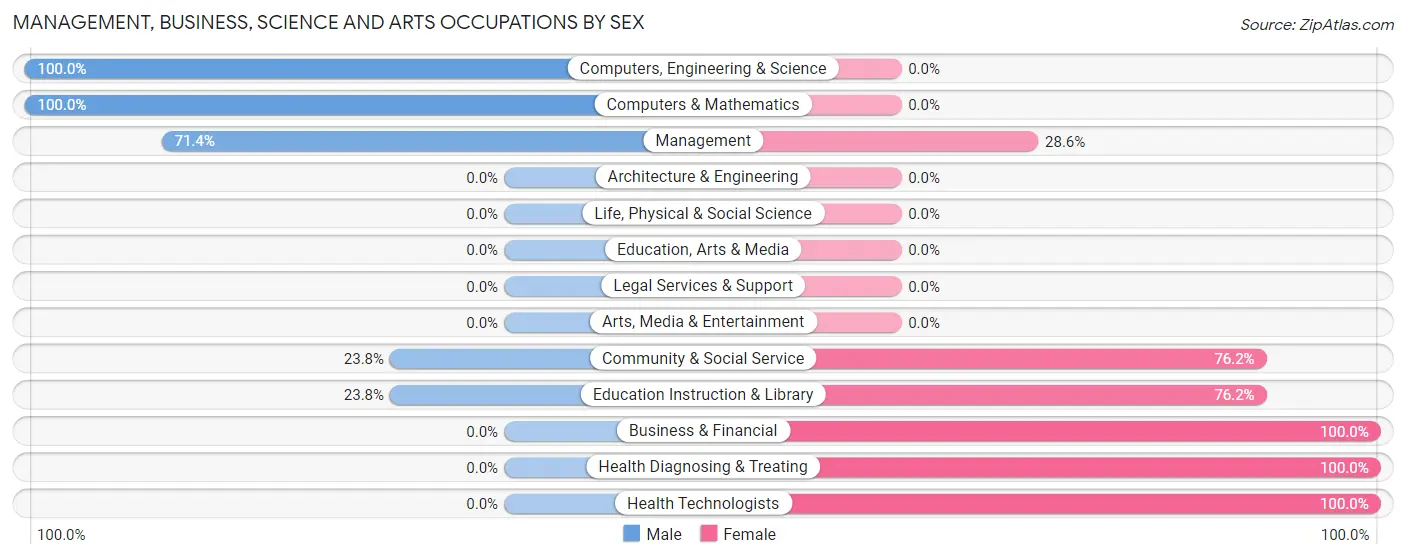
Management, Business, Science and Arts Occupations by Sex
Within the Management, Business, Science and Arts occupations in Frenchburg, the most male-oriented occupations are Computers, Engineering & Science (100.0%), Computers & Mathematics (100.0%), and Management (71.4%), while the most female-oriented occupations are Business & Financial (100.0%), Health Diagnosing & Treating (100.0%), and Health Technologists (100.0%).
| Occupation | Male | Female |
| Management | 10 (71.4%) | 4 (28.6%) |
| Business & Financial | 0 (0.0%) | 7 (100.0%) |
| Computers, Engineering & Science | 5 (100.0%) | 0 (0.0%) |
| Computers & Mathematics | 5 (100.0%) | 0 (0.0%) |
| Architecture & Engineering | 0 (0.0%) | 0 (0.0%) |
| Life, Physical & Social Science | 0 (0.0%) | 0 (0.0%) |
| Community & Social Service | 5 (23.8%) | 16 (76.2%) |
| Education, Arts & Media | 0 (0.0%) | 0 (0.0%) |
| Legal Services & Support | 0 (0.0%) | 0 (0.0%) |
| Education Instruction & Library | 5 (23.8%) | 16 (76.2%) |
| Arts, Media & Entertainment | 0 (0.0%) | 0 (0.0%) |
| Health Diagnosing & Treating | 0 (0.0%) | 9 (100.0%) |
| Health Technologists | 0 (0.0%) | 9 (100.0%) |
| Total (Category) | 20 (35.7%) | 36 (64.3%) |
| Total (Overall) | 167 (57.4%) | 124 (42.6%) |
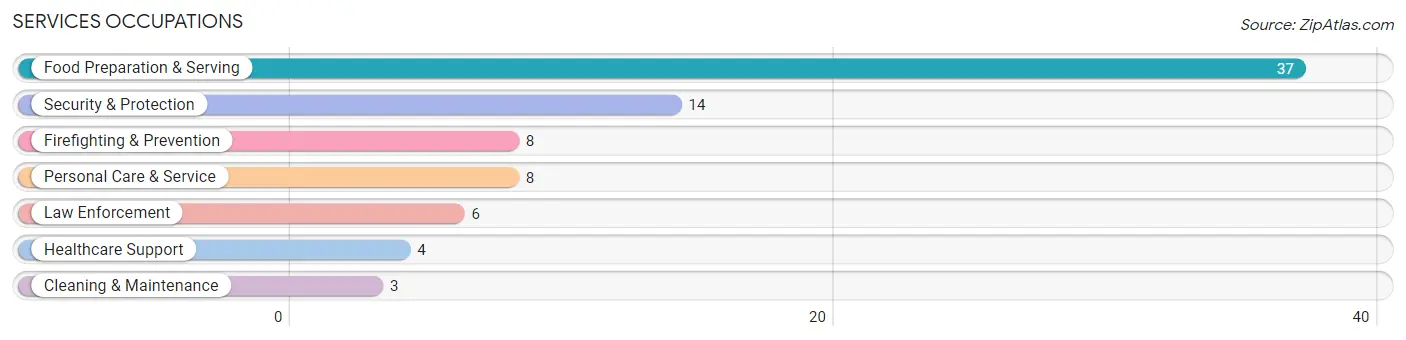
Services Occupations
The most common Services occupations in Frenchburg are Food Preparation & Serving (37 | 12.7%), Security & Protection (14 | 4.8%), Firefighting & Prevention (8 | 2.8%), Personal Care & Service (8 | 2.8%), and Law Enforcement (6 | 2.1%).
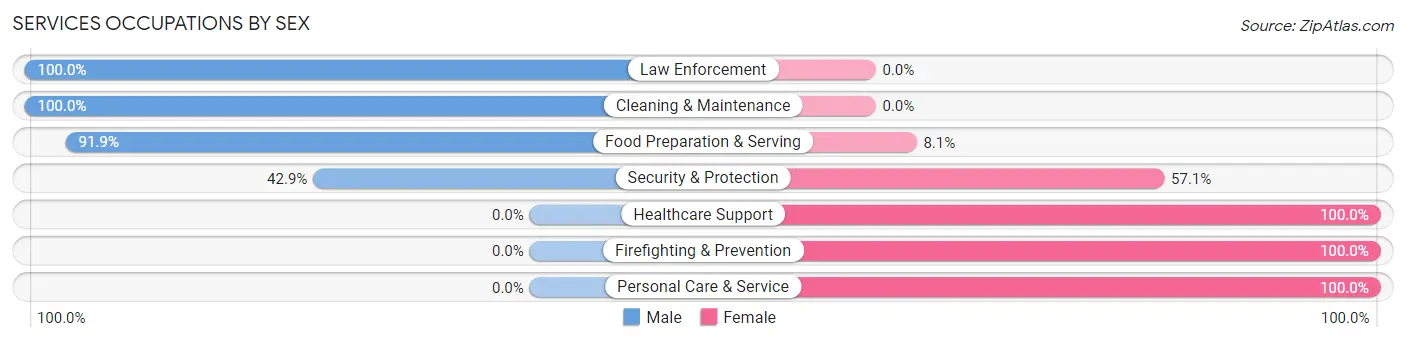
Services Occupations by Sex
Within the Services occupations in Frenchburg, the most male-oriented occupations are Law Enforcement (100.0%), Cleaning & Maintenance (100.0%), and Food Preparation & Serving (91.9%), while the most female-oriented occupations are Healthcare Support (100.0%), Firefighting & Prevention (100.0%), and Personal Care & Service (100.0%).
| Occupation | Male | Female |
| Healthcare Support | 0 (0.0%) | 4 (100.0%) |
| Security & Protection | 6 (42.9%) | 8 (57.1%) |
| Firefighting & Prevention | 0 (0.0%) | 8 (100.0%) |
| Law Enforcement | 6 (100.0%) | 0 (0.0%) |
| Food Preparation & Serving | 34 (91.9%) | 3 (8.1%) |
| Cleaning & Maintenance | 3 (100.0%) | 0 (0.0%) |
| Personal Care & Service | 0 (0.0%) | 8 (100.0%) |
| Total (Category) | 43 (65.1%) | 23 (34.8%) |
| Total (Overall) | 167 (57.4%) | 124 (42.6%) |
Sales and Office Occupations
The most common Sales and Office occupations in Frenchburg are Sales & Related (47 | 16.2%), and Office & Administration (1 | 0.3%).
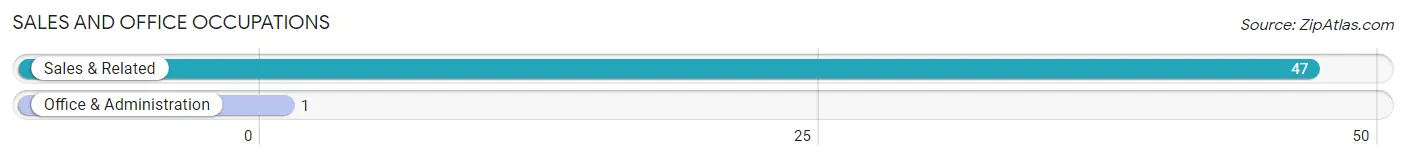
Sales and Office Occupations by Sex
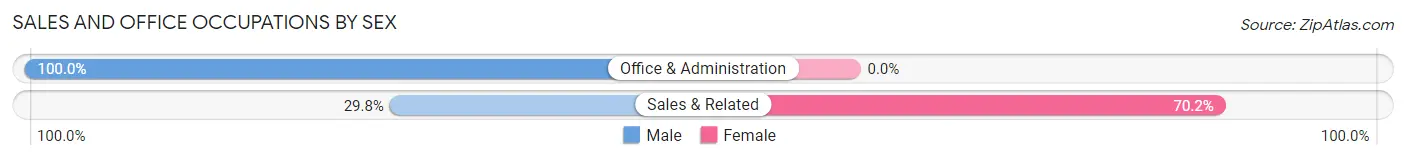
| Occupation | Male | Female |
| Sales & Related | 14 (29.8%) | 33 (70.2%) |
| Office & Administration | 1 (100.0%) | 0 (0.0%) |
| Total (Category) | 15 (31.2%) | 33 (68.8%) |
| Total (Overall) | 167 (57.4%) | 124 (42.6%) |
Natural Resources, Construction and Maintenance Occupations
The most common Natural Resources, Construction and Maintenance occupations in Frenchburg are Construction & Extraction (46 | 15.8%), Installation, Maintenance & Repair (13 | 4.5%), and Farming, Fishing & Forestry (3 | 1.0%).
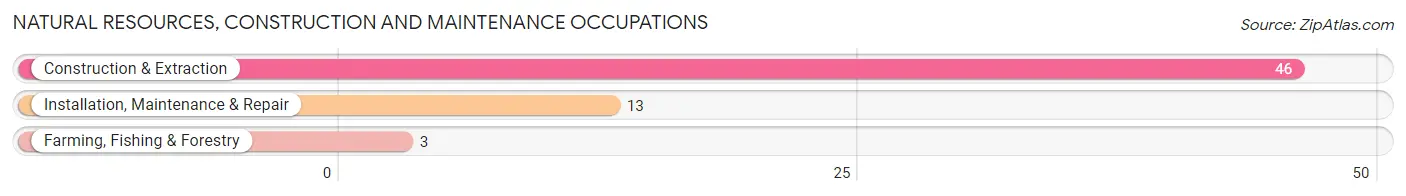
Natural Resources, Construction and Maintenance Occupations by Sex
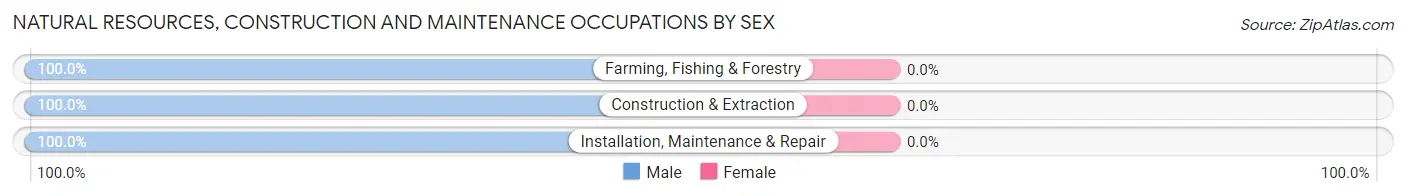
| Occupation | Male | Female |
| Farming, Fishing & Forestry | 3 (100.0%) | 0 (0.0%) |
| Construction & Extraction | 46 (100.0%) | 0 (0.0%) |
| Installation, Maintenance & Repair | 13 (100.0%) | 0 (0.0%) |
| Total (Category) | 62 (100.0%) | 0 (0.0%) |
| Total (Overall) | 167 (57.4%) | 124 (42.6%) |
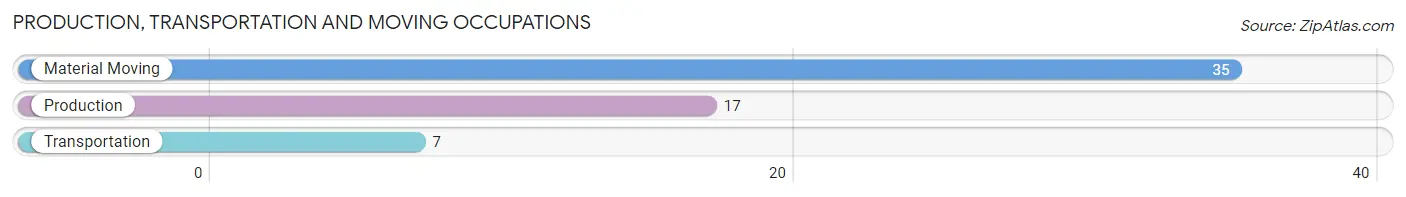
Production, Transportation and Moving Occupations
The most common Production, Transportation and Moving occupations in Frenchburg are Material Moving (35 | 12.0%), Production (17 | 5.8%), and Transportation (7 | 2.4%).
Production, Transportation and Moving Occupations by Sex
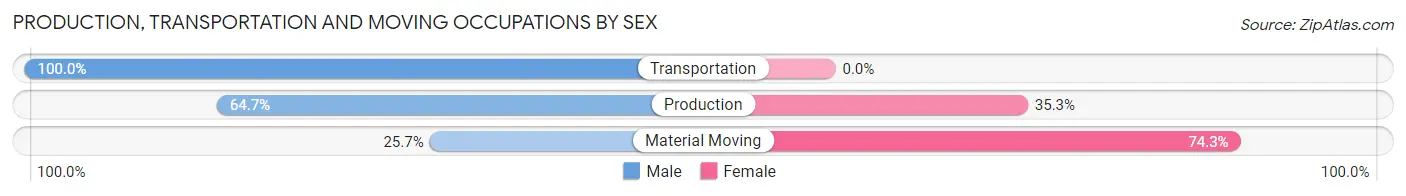
| Occupation | Male | Female |
| Production | 11 (64.7%) | 6 (35.3%) |
| Transportation | 7 (100.0%) | 0 (0.0%) |
| Material Moving | 9 (25.7%) | 26 (74.3%) |
| Total (Category) | 27 (45.8%) | 32 (54.2%) |
| Total (Overall) | 167 (57.4%) | 124 (42.6%) |
Employment Industries by Sex in Frenchburg
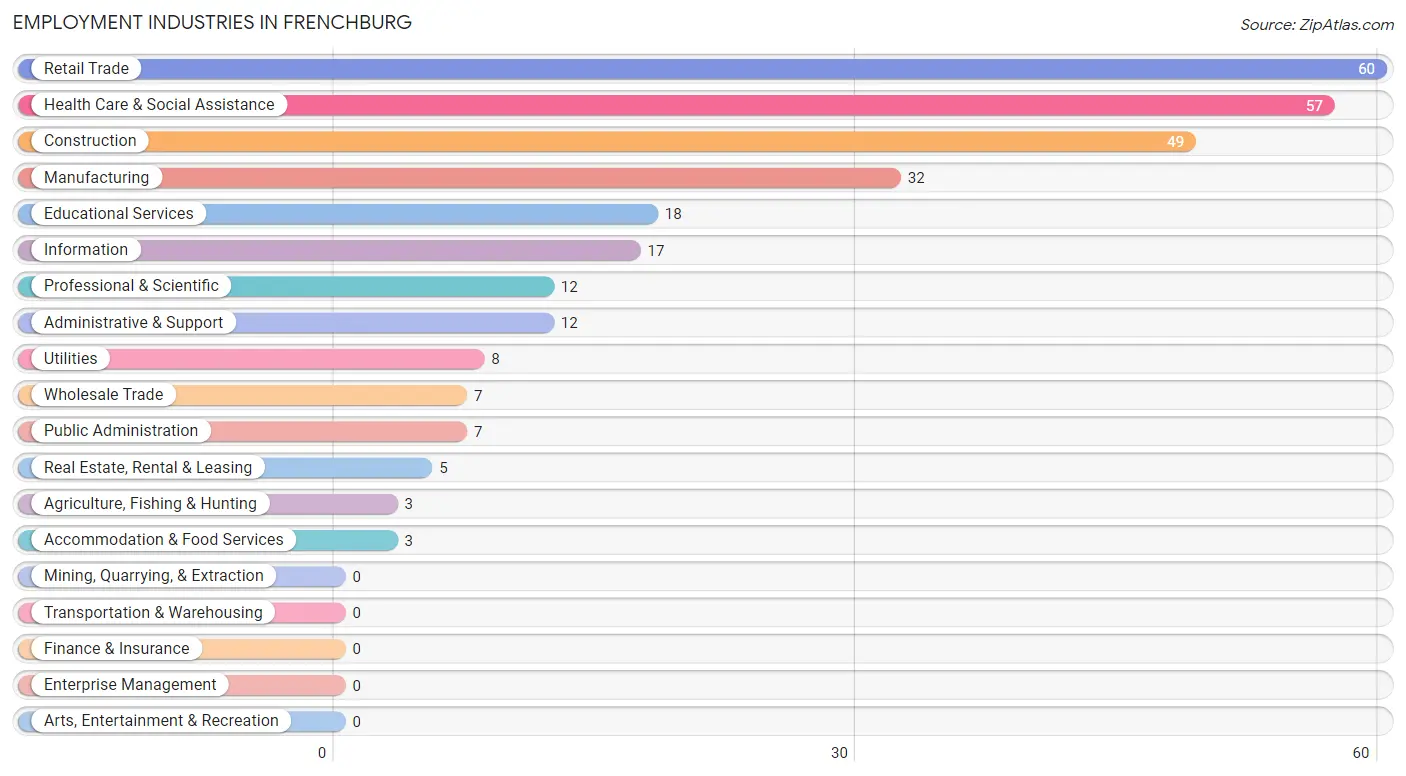
Employment Industries in Frenchburg
The major employment industries in Frenchburg include Retail Trade (60 | 20.6%), Health Care & Social Assistance (57 | 19.6%), Construction (49 | 16.8%), Manufacturing (32 | 11.0%), and Educational Services (18 | 6.2%).
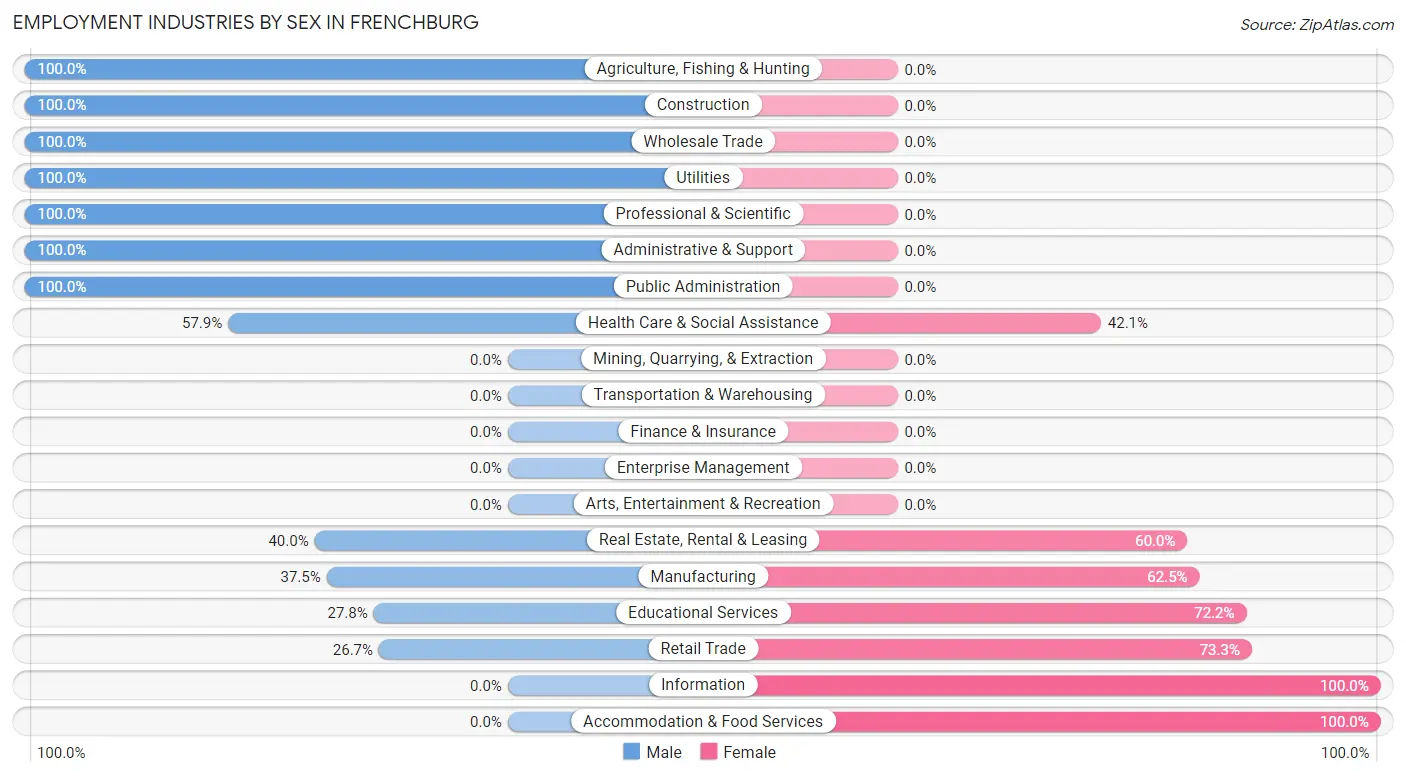
Employment Industries by Sex in Frenchburg
The Frenchburg industries that see more men than women are Agriculture, Fishing & Hunting (100.0%), Construction (100.0%), and Wholesale Trade (100.0%), whereas the industries that tend to have a higher number of women are Information (100.0%), Accommodation & Food Services (100.0%), and Retail Trade (73.3%).
| Industry | Male | Female |
| Agriculture, Fishing & Hunting | 3 (100.0%) | 0 (0.0%) |
| Mining, Quarrying, & Extraction | 0 (0.0%) | 0 (0.0%) |
| Construction | 49 (100.0%) | 0 (0.0%) |
| Manufacturing | 12 (37.5%) | 20 (62.5%) |
| Wholesale Trade | 7 (100.0%) | 0 (0.0%) |
| Retail Trade | 16 (26.7%) | 44 (73.3%) |
| Transportation & Warehousing | 0 (0.0%) | 0 (0.0%) |
| Utilities | 8 (100.0%) | 0 (0.0%) |
| Information | 0 (0.0%) | 17 (100.0%) |
| Finance & Insurance | 0 (0.0%) | 0 (0.0%) |
| Real Estate, Rental & Leasing | 2 (40.0%) | 3 (60.0%) |
| Professional & Scientific | 12 (100.0%) | 0 (0.0%) |
| Enterprise Management | 0 (0.0%) | 0 (0.0%) |
| Administrative & Support | 12 (100.0%) | 0 (0.0%) |
| Educational Services | 5 (27.8%) | 13 (72.2%) |
| Health Care & Social Assistance | 33 (57.9%) | 24 (42.1%) |
| Arts, Entertainment & Recreation | 0 (0.0%) | 0 (0.0%) |
| Accommodation & Food Services | 0 (0.0%) | 3 (100.0%) |
| Public Administration | 7 (100.0%) | 0 (0.0%) |
| Total | 167 (57.4%) | 124 (42.6%) |
Education in Frenchburg
School Enrollment in Frenchburg
The most common levels of schooling among the 202 students in Frenchburg are middle school (83 | 41.1%), high school (36 | 17.8%), and elementary school (34 | 16.8%).
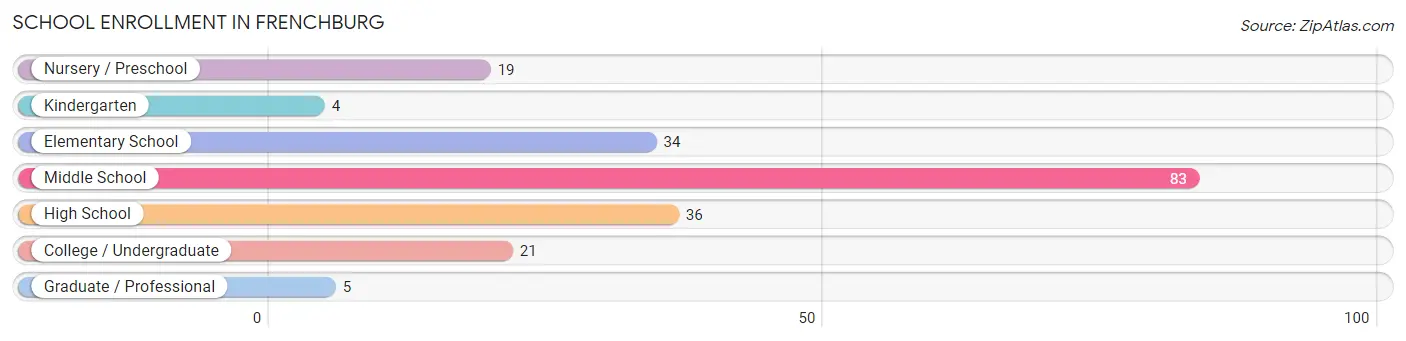
| School Level | # Students | % Students |
| Nursery / Preschool | 19 | 9.4% |
| Kindergarten | 4 | 2.0% |
| Elementary School | 34 | 16.8% |
| Middle School | 83 | 41.1% |
| High School | 36 | 17.8% |
| College / Undergraduate | 21 | 10.4% |
| Graduate / Professional | 5 | 2.5% |
| Total | 202 | 100.0% |
School Enrollment by Age by Funding Source in Frenchburg
Out of a total of 202 students who are enrolled in schools in Frenchburg, 3 (1.5%) attend a private institution, while the remaining 199 (98.5%) are enrolled in public schools. The age group of 18 to 19 year olds has the highest likelihood of being enrolled in private schools, with 3 (37.5% in the age bracket) enrolled. Conversely, the age group of 3 to 4 year olds has the lowest likelihood of being enrolled in a private school, with 19 (100.0% in the age bracket) attending a public institution.
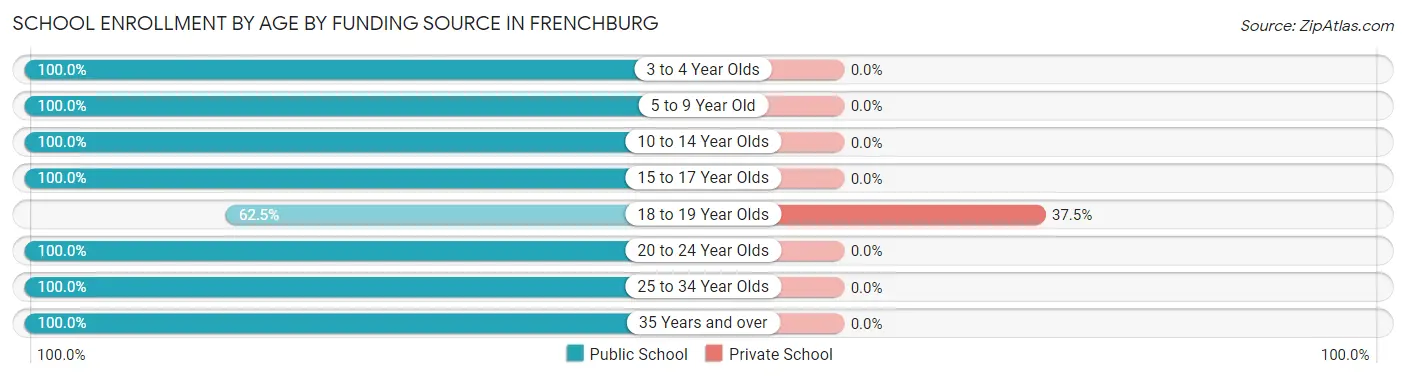
| Age Bracket | Public School | Private School |
| 3 to 4 Year Olds | 19 (100.0%) | 0 (0.0%) |
| 5 to 9 Year Old | 38 (100.0%) | 0 (0.0%) |
| 10 to 14 Year Olds | 101 (100.0%) | 0 (0.0%) |
| 15 to 17 Year Olds | 15 (100.0%) | 0 (0.0%) |
| 18 to 19 Year Olds | 5 (62.5%) | 3 (37.5%) |
| 20 to 24 Year Olds | 2 (100.0%) | 0 (0.0%) |
| 25 to 34 Year Olds | 16 (100.0%) | 0 (0.0%) |
| 35 Years and over | 3 (100.0%) | 0 (0.0%) |
| Total | 199 (98.5%) | 3 (1.5%) |
Educational Attainment by Field of Study in Frenchburg
Science & technology (13 | 27.7%), education (12 | 25.5%), bio, nature & agricultural (11 | 23.4%), visual & performing arts (5 | 10.6%), and communications (3 | 6.4%) are the most common fields of study among 47 individuals in Frenchburg who have obtained a bachelor's degree or higher.
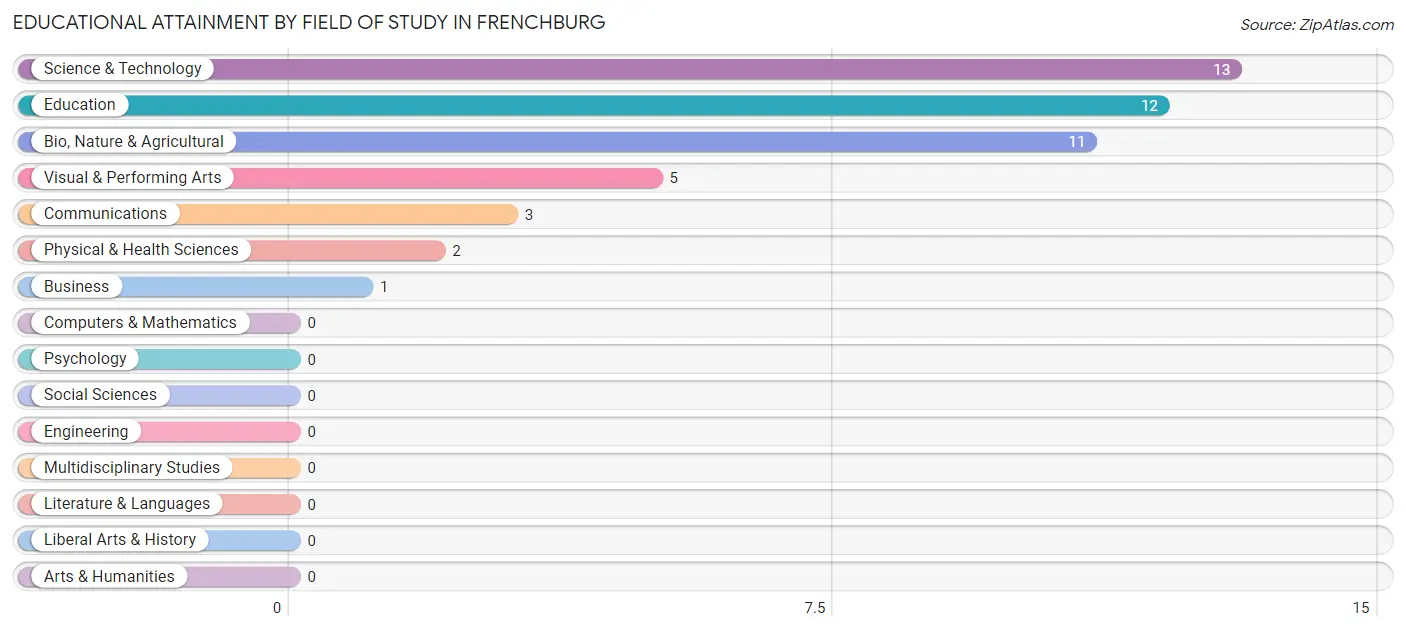
| Field of Study | # Graduates | % Graduates |
| Computers & Mathematics | 0 | 0.0% |
| Bio, Nature & Agricultural | 11 | 23.4% |
| Physical & Health Sciences | 2 | 4.3% |
| Psychology | 0 | 0.0% |
| Social Sciences | 0 | 0.0% |
| Engineering | 0 | 0.0% |
| Multidisciplinary Studies | 0 | 0.0% |
| Science & Technology | 13 | 27.7% |
| Business | 1 | 2.1% |
| Education | 12 | 25.5% |
| Literature & Languages | 0 | 0.0% |
| Liberal Arts & History | 0 | 0.0% |
| Visual & Performing Arts | 5 | 10.6% |
| Communications | 3 | 6.4% |
| Arts & Humanities | 0 | 0.0% |
| Total | 47 | 100.0% |
Transportation & Commute in Frenchburg
Vehicle Availability by Sex in Frenchburg
The most prevalent vehicle ownership categories in Frenchburg are males with 1 vehicle (62, accounting for 37.1%) and females with 1 vehicle (22, making up 50.0%).
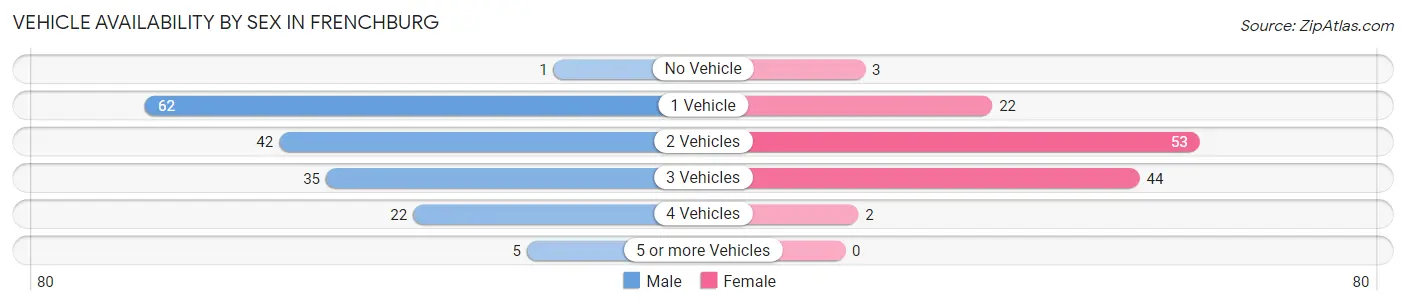
| Vehicles Available | Male | Female |
| No Vehicle | 1 (0.6%) | 3 (2.4%) |
| 1 Vehicle | 62 (37.1%) | 22 (17.7%) |
| 2 Vehicles | 42 (25.2%) | 53 (42.7%) |
| 3 Vehicles | 35 (21.0%) | 44 (35.5%) |
| 4 Vehicles | 22 (13.2%) | 2 (1.6%) |
| 5 or more Vehicles | 5 (3.0%) | 0 (0.0%) |
| Total | 167 (100.0%) | 124 (100.0%) |
Commute Time in Frenchburg
The most frequently occuring commute durations in Frenchburg are 45 to 59 minutes (96 commuters, 35.7%), 30 to 34 minutes (52 commuters, 19.3%), and 5 to 9 minutes (46 commuters, 17.1%).
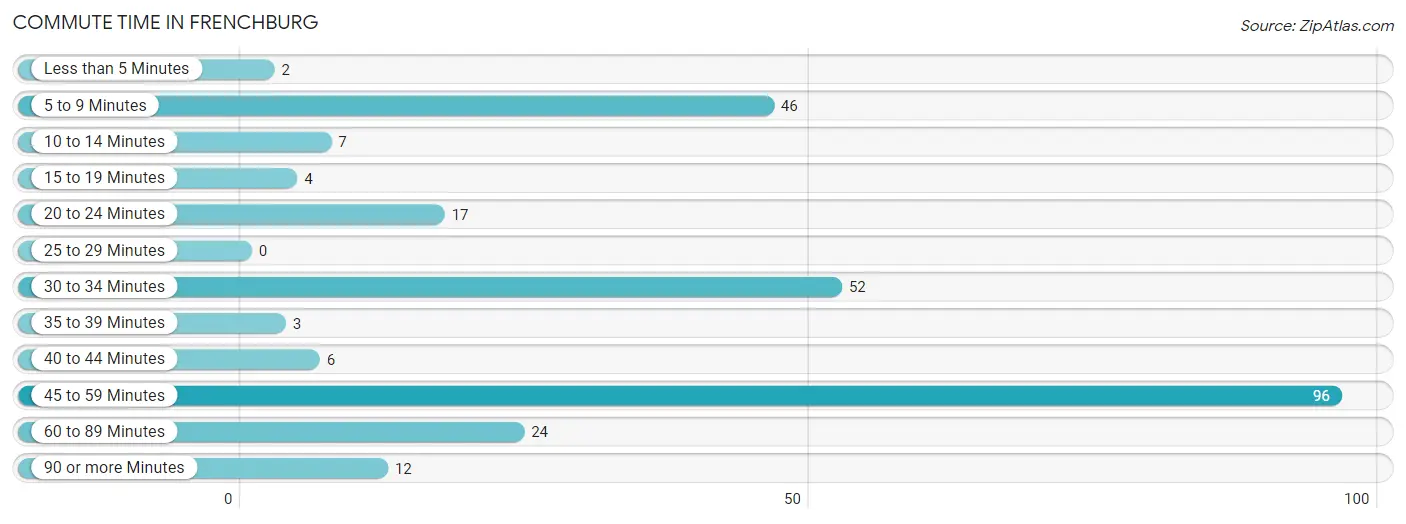
| Commute Time | # Commuters | % Commuters |
| Less than 5 Minutes | 2 | 0.7% |
| 5 to 9 Minutes | 46 | 17.1% |
| 10 to 14 Minutes | 7 | 2.6% |
| 15 to 19 Minutes | 4 | 1.5% |
| 20 to 24 Minutes | 17 | 6.3% |
| 25 to 29 Minutes | 0 | 0.0% |
| 30 to 34 Minutes | 52 | 19.3% |
| 35 to 39 Minutes | 3 | 1.1% |
| 40 to 44 Minutes | 6 | 2.2% |
| 45 to 59 Minutes | 96 | 35.7% |
| 60 to 89 Minutes | 24 | 8.9% |
| 90 or more Minutes | 12 | 4.5% |
Commute Time by Sex in Frenchburg
The most common commute times in Frenchburg are 45 to 59 minutes (74 commuters, 46.5%) for males and 5 to 9 minutes (31 commuters, 28.2%) for females.
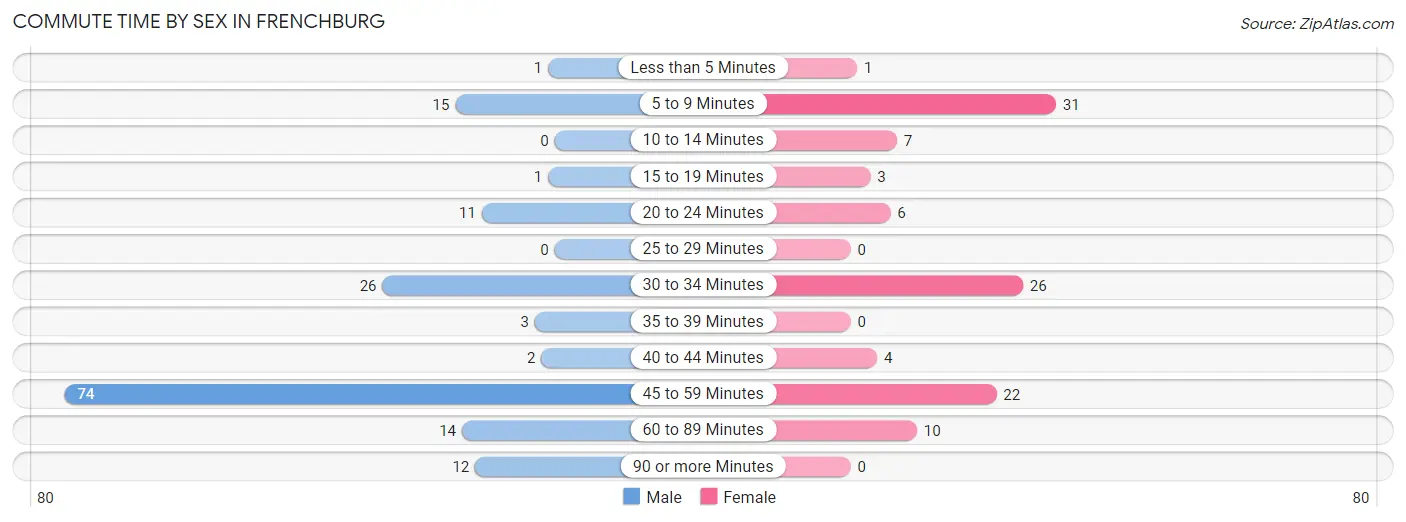
| Commute Time | Male | Female |
| Less than 5 Minutes | 1 (0.6%) | 1 (0.9%) |
| 5 to 9 Minutes | 15 (9.4%) | 31 (28.2%) |
| 10 to 14 Minutes | 0 (0.0%) | 7 (6.4%) |
| 15 to 19 Minutes | 1 (0.6%) | 3 (2.7%) |
| 20 to 24 Minutes | 11 (6.9%) | 6 (5.4%) |
| 25 to 29 Minutes | 0 (0.0%) | 0 (0.0%) |
| 30 to 34 Minutes | 26 (16.4%) | 26 (23.6%) |
| 35 to 39 Minutes | 3 (1.9%) | 0 (0.0%) |
| 40 to 44 Minutes | 2 (1.3%) | 4 (3.6%) |
| 45 to 59 Minutes | 74 (46.5%) | 22 (20.0%) |
| 60 to 89 Minutes | 14 (8.8%) | 10 (9.1%) |
| 90 or more Minutes | 12 (7.5%) | 0 (0.0%) |
Time of Departure to Work by Sex in Frenchburg
The most frequent times of departure to work in Frenchburg are 6:00 AM to 6:29 AM (41, 25.8%) for males and 7:30 AM to 7:59 AM (32, 29.1%) for females.
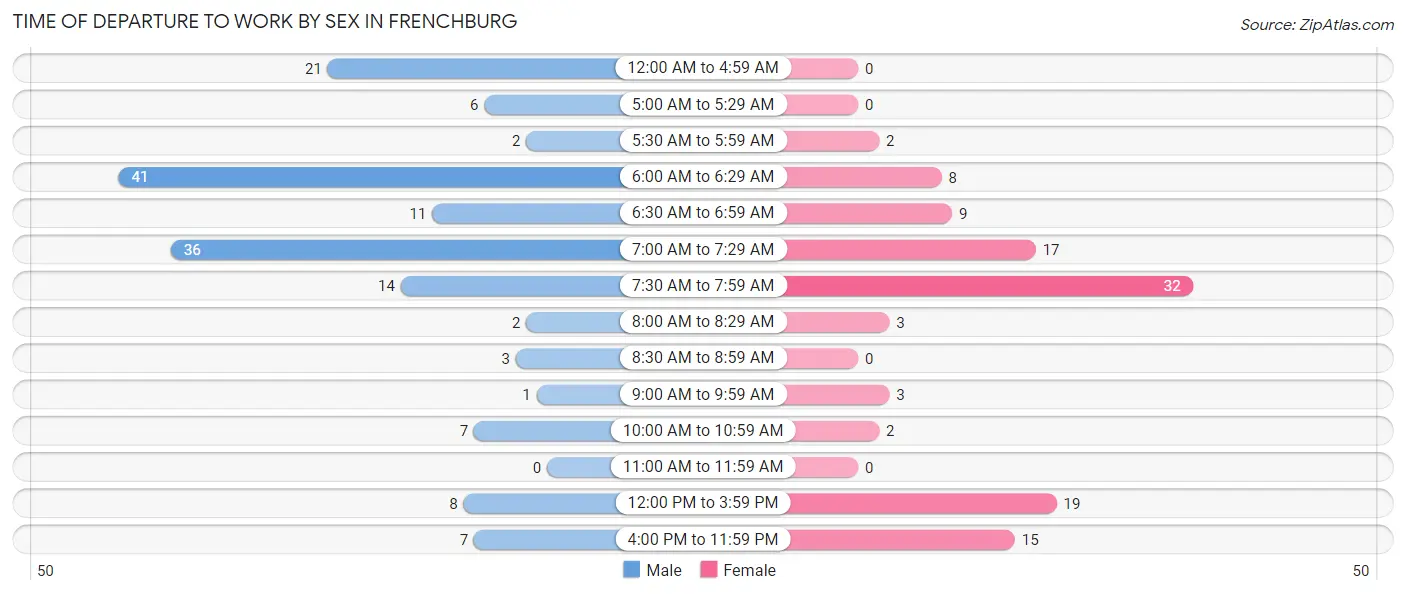
| Time of Departure | Male | Female |
| 12:00 AM to 4:59 AM | 21 (13.2%) | 0 (0.0%) |
| 5:00 AM to 5:29 AM | 6 (3.8%) | 0 (0.0%) |
| 5:30 AM to 5:59 AM | 2 (1.3%) | 2 (1.8%) |
| 6:00 AM to 6:29 AM | 41 (25.8%) | 8 (7.3%) |
| 6:30 AM to 6:59 AM | 11 (6.9%) | 9 (8.2%) |
| 7:00 AM to 7:29 AM | 36 (22.6%) | 17 (15.4%) |
| 7:30 AM to 7:59 AM | 14 (8.8%) | 32 (29.1%) |
| 8:00 AM to 8:29 AM | 2 (1.3%) | 3 (2.7%) |
| 8:30 AM to 8:59 AM | 3 (1.9%) | 0 (0.0%) |
| 9:00 AM to 9:59 AM | 1 (0.6%) | 3 (2.7%) |
| 10:00 AM to 10:59 AM | 7 (4.4%) | 2 (1.8%) |
| 11:00 AM to 11:59 AM | 0 (0.0%) | 0 (0.0%) |
| 12:00 PM to 3:59 PM | 8 (5.0%) | 19 (17.3%) |
| 4:00 PM to 11:59 PM | 7 (4.4%) | 15 (13.6%) |
| Total | 159 (100.0%) | 110 (100.0%) |
Housing Occupancy in Frenchburg
Occupancy by Ownership in Frenchburg
Of the total 247 dwellings in Frenchburg, owner-occupied units account for 120 (48.6%), while renter-occupied units make up 127 (51.4%).
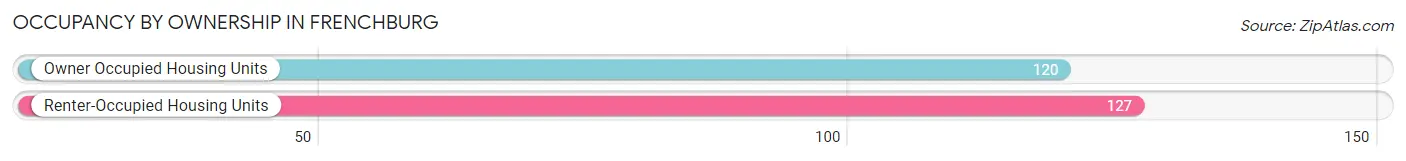
| Occupancy | # Housing Units | % Housing Units |
| Owner Occupied Housing Units | 120 | 48.6% |
| Renter-Occupied Housing Units | 127 | 51.4% |
| Total Occupied Housing Units | 247 | 100.0% |
Occupancy by Household Size in Frenchburg
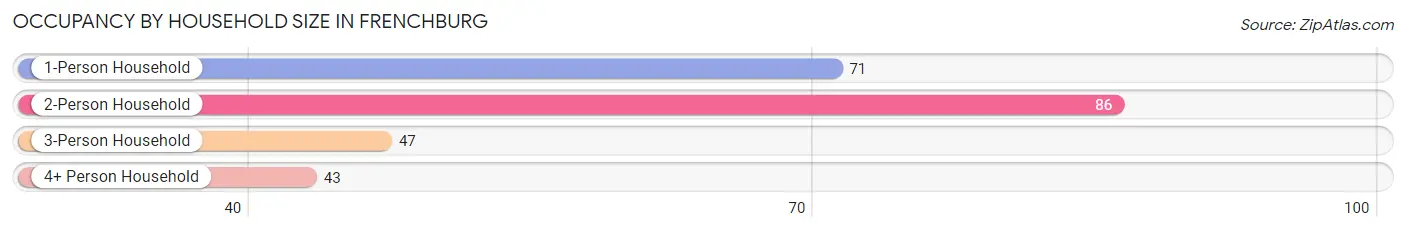
| Household Size | # Housing Units | % Housing Units |
| 1-Person Household | 71 | 28.7% |
| 2-Person Household | 86 | 34.8% |
| 3-Person Household | 47 | 19.0% |
| 4+ Person Household | 43 | 17.4% |
| Total Housing Units | 247 | 100.0% |
Occupancy by Ownership by Household Size in Frenchburg
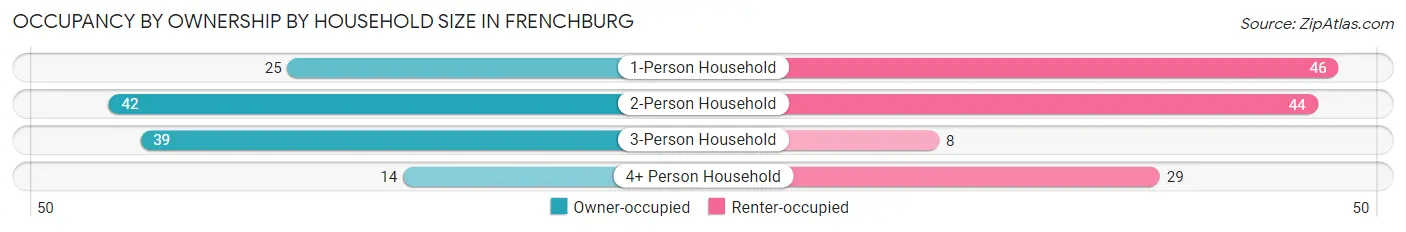
| Household Size | Owner-occupied | Renter-occupied |
| 1-Person Household | 25 (35.2%) | 46 (64.8%) |
| 2-Person Household | 42 (48.8%) | 44 (51.2%) |
| 3-Person Household | 39 (83.0%) | 8 (17.0%) |
| 4+ Person Household | 14 (32.6%) | 29 (67.4%) |
| Total Housing Units | 120 (48.6%) | 127 (51.4%) |
Occupancy by Educational Attainment in Frenchburg
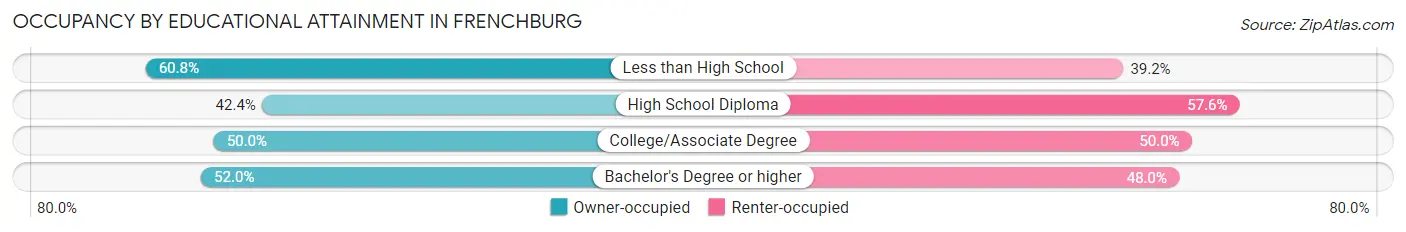
| Household Size | Owner-occupied | Renter-occupied |
| Less than High School | 31 (60.8%) | 20 (39.2%) |
| High School Diploma | 53 (42.4%) | 72 (57.6%) |
| College/Associate Degree | 23 (50.0%) | 23 (50.0%) |
| Bachelor's Degree or higher | 13 (52.0%) | 12 (48.0%) |
Occupancy by Age of Householder in Frenchburg
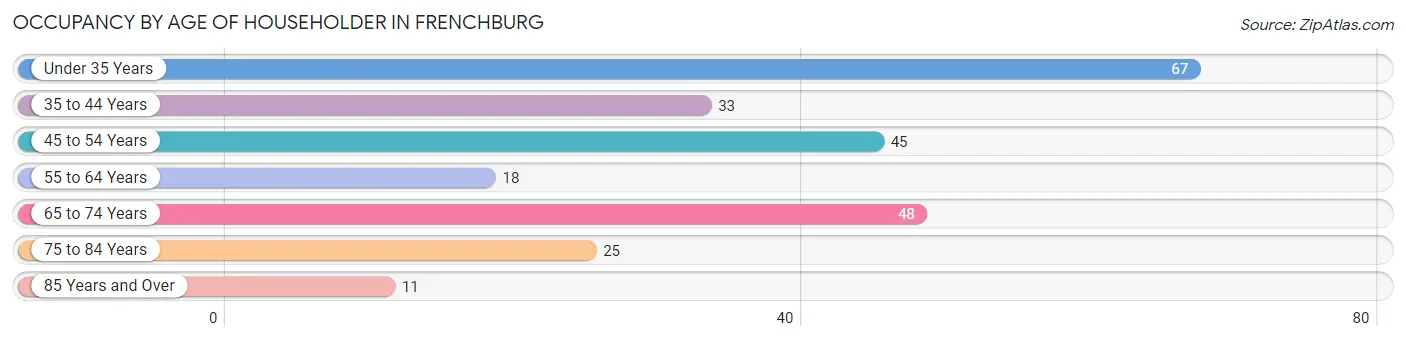
| Age Bracket | # Households | % Households |
| Under 35 Years | 67 | 27.1% |
| 35 to 44 Years | 33 | 13.4% |
| 45 to 54 Years | 45 | 18.2% |
| 55 to 64 Years | 18 | 7.3% |
| 65 to 74 Years | 48 | 19.4% |
| 75 to 84 Years | 25 | 10.1% |
| 85 Years and Over | 11 | 4.4% |
| Total | 247 | 100.0% |
Housing Finances in Frenchburg
Median Income by Occupancy in Frenchburg
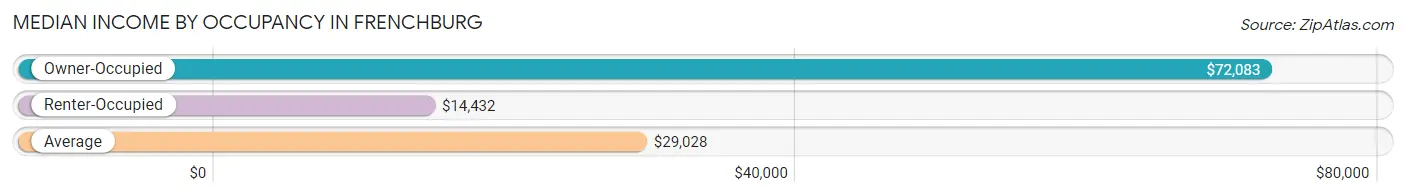
| Occupancy Type | # Households | Median Income |
| Owner-Occupied | 120 (48.6%) | $72,083 |
| Renter-Occupied | 127 (51.4%) | $14,432 |
| Average | 247 (100.0%) | $29,028 |
Occupancy by Householder Income Bracket in Frenchburg
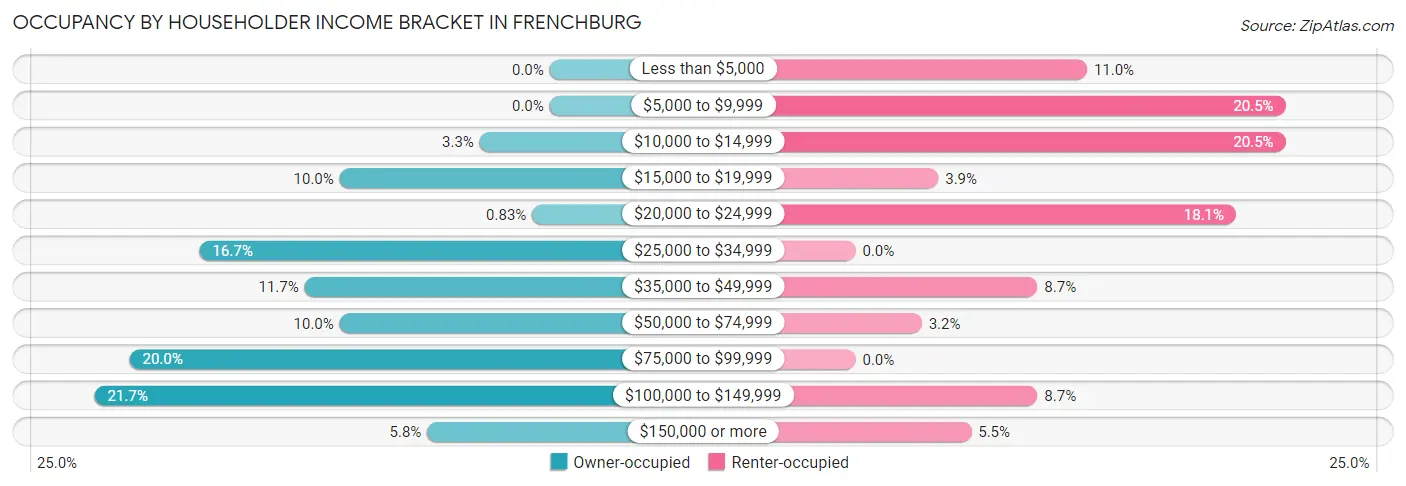
| Income Bracket | Owner-occupied | Renter-occupied |
| Less than $5,000 | 0 (0.0%) | 14 (11.0%) |
| $5,000 to $9,999 | 0 (0.0%) | 26 (20.5%) |
| $10,000 to $14,999 | 4 (3.3%) | 26 (20.5%) |
| $15,000 to $19,999 | 12 (10.0%) | 5 (3.9%) |
| $20,000 to $24,999 | 1 (0.8%) | 23 (18.1%) |
| $25,000 to $34,999 | 20 (16.7%) | 0 (0.0%) |
| $35,000 to $49,999 | 14 (11.7%) | 11 (8.7%) |
| $50,000 to $74,999 | 12 (10.0%) | 4 (3.2%) |
| $75,000 to $99,999 | 24 (20.0%) | 0 (0.0%) |
| $100,000 to $149,999 | 26 (21.7%) | 11 (8.7%) |
| $150,000 or more | 7 (5.8%) | 7 (5.5%) |
| Total | 120 (100.0%) | 127 (100.0%) |
Monthly Housing Cost Tiers in Frenchburg
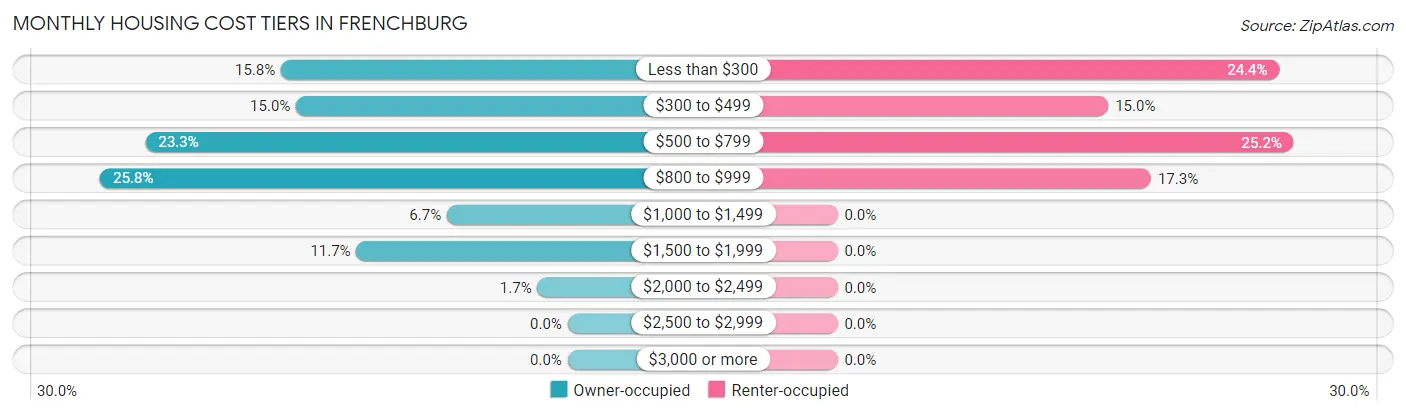
| Monthly Cost | Owner-occupied | Renter-occupied |
| Less than $300 | 19 (15.8%) | 31 (24.4%) |
| $300 to $499 | 18 (15.0%) | 19 (15.0%) |
| $500 to $799 | 28 (23.3%) | 32 (25.2%) |
| $800 to $999 | 31 (25.8%) | 22 (17.3%) |
| $1,000 to $1,499 | 8 (6.7%) | 0 (0.0%) |
| $1,500 to $1,999 | 14 (11.7%) | 0 (0.0%) |
| $2,000 to $2,499 | 2 (1.7%) | 0 (0.0%) |
| $2,500 to $2,999 | 0 (0.0%) | 0 (0.0%) |
| $3,000 or more | 0 (0.0%) | 0 (0.0%) |
| Total | 120 (100.0%) | 127 (100.0%) |
Physical Housing Characteristics in Frenchburg
Housing Structures in Frenchburg
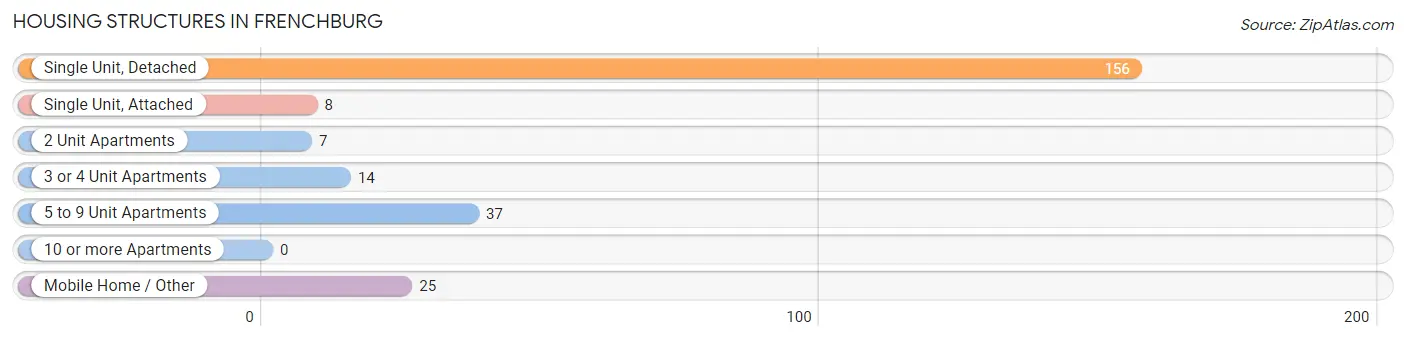
| Structure Type | # Housing Units | % Housing Units |
| Single Unit, Detached | 156 | 63.2% |
| Single Unit, Attached | 8 | 3.2% |
| 2 Unit Apartments | 7 | 2.8% |
| 3 or 4 Unit Apartments | 14 | 5.7% |
| 5 to 9 Unit Apartments | 37 | 15.0% |
| 10 or more Apartments | 0 | 0.0% |
| Mobile Home / Other | 25 | 10.1% |
| Total | 247 | 100.0% |
Housing Structures by Occupancy in Frenchburg
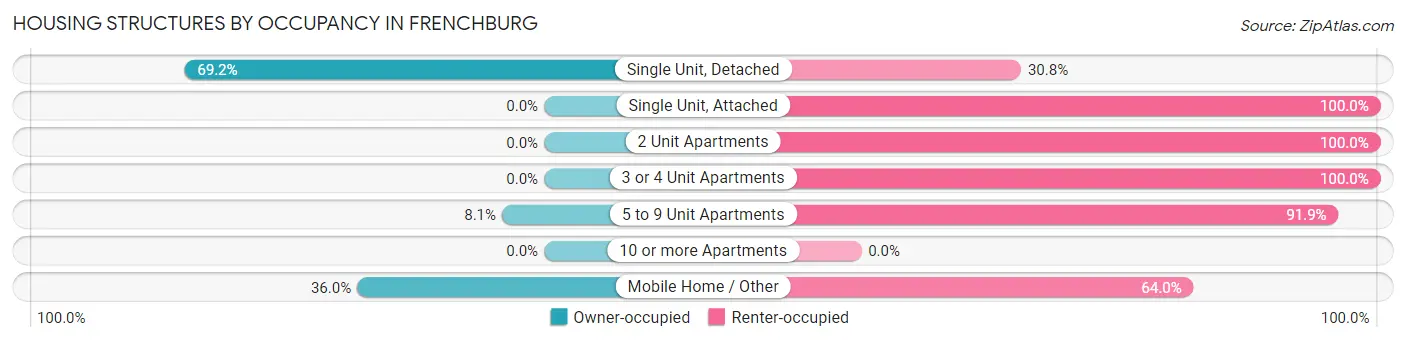
| Structure Type | Owner-occupied | Renter-occupied |
| Single Unit, Detached | 108 (69.2%) | 48 (30.8%) |
| Single Unit, Attached | 0 (0.0%) | 8 (100.0%) |
| 2 Unit Apartments | 0 (0.0%) | 7 (100.0%) |
| 3 or 4 Unit Apartments | 0 (0.0%) | 14 (100.0%) |
| 5 to 9 Unit Apartments | 3 (8.1%) | 34 (91.9%) |
| 10 or more Apartments | 0 (0.0%) | 0 (0.0%) |
| Mobile Home / Other | 9 (36.0%) | 16 (64.0%) |
| Total | 120 (48.6%) | 127 (51.4%) |
Housing Structures by Number of Rooms in Frenchburg
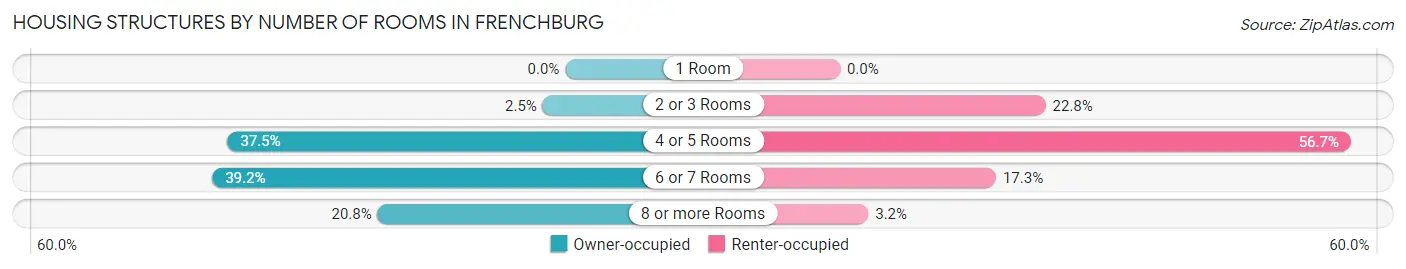
| Number of Rooms | Owner-occupied | Renter-occupied |
| 1 Room | 0 (0.0%) | 0 (0.0%) |
| 2 or 3 Rooms | 3 (2.5%) | 29 (22.8%) |
| 4 or 5 Rooms | 45 (37.5%) | 72 (56.7%) |
| 6 or 7 Rooms | 47 (39.2%) | 22 (17.3%) |
| 8 or more Rooms | 25 (20.8%) | 4 (3.2%) |
| Total | 120 (100.0%) | 127 (100.0%) |
Housing Structure by Heating Type in Frenchburg
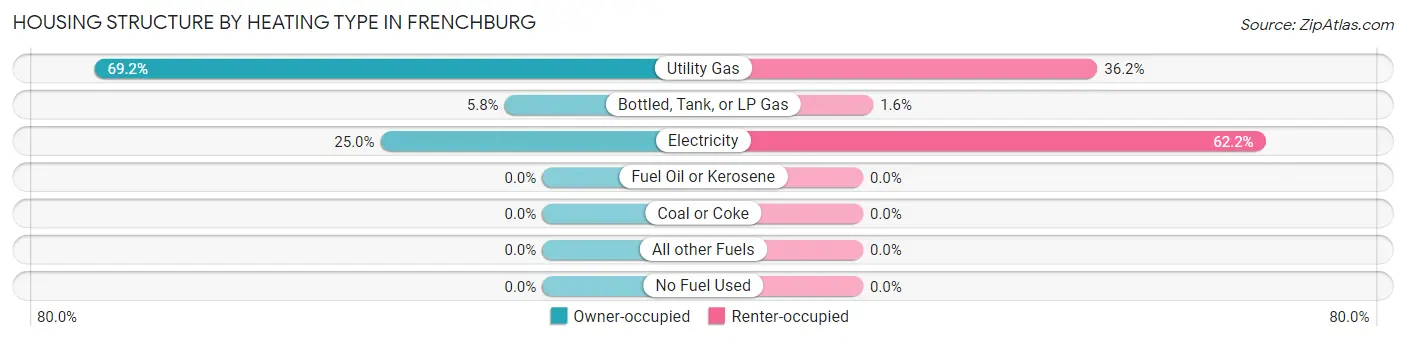
| Heating Type | Owner-occupied | Renter-occupied |
| Utility Gas | 83 (69.2%) | 46 (36.2%) |
| Bottled, Tank, or LP Gas | 7 (5.8%) | 2 (1.6%) |
| Electricity | 30 (25.0%) | 79 (62.2%) |
| Fuel Oil or Kerosene | 0 (0.0%) | 0 (0.0%) |
| Coal or Coke | 0 (0.0%) | 0 (0.0%) |
| All other Fuels | 0 (0.0%) | 0 (0.0%) |
| No Fuel Used | 0 (0.0%) | 0 (0.0%) |
| Total | 120 (100.0%) | 127 (100.0%) |
Household Vehicle Usage in Frenchburg
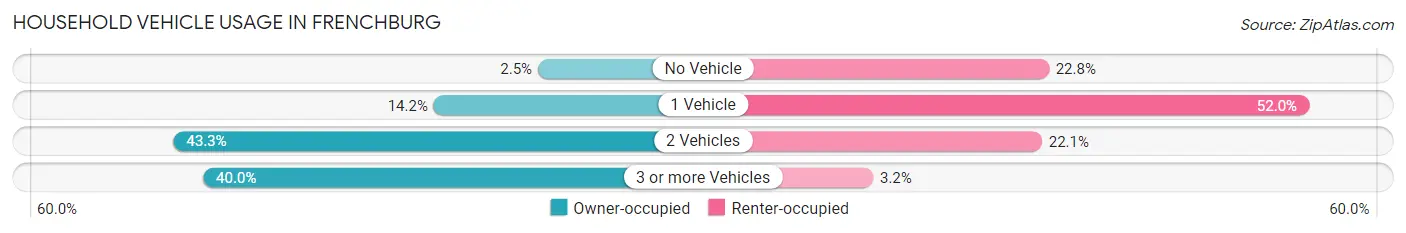
| Vehicles per Household | Owner-occupied | Renter-occupied |
| No Vehicle | 3 (2.5%) | 29 (22.8%) |
| 1 Vehicle | 17 (14.2%) | 66 (52.0%) |
| 2 Vehicles | 52 (43.3%) | 28 (22.1%) |
| 3 or more Vehicles | 48 (40.0%) | 4 (3.2%) |
| Total | 120 (100.0%) | 127 (100.0%) |
Real Estate & Mortgages in Frenchburg
Real Estate and Mortgage Overview in Frenchburg
| Characteristic | Without Mortgage | With Mortgage |
| Housing Units | 46 | 74 |
| Median Property Value | $152,100 | $126,300 |
| Median Household Income | $50,000 | $2 |
| Monthly Housing Costs | $350 | $0 |
| Real Estate Taxes | - | - |
Property Value by Mortgage Status in Frenchburg
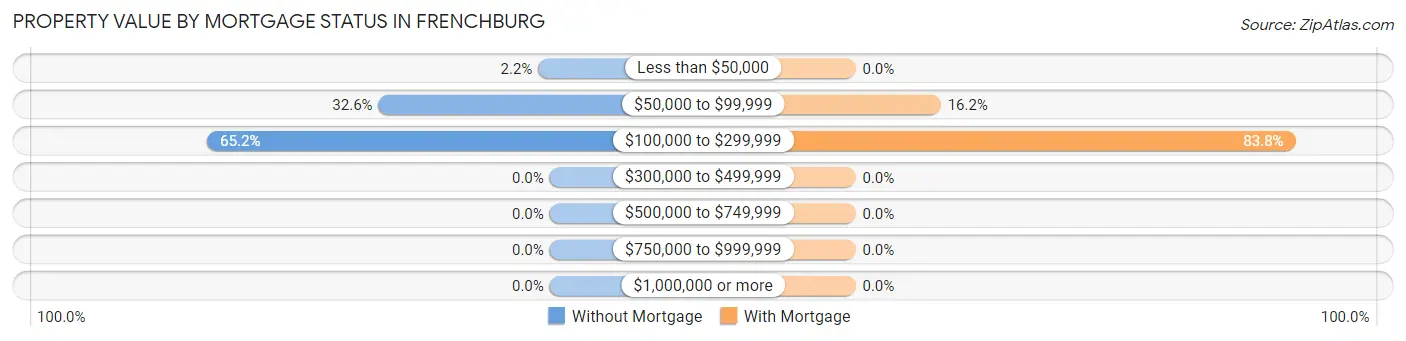
| Property Value | Without Mortgage | With Mortgage |
| Less than $50,000 | 1 (2.2%) | 0 (0.0%) |
| $50,000 to $99,999 | 15 (32.6%) | 12 (16.2%) |
| $100,000 to $299,999 | 30 (65.2%) | 62 (83.8%) |
| $300,000 to $499,999 | 0 (0.0%) | 0 (0.0%) |
| $500,000 to $749,999 | 0 (0.0%) | 0 (0.0%) |
| $750,000 to $999,999 | 0 (0.0%) | 0 (0.0%) |
| $1,000,000 or more | 0 (0.0%) | 0 (0.0%) |
| Total | 46 (100.0%) | 74 (100.0%) |
Household Income by Mortgage Status in Frenchburg
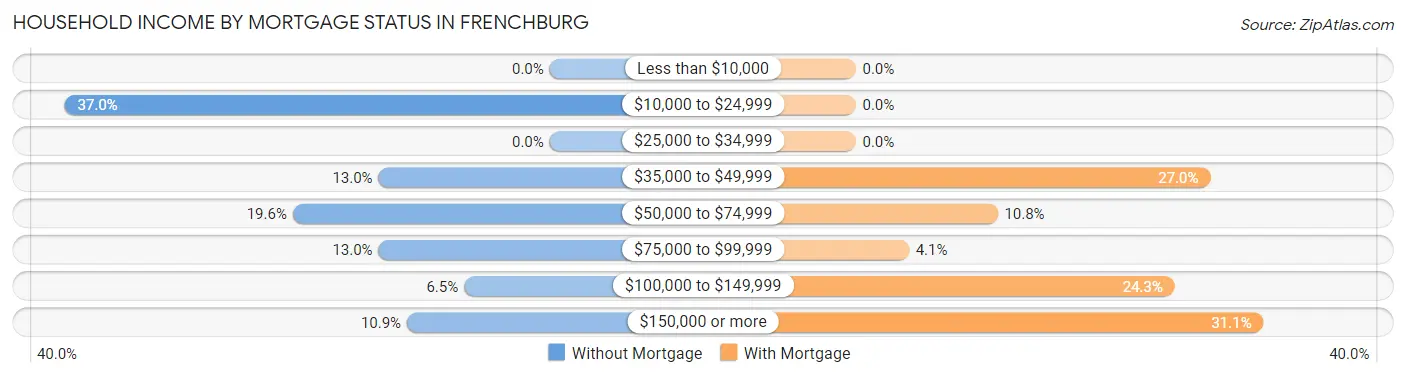
| Household Income | Without Mortgage | With Mortgage |
| Less than $10,000 | 0 (0.0%) | 0 (0.0%) |
| $10,000 to $24,999 | 17 (37.0%) | 0 (0.0%) |
| $25,000 to $34,999 | 0 (0.0%) | 0 (0.0%) |
| $35,000 to $49,999 | 6 (13.0%) | 20 (27.0%) |
| $50,000 to $74,999 | 9 (19.6%) | 8 (10.8%) |
| $75,000 to $99,999 | 6 (13.0%) | 3 (4.1%) |
| $100,000 to $149,999 | 3 (6.5%) | 18 (24.3%) |
| $150,000 or more | 5 (10.9%) | 23 (31.1%) |
| Total | 46 (100.0%) | 74 (100.0%) |
Property Value to Household Income Ratio in Frenchburg
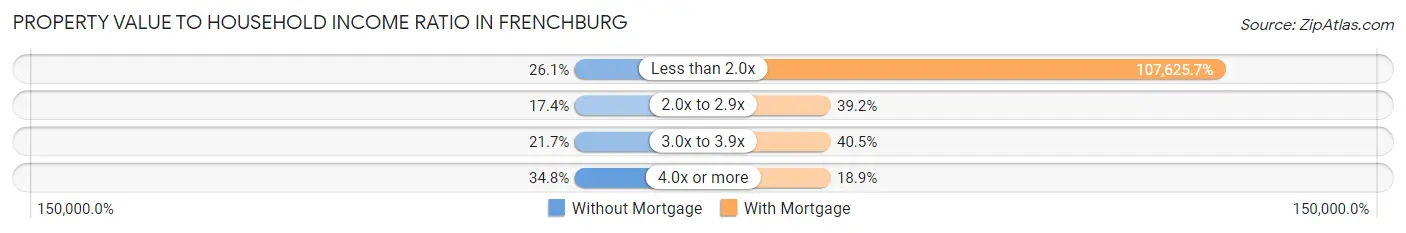
| Value-to-Income Ratio | Without Mortgage | With Mortgage |
| Less than 2.0x | 12 (26.1%) | 79,643 (107,625.7%) |
| 2.0x to 2.9x | 8 (17.4%) | 29 (39.2%) |
| 3.0x to 3.9x | 10 (21.7%) | 30 (40.5%) |
| 4.0x or more | 16 (34.8%) | 14 (18.9%) |
| Total | 46 (100.0%) | 74 (100.0%) |
Real Estate Taxes by Mortgage Status in Frenchburg
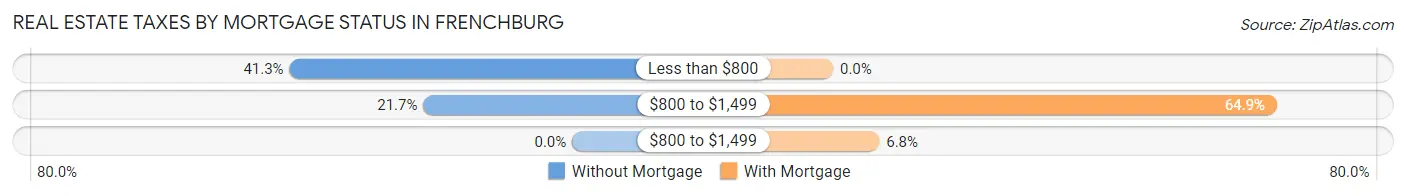
| Property Taxes | Without Mortgage | With Mortgage |
| Less than $800 | 19 (41.3%) | 0 (0.0%) |
| $800 to $1,499 | 10 (21.7%) | 48 (64.9%) |
| $800 to $1,499 | 0 (0.0%) | 5 (6.8%) |
| Total | 46 (100.0%) | 74 (100.0%) |
Health & Disability in Frenchburg
Health Insurance Coverage by Age in Frenchburg
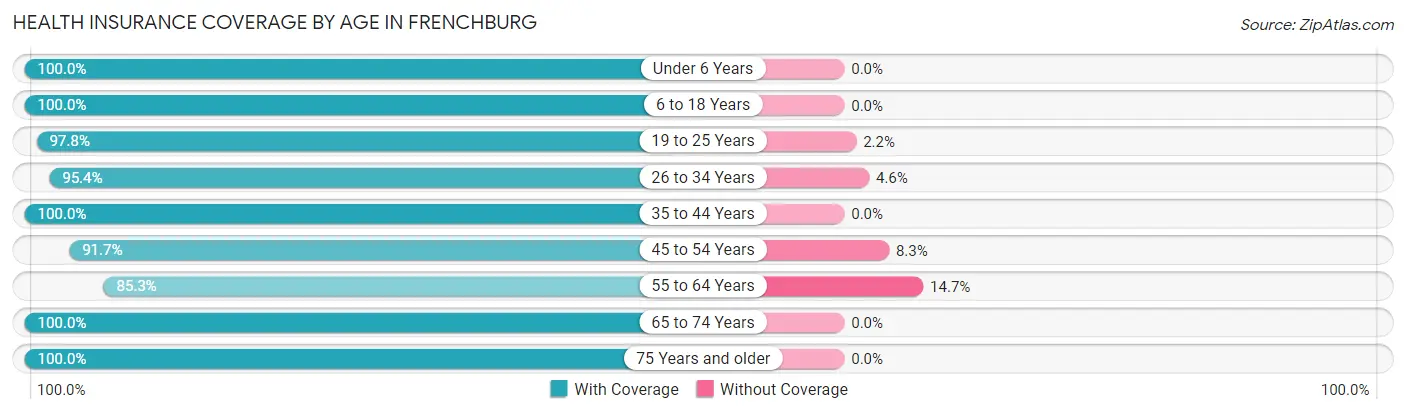
| Age Bracket | With Coverage | Without Coverage |
| Under 6 Years | 77 (100.0%) | 0 (0.0%) |
| 6 to 18 Years | 163 (100.0%) | 0 (0.0%) |
| 19 to 25 Years | 44 (97.8%) | 1 (2.2%) |
| 26 to 34 Years | 145 (95.4%) | 7 (4.6%) |
| 35 to 44 Years | 86 (100.0%) | 0 (0.0%) |
| 45 to 54 Years | 44 (91.7%) | 4 (8.3%) |
| 55 to 64 Years | 58 (85.3%) | 10 (14.7%) |
| 65 to 74 Years | 67 (100.0%) | 0 (0.0%) |
| 75 Years and older | 51 (100.0%) | 0 (0.0%) |
| Total | 735 (97.1%) | 22 (2.9%) |
Health Insurance Coverage by Citizenship Status in Frenchburg
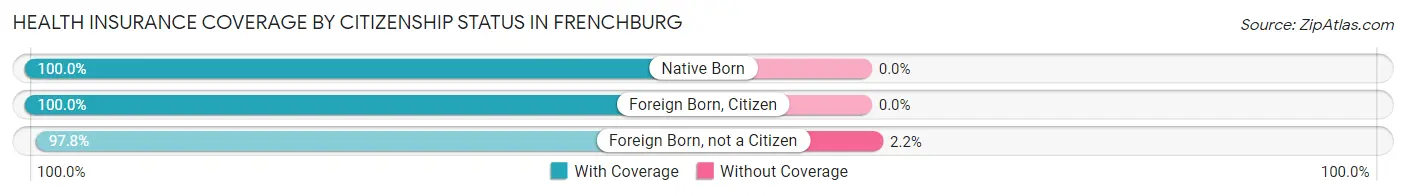
| Citizenship Status | With Coverage | Without Coverage |
| Native Born | 77 (100.0%) | 0 (0.0%) |
| Foreign Born, Citizen | 163 (100.0%) | 0 (0.0%) |
| Foreign Born, not a Citizen | 44 (97.8%) | 1 (2.2%) |
Health Insurance Coverage by Household Income in Frenchburg
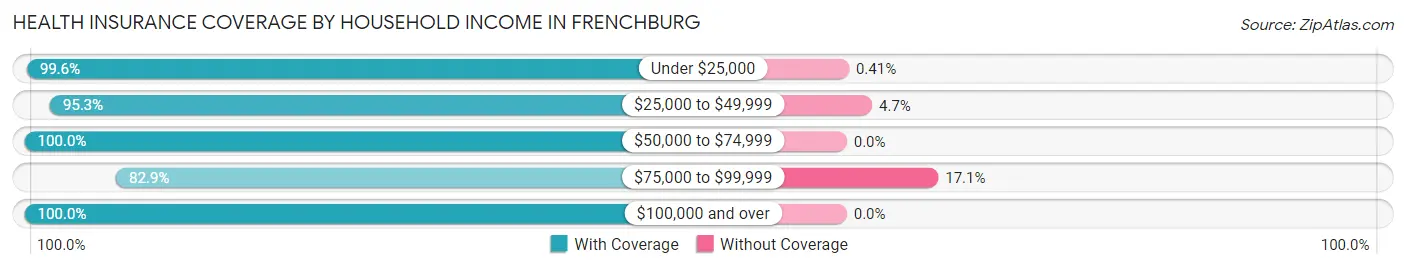
| Household Income | With Coverage | Without Coverage |
| Under $25,000 | 243 (99.6%) | 1 (0.4%) |
| $25,000 to $49,999 | 181 (95.3%) | 9 (4.7%) |
| $50,000 to $74,999 | 38 (100.0%) | 0 (0.0%) |
| $75,000 to $99,999 | 58 (82.9%) | 12 (17.1%) |
| $100,000 and over | 215 (100.0%) | 0 (0.0%) |
Public vs Private Health Insurance Coverage by Age in Frenchburg
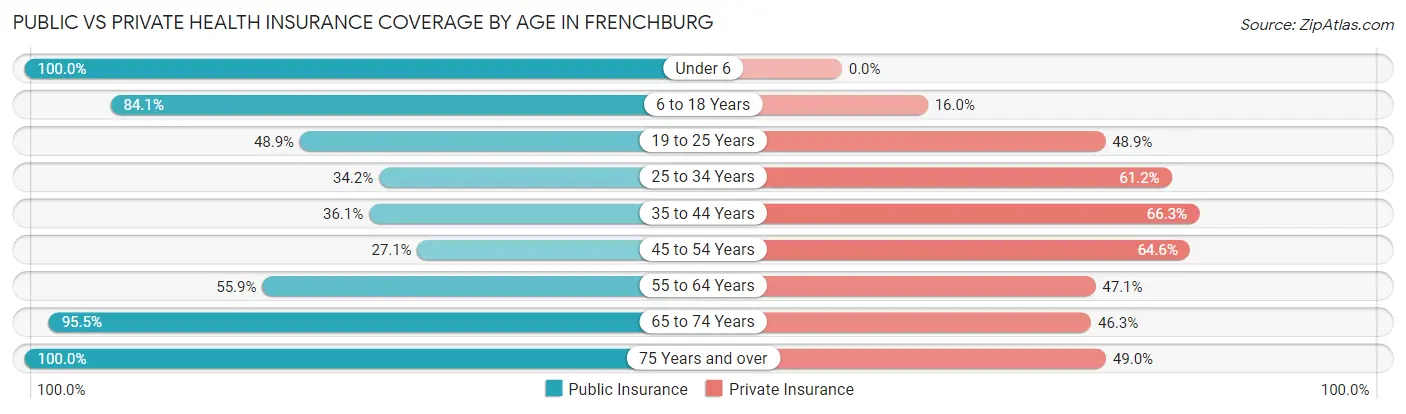
| Age Bracket | Public Insurance | Private Insurance |
| Under 6 | 77 (100.0%) | 0 (0.0%) |
| 6 to 18 Years | 137 (84.1%) | 26 (16.0%) |
| 19 to 25 Years | 22 (48.9%) | 22 (48.9%) |
| 25 to 34 Years | 52 (34.2%) | 93 (61.2%) |
| 35 to 44 Years | 31 (36.0%) | 57 (66.3%) |
| 45 to 54 Years | 13 (27.1%) | 31 (64.6%) |
| 55 to 64 Years | 38 (55.9%) | 32 (47.1%) |
| 65 to 74 Years | 64 (95.5%) | 31 (46.3%) |
| 75 Years and over | 51 (100.0%) | 25 (49.0%) |
| Total | 485 (64.1%) | 317 (41.9%) |
Disability Status by Sex by Age in Frenchburg
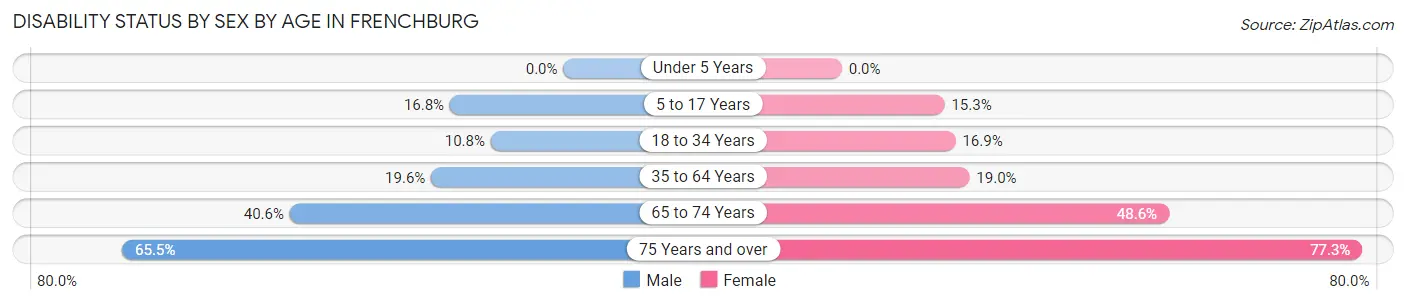
| Age Bracket | Male | Female |
| Under 5 Years | 0 (0.0%) | 0 (0.0%) |
| 5 to 17 Years | 16 (16.8%) | 9 (15.2%) |
| 18 to 34 Years | 14 (10.8%) | 13 (16.9%) |
| 35 to 64 Years | 21 (19.6%) | 18 (19.0%) |
| 65 to 74 Years | 13 (40.6%) | 17 (48.6%) |
| 75 Years and over | 19 (65.5%) | 17 (77.3%) |
Disability Class by Sex by Age in Frenchburg
Disability Class: Hearing Difficulty
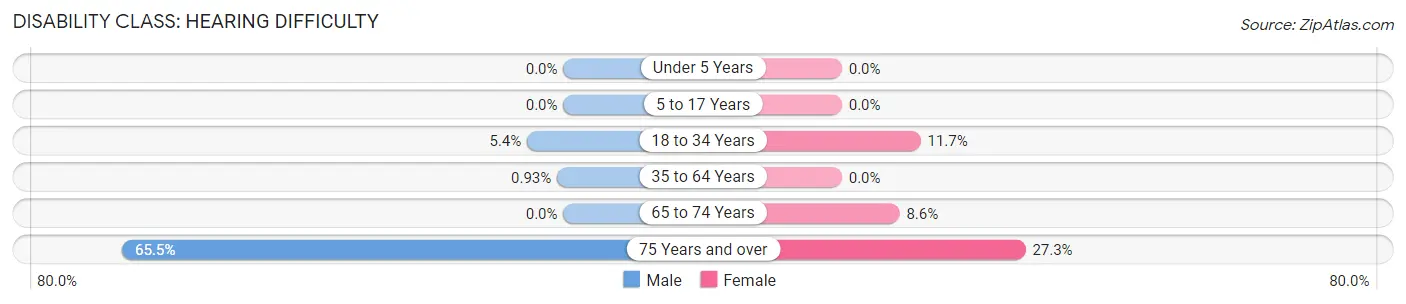
| Age Bracket | Male | Female |
| Under 5 Years | 0 (0.0%) | 0 (0.0%) |
| 5 to 17 Years | 0 (0.0%) | 0 (0.0%) |
| 18 to 34 Years | 7 (5.4%) | 9 (11.7%) |
| 35 to 64 Years | 1 (0.9%) | 0 (0.0%) |
| 65 to 74 Years | 0 (0.0%) | 3 (8.6%) |
| 75 Years and over | 19 (65.5%) | 6 (27.3%) |
Disability Class: Vision Difficulty
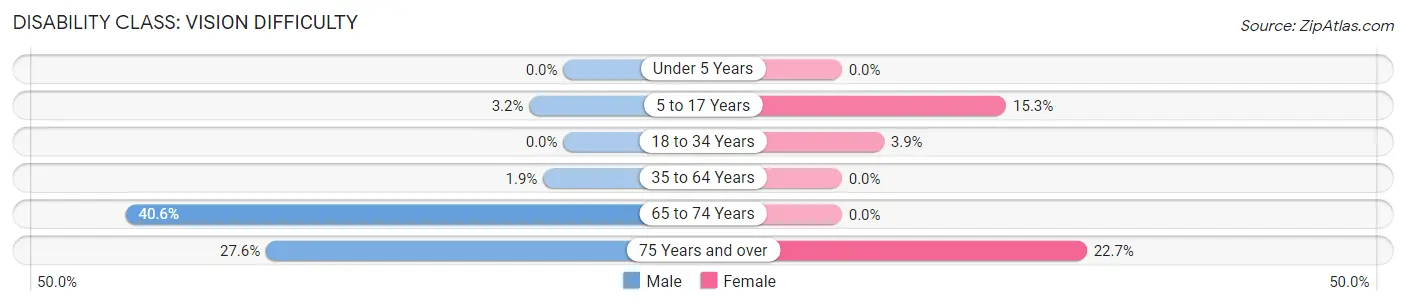
| Age Bracket | Male | Female |
| Under 5 Years | 0 (0.0%) | 0 (0.0%) |
| 5 to 17 Years | 3 (3.2%) | 9 (15.2%) |
| 18 to 34 Years | 0 (0.0%) | 3 (3.9%) |
| 35 to 64 Years | 2 (1.9%) | 0 (0.0%) |
| 65 to 74 Years | 13 (40.6%) | 0 (0.0%) |
| 75 Years and over | 8 (27.6%) | 5 (22.7%) |
Disability Class: Cognitive Difficulty
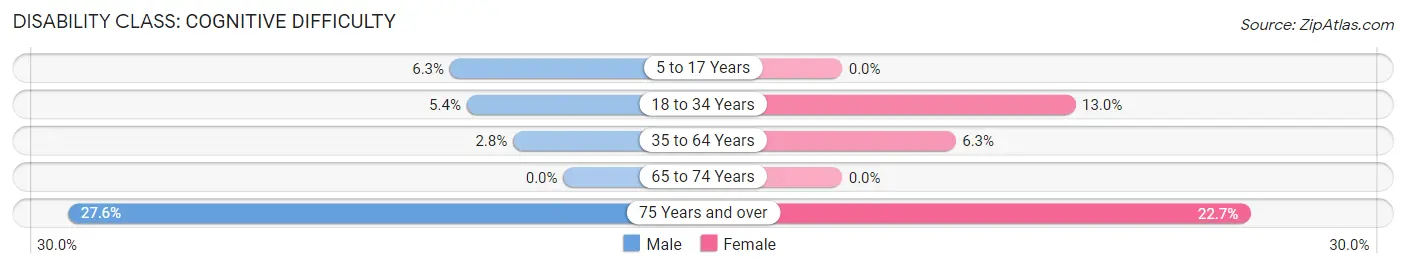
| Age Bracket | Male | Female |
| 5 to 17 Years | 6 (6.3%) | 0 (0.0%) |
| 18 to 34 Years | 7 (5.4%) | 10 (13.0%) |
| 35 to 64 Years | 3 (2.8%) | 6 (6.3%) |
| 65 to 74 Years | 0 (0.0%) | 0 (0.0%) |
| 75 Years and over | 8 (27.6%) | 5 (22.7%) |
Disability Class: Ambulatory Difficulty
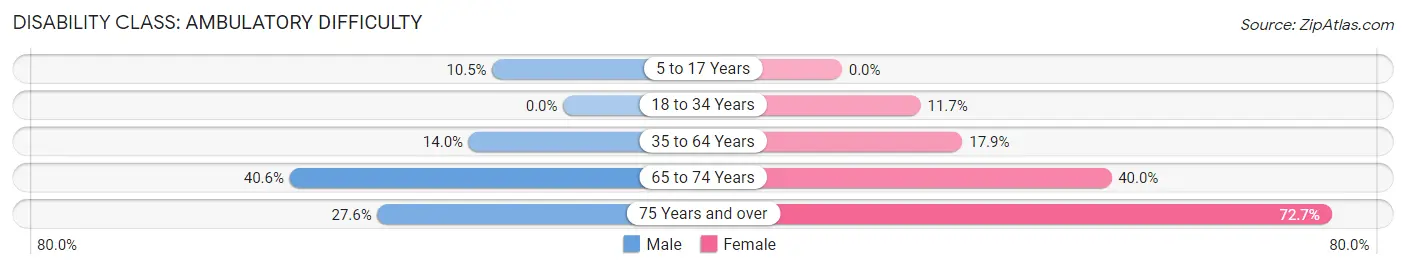
| Age Bracket | Male | Female |
| 5 to 17 Years | 10 (10.5%) | 0 (0.0%) |
| 18 to 34 Years | 0 (0.0%) | 9 (11.7%) |
| 35 to 64 Years | 15 (14.0%) | 17 (17.9%) |
| 65 to 74 Years | 13 (40.6%) | 14 (40.0%) |
| 75 Years and over | 8 (27.6%) | 16 (72.7%) |
Disability Class: Self-Care Difficulty
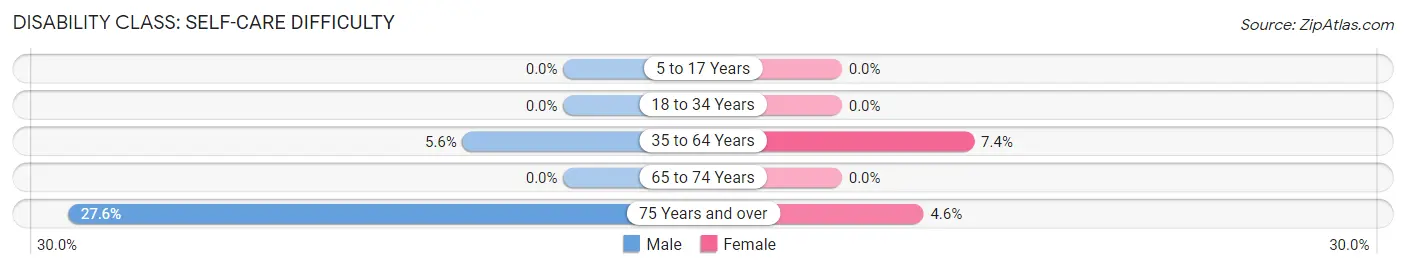
| Age Bracket | Male | Female |
| 5 to 17 Years | 0 (0.0%) | 0 (0.0%) |
| 18 to 34 Years | 0 (0.0%) | 0 (0.0%) |
| 35 to 64 Years | 6 (5.6%) | 7 (7.4%) |
| 65 to 74 Years | 0 (0.0%) | 0 (0.0%) |
| 75 Years and over | 8 (27.6%) | 1 (4.5%) |
Technology Access in Frenchburg
Computing Device Access in Frenchburg
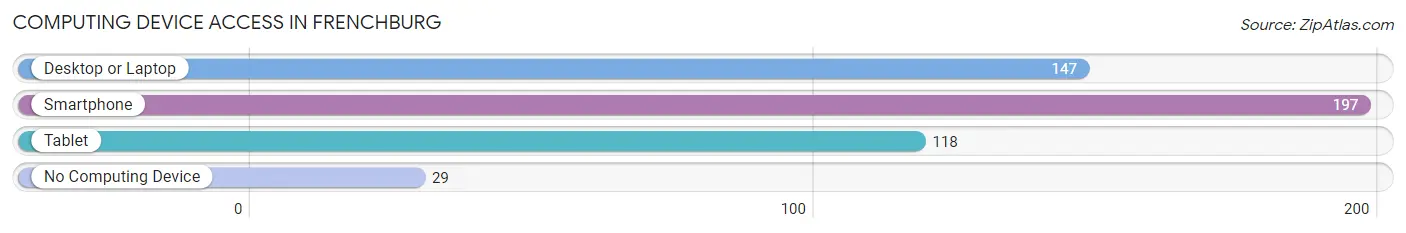
| Device Type | # Households | % Households |
| Desktop or Laptop | 147 | 59.5% |
| Smartphone | 197 | 79.8% |
| Tablet | 118 | 47.8% |
| No Computing Device | 29 | 11.7% |
| Total | 247 | 100.0% |
Internet Access in Frenchburg
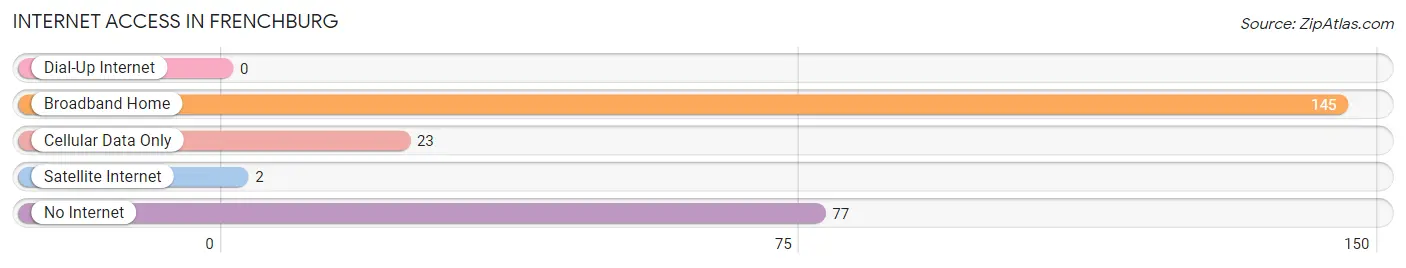
| Internet Type | # Households | % Households |
| Dial-Up Internet | 0 | 0.0% |
| Broadband Home | 145 | 58.7% |
| Cellular Data Only | 23 | 9.3% |
| Satellite Internet | 2 | 0.8% |
| No Internet | 77 | 31.2% |
| Total | 247 | 100.0% |
Frenchburg Summary
History
The small town of Frenchburg, Kentucky is located in the heart of the Appalachian Mountains in Menifee County. It was founded in 1817 by a French immigrant named John French, who had come to the area to work in the salt industry. The town was originally known as French’s Station, but the name was changed to Frenchburg in 1820.
Frenchburg was an important stop on the Lexington and Eastern Railroad, which ran from Lexington to the Ohio River. The railroad brought economic growth to the area, and the town became a center for trade and commerce. The town also became a popular destination for tourists, who came to enjoy the scenic beauty of the Appalachian Mountains.
In the late 19th century, Frenchburg was home to a thriving coal mining industry. The coal mines provided jobs for many of the town’s residents, and the town’s economy flourished. However, the coal industry declined in the early 20th century, and the town’s economy suffered.
In the 1950s, Frenchburg began to experience a revival. The town was designated as a “Historic District” by the National Register of Historic Places in 1975, and the town’s economy began to improve. Today, Frenchburg is a small but vibrant community with a population of around 500 people.
Geography
Frenchburg is located in the Appalachian Mountains of eastern Kentucky. The town is situated in the foothills of the Cumberland Plateau, and is surrounded by rolling hills and lush forests. The town is located at the intersection of US Route 460 and Kentucky Route 15.
The town is located in Menifee County, which is part of the Eastern Kentucky Coalfield. The county is home to several small towns, including Frenchburg, which is the county seat. The county is also home to the Daniel Boone National Forest, which is a popular destination for outdoor recreation.
The climate in Frenchburg is humid and subtropical, with hot summers and mild winters. The average annual temperature is around 60 degrees Fahrenheit, and the average annual precipitation is around 45 inches.
Economy
The economy of Frenchburg is largely based on tourism and agriculture. The town is home to several small businesses, including restaurants, shops, and lodging. The town is also home to several small farms, which produce a variety of crops, including corn, soybeans, and hay.
The town is also home to several manufacturing companies, which produce a variety of products, including furniture, clothing, and automotive parts. The town is also home to several coal mines, which provide jobs for many of the town’s residents.
Demographics
As of the 2010 census, the population of Frenchburg was 498 people. The racial makeup of the town was 97.2% White, 0.6% African American, 0.2% Native American, 0.2% Asian, 0.2% from other races, and 1.8% from two or more races. Hispanic or Latino of any race were 0.8% of the population.
The median income for a household in Frenchburg was $25,625, and the median income for a family was $31,250. The per capita income for the town was $14,945. About 17.2% of the population was below the poverty line.
Common Questions
What is Per Capita Income in Frenchburg?
Per Capita income in Frenchburg is $19,440.
What is the Median Household income in Frenchburg?
Median Household Income in Frenchburg is $29,028.
What is Income or Wage Gap in Frenchburg?
Income or Wage Gap in Frenchburg is 0.9%.
Women in Frenchburg earn 99.1 cents for every dollar earned by a man.
What is Inequality or Gini Index in Frenchburg?
Inequality or Gini Index in Frenchburg is 0.50.
What is the Total Population of Frenchburg?
Total Population of Frenchburg is 757.
What is the Total Male Population of Frenchburg?
Total Male Population of Frenchburg is 464.
What is the Total Female Population of Frenchburg?
Total Female Population of Frenchburg is 293.
What is the Ratio of Males per 100 Females in Frenchburg?
There are 158.36 Males per 100 Females in Frenchburg.
What is the Ratio of Females per 100 Males in Frenchburg?
There are 63.15 Females per 100 Males in Frenchburg.
What is the Median Population Age in Frenchburg?
Median Population Age in Frenchburg is 30.6 Years.
What is the Average Family Size in Frenchburg
Average Family Size in Frenchburg is 3.8 People.
What is the Average Household Size in Frenchburg
Average Household Size in Frenchburg is 3.1 People.
How Large is the Labor Force in Frenchburg?
There are 304 People in the Labor Forcein in Frenchburg.
What is the Percentage of People in the Labor Force in Frenchburg?
56.5% of People are in the Labor Force in Frenchburg.
What is the Unemployment Rate in Frenchburg?
Unemployment Rate in Frenchburg is 4.3%.