Peter, UT Map & Demographics
Peter Map
Peter Overview
$36,101
PER CAPITA INCOME
$121,696
AVG FAMILY INCOME
$120,179
AVG HOUSEHOLD INCOME
65.0%
WAGE / INCOME GAP [ % ]
35.0¢/ $1
WAGE / INCOME GAP [ $ ]
0.20
INEQUALITY / GINI INDEX
276
TOTAL POPULATION
132
MALE POPULATION
144
FEMALE POPULATION
91.67
MALES / 100 FEMALES
109.09
FEMALES / 100 MALES
36.4
MEDIAN AGE
3.4
AVG FAMILY SIZE
2.9
AVG HOUSEHOLD SIZE
118
LABOR FORCE [ PEOPLE ]
63.1%
PERCENT IN LABOR FORCE
Income in Peter
Income Overview in Peter
Per Capita Income in Peter is $36,101, while median incomes of families and households are $121,696 and $120,179 respectively.
| Characteristic | Number | Measure |
| Per Capita Income | 276 | $36,101 |
| Median Family Income | 77 | $121,696 |
| Mean Family Income | 77 | $113,965 |
| Median Household Income | 94 | $120,179 |
| Mean Household Income | 94 | $104,855 |
| Income Deficit | 77 | $0 |
| Wage / Income Gap (%) | 276 | 65.02% |
| Wage / Income Gap ($) | 276 | 34.98¢ per $1 |
| Gini / Inequality Index | 276 | 0.20 |
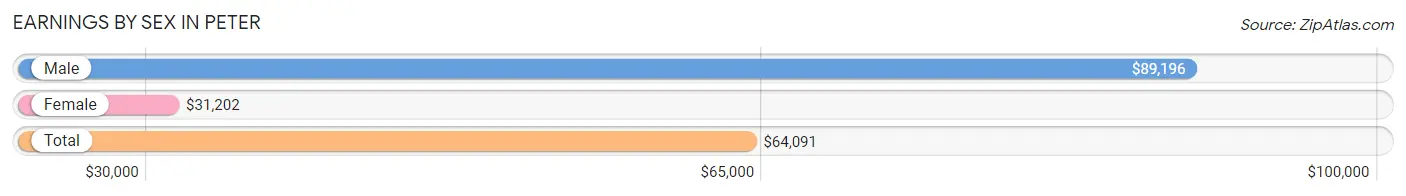
Earnings by Sex in Peter
Average Earnings in Peter are $64,091, $89,196 for men and $31,202 for women, a difference of 65.0%.
| Sex | Number | Average Earnings |
| Male | 71 (60.2%) | $89,196 |
| Female | 47 (39.8%) | $31,202 |
| Total | 118 (100.0%) | $64,091 |
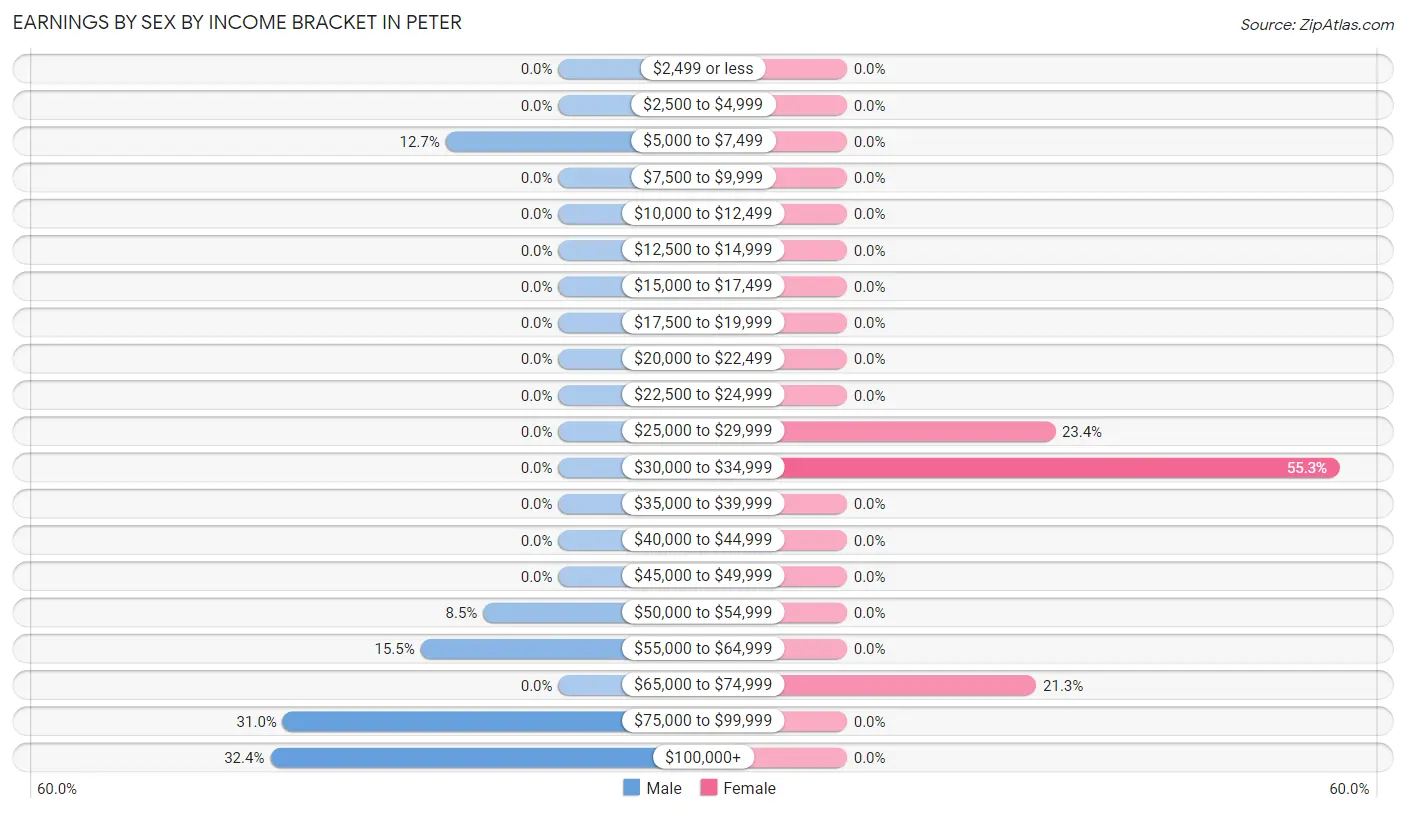
Earnings by Sex by Income Bracket in Peter
The most common earnings brackets in Peter are $100,000+ for men (23 | 32.4%) and $30,000 to $34,999 for women (26 | 55.3%).
| Income | Male | Female |
| $2,499 or less | 0 (0.0%) | 0 (0.0%) |
| $2,500 to $4,999 | 0 (0.0%) | 0 (0.0%) |
| $5,000 to $7,499 | 9 (12.7%) | 0 (0.0%) |
| $7,500 to $9,999 | 0 (0.0%) | 0 (0.0%) |
| $10,000 to $12,499 | 0 (0.0%) | 0 (0.0%) |
| $12,500 to $14,999 | 0 (0.0%) | 0 (0.0%) |
| $15,000 to $17,499 | 0 (0.0%) | 0 (0.0%) |
| $17,500 to $19,999 | 0 (0.0%) | 0 (0.0%) |
| $20,000 to $22,499 | 0 (0.0%) | 0 (0.0%) |
| $22,500 to $24,999 | 0 (0.0%) | 0 (0.0%) |
| $25,000 to $29,999 | 0 (0.0%) | 11 (23.4%) |
| $30,000 to $34,999 | 0 (0.0%) | 26 (55.3%) |
| $35,000 to $39,999 | 0 (0.0%) | 0 (0.0%) |
| $40,000 to $44,999 | 0 (0.0%) | 0 (0.0%) |
| $45,000 to $49,999 | 0 (0.0%) | 0 (0.0%) |
| $50,000 to $54,999 | 6 (8.5%) | 0 (0.0%) |
| $55,000 to $64,999 | 11 (15.5%) | 0 (0.0%) |
| $65,000 to $74,999 | 0 (0.0%) | 10 (21.3%) |
| $75,000 to $99,999 | 22 (31.0%) | 0 (0.0%) |
| $100,000+ | 23 (32.4%) | 0 (0.0%) |
| Total | 71 (100.0%) | 47 (100.0%) |
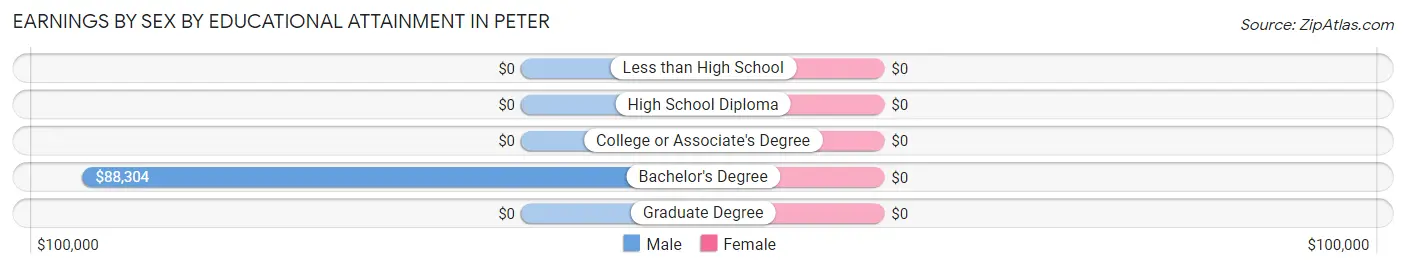
Earnings by Sex by Educational Attainment in Peter
| Educational Attainment | Male Income | Female Income |
| Less than High School | - | - |
| High School Diploma | - | - |
| College or Associate's Degree | - | - |
| Bachelor's Degree | $88,304 | $0 |
| Graduate Degree | - | - |
| Total | $92,500 | $31,202 |
Family Income in Peter
Family Income Brackets in Peter
According to the Peter family income data, there are 36 families falling into the $100,000 to $149,999 income range, which is the most common income bracket and makes up 46.8% of all families.
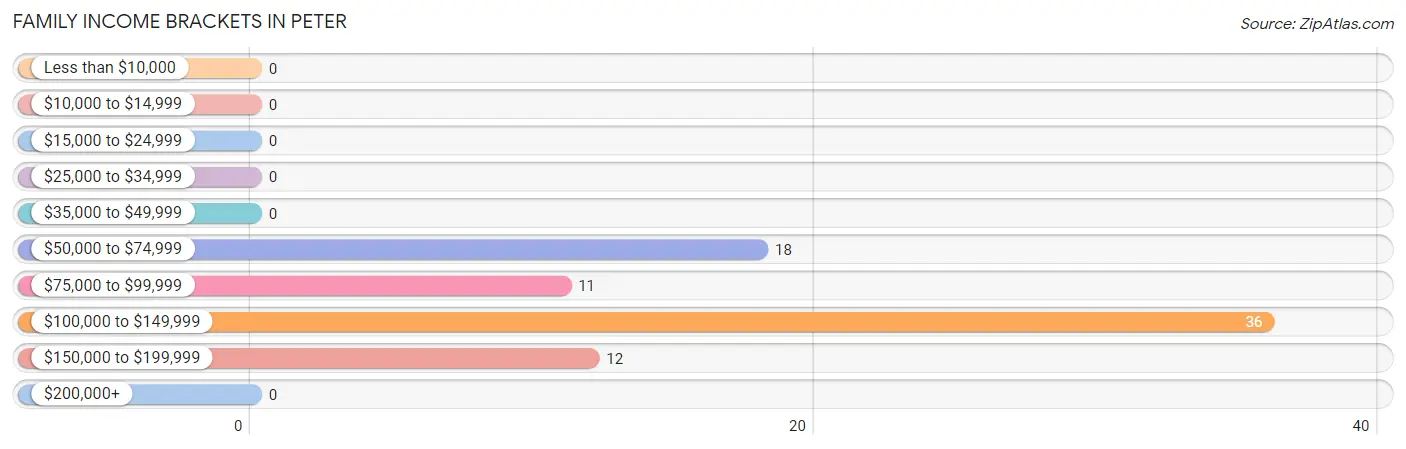
| Income Bracket | # Families | % Families |
| Less than $10,000 | 0 | 0.0% |
| $10,000 to $14,999 | 0 | 0.0% |
| $15,000 to $24,999 | 0 | 0.0% |
| $25,000 to $34,999 | 0 | 0.0% |
| $35,000 to $49,999 | 0 | 0.0% |
| $50,000 to $74,999 | 18 | 23.4% |
| $75,000 to $99,999 | 11 | 14.3% |
| $100,000 to $149,999 | 36 | 46.8% |
| $150,000 to $199,999 | 12 | 15.6% |
| $200,000+ | 0 | 0.0% |
Family Income by Famaliy Size in Peter
| Income Bracket | # Families | Median Income |
| 2-Person Families | 19 (24.7%) | $0 |
| 3-Person Families | 23 (29.9%) | $0 |
| 4-Person Families | 6 (7.8%) | $0 |
| 5-Person Families | 11 (14.3%) | $0 |
| 6-Person Families | 18 (23.4%) | $0 |
| 7+ Person Families | 0 (0.0%) | $0 |
| Total | 77 (100.0%) | $121,696 |
Family Income by Number of Earners in Peter
| Number of Earners | # Families | Median Income |
| No Earners | 5 (6.5%) | $0 |
| 1 Earner | 36 (46.8%) | $0 |
| 2 Earners | 25 (32.5%) | $0 |
| 3+ Earners | 11 (14.3%) | $0 |
| Total | 77 (100.0%) | $121,696 |
Household Income in Peter
Household Income Brackets in Peter
With 36 households falling in the category, the $100,000 to $149,999 income range is the most frequent in Peter, accounting for 38.3% of all households.
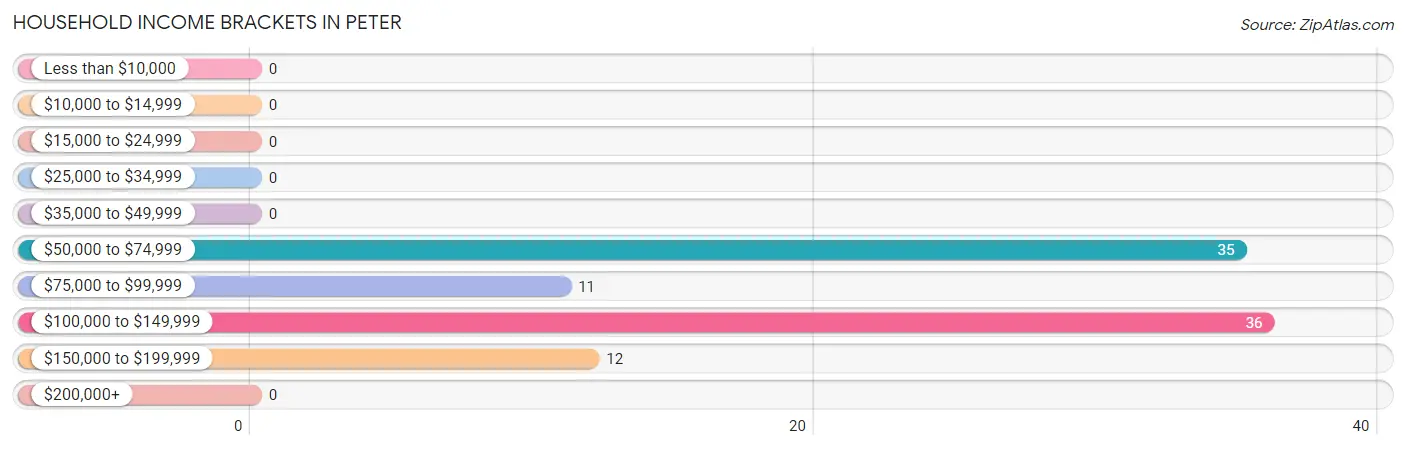
| Income Bracket | # Households | % Households |
| Less than $10,000 | 0 | 0.0% |
| $10,000 to $14,999 | 0 | 0.0% |
| $15,000 to $24,999 | 0 | 0.0% |
| $25,000 to $34,999 | 0 | 0.0% |
| $35,000 to $49,999 | 0 | 0.0% |
| $50,000 to $74,999 | 35 | 37.2% |
| $75,000 to $99,999 | 11 | 11.7% |
| $100,000 to $149,999 | 36 | 38.3% |
| $150,000 to $199,999 | 12 | 12.8% |
| $200,000+ | 0 | 0.0% |
Household Income by Householder Age in Peter
The median household income in Peter is $120,179, with the highest median household income of $133,750 found in the 25 to 44 years age bracket for the primary householder. A total of 46 households (48.9%) fall into this category.
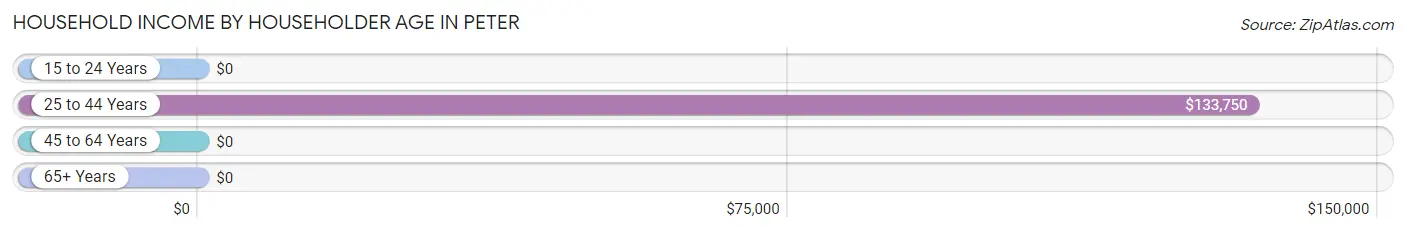
| Income Bracket | # Households | Median Income |
| 15 to 24 Years | 0 (0.0%) | $0 |
| 25 to 44 Years | 46 (48.9%) | $133,750 |
| 45 to 64 Years | 19 (20.2%) | $0 |
| 65+ Years | 29 (30.8%) | $0 |
| Total | 94 (100.0%) | $120,179 |
Poverty in Peter
Income Below Poverty by Sex and Age in Peter
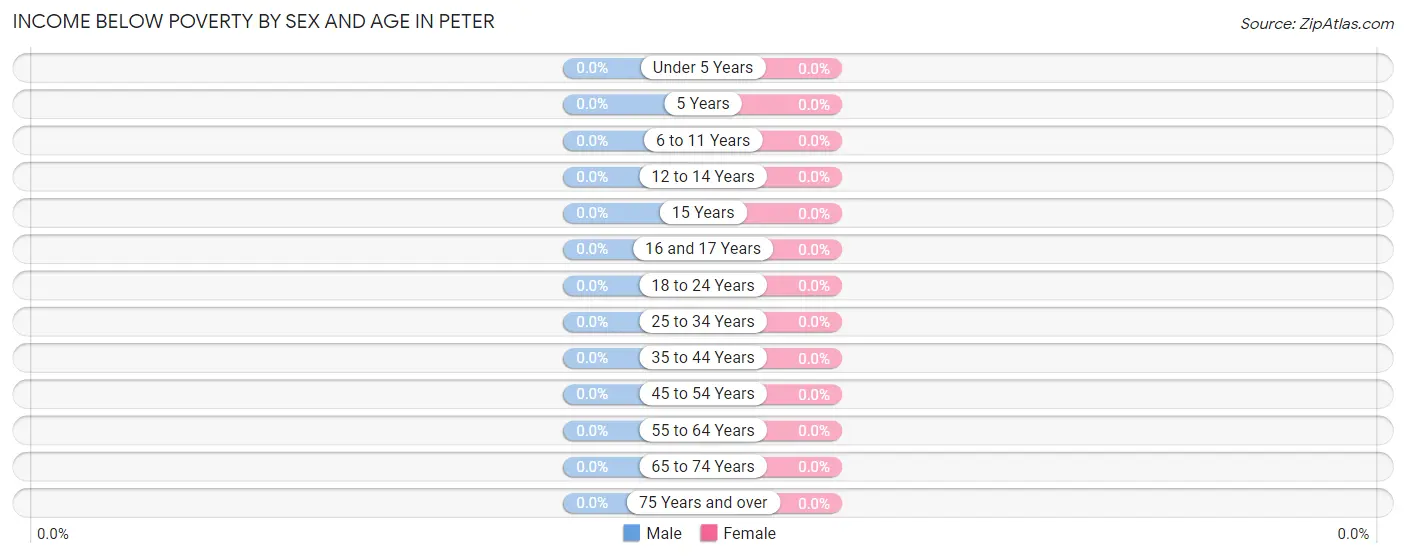
| Age Bracket | Male | Female |
| Under 5 Years | 0 (0.0%) | 0 (0.0%) |
| 5 Years | 0 (0.0%) | 0 (0.0%) |
| 6 to 11 Years | 0 (0.0%) | 0 (0.0%) |
| 12 to 14 Years | 0 (0.0%) | 0 (0.0%) |
| 15 Years | 0 (0.0%) | 0 (0.0%) |
| 16 and 17 Years | 0 (0.0%) | 0 (0.0%) |
| 18 to 24 Years | 0 (0.0%) | 0 (0.0%) |
| 25 to 34 Years | 0 (0.0%) | 0 (0.0%) |
| 35 to 44 Years | 0 (0.0%) | 0 (0.0%) |
| 45 to 54 Years | 0 (0.0%) | 0 (0.0%) |
| 55 to 64 Years | 0 (0.0%) | 0 (0.0%) |
| 65 to 74 Years | 0 (0.0%) | 0 (0.0%) |
| 75 Years and over | 0 (0.0%) | 0 (0.0%) |
| Total | 0 (0.0%) | 0 (0.0%) |
Income Above Poverty by Sex and Age in Peter
According to the poverty statistics in Peter, males aged under 5 years and females aged under 5 years are the age groups that are most secure financially, with 100.0% of males and 100.0% of females in these age groups living above the poverty line.
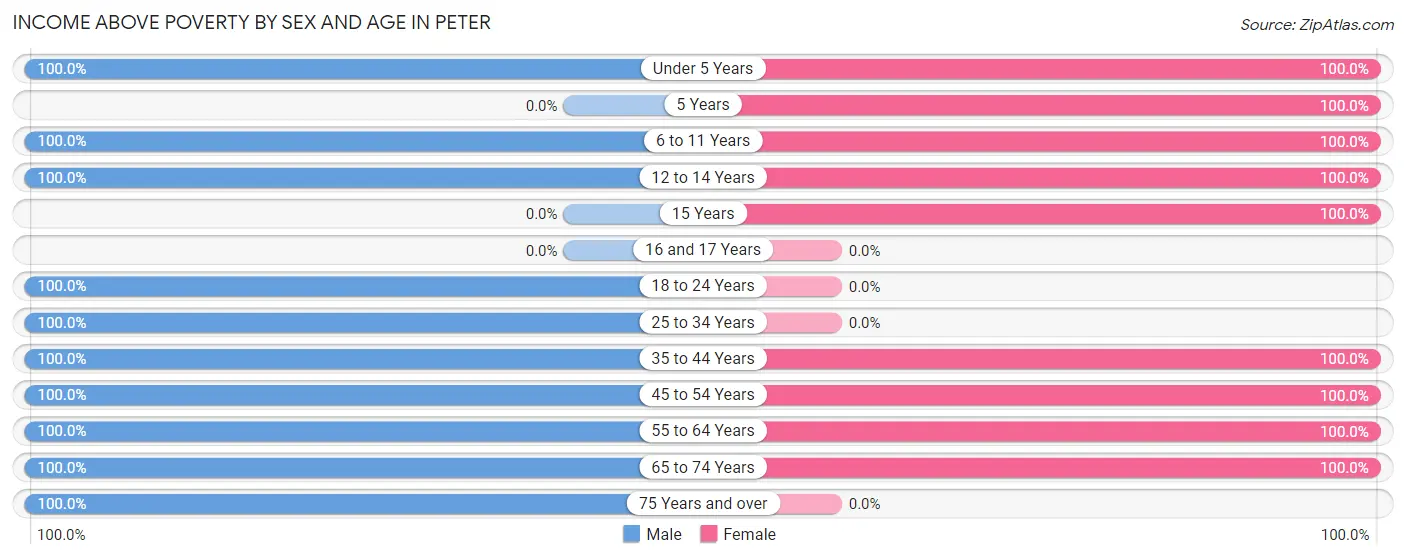
| Age Bracket | Male | Female |
| Under 5 Years | 14 (100.0%) | 17 (100.0%) |
| 5 Years | 0 (0.0%) | 6 (100.0%) |
| 6 to 11 Years | 7 (100.0%) | 23 (100.0%) |
| 12 to 14 Years | 6 (100.0%) | 8 (100.0%) |
| 15 Years | 0 (0.0%) | 8 (100.0%) |
| 16 and 17 Years | 0 (0.0%) | 0 (0.0%) |
| 18 to 24 Years | 9 (100.0%) | 0 (0.0%) |
| 25 to 34 Years | 12 (100.0%) | 0 (0.0%) |
| 35 to 44 Years | 28 (100.0%) | 51 (100.0%) |
| 45 to 54 Years | 22 (100.0%) | 14 (100.0%) |
| 55 to 64 Years | 5 (100.0%) | 6 (100.0%) |
| 65 to 74 Years | 12 (100.0%) | 11 (100.0%) |
| 75 Years and over | 17 (100.0%) | 0 (0.0%) |
| Total | 132 (100.0%) | 144 (100.0%) |
Income Below Poverty Among Married-Couple Families in Peter
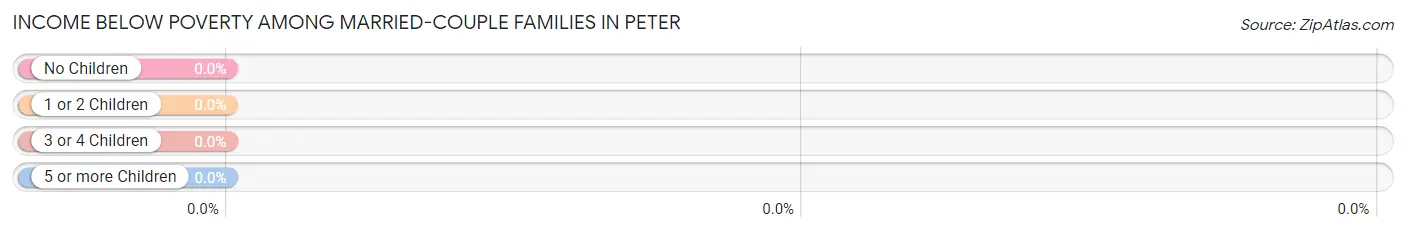
| Children | Above Poverty | Below Poverty |
| No Children | 31 (100.0%) | 0 (0.0%) |
| 1 or 2 Children | 28 (100.0%) | 0 (0.0%) |
| 3 or 4 Children | 18 (100.0%) | 0 (0.0%) |
| 5 or more Children | 0 (0.0%) | 0 (0.0%) |
| Total | 77 (100.0%) | 0 (0.0%) |
Income Below Poverty Among Single-Parent Households in Peter
| Children | Single Father | Single Mother |
| No Children | 0 (0.0%) | 0 (0.0%) |
| 1 or 2 Children | 0 (0.0%) | 0 (0.0%) |
| 3 or 4 Children | 0 (0.0%) | 0 (0.0%) |
| 5 or more Children | 0 (0.0%) | 0 (0.0%) |
| Total | 0 (0.0%) | 0 (0.0%) |
Income Below Poverty Among Married-Couple vs Single-Parent Households in Peter
| Children | Married-Couple Families | Single-Parent Households |
| No Children | 0 (0.0%) | 0 (0.0%) |
| 1 or 2 Children | 0 (0.0%) | 0 (0.0%) |
| 3 or 4 Children | 0 (0.0%) | 0 (0.0%) |
| 5 or more Children | 0 (0.0%) | 0 (0.0%) |
| Total | 0 (0.0%) | 0 (0.0%) |
Race in Peter
The most populous races in Peter are White / Caucasian (246 | 89.1%), Hispanic or Latino (30 | 10.9%), and Two or more Races (30 | 10.9%).
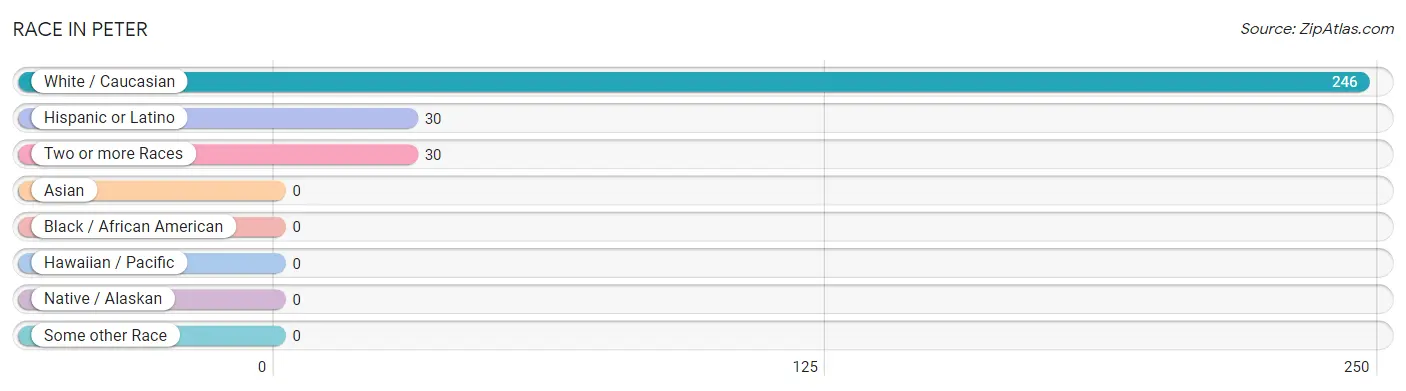
| Race | # Population | % Population |
| Asian | 0 | 0.0% |
| Black / African American | 0 | 0.0% |
| Hawaiian / Pacific | 0 | 0.0% |
| Hispanic or Latino | 30 | 10.9% |
| Native / Alaskan | 0 | 0.0% |
| White / Caucasian | 246 | 89.1% |
| Two or more Races | 30 | 10.9% |
| Some other Race | 0 | 0.0% |
| Total | 276 | 100.0% |
Ancestry in Peter
The most populous ancestries reported in Peter are English (81 | 29.3%), German (53 | 19.2%), European (42 | 15.2%), Norwegian (35 | 12.7%), and Peruvian (30 | 10.9%), together accounting for 87.3% of all Peter residents.

| Ancestry | # Population | % Population |
| American | 14 | 5.1% |
| Danish | 23 | 8.3% |
| English | 81 | 29.3% |
| European | 42 | 15.2% |
| French | 14 | 5.1% |
| German | 53 | 19.2% |
| Italian | 28 | 10.1% |
| Norwegian | 35 | 12.7% |
| Peruvian | 30 | 10.9% |
| Polish | 6 | 2.2% |
| Portuguese | 13 | 4.7% |
| South American | 30 | 10.9% |
| South American Indian | 30 | 10.9% |
| Swedish | 20 | 7.2% |
| Welsh | 17 | 6.2% | View All 15 Rows |
Immigrants in Peter
The most numerous immigrant groups reported in Peter came from Latin America (12 | 4.3%), South America (12 | 4.3%), Brazil (7 | 2.5%), and Peru (5 | 1.8%), together accounting for 13.1% of all Peter residents.
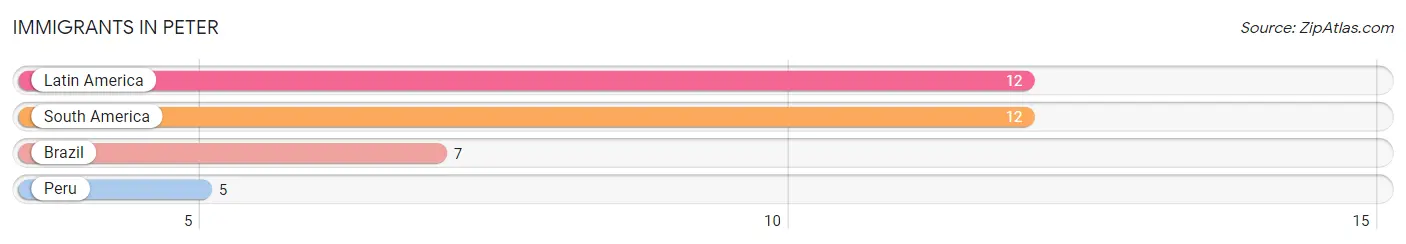
| Immigration Origin | # Population | % Population |
| Brazil | 7 | 2.5% |
| Latin America | 12 | 4.3% |
| Peru | 5 | 1.8% |
| South America | 12 | 4.3% | View All 4 Rows |
Sex and Age in Peter
Sex and Age in Peter
The most populous age groups in Peter are 35 to 39 Years (17 | 12.9%) for men and 40 to 44 Years (29 | 20.1%) for women.
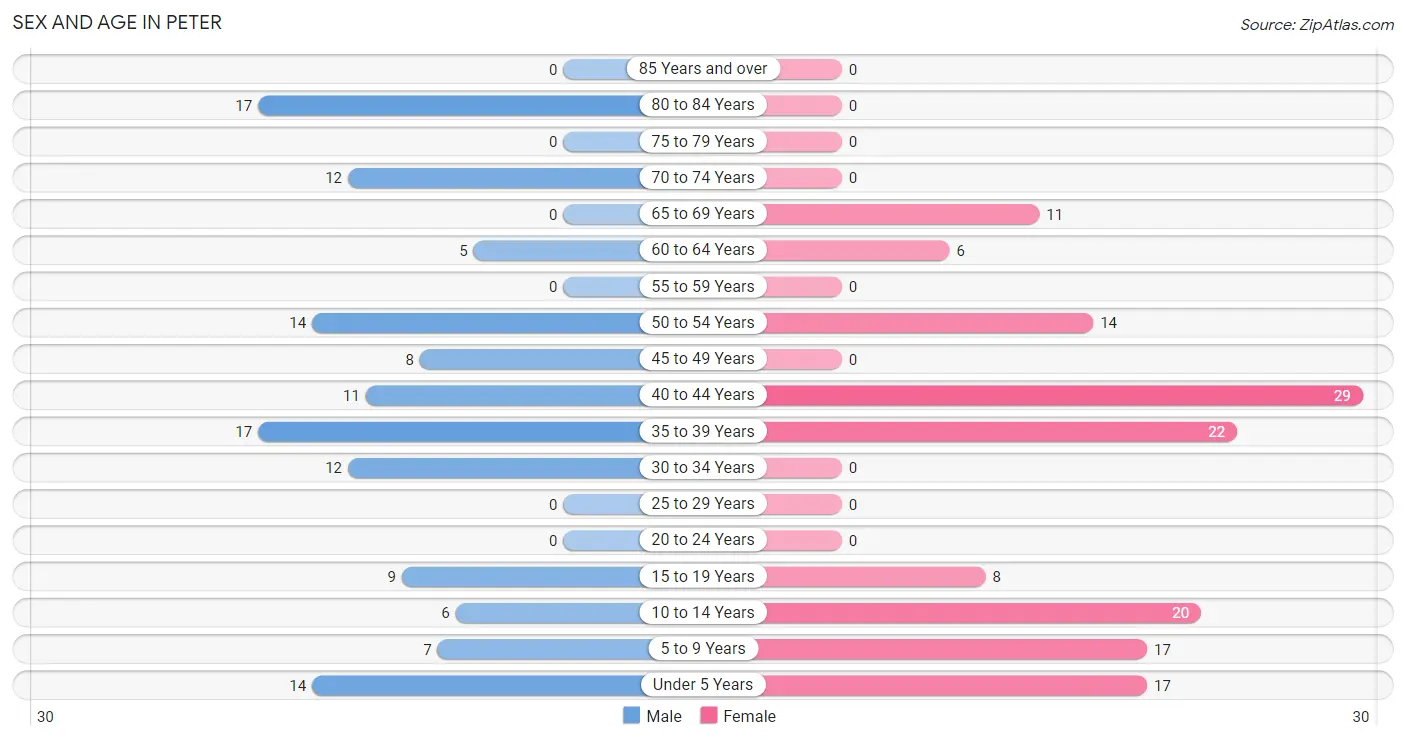
| Age Bracket | Male | Female |
| Under 5 Years | 14 (10.6%) | 17 (11.8%) |
| 5 to 9 Years | 7 (5.3%) | 17 (11.8%) |
| 10 to 14 Years | 6 (4.5%) | 20 (13.9%) |
| 15 to 19 Years | 9 (6.8%) | 8 (5.6%) |
| 20 to 24 Years | 0 (0.0%) | 0 (0.0%) |
| 25 to 29 Years | 0 (0.0%) | 0 (0.0%) |
| 30 to 34 Years | 12 (9.1%) | 0 (0.0%) |
| 35 to 39 Years | 17 (12.9%) | 22 (15.3%) |
| 40 to 44 Years | 11 (8.3%) | 29 (20.1%) |
| 45 to 49 Years | 8 (6.1%) | 0 (0.0%) |
| 50 to 54 Years | 14 (10.6%) | 14 (9.7%) |
| 55 to 59 Years | 0 (0.0%) | 0 (0.0%) |
| 60 to 64 Years | 5 (3.8%) | 6 (4.2%) |
| 65 to 69 Years | 0 (0.0%) | 11 (7.6%) |
| 70 to 74 Years | 12 (9.1%) | 0 (0.0%) |
| 75 to 79 Years | 0 (0.0%) | 0 (0.0%) |
| 80 to 84 Years | 17 (12.9%) | 0 (0.0%) |
| 85 Years and over | 0 (0.0%) | 0 (0.0%) |
| Total | 132 (100.0%) | 144 (100.0%) |
Families and Households in Peter
Median Family Size in Peter
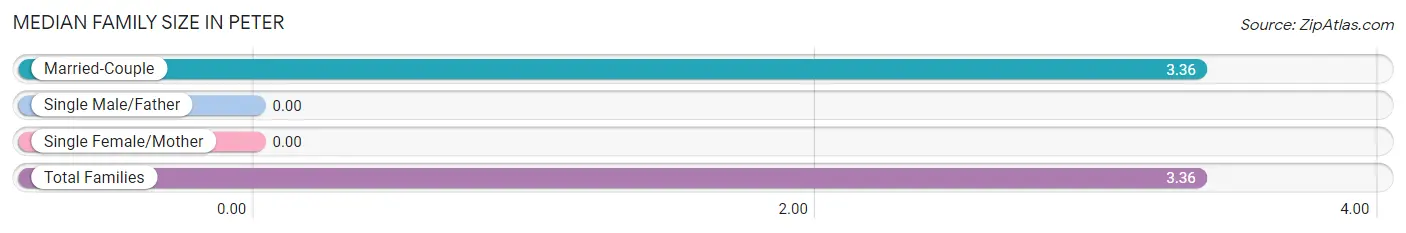
| Family Type | # Families | Family Size |
| Married-Couple | 77 (100.0%) | 3.36 |
| Single Male/Father | 0 (0.0%) | - |
| Single Female/Mother | 0 (0.0%) | - |
| Total Families | 77 (100.0%) | 3.36 |
Median Household Size in Peter
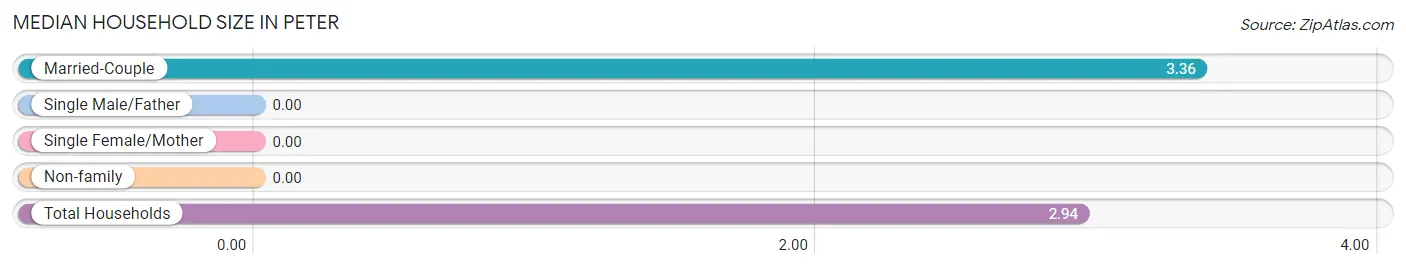
| Household Type | # Households | Household Size |
| Married-Couple | 77 (81.9%) | 3.36 |
| Single Male/Father | 0 (0.0%) | - |
| Single Female/Mother | 0 (0.0%) | - |
| Non-family | 17 (18.1%) | - |
| Total Households | 94 (100.0%) | 2.94 |
Household Size by Marriage Status in Peter
Out of a total of 94 households in Peter, 77 (81.9%) are family households, while 17 (18.1%) are nonfamily households. The most numerous type of family households are 3-person households, comprising 23, and the most common type of nonfamily households are 1-person households, comprising 17.
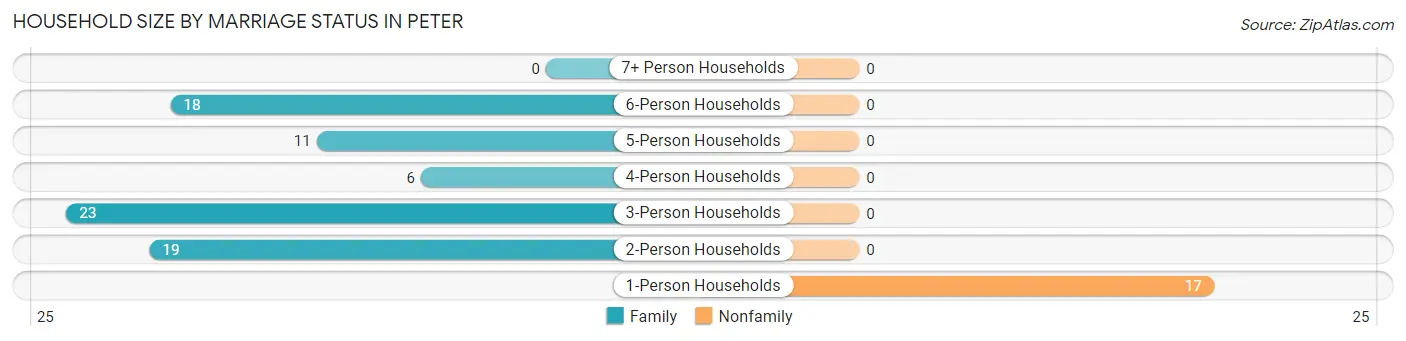
| Household Size | Family Households | Nonfamily Households |
| 1-Person Households | - | 17 (18.1%) |
| 2-Person Households | 19 (20.2%) | 0 (0.0%) |
| 3-Person Households | 23 (24.5%) | 0 (0.0%) |
| 4-Person Households | 6 (6.4%) | 0 (0.0%) |
| 5-Person Households | 11 (11.7%) | 0 (0.0%) |
| 6-Person Households | 18 (19.2%) | 0 (0.0%) |
| 7+ Person Households | 0 (0.0%) | 0 (0.0%) |
| Total | 77 (81.9%) | 17 (18.1%) |
Female Fertility in Peter
Fertility by Age in Peter
| Age Bracket | Women with Births | Births / 1,000 Women |
| 15 to 19 years | 0 (0.0%) | 0.0 |
| 20 to 34 years | 0 (0.0%) | 0.0 |
| 35 to 50 years | 0 (0.0%) | 0.0 |
| Total | 0 (0.0%) | 0.0 |
Fertility by Age by Marriage Status in Peter
| Age Bracket | Married | Unmarried |
| 15 to 19 years | 0 (0.0%) | 0 (0.0%) |
| 20 to 34 years | 0 (0.0%) | 0 (0.0%) |
| 35 to 50 years | 0 (0.0%) | 0 (0.0%) |
| Total | 0 (0.0%) | 0 (0.0%) |
Fertility by Education in Peter
| Educational Attainment | Women with Births | Births / 1,000 Women |
| Less than High School | 0 (0.0%) | 0.0 |
| High School Diploma | 0 (0.0%) | 0.0 |
| College or Associate's Degree | 0 (0.0%) | 0.0 |
| Bachelor's Degree | 0 (0.0%) | 0.0 |
| Graduate Degree | 0 (0.0%) | 0.0 |
| Total | 0 (0.0%) | 0.0 |
Fertility by Education by Marriage Status in Peter
| Educational Attainment | Married | Unmarried |
| Less than High School | 0 (0.0%) | 0 (0.0%) |
| High School Diploma | 0 (0.0%) | 0 (0.0%) |
| College or Associate's Degree | 0 (0.0%) | 0 (0.0%) |
| Bachelor's Degree | 0 (0.0%) | 0 (0.0%) |
| Graduate Degree | 0 (0.0%) | 0 (0.0%) |
| Total | 0 (0.0%) | 0 (0.0%) |
Employment Characteristics in Peter
Employment by Class of Employer in Peter
Among the 118 employed individuals in Peter, private company employees (83 | 70.3%), federal government employees (14 | 11.9%), and local government employees (11 | 9.3%) make up the most common classes of employment.
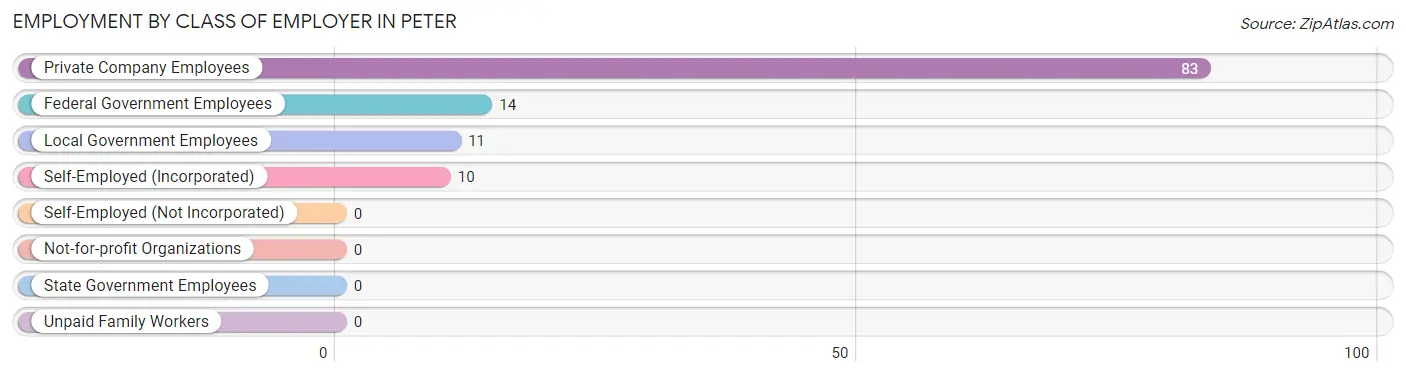
| Employer Class | # Employees | % Employees |
| Private Company Employees | 83 | 70.3% |
| Self-Employed (Incorporated) | 10 | 8.5% |
| Self-Employed (Not Incorporated) | 0 | 0.0% |
| Not-for-profit Organizations | 0 | 0.0% |
| Local Government Employees | 11 | 9.3% |
| State Government Employees | 0 | 0.0% |
| Federal Government Employees | 14 | 11.9% |
| Unpaid Family Workers | 0 | 0.0% |
| Total | 118 | 100.0% |
Employment Status by Age in Peter
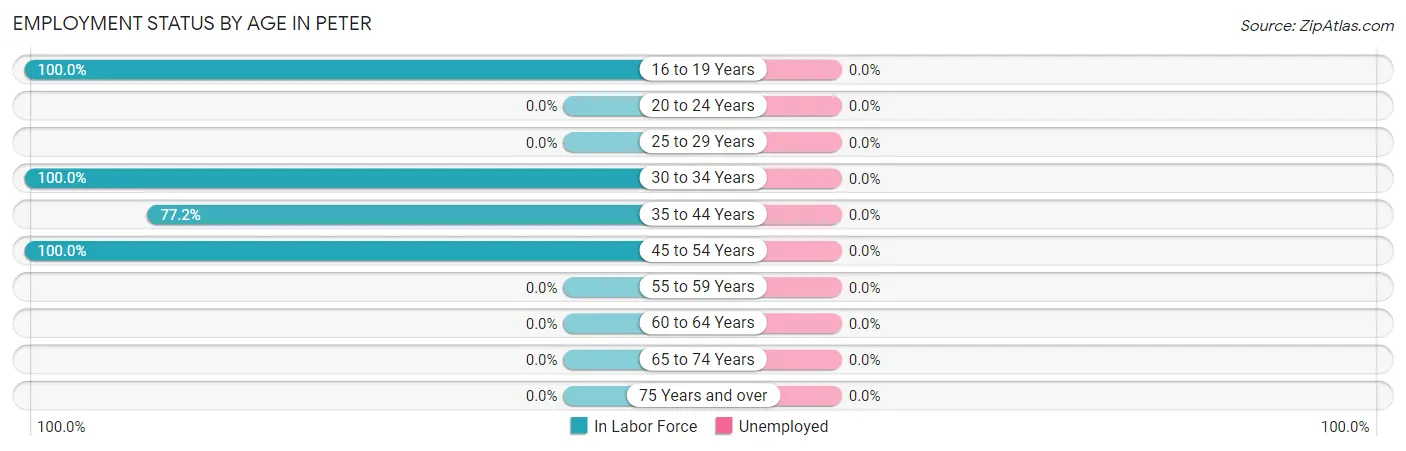
| Age Bracket | In Labor Force | Unemployed |
| 16 to 19 Years | 9 (100.0%) | 0 (0.0%) |
| 20 to 24 Years | 0 (0.0%) | 0 (0.0%) |
| 25 to 29 Years | 0 (0.0%) | 0 (0.0%) |
| 30 to 34 Years | 12 (100.0%) | 0 (0.0%) |
| 35 to 44 Years | 61 (77.2%) | 0 (0.0%) |
| 45 to 54 Years | 36 (100.0%) | 0 (0.0%) |
| 55 to 59 Years | 0 (0.0%) | 0 (0.0%) |
| 60 to 64 Years | 0 (0.0%) | 0 (0.0%) |
| 65 to 74 Years | 0 (0.0%) | 0 (0.0%) |
| 75 Years and over | 0 (0.0%) | 0 (0.0%) |
| Total | 118 (63.1%) | 0 (0.0%) |
Employment Status by Educational Attainment in Peter
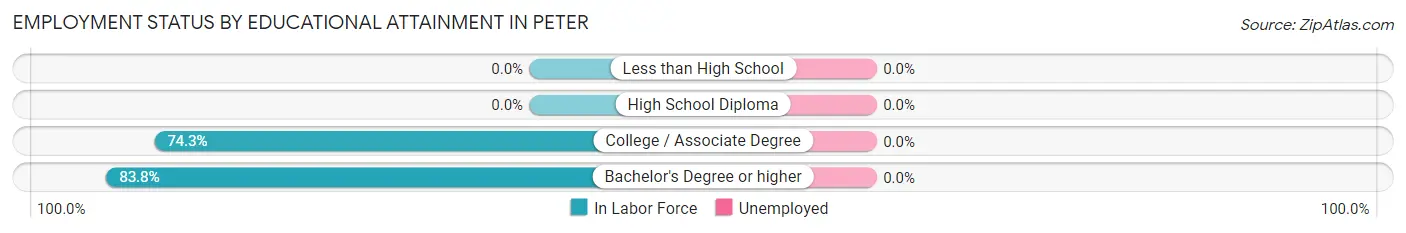
| Educational Attainment | In Labor Force | Unemployed |
| Less than High School | 0 (0.0%) | 0 (0.0%) |
| High School Diploma | 0 (0.0%) | 0 (0.0%) |
| College / Associate Degree | 52 (74.3%) | 0 (0.0%) |
| Bachelor's Degree or higher | 57 (83.8%) | 0 (0.0%) |
| Total | 109 (79.0%) | 0 (0.0%) |
Employment Occupations by Sex in Peter
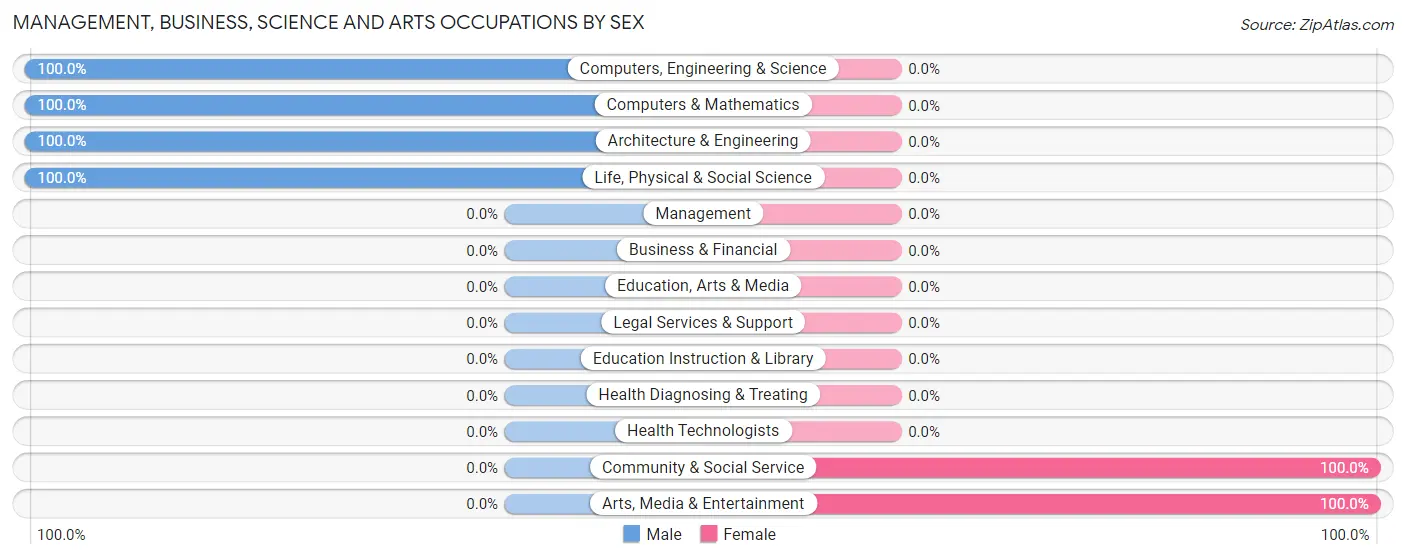
Management, Business, Science and Arts Occupations
The most common Management, Business, Science and Arts occupations in Peter are Computers, Engineering & Science (48 | 40.7%), Architecture & Engineering (19 | 16.1%), Computers & Mathematics (18 | 15.2%), Life, Physical & Social Science (11 | 9.3%), and Community & Social Service (11 | 9.3%).
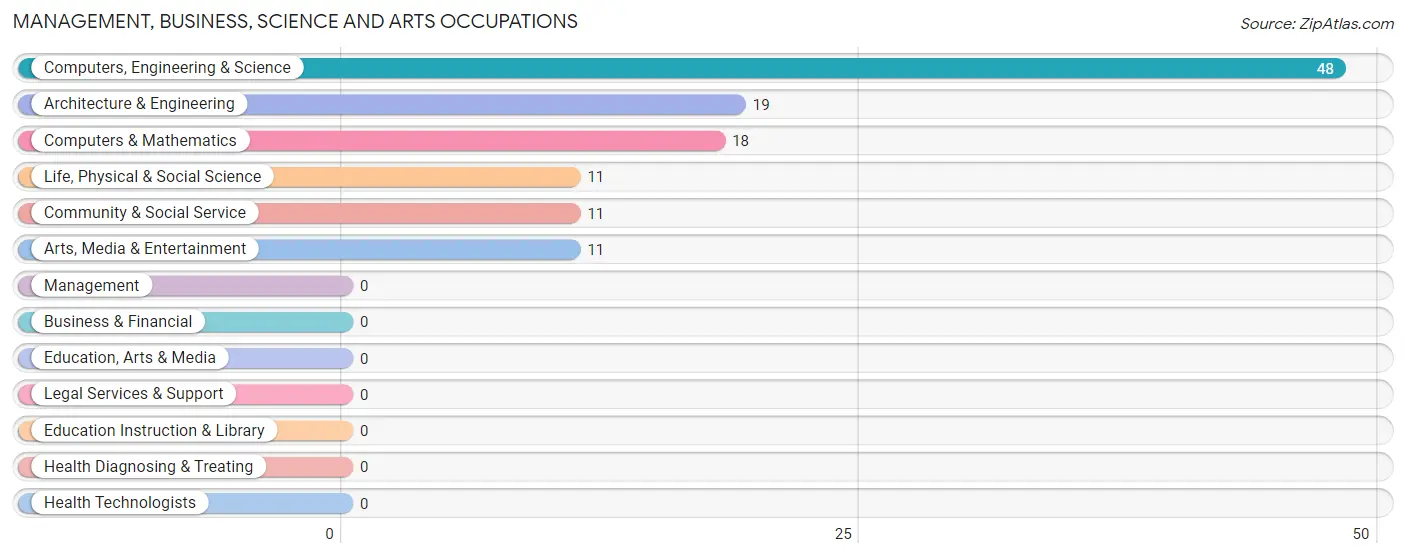
Management, Business, Science and Arts Occupations by Sex
Within the Management, Business, Science and Arts occupations in Peter, the most male-oriented occupations are Computers, Engineering & Science (100.0%), Computers & Mathematics (100.0%), and Architecture & Engineering (100.0%), while the most female-oriented occupations are Community & Social Service (100.0%), and Arts, Media & Entertainment (100.0%).
| Occupation | Male | Female |
| Management | 0 (0.0%) | 0 (0.0%) |
| Business & Financial | 0 (0.0%) | 0 (0.0%) |
| Computers, Engineering & Science | 48 (100.0%) | 0 (0.0%) |
| Computers & Mathematics | 18 (100.0%) | 0 (0.0%) |
| Architecture & Engineering | 19 (100.0%) | 0 (0.0%) |
| Life, Physical & Social Science | 11 (100.0%) | 0 (0.0%) |
| Community & Social Service | 0 (0.0%) | 11 (100.0%) |
| Education, Arts & Media | 0 (0.0%) | 0 (0.0%) |
| Legal Services & Support | 0 (0.0%) | 0 (0.0%) |
| Education Instruction & Library | 0 (0.0%) | 0 (0.0%) |
| Arts, Media & Entertainment | 0 (0.0%) | 11 (100.0%) |
| Health Diagnosing & Treating | 0 (0.0%) | 0 (0.0%) |
| Health Technologists | 0 (0.0%) | 0 (0.0%) |
| Total (Category) | 48 (81.4%) | 11 (18.6%) |
| Total (Overall) | 71 (60.2%) | 47 (39.8%) |
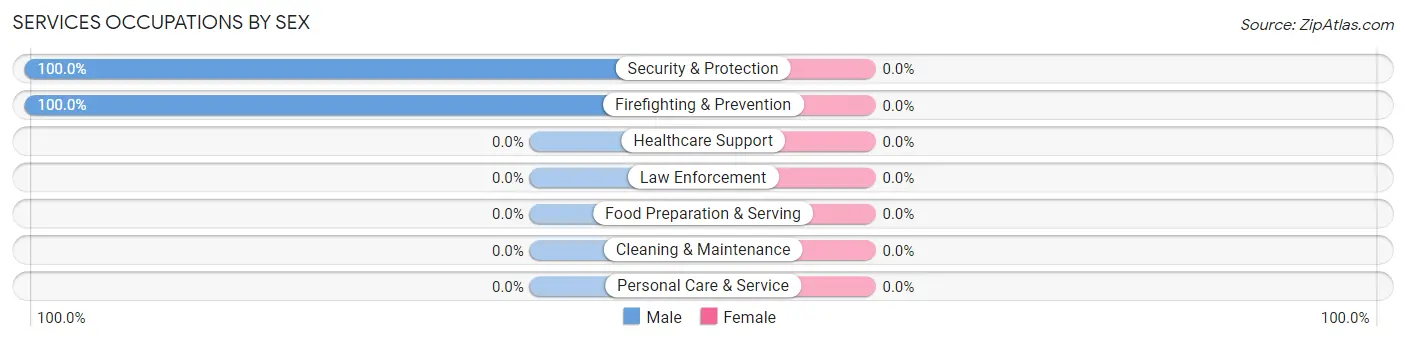
Services Occupations
The most common Services occupations in Peter are Security & Protection (14 | 11.9%), and Firefighting & Prevention (14 | 11.9%).
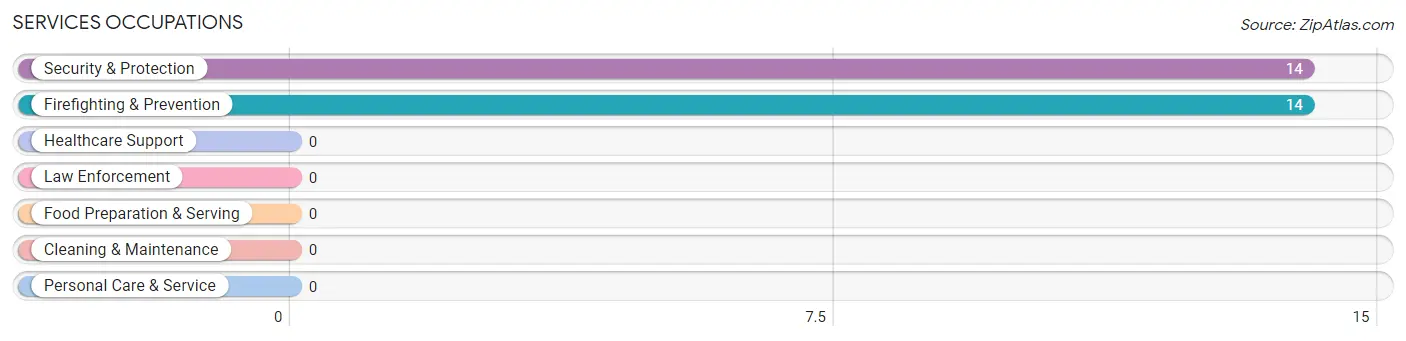
Services Occupations by Sex
| Occupation | Male | Female |
| Healthcare Support | 0 (0.0%) | 0 (0.0%) |
| Security & Protection | 14 (100.0%) | 0 (0.0%) |
| Firefighting & Prevention | 14 (100.0%) | 0 (0.0%) |
| Law Enforcement | 0 (0.0%) | 0 (0.0%) |
| Food Preparation & Serving | 0 (0.0%) | 0 (0.0%) |
| Cleaning & Maintenance | 0 (0.0%) | 0 (0.0%) |
| Personal Care & Service | 0 (0.0%) | 0 (0.0%) |
| Total (Category) | 14 (100.0%) | 0 (0.0%) |
| Total (Overall) | 71 (60.2%) | 47 (39.8%) |
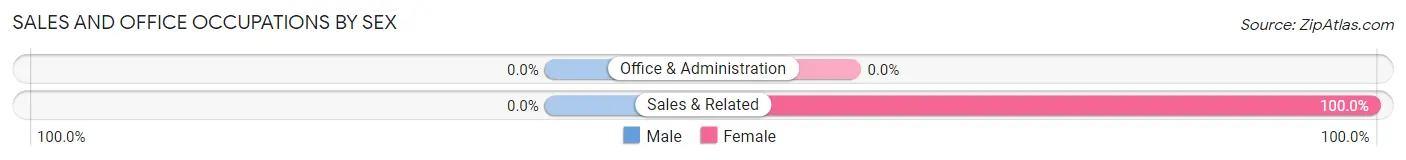
Sales and Office Occupations
The most common Sales and Office occupations in Peter are , and Sales & Related (12 | 10.2%).
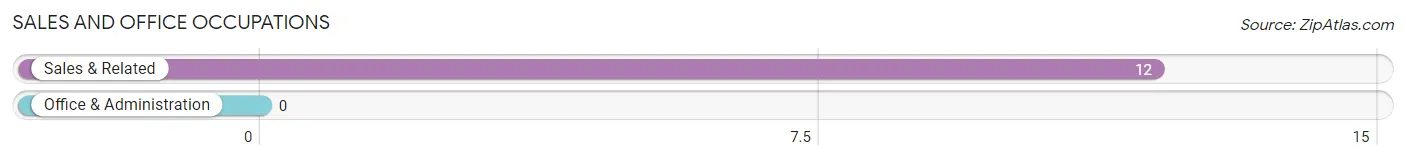
Sales and Office Occupations by Sex
| Occupation | Male | Female |
| Sales & Related | 0 (0.0%) | 12 (100.0%) |
| Office & Administration | 0 (0.0%) | 0 (0.0%) |
| Total (Category) | 0 (0.0%) | 12 (100.0%) |
| Total (Overall) | 71 (60.2%) | 47 (39.8%) |
Natural Resources, Construction and Maintenance Occupations
Natural Resources, Construction and Maintenance Occupations by Sex
| Occupation | Male | Female |
| Farming, Fishing & Forestry | 0 (0.0%) | 0 (0.0%) |
| Construction & Extraction | 0 (0.0%) | 0 (0.0%) |
| Installation, Maintenance & Repair | 0 (0.0%) | 0 (0.0%) |
| Total (Category) | 0 (0.0%) | 0 (0.0%) |
| Total (Overall) | 71 (60.2%) | 47 (39.8%) |
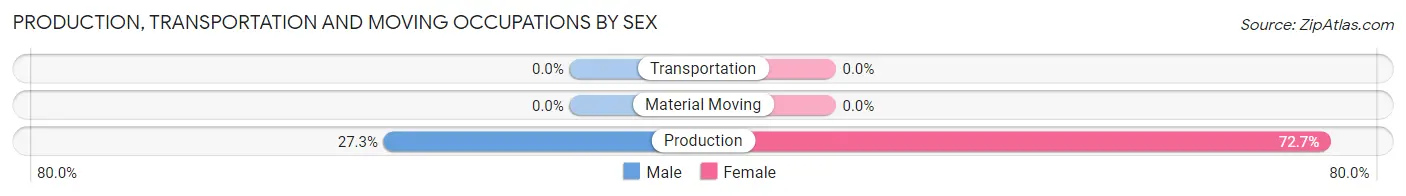
Production, Transportation and Moving Occupations
The most common Production, Transportation and Moving occupations in Peter are , and Production (33 | 28.0%).
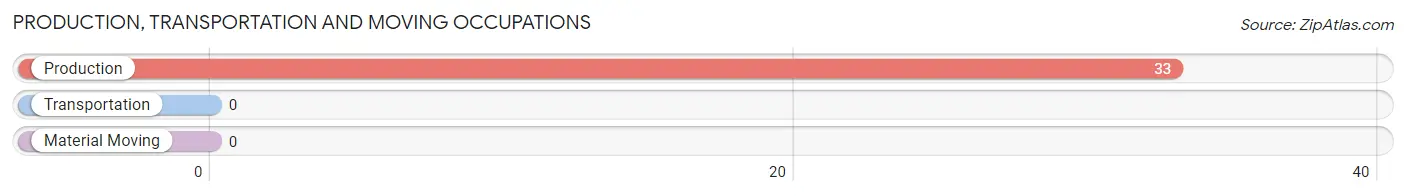
Production, Transportation and Moving Occupations by Sex
| Occupation | Male | Female |
| Production | 9 (27.3%) | 24 (72.7%) |
| Transportation | 0 (0.0%) | 0 (0.0%) |
| Material Moving | 0 (0.0%) | 0 (0.0%) |
| Total (Category) | 9 (27.3%) | 24 (72.7%) |
| Total (Overall) | 71 (60.2%) | 47 (39.8%) |
Employment Industries by Sex in Peter
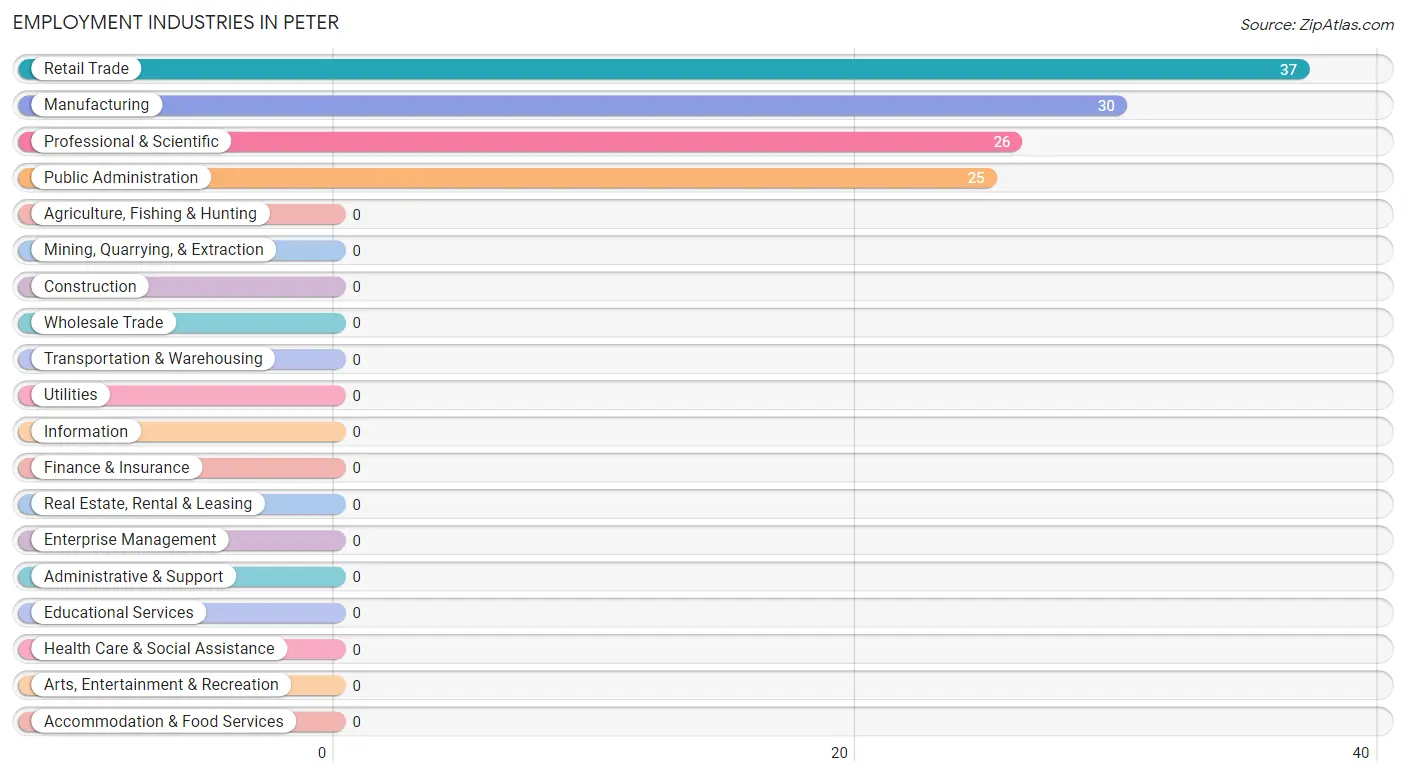
Employment Industries in Peter
The major employment industries in Peter include Retail Trade (37 | 31.4%), Manufacturing (30 | 25.4%), Professional & Scientific (26 | 22.0%), and Public Administration (25 | 21.2%).
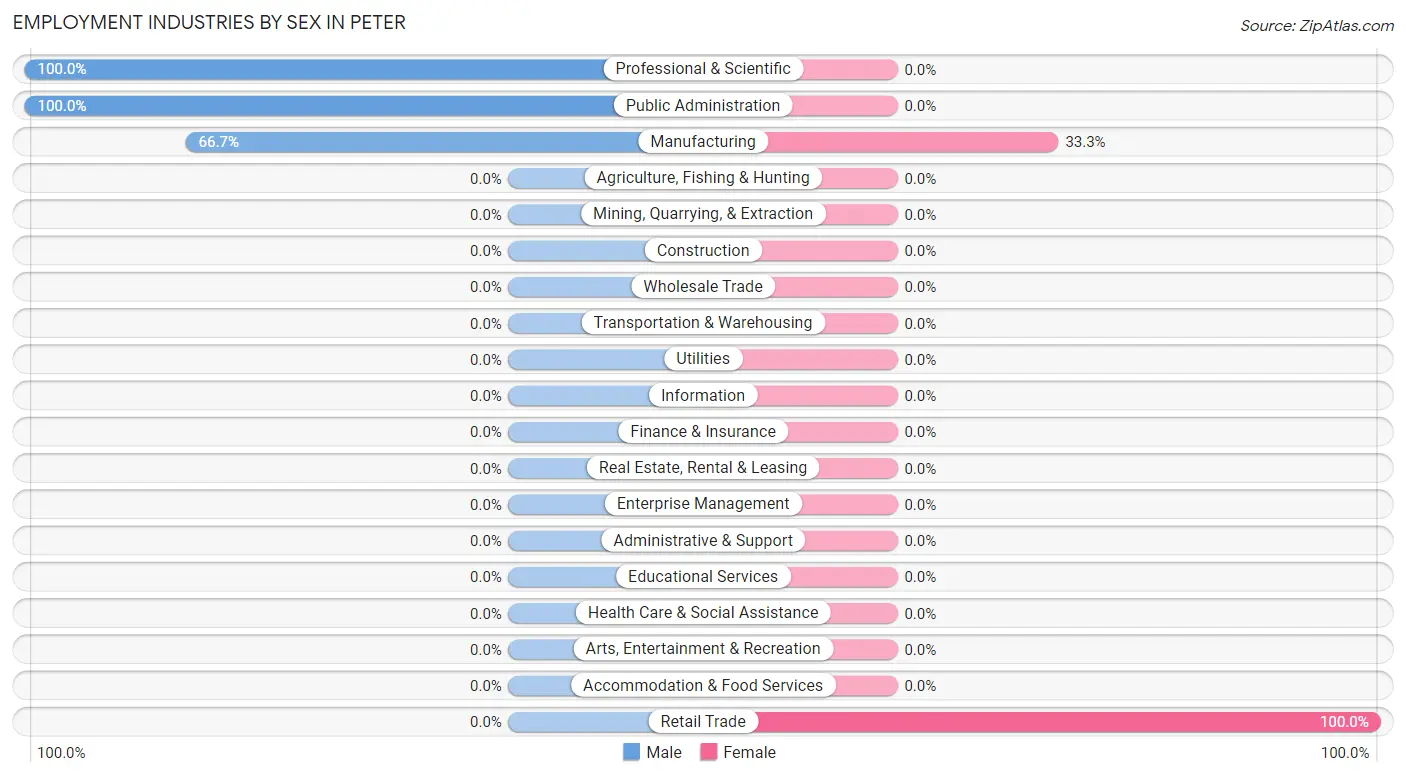
Employment Industries by Sex in Peter
The Peter industries that see more men than women are Professional & Scientific (100.0%), Public Administration (100.0%), and Manufacturing (66.7%), whereas the industries that tend to have a higher number of women are Retail Trade (100.0%), and Manufacturing (33.3%).
| Industry | Male | Female |
| Agriculture, Fishing & Hunting | 0 (0.0%) | 0 (0.0%) |
| Mining, Quarrying, & Extraction | 0 (0.0%) | 0 (0.0%) |
| Construction | 0 (0.0%) | 0 (0.0%) |
| Manufacturing | 20 (66.7%) | 10 (33.3%) |
| Wholesale Trade | 0 (0.0%) | 0 (0.0%) |
| Retail Trade | 0 (0.0%) | 37 (100.0%) |
| Transportation & Warehousing | 0 (0.0%) | 0 (0.0%) |
| Utilities | 0 (0.0%) | 0 (0.0%) |
| Information | 0 (0.0%) | 0 (0.0%) |
| Finance & Insurance | 0 (0.0%) | 0 (0.0%) |
| Real Estate, Rental & Leasing | 0 (0.0%) | 0 (0.0%) |
| Professional & Scientific | 26 (100.0%) | 0 (0.0%) |
| Enterprise Management | 0 (0.0%) | 0 (0.0%) |
| Administrative & Support | 0 (0.0%) | 0 (0.0%) |
| Educational Services | 0 (0.0%) | 0 (0.0%) |
| Health Care & Social Assistance | 0 (0.0%) | 0 (0.0%) |
| Arts, Entertainment & Recreation | 0 (0.0%) | 0 (0.0%) |
| Accommodation & Food Services | 0 (0.0%) | 0 (0.0%) |
| Public Administration | 25 (100.0%) | 0 (0.0%) |
| Total | 71 (60.2%) | 47 (39.8%) |
Education in Peter
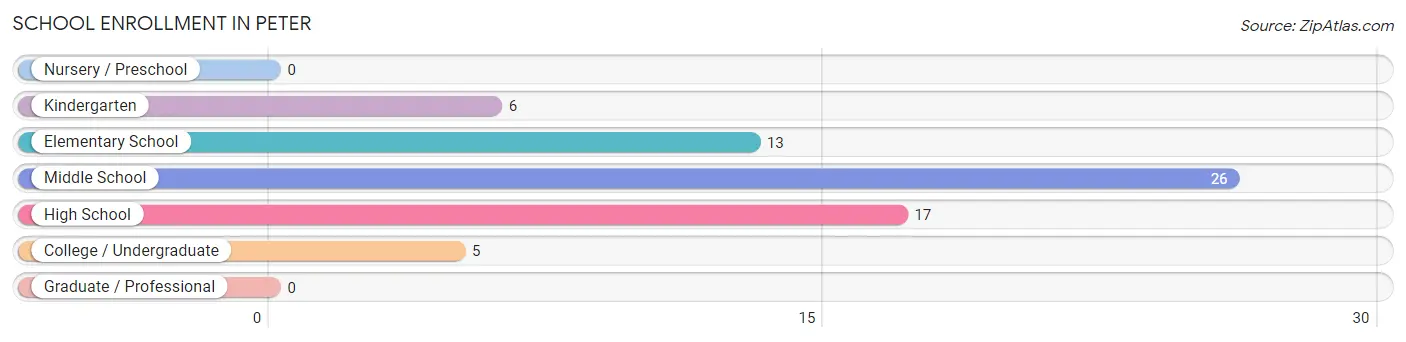
School Enrollment in Peter
The most common levels of schooling among the 67 students in Peter are middle school (26 | 38.8%), high school (17 | 25.4%), and elementary school (13 | 19.4%).
| School Level | # Students | % Students |
| Nursery / Preschool | 0 | 0.0% |
| Kindergarten | 6 | 9.0% |
| Elementary School | 13 | 19.4% |
| Middle School | 26 | 38.8% |
| High School | 17 | 25.4% |
| College / Undergraduate | 5 | 7.5% |
| Graduate / Professional | 0 | 0.0% |
| Total | 67 | 100.0% |
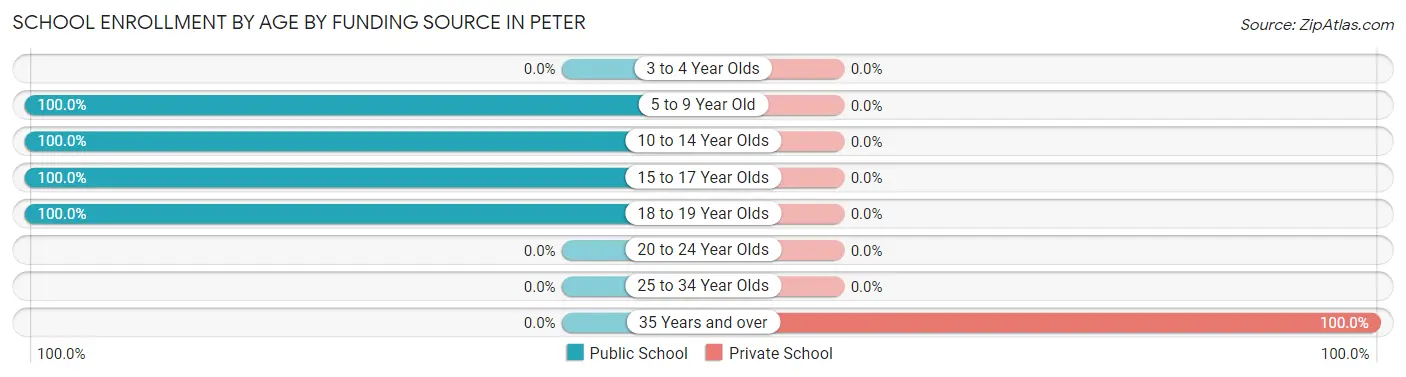
School Enrollment by Age by Funding Source in Peter
Out of a total of 67 students who are enrolled in schools in Peter, 5 (7.5%) attend a private institution, while the remaining 62 (92.5%) are enrolled in public schools. The age group of 35 years and over has the highest likelihood of being enrolled in private schools, with 5 (100.0% in the age bracket) enrolled. Conversely, the age group of 5 to 9 year old has the lowest likelihood of being enrolled in a private school, with 19 (100.0% in the age bracket) attending a public institution.
| Age Bracket | Public School | Private School |
| 3 to 4 Year Olds | 0 (0.0%) | 0 (0.0%) |
| 5 to 9 Year Old | 19 (100.0%) | 0 (0.0%) |
| 10 to 14 Year Olds | 26 (100.0%) | 0 (0.0%) |
| 15 to 17 Year Olds | 8 (100.0%) | 0 (0.0%) |
| 18 to 19 Year Olds | 9 (100.0%) | 0 (0.0%) |
| 20 to 24 Year Olds | 0 (0.0%) | 0 (0.0%) |
| 25 to 34 Year Olds | 0 (0.0%) | 0 (0.0%) |
| 35 Years and over | 0 (0.0%) | 5 (100.0%) |
| Total | 62 (92.5%) | 5 (7.5%) |
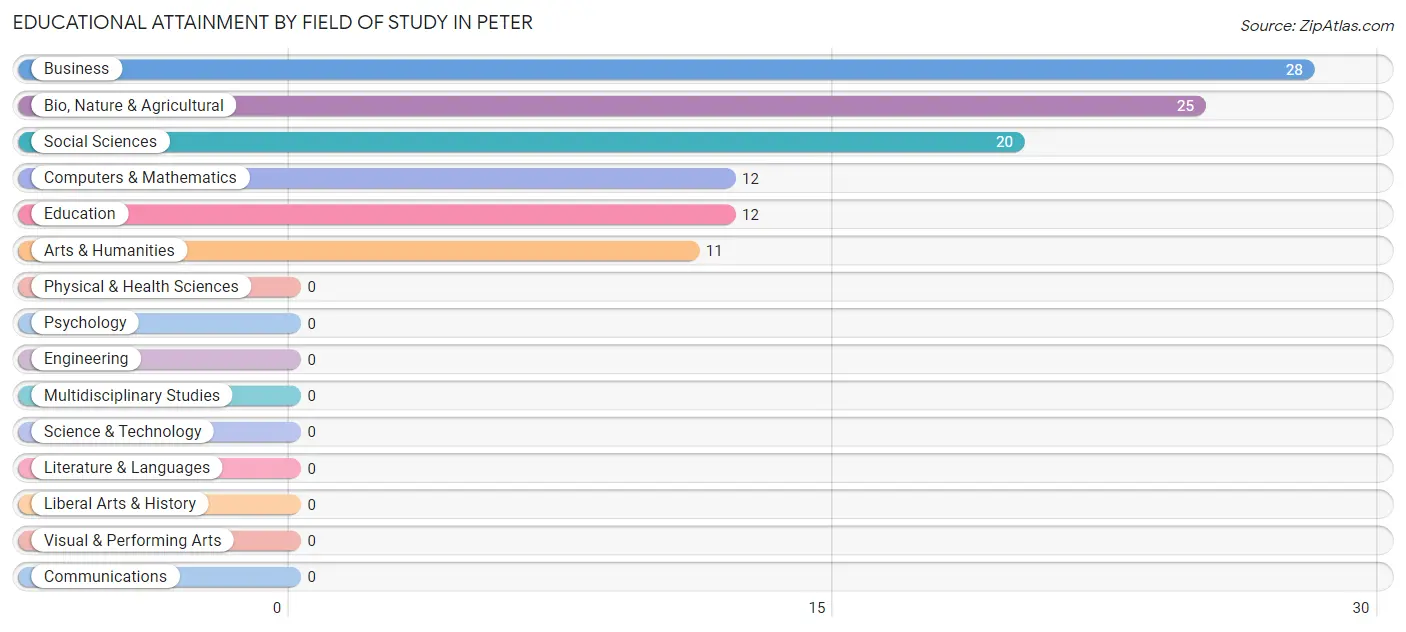
Educational Attainment by Field of Study in Peter
Business (28 | 25.9%), bio, nature & agricultural (25 | 23.2%), social sciences (20 | 18.5%), computers & mathematics (12 | 11.1%), and education (12 | 11.1%) are the most common fields of study among 108 individuals in Peter who have obtained a bachelor's degree or higher.
| Field of Study | # Graduates | % Graduates |
| Computers & Mathematics | 12 | 11.1% |
| Bio, Nature & Agricultural | 25 | 23.2% |
| Physical & Health Sciences | 0 | 0.0% |
| Psychology | 0 | 0.0% |
| Social Sciences | 20 | 18.5% |
| Engineering | 0 | 0.0% |
| Multidisciplinary Studies | 0 | 0.0% |
| Science & Technology | 0 | 0.0% |
| Business | 28 | 25.9% |
| Education | 12 | 11.1% |
| Literature & Languages | 0 | 0.0% |
| Liberal Arts & History | 0 | 0.0% |
| Visual & Performing Arts | 0 | 0.0% |
| Communications | 0 | 0.0% |
| Arts & Humanities | 11 | 10.2% |
| Total | 108 | 100.0% |
Transportation & Commute in Peter
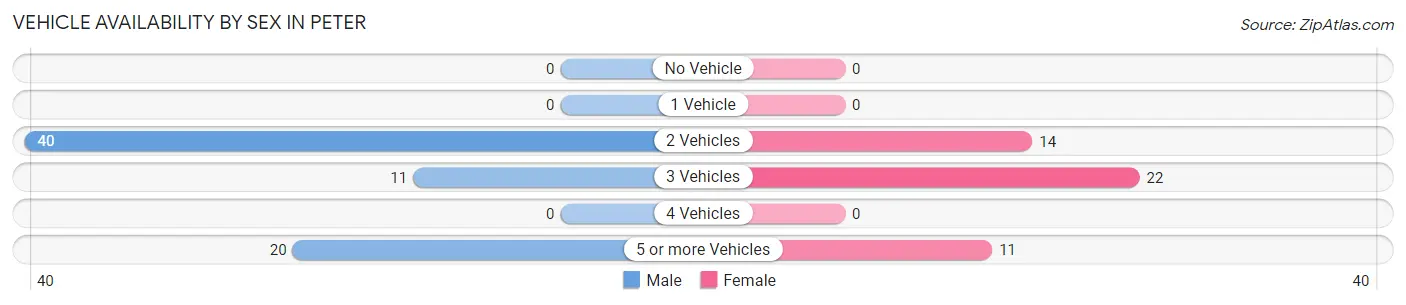
Vehicle Availability by Sex in Peter
The most prevalent vehicle ownership categories in Peter are males with 2 vehicles (40, accounting for 56.3%) and females with 2 vehicles (14, making up 85.1%).
| Vehicles Available | Male | Female |
| No Vehicle | 0 (0.0%) | 0 (0.0%) |
| 1 Vehicle | 0 (0.0%) | 0 (0.0%) |
| 2 Vehicles | 40 (56.3%) | 14 (29.8%) |
| 3 Vehicles | 11 (15.5%) | 22 (46.8%) |
| 4 Vehicles | 0 (0.0%) | 0 (0.0%) |
| 5 or more Vehicles | 20 (28.2%) | 11 (23.4%) |
| Total | 71 (100.0%) | 47 (100.0%) |
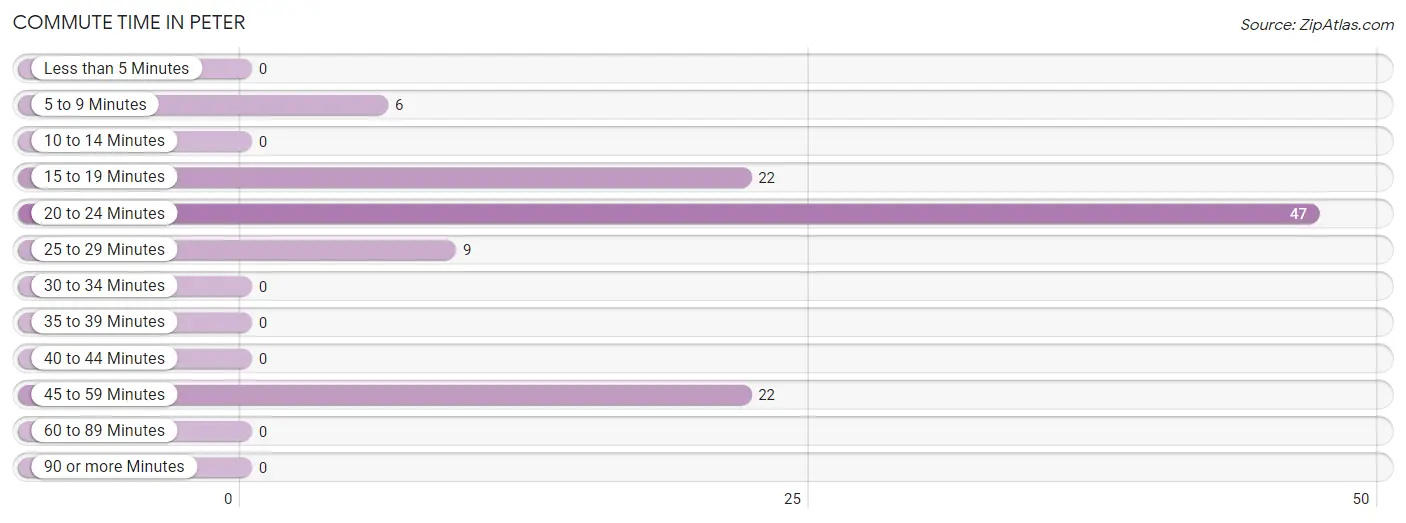
Commute Time in Peter
The most frequently occuring commute durations in Peter are 20 to 24 minutes (47 commuters, 44.3%), 15 to 19 minutes (22 commuters, 20.7%), and 45 to 59 minutes (22 commuters, 20.7%).
| Commute Time | # Commuters | % Commuters |
| Less than 5 Minutes | 0 | 0.0% |
| 5 to 9 Minutes | 6 | 5.7% |
| 10 to 14 Minutes | 0 | 0.0% |
| 15 to 19 Minutes | 22 | 20.7% |
| 20 to 24 Minutes | 47 | 44.3% |
| 25 to 29 Minutes | 9 | 8.5% |
| 30 to 34 Minutes | 0 | 0.0% |
| 35 to 39 Minutes | 0 | 0.0% |
| 40 to 44 Minutes | 0 | 0.0% |
| 45 to 59 Minutes | 22 | 20.7% |
| 60 to 89 Minutes | 0 | 0.0% |
| 90 or more Minutes | 0 | 0.0% |
Commute Time by Sex in Peter
The most common commute times in Peter are 45 to 59 minutes (22 commuters, 37.3%) for males and 20 to 24 minutes (36 commuters, 76.6%) for females.
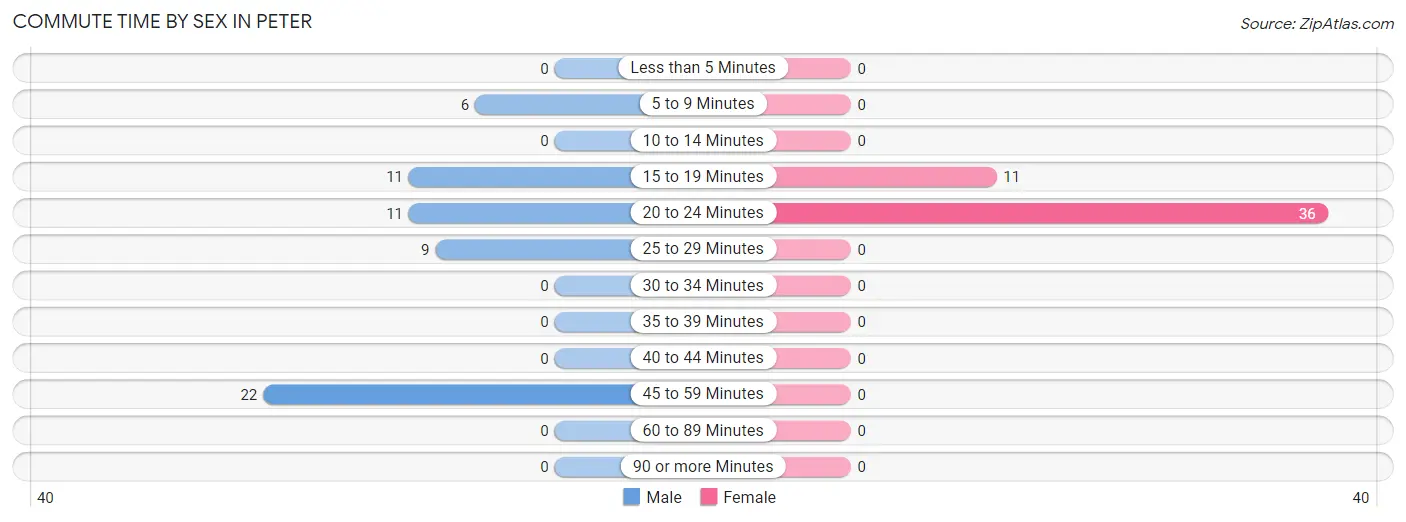
| Commute Time | Male | Female |
| Less than 5 Minutes | 0 (0.0%) | 0 (0.0%) |
| 5 to 9 Minutes | 6 (10.2%) | 0 (0.0%) |
| 10 to 14 Minutes | 0 (0.0%) | 0 (0.0%) |
| 15 to 19 Minutes | 11 (18.6%) | 11 (23.4%) |
| 20 to 24 Minutes | 11 (18.6%) | 36 (76.6%) |
| 25 to 29 Minutes | 9 (15.2%) | 0 (0.0%) |
| 30 to 34 Minutes | 0 (0.0%) | 0 (0.0%) |
| 35 to 39 Minutes | 0 (0.0%) | 0 (0.0%) |
| 40 to 44 Minutes | 0 (0.0%) | 0 (0.0%) |
| 45 to 59 Minutes | 22 (37.3%) | 0 (0.0%) |
| 60 to 89 Minutes | 0 (0.0%) | 0 (0.0%) |
| 90 or more Minutes | 0 (0.0%) | 0 (0.0%) |
Time of Departure to Work by Sex in Peter
The most frequent times of departure to work in Peter are 7:30 AM to 7:59 AM (19, 32.2%) for males and 9:00 AM to 9:59 AM (14, 29.8%) for females.
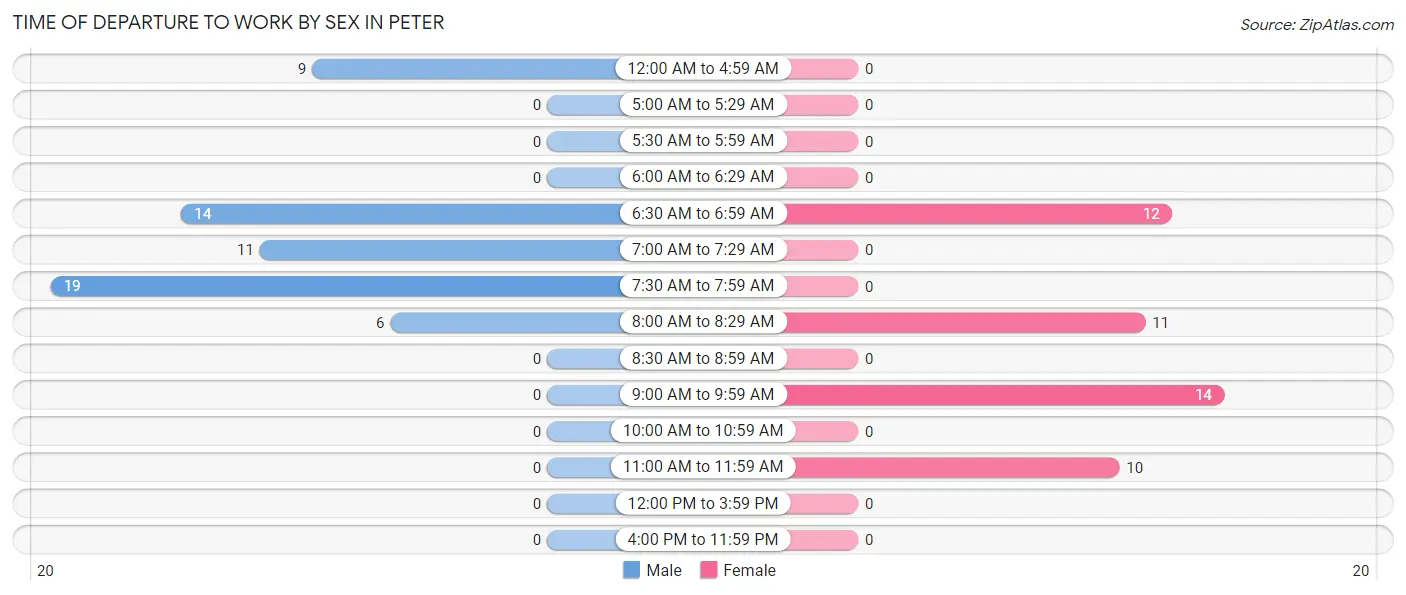
| Time of Departure | Male | Female |
| 12:00 AM to 4:59 AM | 9 (15.2%) | 0 (0.0%) |
| 5:00 AM to 5:29 AM | 0 (0.0%) | 0 (0.0%) |
| 5:30 AM to 5:59 AM | 0 (0.0%) | 0 (0.0%) |
| 6:00 AM to 6:29 AM | 0 (0.0%) | 0 (0.0%) |
| 6:30 AM to 6:59 AM | 14 (23.7%) | 12 (25.5%) |
| 7:00 AM to 7:29 AM | 11 (18.6%) | 0 (0.0%) |
| 7:30 AM to 7:59 AM | 19 (32.2%) | 0 (0.0%) |
| 8:00 AM to 8:29 AM | 6 (10.2%) | 11 (23.4%) |
| 8:30 AM to 8:59 AM | 0 (0.0%) | 0 (0.0%) |
| 9:00 AM to 9:59 AM | 0 (0.0%) | 14 (29.8%) |
| 10:00 AM to 10:59 AM | 0 (0.0%) | 0 (0.0%) |
| 11:00 AM to 11:59 AM | 0 (0.0%) | 10 (21.3%) |
| 12:00 PM to 3:59 PM | 0 (0.0%) | 0 (0.0%) |
| 4:00 PM to 11:59 PM | 0 (0.0%) | 0 (0.0%) |
| Total | 59 (100.0%) | 47 (100.0%) |
Housing Occupancy in Peter
Occupancy by Ownership in Peter
Of the total 94 dwellings in Peter, owner-occupied units account for 94 (100.0%), while renter-occupied units make up 0 (0.0%).
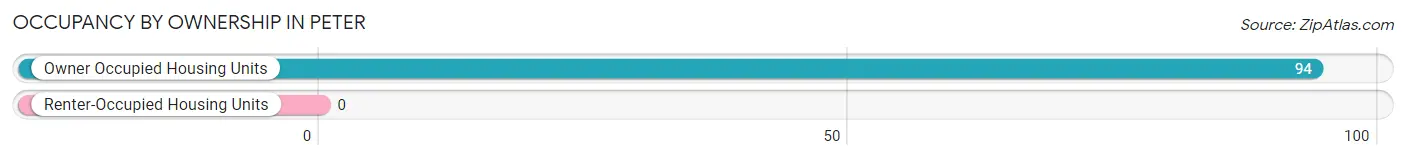
| Occupancy | # Housing Units | % Housing Units |
| Owner Occupied Housing Units | 94 | 100.0% |
| Renter-Occupied Housing Units | 0 | 0.0% |
| Total Occupied Housing Units | 94 | 100.0% |
Occupancy by Household Size in Peter
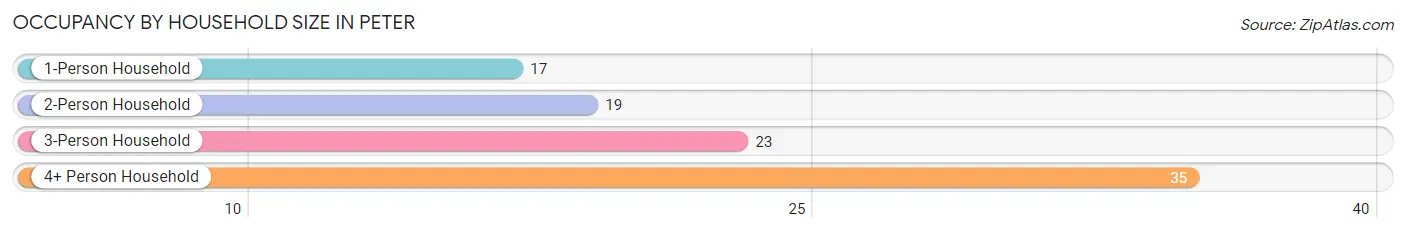
| Household Size | # Housing Units | % Housing Units |
| 1-Person Household | 17 | 18.1% |
| 2-Person Household | 19 | 20.2% |
| 3-Person Household | 23 | 24.5% |
| 4+ Person Household | 35 | 37.2% |
| Total Housing Units | 94 | 100.0% |
Occupancy by Ownership by Household Size in Peter
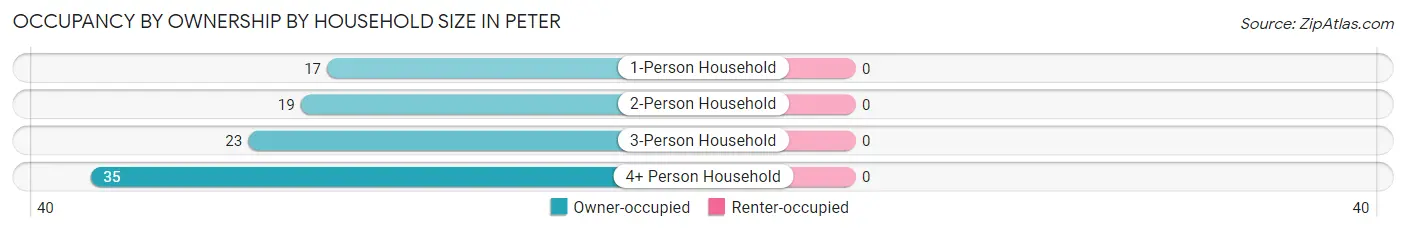
| Household Size | Owner-occupied | Renter-occupied |
| 1-Person Household | 17 (100.0%) | 0 (0.0%) |
| 2-Person Household | 19 (100.0%) | 0 (0.0%) |
| 3-Person Household | 23 (100.0%) | 0 (0.0%) |
| 4+ Person Household | 35 (100.0%) | 0 (0.0%) |
| Total Housing Units | 94 (100.0%) | 0 (0.0%) |
Occupancy by Educational Attainment in Peter
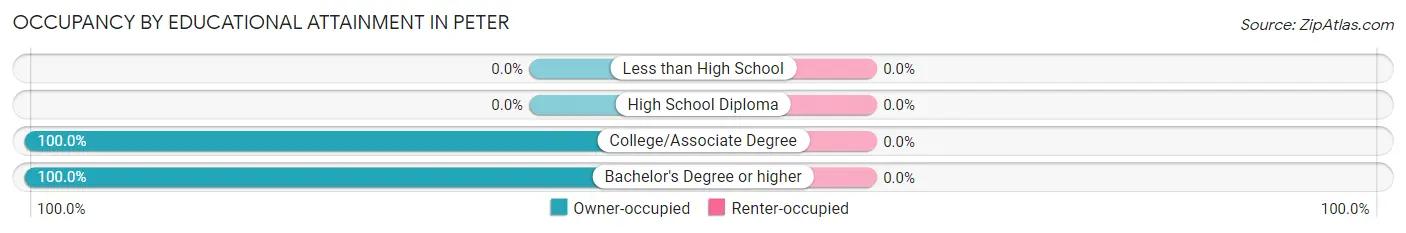
| Household Size | Owner-occupied | Renter-occupied |
| Less than High School | 0 (0.0%) | 0 (0.0%) |
| High School Diploma | 0 (0.0%) | 0 (0.0%) |
| College/Associate Degree | 17 (100.0%) | 0 (0.0%) |
| Bachelor's Degree or higher | 77 (100.0%) | 0 (0.0%) |
Occupancy by Age of Householder in Peter
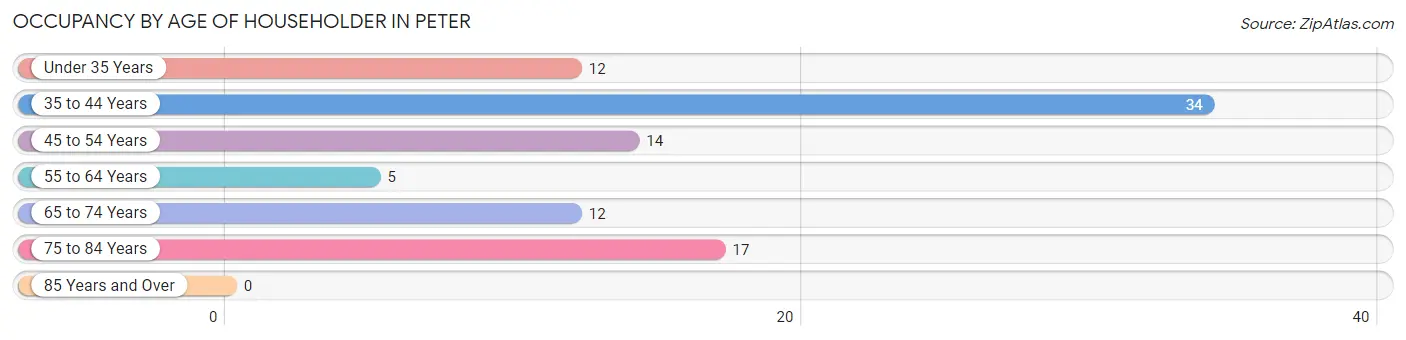
| Age Bracket | # Households | % Households |
| Under 35 Years | 12 | 12.8% |
| 35 to 44 Years | 34 | 36.2% |
| 45 to 54 Years | 14 | 14.9% |
| 55 to 64 Years | 5 | 5.3% |
| 65 to 74 Years | 12 | 12.8% |
| 75 to 84 Years | 17 | 18.1% |
| 85 Years and Over | 0 | 0.0% |
| Total | 94 | 100.0% |
Housing Finances in Peter
Median Income by Occupancy in Peter
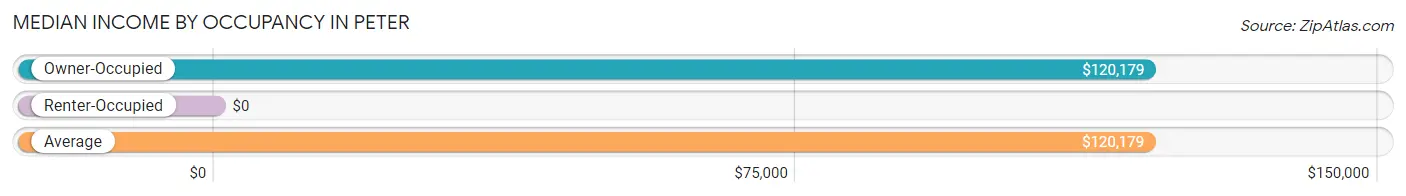
| Occupancy Type | # Households | Median Income |
| Owner-Occupied | 94 (100.0%) | $120,179 |
| Renter-Occupied | 0 (0.0%) | $0 |
| Average | 94 (100.0%) | $120,179 |
Occupancy by Householder Income Bracket in Peter
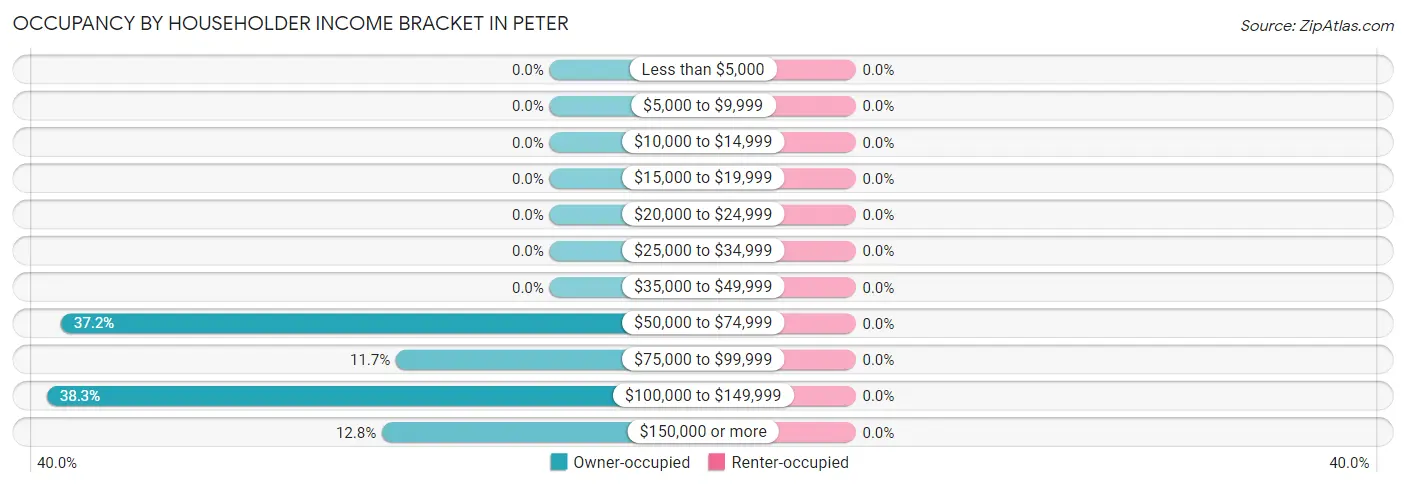
| Income Bracket | Owner-occupied | Renter-occupied |
| Less than $5,000 | 0 (0.0%) | 0 (0.0%) |
| $5,000 to $9,999 | 0 (0.0%) | 0 (0.0%) |
| $10,000 to $14,999 | 0 (0.0%) | 0 (0.0%) |
| $15,000 to $19,999 | 0 (0.0%) | 0 (0.0%) |
| $20,000 to $24,999 | 0 (0.0%) | 0 (0.0%) |
| $25,000 to $34,999 | 0 (0.0%) | 0 (0.0%) |
| $35,000 to $49,999 | 0 (0.0%) | 0 (0.0%) |
| $50,000 to $74,999 | 35 (37.2%) | 0 (0.0%) |
| $75,000 to $99,999 | 11 (11.7%) | 0 (0.0%) |
| $100,000 to $149,999 | 36 (38.3%) | 0 (0.0%) |
| $150,000 or more | 12 (12.8%) | 0 (0.0%) |
| Total | 94 (100.0%) | 0 (0.0%) |
Monthly Housing Cost Tiers in Peter
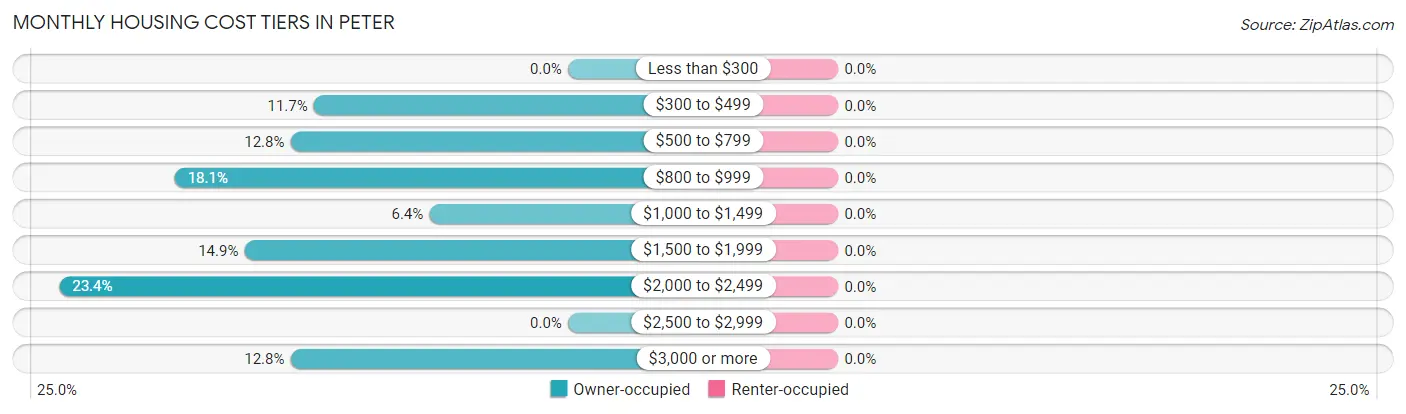
| Monthly Cost | Owner-occupied | Renter-occupied |
| Less than $300 | 0 (0.0%) | 0 (0.0%) |
| $300 to $499 | 11 (11.7%) | 0 (0.0%) |
| $500 to $799 | 12 (12.8%) | 0 (0.0%) |
| $800 to $999 | 17 (18.1%) | 0 (0.0%) |
| $1,000 to $1,499 | 6 (6.4%) | 0 (0.0%) |
| $1,500 to $1,999 | 14 (14.9%) | 0 (0.0%) |
| $2,000 to $2,499 | 22 (23.4%) | 0 (0.0%) |
| $2,500 to $2,999 | 0 (0.0%) | 0 (0.0%) |
| $3,000 or more | 12 (12.8%) | 0 (0.0%) |
| Total | 94 (100.0%) | 0 (0.0%) |
Physical Housing Characteristics in Peter
Housing Structures in Peter
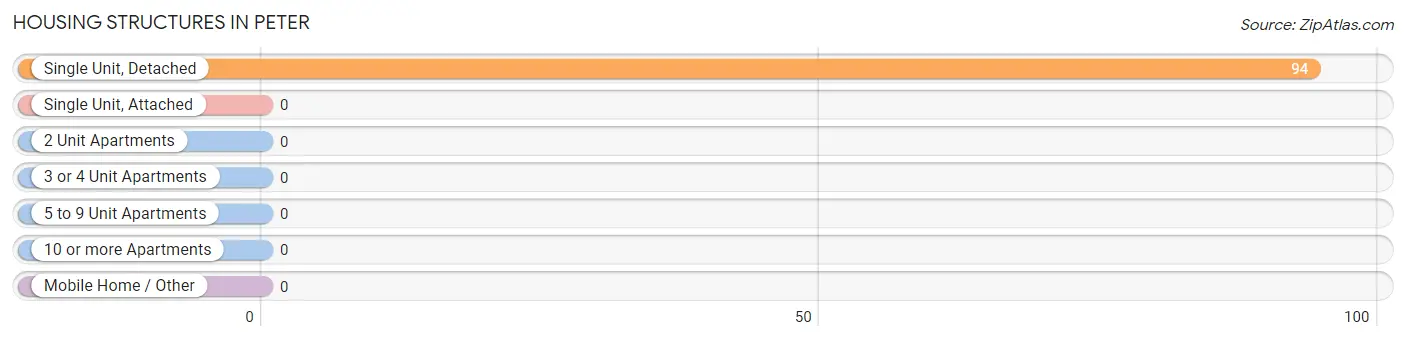
| Structure Type | # Housing Units | % Housing Units |
| Single Unit, Detached | 94 | 100.0% |
| Single Unit, Attached | 0 | 0.0% |
| 2 Unit Apartments | 0 | 0.0% |
| 3 or 4 Unit Apartments | 0 | 0.0% |
| 5 to 9 Unit Apartments | 0 | 0.0% |
| 10 or more Apartments | 0 | 0.0% |
| Mobile Home / Other | 0 | 0.0% |
| Total | 94 | 100.0% |
Housing Structures by Occupancy in Peter
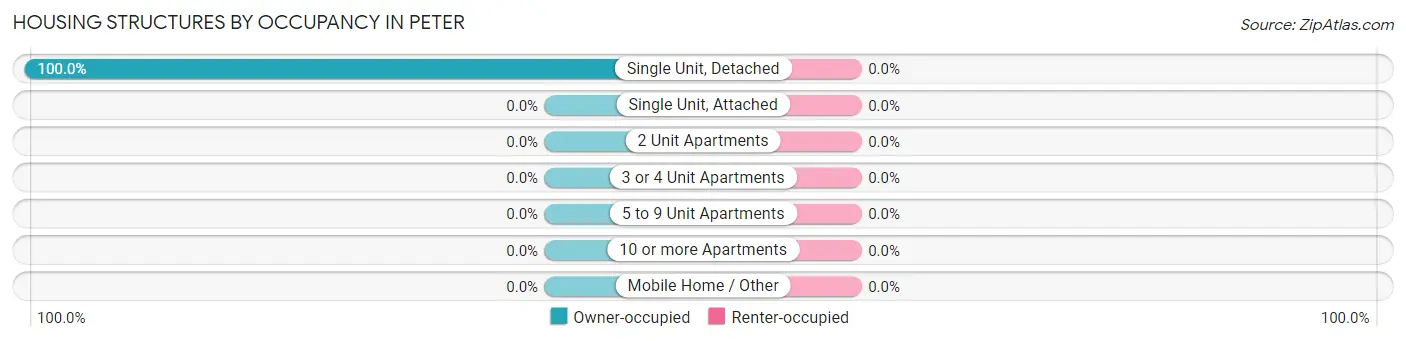
| Structure Type | Owner-occupied | Renter-occupied |
| Single Unit, Detached | 94 (100.0%) | 0 (0.0%) |
| Single Unit, Attached | 0 (0.0%) | 0 (0.0%) |
| 2 Unit Apartments | 0 (0.0%) | 0 (0.0%) |
| 3 or 4 Unit Apartments | 0 (0.0%) | 0 (0.0%) |
| 5 to 9 Unit Apartments | 0 (0.0%) | 0 (0.0%) |
| 10 or more Apartments | 0 (0.0%) | 0 (0.0%) |
| Mobile Home / Other | 0 (0.0%) | 0 (0.0%) |
| Total | 94 (100.0%) | 0 (0.0%) |
Housing Structures by Number of Rooms in Peter
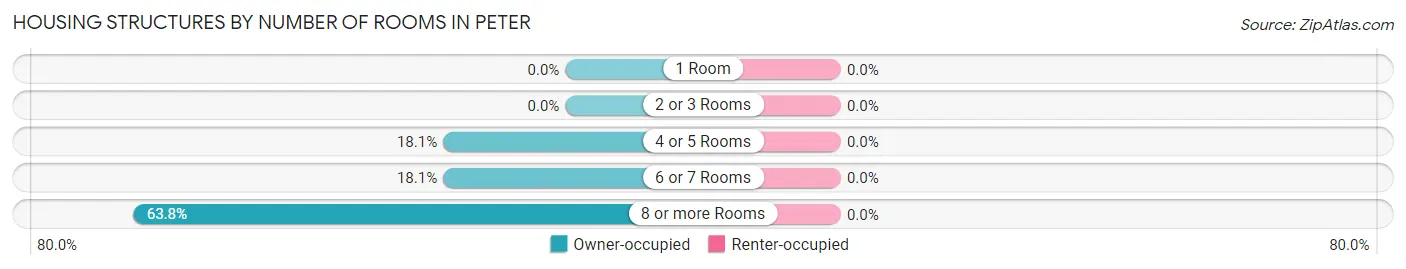
| Number of Rooms | Owner-occupied | Renter-occupied |
| 1 Room | 0 (0.0%) | 0 (0.0%) |
| 2 or 3 Rooms | 0 (0.0%) | 0 (0.0%) |
| 4 or 5 Rooms | 17 (18.1%) | 0 (0.0%) |
| 6 or 7 Rooms | 17 (18.1%) | 0 (0.0%) |
| 8 or more Rooms | 60 (63.8%) | 0 (0.0%) |
| Total | 94 (100.0%) | 0 (0.0%) |
Housing Structure by Heating Type in Peter
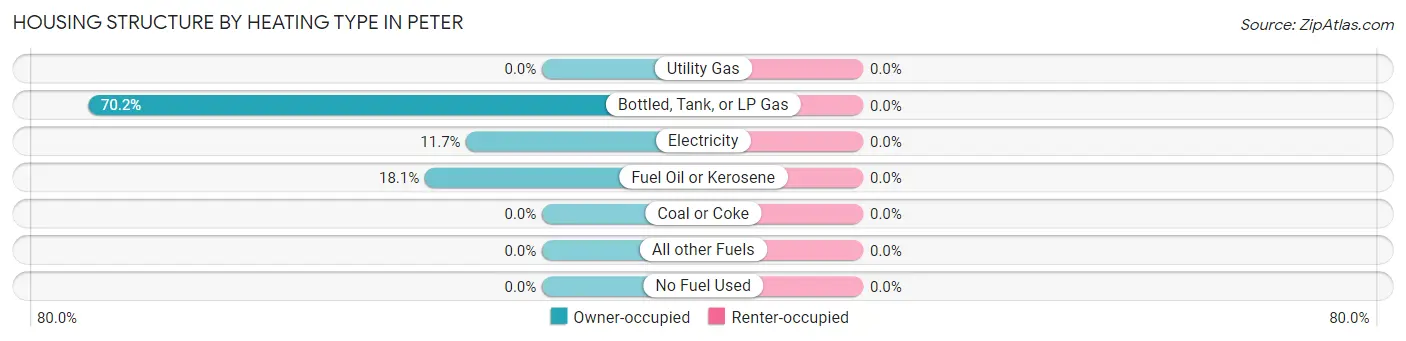
| Heating Type | Owner-occupied | Renter-occupied |
| Utility Gas | 0 (0.0%) | 0 (0.0%) |
| Bottled, Tank, or LP Gas | 66 (70.2%) | 0 (0.0%) |
| Electricity | 11 (11.7%) | 0 (0.0%) |
| Fuel Oil or Kerosene | 17 (18.1%) | 0 (0.0%) |
| Coal or Coke | 0 (0.0%) | 0 (0.0%) |
| All other Fuels | 0 (0.0%) | 0 (0.0%) |
| No Fuel Used | 0 (0.0%) | 0 (0.0%) |
| Total | 94 (100.0%) | 0 (0.0%) |
Household Vehicle Usage in Peter
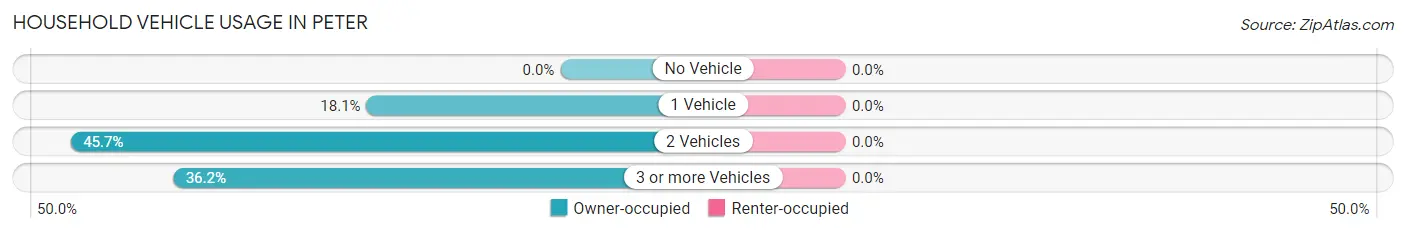
| Vehicles per Household | Owner-occupied | Renter-occupied |
| No Vehicle | 0 (0.0%) | 0 (0.0%) |
| 1 Vehicle | 17 (18.1%) | 0 (0.0%) |
| 2 Vehicles | 43 (45.7%) | 0 (0.0%) |
| 3 or more Vehicles | 34 (36.2%) | 0 (0.0%) |
| Total | 94 (100.0%) | 0 (0.0%) |
Real Estate & Mortgages in Peter
Real Estate and Mortgage Overview in Peter
| Characteristic | Without Mortgage | With Mortgage |
| Housing Units | 23 | 71 |
| Median Property Value | $297,900 | $489,300 |
| Median Household Income | $72,396 | $12 |
| Monthly Housing Costs | $504 | $12 |
| Real Estate Taxes | $1,319 | $0 |
Property Value by Mortgage Status in Peter
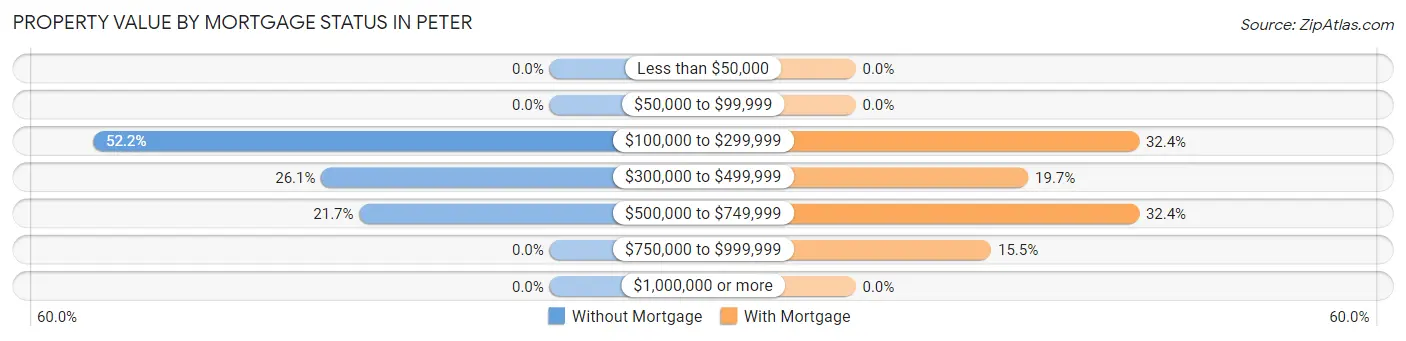
| Property Value | Without Mortgage | With Mortgage |
| Less than $50,000 | 0 (0.0%) | 0 (0.0%) |
| $50,000 to $99,999 | 0 (0.0%) | 0 (0.0%) |
| $100,000 to $299,999 | 12 (52.2%) | 23 (32.4%) |
| $300,000 to $499,999 | 6 (26.1%) | 14 (19.7%) |
| $500,000 to $749,999 | 5 (21.7%) | 23 (32.4%) |
| $750,000 to $999,999 | 0 (0.0%) | 11 (15.5%) |
| $1,000,000 or more | 0 (0.0%) | 0 (0.0%) |
| Total | 23 (100.0%) | 71 (100.0%) |
Household Income by Mortgage Status in Peter
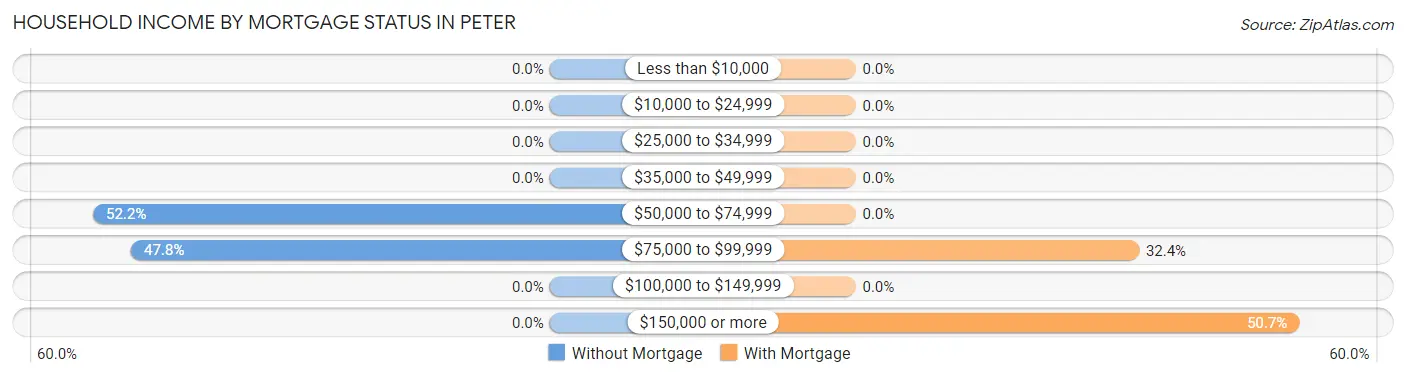
| Household Income | Without Mortgage | With Mortgage |
| Less than $10,000 | 0 (0.0%) | 0 (0.0%) |
| $10,000 to $24,999 | 0 (0.0%) | 0 (0.0%) |
| $25,000 to $34,999 | 0 (0.0%) | 0 (0.0%) |
| $35,000 to $49,999 | 0 (0.0%) | 0 (0.0%) |
| $50,000 to $74,999 | 12 (52.2%) | 0 (0.0%) |
| $75,000 to $99,999 | 11 (47.8%) | 23 (32.4%) |
| $100,000 to $149,999 | 0 (0.0%) | 0 (0.0%) |
| $150,000 or more | 0 (0.0%) | 36 (50.7%) |
| Total | 23 (100.0%) | 71 (100.0%) |
Property Value to Household Income Ratio in Peter
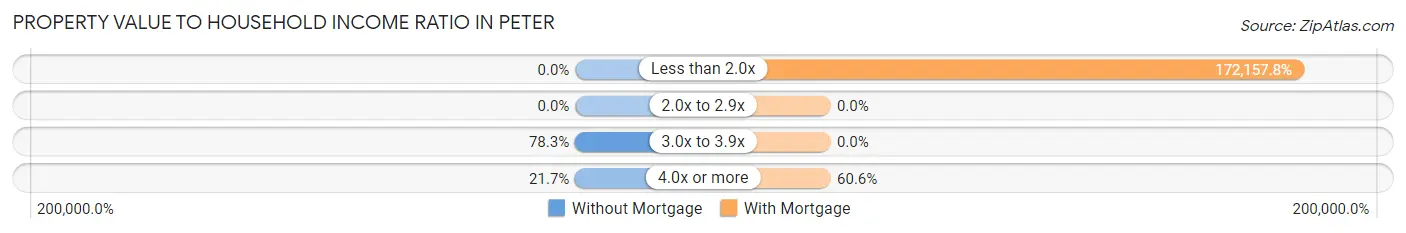
| Value-to-Income Ratio | Without Mortgage | With Mortgage |
| Less than 2.0x | 0 (0.0%) | 122,232 (172,157.8%) |
| 2.0x to 2.9x | 0 (0.0%) | 0 (0.0%) |
| 3.0x to 3.9x | 18 (78.3%) | 0 (0.0%) |
| 4.0x or more | 5 (21.7%) | 43 (60.6%) |
| Total | 23 (100.0%) | 71 (100.0%) |
Real Estate Taxes by Mortgage Status in Peter
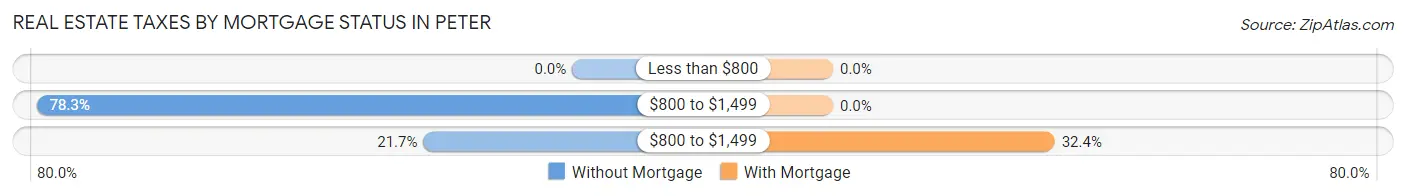
| Property Taxes | Without Mortgage | With Mortgage |
| Less than $800 | 0 (0.0%) | 0 (0.0%) |
| $800 to $1,499 | 18 (78.3%) | 0 (0.0%) |
| $800 to $1,499 | 5 (21.7%) | 23 (32.4%) |
| Total | 23 (100.0%) | 71 (100.0%) |
Health & Disability in Peter
Health Insurance Coverage by Age in Peter
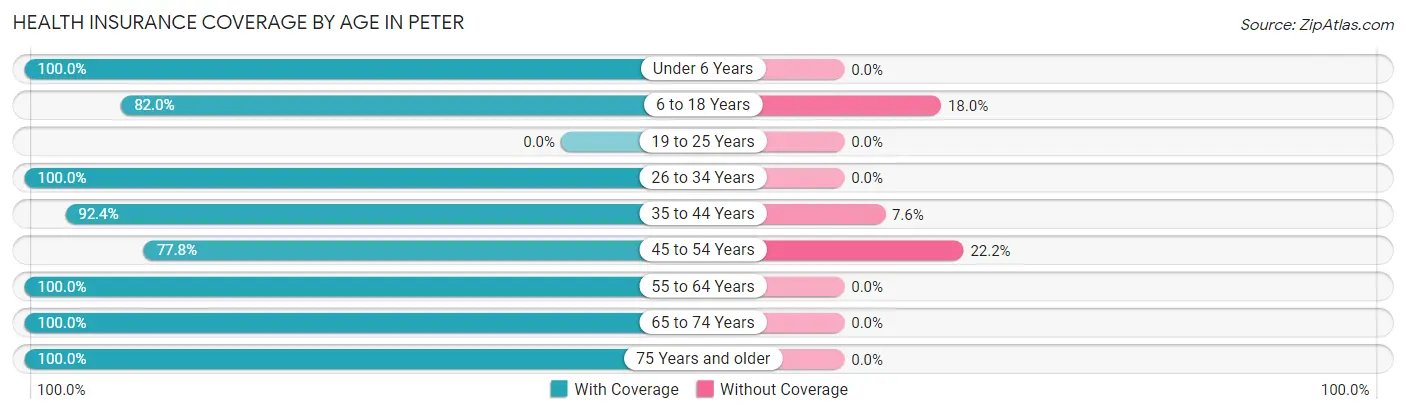
| Age Bracket | With Coverage | Without Coverage |
| Under 6 Years | 37 (100.0%) | 0 (0.0%) |
| 6 to 18 Years | 50 (82.0%) | 11 (18.0%) |
| 19 to 25 Years | 0 (0.0%) | 0 (0.0%) |
| 26 to 34 Years | 12 (100.0%) | 0 (0.0%) |
| 35 to 44 Years | 73 (92.4%) | 6 (7.6%) |
| 45 to 54 Years | 28 (77.8%) | 8 (22.2%) |
| 55 to 64 Years | 11 (100.0%) | 0 (0.0%) |
| 65 to 74 Years | 23 (100.0%) | 0 (0.0%) |
| 75 Years and older | 17 (100.0%) | 0 (0.0%) |
| Total | 251 (90.9%) | 25 (9.1%) |
Health Insurance Coverage by Citizenship Status in Peter
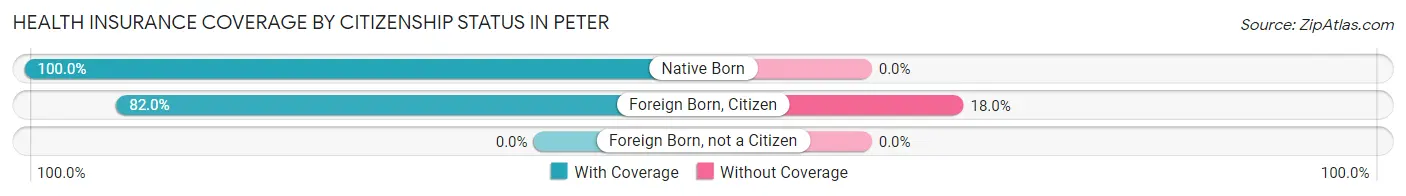
| Citizenship Status | With Coverage | Without Coverage |
| Native Born | 37 (100.0%) | 0 (0.0%) |
| Foreign Born, Citizen | 50 (82.0%) | 11 (18.0%) |
| Foreign Born, not a Citizen | 0 (0.0%) | 0 (0.0%) |
Health Insurance Coverage by Household Income in Peter
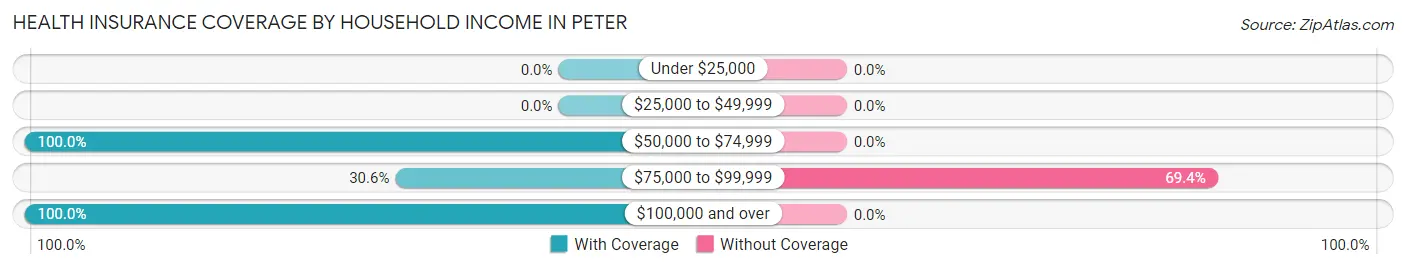
| Household Income | With Coverage | Without Coverage |
| Under $25,000 | 0 (0.0%) | 0 (0.0%) |
| $25,000 to $49,999 | 0 (0.0%) | 0 (0.0%) |
| $50,000 to $74,999 | 92 (100.0%) | 0 (0.0%) |
| $75,000 to $99,999 | 11 (30.6%) | 25 (69.4%) |
| $100,000 and over | 148 (100.0%) | 0 (0.0%) |
Public vs Private Health Insurance Coverage by Age in Peter
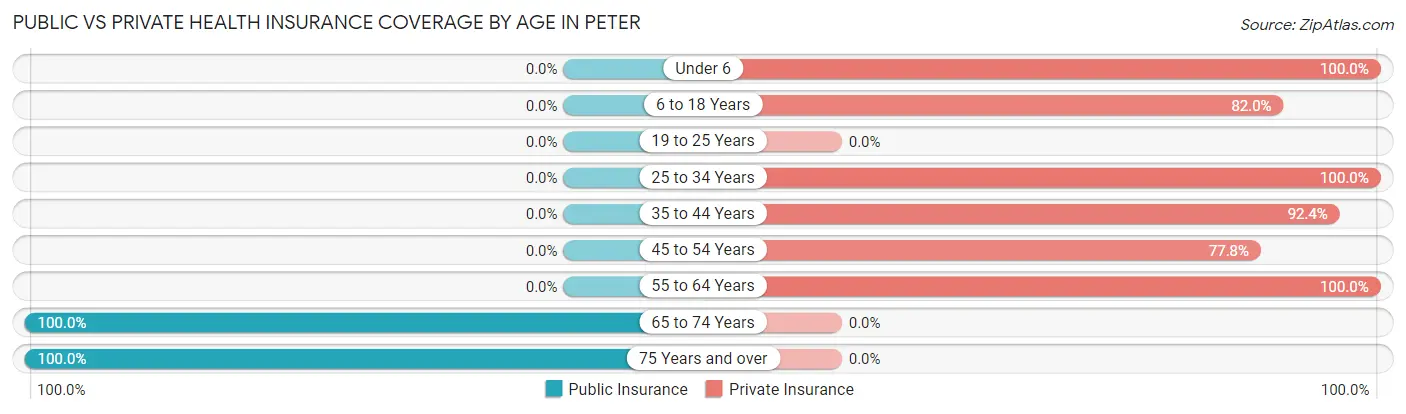
| Age Bracket | Public Insurance | Private Insurance |
| Under 6 | 0 (0.0%) | 37 (100.0%) |
| 6 to 18 Years | 0 (0.0%) | 50 (82.0%) |
| 19 to 25 Years | 0 (0.0%) | 0 (0.0%) |
| 25 to 34 Years | 0 (0.0%) | 12 (100.0%) |
| 35 to 44 Years | 0 (0.0%) | 73 (92.4%) |
| 45 to 54 Years | 0 (0.0%) | 28 (77.8%) |
| 55 to 64 Years | 0 (0.0%) | 11 (100.0%) |
| 65 to 74 Years | 23 (100.0%) | 0 (0.0%) |
| 75 Years and over | 17 (100.0%) | 0 (0.0%) |
| Total | 40 (14.5%) | 211 (76.4%) |
Disability Status by Sex by Age in Peter
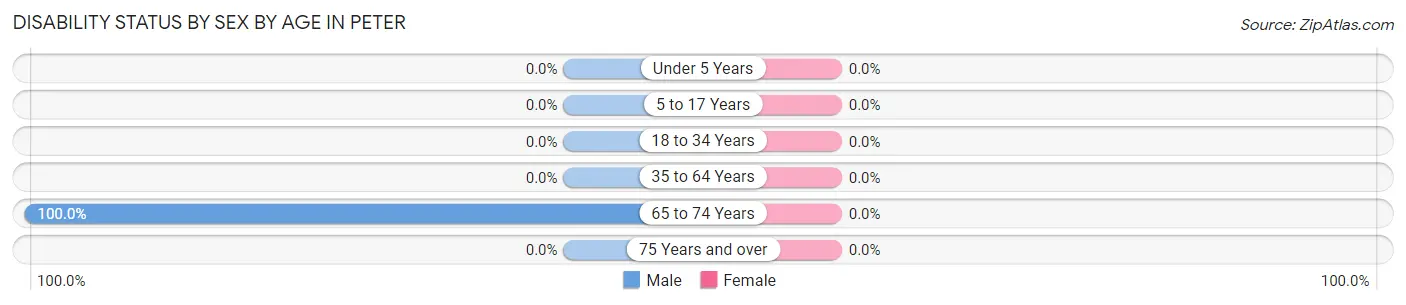
| Age Bracket | Male | Female |
| Under 5 Years | 0 (0.0%) | 0 (0.0%) |
| 5 to 17 Years | 0 (0.0%) | 0 (0.0%) |
| 18 to 34 Years | 0 (0.0%) | 0 (0.0%) |
| 35 to 64 Years | 0 (0.0%) | 0 (0.0%) |
| 65 to 74 Years | 12 (100.0%) | 0 (0.0%) |
| 75 Years and over | 0 (0.0%) | 0 (0.0%) |
Disability Class by Sex by Age in Peter
Disability Class: Hearing Difficulty
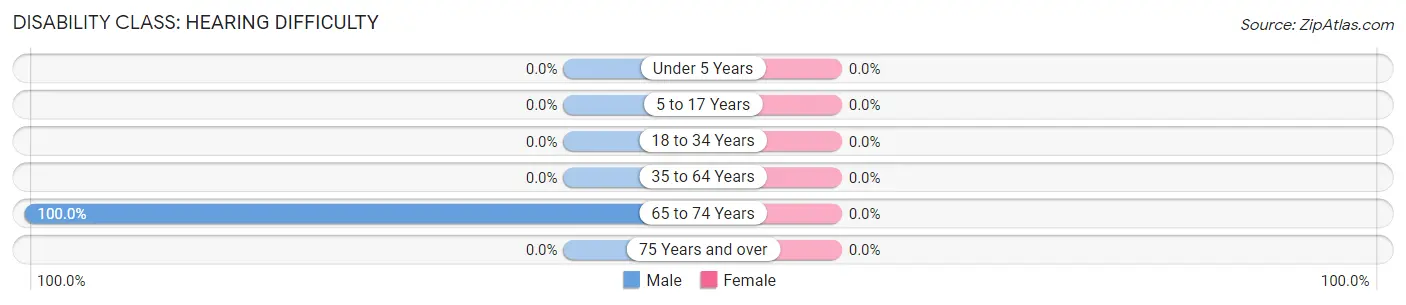
| Age Bracket | Male | Female |
| Under 5 Years | 0 (0.0%) | 0 (0.0%) |
| 5 to 17 Years | 0 (0.0%) | 0 (0.0%) |
| 18 to 34 Years | 0 (0.0%) | 0 (0.0%) |
| 35 to 64 Years | 0 (0.0%) | 0 (0.0%) |
| 65 to 74 Years | 12 (100.0%) | 0 (0.0%) |
| 75 Years and over | 0 (0.0%) | 0 (0.0%) |
Disability Class: Vision Difficulty
| Age Bracket | Male | Female |
| Under 5 Years | 0 (0.0%) | 0 (0.0%) |
| 5 to 17 Years | 0 (0.0%) | 0 (0.0%) |
| 18 to 34 Years | 0 (0.0%) | 0 (0.0%) |
| 35 to 64 Years | 0 (0.0%) | 0 (0.0%) |
| 65 to 74 Years | 0 (0.0%) | 0 (0.0%) |
| 75 Years and over | 0 (0.0%) | 0 (0.0%) |
Disability Class: Cognitive Difficulty
| Age Bracket | Male | Female |
| 5 to 17 Years | 0 (0.0%) | 0 (0.0%) |
| 18 to 34 Years | 0 (0.0%) | 0 (0.0%) |
| 35 to 64 Years | 0 (0.0%) | 0 (0.0%) |
| 65 to 74 Years | 0 (0.0%) | 0 (0.0%) |
| 75 Years and over | 0 (0.0%) | 0 (0.0%) |
Disability Class: Ambulatory Difficulty
| Age Bracket | Male | Female |
| 5 to 17 Years | 0 (0.0%) | 0 (0.0%) |
| 18 to 34 Years | 0 (0.0%) | 0 (0.0%) |
| 35 to 64 Years | 0 (0.0%) | 0 (0.0%) |
| 65 to 74 Years | 0 (0.0%) | 0 (0.0%) |
| 75 Years and over | 0 (0.0%) | 0 (0.0%) |
Disability Class: Self-Care Difficulty
| Age Bracket | Male | Female |
| 5 to 17 Years | 0 (0.0%) | 0 (0.0%) |
| 18 to 34 Years | 0 (0.0%) | 0 (0.0%) |
| 35 to 64 Years | 0 (0.0%) | 0 (0.0%) |
| 65 to 74 Years | 0 (0.0%) | 0 (0.0%) |
| 75 Years and over | 0 (0.0%) | 0 (0.0%) |
Technology Access in Peter
Computing Device Access in Peter
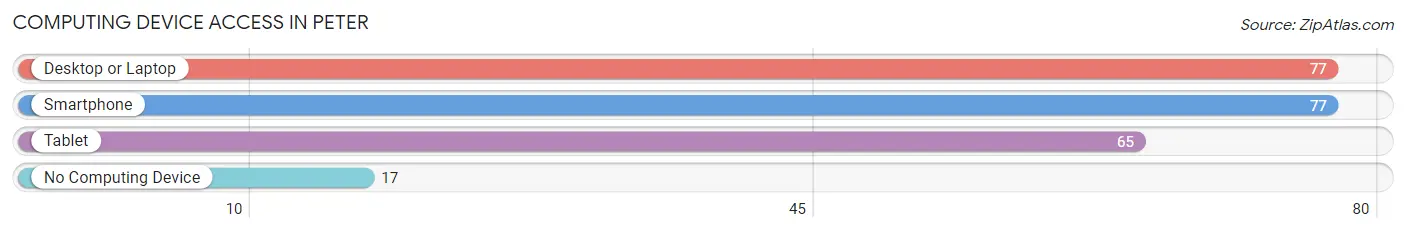
| Device Type | # Households | % Households |
| Desktop or Laptop | 77 | 81.9% |
| Smartphone | 77 | 81.9% |
| Tablet | 65 | 69.2% |
| No Computing Device | 17 | 18.1% |
| Total | 94 | 100.0% |
Internet Access in Peter
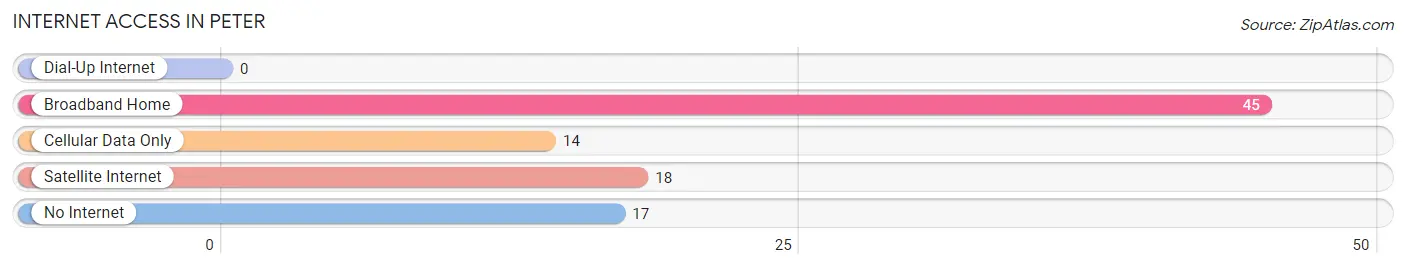
| Internet Type | # Households | % Households |
| Dial-Up Internet | 0 | 0.0% |
| Broadband Home | 45 | 47.9% |
| Cellular Data Only | 14 | 14.9% |
| Satellite Internet | 18 | 19.2% |
| No Internet | 17 | 18.1% |
| Total | 94 | 100.0% |
Peter Summary
Introduction
The state of Utah is located in the western United States and is bordered by Idaho, Wyoming, Colorado, Arizona, and Nevada. It is the 13th largest state in the US and the 33rd most populous. Utah is known for its diverse geography, ranging from the Great Salt Lake in the north to the red rock canyons of the south. It is also home to the world-famous ski resorts of Park City and Snowbird. The state is known for its strong economy, which is largely based on tourism, mining, and agriculture. Utah also has a rich history, with the first settlers arriving in the area in the late 1800s.
History
The first inhabitants of Utah were Native American tribes, including the Ute, Paiute, and Shoshone. These tribes lived in the area for thousands of years before the arrival of the first European settlers in the late 1800s. The first Europeans to explore the area were Spanish explorers, who arrived in the late 1700s. The first permanent settlement in Utah was established in 1847 by a group of Mormon pioneers led by Brigham Young. The Mormons were fleeing religious persecution in the east and were looking for a place to practice their faith freely.
The Mormons quickly established a strong presence in the area, and by 1850, Utah was officially organized as a territory of the United States. In 1896, Utah became the 45th state to join the Union. Throughout the 20th century, Utah experienced rapid growth and development, becoming an important center for industry, agriculture, and tourism.
Geography
Utah is located in the western United States and is bordered by Idaho, Wyoming, Colorado, Arizona, and Nevada. It is the 13th largest state in the US and the 33rd most populous. Utah is known for its diverse geography, ranging from the Great Salt Lake in the north to the red rock canyons of the south. It is also home to the world-famous ski resorts of Park City and Snowbird.
The state is divided into three distinct geographic regions: the Great Basin, the Colorado Plateau, and the Rocky Mountains. The Great Basin is a large, arid region that covers most of the state. It is characterized by its flat terrain and sparse vegetation. The Colorado Plateau is a high-altitude region that is home to the state’s famous red rock canyons. The Rocky Mountains are located in the northern part of the state and are home to some of the highest peaks in the US.
Economy
Utah has a strong and diverse economy that is largely based on tourism, mining, and agriculture. Tourism is a major industry in the state, with millions of visitors coming to Utah each year to experience its natural beauty and outdoor recreation opportunities. Mining is also an important part of the state’s economy, with the extraction of minerals such as copper, gold, and silver providing jobs and revenue for the state. Agriculture is also an important part of the state’s economy, with the production of livestock, dairy products, and crops such as wheat, corn, and hay providing jobs and revenue for the state.
Demographics
As of 2020, the population of Utah was estimated to be 3.2 million. The state is predominantly white, with non-Hispanic whites making up 79.2% of the population. The largest minority groups in the state are Hispanics (13.2%), Asians (3.2%), and African Americans (2.2%). The state’s population is also relatively young, with a median age of 30.7 years. The state’s population is also growing rapidly, with an estimated population growth rate of 2.2% between 2020 and 2030.
Conclusion
Utah is a state located in the western United States that is known for its diverse geography, strong economy, and rich history. The state is home to millions of people and is a popular destination for tourists and outdoor enthusiasts. The state’s economy is largely based on tourism, mining, and agriculture, and its population is growing rapidly. Utah is a unique and vibrant state that offers something for everyone.
Common Questions
What is Per Capita Income in Peter?
Per Capita income in Peter is $36,101.
What is the Median Family Income in Peter?
Median Family Income in Peter is $121,696.
What is the Median Household income in Peter?
Median Household Income in Peter is $120,179.
What is Income or Wage Gap in Peter?
Income or Wage Gap in Peter is 65.0%.
Women in Peter earn 35.0 cents for every dollar earned by a man.
What is Inequality or Gini Index in Peter?
Inequality or Gini Index in Peter is 0.20.
What is the Total Population of Peter?
Total Population of Peter is 276.
What is the Total Male Population of Peter?
Total Male Population of Peter is 132.
What is the Total Female Population of Peter?
Total Female Population of Peter is 144.
What is the Ratio of Males per 100 Females in Peter?
There are 91.67 Males per 100 Females in Peter.
What is the Ratio of Females per 100 Males in Peter?
There are 109.09 Females per 100 Males in Peter.
What is the Median Population Age in Peter?
Median Population Age in Peter is 36.4 Years.
What is the Average Family Size in Peter
Average Family Size in Peter is 3.4 People.
What is the Average Household Size in Peter
Average Household Size in Peter is 2.9 People.
How Large is the Labor Force in Peter?
There are 118 People in the Labor Forcein in Peter.
What is the Percentage of People in the Labor Force in Peter?
63.1% of People are in the Labor Force in Peter.