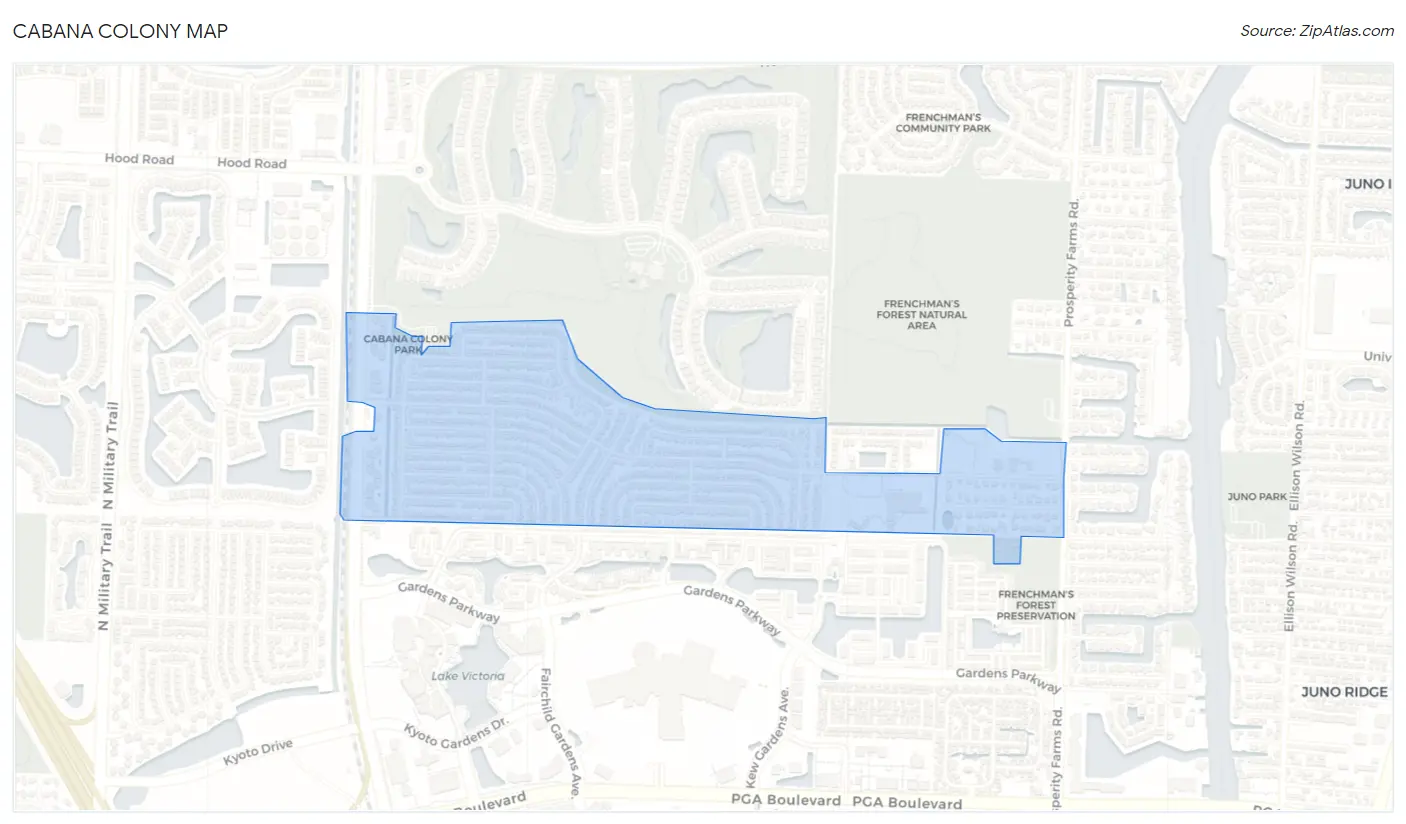
Cabana Colony, FL Map & Demographics
Cabana Colony Map
Cabana Colony Overview
$42,434
PER CAPITA INCOME
$65,833
AVG FAMILY INCOME
$92,635
AVG HOUSEHOLD INCOME
24.8%
WAGE / INCOME GAP [ % ]
75.2¢/ $1
WAGE / INCOME GAP [ $ ]
0.41
INEQUALITY / GINI INDEX
2,334
TOTAL POPULATION
1,273
MALE POPULATION
1,061
FEMALE POPULATION
119.98
MALES / 100 FEMALES
83.35
FEMALES / 100 MALES
32.2
MEDIAN AGE
2.9
AVG FAMILY SIZE
2.6
AVG HOUSEHOLD SIZE
1,547
LABOR FORCE [ PEOPLE ]
86.9%
PERCENT IN LABOR FORCE
1.1%
UNEMPLOYMENT RATE
Income in Cabana Colony
Income Overview in Cabana Colony
Per Capita Income in Cabana Colony is $42,434, while median incomes of families and households are $65,833 and $92,635 respectively.
| Characteristic | Number | Measure |
| Per Capita Income | 2,334 | $42,434 |
| Median Family Income | 596 | $65,833 |
| Mean Family Income | 596 | $106,535 |
| Median Household Income | 899 | $92,635 |
| Mean Household Income | 899 | $108,127 |
| Income Deficit | 596 | $0 |
| Wage / Income Gap (%) | 2,334 | 24.81% |
| Wage / Income Gap ($) | 2,334 | 75.19¢ per $1 |
| Gini / Inequality Index | 2,334 | 0.41 |
Earnings by Sex in Cabana Colony
Average Earnings in Cabana Colony are $37,560, $45,283 for men and $34,048 for women, a difference of 24.8%.
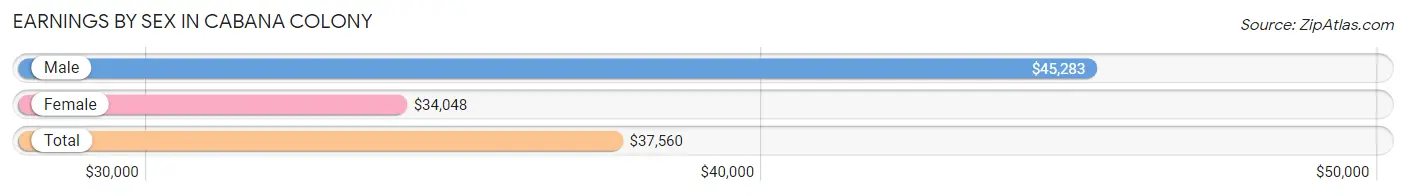
| Sex | Number | Average Earnings |
| Male | 923 (59.3%) | $45,283 |
| Female | 634 (40.7%) | $34,048 |
| Total | 1,557 (100.0%) | $37,560 |
Earnings by Sex by Income Bracket in Cabana Colony
The most common earnings brackets in Cabana Colony are $100,000+ for men (212 | 23.0%) and $25,000 to $29,999 for women (129 | 20.3%).
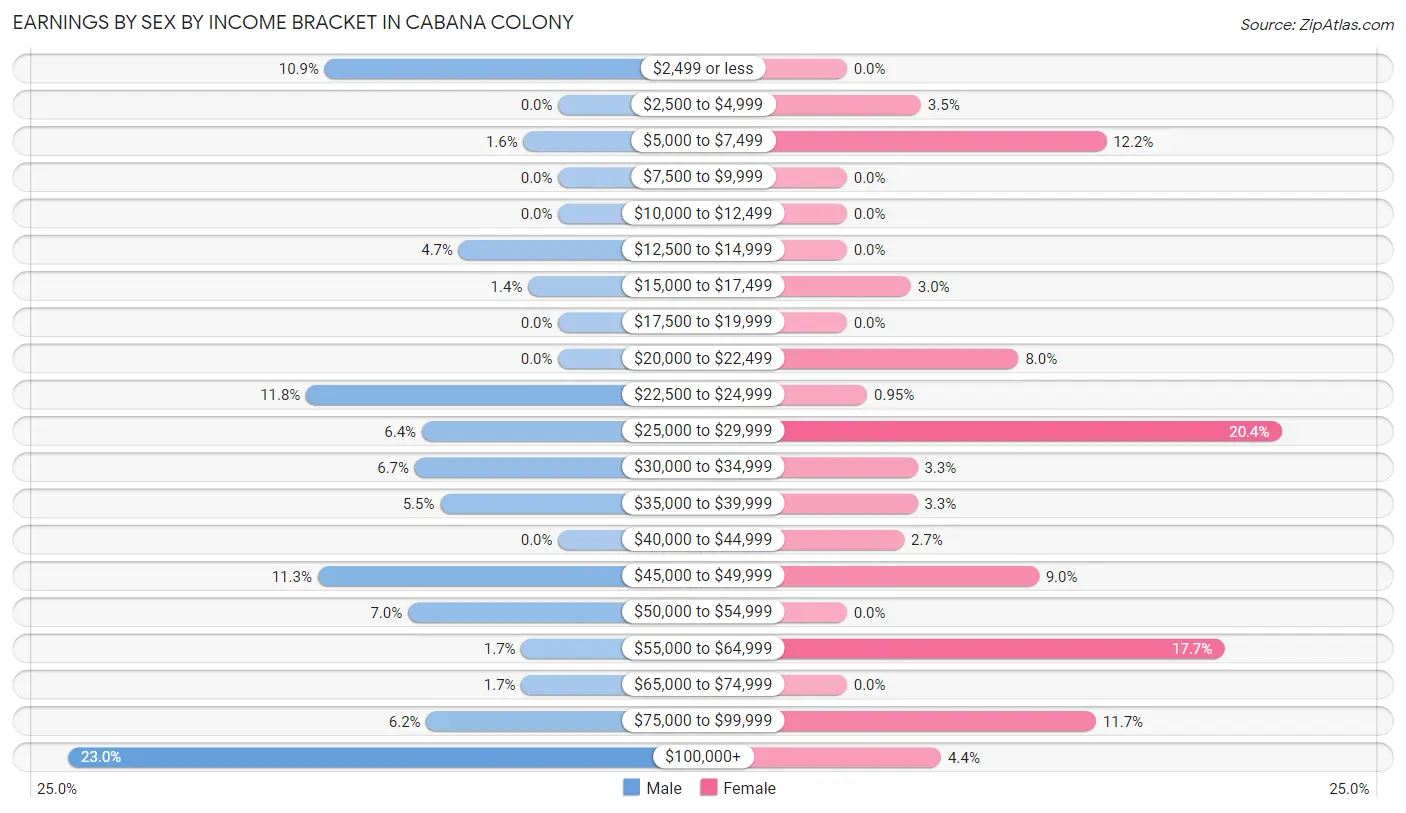
| Income | Male | Female |
| $2,499 or less | 101 (10.9%) | 0 (0.0%) |
| $2,500 to $4,999 | 0 (0.0%) | 22 (3.5%) |
| $5,000 to $7,499 | 15 (1.6%) | 77 (12.1%) |
| $7,500 to $9,999 | 0 (0.0%) | 0 (0.0%) |
| $10,000 to $12,499 | 0 (0.0%) | 0 (0.0%) |
| $12,500 to $14,999 | 43 (4.7%) | 0 (0.0%) |
| $15,000 to $17,499 | 13 (1.4%) | 19 (3.0%) |
| $17,500 to $19,999 | 0 (0.0%) | 0 (0.0%) |
| $20,000 to $22,499 | 0 (0.0%) | 51 (8.0%) |
| $22,500 to $24,999 | 109 (11.8%) | 6 (0.9%) |
| $25,000 to $29,999 | 59 (6.4%) | 129 (20.3%) |
| $30,000 to $34,999 | 62 (6.7%) | 21 (3.3%) |
| $35,000 to $39,999 | 51 (5.5%) | 21 (3.3%) |
| $40,000 to $44,999 | 0 (0.0%) | 17 (2.7%) |
| $45,000 to $49,999 | 104 (11.3%) | 57 (9.0%) |
| $50,000 to $54,999 | 65 (7.0%) | 0 (0.0%) |
| $55,000 to $64,999 | 16 (1.7%) | 112 (17.7%) |
| $65,000 to $74,999 | 16 (1.7%) | 0 (0.0%) |
| $75,000 to $99,999 | 57 (6.2%) | 74 (11.7%) |
| $100,000+ | 212 (23.0%) | 28 (4.4%) |
| Total | 923 (100.0%) | 634 (100.0%) |
Earnings by Sex by Educational Attainment in Cabana Colony
Average earnings in Cabana Colony are $48,319 for men and $38,631 for women, a difference of 20.1%. Men with an educational attainment of bachelor's degree enjoy the highest average annual earnings of $108,750, while those with high school diploma education earn the least with $24,963. Women with an educational attainment of bachelor's degree earn the most with the average annual earnings of $56,114, while those with high school diploma education have the smallest earnings of $28,333.
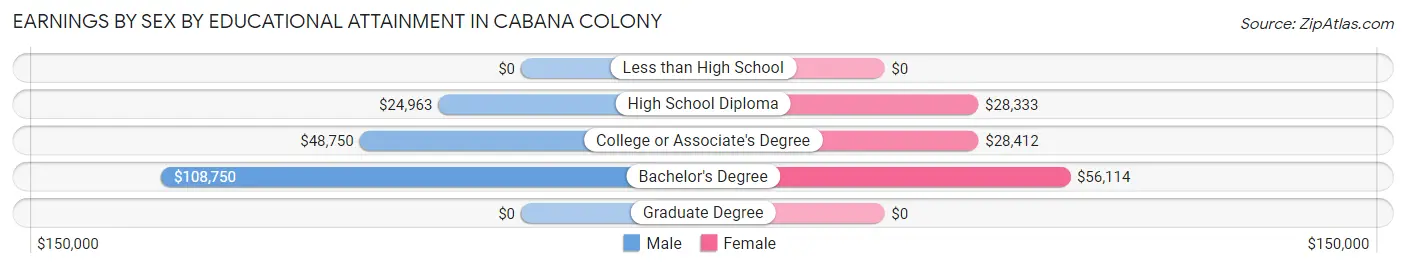
| Educational Attainment | Male Income | Female Income |
| Less than High School | - | - |
| High School Diploma | $24,963 | $28,333 |
| College or Associate's Degree | $48,750 | $28,412 |
| Bachelor's Degree | $108,750 | $56,114 |
| Graduate Degree | - | - |
| Total | $48,319 | $38,631 |
Family Income in Cabana Colony
Family Income Brackets in Cabana Colony
According to the Cabana Colony family income data, there are 150 families falling into the $50,000 to $74,999 income range, which is the most common income bracket and makes up 25.2% of all families.
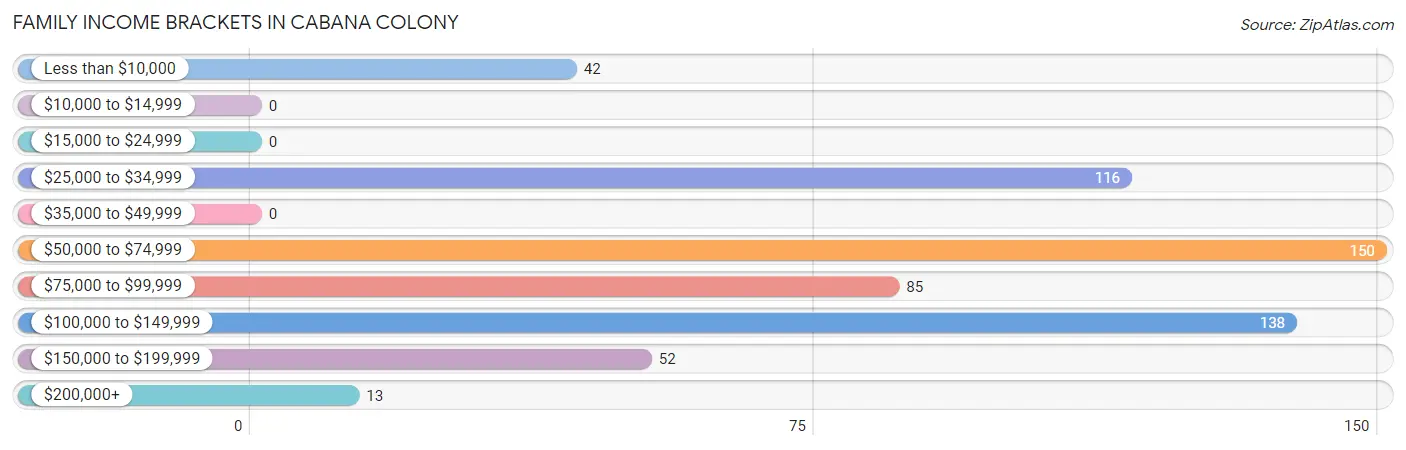
| Income Bracket | # Families | % Families |
| Less than $10,000 | 42 | 7.0% |
| $10,000 to $14,999 | 0 | 0.0% |
| $15,000 to $24,999 | 0 | 0.0% |
| $25,000 to $34,999 | 116 | 19.5% |
| $35,000 to $49,999 | 0 | 0.0% |
| $50,000 to $74,999 | 150 | 25.2% |
| $75,000 to $99,999 | 85 | 14.3% |
| $100,000 to $149,999 | 138 | 23.2% |
| $150,000 to $199,999 | 52 | 8.7% |
| $200,000+ | 13 | 2.2% |
Family Income by Famaliy Size in Cabana Colony
2-person families (257 | 43.1%) account for the highest median family income in Cabana Colony with $115,996 per family, while 2-person families (257 | 43.1%) have the highest median income of $57,998 per family member.
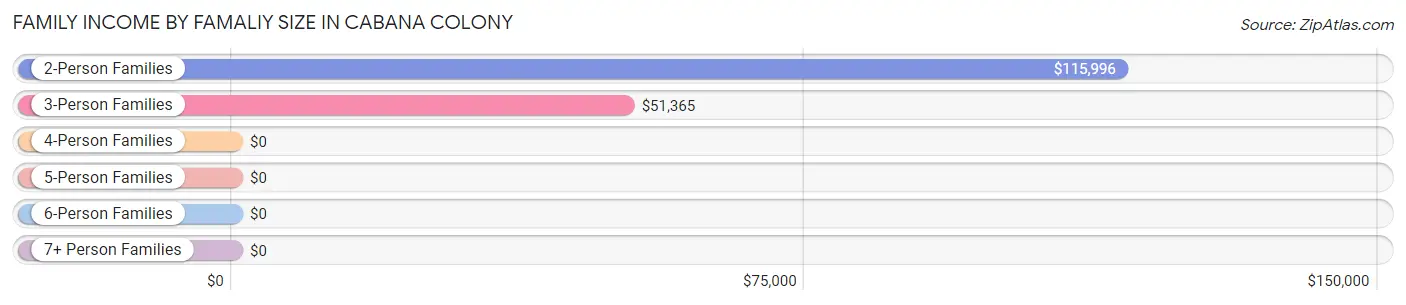
| Income Bracket | # Families | Median Income |
| 2-Person Families | 257 (43.1%) | $115,996 |
| 3-Person Families | 279 (46.8%) | $51,365 |
| 4-Person Families | 16 (2.7%) | $0 |
| 5-Person Families | 44 (7.4%) | $0 |
| 6-Person Families | 0 (0.0%) | $0 |
| 7+ Person Families | 0 (0.0%) | $0 |
| Total | 596 (100.0%) | $65,833 |
Family Income by Number of Earners in Cabana Colony
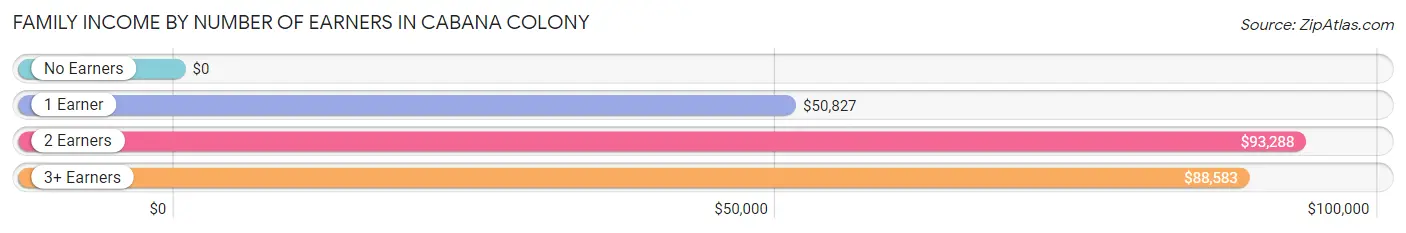
| Number of Earners | # Families | Median Income |
| No Earners | 13 (2.2%) | $0 |
| 1 Earner | 275 (46.1%) | $50,827 |
| 2 Earners | 255 (42.8%) | $93,288 |
| 3+ Earners | 53 (8.9%) | $88,583 |
| Total | 596 (100.0%) | $65,833 |
Household Income in Cabana Colony
Household Income Brackets in Cabana Colony
With 287 households falling in the category, the $100,000 to $149,999 income range is the most frequent in Cabana Colony, accounting for 31.9% of all households.
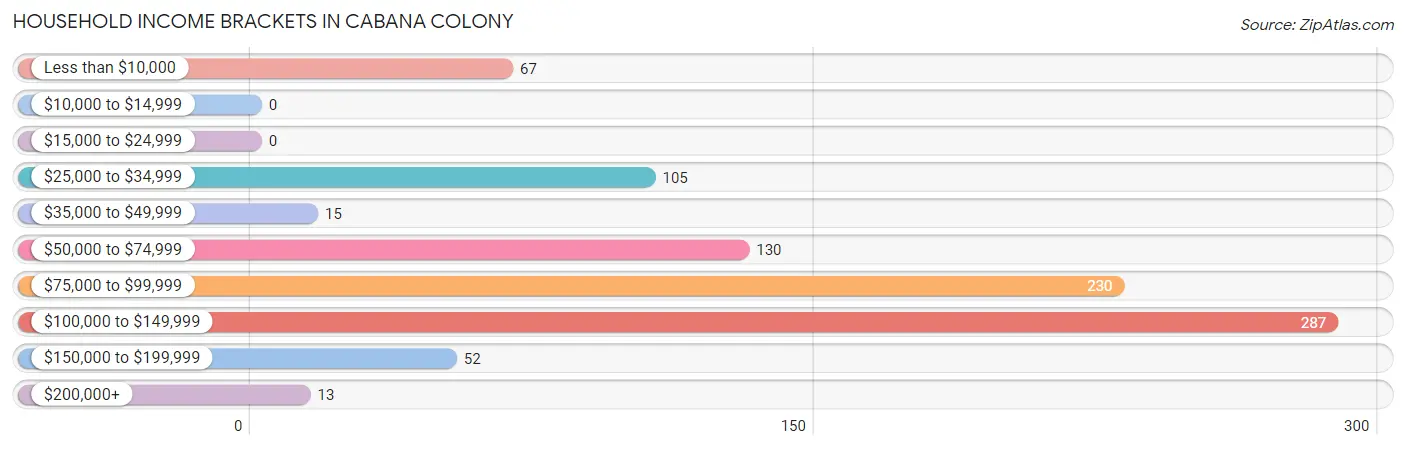
| Income Bracket | # Households | % Households |
| Less than $10,000 | 67 | 7.5% |
| $10,000 to $14,999 | 0 | 0.0% |
| $15,000 to $24,999 | 0 | 0.0% |
| $25,000 to $34,999 | 105 | 11.7% |
| $35,000 to $49,999 | 15 | 1.7% |
| $50,000 to $74,999 | 130 | 14.5% |
| $75,000 to $99,999 | 230 | 25.6% |
| $100,000 to $149,999 | 287 | 31.9% |
| $150,000 to $199,999 | 52 | 5.8% |
| $200,000+ | 13 | 1.4% |
Household Income by Householder Age in Cabana Colony
The median household income in Cabana Colony is $92,635, with the highest median household income of $133,750 found in the 65+ years age bracket for the primary householder. A total of 170 households (18.9%) fall into this category.
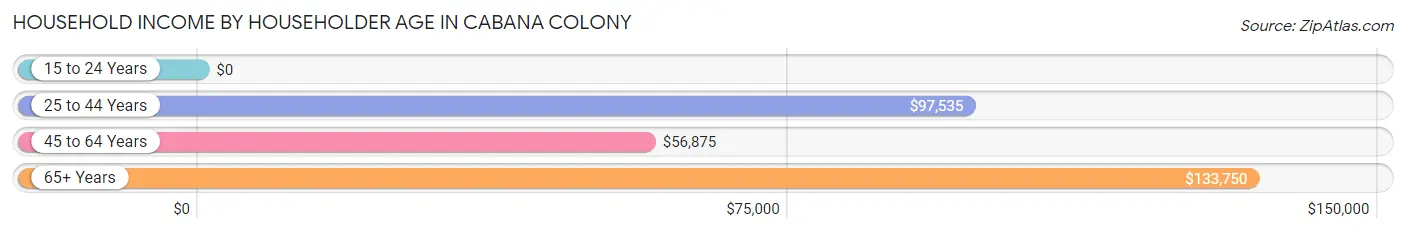
| Income Bracket | # Households | Median Income |
| 15 to 24 Years | 0 (0.0%) | $0 |
| 25 to 44 Years | 449 (49.9%) | $97,535 |
| 45 to 64 Years | 280 (31.1%) | $56,875 |
| 65+ Years | 170 (18.9%) | $133,750 |
| Total | 899 (100.0%) | $92,635 |
Poverty in Cabana Colony
Income Below Poverty by Sex and Age in Cabana Colony
With 7.2% poverty level for males and 11.2% for females among the residents of Cabana Colony, 18 to 24 year old males and 16 and 17 year old females are the most vulnerable to poverty, with 64 males (45.7%) and 51 females (100.0%) in their respective age groups living below the poverty level.
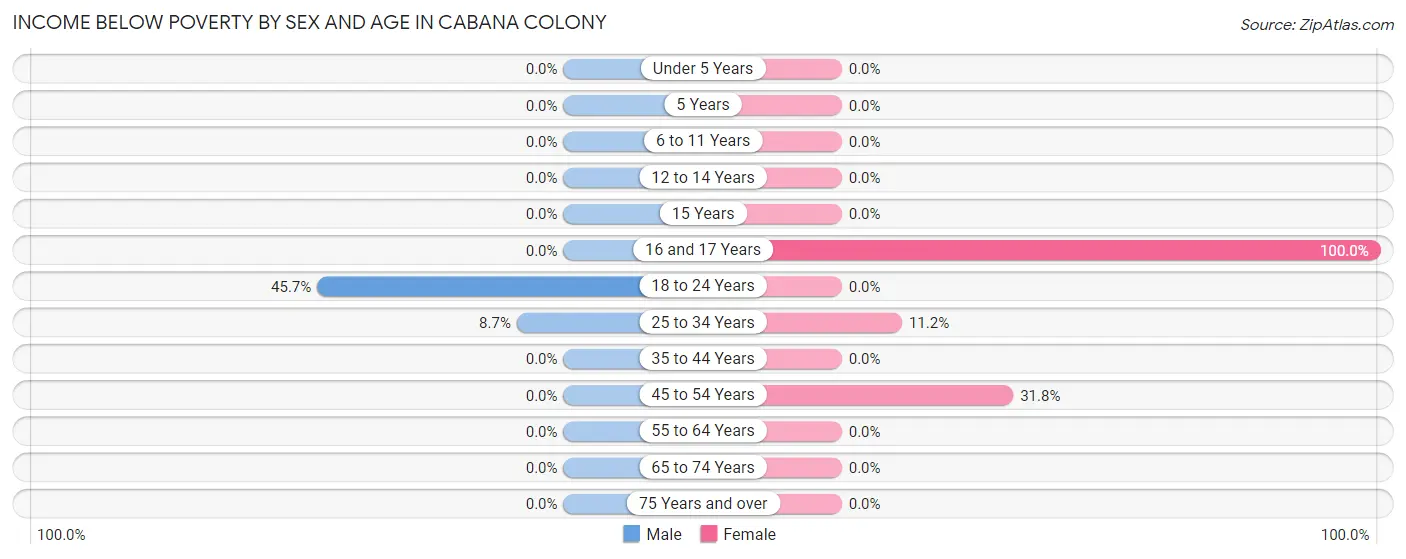
| Age Bracket | Male | Female |
| Under 5 Years | 0 (0.0%) | 0 (0.0%) |
| 5 Years | 0 (0.0%) | 0 (0.0%) |
| 6 to 11 Years | 0 (0.0%) | 0 (0.0%) |
| 12 to 14 Years | 0 (0.0%) | 0 (0.0%) |
| 15 Years | 0 (0.0%) | 0 (0.0%) |
| 16 and 17 Years | 0 (0.0%) | 51 (100.0%) |
| 18 to 24 Years | 64 (45.7%) | 0 (0.0%) |
| 25 to 34 Years | 25 (8.6%) | 22 (11.2%) |
| 35 to 44 Years | 0 (0.0%) | 0 (0.0%) |
| 45 to 54 Years | 0 (0.0%) | 42 (31.8%) |
| 55 to 64 Years | 0 (0.0%) | 0 (0.0%) |
| 65 to 74 Years | 0 (0.0%) | 0 (0.0%) |
| 75 Years and over | 0 (0.0%) | 0 (0.0%) |
| Total | 89 (7.2%) | 115 (11.2%) |
Income Above Poverty by Sex and Age in Cabana Colony
According to the poverty statistics in Cabana Colony, males aged under 5 years and females aged under 5 years are the age groups that are most secure financially, with 100.0% of males and 100.0% of females in these age groups living above the poverty line.
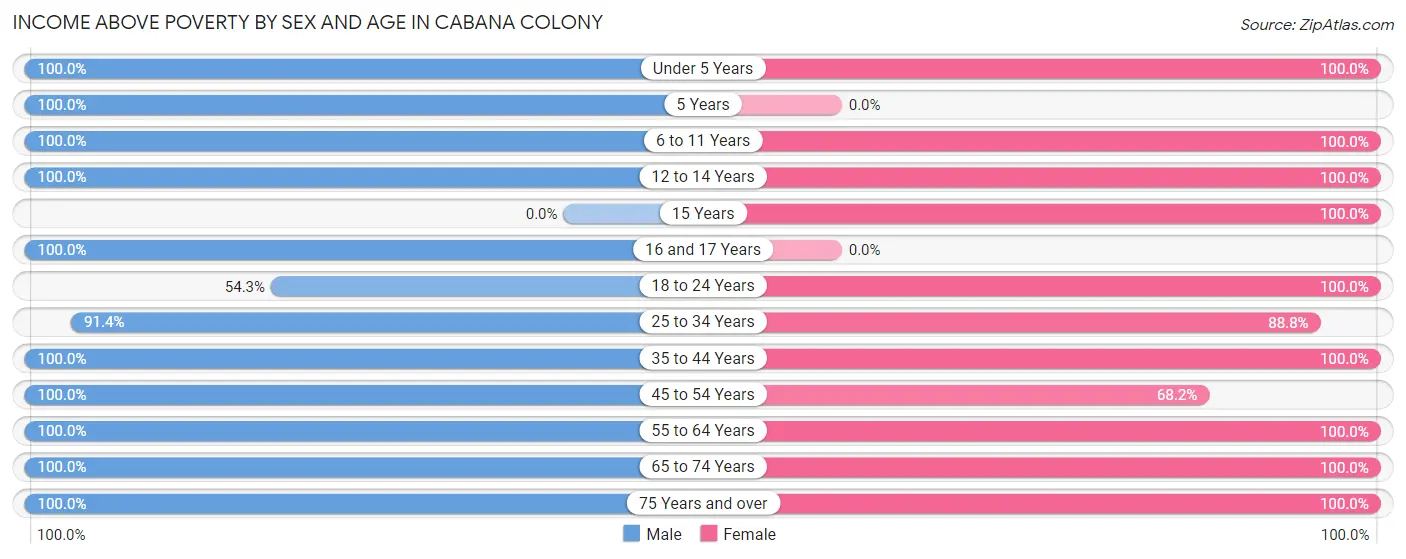
| Age Bracket | Male | Female |
| Under 5 Years | 84 (100.0%) | 105 (100.0%) |
| 5 Years | 53 (100.0%) | 0 (0.0%) |
| 6 to 11 Years | 74 (100.0%) | 111 (100.0%) |
| 12 to 14 Years | 18 (100.0%) | 13 (100.0%) |
| 15 Years | 0 (0.0%) | 24 (100.0%) |
| 16 and 17 Years | 78 (100.0%) | 0 (0.0%) |
| 18 to 24 Years | 76 (54.3%) | 35 (100.0%) |
| 25 to 34 Years | 264 (91.3%) | 175 (88.8%) |
| 35 to 44 Years | 224 (100.0%) | 193 (100.0%) |
| 45 to 54 Years | 115 (100.0%) | 90 (68.2%) |
| 55 to 64 Years | 57 (100.0%) | 63 (100.0%) |
| 65 to 74 Years | 94 (100.0%) | 91 (100.0%) |
| 75 Years and over | 13 (100.0%) | 8 (100.0%) |
| Total | 1,150 (92.8%) | 908 (88.8%) |
Income Below Poverty Among Married-Couple Families in Cabana Colony
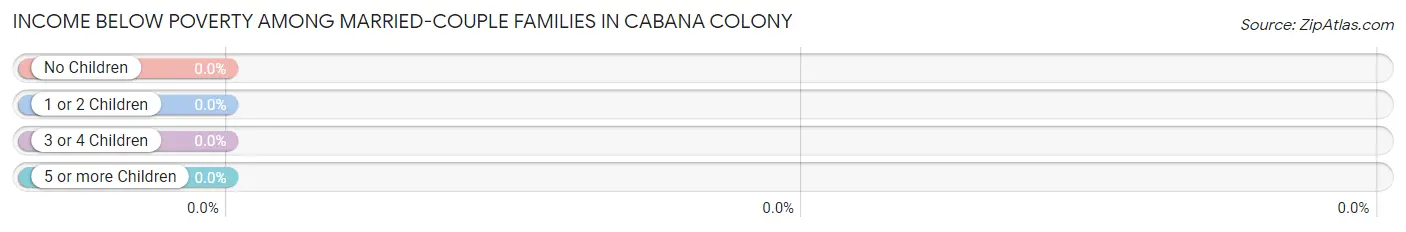
| Children | Above Poverty | Below Poverty |
| No Children | 86 (100.0%) | 0 (0.0%) |
| 1 or 2 Children | 135 (100.0%) | 0 (0.0%) |
| 3 or 4 Children | 0 (0.0%) | 0 (0.0%) |
| 5 or more Children | 0 (0.0%) | 0 (0.0%) |
| Total | 221 (100.0%) | 0 (0.0%) |
Income Below Poverty Among Single-Parent Households in Cabana Colony
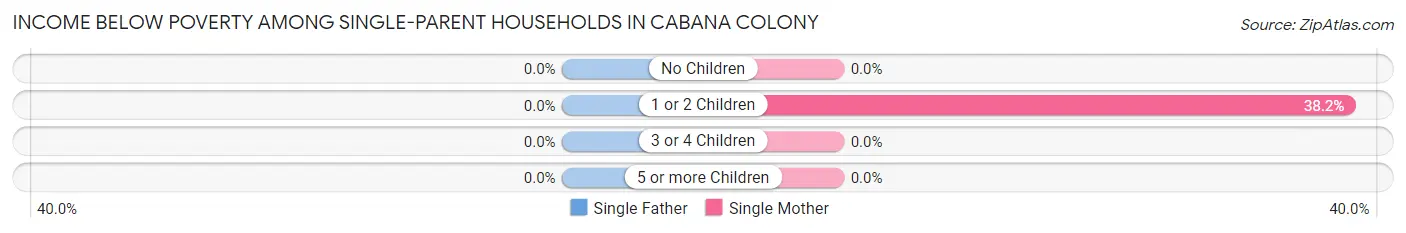
| Children | Single Father | Single Mother |
| No Children | 0 (0.0%) | 0 (0.0%) |
| 1 or 2 Children | 0 (0.0%) | 42 (38.2%) |
| 3 or 4 Children | 0 (0.0%) | 0 (0.0%) |
| 5 or more Children | 0 (0.0%) | 0 (0.0%) |
| Total | 0 (0.0%) | 42 (27.5%) |
Income Below Poverty Among Married-Couple vs Single-Parent Households in Cabana Colony
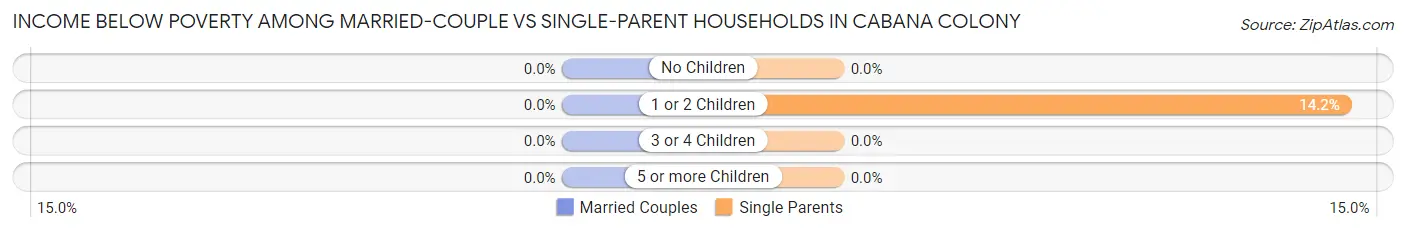
| Children | Married-Couple Families | Single-Parent Households |
| No Children | 0 (0.0%) | 0 (0.0%) |
| 1 or 2 Children | 0 (0.0%) | 42 (14.2%) |
| 3 or 4 Children | 0 (0.0%) | 0 (0.0%) |
| 5 or more Children | 0 (0.0%) | 0 (0.0%) |
| Total | 0 (0.0%) | 42 (11.2%) |
Race in Cabana Colony
The most populous races in Cabana Colony are White / Caucasian (1,407 | 60.3%), Hispanic or Latino (1,014 | 43.4%), and Two or more Races (557 | 23.9%).
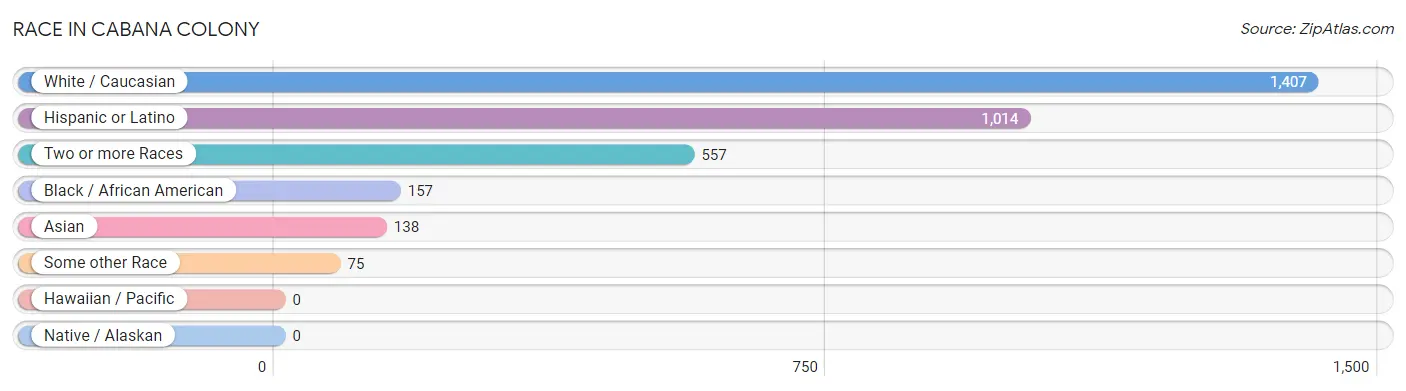
| Race | # Population | % Population |
| Asian | 138 | 5.9% |
| Black / African American | 157 | 6.7% |
| Hawaiian / Pacific | 0 | 0.0% |
| Hispanic or Latino | 1,014 | 43.4% |
| Native / Alaskan | 0 | 0.0% |
| White / Caucasian | 1,407 | 60.3% |
| Two or more Races | 557 | 23.9% |
| Some other Race | 75 | 3.2% |
| Total | 2,334 | 100.0% |
Ancestry in Cabana Colony
The most populous ancestries reported in Cabana Colony are South American (578 | 24.8%), Peruvian (278 | 11.9%), German (268 | 11.5%), English (219 | 9.4%), and Venezuelan (214 | 9.2%), together accounting for 66.7% of all Cabana Colony residents.
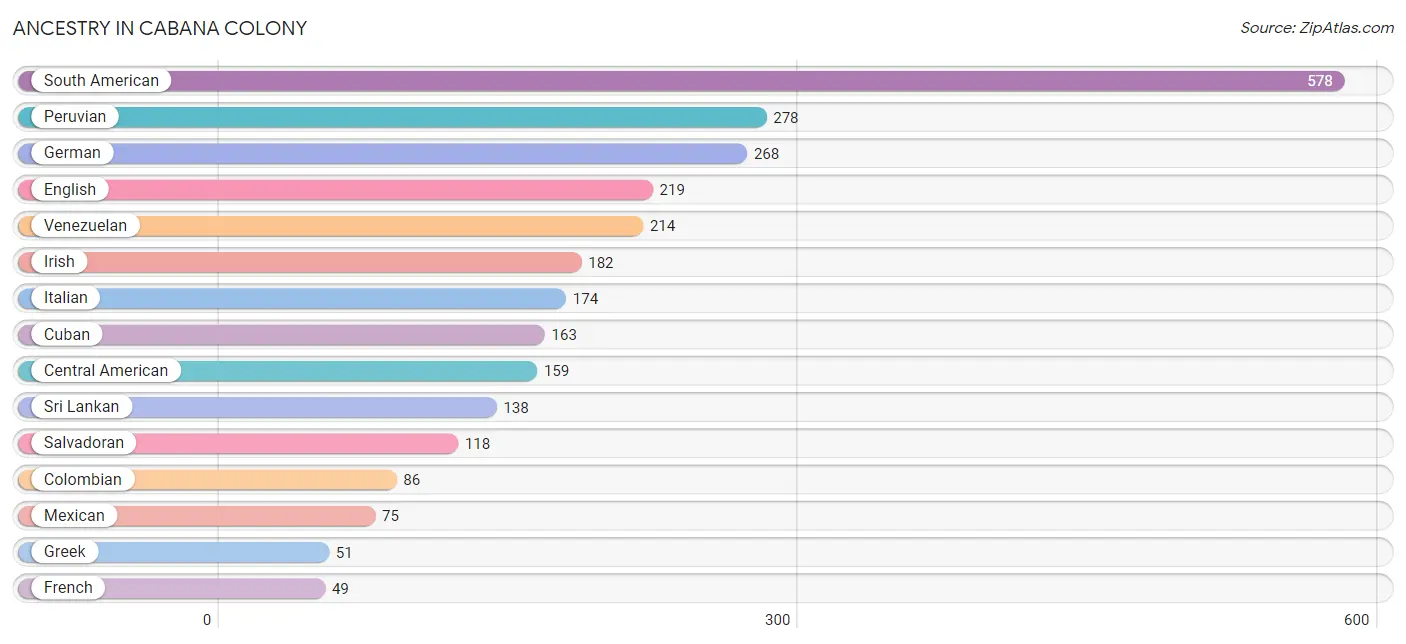
| Ancestry | # Population | % Population |
| Bhutanese | 36 | 1.5% |
| Central American | 159 | 6.8% |
| Central American Indian | 41 | 1.8% |
| Colombian | 86 | 3.7% |
| Cuban | 163 | 7.0% |
| Czechoslovakian | 12 | 0.5% |
| Danish | 13 | 0.6% |
| Dominican | 39 | 1.7% |
| English | 219 | 9.4% |
| French | 49 | 2.1% |
| French Canadian | 13 | 0.6% |
| German | 268 | 11.5% |
| Greek | 51 | 2.2% |
| Guatemalan | 41 | 1.8% |
| Irish | 182 | 7.8% |
| Italian | 174 | 7.5% |
| Mexican | 75 | 3.2% |
| Norwegian | 22 | 0.9% |
| Peruvian | 278 | 11.9% |
| Salvadoran | 118 | 5.1% |
| Scottish | 17 | 0.7% |
| South American | 578 | 24.8% |
| Sri Lankan | 138 | 5.9% |
| Venezuelan | 214 | 9.2% | View All 24 Rows |
Immigrants in Cabana Colony
The most numerous immigrant groups reported in Cabana Colony came from Latin America (449 | 19.2%), Central America (178 | 7.6%), South America (147 | 6.3%), Asia (138 | 5.9%), and South Eastern Asia (138 | 5.9%), together accounting for 45.0% of all Cabana Colony residents.
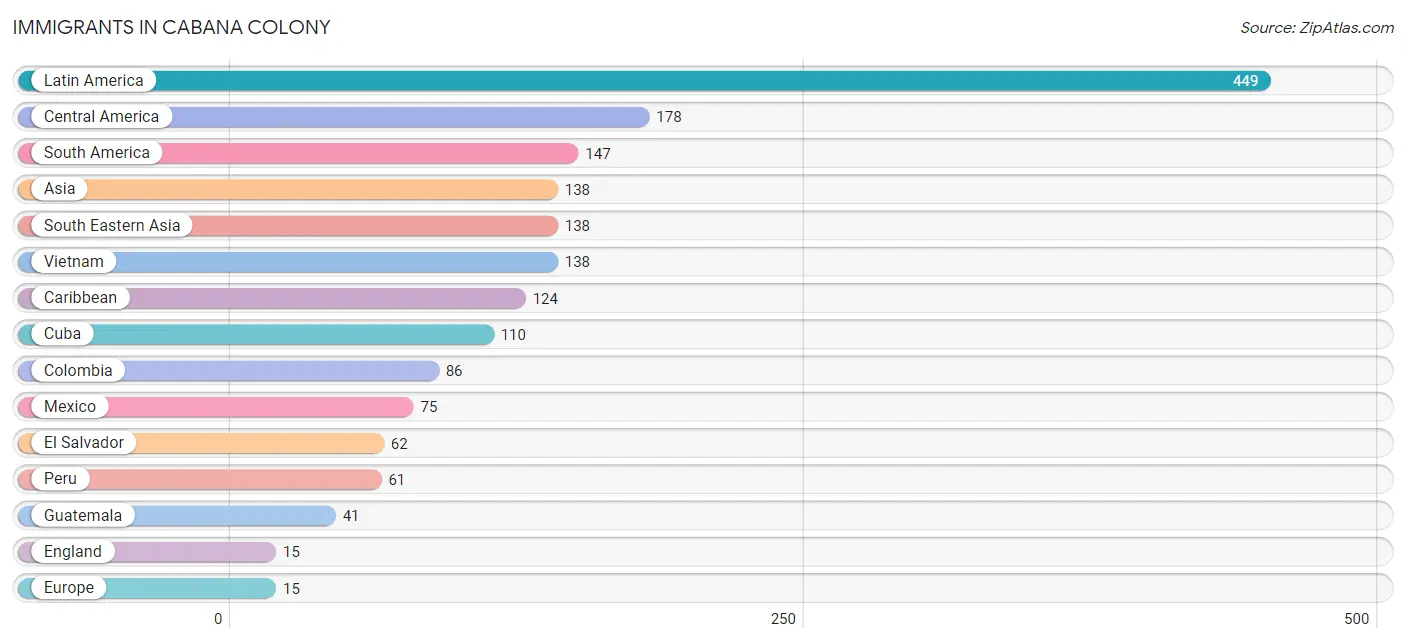
| Immigration Origin | # Population | % Population |
| Asia | 138 | 5.9% |
| Caribbean | 124 | 5.3% |
| Central America | 178 | 7.6% |
| Colombia | 86 | 3.7% |
| Cuba | 110 | 4.7% |
| Dominican Republic | 14 | 0.6% |
| El Salvador | 62 | 2.7% |
| England | 15 | 0.6% |
| Europe | 15 | 0.6% |
| Guatemala | 41 | 1.8% |
| Latin America | 449 | 19.2% |
| Mexico | 75 | 3.2% |
| Northern Europe | 15 | 0.6% |
| Peru | 61 | 2.6% |
| South America | 147 | 6.3% |
| South Eastern Asia | 138 | 5.9% |
| Vietnam | 138 | 5.9% | View All 17 Rows |
Sex and Age in Cabana Colony
Sex and Age in Cabana Colony
The most populous age groups in Cabana Colony are 30 to 34 Years (219 | 17.2%) for men and 35 to 39 Years (165 | 15.5%) for women.
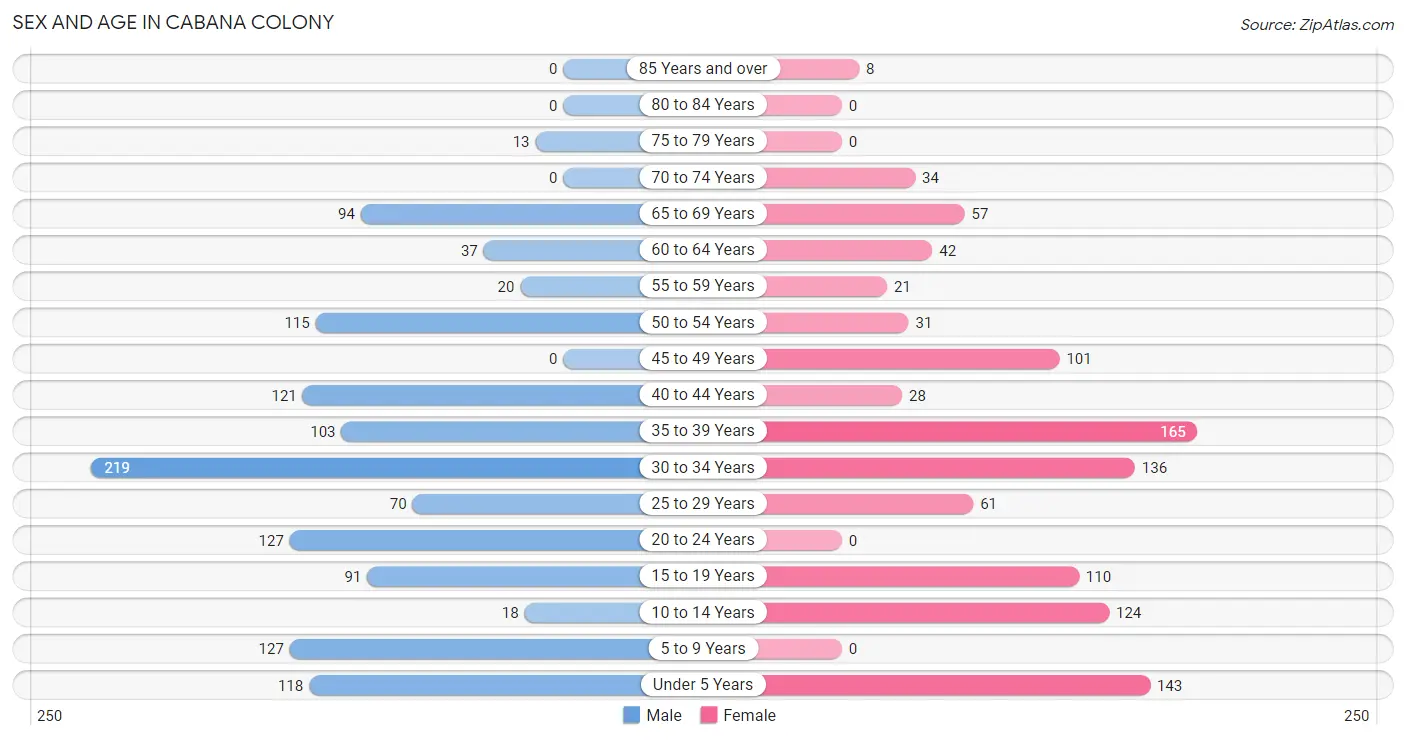
| Age Bracket | Male | Female |
| Under 5 Years | 118 (9.3%) | 143 (13.5%) |
| 5 to 9 Years | 127 (10.0%) | 0 (0.0%) |
| 10 to 14 Years | 18 (1.4%) | 124 (11.7%) |
| 15 to 19 Years | 91 (7.1%) | 110 (10.4%) |
| 20 to 24 Years | 127 (10.0%) | 0 (0.0%) |
| 25 to 29 Years | 70 (5.5%) | 61 (5.8%) |
| 30 to 34 Years | 219 (17.2%) | 136 (12.8%) |
| 35 to 39 Years | 103 (8.1%) | 165 (15.5%) |
| 40 to 44 Years | 121 (9.5%) | 28 (2.6%) |
| 45 to 49 Years | 0 (0.0%) | 101 (9.5%) |
| 50 to 54 Years | 115 (9.0%) | 31 (2.9%) |
| 55 to 59 Years | 20 (1.6%) | 21 (2.0%) |
| 60 to 64 Years | 37 (2.9%) | 42 (4.0%) |
| 65 to 69 Years | 94 (7.4%) | 57 (5.4%) |
| 70 to 74 Years | 0 (0.0%) | 34 (3.2%) |
| 75 to 79 Years | 13 (1.0%) | 0 (0.0%) |
| 80 to 84 Years | 0 (0.0%) | 0 (0.0%) |
| 85 Years and over | 0 (0.0%) | 8 (0.7%) |
| Total | 1,273 (100.0%) | 1,061 (100.0%) |
Families and Households in Cabana Colony
Median Family Size in Cabana Colony
The median family size in Cabana Colony is 2.91 persons per family, with married-couple families (221 | 37.1%) accounting for the largest median family size of 3.44 persons per family. On the other hand, single male/father families (222 | 37.2%) represent the smallest median family size with 2.58 persons per family.
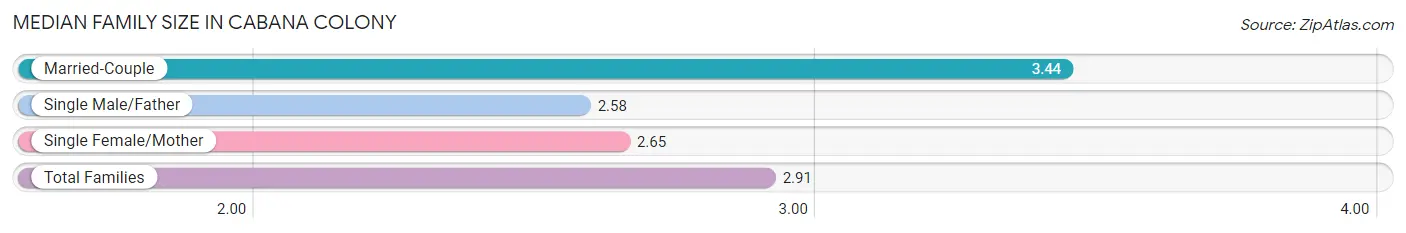
| Family Type | # Families | Family Size |
| Married-Couple | 221 (37.1%) | 3.44 |
| Single Male/Father | 222 (37.2%) | 2.58 |
| Single Female/Mother | 153 (25.7%) | 2.65 |
| Total Families | 596 (100.0%) | 2.91 |
Median Household Size in Cabana Colony
The median household size in Cabana Colony is 2.60 persons per household, with married-couple households (221 | 24.6%) accounting for the largest median household size of 3.44 persons per household. non-family households (303 | 33.7%) represent the smallest median household size with 1.15 persons per household.
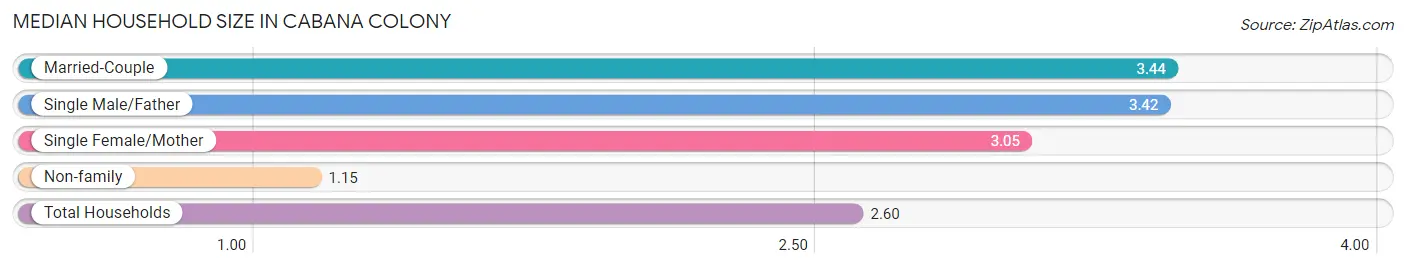
| Household Type | # Households | Household Size |
| Married-Couple | 221 (24.6%) | 3.44 |
| Single Male/Father | 222 (24.7%) | 3.42 |
| Single Female/Mother | 153 (17.0%) | 3.05 |
| Non-family | 303 (33.7%) | 1.15 |
| Total Households | 899 (100.0%) | 2.60 |
Household Size by Marriage Status in Cabana Colony
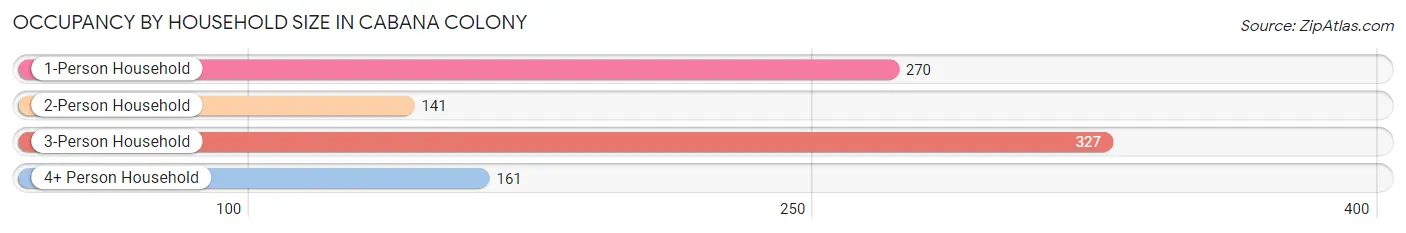
Out of a total of 899 households in Cabana Colony, 596 (66.3%) are family households, while 303 (33.7%) are nonfamily households. The most numerous type of family households are 3-person households, comprising 327, and the most common type of nonfamily households are 1-person households, comprising 270.
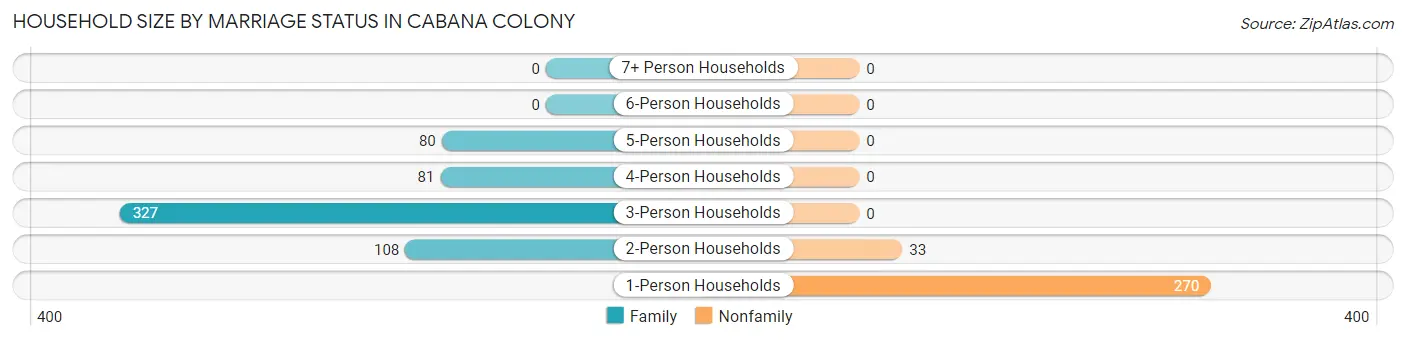
| Household Size | Family Households | Nonfamily Households |
| 1-Person Households | - | 270 (30.0%) |
| 2-Person Households | 108 (12.0%) | 33 (3.7%) |
| 3-Person Households | 327 (36.4%) | 0 (0.0%) |
| 4-Person Households | 81 (9.0%) | 0 (0.0%) |
| 5-Person Households | 80 (8.9%) | 0 (0.0%) |
| 6-Person Households | 0 (0.0%) | 0 (0.0%) |
| 7+ Person Households | 0 (0.0%) | 0 (0.0%) |
| Total | 596 (66.3%) | 303 (33.7%) |
Female Fertility in Cabana Colony
Fertility by Age in Cabana Colony
Average fertility rate in Cabana Colony is 28.0 births per 1,000 women. Women in the age bracket of 20 to 34 years have the highest fertility rate with 86.0 births per 1,000 women. Women in the age bracket of 20 to 34 years acount for 100.0% of all women with births.
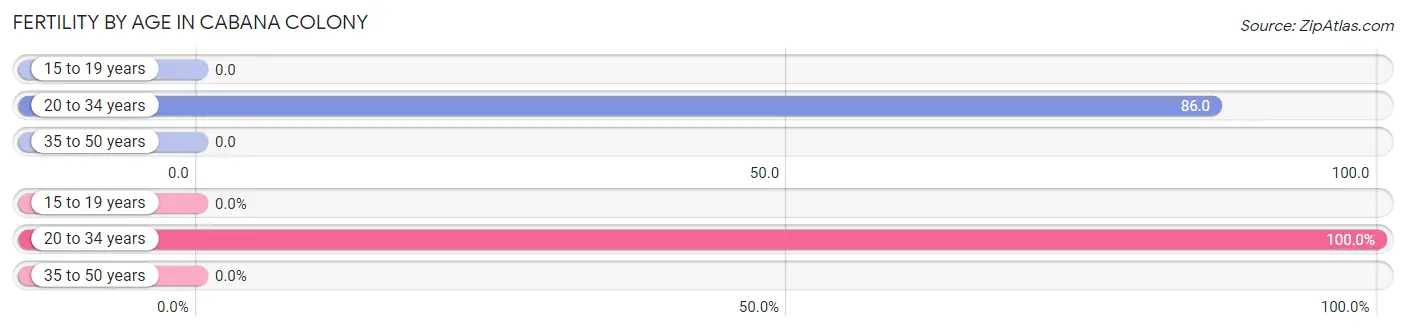
| Age Bracket | Women with Births | Births / 1,000 Women |
| 15 to 19 years | 0 (0.0%) | 0.0 |
| 20 to 34 years | 17 (100.0%) | 86.0 |
| 35 to 50 years | 0 (0.0%) | 0.0 |
| Total | 17 (100.0%) | 28.0 |
Fertility by Age by Marriage Status in Cabana Colony
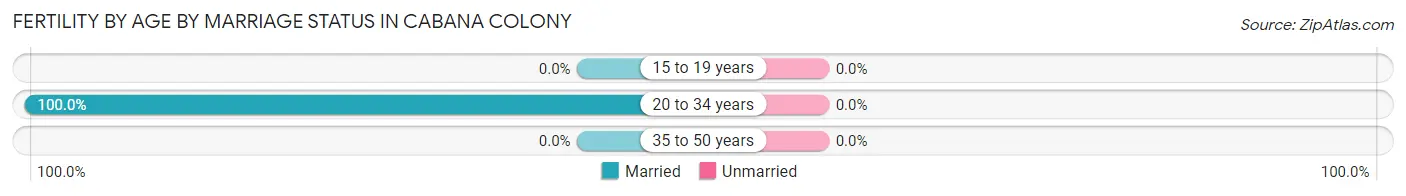
| Age Bracket | Married | Unmarried |
| 15 to 19 years | 0 (0.0%) | 0 (0.0%) |
| 20 to 34 years | 17 (100.0%) | 0 (0.0%) |
| 35 to 50 years | 0 (0.0%) | 0 (0.0%) |
| Total | 17 (100.0%) | 0 (0.0%) |
Fertility by Education in Cabana Colony
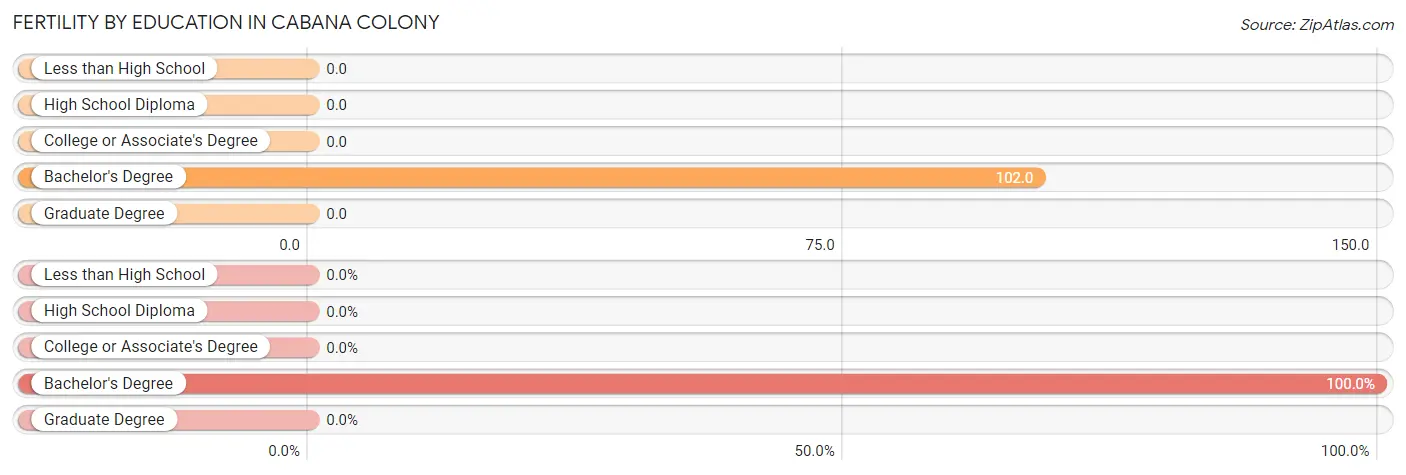
| Educational Attainment | Women with Births | Births / 1,000 Women |
| Less than High School | 0 (0.0%) | 0.0 |
| High School Diploma | 0 (0.0%) | 0.0 |
| College or Associate's Degree | 0 (0.0%) | 0.0 |
| Bachelor's Degree | 17 (100.0%) | 102.0 |
| Graduate Degree | 0 (0.0%) | 0.0 |
| Total | 17 (100.0%) | 28.0 |
Fertility by Education by Marriage Status in Cabana Colony
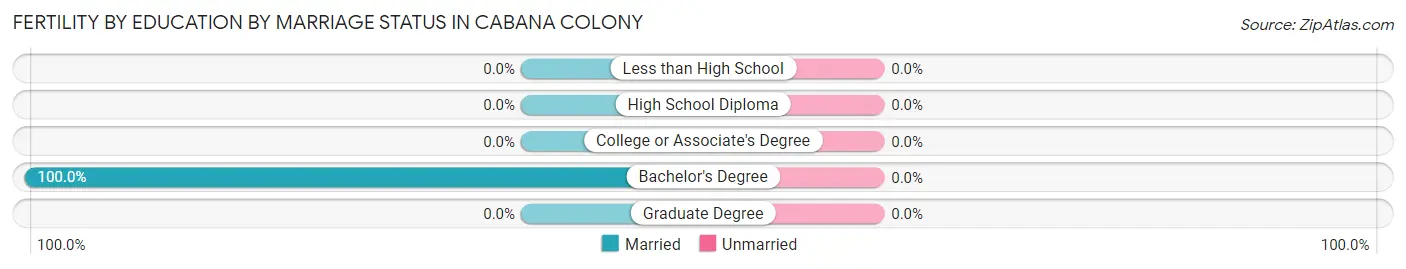
| Educational Attainment | Married | Unmarried |
| Less than High School | 0 (0.0%) | 0 (0.0%) |
| High School Diploma | 0 (0.0%) | 0 (0.0%) |
| College or Associate's Degree | 0 (0.0%) | 0 (0.0%) |
| Bachelor's Degree | 17 (100.0%) | 0 (0.0%) |
| Graduate Degree | 0 (0.0%) | 0 (0.0%) |
| Total | 17 (100.0%) | 0 (0.0%) |
Employment Characteristics in Cabana Colony
Employment by Class of Employer in Cabana Colony
Among the 1,395 employed individuals in Cabana Colony, private company employees (1,029 | 73.8%), self-employed (not incorporated) (108 | 7.7%), and local government employees (98 | 7.0%) make up the most common classes of employment.
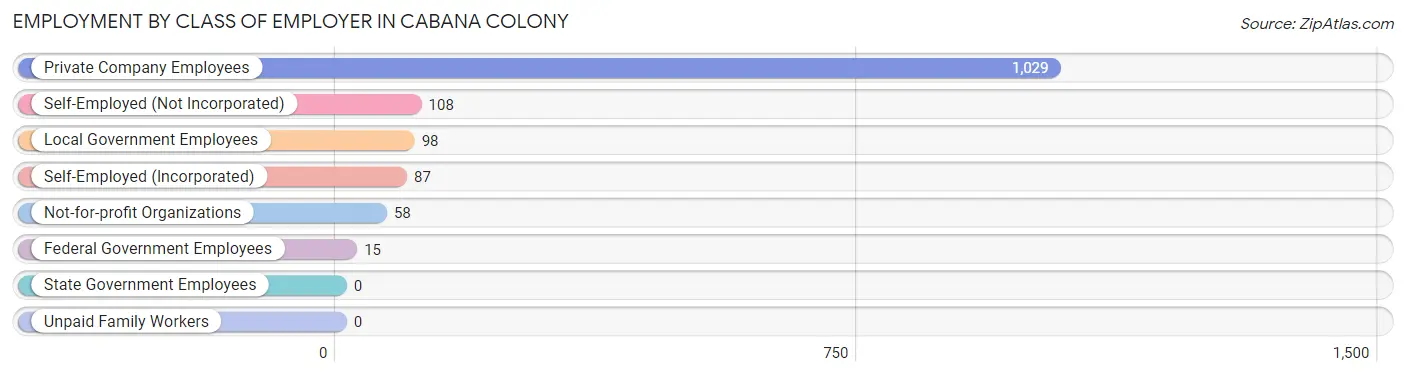
| Employer Class | # Employees | % Employees |
| Private Company Employees | 1,029 | 73.8% |
| Self-Employed (Incorporated) | 87 | 6.2% |
| Self-Employed (Not Incorporated) | 108 | 7.7% |
| Not-for-profit Organizations | 58 | 4.2% |
| Local Government Employees | 98 | 7.0% |
| State Government Employees | 0 | 0.0% |
| Federal Government Employees | 15 | 1.1% |
| Unpaid Family Workers | 0 | 0.0% |
| Total | 1,395 | 100.0% |
Employment Status by Age in Cabana Colony
According to the labor force statistics for Cabana Colony, out of the total population over 16 years of age (1,780), 86.9% or 1,547 individuals are in the labor force, with 1.1% or 17 of them unemployed. The age group with the highest labor force participation rate is 20 to 24 years, with 100.0% or 127 individuals in the labor force. Within the labor force, the 16 to 19 years age range has the highest percentage of unemployed individuals, with 26.2% or 17 of them being unemployed.
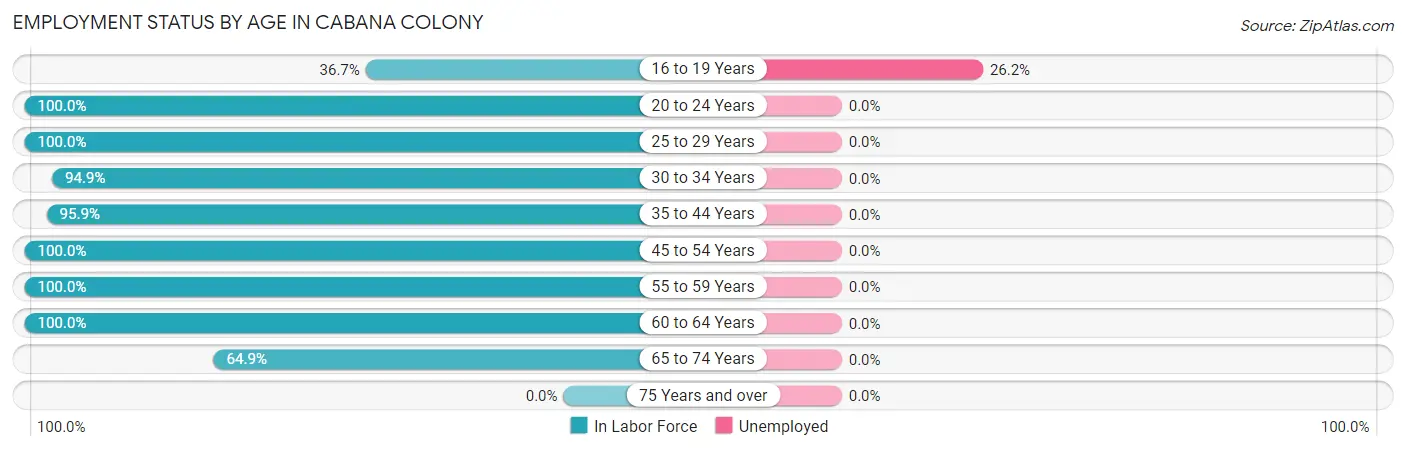
| Age Bracket | In Labor Force | Unemployed |
| 16 to 19 Years | 65 (36.7%) | 17 (26.2%) |
| 20 to 24 Years | 127 (100.0%) | 0 (0.0%) |
| 25 to 29 Years | 131 (100.0%) | 0 (0.0%) |
| 30 to 34 Years | 337 (94.9%) | 0 (0.0%) |
| 35 to 44 Years | 400 (95.9%) | 0 (0.0%) |
| 45 to 54 Years | 247 (100.0%) | 0 (0.0%) |
| 55 to 59 Years | 41 (100.0%) | 0 (0.0%) |
| 60 to 64 Years | 79 (100.0%) | 0 (0.0%) |
| 65 to 74 Years | 120 (64.9%) | 0 (0.0%) |
| 75 Years and over | 0 (0.0%) | 0 (0.0%) |
| Total | 1,547 (86.9%) | 17 (1.1%) |
Employment Status by Educational Attainment in Cabana Colony
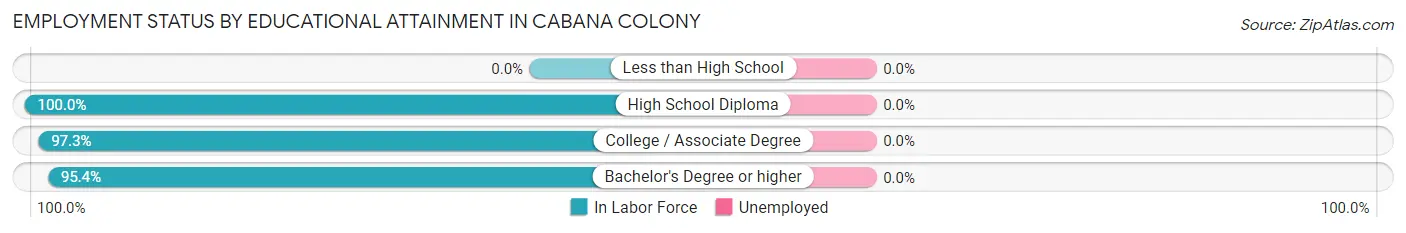
| Educational Attainment | In Labor Force | Unemployed |
| Less than High School | 0 (0.0%) | 0 (0.0%) |
| High School Diploma | 236 (100.0%) | 0 (0.0%) |
| College / Associate Degree | 643 (97.3%) | 0 (0.0%) |
| Bachelor's Degree or higher | 356 (95.4%) | 0 (0.0%) |
| Total | 1,234 (97.2%) | 0 (0.0%) |
Employment Occupations by Sex in Cabana Colony
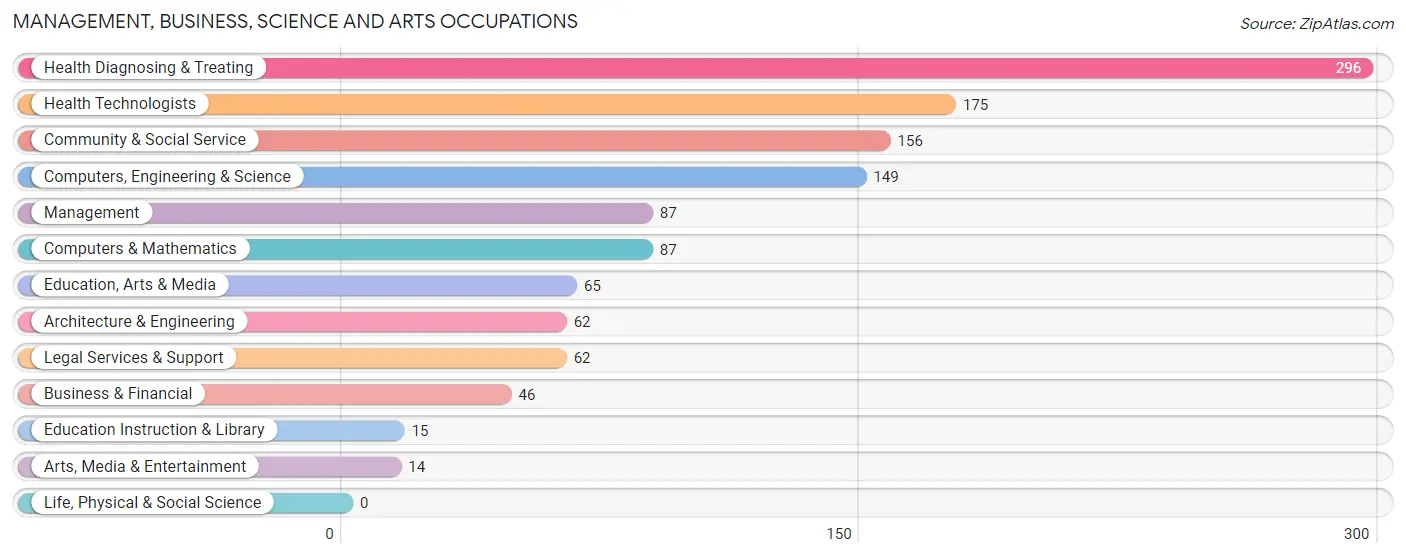
Management, Business, Science and Arts Occupations
The most common Management, Business, Science and Arts occupations in Cabana Colony are Health Diagnosing & Treating (296 | 19.4%), Health Technologists (175 | 11.4%), Community & Social Service (156 | 10.2%), Computers, Engineering & Science (149 | 9.7%), and Management (87 | 5.7%).
Management, Business, Science and Arts Occupations by Sex
Within the Management, Business, Science and Arts occupations in Cabana Colony, the most male-oriented occupations are Education, Arts & Media (100.0%), Legal Services & Support (74.2%), and Community & Social Service (71.2%), while the most female-oriented occupations are Business & Financial (100.0%), Education Instruction & Library (100.0%), and Arts, Media & Entertainment (100.0%).
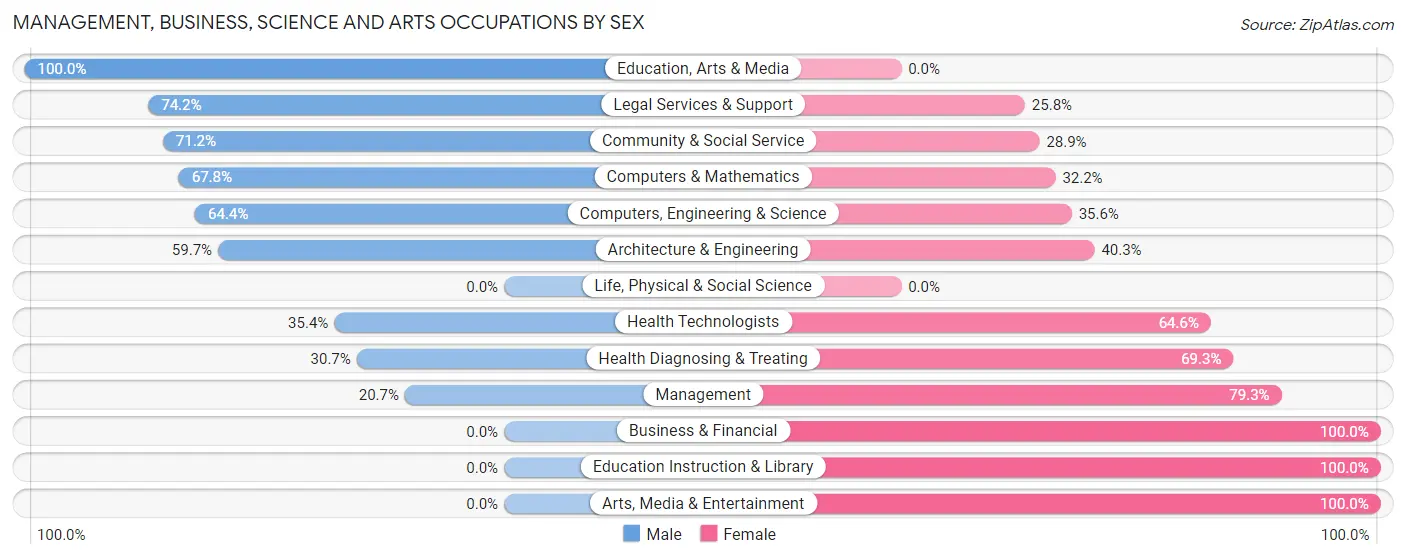
| Occupation | Male | Female |
| Management | 18 (20.7%) | 69 (79.3%) |
| Business & Financial | 0 (0.0%) | 46 (100.0%) |
| Computers, Engineering & Science | 96 (64.4%) | 53 (35.6%) |
| Computers & Mathematics | 59 (67.8%) | 28 (32.2%) |
| Architecture & Engineering | 37 (59.7%) | 25 (40.3%) |
| Life, Physical & Social Science | 0 (0.0%) | 0 (0.0%) |
| Community & Social Service | 111 (71.2%) | 45 (28.8%) |
| Education, Arts & Media | 65 (100.0%) | 0 (0.0%) |
| Legal Services & Support | 46 (74.2%) | 16 (25.8%) |
| Education Instruction & Library | 0 (0.0%) | 15 (100.0%) |
| Arts, Media & Entertainment | 0 (0.0%) | 14 (100.0%) |
| Health Diagnosing & Treating | 91 (30.7%) | 205 (69.3%) |
| Health Technologists | 62 (35.4%) | 113 (64.6%) |
| Total (Category) | 316 (43.0%) | 418 (57.0%) |
| Total (Overall) | 896 (58.6%) | 634 (41.4%) |
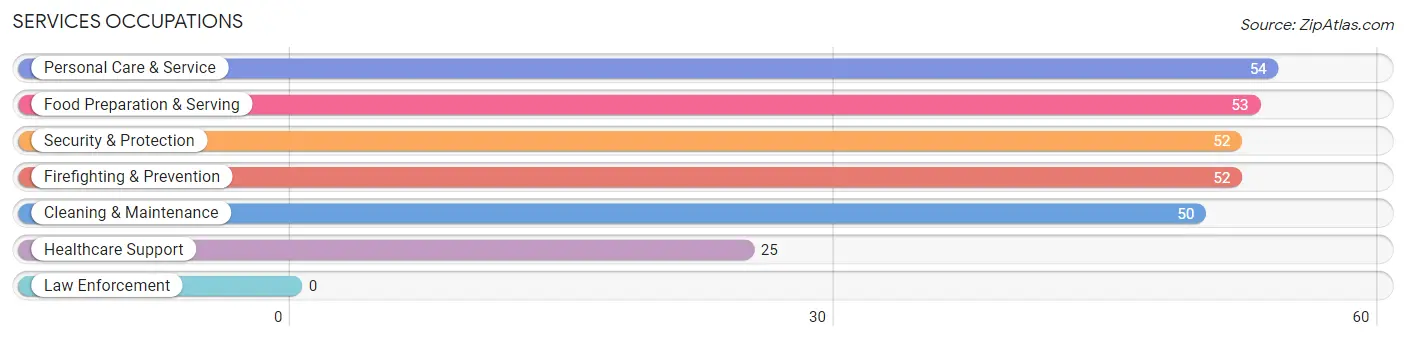
Services Occupations
The most common Services occupations in Cabana Colony are Personal Care & Service (54 | 3.5%), Food Preparation & Serving (53 | 3.5%), Security & Protection (52 | 3.4%), Firefighting & Prevention (52 | 3.4%), and Cleaning & Maintenance (50 | 3.3%).
Services Occupations by Sex
Within the Services occupations in Cabana Colony, the most male-oriented occupations are Healthcare Support (100.0%), Security & Protection (100.0%), and Firefighting & Prevention (100.0%), while the most female-oriented occupations are Personal Care & Service (100.0%), Food Preparation & Serving (66.0%), and Cleaning & Maintenance (62.0%).
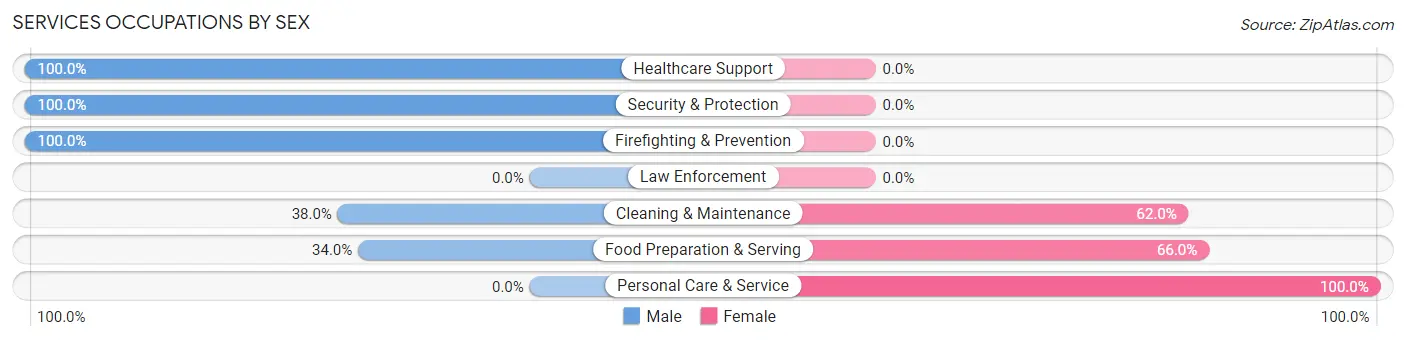
| Occupation | Male | Female |
| Healthcare Support | 25 (100.0%) | 0 (0.0%) |
| Security & Protection | 52 (100.0%) | 0 (0.0%) |
| Firefighting & Prevention | 52 (100.0%) | 0 (0.0%) |
| Law Enforcement | 0 (0.0%) | 0 (0.0%) |
| Food Preparation & Serving | 18 (34.0%) | 35 (66.0%) |
| Cleaning & Maintenance | 19 (38.0%) | 31 (62.0%) |
| Personal Care & Service | 0 (0.0%) | 54 (100.0%) |
| Total (Category) | 114 (48.7%) | 120 (51.3%) |
| Total (Overall) | 896 (58.6%) | 634 (41.4%) |
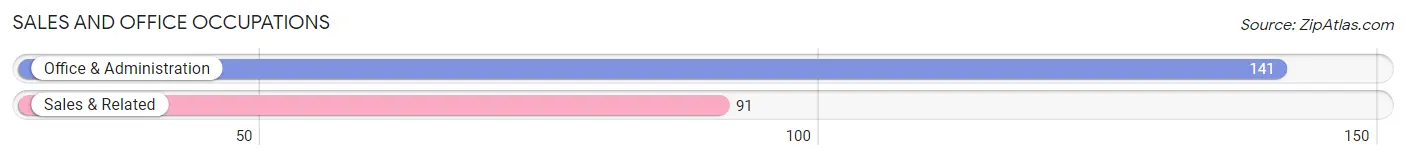
Sales and Office Occupations
The most common Sales and Office occupations in Cabana Colony are Office & Administration (141 | 9.2%), and Sales & Related (91 | 5.9%).
Sales and Office Occupations by Sex
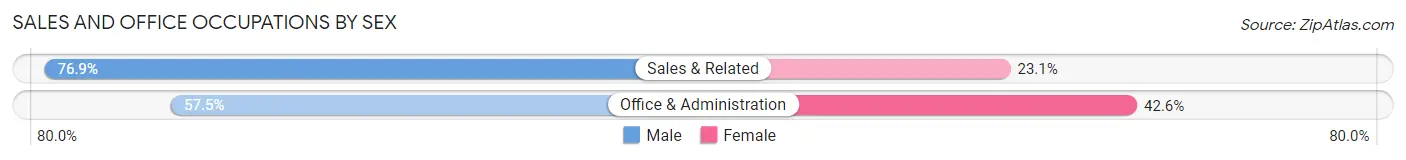
| Occupation | Male | Female |
| Sales & Related | 70 (76.9%) | 21 (23.1%) |
| Office & Administration | 81 (57.5%) | 60 (42.5%) |
| Total (Category) | 151 (65.1%) | 81 (34.9%) |
| Total (Overall) | 896 (58.6%) | 634 (41.4%) |
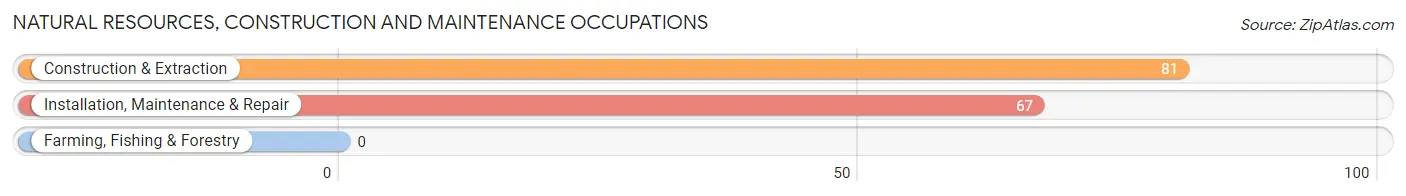
Natural Resources, Construction and Maintenance Occupations
The most common Natural Resources, Construction and Maintenance occupations in Cabana Colony are Construction & Extraction (81 | 5.3%), and Installation, Maintenance & Repair (67 | 4.4%).
Natural Resources, Construction and Maintenance Occupations by Sex
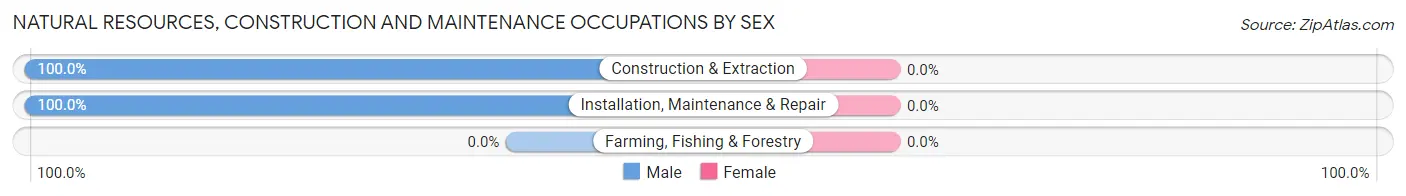
| Occupation | Male | Female |
| Farming, Fishing & Forestry | 0 (0.0%) | 0 (0.0%) |
| Construction & Extraction | 81 (100.0%) | 0 (0.0%) |
| Installation, Maintenance & Repair | 67 (100.0%) | 0 (0.0%) |
| Total (Category) | 148 (100.0%) | 0 (0.0%) |
| Total (Overall) | 896 (58.6%) | 634 (41.4%) |
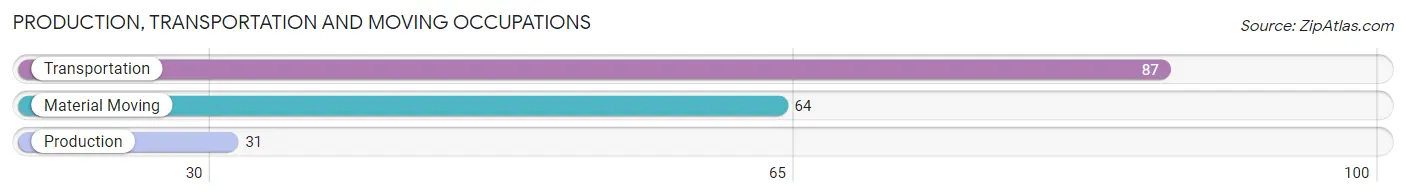
Production, Transportation and Moving Occupations
The most common Production, Transportation and Moving occupations in Cabana Colony are Transportation (87 | 5.7%), Material Moving (64 | 4.2%), and Production (31 | 2.0%).
Production, Transportation and Moving Occupations by Sex
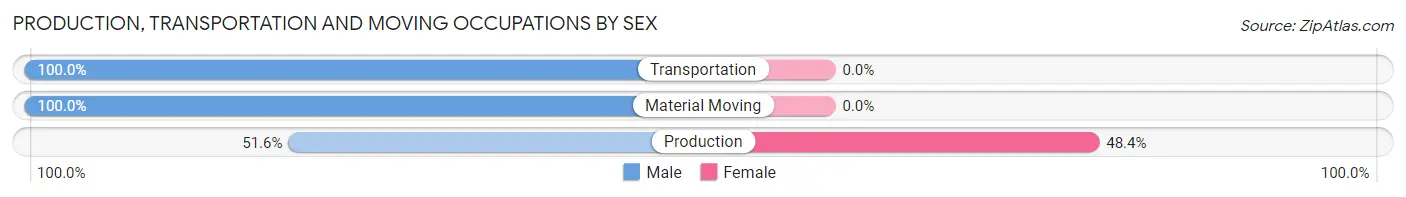
| Occupation | Male | Female |
| Production | 16 (51.6%) | 15 (48.4%) |
| Transportation | 87 (100.0%) | 0 (0.0%) |
| Material Moving | 64 (100.0%) | 0 (0.0%) |
| Total (Category) | 167 (91.8%) | 15 (8.2%) |
| Total (Overall) | 896 (58.6%) | 634 (41.4%) |
Employment Industries by Sex in Cabana Colony
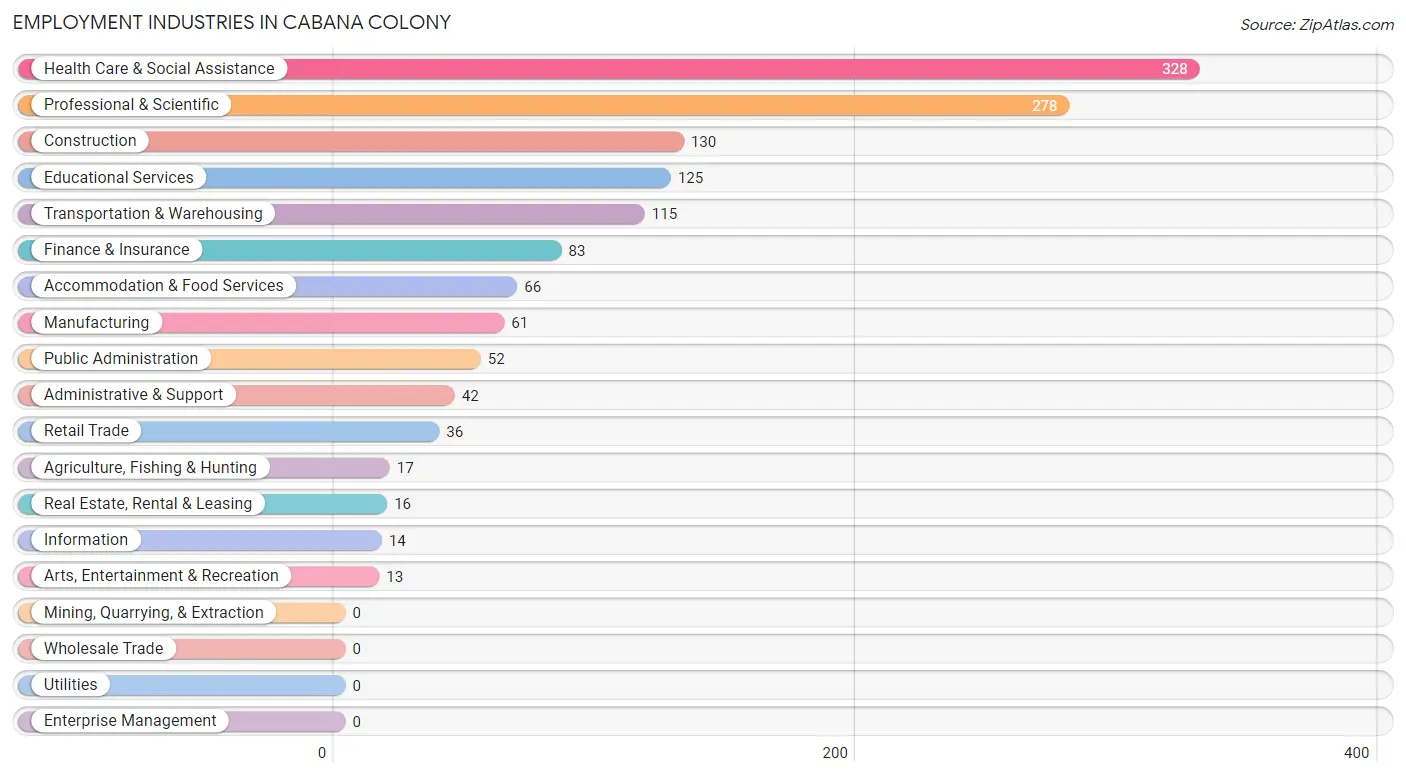
Employment Industries in Cabana Colony
The major employment industries in Cabana Colony include Health Care & Social Assistance (328 | 21.4%), Professional & Scientific (278 | 18.2%), Construction (130 | 8.5%), Educational Services (125 | 8.2%), and Transportation & Warehousing (115 | 7.5%).
Employment Industries by Sex in Cabana Colony
The Cabana Colony industries that see more men than women are Agriculture, Fishing & Hunting (100.0%), Construction (100.0%), and Transportation & Warehousing (100.0%), whereas the industries that tend to have a higher number of women are Retail Trade (100.0%), Information (100.0%), and Real Estate, Rental & Leasing (100.0%).
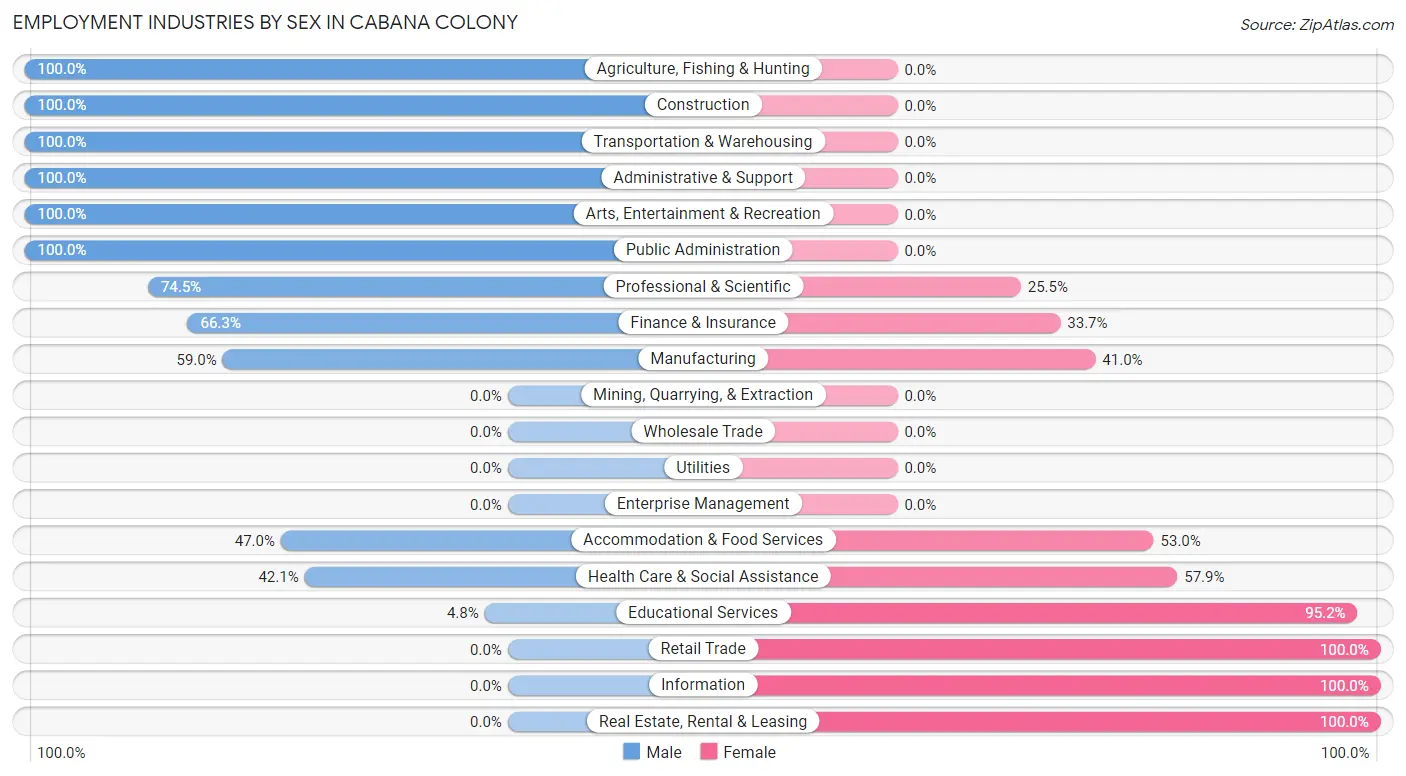
| Industry | Male | Female |
| Agriculture, Fishing & Hunting | 17 (100.0%) | 0 (0.0%) |
| Mining, Quarrying, & Extraction | 0 (0.0%) | 0 (0.0%) |
| Construction | 130 (100.0%) | 0 (0.0%) |
| Manufacturing | 36 (59.0%) | 25 (41.0%) |
| Wholesale Trade | 0 (0.0%) | 0 (0.0%) |
| Retail Trade | 0 (0.0%) | 36 (100.0%) |
| Transportation & Warehousing | 115 (100.0%) | 0 (0.0%) |
| Utilities | 0 (0.0%) | 0 (0.0%) |
| Information | 0 (0.0%) | 14 (100.0%) |
| Finance & Insurance | 55 (66.3%) | 28 (33.7%) |
| Real Estate, Rental & Leasing | 0 (0.0%) | 16 (100.0%) |
| Professional & Scientific | 207 (74.5%) | 71 (25.5%) |
| Enterprise Management | 0 (0.0%) | 0 (0.0%) |
| Administrative & Support | 42 (100.0%) | 0 (0.0%) |
| Educational Services | 6 (4.8%) | 119 (95.2%) |
| Health Care & Social Assistance | 138 (42.1%) | 190 (57.9%) |
| Arts, Entertainment & Recreation | 13 (100.0%) | 0 (0.0%) |
| Accommodation & Food Services | 31 (47.0%) | 35 (53.0%) |
| Public Administration | 52 (100.0%) | 0 (0.0%) |
| Total | 896 (58.6%) | 634 (41.4%) |
Education in Cabana Colony
School Enrollment in Cabana Colony
The most common levels of schooling among the 669 students in Cabana Colony are college / undergraduate (202 | 30.2%), elementary school (185 | 27.7%), and high school (137 | 20.5%).
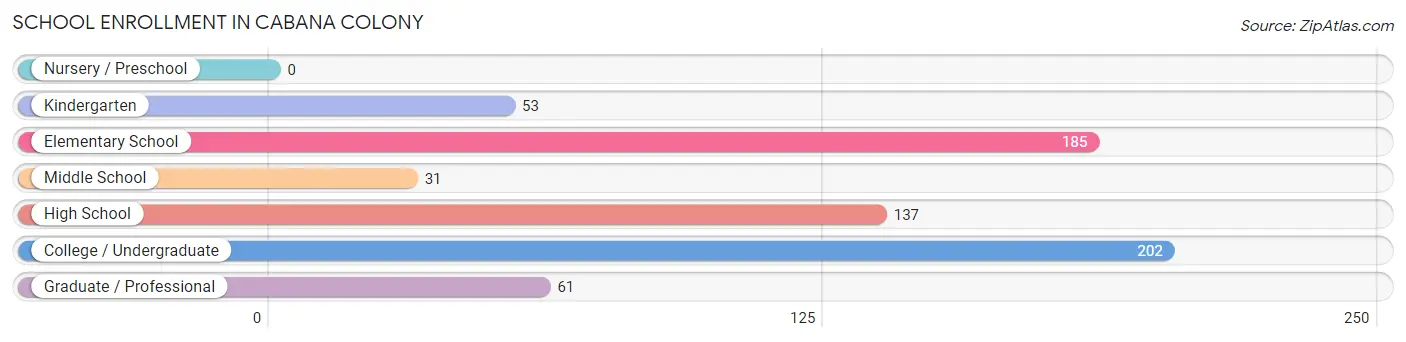
| School Level | # Students | % Students |
| Nursery / Preschool | 0 | 0.0% |
| Kindergarten | 53 | 7.9% |
| Elementary School | 185 | 27.7% |
| Middle School | 31 | 4.6% |
| High School | 137 | 20.5% |
| College / Undergraduate | 202 | 30.2% |
| Graduate / Professional | 61 | 9.1% |
| Total | 669 | 100.0% |
School Enrollment by Age by Funding Source in Cabana Colony
Out of a total of 669 students who are enrolled in schools in Cabana Colony, 89 (13.3%) attend a private institution, while the remaining 580 (86.7%) are enrolled in public schools. The age group of 35 years and over has the highest likelihood of being enrolled in private schools, with 42 (47.2% in the age bracket) enrolled. Conversely, the age group of 10 to 14 year olds has the lowest likelihood of being enrolled in a private school, with 142 (100.0% in the age bracket) attending a public institution.
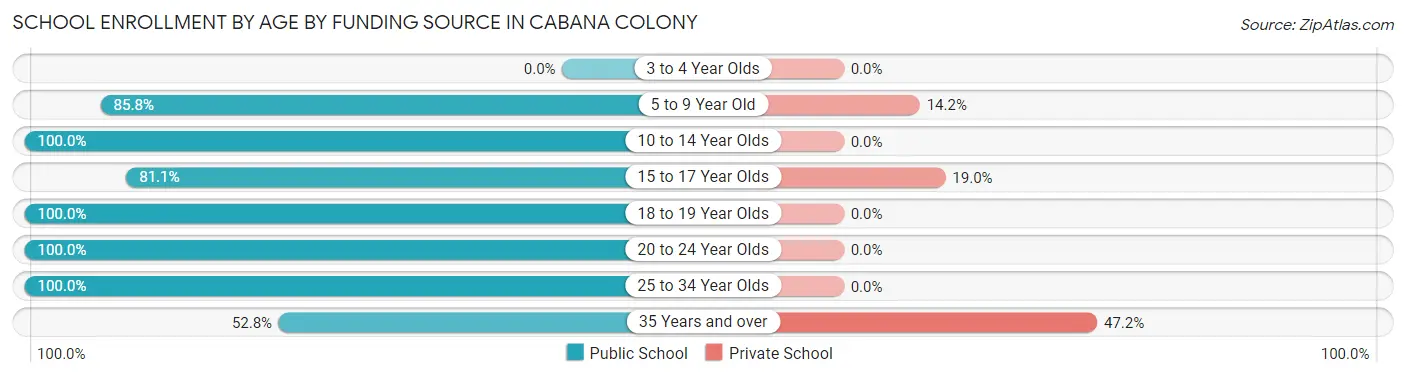
| Age Bracket | Public School | Private School |
| 3 to 4 Year Olds | 0 (0.0%) | 0 (0.0%) |
| 5 to 9 Year Old | 109 (85.8%) | 18 (14.2%) |
| 10 to 14 Year Olds | 142 (100.0%) | 0 (0.0%) |
| 15 to 17 Year Olds | 124 (81.0%) | 29 (19.0%) |
| 18 to 19 Year Olds | 48 (100.0%) | 0 (0.0%) |
| 20 to 24 Year Olds | 85 (100.0%) | 0 (0.0%) |
| 25 to 34 Year Olds | 25 (100.0%) | 0 (0.0%) |
| 35 Years and over | 47 (52.8%) | 42 (47.2%) |
| Total | 580 (86.7%) | 89 (13.3%) |
Educational Attainment by Field of Study in Cabana Colony
Business (246 | 47.9%), engineering (87 | 16.9%), computers & mathematics (67 | 13.0%), science & technology (43 | 8.4%), and education (36 | 7.0%) are the most common fields of study among 514 individuals in Cabana Colony who have obtained a bachelor's degree or higher.
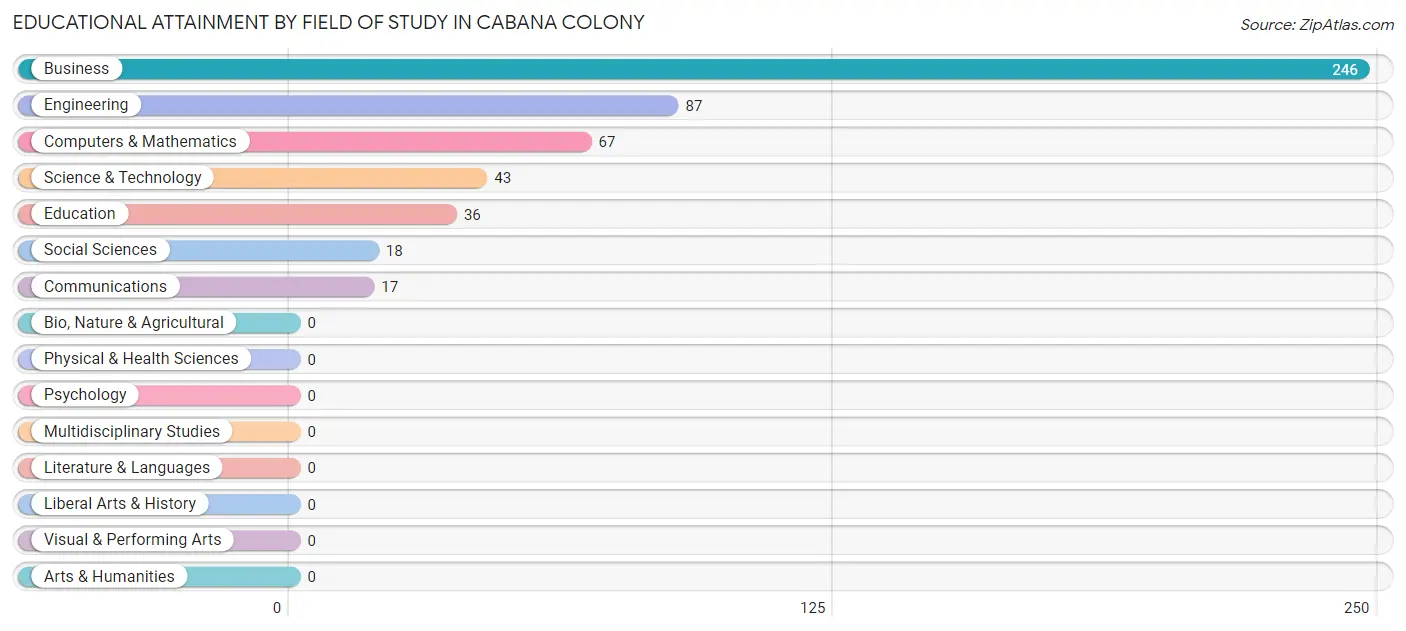
| Field of Study | # Graduates | % Graduates |
| Computers & Mathematics | 67 | 13.0% |
| Bio, Nature & Agricultural | 0 | 0.0% |
| Physical & Health Sciences | 0 | 0.0% |
| Psychology | 0 | 0.0% |
| Social Sciences | 18 | 3.5% |
| Engineering | 87 | 16.9% |
| Multidisciplinary Studies | 0 | 0.0% |
| Science & Technology | 43 | 8.4% |
| Business | 246 | 47.9% |
| Education | 36 | 7.0% |
| Literature & Languages | 0 | 0.0% |
| Liberal Arts & History | 0 | 0.0% |
| Visual & Performing Arts | 0 | 0.0% |
| Communications | 17 | 3.3% |
| Arts & Humanities | 0 | 0.0% |
| Total | 514 | 100.0% |
Transportation & Commute in Cabana Colony
Vehicle Availability by Sex in Cabana Colony
The most prevalent vehicle ownership categories in Cabana Colony are males with 1 vehicle (331, accounting for 40.4%) and females with 1 vehicle (122, making up 57.6%).
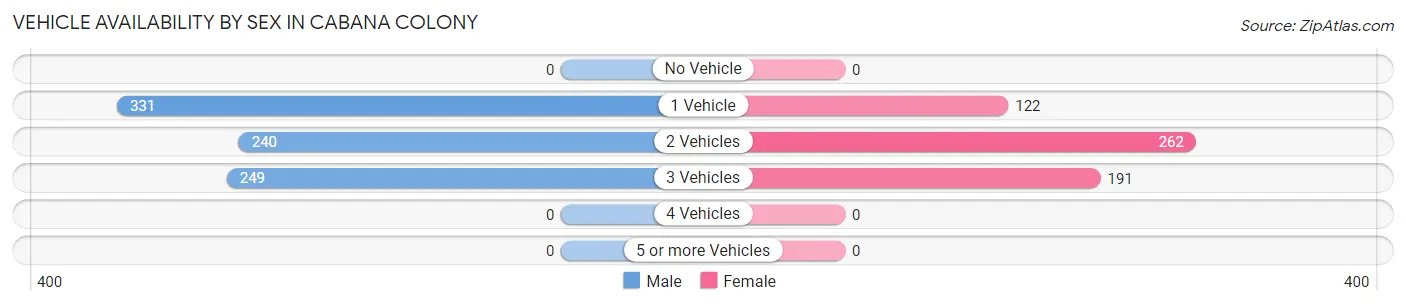
| Vehicles Available | Male | Female |
| No Vehicle | 0 (0.0%) | 0 (0.0%) |
| 1 Vehicle | 331 (40.4%) | 122 (21.2%) |
| 2 Vehicles | 240 (29.3%) | 262 (45.6%) |
| 3 Vehicles | 249 (30.4%) | 191 (33.2%) |
| 4 Vehicles | 0 (0.0%) | 0 (0.0%) |
| 5 or more Vehicles | 0 (0.0%) | 0 (0.0%) |
| Total | 820 (100.0%) | 575 (100.0%) |
Commute Time in Cabana Colony
The most frequently occuring commute durations in Cabana Colony are 15 to 19 minutes (373 commuters, 30.4%), 30 to 34 minutes (249 commuters, 20.3%), and 20 to 24 minutes (176 commuters, 14.4%).
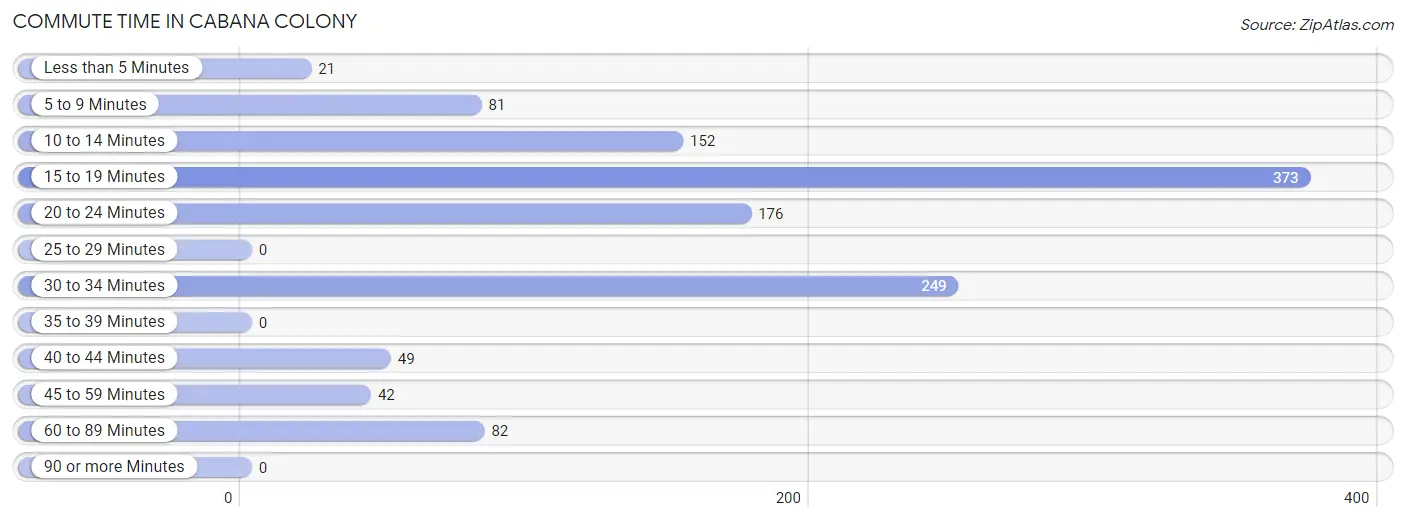
| Commute Time | # Commuters | % Commuters |
| Less than 5 Minutes | 21 | 1.7% |
| 5 to 9 Minutes | 81 | 6.6% |
| 10 to 14 Minutes | 152 | 12.4% |
| 15 to 19 Minutes | 373 | 30.4% |
| 20 to 24 Minutes | 176 | 14.4% |
| 25 to 29 Minutes | 0 | 0.0% |
| 30 to 34 Minutes | 249 | 20.3% |
| 35 to 39 Minutes | 0 | 0.0% |
| 40 to 44 Minutes | 49 | 4.0% |
| 45 to 59 Minutes | 42 | 3.4% |
| 60 to 89 Minutes | 82 | 6.7% |
| 90 or more Minutes | 0 | 0.0% |
Commute Time by Sex in Cabana Colony
The most common commute times in Cabana Colony are 15 to 19 minutes (244 commuters, 33.6%) for males and 15 to 19 minutes (129 commuters, 25.9%) for females.
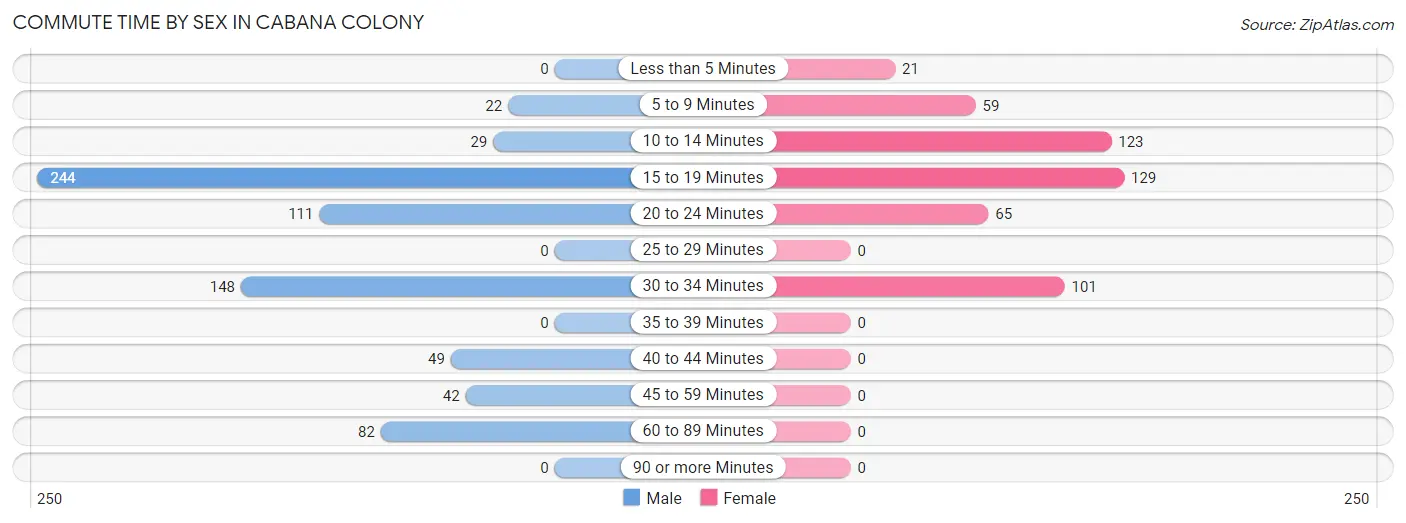
| Commute Time | Male | Female |
| Less than 5 Minutes | 0 (0.0%) | 21 (4.2%) |
| 5 to 9 Minutes | 22 (3.0%) | 59 (11.8%) |
| 10 to 14 Minutes | 29 (4.0%) | 123 (24.7%) |
| 15 to 19 Minutes | 244 (33.6%) | 129 (25.9%) |
| 20 to 24 Minutes | 111 (15.3%) | 65 (13.1%) |
| 25 to 29 Minutes | 0 (0.0%) | 0 (0.0%) |
| 30 to 34 Minutes | 148 (20.4%) | 101 (20.3%) |
| 35 to 39 Minutes | 0 (0.0%) | 0 (0.0%) |
| 40 to 44 Minutes | 49 (6.7%) | 0 (0.0%) |
| 45 to 59 Minutes | 42 (5.8%) | 0 (0.0%) |
| 60 to 89 Minutes | 82 (11.3%) | 0 (0.0%) |
| 90 or more Minutes | 0 (0.0%) | 0 (0.0%) |
Time of Departure to Work by Sex in Cabana Colony
The most frequent times of departure to work in Cabana Colony are 8:00 AM to 8:29 AM (235, 32.3%) for males and 8:30 AM to 8:59 AM (161, 32.3%) for females.
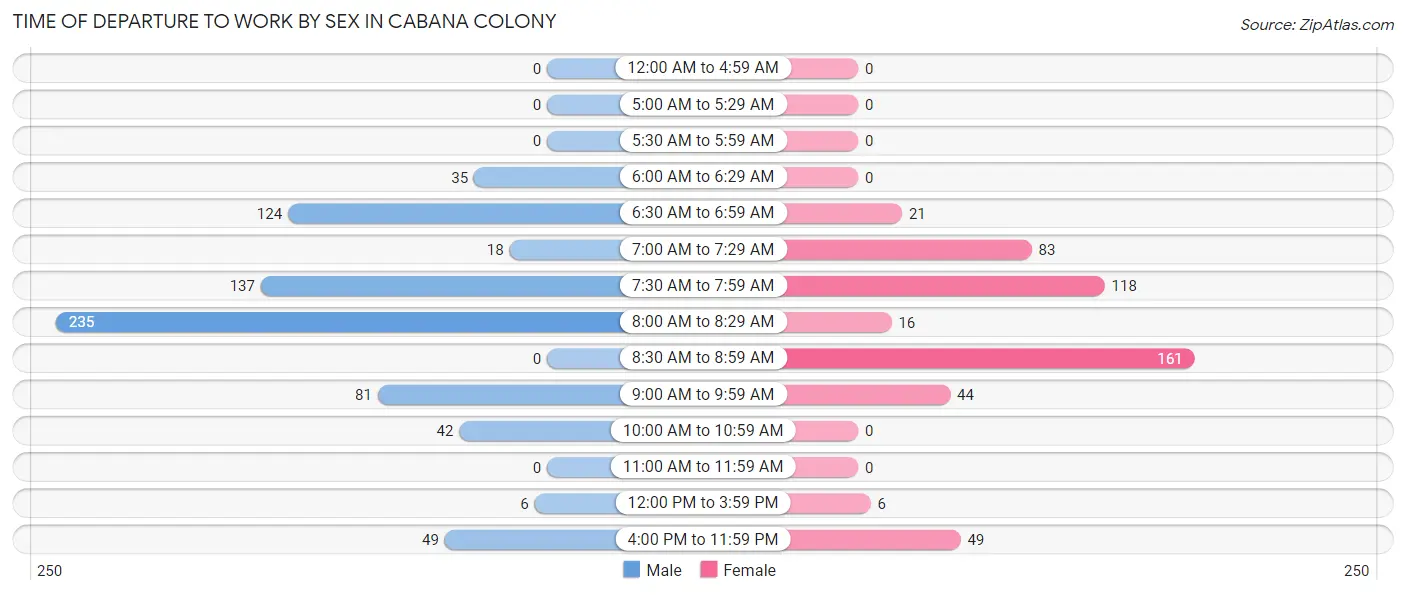
| Time of Departure | Male | Female |
| 12:00 AM to 4:59 AM | 0 (0.0%) | 0 (0.0%) |
| 5:00 AM to 5:29 AM | 0 (0.0%) | 0 (0.0%) |
| 5:30 AM to 5:59 AM | 0 (0.0%) | 0 (0.0%) |
| 6:00 AM to 6:29 AM | 35 (4.8%) | 0 (0.0%) |
| 6:30 AM to 6:59 AM | 124 (17.1%) | 21 (4.2%) |
| 7:00 AM to 7:29 AM | 18 (2.5%) | 83 (16.7%) |
| 7:30 AM to 7:59 AM | 137 (18.8%) | 118 (23.7%) |
| 8:00 AM to 8:29 AM | 235 (32.3%) | 16 (3.2%) |
| 8:30 AM to 8:59 AM | 0 (0.0%) | 161 (32.3%) |
| 9:00 AM to 9:59 AM | 81 (11.1%) | 44 (8.8%) |
| 10:00 AM to 10:59 AM | 42 (5.8%) | 0 (0.0%) |
| 11:00 AM to 11:59 AM | 0 (0.0%) | 0 (0.0%) |
| 12:00 PM to 3:59 PM | 6 (0.8%) | 6 (1.2%) |
| 4:00 PM to 11:59 PM | 49 (6.7%) | 49 (9.8%) |
| Total | 727 (100.0%) | 498 (100.0%) |
Housing Occupancy in Cabana Colony
Occupancy by Ownership in Cabana Colony
Of the total 899 dwellings in Cabana Colony, owner-occupied units account for 504 (56.1%), while renter-occupied units make up 395 (43.9%).
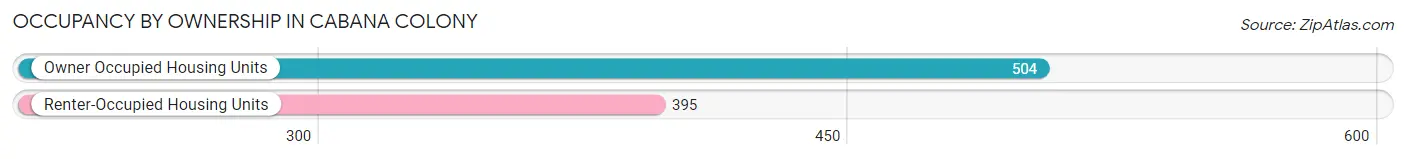
| Occupancy | # Housing Units | % Housing Units |
| Owner Occupied Housing Units | 504 | 56.1% |
| Renter-Occupied Housing Units | 395 | 43.9% |
| Total Occupied Housing Units | 899 | 100.0% |
Occupancy by Household Size in Cabana Colony
| Household Size | # Housing Units | % Housing Units |
| 1-Person Household | 270 | 30.0% |
| 2-Person Household | 141 | 15.7% |
| 3-Person Household | 327 | 36.4% |
| 4+ Person Household | 161 | 17.9% |
| Total Housing Units | 899 | 100.0% |
Occupancy by Ownership by Household Size in Cabana Colony
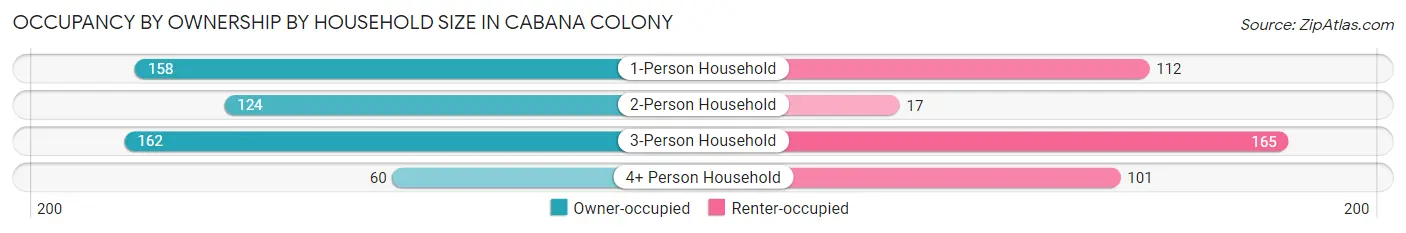
| Household Size | Owner-occupied | Renter-occupied |
| 1-Person Household | 158 (58.5%) | 112 (41.5%) |
| 2-Person Household | 124 (87.9%) | 17 (12.1%) |
| 3-Person Household | 162 (49.5%) | 165 (50.5%) |
| 4+ Person Household | 60 (37.3%) | 101 (62.7%) |
| Total Housing Units | 504 (56.1%) | 395 (43.9%) |
Occupancy by Educational Attainment in Cabana Colony
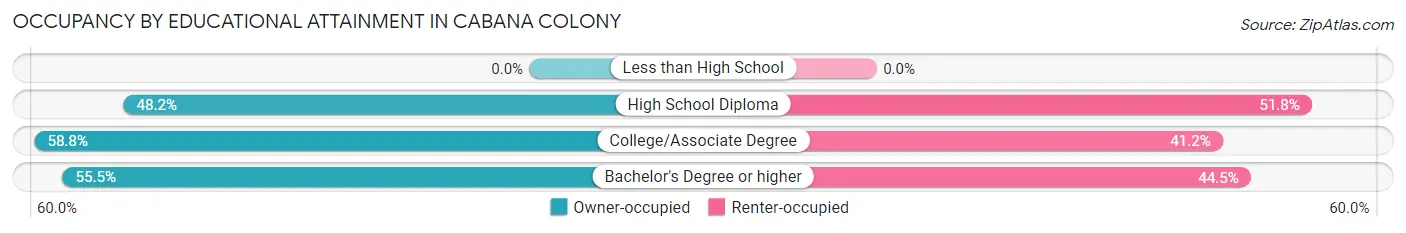
| Household Size | Owner-occupied | Renter-occupied |
| Less than High School | 0 (0.0%) | 0 (0.0%) |
| High School Diploma | 54 (48.2%) | 58 (51.8%) |
| College/Associate Degree | 237 (58.8%) | 166 (41.2%) |
| Bachelor's Degree or higher | 213 (55.5%) | 171 (44.5%) |
Occupancy by Age of Householder in Cabana Colony
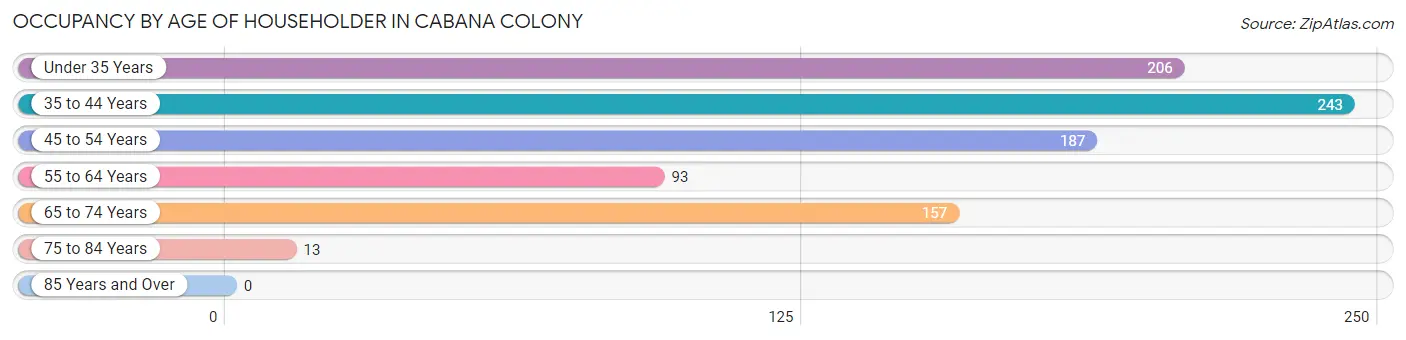
| Age Bracket | # Households | % Households |
| Under 35 Years | 206 | 22.9% |
| 35 to 44 Years | 243 | 27.0% |
| 45 to 54 Years | 187 | 20.8% |
| 55 to 64 Years | 93 | 10.3% |
| 65 to 74 Years | 157 | 17.5% |
| 75 to 84 Years | 13 | 1.5% |
| 85 Years and Over | 0 | 0.0% |
| Total | 899 | 100.0% |
Housing Finances in Cabana Colony
Median Income by Occupancy in Cabana Colony
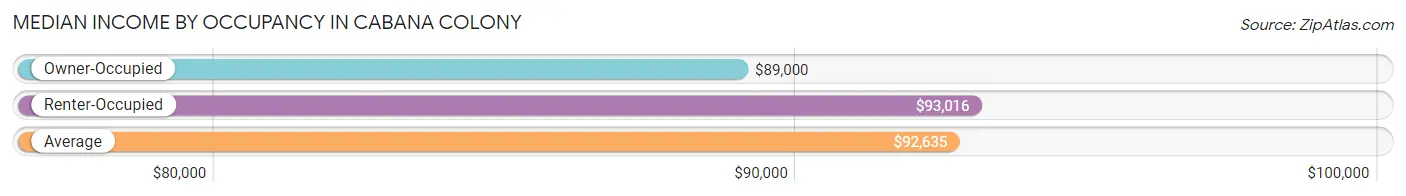
| Occupancy Type | # Households | Median Income |
| Owner-Occupied | 504 (56.1%) | $89,000 |
| Renter-Occupied | 395 (43.9%) | $93,016 |
| Average | 899 (100.0%) | $92,635 |
Occupancy by Householder Income Bracket in Cabana Colony
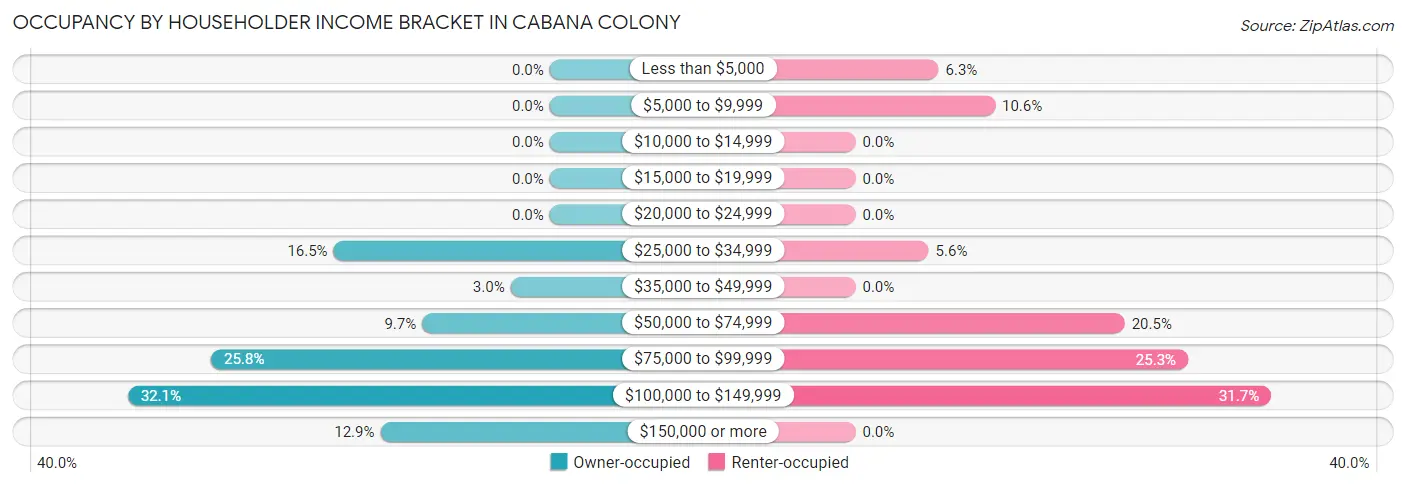
| Income Bracket | Owner-occupied | Renter-occupied |
| Less than $5,000 | 0 (0.0%) | 25 (6.3%) |
| $5,000 to $9,999 | 0 (0.0%) | 42 (10.6%) |
| $10,000 to $14,999 | 0 (0.0%) | 0 (0.0%) |
| $15,000 to $19,999 | 0 (0.0%) | 0 (0.0%) |
| $20,000 to $24,999 | 0 (0.0%) | 0 (0.0%) |
| $25,000 to $34,999 | 83 (16.5%) | 22 (5.6%) |
| $35,000 to $49,999 | 15 (3.0%) | 0 (0.0%) |
| $50,000 to $74,999 | 49 (9.7%) | 81 (20.5%) |
| $75,000 to $99,999 | 130 (25.8%) | 100 (25.3%) |
| $100,000 to $149,999 | 162 (32.1%) | 125 (31.7%) |
| $150,000 or more | 65 (12.9%) | 0 (0.0%) |
| Total | 504 (100.0%) | 395 (100.0%) |
Monthly Housing Cost Tiers in Cabana Colony
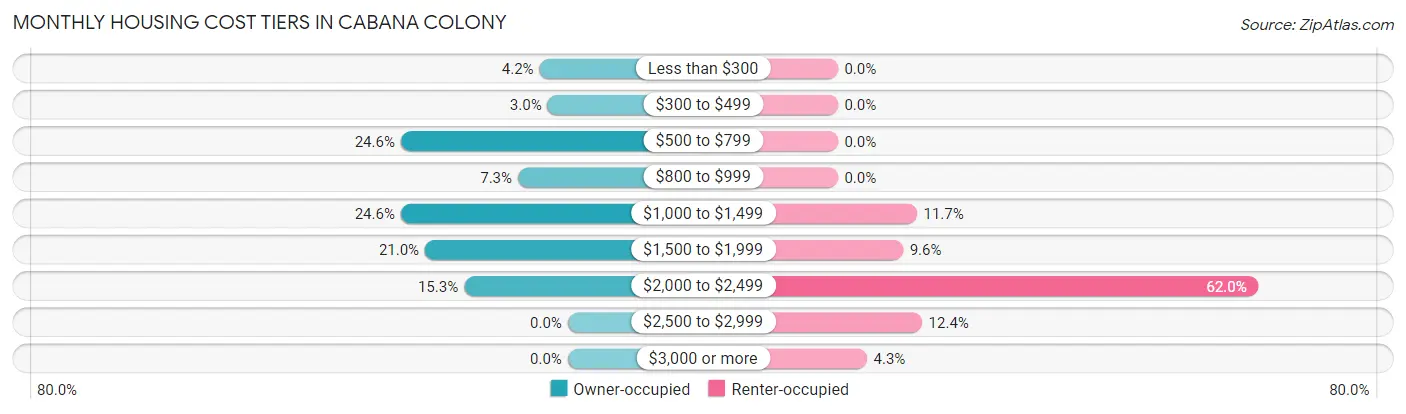
| Monthly Cost | Owner-occupied | Renter-occupied |
| Less than $300 | 21 (4.2%) | 0 (0.0%) |
| $300 to $499 | 15 (3.0%) | 0 (0.0%) |
| $500 to $799 | 124 (24.6%) | 0 (0.0%) |
| $800 to $999 | 37 (7.3%) | 0 (0.0%) |
| $1,000 to $1,499 | 124 (24.6%) | 46 (11.7%) |
| $1,500 to $1,999 | 106 (21.0%) | 38 (9.6%) |
| $2,000 to $2,499 | 77 (15.3%) | 245 (62.0%) |
| $2,500 to $2,999 | 0 (0.0%) | 49 (12.4%) |
| $3,000 or more | 0 (0.0%) | 17 (4.3%) |
| Total | 504 (100.0%) | 395 (100.0%) |
Physical Housing Characteristics in Cabana Colony
Housing Structures in Cabana Colony
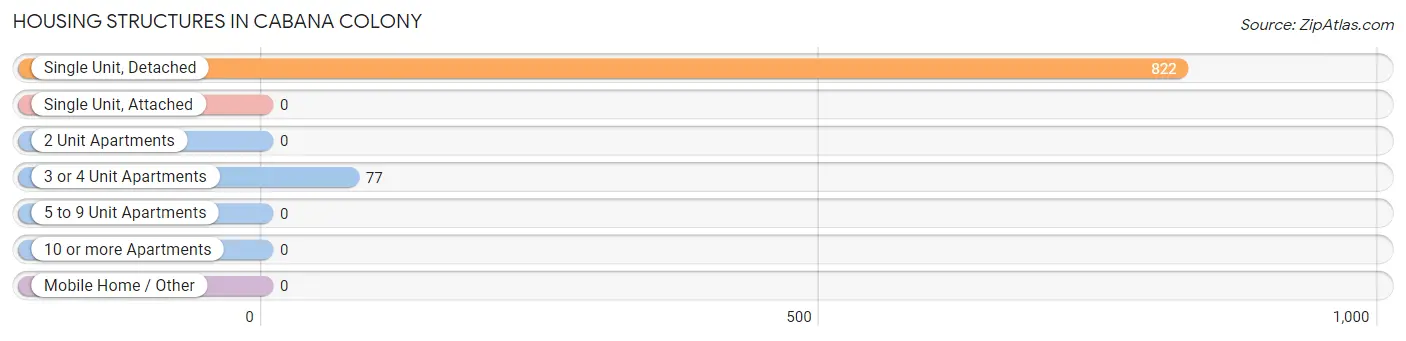
| Structure Type | # Housing Units | % Housing Units |
| Single Unit, Detached | 822 | 91.4% |
| Single Unit, Attached | 0 | 0.0% |
| 2 Unit Apartments | 0 | 0.0% |
| 3 or 4 Unit Apartments | 77 | 8.6% |
| 5 to 9 Unit Apartments | 0 | 0.0% |
| 10 or more Apartments | 0 | 0.0% |
| Mobile Home / Other | 0 | 0.0% |
| Total | 899 | 100.0% |
Housing Structures by Occupancy in Cabana Colony
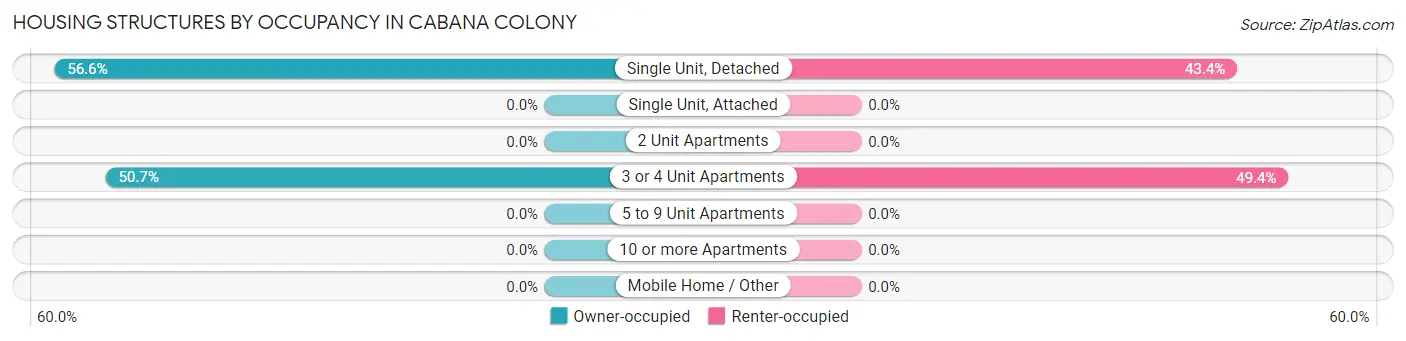
| Structure Type | Owner-occupied | Renter-occupied |
| Single Unit, Detached | 465 (56.6%) | 357 (43.4%) |
| Single Unit, Attached | 0 (0.0%) | 0 (0.0%) |
| 2 Unit Apartments | 0 (0.0%) | 0 (0.0%) |
| 3 or 4 Unit Apartments | 39 (50.6%) | 38 (49.3%) |
| 5 to 9 Unit Apartments | 0 (0.0%) | 0 (0.0%) |
| 10 or more Apartments | 0 (0.0%) | 0 (0.0%) |
| Mobile Home / Other | 0 (0.0%) | 0 (0.0%) |
| Total | 504 (56.1%) | 395 (43.9%) |
Housing Structures by Number of Rooms in Cabana Colony
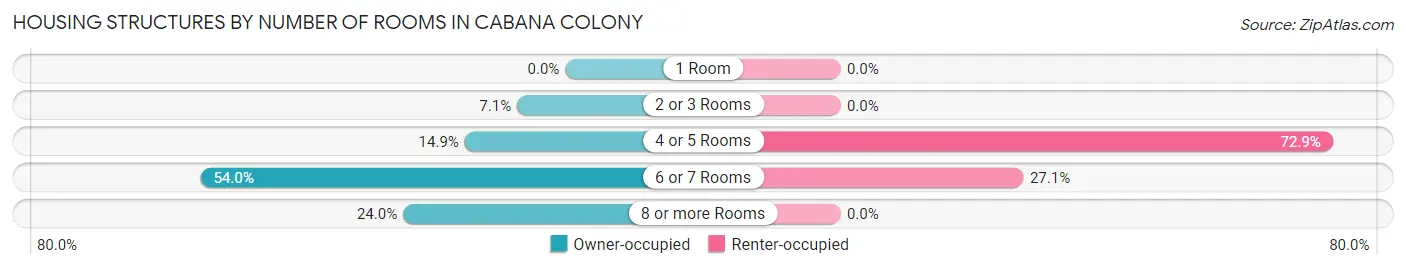
| Number of Rooms | Owner-occupied | Renter-occupied |
| 1 Room | 0 (0.0%) | 0 (0.0%) |
| 2 or 3 Rooms | 36 (7.1%) | 0 (0.0%) |
| 4 or 5 Rooms | 75 (14.9%) | 288 (72.9%) |
| 6 or 7 Rooms | 272 (54.0%) | 107 (27.1%) |
| 8 or more Rooms | 121 (24.0%) | 0 (0.0%) |
| Total | 504 (100.0%) | 395 (100.0%) |
Housing Structure by Heating Type in Cabana Colony
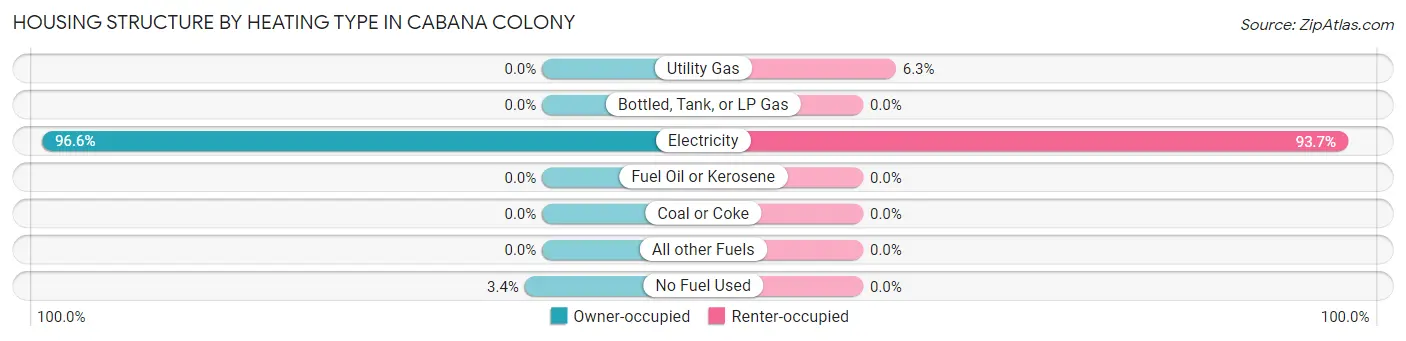
| Heating Type | Owner-occupied | Renter-occupied |
| Utility Gas | 0 (0.0%) | 25 (6.3%) |
| Bottled, Tank, or LP Gas | 0 (0.0%) | 0 (0.0%) |
| Electricity | 487 (96.6%) | 370 (93.7%) |
| Fuel Oil or Kerosene | 0 (0.0%) | 0 (0.0%) |
| Coal or Coke | 0 (0.0%) | 0 (0.0%) |
| All other Fuels | 0 (0.0%) | 0 (0.0%) |
| No Fuel Used | 17 (3.4%) | 0 (0.0%) |
| Total | 504 (100.0%) | 395 (100.0%) |
Household Vehicle Usage in Cabana Colony
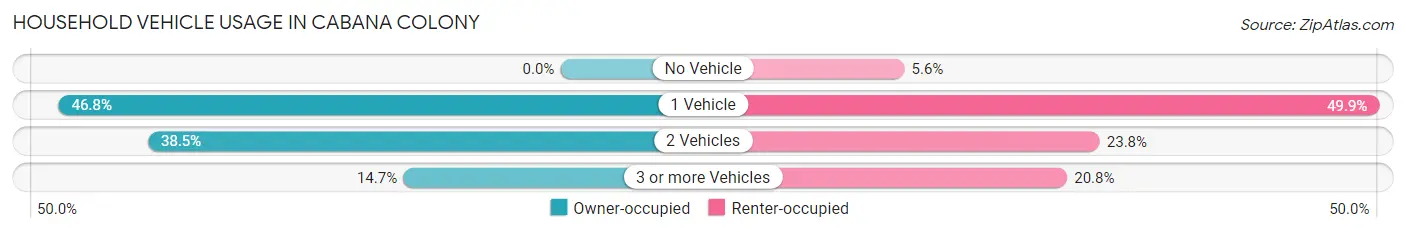
| Vehicles per Household | Owner-occupied | Renter-occupied |
| No Vehicle | 0 (0.0%) | 22 (5.6%) |
| 1 Vehicle | 236 (46.8%) | 197 (49.9%) |
| 2 Vehicles | 194 (38.5%) | 94 (23.8%) |
| 3 or more Vehicles | 74 (14.7%) | 82 (20.8%) |
| Total | 504 (100.0%) | 395 (100.0%) |
Real Estate & Mortgages in Cabana Colony
Real Estate and Mortgage Overview in Cabana Colony
| Characteristic | Without Mortgage | With Mortgage |
| Housing Units | 227 | 277 |
| Median Property Value | $415,300 | $325,400 |
| Median Household Income | - | - |
| Monthly Housing Costs | $572 | $0 |
| Real Estate Taxes | $2,752 | $16 |
Property Value by Mortgage Status in Cabana Colony
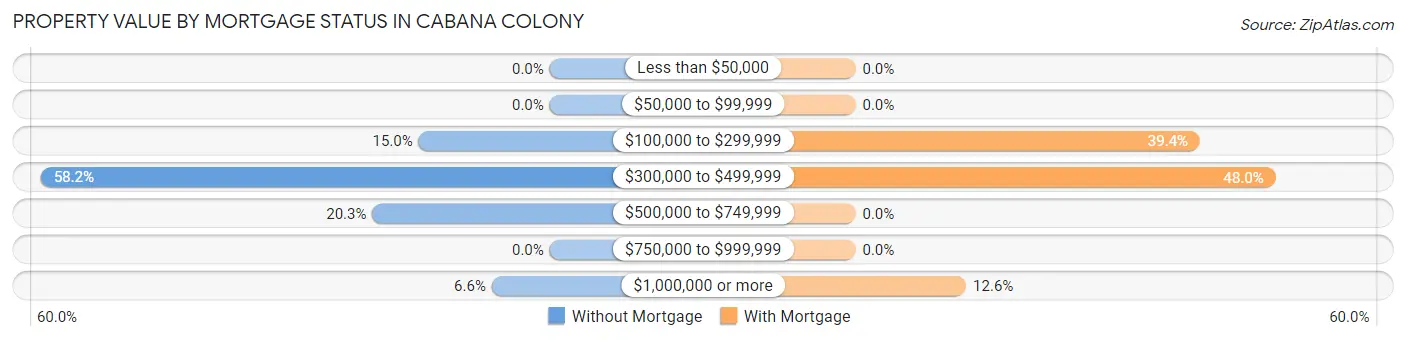
| Property Value | Without Mortgage | With Mortgage |
| Less than $50,000 | 0 (0.0%) | 0 (0.0%) |
| $50,000 to $99,999 | 0 (0.0%) | 0 (0.0%) |
| $100,000 to $299,999 | 34 (15.0%) | 109 (39.4%) |
| $300,000 to $499,999 | 132 (58.2%) | 133 (48.0%) |
| $500,000 to $749,999 | 46 (20.3%) | 0 (0.0%) |
| $750,000 to $999,999 | 0 (0.0%) | 0 (0.0%) |
| $1,000,000 or more | 15 (6.6%) | 35 (12.6%) |
| Total | 227 (100.0%) | 277 (100.0%) |
Household Income by Mortgage Status in Cabana Colony
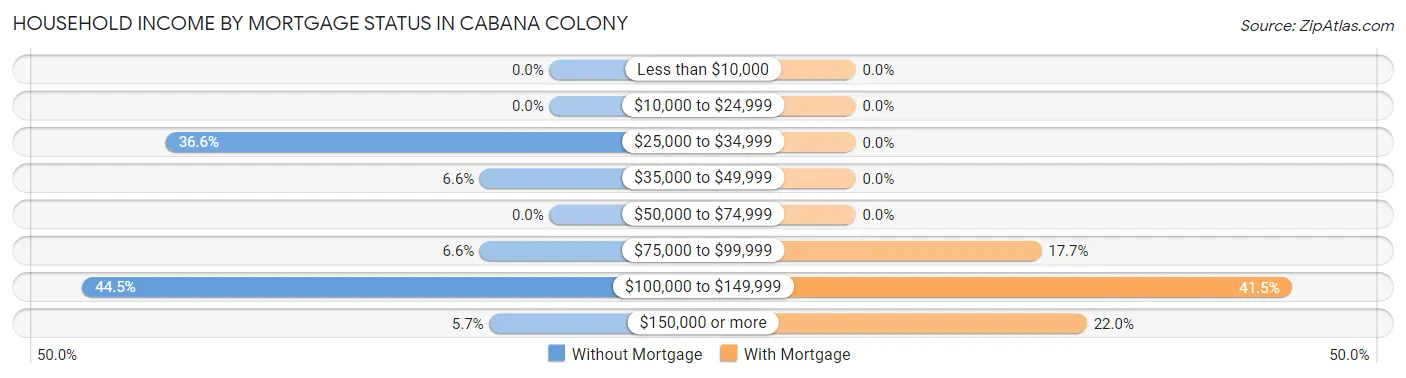
| Household Income | Without Mortgage | With Mortgage |
| Less than $10,000 | 0 (0.0%) | 0 (0.0%) |
| $10,000 to $24,999 | 0 (0.0%) | 0 (0.0%) |
| $25,000 to $34,999 | 83 (36.6%) | 0 (0.0%) |
| $35,000 to $49,999 | 15 (6.6%) | 0 (0.0%) |
| $50,000 to $74,999 | 0 (0.0%) | 0 (0.0%) |
| $75,000 to $99,999 | 15 (6.6%) | 49 (17.7%) |
| $100,000 to $149,999 | 101 (44.5%) | 115 (41.5%) |
| $150,000 or more | 13 (5.7%) | 61 (22.0%) |
| Total | 227 (100.0%) | 277 (100.0%) |
Property Value to Household Income Ratio in Cabana Colony
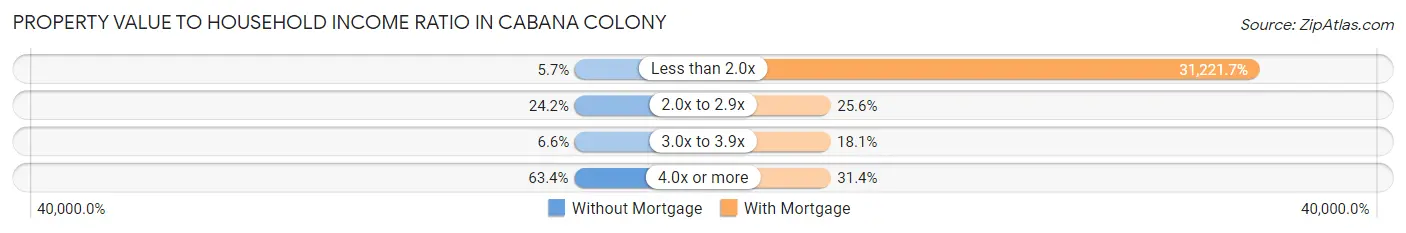
| Value-to-Income Ratio | Without Mortgage | With Mortgage |
| Less than 2.0x | 13 (5.7%) | 86,484 (31,221.7%) |
| 2.0x to 2.9x | 55 (24.2%) | 71 (25.6%) |
| 3.0x to 3.9x | 15 (6.6%) | 50 (18.0%) |
| 4.0x or more | 144 (63.4%) | 87 (31.4%) |
| Total | 227 (100.0%) | 277 (100.0%) |
Real Estate Taxes by Mortgage Status in Cabana Colony
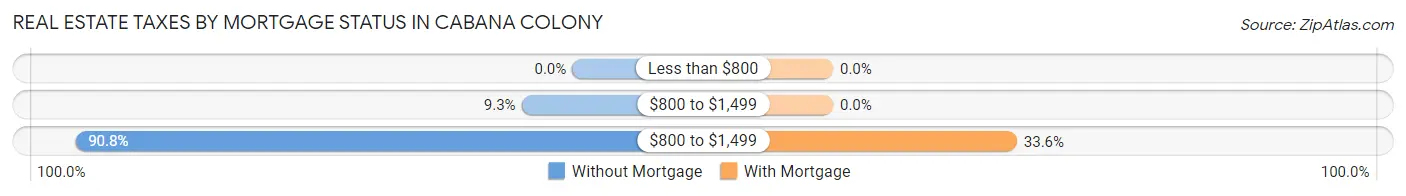
| Property Taxes | Without Mortgage | With Mortgage |
| Less than $800 | 0 (0.0%) | 0 (0.0%) |
| $800 to $1,499 | 21 (9.2%) | 0 (0.0%) |
| $800 to $1,499 | 206 (90.7%) | 93 (33.6%) |
| Total | 227 (100.0%) | 277 (100.0%) |
Health & Disability in Cabana Colony
Health Insurance Coverage by Age in Cabana Colony
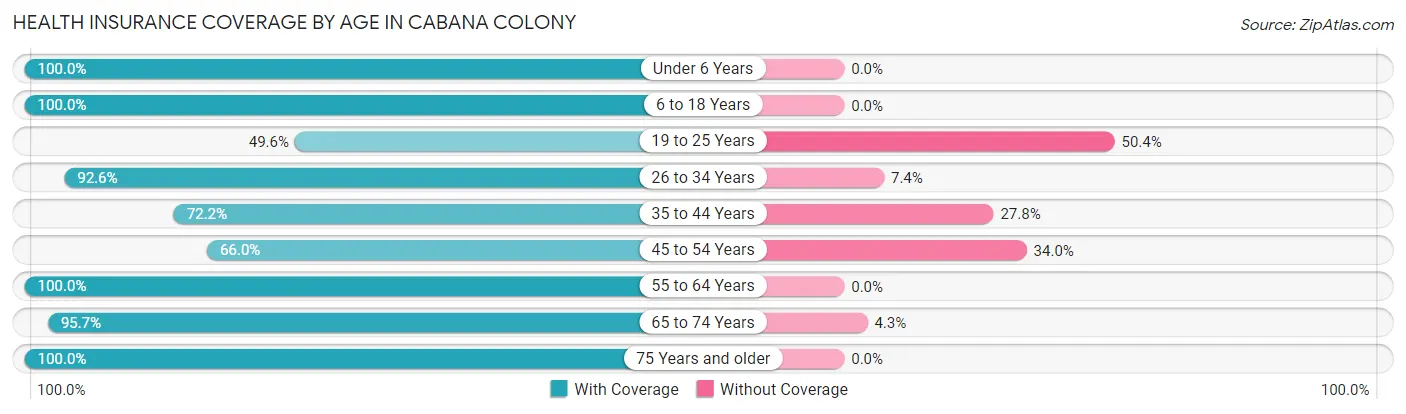
| Age Bracket | With Coverage | Without Coverage |
| Under 6 Years | 314 (100.0%) | 0 (0.0%) |
| 6 to 18 Years | 417 (100.0%) | 0 (0.0%) |
| 19 to 25 Years | 63 (49.6%) | 64 (50.4%) |
| 26 to 34 Years | 450 (92.6%) | 36 (7.4%) |
| 35 to 44 Years | 301 (72.2%) | 116 (27.8%) |
| 45 to 54 Years | 163 (66.0%) | 84 (34.0%) |
| 55 to 64 Years | 120 (100.0%) | 0 (0.0%) |
| 65 to 74 Years | 177 (95.7%) | 8 (4.3%) |
| 75 Years and older | 21 (100.0%) | 0 (0.0%) |
| Total | 2,026 (86.8%) | 308 (13.2%) |
Health Insurance Coverage by Citizenship Status in Cabana Colony
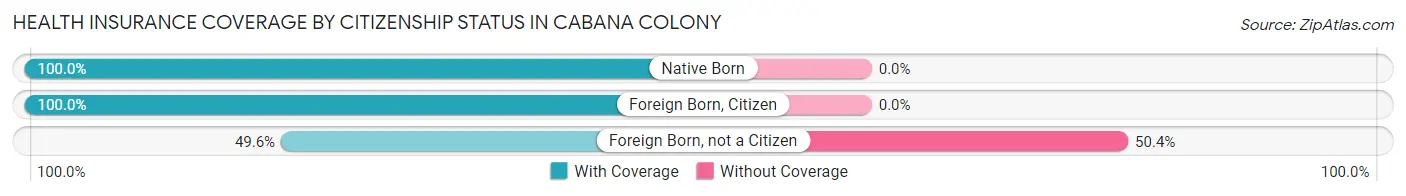
| Citizenship Status | With Coverage | Without Coverage |
| Native Born | 314 (100.0%) | 0 (0.0%) |
| Foreign Born, Citizen | 417 (100.0%) | 0 (0.0%) |
| Foreign Born, not a Citizen | 63 (49.6%) | 64 (50.4%) |
Health Insurance Coverage by Household Income in Cabana Colony
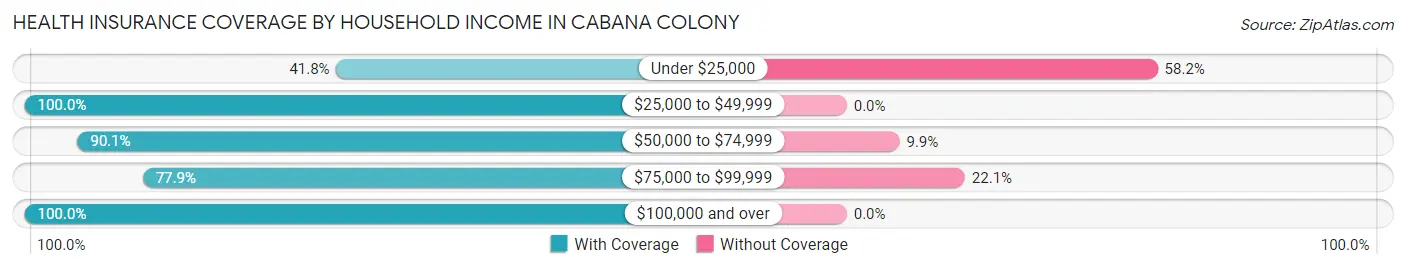
| Household Income | With Coverage | Without Coverage |
| Under $25,000 | 76 (41.8%) | 106 (58.2%) |
| $25,000 to $49,999 | 219 (100.0%) | 0 (0.0%) |
| $50,000 to $74,999 | 383 (90.1%) | 42 (9.9%) |
| $75,000 to $99,999 | 563 (77.9%) | 160 (22.1%) |
| $100,000 and over | 785 (100.0%) | 0 (0.0%) |
Public vs Private Health Insurance Coverage by Age in Cabana Colony
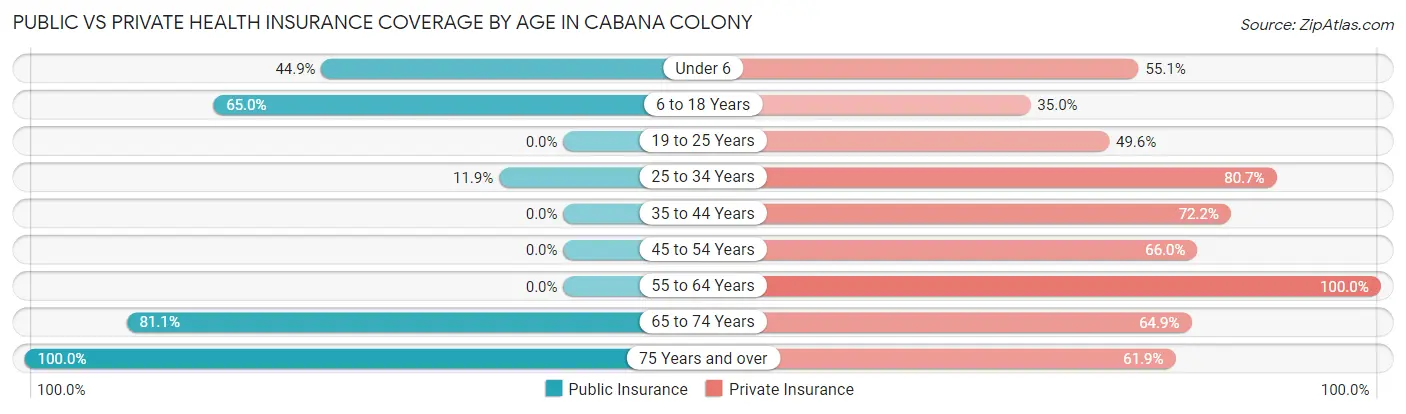
| Age Bracket | Public Insurance | Private Insurance |
| Under 6 | 141 (44.9%) | 173 (55.1%) |
| 6 to 18 Years | 271 (65.0%) | 146 (35.0%) |
| 19 to 25 Years | 0 (0.0%) | 63 (49.6%) |
| 25 to 34 Years | 58 (11.9%) | 392 (80.7%) |
| 35 to 44 Years | 0 (0.0%) | 301 (72.2%) |
| 45 to 54 Years | 0 (0.0%) | 163 (66.0%) |
| 55 to 64 Years | 0 (0.0%) | 120 (100.0%) |
| 65 to 74 Years | 150 (81.1%) | 120 (64.9%) |
| 75 Years and over | 21 (100.0%) | 13 (61.9%) |
| Total | 641 (27.5%) | 1,491 (63.9%) |
Disability Status by Sex by Age in Cabana Colony
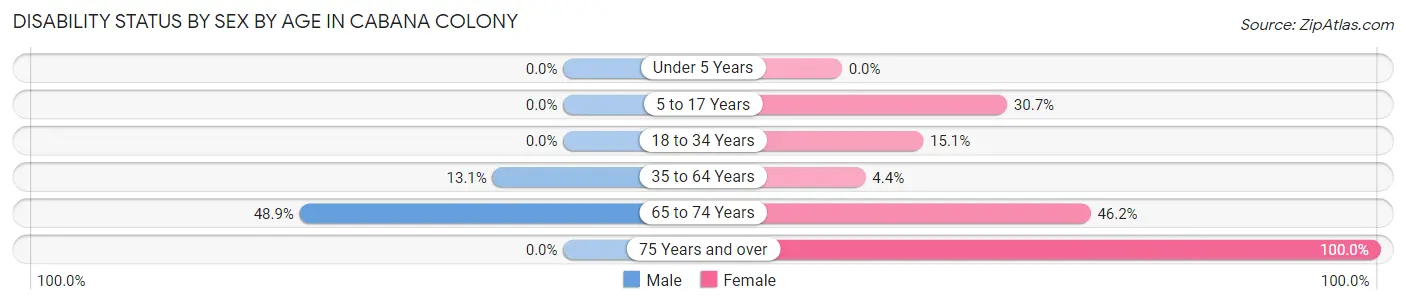
| Age Bracket | Male | Female |
| Under 5 Years | 0 (0.0%) | 0 (0.0%) |
| 5 to 17 Years | 0 (0.0%) | 61 (30.6%) |
| 18 to 34 Years | 0 (0.0%) | 35 (15.1%) |
| 35 to 64 Years | 52 (13.1%) | 17 (4.4%) |
| 65 to 74 Years | 46 (48.9%) | 42 (46.2%) |
| 75 Years and over | 0 (0.0%) | 8 (100.0%) |
Disability Class by Sex by Age in Cabana Colony
Disability Class: Hearing Difficulty
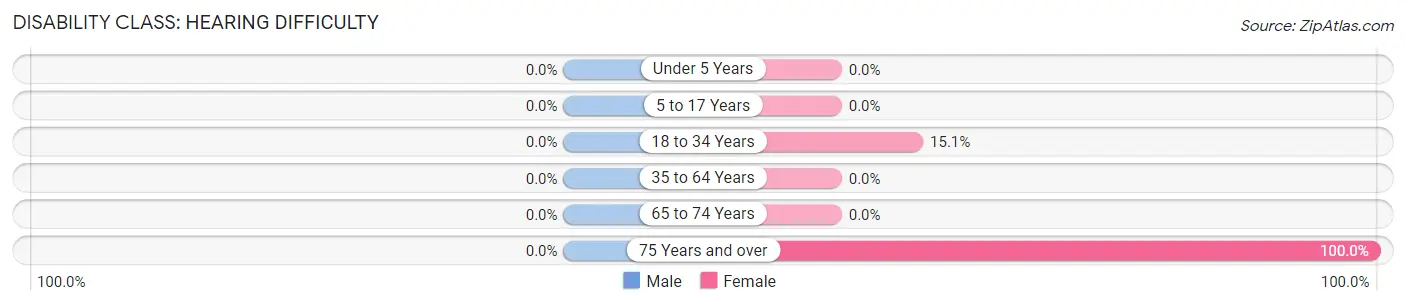
| Age Bracket | Male | Female |
| Under 5 Years | 0 (0.0%) | 0 (0.0%) |
| 5 to 17 Years | 0 (0.0%) | 0 (0.0%) |
| 18 to 34 Years | 0 (0.0%) | 35 (15.1%) |
| 35 to 64 Years | 0 (0.0%) | 0 (0.0%) |
| 65 to 74 Years | 0 (0.0%) | 0 (0.0%) |
| 75 Years and over | 0 (0.0%) | 8 (100.0%) |
Disability Class: Vision Difficulty
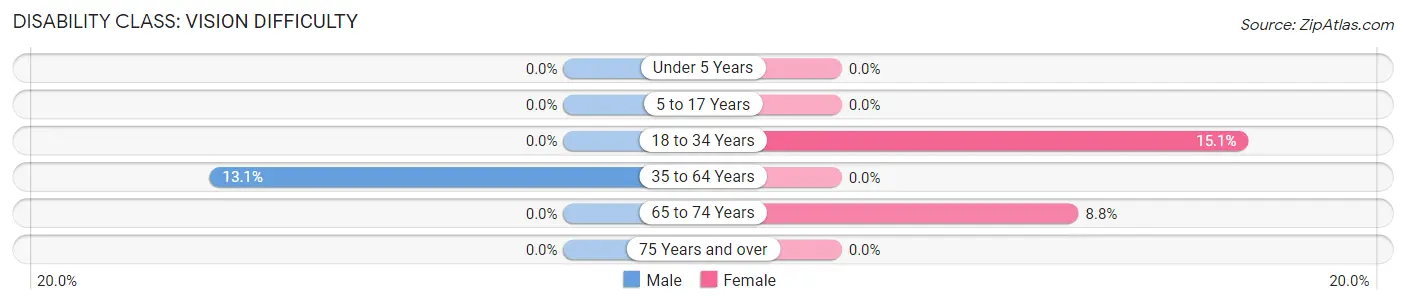
| Age Bracket | Male | Female |
| Under 5 Years | 0 (0.0%) | 0 (0.0%) |
| 5 to 17 Years | 0 (0.0%) | 0 (0.0%) |
| 18 to 34 Years | 0 (0.0%) | 35 (15.1%) |
| 35 to 64 Years | 52 (13.1%) | 0 (0.0%) |
| 65 to 74 Years | 0 (0.0%) | 8 (8.8%) |
| 75 Years and over | 0 (0.0%) | 0 (0.0%) |
Disability Class: Cognitive Difficulty
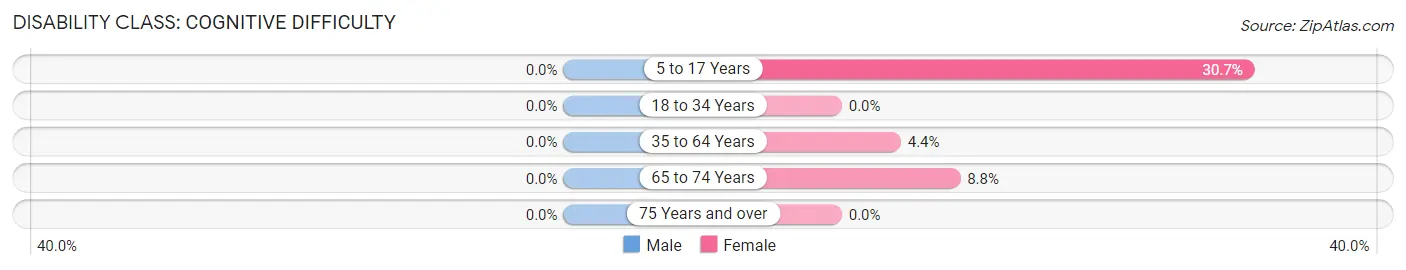
| Age Bracket | Male | Female |
| 5 to 17 Years | 0 (0.0%) | 61 (30.6%) |
| 18 to 34 Years | 0 (0.0%) | 0 (0.0%) |
| 35 to 64 Years | 0 (0.0%) | 17 (4.4%) |
| 65 to 74 Years | 0 (0.0%) | 8 (8.8%) |
| 75 Years and over | 0 (0.0%) | 0 (0.0%) |
Disability Class: Ambulatory Difficulty
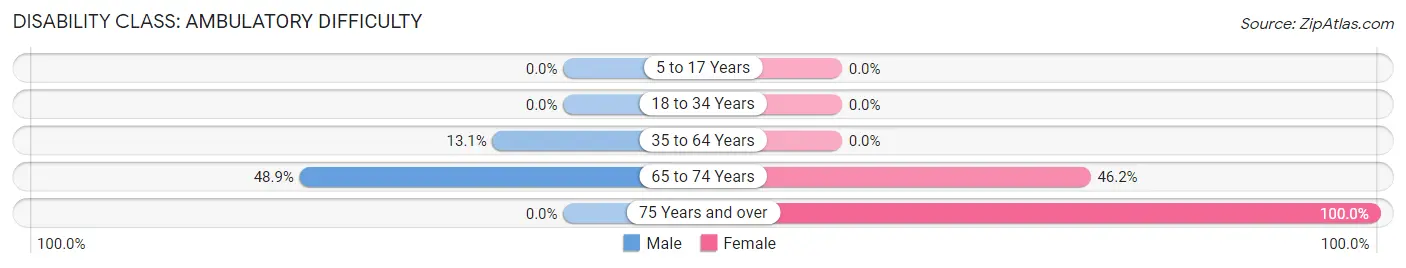
| Age Bracket | Male | Female |
| 5 to 17 Years | 0 (0.0%) | 0 (0.0%) |
| 18 to 34 Years | 0 (0.0%) | 0 (0.0%) |
| 35 to 64 Years | 52 (13.1%) | 0 (0.0%) |
| 65 to 74 Years | 46 (48.9%) | 42 (46.2%) |
| 75 Years and over | 0 (0.0%) | 8 (100.0%) |
Disability Class: Self-Care Difficulty
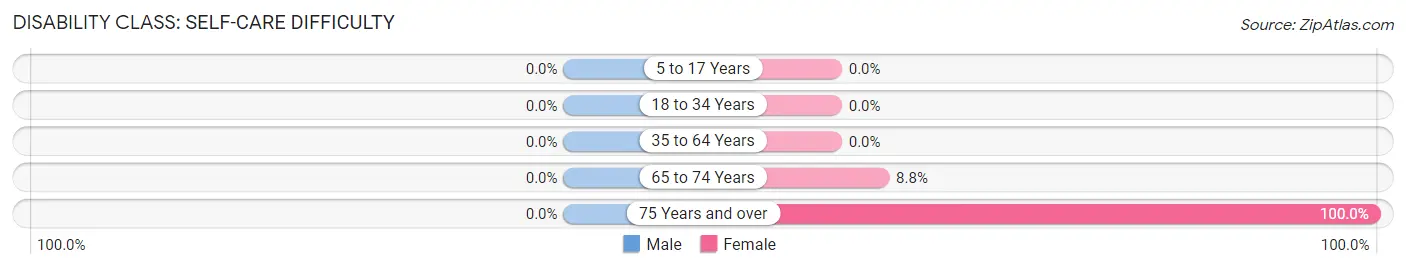
| Age Bracket | Male | Female |
| 5 to 17 Years | 0 (0.0%) | 0 (0.0%) |
| 18 to 34 Years | 0 (0.0%) | 0 (0.0%) |
| 35 to 64 Years | 0 (0.0%) | 0 (0.0%) |
| 65 to 74 Years | 0 (0.0%) | 8 (8.8%) |
| 75 Years and over | 0 (0.0%) | 8 (100.0%) |
Technology Access in Cabana Colony
Computing Device Access in Cabana Colony
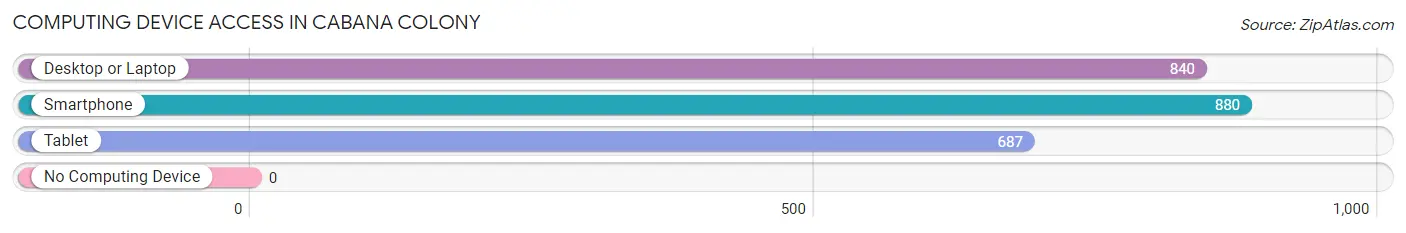
| Device Type | # Households | % Households |
| Desktop or Laptop | 840 | 93.4% |
| Smartphone | 880 | 97.9% |
| Tablet | 687 | 76.4% |
| No Computing Device | 0 | 0.0% |
| Total | 899 | 100.0% |
Internet Access in Cabana Colony
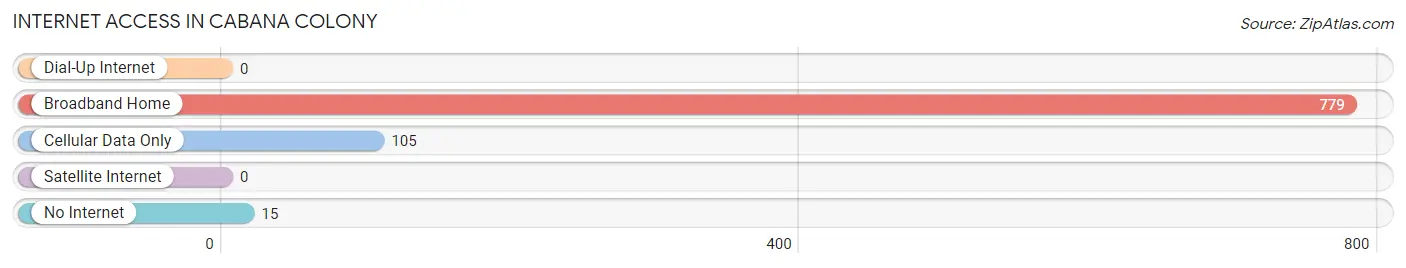
| Internet Type | # Households | % Households |
| Dial-Up Internet | 0 | 0.0% |
| Broadband Home | 779 | 86.7% |
| Cellular Data Only | 105 | 11.7% |
| Satellite Internet | 0 | 0.0% |
| No Internet | 15 | 1.7% |
| Total | 899 | 100.0% |
Cabana Colony Summary
Cabana Colony is a small, unincorporated community located in Brevard County, Florida. It is situated on the Indian River Lagoon, just south of the city of Melbourne. The community is bordered by the cities of Melbourne and Palm Bay, and is part of the Palm Bay-Melbourne-Titusville Metropolitan Statistical Area.
History
Cabana Colony was established in the 1950s as a vacation destination for families. The community was originally developed by the Cabana Colony Corporation, which was founded by a group of investors from the Midwest. The corporation purchased a large tract of land along the Indian River Lagoon and began developing the area into a residential community. The first homes were built in the late 1950s and early 1960s.
The community was named after the Cabana Club, a popular nightclub located in the area. The club was a popular destination for locals and tourists alike, and was known for its live music and dancing. The club closed in the late 1960s, but the name Cabana Colony remained.
Geography
Cabana Colony is located in Brevard County, Florida. It is situated on the Indian River Lagoon, just south of the city of Melbourne. The community is bordered by the cities of Melbourne and Palm Bay, and is part of the Palm Bay-Melbourne-Titusville Metropolitan Statistical Area.
The community is located on a barrier island, which is separated from the mainland by the Indian River Lagoon. The island is approximately 4 miles long and 1 mile wide. The terrain is mostly flat, with some areas of marshland.
Economy
Cabana Colony is primarily a residential community, with no major industries or businesses located in the area. The majority of the residents are employed in the nearby cities of Melbourne and Palm Bay.
The community does have a few small businesses, including a convenience store, a bait and tackle shop, and a few restaurants. There is also a marina located in the area, which provides access to the Indian River Lagoon.
Demographics
As of the 2010 census, the population of Cabana Colony was 1,845. The racial makeup of the community was 94.3% White, 2.2% African American, 0.7% Native American, 0.7% Asian, 0.2% Pacific Islander, and 1.1% from other races. Hispanic or Latino of any race were 3.2% of the population.
The median household income in Cabana Colony was $45,938, and the median family income was $50,938. The per capita income was $22,938. About 8.3% of families and 10.2% of the population were below the poverty line, including 14.3% of those under age 18 and 6.2% of those age 65 or over.
Common Questions
What is Per Capita Income in Cabana Colony?
Per Capita income in Cabana Colony is $42,434.
What is the Median Family Income in Cabana Colony?
Median Family Income in Cabana Colony is $65,833.
What is the Median Household income in Cabana Colony?
Median Household Income in Cabana Colony is $92,635.
What is Income or Wage Gap in Cabana Colony?
Income or Wage Gap in Cabana Colony is 24.8%.
Women in Cabana Colony earn 75.2 cents for every dollar earned by a man.
What is Inequality or Gini Index in Cabana Colony?
Inequality or Gini Index in Cabana Colony is 0.41.
What is the Total Population of Cabana Colony?
Total Population of Cabana Colony is 2,334.
What is the Total Male Population of Cabana Colony?
Total Male Population of Cabana Colony is 1,273.
What is the Total Female Population of Cabana Colony?
Total Female Population of Cabana Colony is 1,061.
What is the Ratio of Males per 100 Females in Cabana Colony?
There are 119.98 Males per 100 Females in Cabana Colony.
What is the Ratio of Females per 100 Males in Cabana Colony?
There are 83.35 Females per 100 Males in Cabana Colony.
What is the Median Population Age in Cabana Colony?
Median Population Age in Cabana Colony is 32.2 Years.
What is the Average Family Size in Cabana Colony
Average Family Size in Cabana Colony is 2.9 People.
What is the Average Household Size in Cabana Colony
Average Household Size in Cabana Colony is 2.6 People.
How Large is the Labor Force in Cabana Colony?
There are 1,547 People in the Labor Forcein in Cabana Colony.
What is the Percentage of People in the Labor Force in Cabana Colony?
86.9% of People are in the Labor Force in Cabana Colony.
What is the Unemployment Rate in Cabana Colony?
Unemployment Rate in Cabana Colony is 1.1%.