Riverside, ID Map & Demographics
Riverside Map
Riverside Overview
$41,314
PER CAPITA INCOME
$99,167
AVG FAMILY INCOME
$94,583
AVG HOUSEHOLD INCOME
0.40
INEQUALITY / GINI INDEX
1,074
TOTAL POPULATION
598
MALE POPULATION
476
FEMALE POPULATION
125.63
MALES / 100 FEMALES
79.60
FEMALES / 100 MALES
31.8
MEDIAN AGE
3.3
AVG FAMILY SIZE
3.2
AVG HOUSEHOLD SIZE
582
LABOR FORCE [ PEOPLE ]
77.1%
PERCENT IN LABOR FORCE
Income in Riverside
Income Overview in Riverside
Per Capita Income in Riverside is $41,314, while median incomes of families and households are $99,167 and $94,583 respectively.
| Characteristic | Number | Measure |
| Per Capita Income | 1,074 | $41,314 |
| Median Family Income | 300 | $99,167 |
| Mean Family Income | 300 | $132,724 |
| Median Household Income | 331 | $94,583 |
| Mean Household Income | 331 | $130,092 |
| Income Deficit | 300 | $0 |
| Wage / Income Gap (%) | 1,074 | 0.00% |
| Wage / Income Gap ($) | 1,074 | 100.00¢ per $1 |
| Gini / Inequality Index | 1,074 | 0.40 |
Earnings by Sex in Riverside
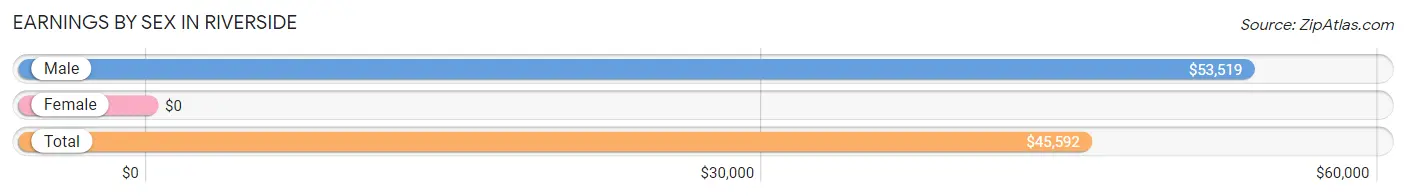
| Sex | Number | Average Earnings |
| Male | 337 (56.7%) | $53,519 |
| Female | 257 (43.3%) | $0 |
| Total | 594 (100.0%) | $45,592 |
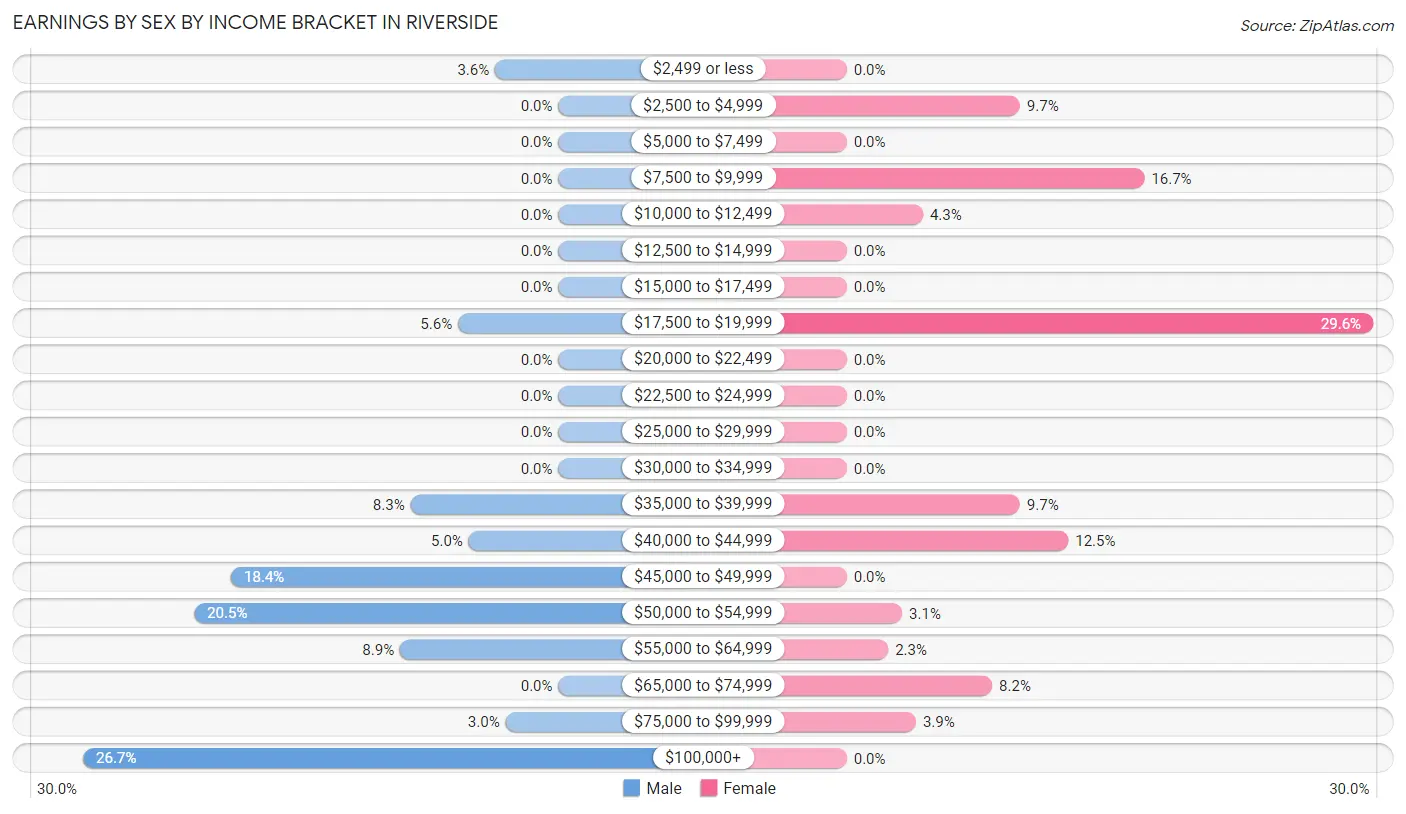
Earnings by Sex by Income Bracket in Riverside
The most common earnings brackets in Riverside are $100,000+ for men (90 | 26.7%) and $17,500 to $19,999 for women (76 | 29.6%).
| Income | Male | Female |
| $2,499 or less | 12 (3.6%) | 0 (0.0%) |
| $2,500 to $4,999 | 0 (0.0%) | 25 (9.7%) |
| $5,000 to $7,499 | 0 (0.0%) | 0 (0.0%) |
| $7,500 to $9,999 | 0 (0.0%) | 43 (16.7%) |
| $10,000 to $12,499 | 0 (0.0%) | 11 (4.3%) |
| $12,500 to $14,999 | 0 (0.0%) | 0 (0.0%) |
| $15,000 to $17,499 | 0 (0.0%) | 0 (0.0%) |
| $17,500 to $19,999 | 19 (5.6%) | 76 (29.6%) |
| $20,000 to $22,499 | 0 (0.0%) | 0 (0.0%) |
| $22,500 to $24,999 | 0 (0.0%) | 0 (0.0%) |
| $25,000 to $29,999 | 0 (0.0%) | 0 (0.0%) |
| $30,000 to $34,999 | 0 (0.0%) | 0 (0.0%) |
| $35,000 to $39,999 | 28 (8.3%) | 25 (9.7%) |
| $40,000 to $44,999 | 17 (5.0%) | 32 (12.4%) |
| $45,000 to $49,999 | 62 (18.4%) | 0 (0.0%) |
| $50,000 to $54,999 | 69 (20.5%) | 8 (3.1%) |
| $55,000 to $64,999 | 30 (8.9%) | 6 (2.3%) |
| $65,000 to $74,999 | 0 (0.0%) | 21 (8.2%) |
| $75,000 to $99,999 | 10 (3.0%) | 10 (3.9%) |
| $100,000+ | 90 (26.7%) | 0 (0.0%) |
| Total | 337 (100.0%) | 257 (100.0%) |
Earnings by Sex by Educational Attainment in Riverside
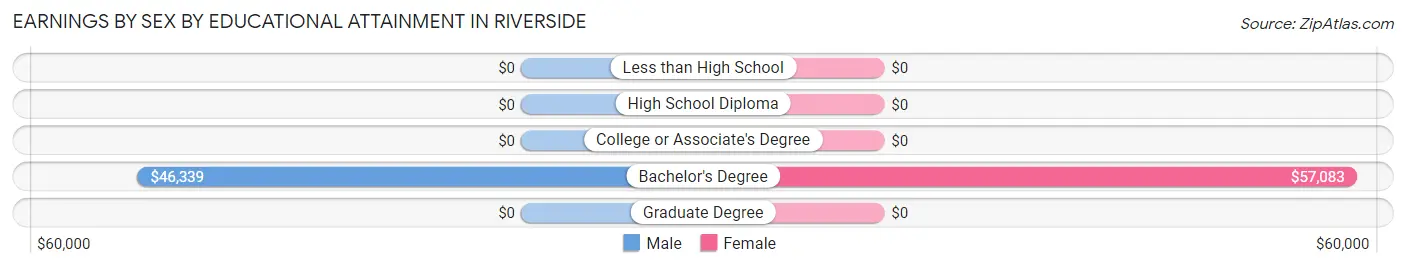
| Educational Attainment | Male Income | Female Income |
| Less than High School | - | - |
| High School Diploma | - | - |
| College or Associate's Degree | - | - |
| Bachelor's Degree | $46,339 | $57,083 |
| Graduate Degree | - | - |
| Total | $57,500 | $0 |
Family Income in Riverside
Family Income Brackets in Riverside
According to the Riverside family income data, there are 74 families falling into the $100,000 to $149,999 income range, which is the most common income bracket and makes up 24.7% of all families.
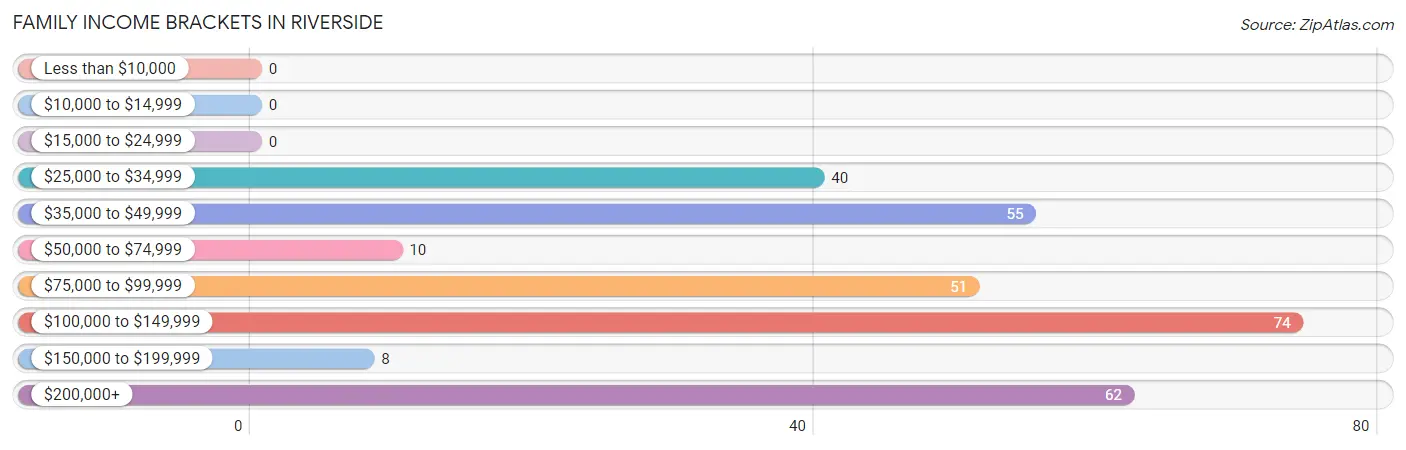
| Income Bracket | # Families | % Families |
| Less than $10,000 | 0 | 0.0% |
| $10,000 to $14,999 | 0 | 0.0% |
| $15,000 to $24,999 | 0 | 0.0% |
| $25,000 to $34,999 | 40 | 13.3% |
| $35,000 to $49,999 | 55 | 18.3% |
| $50,000 to $74,999 | 10 | 3.3% |
| $75,000 to $99,999 | 51 | 17.0% |
| $100,000 to $149,999 | 74 | 24.7% |
| $150,000 to $199,999 | 8 | 2.7% |
| $200,000+ | 62 | 20.7% |
Family Income by Famaliy Size in Riverside
4-person families (54 | 18.0%) account for the highest median family income in Riverside with $120,089 per family, while 4-person families (54 | 18.0%) have the highest median income of $30,022 per family member.
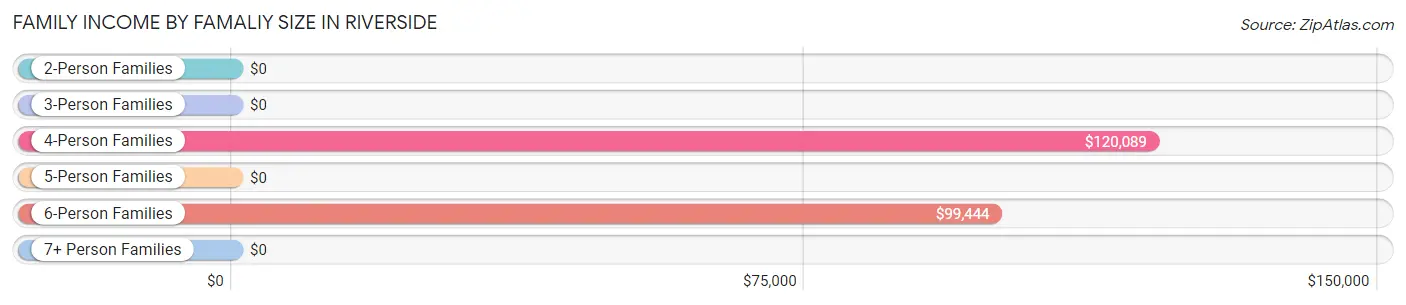
| Income Bracket | # Families | Median Income |
| 2-Person Families | 184 (61.3%) | $0 |
| 3-Person Families | 6 (2.0%) | $0 |
| 4-Person Families | 54 (18.0%) | $120,089 |
| 5-Person Families | 16 (5.3%) | $0 |
| 6-Person Families | 28 (9.3%) | $99,444 |
| 7+ Person Families | 12 (4.0%) | $0 |
| Total | 300 (100.0%) | $99,167 |
Family Income by Number of Earners in Riverside
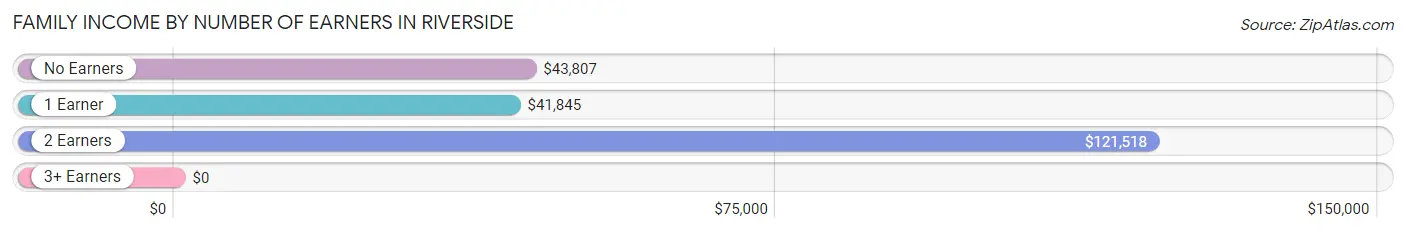
| Number of Earners | # Families | Median Income |
| No Earners | 35 (11.7%) | $43,807 |
| 1 Earner | 99 (33.0%) | $41,845 |
| 2 Earners | 146 (48.7%) | $121,518 |
| 3+ Earners | 20 (6.7%) | $0 |
| Total | 300 (100.0%) | $99,167 |
Household Income in Riverside
Household Income Brackets in Riverside
With 96 households falling in the category, the $75,000 to $99,999 income range is the most frequent in Riverside, accounting for 29.0% of all households.
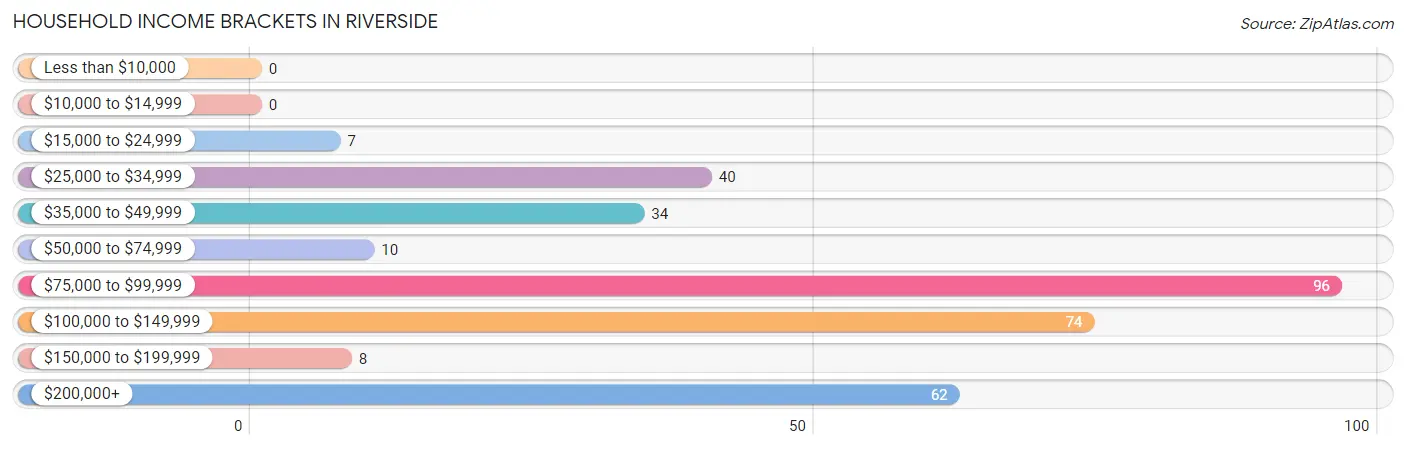
| Income Bracket | # Households | % Households |
| Less than $10,000 | 0 | 0.0% |
| $10,000 to $14,999 | 0 | 0.0% |
| $15,000 to $24,999 | 7 | 2.1% |
| $25,000 to $34,999 | 40 | 12.1% |
| $35,000 to $49,999 | 34 | 10.3% |
| $50,000 to $74,999 | 10 | 3.0% |
| $75,000 to $99,999 | 96 | 29.0% |
| $100,000 to $149,999 | 74 | 22.4% |
| $150,000 to $199,999 | 8 | 2.4% |
| $200,000+ | 62 | 18.7% |
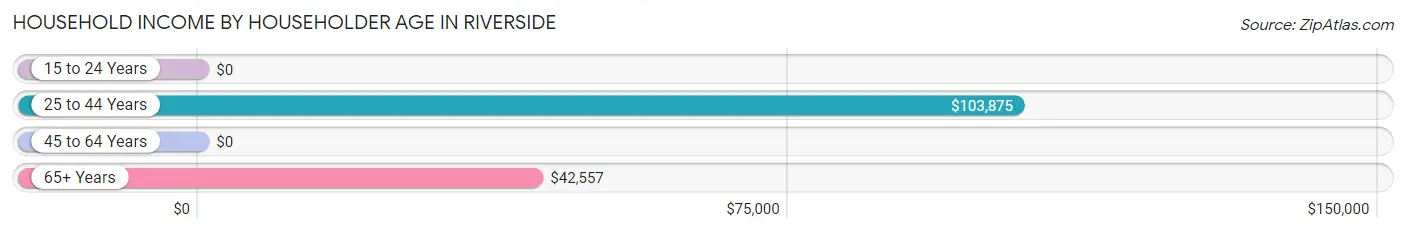
Household Income by Householder Age in Riverside
The median household income in Riverside is $94,583, with the highest median household income of $103,875 found in the 25 to 44 years age bracket for the primary householder. A total of 71 households (21.4%) fall into this category. Meanwhile, the 15 to 24 years age bracket for the primary householder has the lowest median household income of $0, with 21 households (6.3%) in this group.
| Income Bracket | # Households | Median Income |
| 15 to 24 Years | 21 (6.3%) | $0 |
| 25 to 44 Years | 71 (21.4%) | $103,875 |
| 45 to 64 Years | 144 (43.5%) | $0 |
| 65+ Years | 95 (28.7%) | $42,557 |
| Total | 331 (100.0%) | $94,583 |
Poverty in Riverside
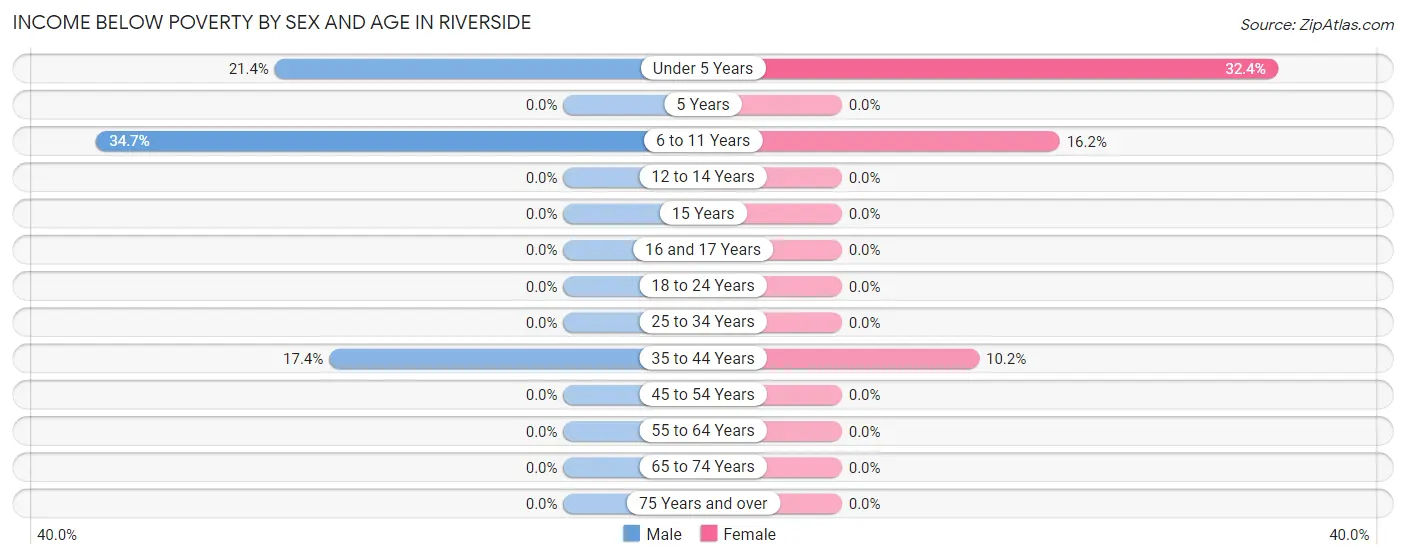
Income Below Poverty by Sex and Age in Riverside
With 7.9% poverty level for males and 6.9% for females among the residents of Riverside, 6 to 11 year old males and under 5 year old females are the most vulnerable to poverty, with 26 males (34.7%) and 11 females (32.4%) in their respective age groups living below the poverty level.
| Age Bracket | Male | Female |
| Under 5 Years | 9 (21.4%) | 11 (32.4%) |
| 5 Years | 0 (0.0%) | 0 (0.0%) |
| 6 to 11 Years | 26 (34.7%) | 11 (16.2%) |
| 12 to 14 Years | 0 (0.0%) | 0 (0.0%) |
| 15 Years | 0 (0.0%) | 0 (0.0%) |
| 16 and 17 Years | 0 (0.0%) | 0 (0.0%) |
| 18 to 24 Years | 0 (0.0%) | 0 (0.0%) |
| 25 to 34 Years | 0 (0.0%) | 0 (0.0%) |
| 35 to 44 Years | 12 (17.4%) | 11 (10.2%) |
| 45 to 54 Years | 0 (0.0%) | 0 (0.0%) |
| 55 to 64 Years | 0 (0.0%) | 0 (0.0%) |
| 65 to 74 Years | 0 (0.0%) | 0 (0.0%) |
| 75 Years and over | 0 (0.0%) | 0 (0.0%) |
| Total | 47 (7.9%) | 33 (6.9%) |
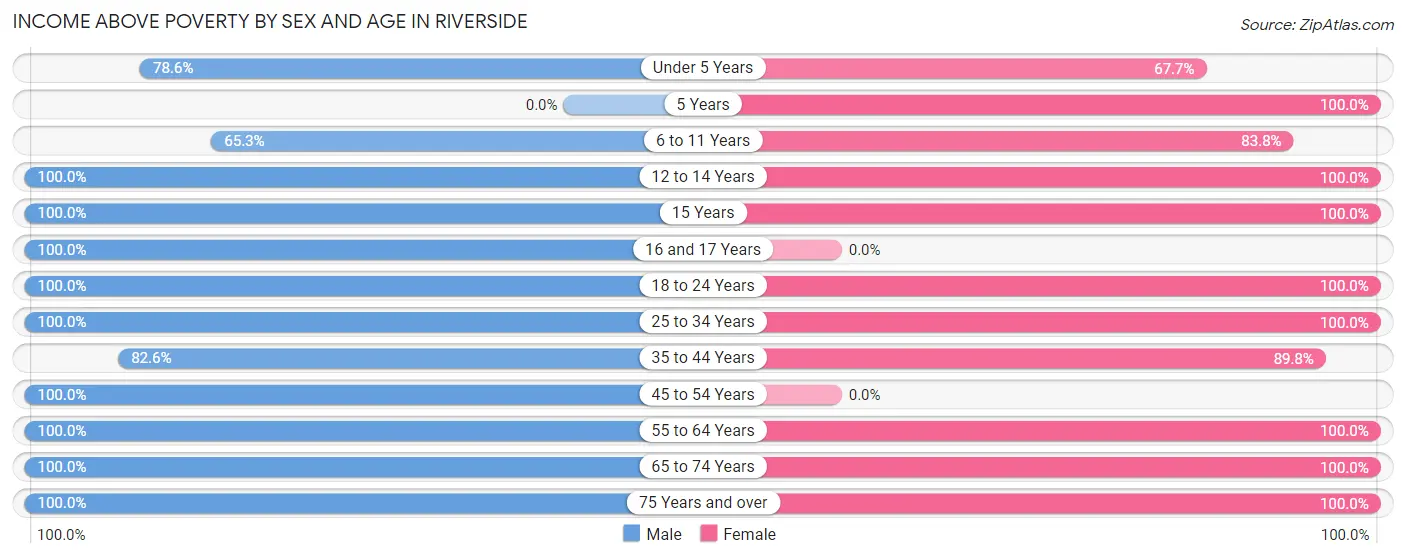
Income Above Poverty by Sex and Age in Riverside
According to the poverty statistics in Riverside, males aged 12 to 14 years and females aged 5 years are the age groups that are most secure financially, with 100.0% of males and 100.0% of females in these age groups living above the poverty line.
| Age Bracket | Male | Female |
| Under 5 Years | 33 (78.6%) | 23 (67.6%) |
| 5 Years | 0 (0.0%) | 4 (100.0%) |
| 6 to 11 Years | 49 (65.3%) | 57 (83.8%) |
| 12 to 14 Years | 46 (100.0%) | 28 (100.0%) |
| 15 Years | 14 (100.0%) | 8 (100.0%) |
| 16 and 17 Years | 12 (100.0%) | 0 (0.0%) |
| 18 to 24 Years | 65 (100.0%) | 88 (100.0%) |
| 25 to 34 Years | 39 (100.0%) | 26 (100.0%) |
| 35 to 44 Years | 57 (82.6%) | 97 (89.8%) |
| 45 to 54 Years | 116 (100.0%) | 0 (0.0%) |
| 55 to 64 Years | 40 (100.0%) | 23 (100.0%) |
| 65 to 74 Years | 14 (100.0%) | 20 (100.0%) |
| 75 Years and over | 66 (100.0%) | 69 (100.0%) |
| Total | 551 (92.1%) | 443 (93.1%) |
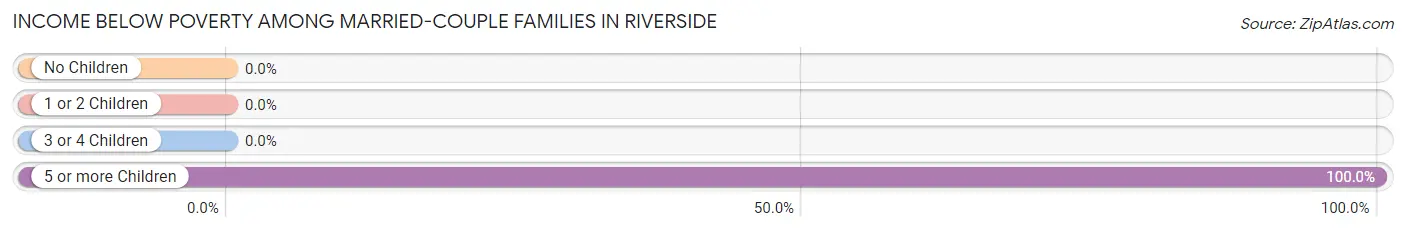
Income Below Poverty Among Married-Couple Families in Riverside
The poverty statistics for married-couple families in Riverside show that 6.2% or 12 of the total 192 families live below the poverty line. Families with 5 or more children have the highest poverty rate of 100.0%, comprising of 12 families. On the other hand, families with no children have the lowest poverty rate of 0.0%, which includes 0 families.
| Children | Above Poverty | Below Poverty |
| No Children | 87 (100.0%) | 0 (0.0%) |
| 1 or 2 Children | 49 (100.0%) | 0 (0.0%) |
| 3 or 4 Children | 44 (100.0%) | 0 (0.0%) |
| 5 or more Children | 0 (0.0%) | 12 (100.0%) |
| Total | 180 (93.8%) | 12 (6.2%) |
Income Below Poverty Among Single-Parent Households in Riverside
| Children | Single Father | Single Mother |
| No Children | 0 (0.0%) | 0 (0.0%) |
| 1 or 2 Children | 0 (0.0%) | 0 (0.0%) |
| 3 or 4 Children | 0 (0.0%) | 0 (0.0%) |
| 5 or more Children | 0 (0.0%) | 0 (0.0%) |
| Total | 0 (0.0%) | 0 (0.0%) |
Income Below Poverty Among Married-Couple vs Single-Parent Households in Riverside
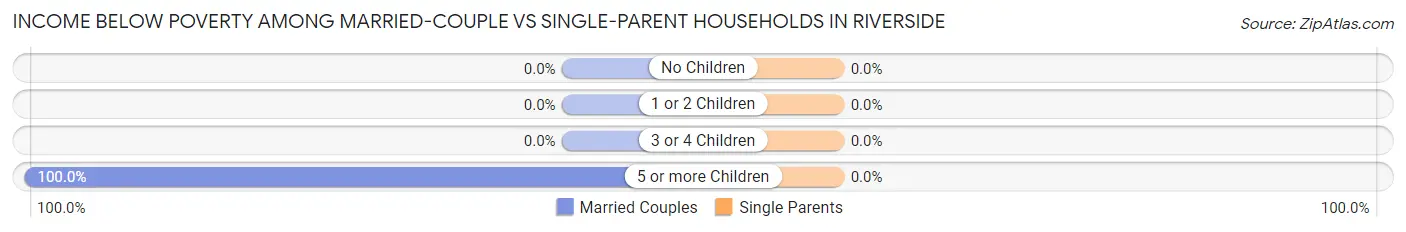
| Children | Married-Couple Families | Single-Parent Households |
| No Children | 0 (0.0%) | 0 (0.0%) |
| 1 or 2 Children | 0 (0.0%) | 0 (0.0%) |
| 3 or 4 Children | 0 (0.0%) | 0 (0.0%) |
| 5 or more Children | 12 (100.0%) | 0 (0.0%) |
| Total | 12 (6.2%) | 0 (0.0%) |
Race in Riverside
The most populous races in Riverside are White / Caucasian (944 | 87.9%), Hispanic or Latino (96 | 8.9%), and Some other Race (96 | 8.9%).
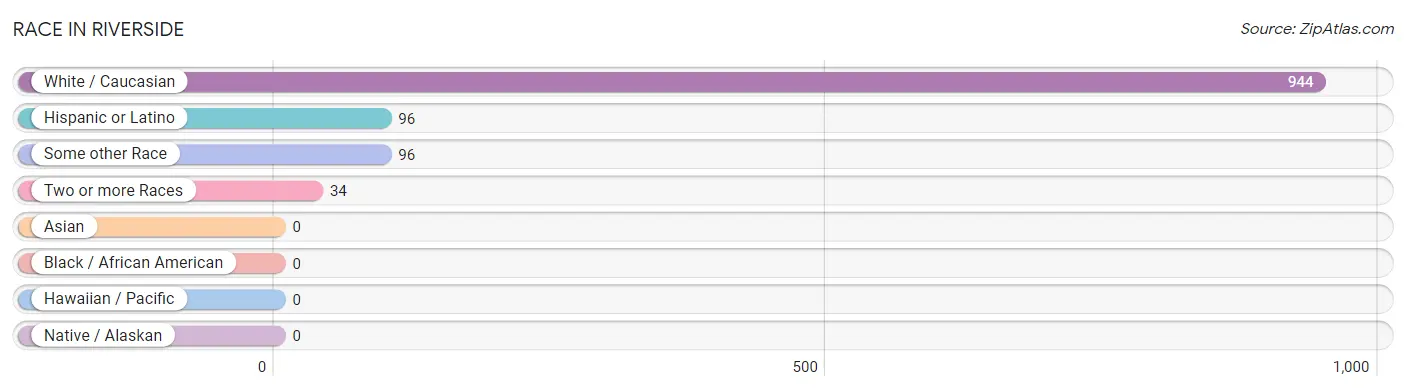
| Race | # Population | % Population |
| Asian | 0 | 0.0% |
| Black / African American | 0 | 0.0% |
| Hawaiian / Pacific | 0 | 0.0% |
| Hispanic or Latino | 96 | 8.9% |
| Native / Alaskan | 0 | 0.0% |
| White / Caucasian | 944 | 87.9% |
| Two or more Races | 34 | 3.2% |
| Some other Race | 96 | 8.9% |
| Total | 1,074 | 100.0% |
Ancestry in Riverside
The most populous ancestries reported in Riverside are English (321 | 29.9%), American (123 | 11.5%), Irish (104 | 9.7%), Peruvian (89 | 8.3%), and South American (89 | 8.3%), together accounting for 67.6% of all Riverside residents.
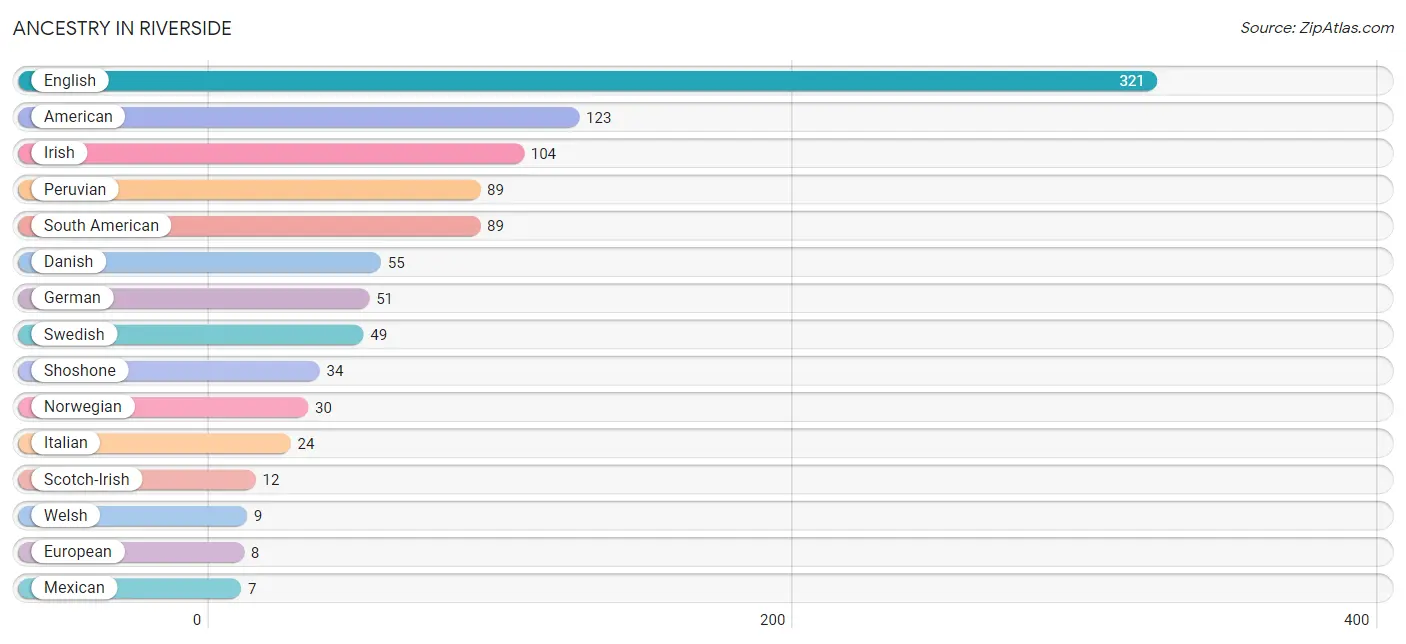
| Ancestry | # Population | % Population |
| American | 123 | 11.5% |
| Danish | 55 | 5.1% |
| English | 321 | 29.9% |
| European | 8 | 0.7% |
| German | 51 | 4.8% |
| Irish | 104 | 9.7% |
| Italian | 24 | 2.2% |
| Mexican | 7 | 0.6% |
| Norwegian | 30 | 2.8% |
| Peruvian | 89 | 8.3% |
| Scotch-Irish | 12 | 1.1% |
| Shoshone | 34 | 3.2% |
| South American | 89 | 8.3% |
| Swedish | 49 | 4.6% |
| Welsh | 9 | 0.8% | View All 15 Rows |
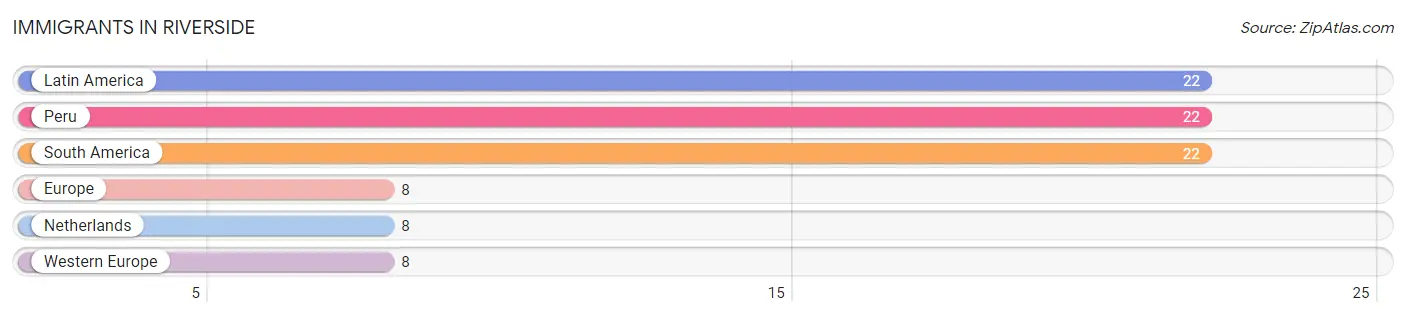
Immigrants in Riverside
The most numerous immigrant groups reported in Riverside came from Latin America (22 | 2.1%), Peru (22 | 2.1%), South America (22 | 2.1%), Europe (8 | 0.7%), and Netherlands (8 | 0.7%), together accounting for 7.6% of all Riverside residents.
| Immigration Origin | # Population | % Population |
| Europe | 8 | 0.7% |
| Latin America | 22 | 2.1% |
| Netherlands | 8 | 0.7% |
| Peru | 22 | 2.1% |
| South America | 22 | 2.1% |
| Western Europe | 8 | 0.7% | View All 6 Rows |
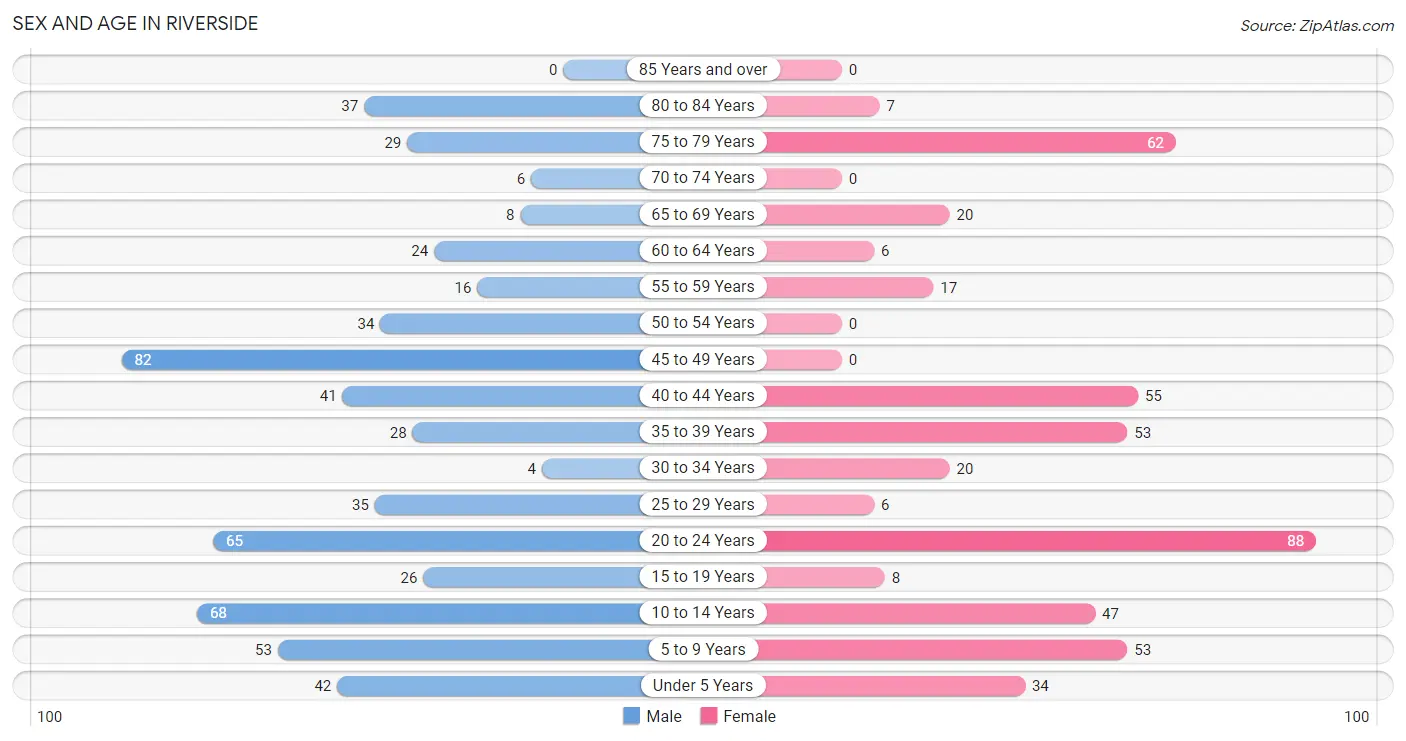
Sex and Age in Riverside
Sex and Age in Riverside
The most populous age groups in Riverside are 45 to 49 Years (82 | 13.7%) for men and 20 to 24 Years (88 | 18.5%) for women.
| Age Bracket | Male | Female |
| Under 5 Years | 42 (7.0%) | 34 (7.1%) |
| 5 to 9 Years | 53 (8.9%) | 53 (11.1%) |
| 10 to 14 Years | 68 (11.4%) | 47 (9.9%) |
| 15 to 19 Years | 26 (4.3%) | 8 (1.7%) |
| 20 to 24 Years | 65 (10.9%) | 88 (18.5%) |
| 25 to 29 Years | 35 (5.9%) | 6 (1.3%) |
| 30 to 34 Years | 4 (0.7%) | 20 (4.2%) |
| 35 to 39 Years | 28 (4.7%) | 53 (11.1%) |
| 40 to 44 Years | 41 (6.9%) | 55 (11.6%) |
| 45 to 49 Years | 82 (13.7%) | 0 (0.0%) |
| 50 to 54 Years | 34 (5.7%) | 0 (0.0%) |
| 55 to 59 Years | 16 (2.7%) | 17 (3.6%) |
| 60 to 64 Years | 24 (4.0%) | 6 (1.3%) |
| 65 to 69 Years | 8 (1.3%) | 20 (4.2%) |
| 70 to 74 Years | 6 (1.0%) | 0 (0.0%) |
| 75 to 79 Years | 29 (4.9%) | 62 (13.0%) |
| 80 to 84 Years | 37 (6.2%) | 7 (1.5%) |
| 85 Years and over | 0 (0.0%) | 0 (0.0%) |
| Total | 598 (100.0%) | 476 (100.0%) |
Families and Households in Riverside
Median Family Size in Riverside
The median family size in Riverside is 3.34 persons per family, with married-couple families (192 | 64.0%) accounting for the largest median family size of 3.65 persons per family. On the other hand, single male/father families (76 | 25.3%) represent the smallest median family size with 2.74 persons per family.
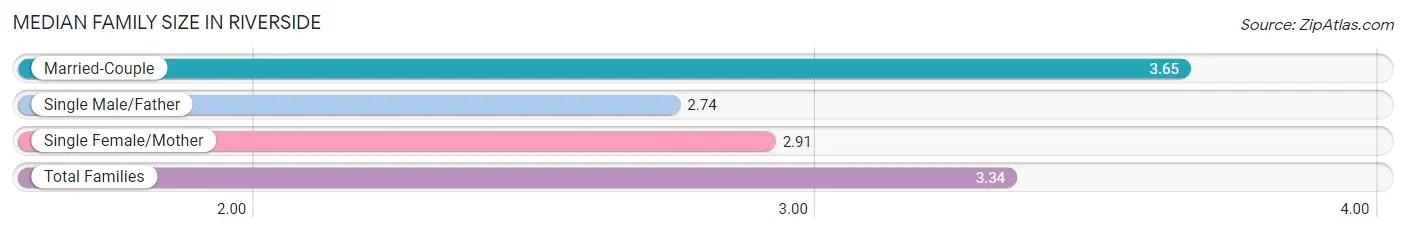
| Family Type | # Families | Family Size |
| Married-Couple | 192 (64.0%) | 3.65 |
| Single Male/Father | 76 (25.3%) | 2.74 |
| Single Female/Mother | 32 (10.7%) | 2.91 |
| Total Families | 300 (100.0%) | 3.34 |
Median Household Size in Riverside
The median household size in Riverside is 3.24 persons per household, with married-couple households (192 | 58.0%) accounting for the largest median household size of 3.65 persons per household. non-family households (31 | 9.4%) represent the smallest median household size with 1.81 persons per household.
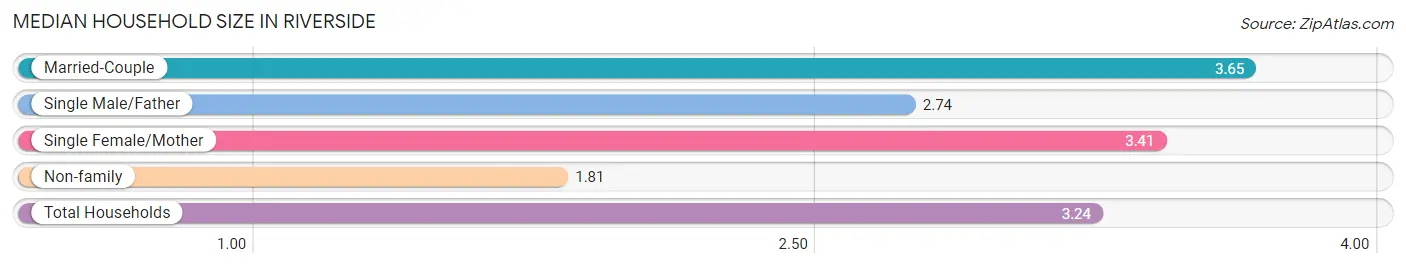
| Household Type | # Households | Household Size |
| Married-Couple | 192 (58.0%) | 3.65 |
| Single Male/Father | 76 (23.0%) | 2.74 |
| Single Female/Mother | 32 (9.7%) | 3.41 |
| Non-family | 31 (9.4%) | 1.81 |
| Total Households | 331 (100.0%) | 3.24 |
Household Size by Marriage Status in Riverside
Out of a total of 331 households in Riverside, 300 (90.6%) are family households, while 31 (9.4%) are nonfamily households. The most numerous type of family households are 2-person households, comprising 163, and the most common type of nonfamily households are 2-person households, comprising 24.
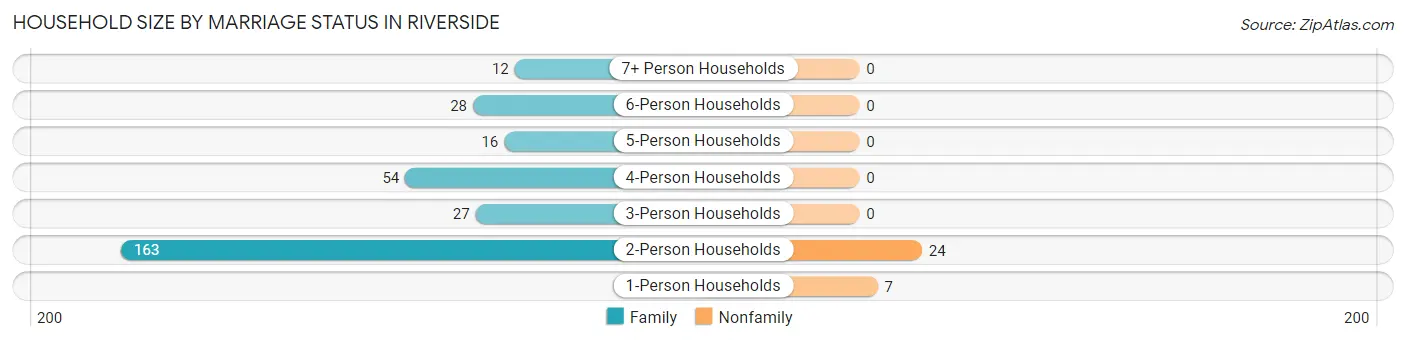
| Household Size | Family Households | Nonfamily Households |
| 1-Person Households | - | 7 (2.1%) |
| 2-Person Households | 163 (49.2%) | 24 (7.2%) |
| 3-Person Households | 27 (8.2%) | 0 (0.0%) |
| 4-Person Households | 54 (16.3%) | 0 (0.0%) |
| 5-Person Households | 16 (4.8%) | 0 (0.0%) |
| 6-Person Households | 28 (8.5%) | 0 (0.0%) |
| 7+ Person Households | 12 (3.6%) | 0 (0.0%) |
| Total | 300 (90.6%) | 31 (9.4%) |
Female Fertility in Riverside
Fertility by Age in Riverside
Average fertility rate in Riverside is 135.0 births per 1,000 women. Women in the age bracket of 20 to 34 years have the highest fertility rate with 272.0 births per 1,000 women. Women in the age bracket of 20 to 34 years acount for 100.0% of all women with births.
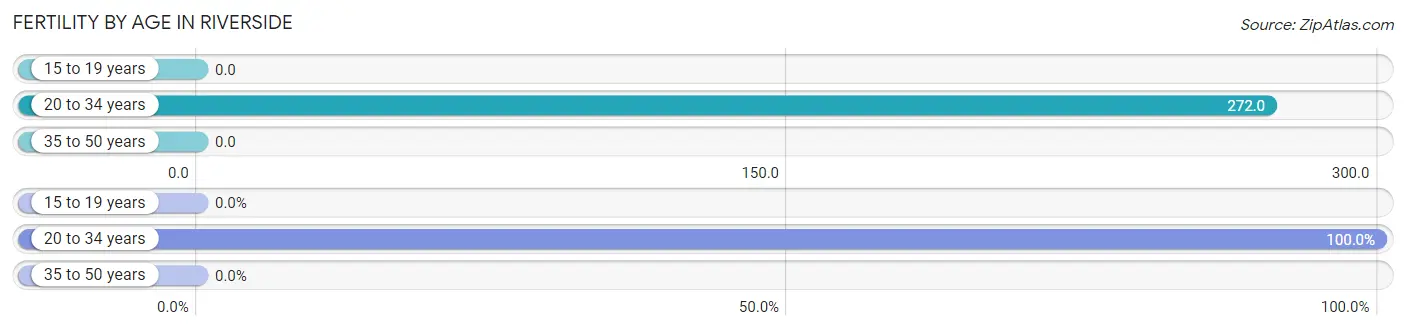
| Age Bracket | Women with Births | Births / 1,000 Women |
| 15 to 19 years | 0 (0.0%) | 0.0 |
| 20 to 34 years | 31 (100.0%) | 272.0 |
| 35 to 50 years | 0 (0.0%) | 0.0 |
| Total | 31 (100.0%) | 135.0 |
Fertility by Age by Marriage Status in Riverside
32.3% of women with births (31) in Riverside are married. The highest percentage of unmarried women with births falls into 20 to 34 years age bracket with 67.7% of them unmarried at the time of birth, while the lowest percentage of unmarried women with births belong to 20 to 34 years age bracket with 67.7% of them unmarried.
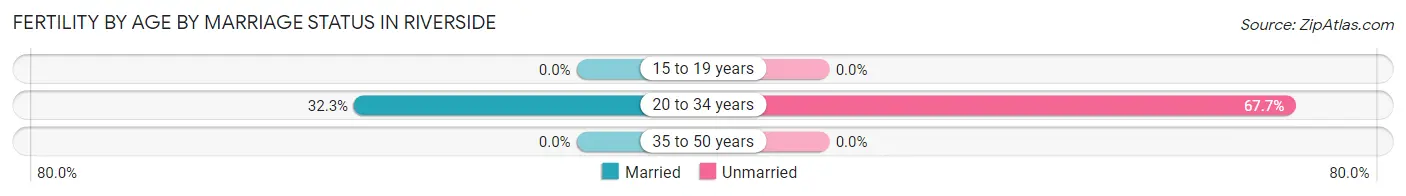
| Age Bracket | Married | Unmarried |
| 15 to 19 years | 0 (0.0%) | 0 (0.0%) |
| 20 to 34 years | 10 (32.3%) | 21 (67.7%) |
| 35 to 50 years | 0 (0.0%) | 0 (0.0%) |
| Total | 10 (32.3%) | 21 (67.7%) |
Fertility by Education in Riverside
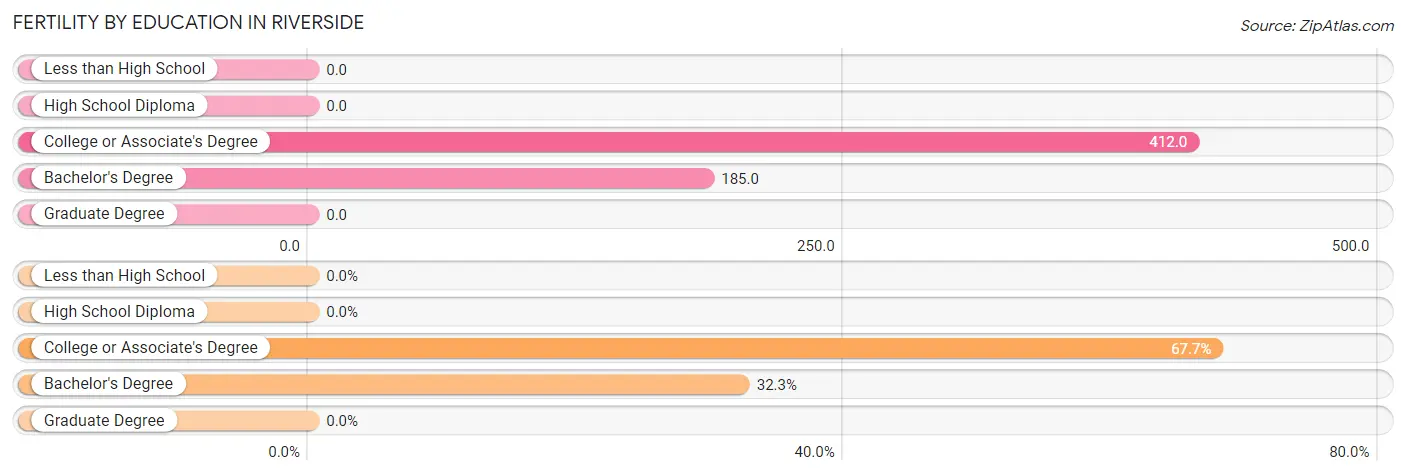
| Educational Attainment | Women with Births | Births / 1,000 Women |
| Less than High School | 0 (0.0%) | 0.0 |
| High School Diploma | 0 (0.0%) | 0.0 |
| College or Associate's Degree | 21 (67.7%) | 412.0 |
| Bachelor's Degree | 10 (32.3%) | 185.0 |
| Graduate Degree | 0 (0.0%) | 0.0 |
| Total | 31 (100.0%) | 135.0 |
Fertility by Education by Marriage Status in Riverside
67.7% of women with births in Riverside are unmarried. Women with the educational attainment of bachelor's degree are most likely to be married with 100.0% of them married at childbirth, while women with the educational attainment of college or associate's degree are least likely to be married with 100.0% of them unmarried at childbirth.
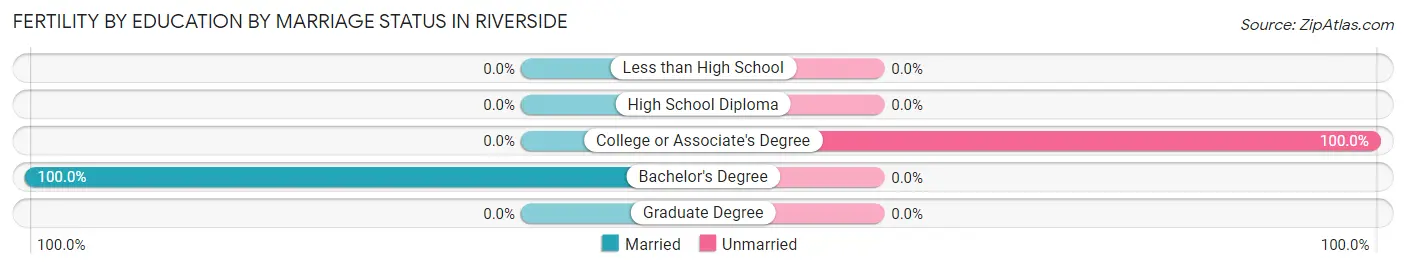
| Educational Attainment | Married | Unmarried |
| Less than High School | 0 (0.0%) | 0 (0.0%) |
| High School Diploma | 0 (0.0%) | 0 (0.0%) |
| College or Associate's Degree | 0 (0.0%) | 21 (100.0%) |
| Bachelor's Degree | 10 (100.0%) | 0 (0.0%) |
| Graduate Degree | 0 (0.0%) | 0 (0.0%) |
| Total | 10 (32.3%) | 21 (67.7%) |
Employment Characteristics in Riverside
Employment by Class of Employer in Riverside
Among the 573 employed individuals in Riverside, private company employees (392 | 68.4%), self-employed (not incorporated) (86 | 15.0%), and local government employees (58 | 10.1%) make up the most common classes of employment.
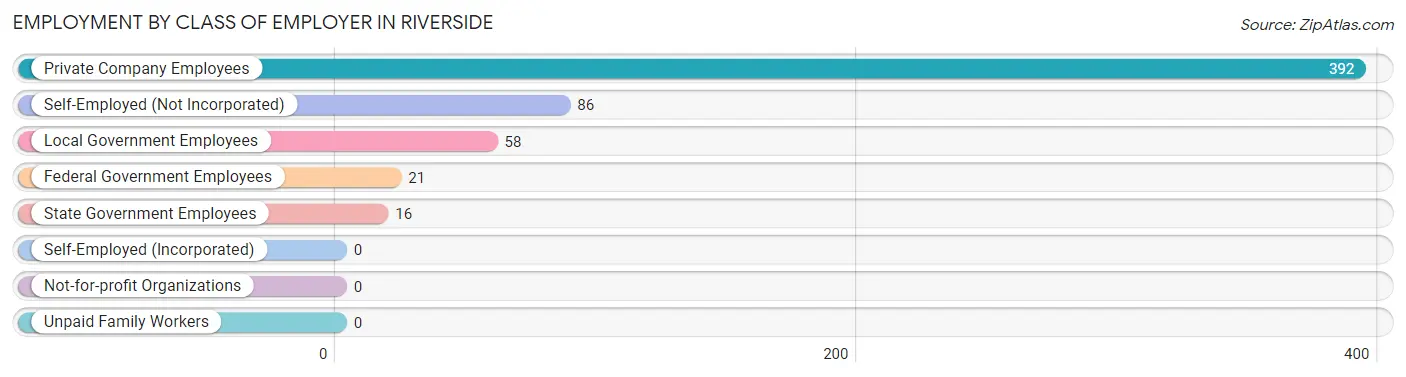
| Employer Class | # Employees | % Employees |
| Private Company Employees | 392 | 68.4% |
| Self-Employed (Incorporated) | 0 | 0.0% |
| Self-Employed (Not Incorporated) | 86 | 15.0% |
| Not-for-profit Organizations | 0 | 0.0% |
| Local Government Employees | 58 | 10.1% |
| State Government Employees | 16 | 2.8% |
| Federal Government Employees | 21 | 3.7% |
| Unpaid Family Workers | 0 | 0.0% |
| Total | 573 | 100.0% |
Employment Status by Age in Riverside
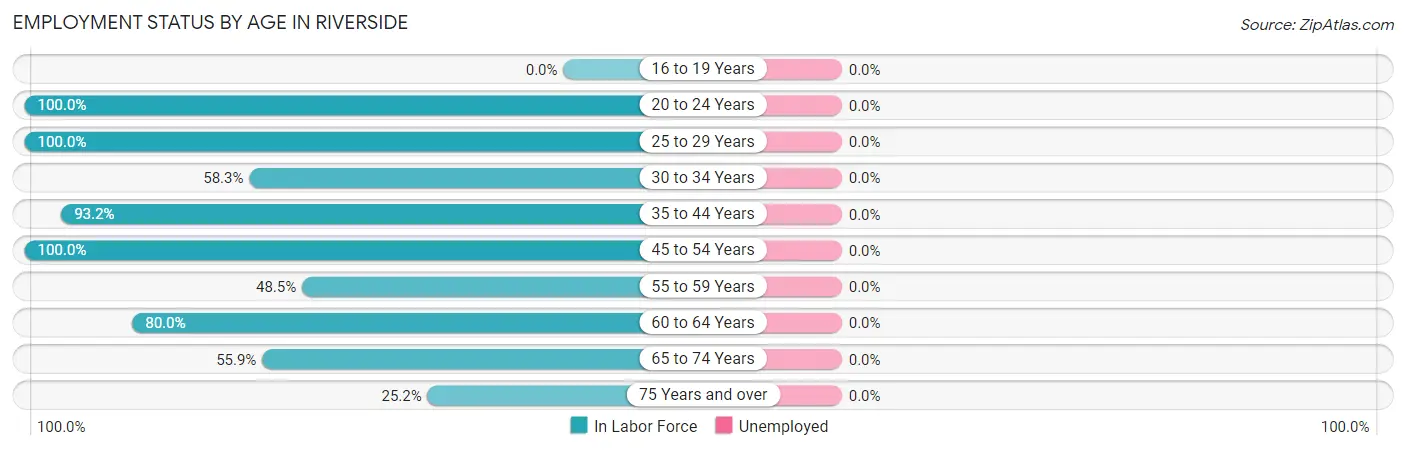
| Age Bracket | In Labor Force | Unemployed |
| 16 to 19 Years | 0 (0.0%) | 0 (0.0%) |
| 20 to 24 Years | 153 (100.0%) | 0 (0.0%) |
| 25 to 29 Years | 41 (100.0%) | 0 (0.0%) |
| 30 to 34 Years | 14 (58.3%) | 0 (0.0%) |
| 35 to 44 Years | 165 (93.2%) | 0 (0.0%) |
| 45 to 54 Years | 116 (100.0%) | 0 (0.0%) |
| 55 to 59 Years | 16 (48.5%) | 0 (0.0%) |
| 60 to 64 Years | 24 (80.0%) | 0 (0.0%) |
| 65 to 74 Years | 19 (55.9%) | 0 (0.0%) |
| 75 Years and over | 34 (25.2%) | 0 (0.0%) |
| Total | 582 (77.1%) | 0 (0.0%) |
Employment Status by Educational Attainment in Riverside
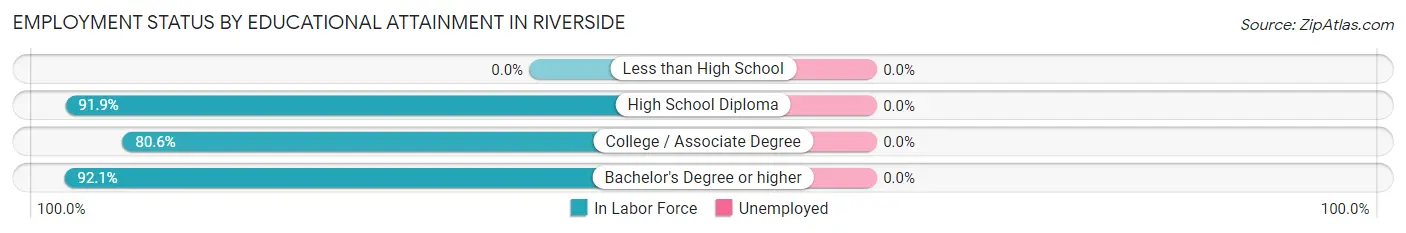
| Educational Attainment | In Labor Force | Unemployed |
| Less than High School | 0 (0.0%) | 0 (0.0%) |
| High School Diploma | 181 (91.9%) | 0 (0.0%) |
| College / Associate Degree | 79 (80.6%) | 0 (0.0%) |
| Bachelor's Degree or higher | 116 (92.1%) | 0 (0.0%) |
| Total | 376 (89.3%) | 0 (0.0%) |
Employment Occupations by Sex in Riverside
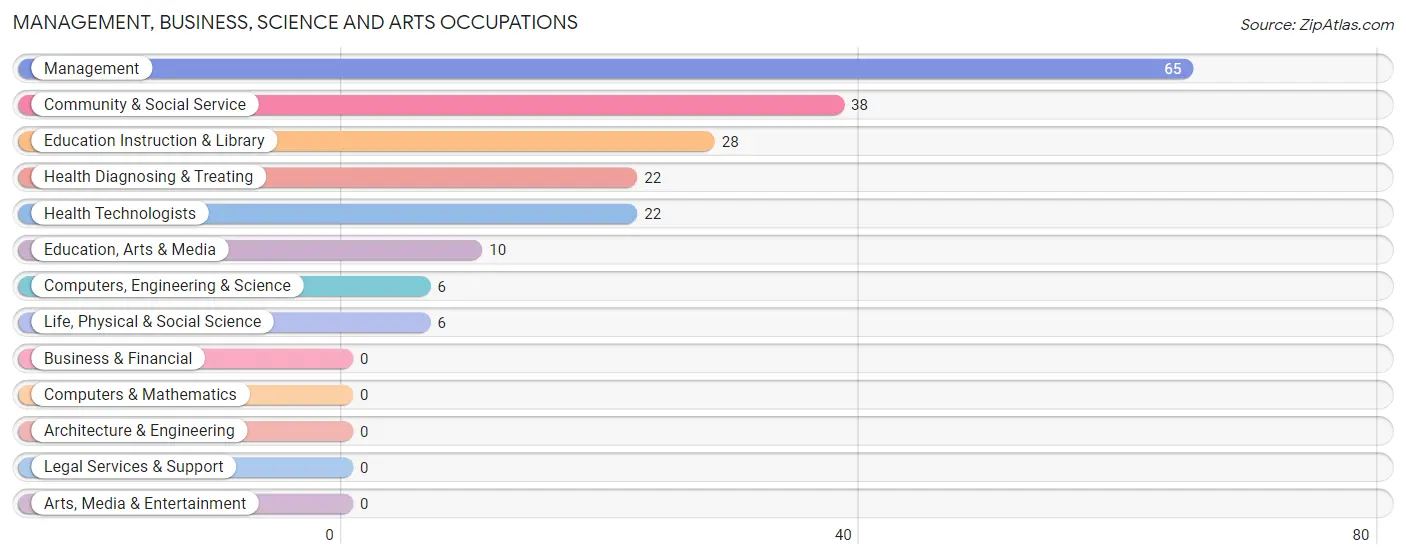
Management, Business, Science and Arts Occupations
The most common Management, Business, Science and Arts occupations in Riverside are Management (65 | 11.2%), Community & Social Service (38 | 6.5%), Education Instruction & Library (28 | 4.8%), Health Diagnosing & Treating (22 | 3.8%), and Health Technologists (22 | 3.8%).
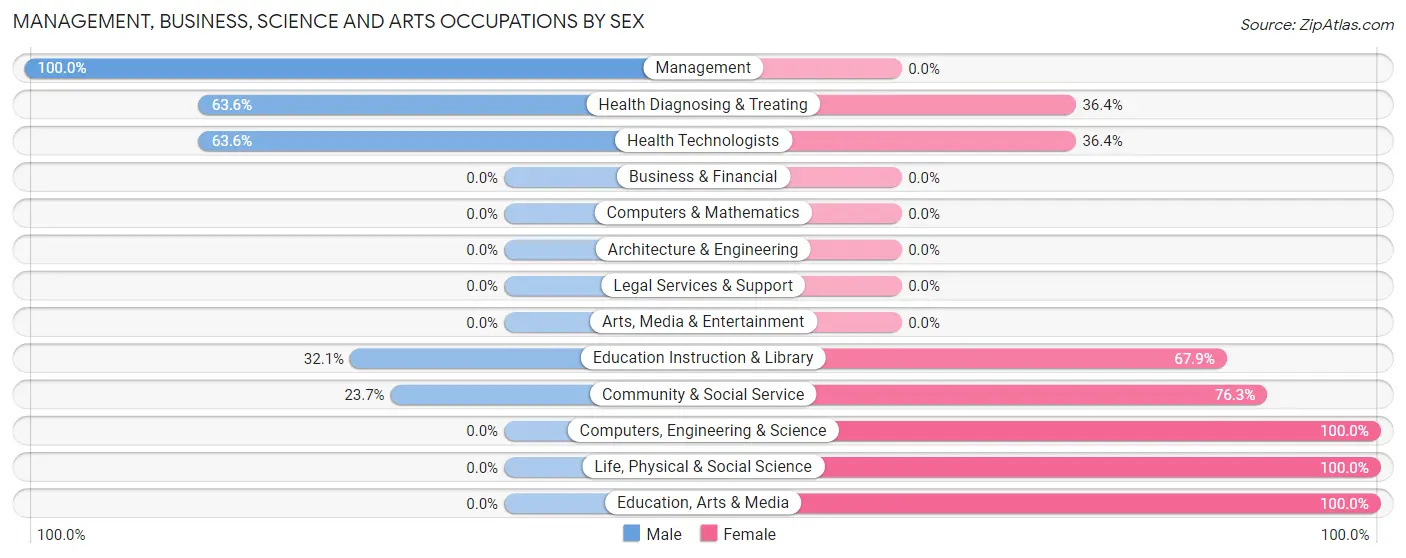
Management, Business, Science and Arts Occupations by Sex
Within the Management, Business, Science and Arts occupations in Riverside, the most male-oriented occupations are Management (100.0%), Health Diagnosing & Treating (63.6%), and Health Technologists (63.6%), while the most female-oriented occupations are Computers, Engineering & Science (100.0%), Life, Physical & Social Science (100.0%), and Education, Arts & Media (100.0%).
| Occupation | Male | Female |
| Management | 65 (100.0%) | 0 (0.0%) |
| Business & Financial | 0 (0.0%) | 0 (0.0%) |
| Computers, Engineering & Science | 0 (0.0%) | 6 (100.0%) |
| Computers & Mathematics | 0 (0.0%) | 0 (0.0%) |
| Architecture & Engineering | 0 (0.0%) | 0 (0.0%) |
| Life, Physical & Social Science | 0 (0.0%) | 6 (100.0%) |
| Community & Social Service | 9 (23.7%) | 29 (76.3%) |
| Education, Arts & Media | 0 (0.0%) | 10 (100.0%) |
| Legal Services & Support | 0 (0.0%) | 0 (0.0%) |
| Education Instruction & Library | 9 (32.1%) | 19 (67.9%) |
| Arts, Media & Entertainment | 0 (0.0%) | 0 (0.0%) |
| Health Diagnosing & Treating | 14 (63.6%) | 8 (36.4%) |
| Health Technologists | 14 (63.6%) | 8 (36.4%) |
| Total (Category) | 88 (67.2%) | 43 (32.8%) |
| Total (Overall) | 325 (55.8%) | 257 (44.2%) |
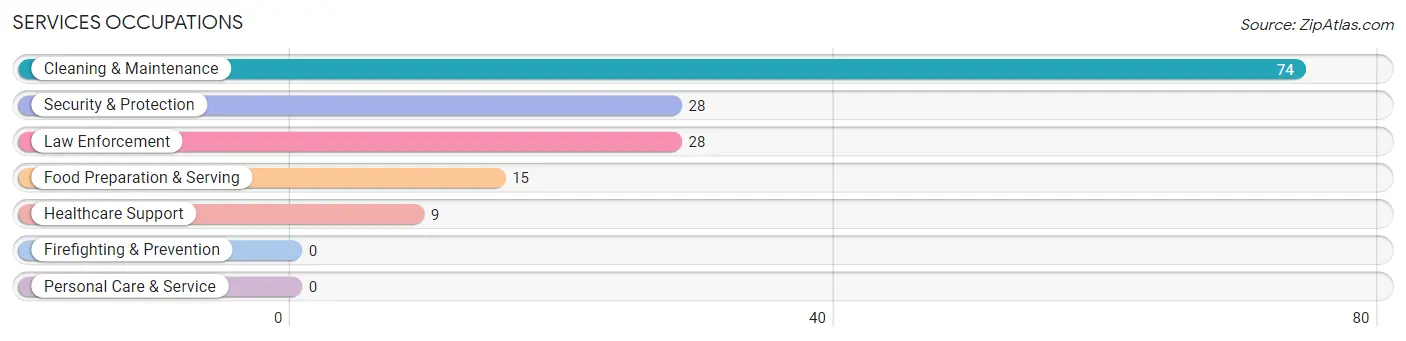
Services Occupations
The most common Services occupations in Riverside are Cleaning & Maintenance (74 | 12.7%), Security & Protection (28 | 4.8%), Law Enforcement (28 | 4.8%), Food Preparation & Serving (15 | 2.6%), and Healthcare Support (9 | 1.5%).
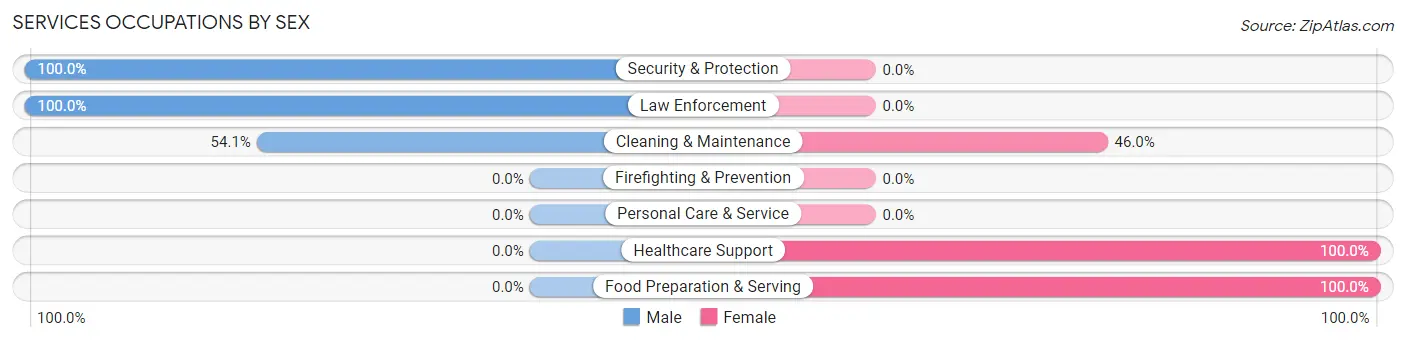
Services Occupations by Sex
Within the Services occupations in Riverside, the most male-oriented occupations are Security & Protection (100.0%), Law Enforcement (100.0%), and Cleaning & Maintenance (54.0%), while the most female-oriented occupations are Healthcare Support (100.0%), Food Preparation & Serving (100.0%), and Cleaning & Maintenance (46.0%).
| Occupation | Male | Female |
| Healthcare Support | 0 (0.0%) | 9 (100.0%) |
| Security & Protection | 28 (100.0%) | 0 (0.0%) |
| Firefighting & Prevention | 0 (0.0%) | 0 (0.0%) |
| Law Enforcement | 28 (100.0%) | 0 (0.0%) |
| Food Preparation & Serving | 0 (0.0%) | 15 (100.0%) |
| Cleaning & Maintenance | 40 (54.0%) | 34 (46.0%) |
| Personal Care & Service | 0 (0.0%) | 0 (0.0%) |
| Total (Category) | 68 (54.0%) | 58 (46.0%) |
| Total (Overall) | 325 (55.8%) | 257 (44.2%) |
Sales and Office Occupations
The most common Sales and Office occupations in Riverside are Sales & Related (98 | 16.8%), and Office & Administration (78 | 13.4%).
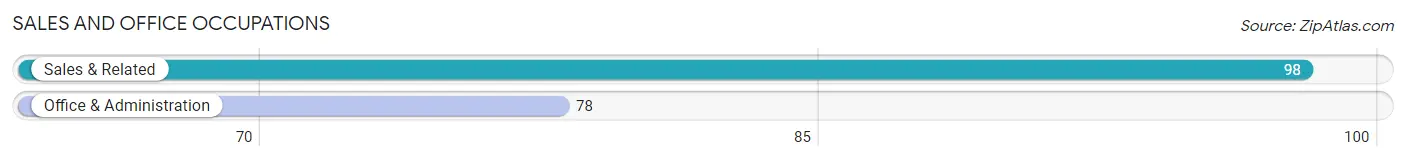
Sales and Office Occupations by Sex
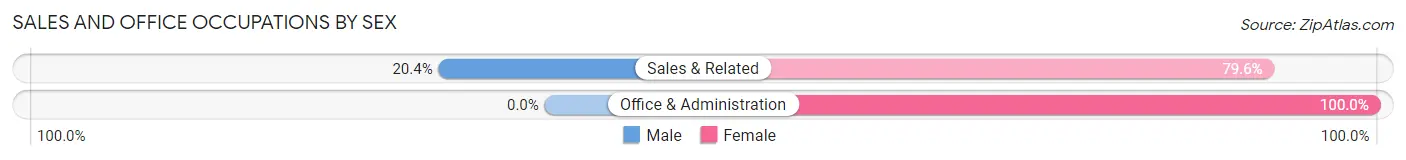
| Occupation | Male | Female |
| Sales & Related | 20 (20.4%) | 78 (79.6%) |
| Office & Administration | 0 (0.0%) | 78 (100.0%) |
| Total (Category) | 20 (11.4%) | 156 (88.6%) |
| Total (Overall) | 325 (55.8%) | 257 (44.2%) |
Natural Resources, Construction and Maintenance Occupations
The most common Natural Resources, Construction and Maintenance occupations in Riverside are Installation, Maintenance & Repair (75 | 12.9%), and Construction & Extraction (19 | 3.3%).
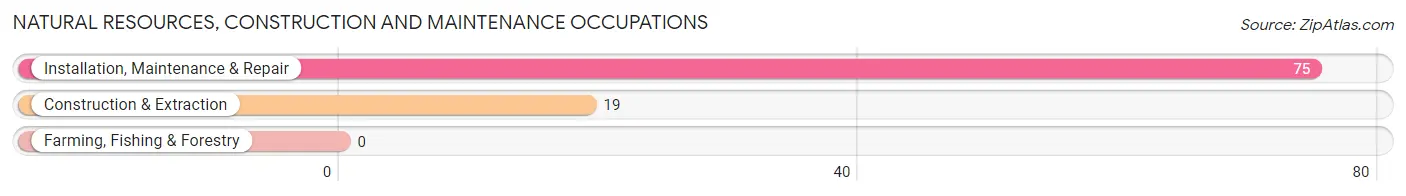
Natural Resources, Construction and Maintenance Occupations by Sex
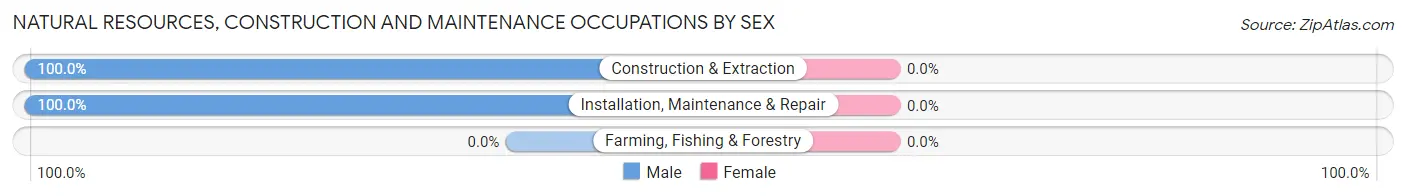
| Occupation | Male | Female |
| Farming, Fishing & Forestry | 0 (0.0%) | 0 (0.0%) |
| Construction & Extraction | 19 (100.0%) | 0 (0.0%) |
| Installation, Maintenance & Repair | 75 (100.0%) | 0 (0.0%) |
| Total (Category) | 94 (100.0%) | 0 (0.0%) |
| Total (Overall) | 325 (55.8%) | 257 (44.2%) |
Production, Transportation and Moving Occupations
The most common Production, Transportation and Moving occupations in Riverside are Transportation (33 | 5.7%), and Production (22 | 3.8%).
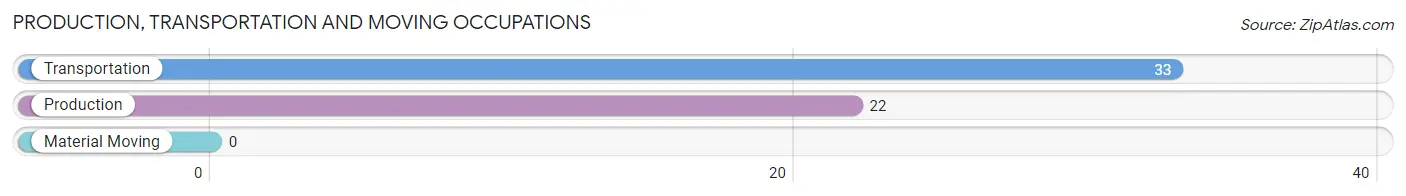
Production, Transportation and Moving Occupations by Sex
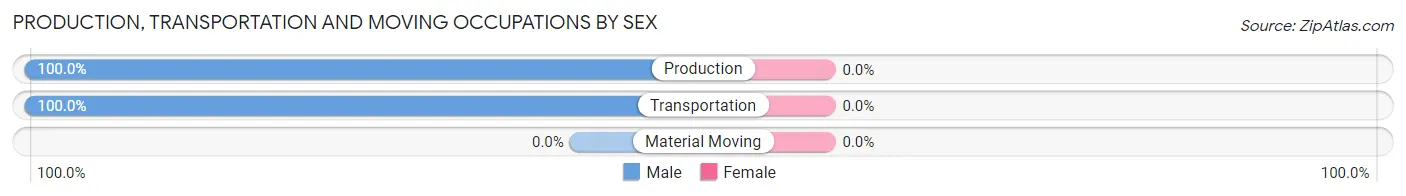
| Occupation | Male | Female |
| Production | 22 (100.0%) | 0 (0.0%) |
| Transportation | 33 (100.0%) | 0 (0.0%) |
| Material Moving | 0 (0.0%) | 0 (0.0%) |
| Total (Category) | 55 (100.0%) | 0 (0.0%) |
| Total (Overall) | 325 (55.8%) | 257 (44.2%) |
Employment Industries by Sex in Riverside
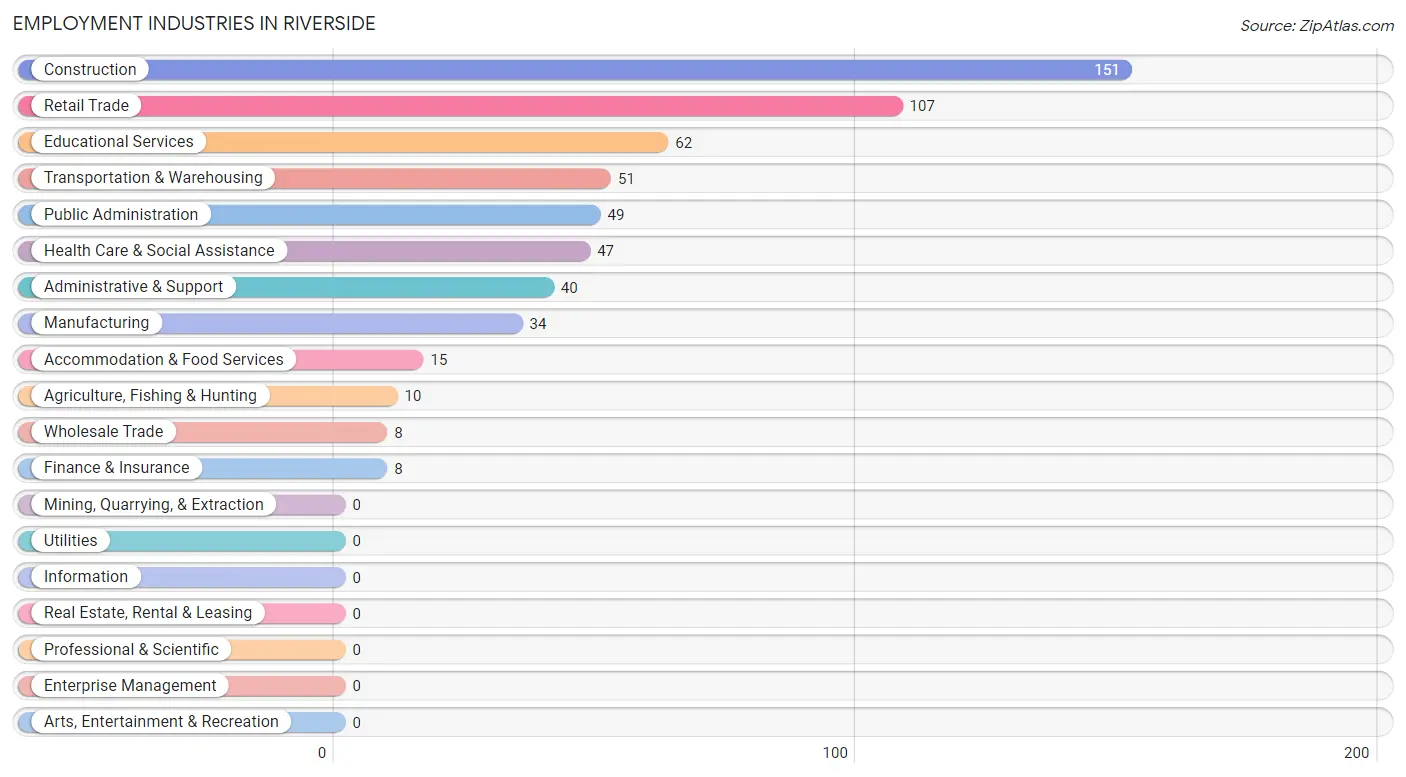
Employment Industries in Riverside
The major employment industries in Riverside include Construction (151 | 26.0%), Retail Trade (107 | 18.4%), Educational Services (62 | 10.6%), Transportation & Warehousing (51 | 8.8%), and Public Administration (49 | 8.4%).
Employment Industries by Sex in Riverside
The Riverside industries that see more men than women are Agriculture, Fishing & Hunting (100.0%), Construction (100.0%), and Wholesale Trade (100.0%), whereas the industries that tend to have a higher number of women are Accommodation & Food Services (100.0%), Retail Trade (96.3%), and Educational Services (85.5%).
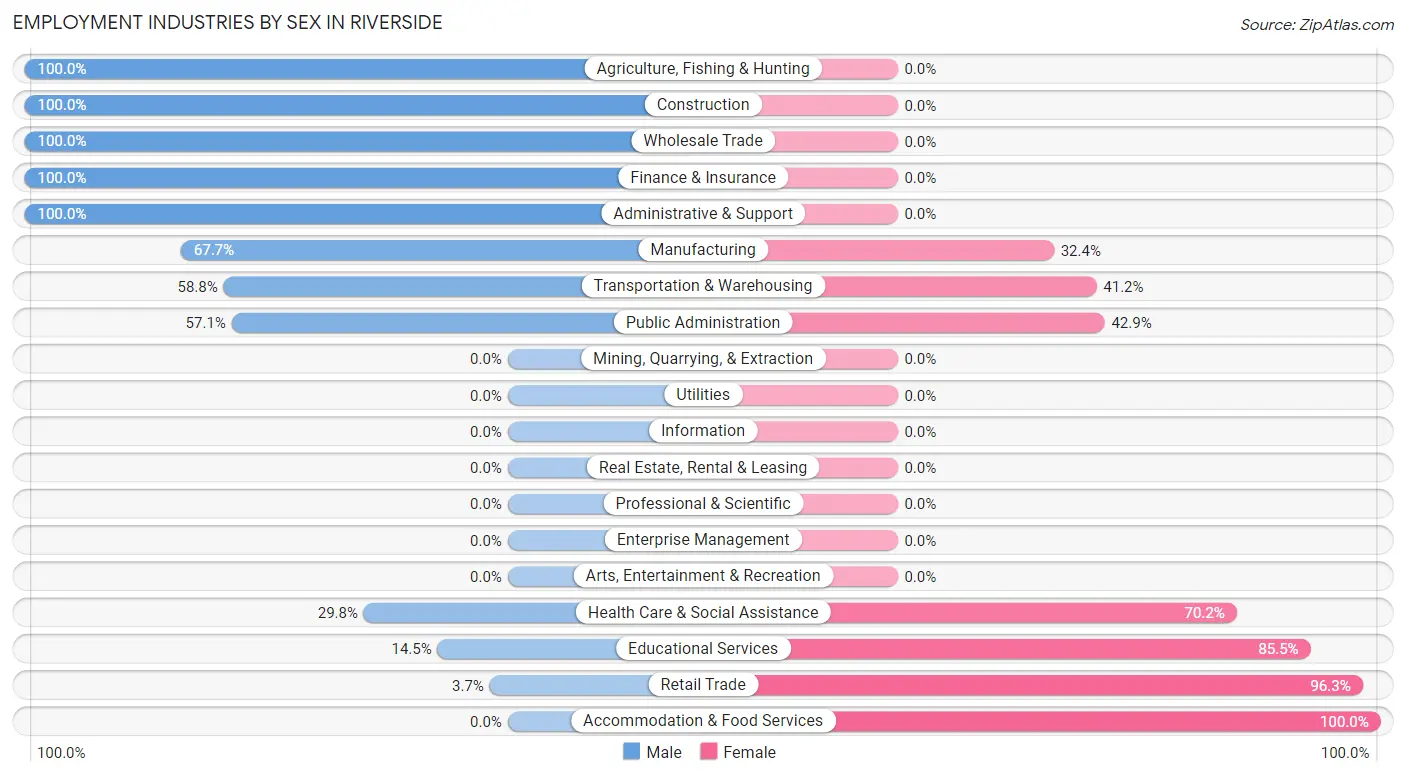
| Industry | Male | Female |
| Agriculture, Fishing & Hunting | 10 (100.0%) | 0 (0.0%) |
| Mining, Quarrying, & Extraction | 0 (0.0%) | 0 (0.0%) |
| Construction | 151 (100.0%) | 0 (0.0%) |
| Manufacturing | 23 (67.6%) | 11 (32.4%) |
| Wholesale Trade | 8 (100.0%) | 0 (0.0%) |
| Retail Trade | 4 (3.7%) | 103 (96.3%) |
| Transportation & Warehousing | 30 (58.8%) | 21 (41.2%) |
| Utilities | 0 (0.0%) | 0 (0.0%) |
| Information | 0 (0.0%) | 0 (0.0%) |
| Finance & Insurance | 8 (100.0%) | 0 (0.0%) |
| Real Estate, Rental & Leasing | 0 (0.0%) | 0 (0.0%) |
| Professional & Scientific | 0 (0.0%) | 0 (0.0%) |
| Enterprise Management | 0 (0.0%) | 0 (0.0%) |
| Administrative & Support | 40 (100.0%) | 0 (0.0%) |
| Educational Services | 9 (14.5%) | 53 (85.5%) |
| Health Care & Social Assistance | 14 (29.8%) | 33 (70.2%) |
| Arts, Entertainment & Recreation | 0 (0.0%) | 0 (0.0%) |
| Accommodation & Food Services | 0 (0.0%) | 15 (100.0%) |
| Public Administration | 28 (57.1%) | 21 (42.9%) |
| Total | 325 (55.8%) | 257 (44.2%) |
Education in Riverside
School Enrollment in Riverside
The most common levels of schooling among the 276 students in Riverside are elementary school (87 | 31.5%), middle school (81 | 29.3%), and high school (44 | 15.9%).
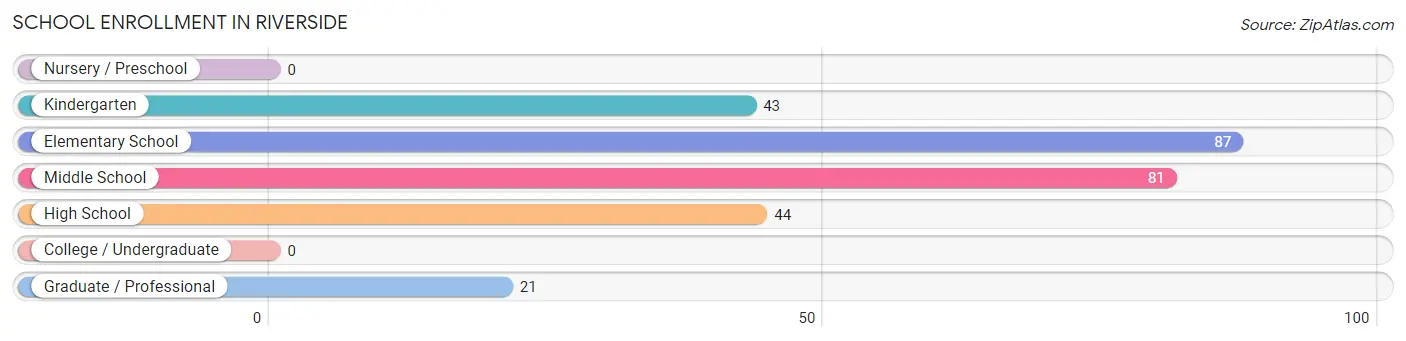
| School Level | # Students | % Students |
| Nursery / Preschool | 0 | 0.0% |
| Kindergarten | 43 | 15.6% |
| Elementary School | 87 | 31.5% |
| Middle School | 81 | 29.3% |
| High School | 44 | 15.9% |
| College / Undergraduate | 0 | 0.0% |
| Graduate / Professional | 21 | 7.6% |
| Total | 276 | 100.0% |
School Enrollment by Age by Funding Source in Riverside
Out of a total of 276 students who are enrolled in schools in Riverside, 21 (7.6%) attend a private institution, while the remaining 255 (92.4%) are enrolled in public schools. The age group of 35 years and over has the highest likelihood of being enrolled in private schools, with 21 (100.0% in the age bracket) enrolled. Conversely, the age group of 5 to 9 year old has the lowest likelihood of being enrolled in a private school, with 106 (100.0% in the age bracket) attending a public institution.
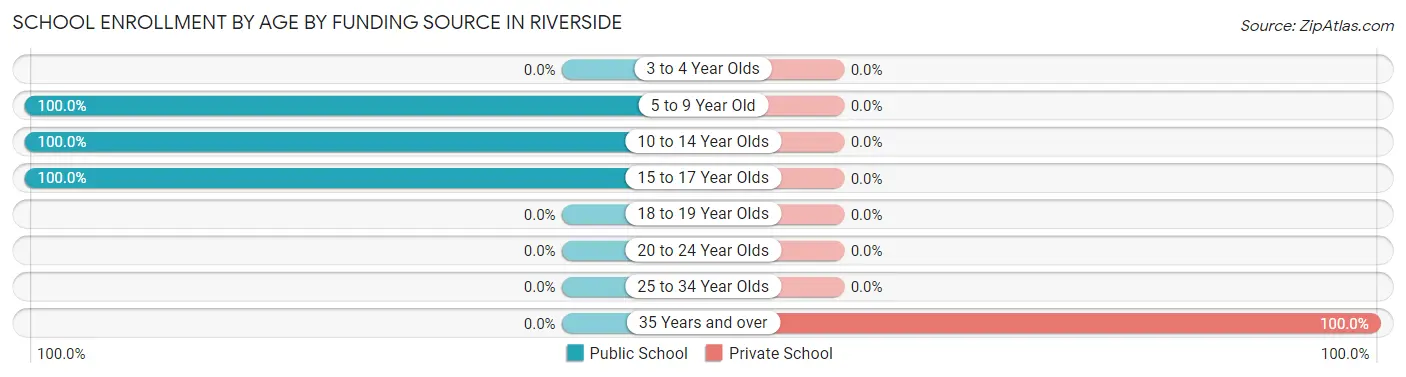
| Age Bracket | Public School | Private School |
| 3 to 4 Year Olds | 0 (0.0%) | 0 (0.0%) |
| 5 to 9 Year Old | 106 (100.0%) | 0 (0.0%) |
| 10 to 14 Year Olds | 115 (100.0%) | 0 (0.0%) |
| 15 to 17 Year Olds | 34 (100.0%) | 0 (0.0%) |
| 18 to 19 Year Olds | 0 (0.0%) | 0 (0.0%) |
| 20 to 24 Year Olds | 0 (0.0%) | 0 (0.0%) |
| 25 to 34 Year Olds | 0 (0.0%) | 0 (0.0%) |
| 35 Years and over | 0 (0.0%) | 21 (100.0%) |
| Total | 255 (92.4%) | 21 (7.6%) |
Educational Attainment by Field of Study in Riverside
Engineering (36 | 23.8%), arts & humanities (32 | 21.2%), education (28 | 18.5%), science & technology (24 | 15.9%), and social sciences (9 | 6.0%) are the most common fields of study among 151 individuals in Riverside who have obtained a bachelor's degree or higher.
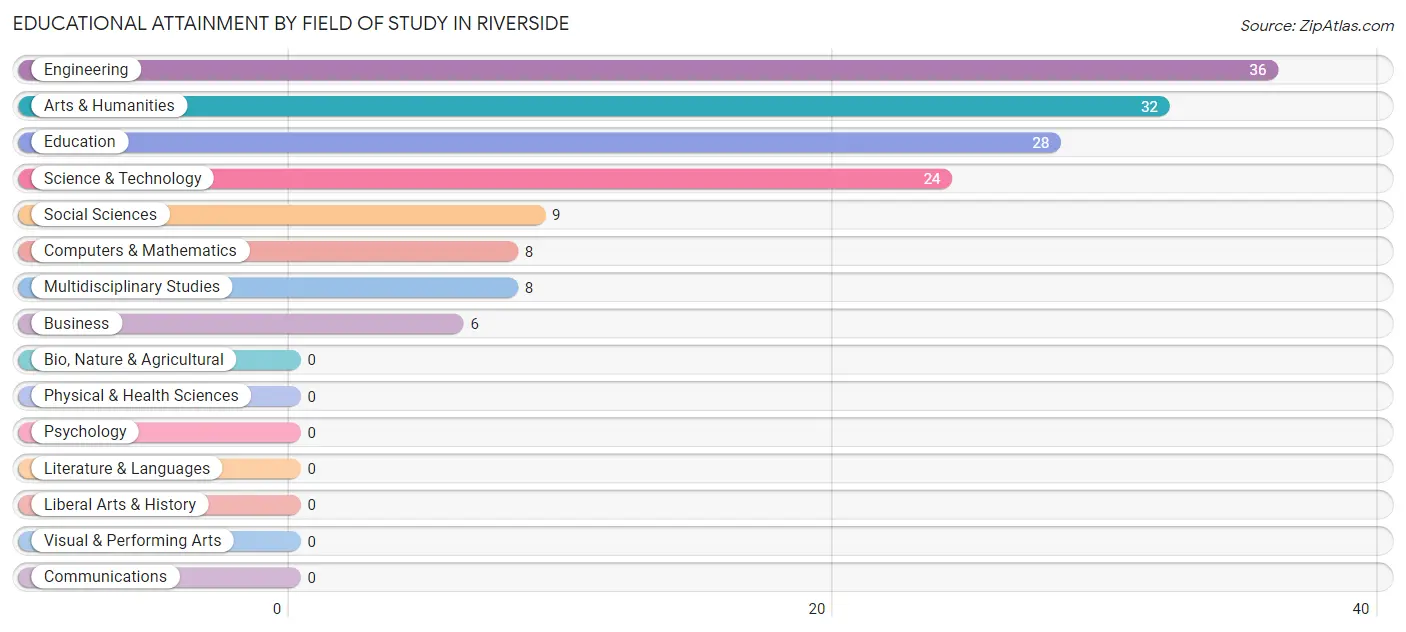
| Field of Study | # Graduates | % Graduates |
| Computers & Mathematics | 8 | 5.3% |
| Bio, Nature & Agricultural | 0 | 0.0% |
| Physical & Health Sciences | 0 | 0.0% |
| Psychology | 0 | 0.0% |
| Social Sciences | 9 | 6.0% |
| Engineering | 36 | 23.8% |
| Multidisciplinary Studies | 8 | 5.3% |
| Science & Technology | 24 | 15.9% |
| Business | 6 | 4.0% |
| Education | 28 | 18.5% |
| Literature & Languages | 0 | 0.0% |
| Liberal Arts & History | 0 | 0.0% |
| Visual & Performing Arts | 0 | 0.0% |
| Communications | 0 | 0.0% |
| Arts & Humanities | 32 | 21.2% |
| Total | 151 | 100.0% |
Transportation & Commute in Riverside
Vehicle Availability by Sex in Riverside
The most prevalent vehicle ownership categories in Riverside are males with 2 vehicles (203, accounting for 62.5%) and females with 2 vehicles (153, making up 81.9%).
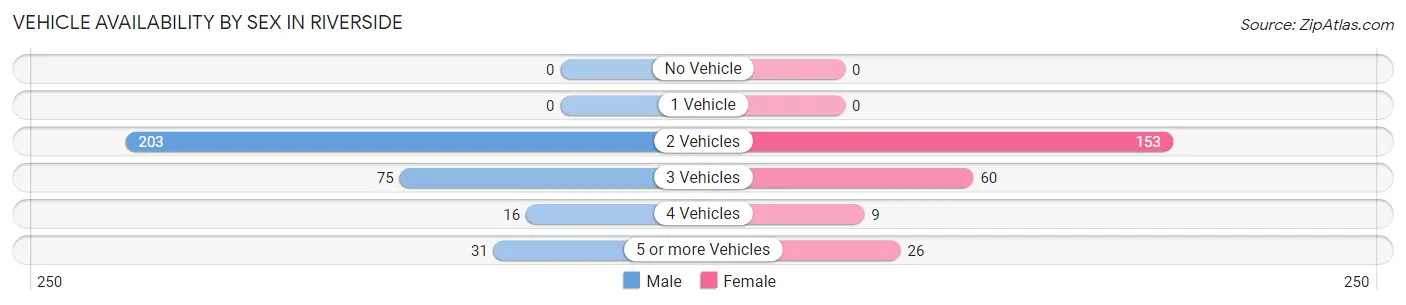
| Vehicles Available | Male | Female |
| No Vehicle | 0 (0.0%) | 0 (0.0%) |
| 1 Vehicle | 0 (0.0%) | 0 (0.0%) |
| 2 Vehicles | 203 (62.5%) | 153 (61.7%) |
| 3 Vehicles | 75 (23.1%) | 60 (24.2%) |
| 4 Vehicles | 16 (4.9%) | 9 (3.6%) |
| 5 or more Vehicles | 31 (9.5%) | 26 (10.5%) |
| Total | 325 (100.0%) | 248 (100.0%) |
Commute Time in Riverside
The most frequently occuring commute durations in Riverside are 10 to 14 minutes (127 commuters, 24.5%), 30 to 34 minutes (96 commuters, 18.5%), and 35 to 39 minutes (76 commuters, 14.6%).
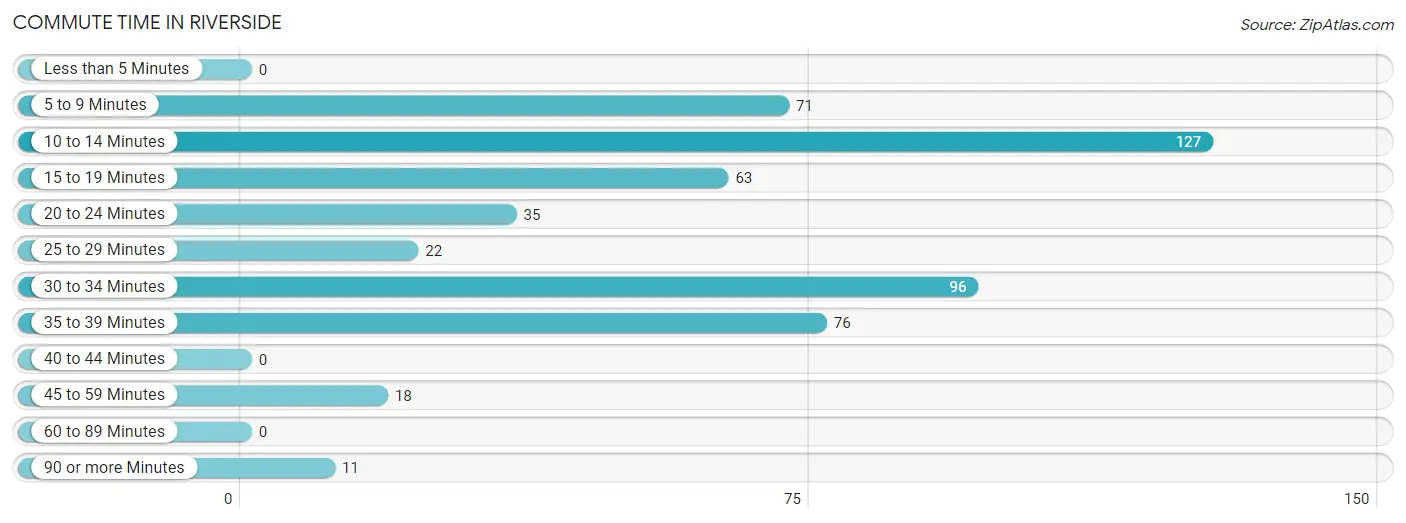
| Commute Time | # Commuters | % Commuters |
| Less than 5 Minutes | 0 | 0.0% |
| 5 to 9 Minutes | 71 | 13.7% |
| 10 to 14 Minutes | 127 | 24.5% |
| 15 to 19 Minutes | 63 | 12.1% |
| 20 to 24 Minutes | 35 | 6.7% |
| 25 to 29 Minutes | 22 | 4.2% |
| 30 to 34 Minutes | 96 | 18.5% |
| 35 to 39 Minutes | 76 | 14.6% |
| 40 to 44 Minutes | 0 | 0.0% |
| 45 to 59 Minutes | 18 | 3.5% |
| 60 to 89 Minutes | 0 | 0.0% |
| 90 or more Minutes | 11 | 2.1% |
Commute Time by Sex in Riverside
The most common commute times in Riverside are 35 to 39 minutes (76 commuters, 28.0%) for males and 10 to 14 minutes (67 commuters, 27.0%) for females.
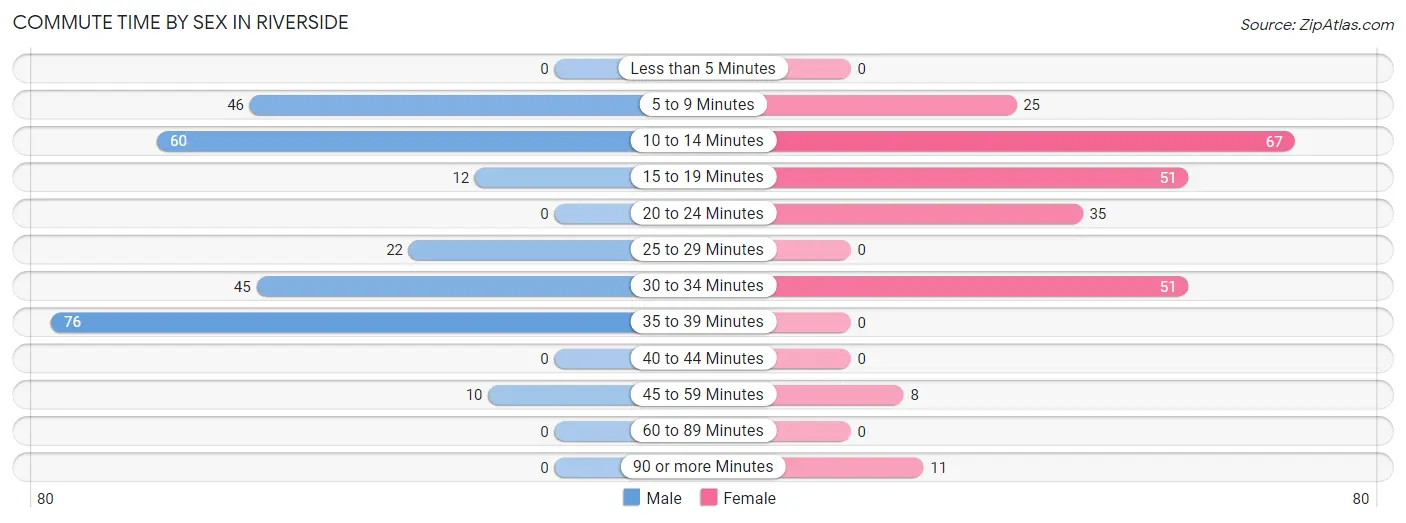
| Commute Time | Male | Female |
| Less than 5 Minutes | 0 (0.0%) | 0 (0.0%) |
| 5 to 9 Minutes | 46 (17.0%) | 25 (10.1%) |
| 10 to 14 Minutes | 60 (22.1%) | 67 (27.0%) |
| 15 to 19 Minutes | 12 (4.4%) | 51 (20.6%) |
| 20 to 24 Minutes | 0 (0.0%) | 35 (14.1%) |
| 25 to 29 Minutes | 22 (8.1%) | 0 (0.0%) |
| 30 to 34 Minutes | 45 (16.6%) | 51 (20.6%) |
| 35 to 39 Minutes | 76 (28.0%) | 0 (0.0%) |
| 40 to 44 Minutes | 0 (0.0%) | 0 (0.0%) |
| 45 to 59 Minutes | 10 (3.7%) | 8 (3.2%) |
| 60 to 89 Minutes | 0 (0.0%) | 0 (0.0%) |
| 90 or more Minutes | 0 (0.0%) | 11 (4.4%) |
Time of Departure to Work by Sex in Riverside
The most frequent times of departure to work in Riverside are 7:30 AM to 7:59 AM (101, 37.3%) for males and 8:00 AM to 8:29 AM (86, 34.7%) for females.
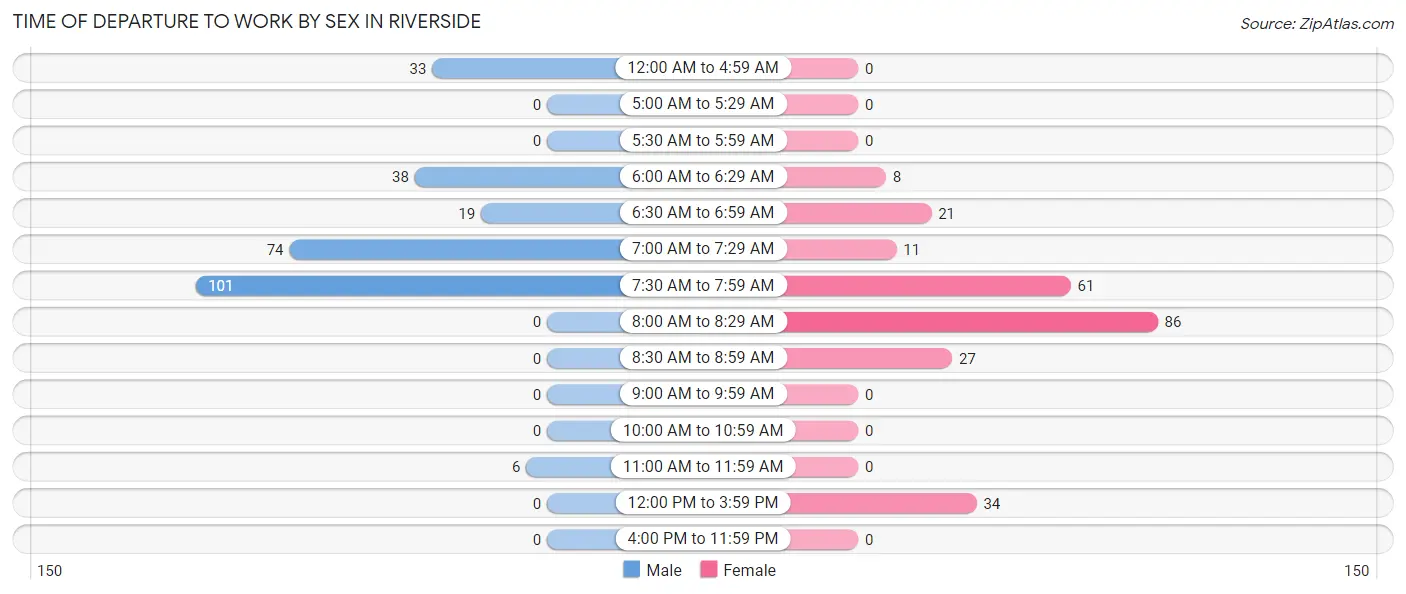
| Time of Departure | Male | Female |
| 12:00 AM to 4:59 AM | 33 (12.2%) | 0 (0.0%) |
| 5:00 AM to 5:29 AM | 0 (0.0%) | 0 (0.0%) |
| 5:30 AM to 5:59 AM | 0 (0.0%) | 0 (0.0%) |
| 6:00 AM to 6:29 AM | 38 (14.0%) | 8 (3.2%) |
| 6:30 AM to 6:59 AM | 19 (7.0%) | 21 (8.5%) |
| 7:00 AM to 7:29 AM | 74 (27.3%) | 11 (4.4%) |
| 7:30 AM to 7:59 AM | 101 (37.3%) | 61 (24.6%) |
| 8:00 AM to 8:29 AM | 0 (0.0%) | 86 (34.7%) |
| 8:30 AM to 8:59 AM | 0 (0.0%) | 27 (10.9%) |
| 9:00 AM to 9:59 AM | 0 (0.0%) | 0 (0.0%) |
| 10:00 AM to 10:59 AM | 0 (0.0%) | 0 (0.0%) |
| 11:00 AM to 11:59 AM | 6 (2.2%) | 0 (0.0%) |
| 12:00 PM to 3:59 PM | 0 (0.0%) | 34 (13.7%) |
| 4:00 PM to 11:59 PM | 0 (0.0%) | 0 (0.0%) |
| Total | 271 (100.0%) | 248 (100.0%) |
Housing Occupancy in Riverside
Occupancy by Ownership in Riverside
Of the total 331 dwellings in Riverside, owner-occupied units account for 331 (100.0%), while renter-occupied units make up 0 (0.0%).
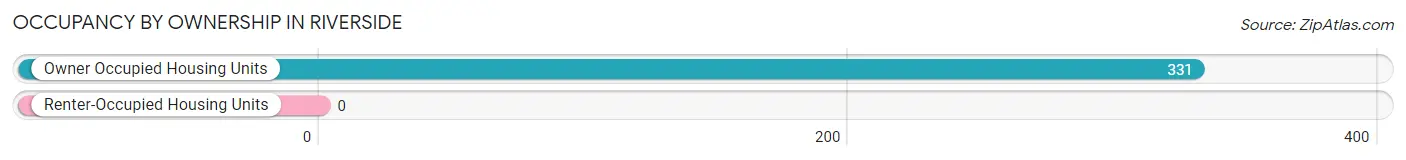
| Occupancy | # Housing Units | % Housing Units |
| Owner Occupied Housing Units | 331 | 100.0% |
| Renter-Occupied Housing Units | 0 | 0.0% |
| Total Occupied Housing Units | 331 | 100.0% |
Occupancy by Household Size in Riverside
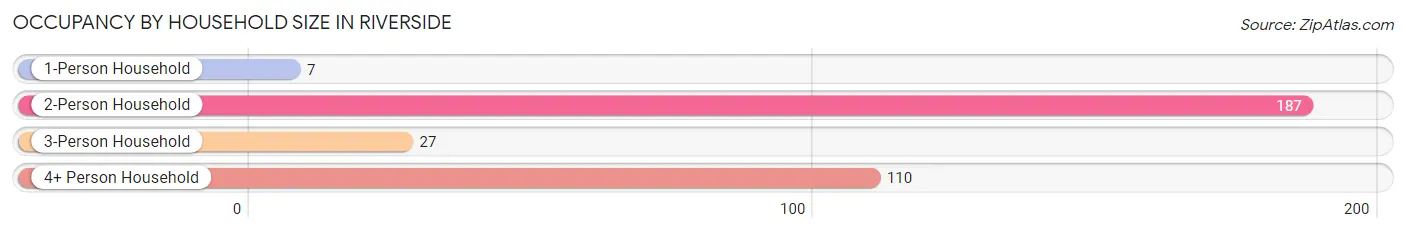
| Household Size | # Housing Units | % Housing Units |
| 1-Person Household | 7 | 2.1% |
| 2-Person Household | 187 | 56.5% |
| 3-Person Household | 27 | 8.2% |
| 4+ Person Household | 110 | 33.2% |
| Total Housing Units | 331 | 100.0% |
Occupancy by Ownership by Household Size in Riverside
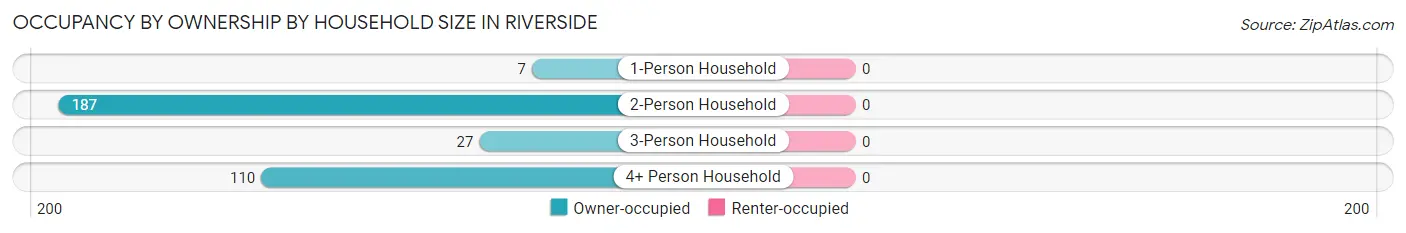
| Household Size | Owner-occupied | Renter-occupied |
| 1-Person Household | 7 (100.0%) | 0 (0.0%) |
| 2-Person Household | 187 (100.0%) | 0 (0.0%) |
| 3-Person Household | 27 (100.0%) | 0 (0.0%) |
| 4+ Person Household | 110 (100.0%) | 0 (0.0%) |
| Total Housing Units | 331 (100.0%) | 0 (0.0%) |
Occupancy by Educational Attainment in Riverside
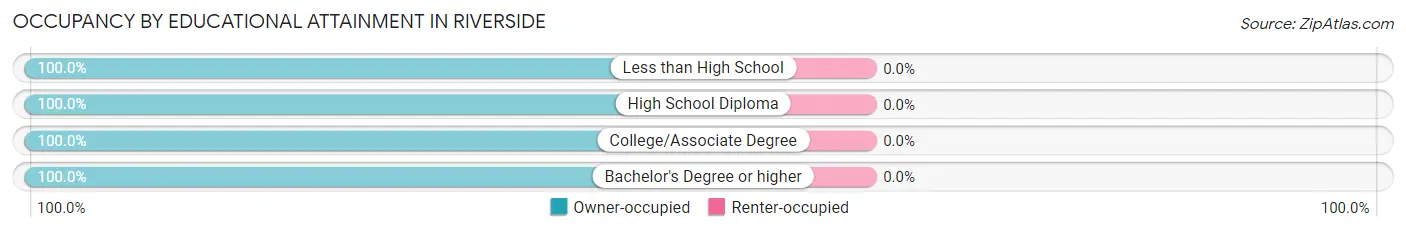
| Household Size | Owner-occupied | Renter-occupied |
| Less than High School | 29 (100.0%) | 0 (0.0%) |
| High School Diploma | 141 (100.0%) | 0 (0.0%) |
| College/Associate Degree | 102 (100.0%) | 0 (0.0%) |
| Bachelor's Degree or higher | 59 (100.0%) | 0 (0.0%) |
Occupancy by Age of Householder in Riverside
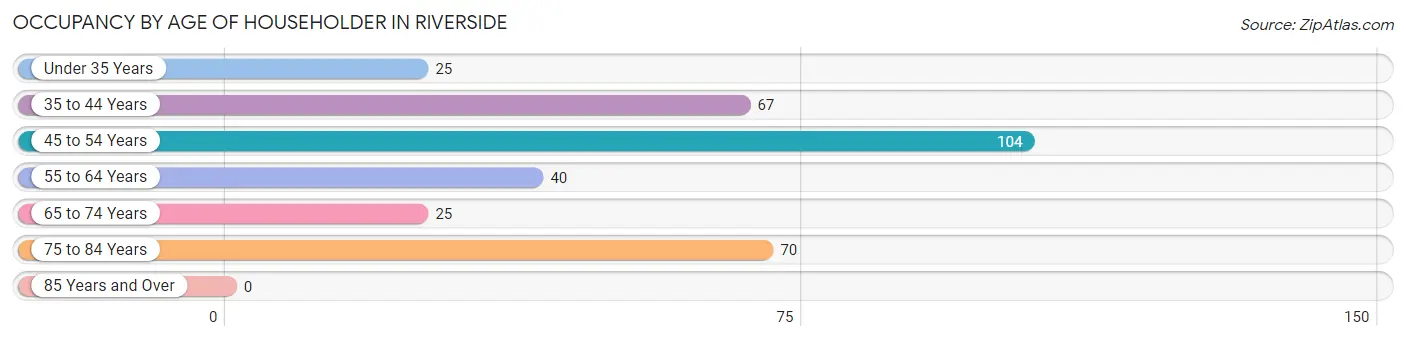
| Age Bracket | # Households | % Households |
| Under 35 Years | 25 | 7.5% |
| 35 to 44 Years | 67 | 20.2% |
| 45 to 54 Years | 104 | 31.4% |
| 55 to 64 Years | 40 | 12.1% |
| 65 to 74 Years | 25 | 7.5% |
| 75 to 84 Years | 70 | 21.1% |
| 85 Years and Over | 0 | 0.0% |
| Total | 331 | 100.0% |
Housing Finances in Riverside
Median Income by Occupancy in Riverside
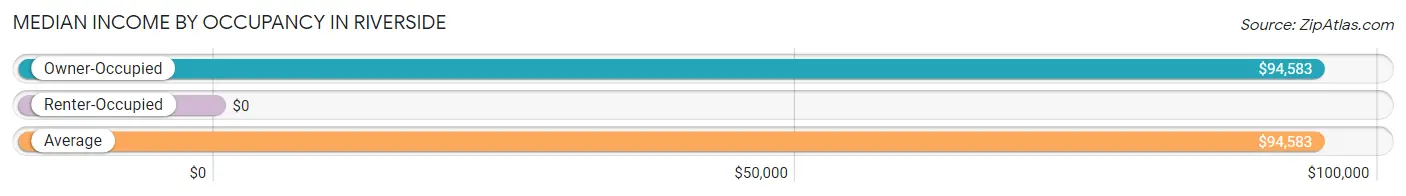
| Occupancy Type | # Households | Median Income |
| Owner-Occupied | 331 (100.0%) | $94,583 |
| Renter-Occupied | 0 (0.0%) | $0 |
| Average | 331 (100.0%) | $94,583 |
Occupancy by Householder Income Bracket in Riverside
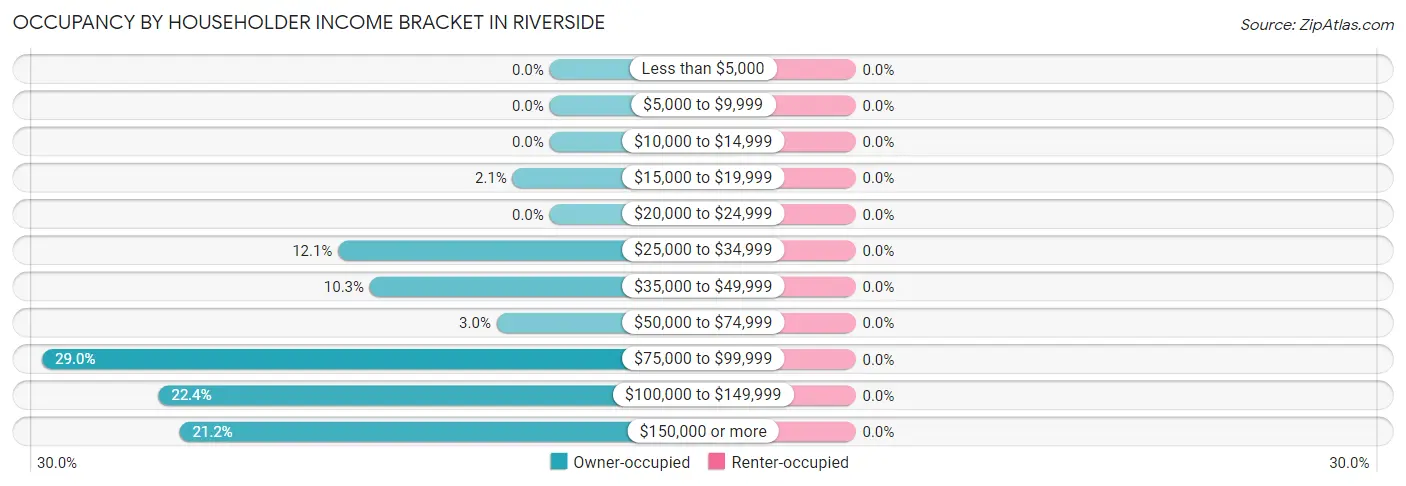
| Income Bracket | Owner-occupied | Renter-occupied |
| Less than $5,000 | 0 (0.0%) | 0 (0.0%) |
| $5,000 to $9,999 | 0 (0.0%) | 0 (0.0%) |
| $10,000 to $14,999 | 0 (0.0%) | 0 (0.0%) |
| $15,000 to $19,999 | 7 (2.1%) | 0 (0.0%) |
| $20,000 to $24,999 | 0 (0.0%) | 0 (0.0%) |
| $25,000 to $34,999 | 40 (12.1%) | 0 (0.0%) |
| $35,000 to $49,999 | 34 (10.3%) | 0 (0.0%) |
| $50,000 to $74,999 | 10 (3.0%) | 0 (0.0%) |
| $75,000 to $99,999 | 96 (29.0%) | 0 (0.0%) |
| $100,000 to $149,999 | 74 (22.4%) | 0 (0.0%) |
| $150,000 or more | 70 (21.1%) | 0 (0.0%) |
| Total | 331 (100.0%) | 0 (0.0%) |
Monthly Housing Cost Tiers in Riverside
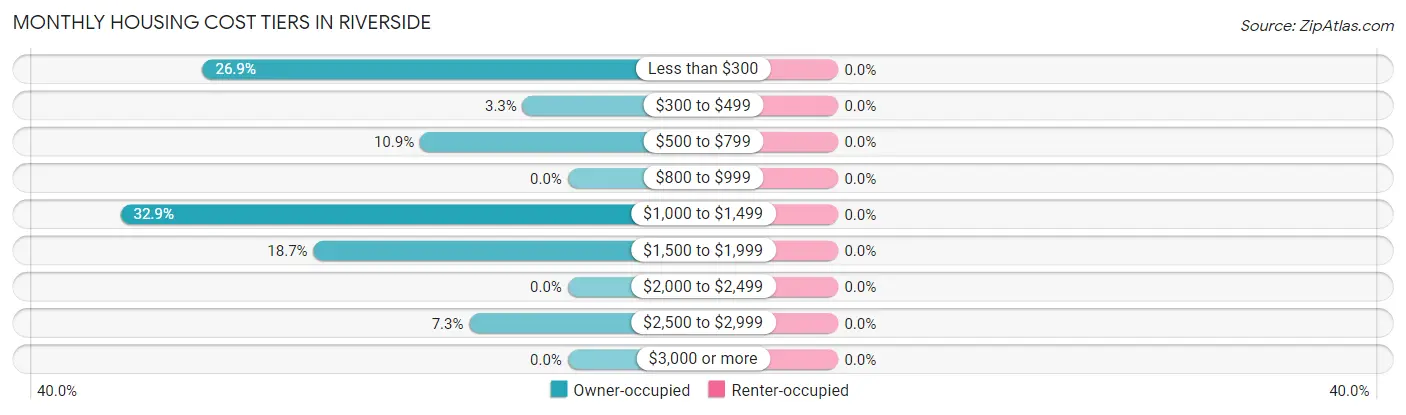
| Monthly Cost | Owner-occupied | Renter-occupied |
| Less than $300 | 89 (26.9%) | 0 (0.0%) |
| $300 to $499 | 11 (3.3%) | 0 (0.0%) |
| $500 to $799 | 36 (10.9%) | 0 (0.0%) |
| $800 to $999 | 0 (0.0%) | 0 (0.0%) |
| $1,000 to $1,499 | 109 (32.9%) | 0 (0.0%) |
| $1,500 to $1,999 | 62 (18.7%) | 0 (0.0%) |
| $2,000 to $2,499 | 0 (0.0%) | 0 (0.0%) |
| $2,500 to $2,999 | 24 (7.2%) | 0 (0.0%) |
| $3,000 or more | 0 (0.0%) | 0 (0.0%) |
| Total | 331 (100.0%) | 0 (0.0%) |
Physical Housing Characteristics in Riverside
Housing Structures in Riverside
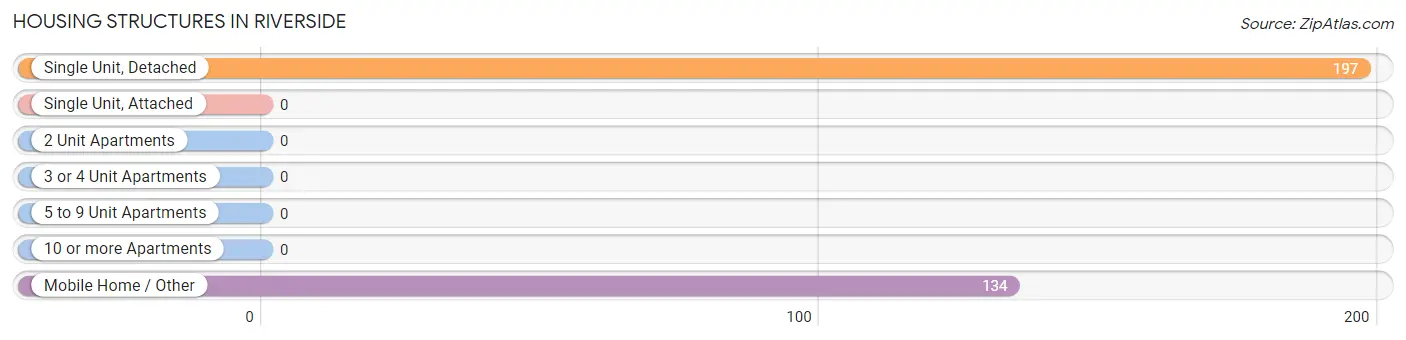
| Structure Type | # Housing Units | % Housing Units |
| Single Unit, Detached | 197 | 59.5% |
| Single Unit, Attached | 0 | 0.0% |
| 2 Unit Apartments | 0 | 0.0% |
| 3 or 4 Unit Apartments | 0 | 0.0% |
| 5 to 9 Unit Apartments | 0 | 0.0% |
| 10 or more Apartments | 0 | 0.0% |
| Mobile Home / Other | 134 | 40.5% |
| Total | 331 | 100.0% |
Housing Structures by Occupancy in Riverside
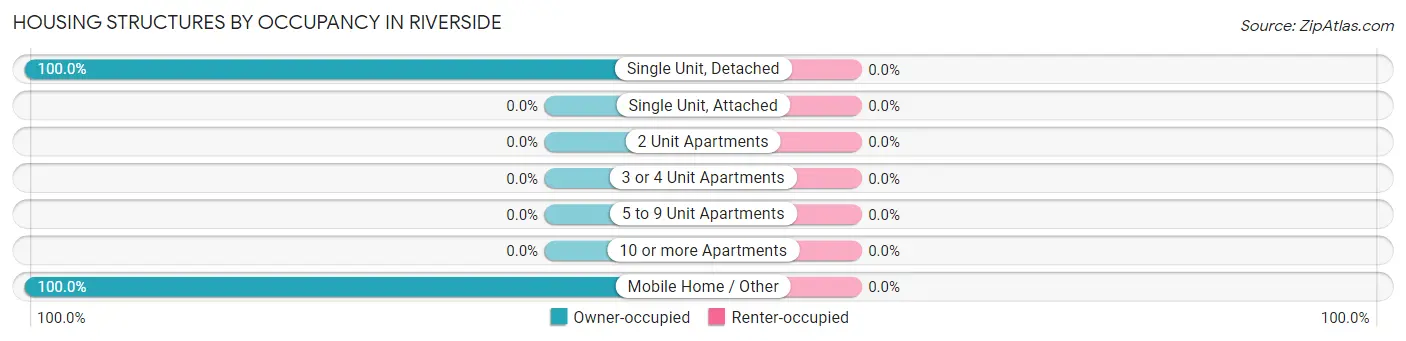
| Structure Type | Owner-occupied | Renter-occupied |
| Single Unit, Detached | 197 (100.0%) | 0 (0.0%) |
| Single Unit, Attached | 0 (0.0%) | 0 (0.0%) |
| 2 Unit Apartments | 0 (0.0%) | 0 (0.0%) |
| 3 or 4 Unit Apartments | 0 (0.0%) | 0 (0.0%) |
| 5 to 9 Unit Apartments | 0 (0.0%) | 0 (0.0%) |
| 10 or more Apartments | 0 (0.0%) | 0 (0.0%) |
| Mobile Home / Other | 134 (100.0%) | 0 (0.0%) |
| Total | 331 (100.0%) | 0 (0.0%) |
Housing Structures by Number of Rooms in Riverside
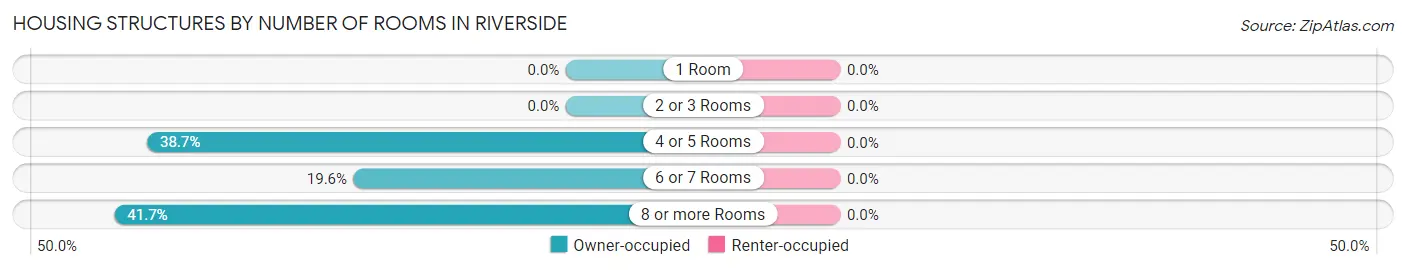
| Number of Rooms | Owner-occupied | Renter-occupied |
| 1 Room | 0 (0.0%) | 0 (0.0%) |
| 2 or 3 Rooms | 0 (0.0%) | 0 (0.0%) |
| 4 or 5 Rooms | 128 (38.7%) | 0 (0.0%) |
| 6 or 7 Rooms | 65 (19.6%) | 0 (0.0%) |
| 8 or more Rooms | 138 (41.7%) | 0 (0.0%) |
| Total | 331 (100.0%) | 0 (0.0%) |
Housing Structure by Heating Type in Riverside
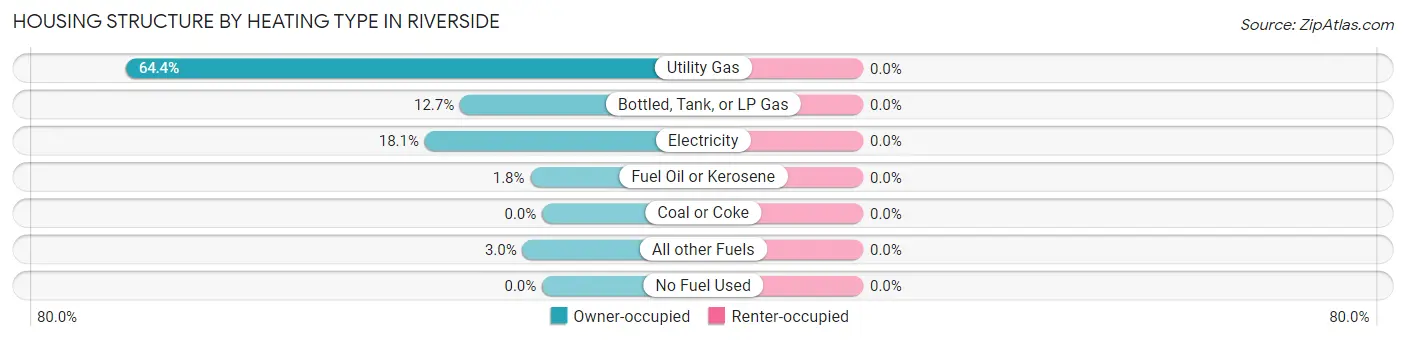
| Heating Type | Owner-occupied | Renter-occupied |
| Utility Gas | 213 (64.3%) | 0 (0.0%) |
| Bottled, Tank, or LP Gas | 42 (12.7%) | 0 (0.0%) |
| Electricity | 60 (18.1%) | 0 (0.0%) |
| Fuel Oil or Kerosene | 6 (1.8%) | 0 (0.0%) |
| Coal or Coke | 0 (0.0%) | 0 (0.0%) |
| All other Fuels | 10 (3.0%) | 0 (0.0%) |
| No Fuel Used | 0 (0.0%) | 0 (0.0%) |
| Total | 331 (100.0%) | 0 (0.0%) |
Household Vehicle Usage in Riverside
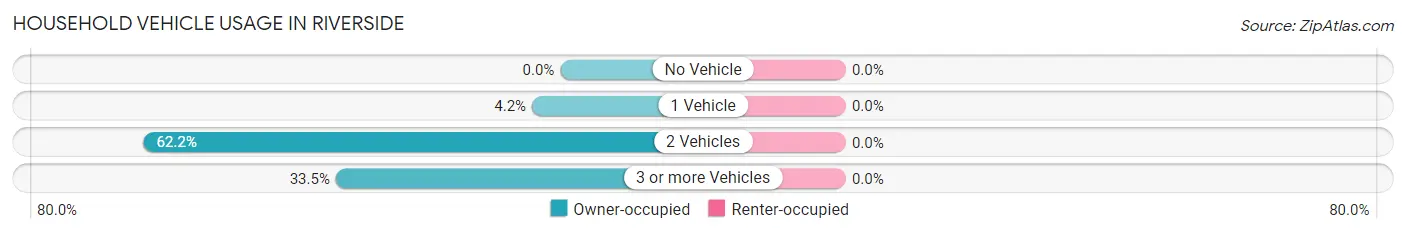
| Vehicles per Household | Owner-occupied | Renter-occupied |
| No Vehicle | 0 (0.0%) | 0 (0.0%) |
| 1 Vehicle | 14 (4.2%) | 0 (0.0%) |
| 2 Vehicles | 206 (62.2%) | 0 (0.0%) |
| 3 or more Vehicles | 111 (33.5%) | 0 (0.0%) |
| Total | 331 (100.0%) | 0 (0.0%) |
Real Estate & Mortgages in Riverside
Real Estate and Mortgage Overview in Riverside
| Characteristic | Without Mortgage | With Mortgage |
| Housing Units | 136 | 195 |
| Median Property Value | - | - |
| Median Household Income | - | - |
| Monthly Housing Costs | - | - |
| Real Estate Taxes | $199 | $0 |
Property Value by Mortgage Status in Riverside
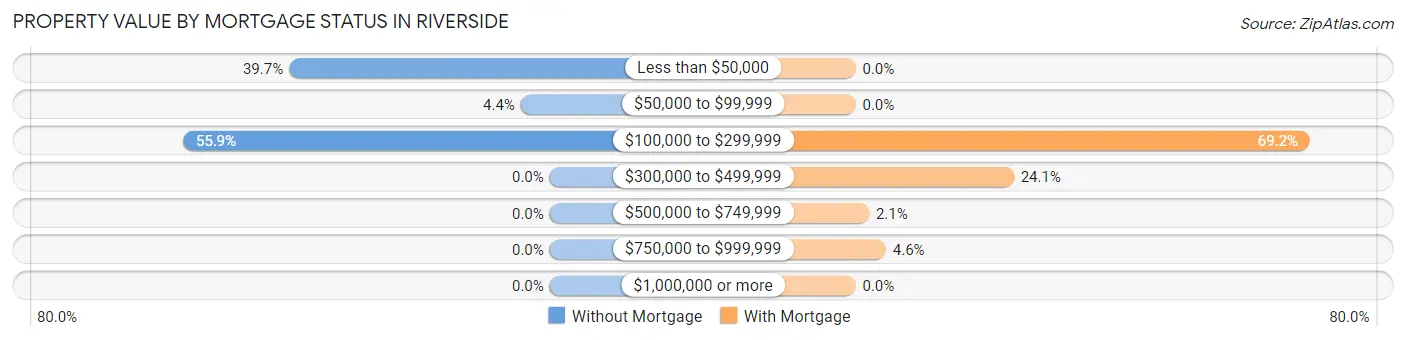
| Property Value | Without Mortgage | With Mortgage |
| Less than $50,000 | 54 (39.7%) | 0 (0.0%) |
| $50,000 to $99,999 | 6 (4.4%) | 0 (0.0%) |
| $100,000 to $299,999 | 76 (55.9%) | 135 (69.2%) |
| $300,000 to $499,999 | 0 (0.0%) | 47 (24.1%) |
| $500,000 to $749,999 | 0 (0.0%) | 4 (2.1%) |
| $750,000 to $999,999 | 0 (0.0%) | 9 (4.6%) |
| $1,000,000 or more | 0 (0.0%) | 0 (0.0%) |
| Total | 136 (100.0%) | 195 (100.0%) |
Household Income by Mortgage Status in Riverside
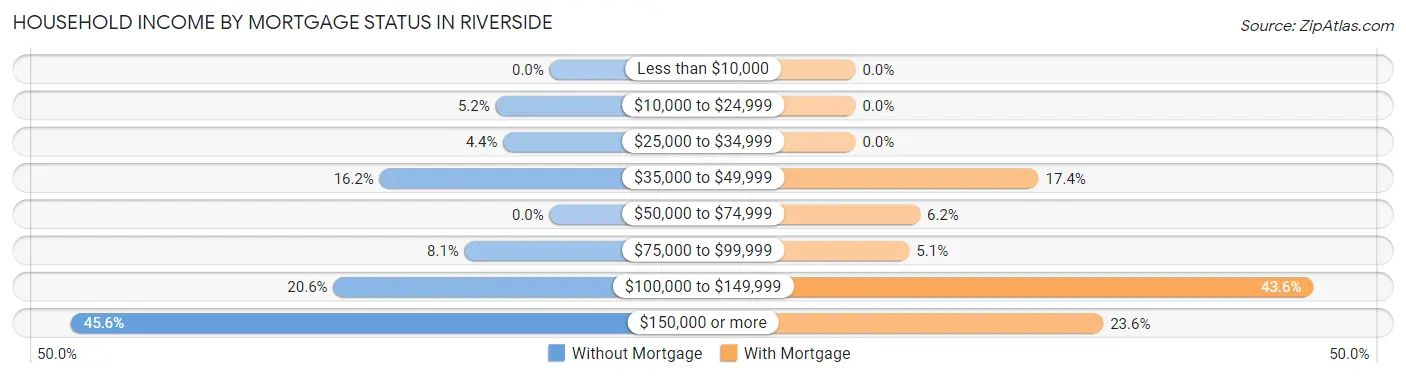
| Household Income | Without Mortgage | With Mortgage |
| Less than $10,000 | 0 (0.0%) | 0 (0.0%) |
| $10,000 to $24,999 | 7 (5.1%) | 0 (0.0%) |
| $25,000 to $34,999 | 6 (4.4%) | 0 (0.0%) |
| $35,000 to $49,999 | 22 (16.2%) | 34 (17.4%) |
| $50,000 to $74,999 | 0 (0.0%) | 12 (6.1%) |
| $75,000 to $99,999 | 11 (8.1%) | 10 (5.1%) |
| $100,000 to $149,999 | 28 (20.6%) | 85 (43.6%) |
| $150,000 or more | 62 (45.6%) | 46 (23.6%) |
| Total | 136 (100.0%) | 195 (100.0%) |
Property Value to Household Income Ratio in Riverside
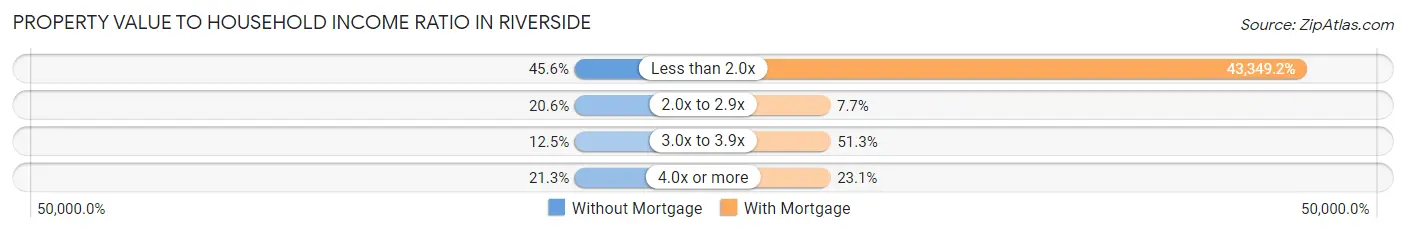
| Value-to-Income Ratio | Without Mortgage | With Mortgage |
| Less than 2.0x | 62 (45.6%) | 84,531 (43,349.2%) |
| 2.0x to 2.9x | 28 (20.6%) | 15 (7.7%) |
| 3.0x to 3.9x | 17 (12.5%) | 100 (51.3%) |
| 4.0x or more | 29 (21.3%) | 45 (23.1%) |
| Total | 136 (100.0%) | 195 (100.0%) |
Real Estate Taxes by Mortgage Status in Riverside
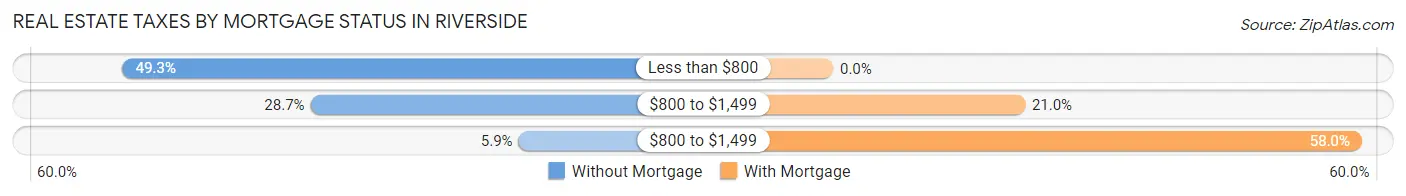
| Property Taxes | Without Mortgage | With Mortgage |
| Less than $800 | 67 (49.3%) | 0 (0.0%) |
| $800 to $1,499 | 39 (28.7%) | 41 (21.0%) |
| $800 to $1,499 | 8 (5.9%) | 113 (58.0%) |
| Total | 136 (100.0%) | 195 (100.0%) |
Health & Disability in Riverside
Health Insurance Coverage by Age in Riverside
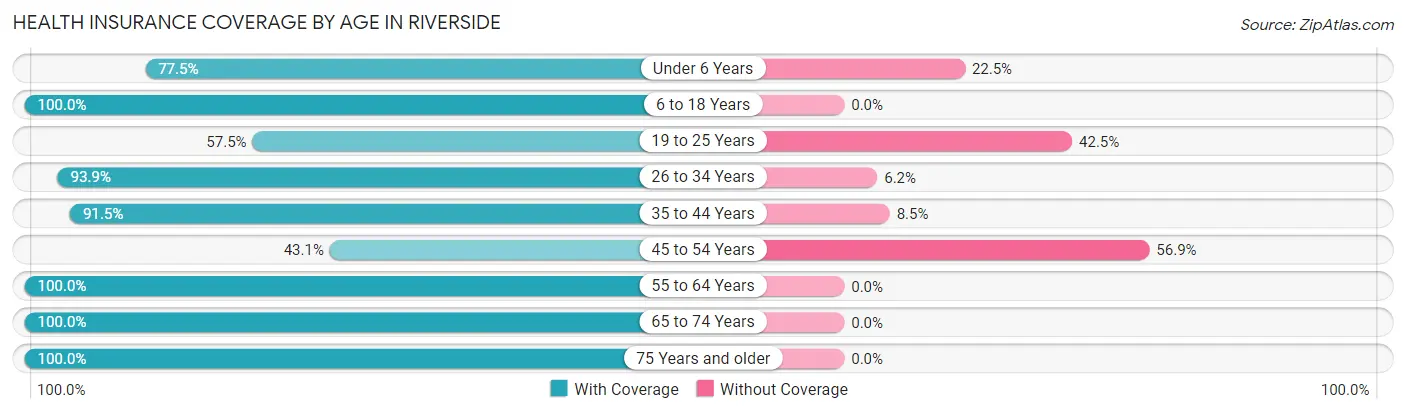
| Age Bracket | With Coverage | Without Coverage |
| Under 6 Years | 62 (77.5%) | 18 (22.5%) |
| 6 to 18 Years | 251 (100.0%) | 0 (0.0%) |
| 19 to 25 Years | 88 (57.5%) | 65 (42.5%) |
| 26 to 34 Years | 61 (93.9%) | 4 (6.1%) |
| 35 to 44 Years | 162 (91.5%) | 15 (8.5%) |
| 45 to 54 Years | 50 (43.1%) | 66 (56.9%) |
| 55 to 64 Years | 63 (100.0%) | 0 (0.0%) |
| 65 to 74 Years | 34 (100.0%) | 0 (0.0%) |
| 75 Years and older | 135 (100.0%) | 0 (0.0%) |
| Total | 906 (84.4%) | 168 (15.6%) |
Health Insurance Coverage by Citizenship Status in Riverside
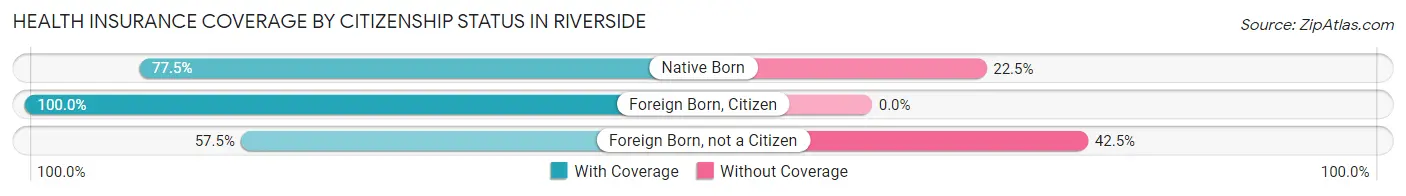
| Citizenship Status | With Coverage | Without Coverage |
| Native Born | 62 (77.5%) | 18 (22.5%) |
| Foreign Born, Citizen | 251 (100.0%) | 0 (0.0%) |
| Foreign Born, not a Citizen | 88 (57.5%) | 65 (42.5%) |
Health Insurance Coverage by Household Income in Riverside
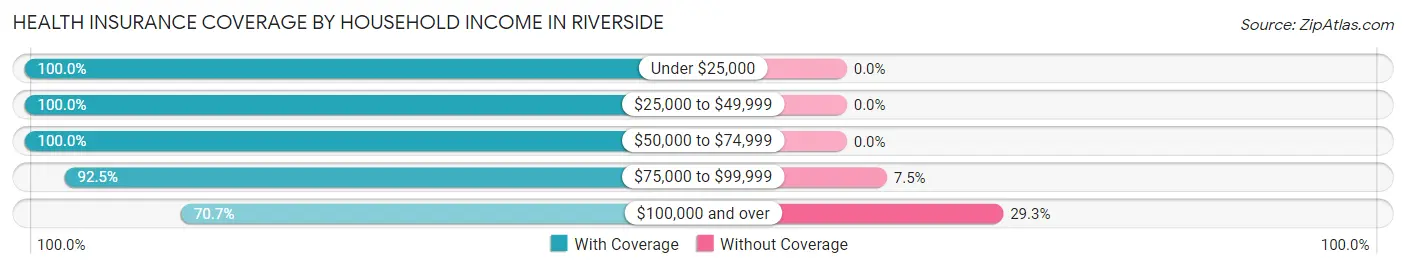
| Household Income | With Coverage | Without Coverage |
| Under $25,000 | 7 (100.0%) | 0 (0.0%) |
| $25,000 to $49,999 | 206 (100.0%) | 0 (0.0%) |
| $50,000 to $74,999 | 20 (100.0%) | 0 (0.0%) |
| $75,000 to $99,999 | 333 (92.5%) | 27 (7.5%) |
| $100,000 and over | 340 (70.7%) | 141 (29.3%) |
Public vs Private Health Insurance Coverage by Age in Riverside
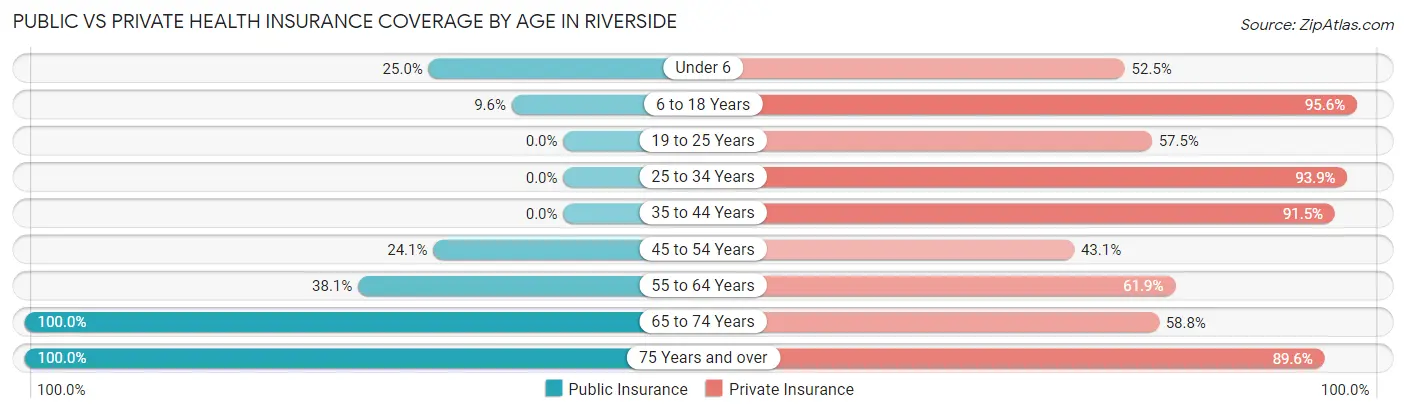
| Age Bracket | Public Insurance | Private Insurance |
| Under 6 | 20 (25.0%) | 42 (52.5%) |
| 6 to 18 Years | 24 (9.6%) | 240 (95.6%) |
| 19 to 25 Years | 0 (0.0%) | 88 (57.5%) |
| 25 to 34 Years | 0 (0.0%) | 61 (93.9%) |
| 35 to 44 Years | 0 (0.0%) | 162 (91.5%) |
| 45 to 54 Years | 28 (24.1%) | 50 (43.1%) |
| 55 to 64 Years | 24 (38.1%) | 39 (61.9%) |
| 65 to 74 Years | 34 (100.0%) | 20 (58.8%) |
| 75 Years and over | 135 (100.0%) | 121 (89.6%) |
| Total | 265 (24.7%) | 823 (76.6%) |
Disability Status by Sex by Age in Riverside
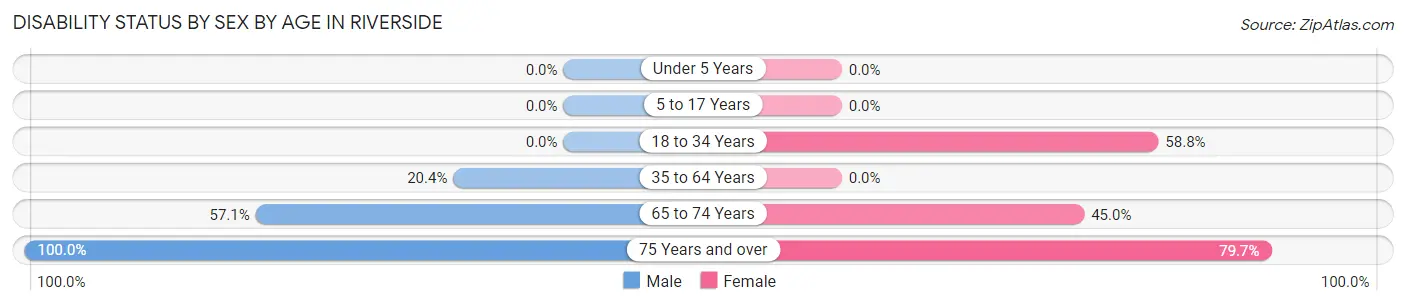
| Age Bracket | Male | Female |
| Under 5 Years | 0 (0.0%) | 0 (0.0%) |
| 5 to 17 Years | 0 (0.0%) | 0 (0.0%) |
| 18 to 34 Years | 0 (0.0%) | 67 (58.8%) |
| 35 to 64 Years | 46 (20.4%) | 0 (0.0%) |
| 65 to 74 Years | 8 (57.1%) | 9 (45.0%) |
| 75 Years and over | 66 (100.0%) | 55 (79.7%) |
Disability Class by Sex by Age in Riverside
Disability Class: Hearing Difficulty
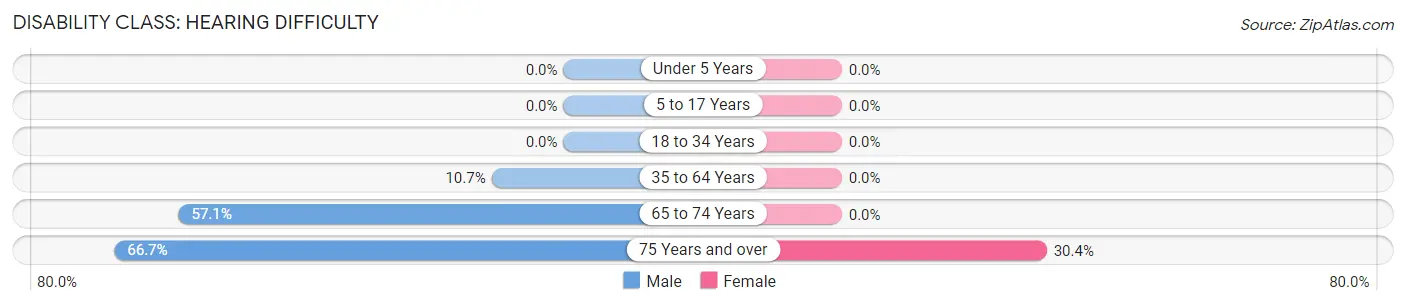
| Age Bracket | Male | Female |
| Under 5 Years | 0 (0.0%) | 0 (0.0%) |
| 5 to 17 Years | 0 (0.0%) | 0 (0.0%) |
| 18 to 34 Years | 0 (0.0%) | 0 (0.0%) |
| 35 to 64 Years | 24 (10.7%) | 0 (0.0%) |
| 65 to 74 Years | 8 (57.1%) | 0 (0.0%) |
| 75 Years and over | 44 (66.7%) | 21 (30.4%) |
Disability Class: Vision Difficulty
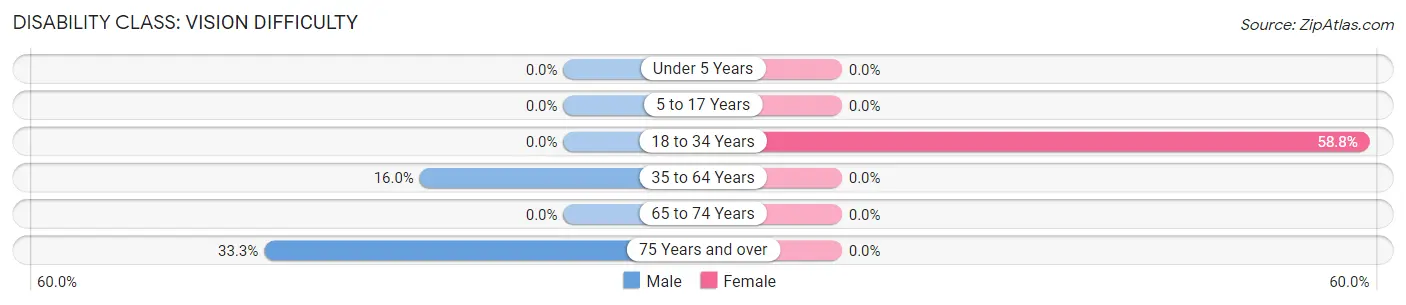
| Age Bracket | Male | Female |
| Under 5 Years | 0 (0.0%) | 0 (0.0%) |
| 5 to 17 Years | 0 (0.0%) | 0 (0.0%) |
| 18 to 34 Years | 0 (0.0%) | 67 (58.8%) |
| 35 to 64 Years | 36 (16.0%) | 0 (0.0%) |
| 65 to 74 Years | 0 (0.0%) | 0 (0.0%) |
| 75 Years and over | 22 (33.3%) | 0 (0.0%) |
Disability Class: Cognitive Difficulty
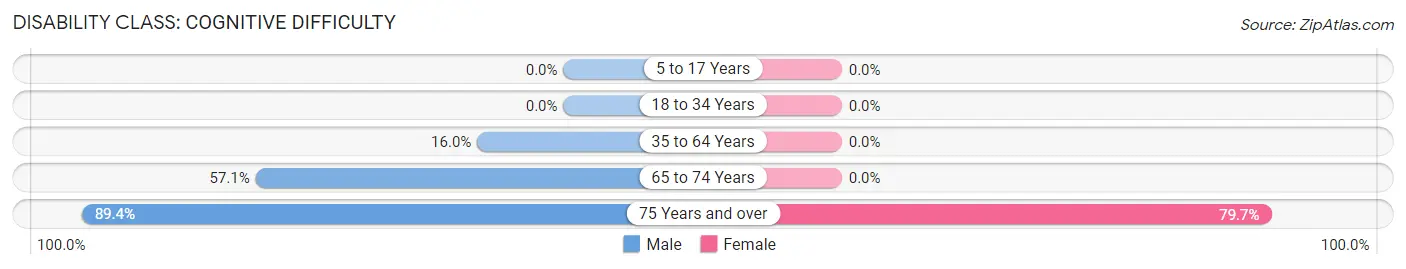
| Age Bracket | Male | Female |
| 5 to 17 Years | 0 (0.0%) | 0 (0.0%) |
| 18 to 34 Years | 0 (0.0%) | 0 (0.0%) |
| 35 to 64 Years | 36 (16.0%) | 0 (0.0%) |
| 65 to 74 Years | 8 (57.1%) | 0 (0.0%) |
| 75 Years and over | 59 (89.4%) | 55 (79.7%) |
Disability Class: Ambulatory Difficulty
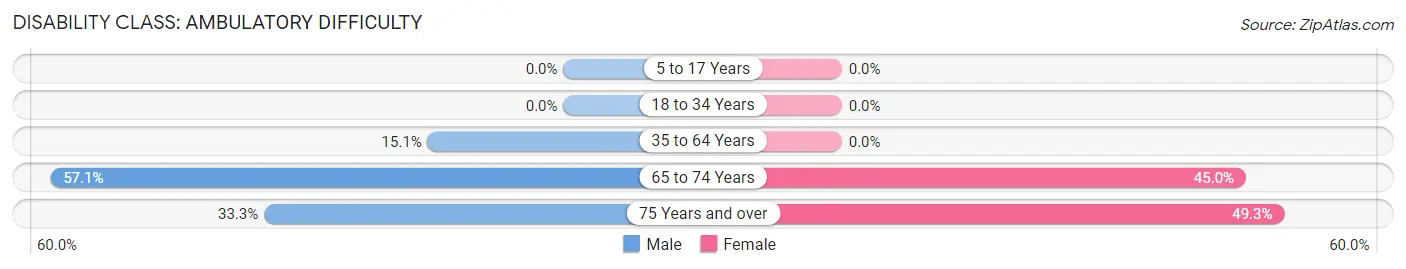
| Age Bracket | Male | Female |
| 5 to 17 Years | 0 (0.0%) | 0 (0.0%) |
| 18 to 34 Years | 0 (0.0%) | 0 (0.0%) |
| 35 to 64 Years | 34 (15.1%) | 0 (0.0%) |
| 65 to 74 Years | 8 (57.1%) | 9 (45.0%) |
| 75 Years and over | 22 (33.3%) | 34 (49.3%) |
Disability Class: Self-Care Difficulty
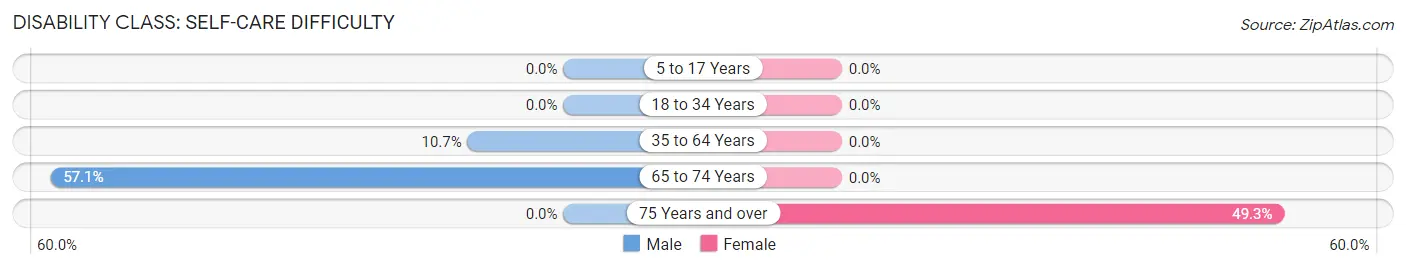
| Age Bracket | Male | Female |
| 5 to 17 Years | 0 (0.0%) | 0 (0.0%) |
| 18 to 34 Years | 0 (0.0%) | 0 (0.0%) |
| 35 to 64 Years | 24 (10.7%) | 0 (0.0%) |
| 65 to 74 Years | 8 (57.1%) | 0 (0.0%) |
| 75 Years and over | 0 (0.0%) | 34 (49.3%) |
Technology Access in Riverside
Computing Device Access in Riverside
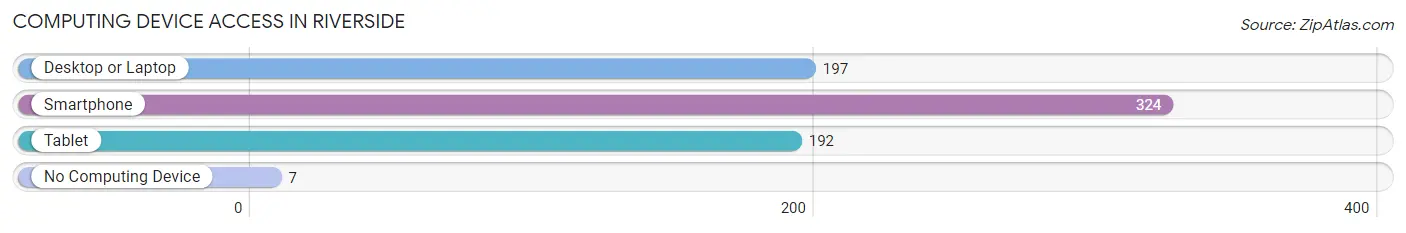
| Device Type | # Households | % Households |
| Desktop or Laptop | 197 | 59.5% |
| Smartphone | 324 | 97.9% |
| Tablet | 192 | 58.0% |
| No Computing Device | 7 | 2.1% |
| Total | 331 | 100.0% |
Internet Access in Riverside
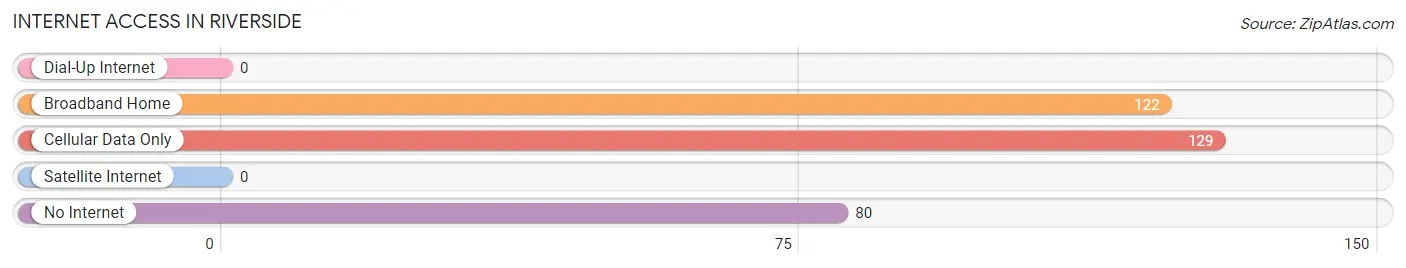
| Internet Type | # Households | % Households |
| Dial-Up Internet | 0 | 0.0% |
| Broadband Home | 122 | 36.9% |
| Cellular Data Only | 129 | 39.0% |
| Satellite Internet | 0 | 0.0% |
| No Internet | 80 | 24.2% |
| Total | 331 | 100.0% |
Riverside Summary
Riverside is a small city located in Bonneville County, Idaho, United States. The city is situated on the Snake River, near the Idaho-Wyoming border. The population of Riverside was 1,845 at the 2010 census.
Geography
Riverside is located at an elevation of 4,890 feet (1,490 m) above sea level. The city is situated on the Snake River, near the Idaho-Wyoming border. The city is located in the Upper Snake River Valley, which is part of the Snake River Plain. The city is surrounded by the Caribou-Targhee National Forest.
History
Riverside was founded in 1883 by a group of settlers from the nearby town of Rexburg. The settlers were looking for a place to settle and farm, and they chose the area near the Snake River. The city was originally named Riverside because of its location on the river.
The city was incorporated in 1891, and the first mayor was elected in 1892. The city was a major stop on the Oregon Short Line Railroad, which ran from Idaho Falls to Oregon. The railroad brought many new settlers to the area, and the population of Riverside grew rapidly.
In the early 1900s, Riverside was a major center for the lumber industry. The city was home to several sawmills and lumber yards. The lumber industry was a major source of employment for the city, and it helped to fuel the city's growth.
Economy
Riverside is a small city, and its economy is largely based on agriculture and tourism. The city is home to several farms, and the surrounding area is known for its production of potatoes, wheat, and other crops.
The city is also a popular tourist destination. The nearby Snake River is a popular spot for fishing, boating, and other outdoor activities. The city is also home to several parks and recreational areas, including Riverside State Park.
Demographics
As of the 2010 census, the population of Riverside was 1,845. The racial makeup of the city was 95.2% White, 0.3% African American, 0.7% Native American, 0.3% Asian, 0.1% Pacific Islander, 1.2% from other races, and 2.3% from two or more races. Hispanic or Latino of any race were 3.2% of the population.
The median income for a household in Riverside was $37,917, and the median income for a family was $45,000. The per capita income for the city was $17,917. About 11.2% of families and 14.2% of the population were below the poverty line, including 17.2% of those under age 18 and 8.3% of those age 65 or over.
Common Questions
What is Per Capita Income in Riverside?
Per Capita income in Riverside is $41,314.
What is the Median Family Income in Riverside?
Median Family Income in Riverside is $99,167.
What is the Median Household income in Riverside?
Median Household Income in Riverside is $94,583.
What is Inequality or Gini Index in Riverside?
Inequality or Gini Index in Riverside is 0.40.
What is the Total Population of Riverside?
Total Population of Riverside is 1,074.
What is the Total Male Population of Riverside?
Total Male Population of Riverside is 598.
What is the Total Female Population of Riverside?
Total Female Population of Riverside is 476.
What is the Ratio of Males per 100 Females in Riverside?
There are 125.63 Males per 100 Females in Riverside.
What is the Ratio of Females per 100 Males in Riverside?
There are 79.60 Females per 100 Males in Riverside.
What is the Median Population Age in Riverside?
Median Population Age in Riverside is 31.8 Years.
What is the Average Family Size in Riverside
Average Family Size in Riverside is 3.3 People.
What is the Average Household Size in Riverside
Average Household Size in Riverside is 3.2 People.
How Large is the Labor Force in Riverside?
There are 582 People in the Labor Forcein in Riverside.
What is the Percentage of People in the Labor Force in Riverside?
77.1% of People are in the Labor Force in Riverside.