Cottontown, TN Map & Demographics
Cottontown Map
Cottontown Overview
$42,603
PER CAPITA INCOME
$54,286
AVG HOUSEHOLD INCOME
19.8%
WAGE / INCOME GAP [ % ]
80.2¢/ $1
WAGE / INCOME GAP [ $ ]
0.45
INEQUALITY / GINI INDEX
345
TOTAL POPULATION
236
MALE POPULATION
109
FEMALE POPULATION
216.51
MALES / 100 FEMALES
46.19
FEMALES / 100 MALES
40.8
MEDIAN AGE
2.4
AVG FAMILY SIZE
2.2
AVG HOUSEHOLD SIZE
180
LABOR FORCE [ PEOPLE ]
66.7%
PERCENT IN LABOR FORCE
12.2%
UNEMPLOYMENT RATE
Cottontown Zip Codes
Cottontown Area Codes
Income in Cottontown
Income Overview in Cottontown
| Characteristic | Number | Measure |
| Per Capita Income | 345 | $42,603 |
| Median Family Income | 136 | $0 |
| Mean Family Income | 136 | $106,953 |
| Median Household Income | 158 | $54,286 |
| Mean Household Income | 158 | $94,814 |
| Income Deficit | 136 | $0 |
| Wage / Income Gap (%) | 345 | 19.82% |
| Wage / Income Gap ($) | 345 | 80.18¢ per $1 |
| Gini / Inequality Index | 345 | 0.45 |
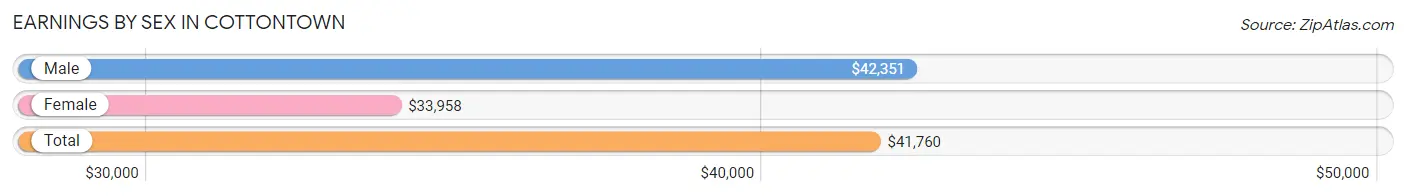
Earnings by Sex in Cottontown
Average Earnings in Cottontown are $41,760, $42,351 for men and $33,958 for women, a difference of 19.8%.
| Sex | Number | Average Earnings |
| Male | 123 (71.9%) | $42,351 |
| Female | 48 (28.1%) | $33,958 |
| Total | 171 (100.0%) | $41,760 |
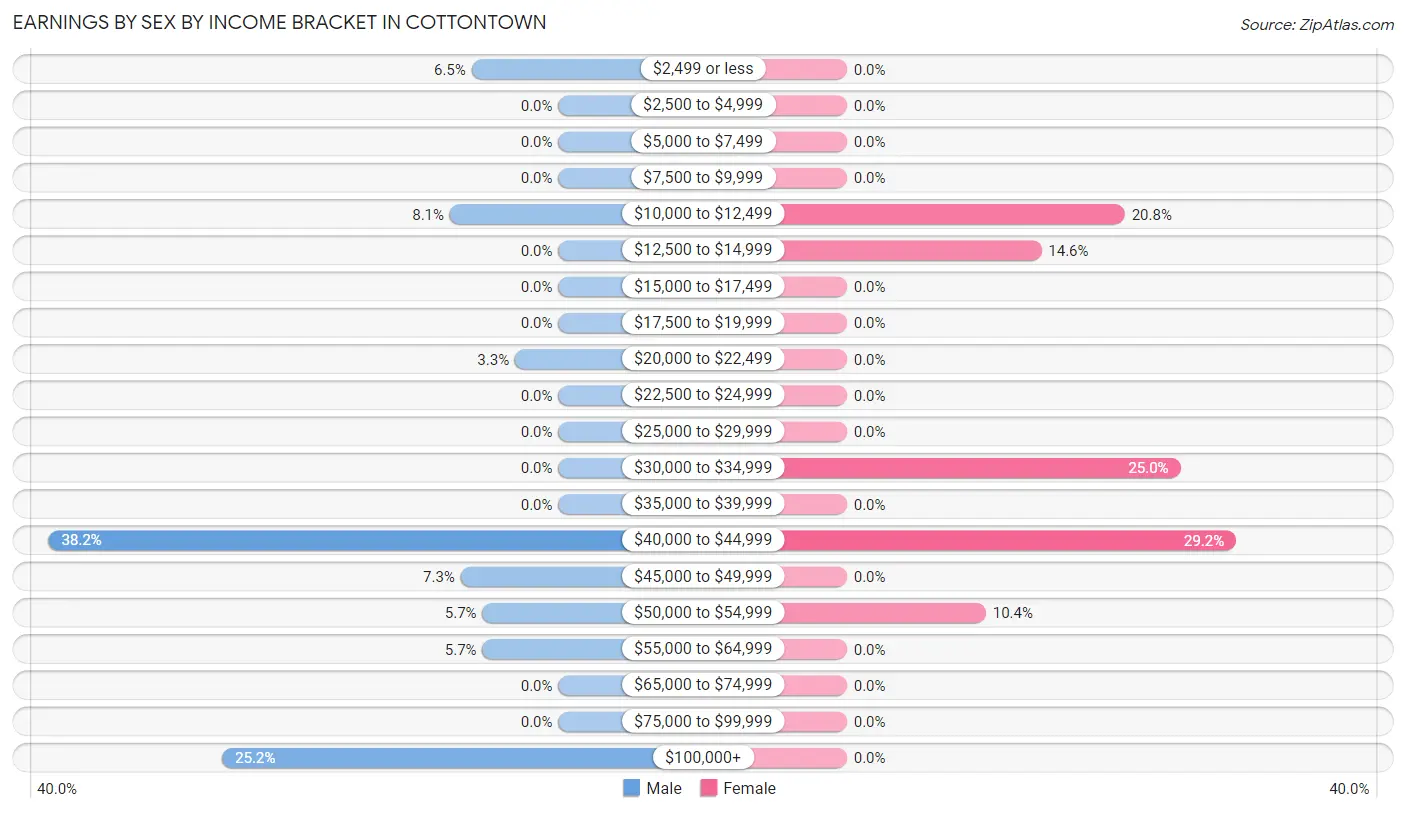
Earnings by Sex by Income Bracket in Cottontown
The most common earnings brackets in Cottontown are $40,000 to $44,999 for men (47 | 38.2%) and $40,000 to $44,999 for women (14 | 29.2%).
| Income | Male | Female |
| $2,499 or less | 8 (6.5%) | 0 (0.0%) |
| $2,500 to $4,999 | 0 (0.0%) | 0 (0.0%) |
| $5,000 to $7,499 | 0 (0.0%) | 0 (0.0%) |
| $7,500 to $9,999 | 0 (0.0%) | 0 (0.0%) |
| $10,000 to $12,499 | 10 (8.1%) | 10 (20.8%) |
| $12,500 to $14,999 | 0 (0.0%) | 7 (14.6%) |
| $15,000 to $17,499 | 0 (0.0%) | 0 (0.0%) |
| $17,500 to $19,999 | 0 (0.0%) | 0 (0.0%) |
| $20,000 to $22,499 | 4 (3.3%) | 0 (0.0%) |
| $22,500 to $24,999 | 0 (0.0%) | 0 (0.0%) |
| $25,000 to $29,999 | 0 (0.0%) | 0 (0.0%) |
| $30,000 to $34,999 | 0 (0.0%) | 12 (25.0%) |
| $35,000 to $39,999 | 0 (0.0%) | 0 (0.0%) |
| $40,000 to $44,999 | 47 (38.2%) | 14 (29.2%) |
| $45,000 to $49,999 | 9 (7.3%) | 0 (0.0%) |
| $50,000 to $54,999 | 7 (5.7%) | 5 (10.4%) |
| $55,000 to $64,999 | 7 (5.7%) | 0 (0.0%) |
| $65,000 to $74,999 | 0 (0.0%) | 0 (0.0%) |
| $75,000 to $99,999 | 0 (0.0%) | 0 (0.0%) |
| $100,000+ | 31 (25.2%) | 0 (0.0%) |
| Total | 123 (100.0%) | 48 (100.0%) |
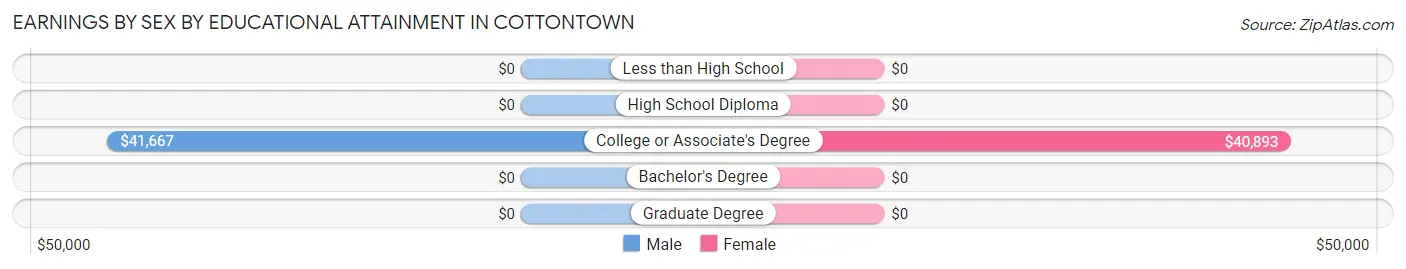
Earnings by Sex by Educational Attainment in Cottontown
Average earnings in Cottontown are $42,470 for men and $33,958 for women, a difference of 20.0%. Men with an educational attainment of college or associate's degree enjoy the highest average annual earnings of $41,667, while those with college or associate's degree education earn the least with $41,667. Women with an educational attainment of college or associate's degree earn the most with the average annual earnings of $40,893, while those with college or associate's degree education have the smallest earnings of $40,893.
| Educational Attainment | Male Income | Female Income |
| Less than High School | - | - |
| High School Diploma | - | - |
| College or Associate's Degree | $41,667 | $40,893 |
| Bachelor's Degree | - | - |
| Graduate Degree | - | - |
| Total | $42,470 | $33,958 |
Family Income in Cottontown
Family Income Brackets in Cottontown
According to the Cottontown family income data, there are 52 families falling into the $35,000 to $49,999 income range, which is the most common income bracket and makes up 38.2% of all families.
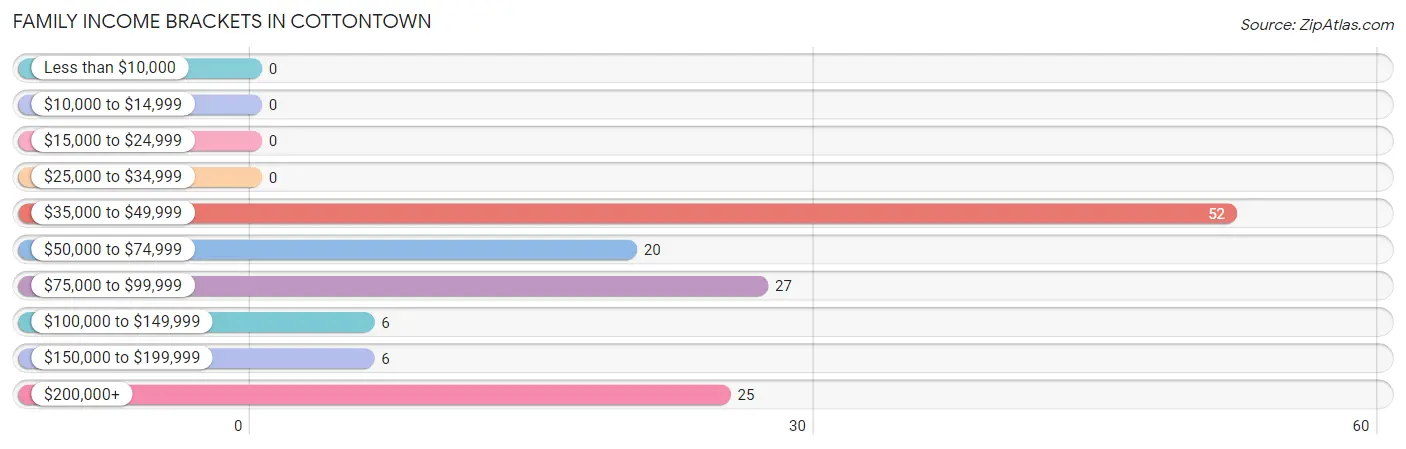
| Income Bracket | # Families | % Families |
| Less than $10,000 | 0 | 0.0% |
| $10,000 to $14,999 | 0 | 0.0% |
| $15,000 to $24,999 | 0 | 0.0% |
| $25,000 to $34,999 | 0 | 0.0% |
| $35,000 to $49,999 | 52 | 38.2% |
| $50,000 to $74,999 | 20 | 14.7% |
| $75,000 to $99,999 | 27 | 19.9% |
| $100,000 to $149,999 | 6 | 4.4% |
| $150,000 to $199,999 | 6 | 4.4% |
| $200,000+ | 25 | 18.4% |
Family Income by Famaliy Size in Cottontown
3-person families (30 | 22.1%) account for the highest median family income in Cottontown with $248,026 per family, while 3-person families (30 | 22.1%) have the highest median income of $82,675 per family member.
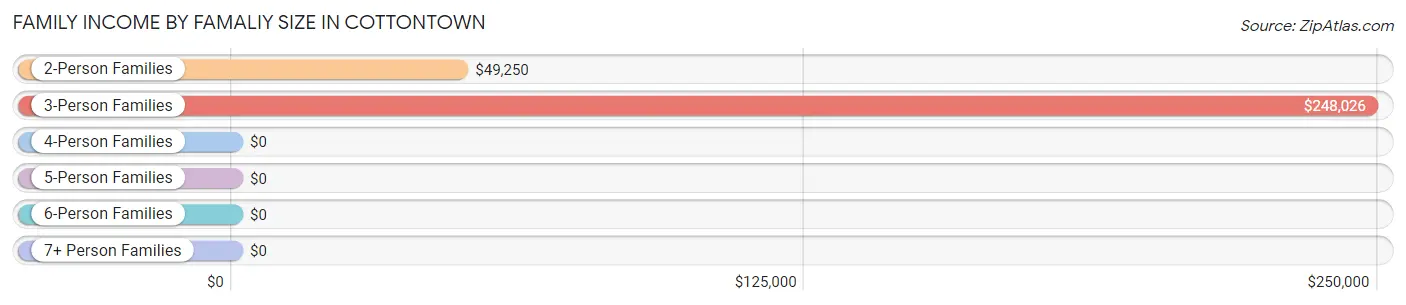
| Income Bracket | # Families | Median Income |
| 2-Person Families | 98 (72.1%) | $49,250 |
| 3-Person Families | 30 (22.1%) | $248,026 |
| 4-Person Families | 2 (1.5%) | $0 |
| 5-Person Families | 0 (0.0%) | $0 |
| 6-Person Families | 6 (4.4%) | $0 |
| 7+ Person Families | 0 (0.0%) | $0 |
| Total | 136 (100.0%) | $0 |
Family Income by Number of Earners in Cottontown
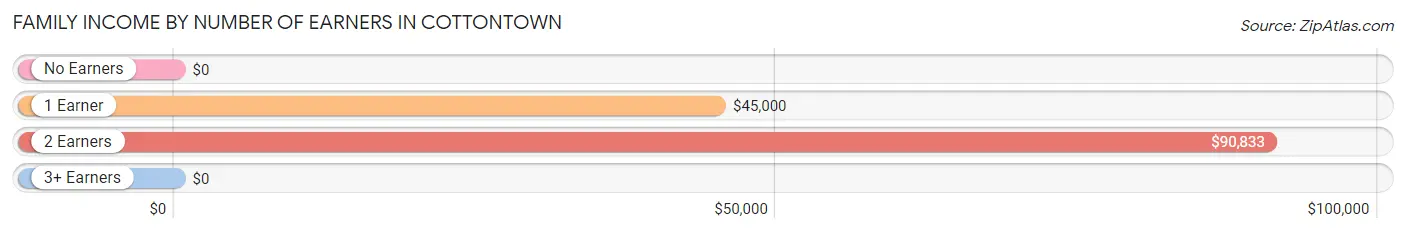
| Number of Earners | # Families | Median Income |
| No Earners | 12 (8.8%) | $0 |
| 1 Earner | 84 (61.8%) | $45,000 |
| 2 Earners | 40 (29.4%) | $90,833 |
| 3+ Earners | 0 (0.0%) | $0 |
| Total | 136 (100.0%) | $0 |
Household Income in Cottontown
Household Income Brackets in Cottontown
With 52 households falling in the category, the $35,000 to $49,999 income range is the most frequent in Cottontown, accounting for 32.9% of all households.
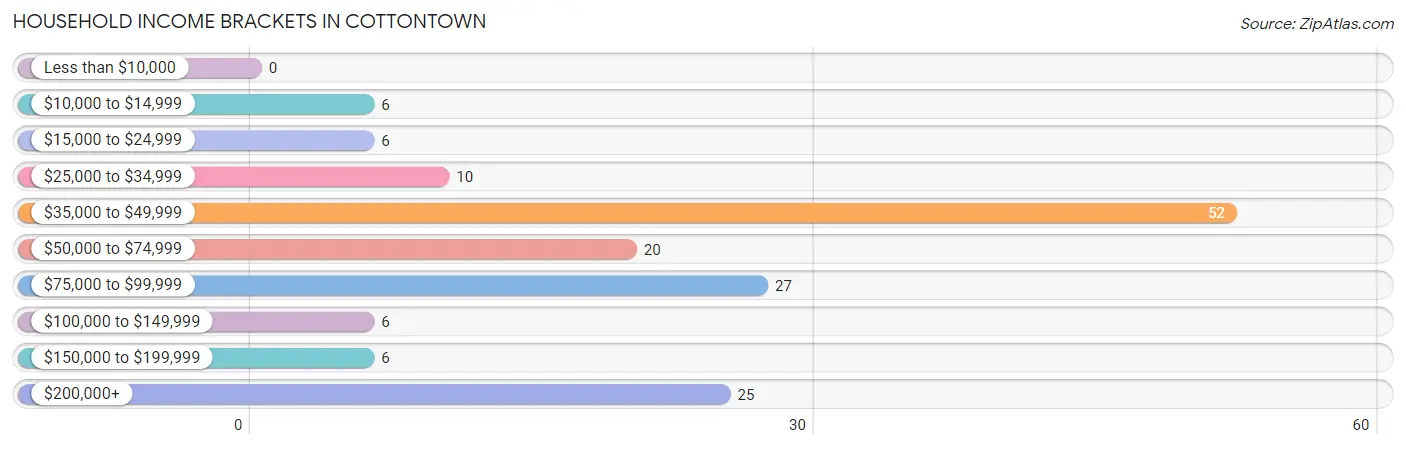
| Income Bracket | # Households | % Households |
| Less than $10,000 | 0 | 0.0% |
| $10,000 to $14,999 | 6 | 3.8% |
| $15,000 to $24,999 | 6 | 3.8% |
| $25,000 to $34,999 | 10 | 6.3% |
| $35,000 to $49,999 | 52 | 32.9% |
| $50,000 to $74,999 | 20 | 12.7% |
| $75,000 to $99,999 | 27 | 17.1% |
| $100,000 to $149,999 | 6 | 3.8% |
| $150,000 to $199,999 | 6 | 3.8% |
| $200,000+ | 25 | 15.8% |
Household Income by Householder Age in Cottontown
The median household income in Cottontown is $54,286, with the highest median household income of $91,042 found in the 45 to 64 years age bracket for the primary householder. A total of 26 households (16.5%) fall into this category.
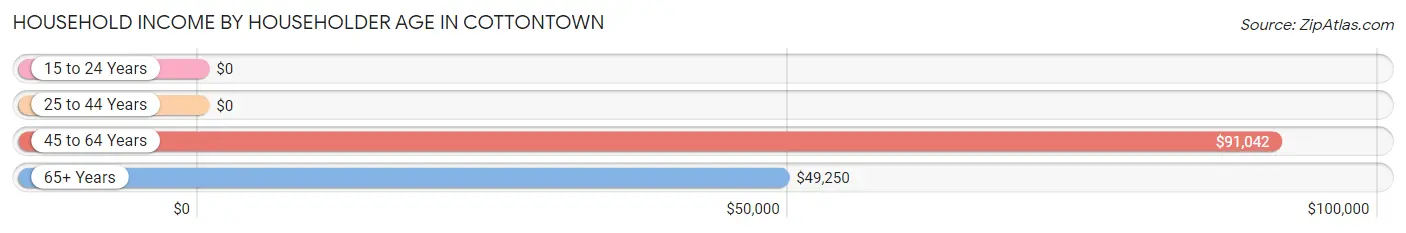
| Income Bracket | # Households | Median Income |
| 15 to 24 Years | 0 (0.0%) | $0 |
| 25 to 44 Years | 74 (46.8%) | $0 |
| 45 to 64 Years | 26 (16.5%) | $91,042 |
| 65+ Years | 58 (36.7%) | $49,250 |
| Total | 158 (100.0%) | $54,286 |
Poverty in Cottontown
Income Below Poverty by Sex and Age in Cottontown
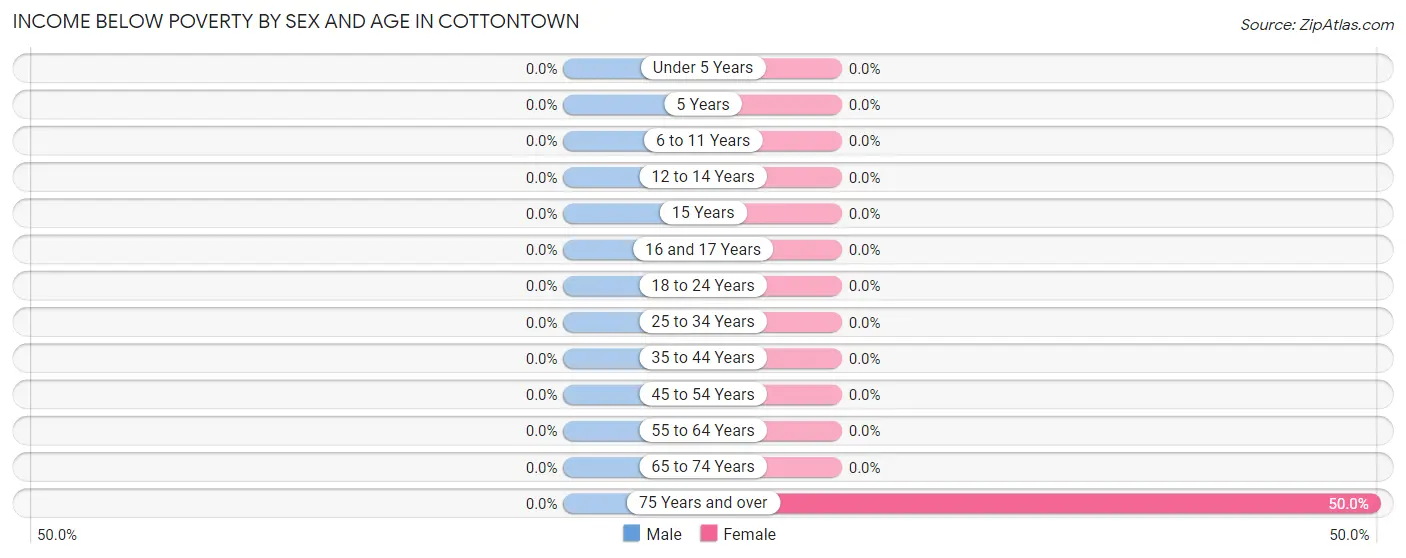
| Age Bracket | Male | Female |
| Under 5 Years | 0 (0.0%) | 0 (0.0%) |
| 5 Years | 0 (0.0%) | 0 (0.0%) |
| 6 to 11 Years | 0 (0.0%) | 0 (0.0%) |
| 12 to 14 Years | 0 (0.0%) | 0 (0.0%) |
| 15 Years | 0 (0.0%) | 0 (0.0%) |
| 16 and 17 Years | 0 (0.0%) | 0 (0.0%) |
| 18 to 24 Years | 0 (0.0%) | 0 (0.0%) |
| 25 to 34 Years | 0 (0.0%) | 0 (0.0%) |
| 35 to 44 Years | 0 (0.0%) | 0 (0.0%) |
| 45 to 54 Years | 0 (0.0%) | 0 (0.0%) |
| 55 to 64 Years | 0 (0.0%) | 0 (0.0%) |
| 65 to 74 Years | 0 (0.0%) | 0 (0.0%) |
| 75 Years and over | 0 (0.0%) | 6 (50.0%) |
| Total | 0 (0.0%) | 6 (5.5%) |
Income Above Poverty by Sex and Age in Cottontown
According to the poverty statistics in Cottontown, males aged 6 to 11 years and females aged 12 to 14 years are the age groups that are most secure financially, with 100.0% of males and 100.0% of females in these age groups living above the poverty line.
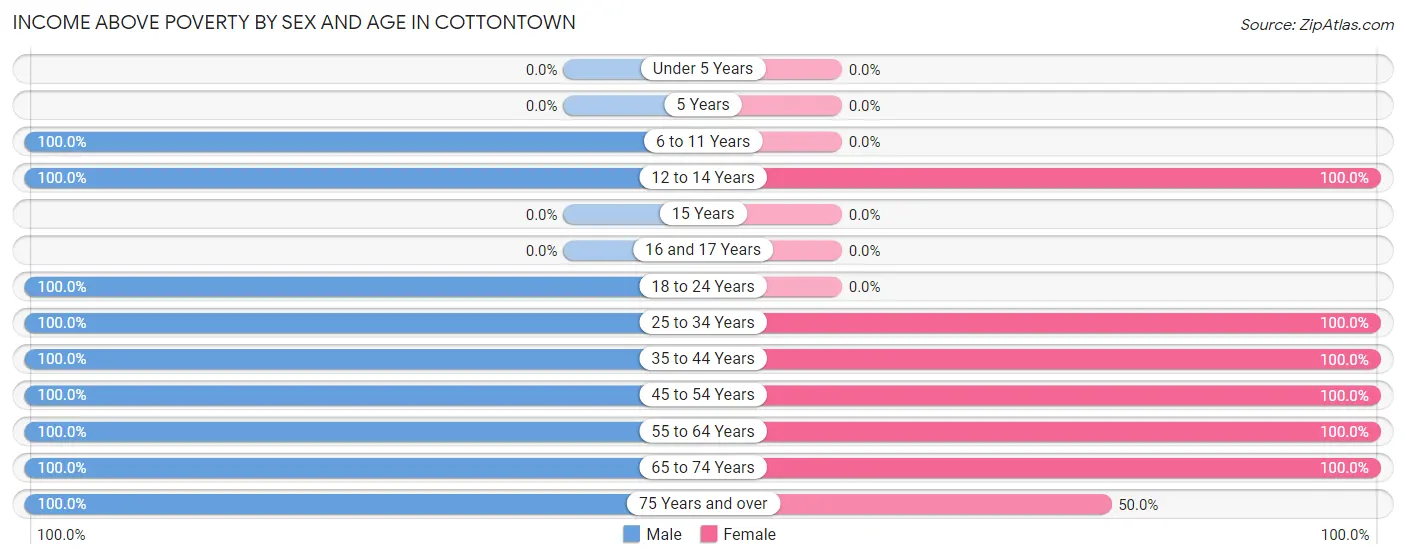
| Age Bracket | Male | Female |
| Under 5 Years | 0 (0.0%) | 0 (0.0%) |
| 5 Years | 0 (0.0%) | 0 (0.0%) |
| 6 to 11 Years | 25 (100.0%) | 0 (0.0%) |
| 12 to 14 Years | 47 (100.0%) | 3 (100.0%) |
| 15 Years | 0 (0.0%) | 0 (0.0%) |
| 16 and 17 Years | 0 (0.0%) | 0 (0.0%) |
| 18 to 24 Years | 4 (100.0%) | 0 (0.0%) |
| 25 to 34 Years | 7 (100.0%) | 26 (100.0%) |
| 35 to 44 Years | 70 (100.0%) | 7 (100.0%) |
| 45 to 54 Years | 18 (100.0%) | 20 (100.0%) |
| 55 to 64 Years | 8 (100.0%) | 7 (100.0%) |
| 65 to 74 Years | 45 (100.0%) | 34 (100.0%) |
| 75 Years and over | 12 (100.0%) | 6 (50.0%) |
| Total | 236 (100.0%) | 103 (94.5%) |
Income Below Poverty Among Married-Couple Families in Cottontown
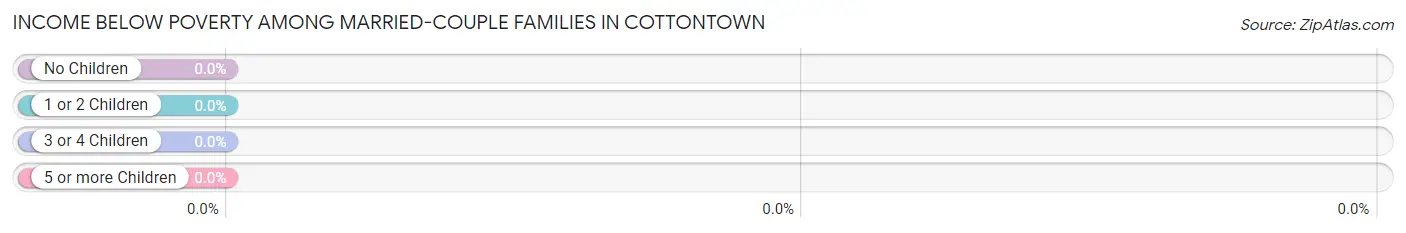
| Children | Above Poverty | Below Poverty |
| No Children | 63 (100.0%) | 0 (0.0%) |
| 1 or 2 Children | 31 (100.0%) | 0 (0.0%) |
| 3 or 4 Children | 0 (0.0%) | 0 (0.0%) |
| 5 or more Children | 0 (0.0%) | 0 (0.0%) |
| Total | 94 (100.0%) | 0 (0.0%) |
Income Below Poverty Among Single-Parent Households in Cottontown
| Children | Single Father | Single Mother |
| No Children | 0 (0.0%) | 0 (0.0%) |
| 1 or 2 Children | 0 (0.0%) | 0 (0.0%) |
| 3 or 4 Children | 0 (0.0%) | 0 (0.0%) |
| 5 or more Children | 0 (0.0%) | 0 (0.0%) |
| Total | 0 (0.0%) | 0 (0.0%) |
Income Below Poverty Among Married-Couple vs Single-Parent Households in Cottontown
| Children | Married-Couple Families | Single-Parent Households |
| No Children | 0 (0.0%) | 0 (0.0%) |
| 1 or 2 Children | 0 (0.0%) | 0 (0.0%) |
| 3 or 4 Children | 0 (0.0%) | 0 (0.0%) |
| 5 or more Children | 0 (0.0%) | 0 (0.0%) |
| Total | 0 (0.0%) | 0 (0.0%) |
Race in Cottontown
The most populous races in Cottontown are White / Caucasian (319 | 92.5%), Hispanic or Latino (26 | 7.5%), and Some other Race (26 | 7.5%).
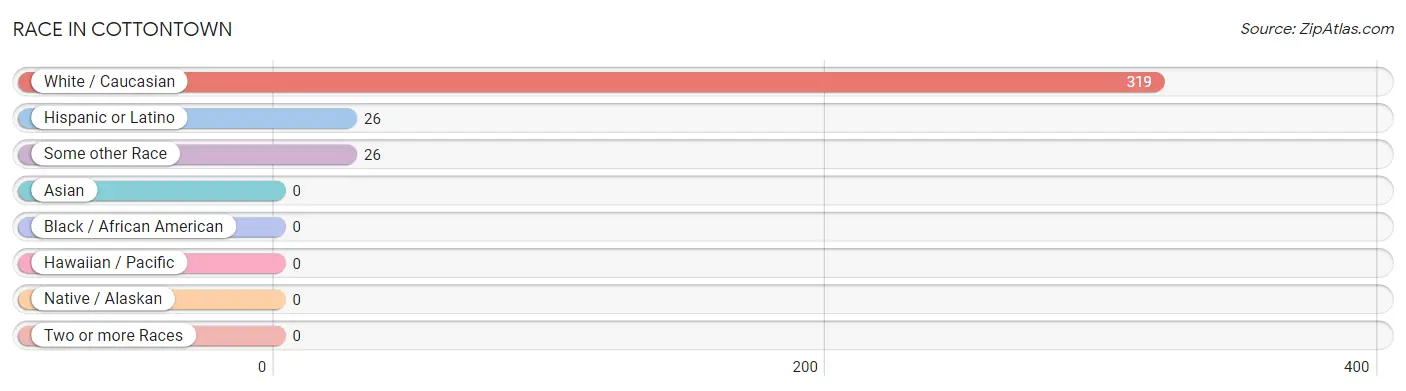
| Race | # Population | % Population |
| Asian | 0 | 0.0% |
| Black / African American | 0 | 0.0% |
| Hawaiian / Pacific | 0 | 0.0% |
| Hispanic or Latino | 26 | 7.5% |
| Native / Alaskan | 0 | 0.0% |
| White / Caucasian | 319 | 92.5% |
| Two or more Races | 0 | 0.0% |
| Some other Race | 26 | 7.5% |
| Total | 345 | 100.0% |
Ancestry in Cottontown
The most populous ancestries reported in Cottontown are German (100 | 29.0%), English (95 | 27.5%), French (92 | 26.7%), American (56 | 16.2%), and Irish (50 | 14.5%), together accounting for 113.9% of all Cottontown residents.
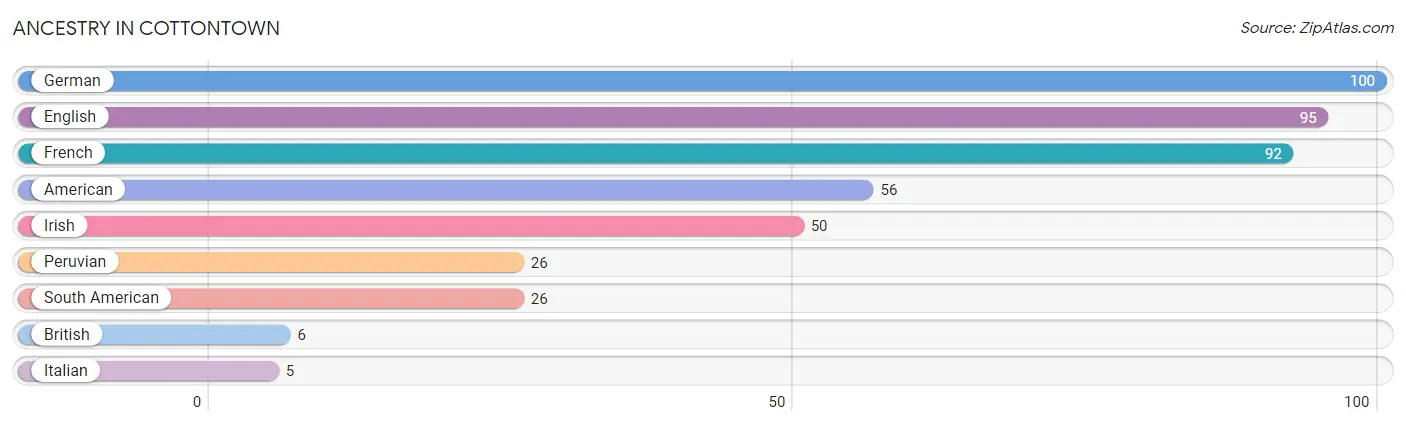
| Ancestry | # Population | % Population |
| American | 56 | 16.2% |
| British | 6 | 1.7% |
| English | 95 | 27.5% |
| French | 92 | 26.7% |
| German | 100 | 29.0% |
| Irish | 50 | 14.5% |
| Italian | 5 | 1.5% |
| Peruvian | 26 | 7.5% |
| South American | 26 | 7.5% | View All 9 Rows |
Immigrants in Cottontown
The most numerous immigrant groups reported in Cottontown came from Latin America (17 | 4.9%), Peru (17 | 4.9%), and South America (17 | 4.9%), together accounting for 14.8% of all Cottontown residents.
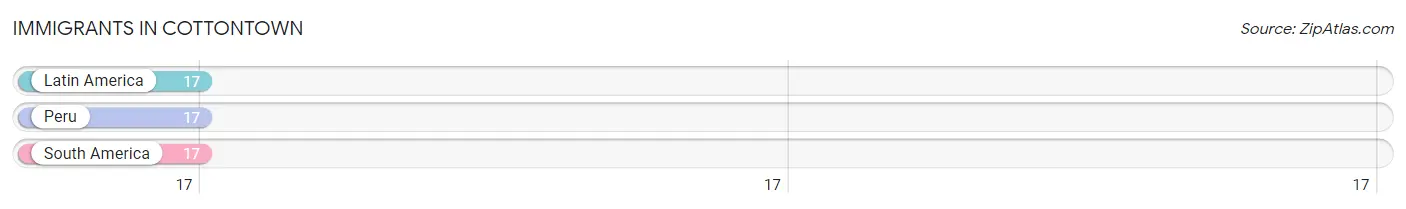
| Immigration Origin | # Population | % Population |
| Latin America | 17 | 4.9% |
| Peru | 17 | 4.9% |
| South America | 17 | 4.9% | View All 3 Rows |
Sex and Age in Cottontown
Sex and Age in Cottontown
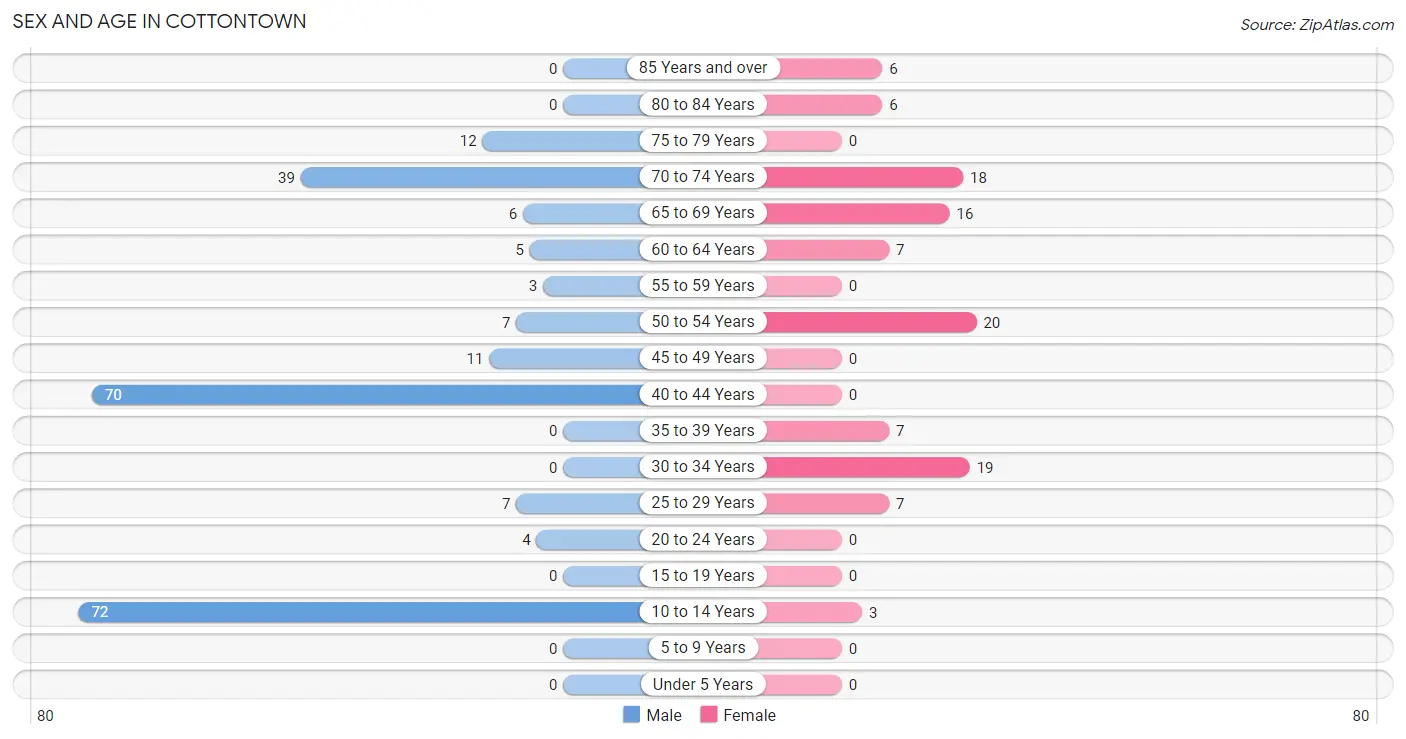
The most populous age groups in Cottontown are 10 to 14 Years (72 | 30.5%) for men and 50 to 54 Years (20 | 18.3%) for women.
| Age Bracket | Male | Female |
| Under 5 Years | 0 (0.0%) | 0 (0.0%) |
| 5 to 9 Years | 0 (0.0%) | 0 (0.0%) |
| 10 to 14 Years | 72 (30.5%) | 3 (2.8%) |
| 15 to 19 Years | 0 (0.0%) | 0 (0.0%) |
| 20 to 24 Years | 4 (1.7%) | 0 (0.0%) |
| 25 to 29 Years | 7 (3.0%) | 7 (6.4%) |
| 30 to 34 Years | 0 (0.0%) | 19 (17.4%) |
| 35 to 39 Years | 0 (0.0%) | 7 (6.4%) |
| 40 to 44 Years | 70 (29.7%) | 0 (0.0%) |
| 45 to 49 Years | 11 (4.7%) | 0 (0.0%) |
| 50 to 54 Years | 7 (3.0%) | 20 (18.3%) |
| 55 to 59 Years | 3 (1.3%) | 0 (0.0%) |
| 60 to 64 Years | 5 (2.1%) | 7 (6.4%) |
| 65 to 69 Years | 6 (2.5%) | 16 (14.7%) |
| 70 to 74 Years | 39 (16.5%) | 18 (16.5%) |
| 75 to 79 Years | 12 (5.1%) | 0 (0.0%) |
| 80 to 84 Years | 0 (0.0%) | 6 (5.5%) |
| 85 Years and over | 0 (0.0%) | 6 (5.5%) |
| Total | 236 (100.0%) | 109 (100.0%) |
Families and Households in Cottontown
Median Family Size in Cottontown
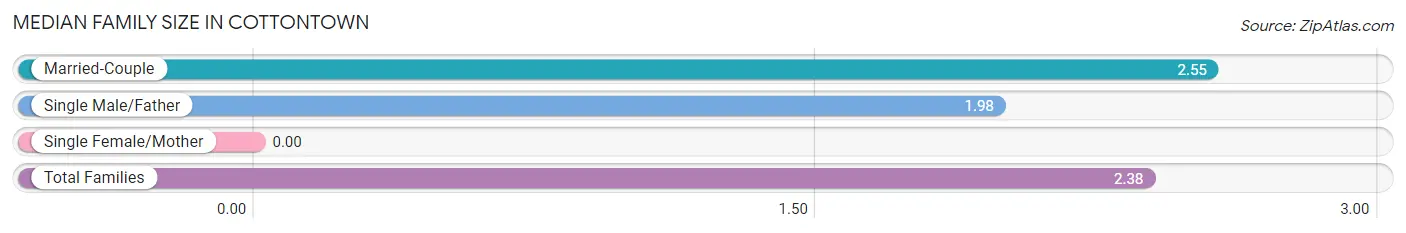
| Family Type | # Families | Family Size |
| Married-Couple | 94 (69.1%) | 2.55 |
| Single Male/Father | 42 (30.9%) | 1.98 |
| Single Female/Mother | 0 (0.0%) | - |
| Total Families | 136 (100.0%) | 2.38 |
Median Household Size in Cottontown
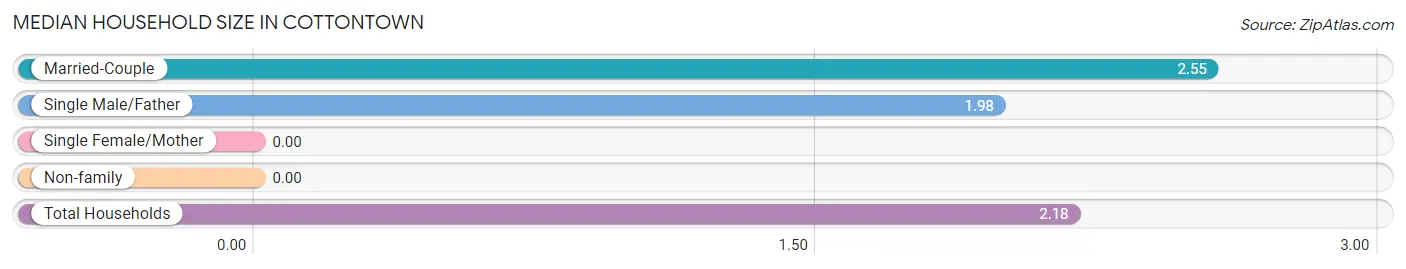
| Household Type | # Households | Household Size |
| Married-Couple | 94 (59.5%) | 2.55 |
| Single Male/Father | 42 (26.6%) | 1.98 |
| Single Female/Mother | 0 (0.0%) | - |
| Non-family | 22 (13.9%) | - |
| Total Households | 158 (100.0%) | 2.18 |
Household Size by Marriage Status in Cottontown
Out of a total of 158 households in Cottontown, 136 (86.1%) are family households, while 22 (13.9%) are nonfamily households. The most numerous type of family households are 2-person households, comprising 98, and the most common type of nonfamily households are 1-person households, comprising 22.
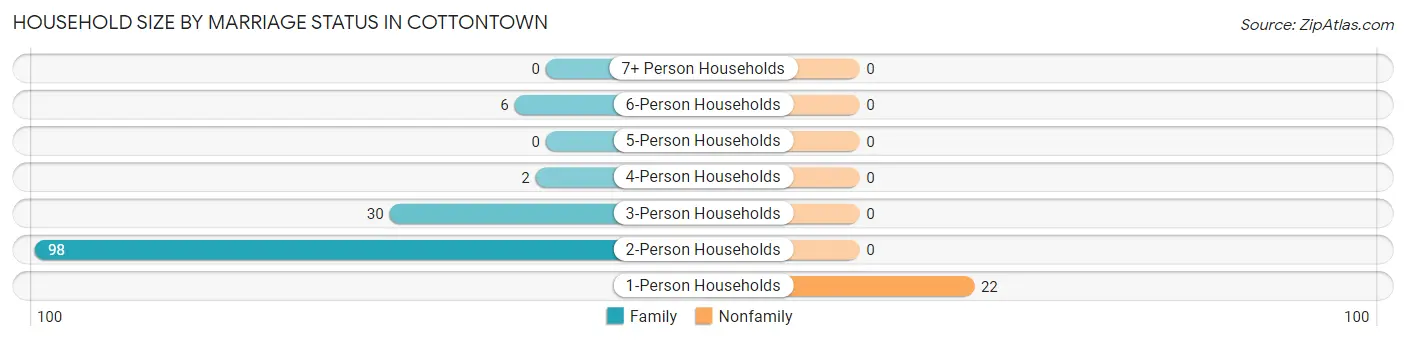
| Household Size | Family Households | Nonfamily Households |
| 1-Person Households | - | 22 (13.9%) |
| 2-Person Households | 98 (62.0%) | 0 (0.0%) |
| 3-Person Households | 30 (19.0%) | 0 (0.0%) |
| 4-Person Households | 2 (1.3%) | 0 (0.0%) |
| 5-Person Households | 0 (0.0%) | 0 (0.0%) |
| 6-Person Households | 6 (3.8%) | 0 (0.0%) |
| 7+ Person Households | 0 (0.0%) | 0 (0.0%) |
| Total | 136 (86.1%) | 22 (13.9%) |
Female Fertility in Cottontown
Fertility by Age in Cottontown
| Age Bracket | Women with Births | Births / 1,000 Women |
| 15 to 19 years | 0 (0.0%) | 0.0 |
| 20 to 34 years | 0 (0.0%) | 0.0 |
| 35 to 50 years | 0 (0.0%) | 0.0 |
| Total | 0 (0.0%) | 0.0 |
Fertility by Age by Marriage Status in Cottontown
| Age Bracket | Married | Unmarried |
| 15 to 19 years | 0 (0.0%) | 0 (0.0%) |
| 20 to 34 years | 0 (0.0%) | 0 (0.0%) |
| 35 to 50 years | 0 (0.0%) | 0 (0.0%) |
| Total | 0 (0.0%) | 0 (0.0%) |
Fertility by Education in Cottontown
| Educational Attainment | Women with Births | Births / 1,000 Women |
| Less than High School | 0 (0.0%) | 0.0 |
| High School Diploma | 0 (0.0%) | 0.0 |
| College or Associate's Degree | 0 (0.0%) | 0.0 |
| Bachelor's Degree | 0 (0.0%) | 0.0 |
| Graduate Degree | 0 (0.0%) | 0.0 |
| Total | 0 (0.0%) | 0.0 |
Fertility by Education by Marriage Status in Cottontown
| Educational Attainment | Married | Unmarried |
| Less than High School | 0 (0.0%) | 0 (0.0%) |
| High School Diploma | 0 (0.0%) | 0 (0.0%) |
| College or Associate's Degree | 0 (0.0%) | 0 (0.0%) |
| Bachelor's Degree | 0 (0.0%) | 0 (0.0%) |
| Graduate Degree | 0 (0.0%) | 0 (0.0%) |
| Total | 0 (0.0%) | 0 (0.0%) |
Employment Characteristics in Cottontown
Employment by Class of Employer in Cottontown
Among the 158 employed individuals in Cottontown, private company employees (139 | 88.0%), and self-employed (not incorporated) (19 | 12.0%) make up the most common classes of employment.
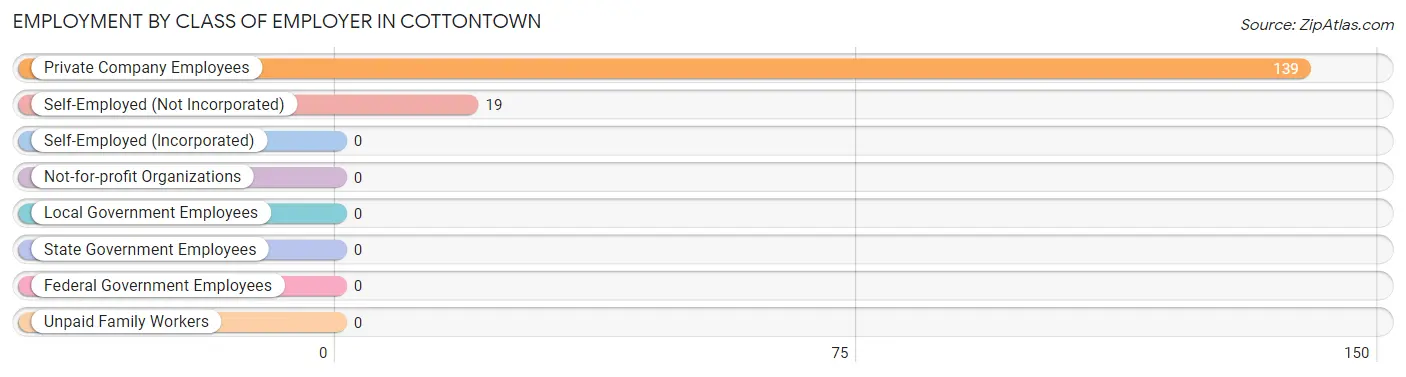
| Employer Class | # Employees | % Employees |
| Private Company Employees | 139 | 88.0% |
| Self-Employed (Incorporated) | 0 | 0.0% |
| Self-Employed (Not Incorporated) | 19 | 12.0% |
| Not-for-profit Organizations | 0 | 0.0% |
| Local Government Employees | 0 | 0.0% |
| State Government Employees | 0 | 0.0% |
| Federal Government Employees | 0 | 0.0% |
| Unpaid Family Workers | 0 | 0.0% |
| Total | 158 | 100.0% |
Employment Status by Age in Cottontown
According to the labor force statistics for Cottontown, out of the total population over 16 years of age (270), 66.7% or 180 individuals are in the labor force, with 12.2% or 22 of them unemployed. The age group with the highest labor force participation rate is 20 to 24 years, with 100.0% or 4 individuals in the labor force. Within the labor force, the 30 to 34 years age range has the highest percentage of unemployed individuals, with 100.0% or 19 of them being unemployed.
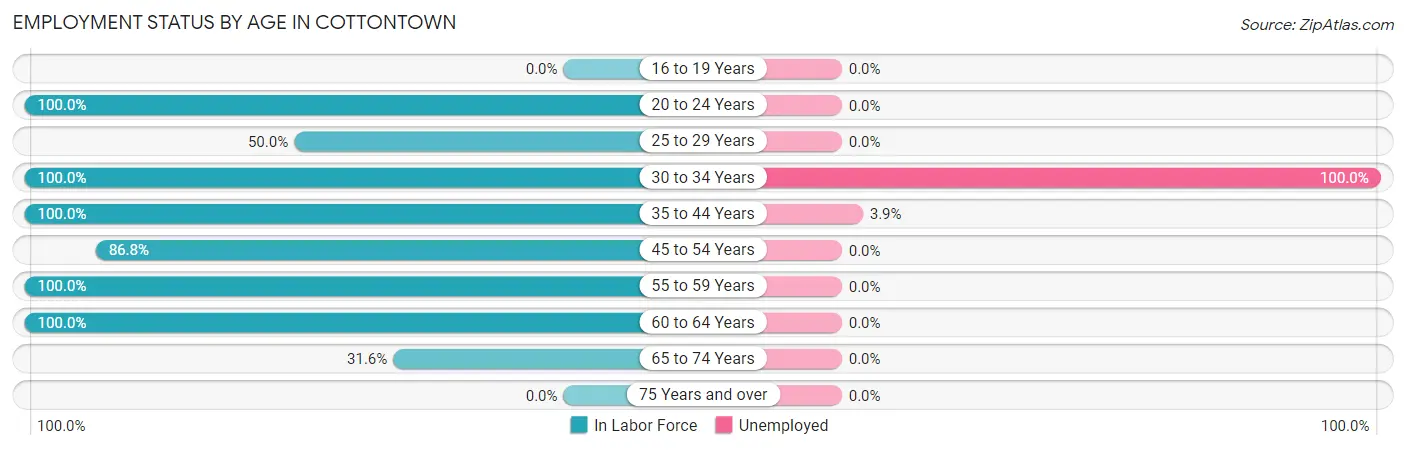
| Age Bracket | In Labor Force | Unemployed |
| 16 to 19 Years | 0 (0.0%) | 0 (0.0%) |
| 20 to 24 Years | 4 (100.0%) | 0 (0.0%) |
| 25 to 29 Years | 7 (50.0%) | 0 (0.0%) |
| 30 to 34 Years | 19 (100.0%) | 19 (100.0%) |
| 35 to 44 Years | 77 (100.0%) | 3 (3.9%) |
| 45 to 54 Years | 33 (86.8%) | 0 (0.0%) |
| 55 to 59 Years | 3 (100.0%) | 0 (0.0%) |
| 60 to 64 Years | 12 (100.0%) | 0 (0.0%) |
| 65 to 74 Years | 25 (31.6%) | 0 (0.0%) |
| 75 Years and over | 0 (0.0%) | 0 (0.0%) |
| Total | 180 (66.7%) | 22 (12.2%) |
Employment Status by Educational Attainment in Cottontown
According to labor force statistics for Cottontown, 92.6% of individuals (151) out of the total population between 25 and 64 years of age (163) are in the labor force, with 14.6% or 22 of them being unemployed. The group with the highest labor force participation rate are those with the educational attainment of college / associate degree, with 100.0% or 66 individuals in the labor force. Within the labor force, individuals with bachelor's degree or higher education have the highest percentage of unemployment, with 42.2% or 19 of them being unemployed.
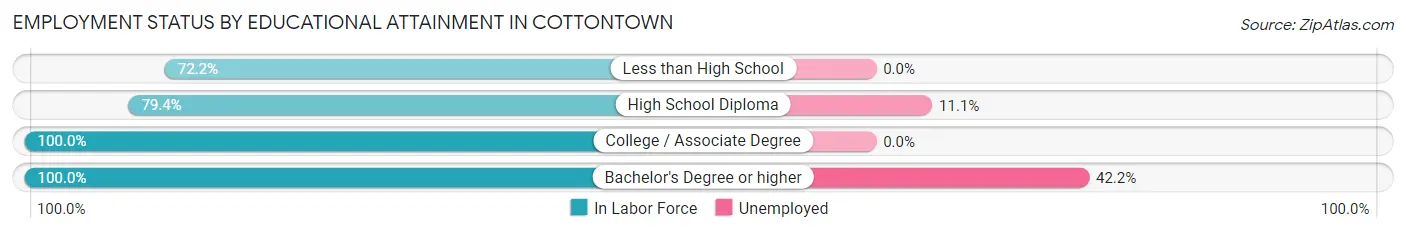
| Educational Attainment | In Labor Force | Unemployed |
| Less than High School | 13 (72.2%) | 0 (0.0%) |
| High School Diploma | 27 (79.4%) | 4 (11.1%) |
| College / Associate Degree | 66 (100.0%) | 0 (0.0%) |
| Bachelor's Degree or higher | 45 (100.0%) | 19 (42.2%) |
| Total | 151 (92.6%) | 24 (14.6%) |
Employment Occupations by Sex in Cottontown
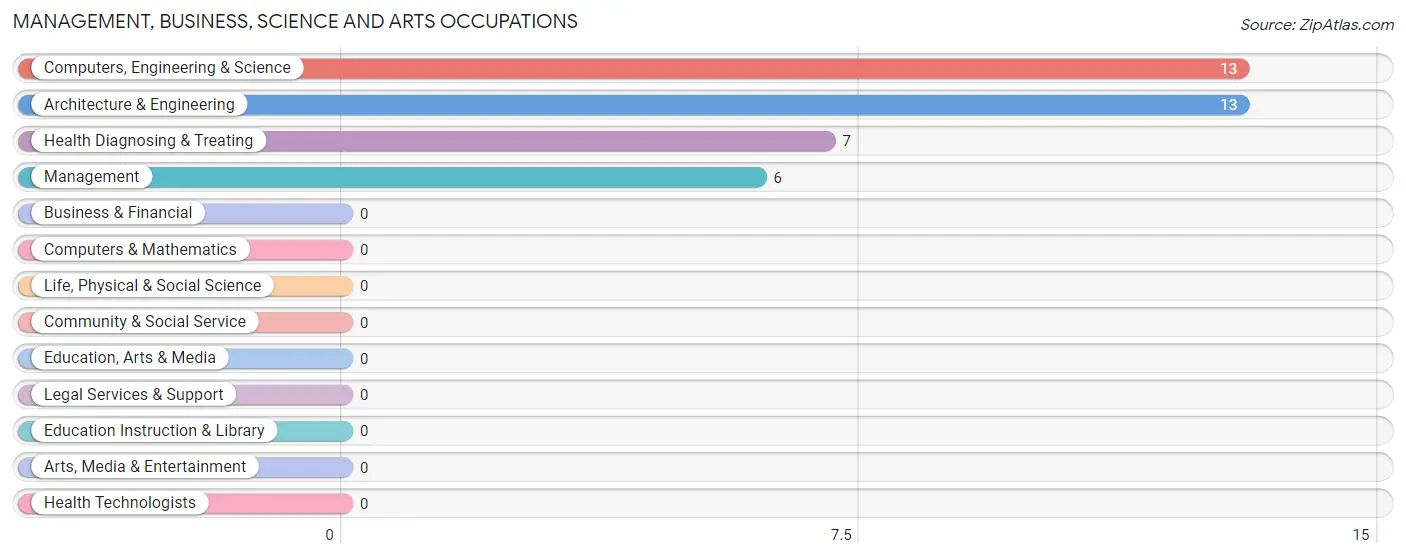
Management, Business, Science and Arts Occupations
The most common Management, Business, Science and Arts occupations in Cottontown are Computers, Engineering & Science (13 | 8.2%), Architecture & Engineering (13 | 8.2%), Health Diagnosing & Treating (7 | 4.4%), and Management (6 | 3.8%).
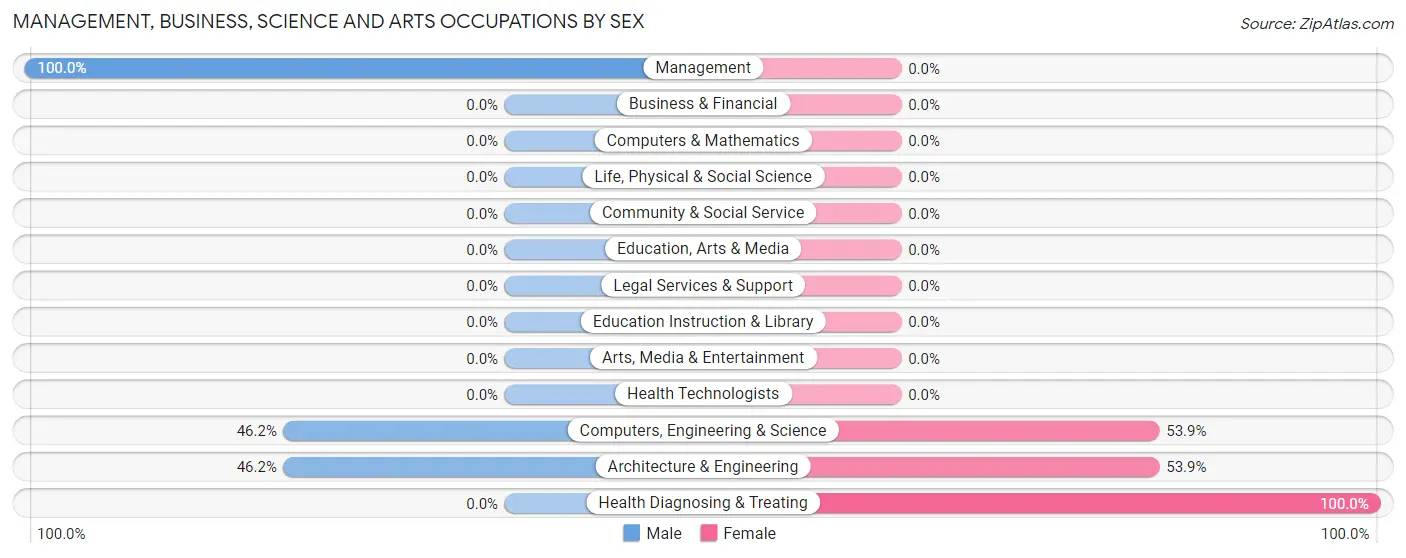
Management, Business, Science and Arts Occupations by Sex
Within the Management, Business, Science and Arts occupations in Cottontown, the most male-oriented occupations are Management (100.0%), Computers, Engineering & Science (46.2%), and Architecture & Engineering (46.2%), while the most female-oriented occupations are Health Diagnosing & Treating (100.0%), Computers, Engineering & Science (53.8%), and Architecture & Engineering (53.8%).
| Occupation | Male | Female |
| Management | 6 (100.0%) | 0 (0.0%) |
| Business & Financial | 0 (0.0%) | 0 (0.0%) |
| Computers, Engineering & Science | 6 (46.2%) | 7 (53.8%) |
| Computers & Mathematics | 0 (0.0%) | 0 (0.0%) |
| Architecture & Engineering | 6 (46.2%) | 7 (53.8%) |
| Life, Physical & Social Science | 0 (0.0%) | 0 (0.0%) |
| Community & Social Service | 0 (0.0%) | 0 (0.0%) |
| Education, Arts & Media | 0 (0.0%) | 0 (0.0%) |
| Legal Services & Support | 0 (0.0%) | 0 (0.0%) |
| Education Instruction & Library | 0 (0.0%) | 0 (0.0%) |
| Arts, Media & Entertainment | 0 (0.0%) | 0 (0.0%) |
| Health Diagnosing & Treating | 0 (0.0%) | 7 (100.0%) |
| Health Technologists | 0 (0.0%) | 0 (0.0%) |
| Total (Category) | 12 (46.2%) | 14 (53.8%) |
| Total (Overall) | 120 (75.9%) | 38 (24.0%) |
Services Occupations
Services Occupations by Sex
| Occupation | Male | Female |
| Healthcare Support | 0 (0.0%) | 0 (0.0%) |
| Security & Protection | 0 (0.0%) | 0 (0.0%) |
| Firefighting & Prevention | 0 (0.0%) | 0 (0.0%) |
| Law Enforcement | 0 (0.0%) | 0 (0.0%) |
| Food Preparation & Serving | 0 (0.0%) | 0 (0.0%) |
| Cleaning & Maintenance | 0 (0.0%) | 0 (0.0%) |
| Personal Care & Service | 0 (0.0%) | 0 (0.0%) |
| Total (Category) | 0 (0.0%) | 0 (0.0%) |
| Total (Overall) | 120 (75.9%) | 38 (24.0%) |
Sales and Office Occupations
The most common Sales and Office occupations in Cottontown are Office & Administration (54 | 34.2%), and Sales & Related (47 | 29.7%).
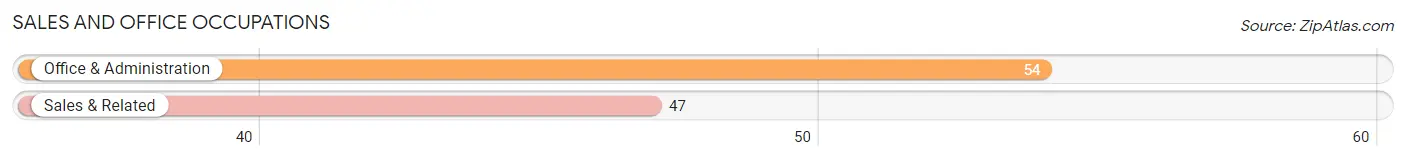
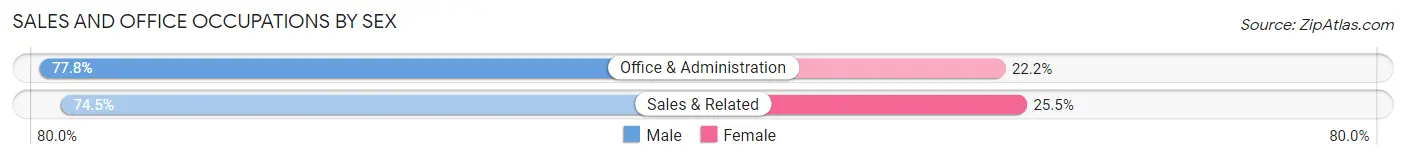
Sales and Office Occupations by Sex
| Occupation | Male | Female |
| Sales & Related | 35 (74.5%) | 12 (25.5%) |
| Office & Administration | 42 (77.8%) | 12 (22.2%) |
| Total (Category) | 77 (76.2%) | 24 (23.8%) |
| Total (Overall) | 120 (75.9%) | 38 (24.0%) |
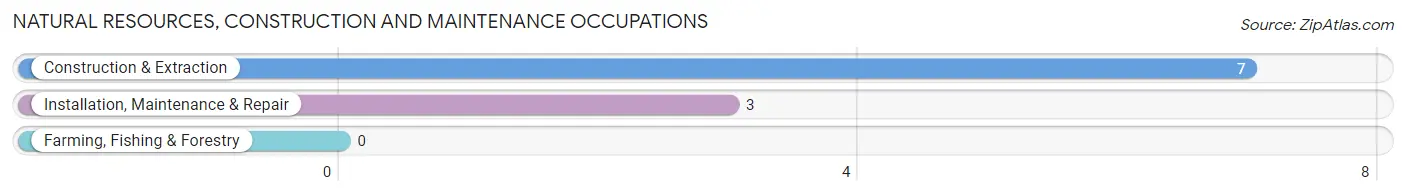
Natural Resources, Construction and Maintenance Occupations
The most common Natural Resources, Construction and Maintenance occupations in Cottontown are Construction & Extraction (7 | 4.4%), and Installation, Maintenance & Repair (3 | 1.9%).
Natural Resources, Construction and Maintenance Occupations by Sex
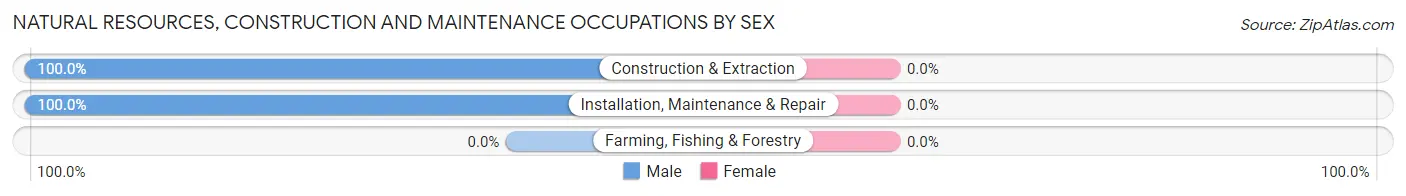
| Occupation | Male | Female |
| Farming, Fishing & Forestry | 0 (0.0%) | 0 (0.0%) |
| Construction & Extraction | 7 (100.0%) | 0 (0.0%) |
| Installation, Maintenance & Repair | 3 (100.0%) | 0 (0.0%) |
| Total (Category) | 10 (100.0%) | 0 (0.0%) |
| Total (Overall) | 120 (75.9%) | 38 (24.0%) |
Production, Transportation and Moving Occupations
The most common Production, Transportation and Moving occupations in Cottontown are Production (16 | 10.1%), and Material Moving (5 | 3.2%).
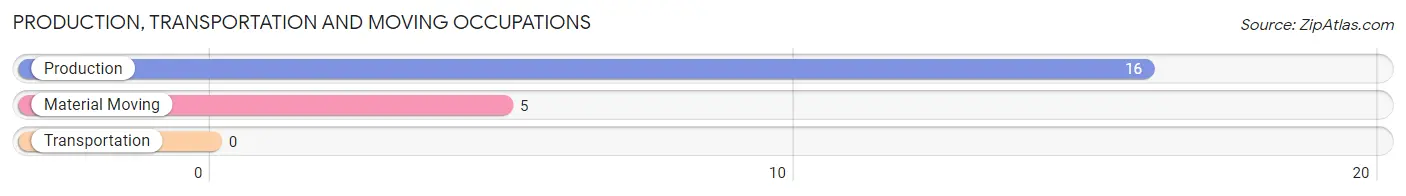
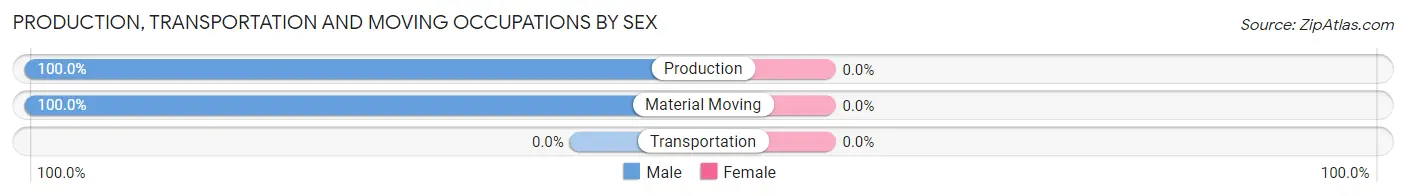
Production, Transportation and Moving Occupations by Sex
| Occupation | Male | Female |
| Production | 16 (100.0%) | 0 (0.0%) |
| Transportation | 0 (0.0%) | 0 (0.0%) |
| Material Moving | 5 (100.0%) | 0 (0.0%) |
| Total (Category) | 21 (100.0%) | 0 (0.0%) |
| Total (Overall) | 120 (75.9%) | 38 (24.0%) |
Employment Industries by Sex in Cottontown
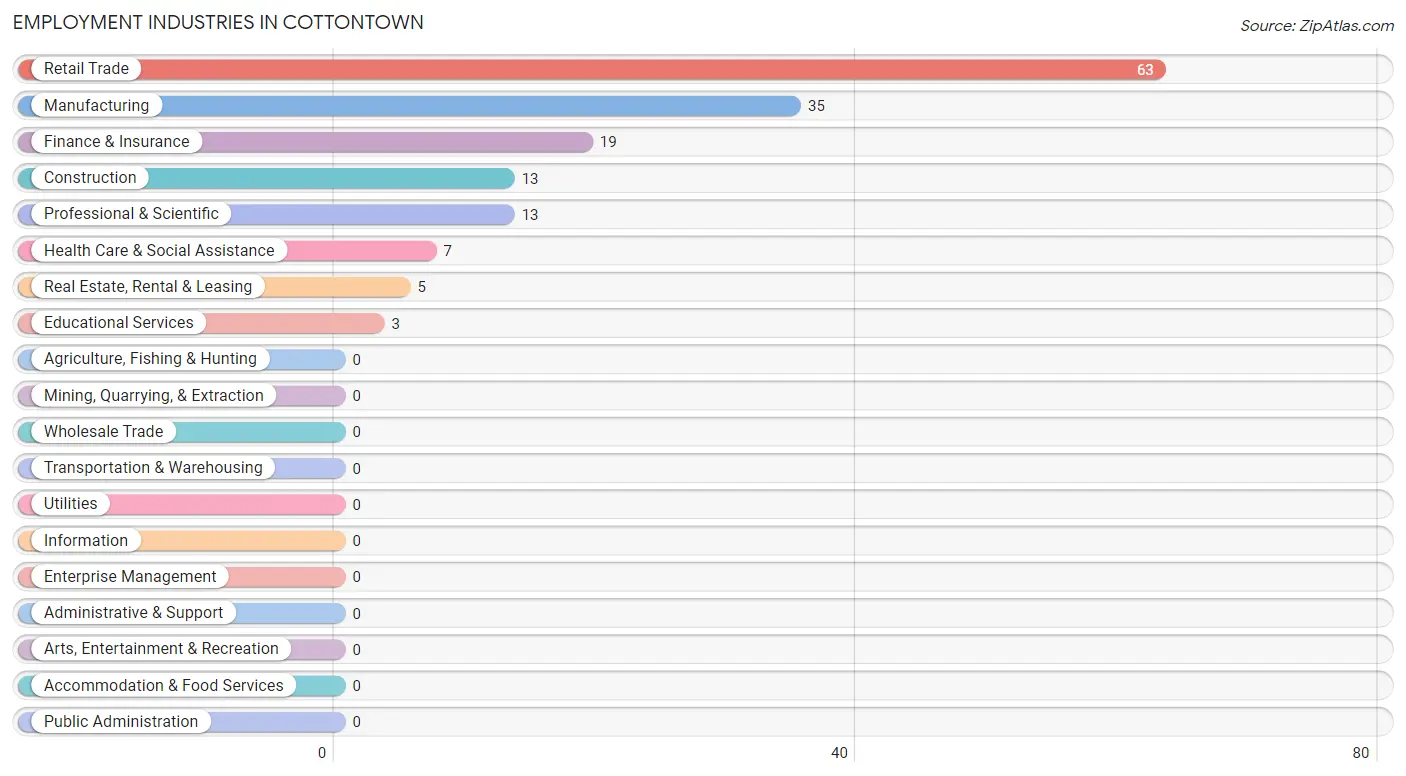
Employment Industries in Cottontown
The major employment industries in Cottontown include Retail Trade (63 | 39.9%), Manufacturing (35 | 22.2%), Finance & Insurance (19 | 12.0%), Construction (13 | 8.2%), and Professional & Scientific (13 | 8.2%).
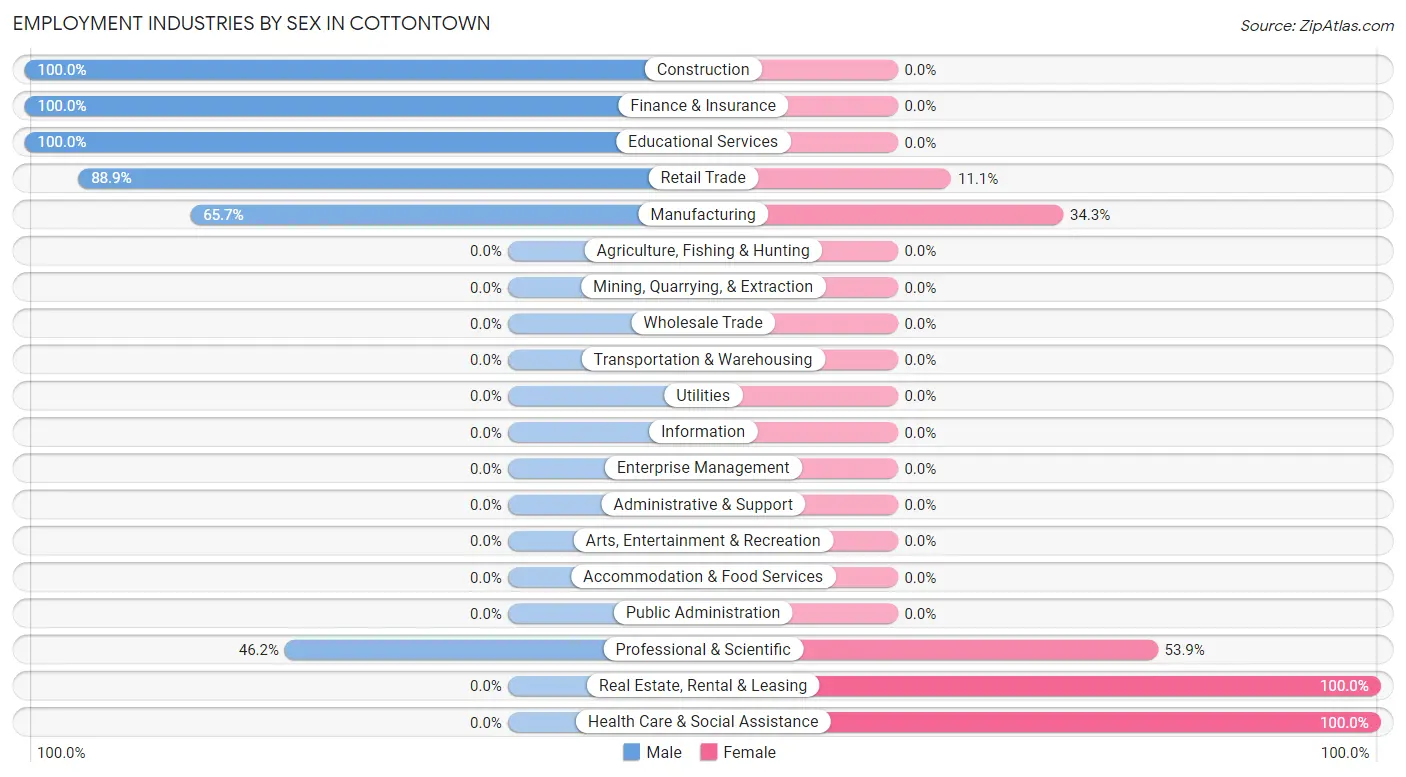
Employment Industries by Sex in Cottontown
The Cottontown industries that see more men than women are Construction (100.0%), Finance & Insurance (100.0%), and Educational Services (100.0%), whereas the industries that tend to have a higher number of women are Real Estate, Rental & Leasing (100.0%), Health Care & Social Assistance (100.0%), and Professional & Scientific (53.8%).
| Industry | Male | Female |
| Agriculture, Fishing & Hunting | 0 (0.0%) | 0 (0.0%) |
| Mining, Quarrying, & Extraction | 0 (0.0%) | 0 (0.0%) |
| Construction | 13 (100.0%) | 0 (0.0%) |
| Manufacturing | 23 (65.7%) | 12 (34.3%) |
| Wholesale Trade | 0 (0.0%) | 0 (0.0%) |
| Retail Trade | 56 (88.9%) | 7 (11.1%) |
| Transportation & Warehousing | 0 (0.0%) | 0 (0.0%) |
| Utilities | 0 (0.0%) | 0 (0.0%) |
| Information | 0 (0.0%) | 0 (0.0%) |
| Finance & Insurance | 19 (100.0%) | 0 (0.0%) |
| Real Estate, Rental & Leasing | 0 (0.0%) | 5 (100.0%) |
| Professional & Scientific | 6 (46.2%) | 7 (53.8%) |
| Enterprise Management | 0 (0.0%) | 0 (0.0%) |
| Administrative & Support | 0 (0.0%) | 0 (0.0%) |
| Educational Services | 3 (100.0%) | 0 (0.0%) |
| Health Care & Social Assistance | 0 (0.0%) | 7 (100.0%) |
| Arts, Entertainment & Recreation | 0 (0.0%) | 0 (0.0%) |
| Accommodation & Food Services | 0 (0.0%) | 0 (0.0%) |
| Public Administration | 0 (0.0%) | 0 (0.0%) |
| Total | 120 (75.9%) | 38 (24.0%) |
Education in Cottontown
School Enrollment in Cottontown
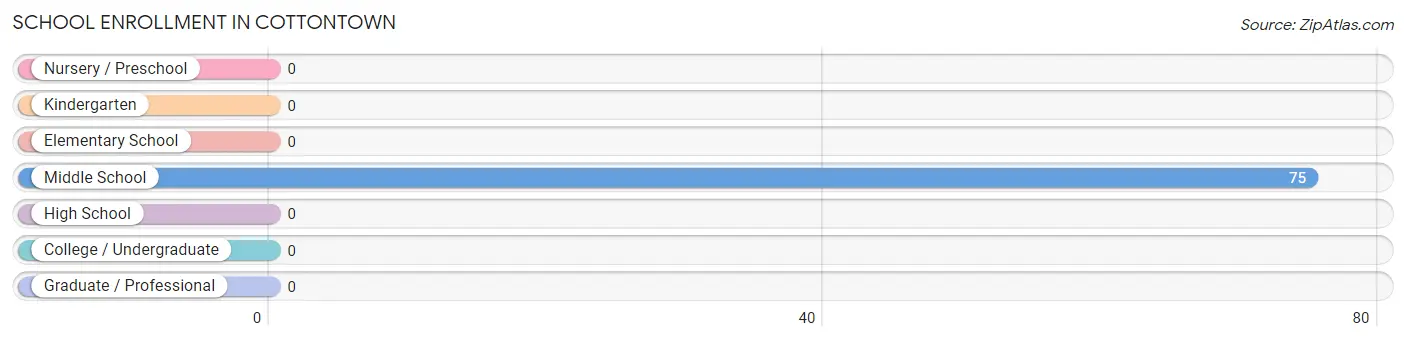
| School Level | # Students | % Students |
| Nursery / Preschool | 0 | 0.0% |
| Kindergarten | 0 | 0.0% |
| Elementary School | 0 | 0.0% |
| Middle School | 75 | 100.0% |
| High School | 0 | 0.0% |
| College / Undergraduate | 0 | 0.0% |
| Graduate / Professional | 0 | 0.0% |
| Total | 75 | 100.0% |
School Enrollment by Age by Funding Source in Cottontown
Out of a total of 75 students who are enrolled in schools in Cottontown, 9 (12.0%) attend a private institution, while the remaining 66 (88.0%) are enrolled in public schools. The age group of 10 to 14 year olds has the highest likelihood of being enrolled in private schools, with 9 (12.0% in the age bracket) enrolled. Conversely, the age group of 10 to 14 year olds has the lowest likelihood of being enrolled in a private school, with 66 (88.0% in the age bracket) attending a public institution.
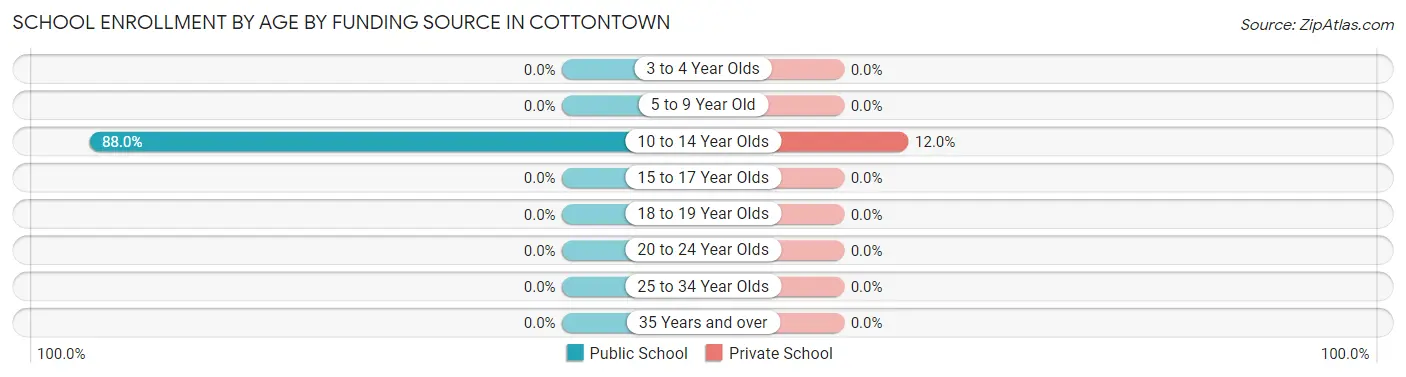
| Age Bracket | Public School | Private School |
| 3 to 4 Year Olds | 0 (0.0%) | 0 (0.0%) |
| 5 to 9 Year Old | 0 (0.0%) | 0 (0.0%) |
| 10 to 14 Year Olds | 66 (88.0%) | 9 (12.0%) |
| 15 to 17 Year Olds | 0 (0.0%) | 0 (0.0%) |
| 18 to 19 Year Olds | 0 (0.0%) | 0 (0.0%) |
| 20 to 24 Year Olds | 0 (0.0%) | 0 (0.0%) |
| 25 to 34 Year Olds | 0 (0.0%) | 0 (0.0%) |
| 35 Years and over | 0 (0.0%) | 0 (0.0%) |
| Total | 66 (88.0%) | 9 (12.0%) |
Educational Attainment by Field of Study in Cottontown
Business (35 | 52.2%), engineering (19 | 28.4%), and science & technology (13 | 19.4%) are the most common fields of study among 67 individuals in Cottontown who have obtained a bachelor's degree or higher.
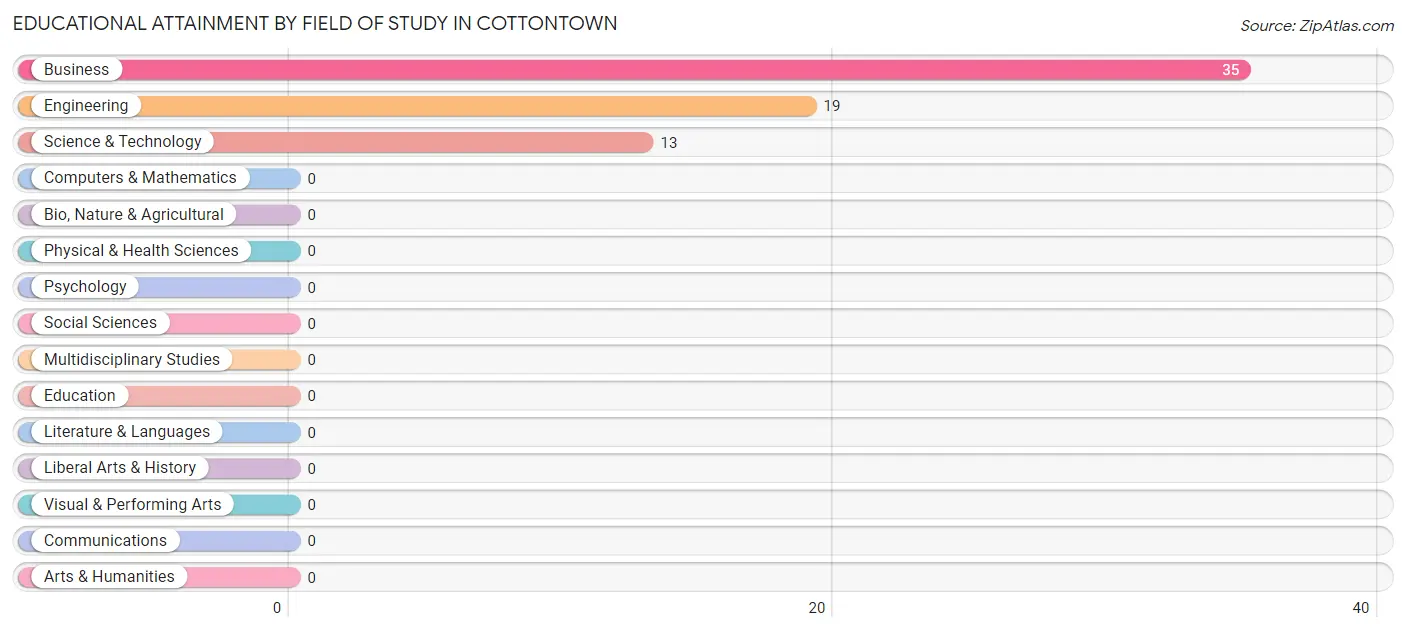
| Field of Study | # Graduates | % Graduates |
| Computers & Mathematics | 0 | 0.0% |
| Bio, Nature & Agricultural | 0 | 0.0% |
| Physical & Health Sciences | 0 | 0.0% |
| Psychology | 0 | 0.0% |
| Social Sciences | 0 | 0.0% |
| Engineering | 19 | 28.4% |
| Multidisciplinary Studies | 0 | 0.0% |
| Science & Technology | 13 | 19.4% |
| Business | 35 | 52.2% |
| Education | 0 | 0.0% |
| Literature & Languages | 0 | 0.0% |
| Liberal Arts & History | 0 | 0.0% |
| Visual & Performing Arts | 0 | 0.0% |
| Communications | 0 | 0.0% |
| Arts & Humanities | 0 | 0.0% |
| Total | 67 | 100.0% |
Transportation & Commute in Cottontown
Vehicle Availability by Sex in Cottontown
The most prevalent vehicle ownership categories in Cottontown are males with 1 vehicle (62, accounting for 51.7%) and females with 1 vehicle (3, making up 163.2%).
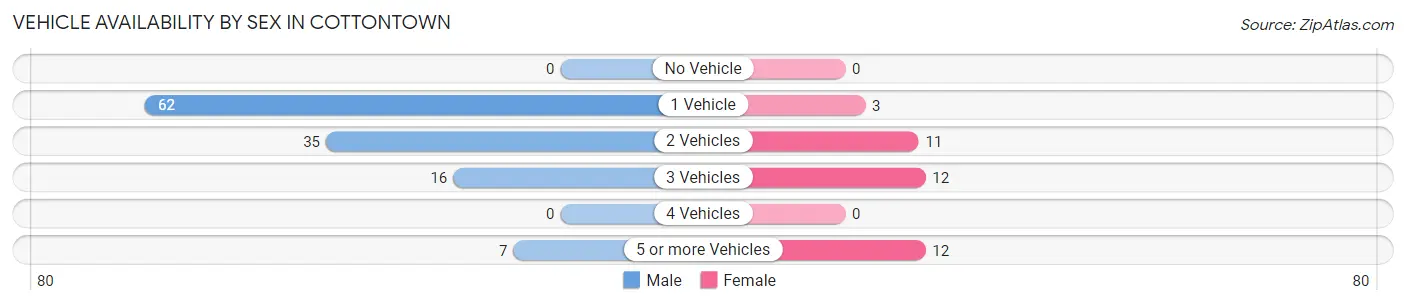
| Vehicles Available | Male | Female |
| No Vehicle | 0 (0.0%) | 0 (0.0%) |
| 1 Vehicle | 62 (51.7%) | 3 (7.9%) |
| 2 Vehicles | 35 (29.2%) | 11 (28.9%) |
| 3 Vehicles | 16 (13.3%) | 12 (31.6%) |
| 4 Vehicles | 0 (0.0%) | 0 (0.0%) |
| 5 or more Vehicles | 7 (5.8%) | 12 (31.6%) |
| Total | 120 (100.0%) | 38 (100.0%) |
Commute Time in Cottontown
The most frequently occuring commute durations in Cottontown are 40 to 44 minutes (48 commuters, 34.5%), 20 to 24 minutes (27 commuters, 19.4%), and 10 to 14 minutes (21 commuters, 15.1%).
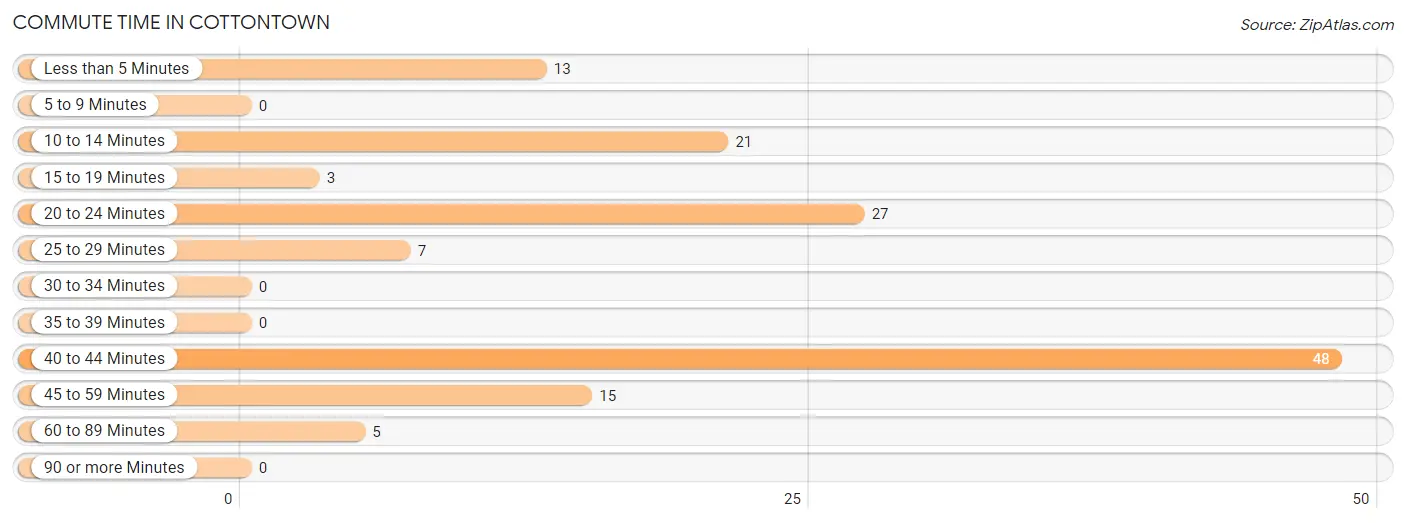
| Commute Time | # Commuters | % Commuters |
| Less than 5 Minutes | 13 | 9.3% |
| 5 to 9 Minutes | 0 | 0.0% |
| 10 to 14 Minutes | 21 | 15.1% |
| 15 to 19 Minutes | 3 | 2.2% |
| 20 to 24 Minutes | 27 | 19.4% |
| 25 to 29 Minutes | 7 | 5.0% |
| 30 to 34 Minutes | 0 | 0.0% |
| 35 to 39 Minutes | 0 | 0.0% |
| 40 to 44 Minutes | 48 | 34.5% |
| 45 to 59 Minutes | 15 | 10.8% |
| 60 to 89 Minutes | 5 | 3.6% |
| 90 or more Minutes | 0 | 0.0% |
Commute Time by Sex in Cottontown
The most common commute times in Cottontown are 40 to 44 minutes (48 commuters, 47.5%) for males and 20 to 24 minutes (12 commuters, 31.6%) for females.
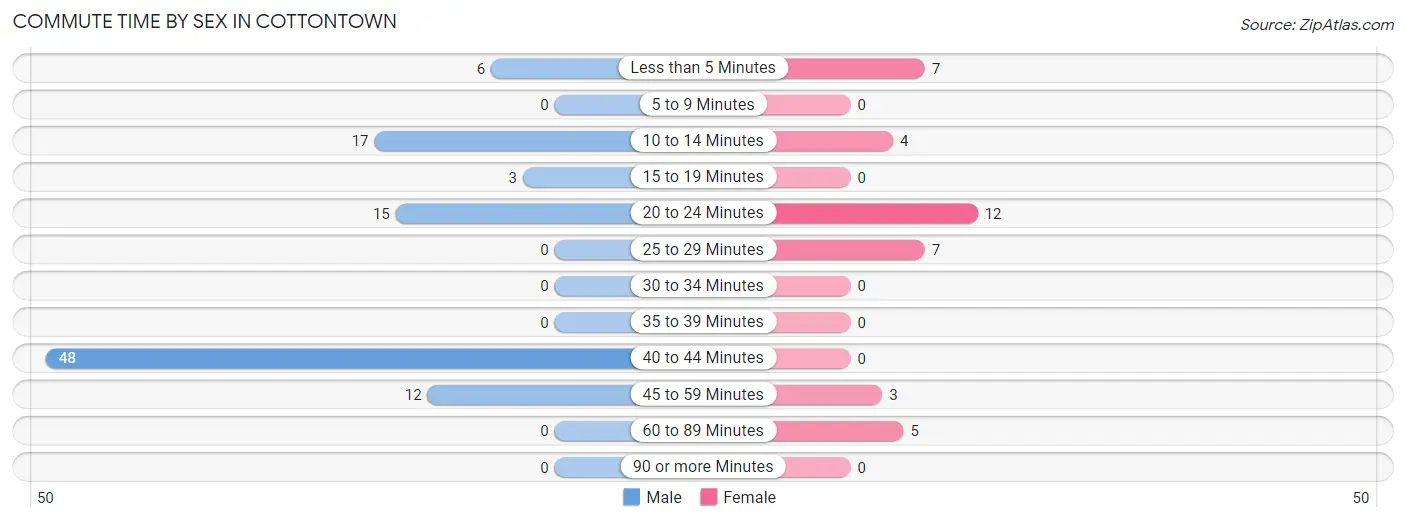
| Commute Time | Male | Female |
| Less than 5 Minutes | 6 (5.9%) | 7 (18.4%) |
| 5 to 9 Minutes | 0 (0.0%) | 0 (0.0%) |
| 10 to 14 Minutes | 17 (16.8%) | 4 (10.5%) |
| 15 to 19 Minutes | 3 (3.0%) | 0 (0.0%) |
| 20 to 24 Minutes | 15 (14.8%) | 12 (31.6%) |
| 25 to 29 Minutes | 0 (0.0%) | 7 (18.4%) |
| 30 to 34 Minutes | 0 (0.0%) | 0 (0.0%) |
| 35 to 39 Minutes | 0 (0.0%) | 0 (0.0%) |
| 40 to 44 Minutes | 48 (47.5%) | 0 (0.0%) |
| 45 to 59 Minutes | 12 (11.9%) | 3 (7.9%) |
| 60 to 89 Minutes | 0 (0.0%) | 5 (13.2%) |
| 90 or more Minutes | 0 (0.0%) | 0 (0.0%) |
Time of Departure to Work by Sex in Cottontown
The most frequent times of departure to work in Cottontown are 6:00 AM to 6:29 AM (42, 41.6%) for males and 7:00 AM to 7:29 AM (12, 31.6%) for females.
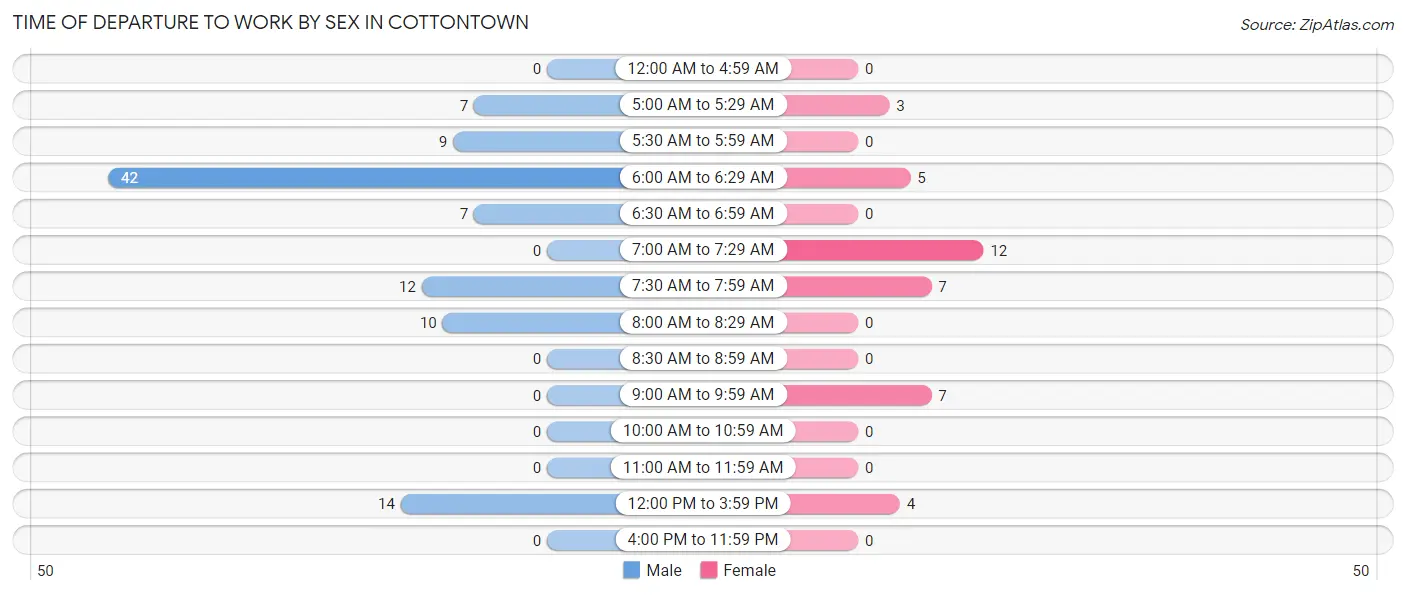
| Time of Departure | Male | Female |
| 12:00 AM to 4:59 AM | 0 (0.0%) | 0 (0.0%) |
| 5:00 AM to 5:29 AM | 7 (6.9%) | 3 (7.9%) |
| 5:30 AM to 5:59 AM | 9 (8.9%) | 0 (0.0%) |
| 6:00 AM to 6:29 AM | 42 (41.6%) | 5 (13.2%) |
| 6:30 AM to 6:59 AM | 7 (6.9%) | 0 (0.0%) |
| 7:00 AM to 7:29 AM | 0 (0.0%) | 12 (31.6%) |
| 7:30 AM to 7:59 AM | 12 (11.9%) | 7 (18.4%) |
| 8:00 AM to 8:29 AM | 10 (9.9%) | 0 (0.0%) |
| 8:30 AM to 8:59 AM | 0 (0.0%) | 0 (0.0%) |
| 9:00 AM to 9:59 AM | 0 (0.0%) | 7 (18.4%) |
| 10:00 AM to 10:59 AM | 0 (0.0%) | 0 (0.0%) |
| 11:00 AM to 11:59 AM | 0 (0.0%) | 0 (0.0%) |
| 12:00 PM to 3:59 PM | 14 (13.9%) | 4 (10.5%) |
| 4:00 PM to 11:59 PM | 0 (0.0%) | 0 (0.0%) |
| Total | 101 (100.0%) | 38 (100.0%) |
Housing Occupancy in Cottontown
Occupancy by Ownership in Cottontown
Of the total 158 dwellings in Cottontown, owner-occupied units account for 116 (73.4%), while renter-occupied units make up 42 (26.6%).
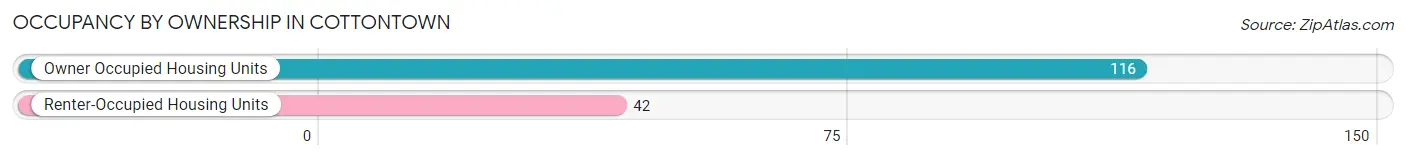
| Occupancy | # Housing Units | % Housing Units |
| Owner Occupied Housing Units | 116 | 73.4% |
| Renter-Occupied Housing Units | 42 | 26.6% |
| Total Occupied Housing Units | 158 | 100.0% |
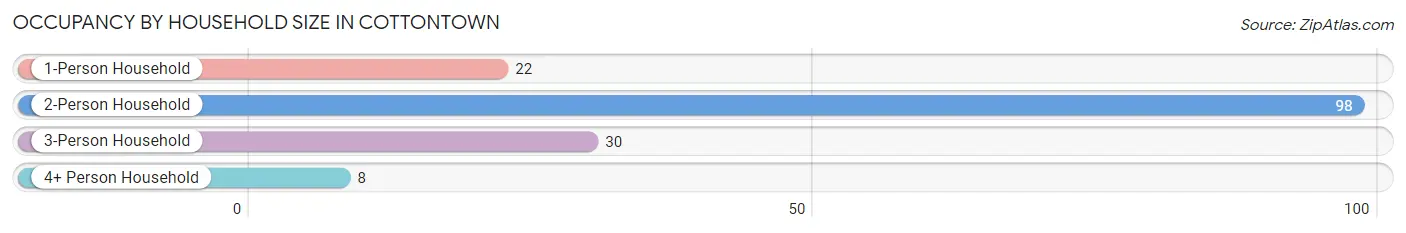
Occupancy by Household Size in Cottontown
| Household Size | # Housing Units | % Housing Units |
| 1-Person Household | 22 | 13.9% |
| 2-Person Household | 98 | 62.0% |
| 3-Person Household | 30 | 19.0% |
| 4+ Person Household | 8 | 5.1% |
| Total Housing Units | 158 | 100.0% |
Occupancy by Ownership by Household Size in Cottontown
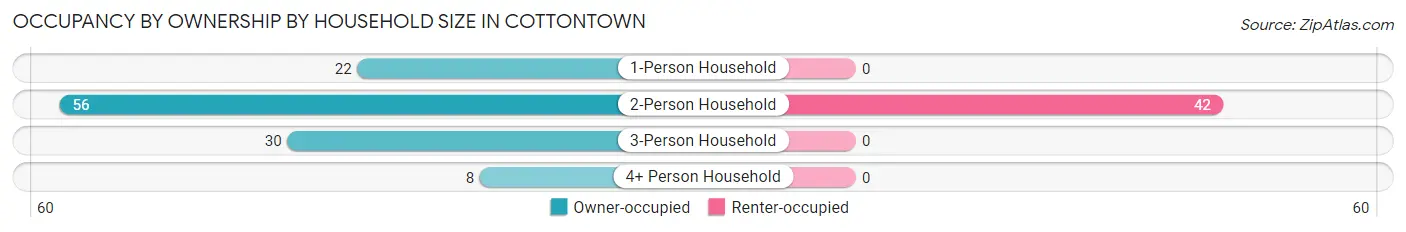
| Household Size | Owner-occupied | Renter-occupied |
| 1-Person Household | 22 (100.0%) | 0 (0.0%) |
| 2-Person Household | 56 (57.1%) | 42 (42.9%) |
| 3-Person Household | 30 (100.0%) | 0 (0.0%) |
| 4+ Person Household | 8 (100.0%) | 0 (0.0%) |
| Total Housing Units | 116 (73.4%) | 42 (26.6%) |
Occupancy by Educational Attainment in Cottontown
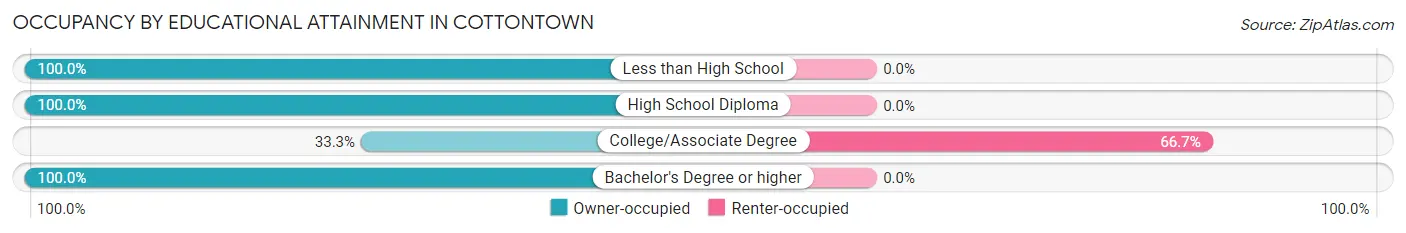
| Household Size | Owner-occupied | Renter-occupied |
| Less than High School | 6 (100.0%) | 0 (0.0%) |
| High School Diploma | 48 (100.0%) | 0 (0.0%) |
| College/Associate Degree | 21 (33.3%) | 42 (66.7%) |
| Bachelor's Degree or higher | 41 (100.0%) | 0 (0.0%) |
Occupancy by Age of Householder in Cottontown
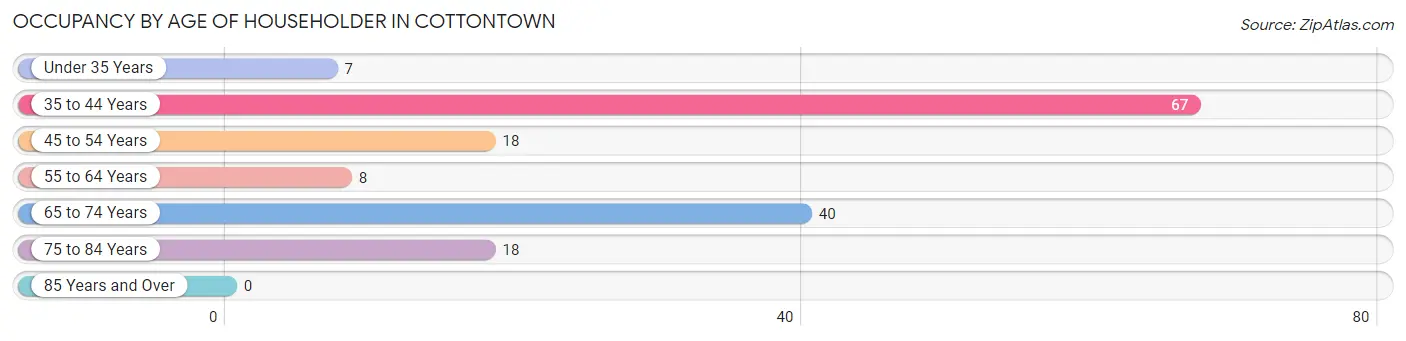
| Age Bracket | # Households | % Households |
| Under 35 Years | 7 | 4.4% |
| 35 to 44 Years | 67 | 42.4% |
| 45 to 54 Years | 18 | 11.4% |
| 55 to 64 Years | 8 | 5.1% |
| 65 to 74 Years | 40 | 25.3% |
| 75 to 84 Years | 18 | 11.4% |
| 85 Years and Over | 0 | 0.0% |
| Total | 158 | 100.0% |
Housing Finances in Cottontown
Median Income by Occupancy in Cottontown
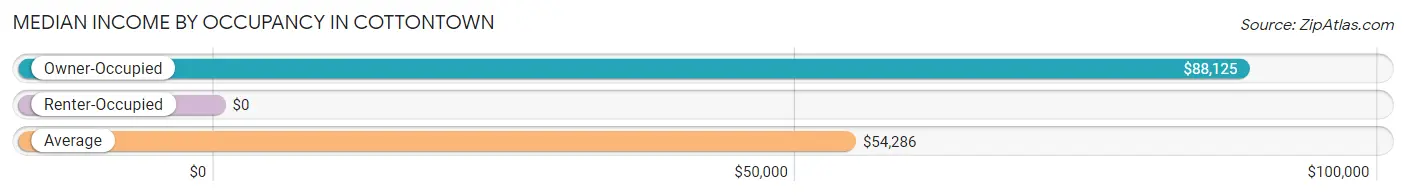
| Occupancy Type | # Households | Median Income |
| Owner-Occupied | 116 (73.4%) | $88,125 |
| Renter-Occupied | 42 (26.6%) | $0 |
| Average | 158 (100.0%) | $54,286 |
Occupancy by Householder Income Bracket in Cottontown
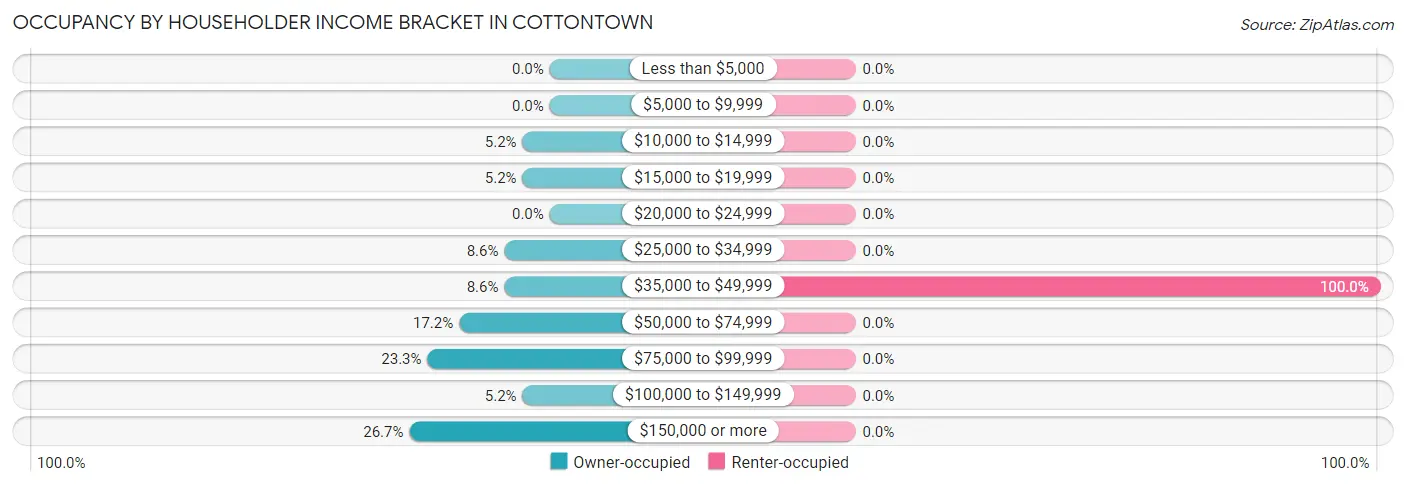
| Income Bracket | Owner-occupied | Renter-occupied |
| Less than $5,000 | 0 (0.0%) | 0 (0.0%) |
| $5,000 to $9,999 | 0 (0.0%) | 0 (0.0%) |
| $10,000 to $14,999 | 6 (5.2%) | 0 (0.0%) |
| $15,000 to $19,999 | 6 (5.2%) | 0 (0.0%) |
| $20,000 to $24,999 | 0 (0.0%) | 0 (0.0%) |
| $25,000 to $34,999 | 10 (8.6%) | 0 (0.0%) |
| $35,000 to $49,999 | 10 (8.6%) | 42 (100.0%) |
| $50,000 to $74,999 | 20 (17.2%) | 0 (0.0%) |
| $75,000 to $99,999 | 27 (23.3%) | 0 (0.0%) |
| $100,000 to $149,999 | 6 (5.2%) | 0 (0.0%) |
| $150,000 or more | 31 (26.7%) | 0 (0.0%) |
| Total | 116 (100.0%) | 42 (100.0%) |
Monthly Housing Cost Tiers in Cottontown
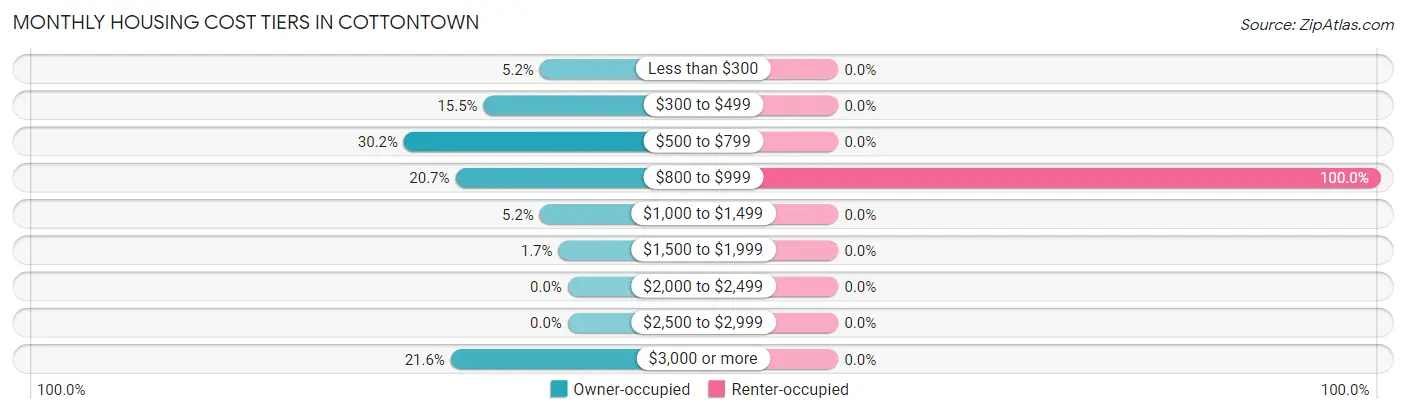
| Monthly Cost | Owner-occupied | Renter-occupied |
| Less than $300 | 6 (5.2%) | 0 (0.0%) |
| $300 to $499 | 18 (15.5%) | 0 (0.0%) |
| $500 to $799 | 35 (30.2%) | 0 (0.0%) |
| $800 to $999 | 24 (20.7%) | 42 (100.0%) |
| $1,000 to $1,499 | 6 (5.2%) | 0 (0.0%) |
| $1,500 to $1,999 | 2 (1.7%) | 0 (0.0%) |
| $2,000 to $2,499 | 0 (0.0%) | 0 (0.0%) |
| $2,500 to $2,999 | 0 (0.0%) | 0 (0.0%) |
| $3,000 or more | 25 (21.5%) | 0 (0.0%) |
| Total | 116 (100.0%) | 42 (100.0%) |
Physical Housing Characteristics in Cottontown
Housing Structures in Cottontown
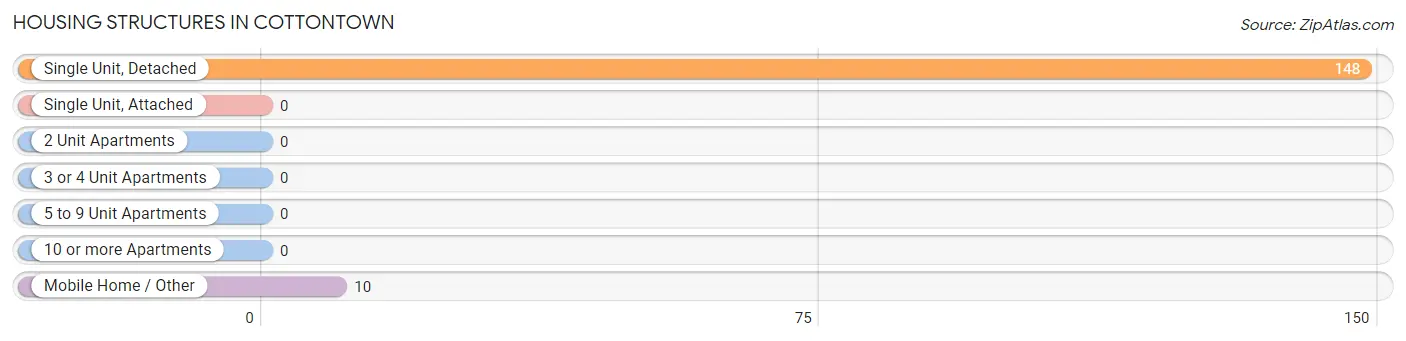
| Structure Type | # Housing Units | % Housing Units |
| Single Unit, Detached | 148 | 93.7% |
| Single Unit, Attached | 0 | 0.0% |
| 2 Unit Apartments | 0 | 0.0% |
| 3 or 4 Unit Apartments | 0 | 0.0% |
| 5 to 9 Unit Apartments | 0 | 0.0% |
| 10 or more Apartments | 0 | 0.0% |
| Mobile Home / Other | 10 | 6.3% |
| Total | 158 | 100.0% |
Housing Structures by Occupancy in Cottontown
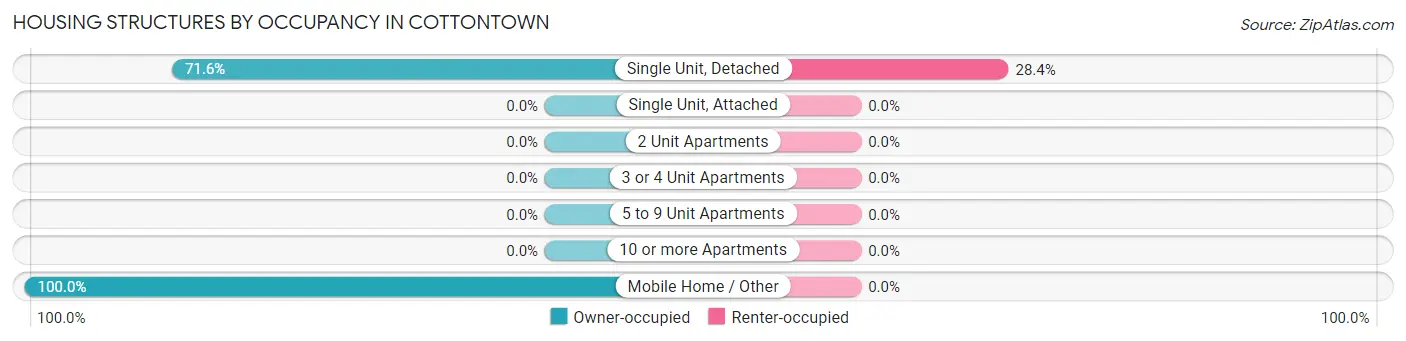
| Structure Type | Owner-occupied | Renter-occupied |
| Single Unit, Detached | 106 (71.6%) | 42 (28.4%) |
| Single Unit, Attached | 0 (0.0%) | 0 (0.0%) |
| 2 Unit Apartments | 0 (0.0%) | 0 (0.0%) |
| 3 or 4 Unit Apartments | 0 (0.0%) | 0 (0.0%) |
| 5 to 9 Unit Apartments | 0 (0.0%) | 0 (0.0%) |
| 10 or more Apartments | 0 (0.0%) | 0 (0.0%) |
| Mobile Home / Other | 10 (100.0%) | 0 (0.0%) |
| Total | 116 (73.4%) | 42 (26.6%) |
Housing Structures by Number of Rooms in Cottontown
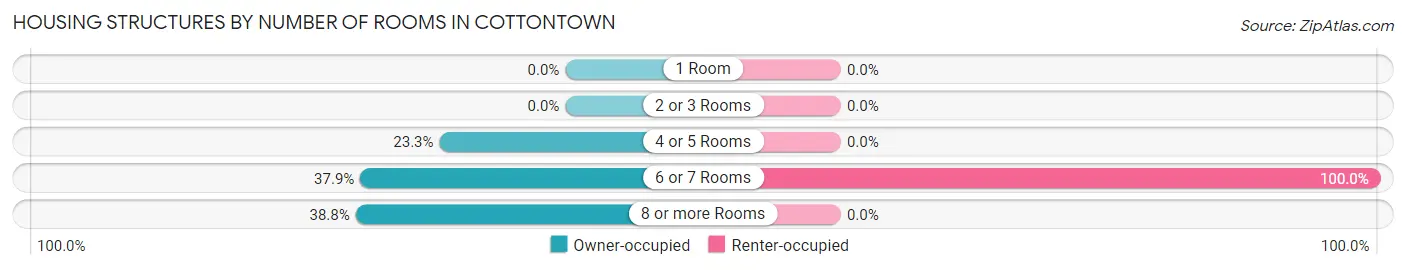
| Number of Rooms | Owner-occupied | Renter-occupied |
| 1 Room | 0 (0.0%) | 0 (0.0%) |
| 2 or 3 Rooms | 0 (0.0%) | 0 (0.0%) |
| 4 or 5 Rooms | 27 (23.3%) | 0 (0.0%) |
| 6 or 7 Rooms | 44 (37.9%) | 42 (100.0%) |
| 8 or more Rooms | 45 (38.8%) | 0 (0.0%) |
| Total | 116 (100.0%) | 42 (100.0%) |
Housing Structure by Heating Type in Cottontown
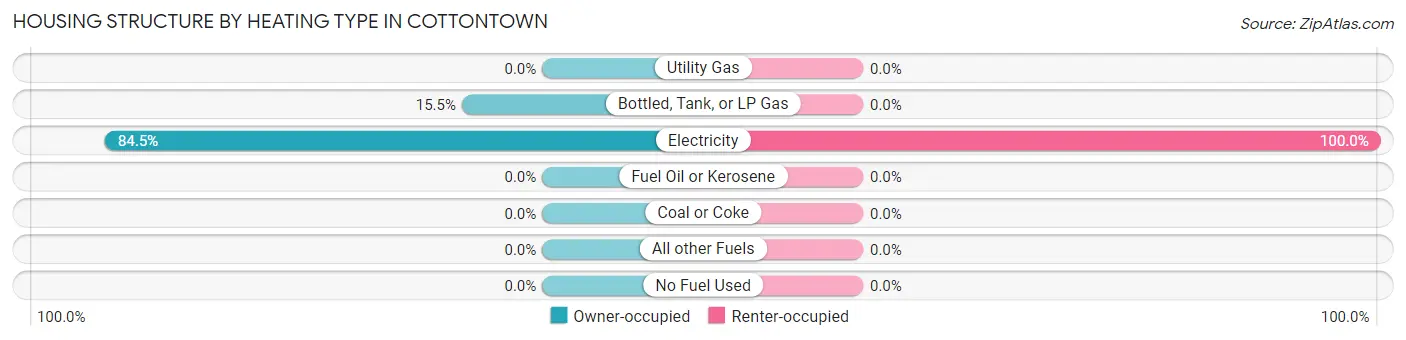
| Heating Type | Owner-occupied | Renter-occupied |
| Utility Gas | 0 (0.0%) | 0 (0.0%) |
| Bottled, Tank, or LP Gas | 18 (15.5%) | 0 (0.0%) |
| Electricity | 98 (84.5%) | 42 (100.0%) |
| Fuel Oil or Kerosene | 0 (0.0%) | 0 (0.0%) |
| Coal or Coke | 0 (0.0%) | 0 (0.0%) |
| All other Fuels | 0 (0.0%) | 0 (0.0%) |
| No Fuel Used | 0 (0.0%) | 0 (0.0%) |
| Total | 116 (100.0%) | 42 (100.0%) |
Household Vehicle Usage in Cottontown
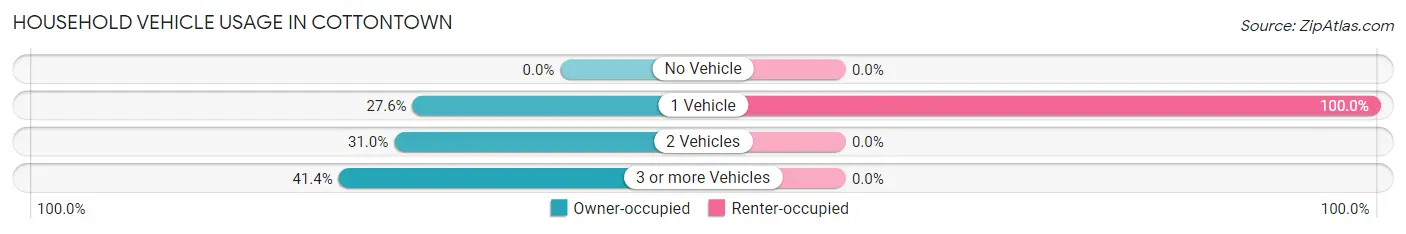
| Vehicles per Household | Owner-occupied | Renter-occupied |
| No Vehicle | 0 (0.0%) | 0 (0.0%) |
| 1 Vehicle | 32 (27.6%) | 42 (100.0%) |
| 2 Vehicles | 36 (31.0%) | 0 (0.0%) |
| 3 or more Vehicles | 48 (41.4%) | 0 (0.0%) |
| Total | 116 (100.0%) | 42 (100.0%) |
Real Estate & Mortgages in Cottontown
Real Estate and Mortgage Overview in Cottontown
| Characteristic | Without Mortgage | With Mortgage |
| Housing Units | 66 | 50 |
| Median Property Value | $472,200 | $0 |
| Median Household Income | $88,750 | $19 |
| Monthly Housing Costs | $625 | $25 |
| Real Estate Taxes | $1,407 | $6 |
Property Value by Mortgage Status in Cottontown
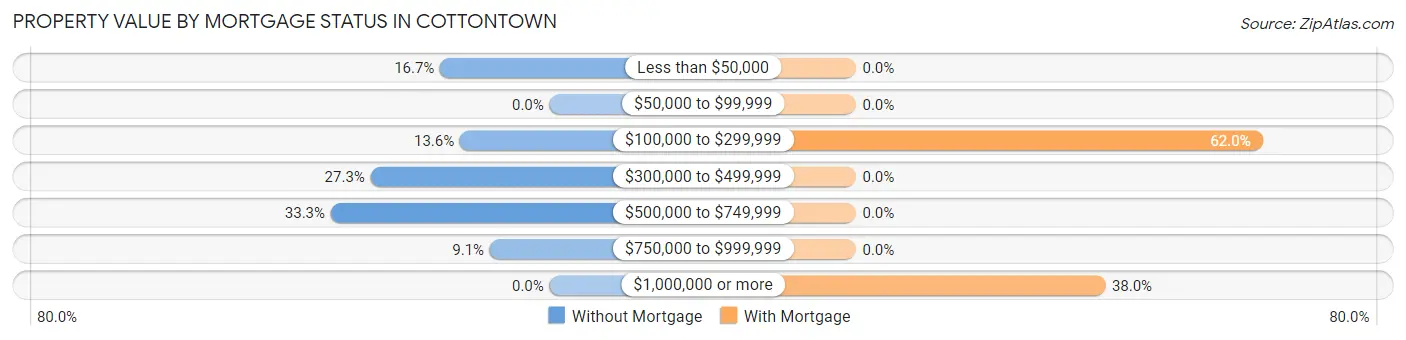
| Property Value | Without Mortgage | With Mortgage |
| Less than $50,000 | 11 (16.7%) | 0 (0.0%) |
| $50,000 to $99,999 | 0 (0.0%) | 0 (0.0%) |
| $100,000 to $299,999 | 9 (13.6%) | 31 (62.0%) |
| $300,000 to $499,999 | 18 (27.3%) | 0 (0.0%) |
| $500,000 to $749,999 | 22 (33.3%) | 0 (0.0%) |
| $750,000 to $999,999 | 6 (9.1%) | 0 (0.0%) |
| $1,000,000 or more | 0 (0.0%) | 19 (38.0%) |
| Total | 66 (100.0%) | 50 (100.0%) |
Household Income by Mortgage Status in Cottontown
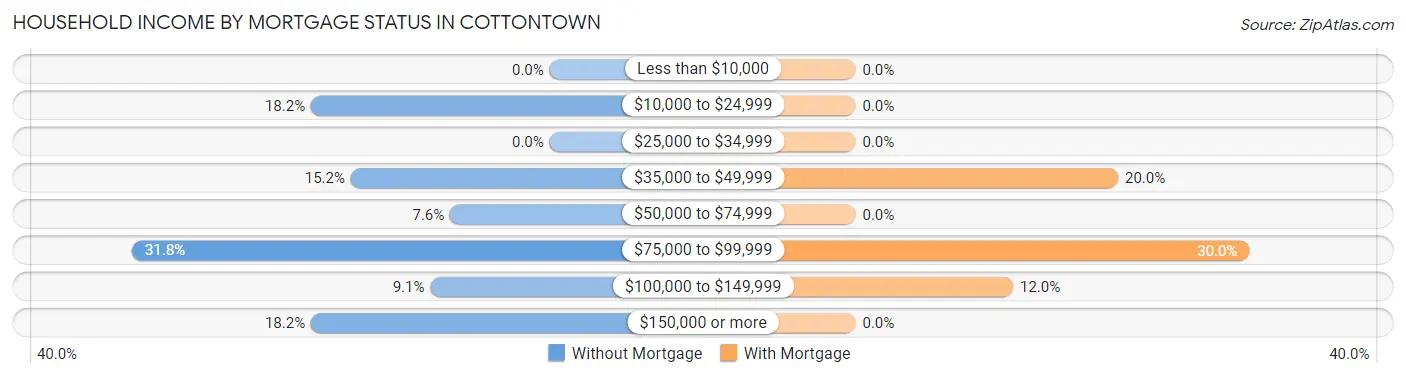
| Household Income | Without Mortgage | With Mortgage |
| Less than $10,000 | 0 (0.0%) | 0 (0.0%) |
| $10,000 to $24,999 | 12 (18.2%) | 0 (0.0%) |
| $25,000 to $34,999 | 0 (0.0%) | 0 (0.0%) |
| $35,000 to $49,999 | 10 (15.1%) | 10 (20.0%) |
| $50,000 to $74,999 | 5 (7.6%) | 0 (0.0%) |
| $75,000 to $99,999 | 21 (31.8%) | 15 (30.0%) |
| $100,000 to $149,999 | 6 (9.1%) | 6 (12.0%) |
| $150,000 or more | 12 (18.2%) | 0 (0.0%) |
| Total | 66 (100.0%) | 50 (100.0%) |
Property Value to Household Income Ratio in Cottontown
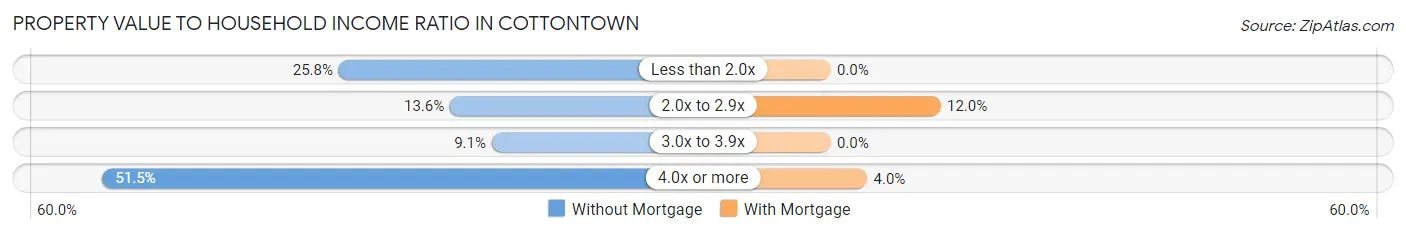
| Value-to-Income Ratio | Without Mortgage | With Mortgage |
| Less than 2.0x | 17 (25.8%) | 0 (0.0%) |
| 2.0x to 2.9x | 9 (13.6%) | 6 (12.0%) |
| 3.0x to 3.9x | 6 (9.1%) | 0 (0.0%) |
| 4.0x or more | 34 (51.5%) | 2 (4.0%) |
| Total | 66 (100.0%) | 50 (100.0%) |
Real Estate Taxes by Mortgage Status in Cottontown
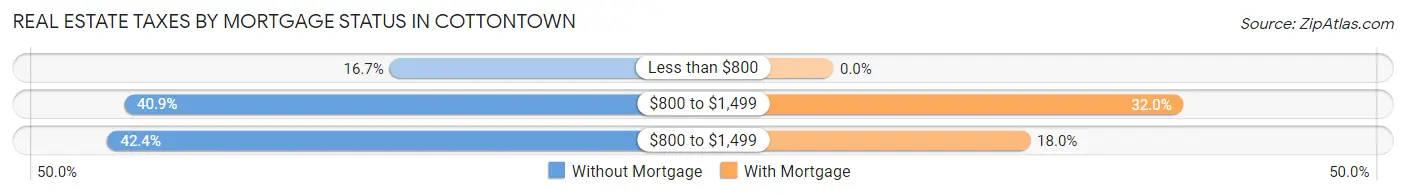
| Property Taxes | Without Mortgage | With Mortgage |
| Less than $800 | 11 (16.7%) | 0 (0.0%) |
| $800 to $1,499 | 27 (40.9%) | 16 (32.0%) |
| $800 to $1,499 | 28 (42.4%) | 9 (18.0%) |
| Total | 66 (100.0%) | 50 (100.0%) |
Health & Disability in Cottontown
Health Insurance Coverage by Age in Cottontown
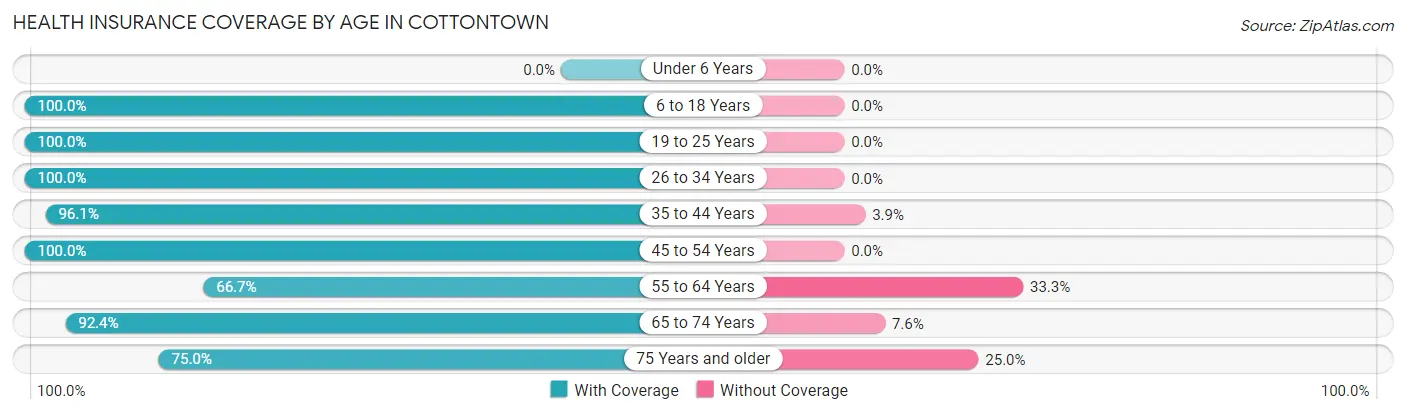
| Age Bracket | With Coverage | Without Coverage |
| Under 6 Years | 0 (0.0%) | 0 (0.0%) |
| 6 to 18 Years | 75 (100.0%) | 0 (0.0%) |
| 19 to 25 Years | 4 (100.0%) | 0 (0.0%) |
| 26 to 34 Years | 33 (100.0%) | 0 (0.0%) |
| 35 to 44 Years | 74 (96.1%) | 3 (3.9%) |
| 45 to 54 Years | 38 (100.0%) | 0 (0.0%) |
| 55 to 64 Years | 10 (66.7%) | 5 (33.3%) |
| 65 to 74 Years | 73 (92.4%) | 6 (7.6%) |
| 75 Years and older | 18 (75.0%) | 6 (25.0%) |
| Total | 325 (94.2%) | 20 (5.8%) |
Health Insurance Coverage by Citizenship Status in Cottontown
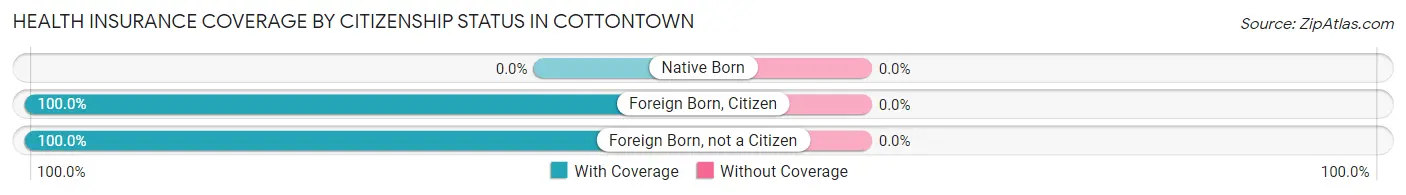
| Citizenship Status | With Coverage | Without Coverage |
| Native Born | 0 (0.0%) | 0 (0.0%) |
| Foreign Born, Citizen | 75 (100.0%) | 0 (0.0%) |
| Foreign Born, not a Citizen | 4 (100.0%) | 0 (0.0%) |
Health Insurance Coverage by Household Income in Cottontown
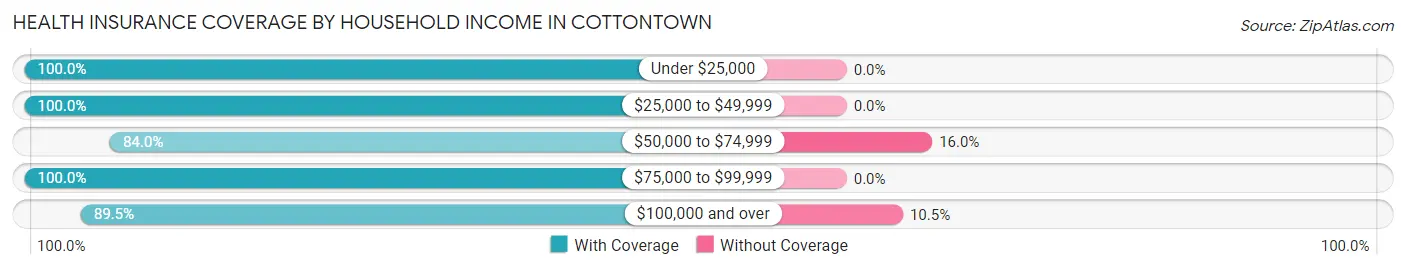
| Household Income | With Coverage | Without Coverage |
| Under $25,000 | 12 (100.0%) | 0 (0.0%) |
| $25,000 to $49,999 | 113 (100.0%) | 0 (0.0%) |
| $50,000 to $74,999 | 42 (84.0%) | 8 (16.0%) |
| $75,000 to $99,999 | 56 (100.0%) | 0 (0.0%) |
| $100,000 and over | 102 (89.5%) | 12 (10.5%) |
Public vs Private Health Insurance Coverage by Age in Cottontown
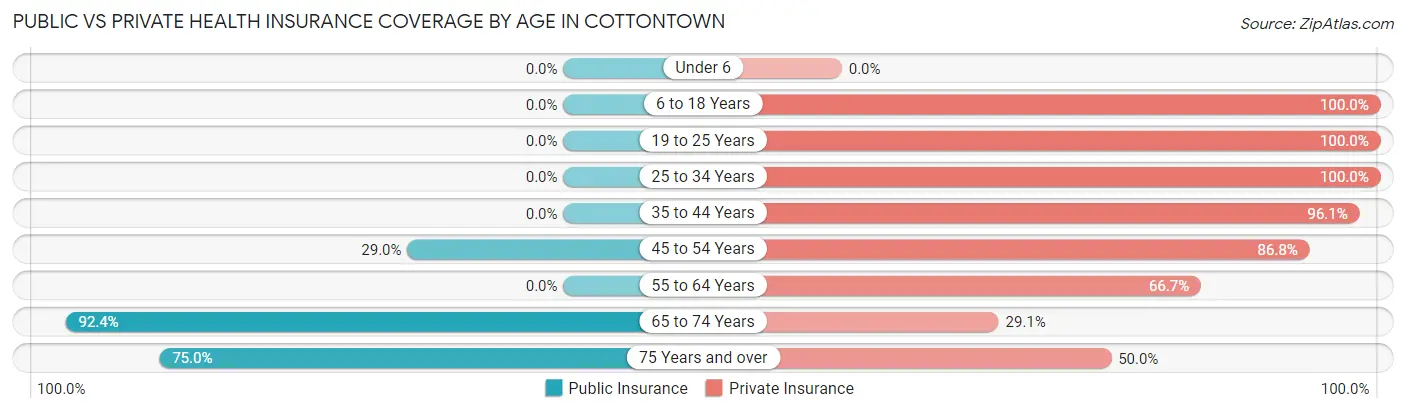
| Age Bracket | Public Insurance | Private Insurance |
| Under 6 | 0 (0.0%) | 0 (0.0%) |
| 6 to 18 Years | 0 (0.0%) | 75 (100.0%) |
| 19 to 25 Years | 0 (0.0%) | 4 (100.0%) |
| 25 to 34 Years | 0 (0.0%) | 33 (100.0%) |
| 35 to 44 Years | 0 (0.0%) | 74 (96.1%) |
| 45 to 54 Years | 11 (28.9%) | 33 (86.8%) |
| 55 to 64 Years | 0 (0.0%) | 10 (66.7%) |
| 65 to 74 Years | 73 (92.4%) | 23 (29.1%) |
| 75 Years and over | 18 (75.0%) | 12 (50.0%) |
| Total | 102 (29.6%) | 264 (76.5%) |
Disability Status by Sex by Age in Cottontown
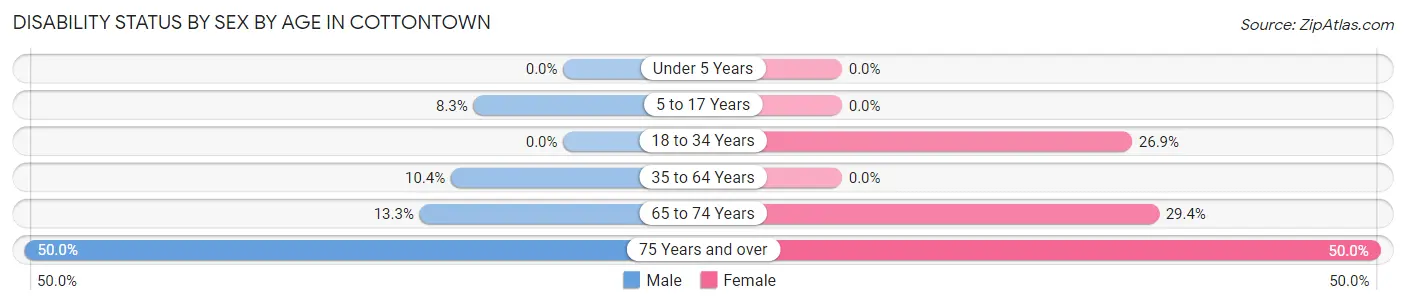
| Age Bracket | Male | Female |
| Under 5 Years | 0 (0.0%) | 0 (0.0%) |
| 5 to 17 Years | 6 (8.3%) | 0 (0.0%) |
| 18 to 34 Years | 0 (0.0%) | 7 (26.9%) |
| 35 to 64 Years | 10 (10.4%) | 0 (0.0%) |
| 65 to 74 Years | 6 (13.3%) | 10 (29.4%) |
| 75 Years and over | 6 (50.0%) | 6 (50.0%) |
Disability Class by Sex by Age in Cottontown
Disability Class: Hearing Difficulty
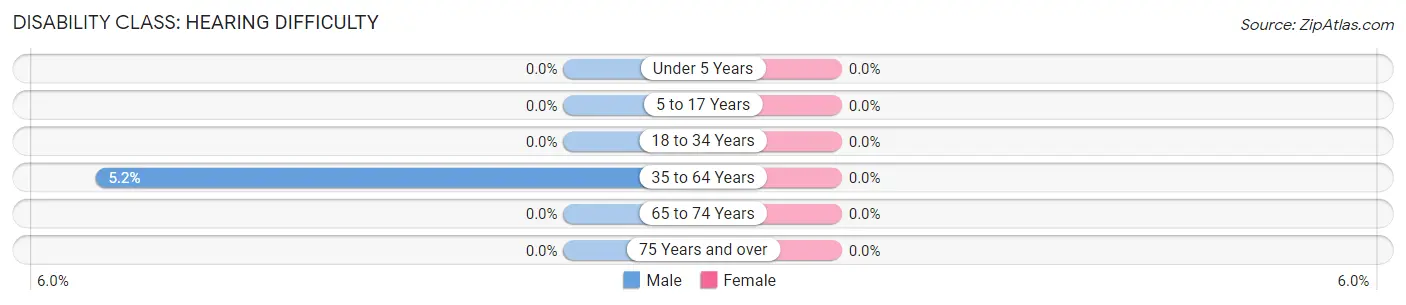
| Age Bracket | Male | Female |
| Under 5 Years | 0 (0.0%) | 0 (0.0%) |
| 5 to 17 Years | 0 (0.0%) | 0 (0.0%) |
| 18 to 34 Years | 0 (0.0%) | 0 (0.0%) |
| 35 to 64 Years | 5 (5.2%) | 0 (0.0%) |
| 65 to 74 Years | 0 (0.0%) | 0 (0.0%) |
| 75 Years and over | 0 (0.0%) | 0 (0.0%) |
Disability Class: Vision Difficulty
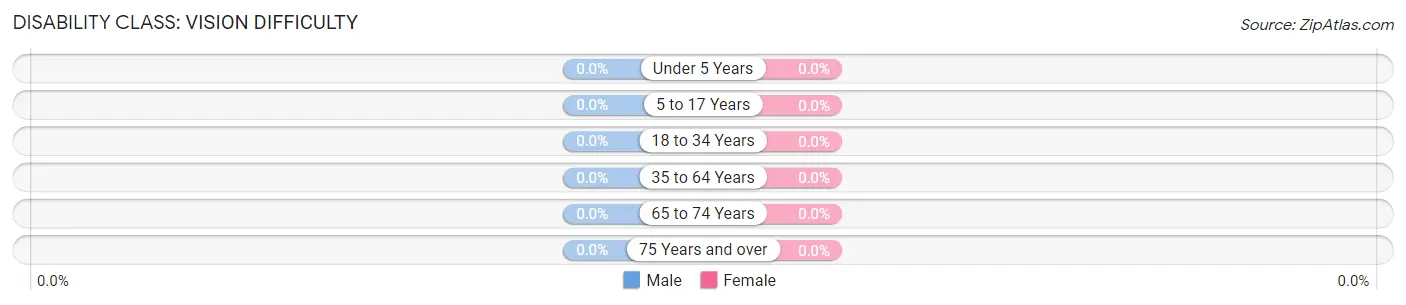
| Age Bracket | Male | Female |
| Under 5 Years | 0 (0.0%) | 0 (0.0%) |
| 5 to 17 Years | 0 (0.0%) | 0 (0.0%) |
| 18 to 34 Years | 0 (0.0%) | 0 (0.0%) |
| 35 to 64 Years | 0 (0.0%) | 0 (0.0%) |
| 65 to 74 Years | 0 (0.0%) | 0 (0.0%) |
| 75 Years and over | 0 (0.0%) | 0 (0.0%) |
Disability Class: Cognitive Difficulty
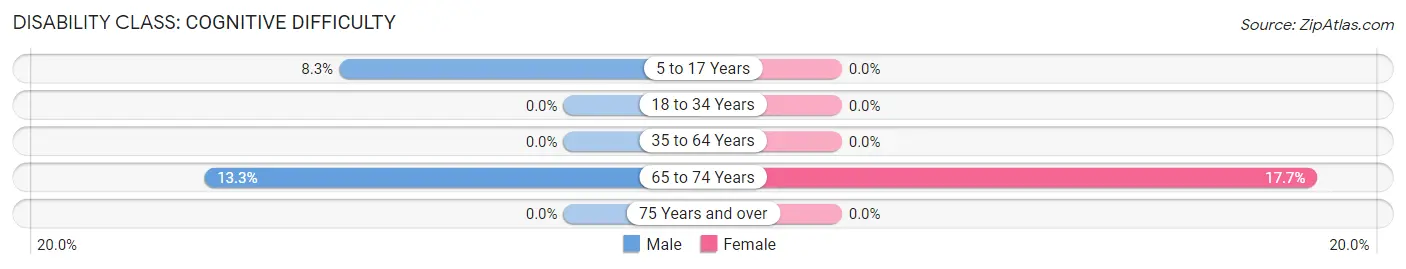
| Age Bracket | Male | Female |
| 5 to 17 Years | 6 (8.3%) | 0 (0.0%) |
| 18 to 34 Years | 0 (0.0%) | 0 (0.0%) |
| 35 to 64 Years | 0 (0.0%) | 0 (0.0%) |
| 65 to 74 Years | 6 (13.3%) | 6 (17.6%) |
| 75 Years and over | 0 (0.0%) | 0 (0.0%) |
Disability Class: Ambulatory Difficulty
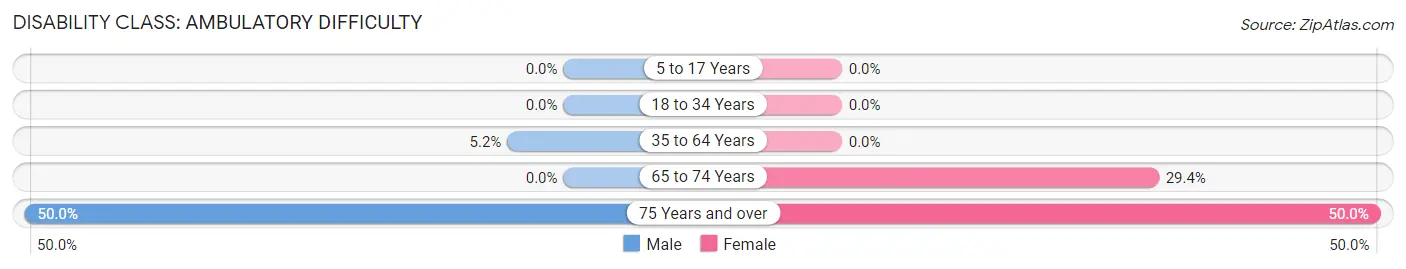
| Age Bracket | Male | Female |
| 5 to 17 Years | 0 (0.0%) | 0 (0.0%) |
| 18 to 34 Years | 0 (0.0%) | 0 (0.0%) |
| 35 to 64 Years | 5 (5.2%) | 0 (0.0%) |
| 65 to 74 Years | 0 (0.0%) | 10 (29.4%) |
| 75 Years and over | 6 (50.0%) | 6 (50.0%) |
Disability Class: Self-Care Difficulty
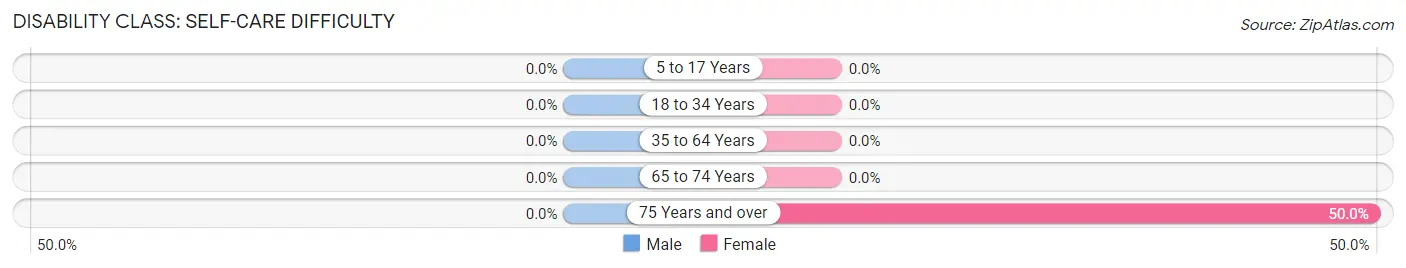
| Age Bracket | Male | Female |
| 5 to 17 Years | 0 (0.0%) | 0 (0.0%) |
| 18 to 34 Years | 0 (0.0%) | 0 (0.0%) |
| 35 to 64 Years | 0 (0.0%) | 0 (0.0%) |
| 65 to 74 Years | 0 (0.0%) | 0 (0.0%) |
| 75 Years and over | 0 (0.0%) | 6 (50.0%) |
Technology Access in Cottontown
Computing Device Access in Cottontown
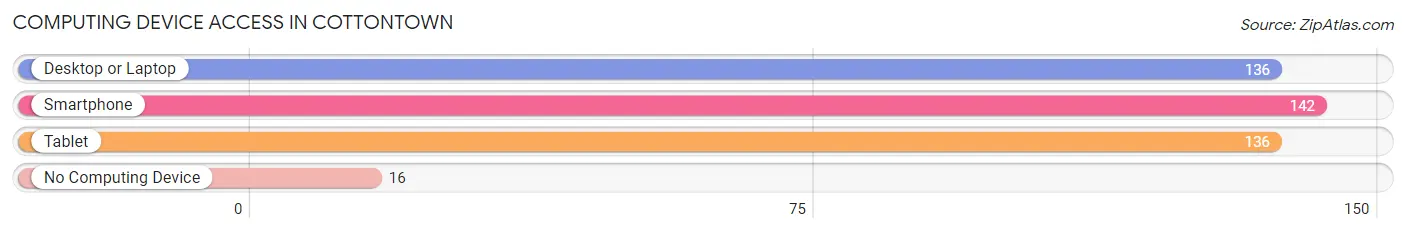
| Device Type | # Households | % Households |
| Desktop or Laptop | 136 | 86.1% |
| Smartphone | 142 | 89.9% |
| Tablet | 136 | 86.1% |
| No Computing Device | 16 | 10.1% |
| Total | 158 | 100.0% |
Internet Access in Cottontown
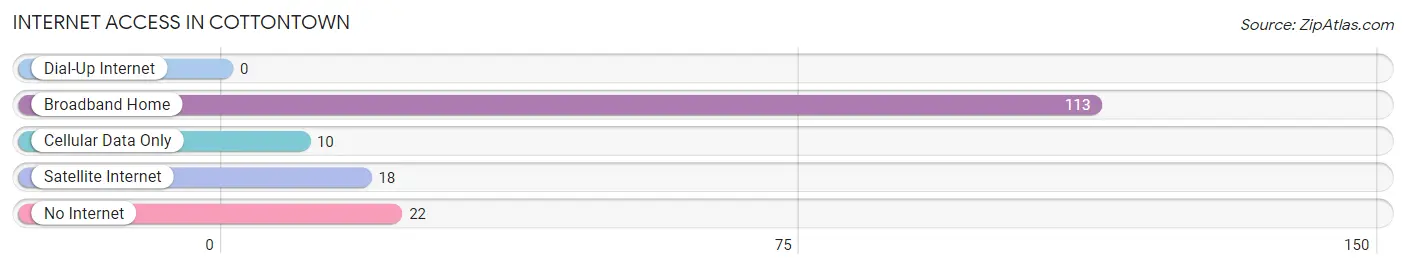
| Internet Type | # Households | % Households |
| Dial-Up Internet | 0 | 0.0% |
| Broadband Home | 113 | 71.5% |
| Cellular Data Only | 10 | 6.3% |
| Satellite Internet | 18 | 11.4% |
| No Internet | 22 | 13.9% |
| Total | 158 | 100.0% |
Cottontown Summary
Cottontown is a small unincorporated community located in Sumner County, Tennessee. It is situated along the banks of the Cumberland River, approximately 20 miles northeast of Nashville. The community is named for the cotton fields that once surrounded it.
History
Cottontown was first settled in the early 1800s by a group of settlers from North Carolina. The settlers were attracted to the area due to its fertile soil and abundant water supply. The community was initially known as “Cotton Town”, but the name was later changed to “Cottontown”.
The first post office in Cottontown was established in 1837. The community grew slowly over the next few decades, and by the late 1800s, it had become a thriving agricultural center. Cotton was the primary crop grown in the area, and the town was home to several cotton gins and warehouses.
In the early 1900s, Cottontown began to experience a period of decline. The cotton industry was in decline, and the town’s population began to dwindle. By the mid-1900s, the town had become a virtual ghost town.
In the late 1900s, Cottontown began to experience a resurgence. The town was revitalized by the construction of a new bridge over the Cumberland River, which allowed for easier access to Nashville. The town also benefited from the growth of nearby cities such as Hendersonville and Gallatin.
Geography
Cottontown is located in Sumner County, Tennessee. It is situated along the banks of the Cumberland River, approximately 20 miles northeast of Nashville. The town is located in a rural area, and is surrounded by rolling hills and farmland.
The climate in Cottontown is humid subtropical, with hot summers and mild winters. The average annual temperature is around 60 degrees Fahrenheit. The average annual precipitation is around 45 inches.
Economy
The economy of Cottontown is largely based on agriculture. The town is home to several farms, which produce a variety of crops, including cotton, corn, soybeans, and wheat. The town is also home to several small businesses, including restaurants, convenience stores, and auto repair shops.
Demographics
As of the 2010 census, Cottontown had a population of 1,845. The racial makeup of the town was 97.3% White, 0.9% African American, 0.3% Native American, 0.2% Asian, and 0.3% from other races. The median household income was $41,250, and the median family income was $45,000.
Conclusion
Cottontown is a small unincorporated community located in Sumner County, Tennessee. It is situated along the banks of the Cumberland River, approximately 20 miles northeast of Nashville. The town was first settled in the early 1800s, and was initially known as “Cotton Town”. The economy of Cottontown is largely based on agriculture, and the town is home to several small businesses. As of the 2010 census, Cottontown had a population of 1,845.
Common Questions
What is Per Capita Income in Cottontown?
Per Capita income in Cottontown is $42,603.
What is the Median Household income in Cottontown?
Median Household Income in Cottontown is $54,286.
What is Income or Wage Gap in Cottontown?
Income or Wage Gap in Cottontown is 19.8%.
Women in Cottontown earn 80.2 cents for every dollar earned by a man.
What is Inequality or Gini Index in Cottontown?
Inequality or Gini Index in Cottontown is 0.45.
What is the Total Population of Cottontown?
Total Population of Cottontown is 345.
What is the Total Male Population of Cottontown?
Total Male Population of Cottontown is 236.
What is the Total Female Population of Cottontown?
Total Female Population of Cottontown is 109.
What is the Ratio of Males per 100 Females in Cottontown?
There are 216.51 Males per 100 Females in Cottontown.
What is the Ratio of Females per 100 Males in Cottontown?
There are 46.19 Females per 100 Males in Cottontown.
What is the Median Population Age in Cottontown?
Median Population Age in Cottontown is 40.8 Years.
What is the Average Family Size in Cottontown
Average Family Size in Cottontown is 2.4 People.
What is the Average Household Size in Cottontown
Average Household Size in Cottontown is 2.2 People.
How Large is the Labor Force in Cottontown?
There are 180 People in the Labor Forcein in Cottontown.
What is the Percentage of People in the Labor Force in Cottontown?
66.7% of People are in the Labor Force in Cottontown.
What is the Unemployment Rate in Cottontown?
Unemployment Rate in Cottontown is 12.2%.