Circleville, UT Map & Demographics
Circleville Map
Circleville Overview
$25,154
PER CAPITA INCOME
$66,250
AVG FAMILY INCOME
$58,438
AVG HOUSEHOLD INCOME
69.9%
WAGE / INCOME GAP [ % ]
30.1¢/ $1
WAGE / INCOME GAP [ $ ]
$9,629
FAMILY INCOME DEFICIT
0.38
INEQUALITY / GINI INDEX
431
TOTAL POPULATION
196
MALE POPULATION
235
FEMALE POPULATION
83.40
MALES / 100 FEMALES
119.90
FEMALES / 100 MALES
46.8
MEDIAN AGE
4.1
AVG FAMILY SIZE
3.5
AVG HOUSEHOLD SIZE
173
LABOR FORCE [ PEOPLE ]
47.5%
PERCENT IN LABOR FORCE
8.1%
UNEMPLOYMENT RATE
Circleville Zip Codes
Circleville Area Codes
Income in Circleville
Income Overview in Circleville
Per Capita Income in Circleville is $25,154, while median incomes of families and households are $66,250 and $58,438 respectively.
| Characteristic | Number | Measure |
| Per Capita Income | 431 | $25,154 |
| Median Family Income | 98 | $66,250 |
| Mean Family Income | 98 | $82,454 |
| Median Household Income | 125 | $58,438 |
| Mean Household Income | 125 | $72,937 |
| Income Deficit | 98 | $9,629 |
| Wage / Income Gap (%) | 431 | 69.91% |
| Wage / Income Gap ($) | 431 | 30.09¢ per $1 |
| Gini / Inequality Index | 431 | 0.38 |
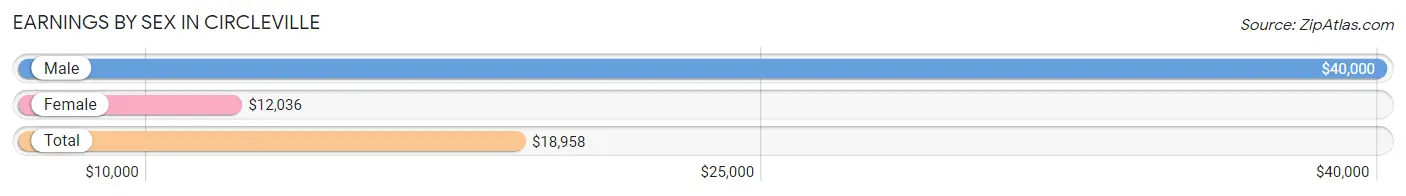
Earnings by Sex in Circleville
Average Earnings in Circleville are $18,958, $40,000 for men and $12,036 for women, a difference of 69.9%.
| Sex | Number | Average Earnings |
| Male | 82 (43.4%) | $40,000 |
| Female | 107 (56.6%) | $12,036 |
| Total | 189 (100.0%) | $18,958 |
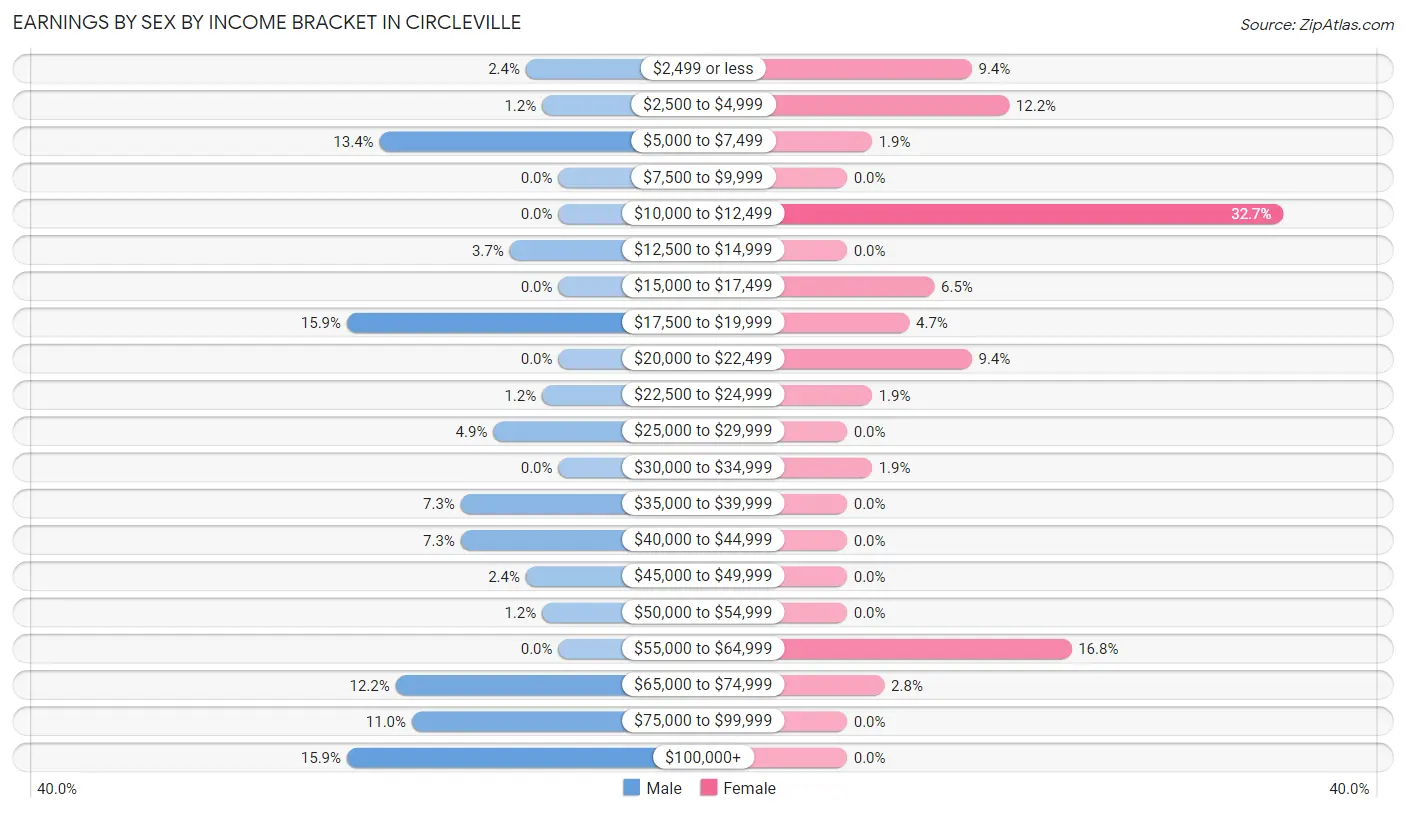
Earnings by Sex by Income Bracket in Circleville
The most common earnings brackets in Circleville are $17,500 to $19,999 for men (13 | 15.9%) and $10,000 to $12,499 for women (35 | 32.7%).
| Income | Male | Female |
| $2,499 or less | 2 (2.4%) | 10 (9.3%) |
| $2,500 to $4,999 | 1 (1.2%) | 13 (12.1%) |
| $5,000 to $7,499 | 11 (13.4%) | 2 (1.9%) |
| $7,500 to $9,999 | 0 (0.0%) | 0 (0.0%) |
| $10,000 to $12,499 | 0 (0.0%) | 35 (32.7%) |
| $12,500 to $14,999 | 3 (3.7%) | 0 (0.0%) |
| $15,000 to $17,499 | 0 (0.0%) | 7 (6.5%) |
| $17,500 to $19,999 | 13 (15.9%) | 5 (4.7%) |
| $20,000 to $22,499 | 0 (0.0%) | 10 (9.3%) |
| $22,500 to $24,999 | 1 (1.2%) | 2 (1.9%) |
| $25,000 to $29,999 | 4 (4.9%) | 0 (0.0%) |
| $30,000 to $34,999 | 0 (0.0%) | 2 (1.9%) |
| $35,000 to $39,999 | 6 (7.3%) | 0 (0.0%) |
| $40,000 to $44,999 | 6 (7.3%) | 0 (0.0%) |
| $45,000 to $49,999 | 2 (2.4%) | 0 (0.0%) |
| $50,000 to $54,999 | 1 (1.2%) | 0 (0.0%) |
| $55,000 to $64,999 | 0 (0.0%) | 18 (16.8%) |
| $65,000 to $74,999 | 10 (12.2%) | 3 (2.8%) |
| $75,000 to $99,999 | 9 (11.0%) | 0 (0.0%) |
| $100,000+ | 13 (15.9%) | 0 (0.0%) |
| Total | 82 (100.0%) | 107 (100.0%) |
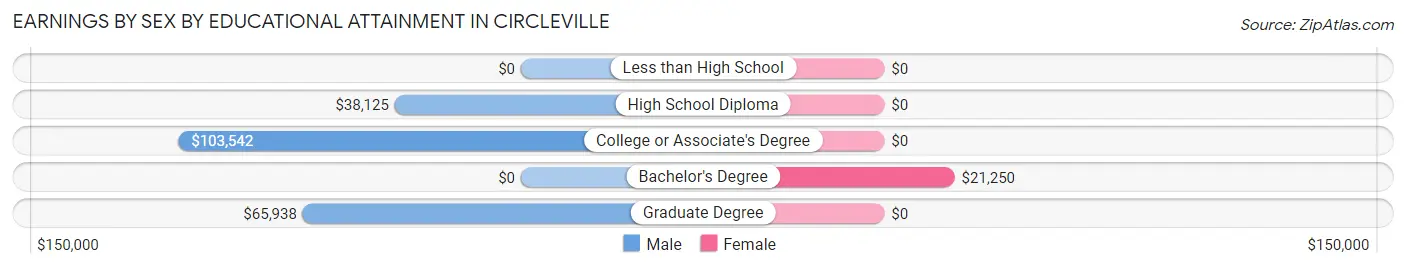
Earnings by Sex by Educational Attainment in Circleville
Average earnings in Circleville are $65,500 for men and $16,071 for women, a difference of 75.5%. Men with an educational attainment of college or associate's degree enjoy the highest average annual earnings of $103,542, while those with high school diploma education earn the least with $38,125. Women with an educational attainment of bachelor's degree earn the most with the average annual earnings of $21,250, while those with bachelor's degree education have the smallest earnings of $21,250.
| Educational Attainment | Male Income | Female Income |
| Less than High School | - | - |
| High School Diploma | $38,125 | $0 |
| College or Associate's Degree | $103,542 | $0 |
| Bachelor's Degree | - | - |
| Graduate Degree | $65,938 | $0 |
| Total | $65,500 | $16,071 |
Family Income in Circleville
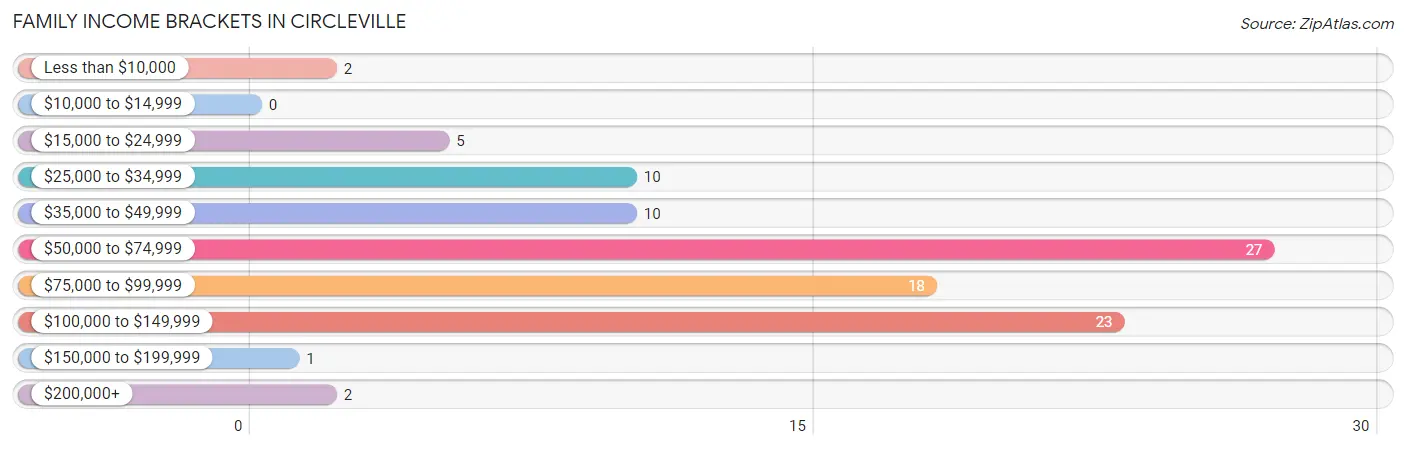
Family Income Brackets in Circleville
According to the Circleville family income data, there are 27 families falling into the $50,000 to $74,999 income range, which is the most common income bracket and makes up 27.6% of all families.
| Income Bracket | # Families | % Families |
| Less than $10,000 | 2 | 2.0% |
| $10,000 to $14,999 | 0 | 0.0% |
| $15,000 to $24,999 | 5 | 5.1% |
| $25,000 to $34,999 | 10 | 10.2% |
| $35,000 to $49,999 | 10 | 10.2% |
| $50,000 to $74,999 | 27 | 27.6% |
| $75,000 to $99,999 | 18 | 18.4% |
| $100,000 to $149,999 | 23 | 23.5% |
| $150,000 to $199,999 | 1 | 1.0% |
| $200,000+ | 2 | 2.0% |
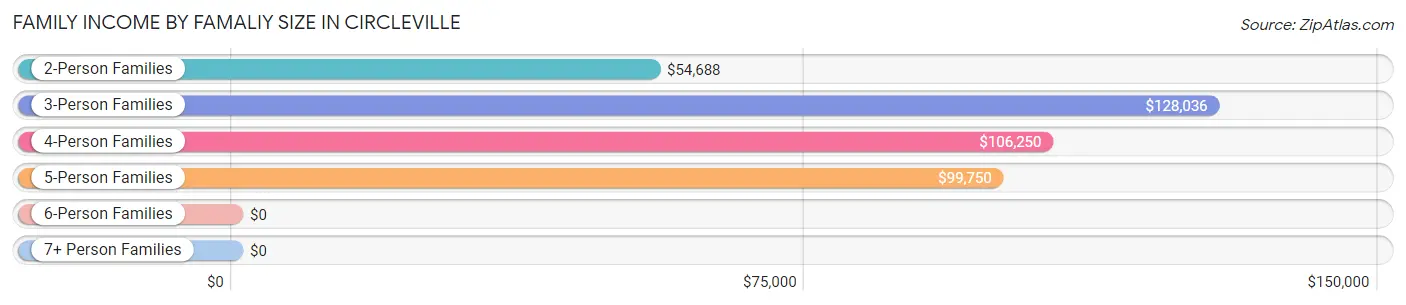
Family Income by Famaliy Size in Circleville
3-person families (11 | 11.2%) account for the highest median family income in Circleville with $128,036 per family, while 3-person families (11 | 11.2%) have the highest median income of $42,679 per family member.
| Income Bracket | # Families | Median Income |
| 2-Person Families | 52 (53.1%) | $54,688 |
| 3-Person Families | 11 (11.2%) | $128,036 |
| 4-Person Families | 17 (17.3%) | $106,250 |
| 5-Person Families | 13 (13.3%) | $99,750 |
| 6-Person Families | 0 (0.0%) | $0 |
| 7+ Person Families | 5 (5.1%) | $0 |
| Total | 98 (100.0%) | $66,250 |
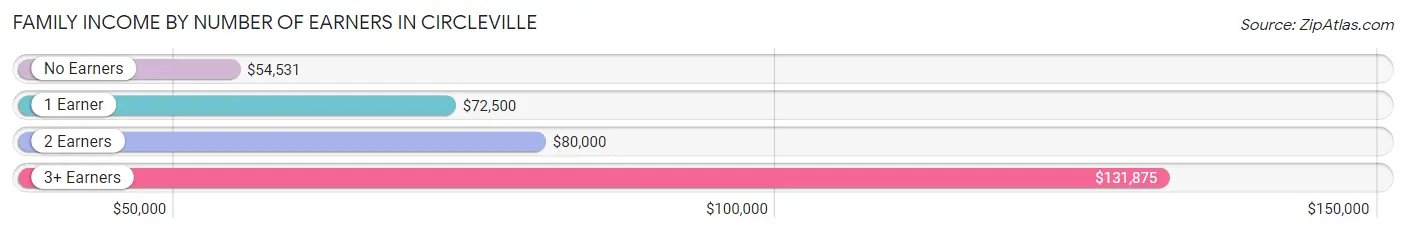
Family Income by Number of Earners in Circleville
The median family income in Circleville is $66,250, with families comprising 3+ earners (15) having the highest median family income of $131,875, while families with no earners (27) have the lowest median family income of $54,531, accounting for 15.3% and 27.6% of families, respectively.
| Number of Earners | # Families | Median Income |
| No Earners | 27 (27.6%) | $54,531 |
| 1 Earner | 32 (32.7%) | $72,500 |
| 2 Earners | 24 (24.5%) | $80,000 |
| 3+ Earners | 15 (15.3%) | $131,875 |
| Total | 98 (100.0%) | $66,250 |
Household Income in Circleville
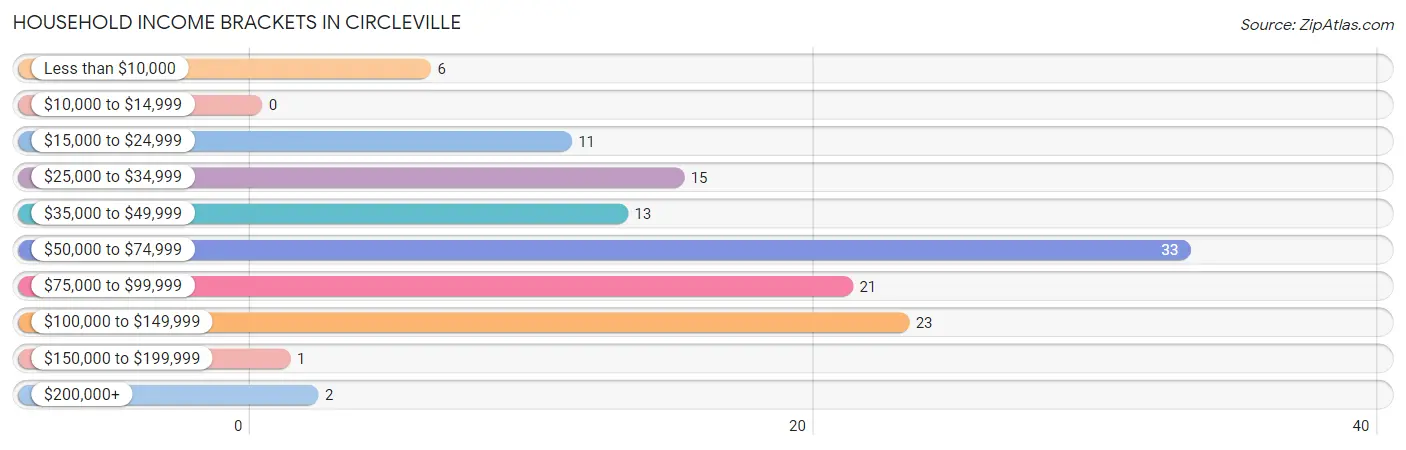
Household Income Brackets in Circleville
With 33 households falling in the category, the $50,000 to $74,999 income range is the most frequent in Circleville, accounting for 26.4% of all households.
| Income Bracket | # Households | % Households |
| Less than $10,000 | 6 | 4.8% |
| $10,000 to $14,999 | 0 | 0.0% |
| $15,000 to $24,999 | 11 | 8.8% |
| $25,000 to $34,999 | 15 | 12.0% |
| $35,000 to $49,999 | 13 | 10.4% |
| $50,000 to $74,999 | 33 | 26.4% |
| $75,000 to $99,999 | 21 | 16.8% |
| $100,000 to $149,999 | 23 | 18.4% |
| $150,000 to $199,999 | 1 | 0.8% |
| $200,000+ | 2 | 1.6% |
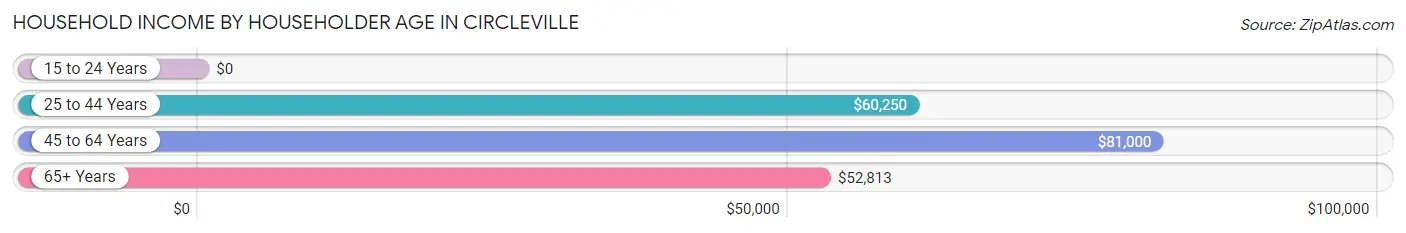
Household Income by Householder Age in Circleville
The median household income in Circleville is $58,438, with the highest median household income of $81,000 found in the 45 to 64 years age bracket for the primary householder. A total of 52 households (41.6%) fall into this category.
| Income Bracket | # Households | Median Income |
| 15 to 24 Years | 0 (0.0%) | $0 |
| 25 to 44 Years | 19 (15.2%) | $60,250 |
| 45 to 64 Years | 52 (41.6%) | $81,000 |
| 65+ Years | 54 (43.2%) | $52,813 |
| Total | 125 (100.0%) | $58,438 |
Poverty in Circleville
Income Below Poverty by Sex and Age in Circleville
With 10.7% poverty level for males and 6.4% for females among the residents of Circleville, 5 year old males and 12 to 14 year old females are the most vulnerable to poverty, with 1 males (100.0%) and 5 females (41.7%) in their respective age groups living below the poverty level.
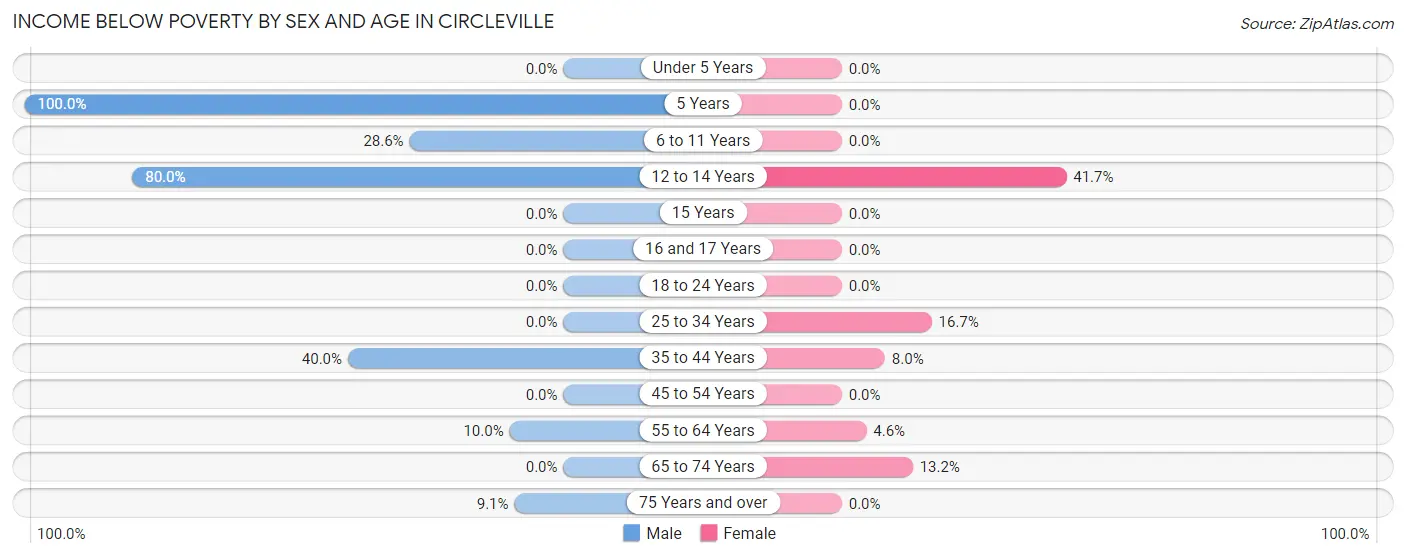
| Age Bracket | Male | Female |
| Under 5 Years | 0 (0.0%) | 0 (0.0%) |
| 5 Years | 1 (100.0%) | 0 (0.0%) |
| 6 to 11 Years | 6 (28.6%) | 0 (0.0%) |
| 12 to 14 Years | 4 (80.0%) | 5 (41.7%) |
| 15 Years | 0 (0.0%) | 0 (0.0%) |
| 16 and 17 Years | 0 (0.0%) | 0 (0.0%) |
| 18 to 24 Years | 0 (0.0%) | 0 (0.0%) |
| 25 to 34 Years | 0 (0.0%) | 1 (16.7%) |
| 35 to 44 Years | 6 (40.0%) | 2 (8.0%) |
| 45 to 54 Years | 0 (0.0%) | 0 (0.0%) |
| 55 to 64 Years | 2 (10.0%) | 2 (4.5%) |
| 65 to 74 Years | 0 (0.0%) | 5 (13.2%) |
| 75 Years and over | 2 (9.1%) | 0 (0.0%) |
| Total | 21 (10.7%) | 15 (6.4%) |
Income Above Poverty by Sex and Age in Circleville
According to the poverty statistics in Circleville, males aged under 5 years and females aged under 5 years are the age groups that are most secure financially, with 100.0% of males and 100.0% of females in these age groups living above the poverty line.
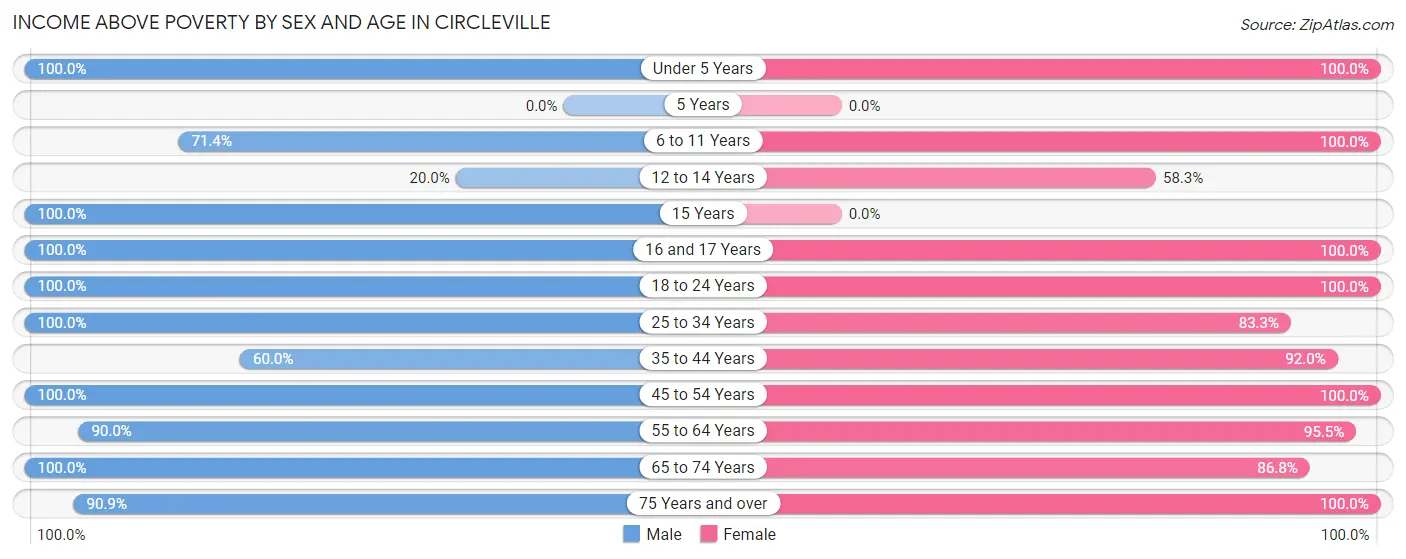
| Age Bracket | Male | Female |
| Under 5 Years | 2 (100.0%) | 4 (100.0%) |
| 5 Years | 0 (0.0%) | 0 (0.0%) |
| 6 to 11 Years | 15 (71.4%) | 11 (100.0%) |
| 12 to 14 Years | 1 (20.0%) | 7 (58.3%) |
| 15 Years | 11 (100.0%) | 0 (0.0%) |
| 16 and 17 Years | 10 (100.0%) | 9 (100.0%) |
| 18 to 24 Years | 19 (100.0%) | 50 (100.0%) |
| 25 to 34 Years | 4 (100.0%) | 5 (83.3%) |
| 35 to 44 Years | 9 (60.0%) | 23 (92.0%) |
| 45 to 54 Years | 34 (100.0%) | 24 (100.0%) |
| 55 to 64 Years | 18 (90.0%) | 42 (95.5%) |
| 65 to 74 Years | 32 (100.0%) | 33 (86.8%) |
| 75 Years and over | 20 (90.9%) | 12 (100.0%) |
| Total | 175 (89.3%) | 220 (93.6%) |
Income Below Poverty Among Married-Couple Families in Circleville
The poverty statistics for married-couple families in Circleville show that 8.0% or 7 of the total 88 families live below the poverty line. Families with 3 or 4 children have the highest poverty rate of 28.6%, comprising of 2 families. On the other hand, families with 5 or more children have the lowest poverty rate of 0.0%, which includes 0 families.
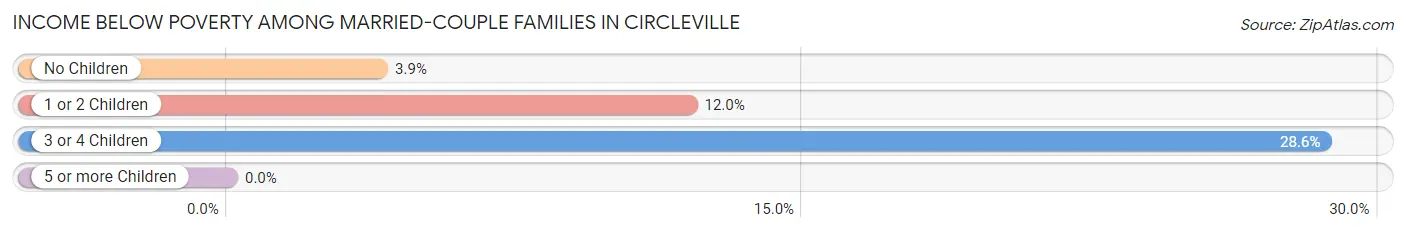
| Children | Above Poverty | Below Poverty |
| No Children | 49 (96.1%) | 2 (3.9%) |
| 1 or 2 Children | 22 (88.0%) | 3 (12.0%) |
| 3 or 4 Children | 5 (71.4%) | 2 (28.6%) |
| 5 or more Children | 5 (100.0%) | 0 (0.0%) |
| Total | 81 (92.0%) | 7 (8.0%) |
Income Below Poverty Among Single-Parent Households in Circleville
| Children | Single Father | Single Mother |
| No Children | 0 (0.0%) | 0 (0.0%) |
| 1 or 2 Children | 0 (0.0%) | 0 (0.0%) |
| 3 or 4 Children | 0 (0.0%) | 0 (0.0%) |
| 5 or more Children | 0 (0.0%) | 0 (0.0%) |
| Total | 0 (0.0%) | 0 (0.0%) |
Income Below Poverty Among Married-Couple vs Single-Parent Households in Circleville
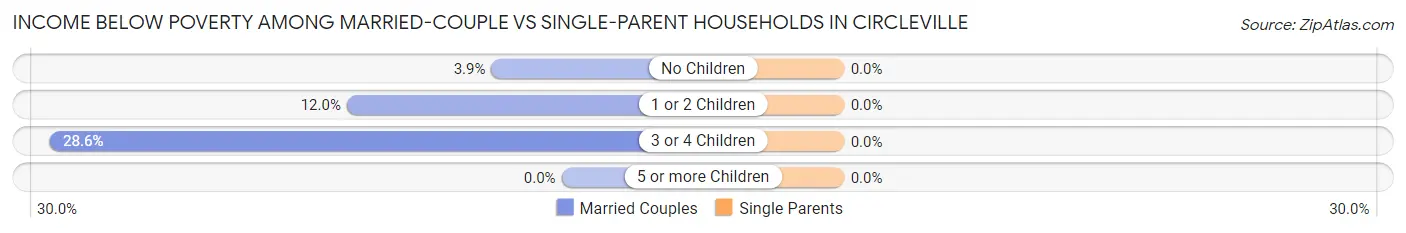
| Children | Married-Couple Families | Single-Parent Households |
| No Children | 2 (3.9%) | 0 (0.0%) |
| 1 or 2 Children | 3 (12.0%) | 0 (0.0%) |
| 3 or 4 Children | 2 (28.6%) | 0 (0.0%) |
| 5 or more Children | 0 (0.0%) | 0 (0.0%) |
| Total | 7 (8.0%) | 0 (0.0%) |
Race in Circleville
The most populous races in Circleville are White / Caucasian (377 | 87.5%), Hispanic or Latino (49 | 11.4%), and Some other Race (29 | 6.7%).
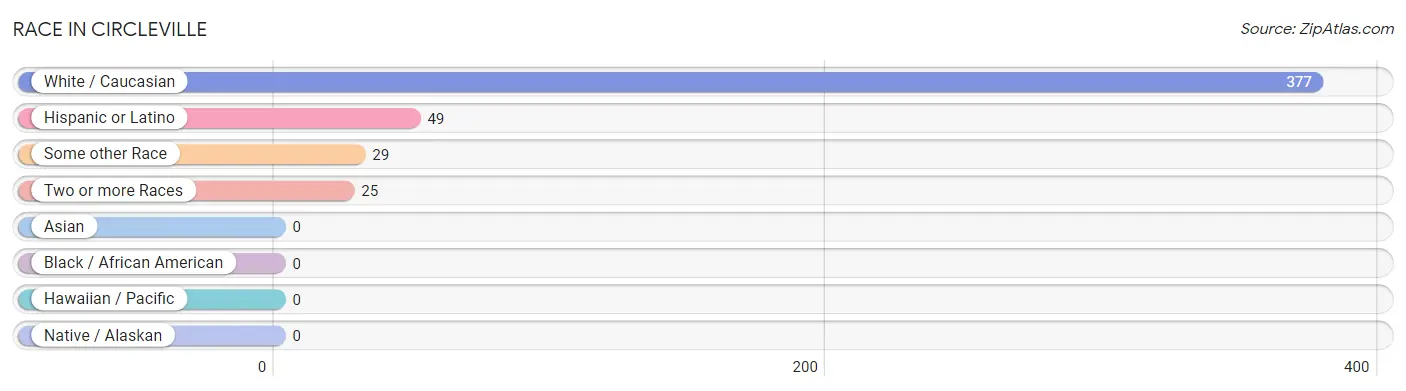
| Race | # Population | % Population |
| Asian | 0 | 0.0% |
| Black / African American | 0 | 0.0% |
| Hawaiian / Pacific | 0 | 0.0% |
| Hispanic or Latino | 49 | 11.4% |
| Native / Alaskan | 0 | 0.0% |
| White / Caucasian | 377 | 87.5% |
| Two or more Races | 25 | 5.8% |
| Some other Race | 29 | 6.7% |
| Total | 431 | 100.0% |
Ancestry in Circleville
The most populous ancestries reported in Circleville are American (94 | 21.8%), English (90 | 20.9%), Norwegian (30 | 7.0%), Mexican (28 | 6.5%), and Scotch-Irish (28 | 6.5%), together accounting for 62.7% of all Circleville residents.
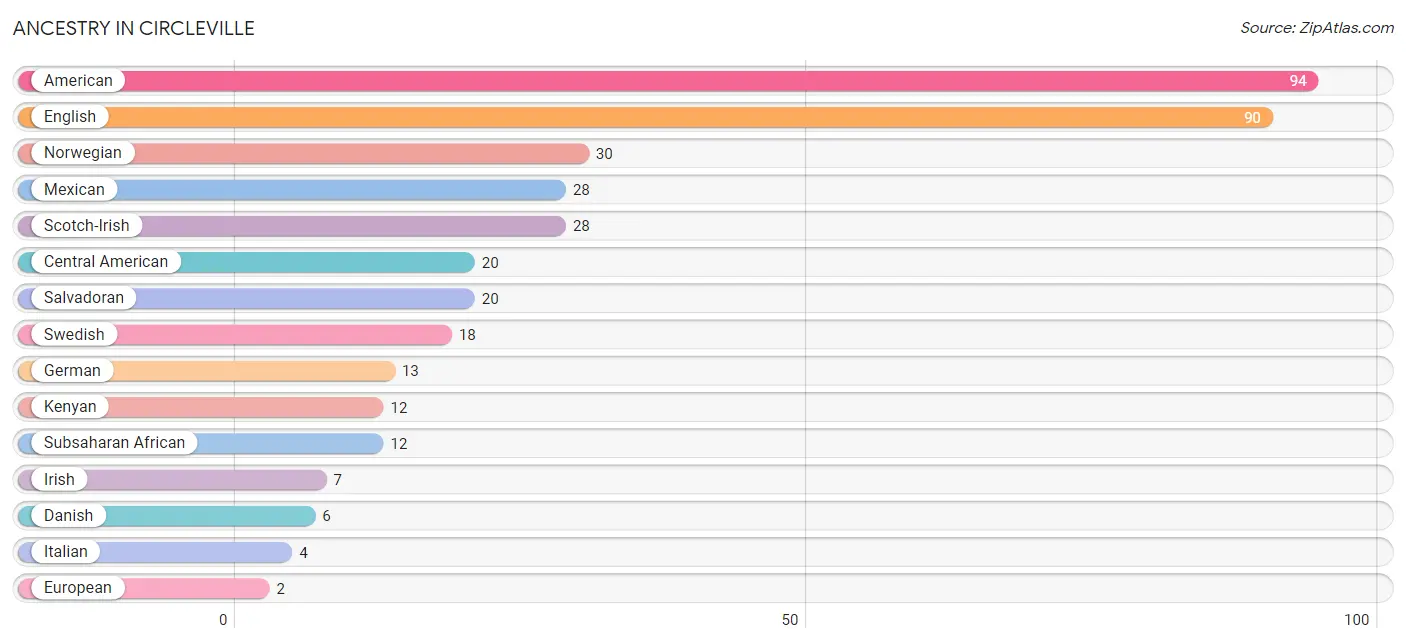
| Ancestry | # Population | % Population |
| American | 94 | 21.8% |
| Central American | 20 | 4.6% |
| Danish | 6 | 1.4% |
| English | 90 | 20.9% |
| European | 2 | 0.5% |
| German | 13 | 3.0% |
| Irish | 7 | 1.6% |
| Italian | 4 | 0.9% |
| Kenyan | 12 | 2.8% |
| Mexican | 28 | 6.5% |
| Norwegian | 30 | 7.0% |
| Portuguese | 1 | 0.2% |
| Puerto Rican | 1 | 0.2% |
| Salvadoran | 20 | 4.6% |
| Scotch-Irish | 28 | 6.5% |
| Scottish | 2 | 0.5% |
| Subsaharan African | 12 | 2.8% |
| Swedish | 18 | 4.2% |
| Swiss | 2 | 0.5% |
| Welsh | 1 | 0.2% | View All 20 Rows |
Immigrants in Circleville
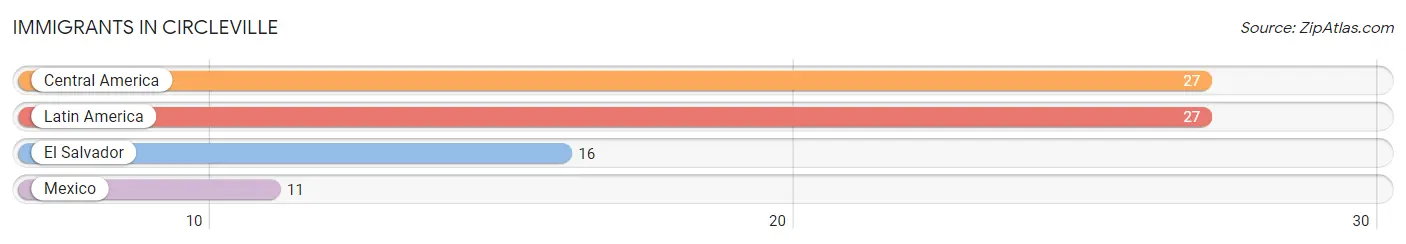
The most numerous immigrant groups reported in Circleville came from Central America (27 | 6.3%), Latin America (27 | 6.3%), El Salvador (16 | 3.7%), and Mexico (11 | 2.5%), together accounting for 18.8% of all Circleville residents.
| Immigration Origin | # Population | % Population |
| Central America | 27 | 6.3% |
| El Salvador | 16 | 3.7% |
| Latin America | 27 | 6.3% |
| Mexico | 11 | 2.5% | View All 4 Rows |
Sex and Age in Circleville
Sex and Age in Circleville
The most populous age groups in Circleville are 15 to 19 Years (24 | 12.2%) for men and 20 to 24 Years (50 | 21.3%) for women.
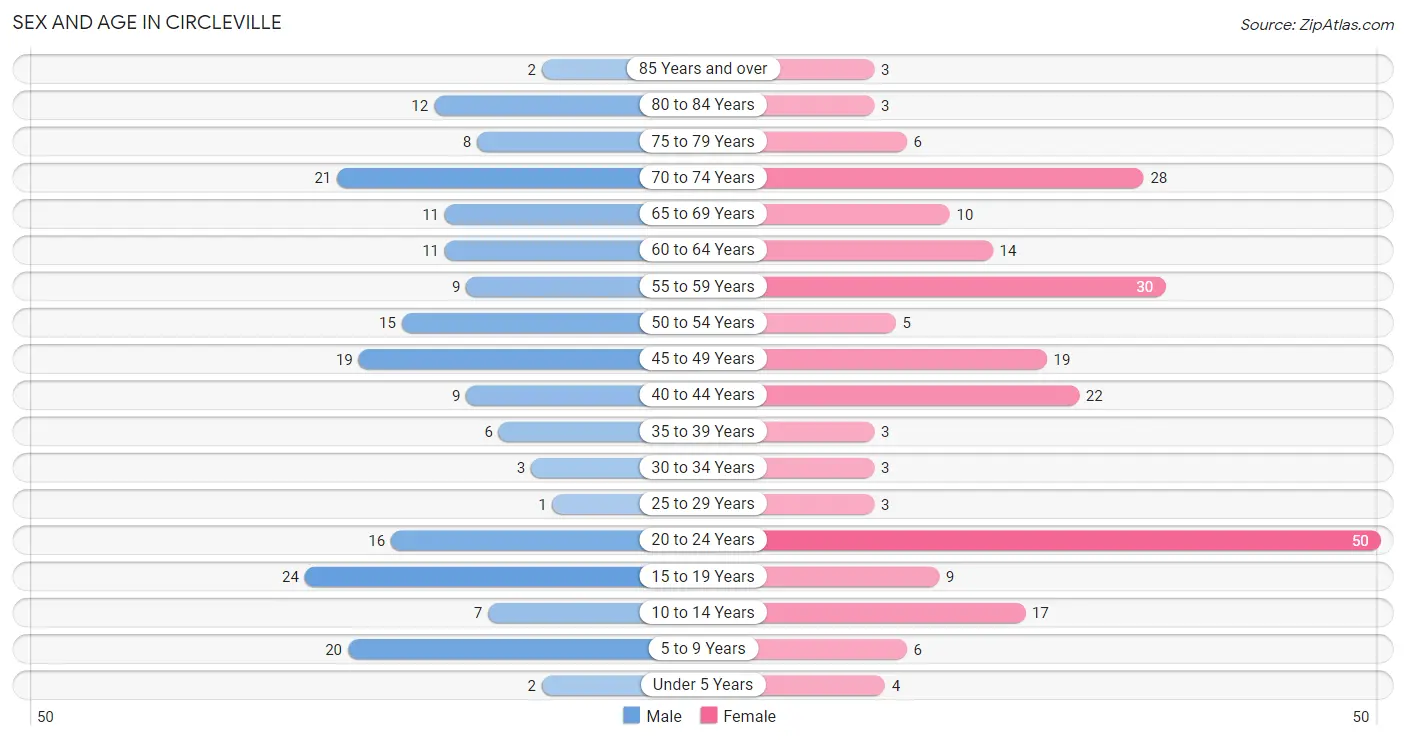
| Age Bracket | Male | Female |
| Under 5 Years | 2 (1.0%) | 4 (1.7%) |
| 5 to 9 Years | 20 (10.2%) | 6 (2.5%) |
| 10 to 14 Years | 7 (3.6%) | 17 (7.2%) |
| 15 to 19 Years | 24 (12.2%) | 9 (3.8%) |
| 20 to 24 Years | 16 (8.2%) | 50 (21.3%) |
| 25 to 29 Years | 1 (0.5%) | 3 (1.3%) |
| 30 to 34 Years | 3 (1.5%) | 3 (1.3%) |
| 35 to 39 Years | 6 (3.1%) | 3 (1.3%) |
| 40 to 44 Years | 9 (4.6%) | 22 (9.4%) |
| 45 to 49 Years | 19 (9.7%) | 19 (8.1%) |
| 50 to 54 Years | 15 (7.6%) | 5 (2.1%) |
| 55 to 59 Years | 9 (4.6%) | 30 (12.8%) |
| 60 to 64 Years | 11 (5.6%) | 14 (6.0%) |
| 65 to 69 Years | 11 (5.6%) | 10 (4.3%) |
| 70 to 74 Years | 21 (10.7%) | 28 (11.9%) |
| 75 to 79 Years | 8 (4.1%) | 6 (2.5%) |
| 80 to 84 Years | 12 (6.1%) | 3 (1.3%) |
| 85 Years and over | 2 (1.0%) | 3 (1.3%) |
| Total | 196 (100.0%) | 235 (100.0%) |
Families and Households in Circleville
Median Family Size in Circleville
The median family size in Circleville is 4.08 persons per family, with single female/mother families (6 | 6.1%) accounting for the largest median family size of 5 persons per family. On the other hand, single male/father families (4 | 4.1%) represent the smallest median family size with 4.00 persons per family.
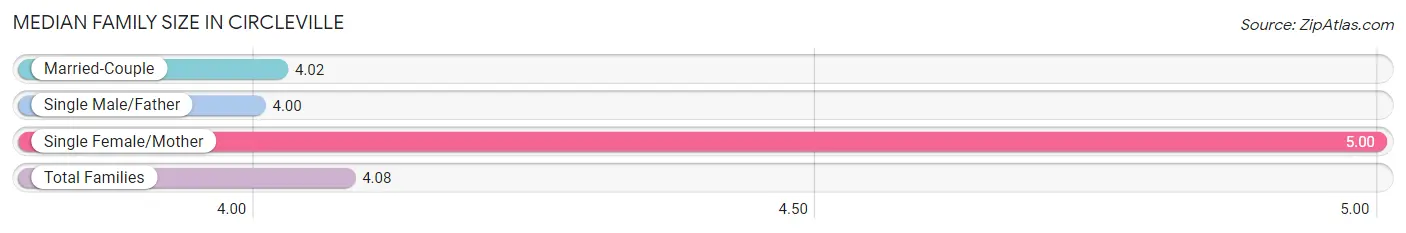
| Family Type | # Families | Family Size |
| Married-Couple | 88 (89.8%) | 4.02 |
| Single Male/Father | 4 (4.1%) | 4.00 |
| Single Female/Mother | 6 (6.1%) | 5.00 |
| Total Families | 98 (100.0%) | 4.08 |
Median Household Size in Circleville
The median household size in Circleville is 3.45 persons per household, with single female/mother households (6 | 4.8%) accounting for the largest median household size of 5 persons per household. non-family households (27 | 21.6%) represent the smallest median household size with 1.15 persons per household.
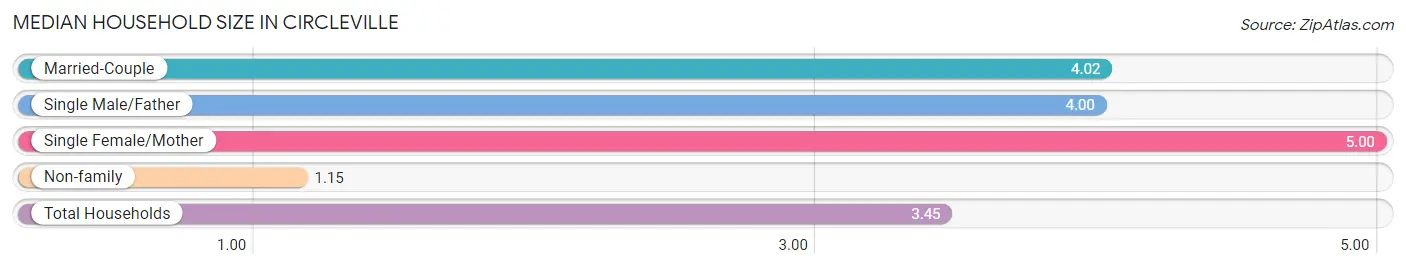
| Household Type | # Households | Household Size |
| Married-Couple | 88 (70.4%) | 4.02 |
| Single Male/Father | 4 (3.2%) | 4.00 |
| Single Female/Mother | 6 (4.8%) | 5.00 |
| Non-family | 27 (21.6%) | 1.15 |
| Total Households | 125 (100.0%) | 3.45 |
Household Size by Marriage Status in Circleville
Out of a total of 125 households in Circleville, 98 (78.4%) are family households, while 27 (21.6%) are nonfamily households. The most numerous type of family households are 2-person households, comprising 52, and the most common type of nonfamily households are 1-person households, comprising 25.
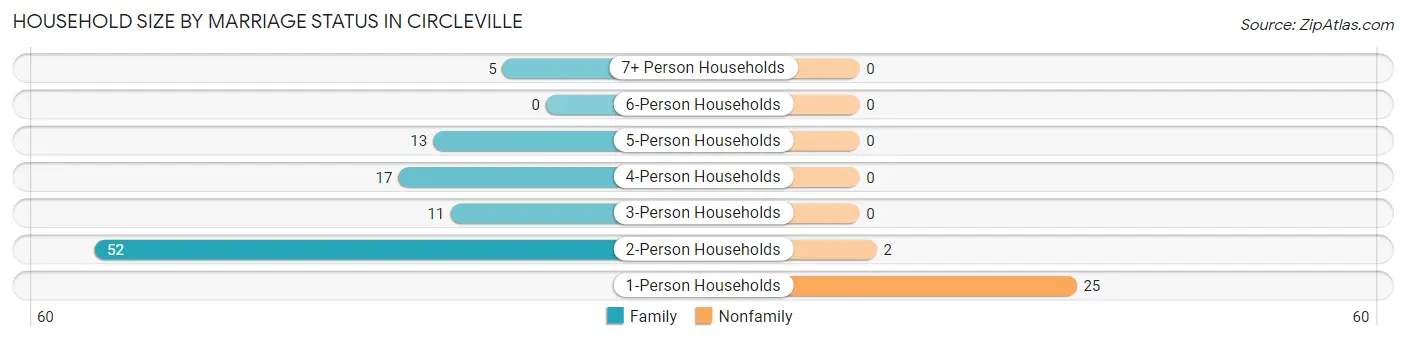
| Household Size | Family Households | Nonfamily Households |
| 1-Person Households | - | 25 (20.0%) |
| 2-Person Households | 52 (41.6%) | 2 (1.6%) |
| 3-Person Households | 11 (8.8%) | 0 (0.0%) |
| 4-Person Households | 17 (13.6%) | 0 (0.0%) |
| 5-Person Households | 13 (10.4%) | 0 (0.0%) |
| 6-Person Households | 0 (0.0%) | 0 (0.0%) |
| 7+ Person Households | 5 (4.0%) | 0 (0.0%) |
| Total | 98 (78.4%) | 27 (21.6%) |
Female Fertility in Circleville
Fertility by Age in Circleville
Average fertility rate in Circleville is 105.0 births per 1,000 women. Women in the age bracket of 20 to 34 years have the highest fertility rate with 214.0 births per 1,000 women. Women in the age bracket of 20 to 34 years acount for 100.0% of all women with births.
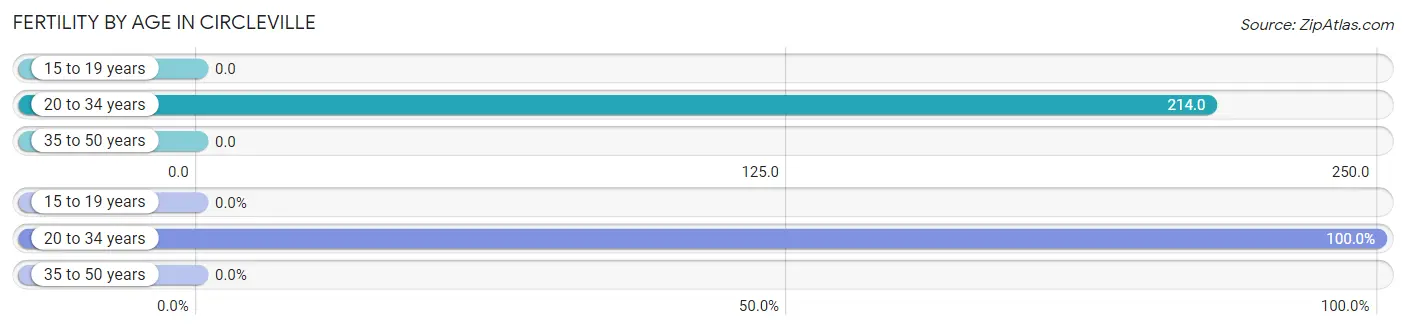
| Age Bracket | Women with Births | Births / 1,000 Women |
| 15 to 19 years | 0 (0.0%) | 0.0 |
| 20 to 34 years | 12 (100.0%) | 214.0 |
| 35 to 50 years | 0 (0.0%) | 0.0 |
| Total | 12 (100.0%) | 105.0 |
Fertility by Age by Marriage Status in Circleville
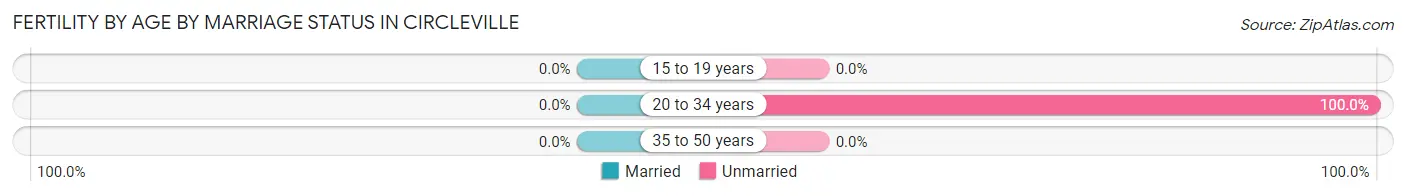
| Age Bracket | Married | Unmarried |
| 15 to 19 years | 0 (0.0%) | 0 (0.0%) |
| 20 to 34 years | 0 (0.0%) | 12 (100.0%) |
| 35 to 50 years | 0 (0.0%) | 0 (0.0%) |
| Total | 0 (0.0%) | 12 (100.0%) |
Fertility by Education in Circleville
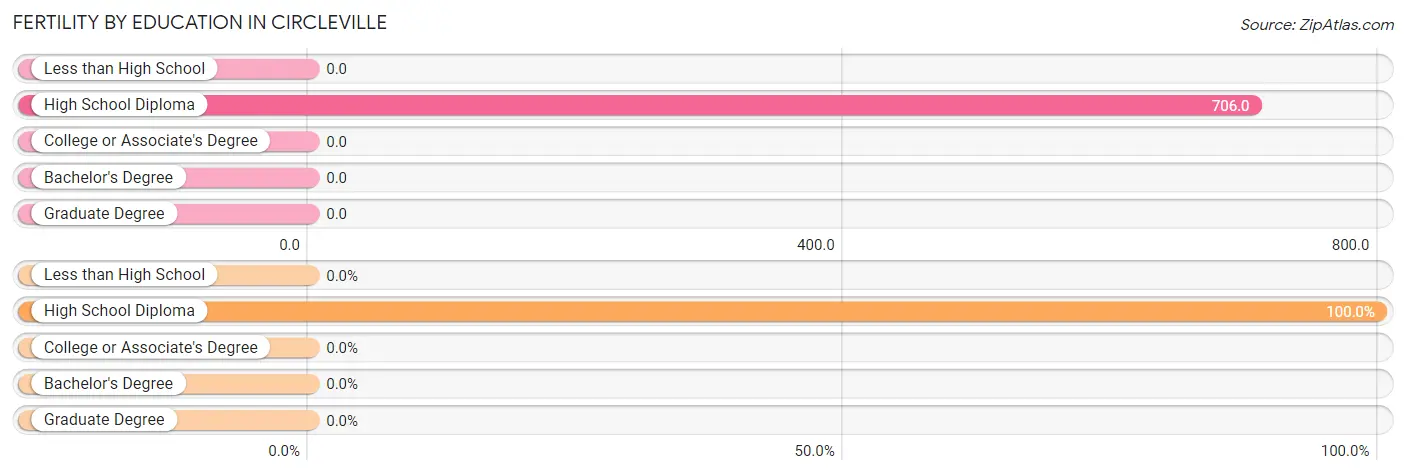
| Educational Attainment | Women with Births | Births / 1,000 Women |
| Less than High School | 0 (0.0%) | 0.0 |
| High School Diploma | 12 (100.0%) | 706.0 |
| College or Associate's Degree | 0 (0.0%) | 0.0 |
| Bachelor's Degree | 0 (0.0%) | 0.0 |
| Graduate Degree | 0 (0.0%) | 0.0 |
| Total | 12 (100.0%) | 105.0 |
Fertility by Education by Marriage Status in Circleville
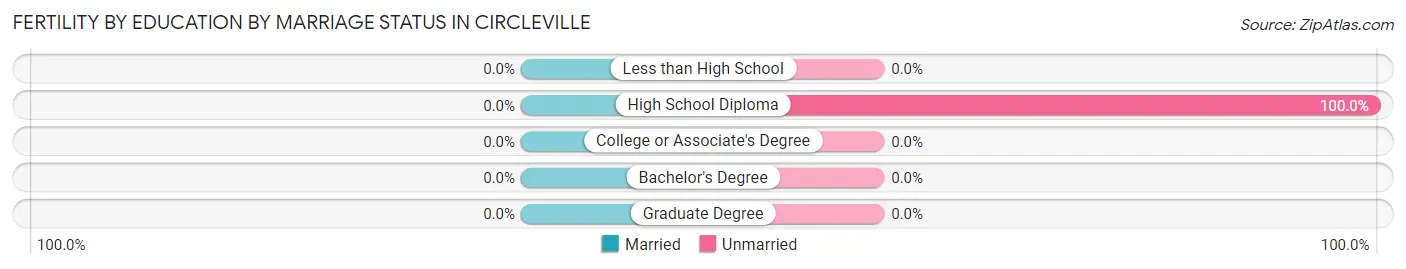
| Educational Attainment | Married | Unmarried |
| Less than High School | 0 (0.0%) | 0 (0.0%) |
| High School Diploma | 0 (0.0%) | 12 (100.0%) |
| College or Associate's Degree | 0 (0.0%) | 0 (0.0%) |
| Bachelor's Degree | 0 (0.0%) | 0 (0.0%) |
| Graduate Degree | 0 (0.0%) | 0 (0.0%) |
| Total | 0 (0.0%) | 12 (100.0%) |
Employment Characteristics in Circleville
Employment by Class of Employer in Circleville
Among the 156 employed individuals in Circleville, private company employees (44 | 28.2%), state government employees (38 | 24.4%), and local government employees (27 | 17.3%) make up the most common classes of employment.
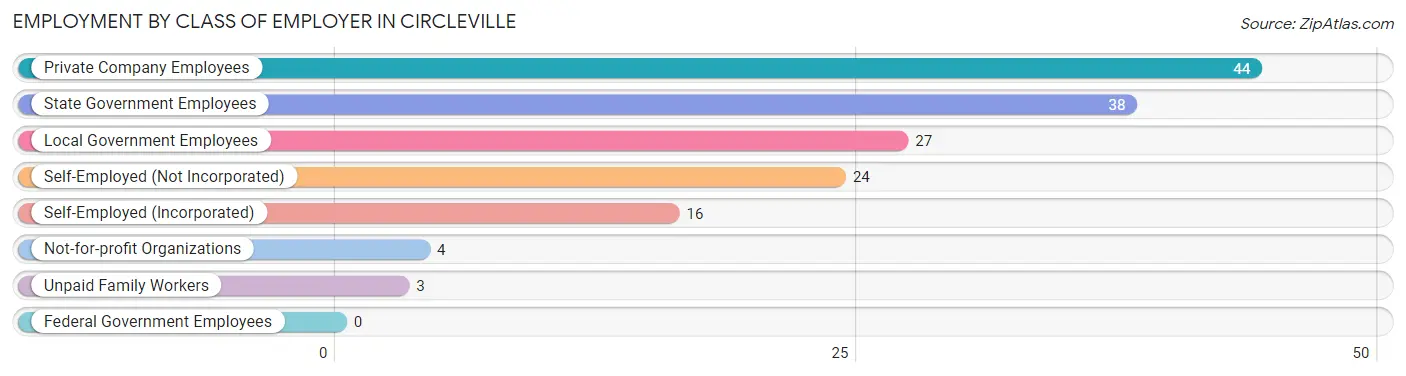
| Employer Class | # Employees | % Employees |
| Private Company Employees | 44 | 28.2% |
| Self-Employed (Incorporated) | 16 | 10.3% |
| Self-Employed (Not Incorporated) | 24 | 15.4% |
| Not-for-profit Organizations | 4 | 2.6% |
| Local Government Employees | 27 | 17.3% |
| State Government Employees | 38 | 24.4% |
| Federal Government Employees | 0 | 0.0% |
| Unpaid Family Workers | 3 | 1.9% |
| Total | 156 | 100.0% |
Employment Status by Age in Circleville
According to the labor force statistics for Circleville, out of the total population over 16 years of age (364), 47.5% or 173 individuals are in the labor force, with 8.1% or 14 of them unemployed. The age group with the highest labor force participation rate is 30 to 34 years, with 100.0% or 6 individuals in the labor force. Within the labor force, the 20 to 24 years age range has the highest percentage of unemployed individuals, with 42.9% or 12 of them being unemployed.
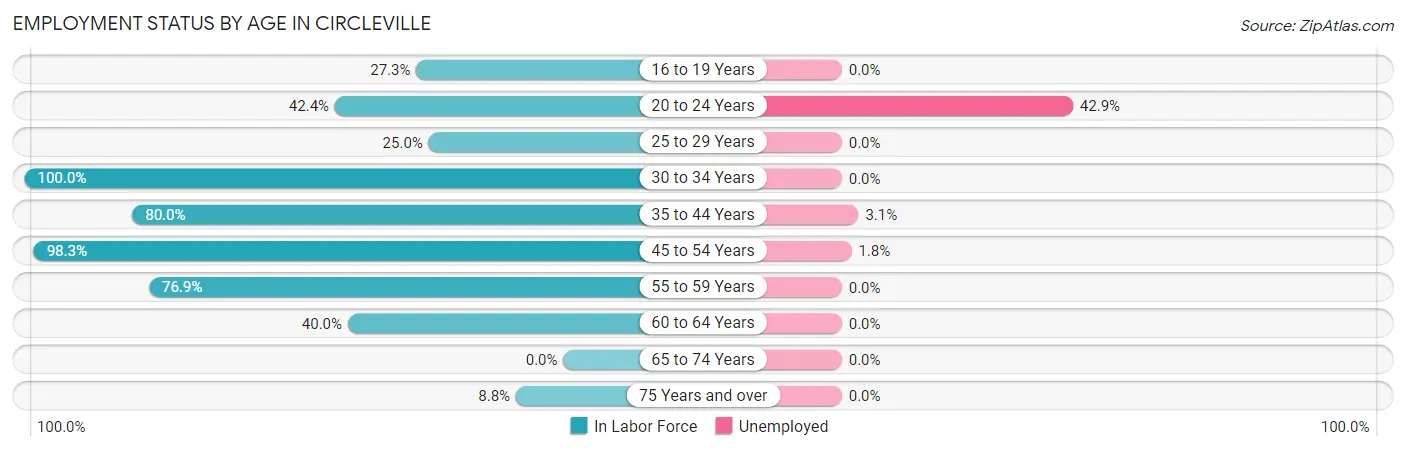
| Age Bracket | In Labor Force | Unemployed |
| 16 to 19 Years | 6 (27.3%) | 0 (0.0%) |
| 20 to 24 Years | 28 (42.4%) | 12 (42.9%) |
| 25 to 29 Years | 1 (25.0%) | 0 (0.0%) |
| 30 to 34 Years | 6 (100.0%) | 0 (0.0%) |
| 35 to 44 Years | 32 (80.0%) | 1 (3.1%) |
| 45 to 54 Years | 57 (98.3%) | 1 (1.8%) |
| 55 to 59 Years | 30 (76.9%) | 0 (0.0%) |
| 60 to 64 Years | 10 (40.0%) | 0 (0.0%) |
| 65 to 74 Years | 0 (0.0%) | 0 (0.0%) |
| 75 Years and over | 3 (8.8%) | 0 (0.0%) |
| Total | 173 (47.5%) | 14 (8.1%) |
Employment Status by Educational Attainment in Circleville
According to labor force statistics for Circleville, 79.1% of individuals (136) out of the total population between 25 and 64 years of age (172) are in the labor force, with 1.5% or 2 of them being unemployed. The group with the highest labor force participation rate are those with the educational attainment of college / associate degree, with 93.2% or 68 individuals in the labor force. Within the labor force, individuals with college / associate degree education have the highest percentage of unemployment, with 2.9% or 2 of them being unemployed.
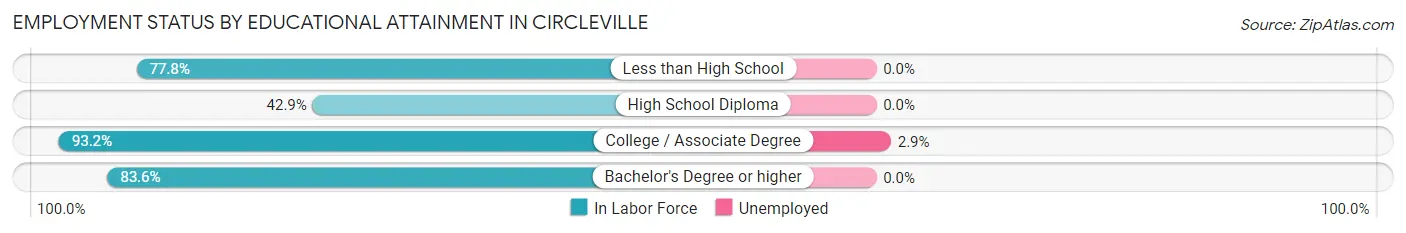
| Educational Attainment | In Labor Force | Unemployed |
| Less than High School | 7 (77.8%) | 0 (0.0%) |
| High School Diploma | 15 (42.9%) | 0 (0.0%) |
| College / Associate Degree | 68 (93.2%) | 2 (2.9%) |
| Bachelor's Degree or higher | 46 (83.6%) | 0 (0.0%) |
| Total | 136 (79.1%) | 3 (1.5%) |
Employment Occupations by Sex in Circleville
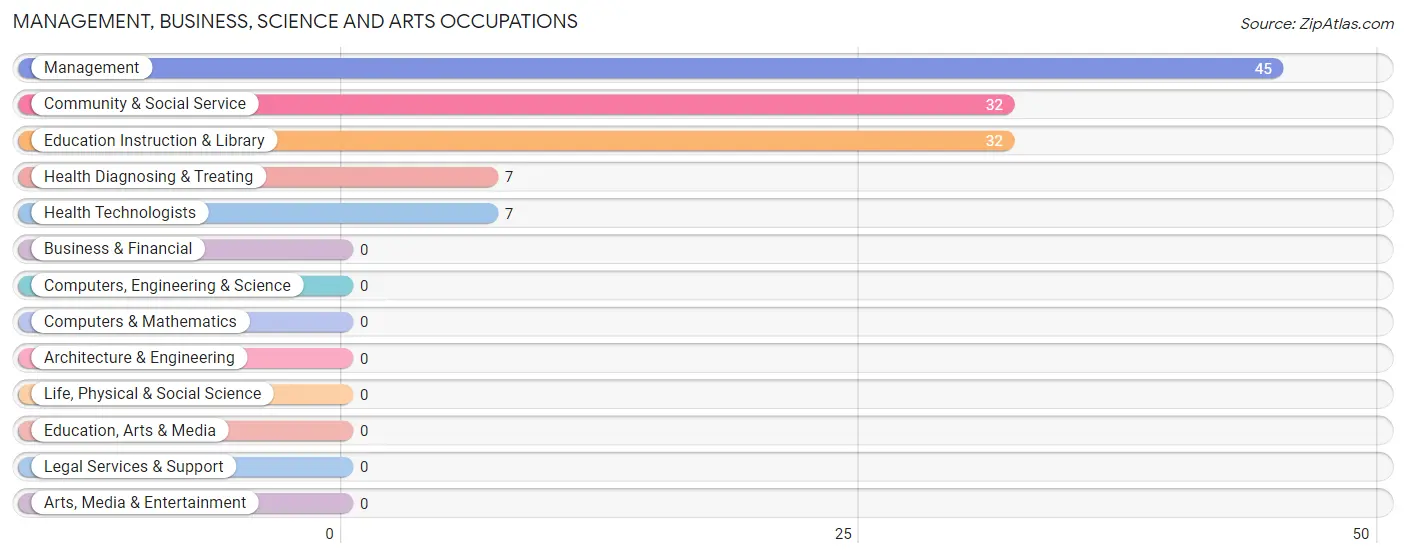
Management, Business, Science and Arts Occupations
The most common Management, Business, Science and Arts occupations in Circleville are Management (45 | 28.3%), Community & Social Service (32 | 20.1%), Education Instruction & Library (32 | 20.1%), Health Diagnosing & Treating (7 | 4.4%), and Health Technologists (7 | 4.4%).
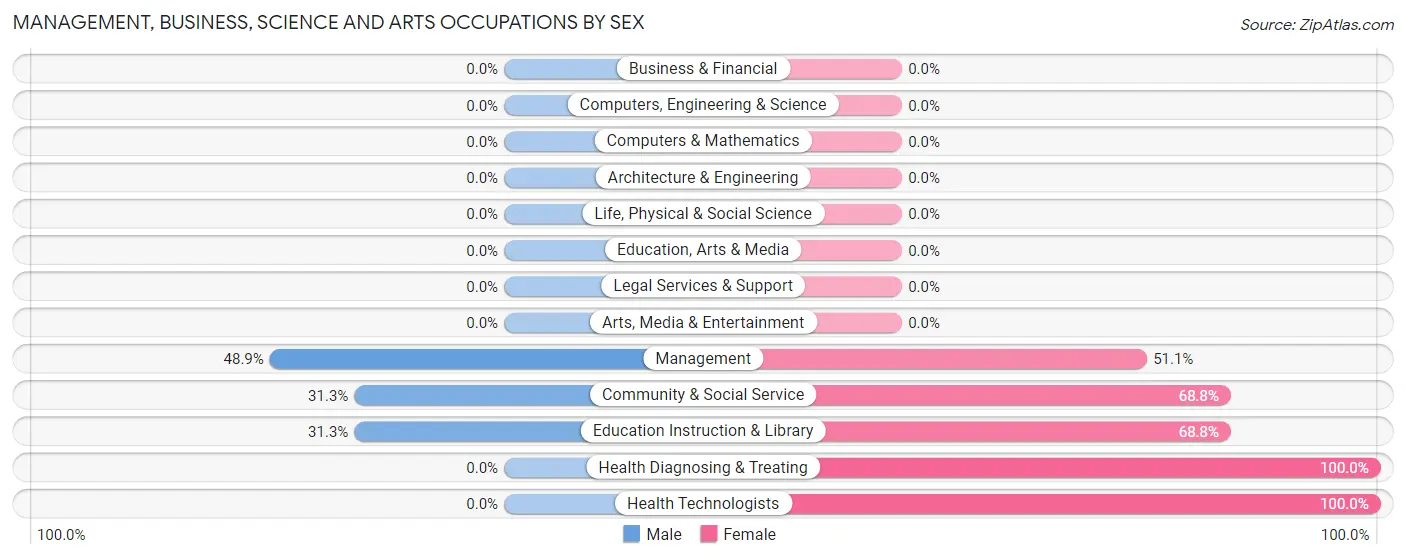
Management, Business, Science and Arts Occupations by Sex
Within the Management, Business, Science and Arts occupations in Circleville, the most male-oriented occupations are Management (48.9%), Community & Social Service (31.2%), and Education Instruction & Library (31.2%), while the most female-oriented occupations are Health Diagnosing & Treating (100.0%), Health Technologists (100.0%), and Community & Social Service (68.8%).
| Occupation | Male | Female |
| Management | 22 (48.9%) | 23 (51.1%) |
| Business & Financial | 0 (0.0%) | 0 (0.0%) |
| Computers, Engineering & Science | 0 (0.0%) | 0 (0.0%) |
| Computers & Mathematics | 0 (0.0%) | 0 (0.0%) |
| Architecture & Engineering | 0 (0.0%) | 0 (0.0%) |
| Life, Physical & Social Science | 0 (0.0%) | 0 (0.0%) |
| Community & Social Service | 10 (31.2%) | 22 (68.8%) |
| Education, Arts & Media | 0 (0.0%) | 0 (0.0%) |
| Legal Services & Support | 0 (0.0%) | 0 (0.0%) |
| Education Instruction & Library | 10 (31.2%) | 22 (68.8%) |
| Arts, Media & Entertainment | 0 (0.0%) | 0 (0.0%) |
| Health Diagnosing & Treating | 0 (0.0%) | 7 (100.0%) |
| Health Technologists | 0 (0.0%) | 7 (100.0%) |
| Total (Category) | 32 (38.1%) | 52 (61.9%) |
| Total (Overall) | 73 (45.9%) | 86 (54.1%) |
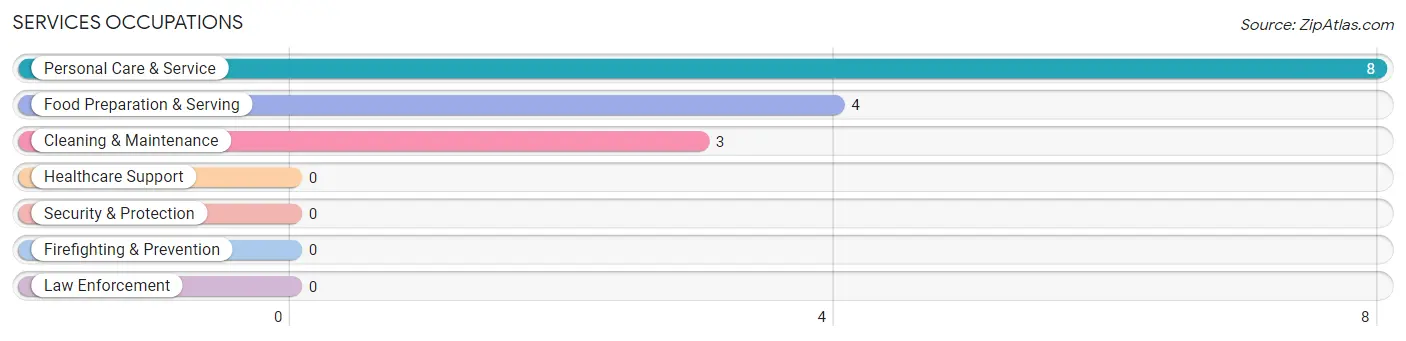
Services Occupations
The most common Services occupations in Circleville are Personal Care & Service (8 | 5.0%), Food Preparation & Serving (4 | 2.5%), and Cleaning & Maintenance (3 | 1.9%).
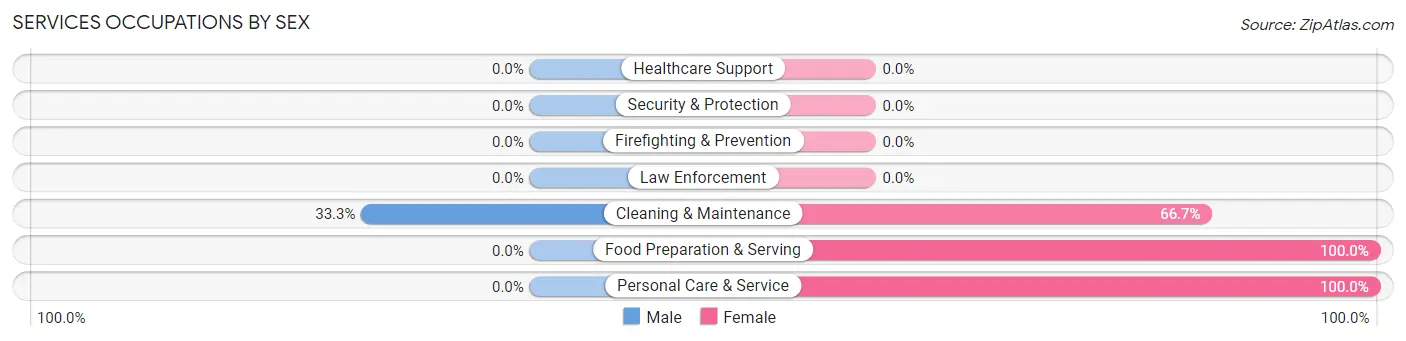
Services Occupations by Sex
| Occupation | Male | Female |
| Healthcare Support | 0 (0.0%) | 0 (0.0%) |
| Security & Protection | 0 (0.0%) | 0 (0.0%) |
| Firefighting & Prevention | 0 (0.0%) | 0 (0.0%) |
| Law Enforcement | 0 (0.0%) | 0 (0.0%) |
| Food Preparation & Serving | 0 (0.0%) | 4 (100.0%) |
| Cleaning & Maintenance | 1 (33.3%) | 2 (66.7%) |
| Personal Care & Service | 0 (0.0%) | 8 (100.0%) |
| Total (Category) | 1 (6.7%) | 14 (93.3%) |
| Total (Overall) | 73 (45.9%) | 86 (54.1%) |
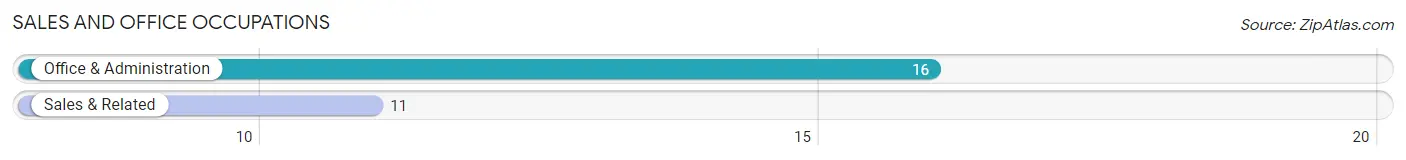
Sales and Office Occupations
The most common Sales and Office occupations in Circleville are Office & Administration (16 | 10.1%), and Sales & Related (11 | 6.9%).
Sales and Office Occupations by Sex
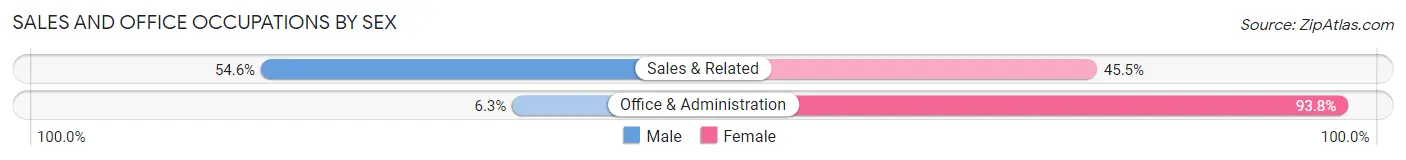
| Occupation | Male | Female |
| Sales & Related | 6 (54.5%) | 5 (45.5%) |
| Office & Administration | 1 (6.2%) | 15 (93.8%) |
| Total (Category) | 7 (25.9%) | 20 (74.1%) |
| Total (Overall) | 73 (45.9%) | 86 (54.1%) |
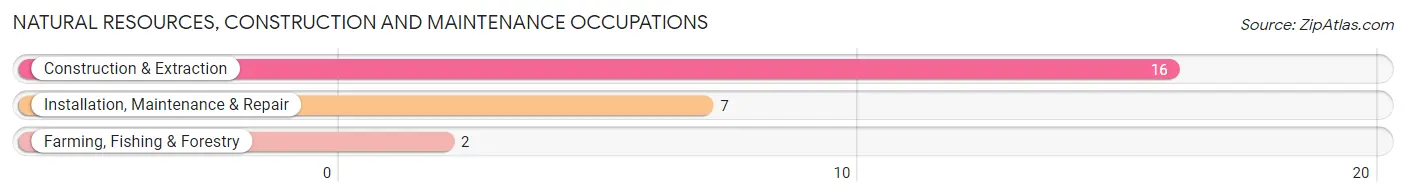
Natural Resources, Construction and Maintenance Occupations
The most common Natural Resources, Construction and Maintenance occupations in Circleville are Construction & Extraction (16 | 10.1%), Installation, Maintenance & Repair (7 | 4.4%), and Farming, Fishing & Forestry (2 | 1.3%).
Natural Resources, Construction and Maintenance Occupations by Sex
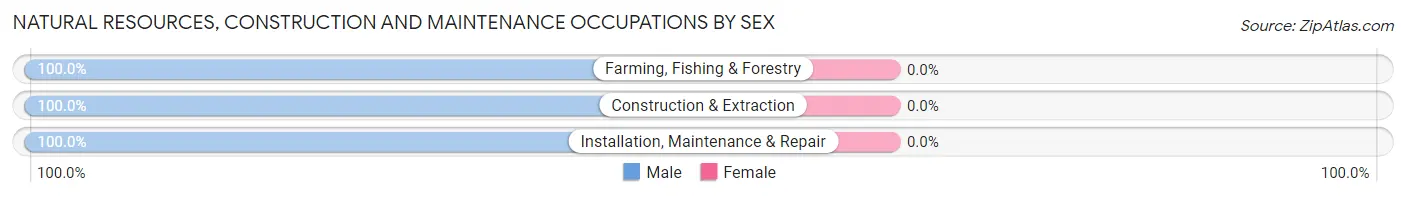
| Occupation | Male | Female |
| Farming, Fishing & Forestry | 2 (100.0%) | 0 (0.0%) |
| Construction & Extraction | 16 (100.0%) | 0 (0.0%) |
| Installation, Maintenance & Repair | 7 (100.0%) | 0 (0.0%) |
| Total (Category) | 25 (100.0%) | 0 (0.0%) |
| Total (Overall) | 73 (45.9%) | 86 (54.1%) |
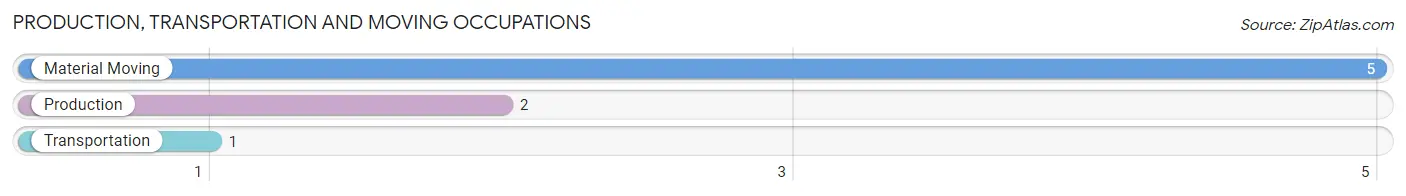
Production, Transportation and Moving Occupations
The most common Production, Transportation and Moving occupations in Circleville are Material Moving (5 | 3.1%), Production (2 | 1.3%), and Transportation (1 | 0.6%).
Production, Transportation and Moving Occupations by Sex
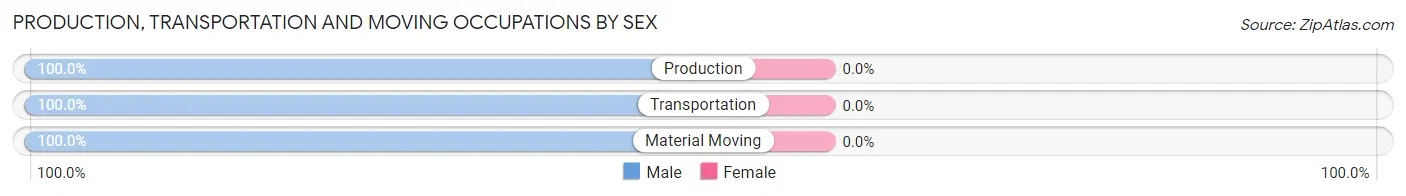
| Occupation | Male | Female |
| Production | 2 (100.0%) | 0 (0.0%) |
| Transportation | 1 (100.0%) | 0 (0.0%) |
| Material Moving | 5 (100.0%) | 0 (0.0%) |
| Total (Category) | 8 (100.0%) | 0 (0.0%) |
| Total (Overall) | 73 (45.9%) | 86 (54.1%) |
Employment Industries by Sex in Circleville
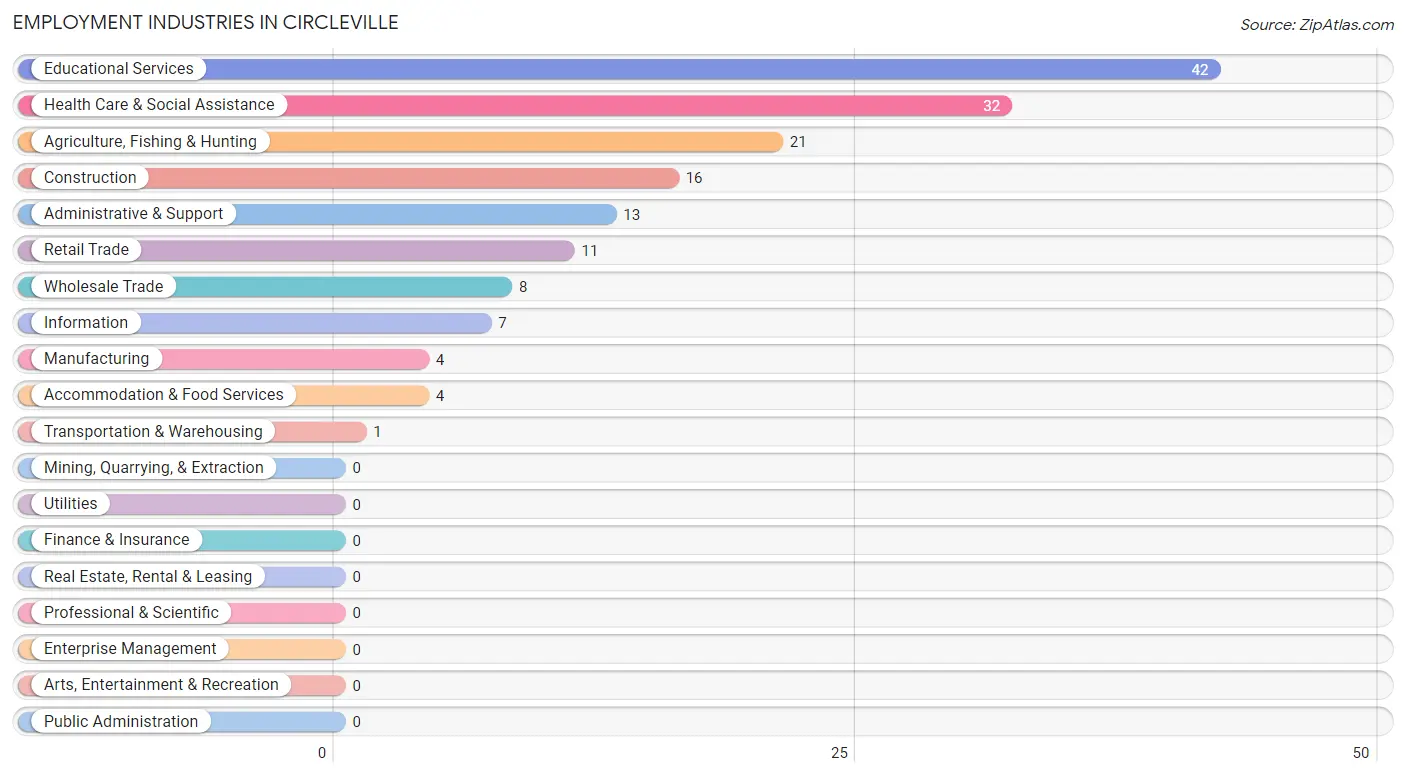
Employment Industries in Circleville
The major employment industries in Circleville include Educational Services (42 | 26.4%), Health Care & Social Assistance (32 | 20.1%), Agriculture, Fishing & Hunting (21 | 13.2%), Construction (16 | 10.1%), and Administrative & Support (13 | 8.2%).
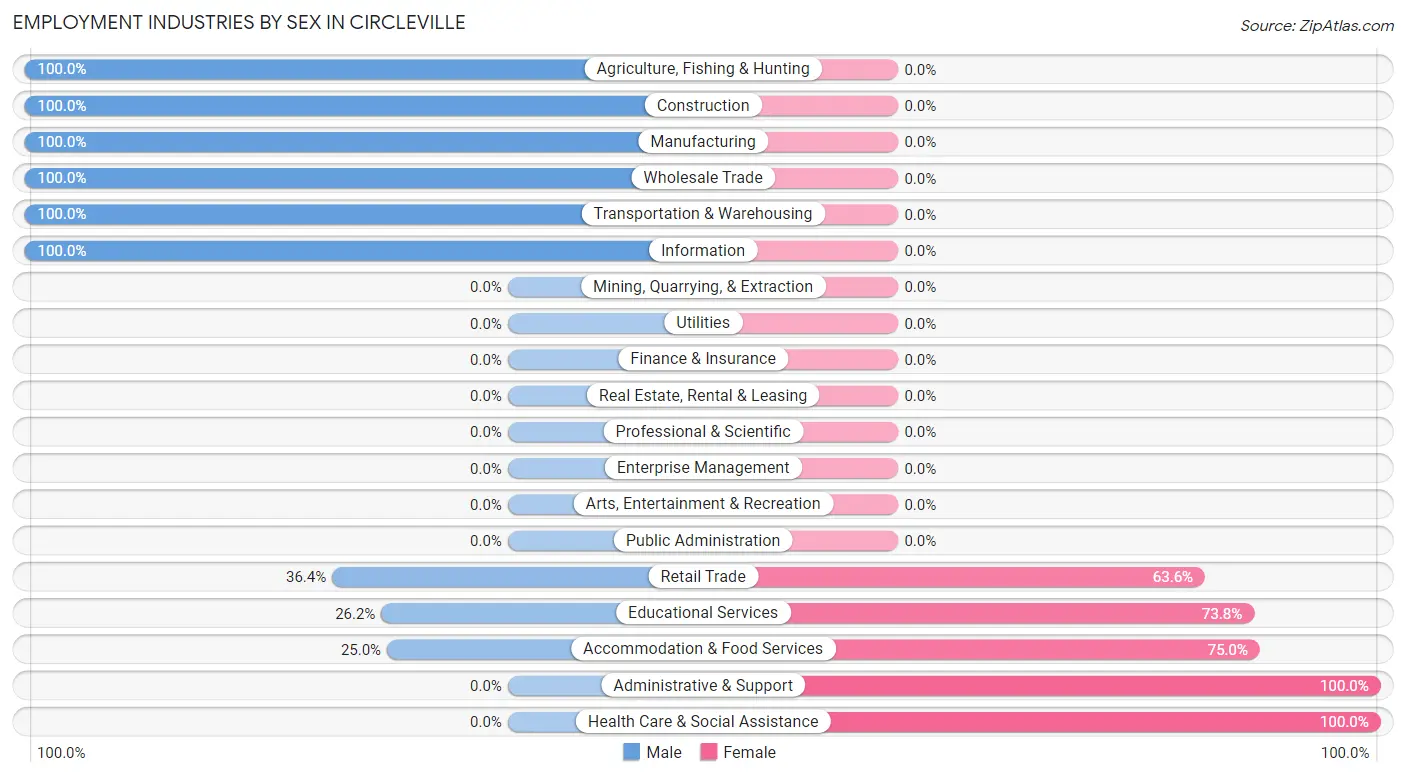
Employment Industries by Sex in Circleville
The Circleville industries that see more men than women are Agriculture, Fishing & Hunting (100.0%), Construction (100.0%), and Manufacturing (100.0%), whereas the industries that tend to have a higher number of women are Administrative & Support (100.0%), Health Care & Social Assistance (100.0%), and Accommodation & Food Services (75.0%).
| Industry | Male | Female |
| Agriculture, Fishing & Hunting | 21 (100.0%) | 0 (0.0%) |
| Mining, Quarrying, & Extraction | 0 (0.0%) | 0 (0.0%) |
| Construction | 16 (100.0%) | 0 (0.0%) |
| Manufacturing | 4 (100.0%) | 0 (0.0%) |
| Wholesale Trade | 8 (100.0%) | 0 (0.0%) |
| Retail Trade | 4 (36.4%) | 7 (63.6%) |
| Transportation & Warehousing | 1 (100.0%) | 0 (0.0%) |
| Utilities | 0 (0.0%) | 0 (0.0%) |
| Information | 7 (100.0%) | 0 (0.0%) |
| Finance & Insurance | 0 (0.0%) | 0 (0.0%) |
| Real Estate, Rental & Leasing | 0 (0.0%) | 0 (0.0%) |
| Professional & Scientific | 0 (0.0%) | 0 (0.0%) |
| Enterprise Management | 0 (0.0%) | 0 (0.0%) |
| Administrative & Support | 0 (0.0%) | 13 (100.0%) |
| Educational Services | 11 (26.2%) | 31 (73.8%) |
| Health Care & Social Assistance | 0 (0.0%) | 32 (100.0%) |
| Arts, Entertainment & Recreation | 0 (0.0%) | 0 (0.0%) |
| Accommodation & Food Services | 1 (25.0%) | 3 (75.0%) |
| Public Administration | 0 (0.0%) | 0 (0.0%) |
| Total | 73 (45.9%) | 86 (54.1%) |
Education in Circleville
School Enrollment in Circleville
The most common levels of schooling among the 137 students in Circleville are college / undergraduate (38 | 27.7%), high school (33 | 24.1%), and middle school (24 | 17.5%).
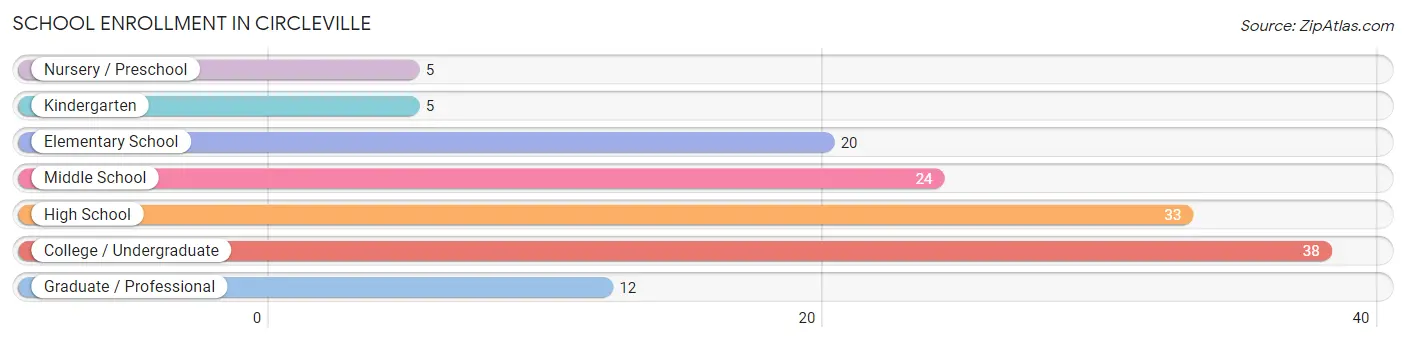
| School Level | # Students | % Students |
| Nursery / Preschool | 5 | 3.6% |
| Kindergarten | 5 | 3.6% |
| Elementary School | 20 | 14.6% |
| Middle School | 24 | 17.5% |
| High School | 33 | 24.1% |
| College / Undergraduate | 38 | 27.7% |
| Graduate / Professional | 12 | 8.8% |
| Total | 137 | 100.0% |
School Enrollment by Age by Funding Source in Circleville
Out of a total of 137 students who are enrolled in schools in Circleville, 24 (17.5%) attend a private institution, while the remaining 113 (82.5%) are enrolled in public schools. The age group of 35 years and over has the highest likelihood of being enrolled in private schools, with 12 (100.0% in the age bracket) enrolled. Conversely, the age group of 3 to 4 year olds has the lowest likelihood of being enrolled in a private school, with 4 (100.0% in the age bracket) attending a public institution.
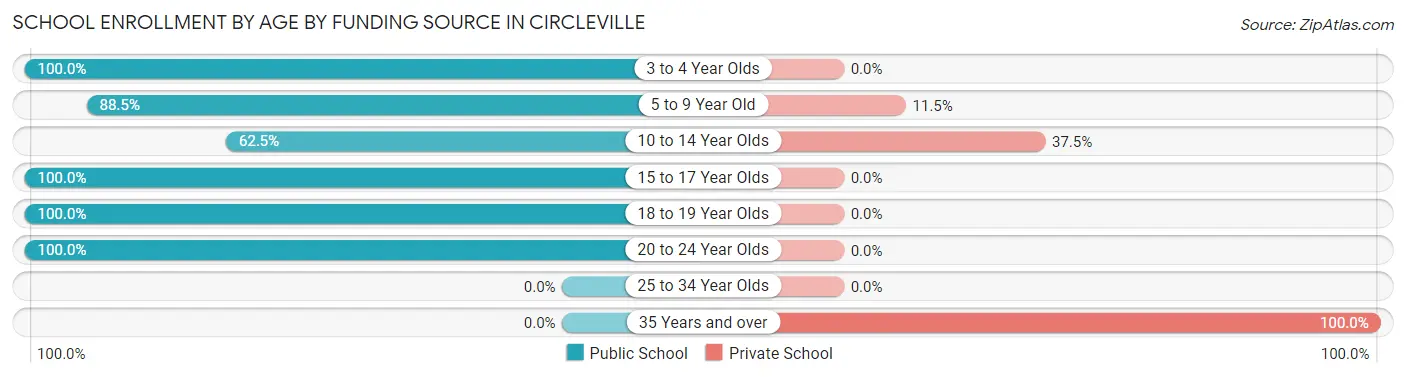
| Age Bracket | Public School | Private School |
| 3 to 4 Year Olds | 4 (100.0%) | 0 (0.0%) |
| 5 to 9 Year Old | 23 (88.5%) | 3 (11.5%) |
| 10 to 14 Year Olds | 15 (62.5%) | 9 (37.5%) |
| 15 to 17 Year Olds | 30 (100.0%) | 0 (0.0%) |
| 18 to 19 Year Olds | 3 (100.0%) | 0 (0.0%) |
| 20 to 24 Year Olds | 38 (100.0%) | 0 (0.0%) |
| 25 to 34 Year Olds | 0 (0.0%) | 0 (0.0%) |
| 35 Years and over | 0 (0.0%) | 12 (100.0%) |
| Total | 113 (82.5%) | 24 (17.5%) |
Educational Attainment by Field of Study in Circleville
Education (34 | 38.2%), business (13 | 14.6%), liberal arts & history (11 | 12.4%), arts & humanities (8 | 9.0%), and bio, nature & agricultural (5 | 5.6%) are the most common fields of study among 89 individuals in Circleville who have obtained a bachelor's degree or higher.
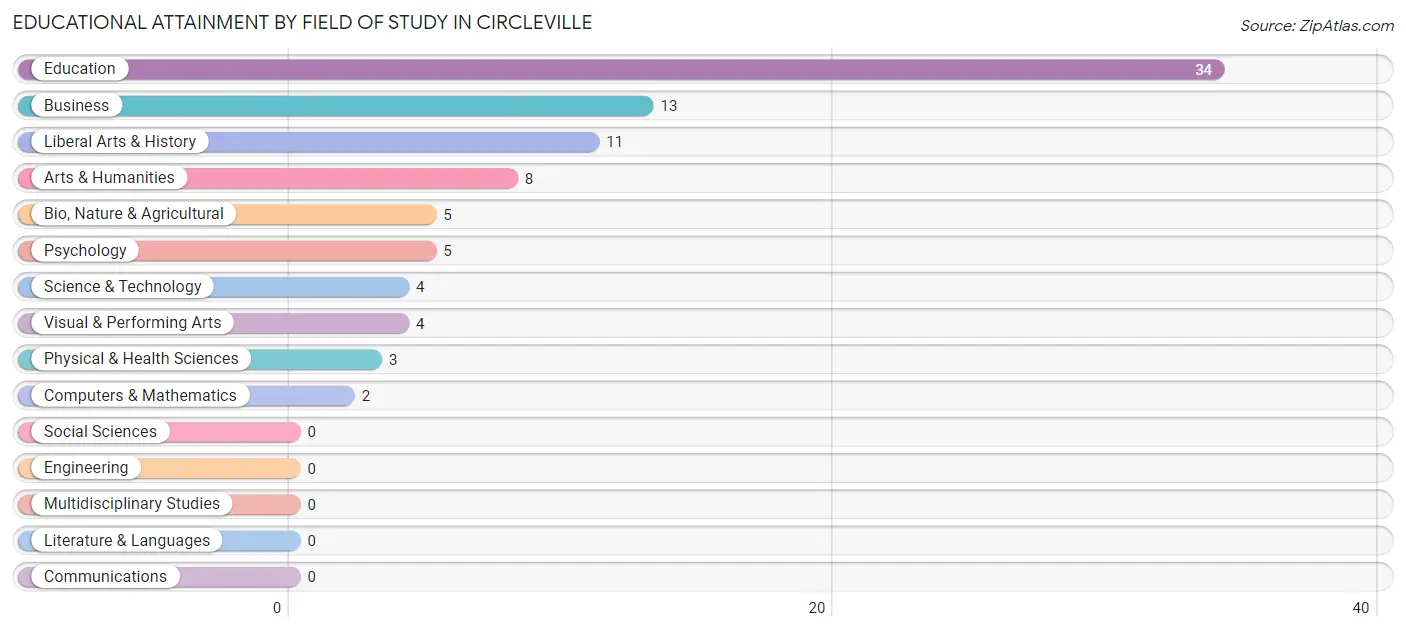
| Field of Study | # Graduates | % Graduates |
| Computers & Mathematics | 2 | 2.2% |
| Bio, Nature & Agricultural | 5 | 5.6% |
| Physical & Health Sciences | 3 | 3.4% |
| Psychology | 5 | 5.6% |
| Social Sciences | 0 | 0.0% |
| Engineering | 0 | 0.0% |
| Multidisciplinary Studies | 0 | 0.0% |
| Science & Technology | 4 | 4.5% |
| Business | 13 | 14.6% |
| Education | 34 | 38.2% |
| Literature & Languages | 0 | 0.0% |
| Liberal Arts & History | 11 | 12.4% |
| Visual & Performing Arts | 4 | 4.5% |
| Communications | 0 | 0.0% |
| Arts & Humanities | 8 | 9.0% |
| Total | 89 | 100.0% |
Transportation & Commute in Circleville
Vehicle Availability by Sex in Circleville
The most prevalent vehicle ownership categories in Circleville are males with 5 or more vehicles (30, accounting for 42.2%) and females with 5 or more vehicles (15, making up 35.3%).
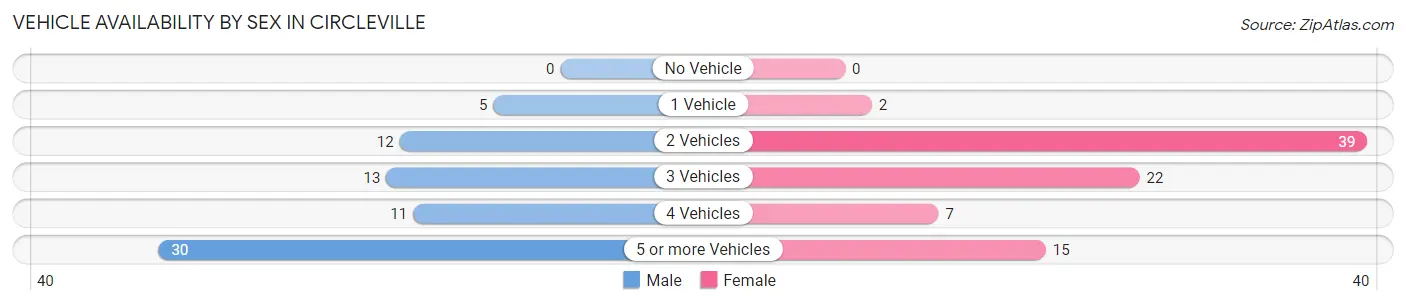
| Vehicles Available | Male | Female |
| No Vehicle | 0 (0.0%) | 0 (0.0%) |
| 1 Vehicle | 5 (7.0%) | 2 (2.4%) |
| 2 Vehicles | 12 (16.9%) | 39 (45.9%) |
| 3 Vehicles | 13 (18.3%) | 22 (25.9%) |
| 4 Vehicles | 11 (15.5%) | 7 (8.2%) |
| 5 or more Vehicles | 30 (42.2%) | 15 (17.6%) |
| Total | 71 (100.0%) | 85 (100.0%) |
Commute Time in Circleville
The most frequently occuring commute durations in Circleville are 5 to 9 minutes (39 commuters, 27.3%), 10 to 14 minutes (37 commuters, 25.9%), and less than 5 minutes (32 commuters, 22.4%).
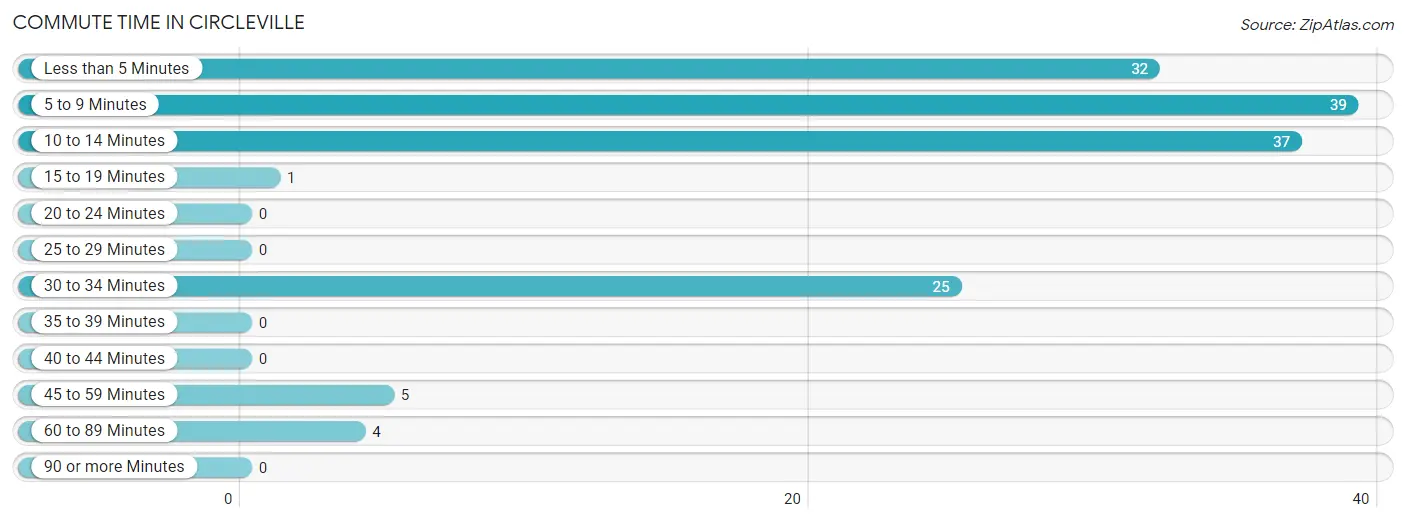
| Commute Time | # Commuters | % Commuters |
| Less than 5 Minutes | 32 | 22.4% |
| 5 to 9 Minutes | 39 | 27.3% |
| 10 to 14 Minutes | 37 | 25.9% |
| 15 to 19 Minutes | 1 | 0.7% |
| 20 to 24 Minutes | 0 | 0.0% |
| 25 to 29 Minutes | 0 | 0.0% |
| 30 to 34 Minutes | 25 | 17.5% |
| 35 to 39 Minutes | 0 | 0.0% |
| 40 to 44 Minutes | 0 | 0.0% |
| 45 to 59 Minutes | 5 | 3.5% |
| 60 to 89 Minutes | 4 | 2.8% |
| 90 or more Minutes | 0 | 0.0% |
Commute Time by Sex in Circleville
The most common commute times in Circleville are less than 5 minutes (22 commuters, 32.4%) for males and 5 to 9 minutes (29 commuters, 38.7%) for females.
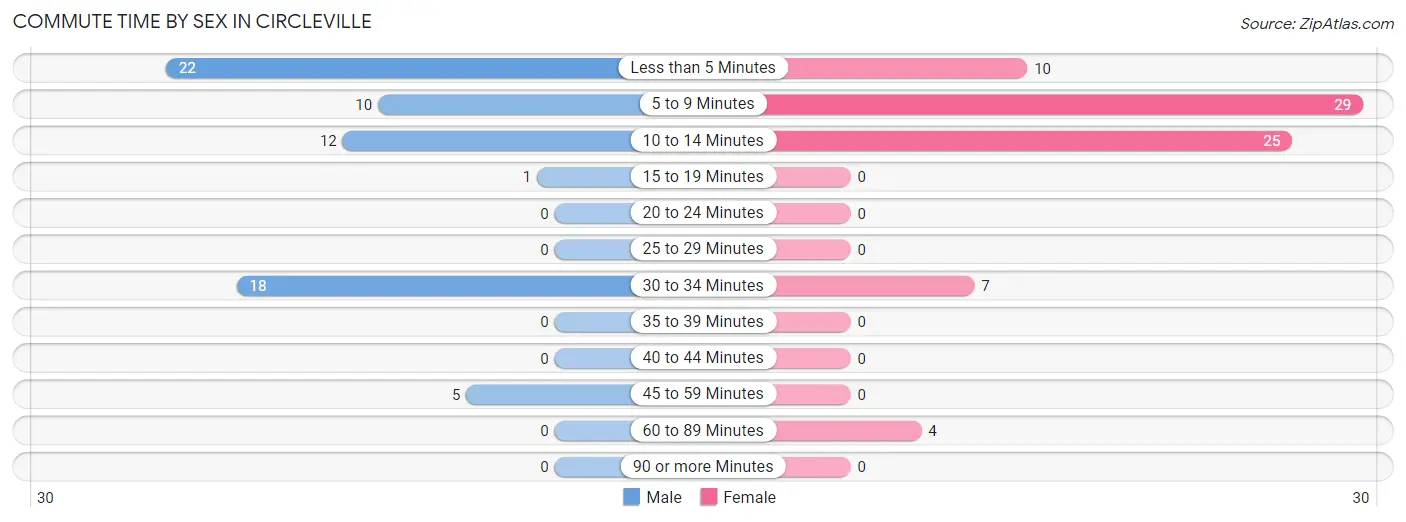
| Commute Time | Male | Female |
| Less than 5 Minutes | 22 (32.4%) | 10 (13.3%) |
| 5 to 9 Minutes | 10 (14.7%) | 29 (38.7%) |
| 10 to 14 Minutes | 12 (17.6%) | 25 (33.3%) |
| 15 to 19 Minutes | 1 (1.5%) | 0 (0.0%) |
| 20 to 24 Minutes | 0 (0.0%) | 0 (0.0%) |
| 25 to 29 Minutes | 0 (0.0%) | 0 (0.0%) |
| 30 to 34 Minutes | 18 (26.5%) | 7 (9.3%) |
| 35 to 39 Minutes | 0 (0.0%) | 0 (0.0%) |
| 40 to 44 Minutes | 0 (0.0%) | 0 (0.0%) |
| 45 to 59 Minutes | 5 (7.3%) | 0 (0.0%) |
| 60 to 89 Minutes | 0 (0.0%) | 4 (5.3%) |
| 90 or more Minutes | 0 (0.0%) | 0 (0.0%) |
Time of Departure to Work by Sex in Circleville
The most frequent times of departure to work in Circleville are 7:00 AM to 7:29 AM (17, 25.0%) for males and 7:30 AM to 7:59 AM (42, 56.0%) for females.
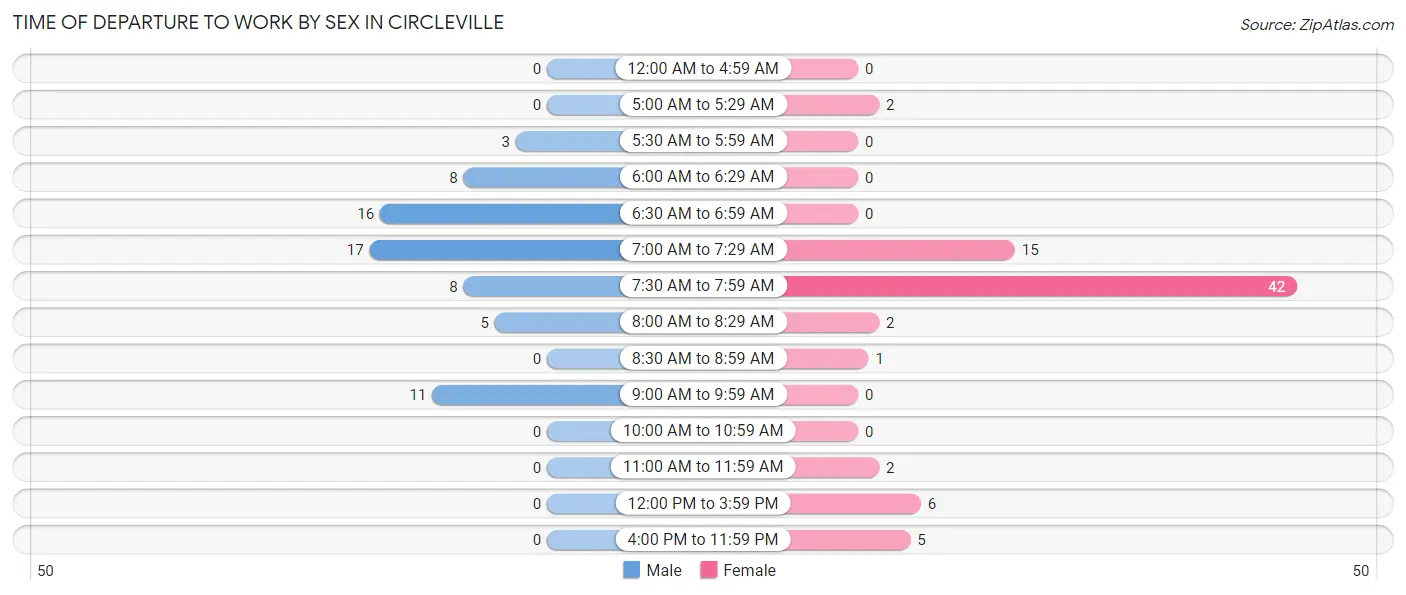
| Time of Departure | Male | Female |
| 12:00 AM to 4:59 AM | 0 (0.0%) | 0 (0.0%) |
| 5:00 AM to 5:29 AM | 0 (0.0%) | 2 (2.7%) |
| 5:30 AM to 5:59 AM | 3 (4.4%) | 0 (0.0%) |
| 6:00 AM to 6:29 AM | 8 (11.8%) | 0 (0.0%) |
| 6:30 AM to 6:59 AM | 16 (23.5%) | 0 (0.0%) |
| 7:00 AM to 7:29 AM | 17 (25.0%) | 15 (20.0%) |
| 7:30 AM to 7:59 AM | 8 (11.8%) | 42 (56.0%) |
| 8:00 AM to 8:29 AM | 5 (7.3%) | 2 (2.7%) |
| 8:30 AM to 8:59 AM | 0 (0.0%) | 1 (1.3%) |
| 9:00 AM to 9:59 AM | 11 (16.2%) | 0 (0.0%) |
| 10:00 AM to 10:59 AM | 0 (0.0%) | 0 (0.0%) |
| 11:00 AM to 11:59 AM | 0 (0.0%) | 2 (2.7%) |
| 12:00 PM to 3:59 PM | 0 (0.0%) | 6 (8.0%) |
| 4:00 PM to 11:59 PM | 0 (0.0%) | 5 (6.7%) |
| Total | 68 (100.0%) | 75 (100.0%) |
Housing Occupancy in Circleville
Occupancy by Ownership in Circleville
Of the total 125 dwellings in Circleville, owner-occupied units account for 110 (88.0%), while renter-occupied units make up 15 (12.0%).
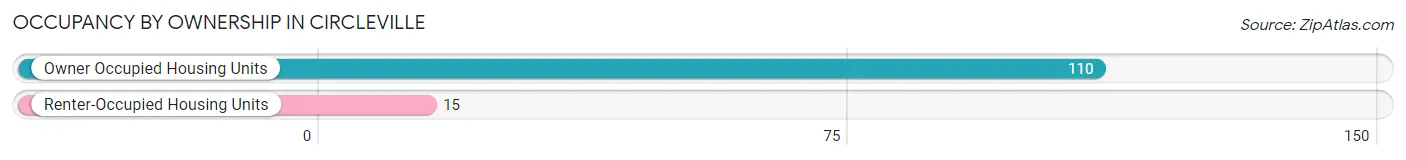
| Occupancy | # Housing Units | % Housing Units |
| Owner Occupied Housing Units | 110 | 88.0% |
| Renter-Occupied Housing Units | 15 | 12.0% |
| Total Occupied Housing Units | 125 | 100.0% |
Occupancy by Household Size in Circleville
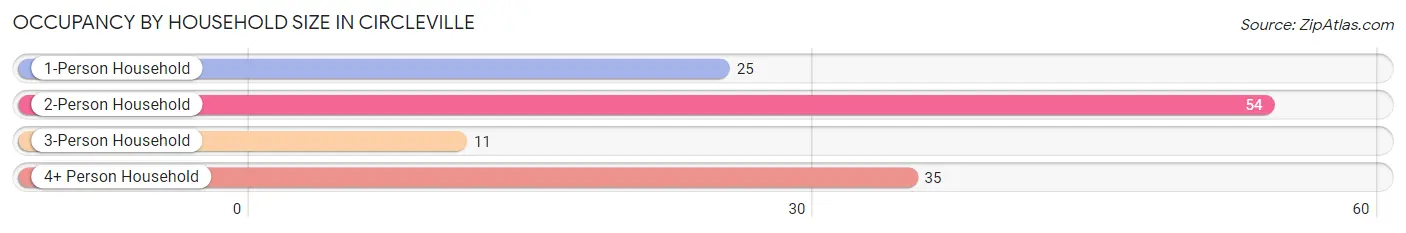
| Household Size | # Housing Units | % Housing Units |
| 1-Person Household | 25 | 20.0% |
| 2-Person Household | 54 | 43.2% |
| 3-Person Household | 11 | 8.8% |
| 4+ Person Household | 35 | 28.0% |
| Total Housing Units | 125 | 100.0% |
Occupancy by Ownership by Household Size in Circleville
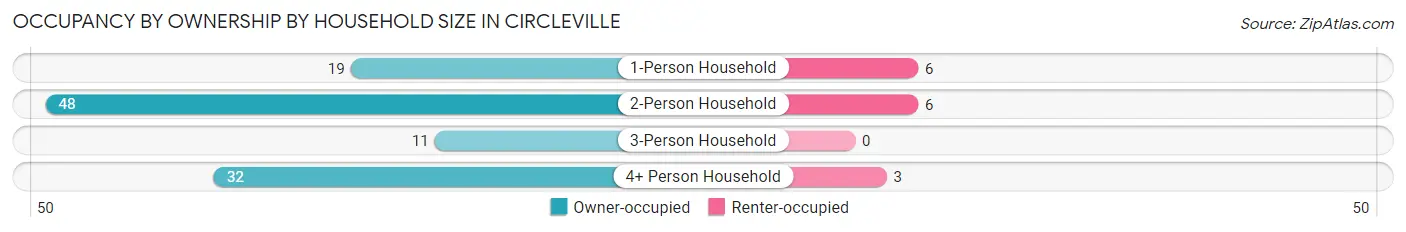
| Household Size | Owner-occupied | Renter-occupied |
| 1-Person Household | 19 (76.0%) | 6 (24.0%) |
| 2-Person Household | 48 (88.9%) | 6 (11.1%) |
| 3-Person Household | 11 (100.0%) | 0 (0.0%) |
| 4+ Person Household | 32 (91.4%) | 3 (8.6%) |
| Total Housing Units | 110 (88.0%) | 15 (12.0%) |
Occupancy by Educational Attainment in Circleville
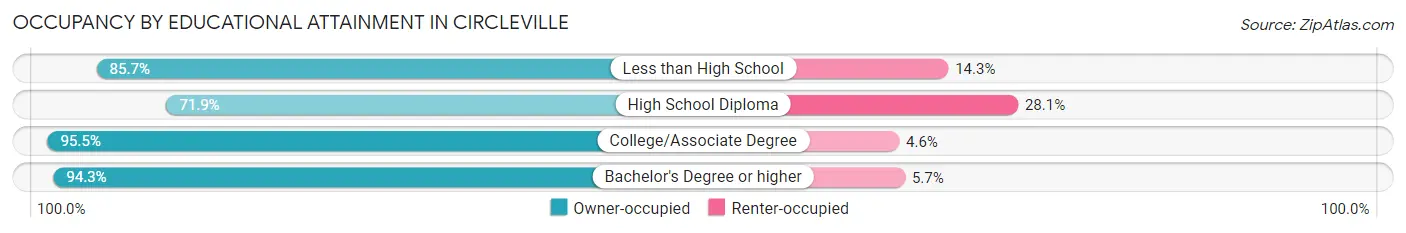
| Household Size | Owner-occupied | Renter-occupied |
| Less than High School | 12 (85.7%) | 2 (14.3%) |
| High School Diploma | 23 (71.9%) | 9 (28.1%) |
| College/Associate Degree | 42 (95.5%) | 2 (4.5%) |
| Bachelor's Degree or higher | 33 (94.3%) | 2 (5.7%) |
Occupancy by Age of Householder in Circleville
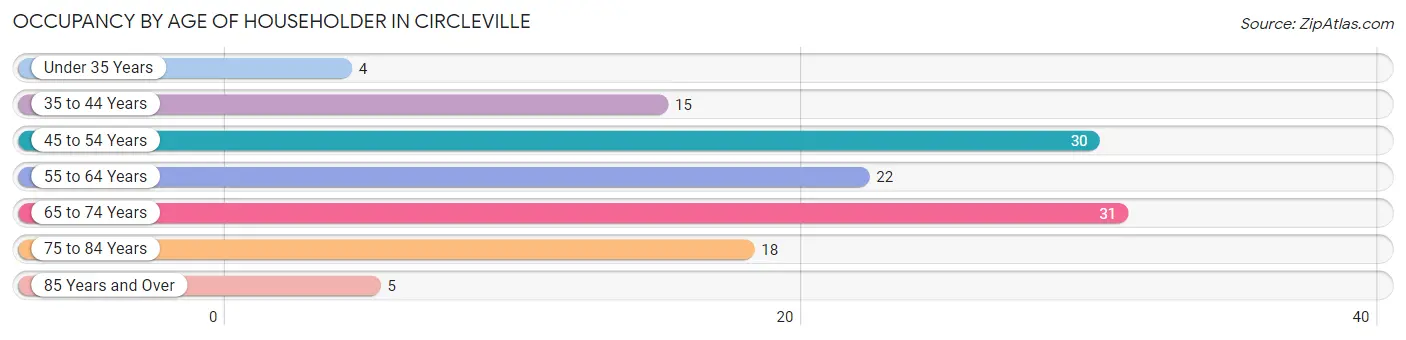
| Age Bracket | # Households | % Households |
| Under 35 Years | 4 | 3.2% |
| 35 to 44 Years | 15 | 12.0% |
| 45 to 54 Years | 30 | 24.0% |
| 55 to 64 Years | 22 | 17.6% |
| 65 to 74 Years | 31 | 24.8% |
| 75 to 84 Years | 18 | 14.4% |
| 85 Years and Over | 5 | 4.0% |
| Total | 125 | 100.0% |
Housing Finances in Circleville
Median Income by Occupancy in Circleville
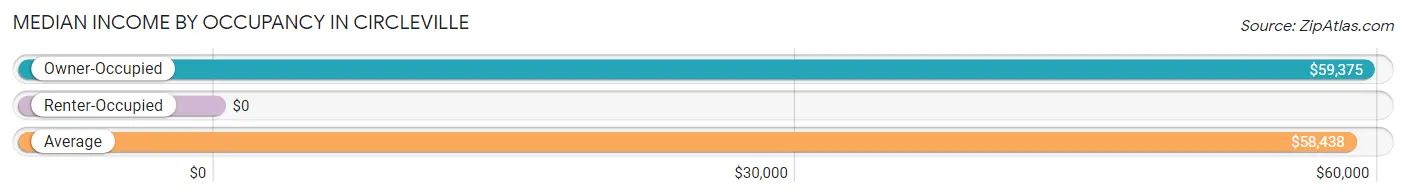
| Occupancy Type | # Households | Median Income |
| Owner-Occupied | 110 (88.0%) | $59,375 |
| Renter-Occupied | 15 (12.0%) | $0 |
| Average | 125 (100.0%) | $58,438 |
Occupancy by Householder Income Bracket in Circleville
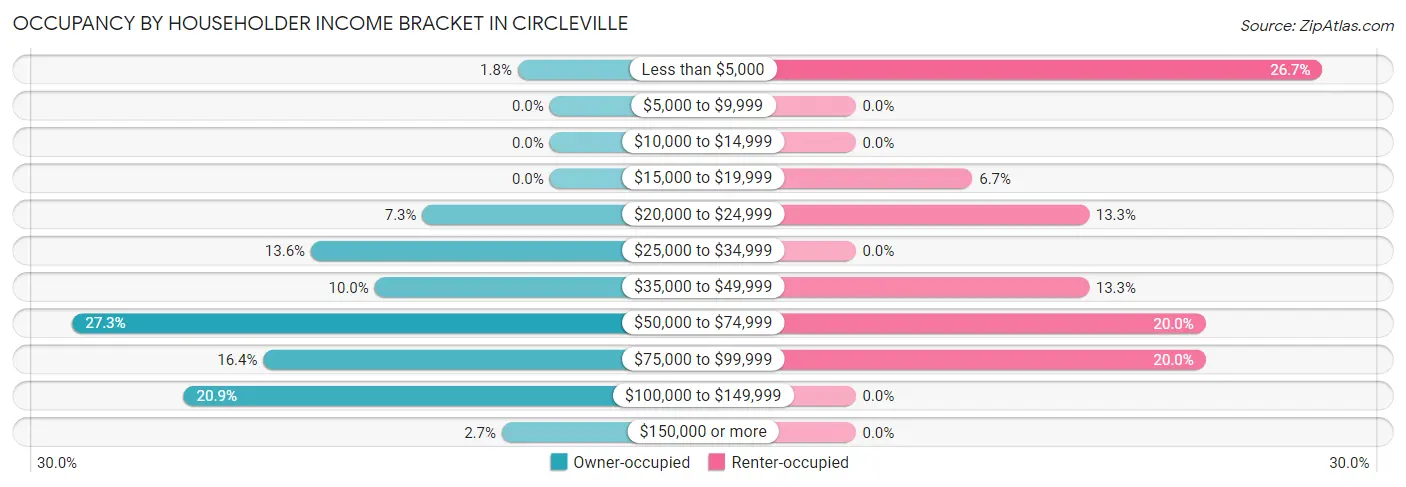
| Income Bracket | Owner-occupied | Renter-occupied |
| Less than $5,000 | 2 (1.8%) | 4 (26.7%) |
| $5,000 to $9,999 | 0 (0.0%) | 0 (0.0%) |
| $10,000 to $14,999 | 0 (0.0%) | 0 (0.0%) |
| $15,000 to $19,999 | 0 (0.0%) | 1 (6.7%) |
| $20,000 to $24,999 | 8 (7.3%) | 2 (13.3%) |
| $25,000 to $34,999 | 15 (13.6%) | 0 (0.0%) |
| $35,000 to $49,999 | 11 (10.0%) | 2 (13.3%) |
| $50,000 to $74,999 | 30 (27.3%) | 3 (20.0%) |
| $75,000 to $99,999 | 18 (16.4%) | 3 (20.0%) |
| $100,000 to $149,999 | 23 (20.9%) | 0 (0.0%) |
| $150,000 or more | 3 (2.7%) | 0 (0.0%) |
| Total | 110 (100.0%) | 15 (100.0%) |
Monthly Housing Cost Tiers in Circleville
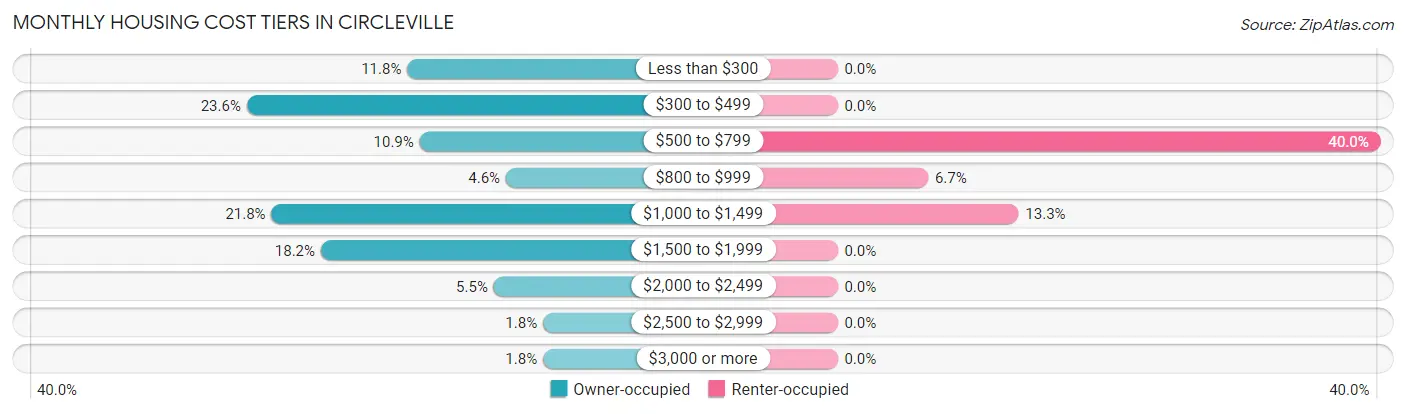
| Monthly Cost | Owner-occupied | Renter-occupied |
| Less than $300 | 13 (11.8%) | 0 (0.0%) |
| $300 to $499 | 26 (23.6%) | 0 (0.0%) |
| $500 to $799 | 12 (10.9%) | 6 (40.0%) |
| $800 to $999 | 5 (4.5%) | 1 (6.7%) |
| $1,000 to $1,499 | 24 (21.8%) | 2 (13.3%) |
| $1,500 to $1,999 | 20 (18.2%) | 0 (0.0%) |
| $2,000 to $2,499 | 6 (5.4%) | 0 (0.0%) |
| $2,500 to $2,999 | 2 (1.8%) | 0 (0.0%) |
| $3,000 or more | 2 (1.8%) | 0 (0.0%) |
| Total | 110 (100.0%) | 15 (100.0%) |
Physical Housing Characteristics in Circleville
Housing Structures in Circleville
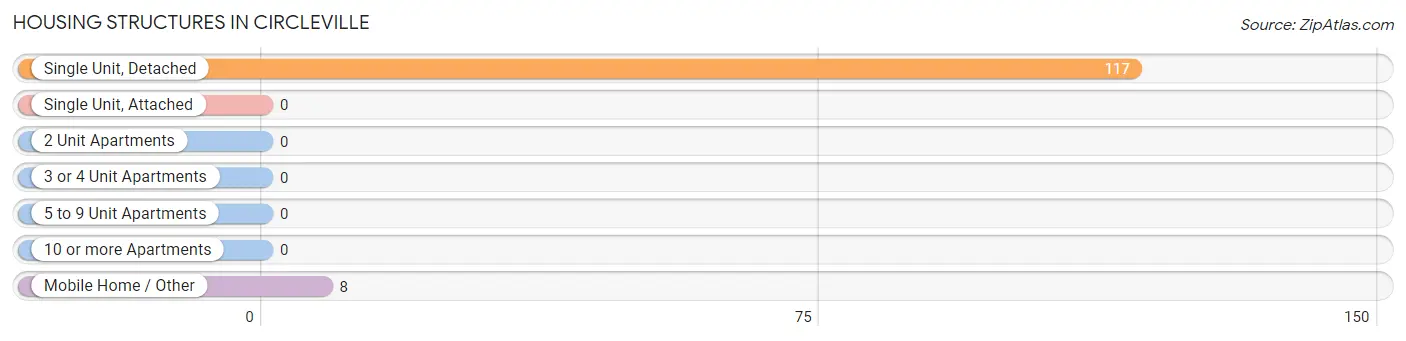
| Structure Type | # Housing Units | % Housing Units |
| Single Unit, Detached | 117 | 93.6% |
| Single Unit, Attached | 0 | 0.0% |
| 2 Unit Apartments | 0 | 0.0% |
| 3 or 4 Unit Apartments | 0 | 0.0% |
| 5 to 9 Unit Apartments | 0 | 0.0% |
| 10 or more Apartments | 0 | 0.0% |
| Mobile Home / Other | 8 | 6.4% |
| Total | 125 | 100.0% |
Housing Structures by Occupancy in Circleville
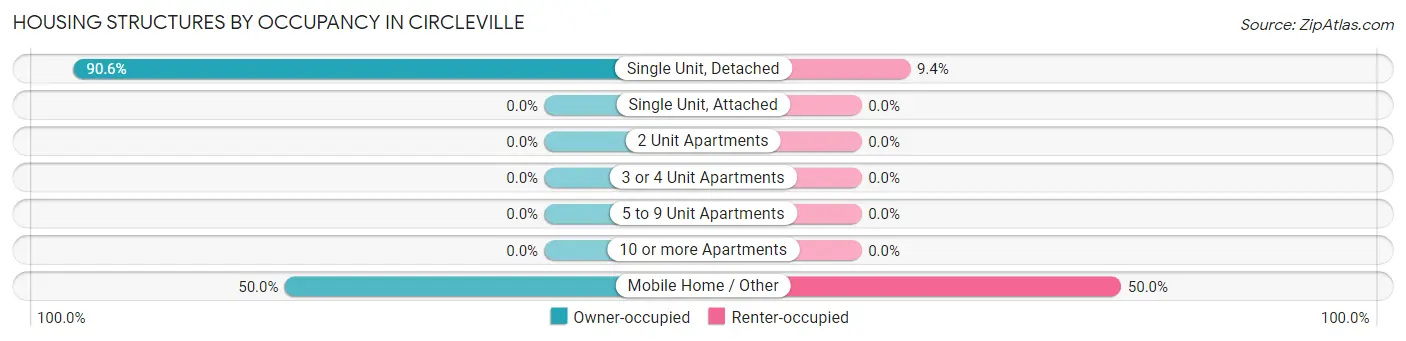
| Structure Type | Owner-occupied | Renter-occupied |
| Single Unit, Detached | 106 (90.6%) | 11 (9.4%) |
| Single Unit, Attached | 0 (0.0%) | 0 (0.0%) |
| 2 Unit Apartments | 0 (0.0%) | 0 (0.0%) |
| 3 or 4 Unit Apartments | 0 (0.0%) | 0 (0.0%) |
| 5 to 9 Unit Apartments | 0 (0.0%) | 0 (0.0%) |
| 10 or more Apartments | 0 (0.0%) | 0 (0.0%) |
| Mobile Home / Other | 4 (50.0%) | 4 (50.0%) |
| Total | 110 (88.0%) | 15 (12.0%) |
Housing Structures by Number of Rooms in Circleville
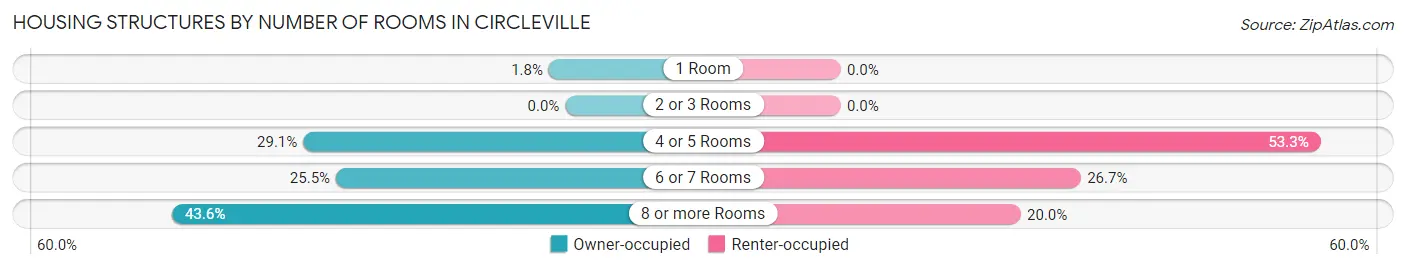
| Number of Rooms | Owner-occupied | Renter-occupied |
| 1 Room | 2 (1.8%) | 0 (0.0%) |
| 2 or 3 Rooms | 0 (0.0%) | 0 (0.0%) |
| 4 or 5 Rooms | 32 (29.1%) | 8 (53.3%) |
| 6 or 7 Rooms | 28 (25.5%) | 4 (26.7%) |
| 8 or more Rooms | 48 (43.6%) | 3 (20.0%) |
| Total | 110 (100.0%) | 15 (100.0%) |
Housing Structure by Heating Type in Circleville
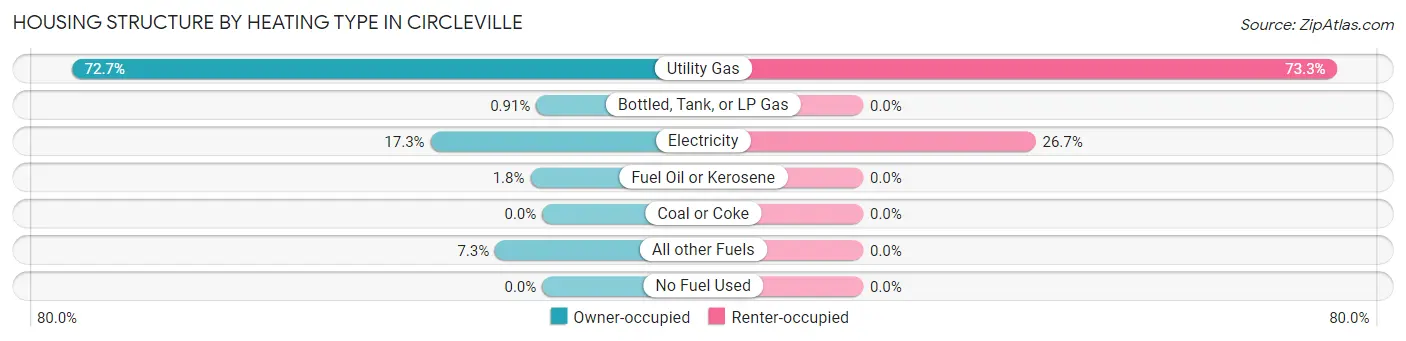
| Heating Type | Owner-occupied | Renter-occupied |
| Utility Gas | 80 (72.7%) | 11 (73.3%) |
| Bottled, Tank, or LP Gas | 1 (0.9%) | 0 (0.0%) |
| Electricity | 19 (17.3%) | 4 (26.7%) |
| Fuel Oil or Kerosene | 2 (1.8%) | 0 (0.0%) |
| Coal or Coke | 0 (0.0%) | 0 (0.0%) |
| All other Fuels | 8 (7.3%) | 0 (0.0%) |
| No Fuel Used | 0 (0.0%) | 0 (0.0%) |
| Total | 110 (100.0%) | 15 (100.0%) |
Household Vehicle Usage in Circleville

| Vehicles per Household | Owner-occupied | Renter-occupied |
| No Vehicle | 0 (0.0%) | 0 (0.0%) |
| 1 Vehicle | 27 (24.5%) | 2 (13.3%) |
| 2 Vehicles | 38 (34.5%) | 8 (53.3%) |
| 3 or more Vehicles | 45 (40.9%) | 5 (33.3%) |
| Total | 110 (100.0%) | 15 (100.0%) |
Real Estate & Mortgages in Circleville
Real Estate and Mortgage Overview in Circleville
| Characteristic | Without Mortgage | With Mortgage |
| Housing Units | 46 | 64 |
| Median Property Value | $200,000 | $285,700 |
| Median Household Income | $55,000 | $0 |
| Monthly Housing Costs | $377 | $2 |
| Real Estate Taxes | $760 | $0 |
Property Value by Mortgage Status in Circleville
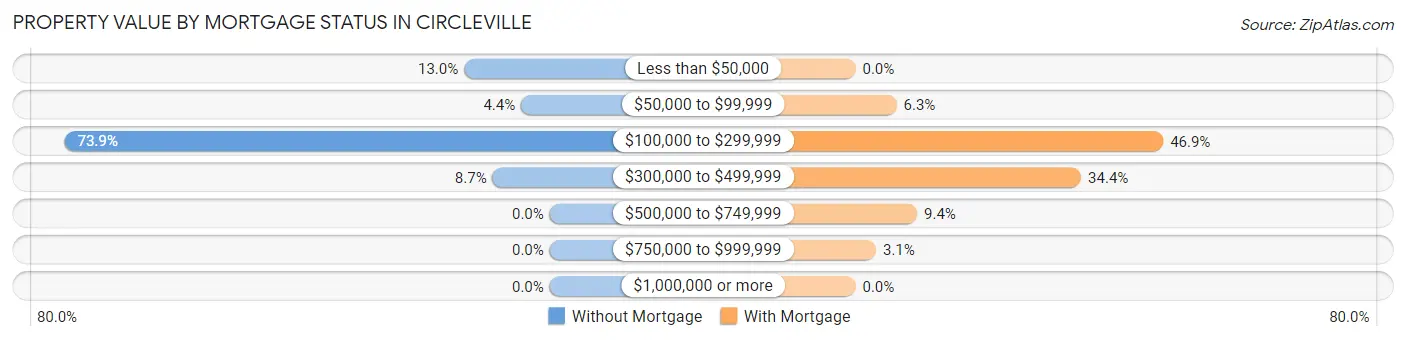
| Property Value | Without Mortgage | With Mortgage |
| Less than $50,000 | 6 (13.0%) | 0 (0.0%) |
| $50,000 to $99,999 | 2 (4.3%) | 4 (6.2%) |
| $100,000 to $299,999 | 34 (73.9%) | 30 (46.9%) |
| $300,000 to $499,999 | 4 (8.7%) | 22 (34.4%) |
| $500,000 to $749,999 | 0 (0.0%) | 6 (9.4%) |
| $750,000 to $999,999 | 0 (0.0%) | 2 (3.1%) |
| $1,000,000 or more | 0 (0.0%) | 0 (0.0%) |
| Total | 46 (100.0%) | 64 (100.0%) |
Household Income by Mortgage Status in Circleville
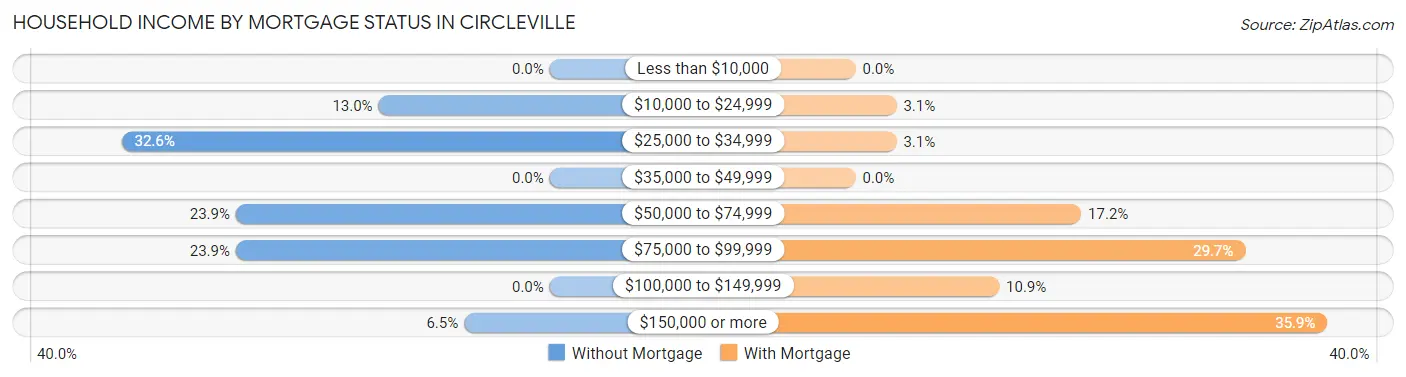
| Household Income | Without Mortgage | With Mortgage |
| Less than $10,000 | 0 (0.0%) | 0 (0.0%) |
| $10,000 to $24,999 | 6 (13.0%) | 2 (3.1%) |
| $25,000 to $34,999 | 15 (32.6%) | 2 (3.1%) |
| $35,000 to $49,999 | 0 (0.0%) | 0 (0.0%) |
| $50,000 to $74,999 | 11 (23.9%) | 11 (17.2%) |
| $75,000 to $99,999 | 11 (23.9%) | 19 (29.7%) |
| $100,000 to $149,999 | 0 (0.0%) | 7 (10.9%) |
| $150,000 or more | 3 (6.5%) | 23 (35.9%) |
| Total | 46 (100.0%) | 64 (100.0%) |
Property Value to Household Income Ratio in Circleville
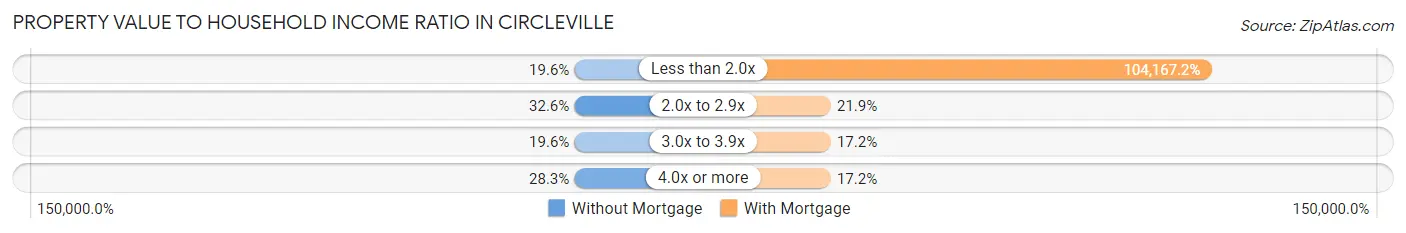
| Value-to-Income Ratio | Without Mortgage | With Mortgage |
| Less than 2.0x | 9 (19.6%) | 66,667 (104,167.2%) |
| 2.0x to 2.9x | 15 (32.6%) | 14 (21.9%) |
| 3.0x to 3.9x | 9 (19.6%) | 11 (17.2%) |
| 4.0x or more | 13 (28.3%) | 11 (17.2%) |
| Total | 46 (100.0%) | 64 (100.0%) |
Real Estate Taxes by Mortgage Status in Circleville
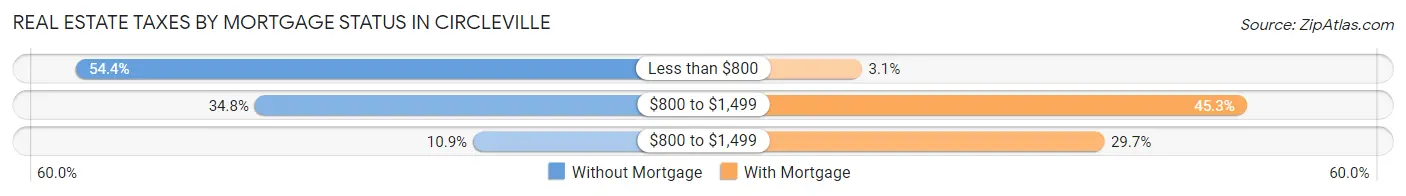
| Property Taxes | Without Mortgage | With Mortgage |
| Less than $800 | 25 (54.3%) | 2 (3.1%) |
| $800 to $1,499 | 16 (34.8%) | 29 (45.3%) |
| $800 to $1,499 | 5 (10.9%) | 19 (29.7%) |
| Total | 46 (100.0%) | 64 (100.0%) |
Health & Disability in Circleville
Health Insurance Coverage by Age in Circleville
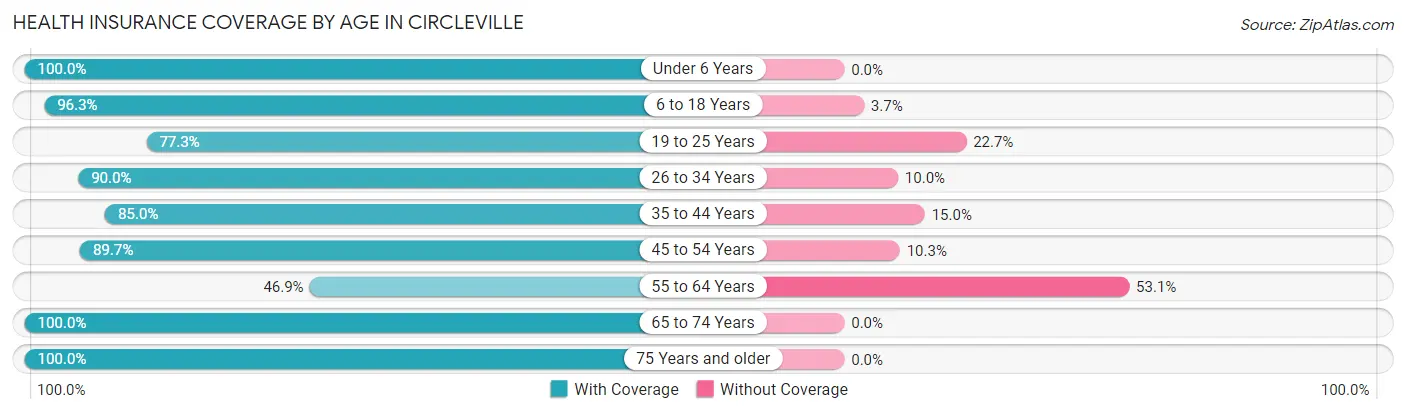
| Age Bracket | With Coverage | Without Coverage |
| Under 6 Years | 7 (100.0%) | 0 (0.0%) |
| 6 to 18 Years | 79 (96.3%) | 3 (3.7%) |
| 19 to 25 Years | 51 (77.3%) | 15 (22.7%) |
| 26 to 34 Years | 9 (90.0%) | 1 (10.0%) |
| 35 to 44 Years | 34 (85.0%) | 6 (15.0%) |
| 45 to 54 Years | 52 (89.7%) | 6 (10.3%) |
| 55 to 64 Years | 30 (46.9%) | 34 (53.1%) |
| 65 to 74 Years | 70 (100.0%) | 0 (0.0%) |
| 75 Years and older | 34 (100.0%) | 0 (0.0%) |
| Total | 366 (84.9%) | 65 (15.1%) |
Health Insurance Coverage by Citizenship Status in Circleville
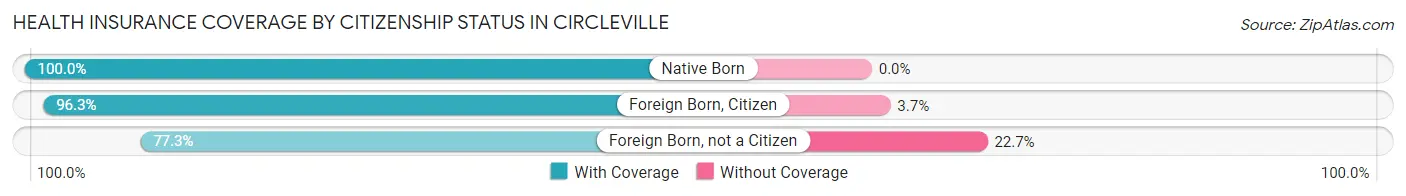
| Citizenship Status | With Coverage | Without Coverage |
| Native Born | 7 (100.0%) | 0 (0.0%) |
| Foreign Born, Citizen | 79 (96.3%) | 3 (3.7%) |
| Foreign Born, not a Citizen | 51 (77.3%) | 15 (22.7%) |
Health Insurance Coverage by Household Income in Circleville
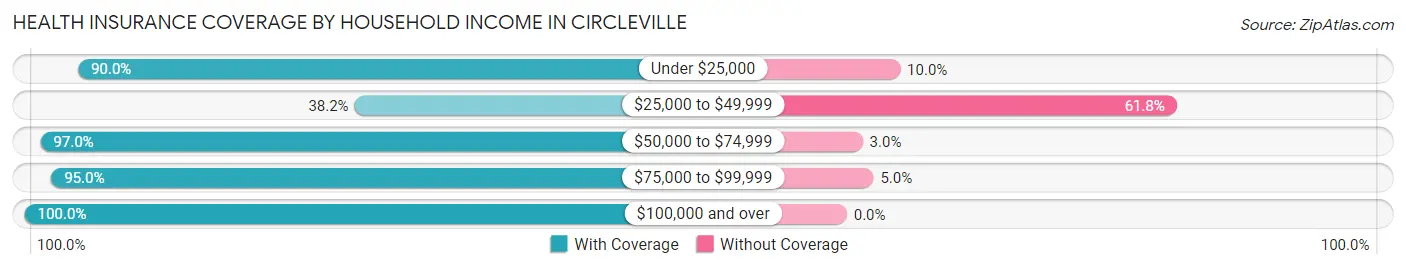
| Household Income | With Coverage | Without Coverage |
| Under $25,000 | 36 (90.0%) | 4 (10.0%) |
| $25,000 to $49,999 | 34 (38.2%) | 55 (61.8%) |
| $50,000 to $74,999 | 98 (97.0%) | 3 (3.0%) |
| $75,000 to $99,999 | 57 (95.0%) | 3 (5.0%) |
| $100,000 and over | 141 (100.0%) | 0 (0.0%) |
Public vs Private Health Insurance Coverage by Age in Circleville
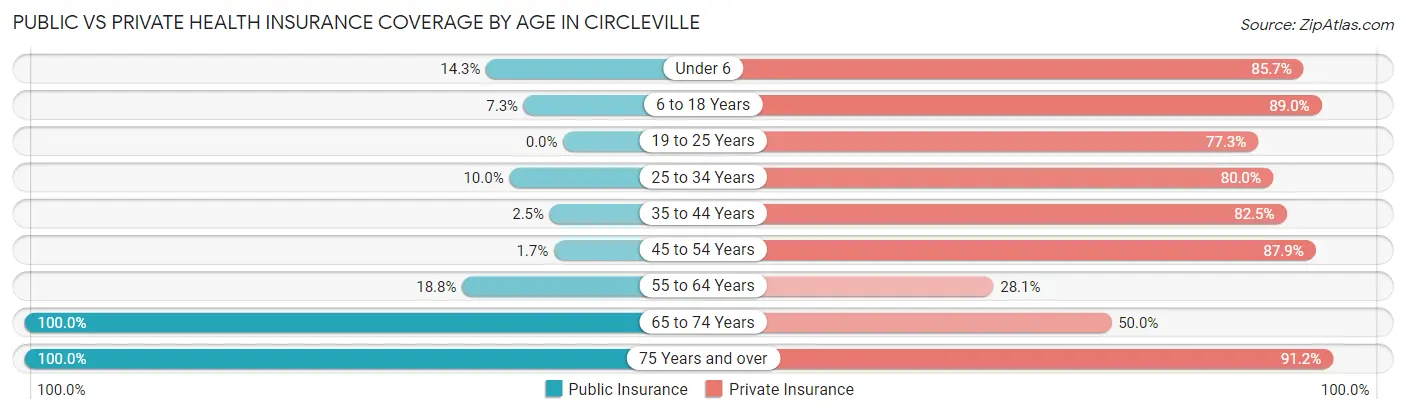
| Age Bracket | Public Insurance | Private Insurance |
| Under 6 | 1 (14.3%) | 6 (85.7%) |
| 6 to 18 Years | 6 (7.3%) | 73 (89.0%) |
| 19 to 25 Years | 0 (0.0%) | 51 (77.3%) |
| 25 to 34 Years | 1 (10.0%) | 8 (80.0%) |
| 35 to 44 Years | 1 (2.5%) | 33 (82.5%) |
| 45 to 54 Years | 1 (1.7%) | 51 (87.9%) |
| 55 to 64 Years | 12 (18.8%) | 18 (28.1%) |
| 65 to 74 Years | 70 (100.0%) | 35 (50.0%) |
| 75 Years and over | 34 (100.0%) | 31 (91.2%) |
| Total | 126 (29.2%) | 306 (71.0%) |
Disability Status by Sex by Age in Circleville
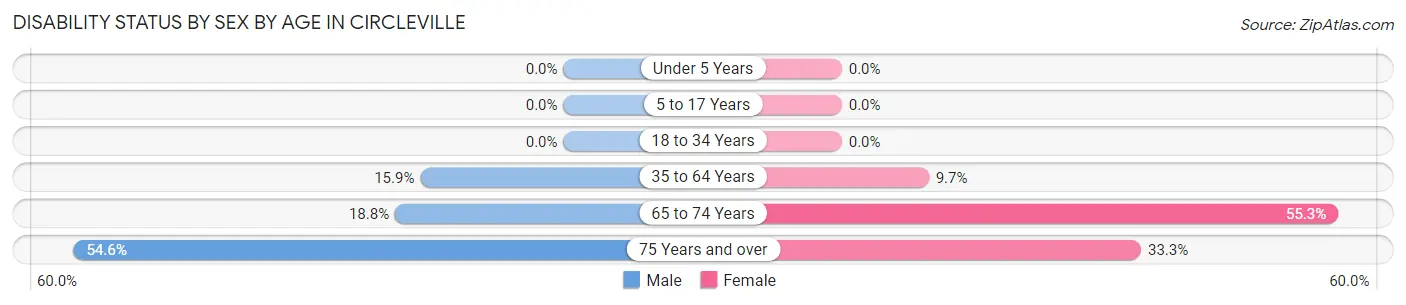
| Age Bracket | Male | Female |
| Under 5 Years | 0 (0.0%) | 0 (0.0%) |
| 5 to 17 Years | 0 (0.0%) | 0 (0.0%) |
| 18 to 34 Years | 0 (0.0%) | 0 (0.0%) |
| 35 to 64 Years | 11 (15.9%) | 9 (9.7%) |
| 65 to 74 Years | 6 (18.8%) | 21 (55.3%) |
| 75 Years and over | 12 (54.5%) | 4 (33.3%) |
Disability Class by Sex by Age in Circleville
Disability Class: Hearing Difficulty
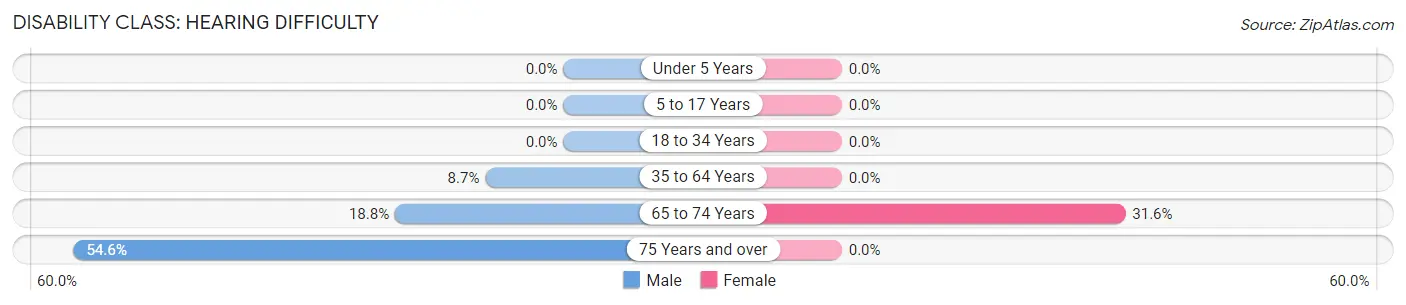
| Age Bracket | Male | Female |
| Under 5 Years | 0 (0.0%) | 0 (0.0%) |
| 5 to 17 Years | 0 (0.0%) | 0 (0.0%) |
| 18 to 34 Years | 0 (0.0%) | 0 (0.0%) |
| 35 to 64 Years | 6 (8.7%) | 0 (0.0%) |
| 65 to 74 Years | 6 (18.8%) | 12 (31.6%) |
| 75 Years and over | 12 (54.5%) | 0 (0.0%) |
Disability Class: Vision Difficulty
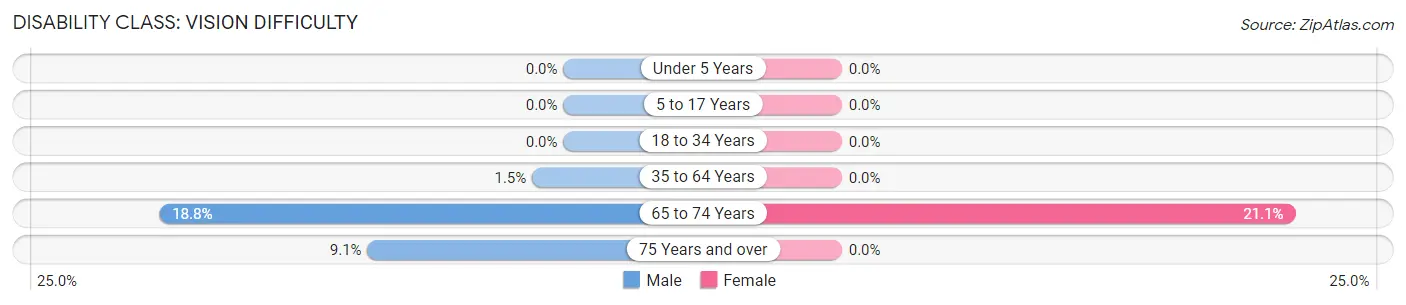
| Age Bracket | Male | Female |
| Under 5 Years | 0 (0.0%) | 0 (0.0%) |
| 5 to 17 Years | 0 (0.0%) | 0 (0.0%) |
| 18 to 34 Years | 0 (0.0%) | 0 (0.0%) |
| 35 to 64 Years | 1 (1.5%) | 0 (0.0%) |
| 65 to 74 Years | 6 (18.8%) | 8 (21.0%) |
| 75 Years and over | 2 (9.1%) | 0 (0.0%) |
Disability Class: Cognitive Difficulty
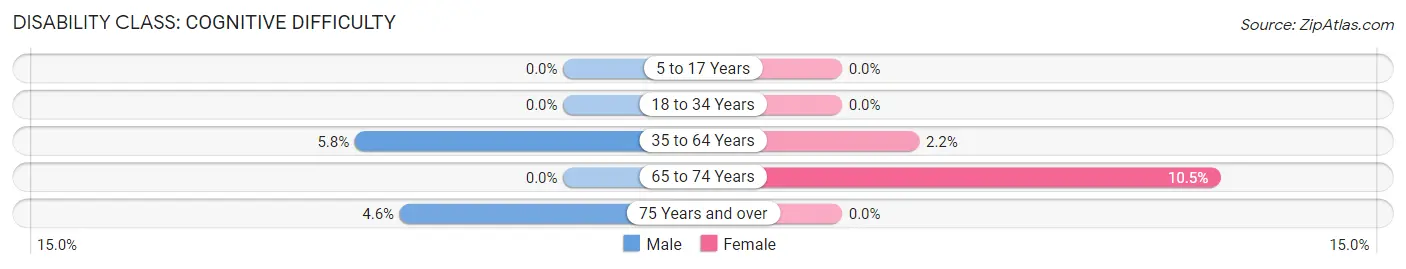
| Age Bracket | Male | Female |
| 5 to 17 Years | 0 (0.0%) | 0 (0.0%) |
| 18 to 34 Years | 0 (0.0%) | 0 (0.0%) |
| 35 to 64 Years | 4 (5.8%) | 2 (2.1%) |
| 65 to 74 Years | 0 (0.0%) | 4 (10.5%) |
| 75 Years and over | 1 (4.5%) | 0 (0.0%) |
Disability Class: Ambulatory Difficulty
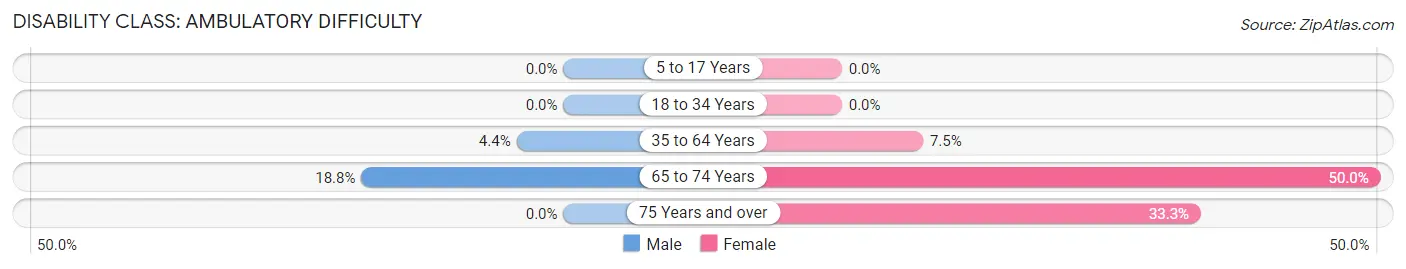
| Age Bracket | Male | Female |
| 5 to 17 Years | 0 (0.0%) | 0 (0.0%) |
| 18 to 34 Years | 0 (0.0%) | 0 (0.0%) |
| 35 to 64 Years | 3 (4.3%) | 7 (7.5%) |
| 65 to 74 Years | 6 (18.8%) | 19 (50.0%) |
| 75 Years and over | 0 (0.0%) | 4 (33.3%) |
Disability Class: Self-Care Difficulty
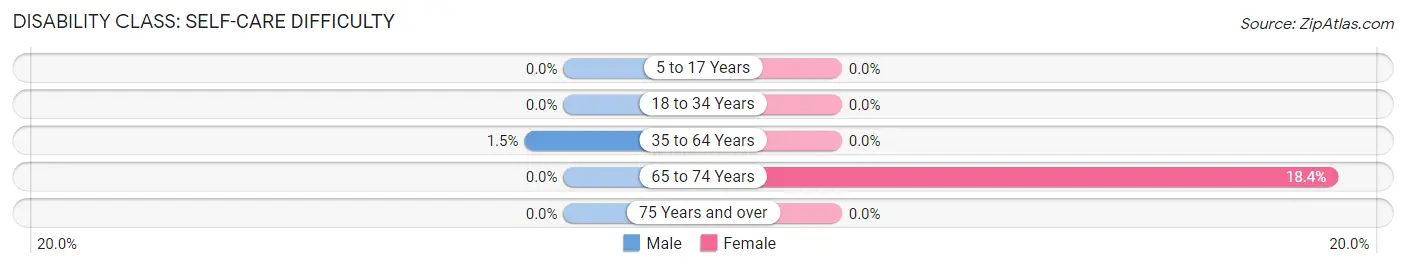
| Age Bracket | Male | Female |
| 5 to 17 Years | 0 (0.0%) | 0 (0.0%) |
| 18 to 34 Years | 0 (0.0%) | 0 (0.0%) |
| 35 to 64 Years | 1 (1.5%) | 0 (0.0%) |
| 65 to 74 Years | 0 (0.0%) | 7 (18.4%) |
| 75 Years and over | 0 (0.0%) | 0 (0.0%) |
Technology Access in Circleville
Computing Device Access in Circleville
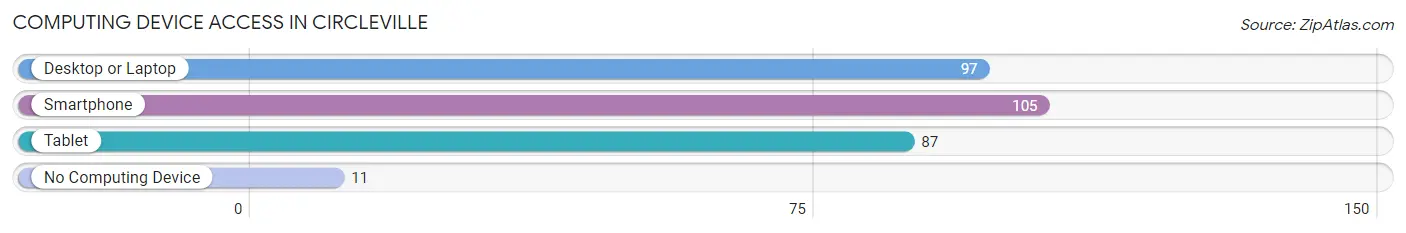
| Device Type | # Households | % Households |
| Desktop or Laptop | 97 | 77.6% |
| Smartphone | 105 | 84.0% |
| Tablet | 87 | 69.6% |
| No Computing Device | 11 | 8.8% |
| Total | 125 | 100.0% |
Internet Access in Circleville
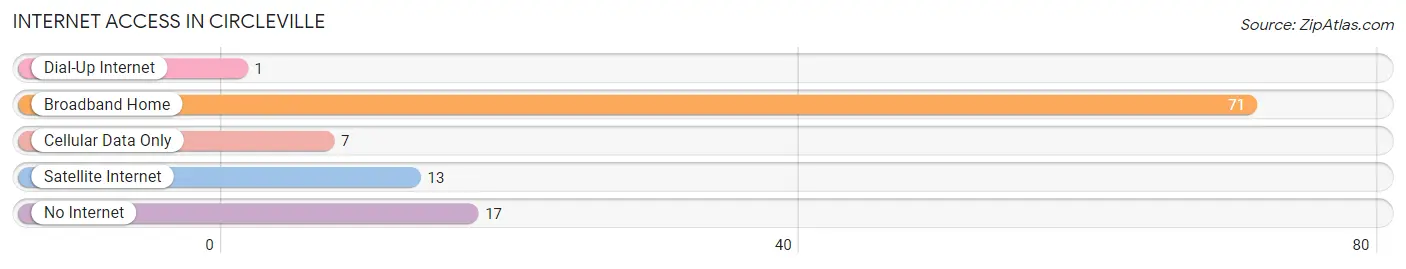
| Internet Type | # Households | % Households |
| Dial-Up Internet | 1 | 0.8% |
| Broadband Home | 71 | 56.8% |
| Cellular Data Only | 7 | 5.6% |
| Satellite Internet | 13 | 10.4% |
| No Internet | 17 | 13.6% |
| Total | 125 | 100.0% |
Circleville Summary
Circleville is a small town located in Piute County, Utah, United States. It is situated in the south-central part of the state, approximately 20 miles east of the Nevada border. The town was founded in 1864 by Mormon pioneers and is named after the circular shape of the valley in which it is located. As of the 2010 census, the population of Circleville was 514.
Geography
Circleville is located at an elevation of 5,890 feet in the Tushar Mountains of south-central Utah. It is situated in a circular valley surrounded by mountains, which gives the town its name. The valley is approximately 5 miles in diameter and is located in the Fishlake National Forest. The town is located on the banks of the Sevier River, which flows through the valley.
The climate in Circleville is semi-arid, with hot summers and cold winters. The average annual temperature is 48°F, with an average high of 79°F in July and an average low of 17°F in January. The average annual precipitation is 11.5 inches, with most of it falling in the form of snow.
Economy
The economy of Circleville is largely based on agriculture and tourism. The town is home to several small farms, which produce hay, alfalfa, and other crops. The town is also a popular destination for outdoor recreation, such as fishing, hunting, and camping.
The town is also home to several small businesses, including a grocery store, a hardware store, a restaurant, and a gas station. The town also has a post office and a library.
Demographics
As of the 2010 census, the population of Circleville was 514. The racial makeup of the town was 97.3% White, 0.2% African American, 0.2% Native American, 0.2% Asian, 0.2% Pacific Islander, 0.6% from other races, and 1.5% from two or more races. Hispanic or Latino of any race were 2.3% of the population.
The median income for a household in Circleville was $37,500, and the median income for a family was $41,250. The per capita income for the town was $17,845. About 11.2% of families and 13.2% of the population were below the poverty line, including 16.7% of those under age 18 and 8.3% of those age 65 or over.
Education
Circleville is served by the Piute County School District. The town has one elementary school, Circleville Elementary School, which serves students in grades K-6. Students in grades 7-12 attend Piute High School in nearby Junction.
The town is also home to a branch of the College of Eastern Utah, which offers classes in a variety of subjects, including business, education, and nursing.
Conclusion
Circleville is a small town located in Piute County, Utah. It was founded in 1864 by Mormon pioneers and is named after the circular shape of the valley in which it is located. The economy of the town is largely based on agriculture and tourism, and the town is a popular destination for outdoor recreation. The population of Circleville was 514 as of the 2010 census, and the town is served by the Piute County School District. The town is also home to a branch of the College of Eastern Utah.
Common Questions
What is Per Capita Income in Circleville?
Per Capita income in Circleville is $25,154.
What is the Median Family Income in Circleville?
Median Family Income in Circleville is $66,250.
What is the Median Household income in Circleville?
Median Household Income in Circleville is $58,438.
What is Income or Wage Gap in Circleville?
Income or Wage Gap in Circleville is 69.9%.
Women in Circleville earn 30.1 cents for every dollar earned by a man.
What is Family Income Deficit in Circleville?
Family Income Deficit in Circleville is $9,629.
Families that are below poverty line in Circleville earn $9,629 less on average than the poverty threshold level.
What is Inequality or Gini Index in Circleville?
Inequality or Gini Index in Circleville is 0.38.
What is the Total Population of Circleville?
Total Population of Circleville is 431.
What is the Total Male Population of Circleville?
Total Male Population of Circleville is 196.
What is the Total Female Population of Circleville?
Total Female Population of Circleville is 235.
What is the Ratio of Males per 100 Females in Circleville?
There are 83.40 Males per 100 Females in Circleville.
What is the Ratio of Females per 100 Males in Circleville?
There are 119.90 Females per 100 Males in Circleville.
What is the Median Population Age in Circleville?
Median Population Age in Circleville is 46.8 Years.
What is the Average Family Size in Circleville
Average Family Size in Circleville is 4.1 People.
What is the Average Household Size in Circleville
Average Household Size in Circleville is 3.5 People.
How Large is the Labor Force in Circleville?
There are 173 People in the Labor Forcein in Circleville.
What is the Percentage of People in the Labor Force in Circleville?
47.5% of People are in the Labor Force in Circleville.
What is the Unemployment Rate in Circleville?
Unemployment Rate in Circleville is 8.1%.