Watterson Park, KY Map & Demographics
Watterson Park Map
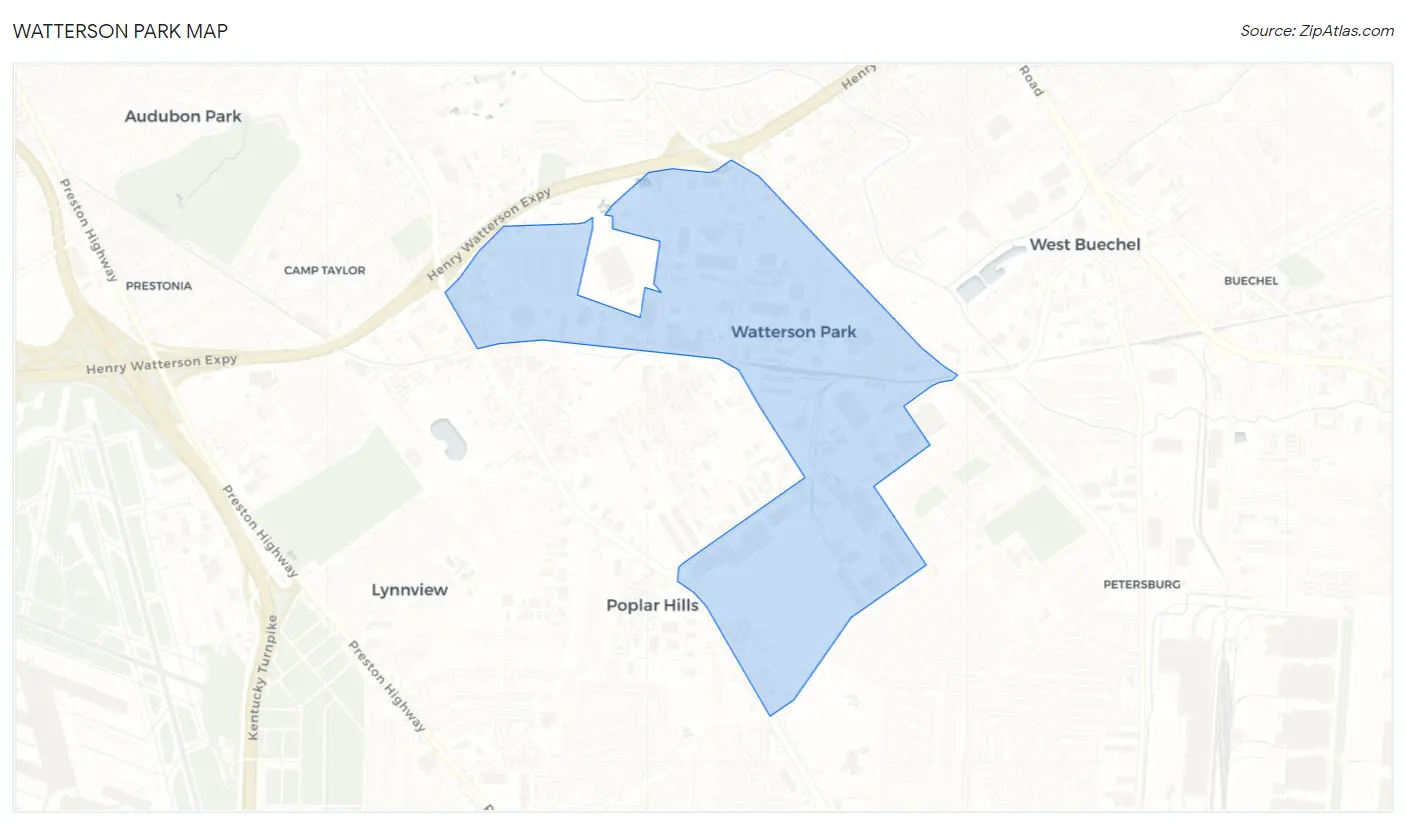
Watterson Park Overview
$24,866
PER CAPITA INCOME
$70,461
AVG FAMILY INCOME
$42,059
AVG HOUSEHOLD INCOME
10.3%
WAGE / INCOME GAP [ % ]
89.7¢/ $1
WAGE / INCOME GAP [ $ ]
0.39
INEQUALITY / GINI INDEX
807
TOTAL POPULATION
483
MALE POPULATION
324
FEMALE POPULATION
149.07
MALES / 100 FEMALES
67.08
FEMALES / 100 MALES
40.3
MEDIAN AGE
3.2
AVG FAMILY SIZE
2.0
AVG HOUSEHOLD SIZE
388
LABOR FORCE [ PEOPLE ]
61.3%
PERCENT IN LABOR FORCE
5.7%
UNEMPLOYMENT RATE
Watterson Park Area Codes
Income in Watterson Park
Income Overview in Watterson Park
Per Capita Income in Watterson Park is $24,866, while median incomes of families and households are $70,461 and $42,059 respectively.
| Characteristic | Number | Measure |
| Per Capita Income | 807 | $24,866 |
| Median Family Income | 173 | $70,461 |
| Mean Family Income | 173 | $70,321 |
| Median Household Income | 398 | $42,059 |
| Mean Household Income | 398 | $49,850 |
| Income Deficit | 173 | $0 |
| Wage / Income Gap (%) | 807 | 10.31% |
| Wage / Income Gap ($) | 807 | 89.69¢ per $1 |
| Gini / Inequality Index | 807 | 0.39 |
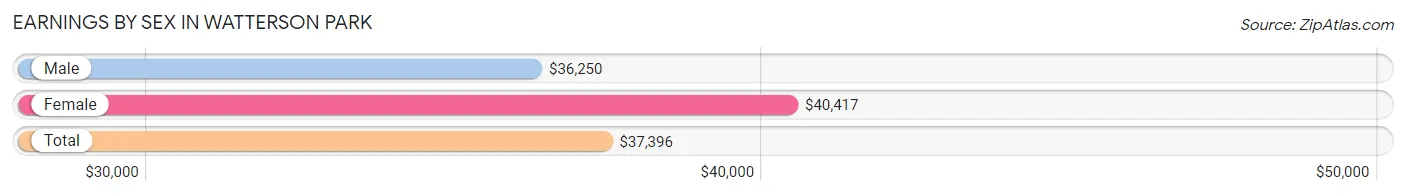
Earnings by Sex in Watterson Park
Average Earnings in Watterson Park are $37,396, $36,250 for men and $40,417 for women, a difference of 10.3%.
| Sex | Number | Average Earnings |
| Male | 248 (62.5%) | $36,250 |
| Female | 149 (37.5%) | $40,417 |
| Total | 397 (100.0%) | $37,396 |
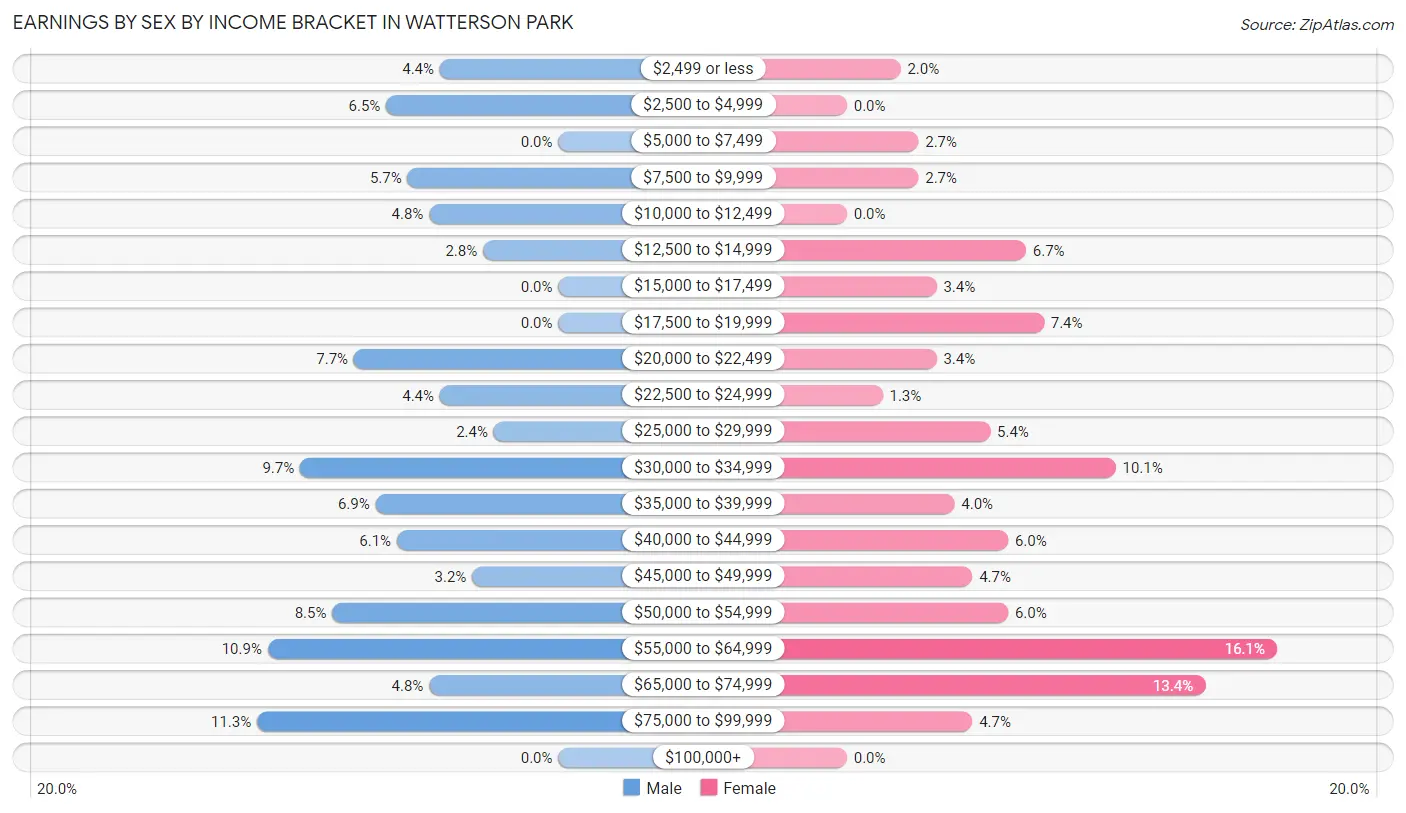
Earnings by Sex by Income Bracket in Watterson Park
The most common earnings brackets in Watterson Park are $75,000 to $99,999 for men (28 | 11.3%) and $55,000 to $64,999 for women (24 | 16.1%).
| Income | Male | Female |
| $2,499 or less | 11 (4.4%) | 3 (2.0%) |
| $2,500 to $4,999 | 16 (6.5%) | 0 (0.0%) |
| $5,000 to $7,499 | 0 (0.0%) | 4 (2.7%) |
| $7,500 to $9,999 | 14 (5.7%) | 4 (2.7%) |
| $10,000 to $12,499 | 12 (4.8%) | 0 (0.0%) |
| $12,500 to $14,999 | 7 (2.8%) | 10 (6.7%) |
| $15,000 to $17,499 | 0 (0.0%) | 5 (3.4%) |
| $17,500 to $19,999 | 0 (0.0%) | 11 (7.4%) |
| $20,000 to $22,499 | 19 (7.7%) | 5 (3.4%) |
| $22,500 to $24,999 | 11 (4.4%) | 2 (1.3%) |
| $25,000 to $29,999 | 6 (2.4%) | 8 (5.4%) |
| $30,000 to $34,999 | 24 (9.7%) | 15 (10.1%) |
| $35,000 to $39,999 | 17 (6.9%) | 6 (4.0%) |
| $40,000 to $44,999 | 15 (6.0%) | 9 (6.0%) |
| $45,000 to $49,999 | 8 (3.2%) | 7 (4.7%) |
| $50,000 to $54,999 | 21 (8.5%) | 9 (6.0%) |
| $55,000 to $64,999 | 27 (10.9%) | 24 (16.1%) |
| $65,000 to $74,999 | 12 (4.8%) | 20 (13.4%) |
| $75,000 to $99,999 | 28 (11.3%) | 7 (4.7%) |
| $100,000+ | 0 (0.0%) | 0 (0.0%) |
| Total | 248 (100.0%) | 149 (100.0%) |
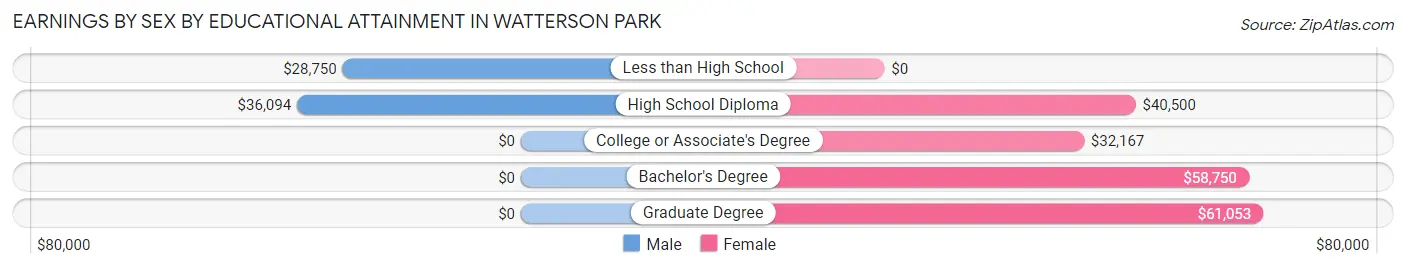
Earnings by Sex by Educational Attainment in Watterson Park
Average earnings in Watterson Park are $36,719 for men and $46,250 for women, a difference of 20.6%. Men with an educational attainment of high school diploma enjoy the highest average annual earnings of $36,094, while those with less than high school education earn the least with $28,750. Women with an educational attainment of graduate degree earn the most with the average annual earnings of $61,053, while those with college or associate's degree education have the smallest earnings of $32,167.
| Educational Attainment | Male Income | Female Income |
| Less than High School | $28,750 | $0 |
| High School Diploma | $36,094 | $40,500 |
| College or Associate's Degree | - | - |
| Bachelor's Degree | - | - |
| Graduate Degree | - | - |
| Total | $36,719 | $46,250 |
Family Income in Watterson Park
Family Income Brackets in Watterson Park
According to the Watterson Park family income data, there are 54 families falling into the $50,000 to $74,999 income range, which is the most common income bracket and makes up 31.2% of all families.
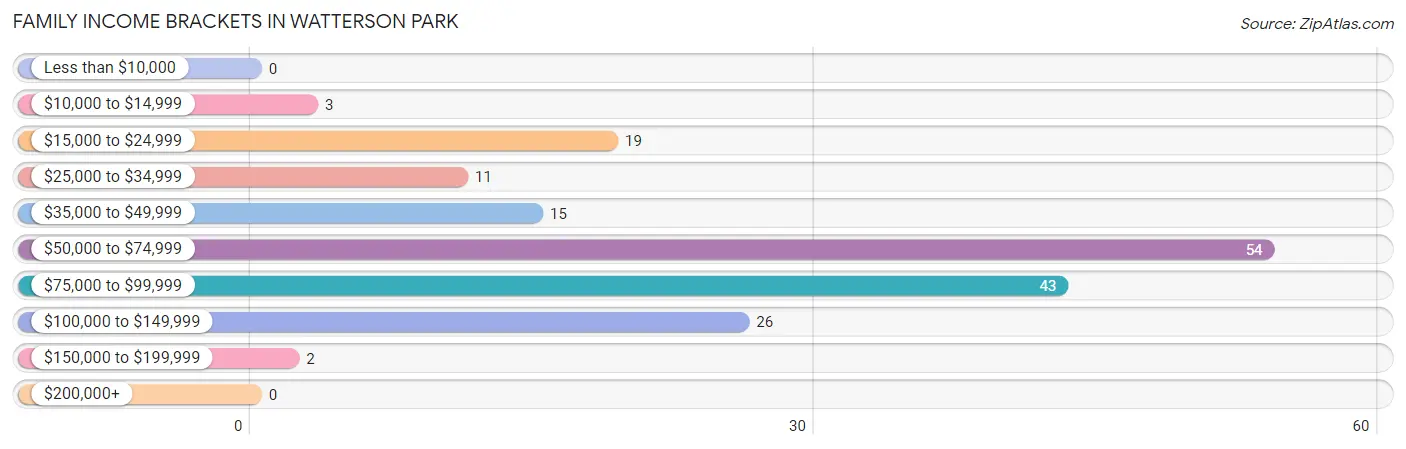
| Income Bracket | # Families | % Families |
| Less than $10,000 | 0 | 0.0% |
| $10,000 to $14,999 | 3 | 1.7% |
| $15,000 to $24,999 | 19 | 11.0% |
| $25,000 to $34,999 | 11 | 6.4% |
| $35,000 to $49,999 | 15 | 8.7% |
| $50,000 to $74,999 | 54 | 31.2% |
| $75,000 to $99,999 | 43 | 24.9% |
| $100,000 to $149,999 | 26 | 15.0% |
| $150,000 to $199,999 | 2 | 1.2% |
| $200,000+ | 0 | 0.0% |
Family Income by Famaliy Size in Watterson Park
4-person families (22 | 12.7%) account for the highest median family income in Watterson Park with $96,250 per family, while 2-person families (90 | 52.0%) have the highest median income of $36,875 per family member.
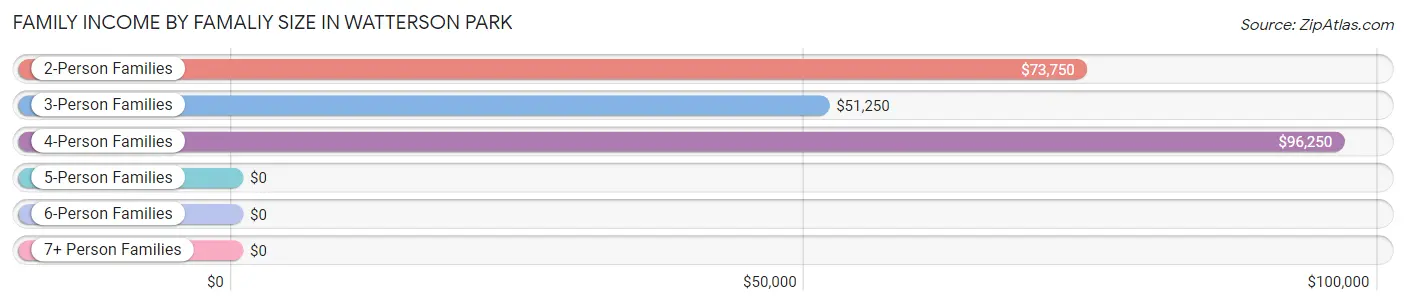
| Income Bracket | # Families | Median Income |
| 2-Person Families | 90 (52.0%) | $73,750 |
| 3-Person Families | 46 (26.6%) | $51,250 |
| 4-Person Families | 22 (12.7%) | $96,250 |
| 5-Person Families | 11 (6.4%) | $0 |
| 6-Person Families | 2 (1.2%) | $0 |
| 7+ Person Families | 2 (1.2%) | $0 |
| Total | 173 (100.0%) | $70,461 |
Family Income by Number of Earners in Watterson Park
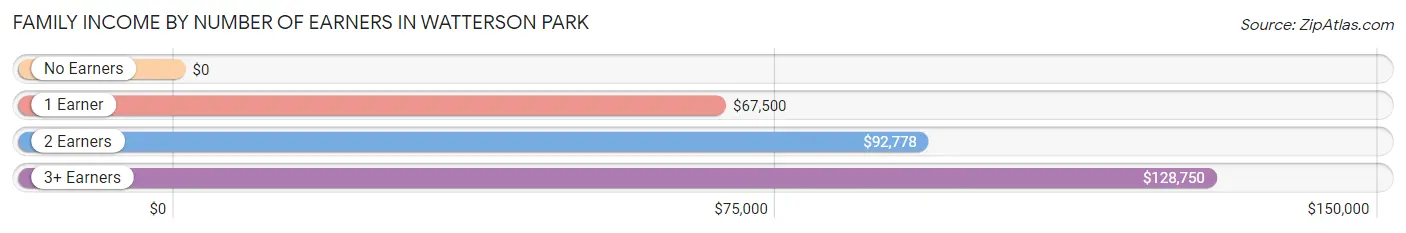
| Number of Earners | # Families | Median Income |
| No Earners | 13 (7.5%) | $0 |
| 1 Earner | 84 (48.5%) | $67,500 |
| 2 Earners | 70 (40.5%) | $92,778 |
| 3+ Earners | 6 (3.5%) | $128,750 |
| Total | 173 (100.0%) | $70,461 |
Household Income in Watterson Park
Household Income Brackets in Watterson Park
With 83 households falling in the category, the $50,000 to $74,999 income range is the most frequent in Watterson Park, accounting for 20.8% of all households.
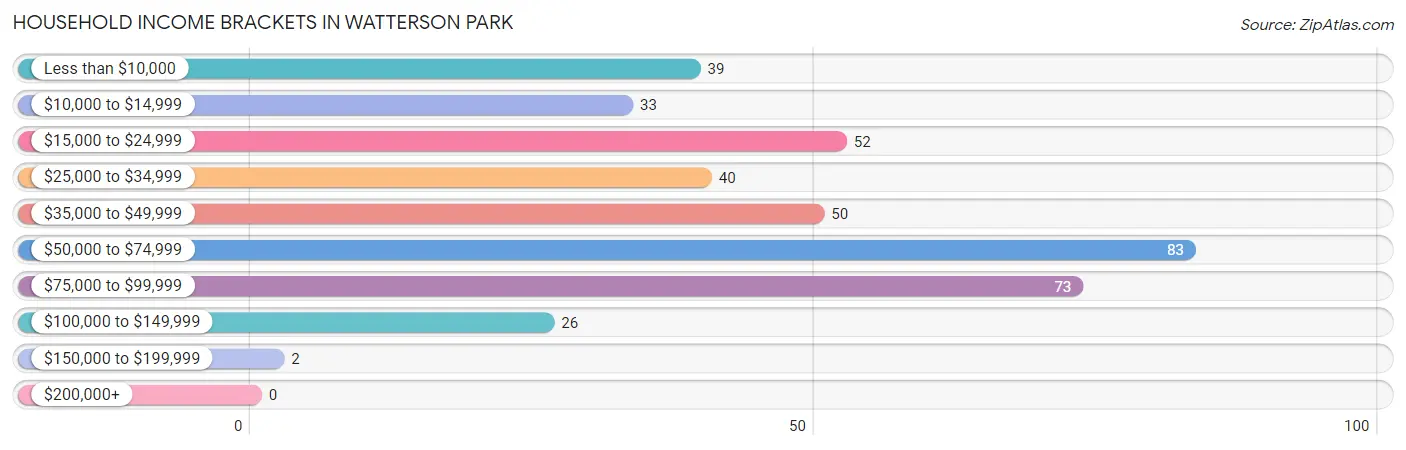
| Income Bracket | # Households | % Households |
| Less than $10,000 | 39 | 9.8% |
| $10,000 to $14,999 | 33 | 8.3% |
| $15,000 to $24,999 | 52 | 13.1% |
| $25,000 to $34,999 | 40 | 10.1% |
| $35,000 to $49,999 | 50 | 12.6% |
| $50,000 to $74,999 | 83 | 20.9% |
| $75,000 to $99,999 | 73 | 18.3% |
| $100,000 to $149,999 | 26 | 6.5% |
| $150,000 to $199,999 | 2 | 0.5% |
| $200,000+ | 0 | 0.0% |
Household Income by Householder Age in Watterson Park
The median household income in Watterson Park is $42,059, with the highest median household income of $63,125 found in the 25 to 44 years age bracket for the primary householder. A total of 116 households (29.1%) fall into this category.
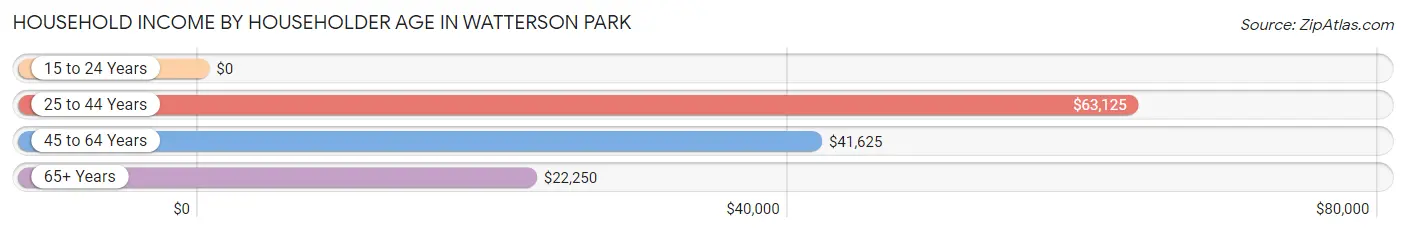
| Income Bracket | # Households | Median Income |
| 15 to 24 Years | 0 (0.0%) | $0 |
| 25 to 44 Years | 116 (29.1%) | $63,125 |
| 45 to 64 Years | 221 (55.5%) | $41,625 |
| 65+ Years | 61 (15.3%) | $22,250 |
| Total | 398 (100.0%) | $42,059 |
Poverty in Watterson Park
Income Below Poverty by Sex and Age in Watterson Park
With 18.6% poverty level for males and 21.3% for females among the residents of Watterson Park, 65 to 74 year old males and 12 to 14 year old females are the most vulnerable to poverty, with 15 males (48.4%) and 18 females (75.0%) in their respective age groups living below the poverty level.
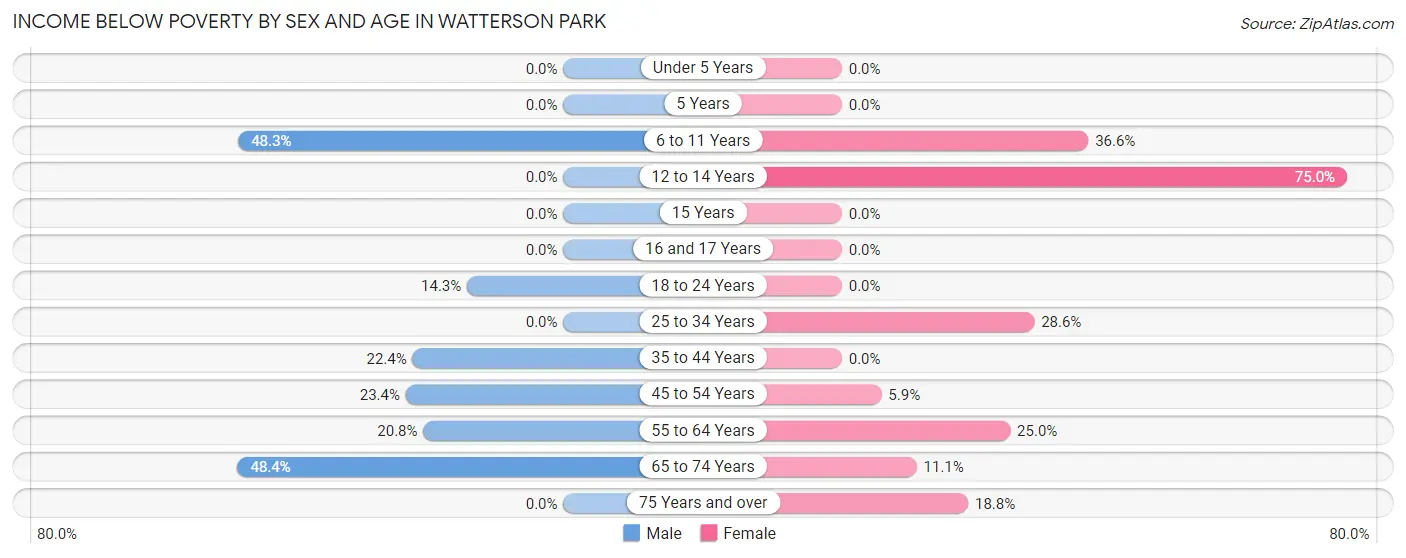
| Age Bracket | Male | Female |
| Under 5 Years | 0 (0.0%) | 0 (0.0%) |
| 5 Years | 0 (0.0%) | 0 (0.0%) |
| 6 to 11 Years | 14 (48.3%) | 15 (36.6%) |
| 12 to 14 Years | 0 (0.0%) | 18 (75.0%) |
| 15 Years | 0 (0.0%) | 0 (0.0%) |
| 16 and 17 Years | 0 (0.0%) | 0 (0.0%) |
| 18 to 24 Years | 3 (14.3%) | 0 (0.0%) |
| 25 to 34 Years | 0 (0.0%) | 12 (28.6%) |
| 35 to 44 Years | 15 (22.4%) | 0 (0.0%) |
| 45 to 54 Years | 22 (23.4%) | 2 (5.9%) |
| 55 to 64 Years | 21 (20.8%) | 16 (25.0%) |
| 65 to 74 Years | 15 (48.4%) | 3 (11.1%) |
| 75 Years and over | 0 (0.0%) | 3 (18.8%) |
| Total | 90 (18.6%) | 69 (21.3%) |
Income Above Poverty by Sex and Age in Watterson Park
According to the poverty statistics in Watterson Park, males aged under 5 years and females aged under 5 years are the age groups that are most secure financially, with 100.0% of males and 100.0% of females in these age groups living above the poverty line.
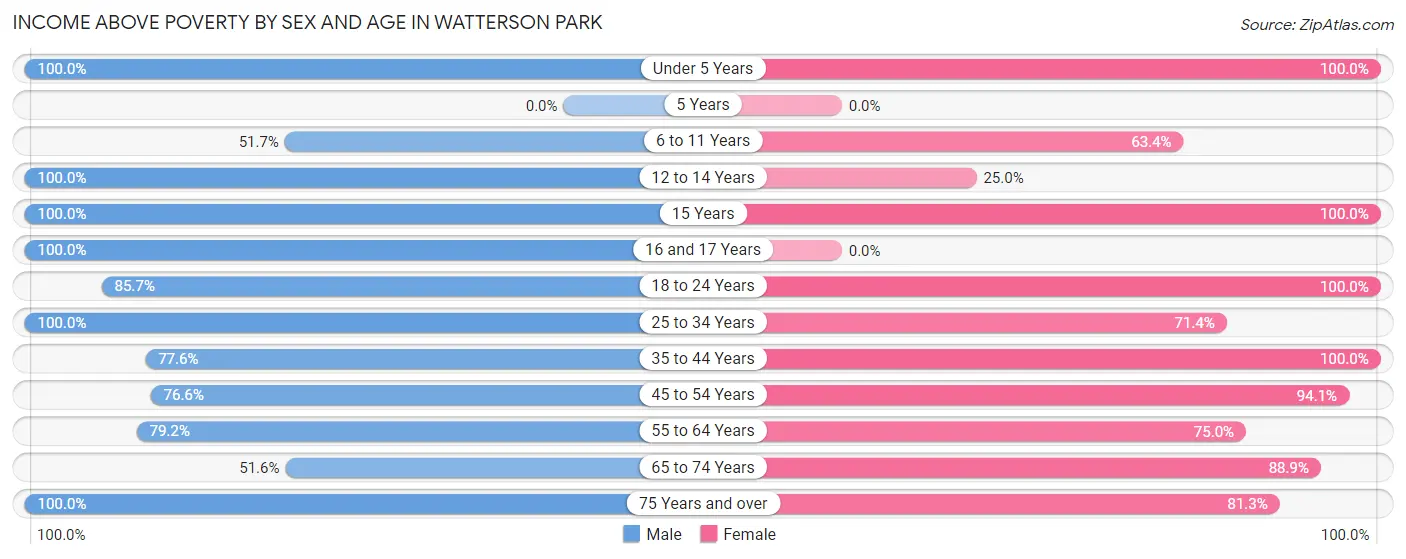
| Age Bracket | Male | Female |
| Under 5 Years | 55 (100.0%) | 15 (100.0%) |
| 5 Years | 0 (0.0%) | 0 (0.0%) |
| 6 to 11 Years | 15 (51.7%) | 26 (63.4%) |
| 12 to 14 Years | 3 (100.0%) | 6 (25.0%) |
| 15 Years | 3 (100.0%) | 4 (100.0%) |
| 16 and 17 Years | 19 (100.0%) | 0 (0.0%) |
| 18 to 24 Years | 18 (85.7%) | 17 (100.0%) |
| 25 to 34 Years | 52 (100.0%) | 30 (71.4%) |
| 35 to 44 Years | 52 (77.6%) | 40 (100.0%) |
| 45 to 54 Years | 72 (76.6%) | 32 (94.1%) |
| 55 to 64 Years | 80 (79.2%) | 48 (75.0%) |
| 65 to 74 Years | 16 (51.6%) | 24 (88.9%) |
| 75 Years and over | 8 (100.0%) | 13 (81.2%) |
| Total | 393 (81.4%) | 255 (78.7%) |
Income Below Poverty Among Married-Couple Families in Watterson Park
The poverty statistics for married-couple families in Watterson Park show that 9.9% or 11 of the total 111 families live below the poverty line. Families with 3 or 4 children have the highest poverty rate of 100.0%, comprising of 11 families. On the other hand, families with no children have the lowest poverty rate of 0.0%, which includes 0 families.
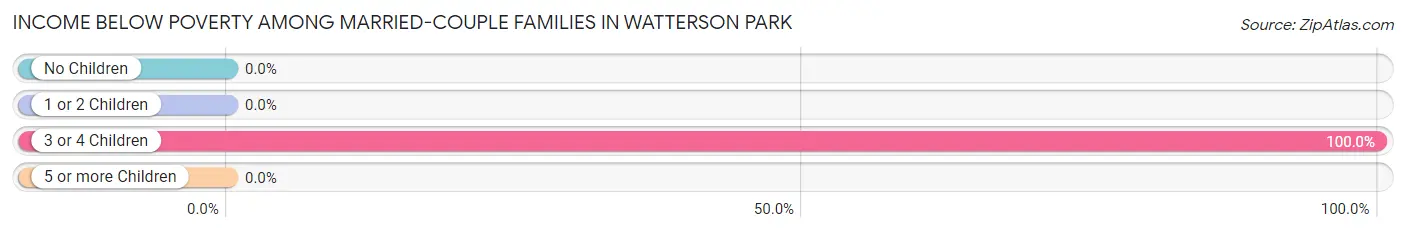
| Children | Above Poverty | Below Poverty |
| No Children | 54 (100.0%) | 0 (0.0%) |
| 1 or 2 Children | 44 (100.0%) | 0 (0.0%) |
| 3 or 4 Children | 0 (0.0%) | 11 (100.0%) |
| 5 or more Children | 2 (100.0%) | 0 (0.0%) |
| Total | 100 (90.1%) | 11 (9.9%) |
Income Below Poverty Among Single-Parent Households in Watterson Park
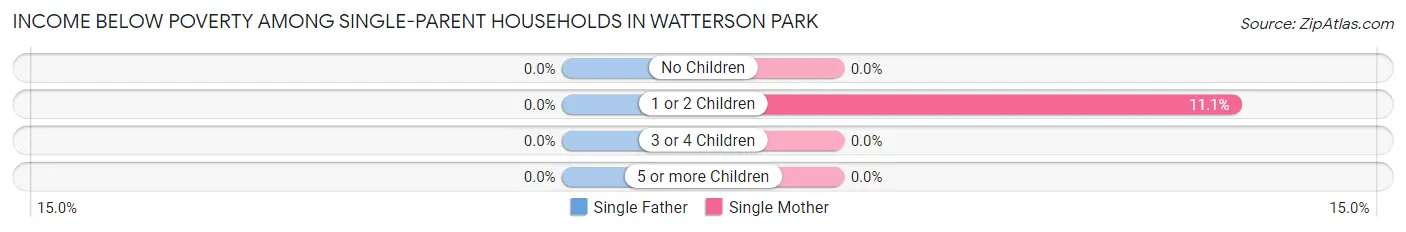
| Children | Single Father | Single Mother |
| No Children | 0 (0.0%) | 0 (0.0%) |
| 1 or 2 Children | 0 (0.0%) | 3 (11.1%) |
| 3 or 4 Children | 0 (0.0%) | 0 (0.0%) |
| 5 or more Children | 0 (0.0%) | 0 (0.0%) |
| Total | 0 (0.0%) | 3 (7.5%) |
Income Below Poverty Among Married-Couple vs Single-Parent Households in Watterson Park
The poverty data for Watterson Park shows that 11 of the married-couple family households (9.9%) and 3 of the single-parent households (4.8%) are living below the poverty level. Within the married-couple family households, those with 3 or 4 children have the highest poverty rate, with 11 households (100.0%) falling below the poverty line. Among the single-parent households, those with 1 or 2 children have the highest poverty rate, with 3 household (11.1%) living below poverty.
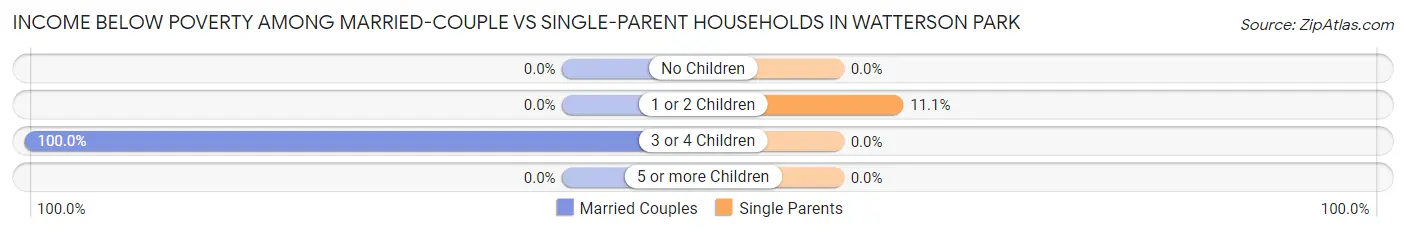
| Children | Married-Couple Families | Single-Parent Households |
| No Children | 0 (0.0%) | 0 (0.0%) |
| 1 or 2 Children | 0 (0.0%) | 3 (11.1%) |
| 3 or 4 Children | 11 (100.0%) | 0 (0.0%) |
| 5 or more Children | 0 (0.0%) | 0 (0.0%) |
| Total | 11 (9.9%) | 3 (4.8%) |
Race in Watterson Park
The most populous races in Watterson Park are White / Caucasian (471 | 58.4%), Black / African American (240 | 29.7%), and Hispanic or Latino (168 | 20.8%).
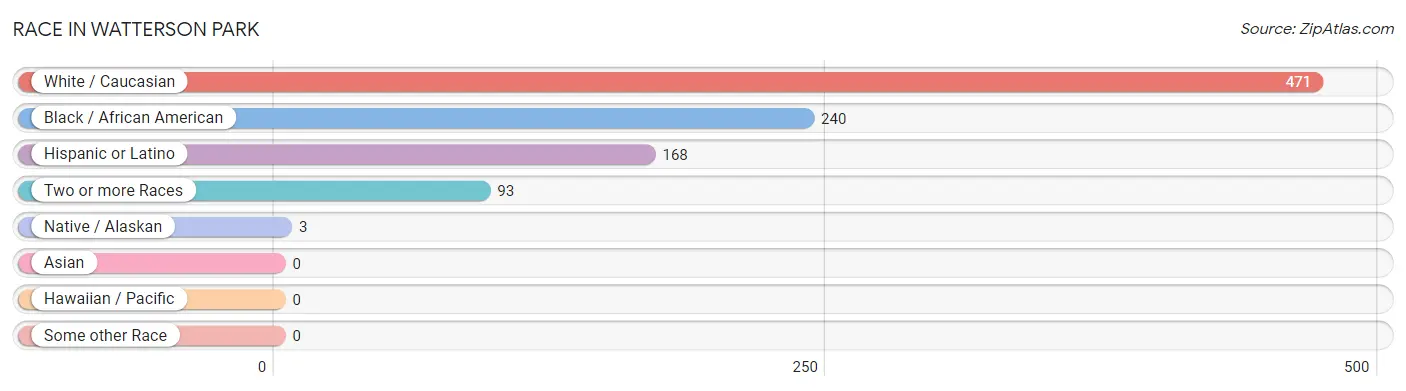
| Race | # Population | % Population |
| Asian | 0 | 0.0% |
| Black / African American | 240 | 29.7% |
| Hawaiian / Pacific | 0 | 0.0% |
| Hispanic or Latino | 168 | 20.8% |
| Native / Alaskan | 3 | 0.4% |
| White / Caucasian | 471 | 58.4% |
| Two or more Races | 93 | 11.5% |
| Some other Race | 0 | 0.0% |
| Total | 807 | 100.0% |
Ancestry in Watterson Park
The most populous ancestries reported in Watterson Park are Mexican (113 | 14.0%), Irish (109 | 13.5%), English (100 | 12.4%), German (68 | 8.4%), and Central American (55 | 6.8%), together accounting for 55.1% of all Watterson Park residents.
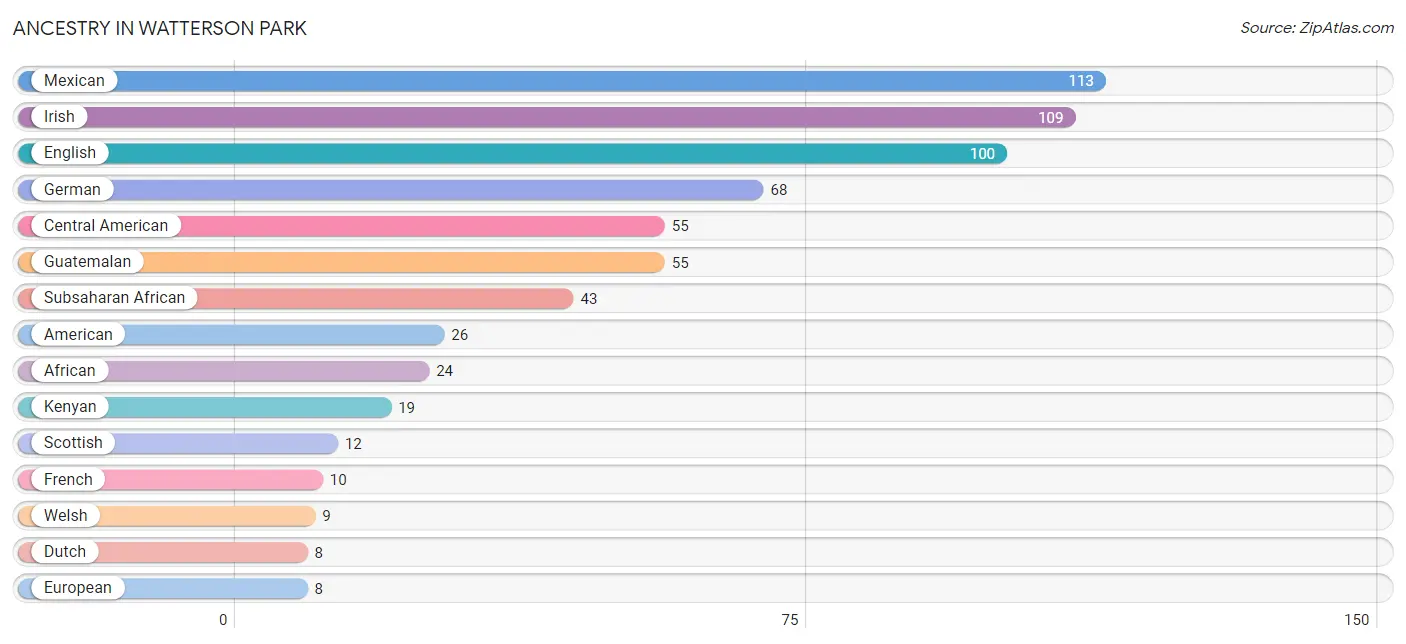
| Ancestry | # Population | % Population |
| African | 24 | 3.0% |
| American | 26 | 3.2% |
| Austrian | 2 | 0.3% |
| Central American | 55 | 6.8% |
| Dutch | 8 | 1.0% |
| English | 100 | 12.4% |
| European | 8 | 1.0% |
| French | 10 | 1.2% |
| German | 68 | 8.4% |
| Guatemalan | 55 | 6.8% |
| Hungarian | 2 | 0.3% |
| Irish | 109 | 13.5% |
| Italian | 6 | 0.7% |
| Kenyan | 19 | 2.4% |
| Mexican | 113 | 14.0% |
| Northern European | 5 | 0.6% |
| Scotch-Irish | 6 | 0.7% |
| Scottish | 12 | 1.5% |
| Subsaharan African | 43 | 5.3% |
| Welsh | 9 | 1.1% |
| Yugoslavian | 8 | 1.0% | View All 21 Rows |
Immigrants in Watterson Park
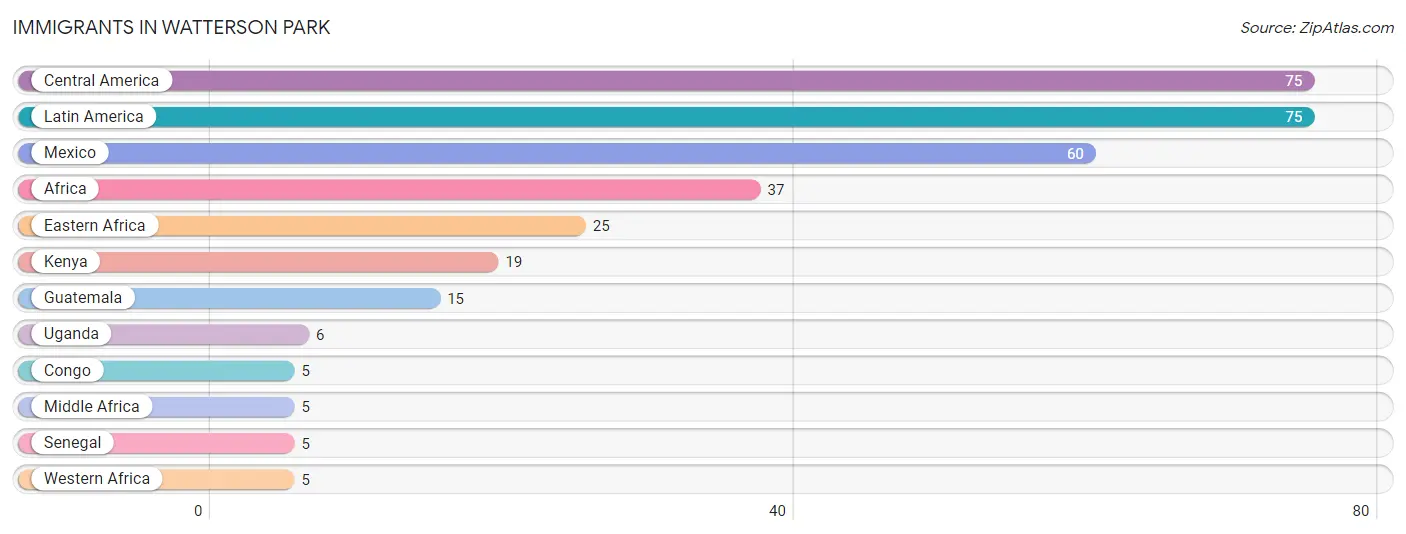
The most numerous immigrant groups reported in Watterson Park came from Central America (75 | 9.3%), Latin America (75 | 9.3%), Mexico (60 | 7.4%), Africa (37 | 4.6%), and Eastern Africa (25 | 3.1%), together accounting for 33.7% of all Watterson Park residents.
| Immigration Origin | # Population | % Population |
| Africa | 37 | 4.6% |
| Central America | 75 | 9.3% |
| Congo | 5 | 0.6% |
| Eastern Africa | 25 | 3.1% |
| Guatemala | 15 | 1.9% |
| Kenya | 19 | 2.4% |
| Latin America | 75 | 9.3% |
| Mexico | 60 | 7.4% |
| Middle Africa | 5 | 0.6% |
| Senegal | 5 | 0.6% |
| Uganda | 6 | 0.7% |
| Western Africa | 5 | 0.6% | View All 12 Rows |
Sex and Age in Watterson Park
Sex and Age in Watterson Park
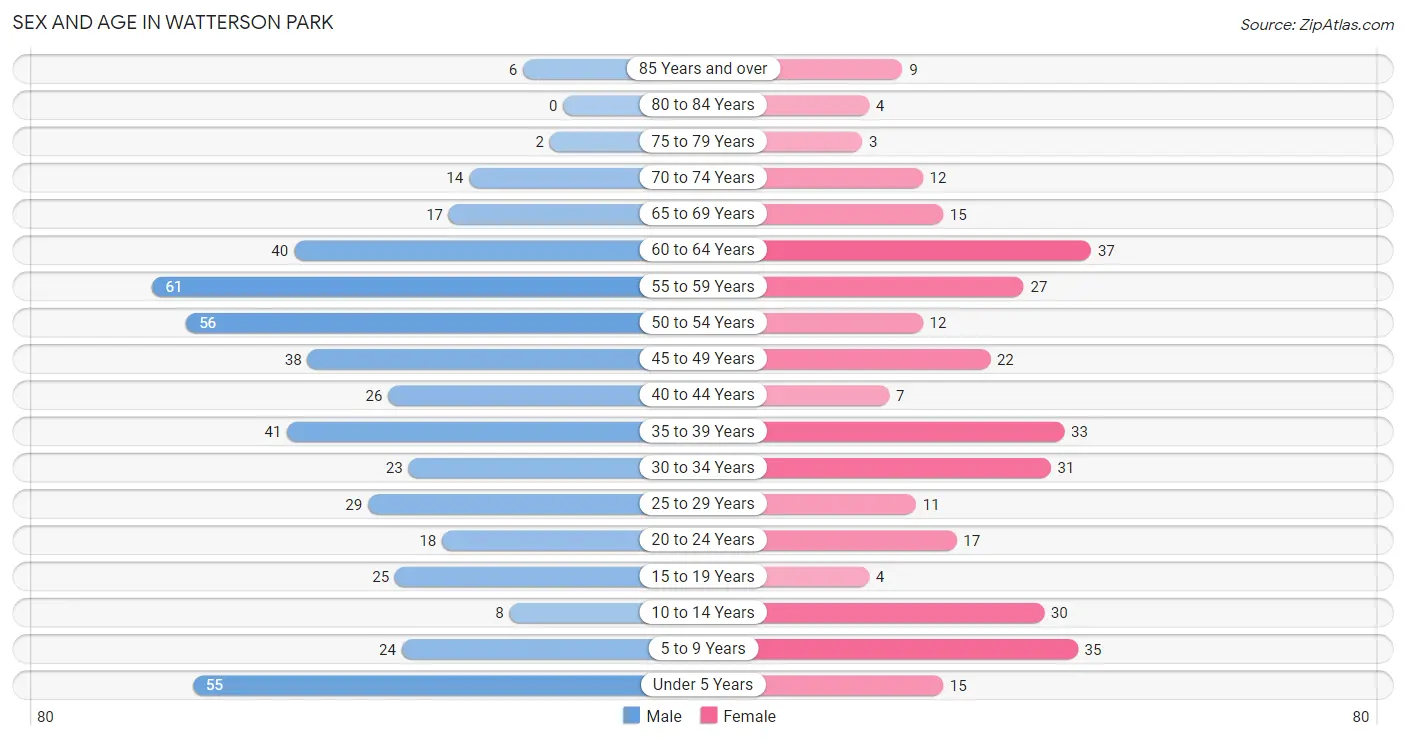
The most populous age groups in Watterson Park are 55 to 59 Years (61 | 12.6%) for men and 60 to 64 Years (37 | 11.4%) for women.
| Age Bracket | Male | Female |
| Under 5 Years | 55 (11.4%) | 15 (4.6%) |
| 5 to 9 Years | 24 (5.0%) | 35 (10.8%) |
| 10 to 14 Years | 8 (1.7%) | 30 (9.3%) |
| 15 to 19 Years | 25 (5.2%) | 4 (1.2%) |
| 20 to 24 Years | 18 (3.7%) | 17 (5.2%) |
| 25 to 29 Years | 29 (6.0%) | 11 (3.4%) |
| 30 to 34 Years | 23 (4.8%) | 31 (9.6%) |
| 35 to 39 Years | 41 (8.5%) | 33 (10.2%) |
| 40 to 44 Years | 26 (5.4%) | 7 (2.2%) |
| 45 to 49 Years | 38 (7.9%) | 22 (6.8%) |
| 50 to 54 Years | 56 (11.6%) | 12 (3.7%) |
| 55 to 59 Years | 61 (12.6%) | 27 (8.3%) |
| 60 to 64 Years | 40 (8.3%) | 37 (11.4%) |
| 65 to 69 Years | 17 (3.5%) | 15 (4.6%) |
| 70 to 74 Years | 14 (2.9%) | 12 (3.7%) |
| 75 to 79 Years | 2 (0.4%) | 3 (0.9%) |
| 80 to 84 Years | 0 (0.0%) | 4 (1.2%) |
| 85 Years and over | 6 (1.2%) | 9 (2.8%) |
| Total | 483 (100.0%) | 324 (100.0%) |
Families and Households in Watterson Park
Median Family Size in Watterson Park
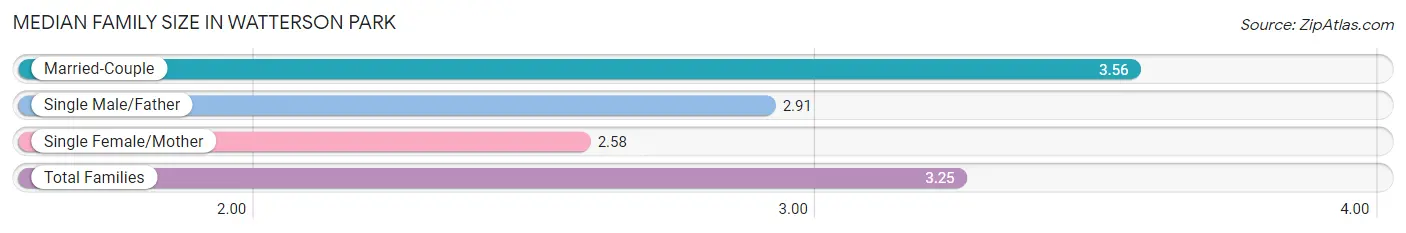
The median family size in Watterson Park is 3.25 persons per family, with married-couple families (111 | 64.2%) accounting for the largest median family size of 3.56 persons per family. On the other hand, single female/mother families (40 | 23.1%) represent the smallest median family size with 2.58 persons per family.
| Family Type | # Families | Family Size |
| Married-Couple | 111 (64.2%) | 3.56 |
| Single Male/Father | 22 (12.7%) | 2.91 |
| Single Female/Mother | 40 (23.1%) | 2.58 |
| Total Families | 173 (100.0%) | 3.25 |
Median Household Size in Watterson Park
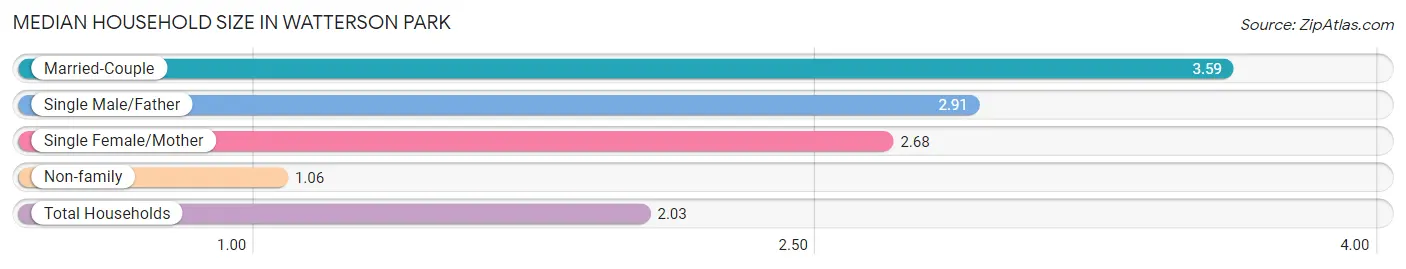
The median household size in Watterson Park is 2.03 persons per household, with married-couple households (111 | 27.9%) accounting for the largest median household size of 3.59 persons per household. non-family households (225 | 56.5%) represent the smallest median household size with 1.06 persons per household.
| Household Type | # Households | Household Size |
| Married-Couple | 111 (27.9%) | 3.59 |
| Single Male/Father | 22 (5.5%) | 2.91 |
| Single Female/Mother | 40 (10.1%) | 2.68 |
| Non-family | 225 (56.5%) | 1.06 |
| Total Households | 398 (100.0%) | 2.03 |
Household Size by Marriage Status in Watterson Park
Out of a total of 398 households in Watterson Park, 173 (43.5%) are family households, while 225 (56.5%) are nonfamily households. The most numerous type of family households are 2-person households, comprising 87, and the most common type of nonfamily households are 1-person households, comprising 211.
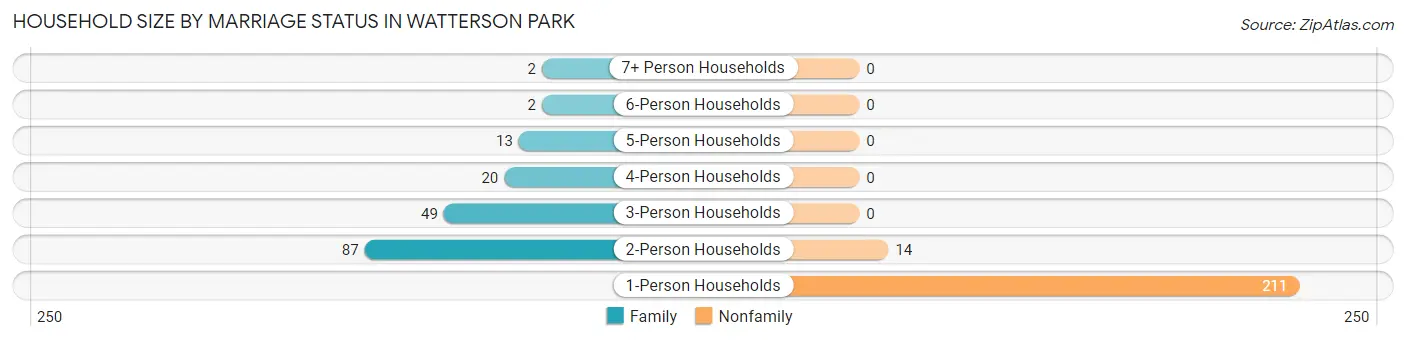
| Household Size | Family Households | Nonfamily Households |
| 1-Person Households | - | 211 (53.0%) |
| 2-Person Households | 87 (21.9%) | 14 (3.5%) |
| 3-Person Households | 49 (12.3%) | 0 (0.0%) |
| 4-Person Households | 20 (5.0%) | 0 (0.0%) |
| 5-Person Households | 13 (3.3%) | 0 (0.0%) |
| 6-Person Households | 2 (0.5%) | 0 (0.0%) |
| 7+ Person Households | 2 (0.5%) | 0 (0.0%) |
| Total | 173 (43.5%) | 225 (56.5%) |
Female Fertility in Watterson Park
Fertility by Age in Watterson Park
| Age Bracket | Women with Births | Births / 1,000 Women |
| 15 to 19 years | 0 (0.0%) | 0.0 |
| 20 to 34 years | 0 (0.0%) | 0.0 |
| 35 to 50 years | 0 (0.0%) | 0.0 |
| Total | 0 (0.0%) | 0.0 |
Fertility by Age by Marriage Status in Watterson Park
| Age Bracket | Married | Unmarried |
| 15 to 19 years | 0 (0.0%) | 0 (0.0%) |
| 20 to 34 years | 0 (0.0%) | 0 (0.0%) |
| 35 to 50 years | 0 (0.0%) | 0 (0.0%) |
| Total | 0 (0.0%) | 0 (0.0%) |
Fertility by Education in Watterson Park
| Educational Attainment | Women with Births | Births / 1,000 Women |
| Less than High School | 0 (0.0%) | 0.0 |
| High School Diploma | 0 (0.0%) | 0.0 |
| College or Associate's Degree | 0 (0.0%) | 0.0 |
| Bachelor's Degree | 0 (0.0%) | 0.0 |
| Graduate Degree | 0 (0.0%) | 0.0 |
| Total | 0 (0.0%) | 0.0 |
Fertility by Education by Marriage Status in Watterson Park
| Educational Attainment | Married | Unmarried |
| Less than High School | 0 (0.0%) | 0 (0.0%) |
| High School Diploma | 0 (0.0%) | 0 (0.0%) |
| College or Associate's Degree | 0 (0.0%) | 0 (0.0%) |
| Bachelor's Degree | 0 (0.0%) | 0 (0.0%) |
| Graduate Degree | 0 (0.0%) | 0 (0.0%) |
| Total | 0 (0.0%) | 0 (0.0%) |
Employment Characteristics in Watterson Park
Employment by Class of Employer in Watterson Park
Among the 357 employed individuals in Watterson Park, private company employees (272 | 76.2%), local government employees (26 | 7.3%), and self-employed (not incorporated) (23 | 6.4%) make up the most common classes of employment.
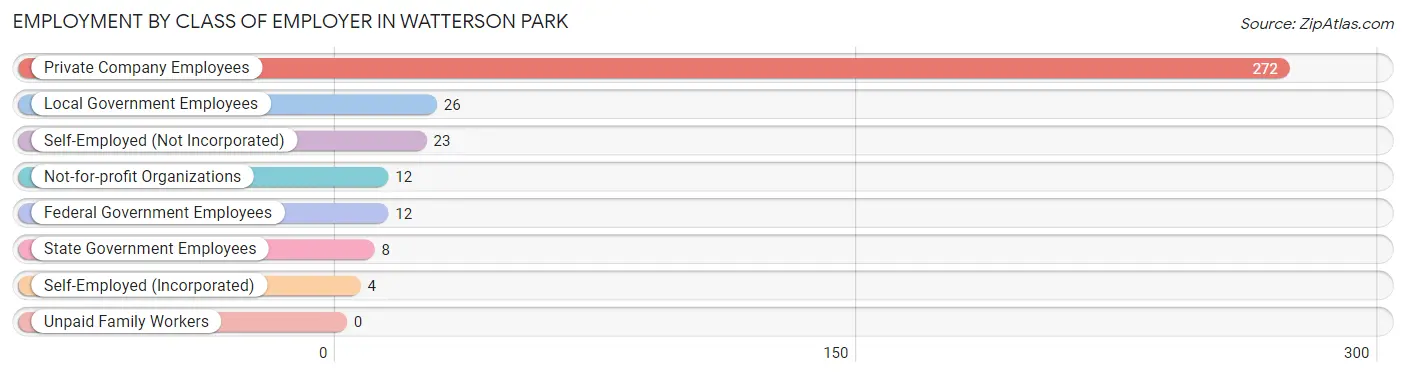
| Employer Class | # Employees | % Employees |
| Private Company Employees | 272 | 76.2% |
| Self-Employed (Incorporated) | 4 | 1.1% |
| Self-Employed (Not Incorporated) | 23 | 6.4% |
| Not-for-profit Organizations | 12 | 3.4% |
| Local Government Employees | 26 | 7.3% |
| State Government Employees | 8 | 2.2% |
| Federal Government Employees | 12 | 3.4% |
| Unpaid Family Workers | 0 | 0.0% |
| Total | 357 | 100.0% |
Employment Status by Age in Watterson Park
According to the labor force statistics for Watterson Park, out of the total population over 16 years of age (633), 61.3% or 388 individuals are in the labor force, with 5.7% or 22 of them unemployed. The age group with the highest labor force participation rate is 35 to 44 years, with 98.1% or 105 individuals in the labor force. Within the labor force, the 16 to 19 years age range has the highest percentage of unemployed individuals, with 100.0% or 5 of them being unemployed.
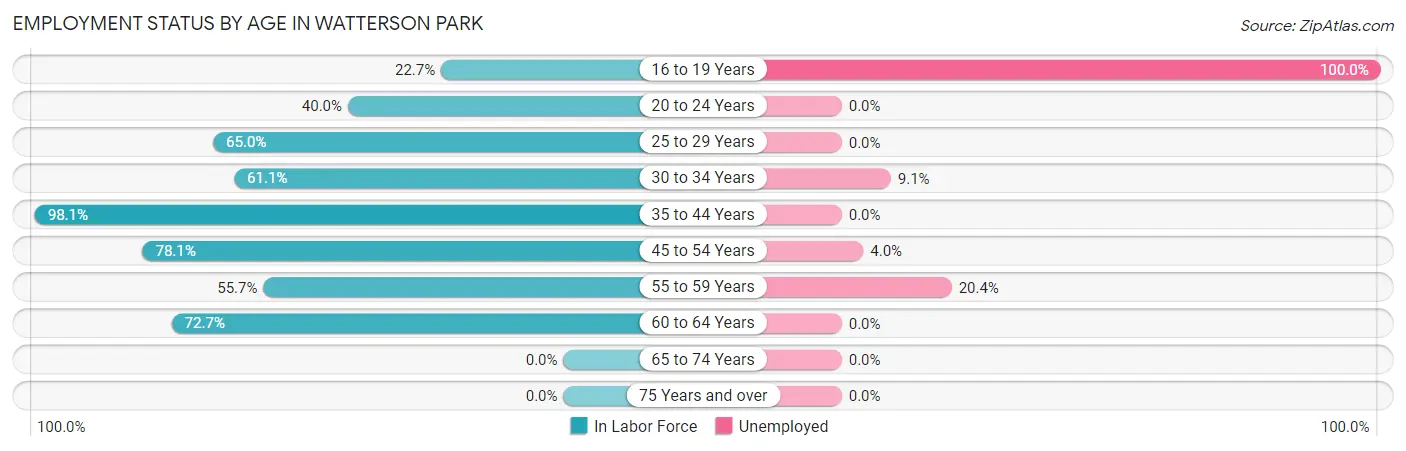
| Age Bracket | In Labor Force | Unemployed |
| 16 to 19 Years | 5 (22.7%) | 5 (100.0%) |
| 20 to 24 Years | 14 (40.0%) | 0 (0.0%) |
| 25 to 29 Years | 26 (65.0%) | 0 (0.0%) |
| 30 to 34 Years | 33 (61.1%) | 3 (9.1%) |
| 35 to 44 Years | 105 (98.1%) | 0 (0.0%) |
| 45 to 54 Years | 100 (78.1%) | 4 (4.0%) |
| 55 to 59 Years | 49 (55.7%) | 10 (20.4%) |
| 60 to 64 Years | 56 (72.7%) | 0 (0.0%) |
| 65 to 74 Years | 0 (0.0%) | 0 (0.0%) |
| 75 Years and over | 0 (0.0%) | 0 (0.0%) |
| Total | 388 (61.3%) | 22 (5.7%) |
Employment Status by Educational Attainment in Watterson Park
According to labor force statistics for Watterson Park, 74.7% of individuals (369) out of the total population between 25 and 64 years of age (494) are in the labor force, with 4.6% or 17 of them being unemployed. The group with the highest labor force participation rate are those with the educational attainment of bachelor's degree or higher, with 97.4% or 112 individuals in the labor force. Within the labor force, individuals with bachelor's degree or higher education have the highest percentage of unemployment, with 11.6% or 13 of them being unemployed.
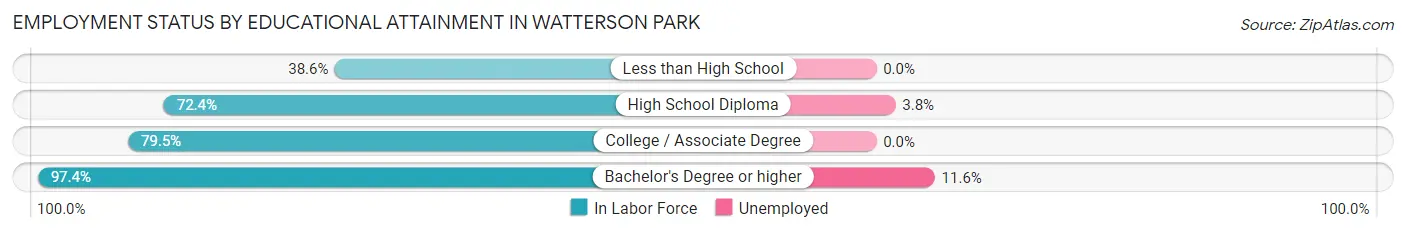
| Educational Attainment | In Labor Force | Unemployed |
| Less than High School | 32 (38.6%) | 0 (0.0%) |
| High School Diploma | 105 (72.4%) | 6 (3.8%) |
| College / Associate Degree | 120 (79.5%) | 0 (0.0%) |
| Bachelor's Degree or higher | 112 (97.4%) | 13 (11.6%) |
| Total | 369 (74.7%) | 23 (4.6%) |
Employment Occupations by Sex in Watterson Park
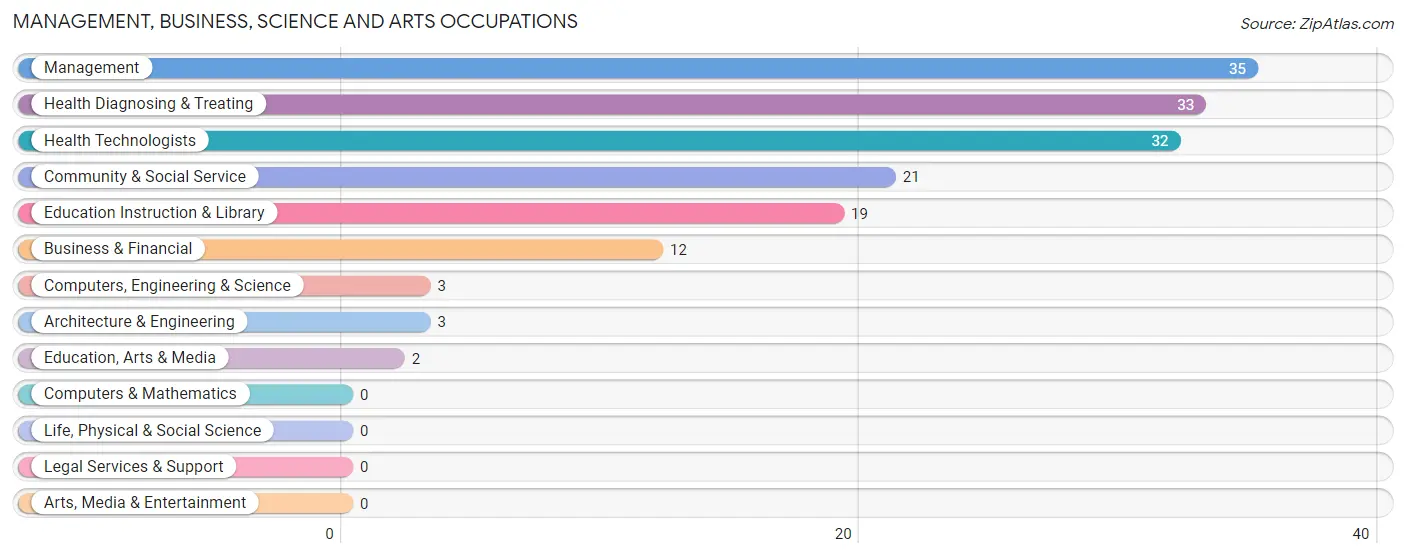
Management, Business, Science and Arts Occupations
The most common Management, Business, Science and Arts occupations in Watterson Park are Management (35 | 9.6%), Health Diagnosing & Treating (33 | 9.0%), Health Technologists (32 | 8.7%), Community & Social Service (21 | 5.7%), and Education Instruction & Library (19 | 5.2%).
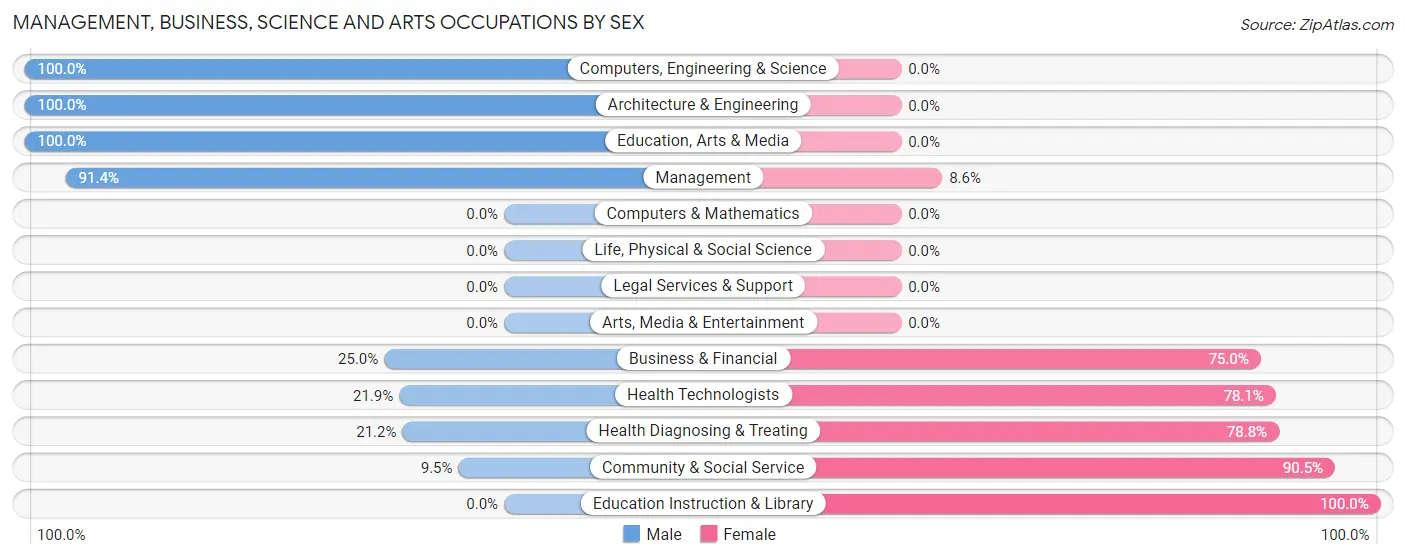
Management, Business, Science and Arts Occupations by Sex
Within the Management, Business, Science and Arts occupations in Watterson Park, the most male-oriented occupations are Computers, Engineering & Science (100.0%), Architecture & Engineering (100.0%), and Education, Arts & Media (100.0%), while the most female-oriented occupations are Education Instruction & Library (100.0%), Community & Social Service (90.5%), and Health Diagnosing & Treating (78.8%).
| Occupation | Male | Female |
| Management | 32 (91.4%) | 3 (8.6%) |
| Business & Financial | 3 (25.0%) | 9 (75.0%) |
| Computers, Engineering & Science | 3 (100.0%) | 0 (0.0%) |
| Computers & Mathematics | 0 (0.0%) | 0 (0.0%) |
| Architecture & Engineering | 3 (100.0%) | 0 (0.0%) |
| Life, Physical & Social Science | 0 (0.0%) | 0 (0.0%) |
| Community & Social Service | 2 (9.5%) | 19 (90.5%) |
| Education, Arts & Media | 2 (100.0%) | 0 (0.0%) |
| Legal Services & Support | 0 (0.0%) | 0 (0.0%) |
| Education Instruction & Library | 0 (0.0%) | 19 (100.0%) |
| Arts, Media & Entertainment | 0 (0.0%) | 0 (0.0%) |
| Health Diagnosing & Treating | 7 (21.2%) | 26 (78.8%) |
| Health Technologists | 7 (21.9%) | 25 (78.1%) |
| Total (Category) | 47 (45.2%) | 57 (54.8%) |
| Total (Overall) | 223 (60.9%) | 143 (39.1%) |
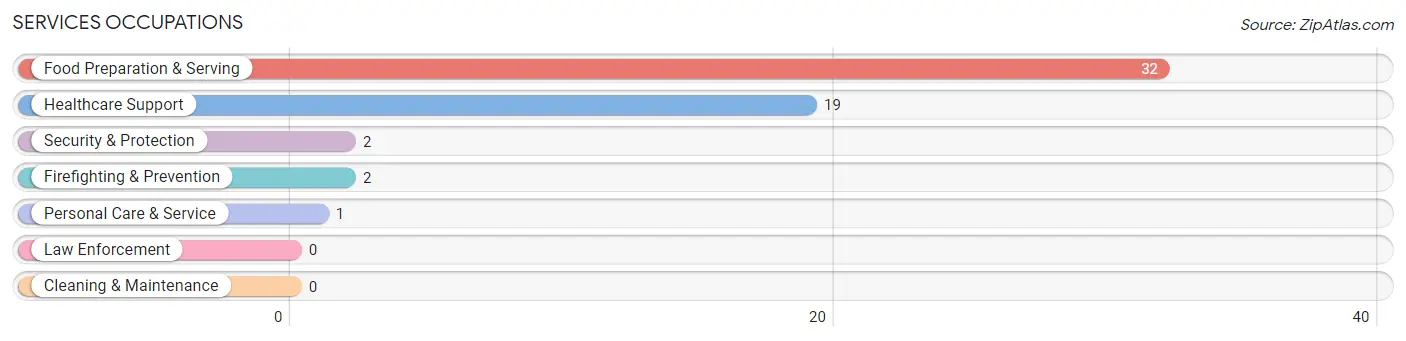
Services Occupations
The most common Services occupations in Watterson Park are Food Preparation & Serving (32 | 8.7%), Healthcare Support (19 | 5.2%), Security & Protection (2 | 0.5%), Firefighting & Prevention (2 | 0.5%), and Personal Care & Service (1 | 0.3%).
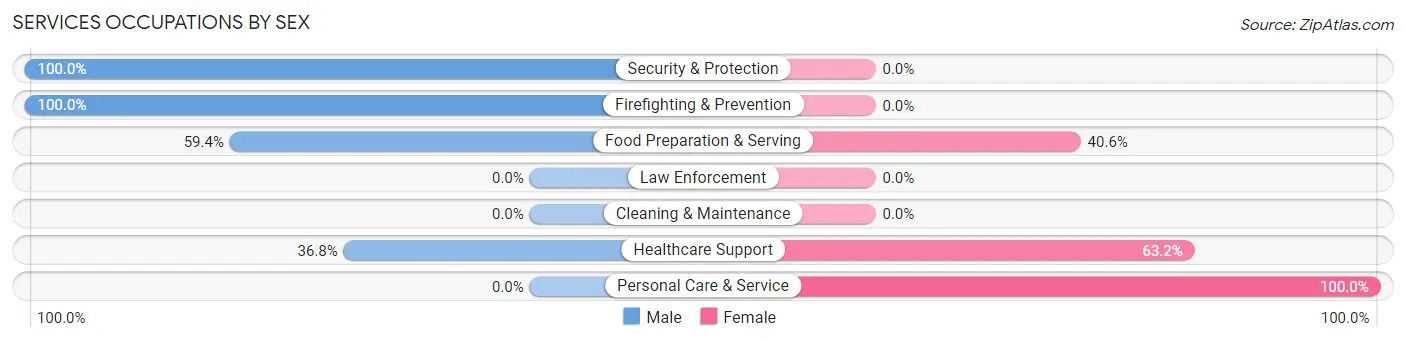
Services Occupations by Sex
Within the Services occupations in Watterson Park, the most male-oriented occupations are Security & Protection (100.0%), Firefighting & Prevention (100.0%), and Food Preparation & Serving (59.4%), while the most female-oriented occupations are Personal Care & Service (100.0%), Healthcare Support (63.2%), and Food Preparation & Serving (40.6%).
| Occupation | Male | Female |
| Healthcare Support | 7 (36.8%) | 12 (63.2%) |
| Security & Protection | 2 (100.0%) | 0 (0.0%) |
| Firefighting & Prevention | 2 (100.0%) | 0 (0.0%) |
| Law Enforcement | 0 (0.0%) | 0 (0.0%) |
| Food Preparation & Serving | 19 (59.4%) | 13 (40.6%) |
| Cleaning & Maintenance | 0 (0.0%) | 0 (0.0%) |
| Personal Care & Service | 0 (0.0%) | 1 (100.0%) |
| Total (Category) | 28 (51.8%) | 26 (48.1%) |
| Total (Overall) | 223 (60.9%) | 143 (39.1%) |
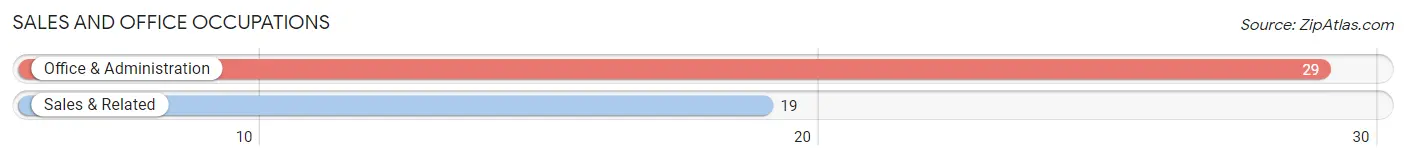
Sales and Office Occupations
The most common Sales and Office occupations in Watterson Park are Office & Administration (29 | 7.9%), and Sales & Related (19 | 5.2%).
Sales and Office Occupations by Sex
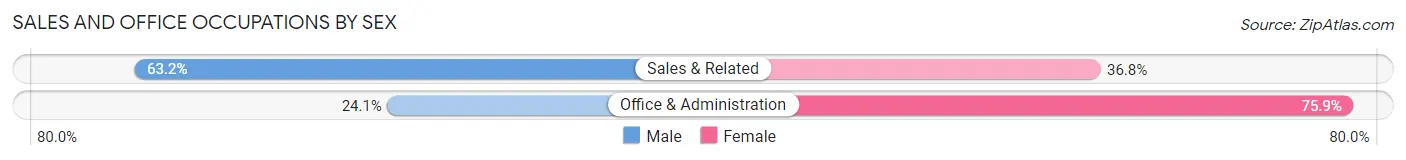
| Occupation | Male | Female |
| Sales & Related | 12 (63.2%) | 7 (36.8%) |
| Office & Administration | 7 (24.1%) | 22 (75.9%) |
| Total (Category) | 19 (39.6%) | 29 (60.4%) |
| Total (Overall) | 223 (60.9%) | 143 (39.1%) |
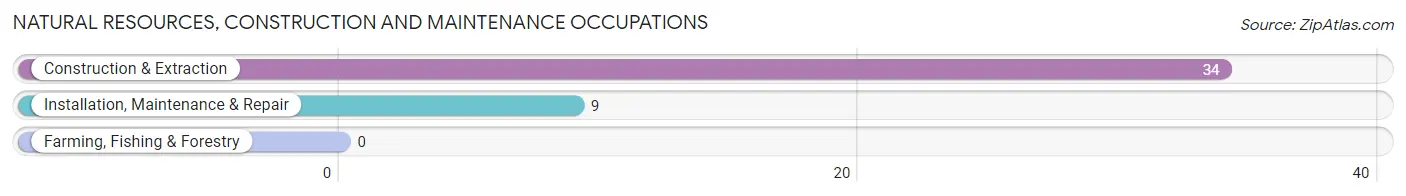
Natural Resources, Construction and Maintenance Occupations
The most common Natural Resources, Construction and Maintenance occupations in Watterson Park are Construction & Extraction (34 | 9.3%), and Installation, Maintenance & Repair (9 | 2.5%).
Natural Resources, Construction and Maintenance Occupations by Sex
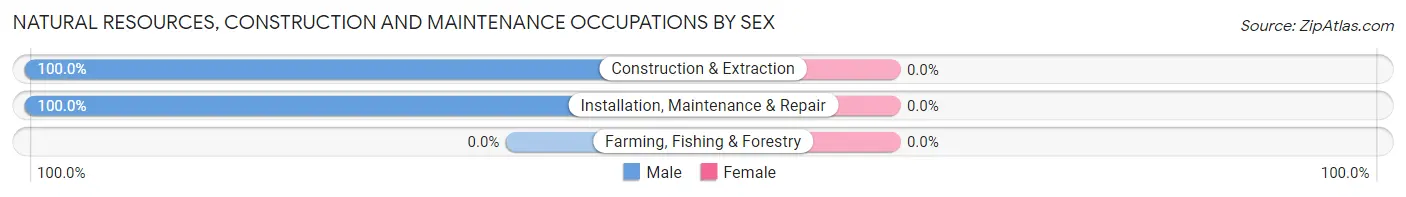
| Occupation | Male | Female |
| Farming, Fishing & Forestry | 0 (0.0%) | 0 (0.0%) |
| Construction & Extraction | 34 (100.0%) | 0 (0.0%) |
| Installation, Maintenance & Repair | 9 (100.0%) | 0 (0.0%) |
| Total (Category) | 43 (100.0%) | 0 (0.0%) |
| Total (Overall) | 223 (60.9%) | 143 (39.1%) |
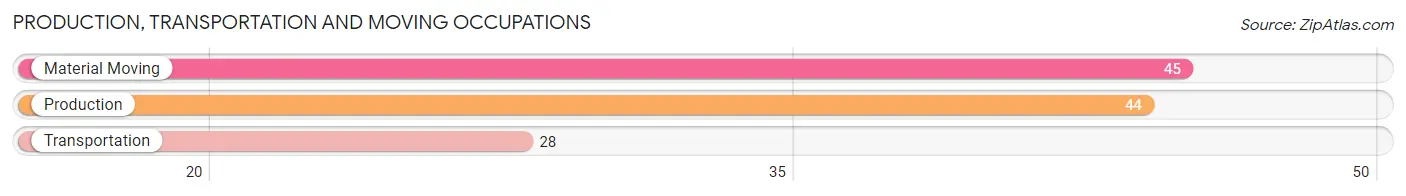
Production, Transportation and Moving Occupations
The most common Production, Transportation and Moving occupations in Watterson Park are Material Moving (45 | 12.3%), Production (44 | 12.0%), and Transportation (28 | 7.6%).
Production, Transportation and Moving Occupations by Sex
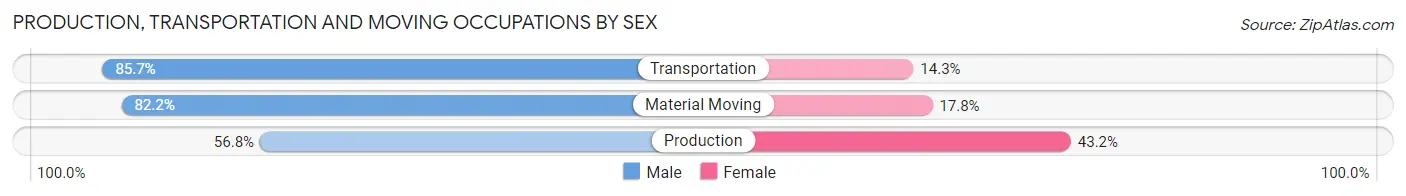
| Occupation | Male | Female |
| Production | 25 (56.8%) | 19 (43.2%) |
| Transportation | 24 (85.7%) | 4 (14.3%) |
| Material Moving | 37 (82.2%) | 8 (17.8%) |
| Total (Category) | 86 (73.5%) | 31 (26.5%) |
| Total (Overall) | 223 (60.9%) | 143 (39.1%) |
Employment Industries by Sex in Watterson Park
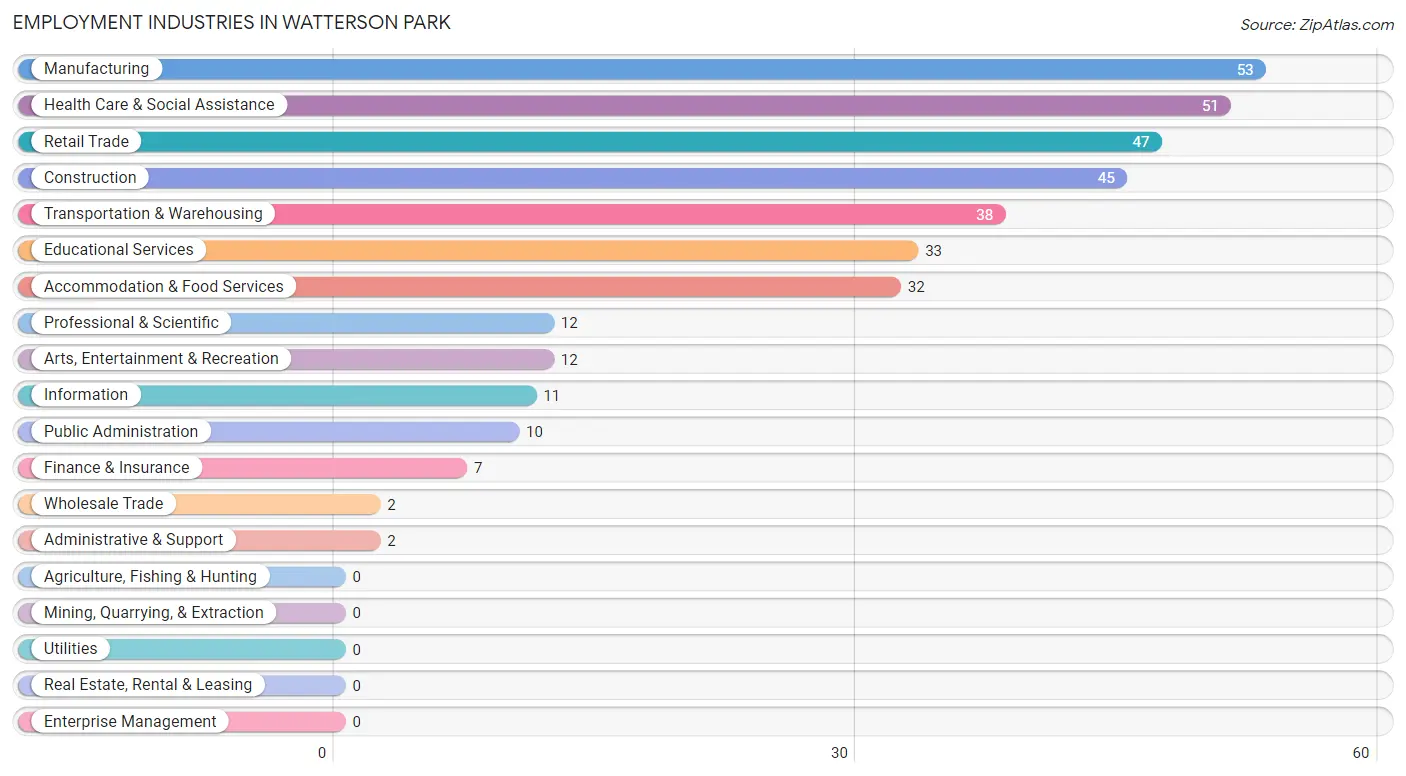
Employment Industries in Watterson Park
The major employment industries in Watterson Park include Manufacturing (53 | 14.5%), Health Care & Social Assistance (51 | 13.9%), Retail Trade (47 | 12.8%), Construction (45 | 12.3%), and Transportation & Warehousing (38 | 10.4%).
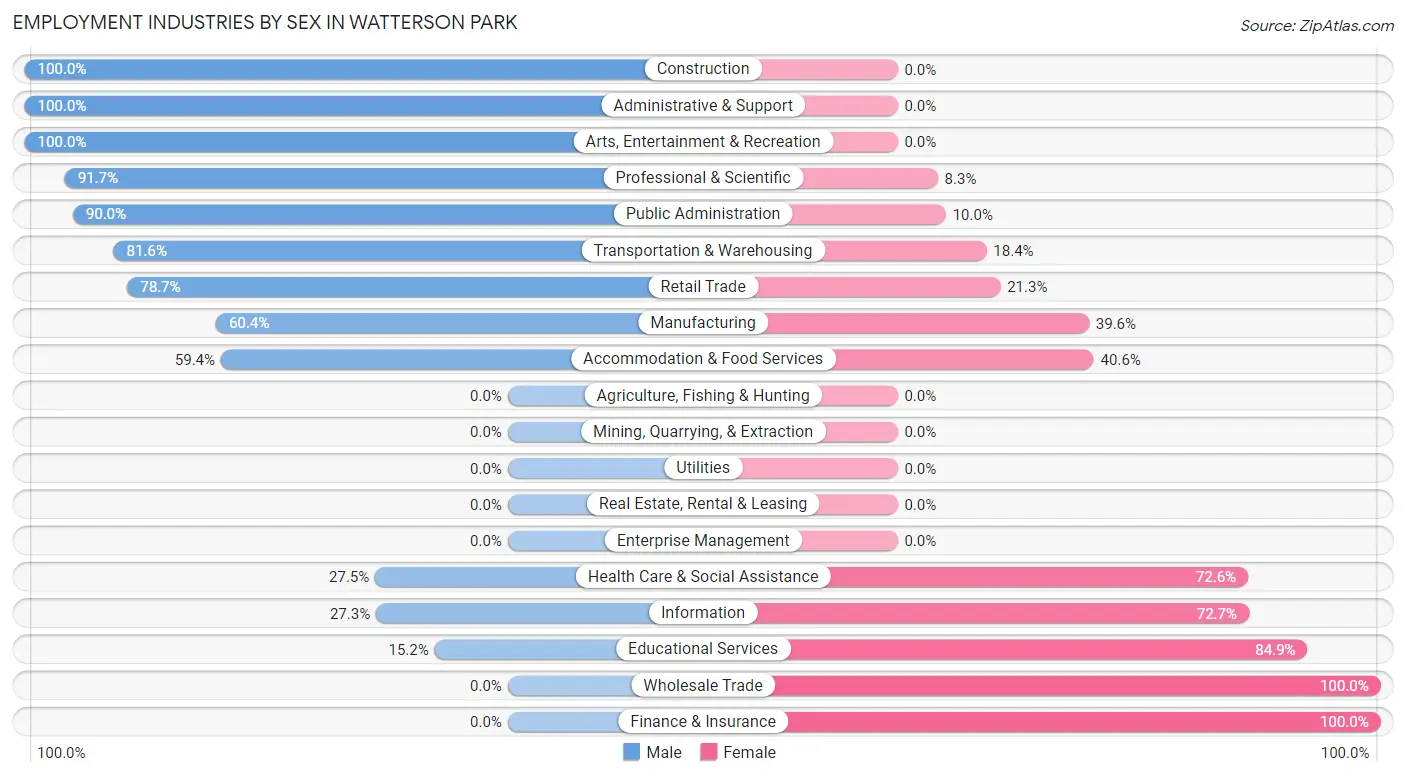
Employment Industries by Sex in Watterson Park
The Watterson Park industries that see more men than women are Construction (100.0%), Administrative & Support (100.0%), and Arts, Entertainment & Recreation (100.0%), whereas the industries that tend to have a higher number of women are Wholesale Trade (100.0%), Finance & Insurance (100.0%), and Educational Services (84.9%).
| Industry | Male | Female |
| Agriculture, Fishing & Hunting | 0 (0.0%) | 0 (0.0%) |
| Mining, Quarrying, & Extraction | 0 (0.0%) | 0 (0.0%) |
| Construction | 45 (100.0%) | 0 (0.0%) |
| Manufacturing | 32 (60.4%) | 21 (39.6%) |
| Wholesale Trade | 0 (0.0%) | 2 (100.0%) |
| Retail Trade | 37 (78.7%) | 10 (21.3%) |
| Transportation & Warehousing | 31 (81.6%) | 7 (18.4%) |
| Utilities | 0 (0.0%) | 0 (0.0%) |
| Information | 3 (27.3%) | 8 (72.7%) |
| Finance & Insurance | 0 (0.0%) | 7 (100.0%) |
| Real Estate, Rental & Leasing | 0 (0.0%) | 0 (0.0%) |
| Professional & Scientific | 11 (91.7%) | 1 (8.3%) |
| Enterprise Management | 0 (0.0%) | 0 (0.0%) |
| Administrative & Support | 2 (100.0%) | 0 (0.0%) |
| Educational Services | 5 (15.1%) | 28 (84.9%) |
| Health Care & Social Assistance | 14 (27.5%) | 37 (72.6%) |
| Arts, Entertainment & Recreation | 12 (100.0%) | 0 (0.0%) |
| Accommodation & Food Services | 19 (59.4%) | 13 (40.6%) |
| Public Administration | 9 (90.0%) | 1 (10.0%) |
| Total | 223 (60.9%) | 143 (39.1%) |
Education in Watterson Park
School Enrollment in Watterson Park
The most common levels of schooling among the 176 students in Watterson Park are elementary school (49 | 27.8%), kindergarten (37 | 21.0%), and high school (32 | 18.2%).
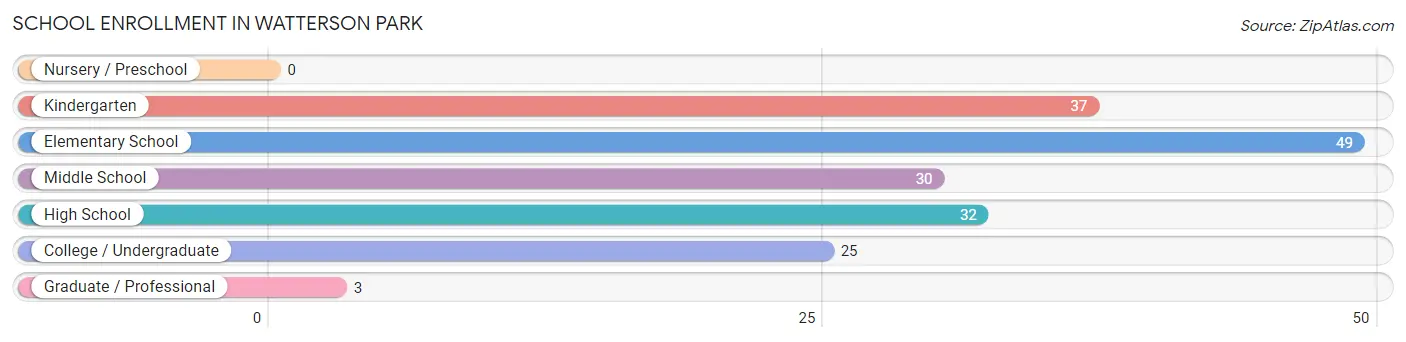
| School Level | # Students | % Students |
| Nursery / Preschool | 0 | 0.0% |
| Kindergarten | 37 | 21.0% |
| Elementary School | 49 | 27.8% |
| Middle School | 30 | 17.1% |
| High School | 32 | 18.2% |
| College / Undergraduate | 25 | 14.2% |
| Graduate / Professional | 3 | 1.7% |
| Total | 176 | 100.0% |
School Enrollment by Age by Funding Source in Watterson Park
Out of a total of 176 students who are enrolled in schools in Watterson Park, 27 (15.3%) attend a private institution, while the remaining 149 (84.7%) are enrolled in public schools. The age group of 35 years and over has the highest likelihood of being enrolled in private schools, with 3 (42.9% in the age bracket) enrolled. Conversely, the age group of 3 to 4 year olds has the lowest likelihood of being enrolled in a private school, with 33 (100.0% in the age bracket) attending a public institution.
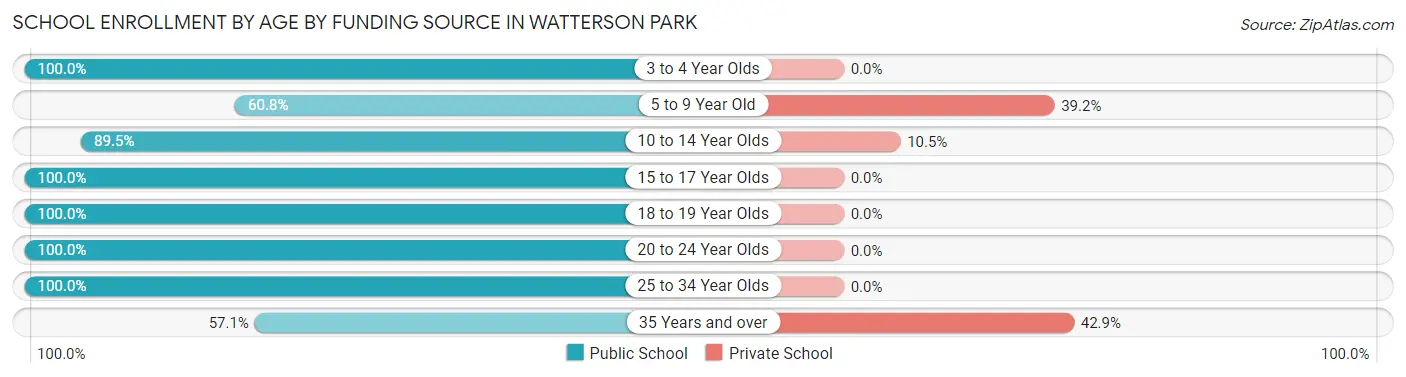
| Age Bracket | Public School | Private School |
| 3 to 4 Year Olds | 33 (100.0%) | 0 (0.0%) |
| 5 to 9 Year Old | 31 (60.8%) | 20 (39.2%) |
| 10 to 14 Year Olds | 34 (89.5%) | 4 (10.5%) |
| 15 to 17 Year Olds | 26 (100.0%) | 0 (0.0%) |
| 18 to 19 Year Olds | 3 (100.0%) | 0 (0.0%) |
| 20 to 24 Year Olds | 15 (100.0%) | 0 (0.0%) |
| 25 to 34 Year Olds | 3 (100.0%) | 0 (0.0%) |
| 35 Years and over | 4 (57.1%) | 3 (42.9%) |
| Total | 149 (84.7%) | 27 (15.3%) |
Educational Attainment by Field of Study in Watterson Park
Business (24 | 17.6%), visual & performing arts (19 | 14.0%), communications (16 | 11.8%), literature & languages (14 | 10.3%), and bio, nature & agricultural (13 | 9.6%) are the most common fields of study among 136 individuals in Watterson Park who have obtained a bachelor's degree or higher.
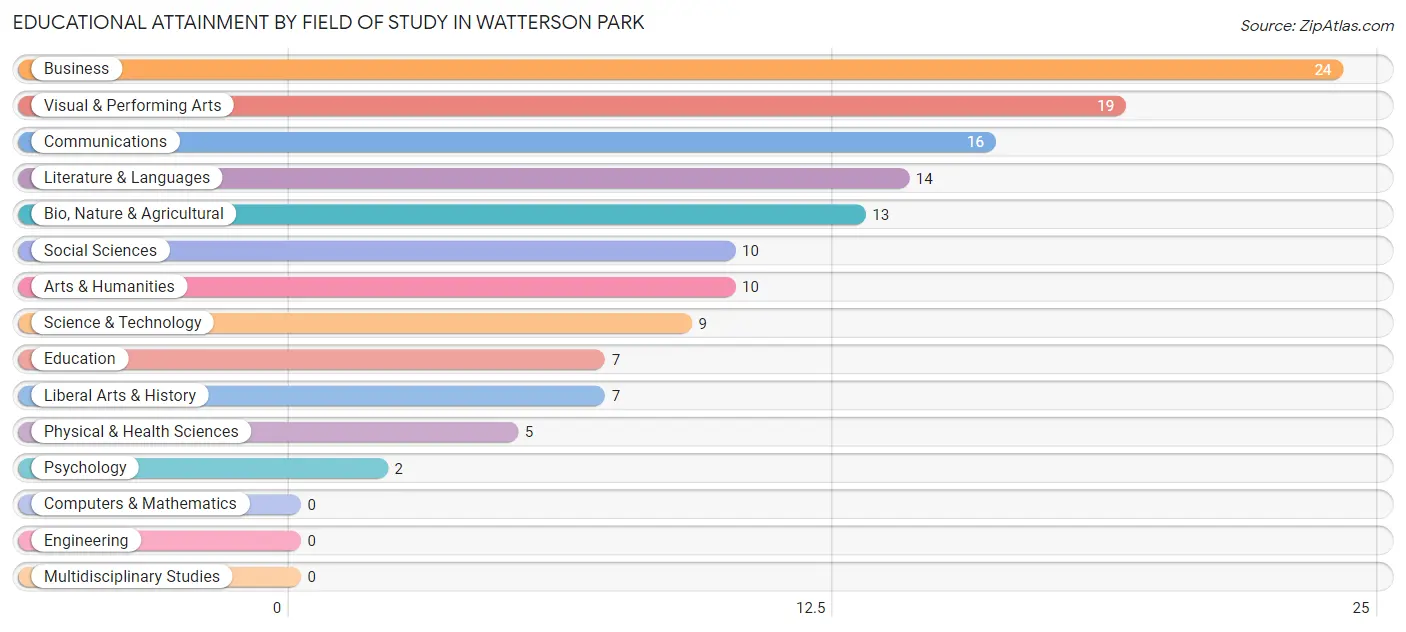
| Field of Study | # Graduates | % Graduates |
| Computers & Mathematics | 0 | 0.0% |
| Bio, Nature & Agricultural | 13 | 9.6% |
| Physical & Health Sciences | 5 | 3.7% |
| Psychology | 2 | 1.5% |
| Social Sciences | 10 | 7.3% |
| Engineering | 0 | 0.0% |
| Multidisciplinary Studies | 0 | 0.0% |
| Science & Technology | 9 | 6.6% |
| Business | 24 | 17.6% |
| Education | 7 | 5.1% |
| Literature & Languages | 14 | 10.3% |
| Liberal Arts & History | 7 | 5.1% |
| Visual & Performing Arts | 19 | 14.0% |
| Communications | 16 | 11.8% |
| Arts & Humanities | 10 | 7.3% |
| Total | 136 | 100.0% |
Transportation & Commute in Watterson Park
Vehicle Availability by Sex in Watterson Park
The most prevalent vehicle ownership categories in Watterson Park are males with 2 vehicles (98, accounting for 44.8%) and females with 2 vehicles (75, making up 71.0%).
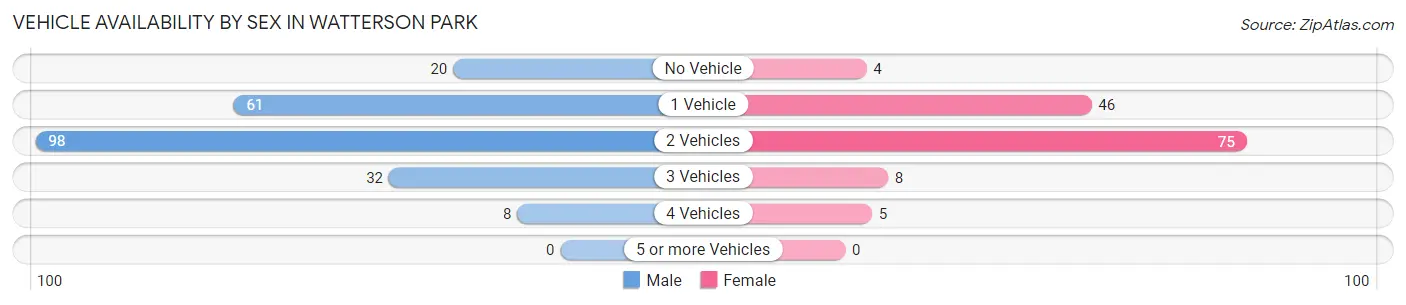
| Vehicles Available | Male | Female |
| No Vehicle | 20 (9.1%) | 4 (2.9%) |
| 1 Vehicle | 61 (27.9%) | 46 (33.3%) |
| 2 Vehicles | 98 (44.8%) | 75 (54.3%) |
| 3 Vehicles | 32 (14.6%) | 8 (5.8%) |
| 4 Vehicles | 8 (3.6%) | 5 (3.6%) |
| 5 or more Vehicles | 0 (0.0%) | 0 (0.0%) |
| Total | 219 (100.0%) | 138 (100.0%) |
Commute Time in Watterson Park
The most frequently occuring commute durations in Watterson Park are 20 to 24 minutes (83 commuters, 25.1%), 15 to 19 minutes (77 commuters, 23.3%), and 30 to 34 minutes (41 commuters, 12.4%).
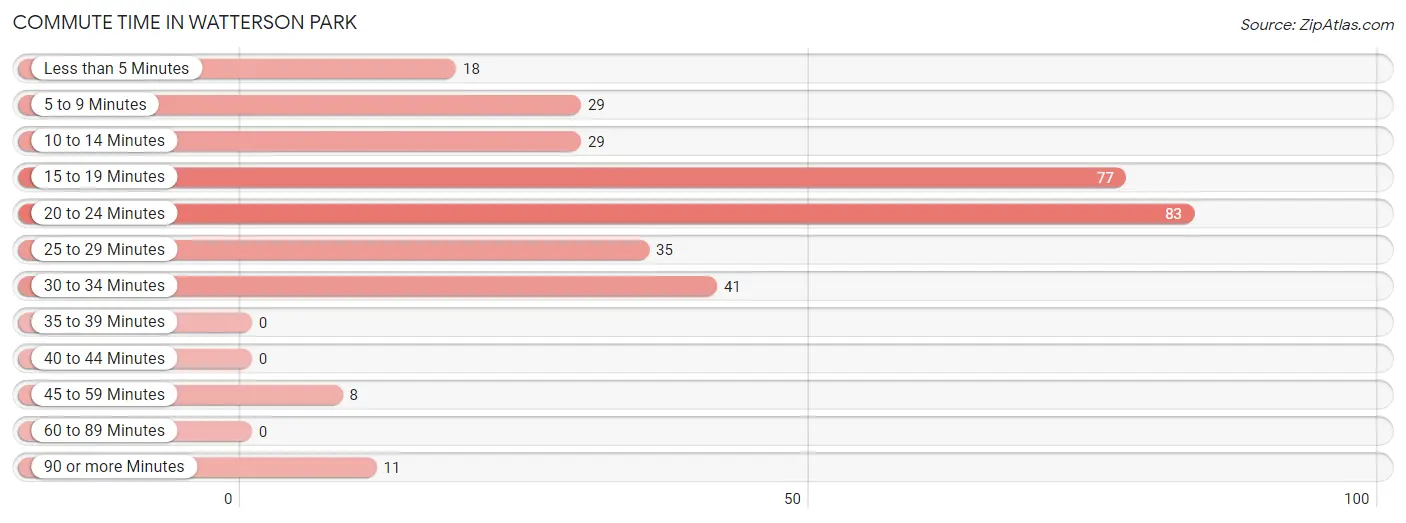
| Commute Time | # Commuters | % Commuters |
| Less than 5 Minutes | 18 | 5.4% |
| 5 to 9 Minutes | 29 | 8.8% |
| 10 to 14 Minutes | 29 | 8.8% |
| 15 to 19 Minutes | 77 | 23.3% |
| 20 to 24 Minutes | 83 | 25.1% |
| 25 to 29 Minutes | 35 | 10.6% |
| 30 to 34 Minutes | 41 | 12.4% |
| 35 to 39 Minutes | 0 | 0.0% |
| 40 to 44 Minutes | 0 | 0.0% |
| 45 to 59 Minutes | 8 | 2.4% |
| 60 to 89 Minutes | 0 | 0.0% |
| 90 or more Minutes | 11 | 3.3% |
Commute Time by Sex in Watterson Park
The most common commute times in Watterson Park are 20 to 24 minutes (48 commuters, 24.0%) for males and 15 to 19 minutes (44 commuters, 33.6%) for females.
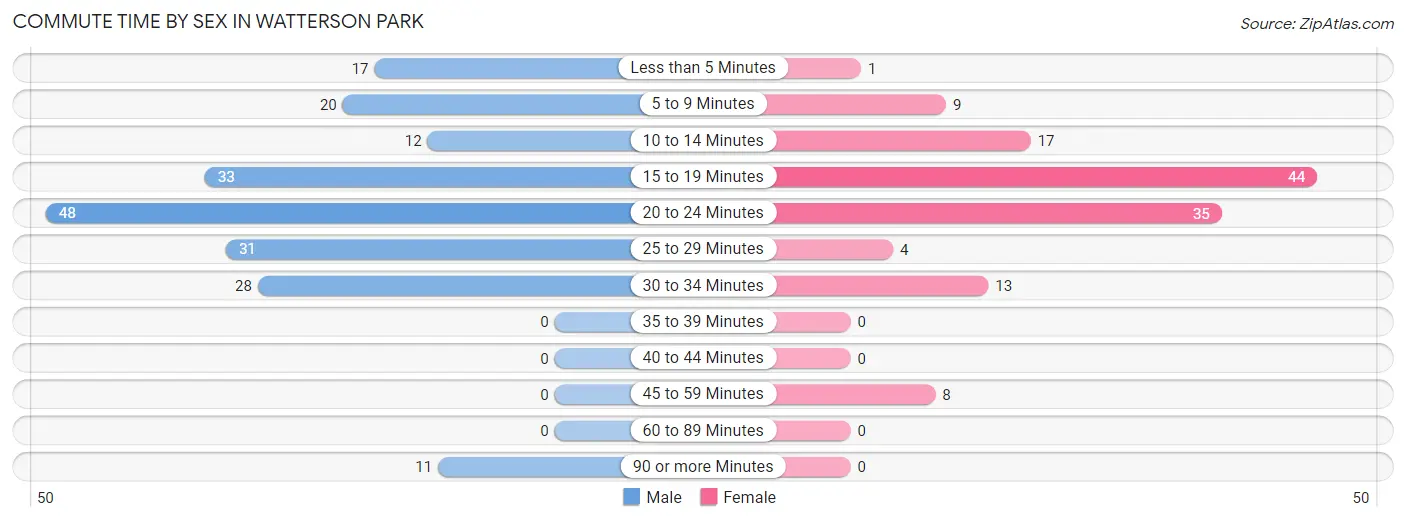
| Commute Time | Male | Female |
| Less than 5 Minutes | 17 (8.5%) | 1 (0.8%) |
| 5 to 9 Minutes | 20 (10.0%) | 9 (6.9%) |
| 10 to 14 Minutes | 12 (6.0%) | 17 (13.0%) |
| 15 to 19 Minutes | 33 (16.5%) | 44 (33.6%) |
| 20 to 24 Minutes | 48 (24.0%) | 35 (26.7%) |
| 25 to 29 Minutes | 31 (15.5%) | 4 (3.0%) |
| 30 to 34 Minutes | 28 (14.0%) | 13 (9.9%) |
| 35 to 39 Minutes | 0 (0.0%) | 0 (0.0%) |
| 40 to 44 Minutes | 0 (0.0%) | 0 (0.0%) |
| 45 to 59 Minutes | 0 (0.0%) | 8 (6.1%) |
| 60 to 89 Minutes | 0 (0.0%) | 0 (0.0%) |
| 90 or more Minutes | 11 (5.5%) | 0 (0.0%) |
Time of Departure to Work by Sex in Watterson Park
The most frequent times of departure to work in Watterson Park are 7:00 AM to 7:29 AM (52, 26.0%) for males and 7:30 AM to 7:59 AM (37, 28.2%) for females.
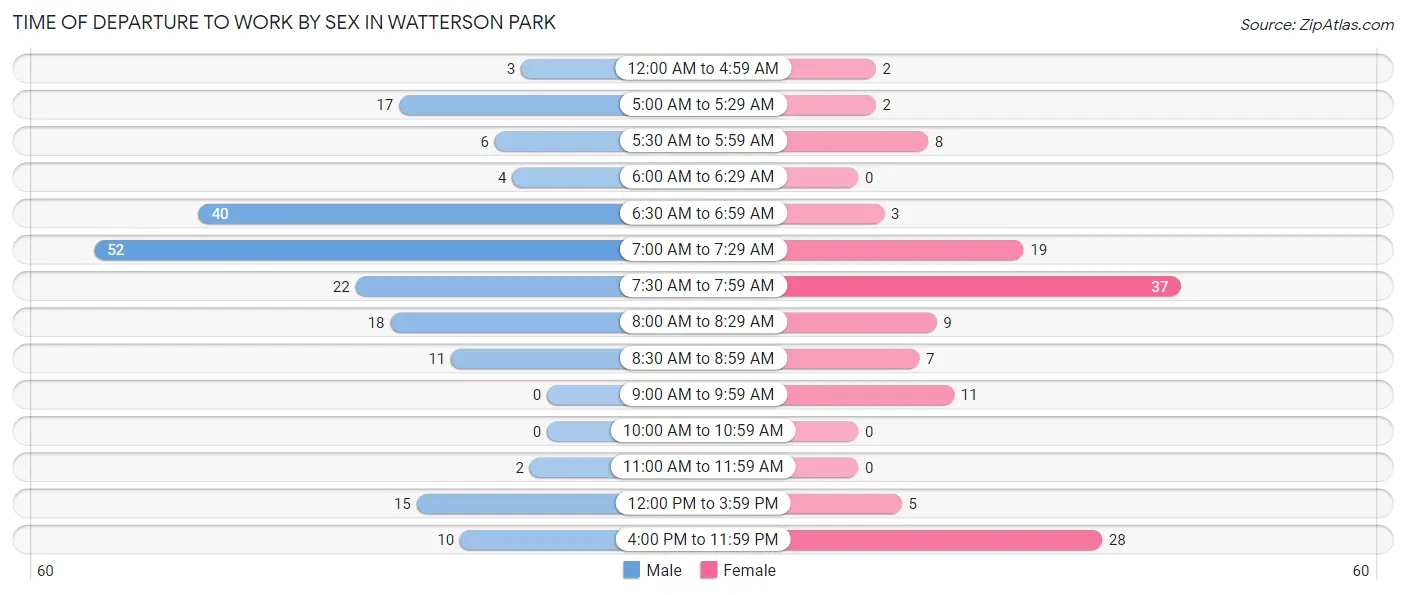
| Time of Departure | Male | Female |
| 12:00 AM to 4:59 AM | 3 (1.5%) | 2 (1.5%) |
| 5:00 AM to 5:29 AM | 17 (8.5%) | 2 (1.5%) |
| 5:30 AM to 5:59 AM | 6 (3.0%) | 8 (6.1%) |
| 6:00 AM to 6:29 AM | 4 (2.0%) | 0 (0.0%) |
| 6:30 AM to 6:59 AM | 40 (20.0%) | 3 (2.3%) |
| 7:00 AM to 7:29 AM | 52 (26.0%) | 19 (14.5%) |
| 7:30 AM to 7:59 AM | 22 (11.0%) | 37 (28.2%) |
| 8:00 AM to 8:29 AM | 18 (9.0%) | 9 (6.9%) |
| 8:30 AM to 8:59 AM | 11 (5.5%) | 7 (5.3%) |
| 9:00 AM to 9:59 AM | 0 (0.0%) | 11 (8.4%) |
| 10:00 AM to 10:59 AM | 0 (0.0%) | 0 (0.0%) |
| 11:00 AM to 11:59 AM | 2 (1.0%) | 0 (0.0%) |
| 12:00 PM to 3:59 PM | 15 (7.5%) | 5 (3.8%) |
| 4:00 PM to 11:59 PM | 10 (5.0%) | 28 (21.4%) |
| Total | 200 (100.0%) | 131 (100.0%) |
Housing Occupancy in Watterson Park
Occupancy by Ownership in Watterson Park
Of the total 398 dwellings in Watterson Park, owner-occupied units account for 179 (45.0%), while renter-occupied units make up 219 (55.0%).
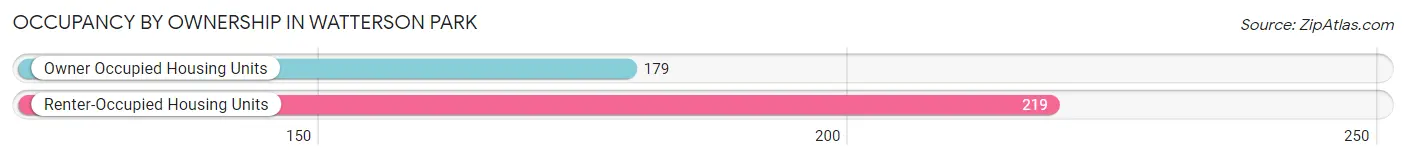
| Occupancy | # Housing Units | % Housing Units |
| Owner Occupied Housing Units | 179 | 45.0% |
| Renter-Occupied Housing Units | 219 | 55.0% |
| Total Occupied Housing Units | 398 | 100.0% |
Occupancy by Household Size in Watterson Park
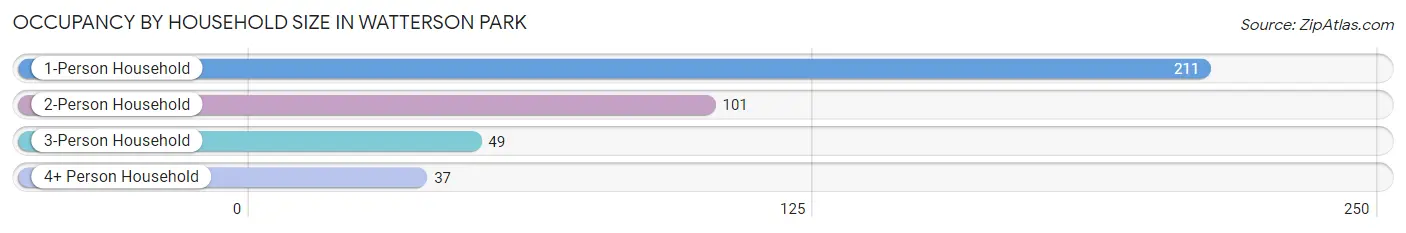
| Household Size | # Housing Units | % Housing Units |
| 1-Person Household | 211 | 53.0% |
| 2-Person Household | 101 | 25.4% |
| 3-Person Household | 49 | 12.3% |
| 4+ Person Household | 37 | 9.3% |
| Total Housing Units | 398 | 100.0% |
Occupancy by Ownership by Household Size in Watterson Park
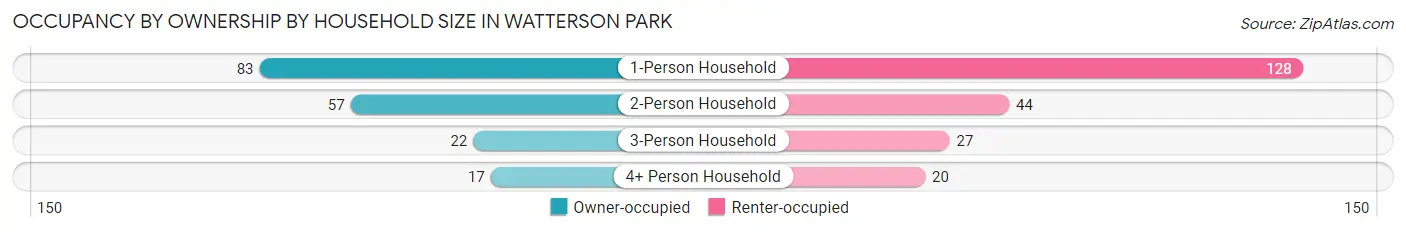
| Household Size | Owner-occupied | Renter-occupied |
| 1-Person Household | 83 (39.3%) | 128 (60.7%) |
| 2-Person Household | 57 (56.4%) | 44 (43.6%) |
| 3-Person Household | 22 (44.9%) | 27 (55.1%) |
| 4+ Person Household | 17 (46.0%) | 20 (54.0%) |
| Total Housing Units | 179 (45.0%) | 219 (55.0%) |
Occupancy by Educational Attainment in Watterson Park
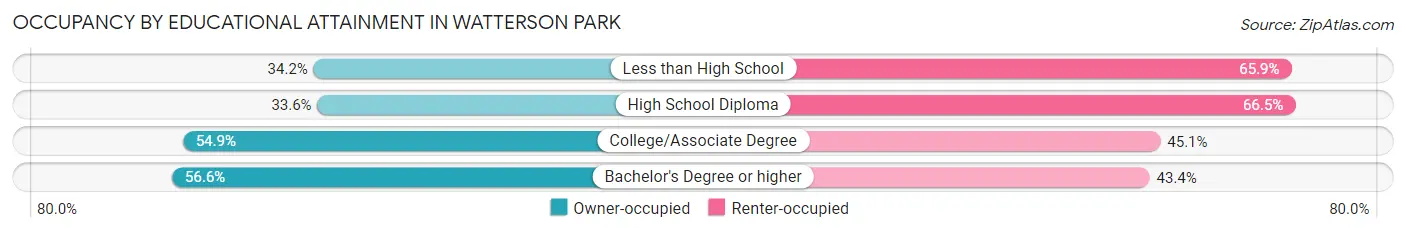
| Household Size | Owner-occupied | Renter-occupied |
| Less than High School | 14 (34.2%) | 27 (65.8%) |
| High School Diploma | 51 (33.6%) | 101 (66.4%) |
| College/Associate Degree | 67 (54.9%) | 55 (45.1%) |
| Bachelor's Degree or higher | 47 (56.6%) | 36 (43.4%) |
Occupancy by Age of Householder in Watterson Park
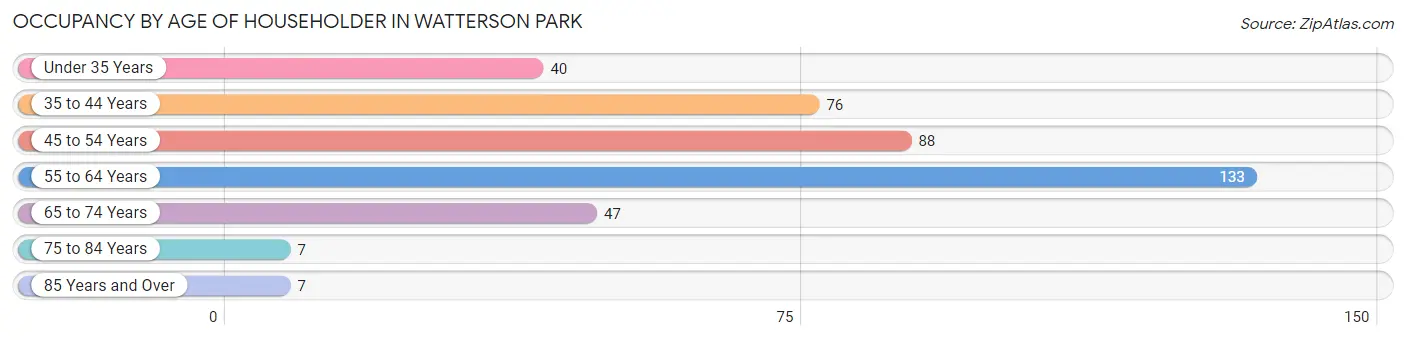
| Age Bracket | # Households | % Households |
| Under 35 Years | 40 | 10.1% |
| 35 to 44 Years | 76 | 19.1% |
| 45 to 54 Years | 88 | 22.1% |
| 55 to 64 Years | 133 | 33.4% |
| 65 to 74 Years | 47 | 11.8% |
| 75 to 84 Years | 7 | 1.8% |
| 85 Years and Over | 7 | 1.8% |
| Total | 398 | 100.0% |
Housing Finances in Watterson Park
Median Income by Occupancy in Watterson Park
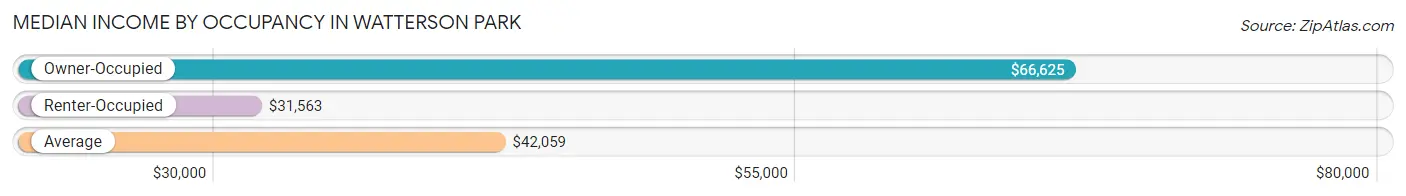
| Occupancy Type | # Households | Median Income |
| Owner-Occupied | 179 (45.0%) | $66,625 |
| Renter-Occupied | 219 (55.0%) | $31,563 |
| Average | 398 (100.0%) | $42,059 |
Occupancy by Householder Income Bracket in Watterson Park
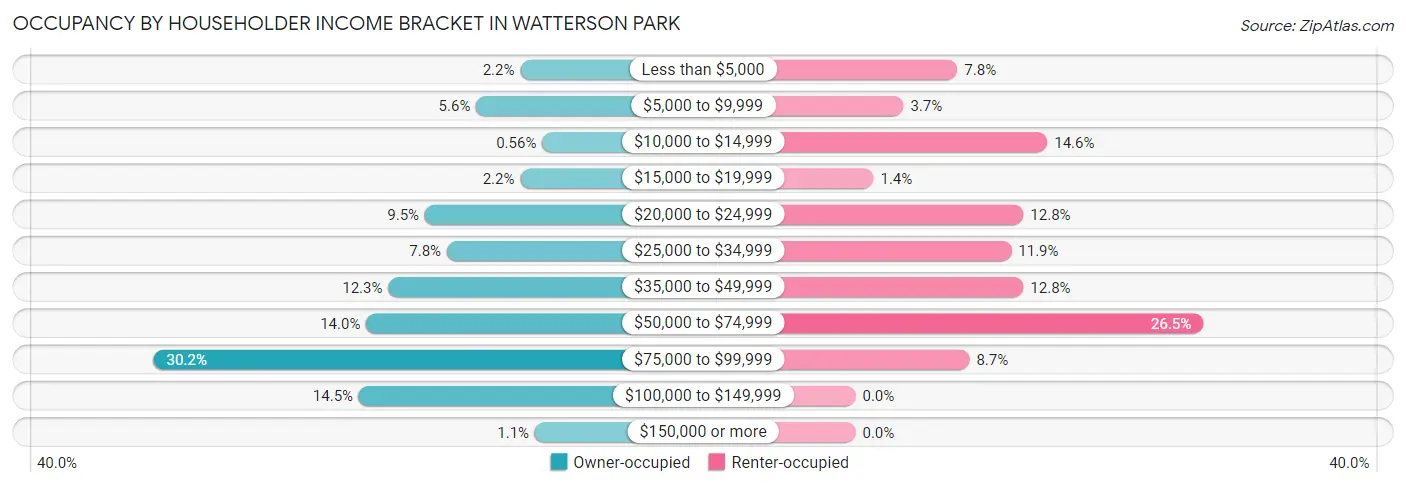
| Income Bracket | Owner-occupied | Renter-occupied |
| Less than $5,000 | 4 (2.2%) | 17 (7.8%) |
| $5,000 to $9,999 | 10 (5.6%) | 8 (3.6%) |
| $10,000 to $14,999 | 1 (0.6%) | 32 (14.6%) |
| $15,000 to $19,999 | 4 (2.2%) | 3 (1.4%) |
| $20,000 to $24,999 | 17 (9.5%) | 28 (12.8%) |
| $25,000 to $34,999 | 14 (7.8%) | 26 (11.9%) |
| $35,000 to $49,999 | 22 (12.3%) | 28 (12.8%) |
| $50,000 to $74,999 | 25 (14.0%) | 58 (26.5%) |
| $75,000 to $99,999 | 54 (30.2%) | 19 (8.7%) |
| $100,000 to $149,999 | 26 (14.5%) | 0 (0.0%) |
| $150,000 or more | 2 (1.1%) | 0 (0.0%) |
| Total | 179 (100.0%) | 219 (100.0%) |
Monthly Housing Cost Tiers in Watterson Park
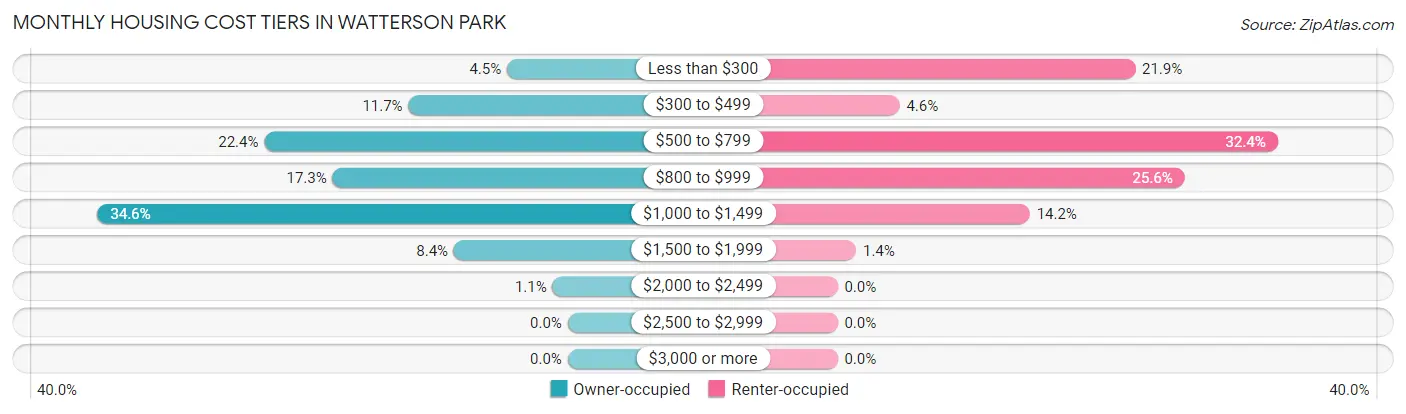
| Monthly Cost | Owner-occupied | Renter-occupied |
| Less than $300 | 8 (4.5%) | 48 (21.9%) |
| $300 to $499 | 21 (11.7%) | 10 (4.6%) |
| $500 to $799 | 40 (22.4%) | 71 (32.4%) |
| $800 to $999 | 31 (17.3%) | 56 (25.6%) |
| $1,000 to $1,499 | 62 (34.6%) | 31 (14.2%) |
| $1,500 to $1,999 | 15 (8.4%) | 3 (1.4%) |
| $2,000 to $2,499 | 2 (1.1%) | 0 (0.0%) |
| $2,500 to $2,999 | 0 (0.0%) | 0 (0.0%) |
| $3,000 or more | 0 (0.0%) | 0 (0.0%) |
| Total | 179 (100.0%) | 219 (100.0%) |
Physical Housing Characteristics in Watterson Park
Housing Structures in Watterson Park
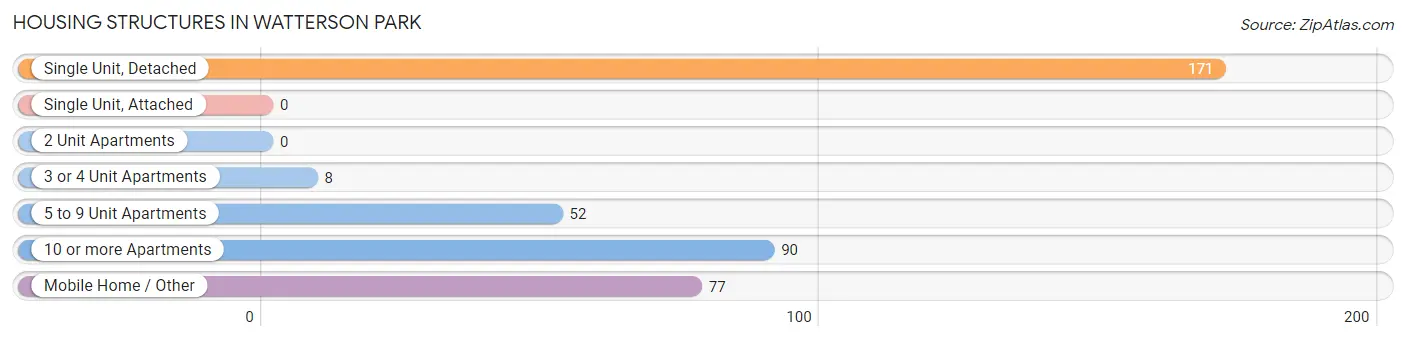
| Structure Type | # Housing Units | % Housing Units |
| Single Unit, Detached | 171 | 43.0% |
| Single Unit, Attached | 0 | 0.0% |
| 2 Unit Apartments | 0 | 0.0% |
| 3 or 4 Unit Apartments | 8 | 2.0% |
| 5 to 9 Unit Apartments | 52 | 13.1% |
| 10 or more Apartments | 90 | 22.6% |
| Mobile Home / Other | 77 | 19.4% |
| Total | 398 | 100.0% |
Housing Structures by Occupancy in Watterson Park
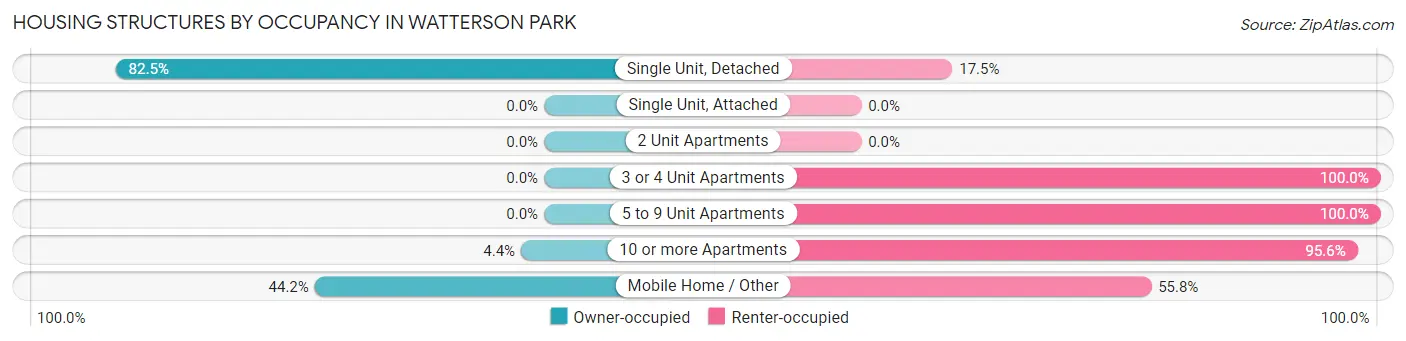
| Structure Type | Owner-occupied | Renter-occupied |
| Single Unit, Detached | 141 (82.5%) | 30 (17.5%) |
| Single Unit, Attached | 0 (0.0%) | 0 (0.0%) |
| 2 Unit Apartments | 0 (0.0%) | 0 (0.0%) |
| 3 or 4 Unit Apartments | 0 (0.0%) | 8 (100.0%) |
| 5 to 9 Unit Apartments | 0 (0.0%) | 52 (100.0%) |
| 10 or more Apartments | 4 (4.4%) | 86 (95.6%) |
| Mobile Home / Other | 34 (44.2%) | 43 (55.8%) |
| Total | 179 (45.0%) | 219 (55.0%) |
Housing Structures by Number of Rooms in Watterson Park
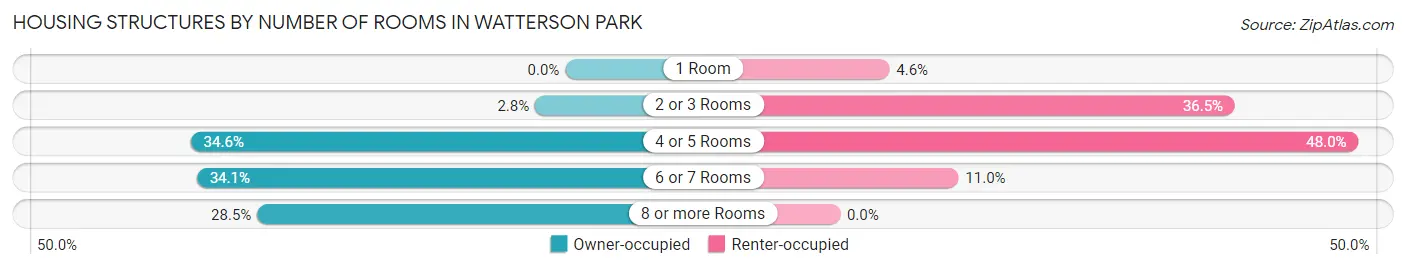
| Number of Rooms | Owner-occupied | Renter-occupied |
| 1 Room | 0 (0.0%) | 10 (4.6%) |
| 2 or 3 Rooms | 5 (2.8%) | 80 (36.5%) |
| 4 or 5 Rooms | 62 (34.6%) | 105 (47.9%) |
| 6 or 7 Rooms | 61 (34.1%) | 24 (11.0%) |
| 8 or more Rooms | 51 (28.5%) | 0 (0.0%) |
| Total | 179 (100.0%) | 219 (100.0%) |
Housing Structure by Heating Type in Watterson Park
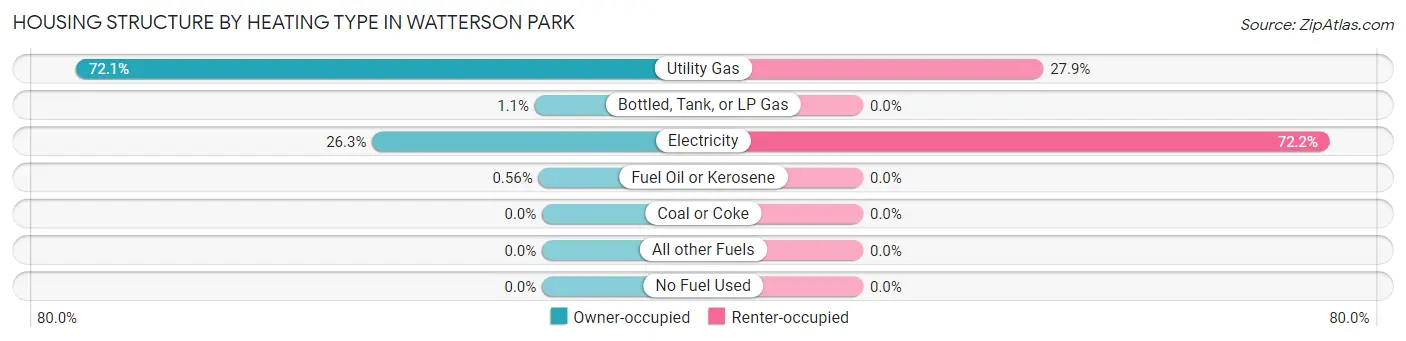
| Heating Type | Owner-occupied | Renter-occupied |
| Utility Gas | 129 (72.1%) | 61 (27.9%) |
| Bottled, Tank, or LP Gas | 2 (1.1%) | 0 (0.0%) |
| Electricity | 47 (26.3%) | 158 (72.2%) |
| Fuel Oil or Kerosene | 1 (0.6%) | 0 (0.0%) |
| Coal or Coke | 0 (0.0%) | 0 (0.0%) |
| All other Fuels | 0 (0.0%) | 0 (0.0%) |
| No Fuel Used | 0 (0.0%) | 0 (0.0%) |
| Total | 179 (100.0%) | 219 (100.0%) |
Household Vehicle Usage in Watterson Park
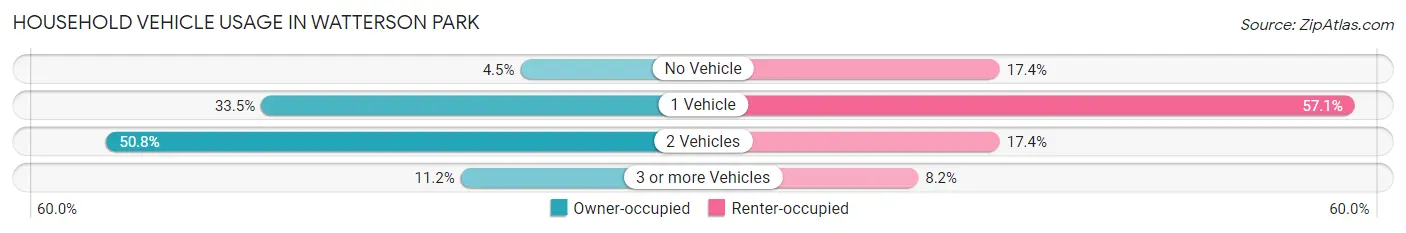
| Vehicles per Household | Owner-occupied | Renter-occupied |
| No Vehicle | 8 (4.5%) | 38 (17.3%) |
| 1 Vehicle | 60 (33.5%) | 125 (57.1%) |
| 2 Vehicles | 91 (50.8%) | 38 (17.3%) |
| 3 or more Vehicles | 20 (11.2%) | 18 (8.2%) |
| Total | 179 (100.0%) | 219 (100.0%) |
Real Estate & Mortgages in Watterson Park
Real Estate and Mortgage Overview in Watterson Park
| Characteristic | Without Mortgage | With Mortgage |
| Housing Units | 59 | 120 |
| Median Property Value | $157,800 | $198,600 |
| Median Household Income | $40,313 | $2 |
| Monthly Housing Costs | $505 | $0 |
| Real Estate Taxes | $1,250 | $0 |
Property Value by Mortgage Status in Watterson Park
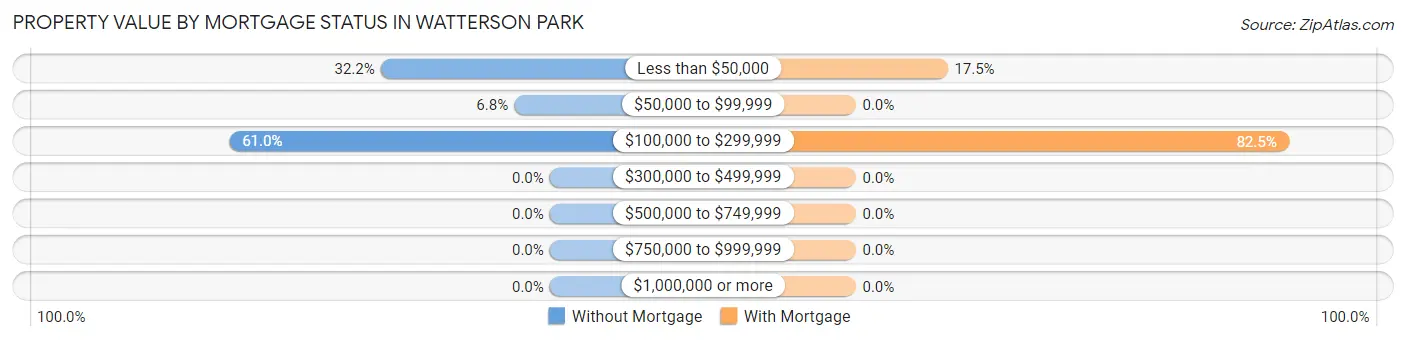
| Property Value | Without Mortgage | With Mortgage |
| Less than $50,000 | 19 (32.2%) | 21 (17.5%) |
| $50,000 to $99,999 | 4 (6.8%) | 0 (0.0%) |
| $100,000 to $299,999 | 36 (61.0%) | 99 (82.5%) |
| $300,000 to $499,999 | 0 (0.0%) | 0 (0.0%) |
| $500,000 to $749,999 | 0 (0.0%) | 0 (0.0%) |
| $750,000 to $999,999 | 0 (0.0%) | 0 (0.0%) |
| $1,000,000 or more | 0 (0.0%) | 0 (0.0%) |
| Total | 59 (100.0%) | 120 (100.0%) |
Household Income by Mortgage Status in Watterson Park
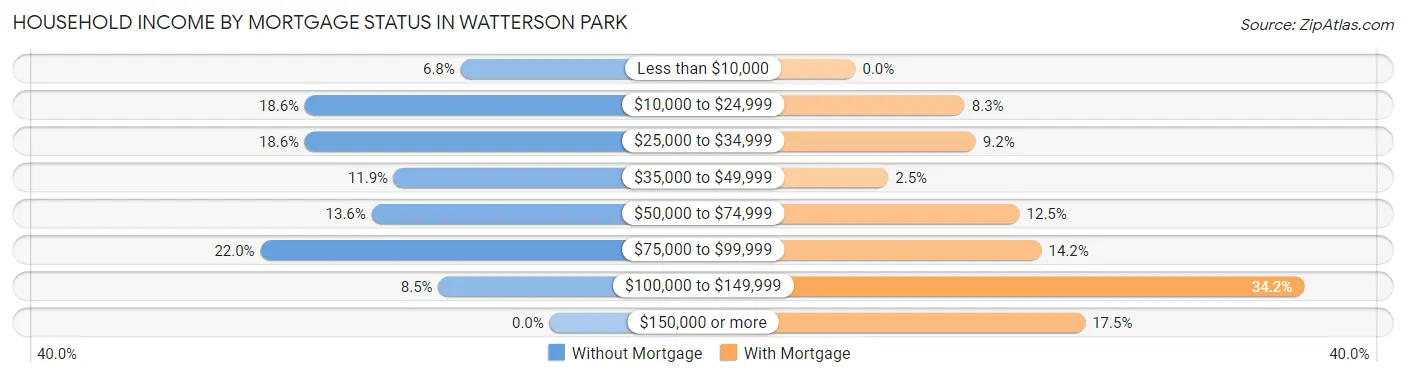
| Household Income | Without Mortgage | With Mortgage |
| Less than $10,000 | 4 (6.8%) | 0 (0.0%) |
| $10,000 to $24,999 | 11 (18.6%) | 10 (8.3%) |
| $25,000 to $34,999 | 11 (18.6%) | 11 (9.2%) |
| $35,000 to $49,999 | 7 (11.9%) | 3 (2.5%) |
| $50,000 to $74,999 | 8 (13.6%) | 15 (12.5%) |
| $75,000 to $99,999 | 13 (22.0%) | 17 (14.2%) |
| $100,000 to $149,999 | 5 (8.5%) | 41 (34.2%) |
| $150,000 or more | 0 (0.0%) | 21 (17.5%) |
| Total | 59 (100.0%) | 120 (100.0%) |
Property Value to Household Income Ratio in Watterson Park
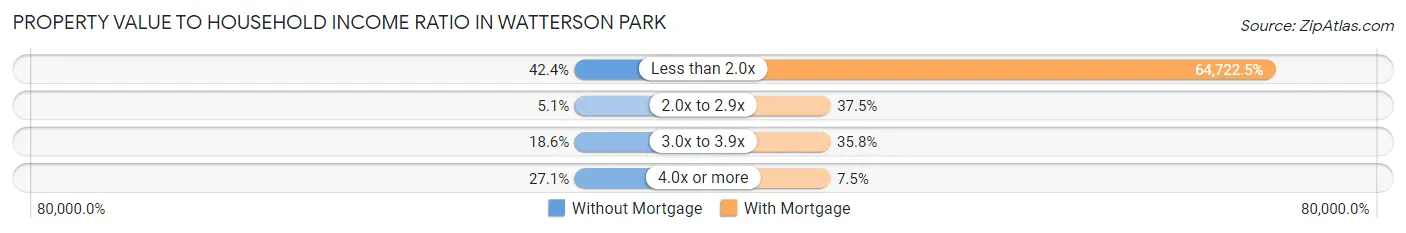
| Value-to-Income Ratio | Without Mortgage | With Mortgage |
| Less than 2.0x | 25 (42.4%) | 77,667 (64,722.5%) |
| 2.0x to 2.9x | 3 (5.1%) | 45 (37.5%) |
| 3.0x to 3.9x | 11 (18.6%) | 43 (35.8%) |
| 4.0x or more | 16 (27.1%) | 9 (7.5%) |
| Total | 59 (100.0%) | 120 (100.0%) |
Real Estate Taxes by Mortgage Status in Watterson Park
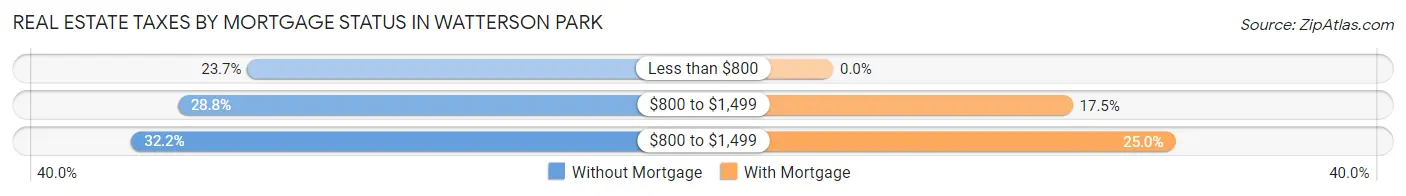
| Property Taxes | Without Mortgage | With Mortgage |
| Less than $800 | 14 (23.7%) | 0 (0.0%) |
| $800 to $1,499 | 17 (28.8%) | 21 (17.5%) |
| $800 to $1,499 | 19 (32.2%) | 30 (25.0%) |
| Total | 59 (100.0%) | 120 (100.0%) |
Health & Disability in Watterson Park
Health Insurance Coverage by Age in Watterson Park
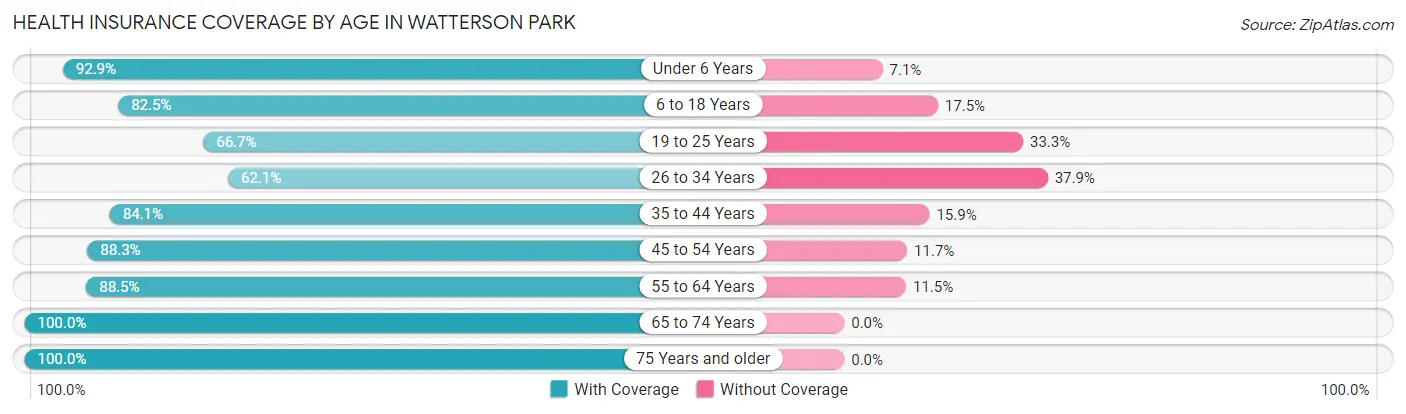
| Age Bracket | With Coverage | Without Coverage |
| Under 6 Years | 65 (92.9%) | 5 (7.1%) |
| 6 to 18 Years | 104 (82.5%) | 22 (17.5%) |
| 19 to 25 Years | 28 (66.7%) | 14 (33.3%) |
| 26 to 34 Years | 54 (62.1%) | 33 (37.9%) |
| 35 to 44 Years | 90 (84.1%) | 17 (15.9%) |
| 45 to 54 Years | 113 (88.3%) | 15 (11.7%) |
| 55 to 64 Years | 146 (88.5%) | 19 (11.5%) |
| 65 to 74 Years | 58 (100.0%) | 0 (0.0%) |
| 75 Years and older | 24 (100.0%) | 0 (0.0%) |
| Total | 682 (84.5%) | 125 (15.5%) |
Health Insurance Coverage by Citizenship Status in Watterson Park
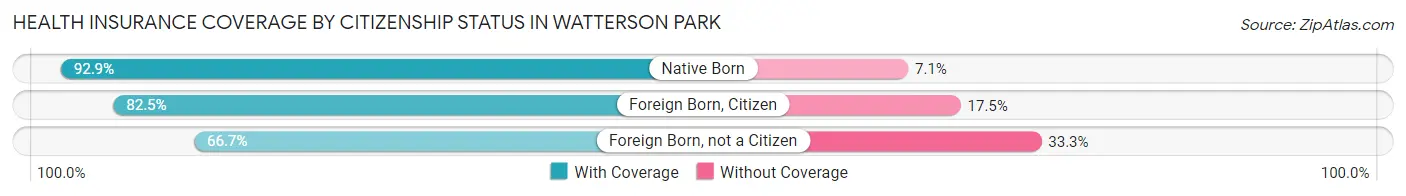
| Citizenship Status | With Coverage | Without Coverage |
| Native Born | 65 (92.9%) | 5 (7.1%) |
| Foreign Born, Citizen | 104 (82.5%) | 22 (17.5%) |
| Foreign Born, not a Citizen | 28 (66.7%) | 14 (33.3%) |
Health Insurance Coverage by Household Income in Watterson Park
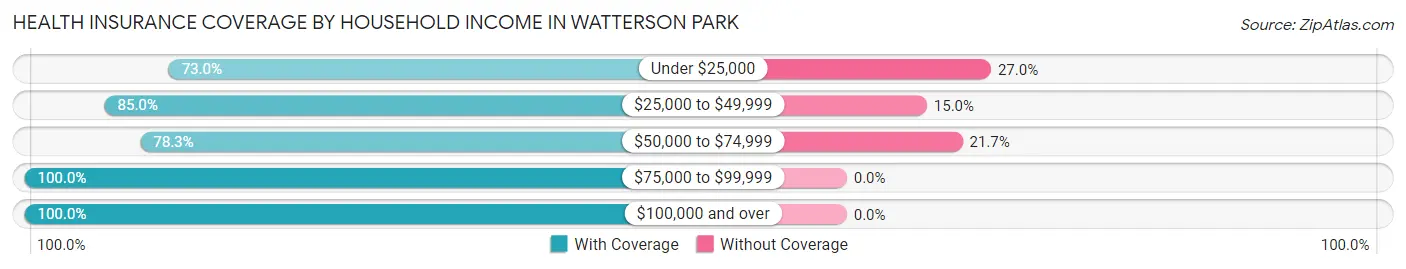
| Household Income | With Coverage | Without Coverage |
| Under $25,000 | 154 (73.0%) | 57 (27.0%) |
| $25,000 to $49,999 | 153 (85.0%) | 27 (15.0%) |
| $50,000 to $74,999 | 148 (78.3%) | 41 (21.7%) |
| $75,000 to $99,999 | 132 (100.0%) | 0 (0.0%) |
| $100,000 and over | 95 (100.0%) | 0 (0.0%) |
Public vs Private Health Insurance Coverage by Age in Watterson Park
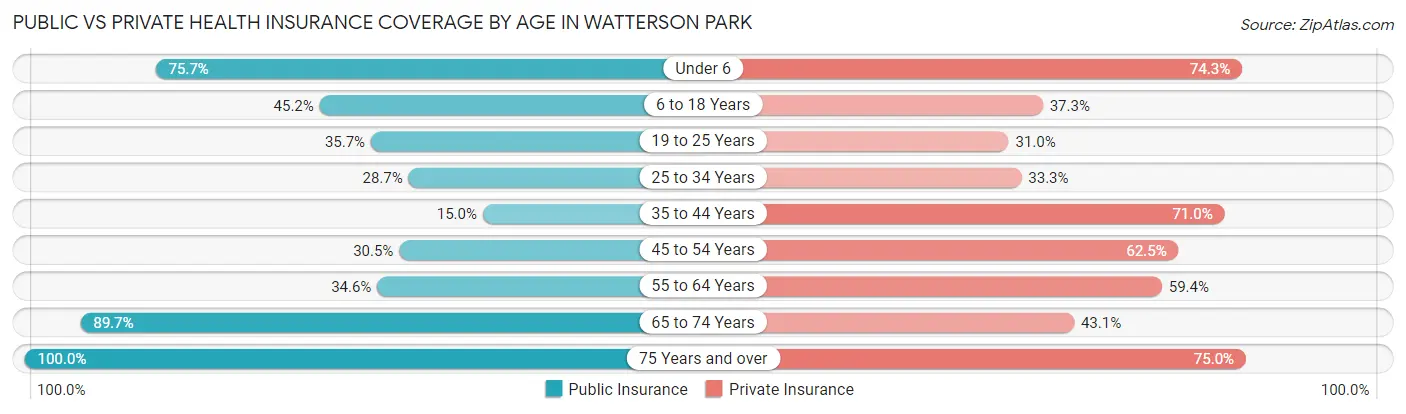
| Age Bracket | Public Insurance | Private Insurance |
| Under 6 | 53 (75.7%) | 52 (74.3%) |
| 6 to 18 Years | 57 (45.2%) | 47 (37.3%) |
| 19 to 25 Years | 15 (35.7%) | 13 (30.9%) |
| 25 to 34 Years | 25 (28.7%) | 29 (33.3%) |
| 35 to 44 Years | 16 (14.9%) | 76 (71.0%) |
| 45 to 54 Years | 39 (30.5%) | 80 (62.5%) |
| 55 to 64 Years | 57 (34.5%) | 98 (59.4%) |
| 65 to 74 Years | 52 (89.7%) | 25 (43.1%) |
| 75 Years and over | 24 (100.0%) | 18 (75.0%) |
| Total | 338 (41.9%) | 438 (54.3%) |
Disability Status by Sex by Age in Watterson Park
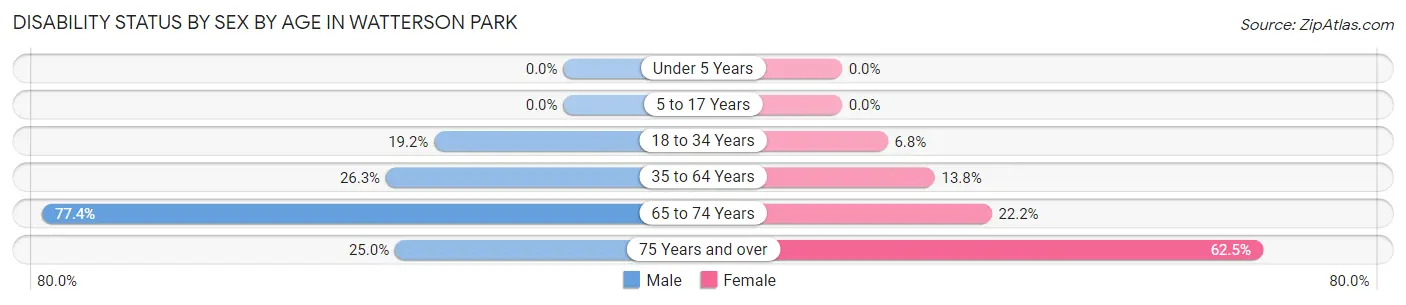
| Age Bracket | Male | Female |
| Under 5 Years | 0 (0.0%) | 0 (0.0%) |
| 5 to 17 Years | 0 (0.0%) | 0 (0.0%) |
| 18 to 34 Years | 14 (19.2%) | 4 (6.8%) |
| 35 to 64 Years | 69 (26.3%) | 19 (13.8%) |
| 65 to 74 Years | 24 (77.4%) | 6 (22.2%) |
| 75 Years and over | 2 (25.0%) | 10 (62.5%) |
Disability Class by Sex by Age in Watterson Park
Disability Class: Hearing Difficulty
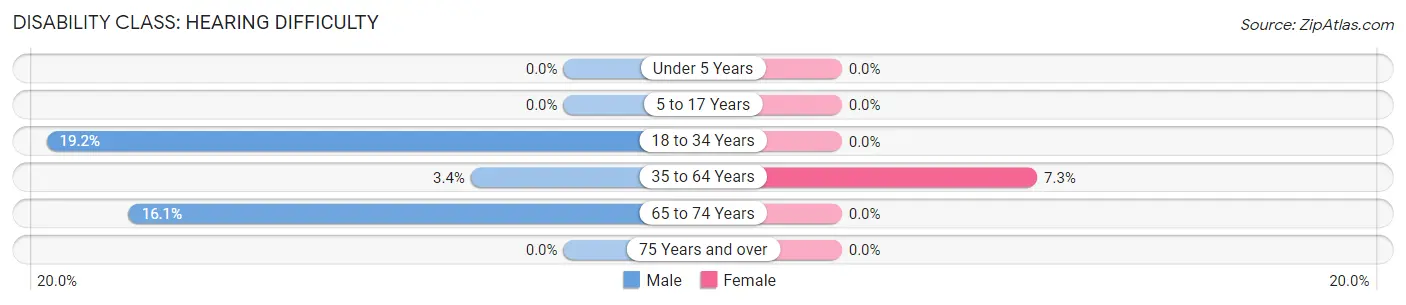
| Age Bracket | Male | Female |
| Under 5 Years | 0 (0.0%) | 0 (0.0%) |
| 5 to 17 Years | 0 (0.0%) | 0 (0.0%) |
| 18 to 34 Years | 14 (19.2%) | 0 (0.0%) |
| 35 to 64 Years | 9 (3.4%) | 10 (7.2%) |
| 65 to 74 Years | 5 (16.1%) | 0 (0.0%) |
| 75 Years and over | 0 (0.0%) | 0 (0.0%) |
Disability Class: Vision Difficulty
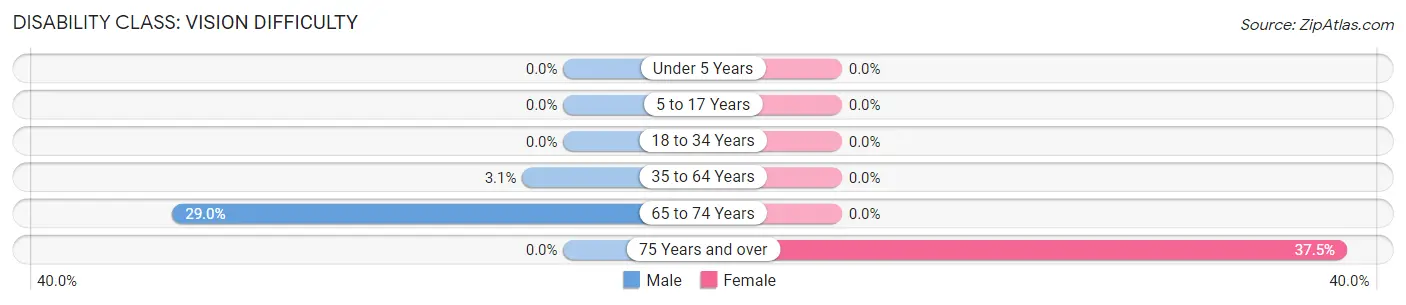
| Age Bracket | Male | Female |
| Under 5 Years | 0 (0.0%) | 0 (0.0%) |
| 5 to 17 Years | 0 (0.0%) | 0 (0.0%) |
| 18 to 34 Years | 0 (0.0%) | 0 (0.0%) |
| 35 to 64 Years | 8 (3.0%) | 0 (0.0%) |
| 65 to 74 Years | 9 (29.0%) | 0 (0.0%) |
| 75 Years and over | 0 (0.0%) | 6 (37.5%) |
Disability Class: Cognitive Difficulty
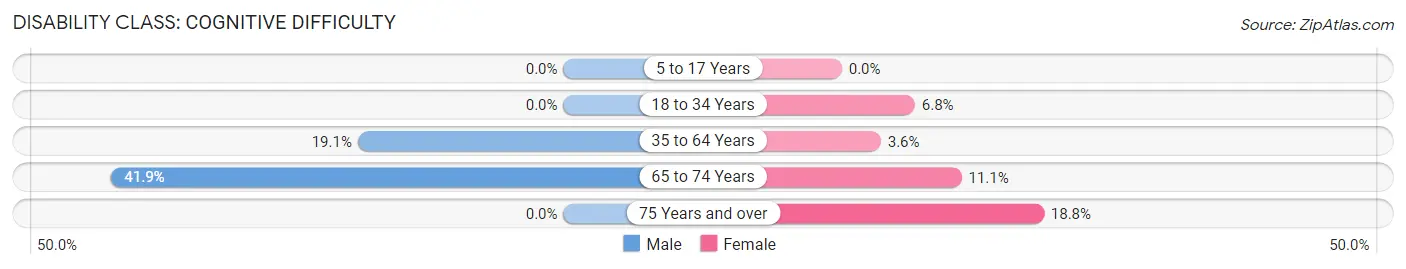
| Age Bracket | Male | Female |
| 5 to 17 Years | 0 (0.0%) | 0 (0.0%) |
| 18 to 34 Years | 0 (0.0%) | 4 (6.8%) |
| 35 to 64 Years | 50 (19.1%) | 5 (3.6%) |
| 65 to 74 Years | 13 (41.9%) | 3 (11.1%) |
| 75 Years and over | 0 (0.0%) | 3 (18.8%) |
Disability Class: Ambulatory Difficulty
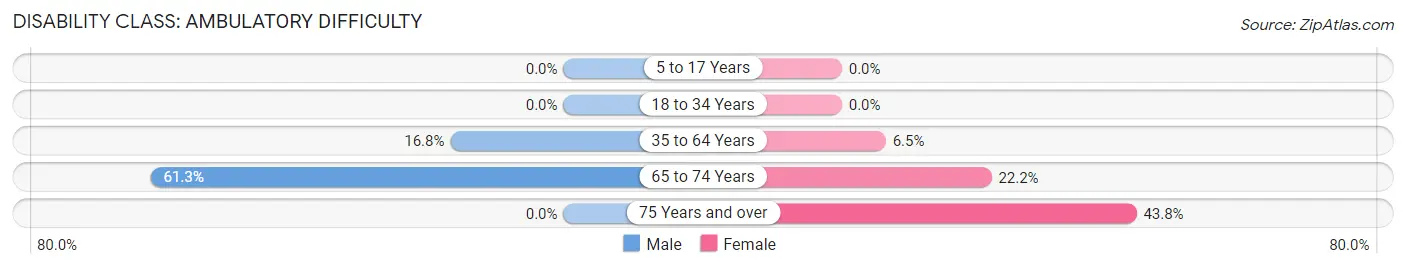
| Age Bracket | Male | Female |
| 5 to 17 Years | 0 (0.0%) | 0 (0.0%) |
| 18 to 34 Years | 0 (0.0%) | 0 (0.0%) |
| 35 to 64 Years | 44 (16.8%) | 9 (6.5%) |
| 65 to 74 Years | 19 (61.3%) | 6 (22.2%) |
| 75 Years and over | 0 (0.0%) | 7 (43.8%) |
Disability Class: Self-Care Difficulty
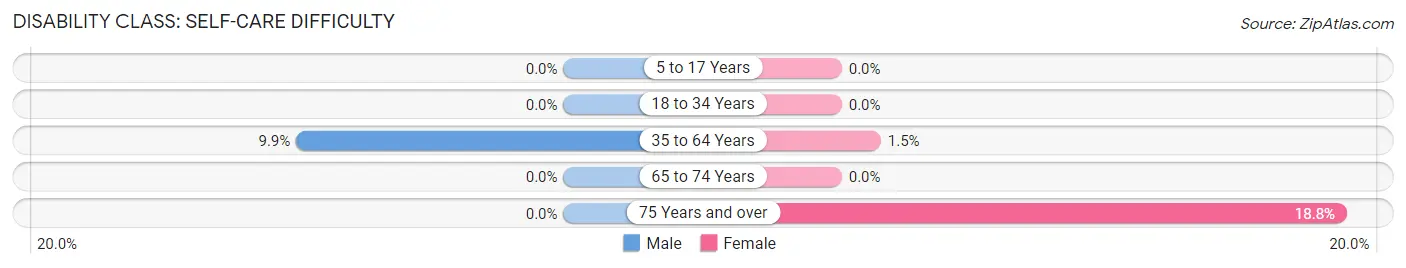
| Age Bracket | Male | Female |
| 5 to 17 Years | 0 (0.0%) | 0 (0.0%) |
| 18 to 34 Years | 0 (0.0%) | 0 (0.0%) |
| 35 to 64 Years | 26 (9.9%) | 2 (1.5%) |
| 65 to 74 Years | 0 (0.0%) | 0 (0.0%) |
| 75 Years and over | 0 (0.0%) | 3 (18.8%) |
Technology Access in Watterson Park
Computing Device Access in Watterson Park
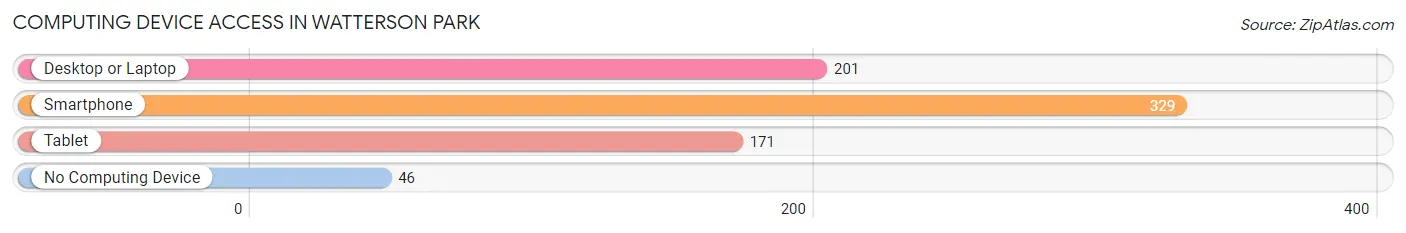
| Device Type | # Households | % Households |
| Desktop or Laptop | 201 | 50.5% |
| Smartphone | 329 | 82.7% |
| Tablet | 171 | 43.0% |
| No Computing Device | 46 | 11.6% |
| Total | 398 | 100.0% |
Internet Access in Watterson Park
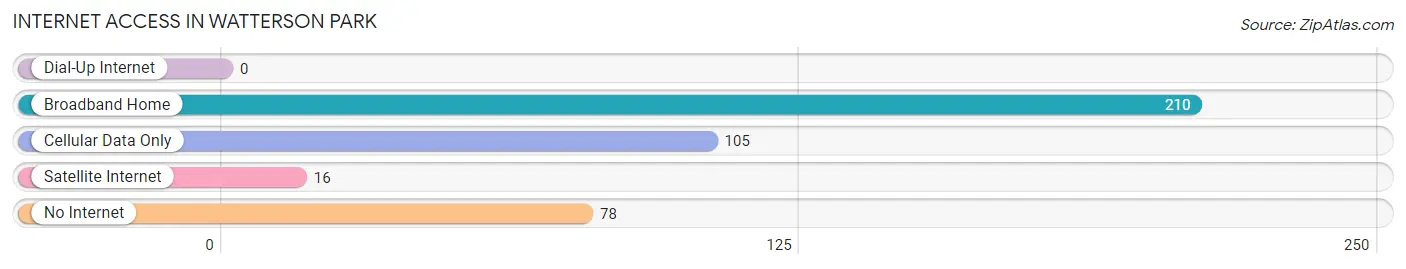
| Internet Type | # Households | % Households |
| Dial-Up Internet | 0 | 0.0% |
| Broadband Home | 210 | 52.8% |
| Cellular Data Only | 105 | 26.4% |
| Satellite Internet | 16 | 4.0% |
| No Internet | 78 | 19.6% |
| Total | 398 | 100.0% |
Watterson Park Summary
Watterson Park is a small unincorporated community located in Jefferson County, Kentucky. It is situated just south of the city of Louisville and is part of the Louisville Metro area. The community is bordered by the Watterson Expressway to the north, the Ohio River to the west, and the Louisville International Airport to the south. Watterson Park is a diverse and vibrant community that is home to a variety of businesses, restaurants, and other amenities.
History
Watterson Park was originally part of a large tract of land owned by the Watterson family in the early 1800s. The family owned a large farm and operated a mill on the property. In the late 1800s, the Watterson family sold the land to the Louisville and Nashville Railroad Company. The railroad company developed the area into a residential neighborhood and named it Watterson Park.
The area was annexed by the city of Louisville in the early 1900s and became part of the city’s South End. Watterson Park was a predominantly white, middle-class neighborhood until the 1950s when African Americans began to move into the area. The neighborhood experienced a period of decline in the 1960s and 1970s due to white flight and the construction of the Watterson Expressway.
In the 1980s, the area began to experience a resurgence as new businesses and restaurants opened in the area. The Watterson Expressway was also widened and improved, making the area more accessible. Today, Watterson Park is a vibrant and diverse community that is home to a variety of businesses, restaurants, and other amenities.
Geography
Watterson Park is located in Jefferson County, Kentucky. It is situated just south of the city of Louisville and is part of the Louisville Metro area. The community is bordered by the Watterson Expressway to the north, the Ohio River to the west, and the Louisville International Airport to the south.
The area is mostly flat with some rolling hills. The terrain is mostly grassy with some trees and shrubs. The climate is humid and subtropical with hot summers and mild winters.
Economy
Watterson Park is home to a variety of businesses, restaurants, and other amenities. The area is home to several large employers, including UPS, Ford Motor Company, and the Louisville International Airport. The area is also home to several small businesses, including restaurants, retail stores, and service providers.
The area is also home to several educational institutions, including the University of Louisville, Jefferson Community and Technical College, and the Louisville Technical Institute.
Demographics
As of the 2010 census, the population of Watterson Park was 8,945. The population is diverse and includes African Americans, Hispanics, Asians, and other ethnicities. The median household income is $37,945 and the median home value is $127,000. The area is mostly residential with some commercial and industrial development.
Conclusion
Watterson Park is a small unincorporated community located in Jefferson County, Kentucky. It is situated just south of the city of Louisville and is part of the Louisville Metro area. The community is bordered by the Watterson Expressway to the north, the Ohio River to the west, and the Louisville International Airport to the south. Watterson Park is a diverse and vibrant community that is home to a variety of businesses, restaurants, and other amenities. The area is mostly flat with some rolling hills and the climate is humid and subtropical. The population of Watterson Park is 8,945 and the median household income is $37,945. The area is mostly residential with some commercial and industrial development.
Common Questions
What is Per Capita Income in Watterson Park?
Per Capita income in Watterson Park is $24,866.
What is the Median Family Income in Watterson Park?
Median Family Income in Watterson Park is $70,461.
What is the Median Household income in Watterson Park?
Median Household Income in Watterson Park is $42,059.
What is Income or Wage Gap in Watterson Park?
Income or Wage Gap in Watterson Park is 10.3%.
Women in Watterson Park earn 89.7 cents for every dollar earned by a man.
What is Inequality or Gini Index in Watterson Park?
Inequality or Gini Index in Watterson Park is 0.39.
What is the Total Population of Watterson Park?
Total Population of Watterson Park is 807.
What is the Total Male Population of Watterson Park?
Total Male Population of Watterson Park is 483.
What is the Total Female Population of Watterson Park?
Total Female Population of Watterson Park is 324.
What is the Ratio of Males per 100 Females in Watterson Park?
There are 149.07 Males per 100 Females in Watterson Park.
What is the Ratio of Females per 100 Males in Watterson Park?
There are 67.08 Females per 100 Males in Watterson Park.
What is the Median Population Age in Watterson Park?
Median Population Age in Watterson Park is 40.3 Years.
What is the Average Family Size in Watterson Park
Average Family Size in Watterson Park is 3.2 People.
What is the Average Household Size in Watterson Park
Average Household Size in Watterson Park is 2.0 People.
How Large is the Labor Force in Watterson Park?
There are 388 People in the Labor Forcein in Watterson Park.
What is the Percentage of People in the Labor Force in Watterson Park?
61.3% of People are in the Labor Force in Watterson Park.
What is the Unemployment Rate in Watterson Park?
Unemployment Rate in Watterson Park is 5.7%.