Roman Forest, TX Map & Demographics
Roman Forest Map
Roman Forest Overview
$50,606
PER CAPITA INCOME
$118,462
AVG FAMILY INCOME
$117,652
AVG HOUSEHOLD INCOME
53.5%
WAGE / INCOME GAP [ % ]
46.5¢/ $1
WAGE / INCOME GAP [ $ ]
0.36
INEQUALITY / GINI INDEX
2,077
TOTAL POPULATION
981
MALE POPULATION
1,096
FEMALE POPULATION
89.51
MALES / 100 FEMALES
111.72
FEMALES / 100 MALES
43.8
MEDIAN AGE
3.0
AVG FAMILY SIZE
2.7
AVG HOUSEHOLD SIZE
1,040
LABOR FORCE [ PEOPLE ]
64.2%
PERCENT IN LABOR FORCE
4.3%
UNEMPLOYMENT RATE
Income in Roman Forest
Income Overview in Roman Forest
Per Capita Income in Roman Forest is $50,606, while median incomes of families and households are $118,462 and $117,652 respectively.
| Characteristic | Number | Measure |
| Per Capita Income | 2,077 | $50,606 |
| Median Family Income | 600 | $118,462 |
| Mean Family Income | 600 | $142,452 |
| Median Household Income | 752 | $117,652 |
| Mean Household Income | 752 | $138,627 |
| Income Deficit | 600 | $0 |
| Wage / Income Gap (%) | 2,077 | 53.47% |
| Wage / Income Gap ($) | 2,077 | 46.53¢ per $1 |
| Gini / Inequality Index | 2,077 | 0.36 |
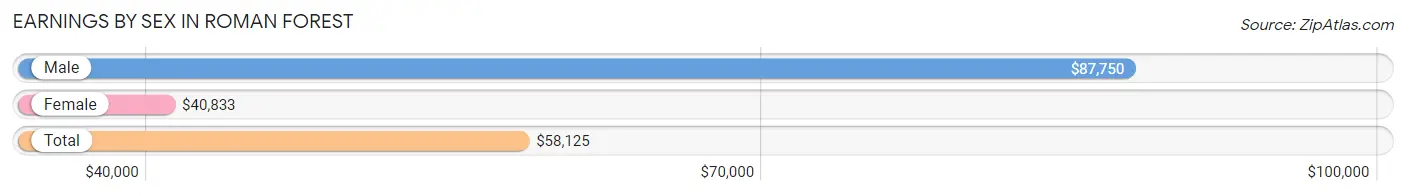
Earnings by Sex in Roman Forest
Average Earnings in Roman Forest are $58,125, $87,750 for men and $40,833 for women, a difference of 53.5%.
| Sex | Number | Average Earnings |
| Male | 613 (56.0%) | $87,750 |
| Female | 482 (44.0%) | $40,833 |
| Total | 1,095 (100.0%) | $58,125 |
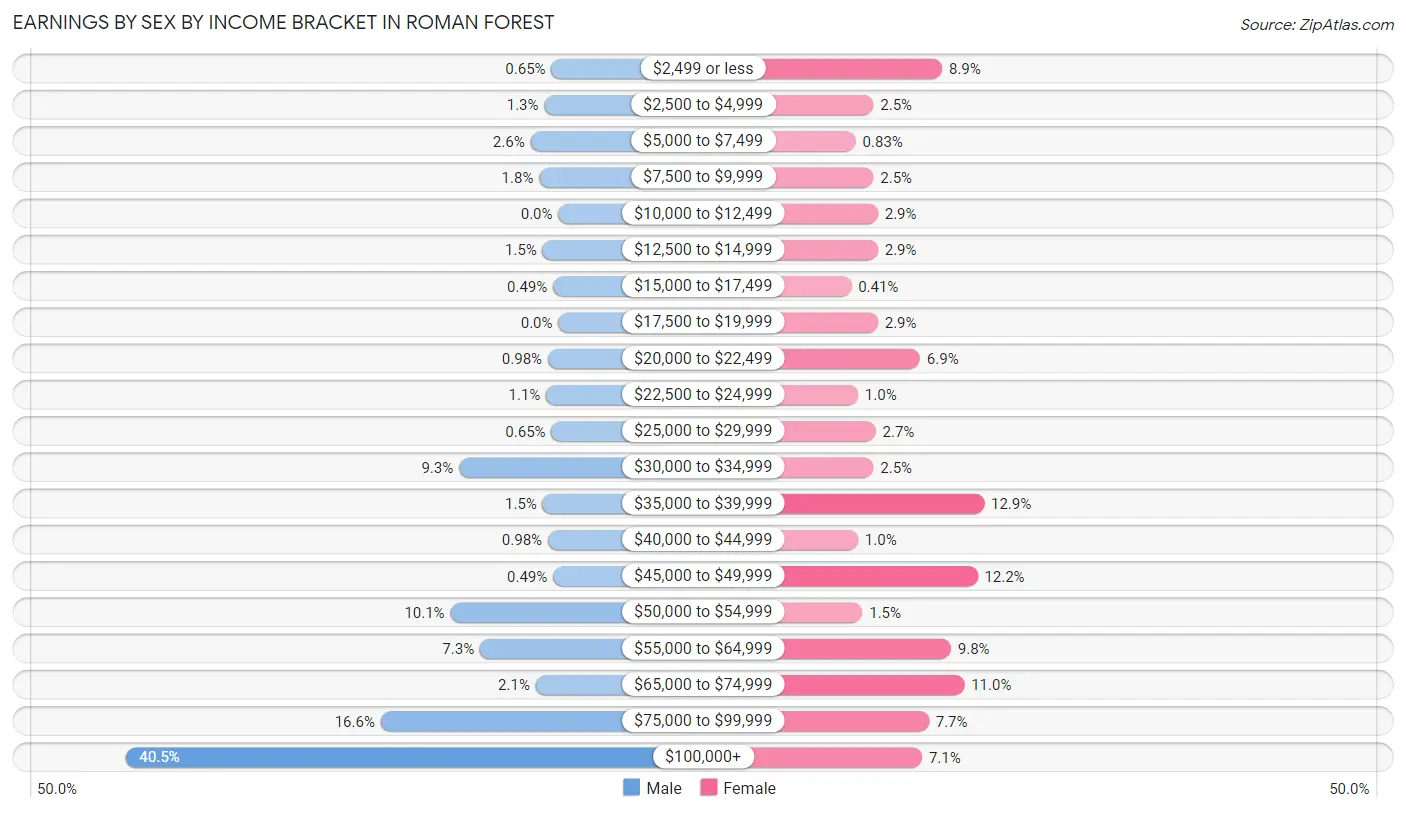
Earnings by Sex by Income Bracket in Roman Forest
The most common earnings brackets in Roman Forest are $100,000+ for men (248 | 40.5%) and $35,000 to $39,999 for women (62 | 12.9%).
| Income | Male | Female |
| $2,499 or less | 4 (0.6%) | 43 (8.9%) |
| $2,500 to $4,999 | 8 (1.3%) | 12 (2.5%) |
| $5,000 to $7,499 | 16 (2.6%) | 4 (0.8%) |
| $7,500 to $9,999 | 11 (1.8%) | 12 (2.5%) |
| $10,000 to $12,499 | 0 (0.0%) | 14 (2.9%) |
| $12,500 to $14,999 | 9 (1.5%) | 14 (2.9%) |
| $15,000 to $17,499 | 3 (0.5%) | 2 (0.4%) |
| $17,500 to $19,999 | 0 (0.0%) | 14 (2.9%) |
| $20,000 to $22,499 | 6 (1.0%) | 33 (6.9%) |
| $22,500 to $24,999 | 7 (1.1%) | 5 (1.0%) |
| $25,000 to $29,999 | 4 (0.6%) | 13 (2.7%) |
| $30,000 to $34,999 | 57 (9.3%) | 12 (2.5%) |
| $35,000 to $39,999 | 9 (1.5%) | 62 (12.9%) |
| $40,000 to $44,999 | 6 (1.0%) | 5 (1.0%) |
| $45,000 to $49,999 | 3 (0.5%) | 59 (12.2%) |
| $50,000 to $54,999 | 62 (10.1%) | 7 (1.5%) |
| $55,000 to $64,999 | 45 (7.3%) | 47 (9.8%) |
| $65,000 to $74,999 | 13 (2.1%) | 53 (11.0%) |
| $75,000 to $99,999 | 102 (16.6%) | 37 (7.7%) |
| $100,000+ | 248 (40.5%) | 34 (7.0%) |
| Total | 613 (100.0%) | 482 (100.0%) |
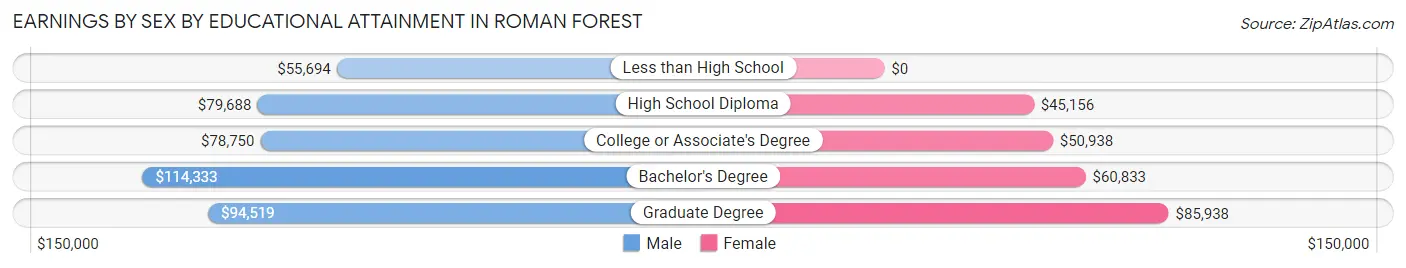
Earnings by Sex by Educational Attainment in Roman Forest
Average earnings in Roman Forest are $94,063 for men and $46,271 for women, a difference of 50.8%. Men with an educational attainment of bachelor's degree enjoy the highest average annual earnings of $114,333, while those with less than high school education earn the least with $55,694. Women with an educational attainment of graduate degree earn the most with the average annual earnings of $85,938, while those with high school diploma education have the smallest earnings of $45,156.
| Educational Attainment | Male Income | Female Income |
| Less than High School | $55,694 | $0 |
| High School Diploma | $79,688 | $45,156 |
| College or Associate's Degree | $78,750 | $50,938 |
| Bachelor's Degree | $114,333 | $60,833 |
| Graduate Degree | $94,519 | $85,938 |
| Total | $94,063 | $46,271 |
Family Income in Roman Forest
Family Income Brackets in Roman Forest
According to the Roman Forest family income data, there are 140 families falling into the $150,000 to $199,999 income range, which is the most common income bracket and makes up 23.3% of all families.
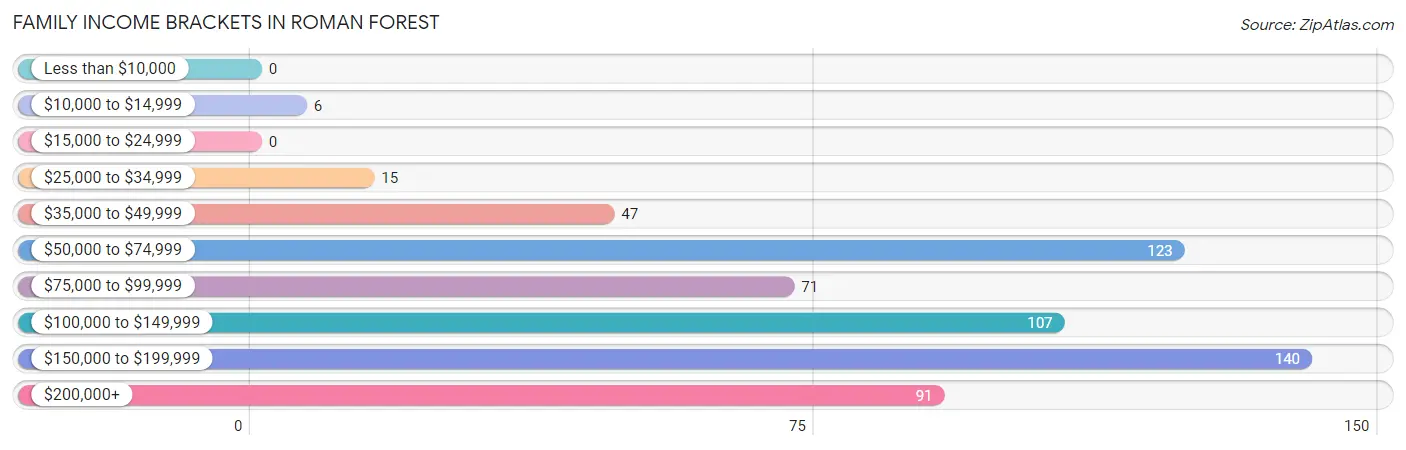
| Income Bracket | # Families | % Families |
| Less than $10,000 | 0 | 0.0% |
| $10,000 to $14,999 | 6 | 1.0% |
| $15,000 to $24,999 | 0 | 0.0% |
| $25,000 to $34,999 | 15 | 2.5% |
| $35,000 to $49,999 | 47 | 7.8% |
| $50,000 to $74,999 | 123 | 20.5% |
| $75,000 to $99,999 | 71 | 11.8% |
| $100,000 to $149,999 | 107 | 17.8% |
| $150,000 to $199,999 | 140 | 23.3% |
| $200,000+ | 91 | 15.2% |
Family Income by Famaliy Size in Roman Forest
2-person families (326 | 54.3%) account for the highest median family income in Roman Forest with $135,938 per family, while 2-person families (326 | 54.3%) have the highest median income of $67,969 per family member.
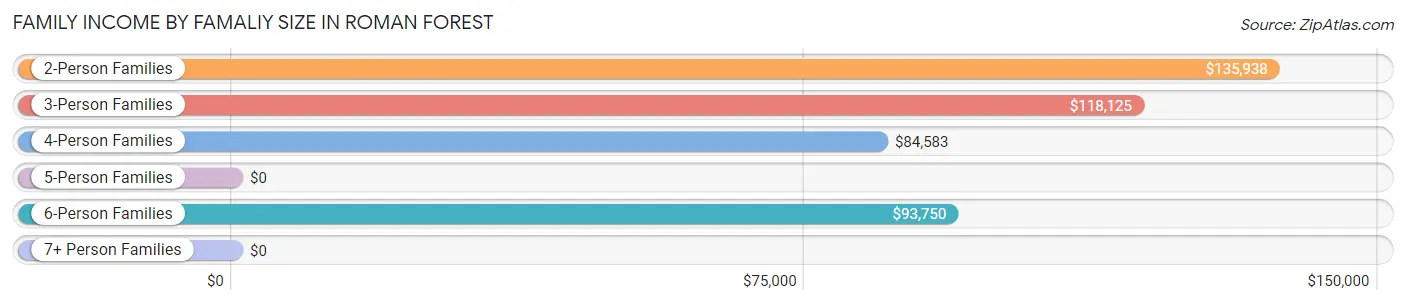
| Income Bracket | # Families | Median Income |
| 2-Person Families | 326 (54.3%) | $135,938 |
| 3-Person Families | 101 (16.8%) | $118,125 |
| 4-Person Families | 99 (16.5%) | $84,583 |
| 5-Person Families | 54 (9.0%) | $0 |
| 6-Person Families | 12 (2.0%) | $93,750 |
| 7+ Person Families | 8 (1.3%) | $0 |
| Total | 600 (100.0%) | $118,462 |
Family Income by Number of Earners in Roman Forest
The median family income in Roman Forest is $118,462, with families comprising 3+ earners (46) having the highest median family income of $171,250, while families with no earners (64) have the lowest median family income of $61,667, accounting for 7.7% and 10.7% of families, respectively.
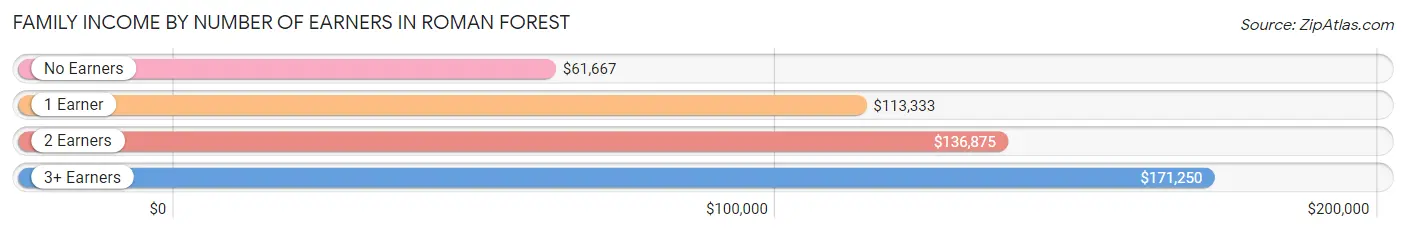
| Number of Earners | # Families | Median Income |
| No Earners | 64 (10.7%) | $61,667 |
| 1 Earner | 264 (44.0%) | $113,333 |
| 2 Earners | 226 (37.7%) | $136,875 |
| 3+ Earners | 46 (7.7%) | $171,250 |
| Total | 600 (100.0%) | $118,462 |
Household Income in Roman Forest
Household Income Brackets in Roman Forest
With 148 households falling in the category, the $100,000 to $149,999 income range is the most frequent in Roman Forest, accounting for 19.7% of all households.
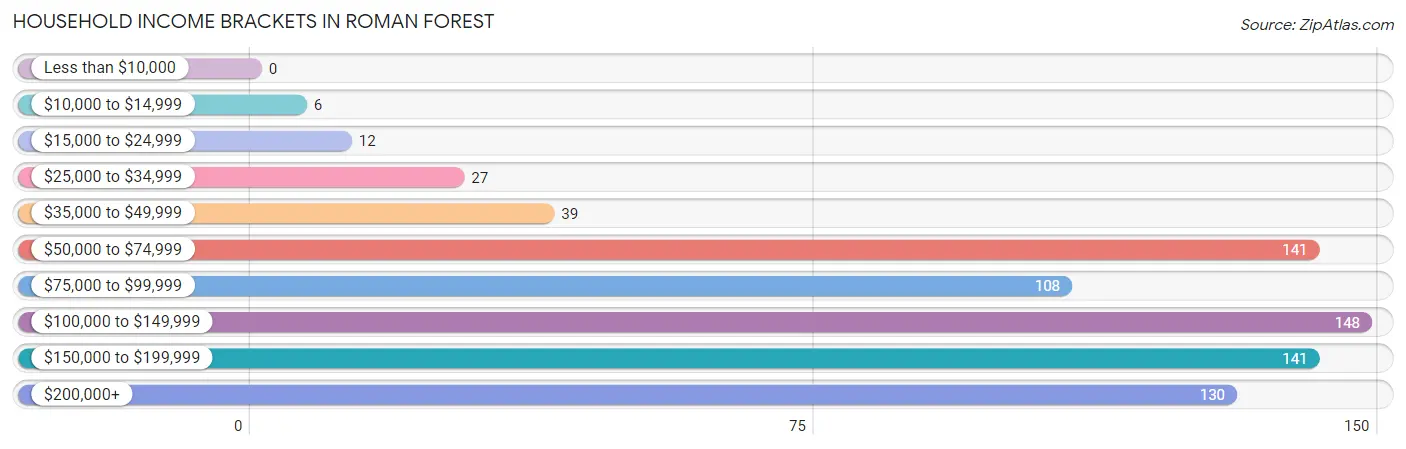
| Income Bracket | # Households | % Households |
| Less than $10,000 | 0 | 0.0% |
| $10,000 to $14,999 | 6 | 0.8% |
| $15,000 to $24,999 | 12 | 1.6% |
| $25,000 to $34,999 | 27 | 3.6% |
| $35,000 to $49,999 | 39 | 5.2% |
| $50,000 to $74,999 | 141 | 18.8% |
| $75,000 to $99,999 | 108 | 14.4% |
| $100,000 to $149,999 | 148 | 19.7% |
| $150,000 to $199,999 | 141 | 18.8% |
| $200,000+ | 130 | 17.3% |
Household Income by Householder Age in Roman Forest
The median household income in Roman Forest is $117,652, with the highest median household income of $128,636 found in the 25 to 44 years age bracket for the primary householder. A total of 270 households (35.9%) fall into this category.
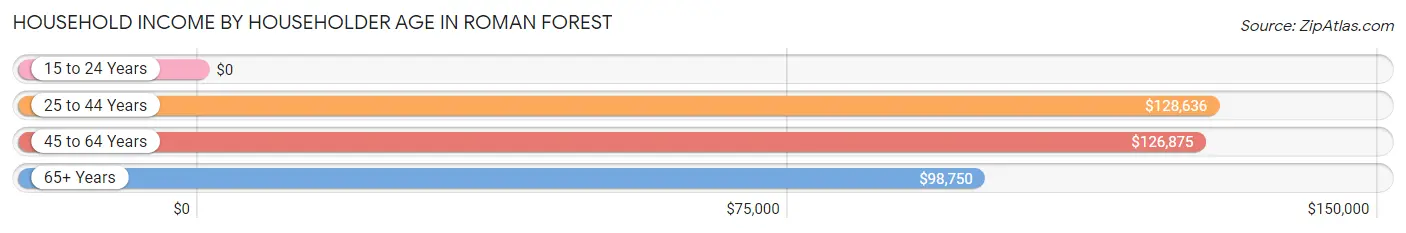
| Income Bracket | # Households | Median Income |
| 15 to 24 Years | 0 (0.0%) | $0 |
| 25 to 44 Years | 270 (35.9%) | $128,636 |
| 45 to 64 Years | 243 (32.3%) | $126,875 |
| 65+ Years | 239 (31.8%) | $98,750 |
| Total | 752 (100.0%) | $117,652 |
Poverty in Roman Forest
Income Below Poverty by Sex and Age in Roman Forest
With 0.9% poverty level for males and 3.3% for females among the residents of Roman Forest, 35 to 44 year old males and under 5 year old females are the most vulnerable to poverty, with 6 males (5.4%) and 13 females (17.3%) in their respective age groups living below the poverty level.
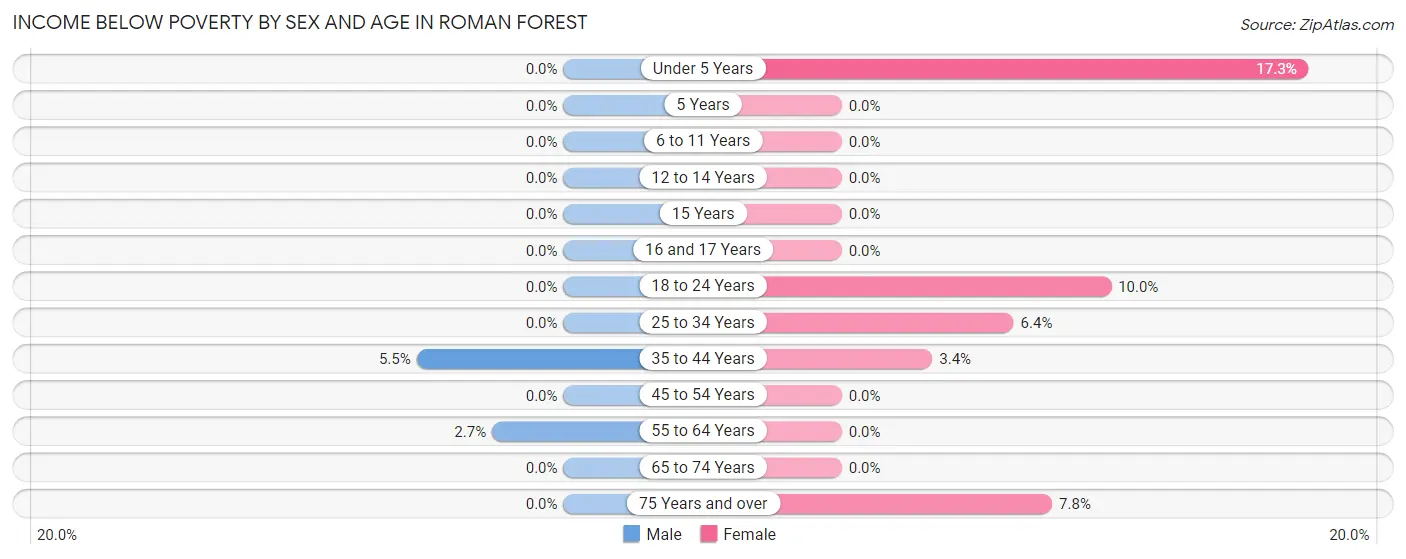
| Age Bracket | Male | Female |
| Under 5 Years | 0 (0.0%) | 13 (17.3%) |
| 5 Years | 0 (0.0%) | 0 (0.0%) |
| 6 to 11 Years | 0 (0.0%) | 0 (0.0%) |
| 12 to 14 Years | 0 (0.0%) | 0 (0.0%) |
| 15 Years | 0 (0.0%) | 0 (0.0%) |
| 16 and 17 Years | 0 (0.0%) | 0 (0.0%) |
| 18 to 24 Years | 0 (0.0%) | 8 (10.0%) |
| 25 to 34 Years | 0 (0.0%) | 6 (6.4%) |
| 35 to 44 Years | 6 (5.4%) | 4 (3.4%) |
| 45 to 54 Years | 0 (0.0%) | 0 (0.0%) |
| 55 to 64 Years | 3 (2.6%) | 0 (0.0%) |
| 65 to 74 Years | 0 (0.0%) | 0 (0.0%) |
| 75 Years and over | 0 (0.0%) | 5 (7.8%) |
| Total | 9 (0.9%) | 36 (3.3%) |
Income Above Poverty by Sex and Age in Roman Forest
According to the poverty statistics in Roman Forest, males aged under 5 years and females aged 5 years are the age groups that are most secure financially, with 100.0% of males and 100.0% of females in these age groups living above the poverty line.
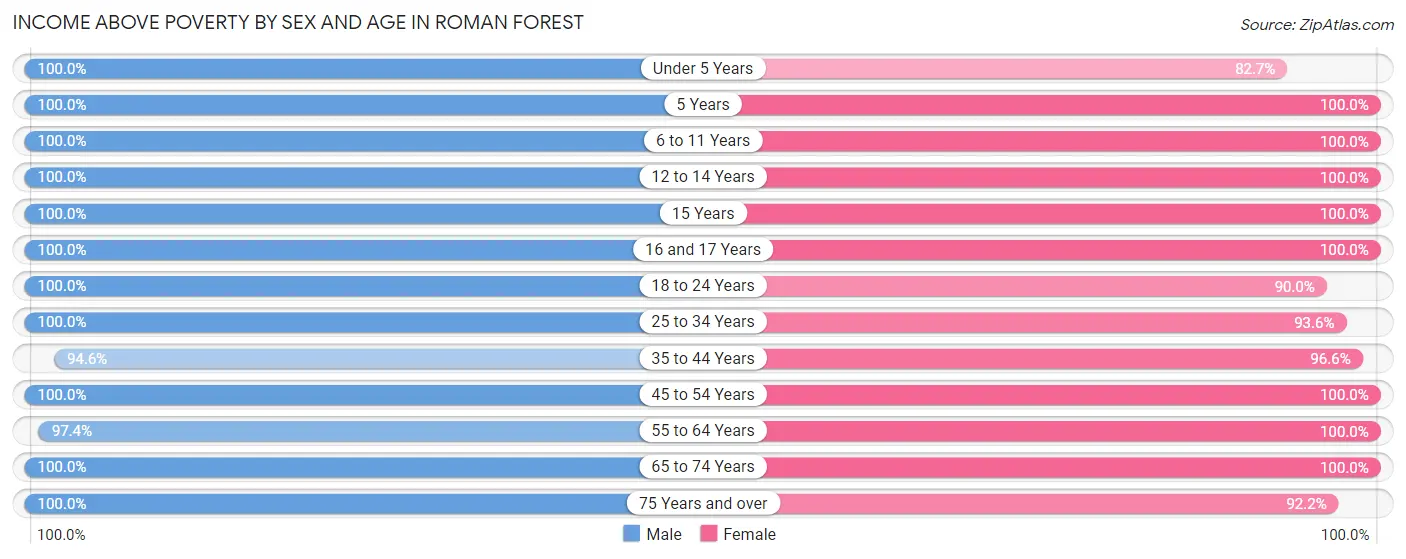
| Age Bracket | Male | Female |
| Under 5 Years | 66 (100.0%) | 62 (82.7%) |
| 5 Years | 17 (100.0%) | 8 (100.0%) |
| 6 to 11 Years | 49 (100.0%) | 102 (100.0%) |
| 12 to 14 Years | 26 (100.0%) | 69 (100.0%) |
| 15 Years | 27 (100.0%) | 2 (100.0%) |
| 16 and 17 Years | 13 (100.0%) | 22 (100.0%) |
| 18 to 24 Years | 90 (100.0%) | 72 (90.0%) |
| 25 to 34 Years | 120 (100.0%) | 88 (93.6%) |
| 35 to 44 Years | 104 (94.6%) | 115 (96.6%) |
| 45 to 54 Years | 148 (100.0%) | 174 (100.0%) |
| 55 to 64 Years | 110 (97.4%) | 93 (100.0%) |
| 65 to 74 Years | 145 (100.0%) | 178 (100.0%) |
| 75 Years and over | 57 (100.0%) | 59 (92.2%) |
| Total | 972 (99.1%) | 1,044 (96.7%) |
Income Below Poverty Among Married-Couple Families in Roman Forest
The poverty statistics for married-couple families in Roman Forest show that 1.2% or 6 of the total 508 families live below the poverty line. Families with 1 or 2 children have the highest poverty rate of 3.5%, comprising of 6 families. On the other hand, families with no children have the lowest poverty rate of 0.0%, which includes 0 families.
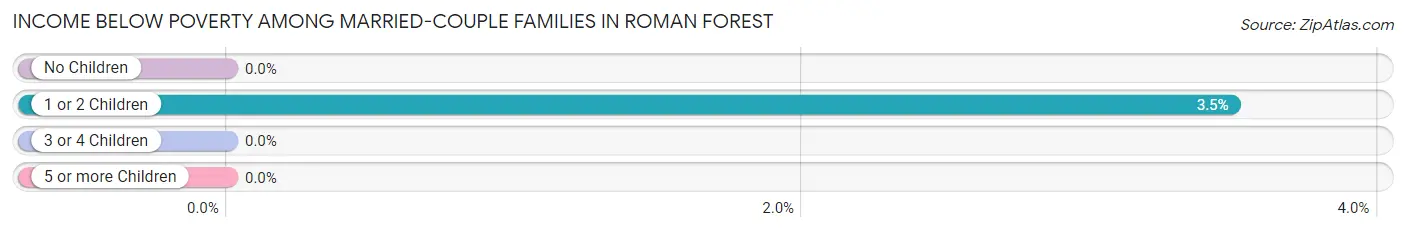
| Children | Above Poverty | Below Poverty |
| No Children | 314 (100.0%) | 0 (0.0%) |
| 1 or 2 Children | 166 (96.5%) | 6 (3.5%) |
| 3 or 4 Children | 19 (100.0%) | 0 (0.0%) |
| 5 or more Children | 3 (100.0%) | 0 (0.0%) |
| Total | 502 (98.8%) | 6 (1.2%) |
Income Below Poverty Among Single-Parent Households in Roman Forest
| Children | Single Father | Single Mother |
| No Children | 0 (0.0%) | 0 (0.0%) |
| 1 or 2 Children | 0 (0.0%) | 0 (0.0%) |
| 3 or 4 Children | 0 (0.0%) | 0 (0.0%) |
| 5 or more Children | 0 (0.0%) | 0 (0.0%) |
| Total | 0 (0.0%) | 0 (0.0%) |
Income Below Poverty Among Married-Couple vs Single-Parent Households in Roman Forest
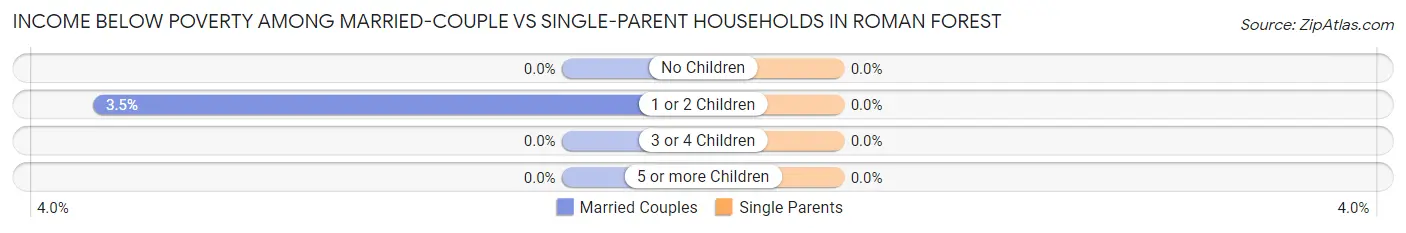
| Children | Married-Couple Families | Single-Parent Households |
| No Children | 0 (0.0%) | 0 (0.0%) |
| 1 or 2 Children | 6 (3.5%) | 0 (0.0%) |
| 3 or 4 Children | 0 (0.0%) | 0 (0.0%) |
| 5 or more Children | 0 (0.0%) | 0 (0.0%) |
| Total | 6 (1.2%) | 0 (0.0%) |
Race in Roman Forest
The most populous races in Roman Forest are White / Caucasian (1,763 | 84.9%), Hispanic or Latino (357 | 17.2%), and Two or more Races (193 | 9.3%).
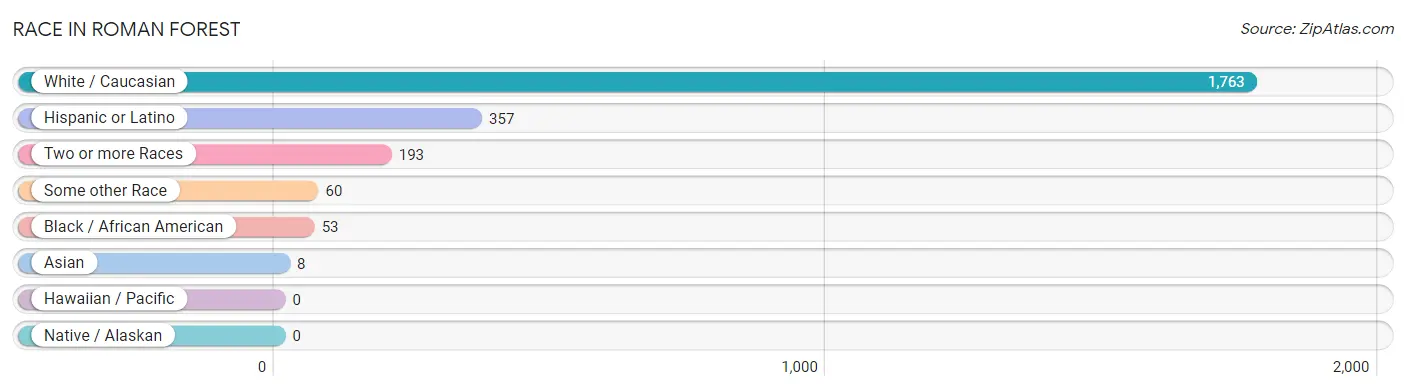
| Race | # Population | % Population |
| Asian | 8 | 0.4% |
| Black / African American | 53 | 2.5% |
| Hawaiian / Pacific | 0 | 0.0% |
| Hispanic or Latino | 357 | 17.2% |
| Native / Alaskan | 0 | 0.0% |
| White / Caucasian | 1,763 | 84.9% |
| Two or more Races | 193 | 9.3% |
| Some other Race | 60 | 2.9% |
| Total | 2,077 | 100.0% |
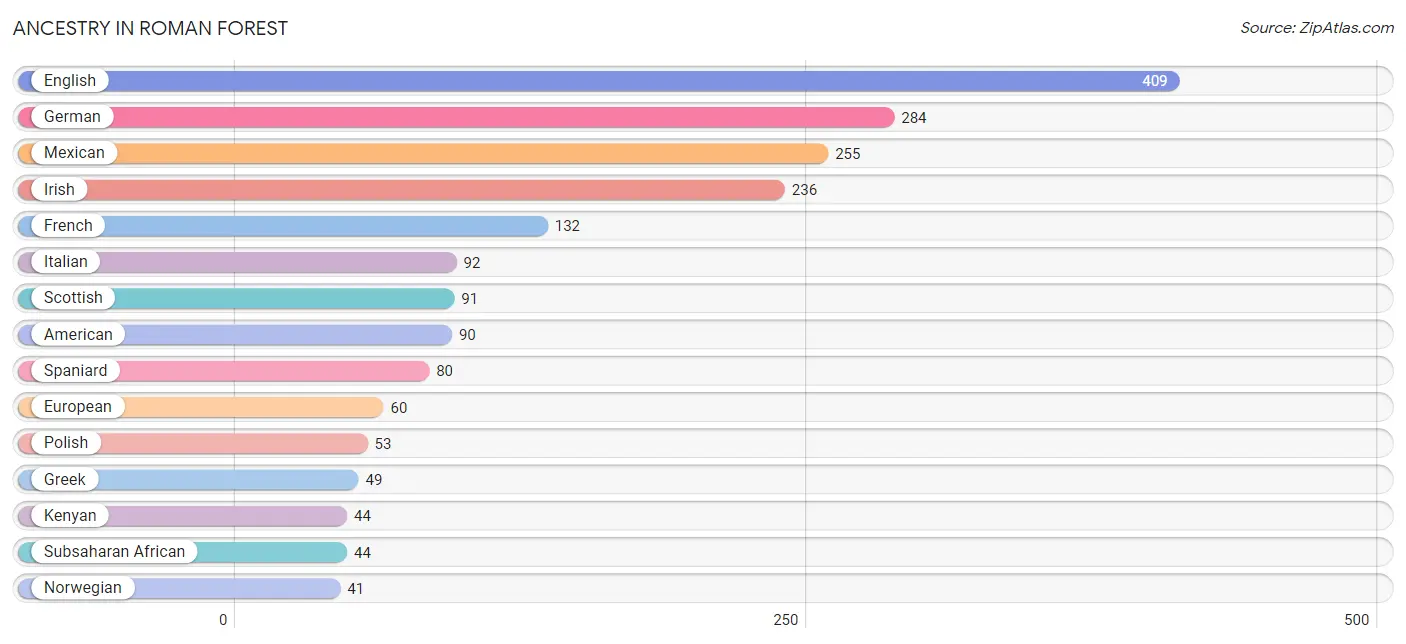
Ancestry in Roman Forest
The most populous ancestries reported in Roman Forest are English (409 | 19.7%), German (284 | 13.7%), Mexican (255 | 12.3%), Irish (236 | 11.4%), and French (132 | 6.4%), together accounting for 63.4% of all Roman Forest residents.
| Ancestry | # Population | % Population |
| Alsatian | 2 | 0.1% |
| American | 90 | 4.3% |
| Arab | 2 | 0.1% |
| Argentinean | 2 | 0.1% |
| Belizean | 5 | 0.2% |
| Bhutanese | 4 | 0.2% |
| Burmese | 14 | 0.7% |
| Cajun | 4 | 0.2% |
| Canadian | 4 | 0.2% |
| Central American | 3 | 0.1% |
| Cherokee | 11 | 0.5% |
| Cuban | 8 | 0.4% |
| Czech | 9 | 0.4% |
| Czechoslovakian | 2 | 0.1% |
| Dutch | 32 | 1.5% |
| Eastern European | 8 | 0.4% |
| Egyptian | 2 | 0.1% |
| English | 409 | 19.7% |
| European | 60 | 2.9% |
| French | 132 | 6.4% |
| German | 284 | 13.7% |
| Greek | 49 | 2.4% |
| Indian (Asian) | 3 | 0.1% |
| Irish | 236 | 11.4% |
| Italian | 92 | 4.4% |
| Japanese | 2 | 0.1% |
| Kenyan | 44 | 2.1% |
| Mexican | 255 | 12.3% |
| Norwegian | 41 | 2.0% |
| Polish | 53 | 2.5% |
| Portuguese | 6 | 0.3% |
| Romanian | 2 | 0.1% |
| Salvadoran | 3 | 0.1% |
| Scotch-Irish | 6 | 0.3% |
| Scottish | 91 | 4.4% |
| South American | 2 | 0.1% |
| Spaniard | 80 | 3.8% |
| Subsaharan African | 44 | 2.1% |
| Swedish | 3 | 0.1% |
| Thai | 3 | 0.1% |
| Welsh | 13 | 0.6% | View All 41 Rows |
Immigrants in Roman Forest
The most numerous immigrant groups reported in Roman Forest came from Europe (31 | 1.5%), Latin America (31 | 1.5%), Central America (28 | 1.3%), Mexico (28 | 1.3%), and Northern Europe (20 | 1.0%), together accounting for 6.6% of all Roman Forest residents.
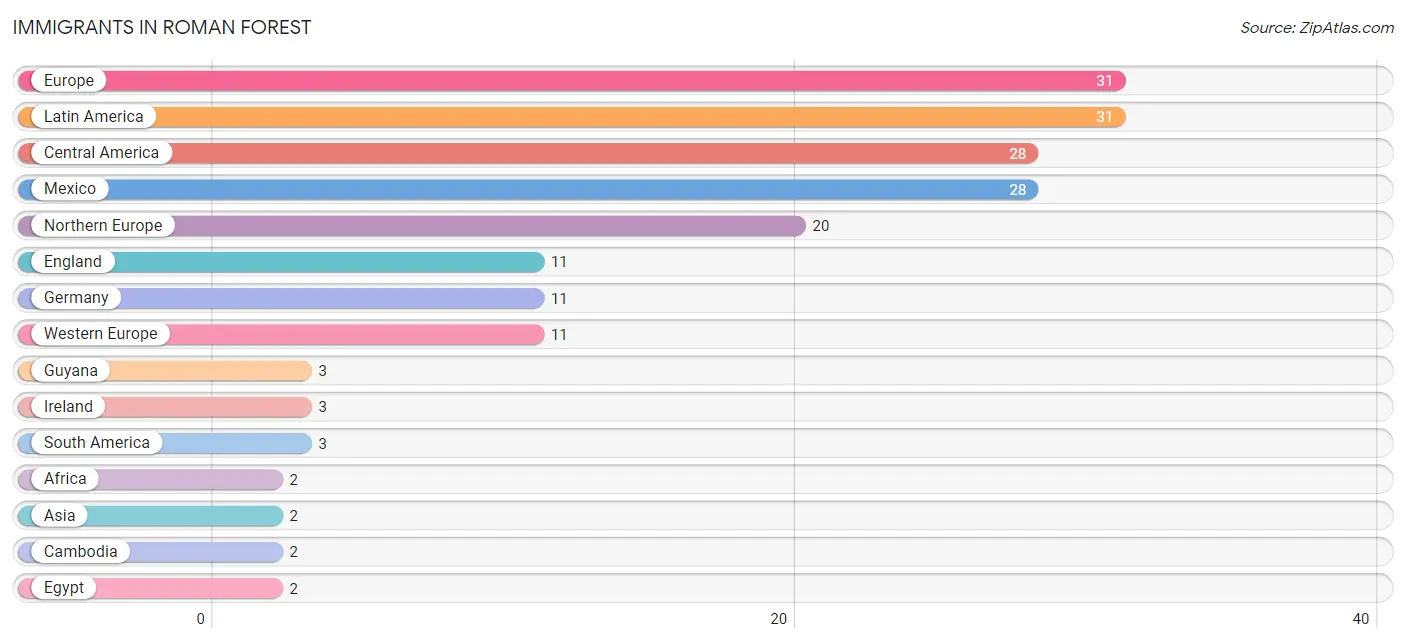
| Immigration Origin | # Population | % Population |
| Africa | 2 | 0.1% |
| Asia | 2 | 0.1% |
| Cambodia | 2 | 0.1% |
| Central America | 28 | 1.3% |
| Egypt | 2 | 0.1% |
| England | 11 | 0.5% |
| Europe | 31 | 1.5% |
| Germany | 11 | 0.5% |
| Guyana | 3 | 0.1% |
| Ireland | 3 | 0.1% |
| Latin America | 31 | 1.5% |
| Mexico | 28 | 1.3% |
| Northern Africa | 2 | 0.1% |
| Northern Europe | 20 | 1.0% |
| South America | 3 | 0.1% |
| South Eastern Asia | 2 | 0.1% |
| Western Europe | 11 | 0.5% | View All 17 Rows |
Sex and Age in Roman Forest
Sex and Age in Roman Forest
The most populous age groups in Roman Forest are 50 to 54 Years (115 | 11.7%) for men and 50 to 54 Years (125 | 11.4%) for women.
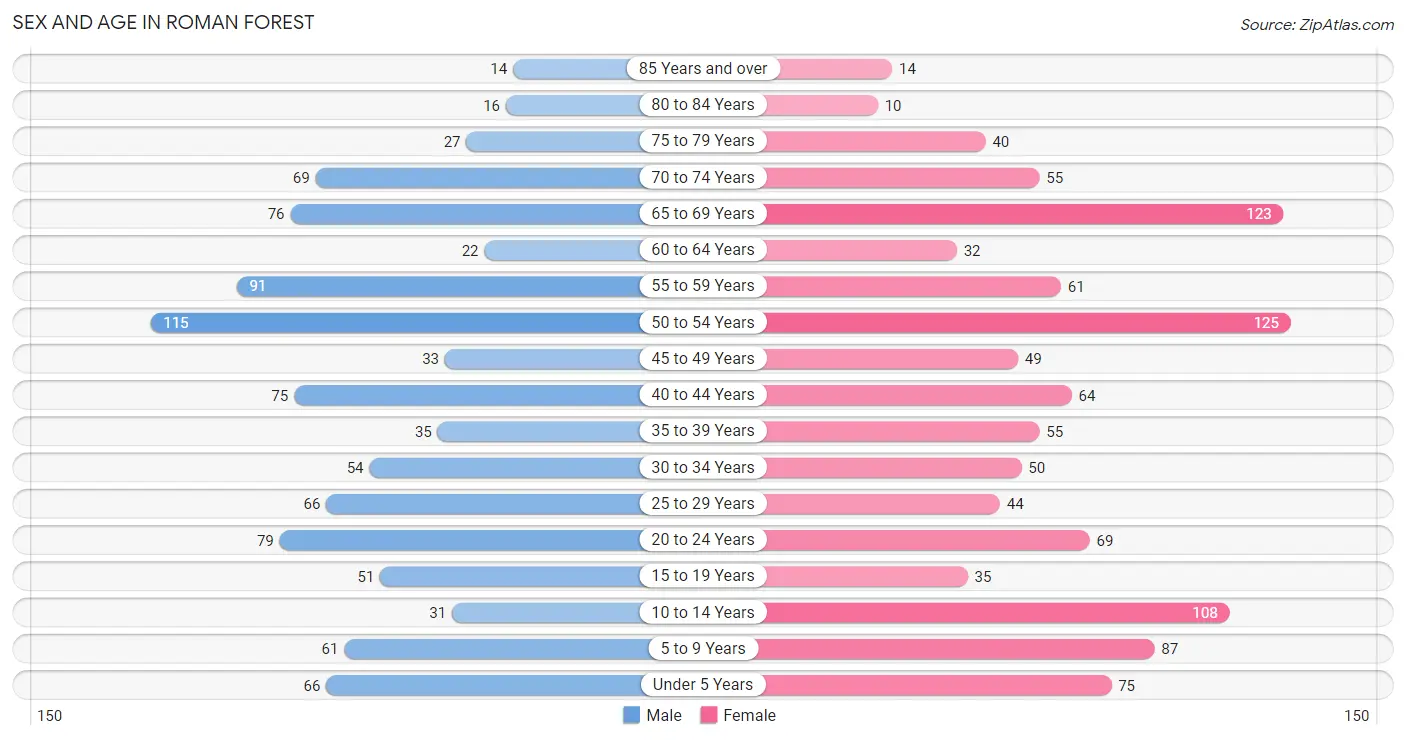
| Age Bracket | Male | Female |
| Under 5 Years | 66 (6.7%) | 75 (6.8%) |
| 5 to 9 Years | 61 (6.2%) | 87 (7.9%) |
| 10 to 14 Years | 31 (3.2%) | 108 (9.9%) |
| 15 to 19 Years | 51 (5.2%) | 35 (3.2%) |
| 20 to 24 Years | 79 (8.1%) | 69 (6.3%) |
| 25 to 29 Years | 66 (6.7%) | 44 (4.0%) |
| 30 to 34 Years | 54 (5.5%) | 50 (4.6%) |
| 35 to 39 Years | 35 (3.6%) | 55 (5.0%) |
| 40 to 44 Years | 75 (7.6%) | 64 (5.8%) |
| 45 to 49 Years | 33 (3.4%) | 49 (4.5%) |
| 50 to 54 Years | 115 (11.7%) | 125 (11.4%) |
| 55 to 59 Years | 91 (9.3%) | 61 (5.6%) |
| 60 to 64 Years | 22 (2.2%) | 32 (2.9%) |
| 65 to 69 Years | 76 (7.7%) | 123 (11.2%) |
| 70 to 74 Years | 69 (7.0%) | 55 (5.0%) |
| 75 to 79 Years | 27 (2.8%) | 40 (3.6%) |
| 80 to 84 Years | 16 (1.6%) | 10 (0.9%) |
| 85 Years and over | 14 (1.4%) | 14 (1.3%) |
| Total | 981 (100.0%) | 1,096 (100.0%) |
Families and Households in Roman Forest
Median Family Size in Roman Forest
The median family size in Roman Forest is 2.98 persons per family, with married-couple families (508 | 84.7%) accounting for the largest median family size of 3.08 persons per family. On the other hand, single male/father families (37 | 6.2%) represent the smallest median family size with 2.35 persons per family.
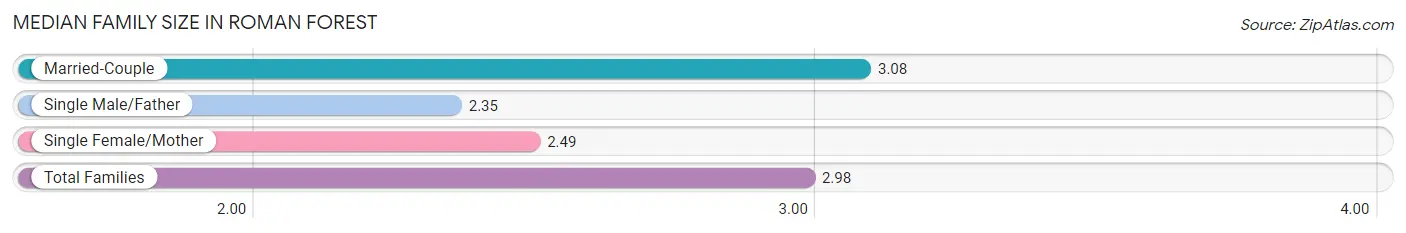
| Family Type | # Families | Family Size |
| Married-Couple | 508 (84.7%) | 3.08 |
| Single Male/Father | 37 (6.2%) | 2.35 |
| Single Female/Mother | 55 (9.2%) | 2.49 |
| Total Families | 600 (100.0%) | 2.98 |
Median Household Size in Roman Forest
The median household size in Roman Forest is 2.74 persons per household, with married-couple households (508 | 67.5%) accounting for the largest median household size of 3.11 persons per household. non-family households (152 | 20.2%) represent the smallest median household size with 1.61 persons per household.
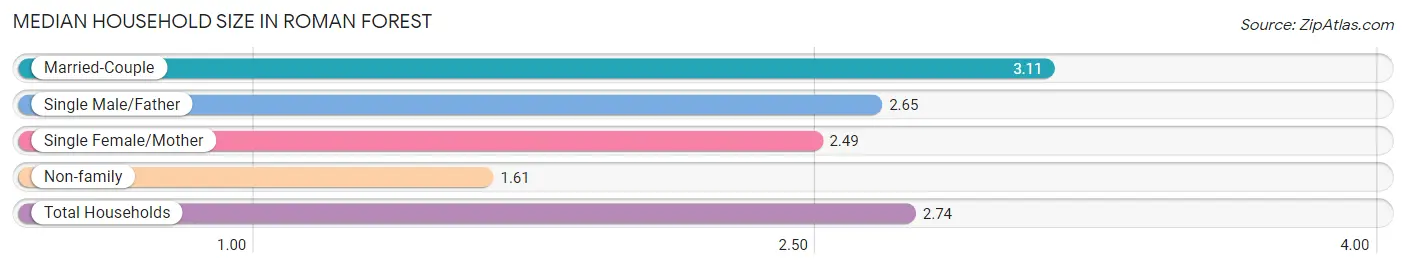
| Household Type | # Households | Household Size |
| Married-Couple | 508 (67.5%) | 3.11 |
| Single Male/Father | 37 (4.9%) | 2.65 |
| Single Female/Mother | 55 (7.3%) | 2.49 |
| Non-family | 152 (20.2%) | 1.61 |
| Total Households | 752 (100.0%) | 2.74 |
Household Size by Marriage Status in Roman Forest
Out of a total of 752 households in Roman Forest, 600 (79.8%) are family households, while 152 (20.2%) are nonfamily households. The most numerous type of family households are 2-person households, comprising 312, and the most common type of nonfamily households are 1-person households, comprising 108.
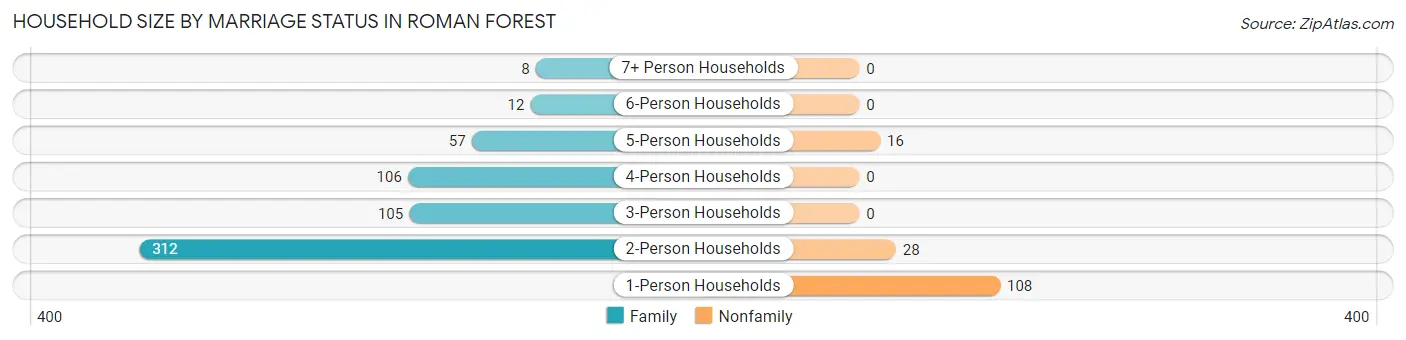
| Household Size | Family Households | Nonfamily Households |
| 1-Person Households | - | 108 (14.4%) |
| 2-Person Households | 312 (41.5%) | 28 (3.7%) |
| 3-Person Households | 105 (14.0%) | 0 (0.0%) |
| 4-Person Households | 106 (14.1%) | 0 (0.0%) |
| 5-Person Households | 57 (7.6%) | 16 (2.1%) |
| 6-Person Households | 12 (1.6%) | 0 (0.0%) |
| 7+ Person Households | 8 (1.1%) | 0 (0.0%) |
| Total | 600 (79.8%) | 152 (20.2%) |
Female Fertility in Roman Forest
Fertility by Age in Roman Forest
Average fertility rate in Roman Forest is 118.0 births per 1,000 women. Women in the age bracket of 20 to 34 years have the highest fertility rate with 215.0 births per 1,000 women. Women in the age bracket of 20 to 34 years acount for 77.8% of all women with births.
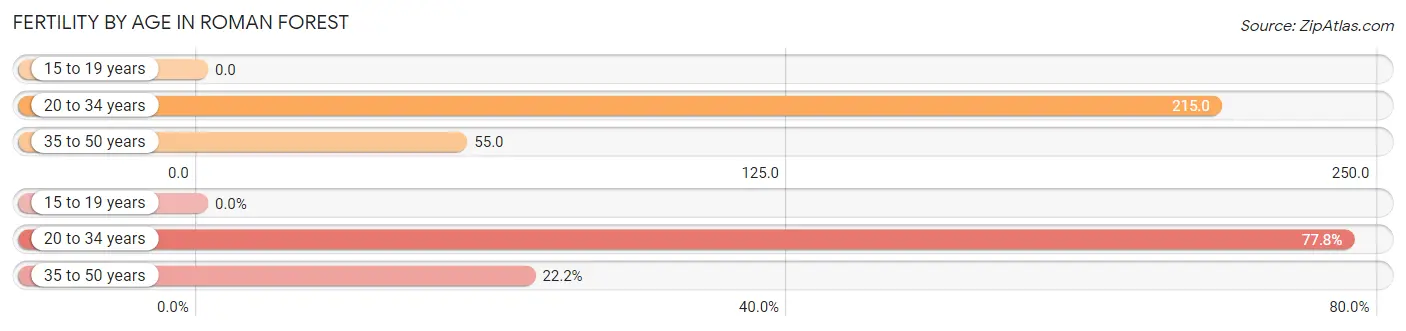
| Age Bracket | Women with Births | Births / 1,000 Women |
| 15 to 19 years | 0 (0.0%) | 0.0 |
| 20 to 34 years | 35 (77.8%) | 215.0 |
| 35 to 50 years | 10 (22.2%) | 55.0 |
| Total | 45 (100.0%) | 118.0 |
Fertility by Age by Marriage Status in Roman Forest
60.0% of women with births (45) in Roman Forest are married. The highest percentage of unmarried women with births falls into 20 to 34 years age bracket with 51.4% of them unmarried at the time of birth, while the lowest percentage of unmarried women with births belong to 35 to 50 years age bracket with 0.0% of them unmarried.
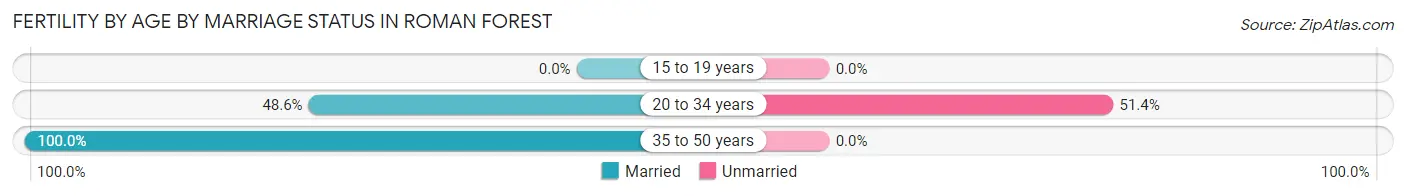
| Age Bracket | Married | Unmarried |
| 15 to 19 years | 0 (0.0%) | 0 (0.0%) |
| 20 to 34 years | 17 (48.6%) | 18 (51.4%) |
| 35 to 50 years | 10 (100.0%) | 0 (0.0%) |
| Total | 27 (60.0%) | 18 (40.0%) |
Fertility by Education in Roman Forest
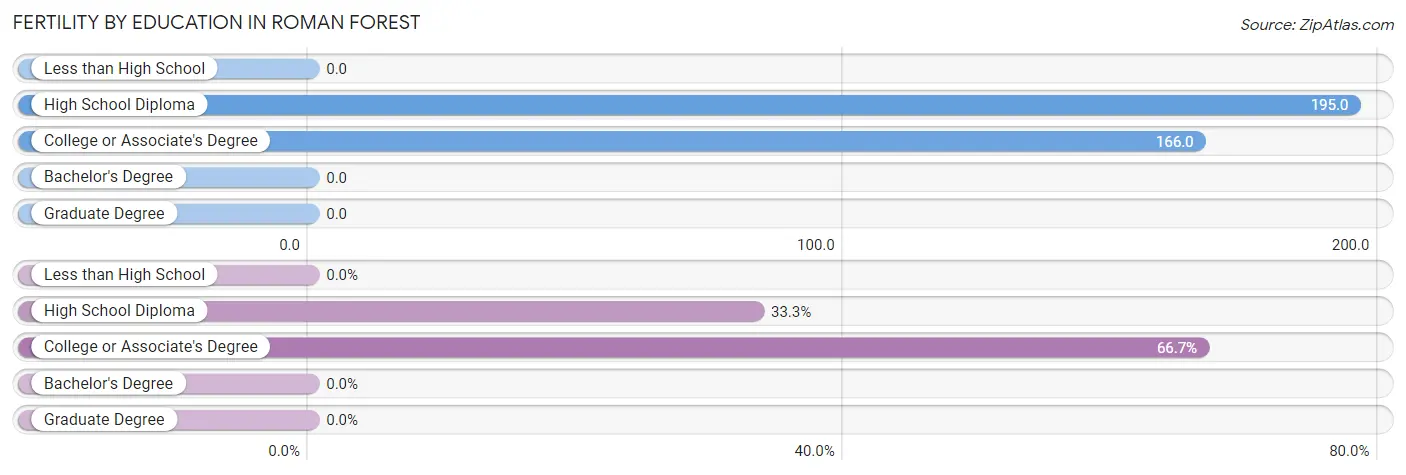
| Educational Attainment | Women with Births | Births / 1,000 Women |
| Less than High School | 0 (0.0%) | 0.0 |
| High School Diploma | 15 (33.3%) | 195.0 |
| College or Associate's Degree | 30 (66.7%) | 166.0 |
| Bachelor's Degree | 0 (0.0%) | 0.0 |
| Graduate Degree | 0 (0.0%) | 0.0 |
| Total | 45 (100.0%) | 118.0 |
Fertility by Education by Marriage Status in Roman Forest
40.0% of women with births in Roman Forest are unmarried. Women with the educational attainment of college or associate's degree are most likely to be married with 90.0% of them married at childbirth, while women with the educational attainment of high school diploma are least likely to be married with 100.0% of them unmarried at childbirth.
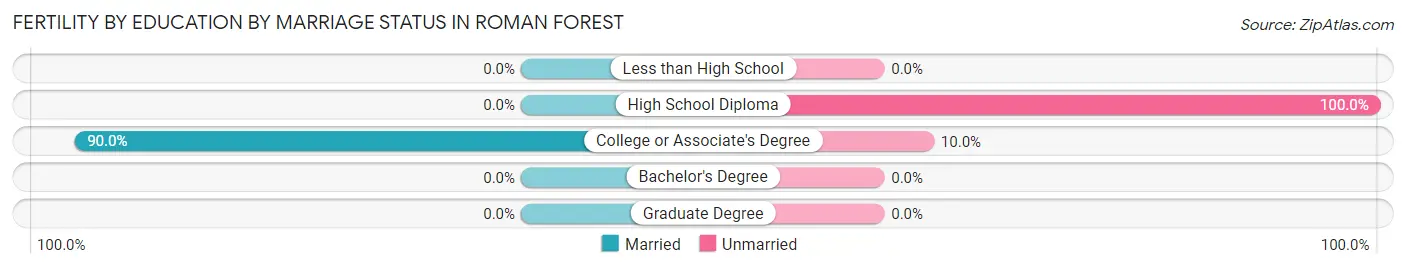
| Educational Attainment | Married | Unmarried |
| Less than High School | 0 (0.0%) | 0 (0.0%) |
| High School Diploma | 0 (0.0%) | 15 (100.0%) |
| College or Associate's Degree | 27 (90.0%) | 3 (10.0%) |
| Bachelor's Degree | 0 (0.0%) | 0 (0.0%) |
| Graduate Degree | 0 (0.0%) | 0 (0.0%) |
| Total | 27 (60.0%) | 18 (40.0%) |
Employment Characteristics in Roman Forest
Employment by Class of Employer in Roman Forest
Among the 974 employed individuals in Roman Forest, private company employees (730 | 75.0%), state government employees (85 | 8.7%), and local government employees (49 | 5.0%) make up the most common classes of employment.
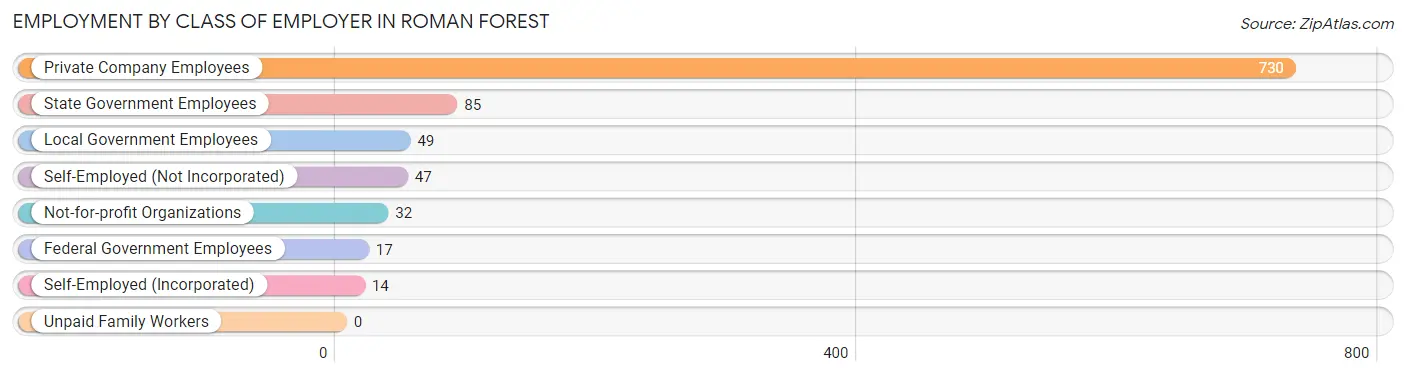
| Employer Class | # Employees | % Employees |
| Private Company Employees | 730 | 75.0% |
| Self-Employed (Incorporated) | 14 | 1.4% |
| Self-Employed (Not Incorporated) | 47 | 4.8% |
| Not-for-profit Organizations | 32 | 3.3% |
| Local Government Employees | 49 | 5.0% |
| State Government Employees | 85 | 8.7% |
| Federal Government Employees | 17 | 1.8% |
| Unpaid Family Workers | 0 | 0.0% |
| Total | 974 | 100.0% |
Employment Status by Age in Roman Forest
According to the labor force statistics for Roman Forest, out of the total population over 16 years of age (1,620), 64.2% or 1,040 individuals are in the labor force, with 4.3% or 45 of them unemployed. The age group with the highest labor force participation rate is 45 to 54 years, with 90.1% or 290 individuals in the labor force. Within the labor force, the 25 to 29 years age range has the highest percentage of unemployed individuals, with 15.6% or 14 of them being unemployed.
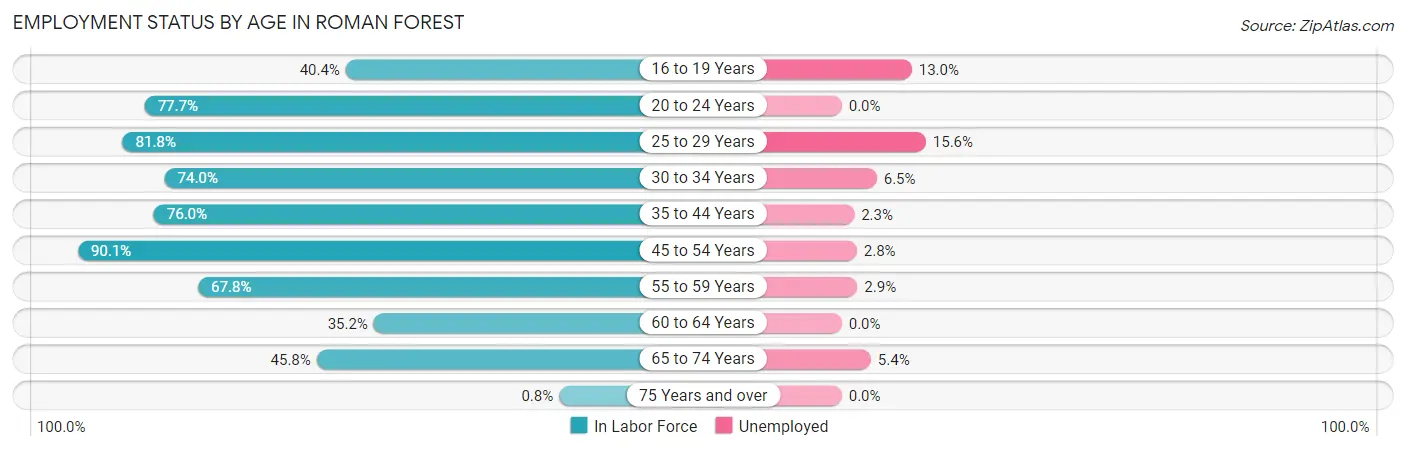
| Age Bracket | In Labor Force | Unemployed |
| 16 to 19 Years | 23 (40.4%) | 3 (13.0%) |
| 20 to 24 Years | 115 (77.7%) | 0 (0.0%) |
| 25 to 29 Years | 90 (81.8%) | 14 (15.6%) |
| 30 to 34 Years | 77 (74.0%) | 5 (6.5%) |
| 35 to 44 Years | 174 (76.0%) | 4 (2.3%) |
| 45 to 54 Years | 290 (90.1%) | 8 (2.8%) |
| 55 to 59 Years | 103 (67.8%) | 3 (2.9%) |
| 60 to 64 Years | 19 (35.2%) | 0 (0.0%) |
| 65 to 74 Years | 148 (45.8%) | 8 (5.4%) |
| 75 Years and over | 1 (0.8%) | 0 (0.0%) |
| Total | 1,040 (64.2%) | 45 (4.3%) |
Employment Status by Educational Attainment in Roman Forest
According to labor force statistics for Roman Forest, 77.5% of individuals (753) out of the total population between 25 and 64 years of age (971) are in the labor force, with 4.5% or 34 of them being unemployed. The group with the highest labor force participation rate are those with the educational attainment of bachelor's degree or higher, with 89.3% or 233 individuals in the labor force. Within the labor force, individuals with less than high school education have the highest percentage of unemployment, with 13.3% or 2 of them being unemployed.
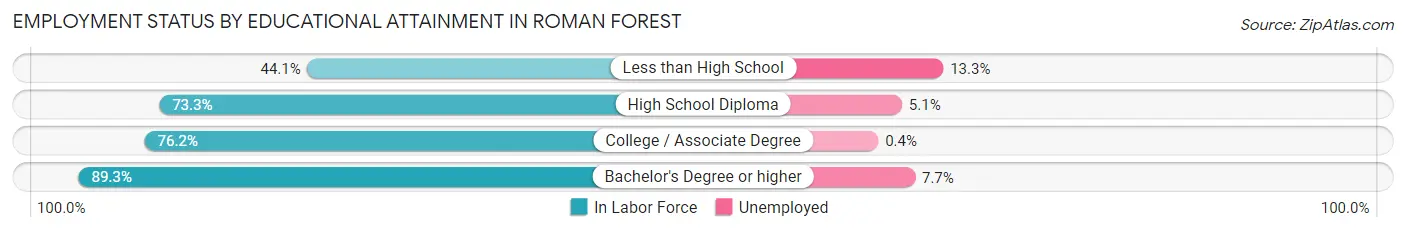
| Educational Attainment | In Labor Force | Unemployed |
| Less than High School | 15 (44.1%) | 5 (13.3%) |
| High School Diploma | 255 (73.3%) | 18 (5.1%) |
| College / Associate Degree | 250 (76.2%) | 1 (0.4%) |
| Bachelor's Degree or higher | 233 (89.3%) | 20 (7.7%) |
| Total | 753 (77.5%) | 44 (4.5%) |
Employment Occupations by Sex in Roman Forest
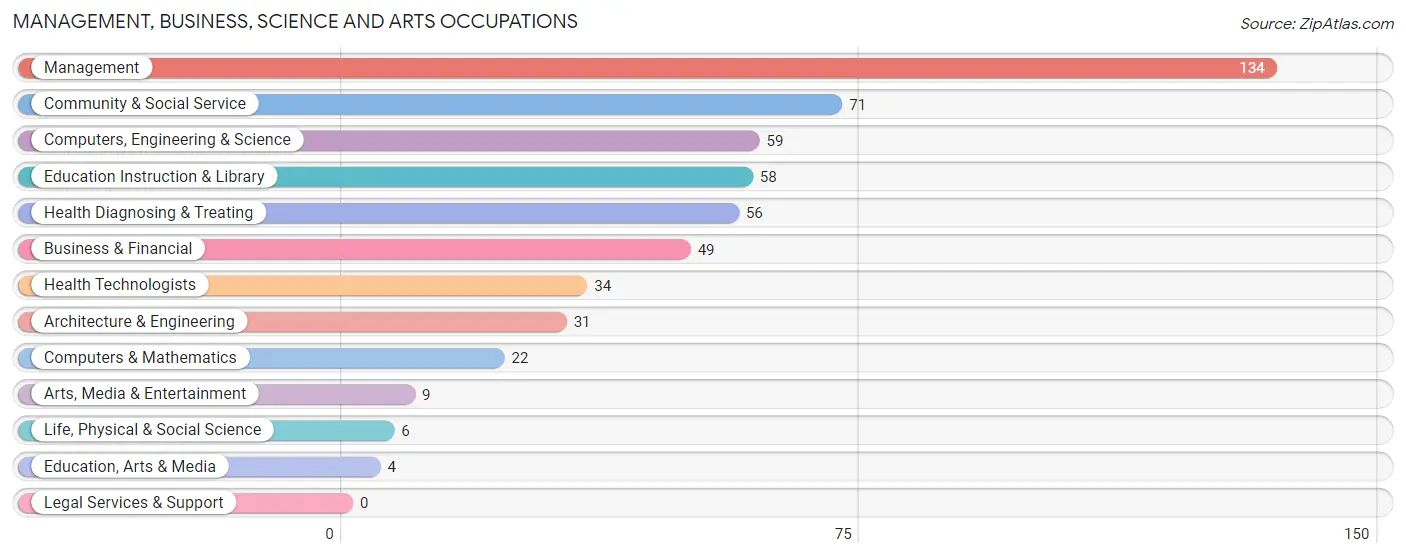
Management, Business, Science and Arts Occupations
The most common Management, Business, Science and Arts occupations in Roman Forest are Management (134 | 13.5%), Community & Social Service (71 | 7.1%), Computers, Engineering & Science (59 | 5.9%), Education Instruction & Library (58 | 5.8%), and Health Diagnosing & Treating (56 | 5.6%).
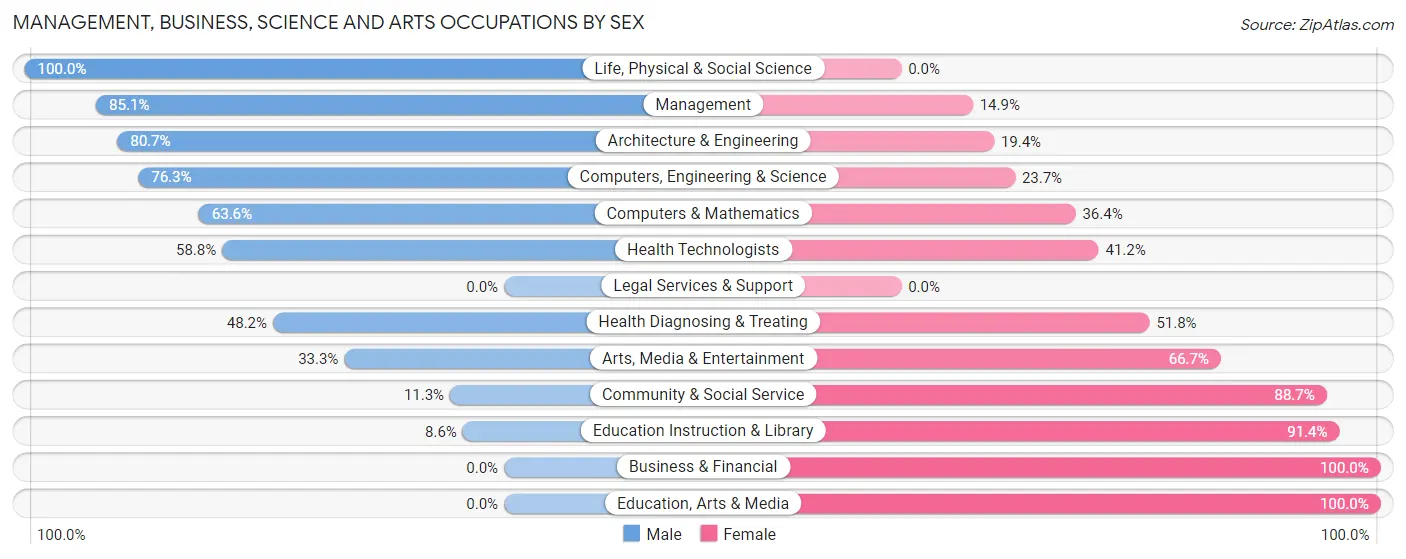
Management, Business, Science and Arts Occupations by Sex
Within the Management, Business, Science and Arts occupations in Roman Forest, the most male-oriented occupations are Life, Physical & Social Science (100.0%), Management (85.1%), and Architecture & Engineering (80.6%), while the most female-oriented occupations are Business & Financial (100.0%), Education, Arts & Media (100.0%), and Education Instruction & Library (91.4%).
| Occupation | Male | Female |
| Management | 114 (85.1%) | 20 (14.9%) |
| Business & Financial | 0 (0.0%) | 49 (100.0%) |
| Computers, Engineering & Science | 45 (76.3%) | 14 (23.7%) |
| Computers & Mathematics | 14 (63.6%) | 8 (36.4%) |
| Architecture & Engineering | 25 (80.6%) | 6 (19.4%) |
| Life, Physical & Social Science | 6 (100.0%) | 0 (0.0%) |
| Community & Social Service | 8 (11.3%) | 63 (88.7%) |
| Education, Arts & Media | 0 (0.0%) | 4 (100.0%) |
| Legal Services & Support | 0 (0.0%) | 0 (0.0%) |
| Education Instruction & Library | 5 (8.6%) | 53 (91.4%) |
| Arts, Media & Entertainment | 3 (33.3%) | 6 (66.7%) |
| Health Diagnosing & Treating | 27 (48.2%) | 29 (51.8%) |
| Health Technologists | 20 (58.8%) | 14 (41.2%) |
| Total (Category) | 194 (52.6%) | 175 (47.4%) |
| Total (Overall) | 572 (57.5%) | 423 (42.5%) |
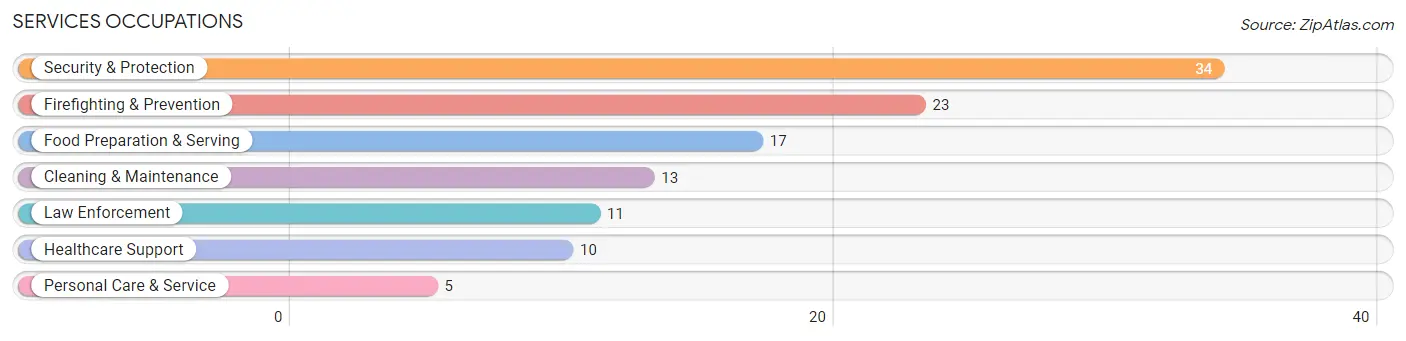
Services Occupations
The most common Services occupations in Roman Forest are Security & Protection (34 | 3.4%), Firefighting & Prevention (23 | 2.3%), Food Preparation & Serving (17 | 1.7%), Cleaning & Maintenance (13 | 1.3%), and Law Enforcement (11 | 1.1%).
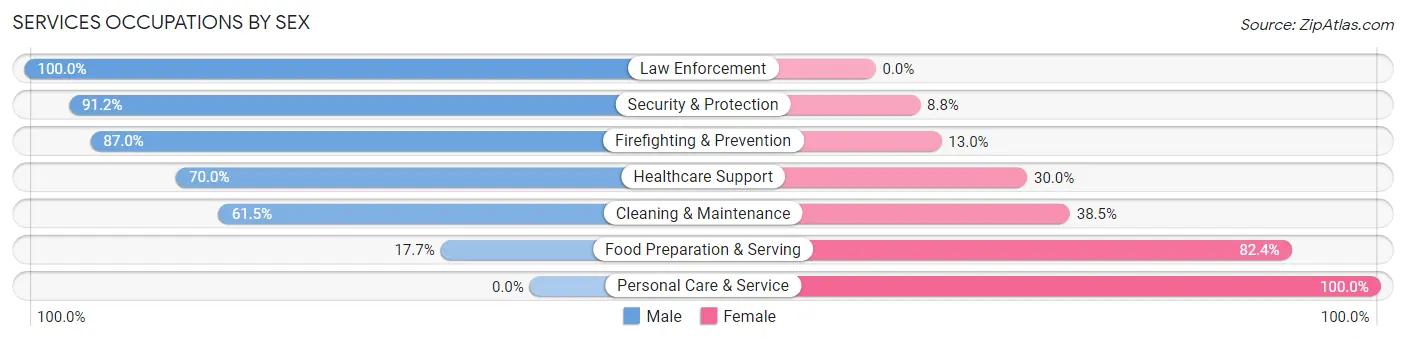
Services Occupations by Sex
Within the Services occupations in Roman Forest, the most male-oriented occupations are Law Enforcement (100.0%), Security & Protection (91.2%), and Firefighting & Prevention (87.0%), while the most female-oriented occupations are Personal Care & Service (100.0%), Food Preparation & Serving (82.4%), and Cleaning & Maintenance (38.5%).
| Occupation | Male | Female |
| Healthcare Support | 7 (70.0%) | 3 (30.0%) |
| Security & Protection | 31 (91.2%) | 3 (8.8%) |
| Firefighting & Prevention | 20 (87.0%) | 3 (13.0%) |
| Law Enforcement | 11 (100.0%) | 0 (0.0%) |
| Food Preparation & Serving | 3 (17.6%) | 14 (82.4%) |
| Cleaning & Maintenance | 8 (61.5%) | 5 (38.5%) |
| Personal Care & Service | 0 (0.0%) | 5 (100.0%) |
| Total (Category) | 49 (62.0%) | 30 (38.0%) |
| Total (Overall) | 572 (57.5%) | 423 (42.5%) |
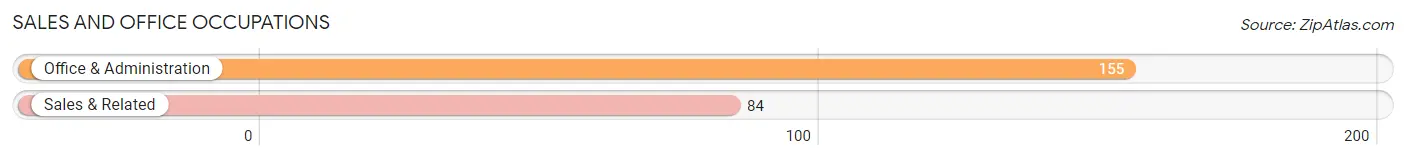
Sales and Office Occupations
The most common Sales and Office occupations in Roman Forest are Office & Administration (155 | 15.6%), and Sales & Related (84 | 8.4%).
Sales and Office Occupations by Sex
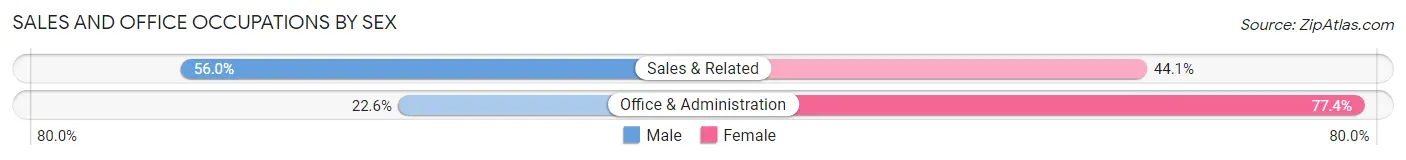
| Occupation | Male | Female |
| Sales & Related | 47 (55.9%) | 37 (44.1%) |
| Office & Administration | 35 (22.6%) | 120 (77.4%) |
| Total (Category) | 82 (34.3%) | 157 (65.7%) |
| Total (Overall) | 572 (57.5%) | 423 (42.5%) |
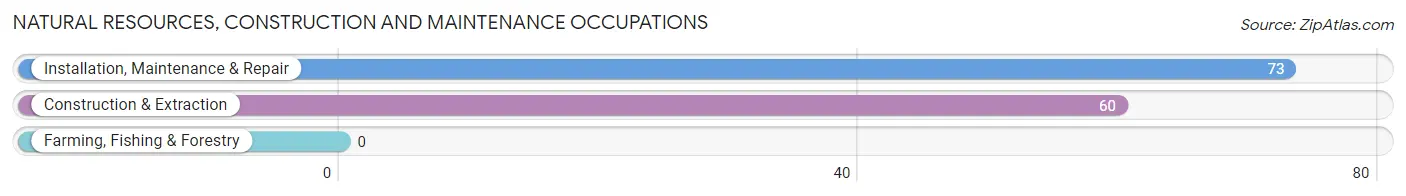
Natural Resources, Construction and Maintenance Occupations
The most common Natural Resources, Construction and Maintenance occupations in Roman Forest are Installation, Maintenance & Repair (73 | 7.3%), and Construction & Extraction (60 | 6.0%).
Natural Resources, Construction and Maintenance Occupations by Sex
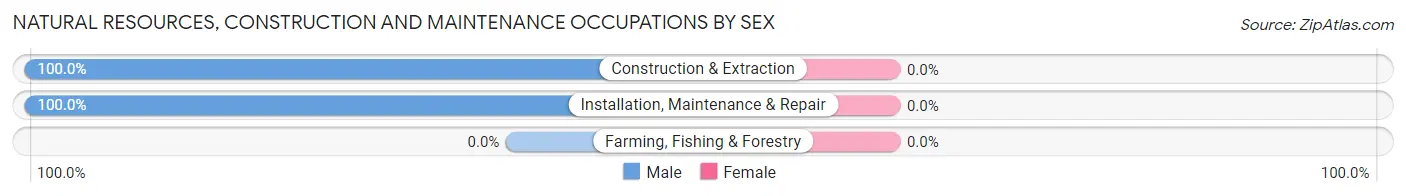
| Occupation | Male | Female |
| Farming, Fishing & Forestry | 0 (0.0%) | 0 (0.0%) |
| Construction & Extraction | 60 (100.0%) | 0 (0.0%) |
| Installation, Maintenance & Repair | 73 (100.0%) | 0 (0.0%) |
| Total (Category) | 133 (100.0%) | 0 (0.0%) |
| Total (Overall) | 572 (57.5%) | 423 (42.5%) |
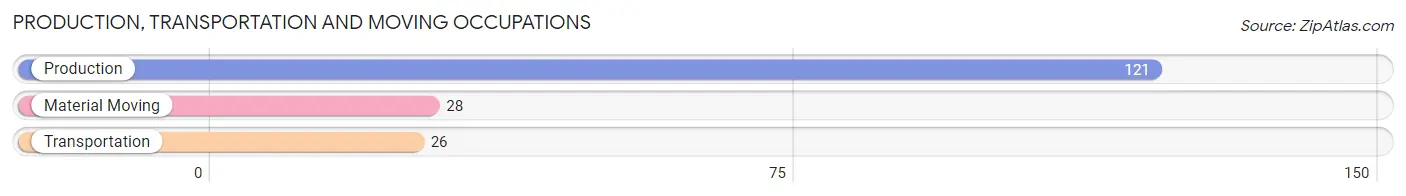
Production, Transportation and Moving Occupations
The most common Production, Transportation and Moving occupations in Roman Forest are Production (121 | 12.2%), Material Moving (28 | 2.8%), and Transportation (26 | 2.6%).
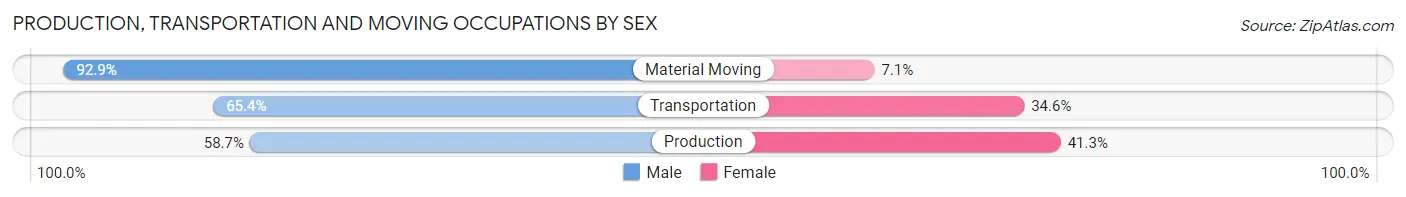
Production, Transportation and Moving Occupations by Sex
| Occupation | Male | Female |
| Production | 71 (58.7%) | 50 (41.3%) |
| Transportation | 17 (65.4%) | 9 (34.6%) |
| Material Moving | 26 (92.9%) | 2 (7.1%) |
| Total (Category) | 114 (65.1%) | 61 (34.9%) |
| Total (Overall) | 572 (57.5%) | 423 (42.5%) |
Employment Industries by Sex in Roman Forest
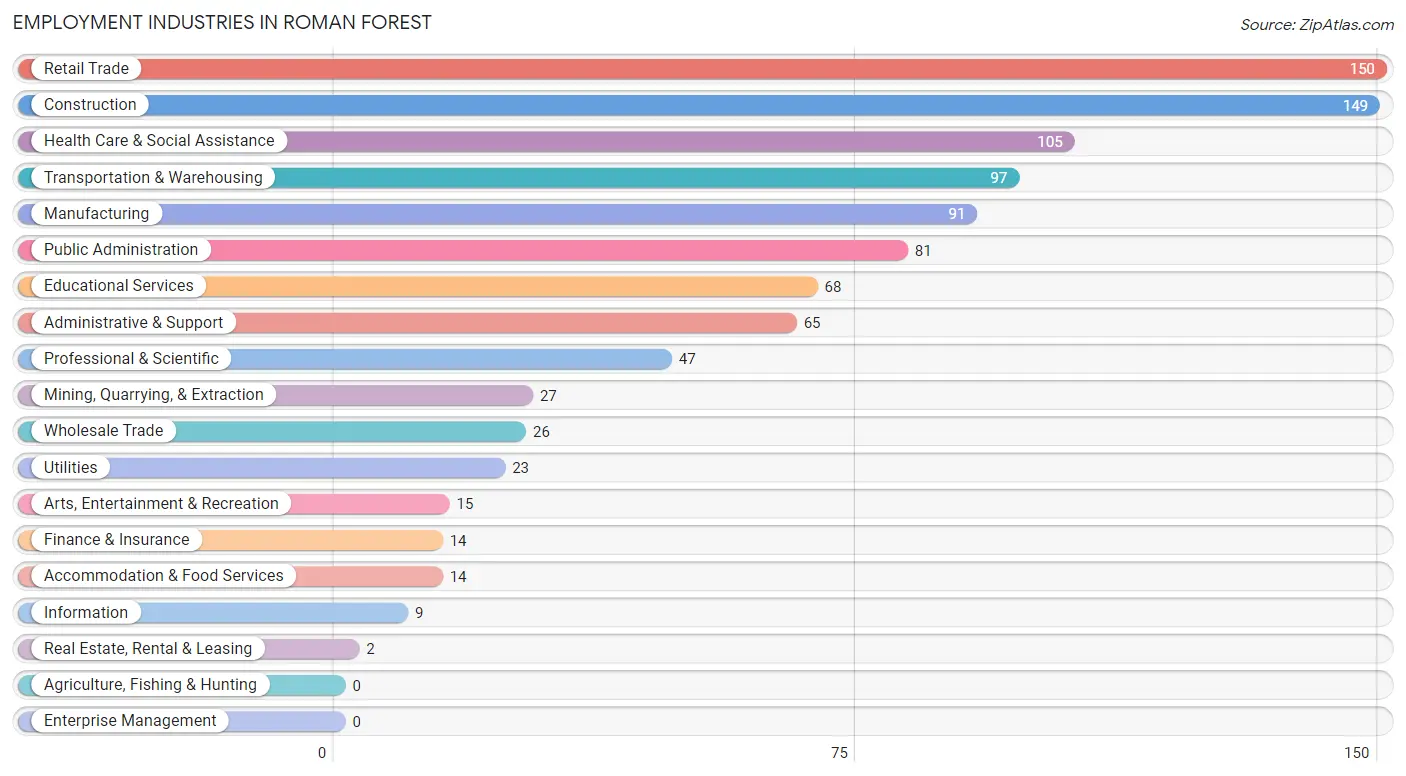
Employment Industries in Roman Forest
The major employment industries in Roman Forest include Retail Trade (150 | 15.1%), Construction (149 | 15.0%), Health Care & Social Assistance (105 | 10.5%), Transportation & Warehousing (97 | 9.8%), and Manufacturing (91 | 9.1%).
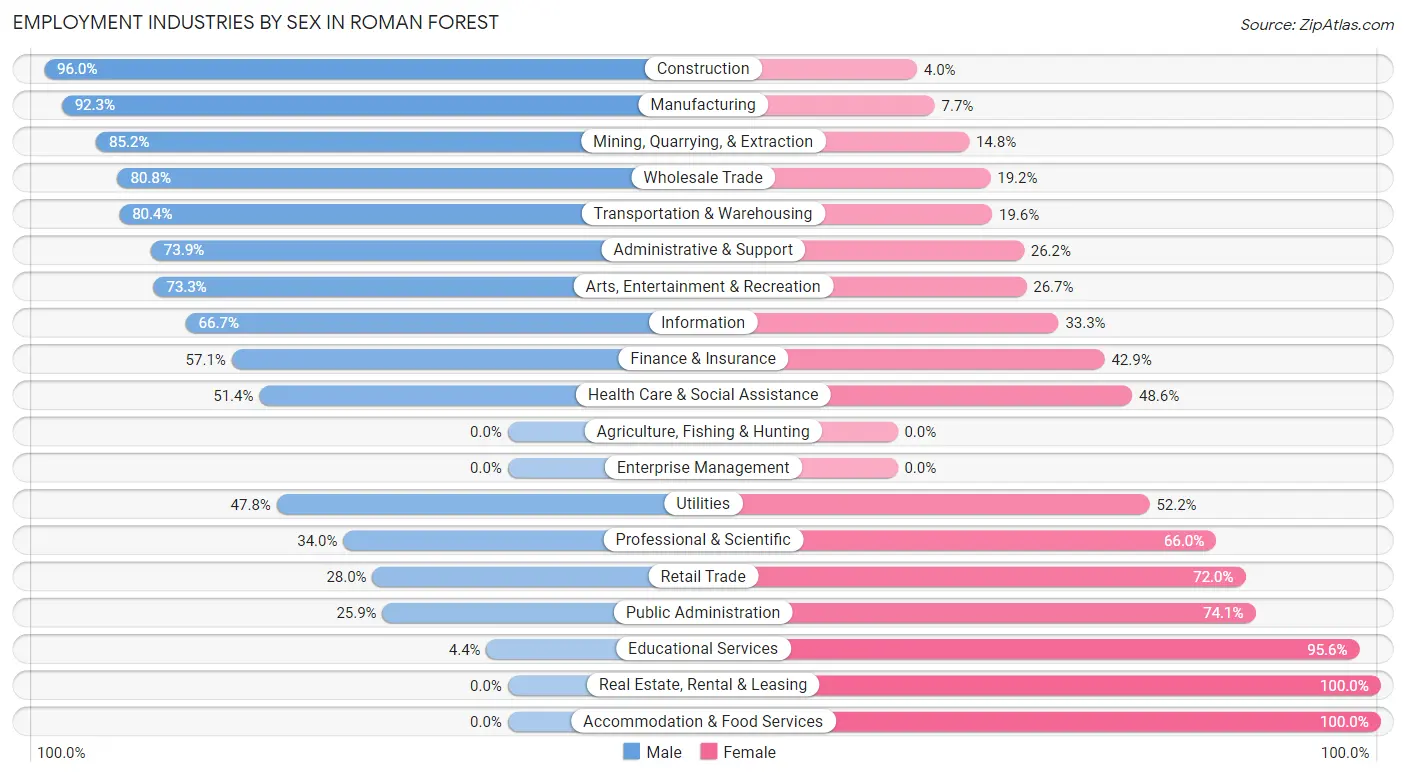
Employment Industries by Sex in Roman Forest
The Roman Forest industries that see more men than women are Construction (96.0%), Manufacturing (92.3%), and Mining, Quarrying, & Extraction (85.2%), whereas the industries that tend to have a higher number of women are Real Estate, Rental & Leasing (100.0%), Accommodation & Food Services (100.0%), and Educational Services (95.6%).
| Industry | Male | Female |
| Agriculture, Fishing & Hunting | 0 (0.0%) | 0 (0.0%) |
| Mining, Quarrying, & Extraction | 23 (85.2%) | 4 (14.8%) |
| Construction | 143 (96.0%) | 6 (4.0%) |
| Manufacturing | 84 (92.3%) | 7 (7.7%) |
| Wholesale Trade | 21 (80.8%) | 5 (19.2%) |
| Retail Trade | 42 (28.0%) | 108 (72.0%) |
| Transportation & Warehousing | 78 (80.4%) | 19 (19.6%) |
| Utilities | 11 (47.8%) | 12 (52.2%) |
| Information | 6 (66.7%) | 3 (33.3%) |
| Finance & Insurance | 8 (57.1%) | 6 (42.9%) |
| Real Estate, Rental & Leasing | 0 (0.0%) | 2 (100.0%) |
| Professional & Scientific | 16 (34.0%) | 31 (66.0%) |
| Enterprise Management | 0 (0.0%) | 0 (0.0%) |
| Administrative & Support | 48 (73.9%) | 17 (26.2%) |
| Educational Services | 3 (4.4%) | 65 (95.6%) |
| Health Care & Social Assistance | 54 (51.4%) | 51 (48.6%) |
| Arts, Entertainment & Recreation | 11 (73.3%) | 4 (26.7%) |
| Accommodation & Food Services | 0 (0.0%) | 14 (100.0%) |
| Public Administration | 21 (25.9%) | 60 (74.1%) |
| Total | 572 (57.5%) | 423 (42.5%) |
Education in Roman Forest
School Enrollment in Roman Forest
The most common levels of schooling among the 466 students in Roman Forest are middle school (139 | 29.8%), elementary school (115 | 24.7%), and high school (77 | 16.5%).
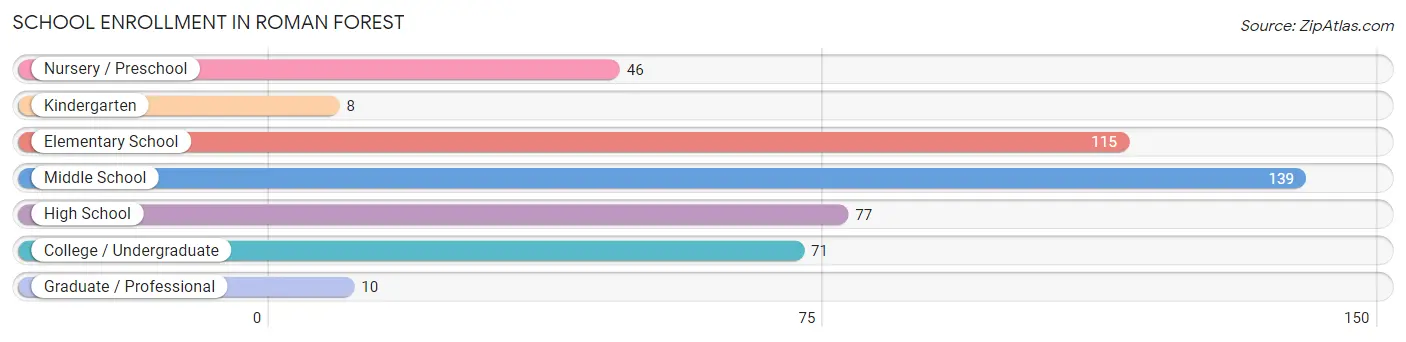
| School Level | # Students | % Students |
| Nursery / Preschool | 46 | 9.9% |
| Kindergarten | 8 | 1.7% |
| Elementary School | 115 | 24.7% |
| Middle School | 139 | 29.8% |
| High School | 77 | 16.5% |
| College / Undergraduate | 71 | 15.2% |
| Graduate / Professional | 10 | 2.1% |
| Total | 466 | 100.0% |
School Enrollment by Age by Funding Source in Roman Forest
Out of a total of 466 students who are enrolled in schools in Roman Forest, 77 (16.5%) attend a private institution, while the remaining 389 (83.5%) are enrolled in public schools. The age group of 35 years and over has the highest likelihood of being enrolled in private schools, with 8 (61.5% in the age bracket) enrolled. Conversely, the age group of 15 to 17 year olds has the lowest likelihood of being enrolled in a private school, with 64 (100.0% in the age bracket) attending a public institution.
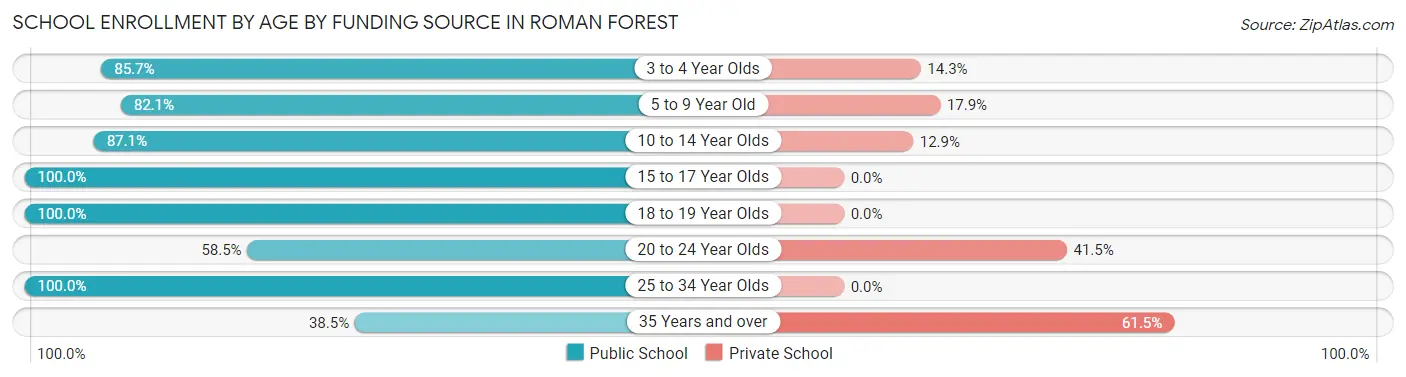
| Age Bracket | Public School | Private School |
| 3 to 4 Year Olds | 24 (85.7%) | 4 (14.3%) |
| 5 to 9 Year Old | 119 (82.1%) | 26 (17.9%) |
| 10 to 14 Year Olds | 115 (87.1%) | 17 (12.9%) |
| 15 to 17 Year Olds | 64 (100.0%) | 0 (0.0%) |
| 18 to 19 Year Olds | 22 (100.0%) | 0 (0.0%) |
| 20 to 24 Year Olds | 31 (58.5%) | 22 (41.5%) |
| 25 to 34 Year Olds | 9 (100.0%) | 0 (0.0%) |
| 35 Years and over | 5 (38.5%) | 8 (61.5%) |
| Total | 389 (83.5%) | 77 (16.5%) |
Educational Attainment by Field of Study in Roman Forest
Engineering (72 | 18.5%), physical & health sciences (59 | 15.1%), science & technology (53 | 13.6%), education (41 | 10.5%), and business (37 | 9.5%) are the most common fields of study among 390 individuals in Roman Forest who have obtained a bachelor's degree or higher.
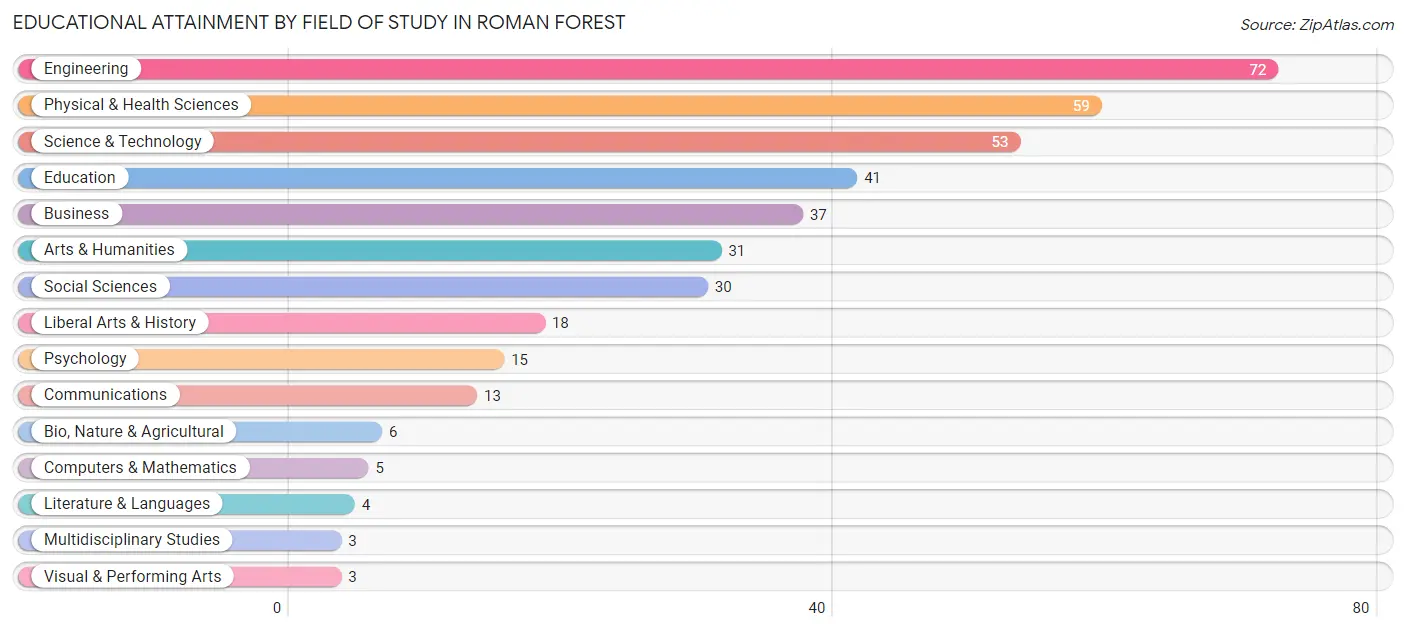
| Field of Study | # Graduates | % Graduates |
| Computers & Mathematics | 5 | 1.3% |
| Bio, Nature & Agricultural | 6 | 1.5% |
| Physical & Health Sciences | 59 | 15.1% |
| Psychology | 15 | 3.8% |
| Social Sciences | 30 | 7.7% |
| Engineering | 72 | 18.5% |
| Multidisciplinary Studies | 3 | 0.8% |
| Science & Technology | 53 | 13.6% |
| Business | 37 | 9.5% |
| Education | 41 | 10.5% |
| Literature & Languages | 4 | 1.0% |
| Liberal Arts & History | 18 | 4.6% |
| Visual & Performing Arts | 3 | 0.8% |
| Communications | 13 | 3.3% |
| Arts & Humanities | 31 | 8.0% |
| Total | 390 | 100.0% |
Transportation & Commute in Roman Forest
Vehicle Availability by Sex in Roman Forest
The most prevalent vehicle ownership categories in Roman Forest are males with 2 vehicles (222, accounting for 39.6%) and females with 2 vehicles (140, making up 55.1%).
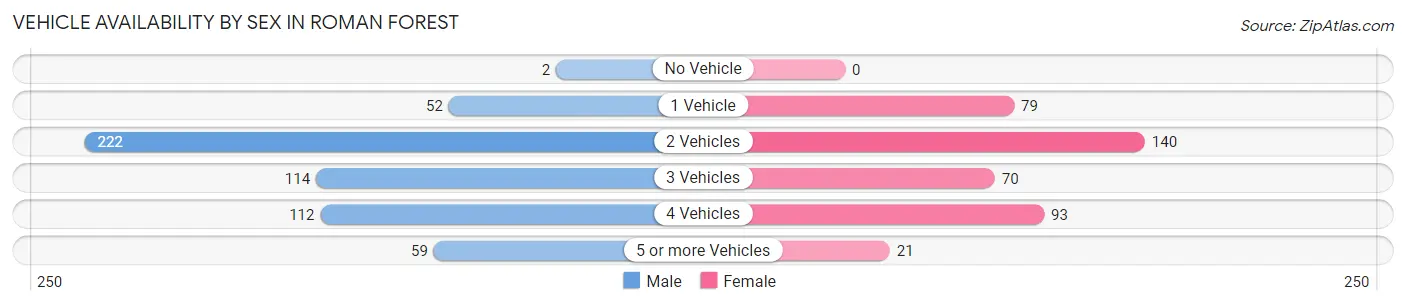
| Vehicles Available | Male | Female |
| No Vehicle | 2 (0.4%) | 0 (0.0%) |
| 1 Vehicle | 52 (9.3%) | 79 (19.6%) |
| 2 Vehicles | 222 (39.6%) | 140 (34.7%) |
| 3 Vehicles | 114 (20.3%) | 70 (17.4%) |
| 4 Vehicles | 112 (20.0%) | 93 (23.1%) |
| 5 or more Vehicles | 59 (10.5%) | 21 (5.2%) |
| Total | 561 (100.0%) | 403 (100.0%) |
Commute Time in Roman Forest
The most frequently occuring commute durations in Roman Forest are 45 to 59 minutes (204 commuters, 21.9%), 30 to 34 minutes (150 commuters, 16.1%), and 60 to 89 minutes (150 commuters, 16.1%).
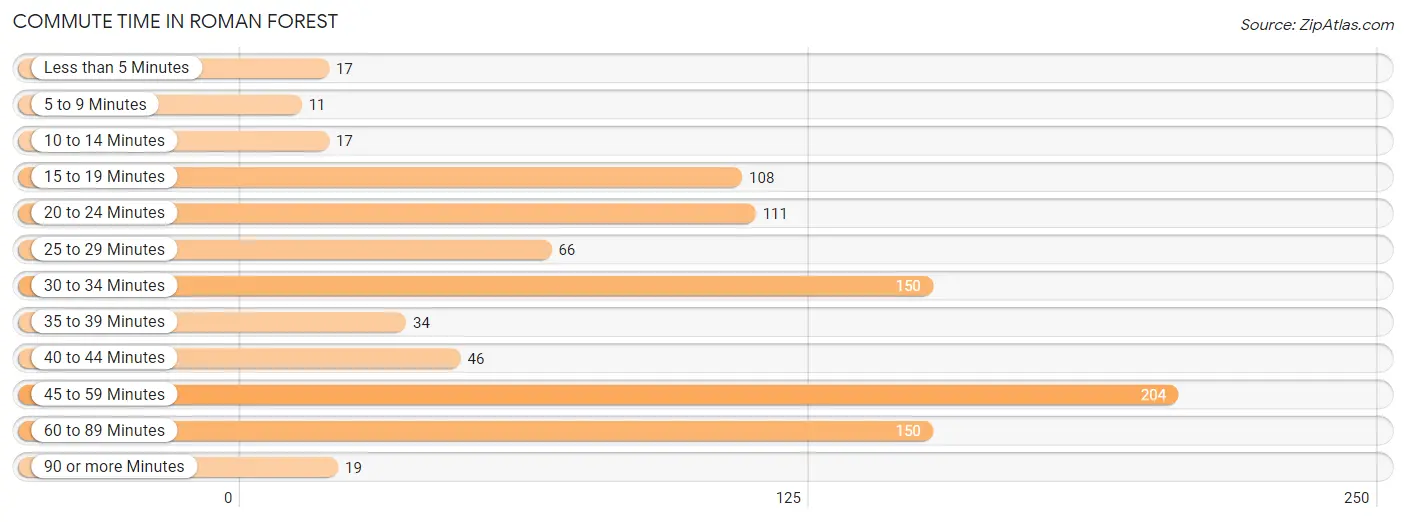
| Commute Time | # Commuters | % Commuters |
| Less than 5 Minutes | 17 | 1.8% |
| 5 to 9 Minutes | 11 | 1.2% |
| 10 to 14 Minutes | 17 | 1.8% |
| 15 to 19 Minutes | 108 | 11.6% |
| 20 to 24 Minutes | 111 | 11.9% |
| 25 to 29 Minutes | 66 | 7.1% |
| 30 to 34 Minutes | 150 | 16.1% |
| 35 to 39 Minutes | 34 | 3.6% |
| 40 to 44 Minutes | 46 | 4.9% |
| 45 to 59 Minutes | 204 | 21.9% |
| 60 to 89 Minutes | 150 | 16.1% |
| 90 or more Minutes | 19 | 2.0% |
Commute Time by Sex in Roman Forest
The most common commute times in Roman Forest are 60 to 89 minutes (134 commuters, 24.2%) for males and 30 to 34 minutes (95 commuters, 25.1%) for females.
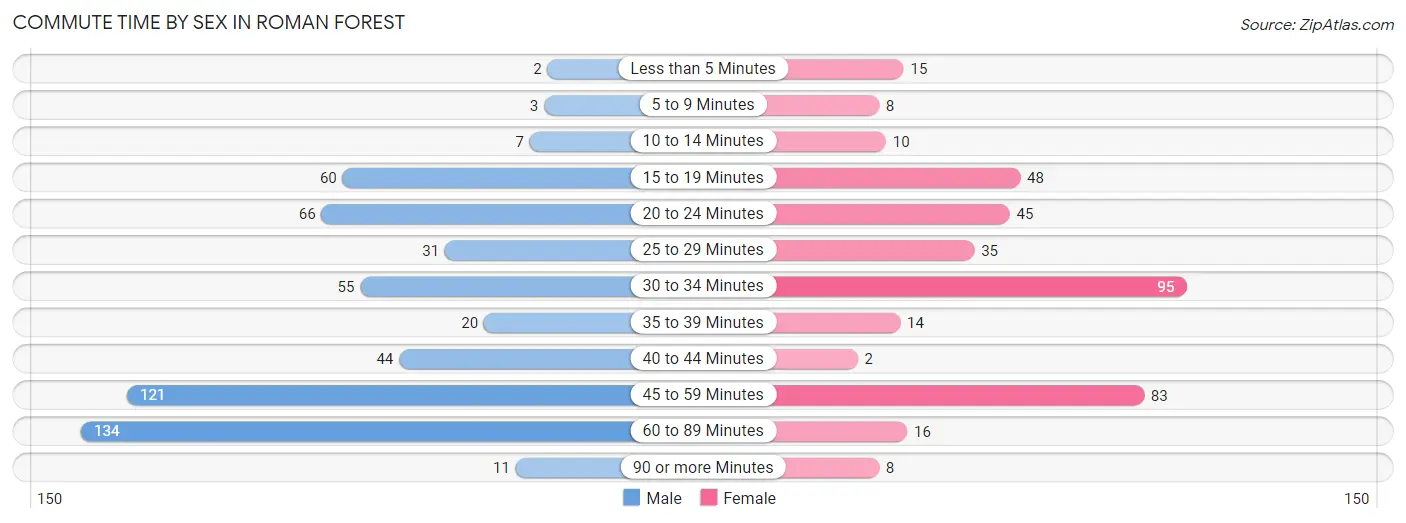
| Commute Time | Male | Female |
| Less than 5 Minutes | 2 (0.4%) | 15 (4.0%) |
| 5 to 9 Minutes | 3 (0.5%) | 8 (2.1%) |
| 10 to 14 Minutes | 7 (1.3%) | 10 (2.6%) |
| 15 to 19 Minutes | 60 (10.8%) | 48 (12.7%) |
| 20 to 24 Minutes | 66 (11.9%) | 45 (11.9%) |
| 25 to 29 Minutes | 31 (5.6%) | 35 (9.2%) |
| 30 to 34 Minutes | 55 (9.9%) | 95 (25.1%) |
| 35 to 39 Minutes | 20 (3.6%) | 14 (3.7%) |
| 40 to 44 Minutes | 44 (7.9%) | 2 (0.5%) |
| 45 to 59 Minutes | 121 (21.8%) | 83 (21.9%) |
| 60 to 89 Minutes | 134 (24.2%) | 16 (4.2%) |
| 90 or more Minutes | 11 (2.0%) | 8 (2.1%) |
Time of Departure to Work by Sex in Roman Forest
The most frequent times of departure to work in Roman Forest are 12:00 AM to 4:59 AM (99, 17.9%) for males and 7:00 AM to 7:29 AM (100, 26.4%) for females.
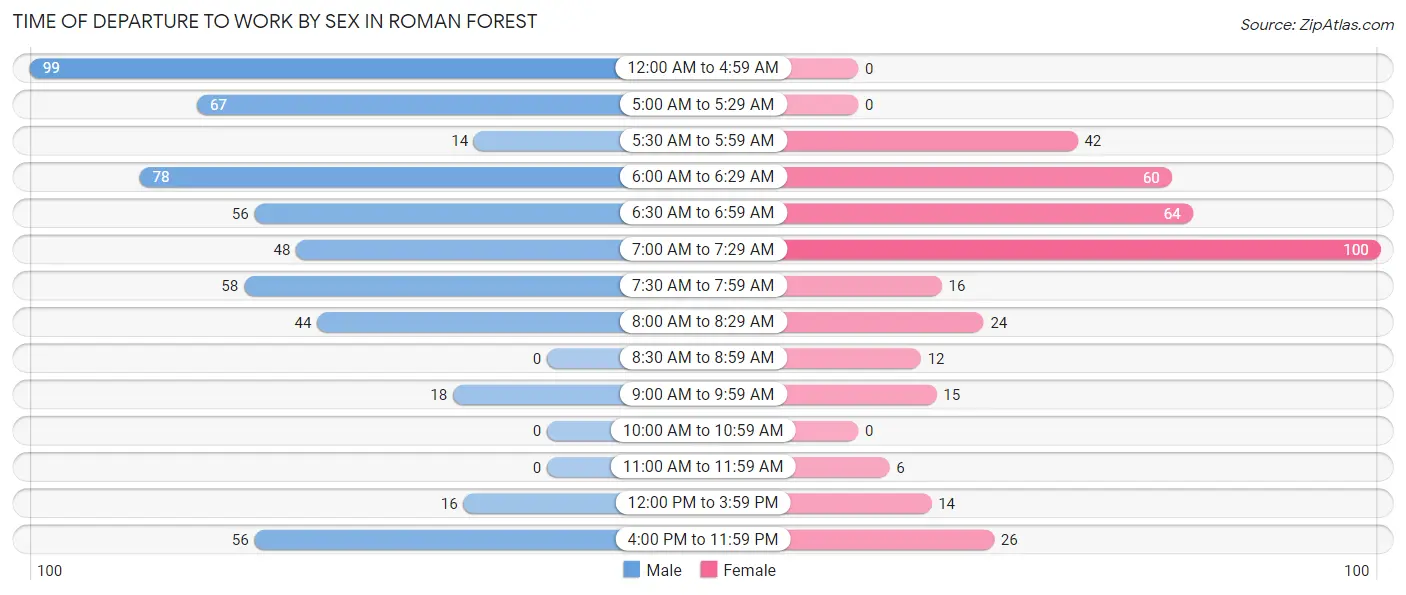
| Time of Departure | Male | Female |
| 12:00 AM to 4:59 AM | 99 (17.9%) | 0 (0.0%) |
| 5:00 AM to 5:29 AM | 67 (12.1%) | 0 (0.0%) |
| 5:30 AM to 5:59 AM | 14 (2.5%) | 42 (11.1%) |
| 6:00 AM to 6:29 AM | 78 (14.1%) | 60 (15.8%) |
| 6:30 AM to 6:59 AM | 56 (10.1%) | 64 (16.9%) |
| 7:00 AM to 7:29 AM | 48 (8.7%) | 100 (26.4%) |
| 7:30 AM to 7:59 AM | 58 (10.5%) | 16 (4.2%) |
| 8:00 AM to 8:29 AM | 44 (7.9%) | 24 (6.3%) |
| 8:30 AM to 8:59 AM | 0 (0.0%) | 12 (3.2%) |
| 9:00 AM to 9:59 AM | 18 (3.3%) | 15 (4.0%) |
| 10:00 AM to 10:59 AM | 0 (0.0%) | 0 (0.0%) |
| 11:00 AM to 11:59 AM | 0 (0.0%) | 6 (1.6%) |
| 12:00 PM to 3:59 PM | 16 (2.9%) | 14 (3.7%) |
| 4:00 PM to 11:59 PM | 56 (10.1%) | 26 (6.9%) |
| Total | 554 (100.0%) | 379 (100.0%) |
Housing Occupancy in Roman Forest
Occupancy by Ownership in Roman Forest
Of the total 752 dwellings in Roman Forest, owner-occupied units account for 697 (92.7%), while renter-occupied units make up 55 (7.3%).
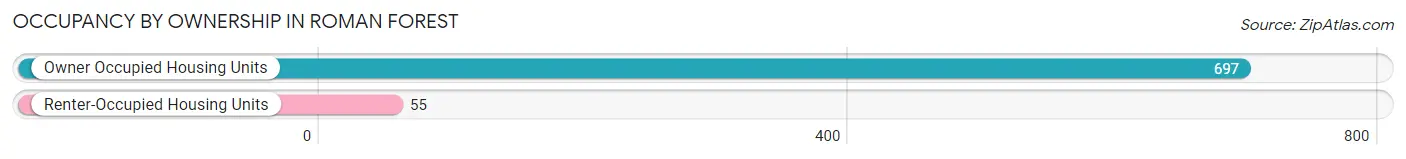
| Occupancy | # Housing Units | % Housing Units |
| Owner Occupied Housing Units | 697 | 92.7% |
| Renter-Occupied Housing Units | 55 | 7.3% |
| Total Occupied Housing Units | 752 | 100.0% |
Occupancy by Household Size in Roman Forest
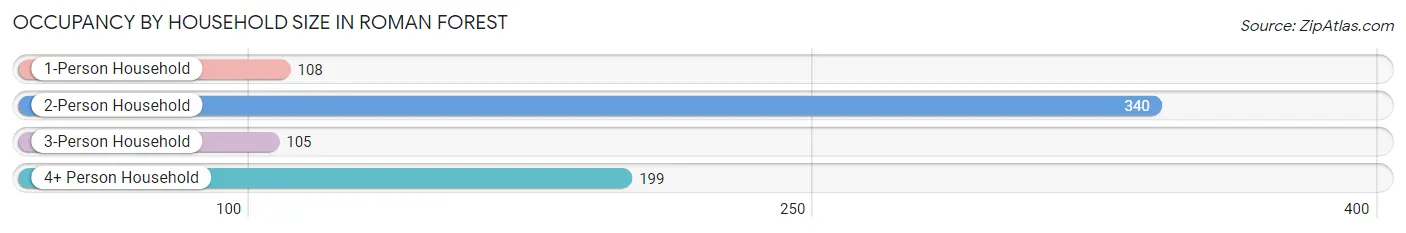
| Household Size | # Housing Units | % Housing Units |
| 1-Person Household | 108 | 14.4% |
| 2-Person Household | 340 | 45.2% |
| 3-Person Household | 105 | 14.0% |
| 4+ Person Household | 199 | 26.5% |
| Total Housing Units | 752 | 100.0% |
Occupancy by Ownership by Household Size in Roman Forest
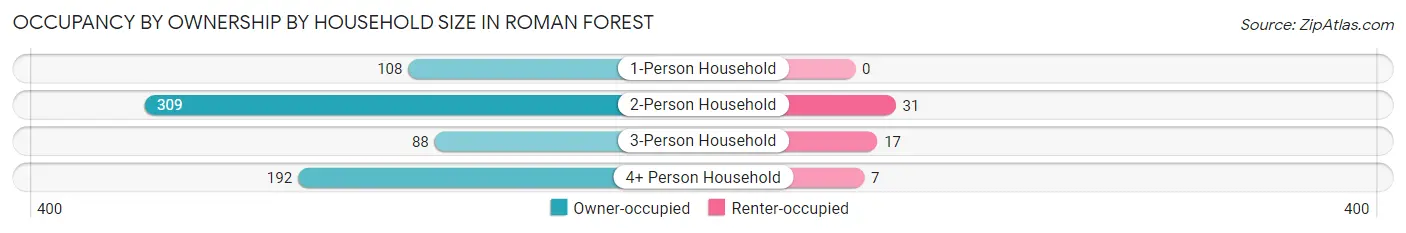
| Household Size | Owner-occupied | Renter-occupied |
| 1-Person Household | 108 (100.0%) | 0 (0.0%) |
| 2-Person Household | 309 (90.9%) | 31 (9.1%) |
| 3-Person Household | 88 (83.8%) | 17 (16.2%) |
| 4+ Person Household | 192 (96.5%) | 7 (3.5%) |
| Total Housing Units | 697 (92.7%) | 55 (7.3%) |
Occupancy by Educational Attainment in Roman Forest
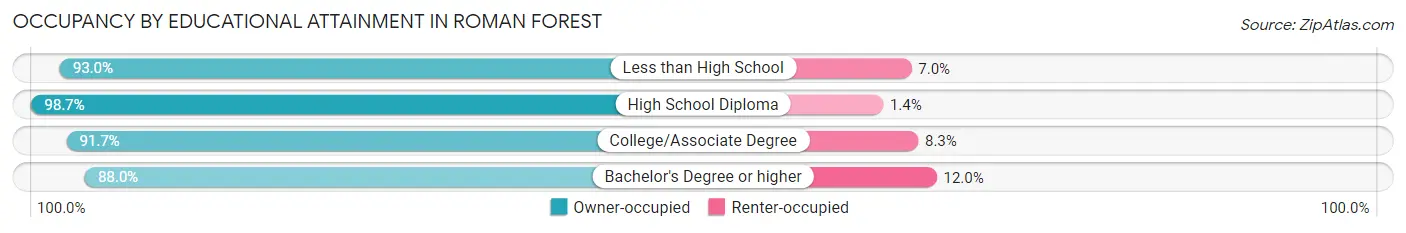
| Household Size | Owner-occupied | Renter-occupied |
| Less than High School | 40 (93.0%) | 3 (7.0%) |
| High School Diploma | 219 (98.7%) | 3 (1.3%) |
| College/Associate Degree | 232 (91.7%) | 21 (8.3%) |
| Bachelor's Degree or higher | 206 (88.0%) | 28 (12.0%) |
Occupancy by Age of Householder in Roman Forest
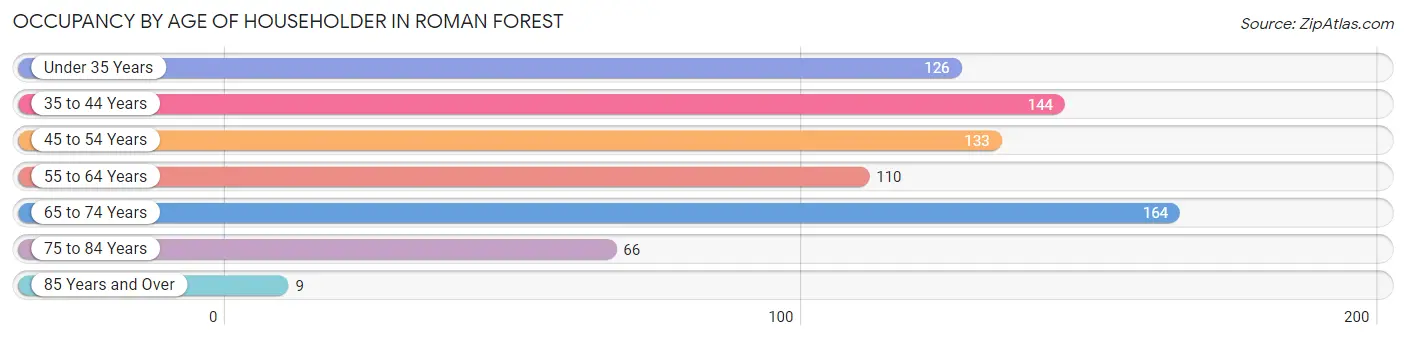
| Age Bracket | # Households | % Households |
| Under 35 Years | 126 | 16.8% |
| 35 to 44 Years | 144 | 19.2% |
| 45 to 54 Years | 133 | 17.7% |
| 55 to 64 Years | 110 | 14.6% |
| 65 to 74 Years | 164 | 21.8% |
| 75 to 84 Years | 66 | 8.8% |
| 85 Years and Over | 9 | 1.2% |
| Total | 752 | 100.0% |
Housing Finances in Roman Forest
Median Income by Occupancy in Roman Forest
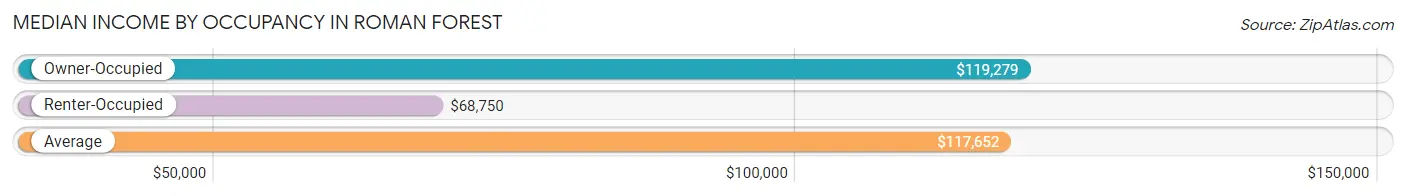
| Occupancy Type | # Households | Median Income |
| Owner-Occupied | 697 (92.7%) | $119,279 |
| Renter-Occupied | 55 (7.3%) | $68,750 |
| Average | 752 (100.0%) | $117,652 |
Occupancy by Householder Income Bracket in Roman Forest
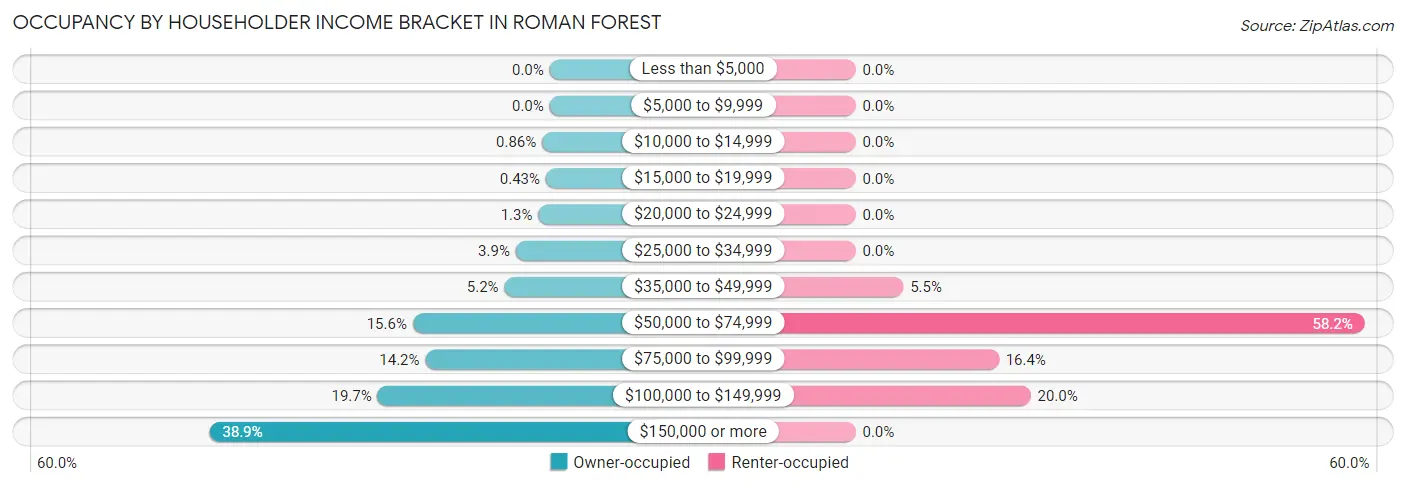
| Income Bracket | Owner-occupied | Renter-occupied |
| Less than $5,000 | 0 (0.0%) | 0 (0.0%) |
| $5,000 to $9,999 | 0 (0.0%) | 0 (0.0%) |
| $10,000 to $14,999 | 6 (0.9%) | 0 (0.0%) |
| $15,000 to $19,999 | 3 (0.4%) | 0 (0.0%) |
| $20,000 to $24,999 | 9 (1.3%) | 0 (0.0%) |
| $25,000 to $34,999 | 27 (3.9%) | 0 (0.0%) |
| $35,000 to $49,999 | 36 (5.2%) | 3 (5.4%) |
| $50,000 to $74,999 | 109 (15.6%) | 32 (58.2%) |
| $75,000 to $99,999 | 99 (14.2%) | 9 (16.4%) |
| $100,000 to $149,999 | 137 (19.7%) | 11 (20.0%) |
| $150,000 or more | 271 (38.9%) | 0 (0.0%) |
| Total | 697 (100.0%) | 55 (100.0%) |
Monthly Housing Cost Tiers in Roman Forest
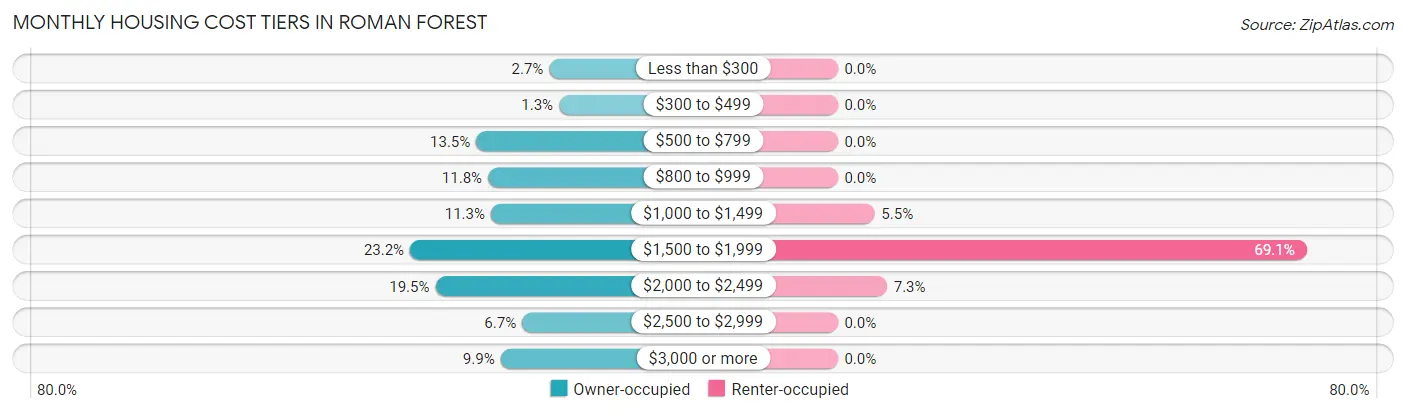
| Monthly Cost | Owner-occupied | Renter-occupied |
| Less than $300 | 19 (2.7%) | 0 (0.0%) |
| $300 to $499 | 9 (1.3%) | 0 (0.0%) |
| $500 to $799 | 94 (13.5%) | 0 (0.0%) |
| $800 to $999 | 82 (11.8%) | 0 (0.0%) |
| $1,000 to $1,499 | 79 (11.3%) | 3 (5.4%) |
| $1,500 to $1,999 | 162 (23.2%) | 38 (69.1%) |
| $2,000 to $2,499 | 136 (19.5%) | 4 (7.3%) |
| $2,500 to $2,999 | 47 (6.7%) | 0 (0.0%) |
| $3,000 or more | 69 (9.9%) | 0 (0.0%) |
| Total | 697 (100.0%) | 55 (100.0%) |
Physical Housing Characteristics in Roman Forest
Housing Structures in Roman Forest
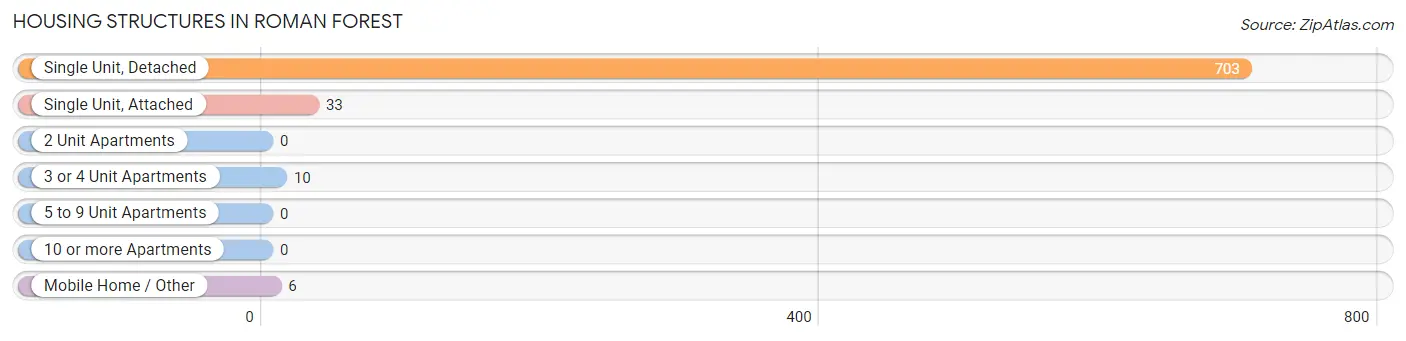
| Structure Type | # Housing Units | % Housing Units |
| Single Unit, Detached | 703 | 93.5% |
| Single Unit, Attached | 33 | 4.4% |
| 2 Unit Apartments | 0 | 0.0% |
| 3 or 4 Unit Apartments | 10 | 1.3% |
| 5 to 9 Unit Apartments | 0 | 0.0% |
| 10 or more Apartments | 0 | 0.0% |
| Mobile Home / Other | 6 | 0.8% |
| Total | 752 | 100.0% |
Housing Structures by Occupancy in Roman Forest
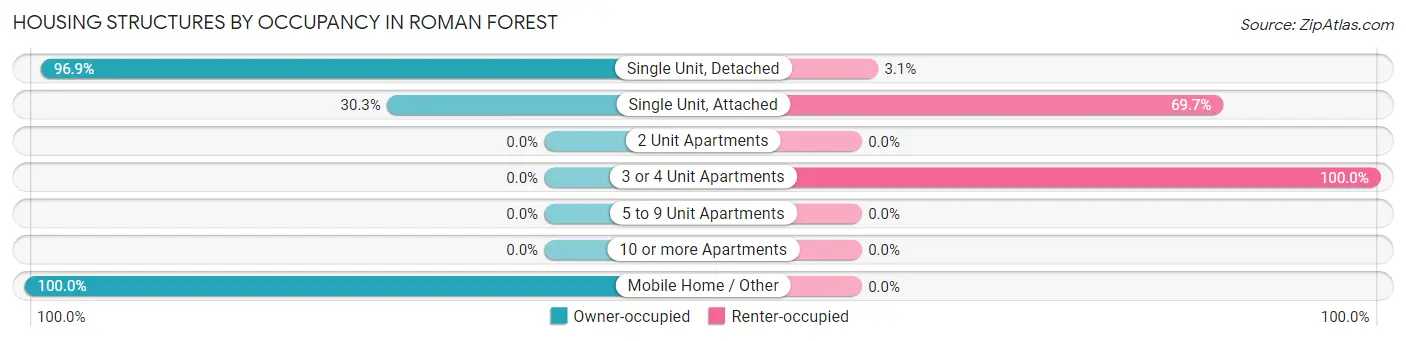
| Structure Type | Owner-occupied | Renter-occupied |
| Single Unit, Detached | 681 (96.9%) | 22 (3.1%) |
| Single Unit, Attached | 10 (30.3%) | 23 (69.7%) |
| 2 Unit Apartments | 0 (0.0%) | 0 (0.0%) |
| 3 or 4 Unit Apartments | 0 (0.0%) | 10 (100.0%) |
| 5 to 9 Unit Apartments | 0 (0.0%) | 0 (0.0%) |
| 10 or more Apartments | 0 (0.0%) | 0 (0.0%) |
| Mobile Home / Other | 6 (100.0%) | 0 (0.0%) |
| Total | 697 (92.7%) | 55 (7.3%) |
Housing Structures by Number of Rooms in Roman Forest
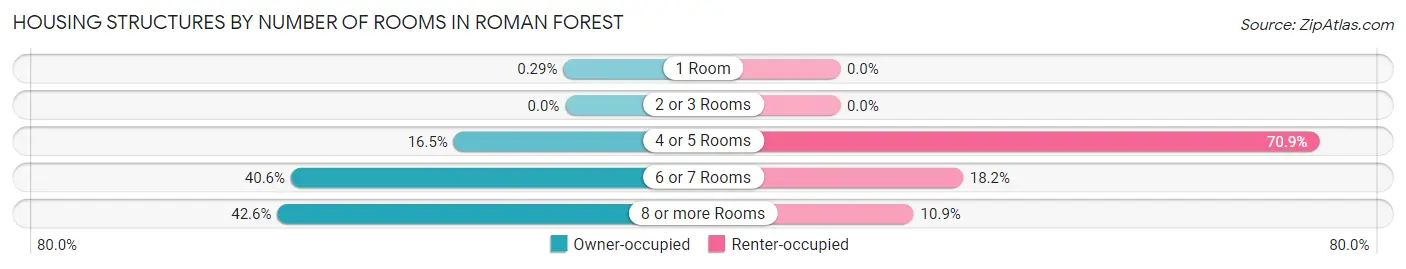
| Number of Rooms | Owner-occupied | Renter-occupied |
| 1 Room | 2 (0.3%) | 0 (0.0%) |
| 2 or 3 Rooms | 0 (0.0%) | 0 (0.0%) |
| 4 or 5 Rooms | 115 (16.5%) | 39 (70.9%) |
| 6 or 7 Rooms | 283 (40.6%) | 10 (18.2%) |
| 8 or more Rooms | 297 (42.6%) | 6 (10.9%) |
| Total | 697 (100.0%) | 55 (100.0%) |
Housing Structure by Heating Type in Roman Forest
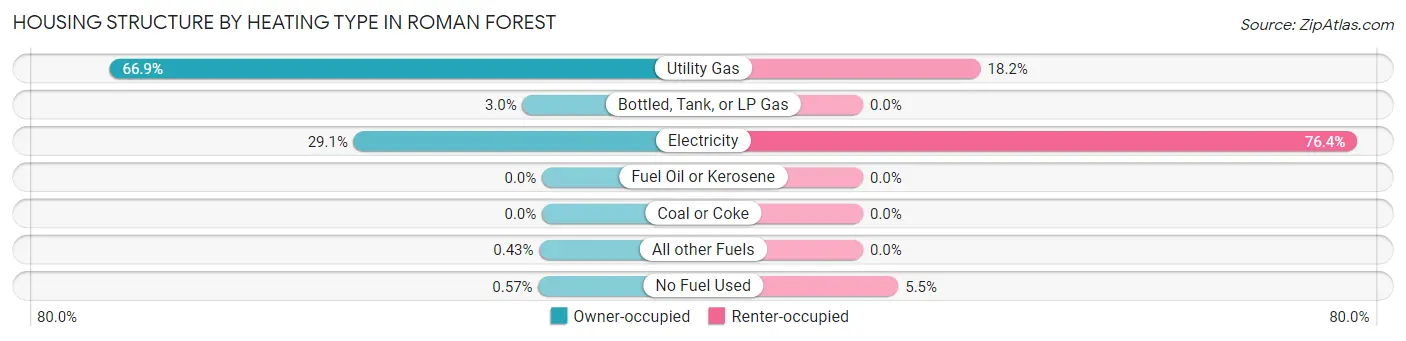
| Heating Type | Owner-occupied | Renter-occupied |
| Utility Gas | 466 (66.9%) | 10 (18.2%) |
| Bottled, Tank, or LP Gas | 21 (3.0%) | 0 (0.0%) |
| Electricity | 203 (29.1%) | 42 (76.4%) |
| Fuel Oil or Kerosene | 0 (0.0%) | 0 (0.0%) |
| Coal or Coke | 0 (0.0%) | 0 (0.0%) |
| All other Fuels | 3 (0.4%) | 0 (0.0%) |
| No Fuel Used | 4 (0.6%) | 3 (5.4%) |
| Total | 697 (100.0%) | 55 (100.0%) |
Household Vehicle Usage in Roman Forest
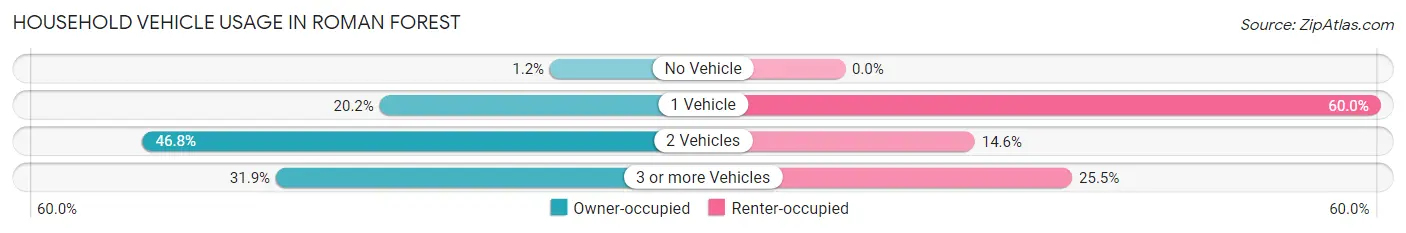
| Vehicles per Household | Owner-occupied | Renter-occupied |
| No Vehicle | 8 (1.1%) | 0 (0.0%) |
| 1 Vehicle | 141 (20.2%) | 33 (60.0%) |
| 2 Vehicles | 326 (46.8%) | 8 (14.5%) |
| 3 or more Vehicles | 222 (31.9%) | 14 (25.5%) |
| Total | 697 (100.0%) | 55 (100.0%) |
Real Estate & Mortgages in Roman Forest
Real Estate and Mortgage Overview in Roman Forest
| Characteristic | Without Mortgage | With Mortgage |
| Housing Units | 273 | 424 |
| Median Property Value | $247,400 | $293,900 |
| Median Household Income | $87,202 | $219 |
| Monthly Housing Costs | $827 | $69 |
| Real Estate Taxes | $3,848 | $11 |
Property Value by Mortgage Status in Roman Forest
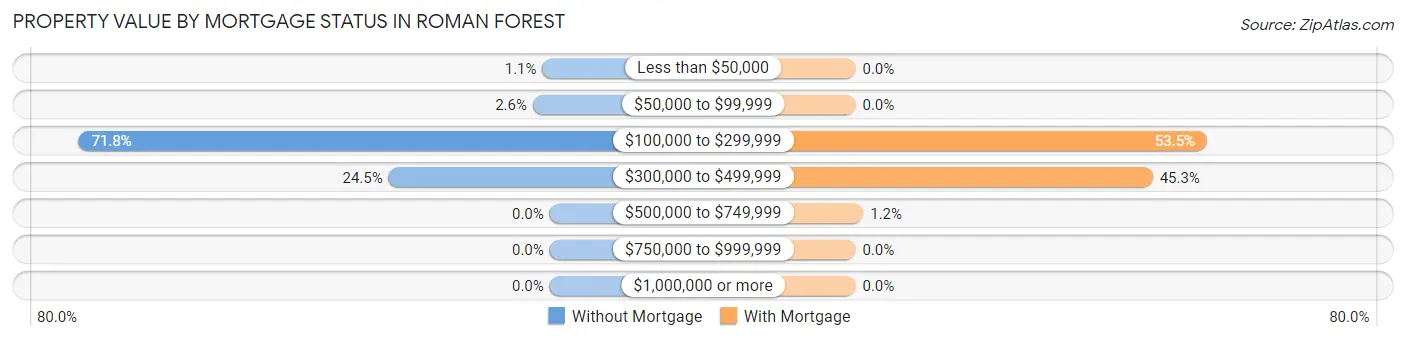
| Property Value | Without Mortgage | With Mortgage |
| Less than $50,000 | 3 (1.1%) | 0 (0.0%) |
| $50,000 to $99,999 | 7 (2.6%) | 0 (0.0%) |
| $100,000 to $299,999 | 196 (71.8%) | 227 (53.5%) |
| $300,000 to $499,999 | 67 (24.5%) | 192 (45.3%) |
| $500,000 to $749,999 | 0 (0.0%) | 5 (1.2%) |
| $750,000 to $999,999 | 0 (0.0%) | 0 (0.0%) |
| $1,000,000 or more | 0 (0.0%) | 0 (0.0%) |
| Total | 273 (100.0%) | 424 (100.0%) |
Household Income by Mortgage Status in Roman Forest
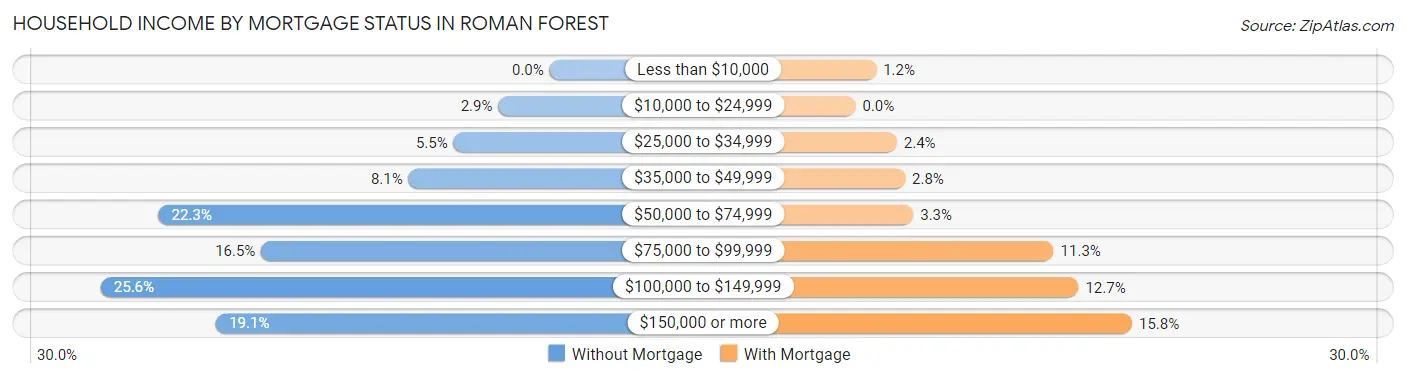
| Household Income | Without Mortgage | With Mortgage |
| Less than $10,000 | 0 (0.0%) | 5 (1.2%) |
| $10,000 to $24,999 | 8 (2.9%) | 0 (0.0%) |
| $25,000 to $34,999 | 15 (5.5%) | 10 (2.4%) |
| $35,000 to $49,999 | 22 (8.1%) | 12 (2.8%) |
| $50,000 to $74,999 | 61 (22.3%) | 14 (3.3%) |
| $75,000 to $99,999 | 45 (16.5%) | 48 (11.3%) |
| $100,000 to $149,999 | 70 (25.6%) | 54 (12.7%) |
| $150,000 or more | 52 (19.1%) | 67 (15.8%) |
| Total | 273 (100.0%) | 424 (100.0%) |
Property Value to Household Income Ratio in Roman Forest
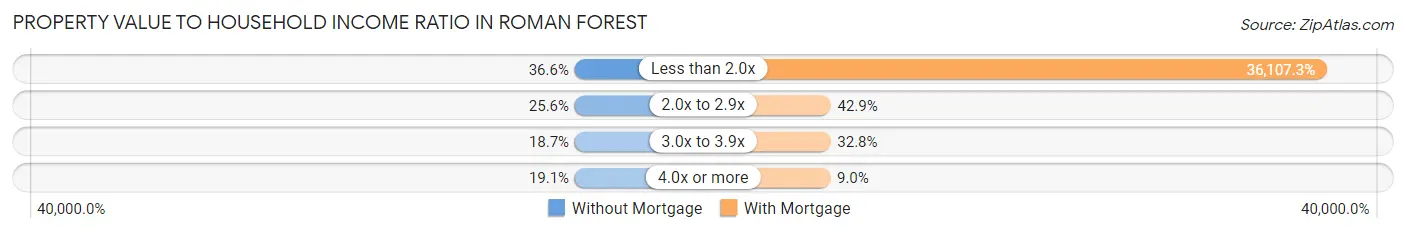
| Value-to-Income Ratio | Without Mortgage | With Mortgage |
| Less than 2.0x | 100 (36.6%) | 153,095 (36,107.3%) |
| 2.0x to 2.9x | 70 (25.6%) | 182 (42.9%) |
| 3.0x to 3.9x | 51 (18.7%) | 139 (32.8%) |
| 4.0x or more | 52 (19.1%) | 38 (9.0%) |
| Total | 273 (100.0%) | 424 (100.0%) |
Real Estate Taxes by Mortgage Status in Roman Forest
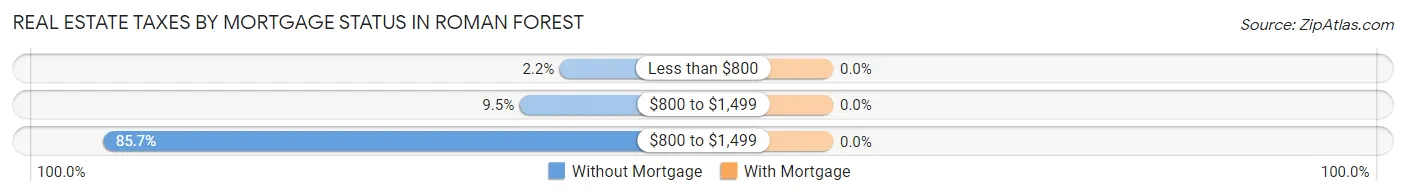
| Property Taxes | Without Mortgage | With Mortgage |
| Less than $800 | 6 (2.2%) | 0 (0.0%) |
| $800 to $1,499 | 26 (9.5%) | 0 (0.0%) |
| $800 to $1,499 | 234 (85.7%) | 0 (0.0%) |
| Total | 273 (100.0%) | 424 (100.0%) |
Health & Disability in Roman Forest
Health Insurance Coverage by Age in Roman Forest
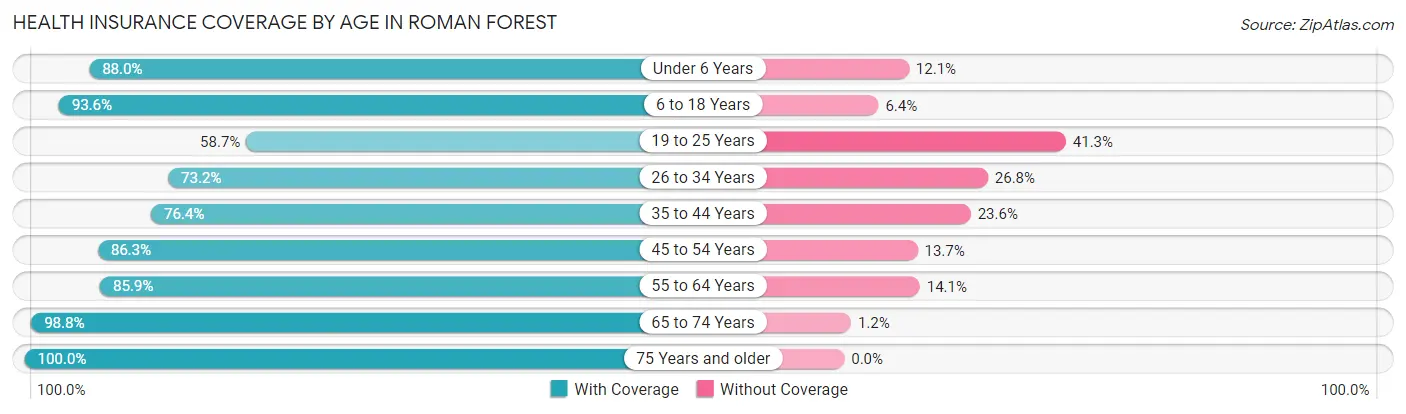
| Age Bracket | With Coverage | Without Coverage |
| Under 6 Years | 146 (87.9%) | 20 (12.0%) |
| 6 to 18 Years | 323 (93.6%) | 22 (6.4%) |
| 19 to 25 Years | 98 (58.7%) | 69 (41.3%) |
| 26 to 34 Years | 145 (73.2%) | 53 (26.8%) |
| 35 to 44 Years | 175 (76.4%) | 54 (23.6%) |
| 45 to 54 Years | 278 (86.3%) | 44 (13.7%) |
| 55 to 64 Years | 177 (85.9%) | 29 (14.1%) |
| 65 to 74 Years | 319 (98.8%) | 4 (1.2%) |
| 75 Years and older | 121 (100.0%) | 0 (0.0%) |
| Total | 1,782 (85.8%) | 295 (14.2%) |
Health Insurance Coverage by Citizenship Status in Roman Forest
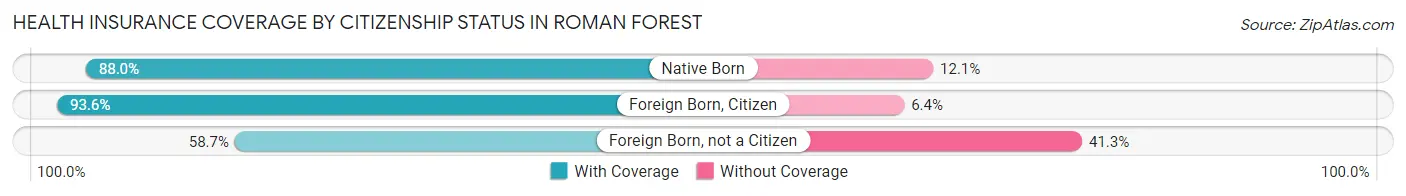
| Citizenship Status | With Coverage | Without Coverage |
| Native Born | 146 (87.9%) | 20 (12.0%) |
| Foreign Born, Citizen | 323 (93.6%) | 22 (6.4%) |
| Foreign Born, not a Citizen | 98 (58.7%) | 69 (41.3%) |
Health Insurance Coverage by Household Income in Roman Forest
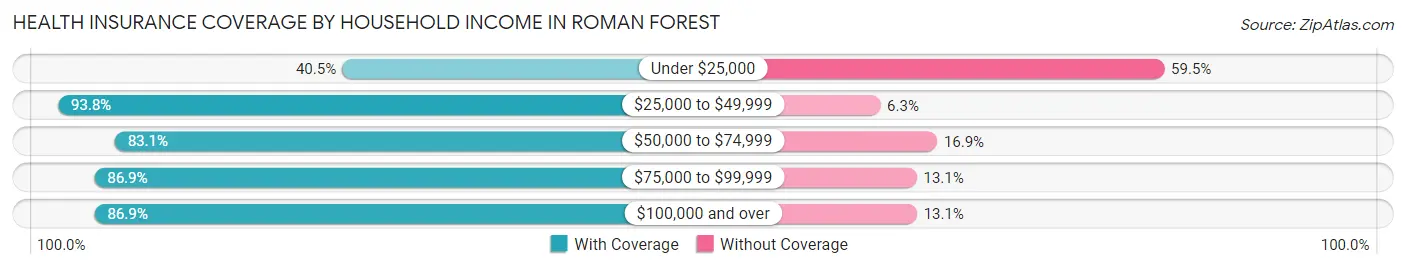
| Household Income | With Coverage | Without Coverage |
| Under $25,000 | 15 (40.5%) | 22 (59.5%) |
| $25,000 to $49,999 | 120 (93.8%) | 8 (6.2%) |
| $50,000 to $74,999 | 369 (83.1%) | 75 (16.9%) |
| $75,000 to $99,999 | 253 (86.9%) | 38 (13.1%) |
| $100,000 and over | 1,008 (86.9%) | 152 (13.1%) |
Public vs Private Health Insurance Coverage by Age in Roman Forest
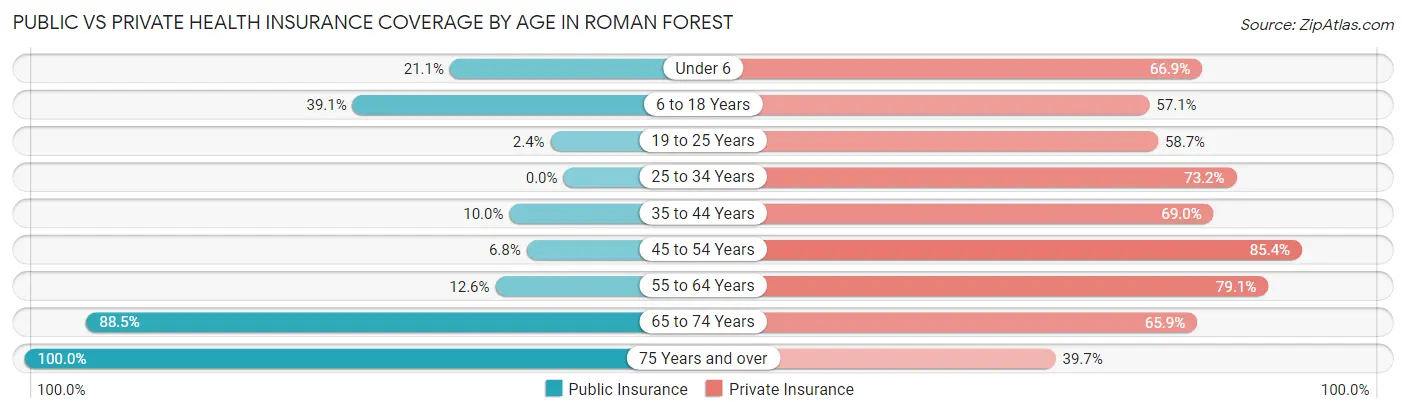
| Age Bracket | Public Insurance | Private Insurance |
| Under 6 | 35 (21.1%) | 111 (66.9%) |
| 6 to 18 Years | 135 (39.1%) | 197 (57.1%) |
| 19 to 25 Years | 4 (2.4%) | 98 (58.7%) |
| 25 to 34 Years | 0 (0.0%) | 145 (73.2%) |
| 35 to 44 Years | 23 (10.0%) | 158 (69.0%) |
| 45 to 54 Years | 22 (6.8%) | 275 (85.4%) |
| 55 to 64 Years | 26 (12.6%) | 163 (79.1%) |
| 65 to 74 Years | 286 (88.5%) | 213 (65.9%) |
| 75 Years and over | 121 (100.0%) | 48 (39.7%) |
| Total | 652 (31.4%) | 1,408 (67.8%) |
Disability Status by Sex by Age in Roman Forest
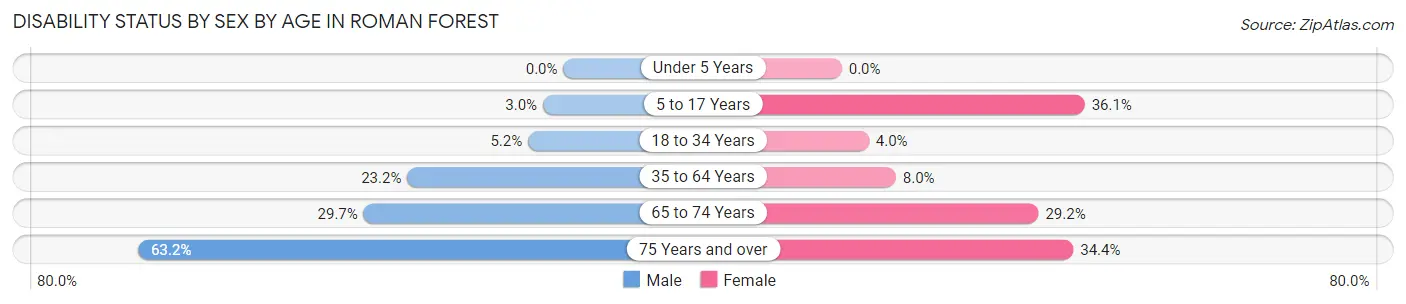
| Age Bracket | Male | Female |
| Under 5 Years | 0 (0.0%) | 0 (0.0%) |
| 5 to 17 Years | 4 (3.0%) | 79 (36.1%) |
| 18 to 34 Years | 11 (5.2%) | 7 (4.0%) |
| 35 to 64 Years | 86 (23.2%) | 31 (8.0%) |
| 65 to 74 Years | 43 (29.7%) | 52 (29.2%) |
| 75 Years and over | 36 (63.2%) | 22 (34.4%) |
Disability Class by Sex by Age in Roman Forest
Disability Class: Hearing Difficulty
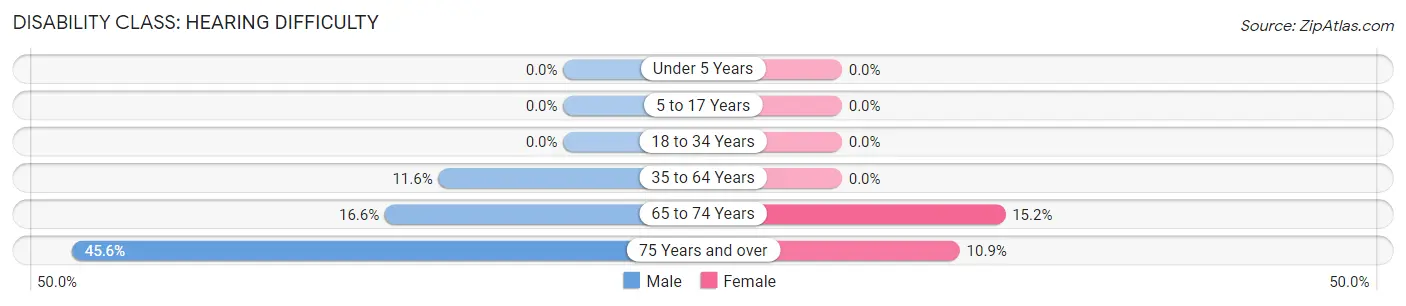
| Age Bracket | Male | Female |
| Under 5 Years | 0 (0.0%) | 0 (0.0%) |
| 5 to 17 Years | 0 (0.0%) | 0 (0.0%) |
| 18 to 34 Years | 0 (0.0%) | 0 (0.0%) |
| 35 to 64 Years | 43 (11.6%) | 0 (0.0%) |
| 65 to 74 Years | 24 (16.6%) | 27 (15.2%) |
| 75 Years and over | 26 (45.6%) | 7 (10.9%) |
Disability Class: Vision Difficulty
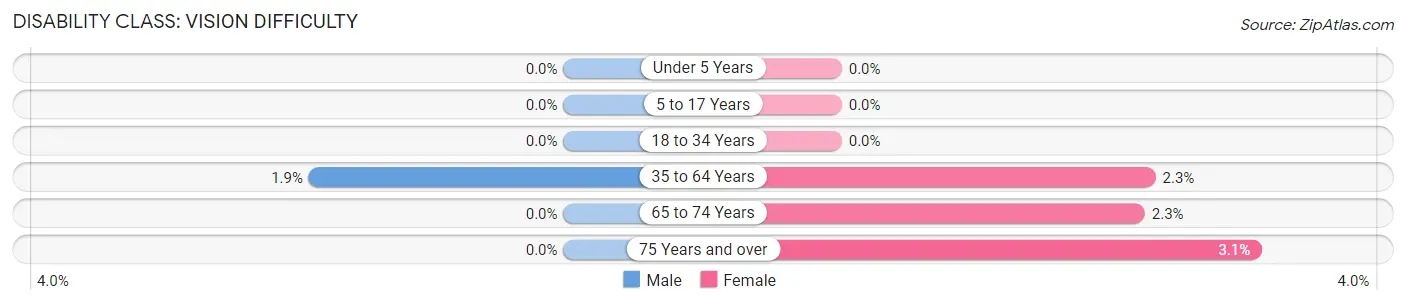
| Age Bracket | Male | Female |
| Under 5 Years | 0 (0.0%) | 0 (0.0%) |
| 5 to 17 Years | 0 (0.0%) | 0 (0.0%) |
| 18 to 34 Years | 0 (0.0%) | 0 (0.0%) |
| 35 to 64 Years | 7 (1.9%) | 9 (2.3%) |
| 65 to 74 Years | 0 (0.0%) | 4 (2.2%) |
| 75 Years and over | 0 (0.0%) | 2 (3.1%) |
Disability Class: Cognitive Difficulty
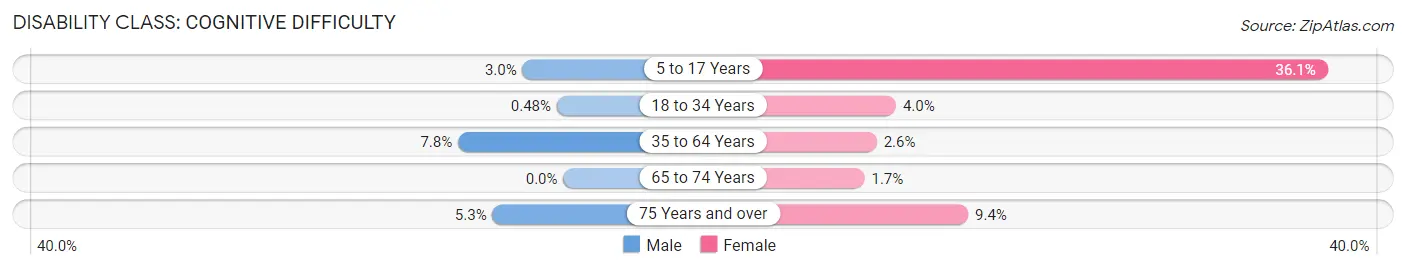
| Age Bracket | Male | Female |
| 5 to 17 Years | 4 (3.0%) | 79 (36.1%) |
| 18 to 34 Years | 1 (0.5%) | 7 (4.0%) |
| 35 to 64 Years | 29 (7.8%) | 10 (2.6%) |
| 65 to 74 Years | 0 (0.0%) | 3 (1.7%) |
| 75 Years and over | 3 (5.3%) | 6 (9.4%) |
Disability Class: Ambulatory Difficulty
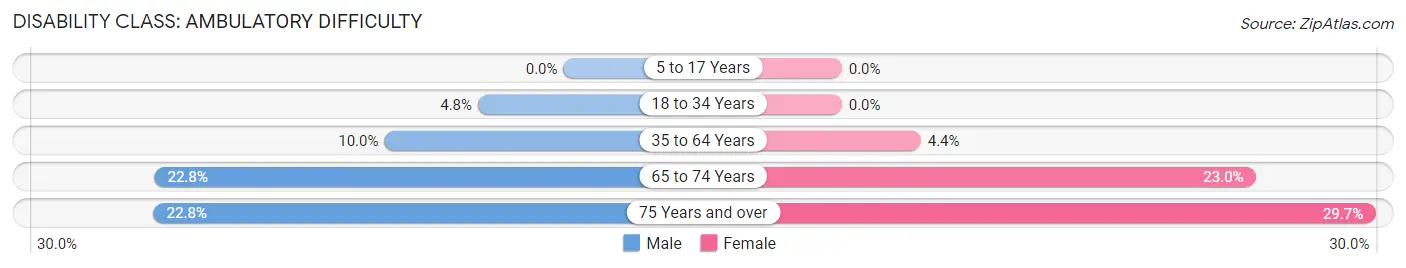
| Age Bracket | Male | Female |
| 5 to 17 Years | 0 (0.0%) | 0 (0.0%) |
| 18 to 34 Years | 10 (4.8%) | 0 (0.0%) |
| 35 to 64 Years | 37 (10.0%) | 17 (4.4%) |
| 65 to 74 Years | 33 (22.8%) | 41 (23.0%) |
| 75 Years and over | 13 (22.8%) | 19 (29.7%) |
Disability Class: Self-Care Difficulty
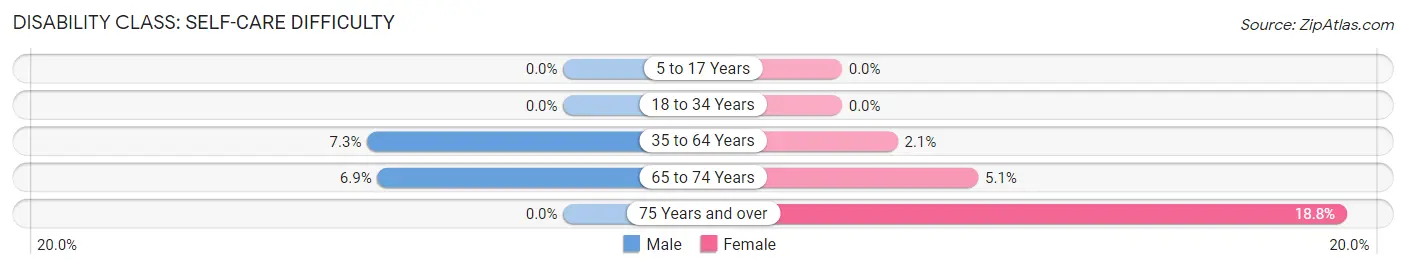
| Age Bracket | Male | Female |
| 5 to 17 Years | 0 (0.0%) | 0 (0.0%) |
| 18 to 34 Years | 0 (0.0%) | 0 (0.0%) |
| 35 to 64 Years | 27 (7.3%) | 8 (2.1%) |
| 65 to 74 Years | 10 (6.9%) | 9 (5.1%) |
| 75 Years and over | 0 (0.0%) | 12 (18.8%) |
Technology Access in Roman Forest
Computing Device Access in Roman Forest
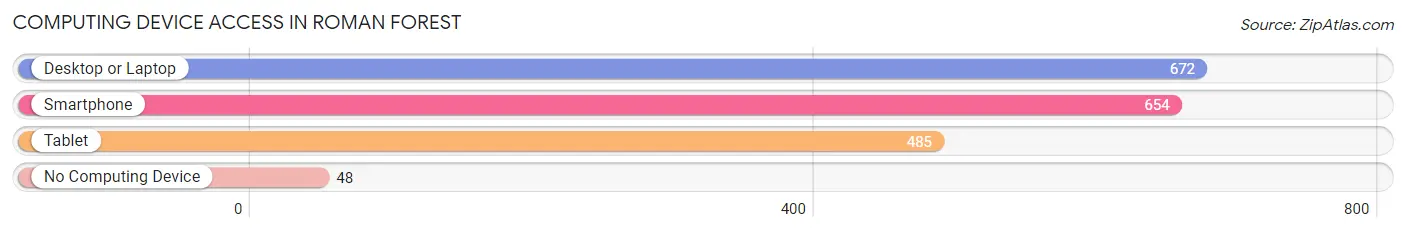
| Device Type | # Households | % Households |
| Desktop or Laptop | 672 | 89.4% |
| Smartphone | 654 | 87.0% |
| Tablet | 485 | 64.5% |
| No Computing Device | 48 | 6.4% |
| Total | 752 | 100.0% |
Internet Access in Roman Forest
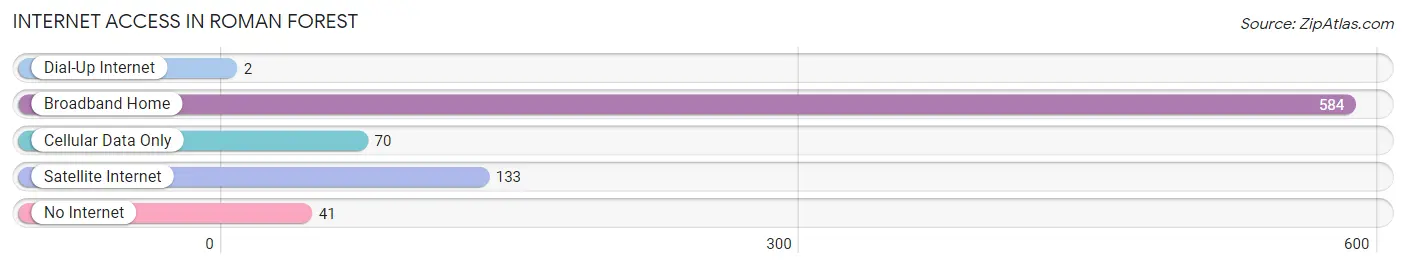
| Internet Type | # Households | % Households |
| Dial-Up Internet | 2 | 0.3% |
| Broadband Home | 584 | 77.7% |
| Cellular Data Only | 70 | 9.3% |
| Satellite Internet | 133 | 17.7% |
| No Internet | 41 | 5.4% |
| Total | 752 | 100.0% |
Roman Forest Summary
Roman Forest is a small city located in Montgomery County, Texas, United States. The city is located approximately 25 miles north of Houston and is part of the Houston–The Woodlands–Sugar Land metropolitan area. As of the 2010 census, the population of Roman Forest was 1,945.
History
The area that is now Roman Forest was originally inhabited by the Atakapan Indians. The first European settlers arrived in the area in the early 1800s. The area was first known as “Roman’s Forest” after the family of William Roman, who settled in the area in 1835. The name was later shortened to Roman Forest.
In the early 1900s, the area was mostly rural and agricultural. The first post office was established in the area in 1910. In the 1950s, the area began to experience rapid growth due to the development of the nearby Houston metropolitan area. The city of Roman Forest was officially incorporated in 1971.
Geography
Roman Forest is located at 30°14'25" North, 95°20'45" West (30.240278, -95.345833). The city is situated in the southeastern part of Montgomery County, approximately 25 miles north of Houston. The city has a total area of 2.2 square miles, all of which is land.
The city is located in the Houston–The Woodlands–Sugar Land metropolitan area. The city is bordered by the cities of Splendora to the north, Porter to the east, and New Caney to the south.
Economy
The economy of Roman Forest is largely based on the oil and gas industry. The city is home to several oil and gas companies, including Chevron, ExxonMobil, and Shell. The city is also home to several manufacturing companies, including a plastics plant and a paper mill.
The city is also home to several retail stores, including a Walmart Supercenter, a Lowe’s Home Improvement store, and a Target. The city is also home to several restaurants, including a McDonald’s, a Subway, and a Whataburger.
Demographics
As of the 2010 census, the population of Roman Forest was 1,945. The racial makeup of the city was 79.2% White, 11.2% African American, 0.7% Native American, 0.7% Asian, 0.1% Pacific Islander, 6.2% from other races, and 2.0% from two or more races. Hispanic or Latino of any race were 16.2% of the population.
The median household income in Roman Forest was $50,938, and the median family income was $54,938. The per capita income for the city was $20,938. About 11.2% of families and 13.2% of the population were below the poverty line, including 17.2% of those under age 18 and 8.2% of those age 65 or over.
Common Questions
What is Per Capita Income in Roman Forest?
Per Capita income in Roman Forest is $50,606.
What is the Median Family Income in Roman Forest?
Median Family Income in Roman Forest is $118,462.
What is the Median Household income in Roman Forest?
Median Household Income in Roman Forest is $117,652.
What is Income or Wage Gap in Roman Forest?
Income or Wage Gap in Roman Forest is 53.5%.
Women in Roman Forest earn 46.5 cents for every dollar earned by a man.
What is Inequality or Gini Index in Roman Forest?
Inequality or Gini Index in Roman Forest is 0.36.
What is the Total Population of Roman Forest?
Total Population of Roman Forest is 2,077.
What is the Total Male Population of Roman Forest?
Total Male Population of Roman Forest is 981.
What is the Total Female Population of Roman Forest?
Total Female Population of Roman Forest is 1,096.
What is the Ratio of Males per 100 Females in Roman Forest?
There are 89.51 Males per 100 Females in Roman Forest.
What is the Ratio of Females per 100 Males in Roman Forest?
There are 111.72 Females per 100 Males in Roman Forest.
What is the Median Population Age in Roman Forest?
Median Population Age in Roman Forest is 43.8 Years.
What is the Average Family Size in Roman Forest
Average Family Size in Roman Forest is 3.0 People.
What is the Average Household Size in Roman Forest
Average Household Size in Roman Forest is 2.7 People.
How Large is the Labor Force in Roman Forest?
There are 1,040 People in the Labor Forcein in Roman Forest.
What is the Percentage of People in the Labor Force in Roman Forest?
64.2% of People are in the Labor Force in Roman Forest.
What is the Unemployment Rate in Roman Forest?
Unemployment Rate in Roman Forest is 4.3%.