Sanborn, IA Map & Demographics
Sanborn Map
Sanborn Overview
$26,751
PER CAPITA INCOME
$70,795
AVG FAMILY INCOME
$54,500
AVG HOUSEHOLD INCOME
57.0%
WAGE / INCOME GAP [ % ]
43.0¢/ $1
WAGE / INCOME GAP [ $ ]
0.42
INEQUALITY / GINI INDEX
1,536
TOTAL POPULATION
714
MALE POPULATION
822
FEMALE POPULATION
86.86
MALES / 100 FEMALES
115.13
FEMALES / 100 MALES
41.3
MEDIAN AGE
3.3
AVG FAMILY SIZE
2.4
AVG HOUSEHOLD SIZE
642
LABOR FORCE [ PEOPLE ]
56.0%
PERCENT IN LABOR FORCE
1.7%
UNEMPLOYMENT RATE
Sanborn Zip Codes
Sanborn Area Codes
Income in Sanborn
Income Overview in Sanborn
Per Capita Income in Sanborn is $26,751, while median incomes of families and households are $70,795 and $54,500 respectively.
| Characteristic | Number | Measure |
| Per Capita Income | 1,536 | $26,751 |
| Median Family Income | 339 | $70,795 |
| Mean Family Income | 339 | $76,534 |
| Median Household Income | 608 | $54,500 |
| Mean Household Income | 608 | $63,919 |
| Income Deficit | 339 | $0 |
| Wage / Income Gap (%) | 1,536 | 57.00% |
| Wage / Income Gap ($) | 1,536 | 43.00¢ per $1 |
| Gini / Inequality Index | 1,536 | 0.42 |
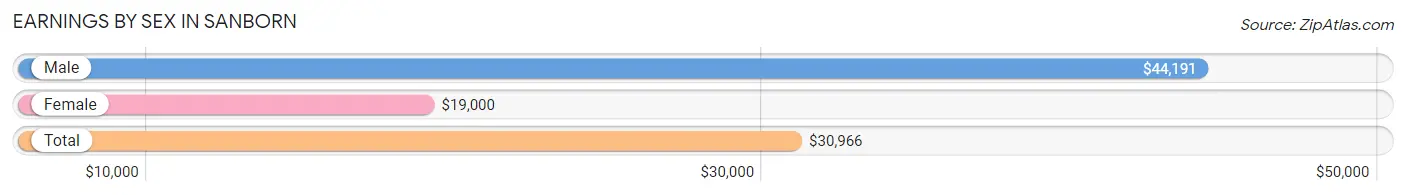
Earnings by Sex in Sanborn
Average Earnings in Sanborn are $30,966, $44,191 for men and $19,000 for women, a difference of 57.0%.
| Sex | Number | Average Earnings |
| Male | 383 (54.0%) | $44,191 |
| Female | 326 (46.0%) | $19,000 |
| Total | 709 (100.0%) | $30,966 |
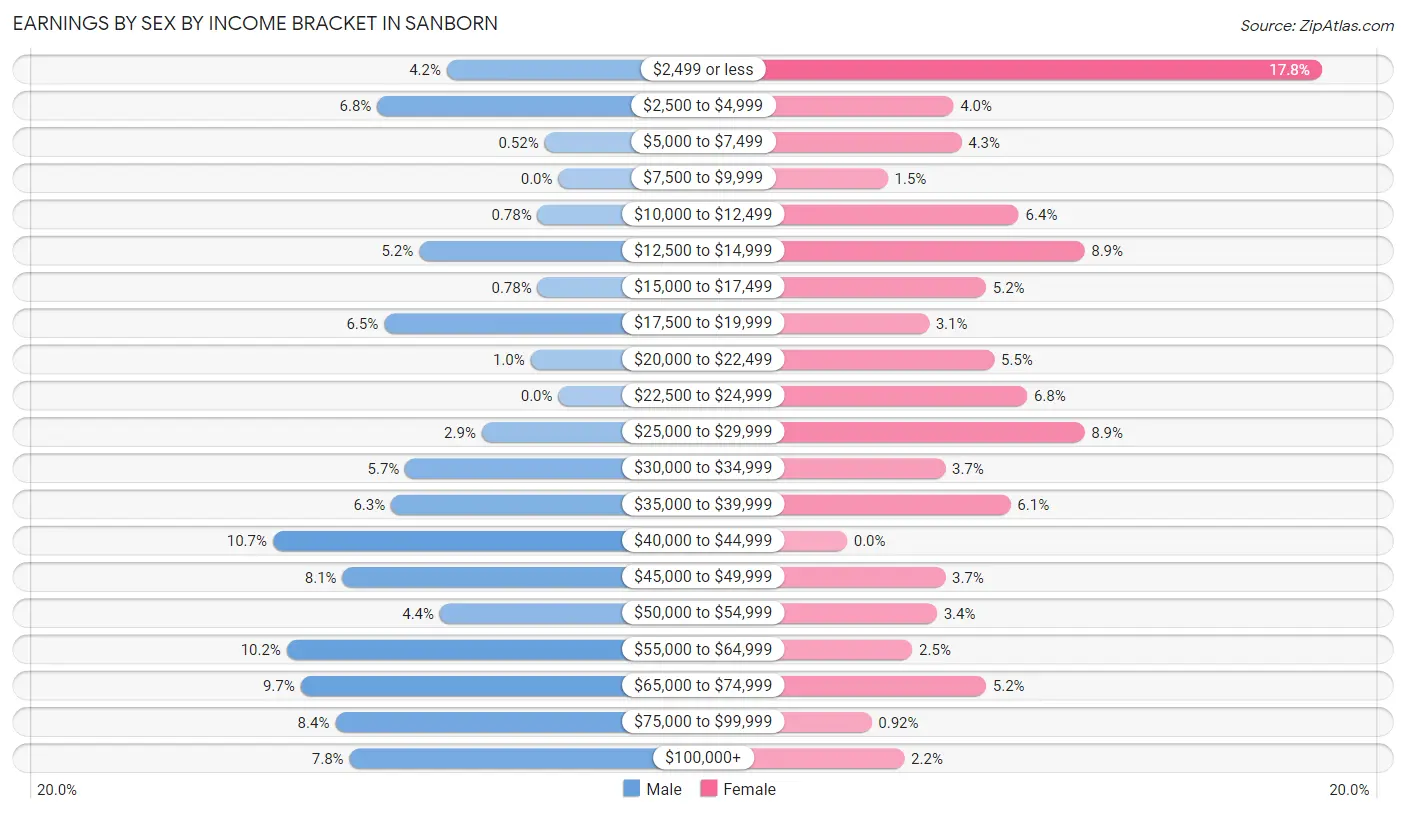
Earnings by Sex by Income Bracket in Sanborn
The most common earnings brackets in Sanborn are $40,000 to $44,999 for men (41 | 10.7%) and $2,499 or less for women (58 | 17.8%).
| Income | Male | Female |
| $2,499 or less | 16 (4.2%) | 58 (17.8%) |
| $2,500 to $4,999 | 26 (6.8%) | 13 (4.0%) |
| $5,000 to $7,499 | 2 (0.5%) | 14 (4.3%) |
| $7,500 to $9,999 | 0 (0.0%) | 5 (1.5%) |
| $10,000 to $12,499 | 3 (0.8%) | 21 (6.4%) |
| $12,500 to $14,999 | 20 (5.2%) | 29 (8.9%) |
| $15,000 to $17,499 | 3 (0.8%) | 17 (5.2%) |
| $17,500 to $19,999 | 25 (6.5%) | 10 (3.1%) |
| $20,000 to $22,499 | 4 (1.0%) | 18 (5.5%) |
| $22,500 to $24,999 | 0 (0.0%) | 22 (6.8%) |
| $25,000 to $29,999 | 11 (2.9%) | 29 (8.9%) |
| $30,000 to $34,999 | 22 (5.7%) | 12 (3.7%) |
| $35,000 to $39,999 | 24 (6.3%) | 20 (6.1%) |
| $40,000 to $44,999 | 41 (10.7%) | 0 (0.0%) |
| $45,000 to $49,999 | 31 (8.1%) | 12 (3.7%) |
| $50,000 to $54,999 | 17 (4.4%) | 11 (3.4%) |
| $55,000 to $64,999 | 39 (10.2%) | 8 (2.5%) |
| $65,000 to $74,999 | 37 (9.7%) | 17 (5.2%) |
| $75,000 to $99,999 | 32 (8.4%) | 3 (0.9%) |
| $100,000+ | 30 (7.8%) | 7 (2.1%) |
| Total | 383 (100.0%) | 326 (100.0%) |
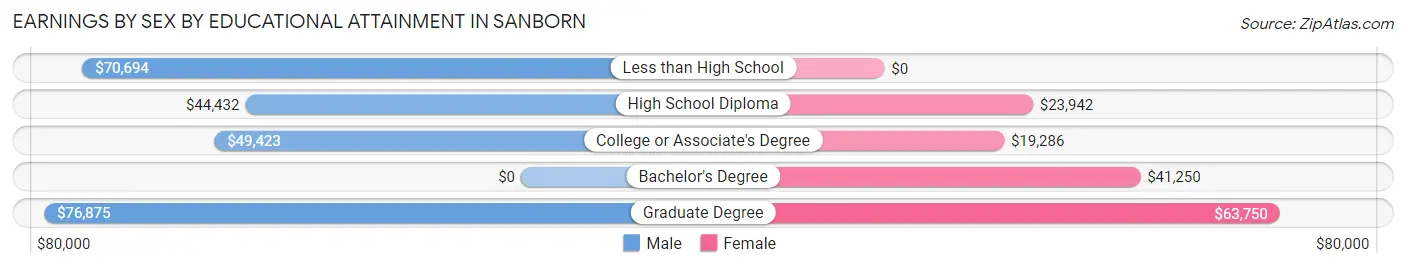
Earnings by Sex by Educational Attainment in Sanborn
Average earnings in Sanborn are $46,071 for men and $23,421 for women, a difference of 49.2%. Men with an educational attainment of graduate degree enjoy the highest average annual earnings of $76,875, while those with high school diploma education earn the least with $44,432. Women with an educational attainment of graduate degree earn the most with the average annual earnings of $63,750, while those with college or associate's degree education have the smallest earnings of $19,286.
| Educational Attainment | Male Income | Female Income |
| Less than High School | $70,694 | $0 |
| High School Diploma | $44,432 | $23,942 |
| College or Associate's Degree | $49,423 | $19,286 |
| Bachelor's Degree | - | - |
| Graduate Degree | $76,875 | $63,750 |
| Total | $46,071 | $23,421 |
Family Income in Sanborn
Family Income Brackets in Sanborn
According to the Sanborn family income data, there are 78 families falling into the $100,000 to $149,999 income range, which is the most common income bracket and makes up 23.0% of all families. Conversely, the $150,000 to $199,999 income bracket is the least frequent group with only 9 families (2.6%) belonging to this category.
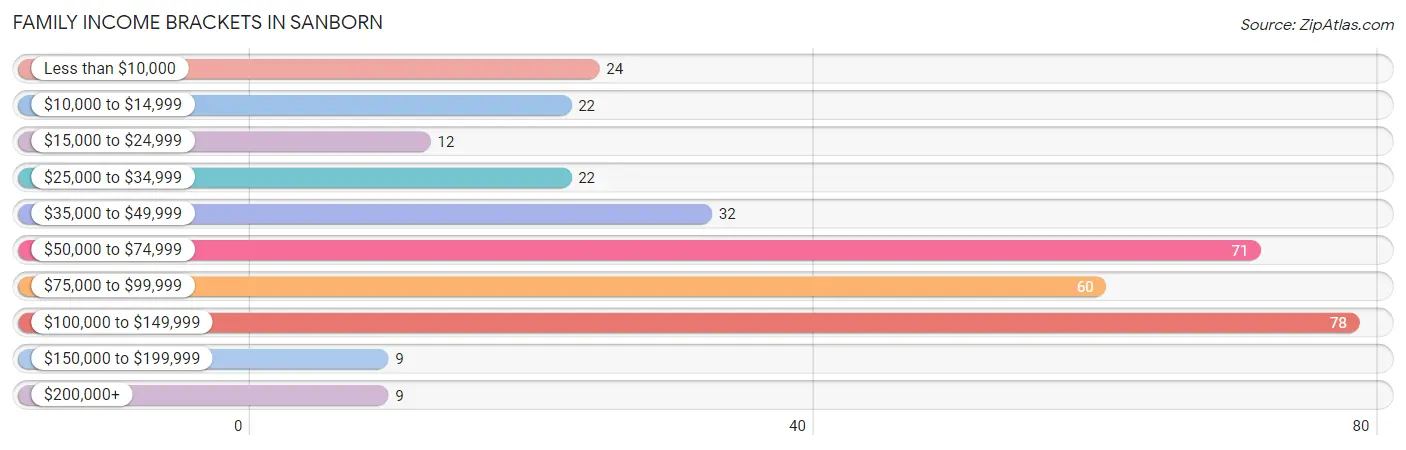
| Income Bracket | # Families | % Families |
| Less than $10,000 | 24 | 7.1% |
| $10,000 to $14,999 | 22 | 6.5% |
| $15,000 to $24,999 | 12 | 3.5% |
| $25,000 to $34,999 | 22 | 6.5% |
| $35,000 to $49,999 | 32 | 9.4% |
| $50,000 to $74,999 | 71 | 20.9% |
| $75,000 to $99,999 | 60 | 17.7% |
| $100,000 to $149,999 | 78 | 23.0% |
| $150,000 to $199,999 | 9 | 2.7% |
| $200,000+ | 9 | 2.7% |
Family Income by Famaliy Size in Sanborn
3-person families (84 | 24.8%) account for the highest median family income in Sanborn with $107,667 per family, while 3-person families (84 | 24.8%) have the highest median income of $35,889 per family member.
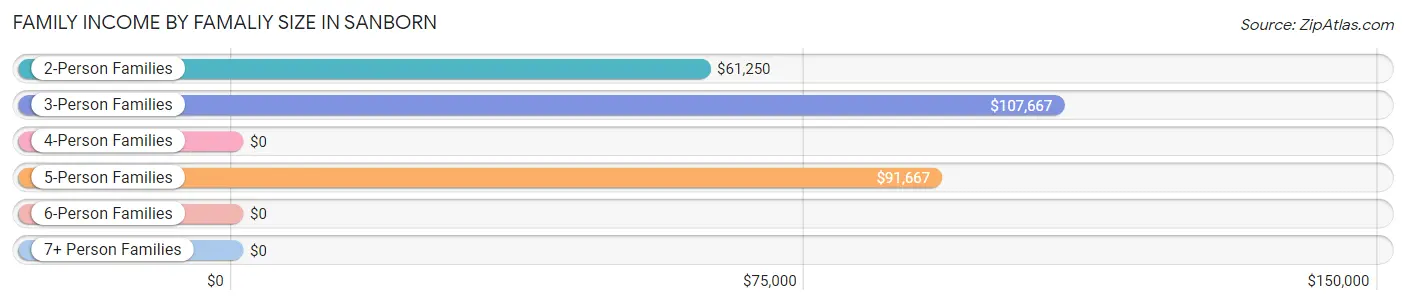
| Income Bracket | # Families | Median Income |
| 2-Person Families | 180 (53.1%) | $61,250 |
| 3-Person Families | 84 (24.8%) | $107,667 |
| 4-Person Families | 28 (8.3%) | $0 |
| 5-Person Families | 22 (6.5%) | $91,667 |
| 6-Person Families | 10 (2.9%) | $0 |
| 7+ Person Families | 15 (4.4%) | $0 |
| Total | 339 (100.0%) | $70,795 |
Family Income by Number of Earners in Sanborn
The median family income in Sanborn is $70,795, with families comprising 3+ earners (28) having the highest median family income of $130,625, while families with 1 earner (147) have the lowest median family income of $42,708, accounting for 8.3% and 43.4% of families, respectively.
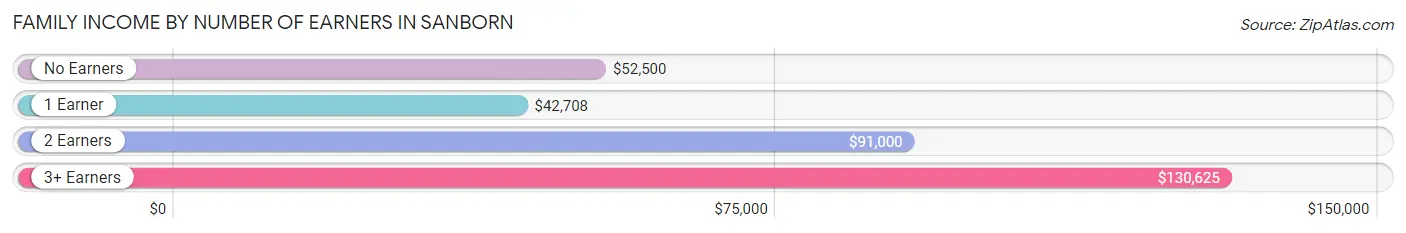
| Number of Earners | # Families | Median Income |
| No Earners | 34 (10.0%) | $52,500 |
| 1 Earner | 147 (43.4%) | $42,708 |
| 2 Earners | 130 (38.4%) | $91,000 |
| 3+ Earners | 28 (8.3%) | $130,625 |
| Total | 339 (100.0%) | $70,795 |
Household Income in Sanborn
Household Income Brackets in Sanborn
With 120 households falling in the category, the $50,000 to $74,999 income range is the most frequent in Sanborn, accounting for 19.7% of all households. In contrast, only 9 households (1.5%) fall into the $200,000+ income bracket, making it the least populous group.
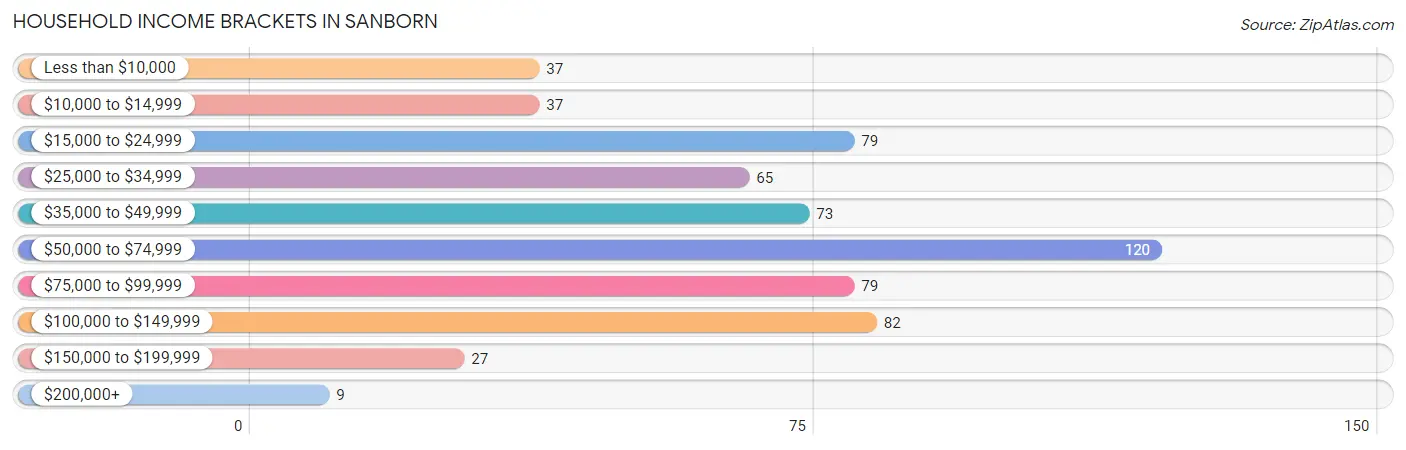
| Income Bracket | # Households | % Households |
| Less than $10,000 | 37 | 6.1% |
| $10,000 to $14,999 | 37 | 6.1% |
| $15,000 to $24,999 | 79 | 13.0% |
| $25,000 to $34,999 | 65 | 10.7% |
| $35,000 to $49,999 | 73 | 12.0% |
| $50,000 to $74,999 | 120 | 19.7% |
| $75,000 to $99,999 | 79 | 13.0% |
| $100,000 to $149,999 | 82 | 13.5% |
| $150,000 to $199,999 | 27 | 4.4% |
| $200,000+ | 9 | 1.5% |
Household Income by Householder Age in Sanborn
The median household income in Sanborn is $54,500, with the highest median household income of $77,083 found in the 45 to 64 years age bracket for the primary householder. A total of 147 households (24.2%) fall into this category. Meanwhile, the 65+ years age bracket for the primary householder has the lowest median household income of $36,250, with 254 households (41.8%) in this group.
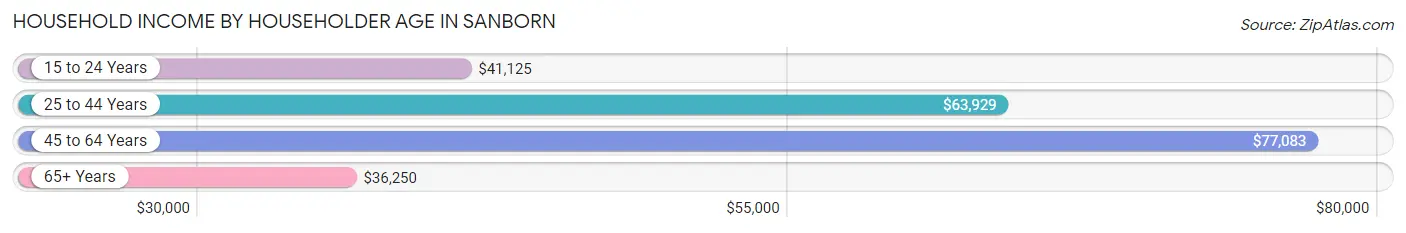
| Income Bracket | # Households | Median Income |
| 15 to 24 Years | 27 (4.4%) | $41,125 |
| 25 to 44 Years | 180 (29.6%) | $63,929 |
| 45 to 64 Years | 147 (24.2%) | $77,083 |
| 65+ Years | 254 (41.8%) | $36,250 |
| Total | 608 (100.0%) | $54,500 |
Poverty in Sanborn
Income Below Poverty by Sex and Age in Sanborn
With 13.3% poverty level for males and 13.3% for females among the residents of Sanborn, 75 year old and over males and 65 to 74 year old females are the most vulnerable to poverty, with 37 males (44.6%) and 25 females (33.8%) in their respective age groups living below the poverty level.
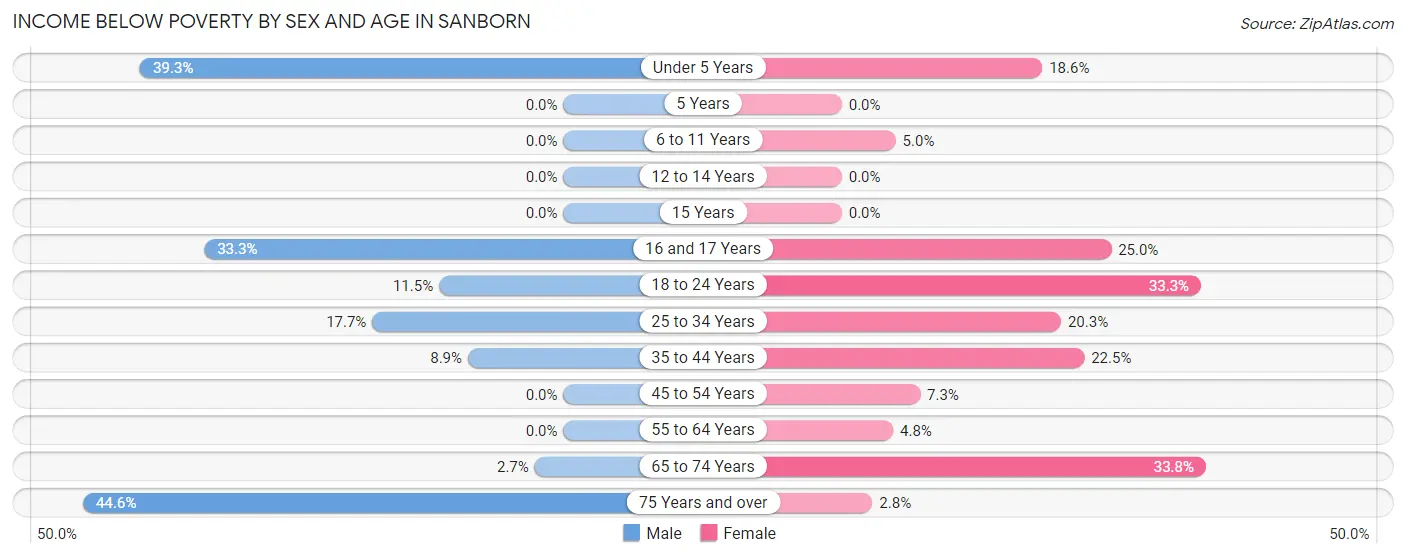
| Age Bracket | Male | Female |
| Under 5 Years | 22 (39.3%) | 8 (18.6%) |
| 5 Years | 0 (0.0%) | 0 (0.0%) |
| 6 to 11 Years | 0 (0.0%) | 6 (5.0%) |
| 12 to 14 Years | 0 (0.0%) | 0 (0.0%) |
| 15 Years | 0 (0.0%) | 0 (0.0%) |
| 16 and 17 Years | 4 (33.3%) | 7 (25.0%) |
| 18 to 24 Years | 9 (11.5%) | 15 (33.3%) |
| 25 to 34 Years | 11 (17.7%) | 12 (20.3%) |
| 35 to 44 Years | 7 (8.9%) | 18 (22.5%) |
| 45 to 54 Years | 0 (0.0%) | 4 (7.3%) |
| 55 to 64 Years | 0 (0.0%) | 3 (4.8%) |
| 65 to 74 Years | 2 (2.7%) | 25 (33.8%) |
| 75 Years and over | 37 (44.6%) | 4 (2.8%) |
| Total | 92 (13.3%) | 102 (13.3%) |
Income Above Poverty by Sex and Age in Sanborn
According to the poverty statistics in Sanborn, males aged 5 years and females aged 5 years are the age groups that are most secure financially, with 100.0% of males and 100.0% of females in these age groups living above the poverty line.
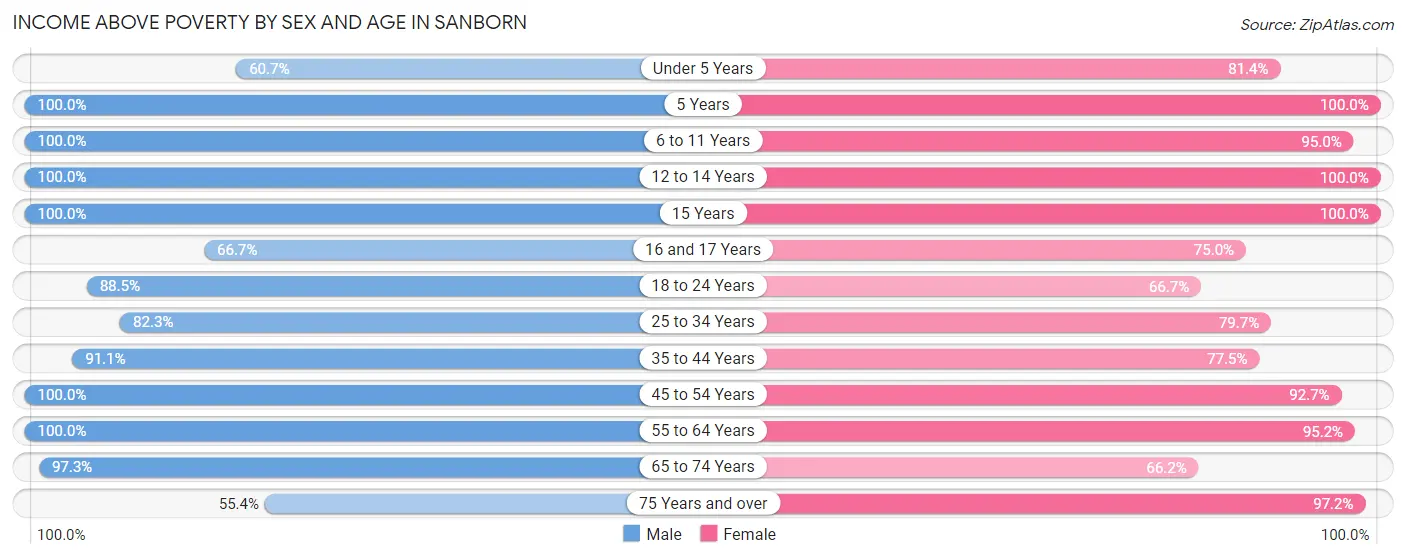
| Age Bracket | Male | Female |
| Under 5 Years | 34 (60.7%) | 35 (81.4%) |
| 5 Years | 8 (100.0%) | 6 (100.0%) |
| 6 to 11 Years | 37 (100.0%) | 114 (95.0%) |
| 12 to 14 Years | 37 (100.0%) | 42 (100.0%) |
| 15 Years | 29 (100.0%) | 9 (100.0%) |
| 16 and 17 Years | 8 (66.7%) | 21 (75.0%) |
| 18 to 24 Years | 69 (88.5%) | 30 (66.7%) |
| 25 to 34 Years | 51 (82.3%) | 47 (79.7%) |
| 35 to 44 Years | 72 (91.1%) | 62 (77.5%) |
| 45 to 54 Years | 50 (100.0%) | 51 (92.7%) |
| 55 to 64 Years | 87 (100.0%) | 60 (95.2%) |
| 65 to 74 Years | 73 (97.3%) | 49 (66.2%) |
| 75 Years and over | 46 (55.4%) | 137 (97.2%) |
| Total | 601 (86.7%) | 663 (86.7%) |
Income Below Poverty Among Married-Couple Families in Sanborn
The poverty statistics for married-couple families in Sanborn show that 14.9% or 40 of the total 269 families live below the poverty line. Families with 1 or 2 children have the highest poverty rate of 22.2%, comprising of 14 families. On the other hand, families with 3 or 4 children have the lowest poverty rate of 0.0%, which includes 0 families.
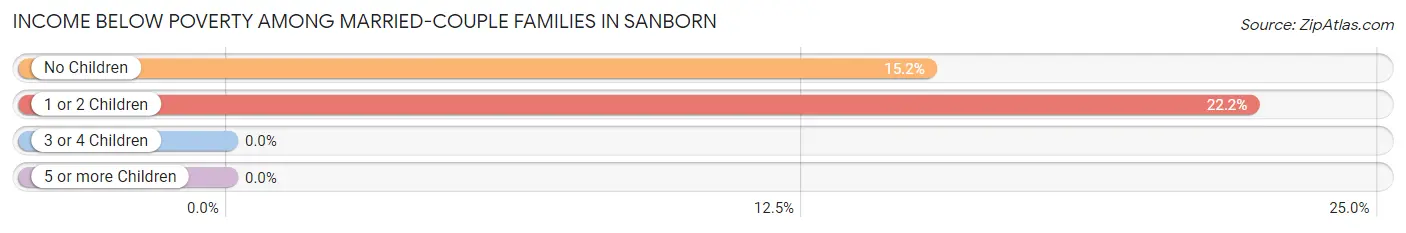
| Children | Above Poverty | Below Poverty |
| No Children | 145 (84.8%) | 26 (15.2%) |
| 1 or 2 Children | 49 (77.8%) | 14 (22.2%) |
| 3 or 4 Children | 30 (100.0%) | 0 (0.0%) |
| 5 or more Children | 5 (100.0%) | 0 (0.0%) |
| Total | 229 (85.1%) | 40 (14.9%) |
Income Below Poverty Among Single-Parent Households in Sanborn
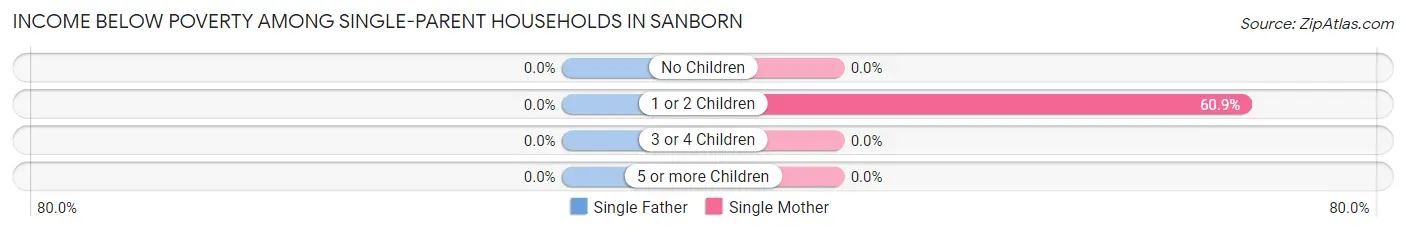
| Children | Single Father | Single Mother |
| No Children | 0 (0.0%) | 0 (0.0%) |
| 1 or 2 Children | 0 (0.0%) | 14 (60.9%) |
| 3 or 4 Children | 0 (0.0%) | 0 (0.0%) |
| 5 or more Children | 0 (0.0%) | 0 (0.0%) |
| Total | 0 (0.0%) | 14 (42.4%) |
Income Below Poverty Among Married-Couple vs Single-Parent Households in Sanborn
The poverty data for Sanborn shows that 40 of the married-couple family households (14.9%) and 14 of the single-parent households (20.0%) are living below the poverty level. Within the married-couple family households, those with 1 or 2 children have the highest poverty rate, with 14 households (22.2%) falling below the poverty line. Among the single-parent households, those with 1 or 2 children have the highest poverty rate, with 14 household (25.0%) living below poverty.
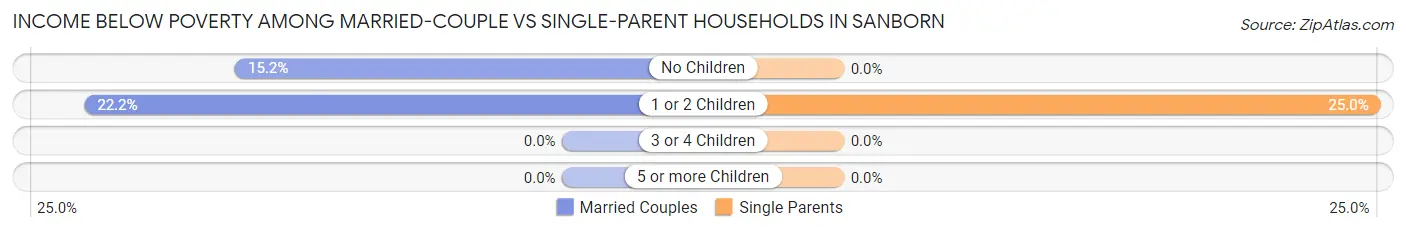
| Children | Married-Couple Families | Single-Parent Households |
| No Children | 26 (15.2%) | 0 (0.0%) |
| 1 or 2 Children | 14 (22.2%) | 14 (25.0%) |
| 3 or 4 Children | 0 (0.0%) | 0 (0.0%) |
| 5 or more Children | 0 (0.0%) | 0 (0.0%) |
| Total | 40 (14.9%) | 14 (20.0%) |
Race in Sanborn
The most populous races in Sanborn are White / Caucasian (1,490 | 97.0%), Black / African American (25 | 1.6%), and Two or more Races (17 | 1.1%).
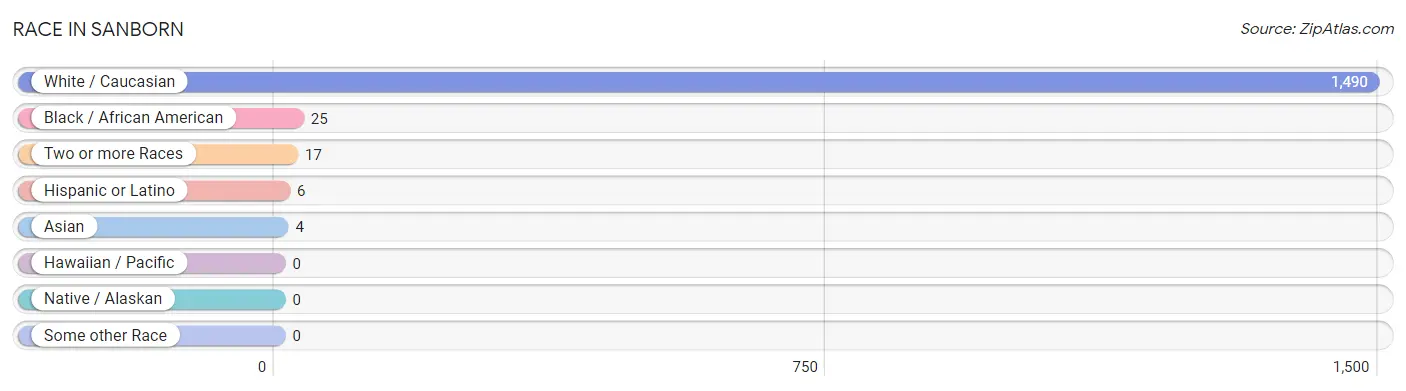
| Race | # Population | % Population |
| Asian | 4 | 0.3% |
| Black / African American | 25 | 1.6% |
| Hawaiian / Pacific | 0 | 0.0% |
| Hispanic or Latino | 6 | 0.4% |
| Native / Alaskan | 0 | 0.0% |
| White / Caucasian | 1,490 | 97.0% |
| Two or more Races | 17 | 1.1% |
| Some other Race | 0 | 0.0% |
| Total | 1,536 | 100.0% |
Ancestry in Sanborn
The most populous ancestries reported in Sanborn are Dutch (502 | 32.7%), German (476 | 31.0%), Irish (92 | 6.0%), English (70 | 4.6%), and American (66 | 4.3%), together accounting for 78.5% of all Sanborn residents.
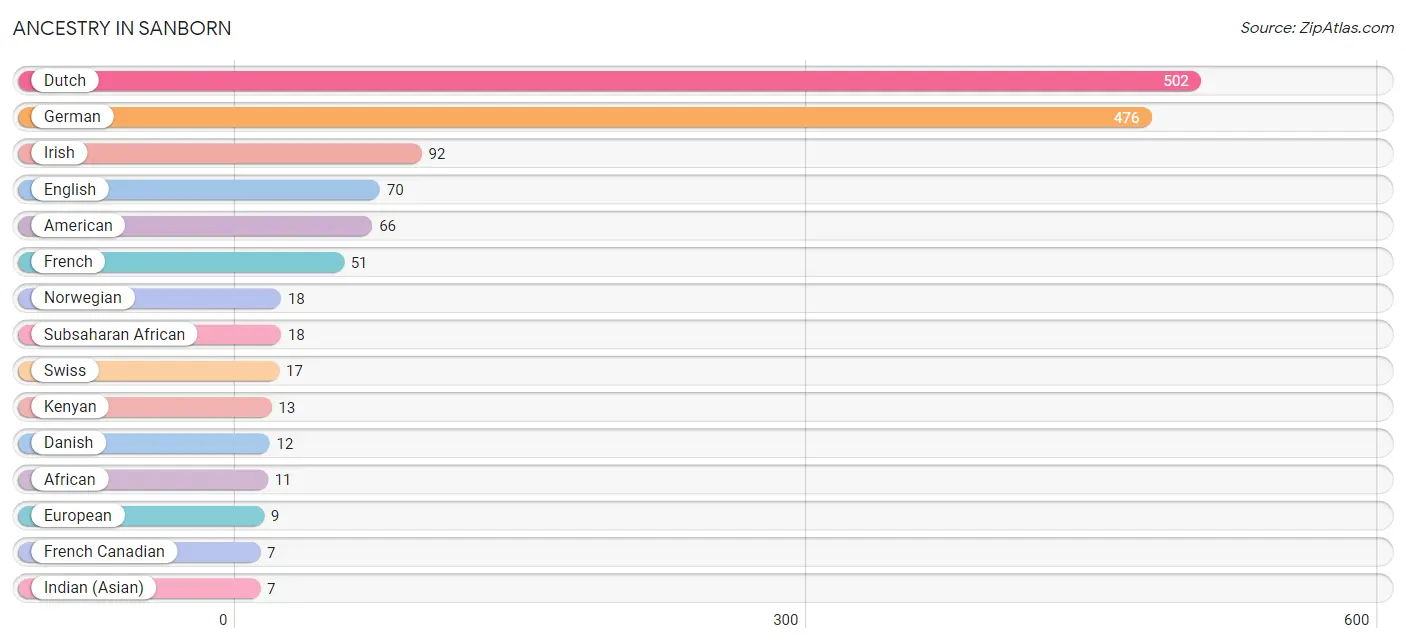
| Ancestry | # Population | % Population |
| African | 11 | 0.7% |
| American | 66 | 4.3% |
| Canadian | 4 | 0.3% |
| Danish | 12 | 0.8% |
| Dutch | 502 | 32.7% |
| English | 70 | 4.6% |
| European | 9 | 0.6% |
| French | 51 | 3.3% |
| French Canadian | 7 | 0.5% |
| German | 476 | 31.0% |
| Indian (Asian) | 7 | 0.5% |
| Irish | 92 | 6.0% |
| Italian | 6 | 0.4% |
| Kenyan | 13 | 0.9% |
| Luxembourger | 4 | 0.3% |
| Mexican | 6 | 0.4% |
| Norwegian | 18 | 1.2% |
| Pennsylvania German | 3 | 0.2% |
| Polish | 4 | 0.3% |
| Scandinavian | 6 | 0.4% |
| Subsaharan African | 18 | 1.2% |
| Swedish | 6 | 0.4% |
| Swiss | 17 | 1.1% |
| Welsh | 5 | 0.3% | View All 24 Rows |
Immigrants in Sanborn
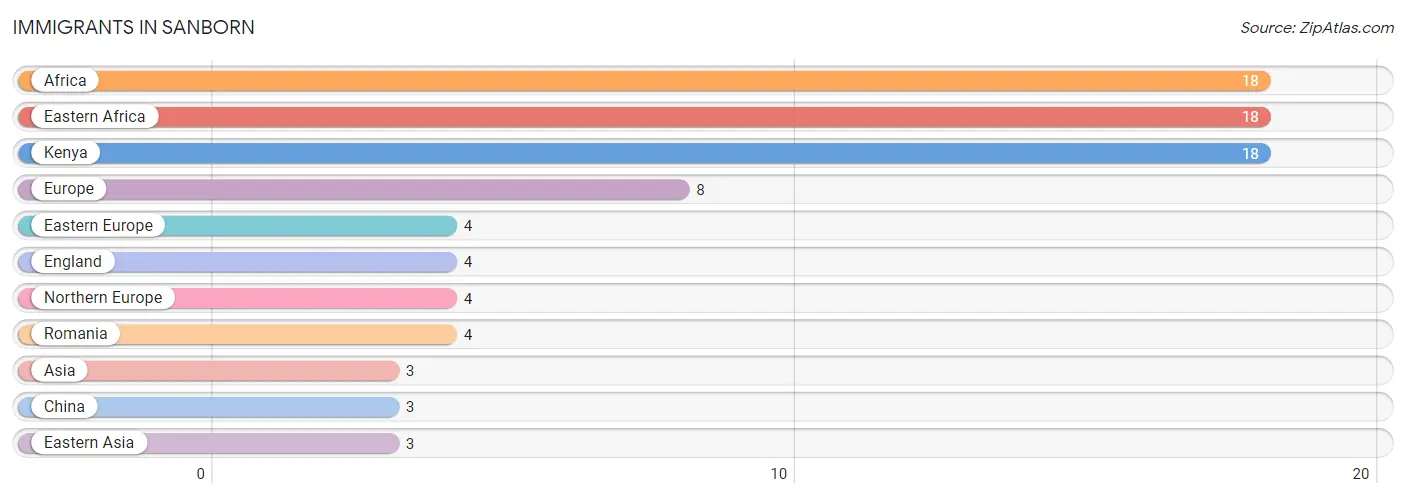
The most numerous immigrant groups reported in Sanborn came from Africa (18 | 1.2%), Eastern Africa (18 | 1.2%), Kenya (18 | 1.2%), Europe (8 | 0.5%), and Eastern Europe (4 | 0.3%), together accounting for 4.3% of all Sanborn residents.
| Immigration Origin | # Population | % Population |
| Africa | 18 | 1.2% |
| Asia | 3 | 0.2% |
| China | 3 | 0.2% |
| Eastern Africa | 18 | 1.2% |
| Eastern Asia | 3 | 0.2% |
| Eastern Europe | 4 | 0.3% |
| England | 4 | 0.3% |
| Europe | 8 | 0.5% |
| Kenya | 18 | 1.2% |
| Northern Europe | 4 | 0.3% |
| Romania | 4 | 0.3% | View All 11 Rows |
Sex and Age in Sanborn
Sex and Age in Sanborn
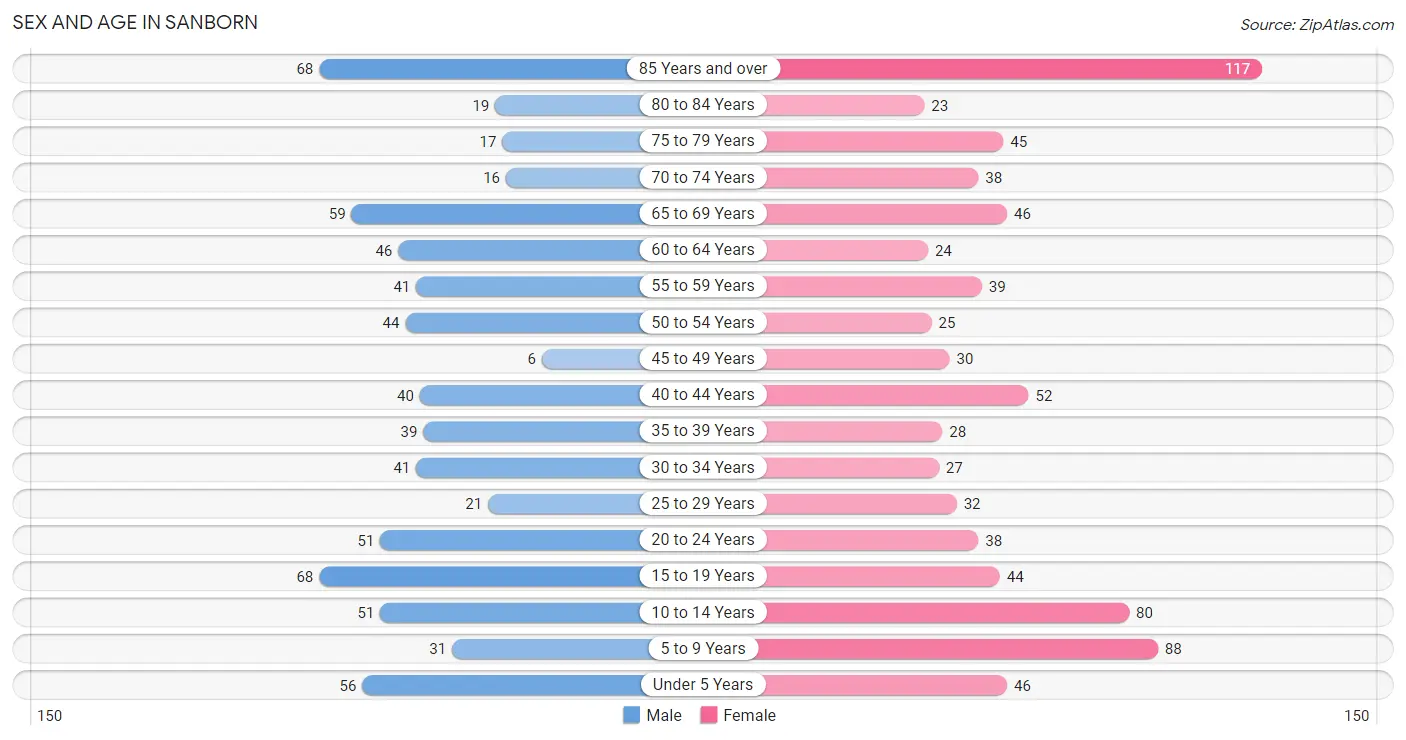
The most populous age groups in Sanborn are 15 to 19 Years (68 | 9.5%) for men and 85 Years and over (117 | 14.2%) for women.
| Age Bracket | Male | Female |
| Under 5 Years | 56 (7.8%) | 46 (5.6%) |
| 5 to 9 Years | 31 (4.3%) | 88 (10.7%) |
| 10 to 14 Years | 51 (7.1%) | 80 (9.7%) |
| 15 to 19 Years | 68 (9.5%) | 44 (5.3%) |
| 20 to 24 Years | 51 (7.1%) | 38 (4.6%) |
| 25 to 29 Years | 21 (2.9%) | 32 (3.9%) |
| 30 to 34 Years | 41 (5.7%) | 27 (3.3%) |
| 35 to 39 Years | 39 (5.5%) | 28 (3.4%) |
| 40 to 44 Years | 40 (5.6%) | 52 (6.3%) |
| 45 to 49 Years | 6 (0.8%) | 30 (3.6%) |
| 50 to 54 Years | 44 (6.2%) | 25 (3.0%) |
| 55 to 59 Years | 41 (5.7%) | 39 (4.7%) |
| 60 to 64 Years | 46 (6.4%) | 24 (2.9%) |
| 65 to 69 Years | 59 (8.3%) | 46 (5.6%) |
| 70 to 74 Years | 16 (2.2%) | 38 (4.6%) |
| 75 to 79 Years | 17 (2.4%) | 45 (5.5%) |
| 80 to 84 Years | 19 (2.7%) | 23 (2.8%) |
| 85 Years and over | 68 (9.5%) | 117 (14.2%) |
| Total | 714 (100.0%) | 822 (100.0%) |
Families and Households in Sanborn
Median Family Size in Sanborn
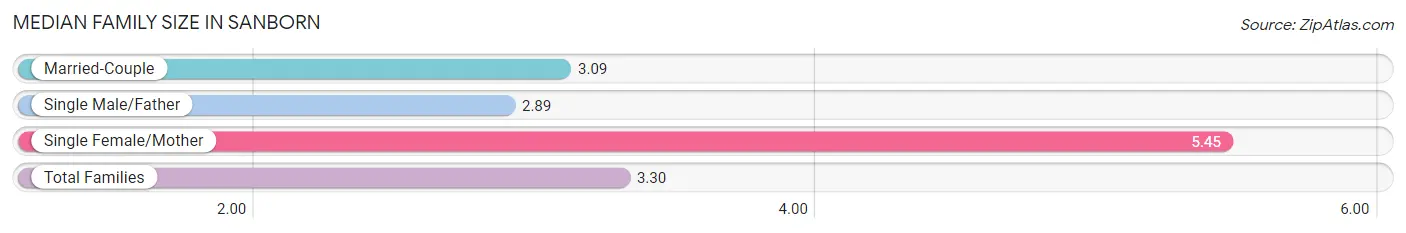
The median family size in Sanborn is 3.30 persons per family, with single female/mother families (33 | 9.7%) accounting for the largest median family size of 5.45 persons per family. On the other hand, single male/father families (37 | 10.9%) represent the smallest median family size with 2.89 persons per family.
| Family Type | # Families | Family Size |
| Married-Couple | 269 (79.3%) | 3.09 |
| Single Male/Father | 37 (10.9%) | 2.89 |
| Single Female/Mother | 33 (9.7%) | 5.45 |
| Total Families | 339 (100.0%) | 3.30 |
Median Household Size in Sanborn
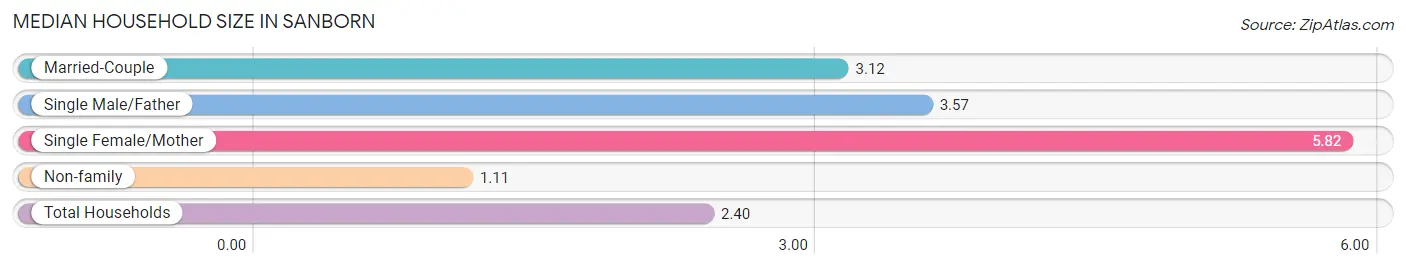
The median household size in Sanborn is 2.40 persons per household, with single female/mother households (33 | 5.4%) accounting for the largest median household size of 5.82 persons per household. non-family households (269 | 44.2%) represent the smallest median household size with 1.11 persons per household.
| Household Type | # Households | Household Size |
| Married-Couple | 269 (44.2%) | 3.12 |
| Single Male/Father | 37 (6.1%) | 3.57 |
| Single Female/Mother | 33 (5.4%) | 5.82 |
| Non-family | 269 (44.2%) | 1.11 |
| Total Households | 608 (100.0%) | 2.40 |
Household Size by Marriage Status in Sanborn
Out of a total of 608 households in Sanborn, 339 (55.8%) are family households, while 269 (44.2%) are nonfamily households. The most numerous type of family households are 2-person households, comprising 165, and the most common type of nonfamily households are 1-person households, comprising 248.
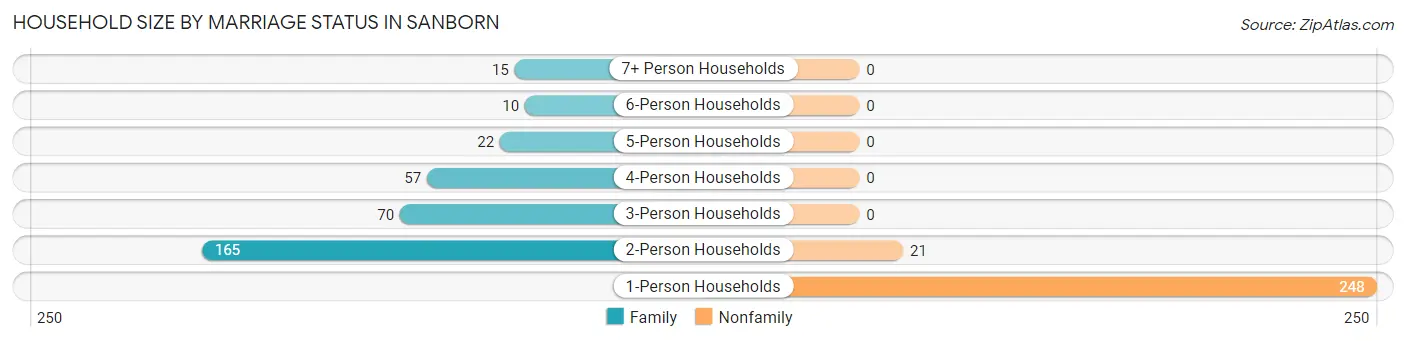
| Household Size | Family Households | Nonfamily Households |
| 1-Person Households | - | 248 (40.8%) |
| 2-Person Households | 165 (27.1%) | 21 (3.5%) |
| 3-Person Households | 70 (11.5%) | 0 (0.0%) |
| 4-Person Households | 57 (9.4%) | 0 (0.0%) |
| 5-Person Households | 22 (3.6%) | 0 (0.0%) |
| 6-Person Households | 10 (1.6%) | 0 (0.0%) |
| 7+ Person Households | 15 (2.5%) | 0 (0.0%) |
| Total | 339 (55.8%) | 269 (44.2%) |
Female Fertility in Sanborn
Fertility by Age in Sanborn
Average fertility rate in Sanborn is 162.0 births per 1,000 women. Women in the age bracket of 20 to 34 years have the highest fertility rate with 206.0 births per 1,000 women. Women in the age bracket of 35 to 50 years acount for 53.5% of all women with births.
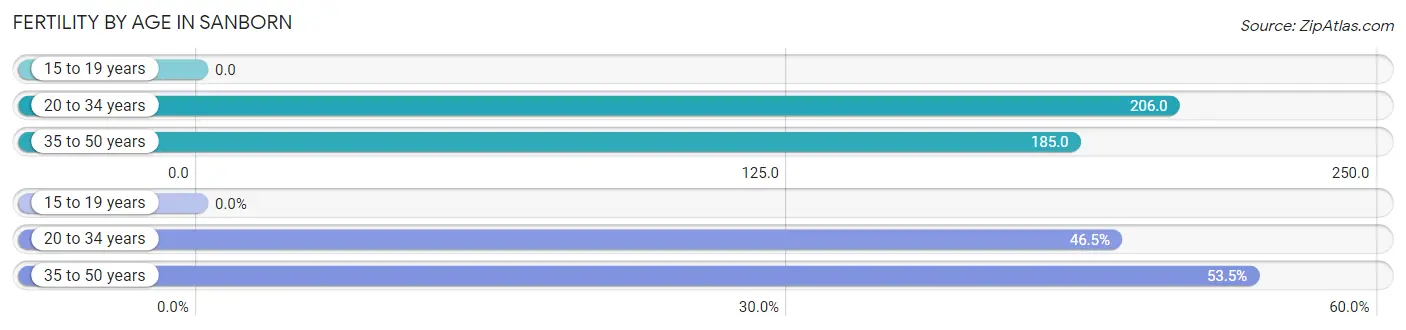
| Age Bracket | Women with Births | Births / 1,000 Women |
| 15 to 19 years | 0 (0.0%) | 0.0 |
| 20 to 34 years | 20 (46.5%) | 206.0 |
| 35 to 50 years | 23 (53.5%) | 185.0 |
| Total | 43 (100.0%) | 162.0 |
Fertility by Age by Marriage Status in Sanborn
76.7% of women with births (43) in Sanborn are married. The highest percentage of unmarried women with births falls into 20 to 34 years age bracket with 50.0% of them unmarried at the time of birth, while the lowest percentage of unmarried women with births belong to 35 to 50 years age bracket with 0.0% of them unmarried.
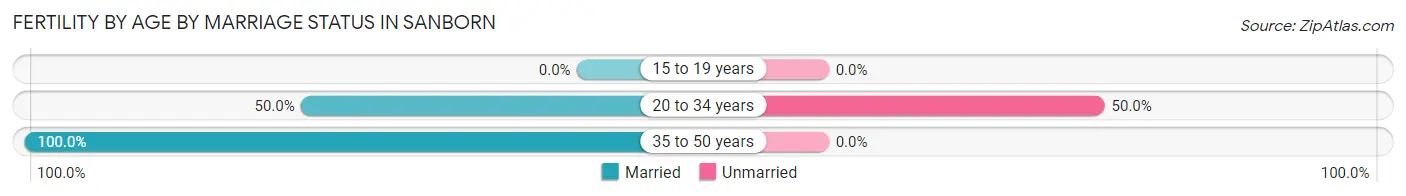
| Age Bracket | Married | Unmarried |
| 15 to 19 years | 0 (0.0%) | 0 (0.0%) |
| 20 to 34 years | 10 (50.0%) | 10 (50.0%) |
| 35 to 50 years | 23 (100.0%) | 0 (0.0%) |
| Total | 33 (76.7%) | 10 (23.3%) |
Fertility by Education in Sanborn
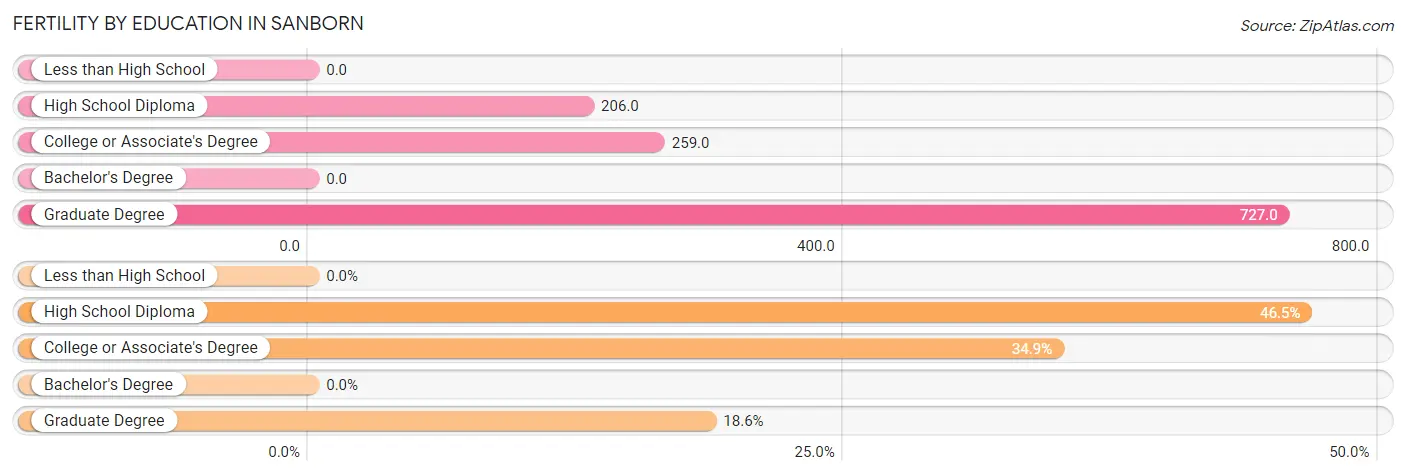
| Educational Attainment | Women with Births | Births / 1,000 Women |
| Less than High School | 0 (0.0%) | 0.0 |
| High School Diploma | 20 (46.5%) | 206.0 |
| College or Associate's Degree | 15 (34.9%) | 259.0 |
| Bachelor's Degree | 0 (0.0%) | 0.0 |
| Graduate Degree | 8 (18.6%) | 727.0 |
| Total | 43 (100.0%) | 162.0 |
Fertility by Education by Marriage Status in Sanborn
23.3% of women with births in Sanborn are unmarried. Women with the educational attainment of college or associate's degree are most likely to be married with 100.0% of them married at childbirth, while women with the educational attainment of high school diploma are least likely to be married with 50.0% of them unmarried at childbirth.
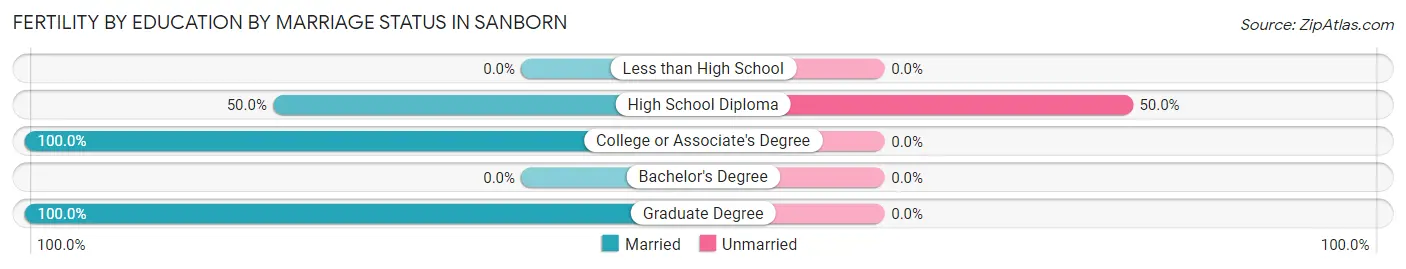
| Educational Attainment | Married | Unmarried |
| Less than High School | 0 (0.0%) | 0 (0.0%) |
| High School Diploma | 10 (50.0%) | 10 (50.0%) |
| College or Associate's Degree | 15 (100.0%) | 0 (0.0%) |
| Bachelor's Degree | 0 (0.0%) | 0 (0.0%) |
| Graduate Degree | 8 (100.0%) | 0 (0.0%) |
| Total | 33 (76.7%) | 10 (23.3%) |
Employment Characteristics in Sanborn
Employment by Class of Employer in Sanborn
Among the 605 employed individuals in Sanborn, private company employees (306 | 50.6%), not-for-profit organizations (103 | 17.0%), and self-employed (not incorporated) (73 | 12.1%) make up the most common classes of employment.
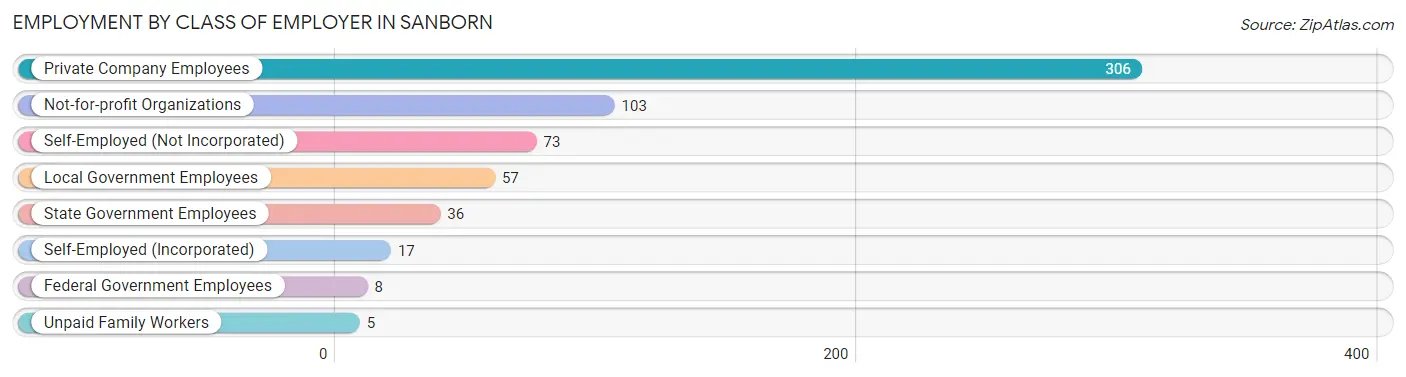
| Employer Class | # Employees | % Employees |
| Private Company Employees | 306 | 50.6% |
| Self-Employed (Incorporated) | 17 | 2.8% |
| Self-Employed (Not Incorporated) | 73 | 12.1% |
| Not-for-profit Organizations | 103 | 17.0% |
| Local Government Employees | 57 | 9.4% |
| State Government Employees | 36 | 5.9% |
| Federal Government Employees | 8 | 1.3% |
| Unpaid Family Workers | 5 | 0.8% |
| Total | 605 | 100.0% |
Employment Status by Age in Sanborn
According to the labor force statistics for Sanborn, out of the total population over 16 years of age (1,146), 56.0% or 642 individuals are in the labor force, with 1.7% or 11 of them unemployed. The age group with the highest labor force participation rate is 30 to 34 years, with 100.0% or 68 individuals in the labor force. Within the labor force, the 75 years and over age range has the highest percentage of unemployed individuals, with 28.6% or 4 of them being unemployed.
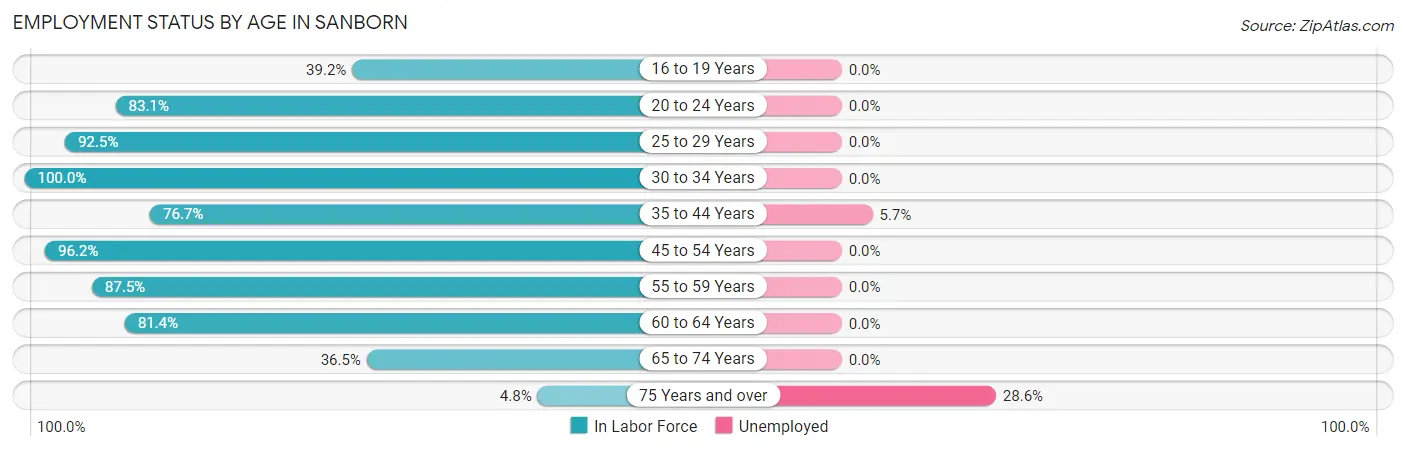
| Age Bracket | In Labor Force | Unemployed |
| 16 to 19 Years | 29 (39.2%) | 0 (0.0%) |
| 20 to 24 Years | 74 (83.1%) | 0 (0.0%) |
| 25 to 29 Years | 49 (92.5%) | 0 (0.0%) |
| 30 to 34 Years | 68 (100.0%) | 0 (0.0%) |
| 35 to 44 Years | 122 (76.7%) | 7 (5.7%) |
| 45 to 54 Years | 101 (96.2%) | 0 (0.0%) |
| 55 to 59 Years | 70 (87.5%) | 0 (0.0%) |
| 60 to 64 Years | 57 (81.4%) | 0 (0.0%) |
| 65 to 74 Years | 58 (36.5%) | 0 (0.0%) |
| 75 Years and over | 14 (4.8%) | 4 (28.6%) |
| Total | 642 (56.0%) | 11 (1.7%) |
Employment Status by Educational Attainment in Sanborn
According to labor force statistics for Sanborn, 87.3% of individuals (467) out of the total population between 25 and 64 years of age (535) are in the labor force, with 1.5% or 7 of them being unemployed. The group with the highest labor force participation rate are those with the educational attainment of college / associate degree, with 95.0% or 171 individuals in the labor force. Within the labor force, individuals with college / associate degree education have the highest percentage of unemployment, with 4.1% or 7 of them being unemployed.
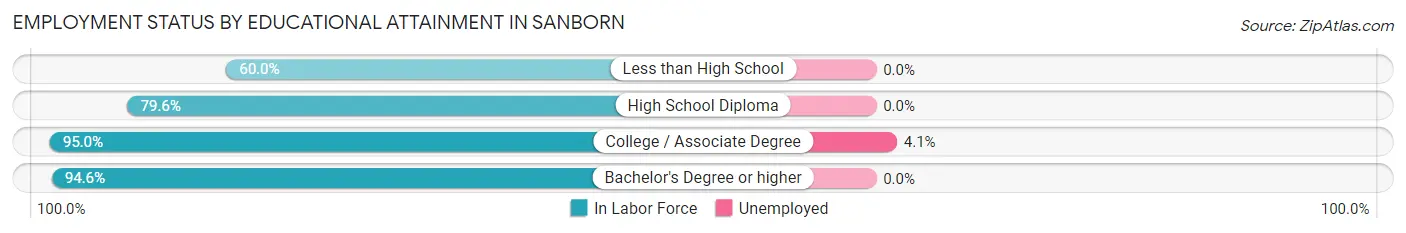
| Educational Attainment | In Labor Force | Unemployed |
| Less than High School | 18 (60.0%) | 0 (0.0%) |
| High School Diploma | 156 (79.6%) | 0 (0.0%) |
| College / Associate Degree | 171 (95.0%) | 7 (4.1%) |
| Bachelor's Degree or higher | 122 (94.6%) | 0 (0.0%) |
| Total | 467 (87.3%) | 8 (1.5%) |
Employment Occupations by Sex in Sanborn
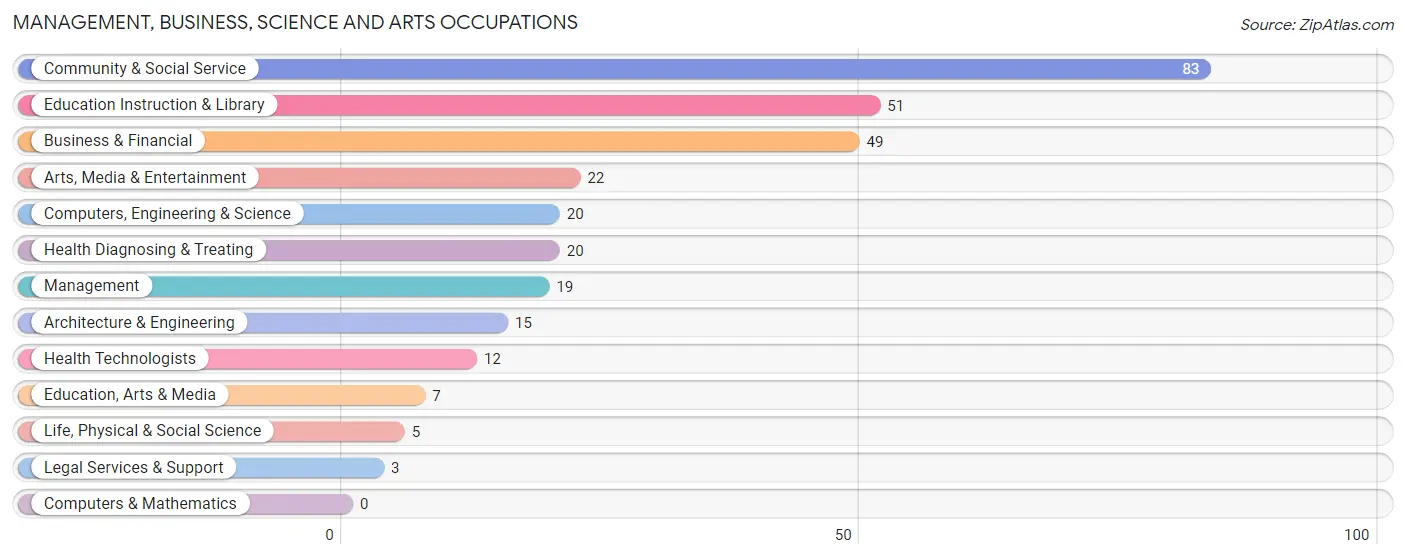
Management, Business, Science and Arts Occupations
The most common Management, Business, Science and Arts occupations in Sanborn are Community & Social Service (83 | 13.2%), Education Instruction & Library (51 | 8.1%), Business & Financial (49 | 7.8%), Arts, Media & Entertainment (22 | 3.5%), and Computers, Engineering & Science (20 | 3.2%).
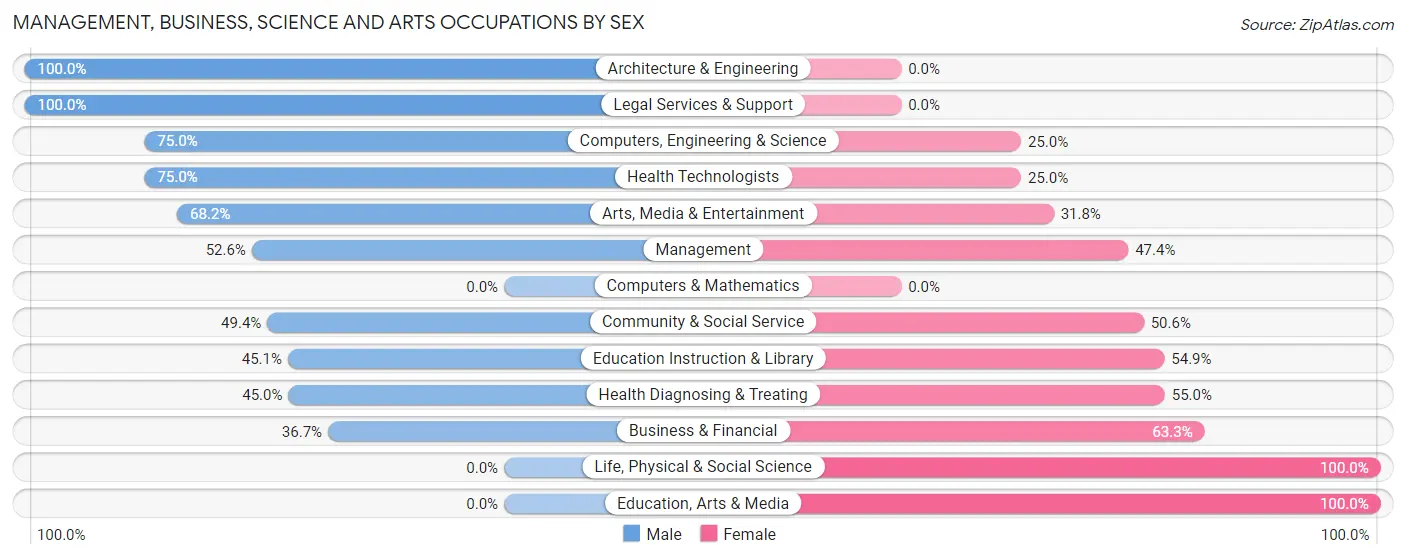
Management, Business, Science and Arts Occupations by Sex
Within the Management, Business, Science and Arts occupations in Sanborn, the most male-oriented occupations are Architecture & Engineering (100.0%), Legal Services & Support (100.0%), and Computers, Engineering & Science (75.0%), while the most female-oriented occupations are Life, Physical & Social Science (100.0%), Education, Arts & Media (100.0%), and Business & Financial (63.3%).
| Occupation | Male | Female |
| Management | 10 (52.6%) | 9 (47.4%) |
| Business & Financial | 18 (36.7%) | 31 (63.3%) |
| Computers, Engineering & Science | 15 (75.0%) | 5 (25.0%) |
| Computers & Mathematics | 0 (0.0%) | 0 (0.0%) |
| Architecture & Engineering | 15 (100.0%) | 0 (0.0%) |
| Life, Physical & Social Science | 0 (0.0%) | 5 (100.0%) |
| Community & Social Service | 41 (49.4%) | 42 (50.6%) |
| Education, Arts & Media | 0 (0.0%) | 7 (100.0%) |
| Legal Services & Support | 3 (100.0%) | 0 (0.0%) |
| Education Instruction & Library | 23 (45.1%) | 28 (54.9%) |
| Arts, Media & Entertainment | 15 (68.2%) | 7 (31.8%) |
| Health Diagnosing & Treating | 9 (45.0%) | 11 (55.0%) |
| Health Technologists | 9 (75.0%) | 3 (25.0%) |
| Total (Category) | 93 (48.7%) | 98 (51.3%) |
| Total (Overall) | 364 (57.7%) | 267 (42.3%) |
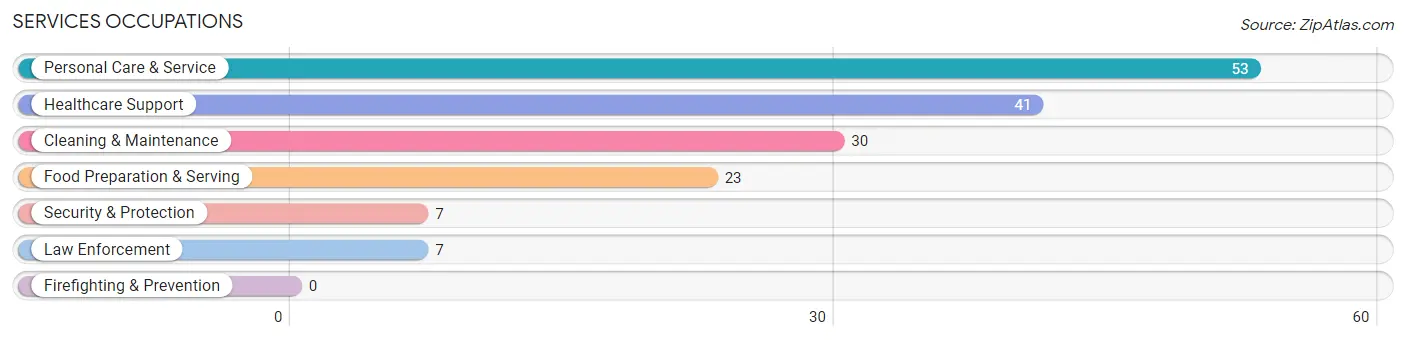
Services Occupations
The most common Services occupations in Sanborn are Personal Care & Service (53 | 8.4%), Healthcare Support (41 | 6.5%), Cleaning & Maintenance (30 | 4.8%), Food Preparation & Serving (23 | 3.6%), and Security & Protection (7 | 1.1%).
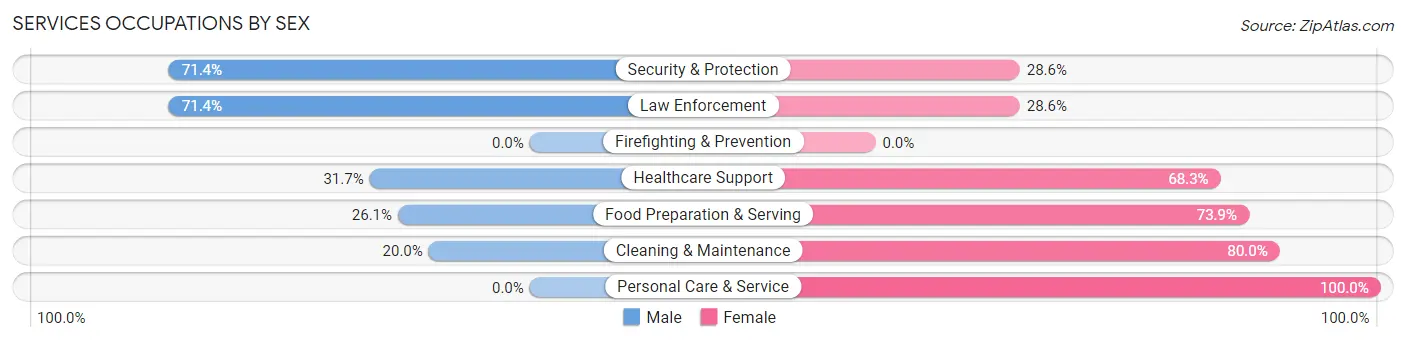
Services Occupations by Sex
Within the Services occupations in Sanborn, the most male-oriented occupations are Security & Protection (71.4%), Law Enforcement (71.4%), and Healthcare Support (31.7%), while the most female-oriented occupations are Personal Care & Service (100.0%), Cleaning & Maintenance (80.0%), and Food Preparation & Serving (73.9%).
| Occupation | Male | Female |
| Healthcare Support | 13 (31.7%) | 28 (68.3%) |
| Security & Protection | 5 (71.4%) | 2 (28.6%) |
| Firefighting & Prevention | 0 (0.0%) | 0 (0.0%) |
| Law Enforcement | 5 (71.4%) | 2 (28.6%) |
| Food Preparation & Serving | 6 (26.1%) | 17 (73.9%) |
| Cleaning & Maintenance | 6 (20.0%) | 24 (80.0%) |
| Personal Care & Service | 0 (0.0%) | 53 (100.0%) |
| Total (Category) | 30 (19.5%) | 124 (80.5%) |
| Total (Overall) | 364 (57.7%) | 267 (42.3%) |
Sales and Office Occupations
The most common Sales and Office occupations in Sanborn are Sales & Related (43 | 6.8%), and Office & Administration (43 | 6.8%).
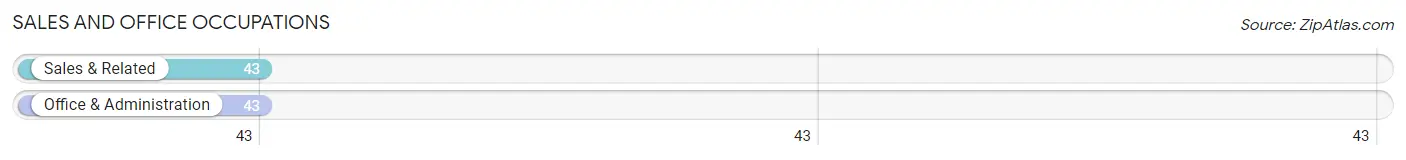
Sales and Office Occupations by Sex
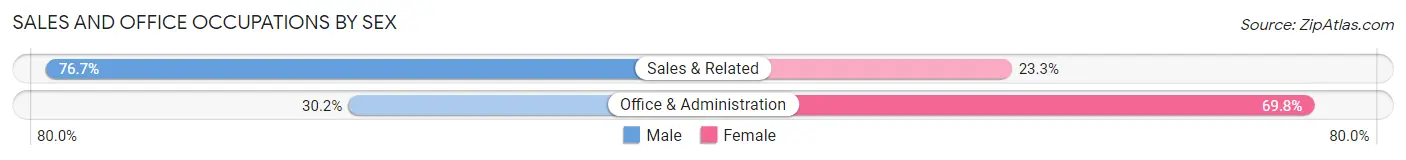
| Occupation | Male | Female |
| Sales & Related | 33 (76.7%) | 10 (23.3%) |
| Office & Administration | 13 (30.2%) | 30 (69.8%) |
| Total (Category) | 46 (53.5%) | 40 (46.5%) |
| Total (Overall) | 364 (57.7%) | 267 (42.3%) |
Natural Resources, Construction and Maintenance Occupations
The most common Natural Resources, Construction and Maintenance occupations in Sanborn are Installation, Maintenance & Repair (64 | 10.1%), Farming, Fishing & Forestry (21 | 3.3%), and Construction & Extraction (19 | 3.0%).
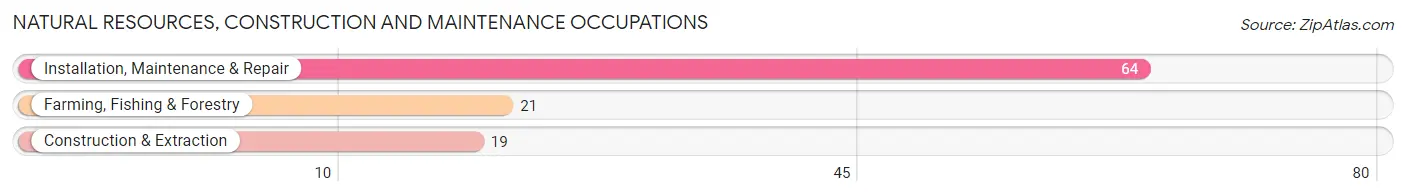
Natural Resources, Construction and Maintenance Occupations by Sex
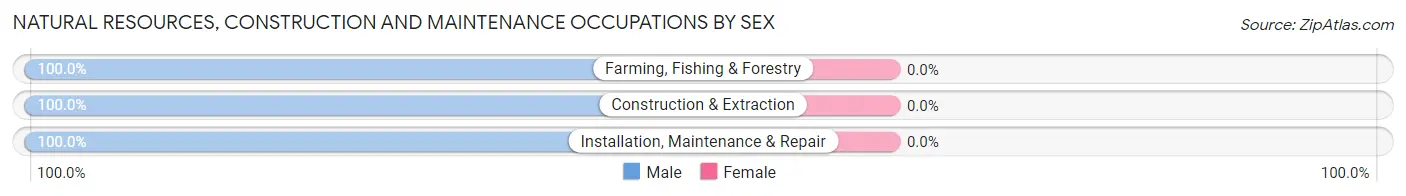
| Occupation | Male | Female |
| Farming, Fishing & Forestry | 21 (100.0%) | 0 (0.0%) |
| Construction & Extraction | 19 (100.0%) | 0 (0.0%) |
| Installation, Maintenance & Repair | 64 (100.0%) | 0 (0.0%) |
| Total (Category) | 104 (100.0%) | 0 (0.0%) |
| Total (Overall) | 364 (57.7%) | 267 (42.3%) |
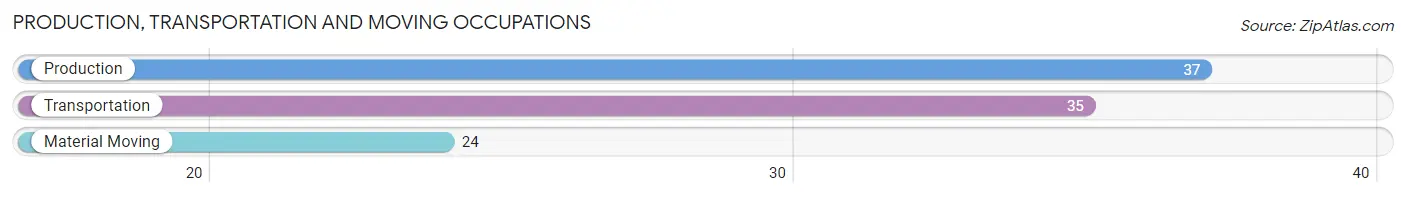
Production, Transportation and Moving Occupations
The most common Production, Transportation and Moving occupations in Sanborn are Production (37 | 5.9%), Transportation (35 | 5.6%), and Material Moving (24 | 3.8%).
Production, Transportation and Moving Occupations by Sex
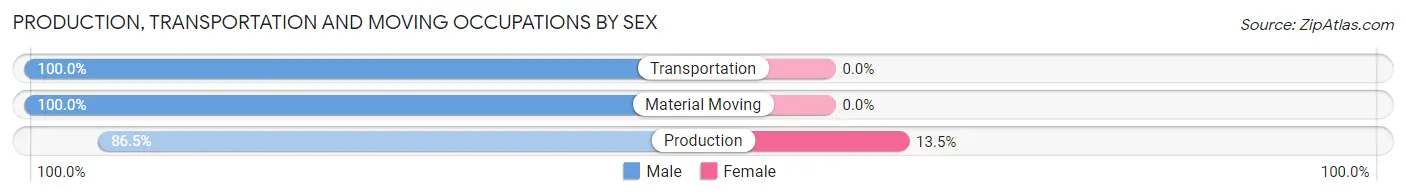
| Occupation | Male | Female |
| Production | 32 (86.5%) | 5 (13.5%) |
| Transportation | 35 (100.0%) | 0 (0.0%) |
| Material Moving | 24 (100.0%) | 0 (0.0%) |
| Total (Category) | 91 (94.8%) | 5 (5.2%) |
| Total (Overall) | 364 (57.7%) | 267 (42.3%) |
Employment Industries by Sex in Sanborn
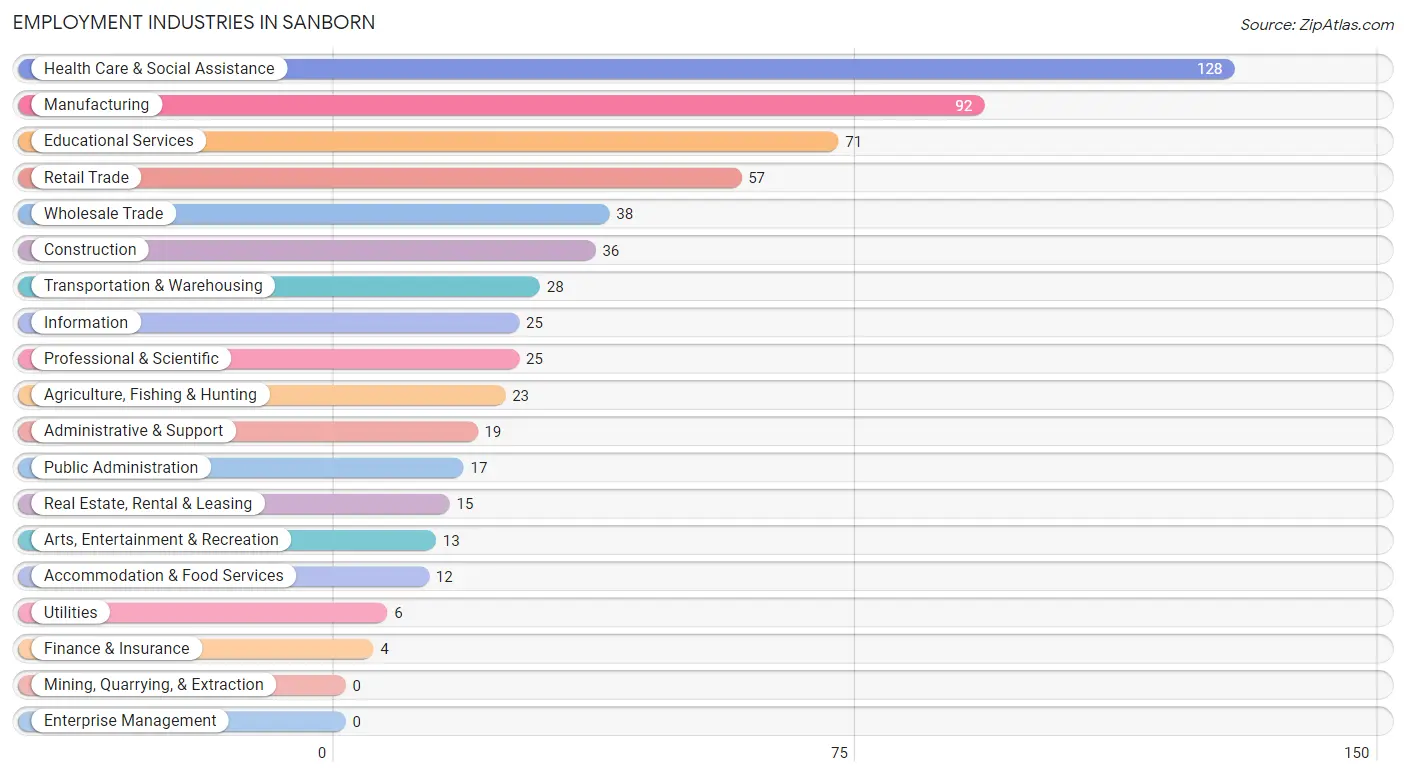
Employment Industries in Sanborn
The major employment industries in Sanborn include Health Care & Social Assistance (128 | 20.3%), Manufacturing (92 | 14.6%), Educational Services (71 | 11.3%), Retail Trade (57 | 9.0%), and Wholesale Trade (38 | 6.0%).
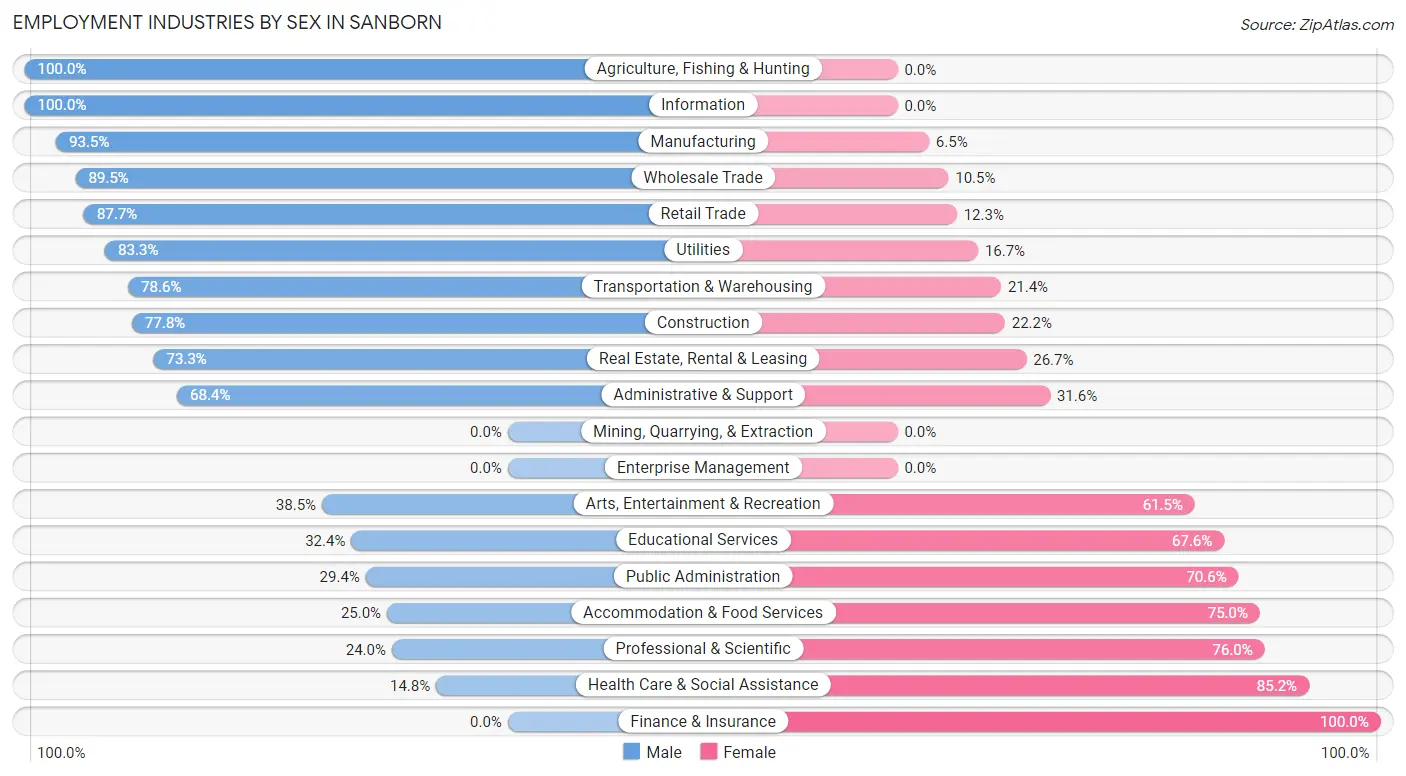
Employment Industries by Sex in Sanborn
The Sanborn industries that see more men than women are Agriculture, Fishing & Hunting (100.0%), Information (100.0%), and Manufacturing (93.5%), whereas the industries that tend to have a higher number of women are Finance & Insurance (100.0%), Health Care & Social Assistance (85.2%), and Professional & Scientific (76.0%).
| Industry | Male | Female |
| Agriculture, Fishing & Hunting | 23 (100.0%) | 0 (0.0%) |
| Mining, Quarrying, & Extraction | 0 (0.0%) | 0 (0.0%) |
| Construction | 28 (77.8%) | 8 (22.2%) |
| Manufacturing | 86 (93.5%) | 6 (6.5%) |
| Wholesale Trade | 34 (89.5%) | 4 (10.5%) |
| Retail Trade | 50 (87.7%) | 7 (12.3%) |
| Transportation & Warehousing | 22 (78.6%) | 6 (21.4%) |
| Utilities | 5 (83.3%) | 1 (16.7%) |
| Information | 25 (100.0%) | 0 (0.0%) |
| Finance & Insurance | 0 (0.0%) | 4 (100.0%) |
| Real Estate, Rental & Leasing | 11 (73.3%) | 4 (26.7%) |
| Professional & Scientific | 6 (24.0%) | 19 (76.0%) |
| Enterprise Management | 0 (0.0%) | 0 (0.0%) |
| Administrative & Support | 13 (68.4%) | 6 (31.6%) |
| Educational Services | 23 (32.4%) | 48 (67.6%) |
| Health Care & Social Assistance | 19 (14.8%) | 109 (85.2%) |
| Arts, Entertainment & Recreation | 5 (38.5%) | 8 (61.5%) |
| Accommodation & Food Services | 3 (25.0%) | 9 (75.0%) |
| Public Administration | 5 (29.4%) | 12 (70.6%) |
| Total | 364 (57.7%) | 267 (42.3%) |
Education in Sanborn
School Enrollment in Sanborn
The most common levels of schooling among the 397 students in Sanborn are middle school (132 | 33.3%), elementary school (108 | 27.2%), and high school (69 | 17.4%).
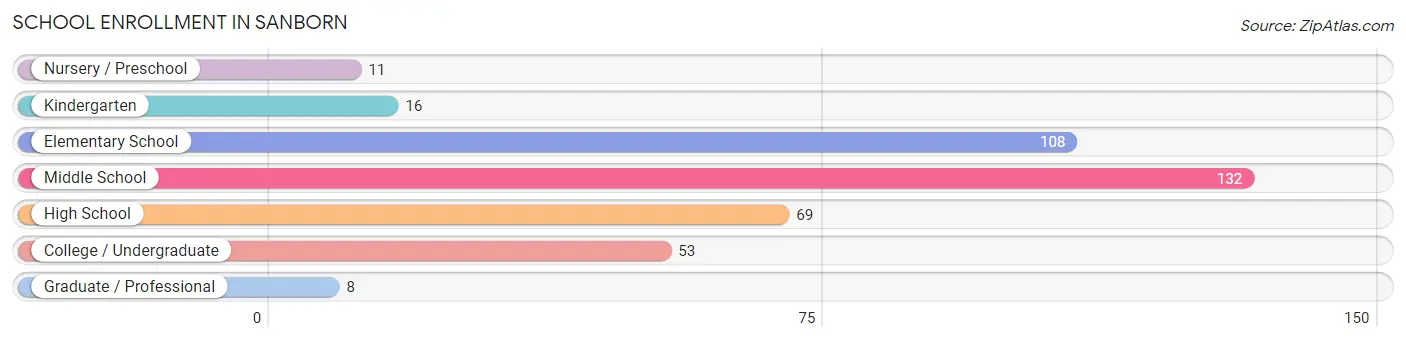
| School Level | # Students | % Students |
| Nursery / Preschool | 11 | 2.8% |
| Kindergarten | 16 | 4.0% |
| Elementary School | 108 | 27.2% |
| Middle School | 132 | 33.3% |
| High School | 69 | 17.4% |
| College / Undergraduate | 53 | 13.4% |
| Graduate / Professional | 8 | 2.0% |
| Total | 397 | 100.0% |
School Enrollment by Age by Funding Source in Sanborn
Out of a total of 397 students who are enrolled in schools in Sanborn, 122 (30.7%) attend a private institution, while the remaining 275 (69.3%) are enrolled in public schools. The age group of 5 to 9 year old has the highest likelihood of being enrolled in private schools, with 55 (46.2% in the age bracket) enrolled. Conversely, the age group of 3 to 4 year olds has the lowest likelihood of being enrolled in a private school, with 6 (100.0% in the age bracket) attending a public institution.
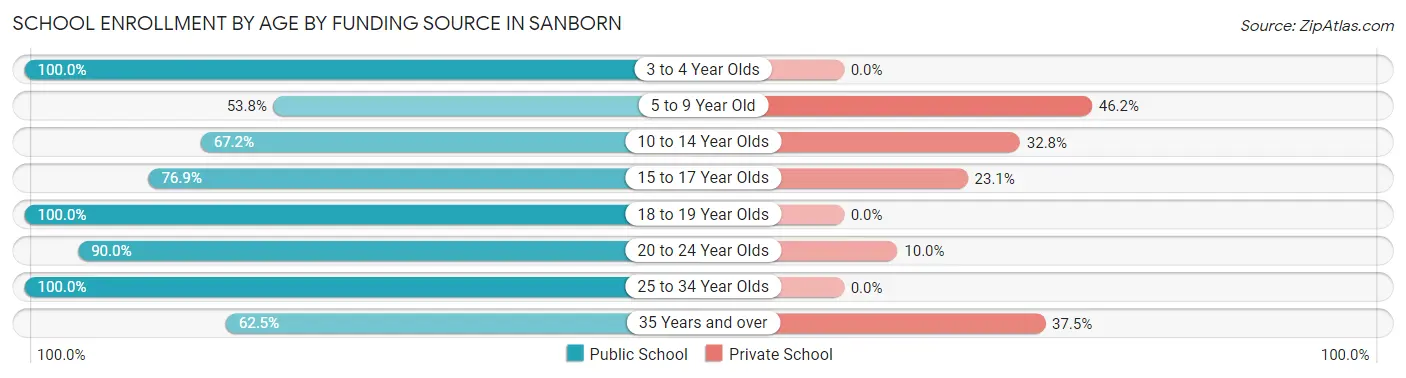
| Age Bracket | Public School | Private School |
| 3 to 4 Year Olds | 6 (100.0%) | 0 (0.0%) |
| 5 to 9 Year Old | 64 (53.8%) | 55 (46.2%) |
| 10 to 14 Year Olds | 88 (67.2%) | 43 (32.8%) |
| 15 to 17 Year Olds | 60 (76.9%) | 18 (23.1%) |
| 18 to 19 Year Olds | 18 (100.0%) | 0 (0.0%) |
| 20 to 24 Year Olds | 27 (90.0%) | 3 (10.0%) |
| 25 to 34 Year Olds | 7 (100.0%) | 0 (0.0%) |
| 35 Years and over | 5 (62.5%) | 3 (37.5%) |
| Total | 275 (69.3%) | 122 (30.7%) |
Educational Attainment by Field of Study in Sanborn
Business (88 | 35.1%), education (72 | 28.7%), science & technology (30 | 11.9%), psychology (13 | 5.2%), and social sciences (13 | 5.2%) are the most common fields of study among 251 individuals in Sanborn who have obtained a bachelor's degree or higher.
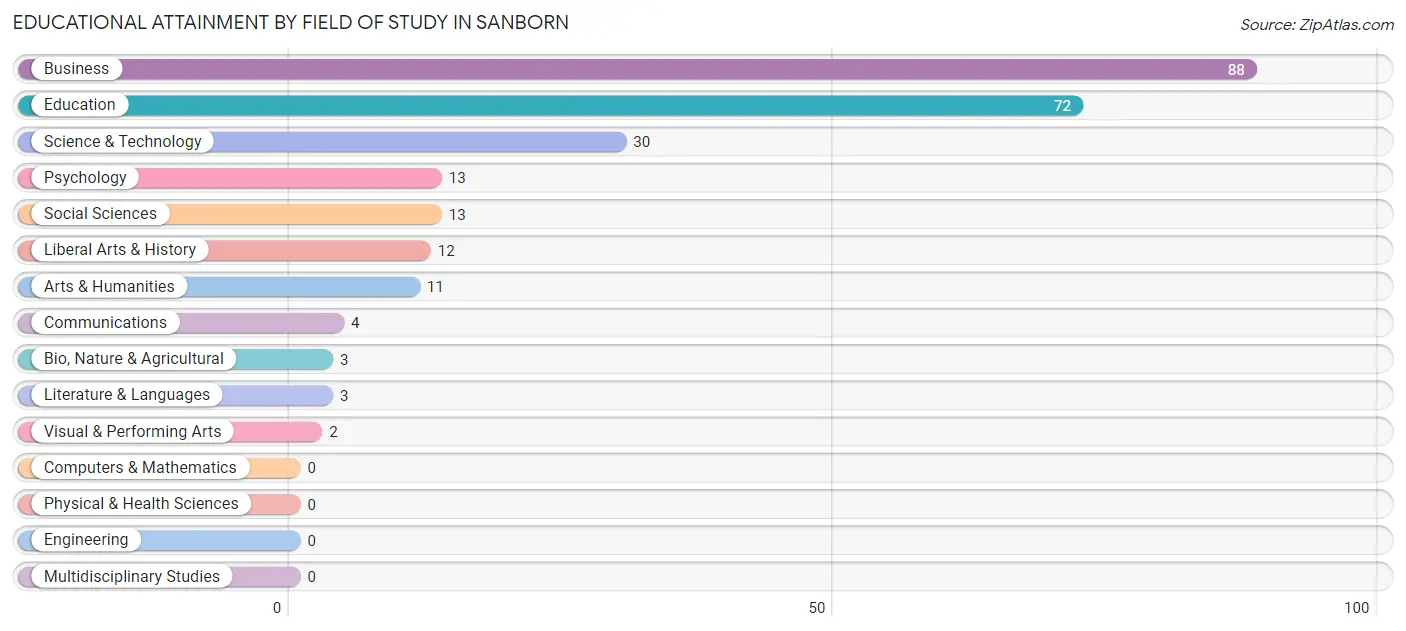
| Field of Study | # Graduates | % Graduates |
| Computers & Mathematics | 0 | 0.0% |
| Bio, Nature & Agricultural | 3 | 1.2% |
| Physical & Health Sciences | 0 | 0.0% |
| Psychology | 13 | 5.2% |
| Social Sciences | 13 | 5.2% |
| Engineering | 0 | 0.0% |
| Multidisciplinary Studies | 0 | 0.0% |
| Science & Technology | 30 | 11.9% |
| Business | 88 | 35.1% |
| Education | 72 | 28.7% |
| Literature & Languages | 3 | 1.2% |
| Liberal Arts & History | 12 | 4.8% |
| Visual & Performing Arts | 2 | 0.8% |
| Communications | 4 | 1.6% |
| Arts & Humanities | 11 | 4.4% |
| Total | 251 | 100.0% |
Transportation & Commute in Sanborn
Vehicle Availability by Sex in Sanborn
The most prevalent vehicle ownership categories in Sanborn are males with 2 vehicles (141, accounting for 40.5%) and females with 2 vehicles (88, making up 54.9%).
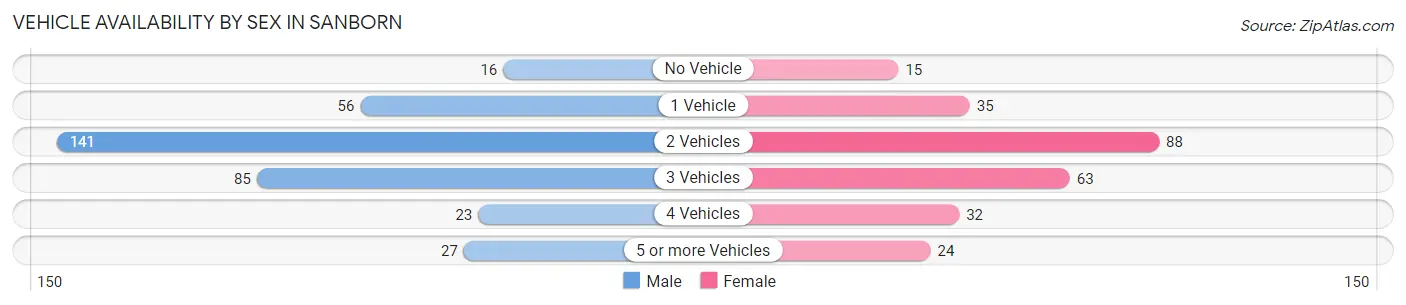
| Vehicles Available | Male | Female |
| No Vehicle | 16 (4.6%) | 15 (5.8%) |
| 1 Vehicle | 56 (16.1%) | 35 (13.6%) |
| 2 Vehicles | 141 (40.5%) | 88 (34.2%) |
| 3 Vehicles | 85 (24.4%) | 63 (24.5%) |
| 4 Vehicles | 23 (6.6%) | 32 (12.4%) |
| 5 or more Vehicles | 27 (7.8%) | 24 (9.3%) |
| Total | 348 (100.0%) | 257 (100.0%) |
Commute Time in Sanborn
The most frequently occuring commute durations in Sanborn are 10 to 14 minutes (106 commuters, 18.9%), 15 to 19 minutes (89 commuters, 15.9%), and 5 to 9 minutes (86 commuters, 15.3%).
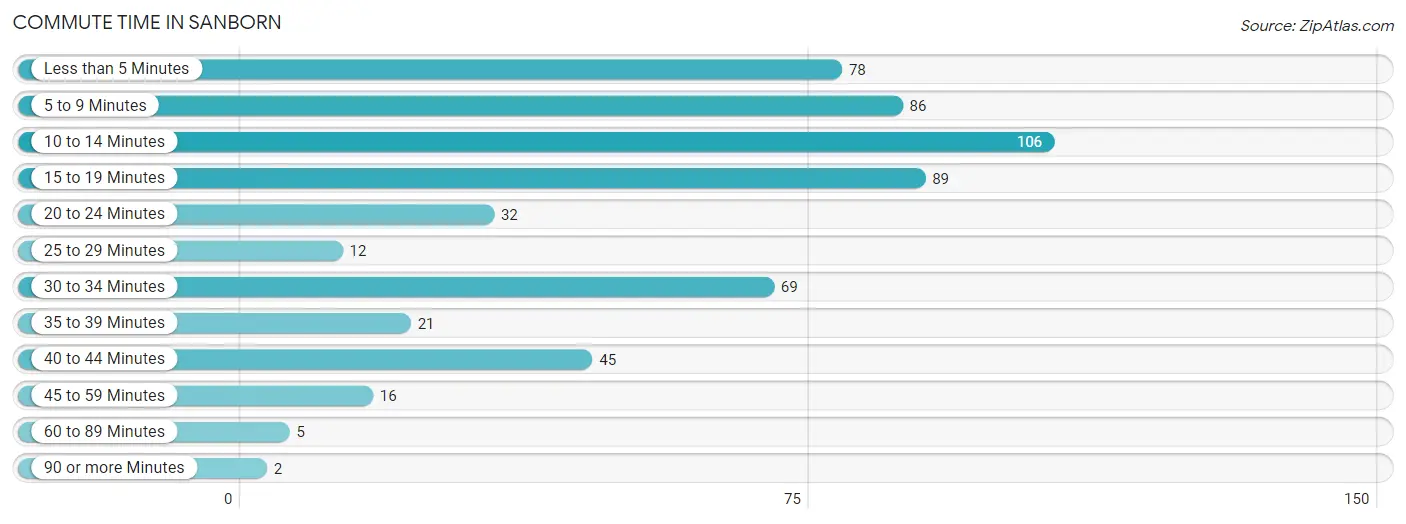
| Commute Time | # Commuters | % Commuters |
| Less than 5 Minutes | 78 | 13.9% |
| 5 to 9 Minutes | 86 | 15.3% |
| 10 to 14 Minutes | 106 | 18.9% |
| 15 to 19 Minutes | 89 | 15.9% |
| 20 to 24 Minutes | 32 | 5.7% |
| 25 to 29 Minutes | 12 | 2.1% |
| 30 to 34 Minutes | 69 | 12.3% |
| 35 to 39 Minutes | 21 | 3.7% |
| 40 to 44 Minutes | 45 | 8.0% |
| 45 to 59 Minutes | 16 | 2.9% |
| 60 to 89 Minutes | 5 | 0.9% |
| 90 or more Minutes | 2 | 0.4% |
Commute Time by Sex in Sanborn
The most common commute times in Sanborn are 15 to 19 minutes (66 commuters, 20.3%) for males and 10 to 14 minutes (60 commuters, 25.5%) for females.
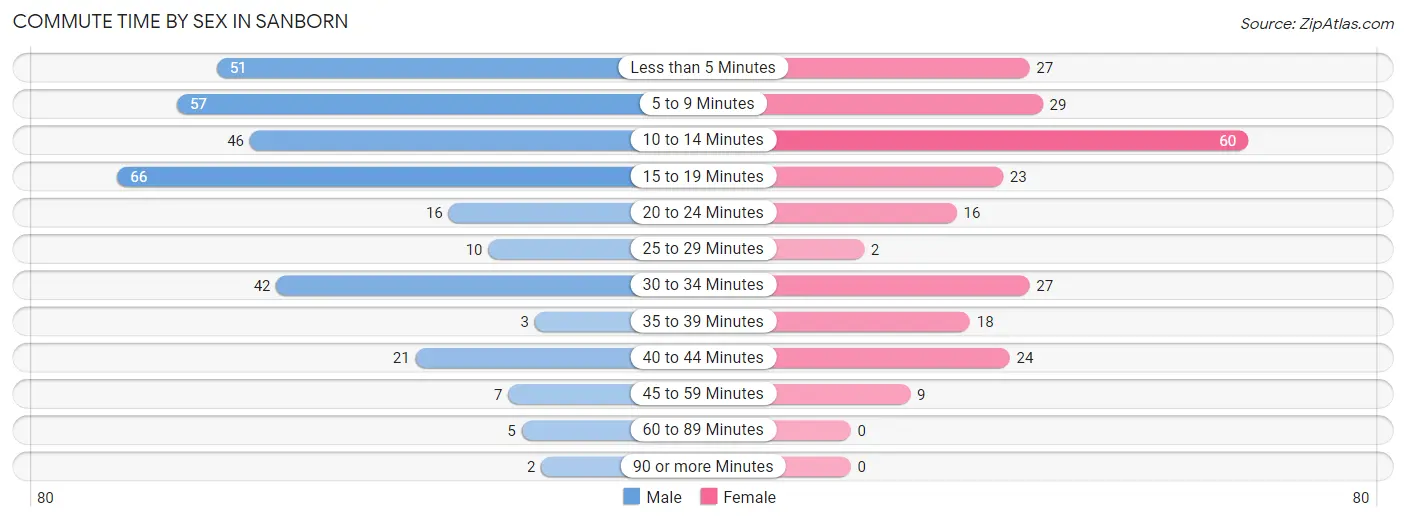
| Commute Time | Male | Female |
| Less than 5 Minutes | 51 (15.6%) | 27 (11.5%) |
| 5 to 9 Minutes | 57 (17.5%) | 29 (12.3%) |
| 10 to 14 Minutes | 46 (14.1%) | 60 (25.5%) |
| 15 to 19 Minutes | 66 (20.3%) | 23 (9.8%) |
| 20 to 24 Minutes | 16 (4.9%) | 16 (6.8%) |
| 25 to 29 Minutes | 10 (3.1%) | 2 (0.9%) |
| 30 to 34 Minutes | 42 (12.9%) | 27 (11.5%) |
| 35 to 39 Minutes | 3 (0.9%) | 18 (7.7%) |
| 40 to 44 Minutes | 21 (6.4%) | 24 (10.2%) |
| 45 to 59 Minutes | 7 (2.1%) | 9 (3.8%) |
| 60 to 89 Minutes | 5 (1.5%) | 0 (0.0%) |
| 90 or more Minutes | 2 (0.6%) | 0 (0.0%) |
Time of Departure to Work by Sex in Sanborn
The most frequent times of departure to work in Sanborn are 7:00 AM to 7:29 AM (68, 20.9%) for males and 7:30 AM to 7:59 AM (45, 19.2%) for females.
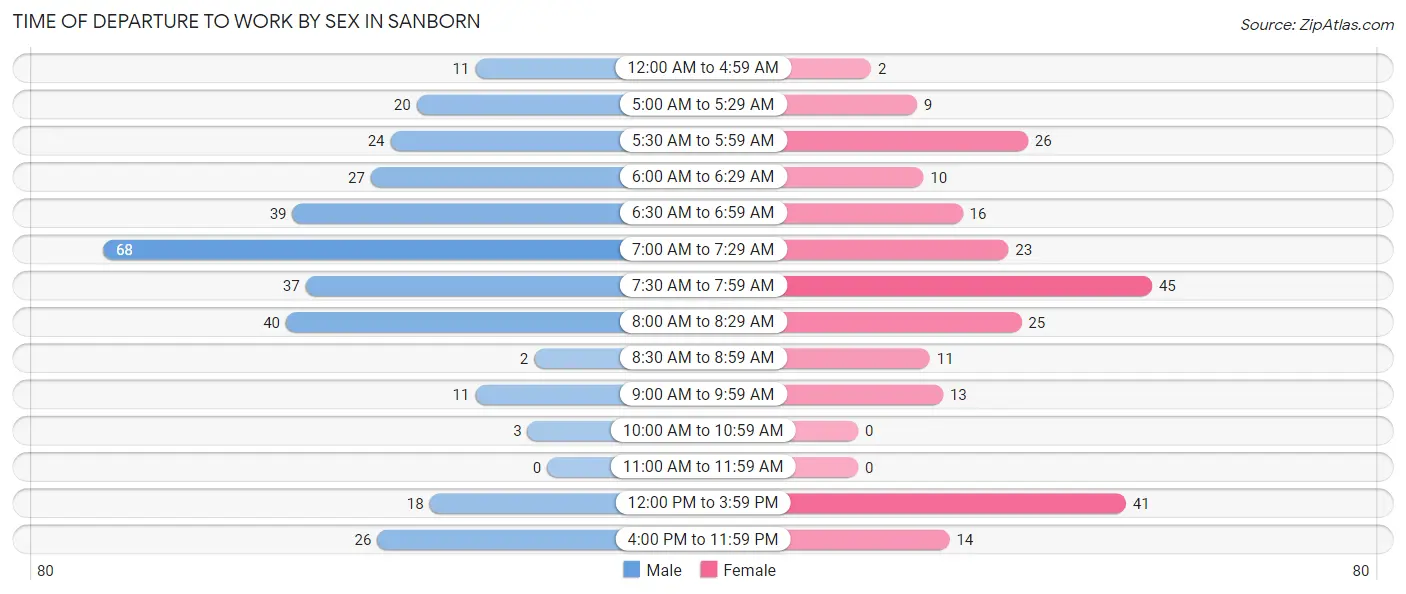
| Time of Departure | Male | Female |
| 12:00 AM to 4:59 AM | 11 (3.4%) | 2 (0.9%) |
| 5:00 AM to 5:29 AM | 20 (6.1%) | 9 (3.8%) |
| 5:30 AM to 5:59 AM | 24 (7.4%) | 26 (11.1%) |
| 6:00 AM to 6:29 AM | 27 (8.3%) | 10 (4.3%) |
| 6:30 AM to 6:59 AM | 39 (12.0%) | 16 (6.8%) |
| 7:00 AM to 7:29 AM | 68 (20.9%) | 23 (9.8%) |
| 7:30 AM to 7:59 AM | 37 (11.4%) | 45 (19.2%) |
| 8:00 AM to 8:29 AM | 40 (12.3%) | 25 (10.6%) |
| 8:30 AM to 8:59 AM | 2 (0.6%) | 11 (4.7%) |
| 9:00 AM to 9:59 AM | 11 (3.4%) | 13 (5.5%) |
| 10:00 AM to 10:59 AM | 3 (0.9%) | 0 (0.0%) |
| 11:00 AM to 11:59 AM | 0 (0.0%) | 0 (0.0%) |
| 12:00 PM to 3:59 PM | 18 (5.5%) | 41 (17.4%) |
| 4:00 PM to 11:59 PM | 26 (8.0%) | 14 (6.0%) |
| Total | 326 (100.0%) | 235 (100.0%) |
Housing Occupancy in Sanborn
Occupancy by Ownership in Sanborn
Of the total 608 dwellings in Sanborn, owner-occupied units account for 461 (75.8%), while renter-occupied units make up 147 (24.2%).
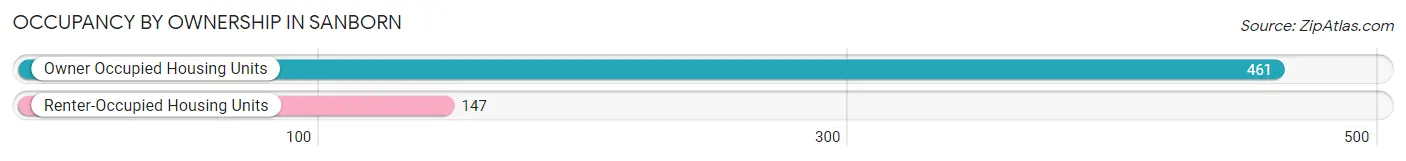
| Occupancy | # Housing Units | % Housing Units |
| Owner Occupied Housing Units | 461 | 75.8% |
| Renter-Occupied Housing Units | 147 | 24.2% |
| Total Occupied Housing Units | 608 | 100.0% |
Occupancy by Household Size in Sanborn
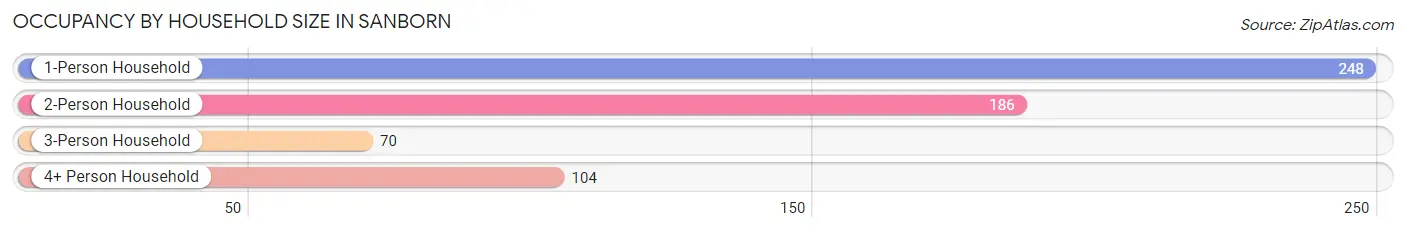
| Household Size | # Housing Units | % Housing Units |
| 1-Person Household | 248 | 40.8% |
| 2-Person Household | 186 | 30.6% |
| 3-Person Household | 70 | 11.5% |
| 4+ Person Household | 104 | 17.1% |
| Total Housing Units | 608 | 100.0% |
Occupancy by Ownership by Household Size in Sanborn
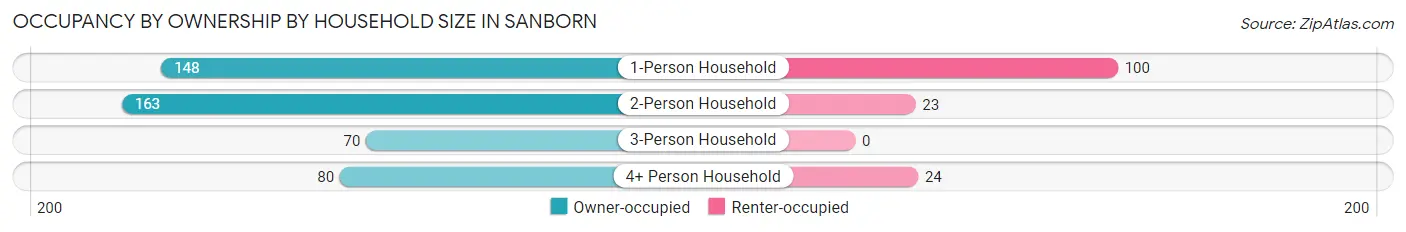
| Household Size | Owner-occupied | Renter-occupied |
| 1-Person Household | 148 (59.7%) | 100 (40.3%) |
| 2-Person Household | 163 (87.6%) | 23 (12.4%) |
| 3-Person Household | 70 (100.0%) | 0 (0.0%) |
| 4+ Person Household | 80 (76.9%) | 24 (23.1%) |
| Total Housing Units | 461 (75.8%) | 147 (24.2%) |
Occupancy by Educational Attainment in Sanborn
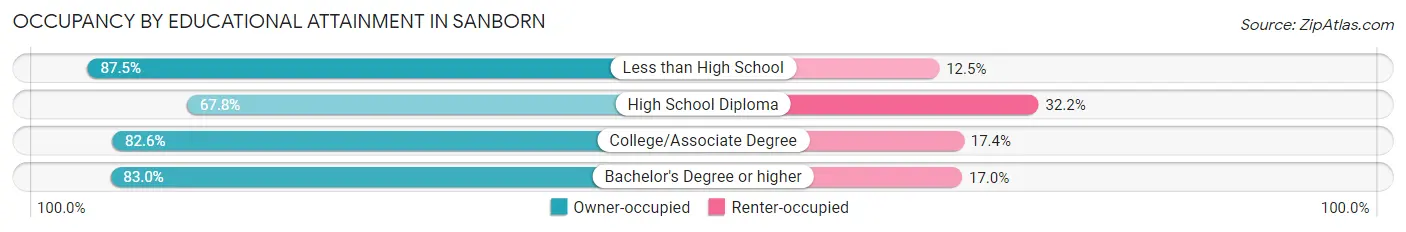
| Household Size | Owner-occupied | Renter-occupied |
| Less than High School | 28 (87.5%) | 4 (12.5%) |
| High School Diploma | 198 (67.8%) | 94 (32.2%) |
| College/Associate Degree | 157 (82.6%) | 33 (17.4%) |
| Bachelor's Degree or higher | 78 (83.0%) | 16 (17.0%) |
Occupancy by Age of Householder in Sanborn
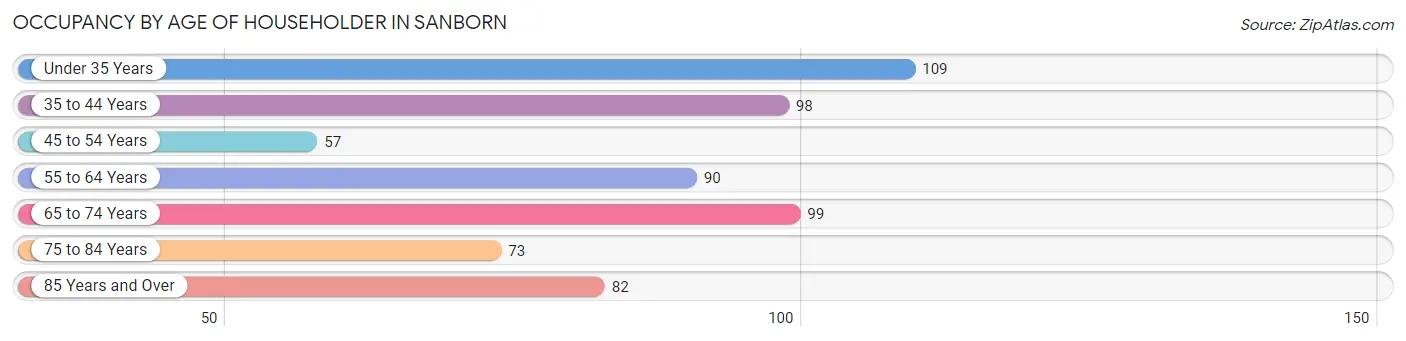
| Age Bracket | # Households | % Households |
| Under 35 Years | 109 | 17.9% |
| 35 to 44 Years | 98 | 16.1% |
| 45 to 54 Years | 57 | 9.4% |
| 55 to 64 Years | 90 | 14.8% |
| 65 to 74 Years | 99 | 16.3% |
| 75 to 84 Years | 73 | 12.0% |
| 85 Years and Over | 82 | 13.5% |
| Total | 608 | 100.0% |
Housing Finances in Sanborn
Median Income by Occupancy in Sanborn
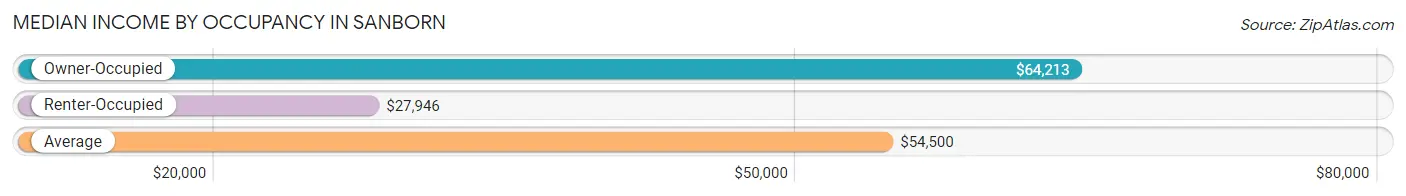
| Occupancy Type | # Households | Median Income |
| Owner-Occupied | 461 (75.8%) | $64,213 |
| Renter-Occupied | 147 (24.2%) | $27,946 |
| Average | 608 (100.0%) | $54,500 |
Occupancy by Householder Income Bracket in Sanborn
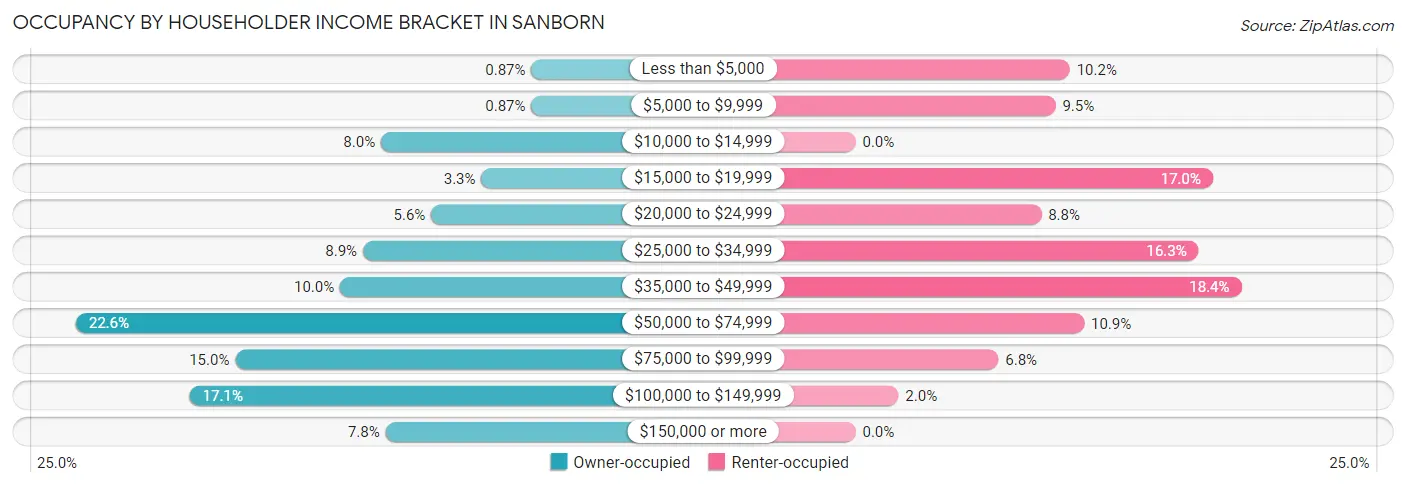
| Income Bracket | Owner-occupied | Renter-occupied |
| Less than $5,000 | 4 (0.9%) | 15 (10.2%) |
| $5,000 to $9,999 | 4 (0.9%) | 14 (9.5%) |
| $10,000 to $14,999 | 37 (8.0%) | 0 (0.0%) |
| $15,000 to $19,999 | 15 (3.3%) | 25 (17.0%) |
| $20,000 to $24,999 | 26 (5.6%) | 13 (8.8%) |
| $25,000 to $34,999 | 41 (8.9%) | 24 (16.3%) |
| $35,000 to $49,999 | 46 (10.0%) | 27 (18.4%) |
| $50,000 to $74,999 | 104 (22.6%) | 16 (10.9%) |
| $75,000 to $99,999 | 69 (15.0%) | 10 (6.8%) |
| $100,000 to $149,999 | 79 (17.1%) | 3 (2.0%) |
| $150,000 or more | 36 (7.8%) | 0 (0.0%) |
| Total | 461 (100.0%) | 147 (100.0%) |
Monthly Housing Cost Tiers in Sanborn
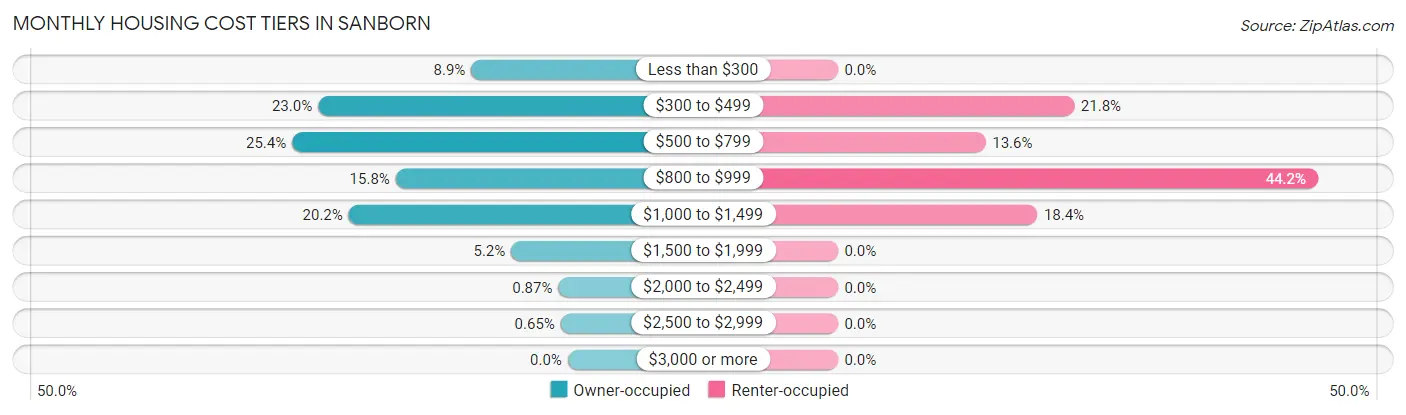
| Monthly Cost | Owner-occupied | Renter-occupied |
| Less than $300 | 41 (8.9%) | 0 (0.0%) |
| $300 to $499 | 106 (23.0%) | 32 (21.8%) |
| $500 to $799 | 117 (25.4%) | 20 (13.6%) |
| $800 to $999 | 73 (15.8%) | 65 (44.2%) |
| $1,000 to $1,499 | 93 (20.2%) | 27 (18.4%) |
| $1,500 to $1,999 | 24 (5.2%) | 0 (0.0%) |
| $2,000 to $2,499 | 4 (0.9%) | 0 (0.0%) |
| $2,500 to $2,999 | 3 (0.6%) | 0 (0.0%) |
| $3,000 or more | 0 (0.0%) | 0 (0.0%) |
| Total | 461 (100.0%) | 147 (100.0%) |
Physical Housing Characteristics in Sanborn
Housing Structures in Sanborn
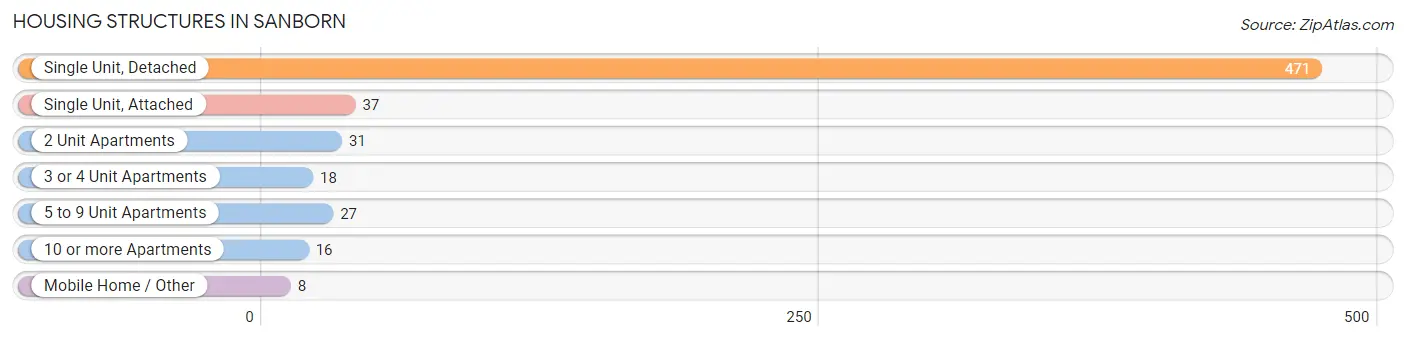
| Structure Type | # Housing Units | % Housing Units |
| Single Unit, Detached | 471 | 77.5% |
| Single Unit, Attached | 37 | 6.1% |
| 2 Unit Apartments | 31 | 5.1% |
| 3 or 4 Unit Apartments | 18 | 3.0% |
| 5 to 9 Unit Apartments | 27 | 4.4% |
| 10 or more Apartments | 16 | 2.6% |
| Mobile Home / Other | 8 | 1.3% |
| Total | 608 | 100.0% |
Housing Structures by Occupancy in Sanborn
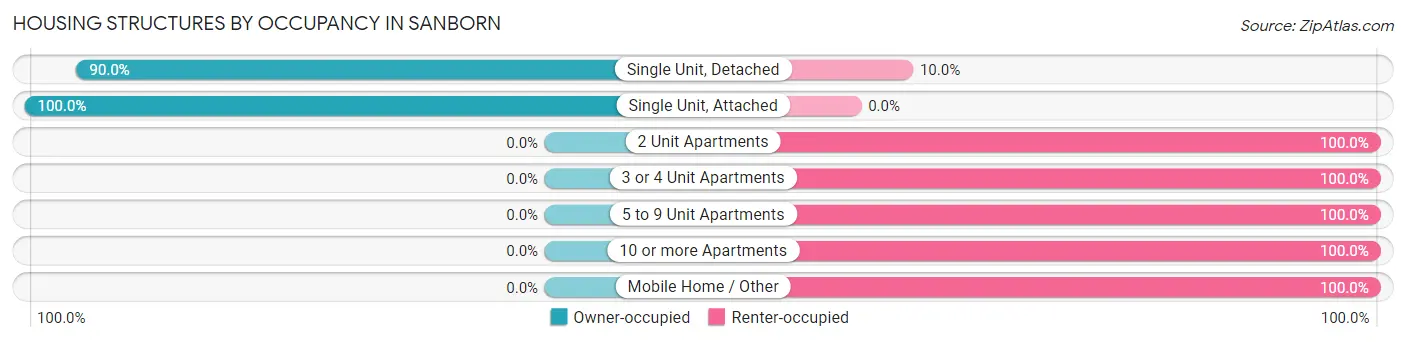
| Structure Type | Owner-occupied | Renter-occupied |
| Single Unit, Detached | 424 (90.0%) | 47 (10.0%) |
| Single Unit, Attached | 37 (100.0%) | 0 (0.0%) |
| 2 Unit Apartments | 0 (0.0%) | 31 (100.0%) |
| 3 or 4 Unit Apartments | 0 (0.0%) | 18 (100.0%) |
| 5 to 9 Unit Apartments | 0 (0.0%) | 27 (100.0%) |
| 10 or more Apartments | 0 (0.0%) | 16 (100.0%) |
| Mobile Home / Other | 0 (0.0%) | 8 (100.0%) |
| Total | 461 (75.8%) | 147 (24.2%) |
Housing Structures by Number of Rooms in Sanborn
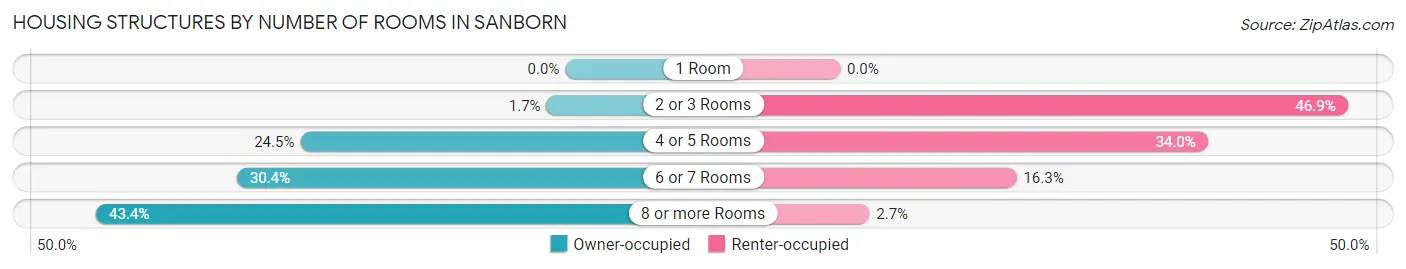
| Number of Rooms | Owner-occupied | Renter-occupied |
| 1 Room | 0 (0.0%) | 0 (0.0%) |
| 2 or 3 Rooms | 8 (1.7%) | 69 (46.9%) |
| 4 or 5 Rooms | 113 (24.5%) | 50 (34.0%) |
| 6 or 7 Rooms | 140 (30.4%) | 24 (16.3%) |
| 8 or more Rooms | 200 (43.4%) | 4 (2.7%) |
| Total | 461 (100.0%) | 147 (100.0%) |
Housing Structure by Heating Type in Sanborn
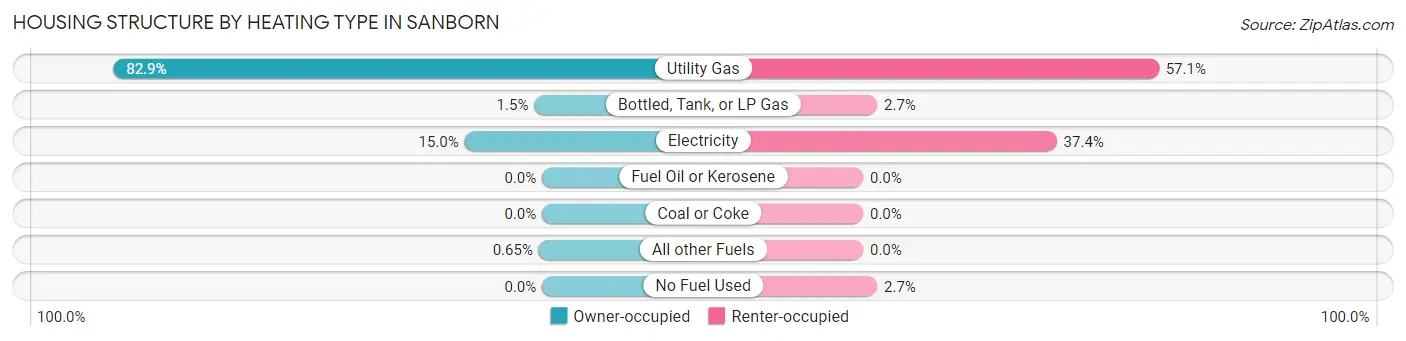
| Heating Type | Owner-occupied | Renter-occupied |
| Utility Gas | 382 (82.9%) | 84 (57.1%) |
| Bottled, Tank, or LP Gas | 7 (1.5%) | 4 (2.7%) |
| Electricity | 69 (15.0%) | 55 (37.4%) |
| Fuel Oil or Kerosene | 0 (0.0%) | 0 (0.0%) |
| Coal or Coke | 0 (0.0%) | 0 (0.0%) |
| All other Fuels | 3 (0.6%) | 0 (0.0%) |
| No Fuel Used | 0 (0.0%) | 4 (2.7%) |
| Total | 461 (100.0%) | 147 (100.0%) |
Household Vehicle Usage in Sanborn
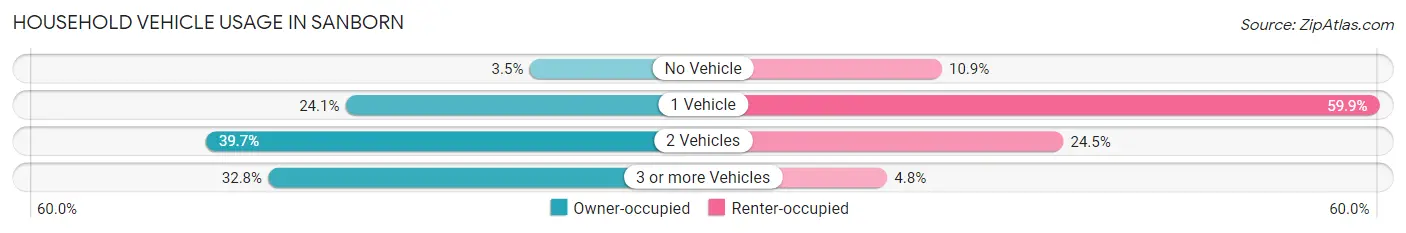
| Vehicles per Household | Owner-occupied | Renter-occupied |
| No Vehicle | 16 (3.5%) | 16 (10.9%) |
| 1 Vehicle | 111 (24.1%) | 88 (59.9%) |
| 2 Vehicles | 183 (39.7%) | 36 (24.5%) |
| 3 or more Vehicles | 151 (32.8%) | 7 (4.8%) |
| Total | 461 (100.0%) | 147 (100.0%) |
Real Estate & Mortgages in Sanborn
Real Estate and Mortgage Overview in Sanborn
| Characteristic | Without Mortgage | With Mortgage |
| Housing Units | 248 | 213 |
| Median Property Value | $125,000 | $115,300 |
| Median Household Income | $56,667 | $23 |
| Monthly Housing Costs | $421 | $0 |
| Real Estate Taxes | $1,608 | $0 |
Property Value by Mortgage Status in Sanborn
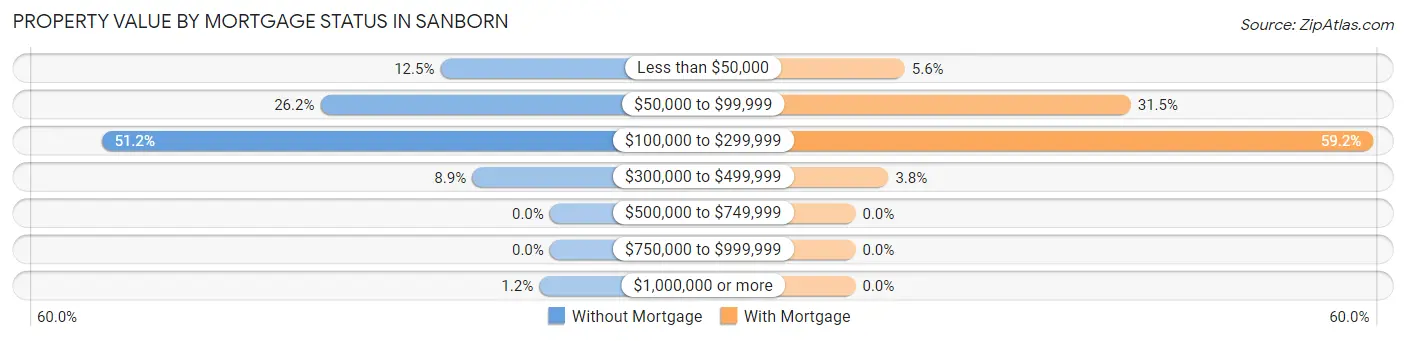
| Property Value | Without Mortgage | With Mortgage |
| Less than $50,000 | 31 (12.5%) | 12 (5.6%) |
| $50,000 to $99,999 | 65 (26.2%) | 67 (31.5%) |
| $100,000 to $299,999 | 127 (51.2%) | 126 (59.2%) |
| $300,000 to $499,999 | 22 (8.9%) | 8 (3.8%) |
| $500,000 to $749,999 | 0 (0.0%) | 0 (0.0%) |
| $750,000 to $999,999 | 0 (0.0%) | 0 (0.0%) |
| $1,000,000 or more | 3 (1.2%) | 0 (0.0%) |
| Total | 248 (100.0%) | 213 (100.0%) |
Household Income by Mortgage Status in Sanborn
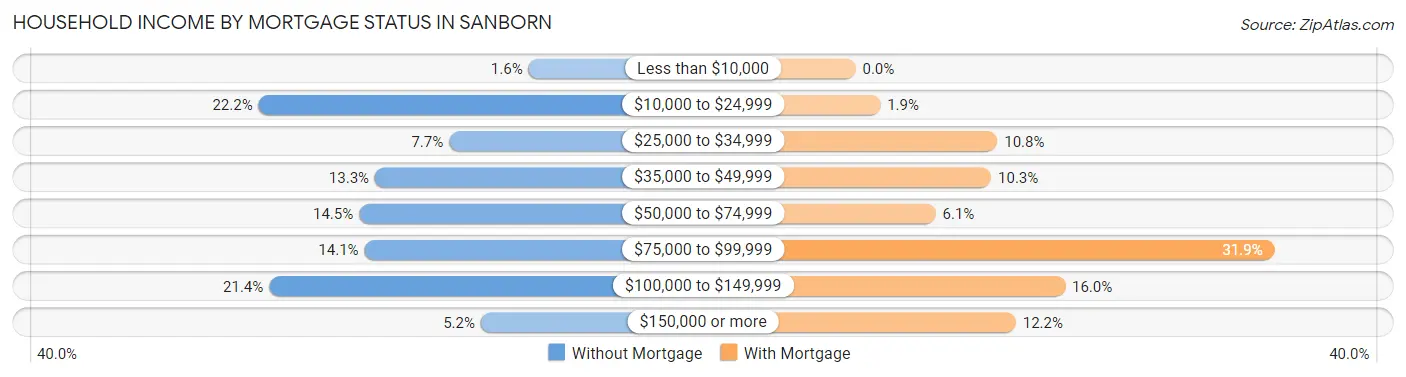
| Household Income | Without Mortgage | With Mortgage |
| Less than $10,000 | 4 (1.6%) | 0 (0.0%) |
| $10,000 to $24,999 | 55 (22.2%) | 4 (1.9%) |
| $25,000 to $34,999 | 19 (7.7%) | 23 (10.8%) |
| $35,000 to $49,999 | 33 (13.3%) | 22 (10.3%) |
| $50,000 to $74,999 | 36 (14.5%) | 13 (6.1%) |
| $75,000 to $99,999 | 35 (14.1%) | 68 (31.9%) |
| $100,000 to $149,999 | 53 (21.4%) | 34 (16.0%) |
| $150,000 or more | 13 (5.2%) | 26 (12.2%) |
| Total | 248 (100.0%) | 213 (100.0%) |
Property Value to Household Income Ratio in Sanborn
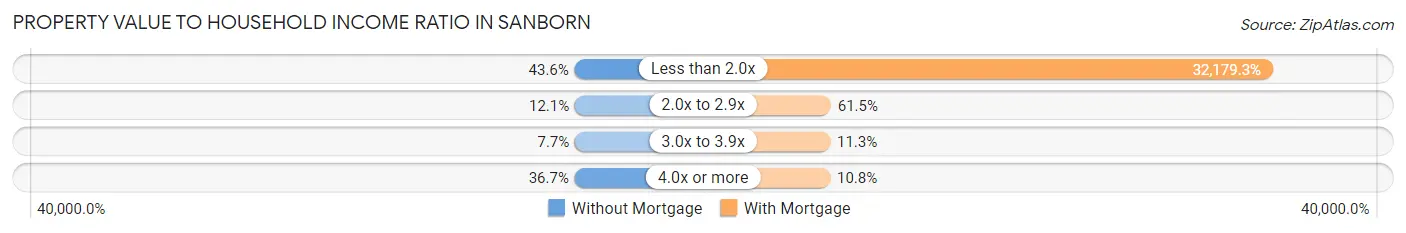
| Value-to-Income Ratio | Without Mortgage | With Mortgage |
| Less than 2.0x | 108 (43.5%) | 68,542 (32,179.3%) |
| 2.0x to 2.9x | 30 (12.1%) | 131 (61.5%) |
| 3.0x to 3.9x | 19 (7.7%) | 24 (11.3%) |
| 4.0x or more | 91 (36.7%) | 23 (10.8%) |
| Total | 248 (100.0%) | 213 (100.0%) |
Real Estate Taxes by Mortgage Status in Sanborn
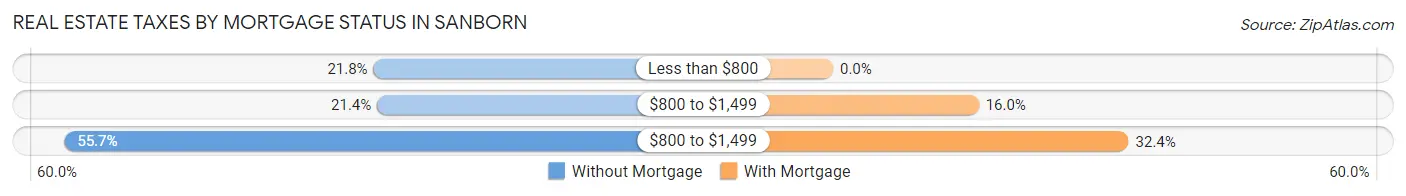
| Property Taxes | Without Mortgage | With Mortgage |
| Less than $800 | 54 (21.8%) | 0 (0.0%) |
| $800 to $1,499 | 53 (21.4%) | 34 (16.0%) |
| $800 to $1,499 | 138 (55.6%) | 69 (32.4%) |
| Total | 248 (100.0%) | 213 (100.0%) |
Health & Disability in Sanborn
Health Insurance Coverage by Age in Sanborn
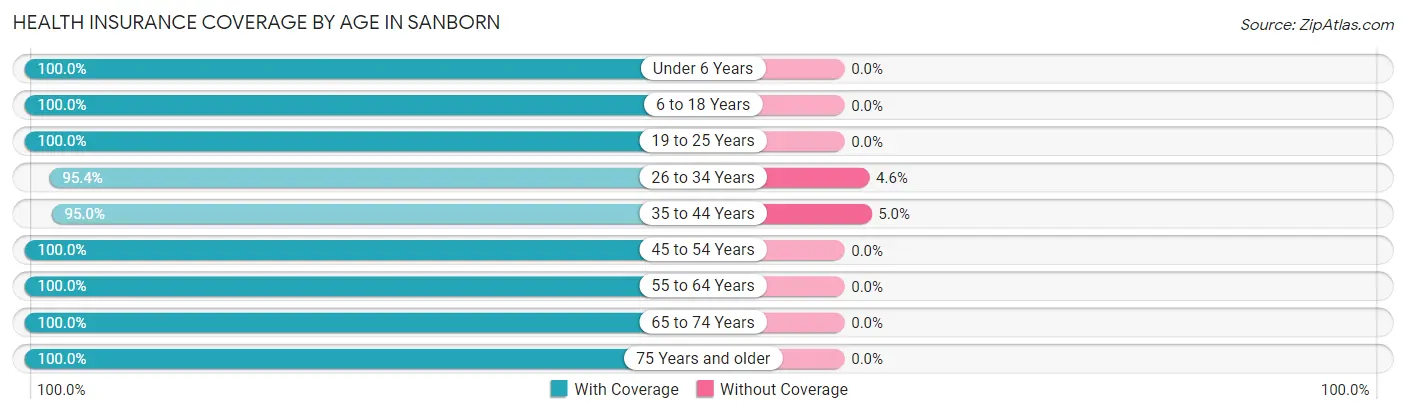
| Age Bracket | With Coverage | Without Coverage |
| Under 6 Years | 116 (100.0%) | 0 (0.0%) |
| 6 to 18 Years | 323 (100.0%) | 0 (0.0%) |
| 19 to 25 Years | 127 (100.0%) | 0 (0.0%) |
| 26 to 34 Years | 103 (95.4%) | 5 (4.6%) |
| 35 to 44 Years | 151 (95.0%) | 8 (5.0%) |
| 45 to 54 Years | 105 (100.0%) | 0 (0.0%) |
| 55 to 64 Years | 150 (100.0%) | 0 (0.0%) |
| 65 to 74 Years | 149 (100.0%) | 0 (0.0%) |
| 75 Years and older | 224 (100.0%) | 0 (0.0%) |
| Total | 1,448 (99.1%) | 13 (0.9%) |
Health Insurance Coverage by Citizenship Status in Sanborn
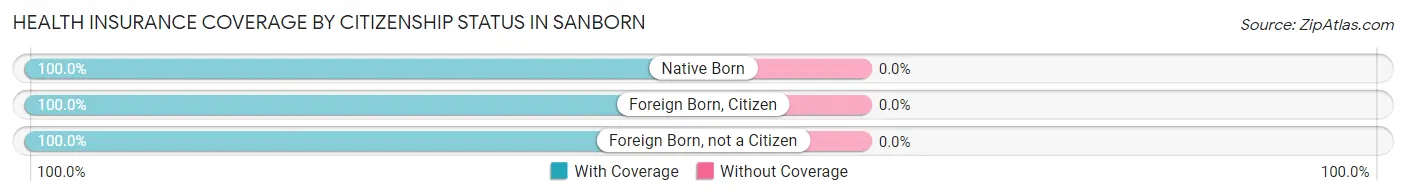
| Citizenship Status | With Coverage | Without Coverage |
| Native Born | 116 (100.0%) | 0 (0.0%) |
| Foreign Born, Citizen | 323 (100.0%) | 0 (0.0%) |
| Foreign Born, not a Citizen | 127 (100.0%) | 0 (0.0%) |
Health Insurance Coverage by Household Income in Sanborn
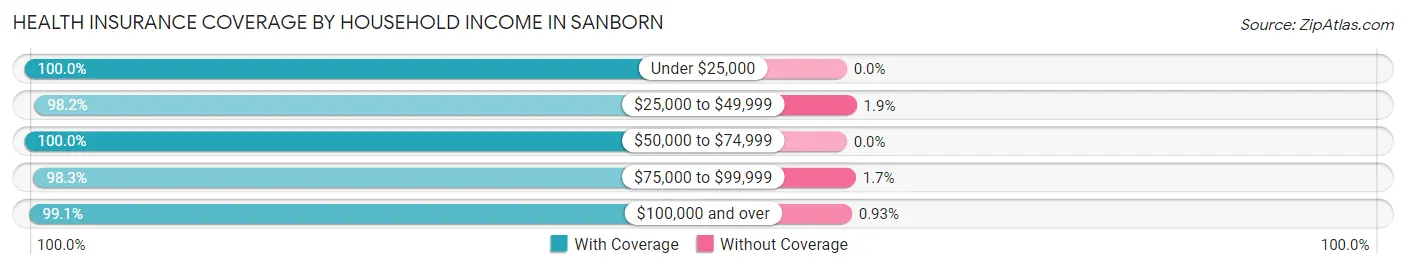
| Household Income | With Coverage | Without Coverage |
| Under $25,000 | 248 (100.0%) | 0 (0.0%) |
| $25,000 to $49,999 | 265 (98.2%) | 5 (1.8%) |
| $50,000 to $74,999 | 325 (100.0%) | 0 (0.0%) |
| $75,000 to $99,999 | 290 (98.3%) | 5 (1.7%) |
| $100,000 and over | 320 (99.1%) | 3 (0.9%) |
Public vs Private Health Insurance Coverage by Age in Sanborn
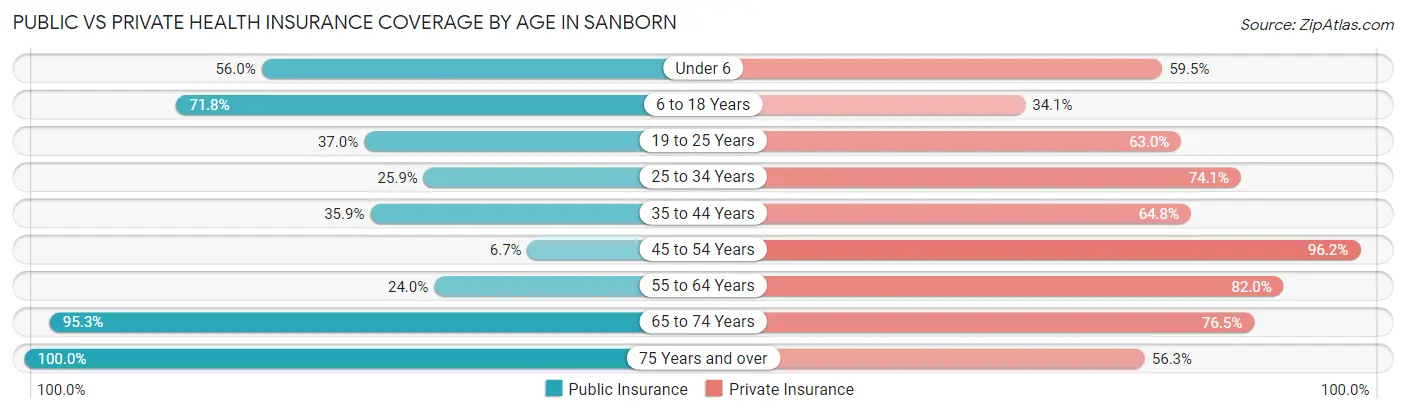
| Age Bracket | Public Insurance | Private Insurance |
| Under 6 | 65 (56.0%) | 69 (59.5%) |
| 6 to 18 Years | 232 (71.8%) | 110 (34.1%) |
| 19 to 25 Years | 47 (37.0%) | 80 (63.0%) |
| 25 to 34 Years | 28 (25.9%) | 80 (74.1%) |
| 35 to 44 Years | 57 (35.8%) | 103 (64.8%) |
| 45 to 54 Years | 7 (6.7%) | 101 (96.2%) |
| 55 to 64 Years | 36 (24.0%) | 123 (82.0%) |
| 65 to 74 Years | 142 (95.3%) | 114 (76.5%) |
| 75 Years and over | 224 (100.0%) | 126 (56.2%) |
| Total | 838 (57.4%) | 906 (62.0%) |
Disability Status by Sex by Age in Sanborn
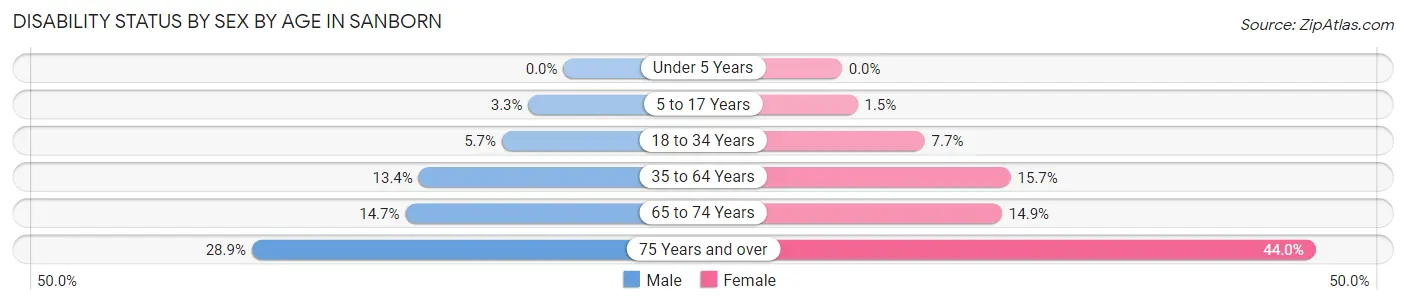
| Age Bracket | Male | Female |
| Under 5 Years | 0 (0.0%) | 0 (0.0%) |
| 5 to 17 Years | 4 (3.3%) | 3 (1.5%) |
| 18 to 34 Years | 8 (5.7%) | 8 (7.7%) |
| 35 to 64 Years | 29 (13.4%) | 31 (15.7%) |
| 65 to 74 Years | 11 (14.7%) | 11 (14.9%) |
| 75 Years and over | 24 (28.9%) | 62 (44.0%) |
Disability Class by Sex by Age in Sanborn
Disability Class: Hearing Difficulty
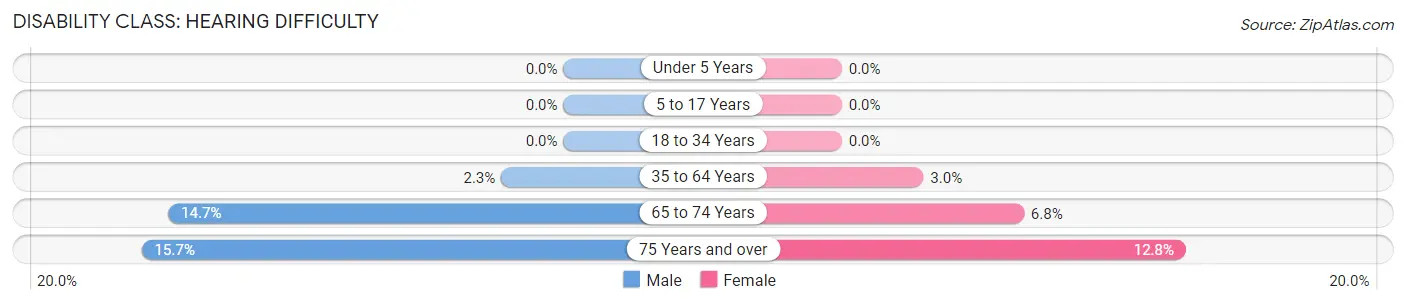
| Age Bracket | Male | Female |
| Under 5 Years | 0 (0.0%) | 0 (0.0%) |
| 5 to 17 Years | 0 (0.0%) | 0 (0.0%) |
| 18 to 34 Years | 0 (0.0%) | 0 (0.0%) |
| 35 to 64 Years | 5 (2.3%) | 6 (3.0%) |
| 65 to 74 Years | 11 (14.7%) | 5 (6.8%) |
| 75 Years and over | 13 (15.7%) | 18 (12.8%) |
Disability Class: Vision Difficulty
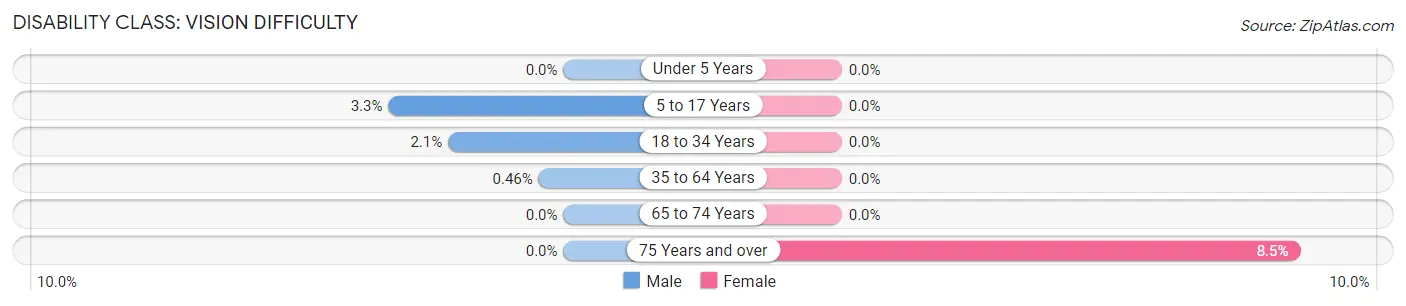
| Age Bracket | Male | Female |
| Under 5 Years | 0 (0.0%) | 0 (0.0%) |
| 5 to 17 Years | 4 (3.3%) | 0 (0.0%) |
| 18 to 34 Years | 3 (2.1%) | 0 (0.0%) |
| 35 to 64 Years | 1 (0.5%) | 0 (0.0%) |
| 65 to 74 Years | 0 (0.0%) | 0 (0.0%) |
| 75 Years and over | 0 (0.0%) | 12 (8.5%) |
Disability Class: Cognitive Difficulty
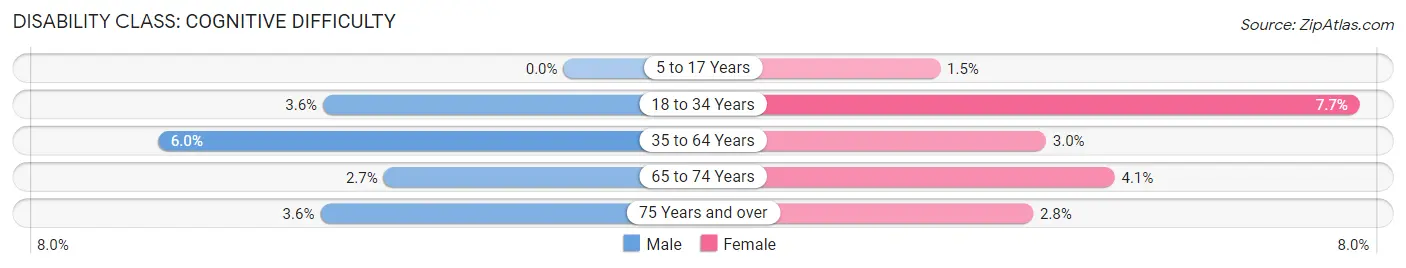
| Age Bracket | Male | Female |
| 5 to 17 Years | 0 (0.0%) | 3 (1.5%) |
| 18 to 34 Years | 5 (3.6%) | 8 (7.7%) |
| 35 to 64 Years | 13 (6.0%) | 6 (3.0%) |
| 65 to 74 Years | 2 (2.7%) | 3 (4.1%) |
| 75 Years and over | 3 (3.6%) | 4 (2.8%) |
Disability Class: Ambulatory Difficulty
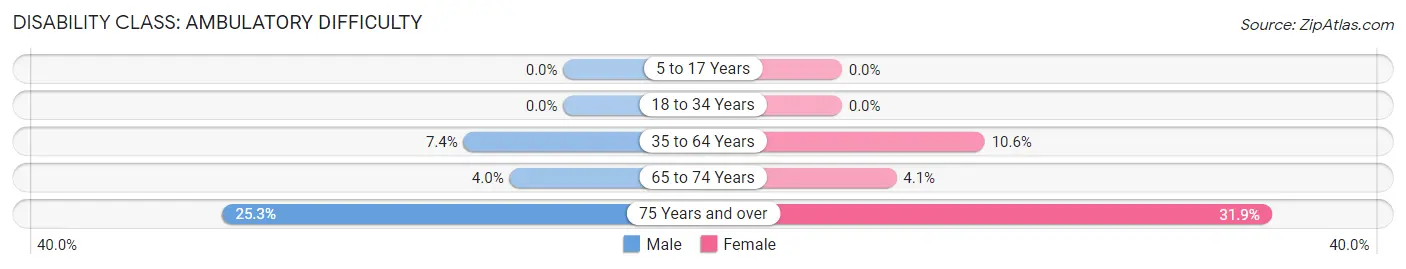
| Age Bracket | Male | Female |
| 5 to 17 Years | 0 (0.0%) | 0 (0.0%) |
| 18 to 34 Years | 0 (0.0%) | 0 (0.0%) |
| 35 to 64 Years | 16 (7.4%) | 21 (10.6%) |
| 65 to 74 Years | 3 (4.0%) | 3 (4.1%) |
| 75 Years and over | 21 (25.3%) | 45 (31.9%) |
Disability Class: Self-Care Difficulty
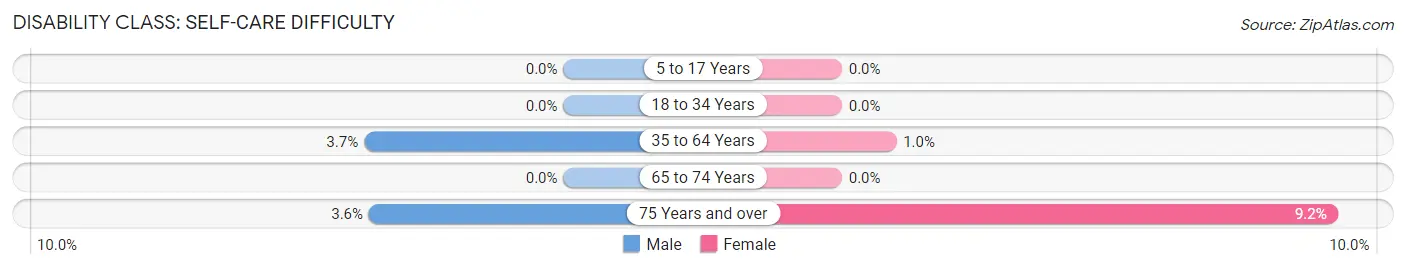
| Age Bracket | Male | Female |
| 5 to 17 Years | 0 (0.0%) | 0 (0.0%) |
| 18 to 34 Years | 0 (0.0%) | 0 (0.0%) |
| 35 to 64 Years | 8 (3.7%) | 2 (1.0%) |
| 65 to 74 Years | 0 (0.0%) | 0 (0.0%) |
| 75 Years and over | 3 (3.6%) | 13 (9.2%) |
Technology Access in Sanborn
Computing Device Access in Sanborn
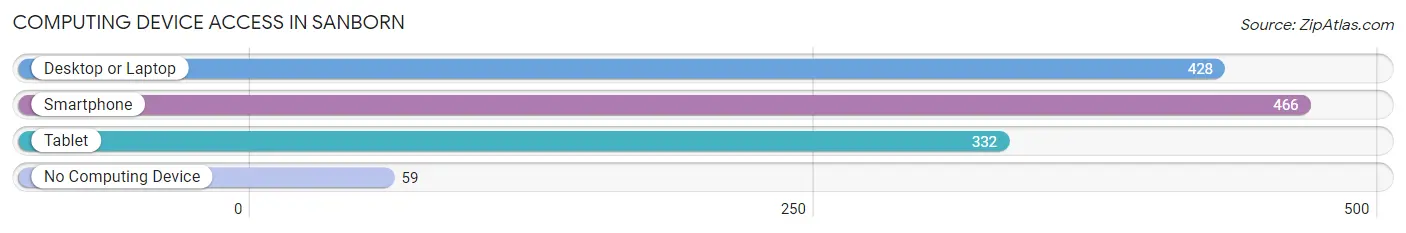
| Device Type | # Households | % Households |
| Desktop or Laptop | 428 | 70.4% |
| Smartphone | 466 | 76.6% |
| Tablet | 332 | 54.6% |
| No Computing Device | 59 | 9.7% |
| Total | 608 | 100.0% |
Internet Access in Sanborn
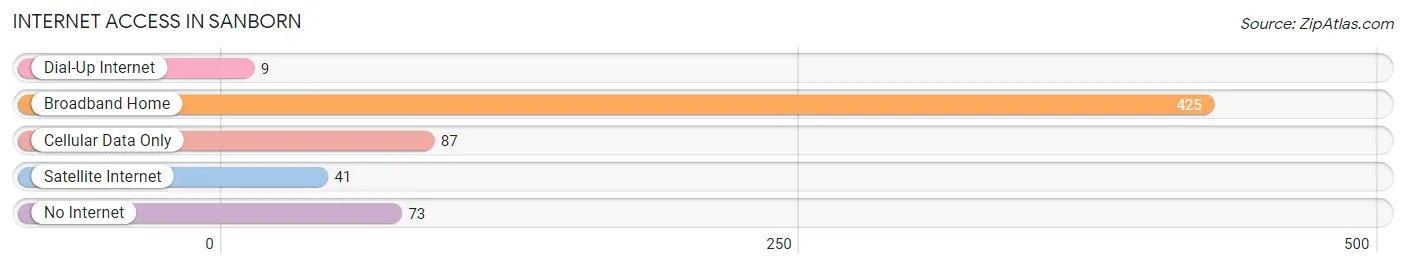
| Internet Type | # Households | % Households |
| Dial-Up Internet | 9 | 1.5% |
| Broadband Home | 425 | 69.9% |
| Cellular Data Only | 87 | 14.3% |
| Satellite Internet | 41 | 6.7% |
| No Internet | 73 | 12.0% |
| Total | 608 | 100.0% |
Sanborn Summary
Sanborn, Iowa is a small town located in O’Brien County in the northwest corner of the state. It is situated on the Little Sioux River and is home to approximately 1,400 people. The town was founded in 1881 and was named after the Sanborn family, who were early settlers in the area.
Geography
Sanborn is located in the northwest corner of Iowa, in O’Brien County. It is situated on the Little Sioux River, which flows through the town. The town is located in the Loess Hills region of the state, which is characterized by rolling hills and fertile soil. The town is located about 25 miles from the Minnesota border and about 50 miles from the South Dakota border.
Economy
Sanborn’s economy is largely based on agriculture. The town is home to several large farms, which produce corn, soybeans, and other crops. The town also has a few small businesses, including a grocery store, a hardware store, and a few restaurants. The town is also home to a few manufacturing companies, which produce agricultural equipment and other products.
Demographics
As of the 2010 census, Sanborn had a population of 1,400 people. The town is predominantly white, with about 95% of the population being white. The median household income in the town is $45,000, and the median home value is $90,000. The town has a low unemployment rate, with only about 4% of the population being unemployed.
History
Sanborn was founded in 1881 by the Sanborn family, who were early settlers in the area. The town was originally a farming community, and the Sanborn family built a grist mill on the Little Sioux River. The town grew slowly over the years, and by the early 1900s, it had become a thriving agricultural community. The town was also home to several small businesses, including a grocery store, a hardware store, and a few restaurants.
In the 1950s, the town began to experience a decline in population as many of the younger residents moved away in search of better job opportunities. However, the town has seen a resurgence in recent years, as more people have moved to the area in search of a rural lifestyle.
Sanborn is a small town with a rich history and a bright future. The town is home to a diverse population and a thriving economy. The town is also home to a variety of recreational activities, including fishing, hunting, and camping. Sanborn is a great place to live and work, and it is sure to continue to grow and prosper in the years to come.
Common Questions
What is Per Capita Income in Sanborn?
Per Capita income in Sanborn is $26,751.
What is the Median Family Income in Sanborn?
Median Family Income in Sanborn is $70,795.
What is the Median Household income in Sanborn?
Median Household Income in Sanborn is $54,500.
What is Income or Wage Gap in Sanborn?
Income or Wage Gap in Sanborn is 57.0%.
Women in Sanborn earn 43.0 cents for every dollar earned by a man.
What is Inequality or Gini Index in Sanborn?
Inequality or Gini Index in Sanborn is 0.42.
What is the Total Population of Sanborn?
Total Population of Sanborn is 1,536.
What is the Total Male Population of Sanborn?
Total Male Population of Sanborn is 714.
What is the Total Female Population of Sanborn?
Total Female Population of Sanborn is 822.
What is the Ratio of Males per 100 Females in Sanborn?
There are 86.86 Males per 100 Females in Sanborn.
What is the Ratio of Females per 100 Males in Sanborn?
There are 115.13 Females per 100 Males in Sanborn.
What is the Median Population Age in Sanborn?
Median Population Age in Sanborn is 41.3 Years.
What is the Average Family Size in Sanborn
Average Family Size in Sanborn is 3.3 People.
What is the Average Household Size in Sanborn
Average Household Size in Sanborn is 2.4 People.
How Large is the Labor Force in Sanborn?
There are 642 People in the Labor Forcein in Sanborn.
What is the Percentage of People in the Labor Force in Sanborn?
56.0% of People are in the Labor Force in Sanborn.
What is the Unemployment Rate in Sanborn?
Unemployment Rate in Sanborn is 1.7%.