Elko New Market, MN Map & Demographics
Elko New Market Map
Elko New Market Overview
$51,624
PER CAPITA INCOME
$149,881
AVG FAMILY INCOME
$149,881
AVG HOUSEHOLD INCOME
42.1%
WAGE / INCOME GAP [ % ]
57.9¢/ $1
WAGE / INCOME GAP [ $ ]
0.28
INEQUALITY / GINI INDEX
4,850
TOTAL POPULATION
2,297
MALE POPULATION
2,553
FEMALE POPULATION
89.97
MALES / 100 FEMALES
111.14
FEMALES / 100 MALES
33.3
MEDIAN AGE
3.2
AVG FAMILY SIZE
3.2
AVG HOUSEHOLD SIZE
3,026
LABOR FORCE [ PEOPLE ]
85.2%
PERCENT IN LABOR FORCE
0.8%
UNEMPLOYMENT RATE
Elko New Market Area Codes
Income in Elko New Market
Income Overview in Elko New Market
Per Capita Income in Elko New Market is $51,624, while median incomes of families and households are $149,881 and $149,881 respectively.
| Characteristic | Number | Measure |
| Per Capita Income | 4,850 | $51,624 |
| Median Family Income | 1,490 | $149,881 |
| Mean Family Income | 1,490 | $168,672 |
| Median Household Income | 1,490 | $149,881 |
| Mean Household Income | 1,490 | $168,772 |
| Income Deficit | 1,490 | $0 |
| Wage / Income Gap (%) | 4,850 | 42.09% |
| Wage / Income Gap ($) | 4,850 | 57.91¢ per $1 |
| Gini / Inequality Index | 4,850 | 0.28 |
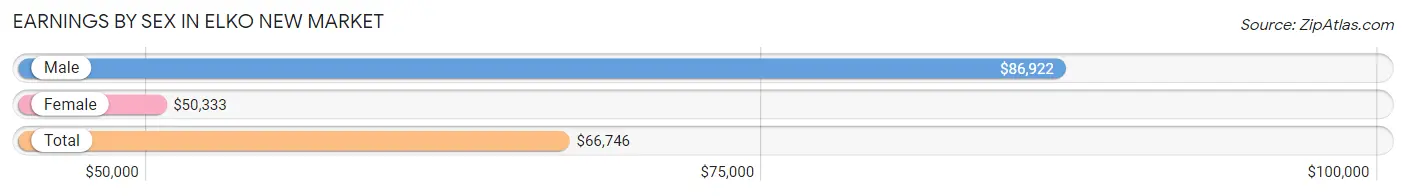
Earnings by Sex in Elko New Market
Average Earnings in Elko New Market are $66,746, $86,922 for men and $50,333 for women, a difference of 42.1%.
| Sex | Number | Average Earnings |
| Male | 1,449 (46.5%) | $86,922 |
| Female | 1,670 (53.5%) | $50,333 |
| Total | 3,119 (100.0%) | $66,746 |
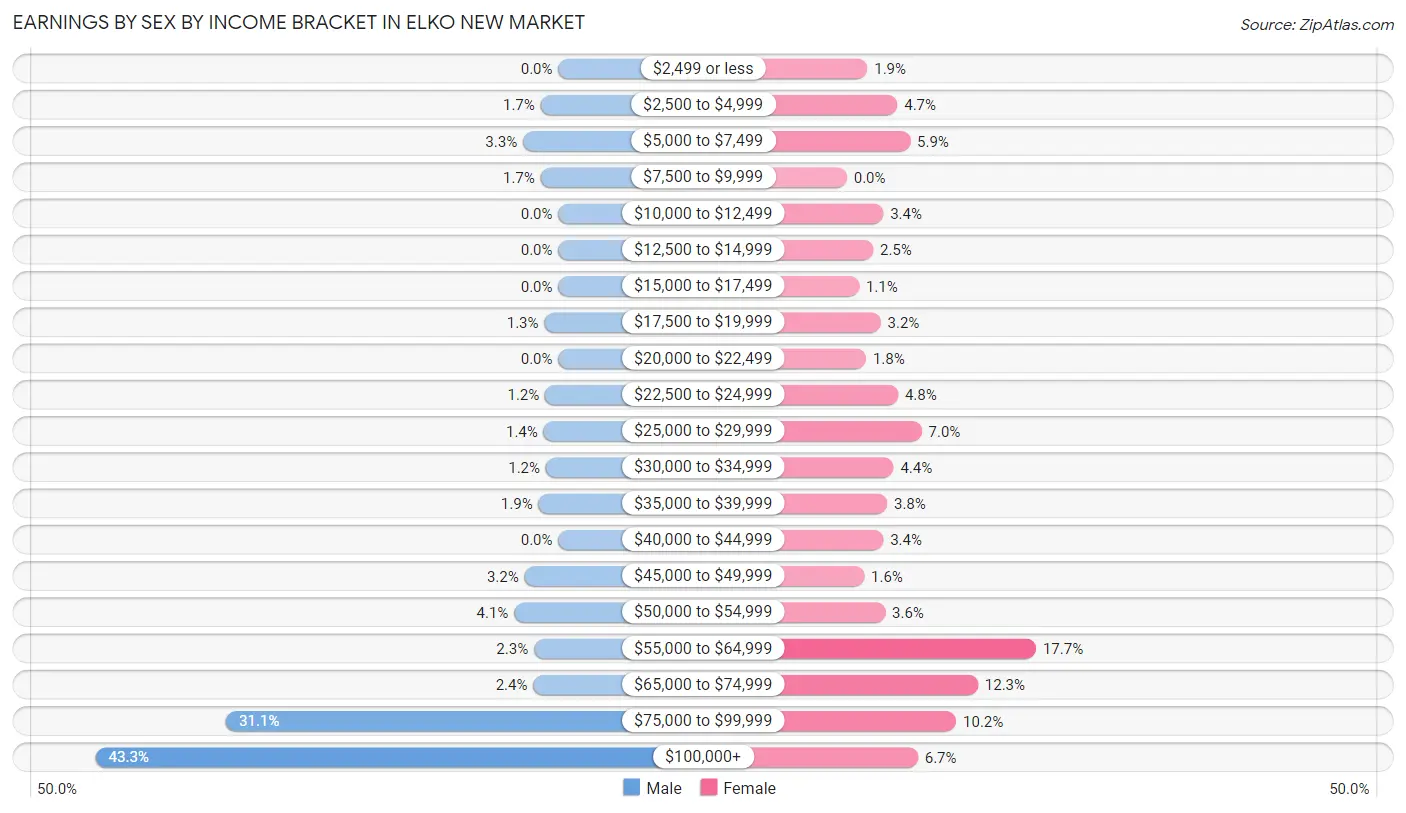
Earnings by Sex by Income Bracket in Elko New Market
The most common earnings brackets in Elko New Market are $100,000+ for men (628 | 43.3%) and $55,000 to $64,999 for women (296 | 17.7%).
| Income | Male | Female |
| $2,499 or less | 0 (0.0%) | 32 (1.9%) |
| $2,500 to $4,999 | 24 (1.7%) | 79 (4.7%) |
| $5,000 to $7,499 | 48 (3.3%) | 99 (5.9%) |
| $7,500 to $9,999 | 24 (1.7%) | 0 (0.0%) |
| $10,000 to $12,499 | 0 (0.0%) | 57 (3.4%) |
| $12,500 to $14,999 | 0 (0.0%) | 41 (2.5%) |
| $15,000 to $17,499 | 0 (0.0%) | 19 (1.1%) |
| $17,500 to $19,999 | 19 (1.3%) | 53 (3.2%) |
| $20,000 to $22,499 | 0 (0.0%) | 30 (1.8%) |
| $22,500 to $24,999 | 18 (1.2%) | 80 (4.8%) |
| $25,000 to $29,999 | 20 (1.4%) | 117 (7.0%) |
| $30,000 to $34,999 | 17 (1.2%) | 73 (4.4%) |
| $35,000 to $39,999 | 27 (1.9%) | 63 (3.8%) |
| $40,000 to $44,999 | 0 (0.0%) | 57 (3.4%) |
| $45,000 to $49,999 | 46 (3.2%) | 27 (1.6%) |
| $50,000 to $54,999 | 60 (4.1%) | 60 (3.6%) |
| $55,000 to $64,999 | 33 (2.3%) | 296 (17.7%) |
| $65,000 to $74,999 | 34 (2.4%) | 205 (12.3%) |
| $75,000 to $99,999 | 451 (31.1%) | 171 (10.2%) |
| $100,000+ | 628 (43.3%) | 111 (6.7%) |
| Total | 1,449 (100.0%) | 1,670 (100.0%) |
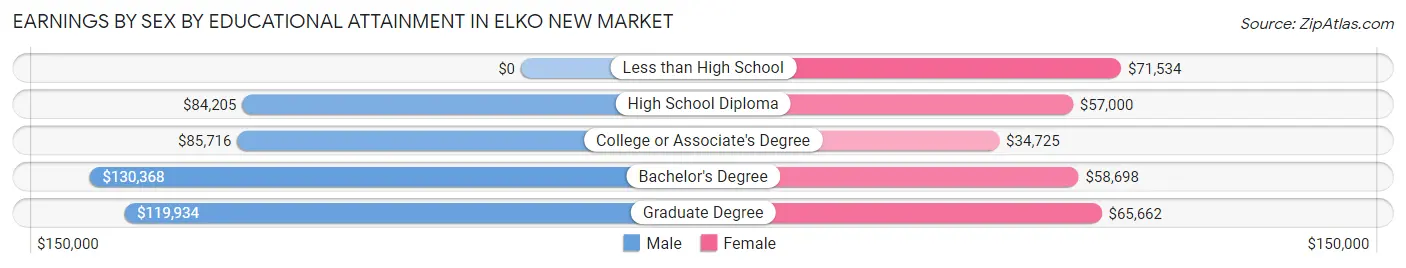
Earnings by Sex by Educational Attainment in Elko New Market
Average earnings in Elko New Market are $87,750 for men and $58,341 for women, a difference of 33.5%. Men with an educational attainment of bachelor's degree enjoy the highest average annual earnings of $130,368, while those with high school diploma education earn the least with $84,205. Women with an educational attainment of less than high school earn the most with the average annual earnings of $71,534, while those with college or associate's degree education have the smallest earnings of $34,725.
| Educational Attainment | Male Income | Female Income |
| Less than High School | - | - |
| High School Diploma | $84,205 | $57,000 |
| College or Associate's Degree | $85,716 | $34,725 |
| Bachelor's Degree | $130,368 | $58,698 |
| Graduate Degree | $119,934 | $65,662 |
| Total | $87,750 | $58,341 |
Family Income in Elko New Market
Family Income Brackets in Elko New Market
According to the Elko New Market family income data, there are 469 families falling into the $100,000 to $149,999 income range, which is the most common income bracket and makes up 31.5% of all families.
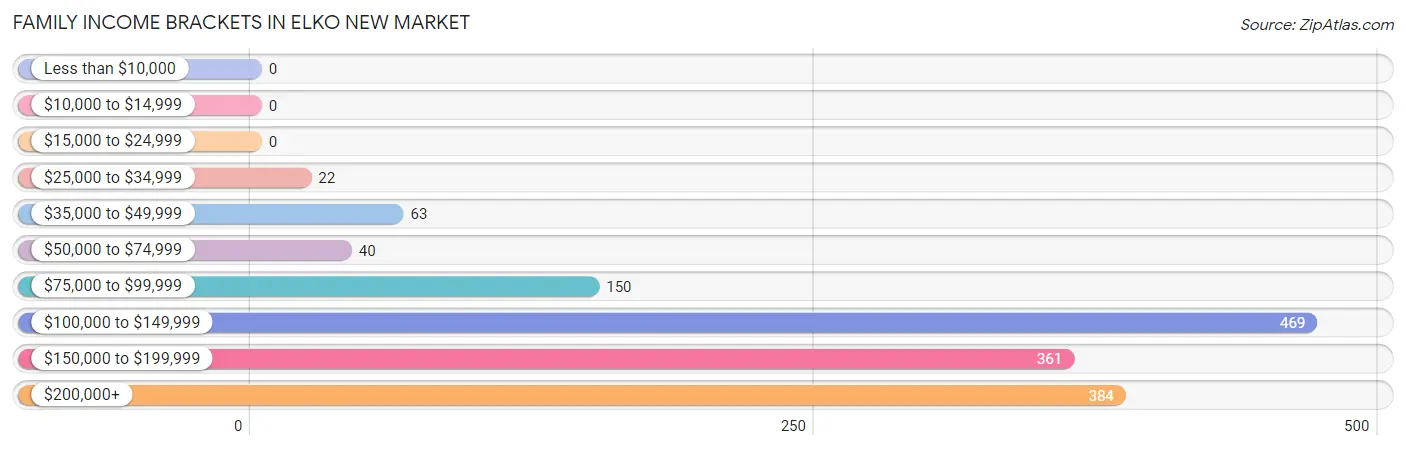
| Income Bracket | # Families | % Families |
| Less than $10,000 | 0 | 0.0% |
| $10,000 to $14,999 | 0 | 0.0% |
| $15,000 to $24,999 | 0 | 0.0% |
| $25,000 to $34,999 | 22 | 1.5% |
| $35,000 to $49,999 | 63 | 4.2% |
| $50,000 to $74,999 | 40 | 2.7% |
| $75,000 to $99,999 | 150 | 10.1% |
| $100,000 to $149,999 | 469 | 31.5% |
| $150,000 to $199,999 | 361 | 24.2% |
| $200,000+ | 384 | 25.8% |
Family Income by Famaliy Size in Elko New Market
4-person families (440 | 29.5%) account for the highest median family income in Elko New Market with $175,294 per family, while 2-person families (437 | 29.3%) have the highest median income of $77,244 per family member.
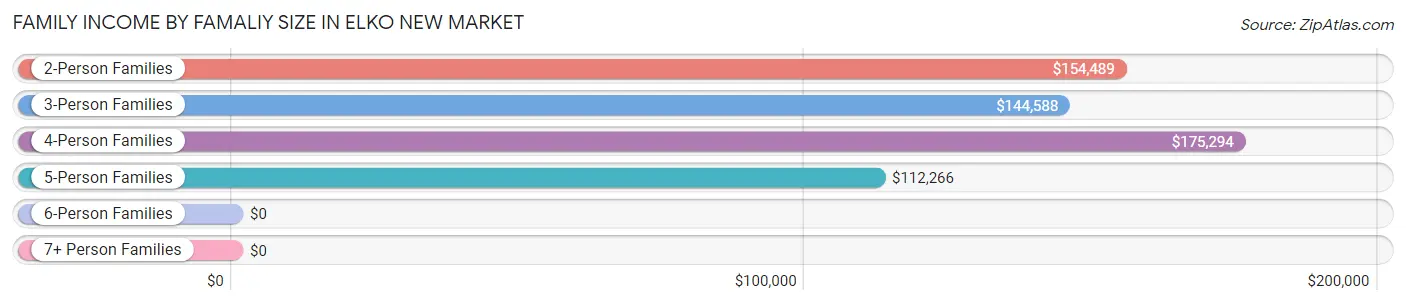
| Income Bracket | # Families | Median Income |
| 2-Person Families | 437 (29.3%) | $154,489 |
| 3-Person Families | 484 (32.5%) | $144,588 |
| 4-Person Families | 440 (29.5%) | $175,294 |
| 5-Person Families | 93 (6.2%) | $112,266 |
| 6-Person Families | 13 (0.9%) | $0 |
| 7+ Person Families | 23 (1.5%) | $0 |
| Total | 1,490 (100.0%) | $149,881 |
Family Income by Number of Earners in Elko New Market
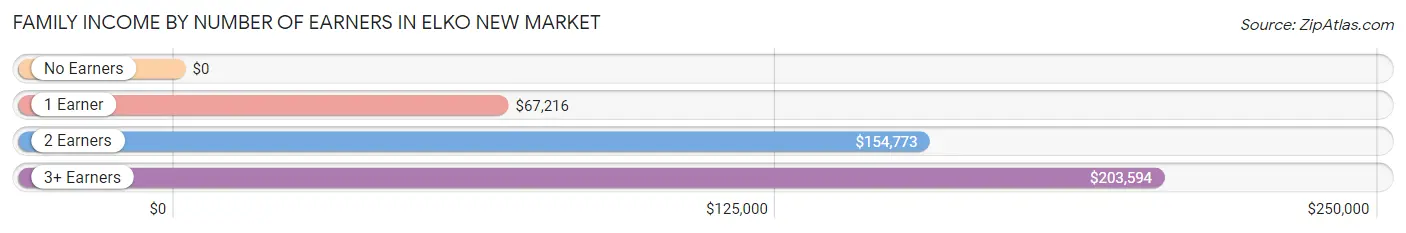
| Number of Earners | # Families | Median Income |
| No Earners | 42 (2.8%) | $0 |
| 1 Earner | 121 (8.1%) | $67,216 |
| 2 Earners | 1,100 (73.8%) | $154,773 |
| 3+ Earners | 227 (15.2%) | $203,594 |
| Total | 1,490 (100.0%) | $149,881 |
Household Income in Elko New Market
Household Income Brackets in Elko New Market
With 469 households falling in the category, the $100,000 to $149,999 income range is the most frequent in Elko New Market, accounting for 31.5% of all households.
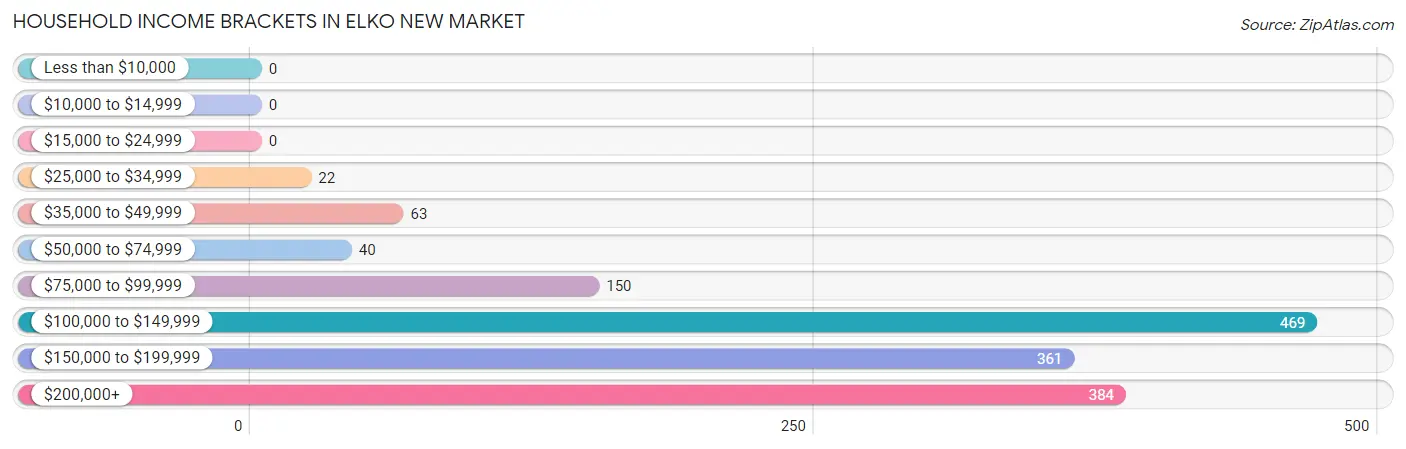
| Income Bracket | # Households | % Households |
| Less than $10,000 | 0 | 0.0% |
| $10,000 to $14,999 | 0 | 0.0% |
| $15,000 to $24,999 | 0 | 0.0% |
| $25,000 to $34,999 | 22 | 1.5% |
| $35,000 to $49,999 | 63 | 4.2% |
| $50,000 to $74,999 | 40 | 2.7% |
| $75,000 to $99,999 | 150 | 10.1% |
| $100,000 to $149,999 | 469 | 31.5% |
| $150,000 to $199,999 | 361 | 24.2% |
| $200,000+ | 384 | 25.8% |
Household Income by Householder Age in Elko New Market
The median household income in Elko New Market is $149,881, with the highest median household income of $186,938 found in the 45 to 64 years age bracket for the primary householder. A total of 623 households (41.8%) fall into this category.
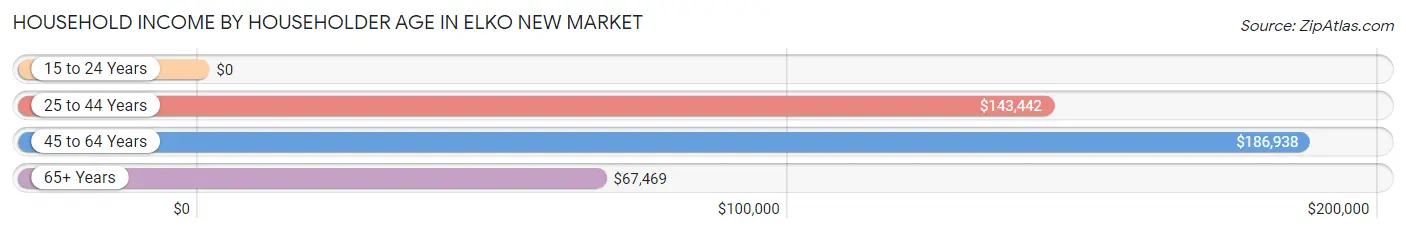
| Income Bracket | # Households | Median Income |
| 15 to 24 Years | 0 (0.0%) | $0 |
| 25 to 44 Years | 788 (52.9%) | $143,442 |
| 45 to 64 Years | 623 (41.8%) | $186,938 |
| 65+ Years | 79 (5.3%) | $67,469 |
| Total | 1,490 (100.0%) | $149,881 |
Poverty in Elko New Market
Income Below Poverty by Sex and Age in Elko New Market
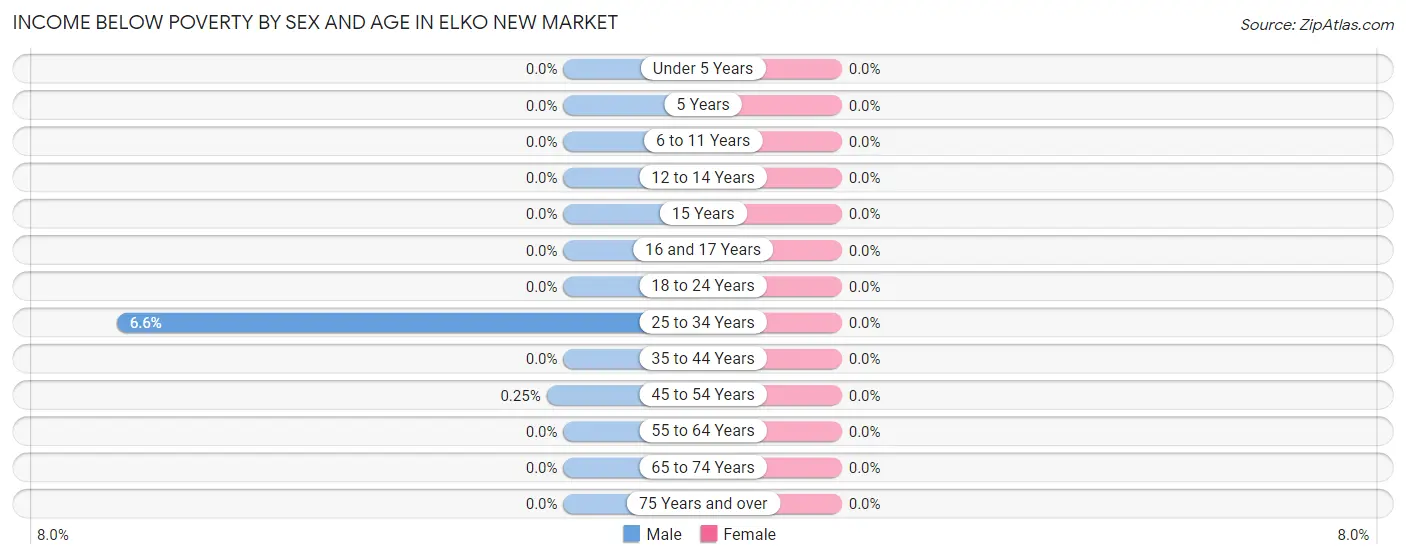
| Age Bracket | Male | Female |
| Under 5 Years | 0 (0.0%) | 0 (0.0%) |
| 5 Years | 0 (0.0%) | 0 (0.0%) |
| 6 to 11 Years | 0 (0.0%) | 0 (0.0%) |
| 12 to 14 Years | 0 (0.0%) | 0 (0.0%) |
| 15 Years | 0 (0.0%) | 0 (0.0%) |
| 16 and 17 Years | 0 (0.0%) | 0 (0.0%) |
| 18 to 24 Years | 0 (0.0%) | 0 (0.0%) |
| 25 to 34 Years | 24 (6.6%) | 0 (0.0%) |
| 35 to 44 Years | 0 (0.0%) | 0 (0.0%) |
| 45 to 54 Years | 1 (0.3%) | 0 (0.0%) |
| 55 to 64 Years | 0 (0.0%) | 0 (0.0%) |
| 65 to 74 Years | 0 (0.0%) | 0 (0.0%) |
| 75 Years and over | 0 (0.0%) | 0 (0.0%) |
| Total | 25 (1.1%) | 0 (0.0%) |
Income Above Poverty by Sex and Age in Elko New Market
According to the poverty statistics in Elko New Market, males aged under 5 years and females aged under 5 years are the age groups that are most secure financially, with 100.0% of males and 100.0% of females in these age groups living above the poverty line.
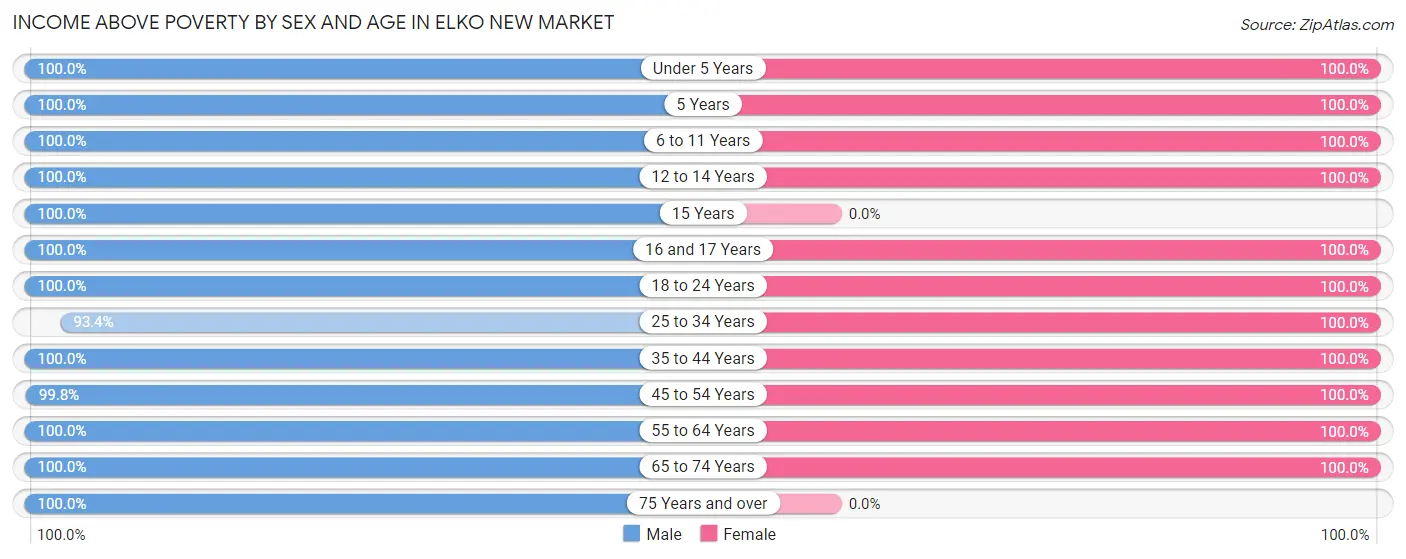
| Age Bracket | Male | Female |
| Under 5 Years | 134 (100.0%) | 234 (100.0%) |
| 5 Years | 64 (100.0%) | 40 (100.0%) |
| 6 to 11 Years | 405 (100.0%) | 209 (100.0%) |
| 12 to 14 Years | 72 (100.0%) | 109 (100.0%) |
| 15 Years | 17 (100.0%) | 0 (0.0%) |
| 16 and 17 Years | 54 (100.0%) | 197 (100.0%) |
| 18 to 24 Years | 50 (100.0%) | 172 (100.0%) |
| 25 to 34 Years | 338 (93.4%) | 456 (100.0%) |
| 35 to 44 Years | 360 (100.0%) | 449 (100.0%) |
| 45 to 54 Years | 399 (99.8%) | 389 (100.0%) |
| 55 to 64 Years | 305 (100.0%) | 243 (100.0%) |
| 65 to 74 Years | 42 (100.0%) | 55 (100.0%) |
| 75 Years and over | 18 (100.0%) | 0 (0.0%) |
| Total | 2,258 (98.9%) | 2,553 (100.0%) |
Income Below Poverty Among Married-Couple Families in Elko New Market
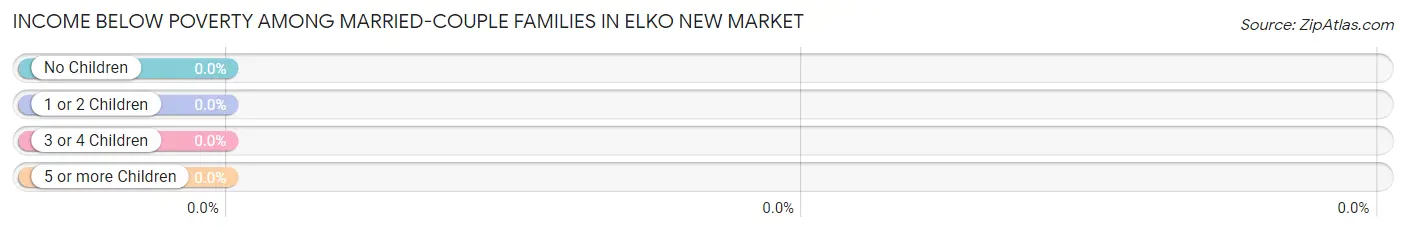
| Children | Above Poverty | Below Poverty |
| No Children | 480 (100.0%) | 0 (0.0%) |
| 1 or 2 Children | 813 (100.0%) | 0 (0.0%) |
| 3 or 4 Children | 95 (100.0%) | 0 (0.0%) |
| 5 or more Children | 8 (100.0%) | 0 (0.0%) |
| Total | 1,396 (100.0%) | 0 (0.0%) |
Income Below Poverty Among Single-Parent Households in Elko New Market
| Children | Single Father | Single Mother |
| No Children | 0 (0.0%) | 0 (0.0%) |
| 1 or 2 Children | 0 (0.0%) | 0 (0.0%) |
| 3 or 4 Children | 0 (0.0%) | 0 (0.0%) |
| 5 or more Children | 0 (0.0%) | 0 (0.0%) |
| Total | 0 (0.0%) | 0 (0.0%) |
Income Below Poverty Among Married-Couple vs Single-Parent Households in Elko New Market
| Children | Married-Couple Families | Single-Parent Households |
| No Children | 0 (0.0%) | 0 (0.0%) |
| 1 or 2 Children | 0 (0.0%) | 0 (0.0%) |
| 3 or 4 Children | 0 (0.0%) | 0 (0.0%) |
| 5 or more Children | 0 (0.0%) | 0 (0.0%) |
| Total | 0 (0.0%) | 0 (0.0%) |
Race in Elko New Market
The most populous races in Elko New Market are White / Caucasian (4,105 | 84.6%), Two or more Races (295 | 6.1%), and Black / African American (253 | 5.2%).
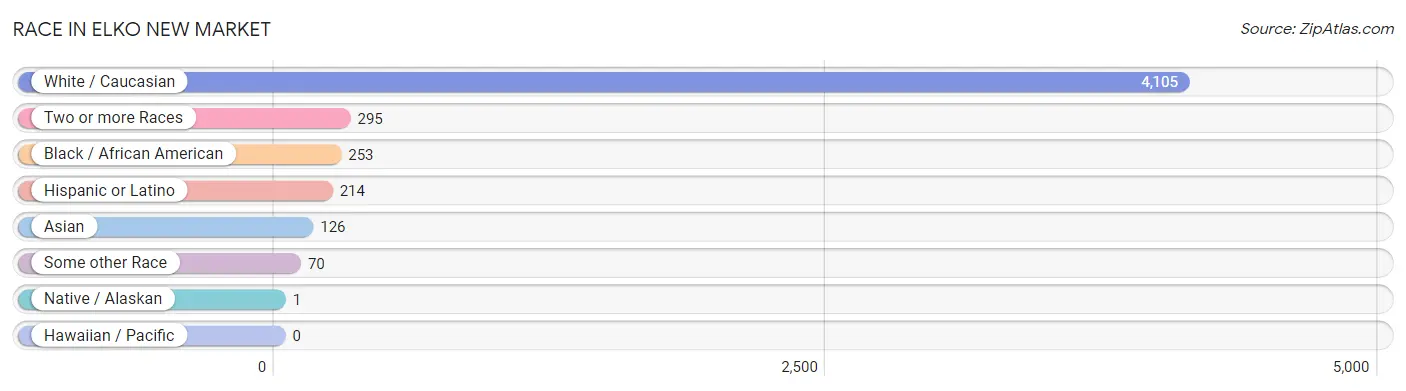
| Race | # Population | % Population |
| Asian | 126 | 2.6% |
| Black / African American | 253 | 5.2% |
| Hawaiian / Pacific | 0 | 0.0% |
| Hispanic or Latino | 214 | 4.4% |
| Native / Alaskan | 1 | 0.0% |
| White / Caucasian | 4,105 | 84.6% |
| Two or more Races | 295 | 6.1% |
| Some other Race | 70 | 1.4% |
| Total | 4,850 | 100.0% |
Ancestry in Elko New Market
The most populous ancestries reported in Elko New Market are German (1,662 | 34.3%), Norwegian (746 | 15.4%), Irish (604 | 12.4%), Swedish (371 | 7.6%), and English (281 | 5.8%), together accounting for 75.5% of all Elko New Market residents.
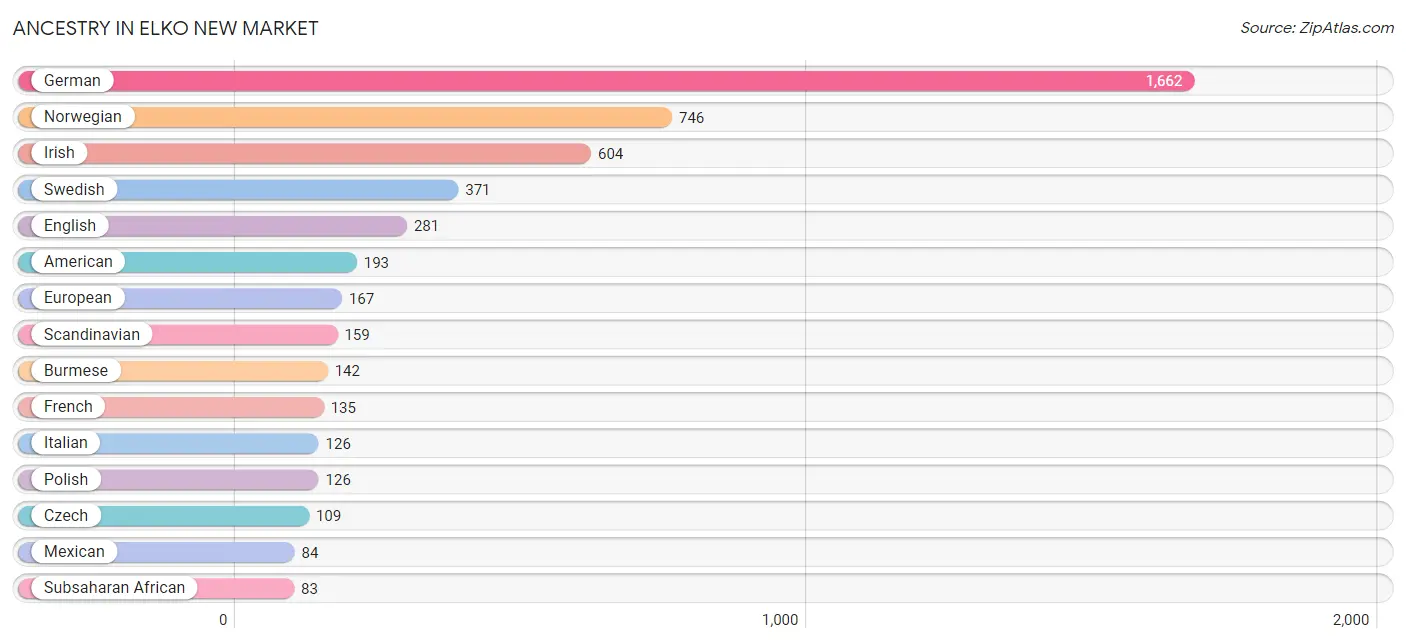
| Ancestry | # Population | % Population |
| African | 22 | 0.4% |
| American | 193 | 4.0% |
| Belgian | 20 | 0.4% |
| British | 50 | 1.0% |
| Burmese | 142 | 2.9% |
| Celtic | 74 | 1.5% |
| Chippewa | 1 | 0.0% |
| Colombian | 52 | 1.1% |
| Cuban | 41 | 0.9% |
| Czech | 109 | 2.2% |
| Danish | 8 | 0.2% |
| Dutch | 59 | 1.2% |
| English | 281 | 5.8% |
| European | 167 | 3.4% |
| French | 135 | 2.8% |
| German | 1,662 | 34.3% |
| Irish | 604 | 12.4% |
| Italian | 126 | 2.6% |
| Kenyan | 46 | 0.9% |
| Mexican | 84 | 1.7% |
| Norwegian | 746 | 15.4% |
| Polish | 126 | 2.6% |
| Puerto Rican | 18 | 0.4% |
| Russian | 14 | 0.3% |
| Scandinavian | 159 | 3.3% |
| Scotch-Irish | 26 | 0.5% |
| Scottish | 8 | 0.2% |
| South American | 52 | 1.1% |
| Spaniard | 19 | 0.4% |
| Subsaharan African | 83 | 1.7% |
| Swedish | 371 | 7.6% |
| Vietnamese | 35 | 0.7% | View All 32 Rows |
Immigrants in Elko New Market
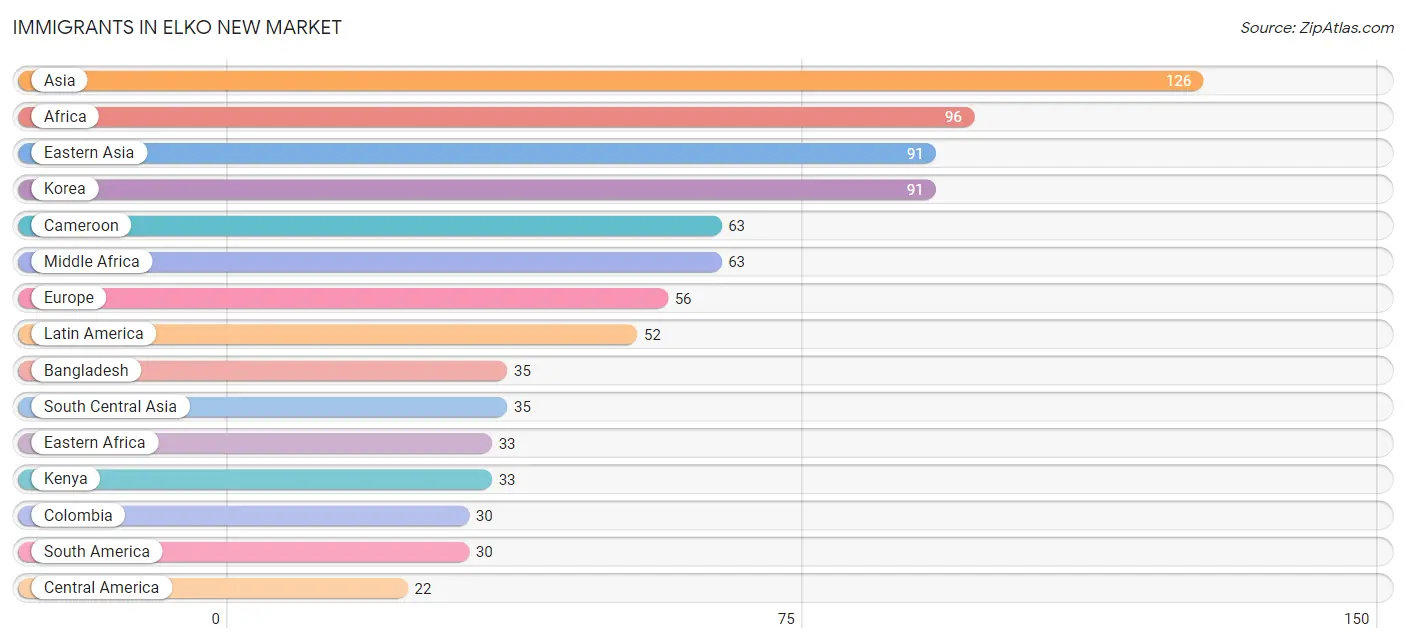
The most numerous immigrant groups reported in Elko New Market came from Asia (126 | 2.6%), Africa (96 | 2.0%), Eastern Asia (91 | 1.9%), Korea (91 | 1.9%), and Cameroon (63 | 1.3%), together accounting for 9.6% of all Elko New Market residents.
| Immigration Origin | # Population | % Population |
| Africa | 96 | 2.0% |
| Asia | 126 | 2.6% |
| Bangladesh | 35 | 0.7% |
| Cameroon | 63 | 1.3% |
| Central America | 22 | 0.4% |
| Colombia | 30 | 0.6% |
| Eastern Africa | 33 | 0.7% |
| Eastern Asia | 91 | 1.9% |
| Eastern Europe | 18 | 0.4% |
| Europe | 56 | 1.1% |
| Germany | 19 | 0.4% |
| Kenya | 33 | 0.7% |
| Korea | 91 | 1.9% |
| Latin America | 52 | 1.1% |
| Mexico | 22 | 0.4% |
| Middle Africa | 63 | 1.3% |
| Russia | 18 | 0.4% |
| South America | 30 | 0.6% |
| South Central Asia | 35 | 0.7% |
| Southern Europe | 19 | 0.4% |
| Spain | 19 | 0.4% |
| Western Europe | 19 | 0.4% | View All 22 Rows |
Sex and Age in Elko New Market
Sex and Age in Elko New Market
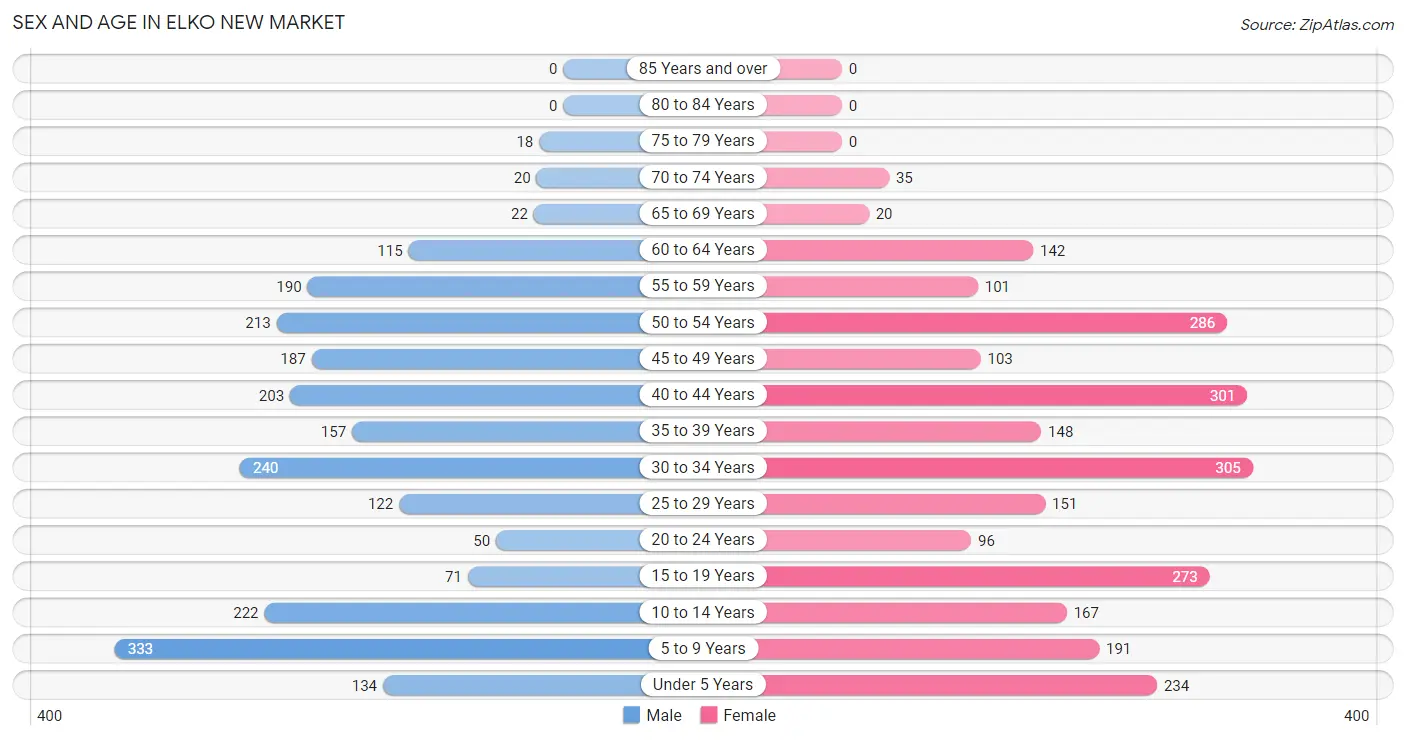
The most populous age groups in Elko New Market are 5 to 9 Years (333 | 14.5%) for men and 30 to 34 Years (305 | 11.9%) for women.
| Age Bracket | Male | Female |
| Under 5 Years | 134 (5.8%) | 234 (9.2%) |
| 5 to 9 Years | 333 (14.5%) | 191 (7.5%) |
| 10 to 14 Years | 222 (9.7%) | 167 (6.5%) |
| 15 to 19 Years | 71 (3.1%) | 273 (10.7%) |
| 20 to 24 Years | 50 (2.2%) | 96 (3.8%) |
| 25 to 29 Years | 122 (5.3%) | 151 (5.9%) |
| 30 to 34 Years | 240 (10.4%) | 305 (11.9%) |
| 35 to 39 Years | 157 (6.8%) | 148 (5.8%) |
| 40 to 44 Years | 203 (8.8%) | 301 (11.8%) |
| 45 to 49 Years | 187 (8.1%) | 103 (4.0%) |
| 50 to 54 Years | 213 (9.3%) | 286 (11.2%) |
| 55 to 59 Years | 190 (8.3%) | 101 (4.0%) |
| 60 to 64 Years | 115 (5.0%) | 142 (5.6%) |
| 65 to 69 Years | 22 (1.0%) | 20 (0.8%) |
| 70 to 74 Years | 20 (0.9%) | 35 (1.4%) |
| 75 to 79 Years | 18 (0.8%) | 0 (0.0%) |
| 80 to 84 Years | 0 (0.0%) | 0 (0.0%) |
| 85 Years and over | 0 (0.0%) | 0 (0.0%) |
| Total | 2,297 (100.0%) | 2,553 (100.0%) |
Families and Households in Elko New Market
Median Family Size in Elko New Market
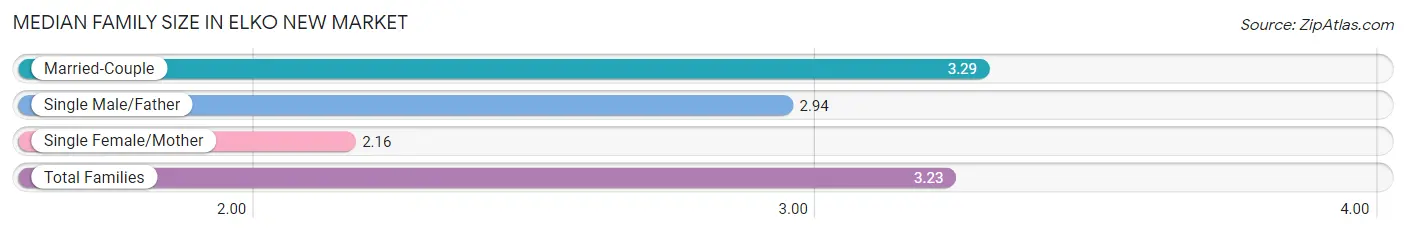
The median family size in Elko New Market is 3.23 persons per family, with married-couple families (1,396 | 93.7%) accounting for the largest median family size of 3.29 persons per family. On the other hand, single female/mother families (76 | 5.1%) represent the smallest median family size with 2.16 persons per family.
| Family Type | # Families | Family Size |
| Married-Couple | 1,396 (93.7%) | 3.29 |
| Single Male/Father | 18 (1.2%) | 2.94 |
| Single Female/Mother | 76 (5.1%) | 2.16 |
| Total Families | 1,490 (100.0%) | 3.23 |
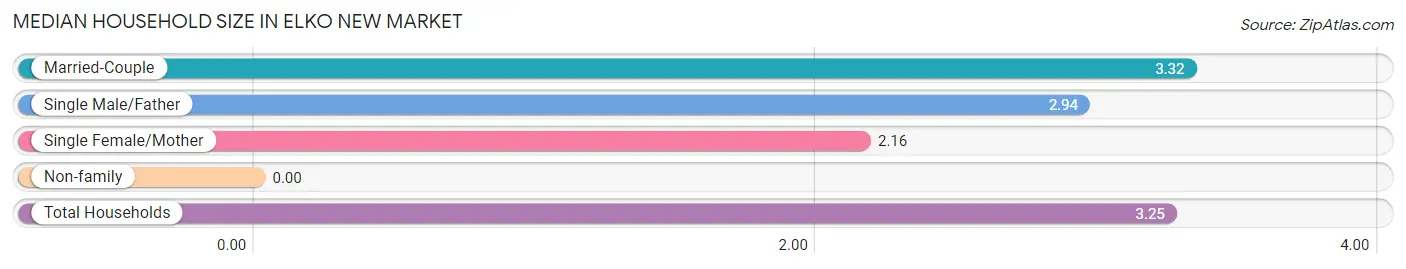
Median Household Size in Elko New Market
| Household Type | # Households | Household Size |
| Married-Couple | 1,396 (93.7%) | 3.32 |
| Single Male/Father | 18 (1.2%) | 2.94 |
| Single Female/Mother | 76 (5.1%) | 2.16 |
| Non-family | 0 (0.0%) | - |
| Total Households | 1,490 (100.0%) | 3.25 |
Household Size by Marriage Status in Elko New Market
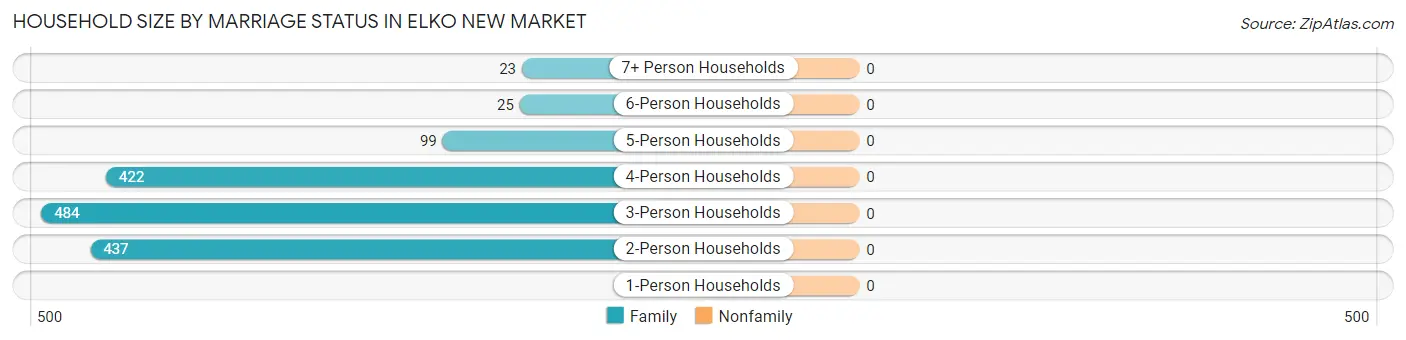
| Household Size | Family Households | Nonfamily Households |
| 1-Person Households | - | 0 (0.0%) |
| 2-Person Households | 437 (29.3%) | 0 (0.0%) |
| 3-Person Households | 484 (32.5%) | 0 (0.0%) |
| 4-Person Households | 422 (28.3%) | 0 (0.0%) |
| 5-Person Households | 99 (6.6%) | 0 (0.0%) |
| 6-Person Households | 25 (1.7%) | 0 (0.0%) |
| 7+ Person Households | 23 (1.5%) | 0 (0.0%) |
| Total | 1,490 (100.0%) | 0 (0.0%) |
Female Fertility in Elko New Market
Fertility by Age in Elko New Market
Average fertility rate in Elko New Market is 48.0 births per 1,000 women. Women in the age bracket of 35 to 50 years have the highest fertility rate with 84.0 births per 1,000 women. Women in the age bracket of 35 to 50 years acount for 73.9% of all women with births.
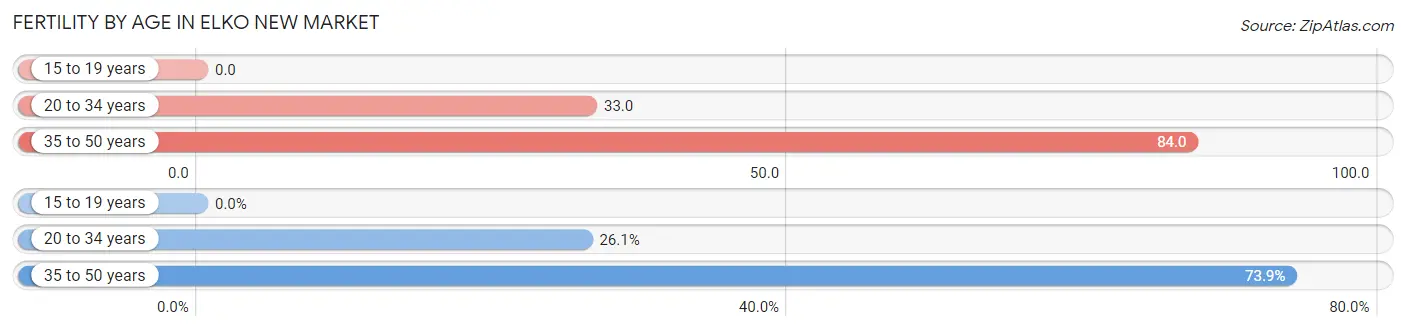
| Age Bracket | Women with Births | Births / 1,000 Women |
| 15 to 19 years | 0 (0.0%) | 0.0 |
| 20 to 34 years | 18 (26.1%) | 33.0 |
| 35 to 50 years | 51 (73.9%) | 84.0 |
| Total | 69 (100.0%) | 48.0 |
Fertility by Age by Marriage Status in Elko New Market
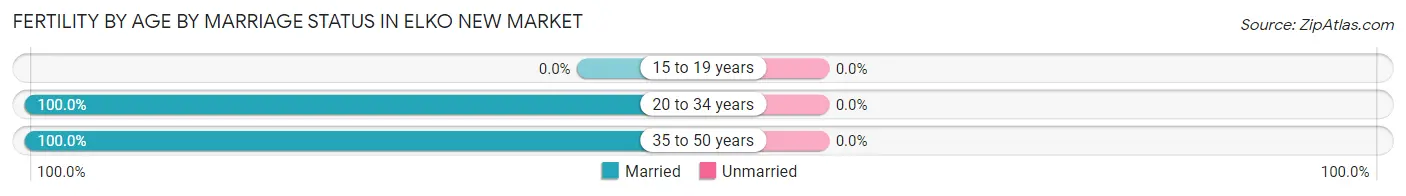
| Age Bracket | Married | Unmarried |
| 15 to 19 years | 0 (0.0%) | 0 (0.0%) |
| 20 to 34 years | 18 (100.0%) | 0 (0.0%) |
| 35 to 50 years | 51 (100.0%) | 0 (0.0%) |
| Total | 69 (100.0%) | 0 (0.0%) |
Fertility by Education in Elko New Market
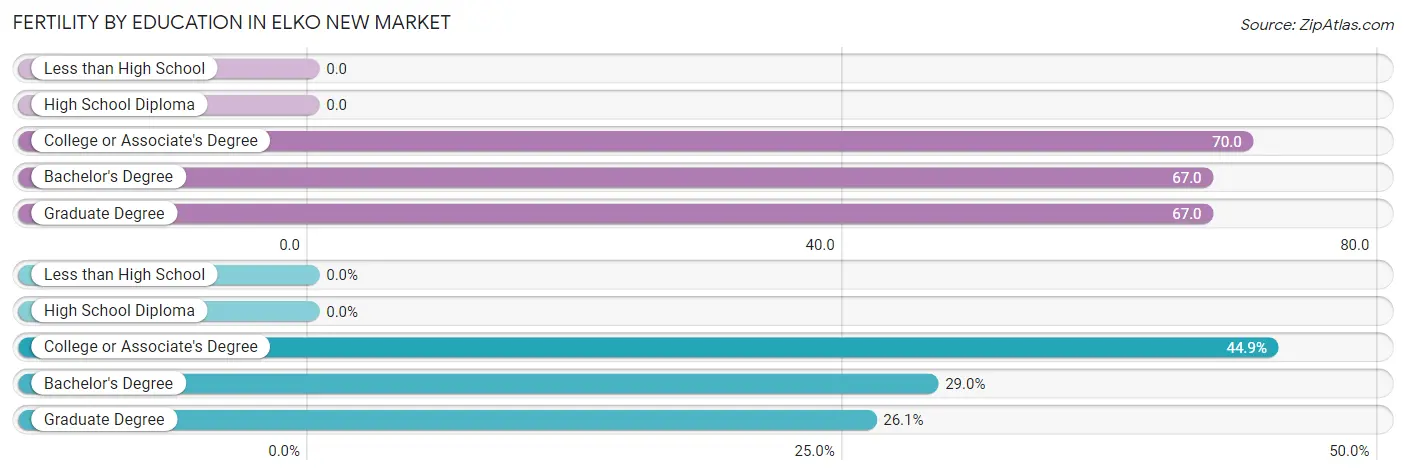
| Educational Attainment | Women with Births | Births / 1,000 Women |
| Less than High School | 0 (0.0%) | 0.0 |
| High School Diploma | 0 (0.0%) | 0.0 |
| College or Associate's Degree | 31 (44.9%) | 70.0 |
| Bachelor's Degree | 20 (29.0%) | 67.0 |
| Graduate Degree | 18 (26.1%) | 67.0 |
| Total | 69 (100.0%) | 48.0 |
Fertility by Education by Marriage Status in Elko New Market
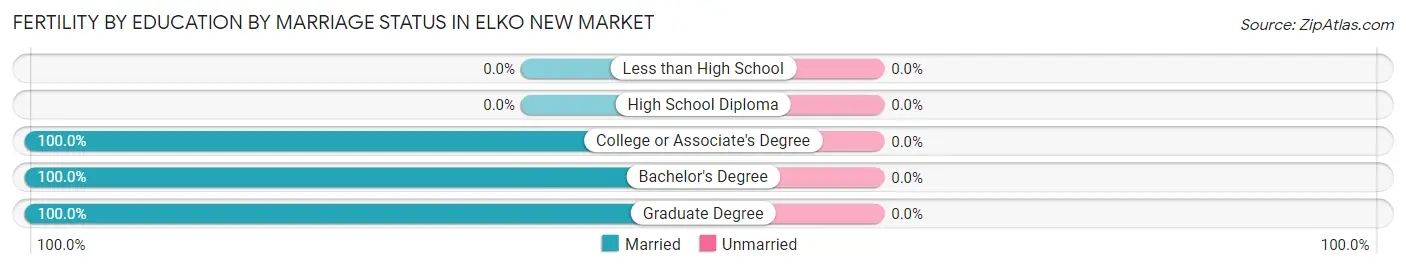
| Educational Attainment | Married | Unmarried |
| Less than High School | 0 (0.0%) | 0 (0.0%) |
| High School Diploma | 0 (0.0%) | 0 (0.0%) |
| College or Associate's Degree | 31 (100.0%) | 0 (0.0%) |
| Bachelor's Degree | 20 (100.0%) | 0 (0.0%) |
| Graduate Degree | 18 (100.0%) | 0 (0.0%) |
| Total | 69 (100.0%) | 0 (0.0%) |
Employment Characteristics in Elko New Market
Employment by Class of Employer in Elko New Market
Among the 2,982 employed individuals in Elko New Market, private company employees (2,028 | 68.0%), local government employees (292 | 9.8%), and not-for-profit organizations (261 | 8.7%) make up the most common classes of employment.
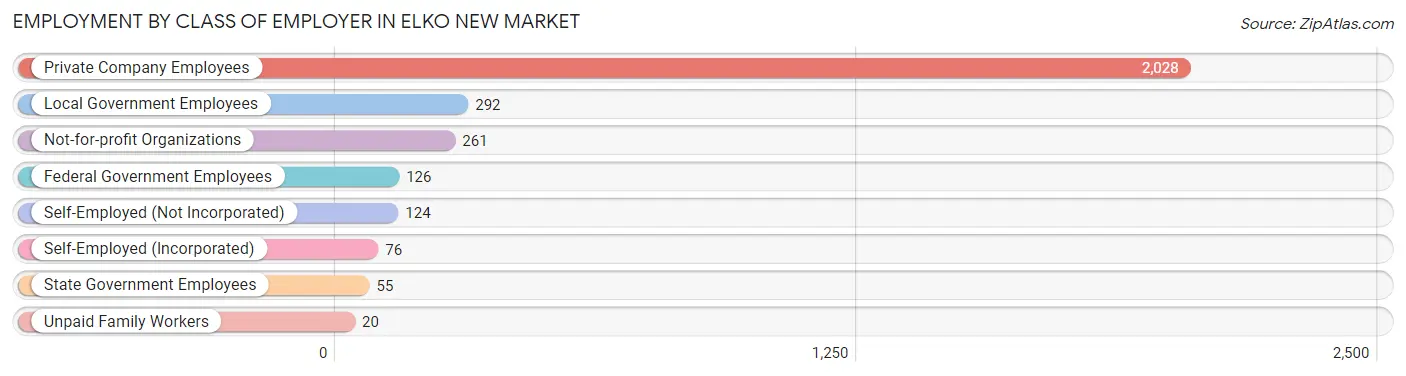
| Employer Class | # Employees | % Employees |
| Private Company Employees | 2,028 | 68.0% |
| Self-Employed (Incorporated) | 76 | 2.5% |
| Self-Employed (Not Incorporated) | 124 | 4.2% |
| Not-for-profit Organizations | 261 | 8.7% |
| Local Government Employees | 292 | 9.8% |
| State Government Employees | 55 | 1.8% |
| Federal Government Employees | 126 | 4.2% |
| Unpaid Family Workers | 20 | 0.7% |
| Total | 2,982 | 100.0% |
Employment Status by Age in Elko New Market
According to the labor force statistics for Elko New Market, out of the total population over 16 years of age (3,552), 85.2% or 3,026 individuals are in the labor force, with 0.8% or 24 of them unemployed. The age group with the highest labor force participation rate is 25 to 29 years, with 100.0% or 273 individuals in the labor force. Within the labor force, the 45 to 54 years age range has the highest percentage of unemployed individuals, with 3.4% or 25 of them being unemployed.
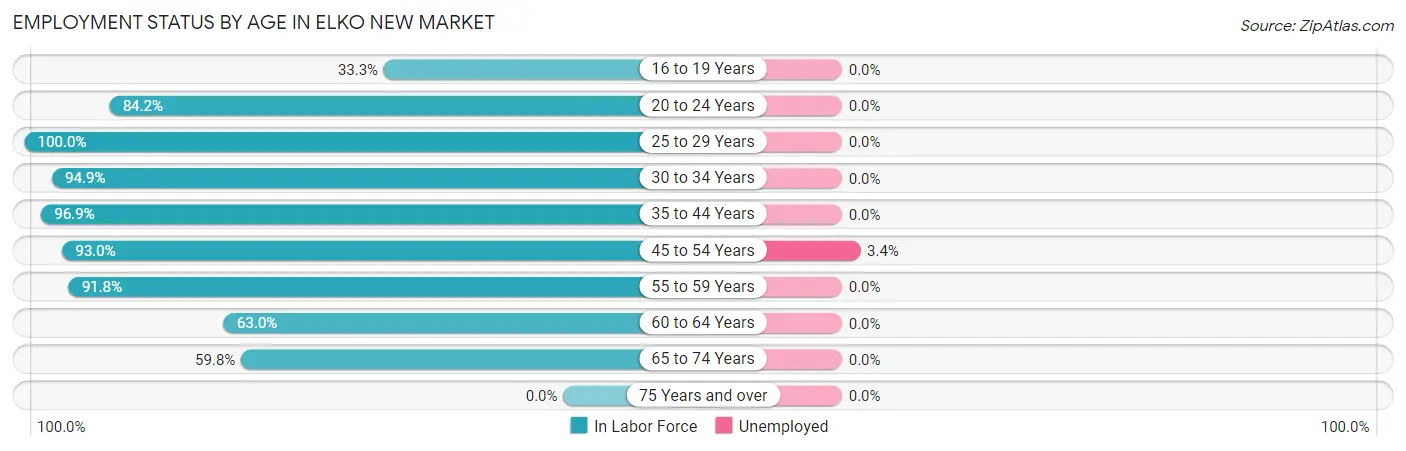
| Age Bracket | In Labor Force | Unemployed |
| 16 to 19 Years | 109 (33.3%) | 0 (0.0%) |
| 20 to 24 Years | 123 (84.2%) | 0 (0.0%) |
| 25 to 29 Years | 273 (100.0%) | 0 (0.0%) |
| 30 to 34 Years | 517 (94.9%) | 0 (0.0%) |
| 35 to 44 Years | 784 (96.9%) | 0 (0.0%) |
| 45 to 54 Years | 734 (93.0%) | 25 (3.4%) |
| 55 to 59 Years | 267 (91.8%) | 0 (0.0%) |
| 60 to 64 Years | 162 (63.0%) | 0 (0.0%) |
| 65 to 74 Years | 58 (59.8%) | 0 (0.0%) |
| 75 Years and over | 0 (0.0%) | 0 (0.0%) |
| Total | 3,026 (85.2%) | 24 (0.8%) |
Employment Status by Educational Attainment in Elko New Market
According to labor force statistics for Elko New Market, 92.3% of individuals (2,736) out of the total population between 25 and 64 years of age (2,964) are in the labor force, with 0.9% or 25 of them being unemployed. The group with the highest labor force participation rate are those with the educational attainment of college / associate degree, with 94.1% or 1,061 individuals in the labor force. Within the labor force, individuals with college / associate degree education have the highest percentage of unemployment, with 2.4% or 25 of them being unemployed.
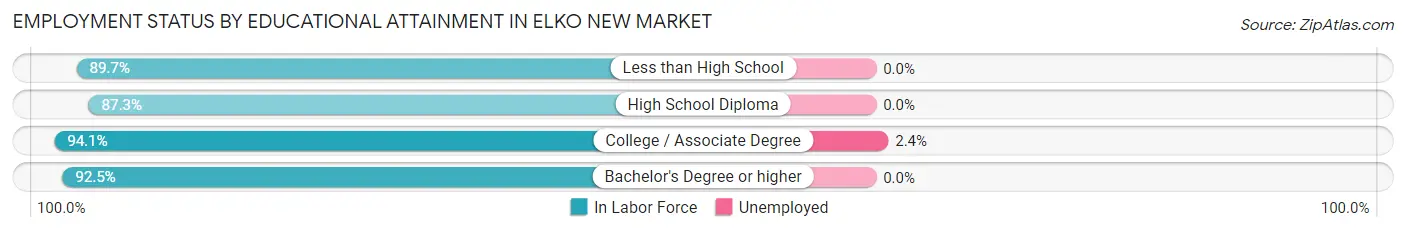
| Educational Attainment | In Labor Force | Unemployed |
| Less than High School | 96 (89.7%) | 0 (0.0%) |
| High School Diploma | 336 (87.3%) | 0 (0.0%) |
| College / Associate Degree | 1,061 (94.1%) | 27 (2.4%) |
| Bachelor's Degree or higher | 1,243 (92.5%) | 0 (0.0%) |
| Total | 2,736 (92.3%) | 27 (0.9%) |
Employment Occupations by Sex in Elko New Market
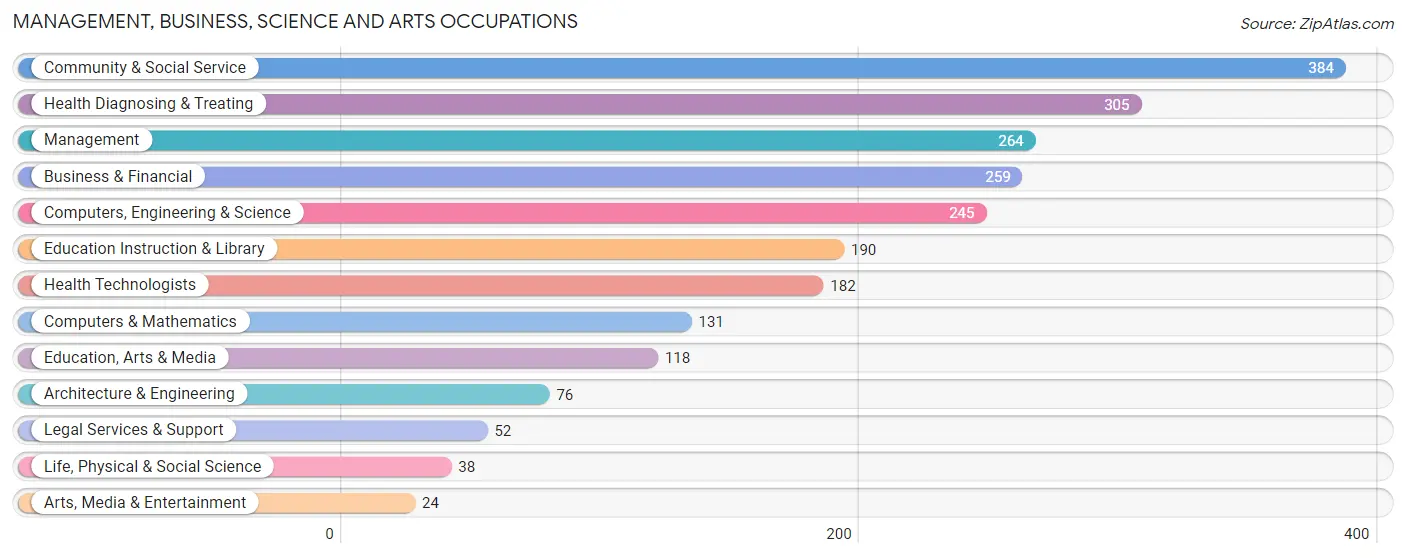
Management, Business, Science and Arts Occupations
The most common Management, Business, Science and Arts occupations in Elko New Market are Community & Social Service (384 | 12.8%), Health Diagnosing & Treating (305 | 10.2%), Management (264 | 8.8%), Business & Financial (259 | 8.6%), and Computers, Engineering & Science (245 | 8.2%).
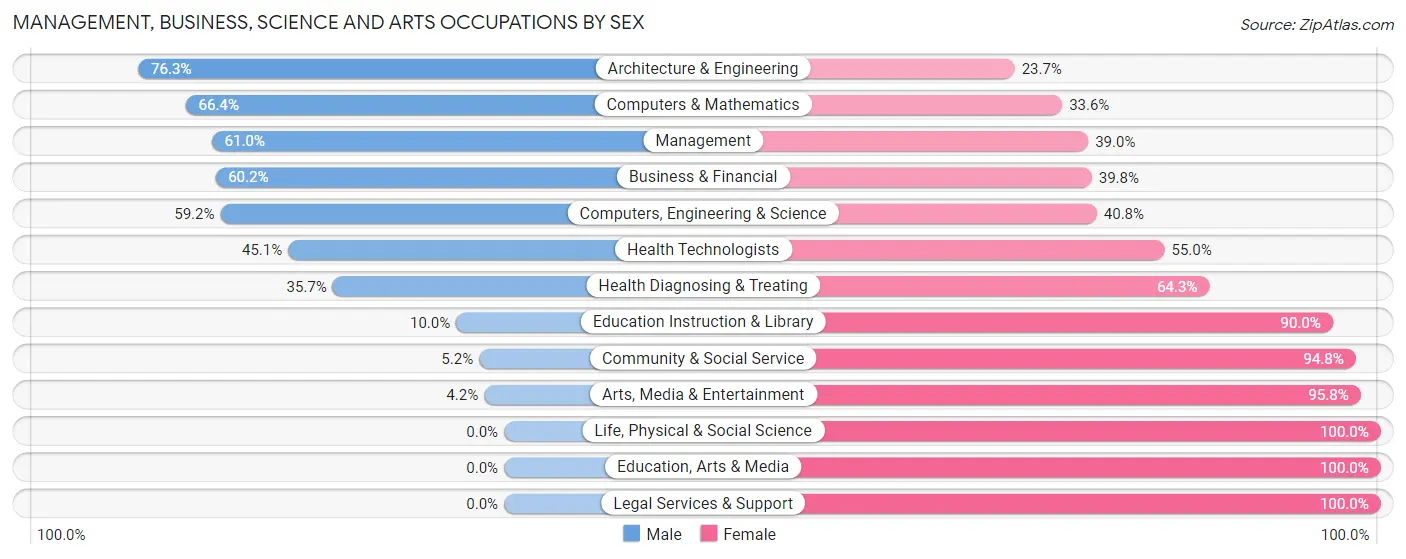
Management, Business, Science and Arts Occupations by Sex
Within the Management, Business, Science and Arts occupations in Elko New Market, the most male-oriented occupations are Architecture & Engineering (76.3%), Computers & Mathematics (66.4%), and Management (61.0%), while the most female-oriented occupations are Life, Physical & Social Science (100.0%), Education, Arts & Media (100.0%), and Legal Services & Support (100.0%).
| Occupation | Male | Female |
| Management | 161 (61.0%) | 103 (39.0%) |
| Business & Financial | 156 (60.2%) | 103 (39.8%) |
| Computers, Engineering & Science | 145 (59.2%) | 100 (40.8%) |
| Computers & Mathematics | 87 (66.4%) | 44 (33.6%) |
| Architecture & Engineering | 58 (76.3%) | 18 (23.7%) |
| Life, Physical & Social Science | 0 (0.0%) | 38 (100.0%) |
| Community & Social Service | 20 (5.2%) | 364 (94.8%) |
| Education, Arts & Media | 0 (0.0%) | 118 (100.0%) |
| Legal Services & Support | 0 (0.0%) | 52 (100.0%) |
| Education Instruction & Library | 19 (10.0%) | 171 (90.0%) |
| Arts, Media & Entertainment | 1 (4.2%) | 23 (95.8%) |
| Health Diagnosing & Treating | 109 (35.7%) | 196 (64.3%) |
| Health Technologists | 82 (45.1%) | 100 (54.9%) |
| Total (Category) | 591 (40.6%) | 866 (59.4%) |
| Total (Overall) | 1,412 (47.0%) | 1,590 (53.0%) |
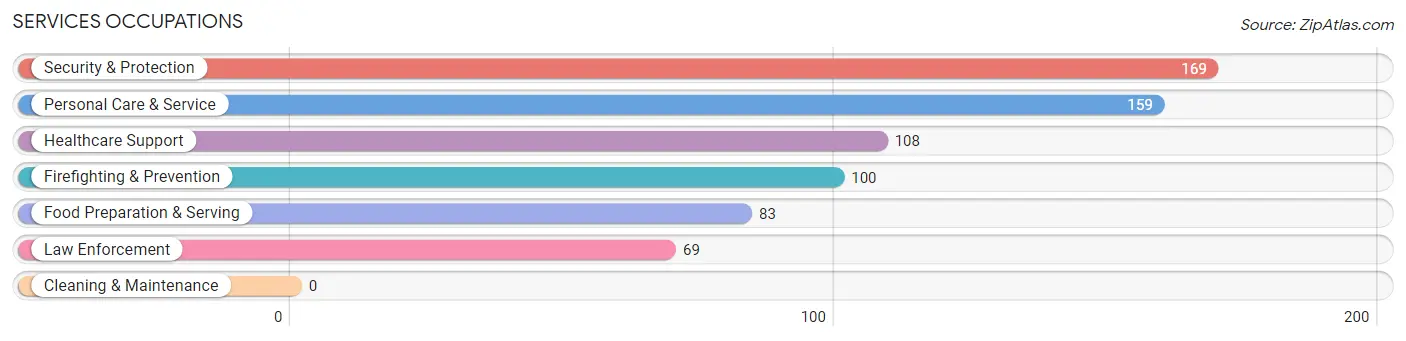
Services Occupations
The most common Services occupations in Elko New Market are Security & Protection (169 | 5.6%), Personal Care & Service (159 | 5.3%), Healthcare Support (108 | 3.6%), Firefighting & Prevention (100 | 3.3%), and Food Preparation & Serving (83 | 2.8%).
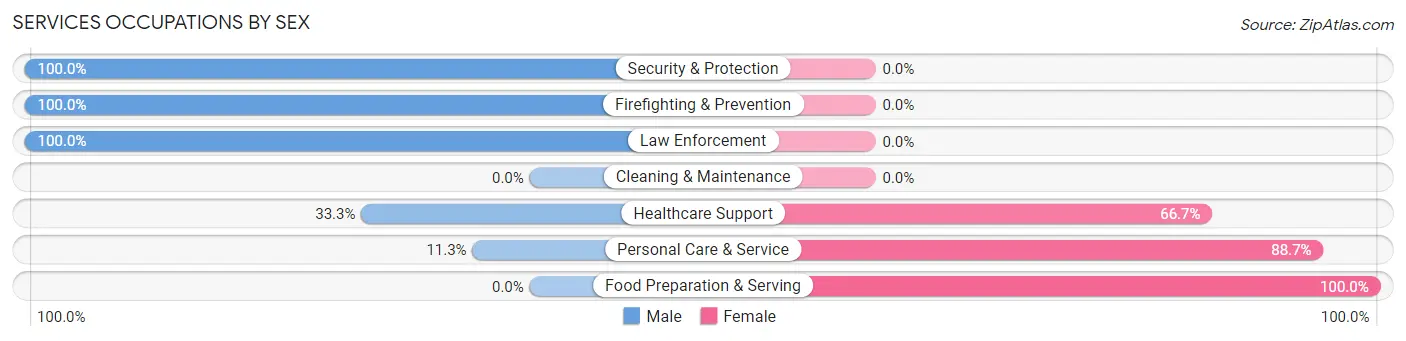
Services Occupations by Sex
Within the Services occupations in Elko New Market, the most male-oriented occupations are Security & Protection (100.0%), Firefighting & Prevention (100.0%), and Law Enforcement (100.0%), while the most female-oriented occupations are Food Preparation & Serving (100.0%), Personal Care & Service (88.7%), and Healthcare Support (66.7%).
| Occupation | Male | Female |
| Healthcare Support | 36 (33.3%) | 72 (66.7%) |
| Security & Protection | 169 (100.0%) | 0 (0.0%) |
| Firefighting & Prevention | 100 (100.0%) | 0 (0.0%) |
| Law Enforcement | 69 (100.0%) | 0 (0.0%) |
| Food Preparation & Serving | 0 (0.0%) | 83 (100.0%) |
| Cleaning & Maintenance | 0 (0.0%) | 0 (0.0%) |
| Personal Care & Service | 18 (11.3%) | 141 (88.7%) |
| Total (Category) | 223 (43.0%) | 296 (57.0%) |
| Total (Overall) | 1,412 (47.0%) | 1,590 (53.0%) |
Sales and Office Occupations
The most common Sales and Office occupations in Elko New Market are Sales & Related (408 | 13.6%), and Office & Administration (292 | 9.7%).

Sales and Office Occupations by Sex

| Occupation | Male | Female |
| Sales & Related | 308 (75.5%) | 100 (24.5%) |
| Office & Administration | 27 (9.2%) | 265 (90.7%) |
| Total (Category) | 335 (47.9%) | 365 (52.1%) |
| Total (Overall) | 1,412 (47.0%) | 1,590 (53.0%) |
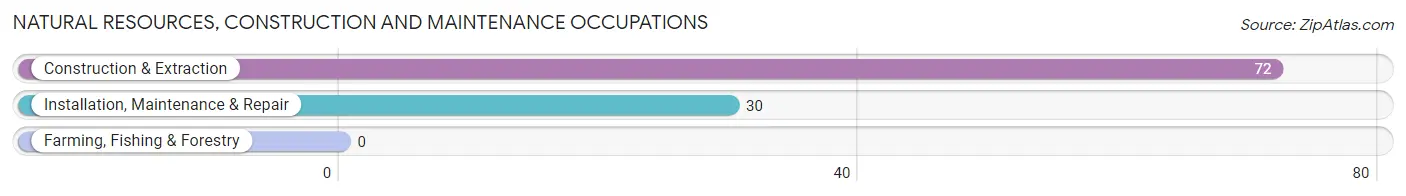
Natural Resources, Construction and Maintenance Occupations
The most common Natural Resources, Construction and Maintenance occupations in Elko New Market are Construction & Extraction (72 | 2.4%), and Installation, Maintenance & Repair (30 | 1.0%).
Natural Resources, Construction and Maintenance Occupations by Sex
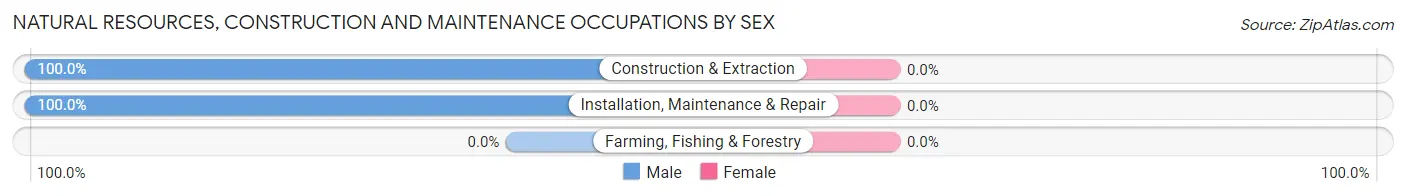
| Occupation | Male | Female |
| Farming, Fishing & Forestry | 0 (0.0%) | 0 (0.0%) |
| Construction & Extraction | 72 (100.0%) | 0 (0.0%) |
| Installation, Maintenance & Repair | 30 (100.0%) | 0 (0.0%) |
| Total (Category) | 102 (100.0%) | 0 (0.0%) |
| Total (Overall) | 1,412 (47.0%) | 1,590 (53.0%) |
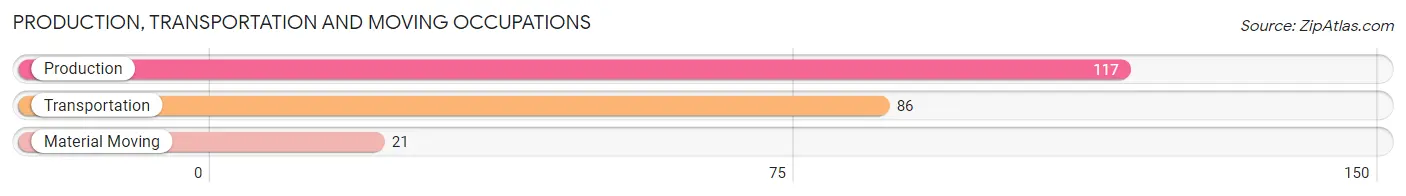
Production, Transportation and Moving Occupations
The most common Production, Transportation and Moving occupations in Elko New Market are Production (117 | 3.9%), Transportation (86 | 2.9%), and Material Moving (21 | 0.7%).
Production, Transportation and Moving Occupations by Sex
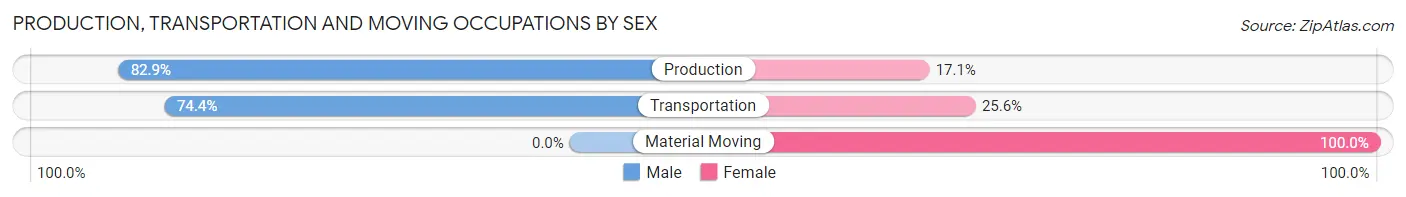
| Occupation | Male | Female |
| Production | 97 (82.9%) | 20 (17.1%) |
| Transportation | 64 (74.4%) | 22 (25.6%) |
| Material Moving | 0 (0.0%) | 21 (100.0%) |
| Total (Category) | 161 (71.9%) | 63 (28.1%) |
| Total (Overall) | 1,412 (47.0%) | 1,590 (53.0%) |
Employment Industries by Sex in Elko New Market
Employment Industries in Elko New Market
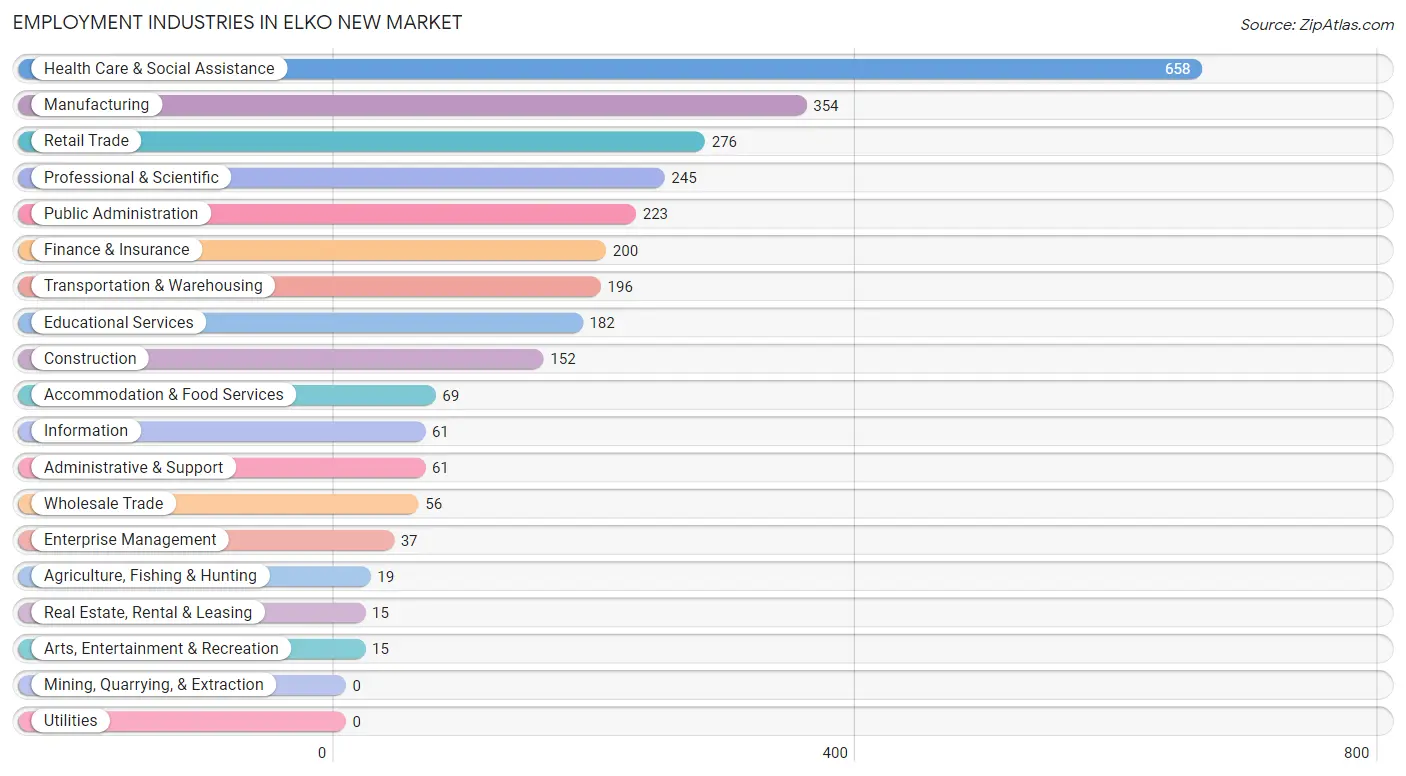
The major employment industries in Elko New Market include Health Care & Social Assistance (658 | 21.9%), Manufacturing (354 | 11.8%), Retail Trade (276 | 9.2%), Professional & Scientific (245 | 8.2%), and Public Administration (223 | 7.4%).
Employment Industries by Sex in Elko New Market
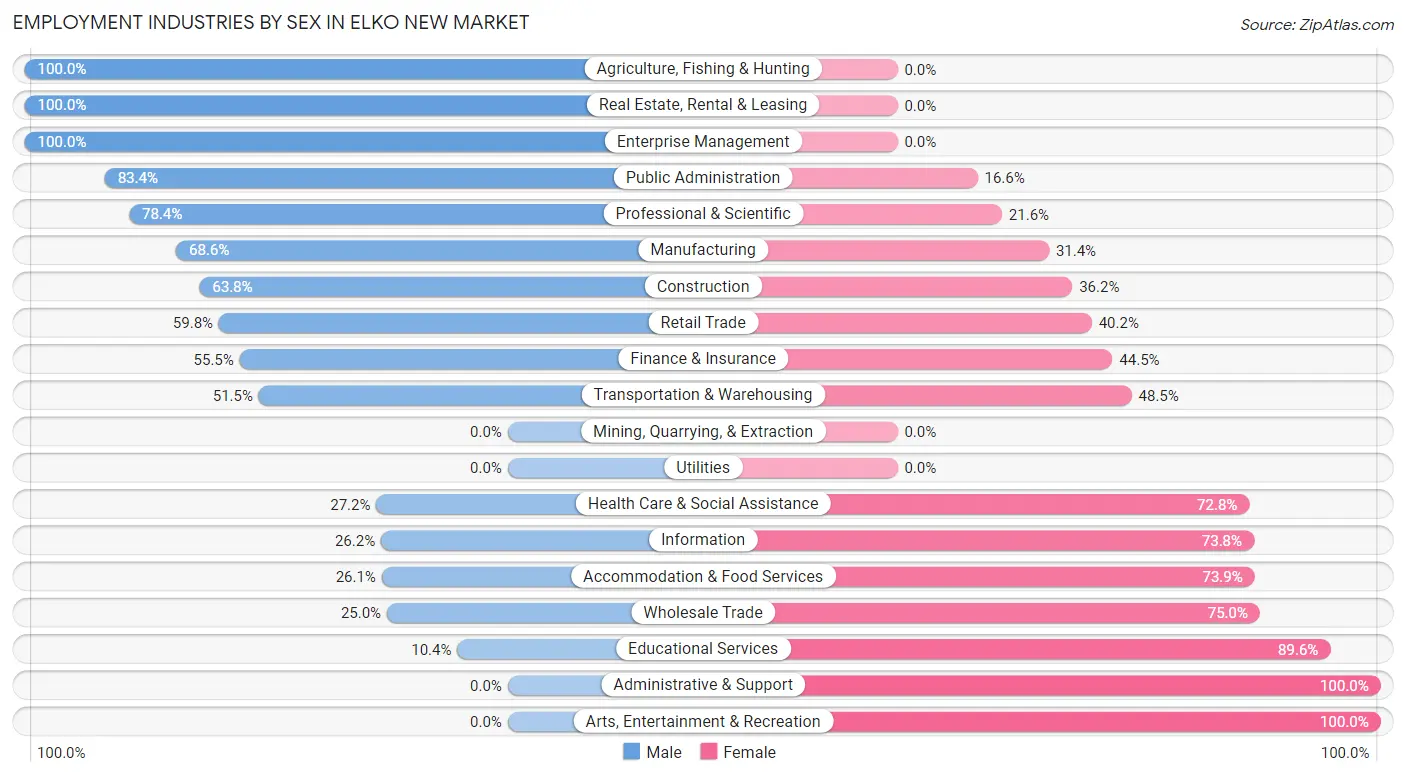
The Elko New Market industries that see more men than women are Agriculture, Fishing & Hunting (100.0%), Real Estate, Rental & Leasing (100.0%), and Enterprise Management (100.0%), whereas the industries that tend to have a higher number of women are Administrative & Support (100.0%), Arts, Entertainment & Recreation (100.0%), and Educational Services (89.6%).
| Industry | Male | Female |
| Agriculture, Fishing & Hunting | 19 (100.0%) | 0 (0.0%) |
| Mining, Quarrying, & Extraction | 0 (0.0%) | 0 (0.0%) |
| Construction | 97 (63.8%) | 55 (36.2%) |
| Manufacturing | 243 (68.6%) | 111 (31.4%) |
| Wholesale Trade | 14 (25.0%) | 42 (75.0%) |
| Retail Trade | 165 (59.8%) | 111 (40.2%) |
| Transportation & Warehousing | 101 (51.5%) | 95 (48.5%) |
| Utilities | 0 (0.0%) | 0 (0.0%) |
| Information | 16 (26.2%) | 45 (73.8%) |
| Finance & Insurance | 111 (55.5%) | 89 (44.5%) |
| Real Estate, Rental & Leasing | 15 (100.0%) | 0 (0.0%) |
| Professional & Scientific | 192 (78.4%) | 53 (21.6%) |
| Enterprise Management | 37 (100.0%) | 0 (0.0%) |
| Administrative & Support | 0 (0.0%) | 61 (100.0%) |
| Educational Services | 19 (10.4%) | 163 (89.6%) |
| Health Care & Social Assistance | 179 (27.2%) | 479 (72.8%) |
| Arts, Entertainment & Recreation | 0 (0.0%) | 15 (100.0%) |
| Accommodation & Food Services | 18 (26.1%) | 51 (73.9%) |
| Public Administration | 186 (83.4%) | 37 (16.6%) |
| Total | 1,412 (47.0%) | 1,590 (53.0%) |
Education in Elko New Market
School Enrollment in Elko New Market
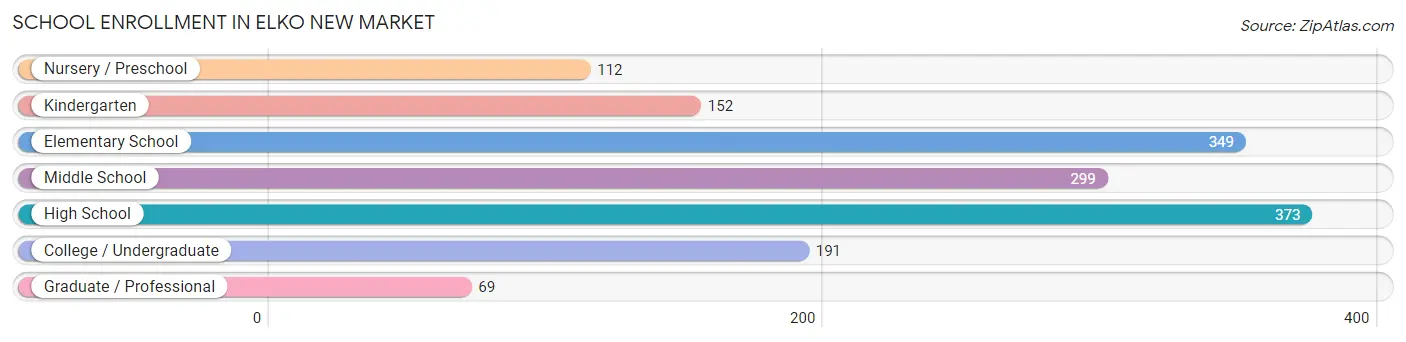
The most common levels of schooling among the 1,545 students in Elko New Market are high school (373 | 24.1%), elementary school (349 | 22.6%), and middle school (299 | 19.4%).
| School Level | # Students | % Students |
| Nursery / Preschool | 112 | 7.2% |
| Kindergarten | 152 | 9.8% |
| Elementary School | 349 | 22.6% |
| Middle School | 299 | 19.4% |
| High School | 373 | 24.1% |
| College / Undergraduate | 191 | 12.4% |
| Graduate / Professional | 69 | 4.5% |
| Total | 1,545 | 100.0% |
School Enrollment by Age by Funding Source in Elko New Market
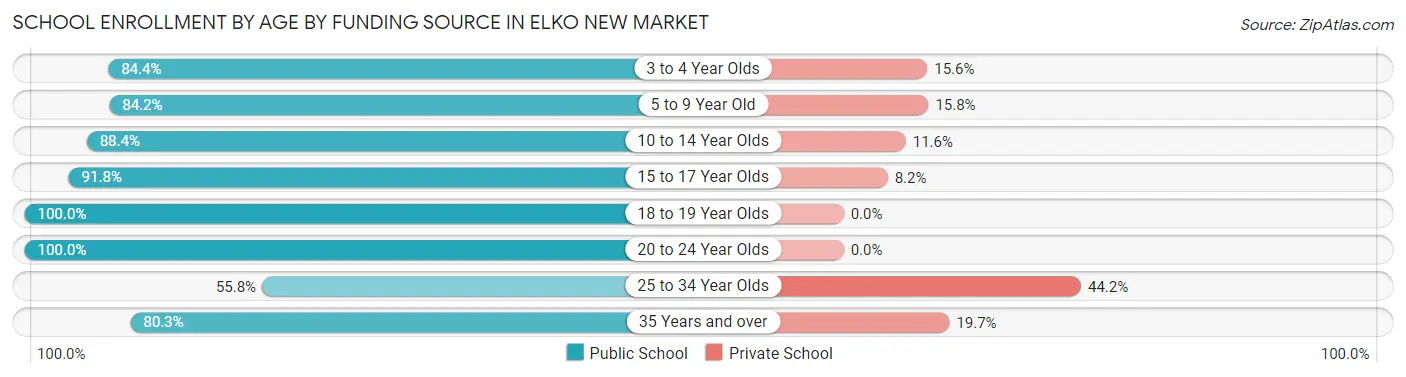
Out of a total of 1,545 students who are enrolled in schools in Elko New Market, 209 (13.5%) attend a private institution, while the remaining 1,336 (86.5%) are enrolled in public schools. The age group of 25 to 34 year olds has the highest likelihood of being enrolled in private schools, with 42 (44.2% in the age bracket) enrolled. Conversely, the age group of 18 to 19 year olds has the lowest likelihood of being enrolled in a private school, with 76 (100.0% in the age bracket) attending a public institution.
| Age Bracket | Public School | Private School |
| 3 to 4 Year Olds | 65 (84.4%) | 12 (15.6%) |
| 5 to 9 Year Old | 400 (84.2%) | 75 (15.8%) |
| 10 to 14 Year Olds | 344 (88.4%) | 45 (11.6%) |
| 15 to 17 Year Olds | 246 (91.8%) | 22 (8.2%) |
| 18 to 19 Year Olds | 76 (100.0%) | 0 (0.0%) |
| 20 to 24 Year Olds | 99 (100.0%) | 0 (0.0%) |
| 25 to 34 Year Olds | 53 (55.8%) | 42 (44.2%) |
| 35 Years and over | 53 (80.3%) | 13 (19.7%) |
| Total | 1,336 (86.5%) | 209 (13.5%) |
Educational Attainment by Field of Study in Elko New Market
Business (324 | 21.8%), education (191 | 12.8%), communications (157 | 10.5%), science & technology (155 | 10.4%), and social sciences (142 | 9.5%) are the most common fields of study among 1,489 individuals in Elko New Market who have obtained a bachelor's degree or higher.
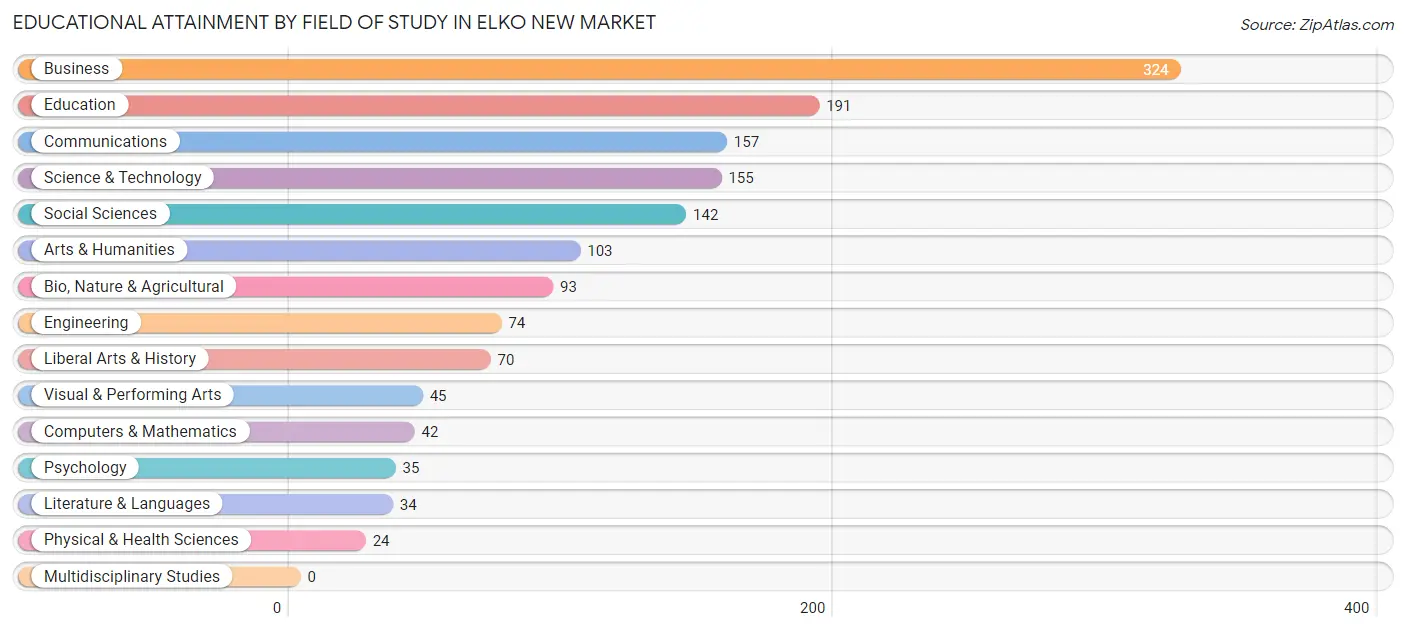
| Field of Study | # Graduates | % Graduates |
| Computers & Mathematics | 42 | 2.8% |
| Bio, Nature & Agricultural | 93 | 6.2% |
| Physical & Health Sciences | 24 | 1.6% |
| Psychology | 35 | 2.4% |
| Social Sciences | 142 | 9.5% |
| Engineering | 74 | 5.0% |
| Multidisciplinary Studies | 0 | 0.0% |
| Science & Technology | 155 | 10.4% |
| Business | 324 | 21.8% |
| Education | 191 | 12.8% |
| Literature & Languages | 34 | 2.3% |
| Liberal Arts & History | 70 | 4.7% |
| Visual & Performing Arts | 45 | 3.0% |
| Communications | 157 | 10.5% |
| Arts & Humanities | 103 | 6.9% |
| Total | 1,489 | 100.0% |
Transportation & Commute in Elko New Market
Vehicle Availability by Sex in Elko New Market
The most prevalent vehicle ownership categories in Elko New Market are males with 2 vehicles (842, accounting for 59.7%) and females with 2 vehicles (855, making up 53.6%).
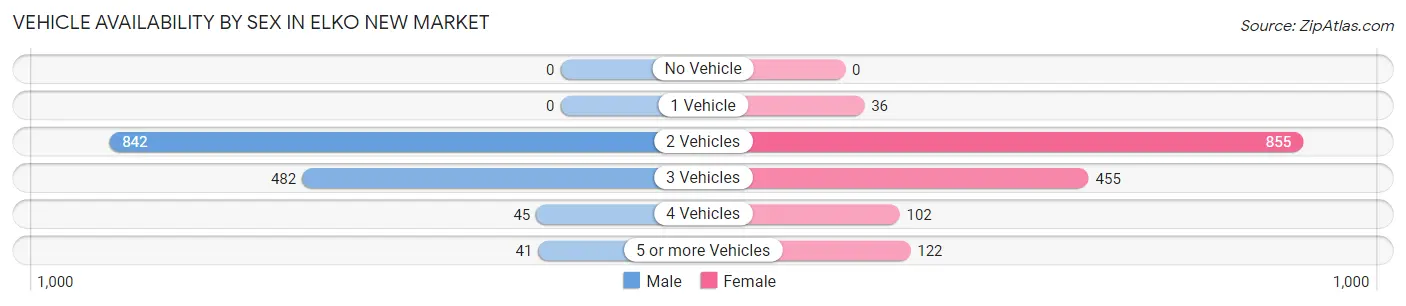
| Vehicles Available | Male | Female |
| No Vehicle | 0 (0.0%) | 0 (0.0%) |
| 1 Vehicle | 0 (0.0%) | 36 (2.3%) |
| 2 Vehicles | 842 (59.7%) | 855 (54.5%) |
| 3 Vehicles | 482 (34.2%) | 455 (29.0%) |
| 4 Vehicles | 45 (3.2%) | 102 (6.5%) |
| 5 or more Vehicles | 41 (2.9%) | 122 (7.8%) |
| Total | 1,410 (100.0%) | 1,570 (100.0%) |
Commute Time in Elko New Market
The most frequently occuring commute durations in Elko New Market are 30 to 34 minutes (597 commuters, 24.6%), 45 to 59 minutes (366 commuters, 15.1%), and 20 to 24 minutes (305 commuters, 12.6%).
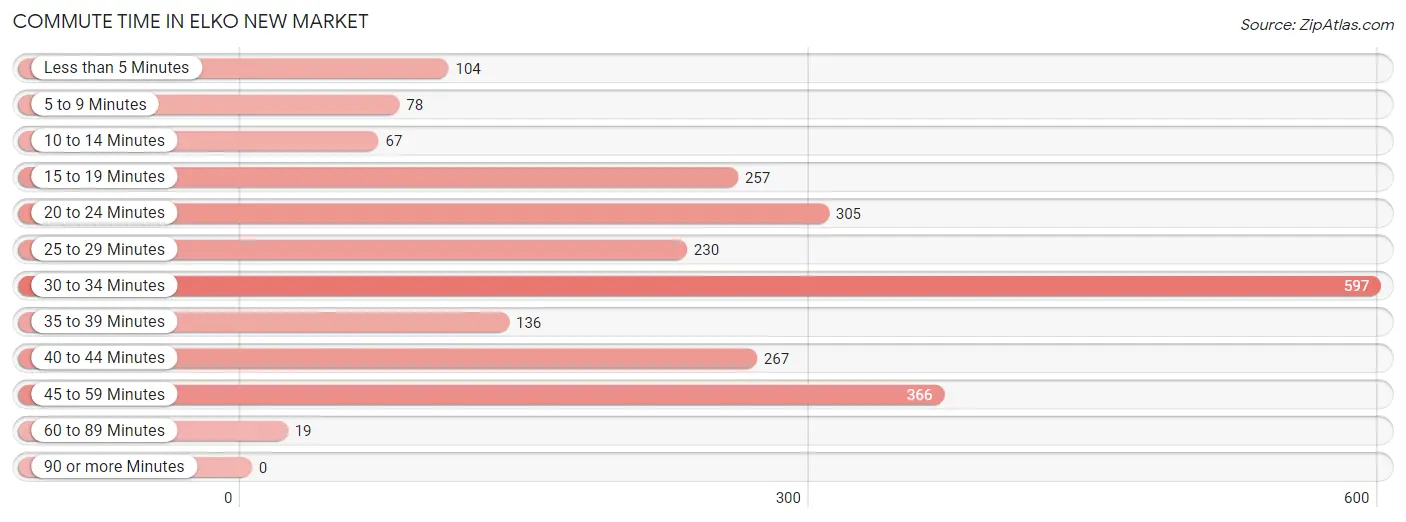
| Commute Time | # Commuters | % Commuters |
| Less than 5 Minutes | 104 | 4.3% |
| 5 to 9 Minutes | 78 | 3.2% |
| 10 to 14 Minutes | 67 | 2.8% |
| 15 to 19 Minutes | 257 | 10.6% |
| 20 to 24 Minutes | 305 | 12.6% |
| 25 to 29 Minutes | 230 | 9.5% |
| 30 to 34 Minutes | 597 | 24.6% |
| 35 to 39 Minutes | 136 | 5.6% |
| 40 to 44 Minutes | 267 | 11.0% |
| 45 to 59 Minutes | 366 | 15.1% |
| 60 to 89 Minutes | 19 | 0.8% |
| 90 or more Minutes | 0 | 0.0% |
Commute Time by Sex in Elko New Market
The most common commute times in Elko New Market are 30 to 34 minutes (336 commuters, 28.0%) for males and 30 to 34 minutes (261 commuters, 21.3%) for females.
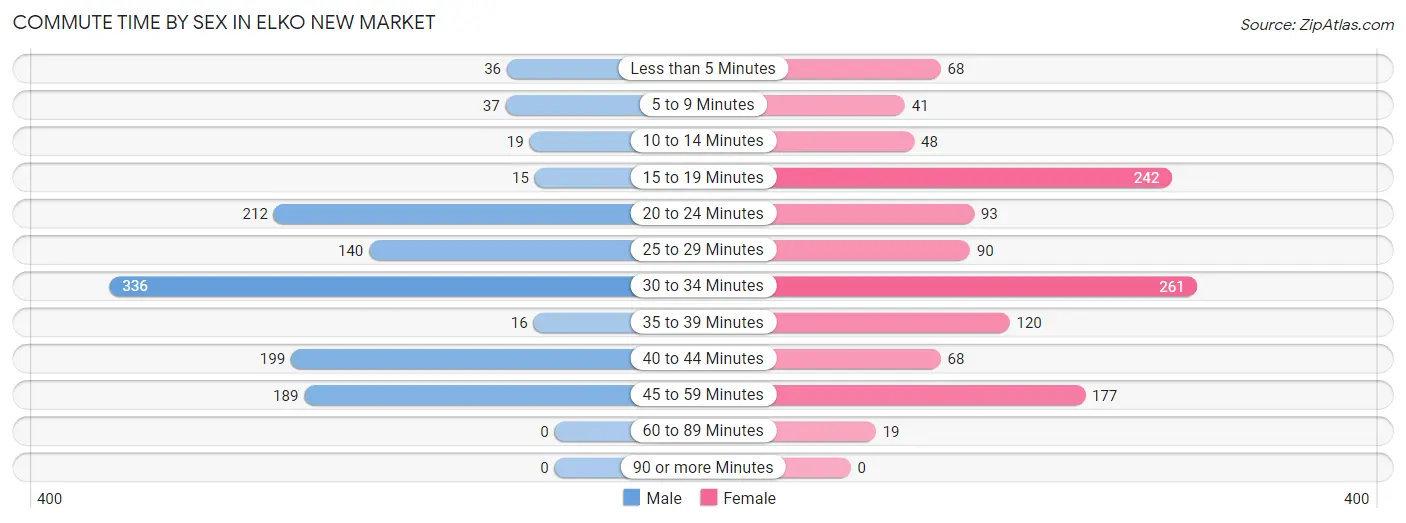
| Commute Time | Male | Female |
| Less than 5 Minutes | 36 (3.0%) | 68 (5.5%) |
| 5 to 9 Minutes | 37 (3.1%) | 41 (3.3%) |
| 10 to 14 Minutes | 19 (1.6%) | 48 (3.9%) |
| 15 to 19 Minutes | 15 (1.3%) | 242 (19.7%) |
| 20 to 24 Minutes | 212 (17.7%) | 93 (7.6%) |
| 25 to 29 Minutes | 140 (11.7%) | 90 (7.3%) |
| 30 to 34 Minutes | 336 (28.0%) | 261 (21.3%) |
| 35 to 39 Minutes | 16 (1.3%) | 120 (9.8%) |
| 40 to 44 Minutes | 199 (16.6%) | 68 (5.5%) |
| 45 to 59 Minutes | 189 (15.8%) | 177 (14.4%) |
| 60 to 89 Minutes | 0 (0.0%) | 19 (1.5%) |
| 90 or more Minutes | 0 (0.0%) | 0 (0.0%) |
Time of Departure to Work by Sex in Elko New Market
The most frequent times of departure to work in Elko New Market are 6:30 AM to 6:59 AM (239, 19.9%) for males and 6:30 AM to 6:59 AM (252, 20.5%) for females.
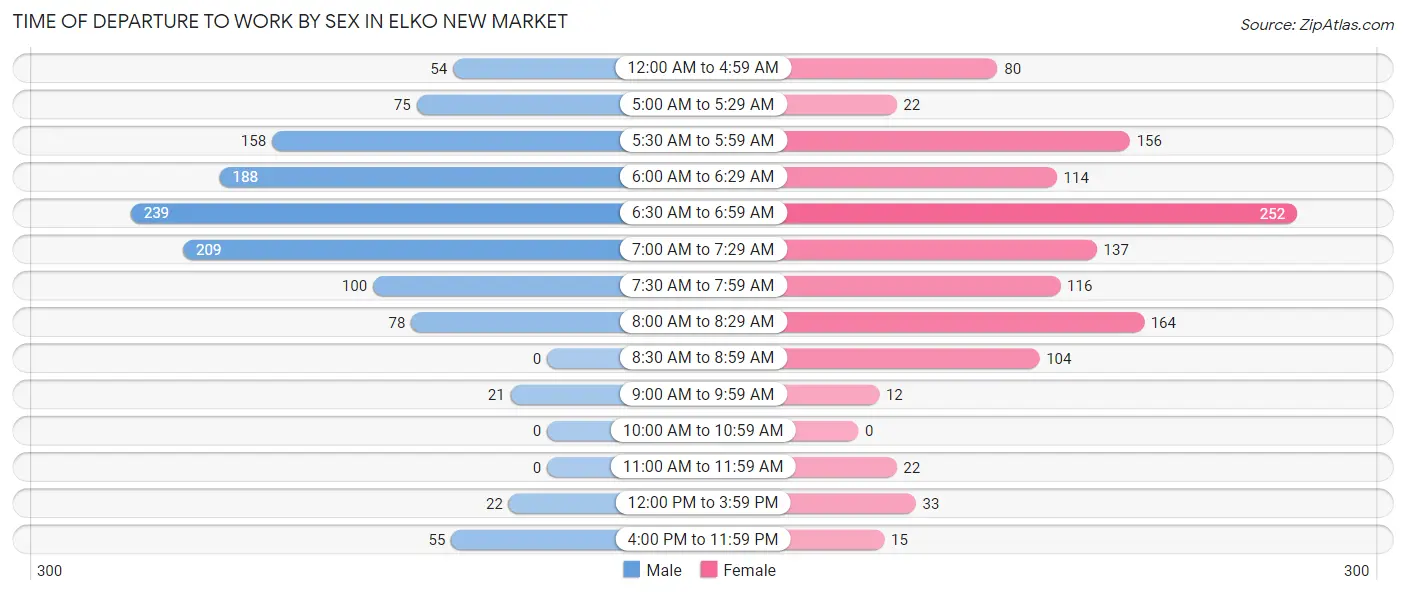
| Time of Departure | Male | Female |
| 12:00 AM to 4:59 AM | 54 (4.5%) | 80 (6.5%) |
| 5:00 AM to 5:29 AM | 75 (6.3%) | 22 (1.8%) |
| 5:30 AM to 5:59 AM | 158 (13.2%) | 156 (12.7%) |
| 6:00 AM to 6:29 AM | 188 (15.7%) | 114 (9.3%) |
| 6:30 AM to 6:59 AM | 239 (19.9%) | 252 (20.5%) |
| 7:00 AM to 7:29 AM | 209 (17.4%) | 137 (11.2%) |
| 7:30 AM to 7:59 AM | 100 (8.3%) | 116 (9.5%) |
| 8:00 AM to 8:29 AM | 78 (6.5%) | 164 (13.4%) |
| 8:30 AM to 8:59 AM | 0 (0.0%) | 104 (8.5%) |
| 9:00 AM to 9:59 AM | 21 (1.8%) | 12 (1.0%) |
| 10:00 AM to 10:59 AM | 0 (0.0%) | 0 (0.0%) |
| 11:00 AM to 11:59 AM | 0 (0.0%) | 22 (1.8%) |
| 12:00 PM to 3:59 PM | 22 (1.8%) | 33 (2.7%) |
| 4:00 PM to 11:59 PM | 55 (4.6%) | 15 (1.2%) |
| Total | 1,199 (100.0%) | 1,227 (100.0%) |
Housing Occupancy in Elko New Market
Occupancy by Ownership in Elko New Market
Of the total 1,490 dwellings in Elko New Market, owner-occupied units account for 1,351 (90.7%), while renter-occupied units make up 139 (9.3%).
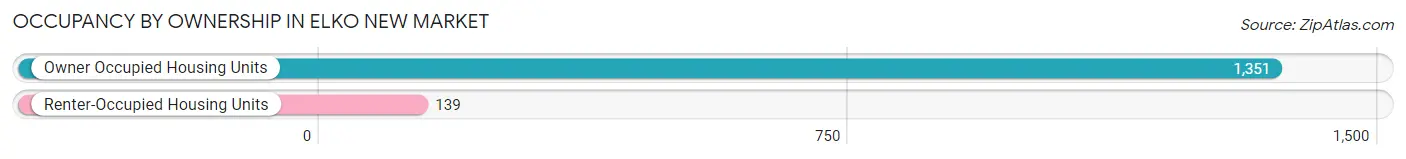
| Occupancy | # Housing Units | % Housing Units |
| Owner Occupied Housing Units | 1,351 | 90.7% |
| Renter-Occupied Housing Units | 139 | 9.3% |
| Total Occupied Housing Units | 1,490 | 100.0% |
Occupancy by Household Size in Elko New Market
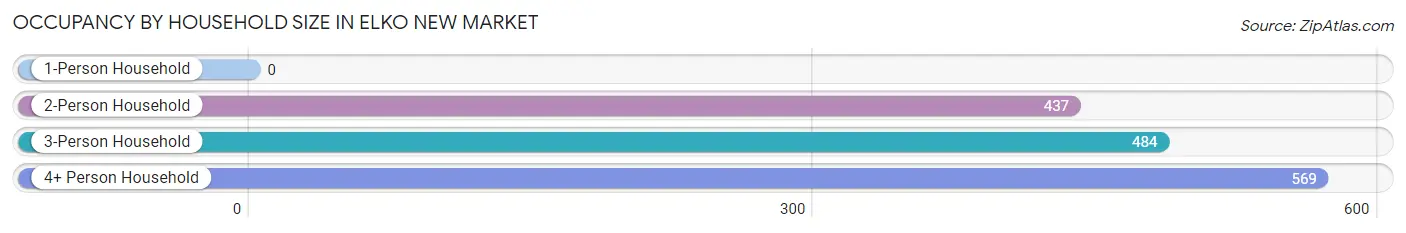
| Household Size | # Housing Units | % Housing Units |
| 1-Person Household | 0 | 0.0% |
| 2-Person Household | 437 | 29.3% |
| 3-Person Household | 484 | 32.5% |
| 4+ Person Household | 569 | 38.2% |
| Total Housing Units | 1,490 | 100.0% |
Occupancy by Ownership by Household Size in Elko New Market
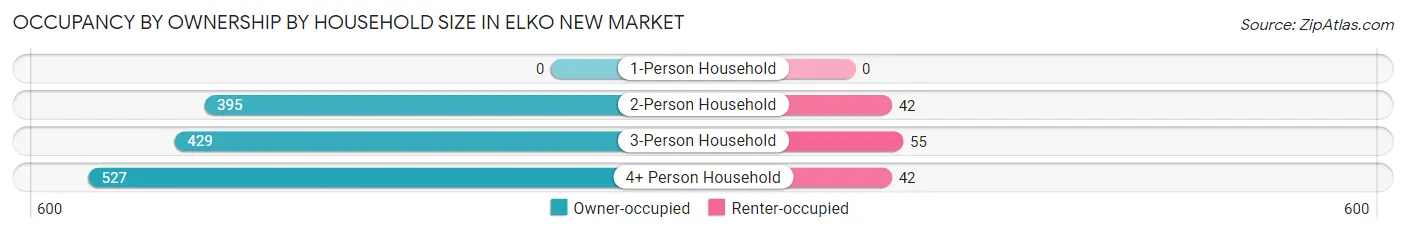
| Household Size | Owner-occupied | Renter-occupied |
| 1-Person Household | 0 (0.0%) | 0 (0.0%) |
| 2-Person Household | 395 (90.4%) | 42 (9.6%) |
| 3-Person Household | 429 (88.6%) | 55 (11.4%) |
| 4+ Person Household | 527 (92.6%) | 42 (7.4%) |
| Total Housing Units | 1,351 (90.7%) | 139 (9.3%) |
Occupancy by Educational Attainment in Elko New Market
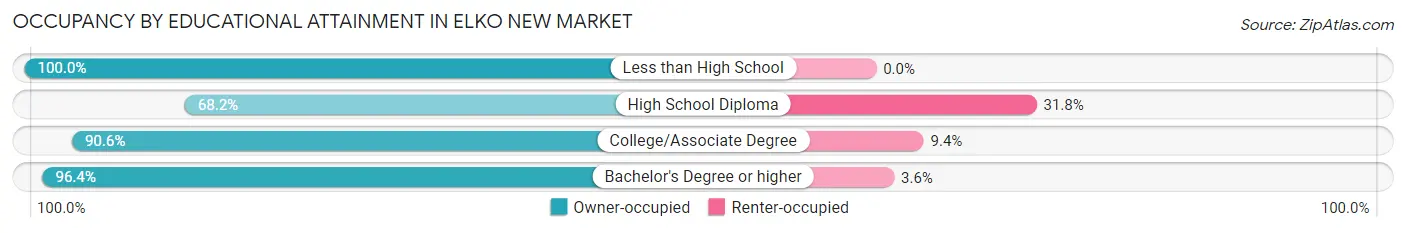
| Household Size | Owner-occupied | Renter-occupied |
| Less than High School | 22 (100.0%) | 0 (0.0%) |
| High School Diploma | 118 (68.2%) | 55 (31.8%) |
| College/Associate Degree | 588 (90.6%) | 61 (9.4%) |
| Bachelor's Degree or higher | 623 (96.4%) | 23 (3.6%) |
Occupancy by Age of Householder in Elko New Market
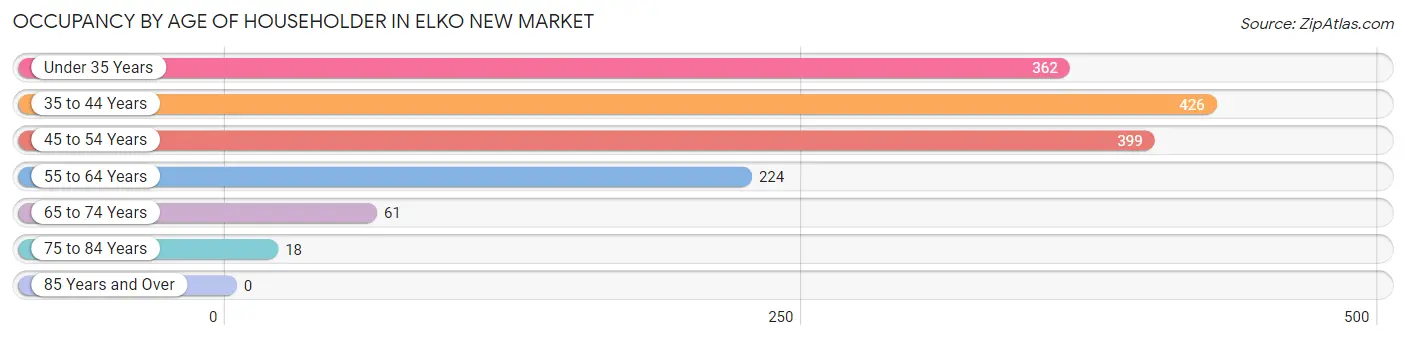
| Age Bracket | # Households | % Households |
| Under 35 Years | 362 | 24.3% |
| 35 to 44 Years | 426 | 28.6% |
| 45 to 54 Years | 399 | 26.8% |
| 55 to 64 Years | 224 | 15.0% |
| 65 to 74 Years | 61 | 4.1% |
| 75 to 84 Years | 18 | 1.2% |
| 85 Years and Over | 0 | 0.0% |
| Total | 1,490 | 100.0% |
Housing Finances in Elko New Market
Median Income by Occupancy in Elko New Market
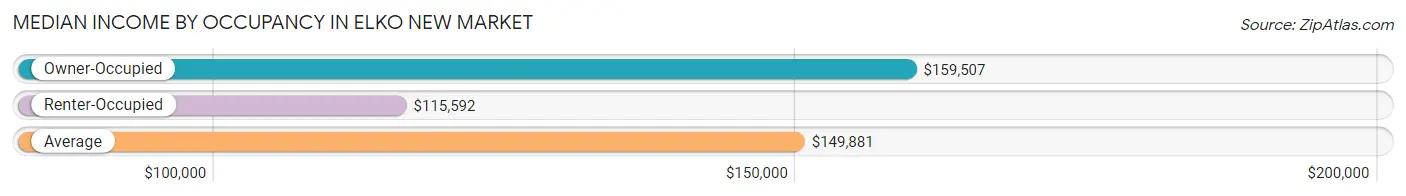
| Occupancy Type | # Households | Median Income |
| Owner-Occupied | 1,351 (90.7%) | $159,507 |
| Renter-Occupied | 139 (9.3%) | $115,592 |
| Average | 1,490 (100.0%) | $149,881 |
Occupancy by Householder Income Bracket in Elko New Market
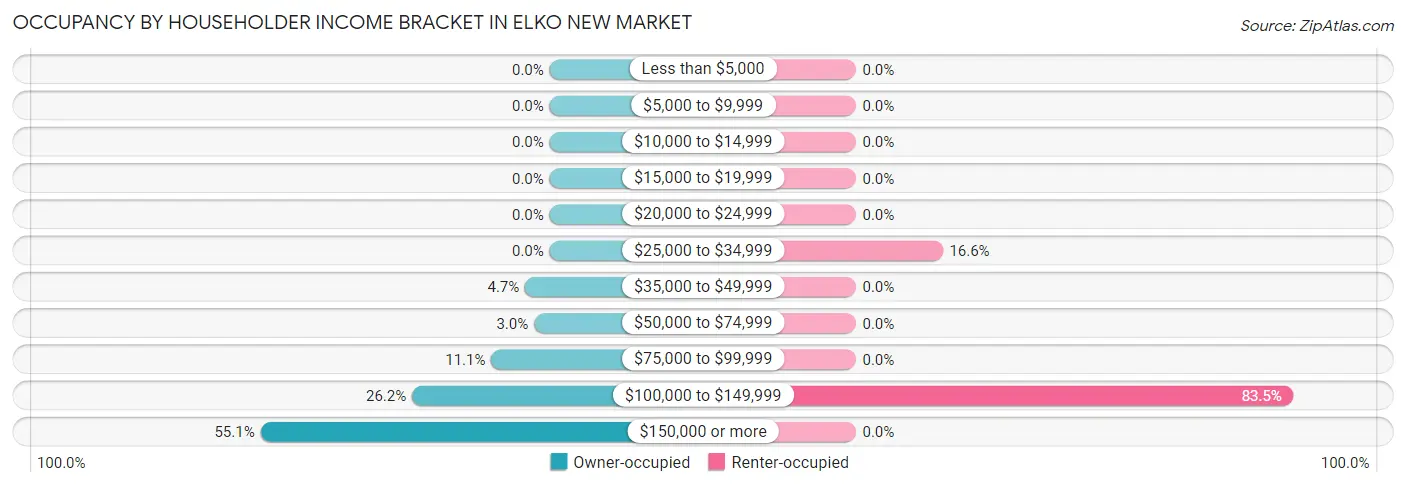
| Income Bracket | Owner-occupied | Renter-occupied |
| Less than $5,000 | 0 (0.0%) | 0 (0.0%) |
| $5,000 to $9,999 | 0 (0.0%) | 0 (0.0%) |
| $10,000 to $14,999 | 0 (0.0%) | 0 (0.0%) |
| $15,000 to $19,999 | 0 (0.0%) | 0 (0.0%) |
| $20,000 to $24,999 | 0 (0.0%) | 0 (0.0%) |
| $25,000 to $34,999 | 0 (0.0%) | 23 (16.6%) |
| $35,000 to $49,999 | 63 (4.7%) | 0 (0.0%) |
| $50,000 to $74,999 | 40 (3.0%) | 0 (0.0%) |
| $75,000 to $99,999 | 150 (11.1%) | 0 (0.0%) |
| $100,000 to $149,999 | 354 (26.2%) | 116 (83.5%) |
| $150,000 or more | 744 (55.1%) | 0 (0.0%) |
| Total | 1,351 (100.0%) | 139 (100.0%) |
Monthly Housing Cost Tiers in Elko New Market
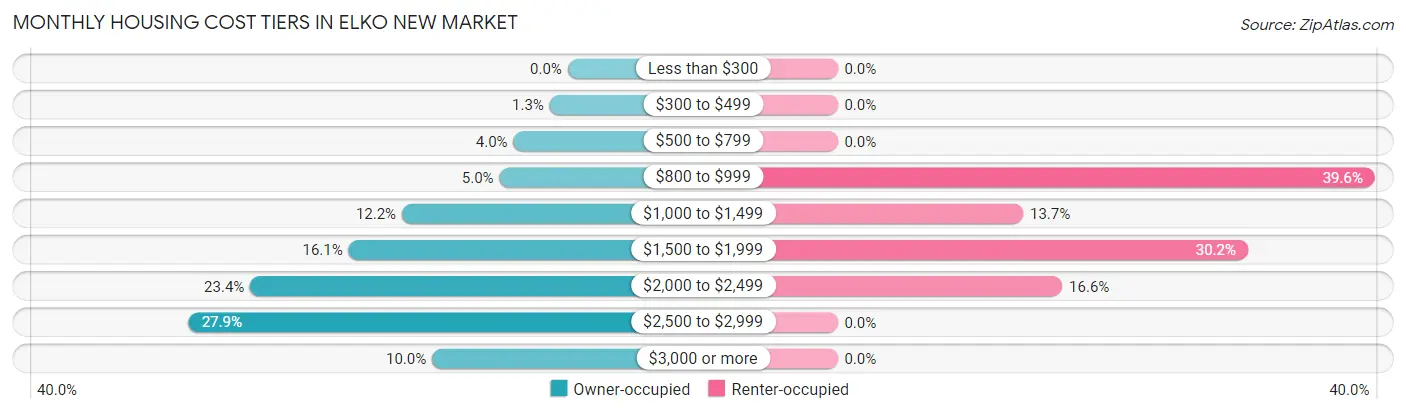
| Monthly Cost | Owner-occupied | Renter-occupied |
| Less than $300 | 0 (0.0%) | 0 (0.0%) |
| $300 to $499 | 18 (1.3%) | 0 (0.0%) |
| $500 to $799 | 54 (4.0%) | 0 (0.0%) |
| $800 to $999 | 68 (5.0%) | 55 (39.6%) |
| $1,000 to $1,499 | 165 (12.2%) | 19 (13.7%) |
| $1,500 to $1,999 | 218 (16.1%) | 42 (30.2%) |
| $2,000 to $2,499 | 316 (23.4%) | 23 (16.6%) |
| $2,500 to $2,999 | 377 (27.9%) | 0 (0.0%) |
| $3,000 or more | 135 (10.0%) | 0 (0.0%) |
| Total | 1,351 (100.0%) | 139 (100.0%) |
Physical Housing Characteristics in Elko New Market
Housing Structures in Elko New Market
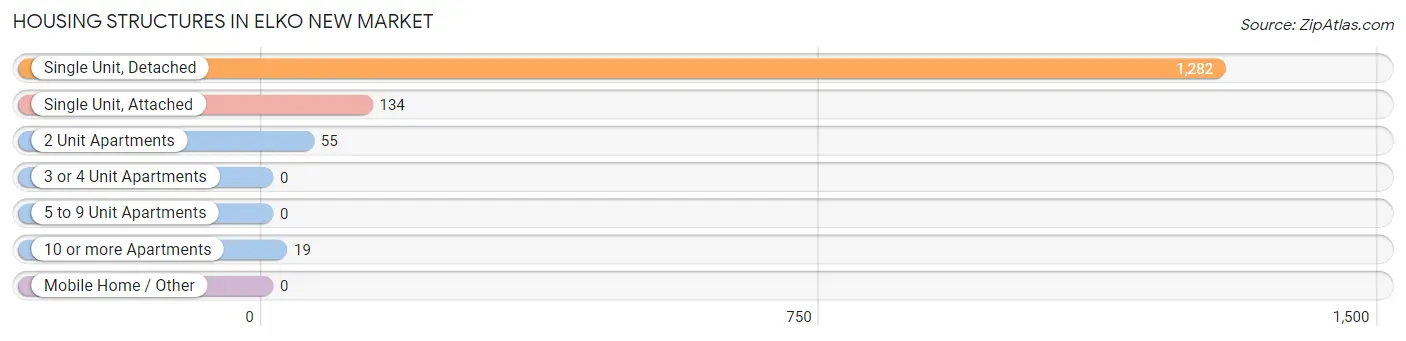
| Structure Type | # Housing Units | % Housing Units |
| Single Unit, Detached | 1,282 | 86.0% |
| Single Unit, Attached | 134 | 9.0% |
| 2 Unit Apartments | 55 | 3.7% |
| 3 or 4 Unit Apartments | 0 | 0.0% |
| 5 to 9 Unit Apartments | 0 | 0.0% |
| 10 or more Apartments | 19 | 1.3% |
| Mobile Home / Other | 0 | 0.0% |
| Total | 1,490 | 100.0% |
Housing Structures by Occupancy in Elko New Market
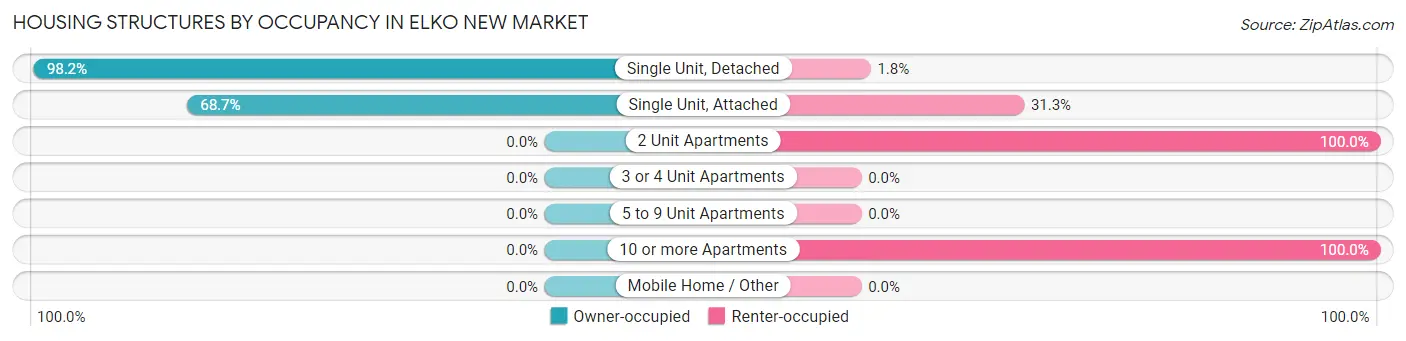
| Structure Type | Owner-occupied | Renter-occupied |
| Single Unit, Detached | 1,259 (98.2%) | 23 (1.8%) |
| Single Unit, Attached | 92 (68.7%) | 42 (31.3%) |
| 2 Unit Apartments | 0 (0.0%) | 55 (100.0%) |
| 3 or 4 Unit Apartments | 0 (0.0%) | 0 (0.0%) |
| 5 to 9 Unit Apartments | 0 (0.0%) | 0 (0.0%) |
| 10 or more Apartments | 0 (0.0%) | 19 (100.0%) |
| Mobile Home / Other | 0 (0.0%) | 0 (0.0%) |
| Total | 1,351 (90.7%) | 139 (9.3%) |
Housing Structures by Number of Rooms in Elko New Market
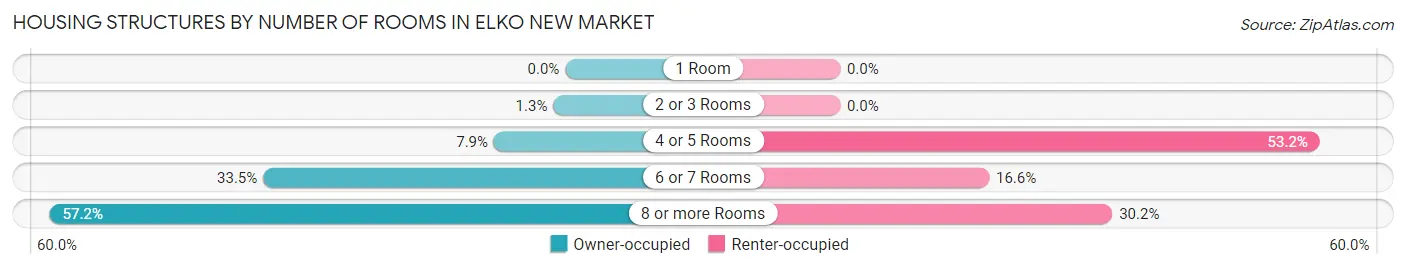
| Number of Rooms | Owner-occupied | Renter-occupied |
| 1 Room | 0 (0.0%) | 0 (0.0%) |
| 2 or 3 Rooms | 18 (1.3%) | 0 (0.0%) |
| 4 or 5 Rooms | 107 (7.9%) | 74 (53.2%) |
| 6 or 7 Rooms | 453 (33.5%) | 23 (16.6%) |
| 8 or more Rooms | 773 (57.2%) | 42 (30.2%) |
| Total | 1,351 (100.0%) | 139 (100.0%) |
Housing Structure by Heating Type in Elko New Market
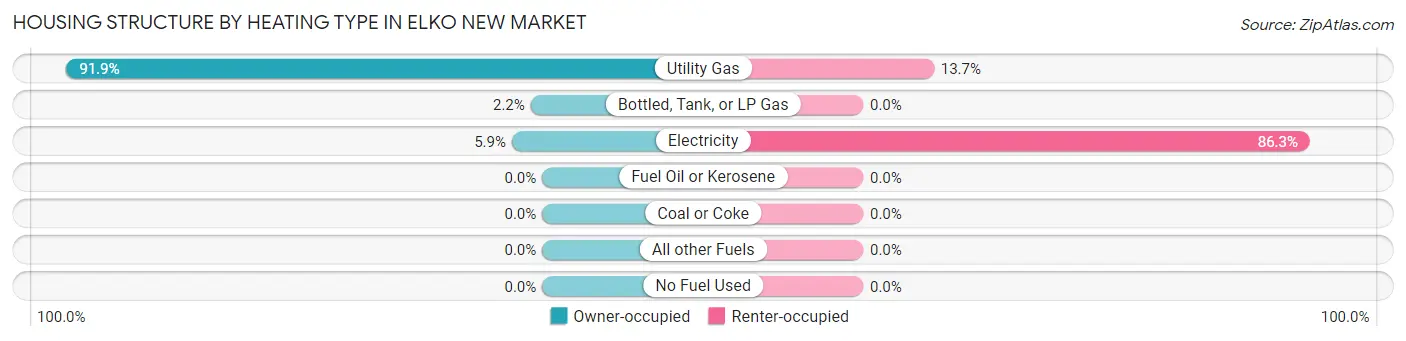
| Heating Type | Owner-occupied | Renter-occupied |
| Utility Gas | 1,242 (91.9%) | 19 (13.7%) |
| Bottled, Tank, or LP Gas | 30 (2.2%) | 0 (0.0%) |
| Electricity | 79 (5.9%) | 120 (86.3%) |
| Fuel Oil or Kerosene | 0 (0.0%) | 0 (0.0%) |
| Coal or Coke | 0 (0.0%) | 0 (0.0%) |
| All other Fuels | 0 (0.0%) | 0 (0.0%) |
| No Fuel Used | 0 (0.0%) | 0 (0.0%) |
| Total | 1,351 (100.0%) | 139 (100.0%) |
Household Vehicle Usage in Elko New Market
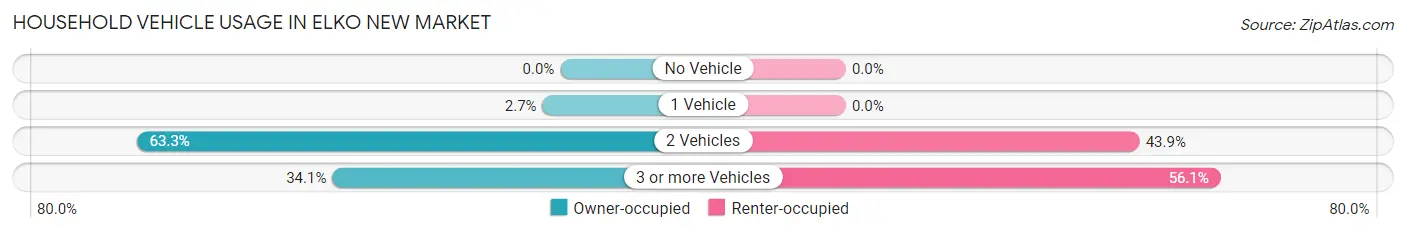
| Vehicles per Household | Owner-occupied | Renter-occupied |
| No Vehicle | 0 (0.0%) | 0 (0.0%) |
| 1 Vehicle | 36 (2.7%) | 0 (0.0%) |
| 2 Vehicles | 855 (63.3%) | 61 (43.9%) |
| 3 or more Vehicles | 460 (34.1%) | 78 (56.1%) |
| Total | 1,351 (100.0%) | 139 (100.0%) |
Real Estate & Mortgages in Elko New Market
Real Estate and Mortgage Overview in Elko New Market
| Characteristic | Without Mortgage | With Mortgage |
| Housing Units | 201 | 1,150 |
| Median Property Value | $361,700 | $385,700 |
| Median Household Income | $129,554 | $664 |
| Monthly Housing Costs | $942 | $135 |
| Real Estate Taxes | $4,520 | $0 |
Property Value by Mortgage Status in Elko New Market
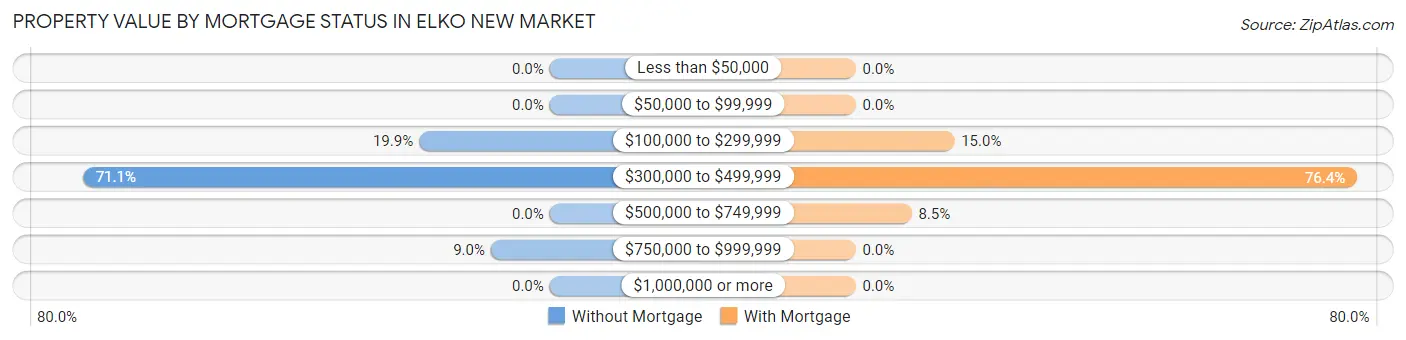
| Property Value | Without Mortgage | With Mortgage |
| Less than $50,000 | 0 (0.0%) | 0 (0.0%) |
| $50,000 to $99,999 | 0 (0.0%) | 0 (0.0%) |
| $100,000 to $299,999 | 40 (19.9%) | 173 (15.0%) |
| $300,000 to $499,999 | 143 (71.1%) | 879 (76.4%) |
| $500,000 to $749,999 | 0 (0.0%) | 98 (8.5%) |
| $750,000 to $999,999 | 18 (9.0%) | 0 (0.0%) |
| $1,000,000 or more | 0 (0.0%) | 0 (0.0%) |
| Total | 201 (100.0%) | 1,150 (100.0%) |
Household Income by Mortgage Status in Elko New Market
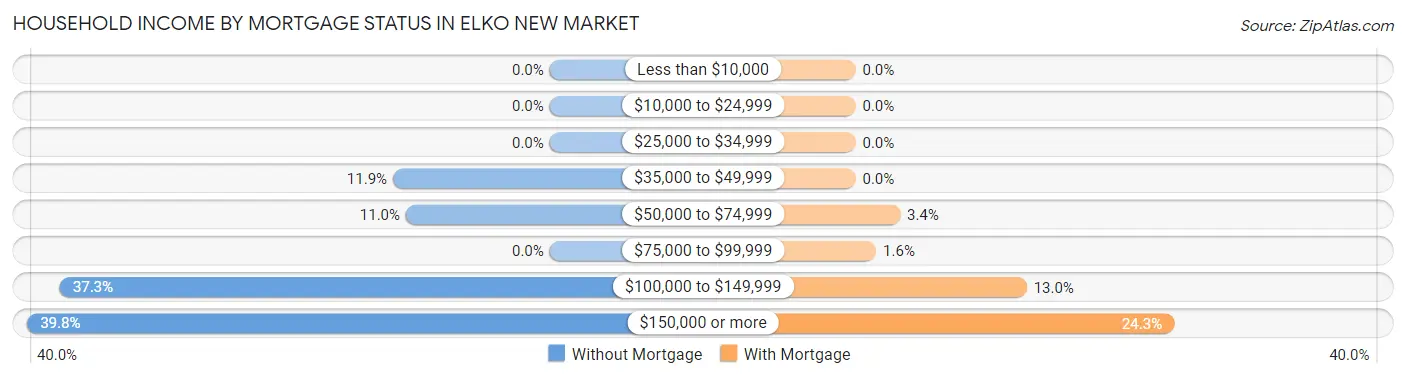
| Household Income | Without Mortgage | With Mortgage |
| Less than $10,000 | 0 (0.0%) | 0 (0.0%) |
| $10,000 to $24,999 | 0 (0.0%) | 0 (0.0%) |
| $25,000 to $34,999 | 0 (0.0%) | 0 (0.0%) |
| $35,000 to $49,999 | 24 (11.9%) | 0 (0.0%) |
| $50,000 to $74,999 | 22 (11.0%) | 39 (3.4%) |
| $75,000 to $99,999 | 0 (0.0%) | 18 (1.6%) |
| $100,000 to $149,999 | 75 (37.3%) | 150 (13.0%) |
| $150,000 or more | 80 (39.8%) | 279 (24.3%) |
| Total | 201 (100.0%) | 1,150 (100.0%) |
Property Value to Household Income Ratio in Elko New Market
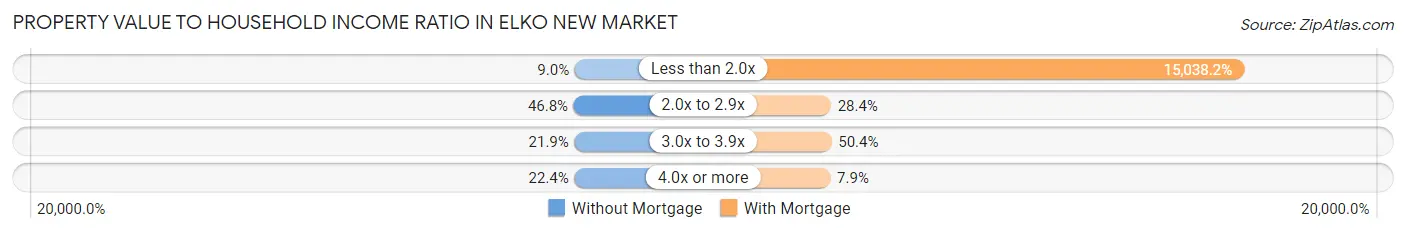
| Value-to-Income Ratio | Without Mortgage | With Mortgage |
| Less than 2.0x | 18 (9.0%) | 172,939 (15,038.2%) |
| 2.0x to 2.9x | 94 (46.8%) | 326 (28.3%) |
| 3.0x to 3.9x | 44 (21.9%) | 579 (50.3%) |
| 4.0x or more | 45 (22.4%) | 91 (7.9%) |
| Total | 201 (100.0%) | 1,150 (100.0%) |
Real Estate Taxes by Mortgage Status in Elko New Market
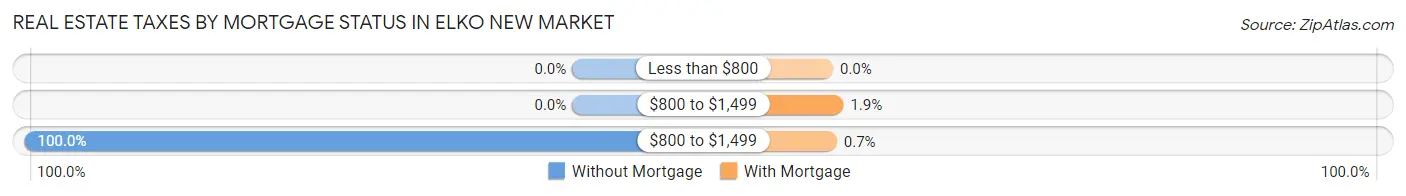
| Property Taxes | Without Mortgage | With Mortgage |
| Less than $800 | 0 (0.0%) | 0 (0.0%) |
| $800 to $1,499 | 0 (0.0%) | 22 (1.9%) |
| $800 to $1,499 | 201 (100.0%) | 8 (0.7%) |
| Total | 201 (100.0%) | 1,150 (100.0%) |
Health & Disability in Elko New Market
Health Insurance Coverage by Age in Elko New Market
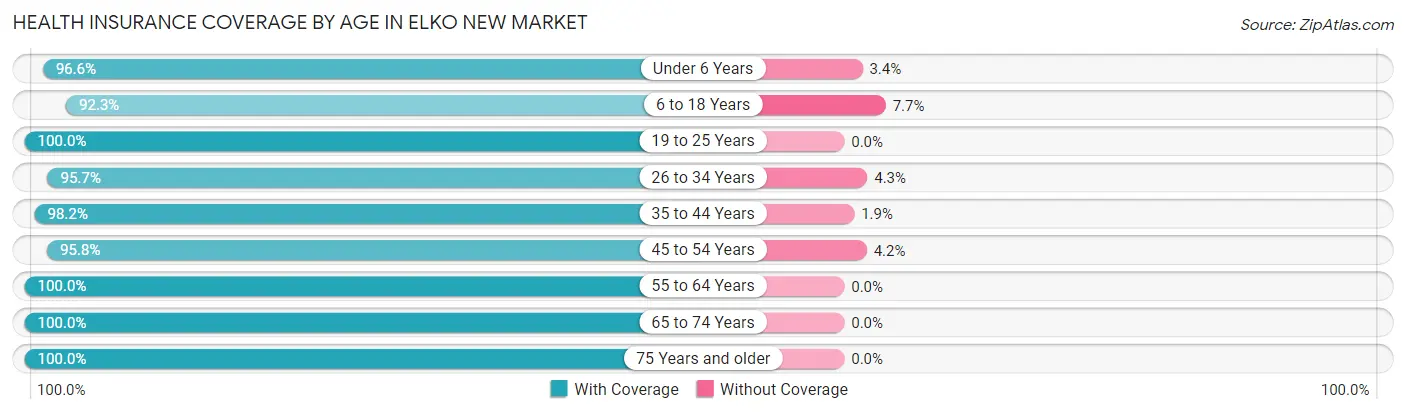
| Age Bracket | With Coverage | Without Coverage |
| Under 6 Years | 456 (96.6%) | 16 (3.4%) |
| 6 to 18 Years | 1,064 (92.3%) | 89 (7.7%) |
| 19 to 25 Years | 171 (100.0%) | 0 (0.0%) |
| 26 to 34 Years | 759 (95.7%) | 34 (4.3%) |
| 35 to 44 Years | 794 (98.2%) | 15 (1.8%) |
| 45 to 54 Years | 756 (95.8%) | 33 (4.2%) |
| 55 to 64 Years | 548 (100.0%) | 0 (0.0%) |
| 65 to 74 Years | 97 (100.0%) | 0 (0.0%) |
| 75 Years and older | 18 (100.0%) | 0 (0.0%) |
| Total | 4,663 (96.1%) | 187 (3.9%) |
Health Insurance Coverage by Citizenship Status in Elko New Market
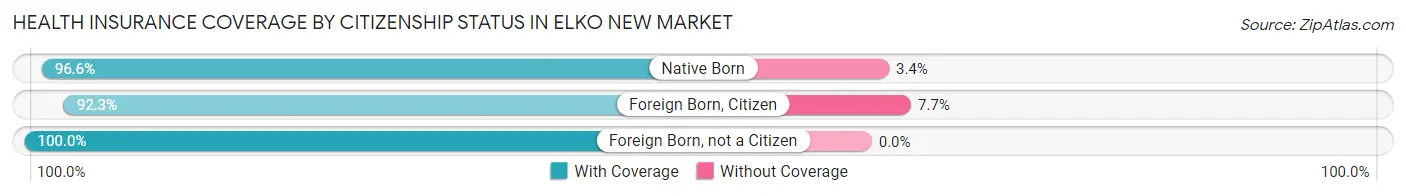
| Citizenship Status | With Coverage | Without Coverage |
| Native Born | 456 (96.6%) | 16 (3.4%) |
| Foreign Born, Citizen | 1,064 (92.3%) | 89 (7.7%) |
| Foreign Born, not a Citizen | 171 (100.0%) | 0 (0.0%) |
Health Insurance Coverage by Household Income in Elko New Market
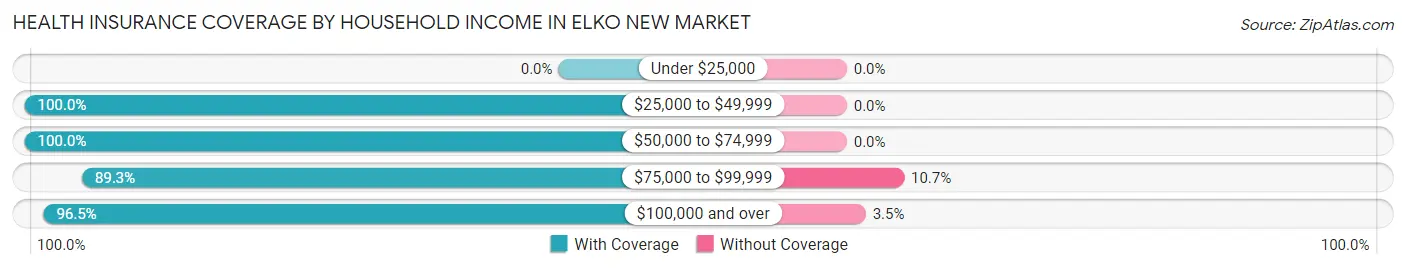
| Household Income | With Coverage | Without Coverage |
| Under $25,000 | 0 (0.0%) | 0 (0.0%) |
| $25,000 to $49,999 | 297 (100.0%) | 0 (0.0%) |
| $50,000 to $74,999 | 101 (100.0%) | 0 (0.0%) |
| $75,000 to $99,999 | 366 (89.3%) | 44 (10.7%) |
| $100,000 and over | 3,895 (96.5%) | 143 (3.5%) |
Public vs Private Health Insurance Coverage by Age in Elko New Market
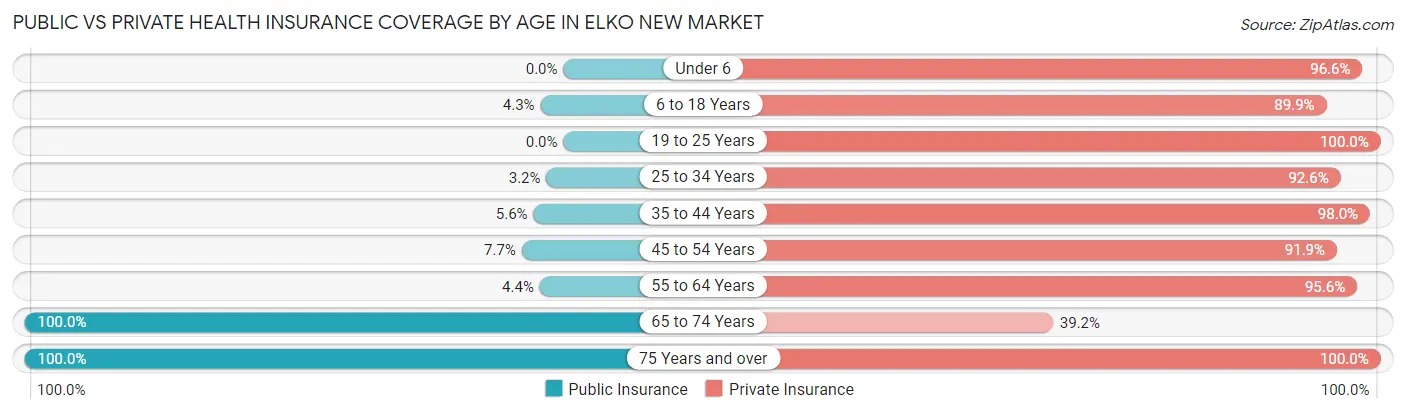
| Age Bracket | Public Insurance | Private Insurance |
| Under 6 | 0 (0.0%) | 456 (96.6%) |
| 6 to 18 Years | 49 (4.3%) | 1,037 (89.9%) |
| 19 to 25 Years | 0 (0.0%) | 171 (100.0%) |
| 25 to 34 Years | 25 (3.2%) | 734 (92.6%) |
| 35 to 44 Years | 45 (5.6%) | 793 (98.0%) |
| 45 to 54 Years | 61 (7.7%) | 725 (91.9%) |
| 55 to 64 Years | 24 (4.4%) | 524 (95.6%) |
| 65 to 74 Years | 97 (100.0%) | 38 (39.2%) |
| 75 Years and over | 18 (100.0%) | 18 (100.0%) |
| Total | 319 (6.6%) | 4,496 (92.7%) |
Disability Status by Sex by Age in Elko New Market
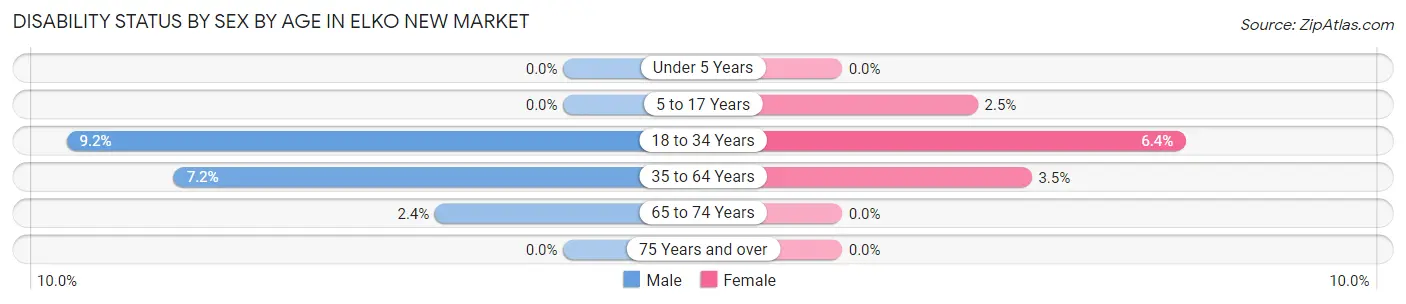
| Age Bracket | Male | Female |
| Under 5 Years | 0 (0.0%) | 0 (0.0%) |
| 5 to 17 Years | 0 (0.0%) | 14 (2.5%) |
| 18 to 34 Years | 38 (9.2%) | 40 (6.4%) |
| 35 to 64 Years | 77 (7.2%) | 38 (3.5%) |
| 65 to 74 Years | 1 (2.4%) | 0 (0.0%) |
| 75 Years and over | 0 (0.0%) | 0 (0.0%) |
Disability Class by Sex by Age in Elko New Market
Disability Class: Hearing Difficulty
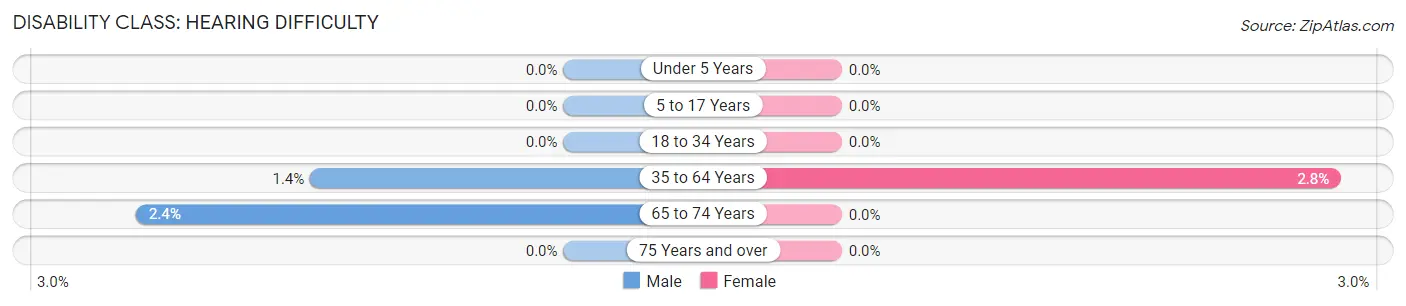
| Age Bracket | Male | Female |
| Under 5 Years | 0 (0.0%) | 0 (0.0%) |
| 5 to 17 Years | 0 (0.0%) | 0 (0.0%) |
| 18 to 34 Years | 0 (0.0%) | 0 (0.0%) |
| 35 to 64 Years | 15 (1.4%) | 30 (2.8%) |
| 65 to 74 Years | 1 (2.4%) | 0 (0.0%) |
| 75 Years and over | 0 (0.0%) | 0 (0.0%) |
Disability Class: Vision Difficulty
| Age Bracket | Male | Female |
| Under 5 Years | 0 (0.0%) | 0 (0.0%) |
| 5 to 17 Years | 0 (0.0%) | 0 (0.0%) |
| 18 to 34 Years | 0 (0.0%) | 0 (0.0%) |
| 35 to 64 Years | 0 (0.0%) | 0 (0.0%) |
| 65 to 74 Years | 0 (0.0%) | 0 (0.0%) |
| 75 Years and over | 0 (0.0%) | 0 (0.0%) |
Disability Class: Cognitive Difficulty
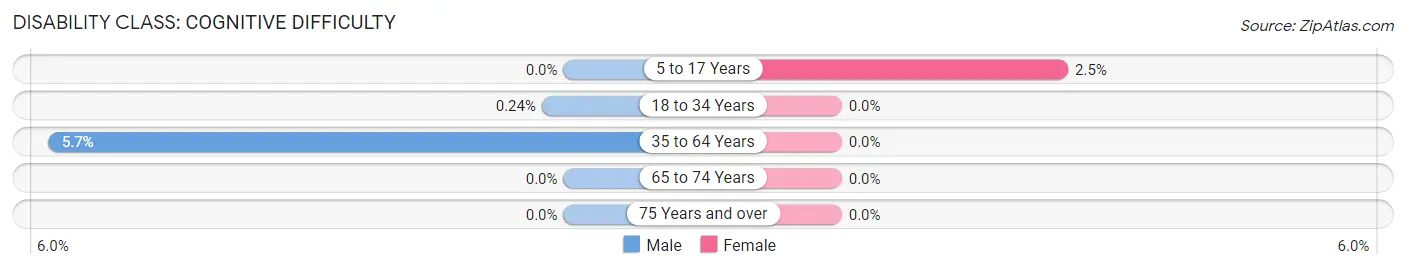
| Age Bracket | Male | Female |
| 5 to 17 Years | 0 (0.0%) | 14 (2.5%) |
| 18 to 34 Years | 1 (0.2%) | 0 (0.0%) |
| 35 to 64 Years | 61 (5.7%) | 0 (0.0%) |
| 65 to 74 Years | 0 (0.0%) | 0 (0.0%) |
| 75 Years and over | 0 (0.0%) | 0 (0.0%) |
Disability Class: Ambulatory Difficulty
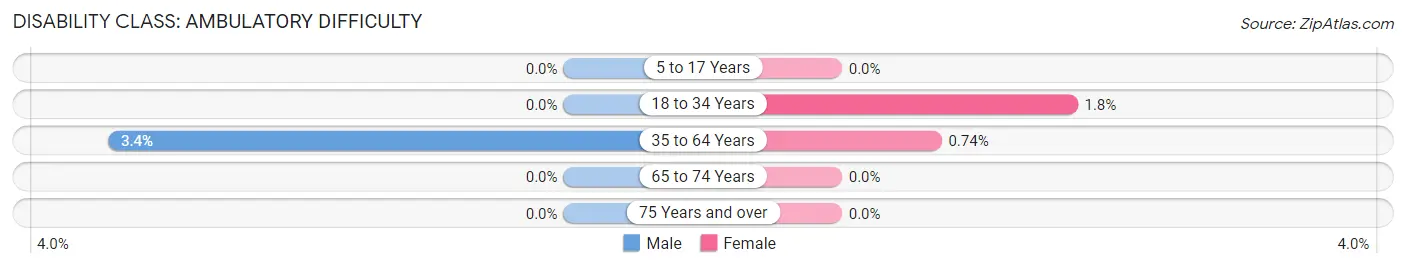
| Age Bracket | Male | Female |
| 5 to 17 Years | 0 (0.0%) | 0 (0.0%) |
| 18 to 34 Years | 0 (0.0%) | 11 (1.8%) |
| 35 to 64 Years | 36 (3.4%) | 8 (0.7%) |
| 65 to 74 Years | 0 (0.0%) | 0 (0.0%) |
| 75 Years and over | 0 (0.0%) | 0 (0.0%) |
Disability Class: Self-Care Difficulty
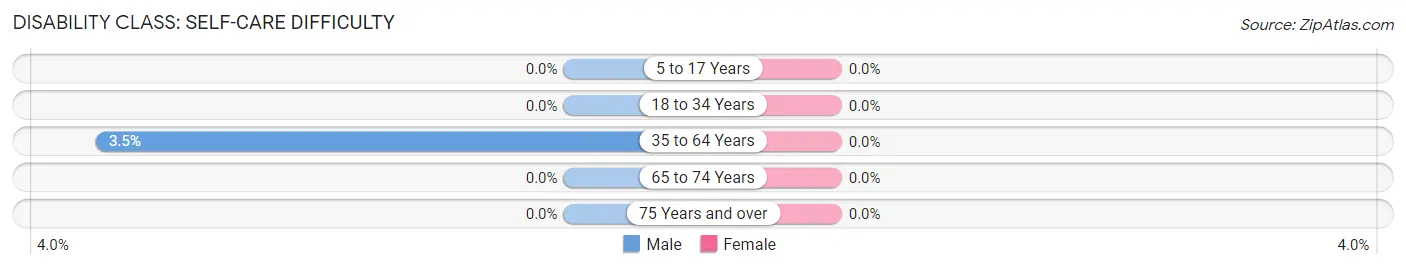
| Age Bracket | Male | Female |
| 5 to 17 Years | 0 (0.0%) | 0 (0.0%) |
| 18 to 34 Years | 0 (0.0%) | 0 (0.0%) |
| 35 to 64 Years | 37 (3.5%) | 0 (0.0%) |
| 65 to 74 Years | 0 (0.0%) | 0 (0.0%) |
| 75 Years and over | 0 (0.0%) | 0 (0.0%) |
Technology Access in Elko New Market
Computing Device Access in Elko New Market
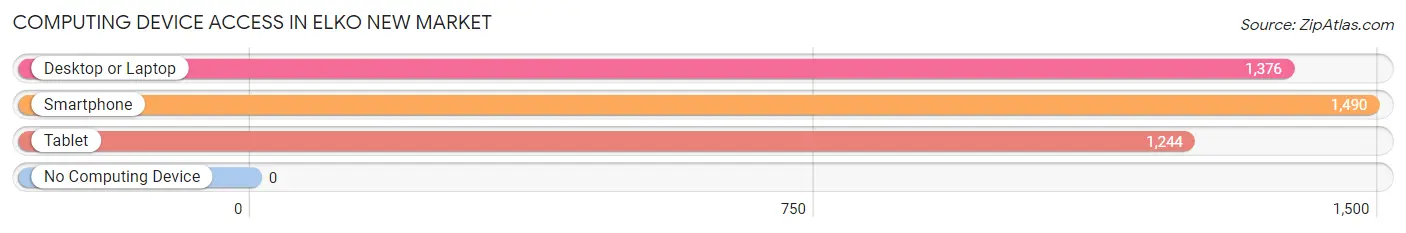
| Device Type | # Households | % Households |
| Desktop or Laptop | 1,376 | 92.3% |
| Smartphone | 1,490 | 100.0% |
| Tablet | 1,244 | 83.5% |
| No Computing Device | 0 | 0.0% |
| Total | 1,490 | 100.0% |
Internet Access in Elko New Market
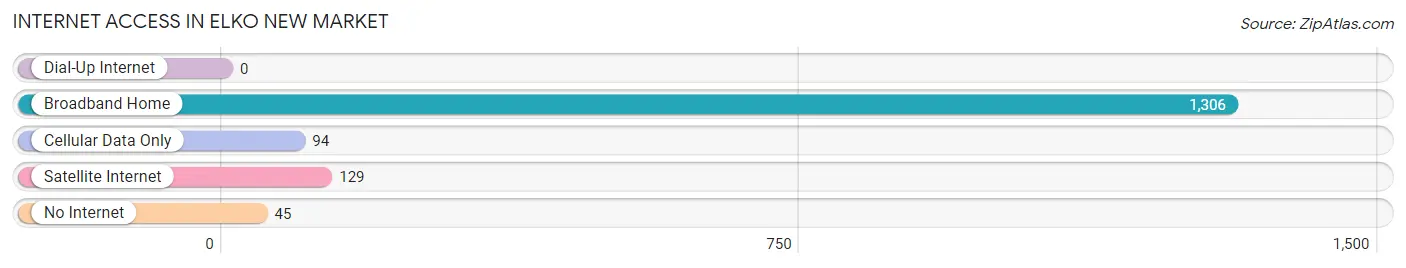
| Internet Type | # Households | % Households |
| Dial-Up Internet | 0 | 0.0% |
| Broadband Home | 1,306 | 87.6% |
| Cellular Data Only | 94 | 6.3% |
| Satellite Internet | 129 | 8.7% |
| No Internet | 45 | 3.0% |
| Total | 1,490 | 100.0% |
Elko New Market Summary
Elko New Market is a small city located in Scott County, Minnesota, United States. The city is located about 25 miles south of Minneapolis and is part of the Twin Cities metropolitan area. As of the 2010 census, the city had a population of 4,110.
History
Elko New Market was founded in 1856 by a group of settlers from New Market, Virginia. The town was originally named Elko, after the nearby Elko Creek. In 1872, the town was renamed Elko New Market, after the original town in Virginia.
The town grew slowly over the years, and by the early 1900s, it had become a popular destination for tourists and vacationers. The town was known for its beautiful scenery and its many lakes and rivers.
In the 1950s, the town began to experience rapid growth as the Twin Cities metropolitan area expanded. The population of Elko New Market increased from 1,000 in 1950 to 4,110 in 2010.
Geography
Elko New Market is located in Scott County, Minnesota, about 25 miles south of Minneapolis. The city is situated on the banks of the Minnesota River, and is surrounded by rolling hills and farmland.
The city has a total area of 4.2 square miles, all of which is land. The city is located at an elevation of 945 feet above sea level.
Economy
The economy of Elko New Market is largely based on agriculture and tourism. The city is home to several farms, which produce a variety of crops, including corn, soybeans, and hay.
The city is also home to several businesses, including restaurants, retail stores, and service providers. The city is also home to several manufacturing companies, including a plastics manufacturer and a metal fabrication company.
Demographics
As of the 2010 census, the population of Elko New Market was 4,110. The racial makeup of the city was 94.3% White, 0.7% African American, 0.3% Native American, 0.7% Asian, 0.1% Pacific Islander, 1.7% from other races, and 2.0% from two or more races. Hispanic or Latino of any race were 4.2% of the population.
The median household income in Elko New Market was $63,958, and the median family income was $76,944. The per capita income for the city was $30,945. About 4.2% of families and 5.7% of the population were below the poverty line, including 8.2% of those under age 18 and 4.2% of those age 65 or over.
Elko New Market is served by the Elko New Market School District, which includes two elementary schools, one middle school, and one high school. The city is also home to several churches, including the Elko New Market United Methodist Church and the Elko New Market Lutheran Church.
Common Questions
What is Per Capita Income in Elko New Market?
Per Capita income in Elko New Market is $51,624.
What is the Median Family Income in Elko New Market?
Median Family Income in Elko New Market is $149,881.
What is the Median Household income in Elko New Market?
Median Household Income in Elko New Market is $149,881.
What is Income or Wage Gap in Elko New Market?
Income or Wage Gap in Elko New Market is 42.1%.
Women in Elko New Market earn 57.9 cents for every dollar earned by a man.
What is Inequality or Gini Index in Elko New Market?
Inequality or Gini Index in Elko New Market is 0.28.
What is the Total Population of Elko New Market?
Total Population of Elko New Market is 4,850.
What is the Total Male Population of Elko New Market?
Total Male Population of Elko New Market is 2,297.
What is the Total Female Population of Elko New Market?
Total Female Population of Elko New Market is 2,553.
What is the Ratio of Males per 100 Females in Elko New Market?
There are 89.97 Males per 100 Females in Elko New Market.
What is the Ratio of Females per 100 Males in Elko New Market?
There are 111.14 Females per 100 Males in Elko New Market.
What is the Median Population Age in Elko New Market?
Median Population Age in Elko New Market is 33.3 Years.
What is the Average Family Size in Elko New Market
Average Family Size in Elko New Market is 3.2 People.
What is the Average Household Size in Elko New Market
Average Household Size in Elko New Market is 3.2 People.
How Large is the Labor Force in Elko New Market?
There are 3,026 People in the Labor Forcein in Elko New Market.
What is the Percentage of People in the Labor Force in Elko New Market?
85.2% of People are in the Labor Force in Elko New Market.
What is the Unemployment Rate in Elko New Market?
Unemployment Rate in Elko New Market is 0.8%.