Point Lay, AK Map & Demographics
Point Lay Map
Point Lay Overview
$25,499
PER CAPITA INCOME
$115,000
AVG FAMILY INCOME
$89,583
AVG HOUSEHOLD INCOME
32.4%
WAGE / INCOME GAP [ % ]
67.6¢/ $1
WAGE / INCOME GAP [ $ ]
0.32
INEQUALITY / GINI INDEX
172
TOTAL POPULATION
98
MALE POPULATION
74
FEMALE POPULATION
132.43
MALES / 100 FEMALES
75.51
FEMALES / 100 MALES
23.8
MEDIAN AGE
5.0
AVG FAMILY SIZE
4.0
AVG HOUSEHOLD SIZE
67
LABOR FORCE [ PEOPLE ]
58.8%
PERCENT IN LABOR FORCE
7.5%
UNEMPLOYMENT RATE
Point Lay Zip Codes
Point Lay Area Codes
Income in Point Lay
Income Overview in Point Lay
Per Capita Income in Point Lay is $25,499, while median incomes of families and households are $115,000 and $89,583 respectively.
| Characteristic | Number | Measure |
| Per Capita Income | 172 | $25,499 |
| Median Family Income | 30 | $115,000 |
| Mean Family Income | 30 | $108,663 |
| Median Household Income | 43 | $89,583 |
| Mean Household Income | 43 | $100,372 |
| Income Deficit | 30 | $0 |
| Wage / Income Gap (%) | 172 | 32.35% |
| Wage / Income Gap ($) | 172 | 67.65¢ per $1 |
| Gini / Inequality Index | 172 | 0.32 |
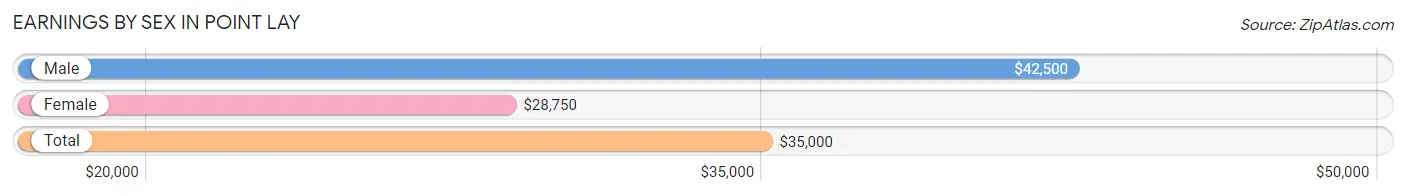
Earnings by Sex in Point Lay
Average Earnings in Point Lay are $35,000, $42,500 for men and $28,750 for women, a difference of 32.4%.
| Sex | Number | Average Earnings |
| Male | 50 (58.1%) | $42,500 |
| Female | 36 (41.9%) | $28,750 |
| Total | 86 (100.0%) | $35,000 |
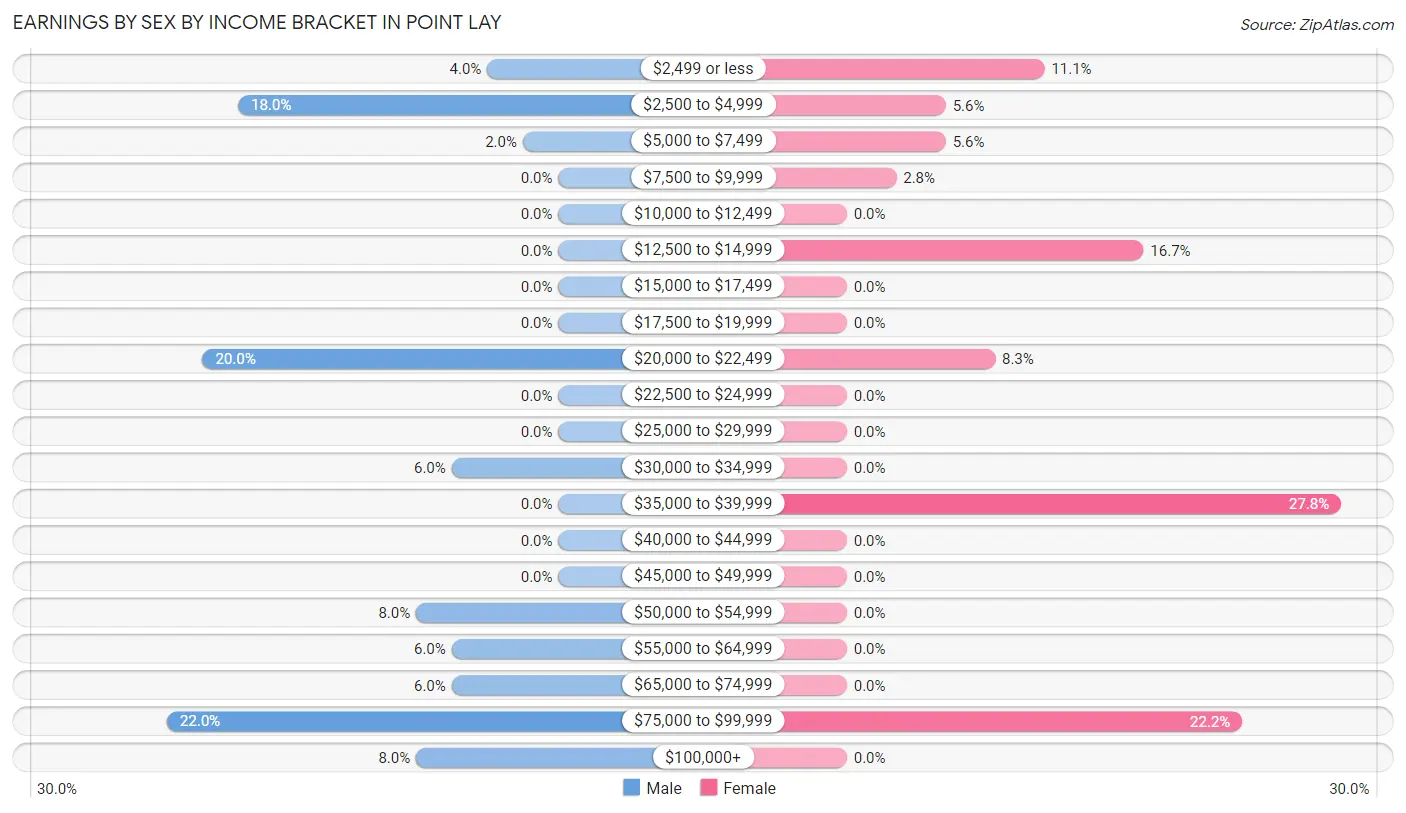
Earnings by Sex by Income Bracket in Point Lay
The most common earnings brackets in Point Lay are $75,000 to $99,999 for men (11 | 22.0%) and $35,000 to $39,999 for women (10 | 27.8%).
| Income | Male | Female |
| $2,499 or less | 2 (4.0%) | 4 (11.1%) |
| $2,500 to $4,999 | 9 (18.0%) | 2 (5.6%) |
| $5,000 to $7,499 | 1 (2.0%) | 2 (5.6%) |
| $7,500 to $9,999 | 0 (0.0%) | 1 (2.8%) |
| $10,000 to $12,499 | 0 (0.0%) | 0 (0.0%) |
| $12,500 to $14,999 | 0 (0.0%) | 6 (16.7%) |
| $15,000 to $17,499 | 0 (0.0%) | 0 (0.0%) |
| $17,500 to $19,999 | 0 (0.0%) | 0 (0.0%) |
| $20,000 to $22,499 | 10 (20.0%) | 3 (8.3%) |
| $22,500 to $24,999 | 0 (0.0%) | 0 (0.0%) |
| $25,000 to $29,999 | 0 (0.0%) | 0 (0.0%) |
| $30,000 to $34,999 | 3 (6.0%) | 0 (0.0%) |
| $35,000 to $39,999 | 0 (0.0%) | 10 (27.8%) |
| $40,000 to $44,999 | 0 (0.0%) | 0 (0.0%) |
| $45,000 to $49,999 | 0 (0.0%) | 0 (0.0%) |
| $50,000 to $54,999 | 4 (8.0%) | 0 (0.0%) |
| $55,000 to $64,999 | 3 (6.0%) | 0 (0.0%) |
| $65,000 to $74,999 | 3 (6.0%) | 0 (0.0%) |
| $75,000 to $99,999 | 11 (22.0%) | 8 (22.2%) |
| $100,000+ | 4 (8.0%) | 0 (0.0%) |
| Total | 50 (100.0%) | 36 (100.0%) |
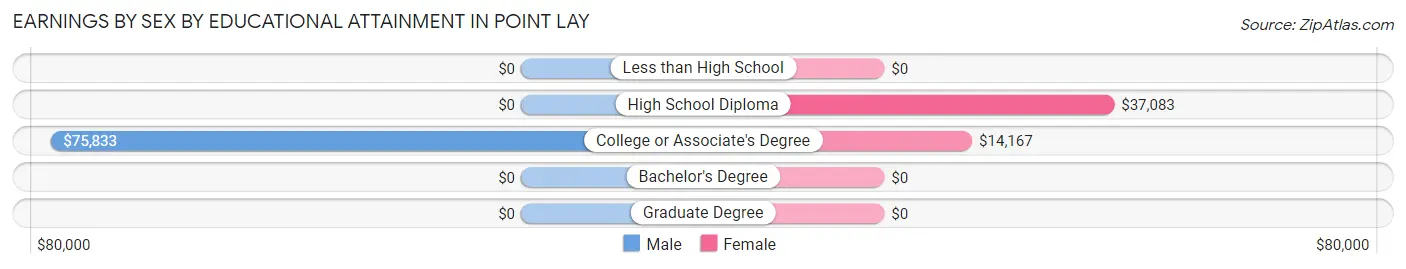
Earnings by Sex by Educational Attainment in Point Lay
| Educational Attainment | Male Income | Female Income |
| Less than High School | - | - |
| High School Diploma | - | - |
| College or Associate's Degree | $75,833 | $14,167 |
| Bachelor's Degree | - | - |
| Graduate Degree | - | - |
| Total | $63,750 | $0 |
Family Income in Point Lay
Family Income Brackets in Point Lay
According to the Point Lay family income data, there are 13 families falling into the $100,000 to $149,999 income range, which is the most common income bracket and makes up 43.3% of all families.
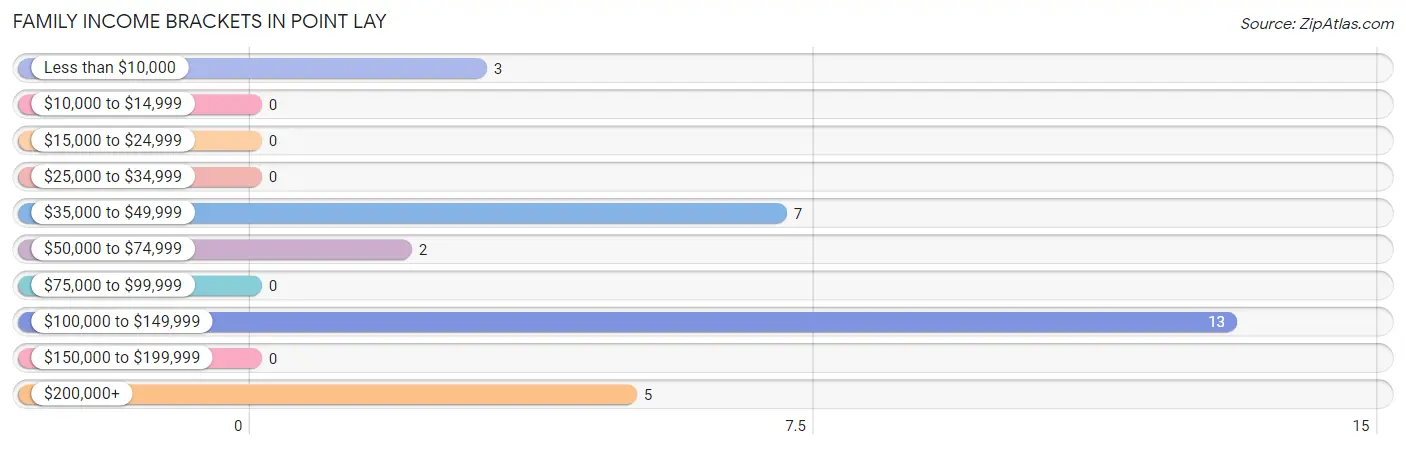
| Income Bracket | # Families | % Families |
| Less than $10,000 | 3 | 10.0% |
| $10,000 to $14,999 | 0 | 0.0% |
| $15,000 to $24,999 | 0 | 0.0% |
| $25,000 to $34,999 | 0 | 0.0% |
| $35,000 to $49,999 | 7 | 23.3% |
| $50,000 to $74,999 | 2 | 6.7% |
| $75,000 to $99,999 | 0 | 0.0% |
| $100,000 to $149,999 | 13 | 43.3% |
| $150,000 to $199,999 | 0 | 0.0% |
| $200,000+ | 5 | 16.7% |
Family Income by Famaliy Size in Point Lay
7+ person families (15 | 50.0%) account for the highest median family income in Point Lay with $122,750 per family, while 7+ person families (15 | 50.0%) have the highest median income of $17,536 per family member.
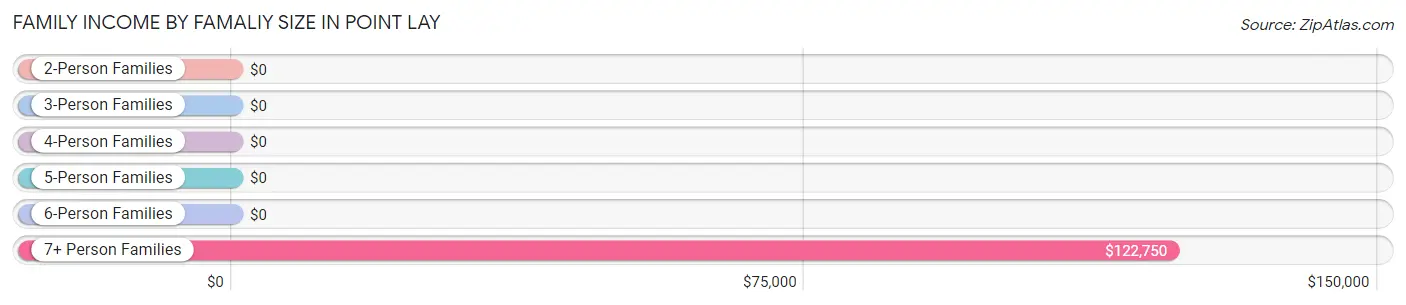
| Income Bracket | # Families | Median Income |
| 2-Person Families | 2 (6.7%) | $0 |
| 3-Person Families | 3 (10.0%) | $0 |
| 4-Person Families | 2 (6.7%) | $0 |
| 5-Person Families | 0 (0.0%) | $0 |
| 6-Person Families | 8 (26.7%) | $0 |
| 7+ Person Families | 15 (50.0%) | $122,750 |
| Total | 30 (100.0%) | $115,000 |
Family Income by Number of Earners in Point Lay
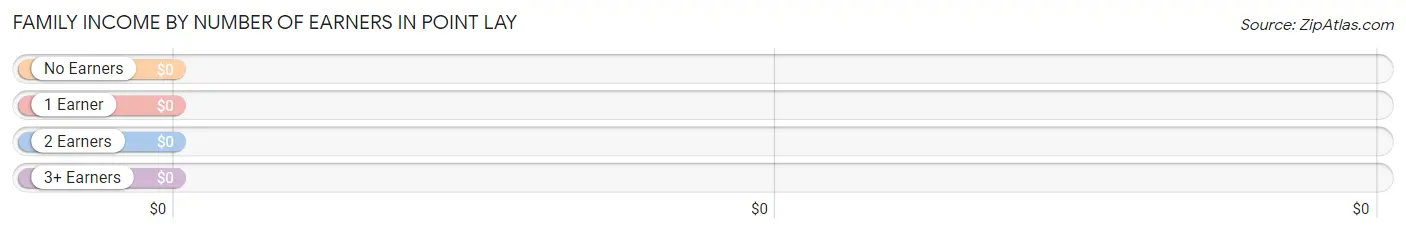
| Number of Earners | # Families | Median Income |
| No Earners | 3 (10.0%) | $0 |
| 1 Earner | 5 (16.7%) | $0 |
| 2 Earners | 11 (36.7%) | $0 |
| 3+ Earners | 11 (36.7%) | $0 |
| Total | 30 (100.0%) | $115,000 |
Household Income in Point Lay
Household Income Brackets in Point Lay
With 13 households falling in the category, the $50,000 to $74,999 income range is the most frequent in Point Lay, accounting for 30.2% of all households.
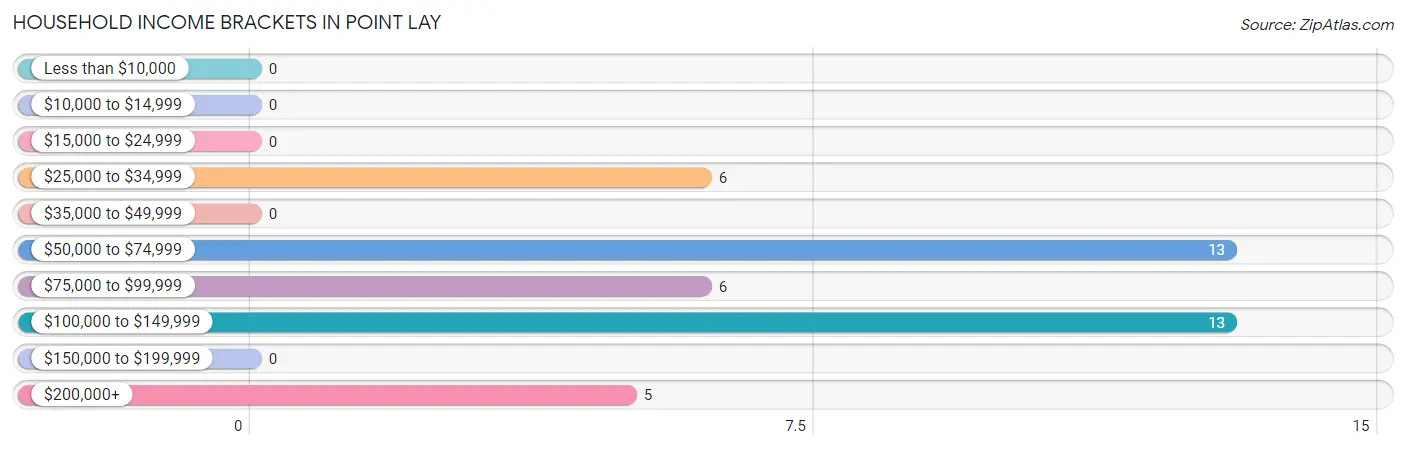
| Income Bracket | # Households | % Households |
| Less than $10,000 | 0 | 0.0% |
| $10,000 to $14,999 | 0 | 0.0% |
| $15,000 to $24,999 | 0 | 0.0% |
| $25,000 to $34,999 | 6 | 14.0% |
| $35,000 to $49,999 | 0 | 0.0% |
| $50,000 to $74,999 | 13 | 30.2% |
| $75,000 to $99,999 | 6 | 14.0% |
| $100,000 to $149,999 | 13 | 30.2% |
| $150,000 to $199,999 | 0 | 0.0% |
| $200,000+ | 5 | 11.6% |
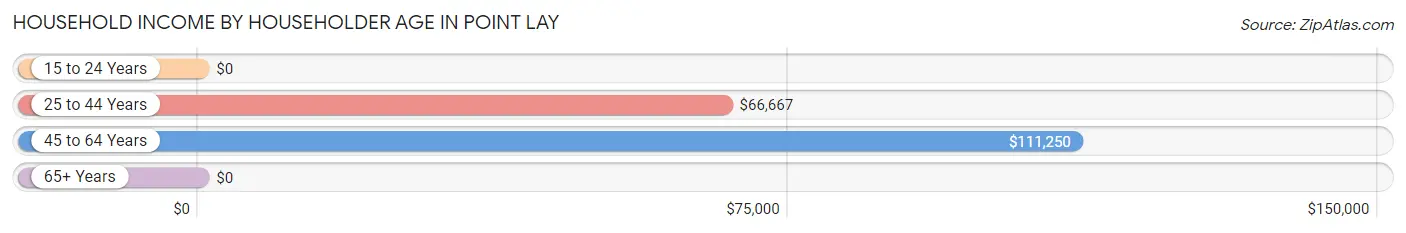
Household Income by Householder Age in Point Lay
The median household income in Point Lay is $89,583, with the highest median household income of $111,250 found in the 45 to 64 years age bracket for the primary householder. A total of 9 households (20.9%) fall into this category.
| Income Bracket | # Households | Median Income |
| 15 to 24 Years | 0 (0.0%) | $0 |
| 25 to 44 Years | 32 (74.4%) | $66,667 |
| 45 to 64 Years | 9 (20.9%) | $111,250 |
| 65+ Years | 2 (4.6%) | $0 |
| Total | 43 (100.0%) | $89,583 |
Poverty in Point Lay
Income Below Poverty by Sex and Age in Point Lay
With 17.3% poverty level for males and 31.1% for females among the residents of Point Lay, 65 to 74 year old males and 55 to 64 year old females are the most vulnerable to poverty, with 3 males (75.0%) and 1 females (100.0%) in their respective age groups living below the poverty level.
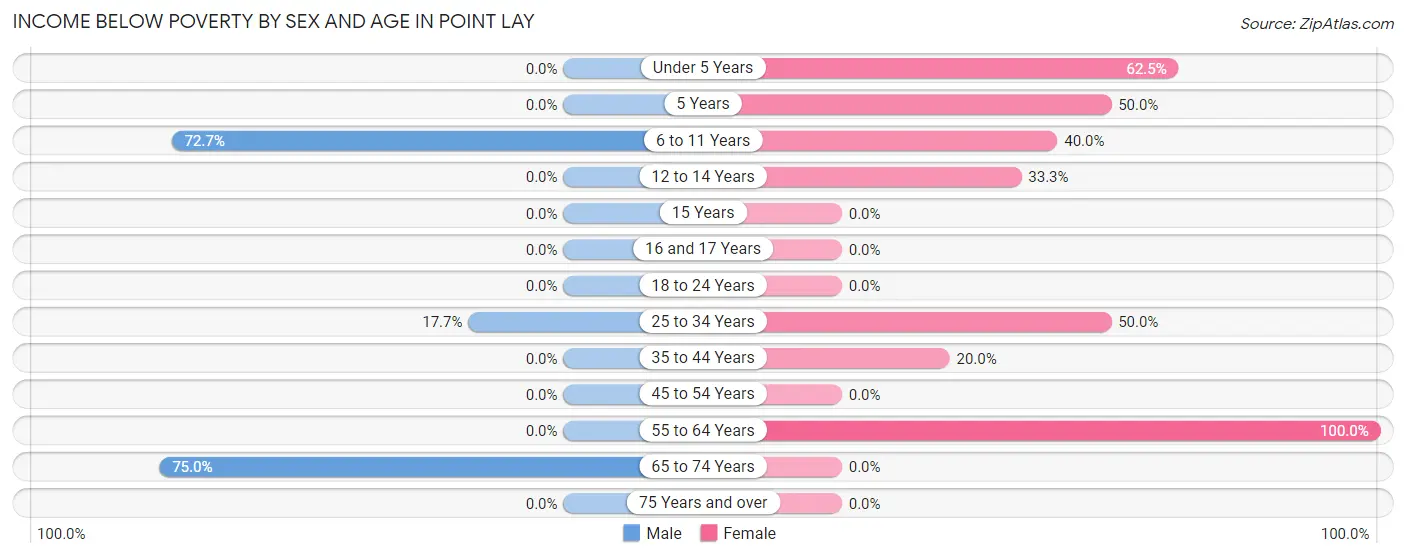
| Age Bracket | Male | Female |
| Under 5 Years | 0 (0.0%) | 5 (62.5%) |
| 5 Years | 0 (0.0%) | 3 (50.0%) |
| 6 to 11 Years | 8 (72.7%) | 4 (40.0%) |
| 12 to 14 Years | 0 (0.0%) | 3 (33.3%) |
| 15 Years | 0 (0.0%) | 0 (0.0%) |
| 16 and 17 Years | 0 (0.0%) | 0 (0.0%) |
| 18 to 24 Years | 0 (0.0%) | 0 (0.0%) |
| 25 to 34 Years | 6 (17.6%) | 5 (50.0%) |
| 35 to 44 Years | 0 (0.0%) | 2 (20.0%) |
| 45 to 54 Years | 0 (0.0%) | 0 (0.0%) |
| 55 to 64 Years | 0 (0.0%) | 1 (100.0%) |
| 65 to 74 Years | 3 (75.0%) | 0 (0.0%) |
| 75 Years and over | 0 (0.0%) | 0 (0.0%) |
| Total | 17 (17.3%) | 23 (31.1%) |
Income Above Poverty by Sex and Age in Point Lay
According to the poverty statistics in Point Lay, males aged under 5 years and females aged 16 and 17 years are the age groups that are most secure financially, with 100.0% of males and 100.0% of females in these age groups living above the poverty line.
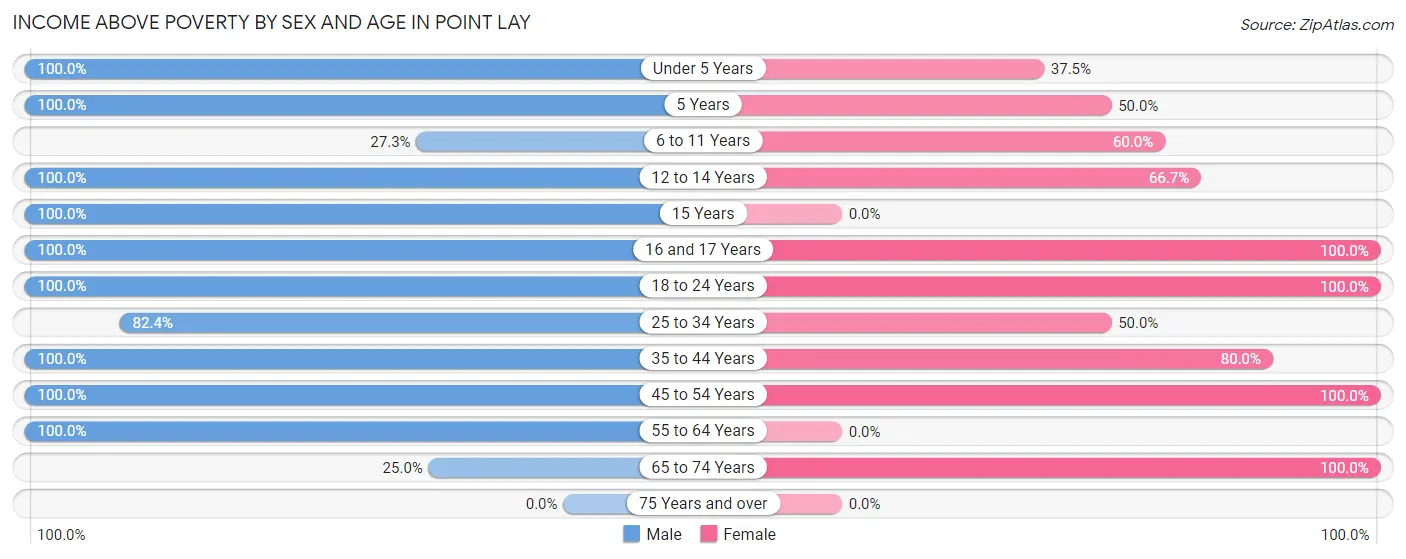
| Age Bracket | Male | Female |
| Under 5 Years | 6 (100.0%) | 3 (37.5%) |
| 5 Years | 2 (100.0%) | 3 (50.0%) |
| 6 to 11 Years | 3 (27.3%) | 6 (60.0%) |
| 12 to 14 Years | 2 (100.0%) | 6 (66.7%) |
| 15 Years | 4 (100.0%) | 0 (0.0%) |
| 16 and 17 Years | 11 (100.0%) | 6 (100.0%) |
| 18 to 24 Years | 6 (100.0%) | 6 (100.0%) |
| 25 to 34 Years | 28 (82.4%) | 5 (50.0%) |
| 35 to 44 Years | 9 (100.0%) | 8 (80.0%) |
| 45 to 54 Years | 6 (100.0%) | 6 (100.0%) |
| 55 to 64 Years | 3 (100.0%) | 0 (0.0%) |
| 65 to 74 Years | 1 (25.0%) | 2 (100.0%) |
| 75 Years and over | 0 (0.0%) | 0 (0.0%) |
| Total | 81 (82.7%) | 51 (68.9%) |
Income Below Poverty Among Married-Couple Families in Point Lay
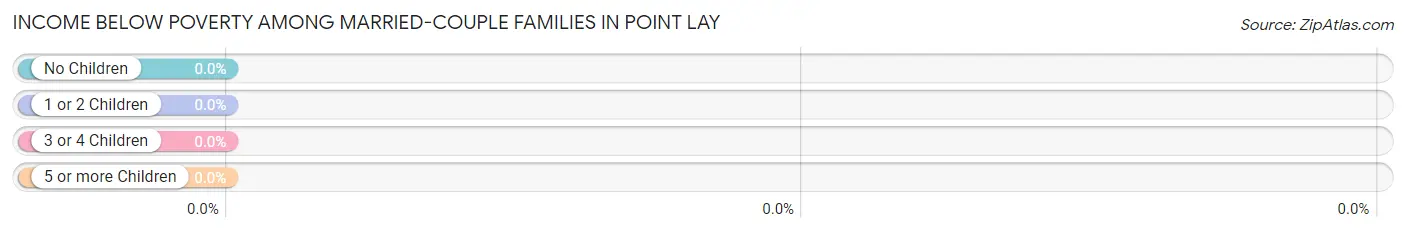
| Children | Above Poverty | Below Poverty |
| No Children | 2 (100.0%) | 0 (0.0%) |
| 1 or 2 Children | 2 (100.0%) | 0 (0.0%) |
| 3 or 4 Children | 3 (100.0%) | 0 (0.0%) |
| 5 or more Children | 5 (100.0%) | 0 (0.0%) |
| Total | 12 (100.0%) | 0 (0.0%) |
Income Below Poverty Among Single-Parent Households in Point Lay
According to the poverty data in Point Lay, 100.0% or 4 single-father households and 21.4% or 3 single-mother households are living below the poverty line. Among single-father households, those with 3 or 4 children have the highest poverty rate, with 4 households (100.0%) experiencing poverty. Likewise, among single-mother households, those with 5 or more children have the highest poverty rate, with 3 households (100.0%) falling below the poverty line.
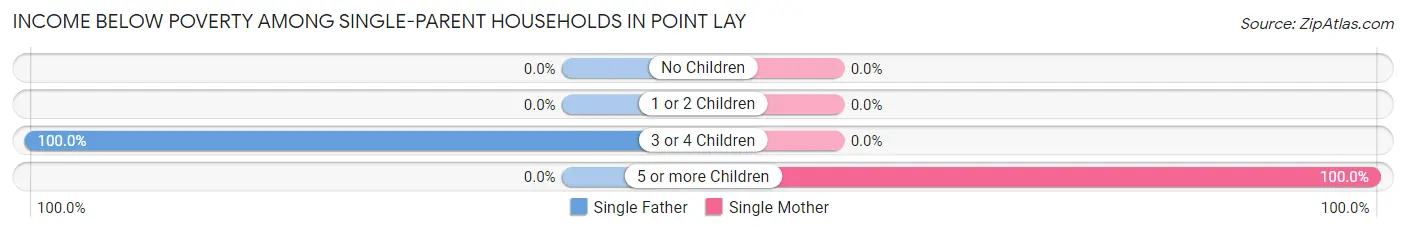
| Children | Single Father | Single Mother |
| No Children | 0 (0.0%) | 0 (0.0%) |
| 1 or 2 Children | 0 (0.0%) | 0 (0.0%) |
| 3 or 4 Children | 4 (100.0%) | 0 (0.0%) |
| 5 or more Children | 0 (0.0%) | 3 (100.0%) |
| Total | 4 (100.0%) | 3 (21.4%) |
Income Below Poverty Among Married-Couple vs Single-Parent Households in Point Lay
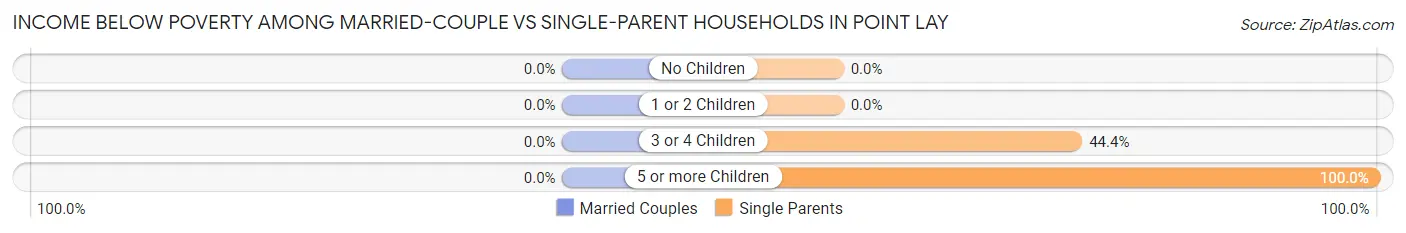
| Children | Married-Couple Families | Single-Parent Households |
| No Children | 0 (0.0%) | 0 (0.0%) |
| 1 or 2 Children | 0 (0.0%) | 0 (0.0%) |
| 3 or 4 Children | 0 (0.0%) | 4 (44.4%) |
| 5 or more Children | 0 (0.0%) | 3 (100.0%) |
| Total | 0 (0.0%) | 7 (38.9%) |
Race in Point Lay
The most populous races in Point Lay are Native / Alaskan (155 | 90.1%), Two or more Races (7 | 4.1%), and White / Caucasian (6 | 3.5%).
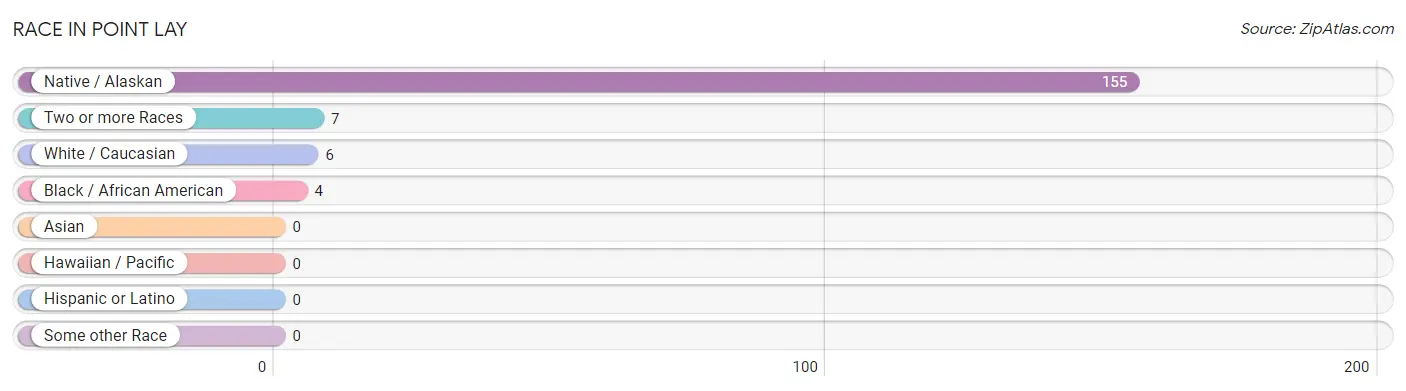
| Race | # Population | % Population |
| Asian | 0 | 0.0% |
| Black / African American | 4 | 2.3% |
| Hawaiian / Pacific | 0 | 0.0% |
| Hispanic or Latino | 0 | 0.0% |
| Native / Alaskan | 155 | 90.1% |
| White / Caucasian | 6 | 3.5% |
| Two or more Races | 7 | 4.1% |
| Some other Race | 0 | 0.0% |
| Total | 172 | 100.0% |
Ancestry in Point Lay
The most populous ancestries reported in Point Lay are Inupiat (146 | 84.9%), German (11 | 6.4%), Kenyan (7 | 4.1%), Subsaharan African (7 | 4.1%), and Alaska Native (5 | 2.9%), together accounting for 102.3% of all Point Lay residents.
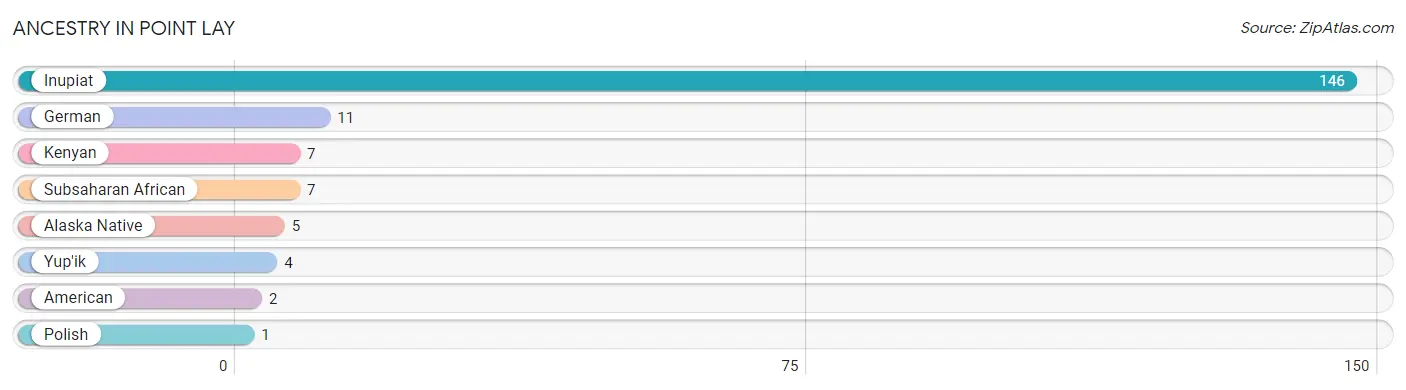
| Ancestry | # Population | % Population |
| Alaska Native | 5 | 2.9% |
| American | 2 | 1.2% |
| German | 11 | 6.4% |
| Inupiat | 146 | 84.9% |
| Kenyan | 7 | 4.1% |
| Polish | 1 | 0.6% |
| Subsaharan African | 7 | 4.1% |
| Yup'ik | 4 | 2.3% | View All 8 Rows |
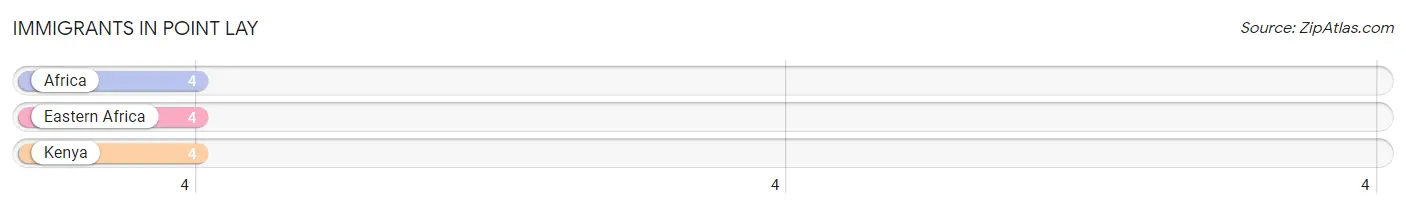
Immigrants in Point Lay
The most numerous immigrant groups reported in Point Lay came from Africa (4 | 2.3%), Eastern Africa (4 | 2.3%), and Kenya (4 | 2.3%), together accounting for 7.0% of all Point Lay residents.
| Immigration Origin | # Population | % Population |
| Africa | 4 | 2.3% |
| Eastern Africa | 4 | 2.3% |
| Kenya | 4 | 2.3% | View All 3 Rows |
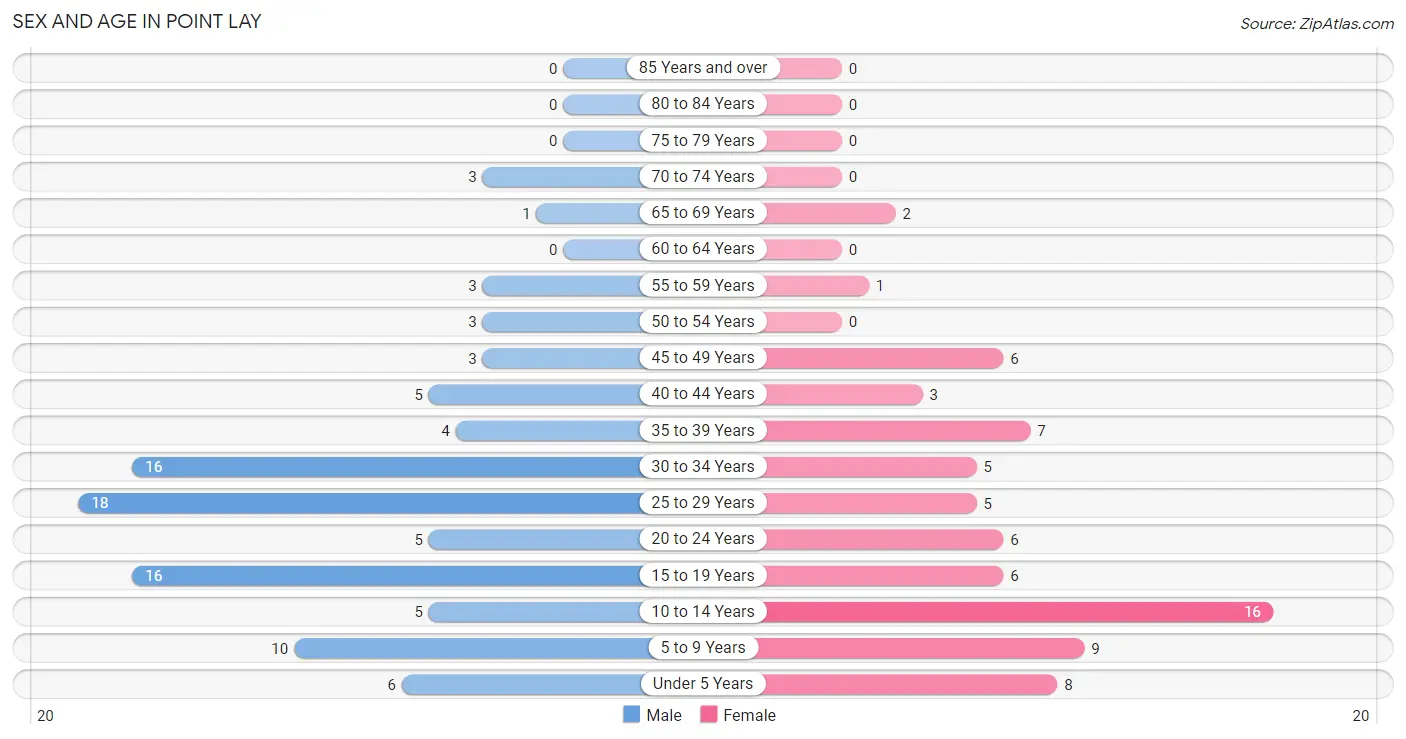
Sex and Age in Point Lay
Sex and Age in Point Lay
The most populous age groups in Point Lay are 25 to 29 Years (18 | 18.4%) for men and 10 to 14 Years (16 | 21.6%) for women.
| Age Bracket | Male | Female |
| Under 5 Years | 6 (6.1%) | 8 (10.8%) |
| 5 to 9 Years | 10 (10.2%) | 9 (12.2%) |
| 10 to 14 Years | 5 (5.1%) | 16 (21.6%) |
| 15 to 19 Years | 16 (16.3%) | 6 (8.1%) |
| 20 to 24 Years | 5 (5.1%) | 6 (8.1%) |
| 25 to 29 Years | 18 (18.4%) | 5 (6.8%) |
| 30 to 34 Years | 16 (16.3%) | 5 (6.8%) |
| 35 to 39 Years | 4 (4.1%) | 7 (9.5%) |
| 40 to 44 Years | 5 (5.1%) | 3 (4.1%) |
| 45 to 49 Years | 3 (3.1%) | 6 (8.1%) |
| 50 to 54 Years | 3 (3.1%) | 0 (0.0%) |
| 55 to 59 Years | 3 (3.1%) | 1 (1.3%) |
| 60 to 64 Years | 0 (0.0%) | 0 (0.0%) |
| 65 to 69 Years | 1 (1.0%) | 2 (2.7%) |
| 70 to 74 Years | 3 (3.1%) | 0 (0.0%) |
| 75 to 79 Years | 0 (0.0%) | 0 (0.0%) |
| 80 to 84 Years | 0 (0.0%) | 0 (0.0%) |
| 85 Years and over | 0 (0.0%) | 0 (0.0%) |
| Total | 98 (100.0%) | 74 (100.0%) |
Families and Households in Point Lay
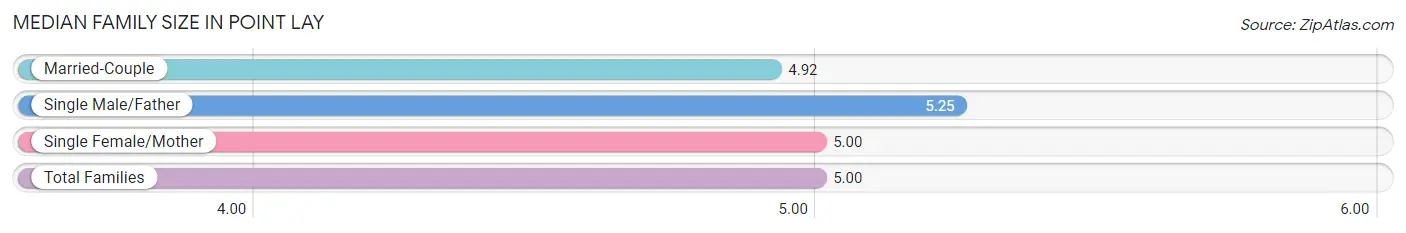
Median Family Size in Point Lay
The median family size in Point Lay is 5.00 persons per family, with single male/father families (4 | 13.3%) accounting for the largest median family size of 5.25 persons per family. On the other hand, married-couple families (12 | 40.0%) represent the smallest median family size with 4.92 persons per family.
| Family Type | # Families | Family Size |
| Married-Couple | 12 (40.0%) | 4.92 |
| Single Male/Father | 4 (13.3%) | 5.25 |
| Single Female/Mother | 14 (46.7%) | 5.00 |
| Total Families | 30 (100.0%) | 5.00 |
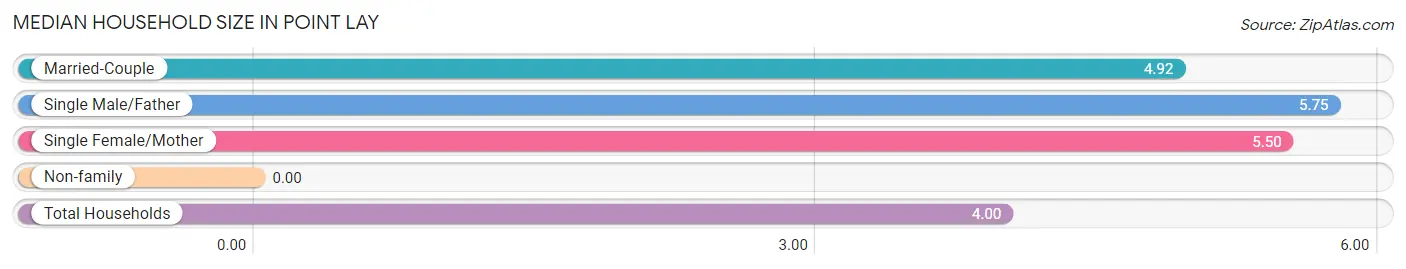
Median Household Size in Point Lay
| Household Type | # Households | Household Size |
| Married-Couple | 12 (27.9%) | 4.92 |
| Single Male/Father | 4 (9.3%) | 5.75 |
| Single Female/Mother | 14 (32.6%) | 5.50 |
| Non-family | 13 (30.2%) | - |
| Total Households | 43 (100.0%) | 4.00 |
Household Size by Marriage Status in Point Lay
Out of a total of 43 households in Point Lay, 30 (69.8%) are family households, while 13 (30.2%) are nonfamily households. The most numerous type of family households are 7+ person households, comprising 18, and the most common type of nonfamily households are 1-person households, comprising 13.
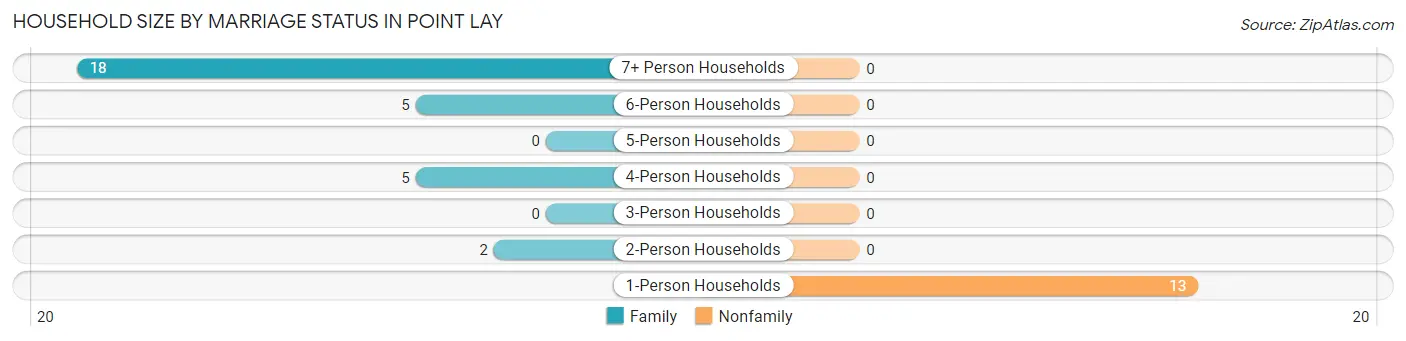
| Household Size | Family Households | Nonfamily Households |
| 1-Person Households | - | 13 (30.2%) |
| 2-Person Households | 2 (4.6%) | 0 (0.0%) |
| 3-Person Households | 0 (0.0%) | 0 (0.0%) |
| 4-Person Households | 5 (11.6%) | 0 (0.0%) |
| 5-Person Households | 0 (0.0%) | 0 (0.0%) |
| 6-Person Households | 5 (11.6%) | 0 (0.0%) |
| 7+ Person Households | 18 (41.9%) | 0 (0.0%) |
| Total | 30 (69.8%) | 13 (30.2%) |
Female Fertility in Point Lay
Fertility by Age in Point Lay
Average fertility rate in Point Lay is 79.0 births per 1,000 women. Women in the age bracket of 35 to 50 years have the highest fertility rate with 188.0 births per 1,000 women. Women in the age bracket of 35 to 50 years acount for 100.0% of all women with births.
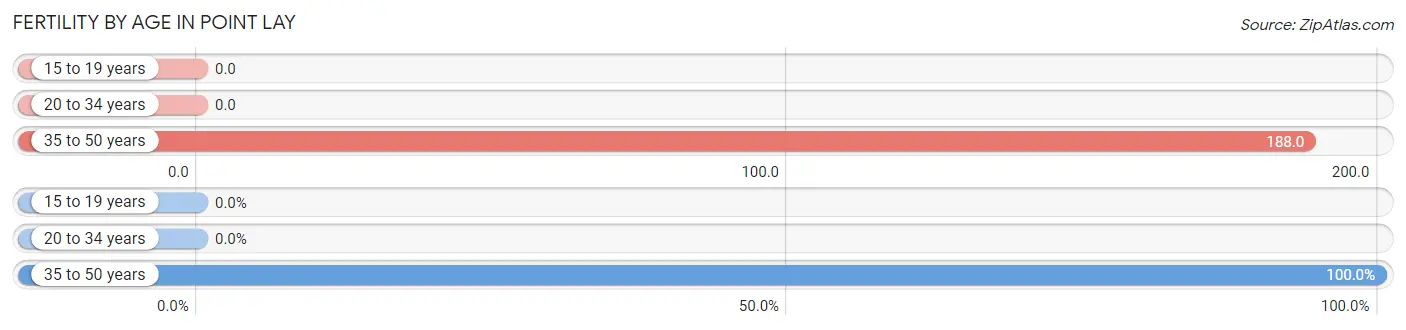
| Age Bracket | Women with Births | Births / 1,000 Women |
| 15 to 19 years | 0 (0.0%) | 0.0 |
| 20 to 34 years | 0 (0.0%) | 0.0 |
| 35 to 50 years | 3 (100.0%) | 188.0 |
| Total | 3 (100.0%) | 79.0 |
Fertility by Age by Marriage Status in Point Lay
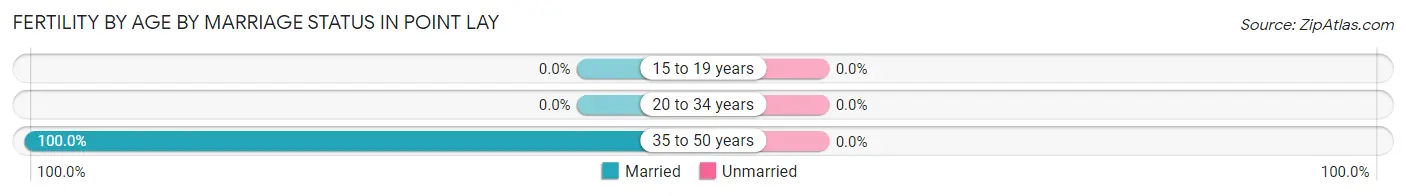
| Age Bracket | Married | Unmarried |
| 15 to 19 years | 0 (0.0%) | 0 (0.0%) |
| 20 to 34 years | 0 (0.0%) | 0 (0.0%) |
| 35 to 50 years | 3 (100.0%) | 0 (0.0%) |
| Total | 3 (100.0%) | 0 (0.0%) |
Fertility by Education in Point Lay
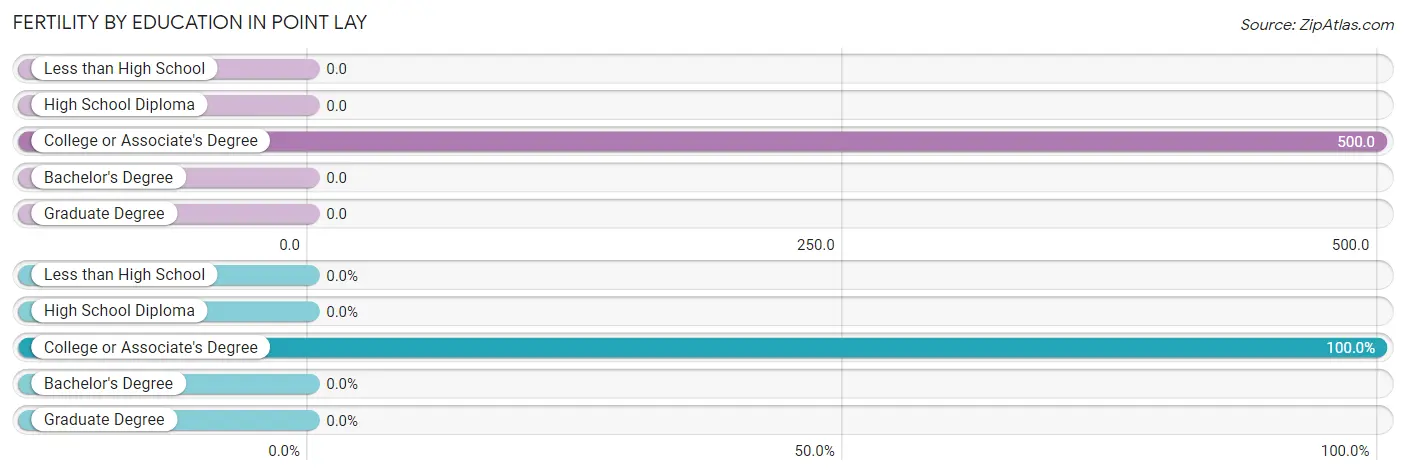
| Educational Attainment | Women with Births | Births / 1,000 Women |
| Less than High School | 0 (0.0%) | 0.0 |
| High School Diploma | 0 (0.0%) | 0.0 |
| College or Associate's Degree | 3 (100.0%) | 500.0 |
| Bachelor's Degree | 0 (0.0%) | 0.0 |
| Graduate Degree | 0 (0.0%) | 0.0 |
| Total | 3 (100.0%) | 79.0 |
Fertility by Education by Marriage Status in Point Lay
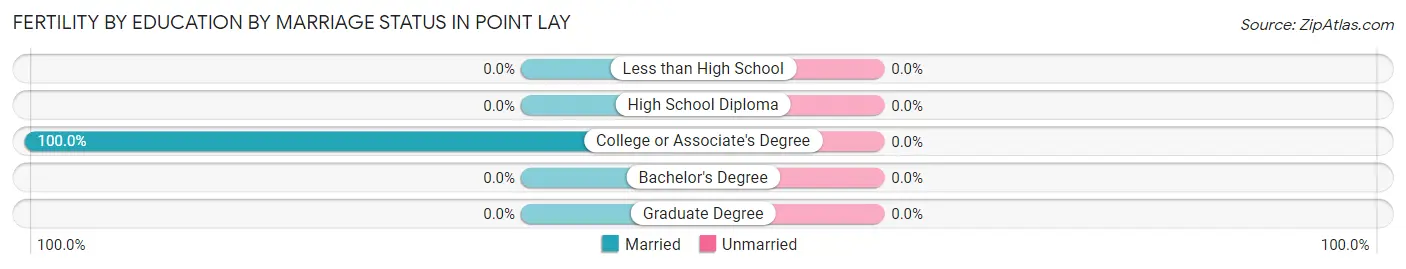
| Educational Attainment | Married | Unmarried |
| Less than High School | 0 (0.0%) | 0 (0.0%) |
| High School Diploma | 0 (0.0%) | 0 (0.0%) |
| College or Associate's Degree | 3 (100.0%) | 0 (0.0%) |
| Bachelor's Degree | 0 (0.0%) | 0 (0.0%) |
| Graduate Degree | 0 (0.0%) | 0 (0.0%) |
| Total | 3 (100.0%) | 0 (0.0%) |
Employment Characteristics in Point Lay
Employment by Class of Employer in Point Lay
Among the 62 employed individuals in Point Lay, local government employees (43 | 69.4%), private company employees (10 | 16.1%), and state government employees (5 | 8.1%) make up the most common classes of employment.
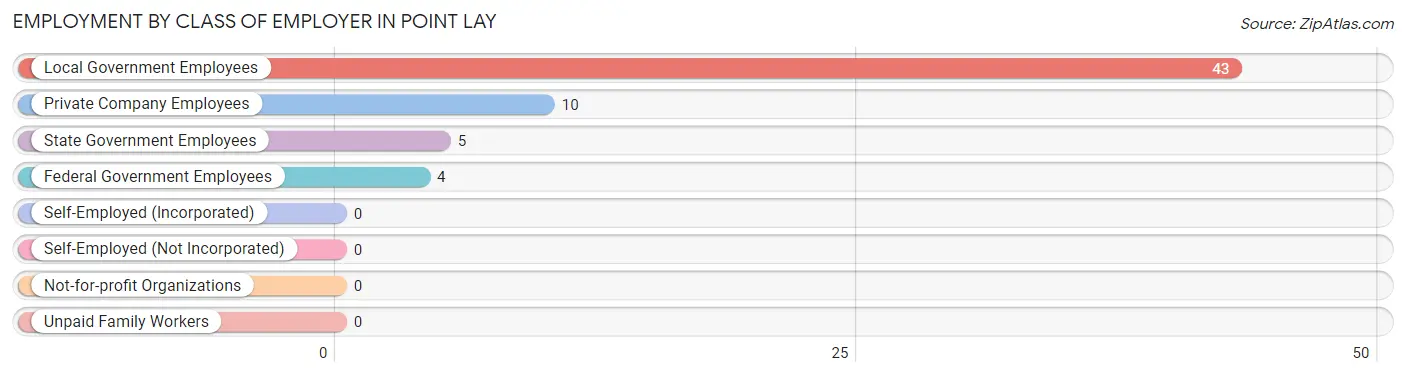
| Employer Class | # Employees | % Employees |
| Private Company Employees | 10 | 16.1% |
| Self-Employed (Incorporated) | 0 | 0.0% |
| Self-Employed (Not Incorporated) | 0 | 0.0% |
| Not-for-profit Organizations | 0 | 0.0% |
| Local Government Employees | 43 | 69.4% |
| State Government Employees | 5 | 8.1% |
| Federal Government Employees | 4 | 6.5% |
| Unpaid Family Workers | 0 | 0.0% |
| Total | 62 | 100.0% |
Employment Status by Age in Point Lay
According to the labor force statistics for Point Lay, out of the total population over 16 years of age (114), 58.8% or 67 individuals are in the labor force, with 7.5% or 5 of them unemployed. The age group with the highest labor force participation rate is 45 to 54 years, with 100.0% or 12 individuals in the labor force. Within the labor force, the 16 to 19 years age range has the highest percentage of unemployed individuals, with 100.0% or 2 of them being unemployed.
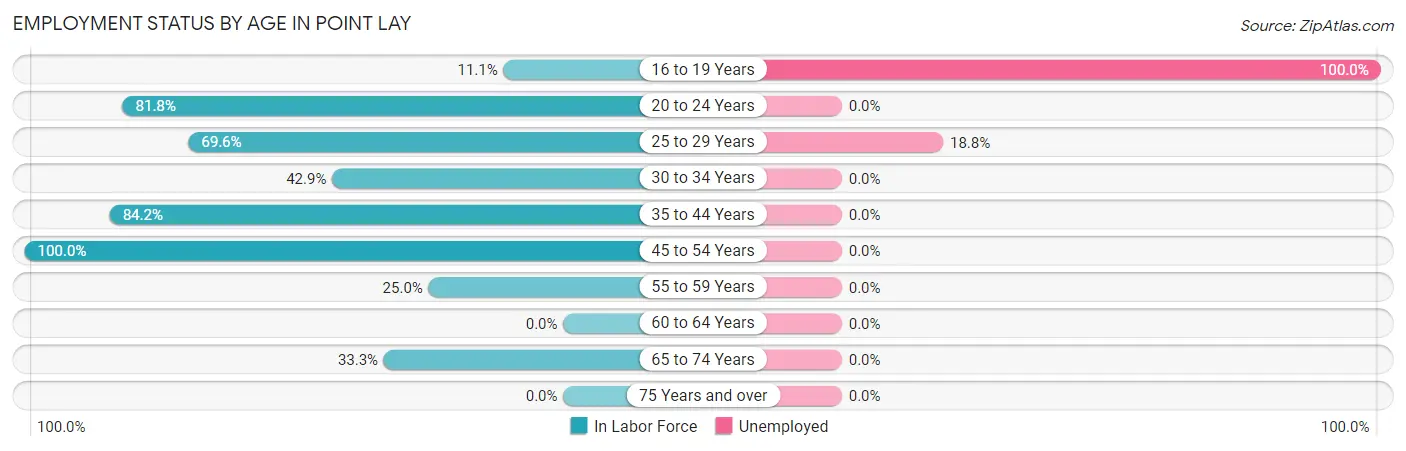
| Age Bracket | In Labor Force | Unemployed |
| 16 to 19 Years | 2 (11.1%) | 2 (100.0%) |
| 20 to 24 Years | 9 (81.8%) | 0 (0.0%) |
| 25 to 29 Years | 16 (69.6%) | 3 (18.8%) |
| 30 to 34 Years | 9 (42.9%) | 0 (0.0%) |
| 35 to 44 Years | 16 (84.2%) | 0 (0.0%) |
| 45 to 54 Years | 12 (100.0%) | 0 (0.0%) |
| 55 to 59 Years | 1 (25.0%) | 0 (0.0%) |
| 60 to 64 Years | 0 (0.0%) | 0 (0.0%) |
| 65 to 74 Years | 2 (33.3%) | 0 (0.0%) |
| 75 Years and over | 0 (0.0%) | 0 (0.0%) |
| Total | 67 (58.8%) | 5 (7.5%) |
Employment Status by Educational Attainment in Point Lay
According to labor force statistics for Point Lay, 68.4% of individuals (54) out of the total population between 25 and 64 years of age (79) are in the labor force, with 5.6% or 3 of them being unemployed. The group with the highest labor force participation rate are those with the educational attainment of bachelor's degree or higher, with 100.0% or 2 individuals in the labor force. Within the labor force, individuals with college / associate degree education have the highest percentage of unemployment, with 10.7% or 3 of them being unemployed.
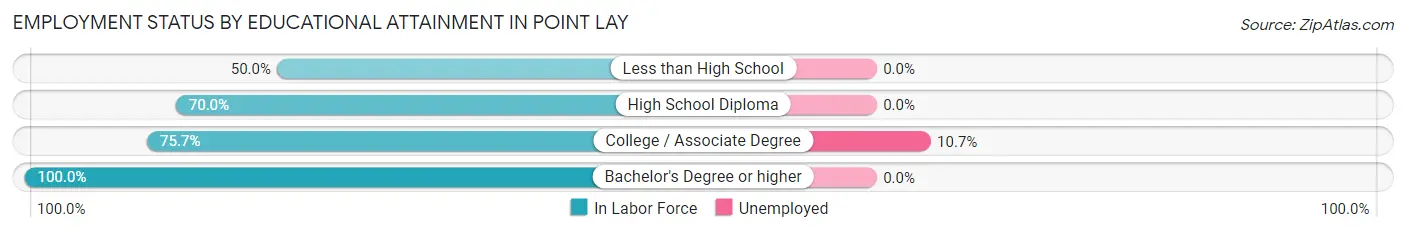
| Educational Attainment | In Labor Force | Unemployed |
| Less than High School | 10 (50.0%) | 0 (0.0%) |
| High School Diploma | 14 (70.0%) | 0 (0.0%) |
| College / Associate Degree | 28 (75.7%) | 4 (10.7%) |
| Bachelor's Degree or higher | 2 (100.0%) | 0 (0.0%) |
| Total | 54 (68.4%) | 4 (5.6%) |
Employment Occupations by Sex in Point Lay
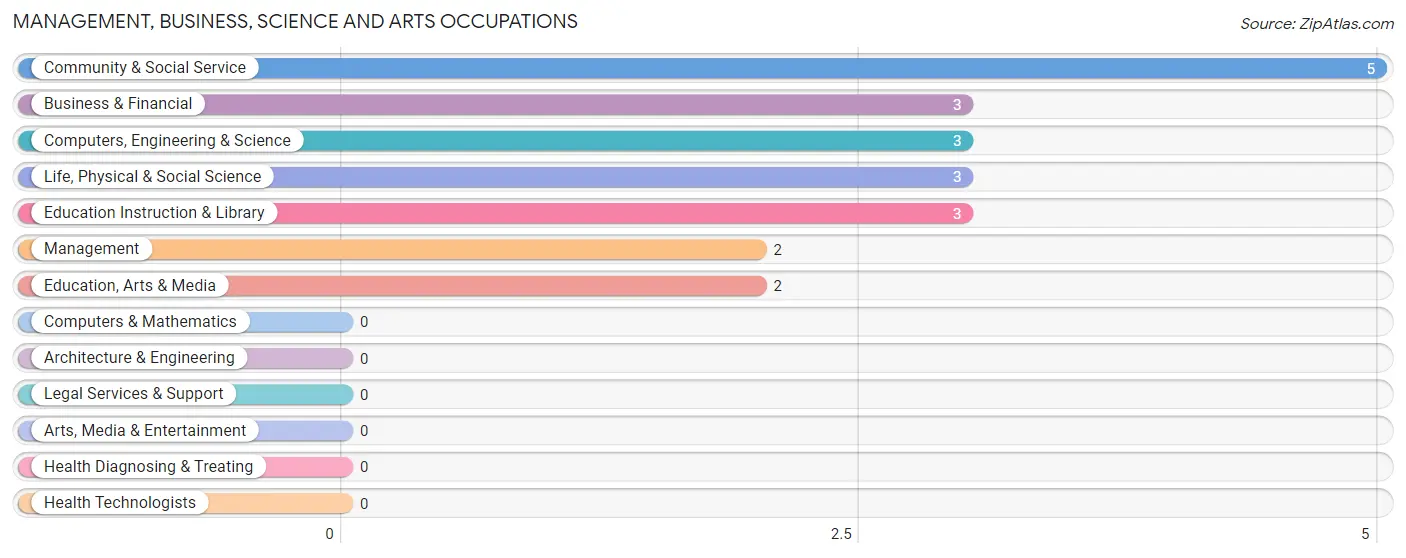
Management, Business, Science and Arts Occupations
The most common Management, Business, Science and Arts occupations in Point Lay are Community & Social Service (5 | 8.1%), Business & Financial (3 | 4.8%), Computers, Engineering & Science (3 | 4.8%), Life, Physical & Social Science (3 | 4.8%), and Education Instruction & Library (3 | 4.8%).
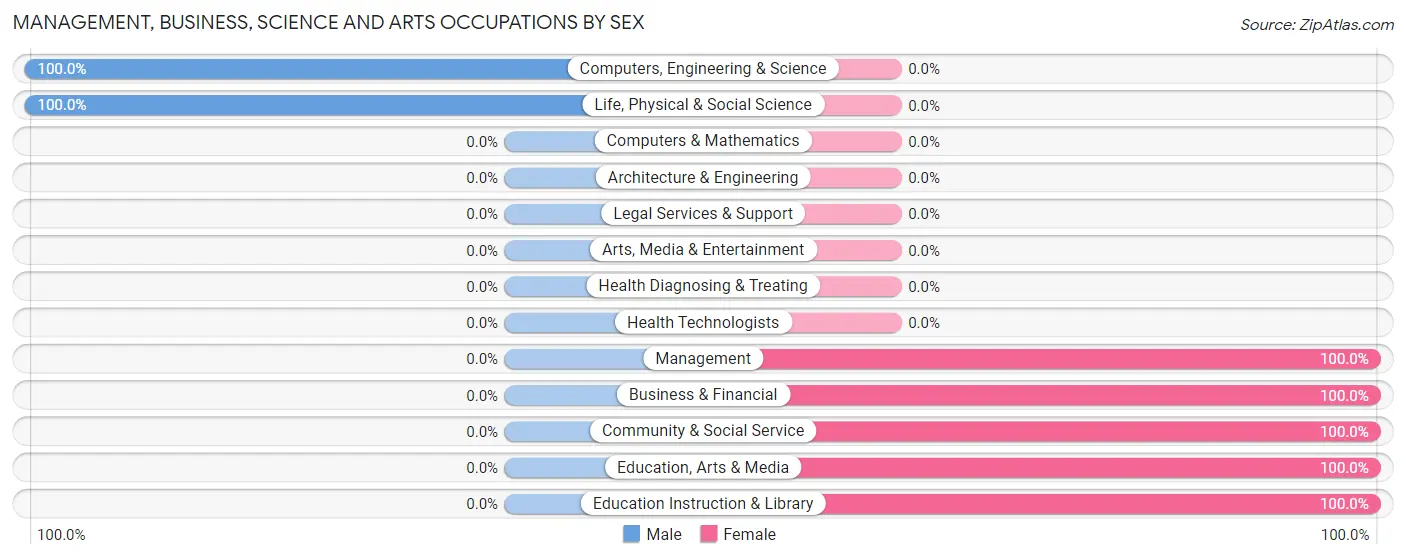
Management, Business, Science and Arts Occupations by Sex
Within the Management, Business, Science and Arts occupations in Point Lay, the most male-oriented occupations are Computers, Engineering & Science (100.0%), and Life, Physical & Social Science (100.0%), while the most female-oriented occupations are Management (100.0%), Business & Financial (100.0%), and Community & Social Service (100.0%).
| Occupation | Male | Female |
| Management | 0 (0.0%) | 2 (100.0%) |
| Business & Financial | 0 (0.0%) | 3 (100.0%) |
| Computers, Engineering & Science | 3 (100.0%) | 0 (0.0%) |
| Computers & Mathematics | 0 (0.0%) | 0 (0.0%) |
| Architecture & Engineering | 0 (0.0%) | 0 (0.0%) |
| Life, Physical & Social Science | 3 (100.0%) | 0 (0.0%) |
| Community & Social Service | 0 (0.0%) | 5 (100.0%) |
| Education, Arts & Media | 0 (0.0%) | 2 (100.0%) |
| Legal Services & Support | 0 (0.0%) | 0 (0.0%) |
| Education Instruction & Library | 0 (0.0%) | 3 (100.0%) |
| Arts, Media & Entertainment | 0 (0.0%) | 0 (0.0%) |
| Health Diagnosing & Treating | 0 (0.0%) | 0 (0.0%) |
| Health Technologists | 0 (0.0%) | 0 (0.0%) |
| Total (Category) | 3 (23.1%) | 10 (76.9%) |
| Total (Overall) | 33 (53.2%) | 29 (46.8%) |
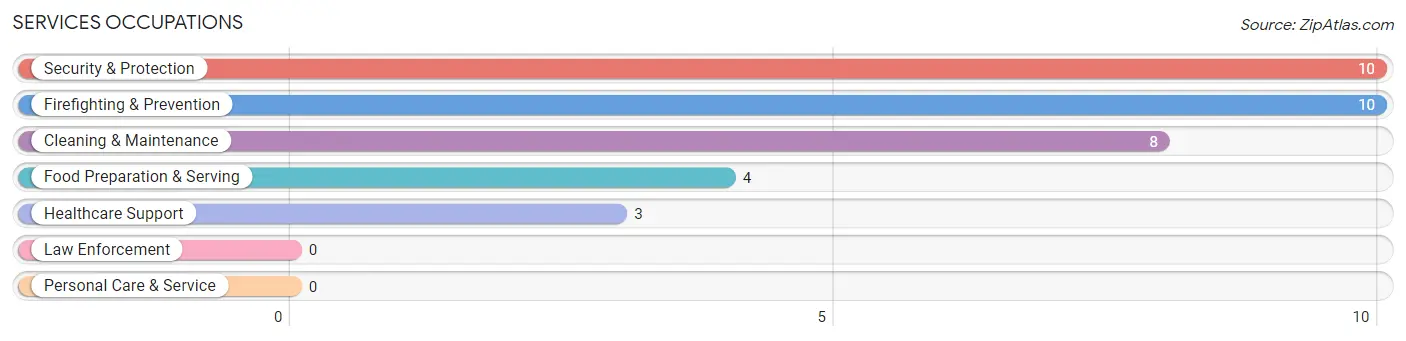
Services Occupations
The most common Services occupations in Point Lay are Security & Protection (10 | 16.1%), Firefighting & Prevention (10 | 16.1%), Cleaning & Maintenance (8 | 12.9%), Food Preparation & Serving (4 | 6.5%), and Healthcare Support (3 | 4.8%).
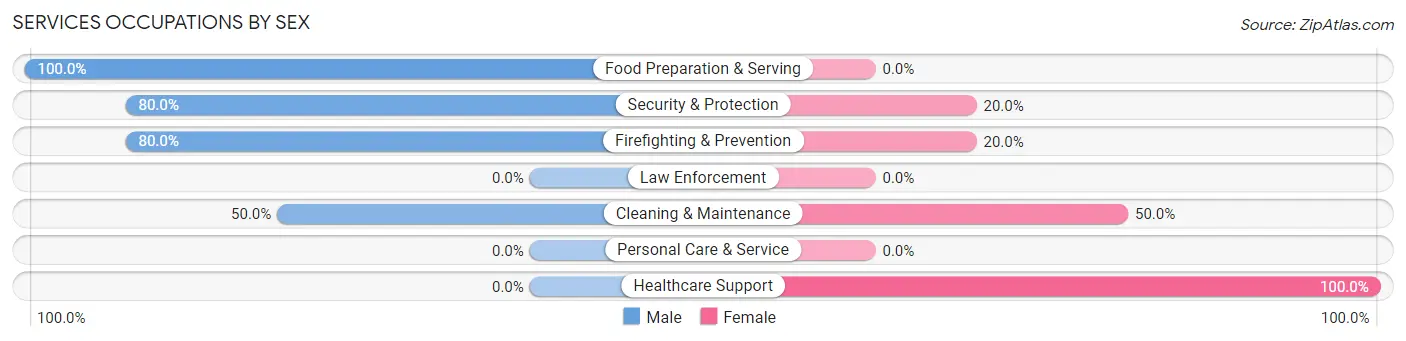
Services Occupations by Sex
Within the Services occupations in Point Lay, the most male-oriented occupations are Food Preparation & Serving (100.0%), Security & Protection (80.0%), and Firefighting & Prevention (80.0%), while the most female-oriented occupations are Healthcare Support (100.0%), Cleaning & Maintenance (50.0%), and Security & Protection (20.0%).
| Occupation | Male | Female |
| Healthcare Support | 0 (0.0%) | 3 (100.0%) |
| Security & Protection | 8 (80.0%) | 2 (20.0%) |
| Firefighting & Prevention | 8 (80.0%) | 2 (20.0%) |
| Law Enforcement | 0 (0.0%) | 0 (0.0%) |
| Food Preparation & Serving | 4 (100.0%) | 0 (0.0%) |
| Cleaning & Maintenance | 4 (50.0%) | 4 (50.0%) |
| Personal Care & Service | 0 (0.0%) | 0 (0.0%) |
| Total (Category) | 16 (64.0%) | 9 (36.0%) |
| Total (Overall) | 33 (53.2%) | 29 (46.8%) |
Sales and Office Occupations
The most common Sales and Office occupations in Point Lay are , and Office & Administration (10 | 16.1%).
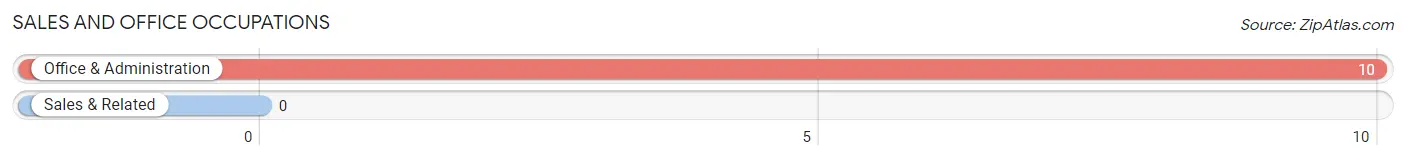
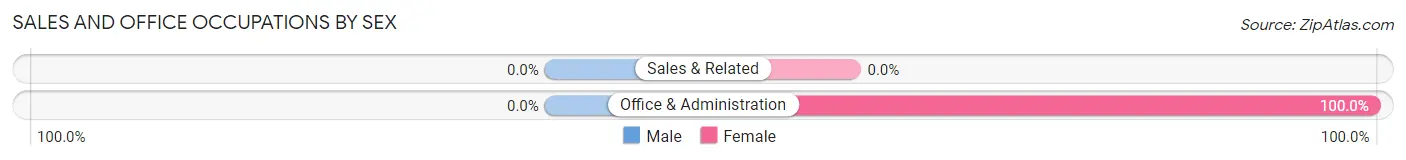
Sales and Office Occupations by Sex
| Occupation | Male | Female |
| Sales & Related | 0 (0.0%) | 0 (0.0%) |
| Office & Administration | 0 (0.0%) | 10 (100.0%) |
| Total (Category) | 0 (0.0%) | 10 (100.0%) |
| Total (Overall) | 33 (53.2%) | 29 (46.8%) |
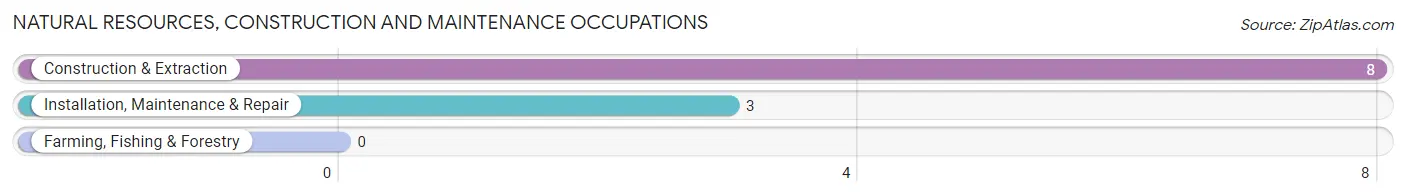
Natural Resources, Construction and Maintenance Occupations
The most common Natural Resources, Construction and Maintenance occupations in Point Lay are Construction & Extraction (8 | 12.9%), and Installation, Maintenance & Repair (3 | 4.8%).
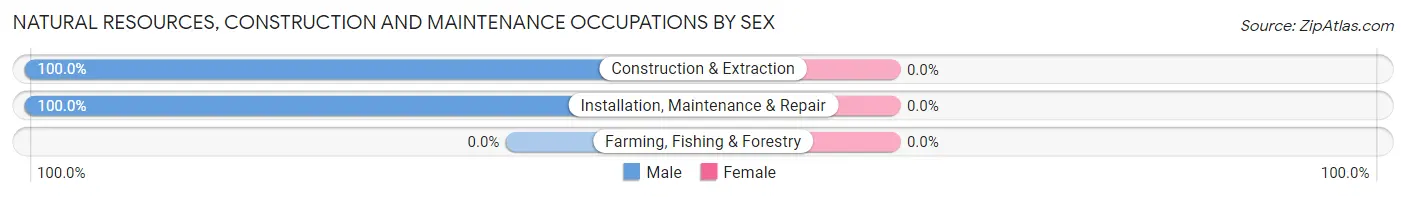
Natural Resources, Construction and Maintenance Occupations by Sex
| Occupation | Male | Female |
| Farming, Fishing & Forestry | 0 (0.0%) | 0 (0.0%) |
| Construction & Extraction | 8 (100.0%) | 0 (0.0%) |
| Installation, Maintenance & Repair | 3 (100.0%) | 0 (0.0%) |
| Total (Category) | 11 (100.0%) | 0 (0.0%) |
| Total (Overall) | 33 (53.2%) | 29 (46.8%) |
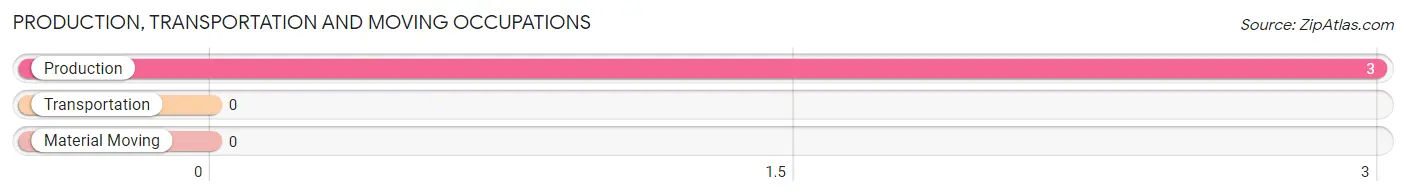
Production, Transportation and Moving Occupations
The most common Production, Transportation and Moving occupations in Point Lay are , and Production (3 | 4.8%).
Production, Transportation and Moving Occupations by Sex
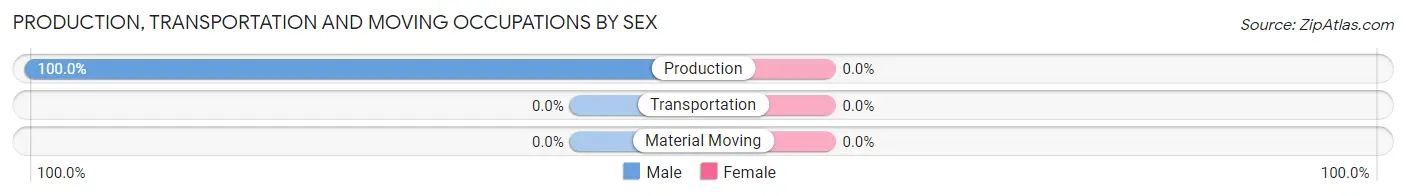
| Occupation | Male | Female |
| Production | 3 (100.0%) | 0 (0.0%) |
| Transportation | 0 (0.0%) | 0 (0.0%) |
| Material Moving | 0 (0.0%) | 0 (0.0%) |
| Total (Category) | 3 (100.0%) | 0 (0.0%) |
| Total (Overall) | 33 (53.2%) | 29 (46.8%) |
Employment Industries by Sex in Point Lay
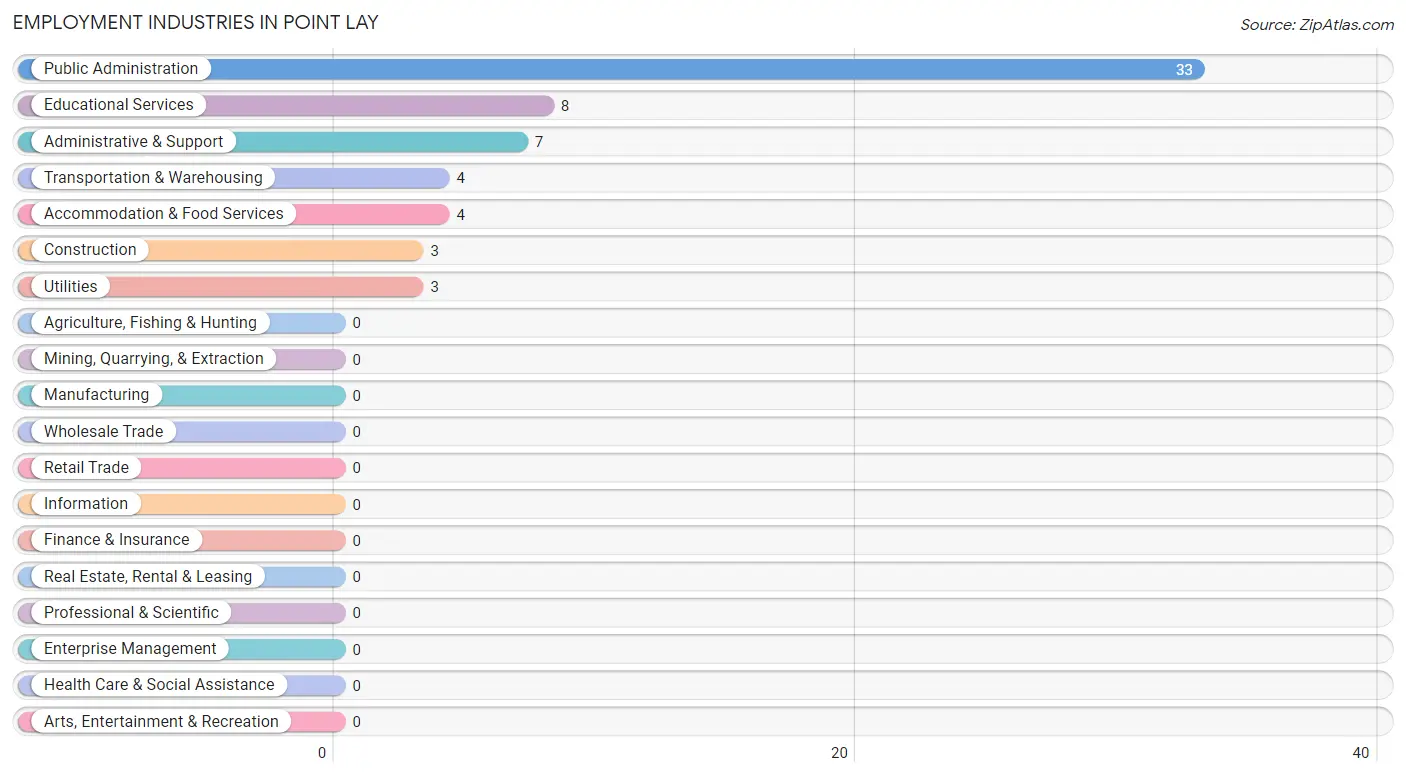
Employment Industries in Point Lay
The major employment industries in Point Lay include Public Administration (33 | 53.2%), Educational Services (8 | 12.9%), Administrative & Support (7 | 11.3%), Transportation & Warehousing (4 | 6.5%), and Accommodation & Food Services (4 | 6.5%).
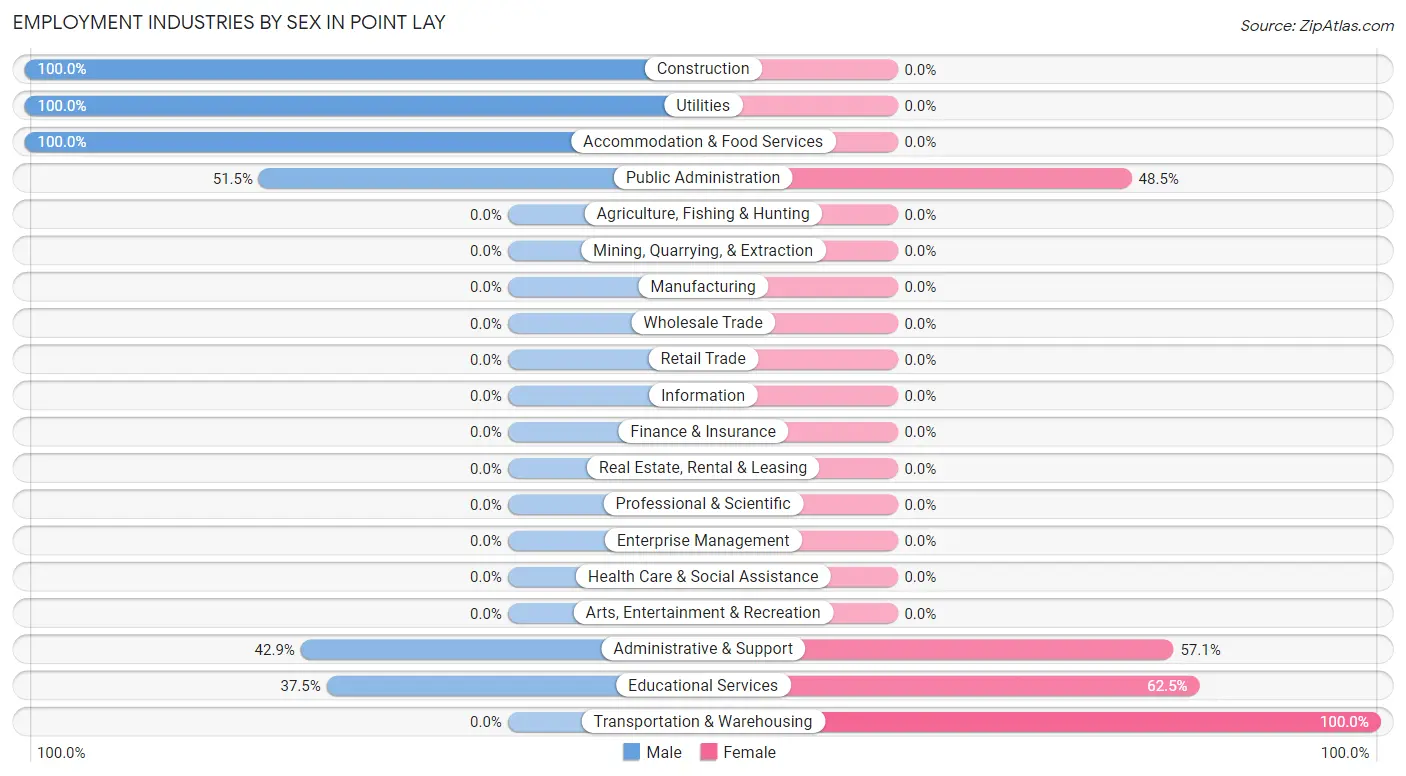
Employment Industries by Sex in Point Lay
The Point Lay industries that see more men than women are Construction (100.0%), Utilities (100.0%), and Accommodation & Food Services (100.0%), whereas the industries that tend to have a higher number of women are Transportation & Warehousing (100.0%), Educational Services (62.5%), and Administrative & Support (57.1%).
| Industry | Male | Female |
| Agriculture, Fishing & Hunting | 0 (0.0%) | 0 (0.0%) |
| Mining, Quarrying, & Extraction | 0 (0.0%) | 0 (0.0%) |
| Construction | 3 (100.0%) | 0 (0.0%) |
| Manufacturing | 0 (0.0%) | 0 (0.0%) |
| Wholesale Trade | 0 (0.0%) | 0 (0.0%) |
| Retail Trade | 0 (0.0%) | 0 (0.0%) |
| Transportation & Warehousing | 0 (0.0%) | 4 (100.0%) |
| Utilities | 3 (100.0%) | 0 (0.0%) |
| Information | 0 (0.0%) | 0 (0.0%) |
| Finance & Insurance | 0 (0.0%) | 0 (0.0%) |
| Real Estate, Rental & Leasing | 0 (0.0%) | 0 (0.0%) |
| Professional & Scientific | 0 (0.0%) | 0 (0.0%) |
| Enterprise Management | 0 (0.0%) | 0 (0.0%) |
| Administrative & Support | 3 (42.9%) | 4 (57.1%) |
| Educational Services | 3 (37.5%) | 5 (62.5%) |
| Health Care & Social Assistance | 0 (0.0%) | 0 (0.0%) |
| Arts, Entertainment & Recreation | 0 (0.0%) | 0 (0.0%) |
| Accommodation & Food Services | 4 (100.0%) | 0 (0.0%) |
| Public Administration | 17 (51.5%) | 16 (48.5%) |
| Total | 33 (53.2%) | 29 (46.8%) |
Education in Point Lay
School Enrollment in Point Lay
The most common levels of schooling among the 69 students in Point Lay are high school (25 | 36.2%), elementary school (17 | 24.6%), and middle school (15 | 21.7%).
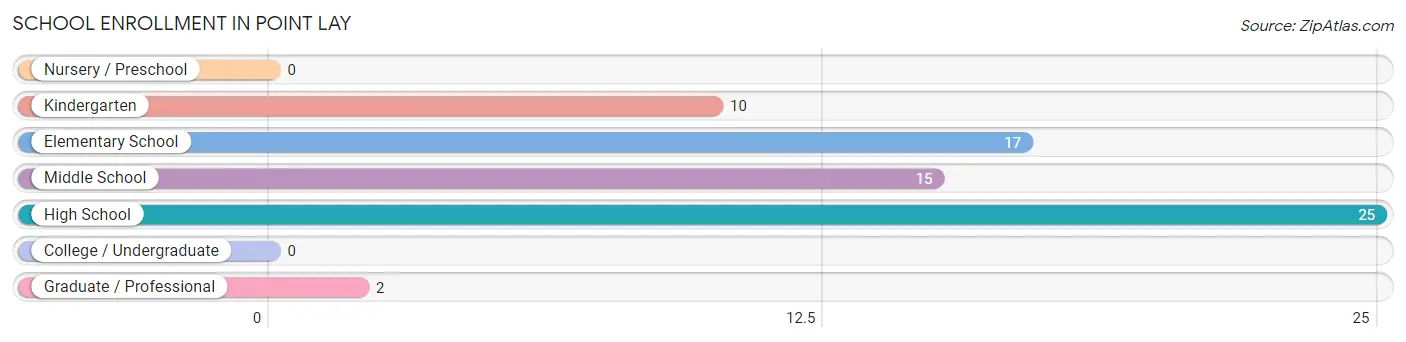
| School Level | # Students | % Students |
| Nursery / Preschool | 0 | 0.0% |
| Kindergarten | 10 | 14.5% |
| Elementary School | 17 | 24.6% |
| Middle School | 15 | 21.7% |
| High School | 25 | 36.2% |
| College / Undergraduate | 0 | 0.0% |
| Graduate / Professional | 2 | 2.9% |
| Total | 69 | 100.0% |
School Enrollment by Age by Funding Source in Point Lay
Out of a total of 69 students who are enrolled in schools in Point Lay, 2 (2.9%) attend a private institution, while the remaining 67 (97.1%) are enrolled in public schools. The age group of 25 to 34 year olds has the highest likelihood of being enrolled in private schools, with 2 (100.0% in the age bracket) enrolled. Conversely, the age group of 3 to 4 year olds has the lowest likelihood of being enrolled in a private school, with 5 (100.0% in the age bracket) attending a public institution.
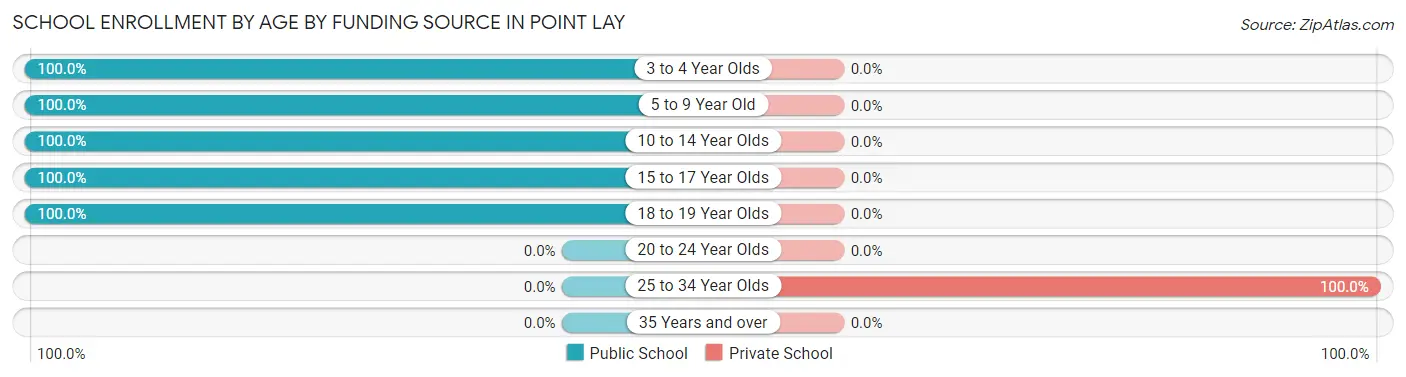
| Age Bracket | Public School | Private School |
| 3 to 4 Year Olds | 5 (100.0%) | 0 (0.0%) |
| 5 to 9 Year Old | 19 (100.0%) | 0 (0.0%) |
| 10 to 14 Year Olds | 21 (100.0%) | 0 (0.0%) |
| 15 to 17 Year Olds | 21 (100.0%) | 0 (0.0%) |
| 18 to 19 Year Olds | 1 (100.0%) | 0 (0.0%) |
| 20 to 24 Year Olds | 0 (0.0%) | 0 (0.0%) |
| 25 to 34 Year Olds | 0 (0.0%) | 2 (100.0%) |
| 35 Years and over | 0 (0.0%) | 0 (0.0%) |
| Total | 67 (97.1%) | 2 (2.9%) |
Educational Attainment by Field of Study in Point Lay
Arts & humanities (3 | 60.0%), and education (2 | 40.0%) are the most common fields of study among 5 individuals in Point Lay who have obtained a bachelor's degree or higher.
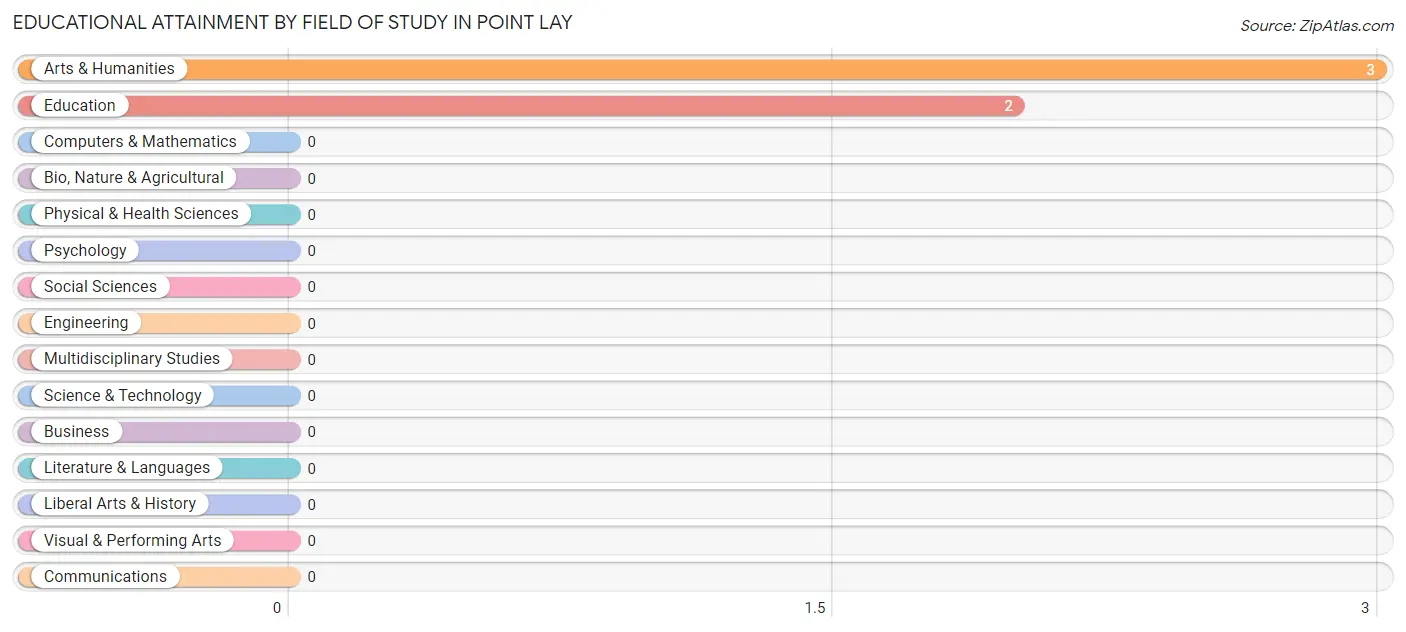
| Field of Study | # Graduates | % Graduates |
| Computers & Mathematics | 0 | 0.0% |
| Bio, Nature & Agricultural | 0 | 0.0% |
| Physical & Health Sciences | 0 | 0.0% |
| Psychology | 0 | 0.0% |
| Social Sciences | 0 | 0.0% |
| Engineering | 0 | 0.0% |
| Multidisciplinary Studies | 0 | 0.0% |
| Science & Technology | 0 | 0.0% |
| Business | 0 | 0.0% |
| Education | 2 | 40.0% |
| Literature & Languages | 0 | 0.0% |
| Liberal Arts & History | 0 | 0.0% |
| Visual & Performing Arts | 0 | 0.0% |
| Communications | 0 | 0.0% |
| Arts & Humanities | 3 | 60.0% |
| Total | 5 | 100.0% |
Transportation & Commute in Point Lay
Vehicle Availability by Sex in Point Lay
The most prevalent vehicle ownership categories in Point Lay are males with no vehicle (22, accounting for 66.7%) and females with no vehicle (27, making up 75.9%).
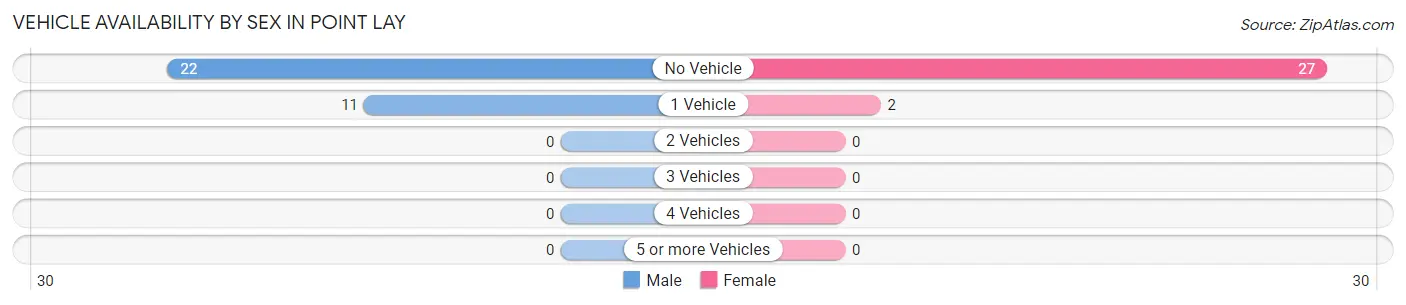
| Vehicles Available | Male | Female |
| No Vehicle | 22 (66.7%) | 27 (93.1%) |
| 1 Vehicle | 11 (33.3%) | 2 (6.9%) |
| 2 Vehicles | 0 (0.0%) | 0 (0.0%) |
| 3 Vehicles | 0 (0.0%) | 0 (0.0%) |
| 4 Vehicles | 0 (0.0%) | 0 (0.0%) |
| 5 or more Vehicles | 0 (0.0%) | 0 (0.0%) |
| Total | 33 (100.0%) | 29 (100.0%) |
Commute Time in Point Lay
The most frequently occuring commute durations in Point Lay are 5 to 9 minutes (32 commuters, 58.2%), less than 5 minutes (16 commuters, 29.1%), and 10 to 14 minutes (7 commuters, 12.7%).
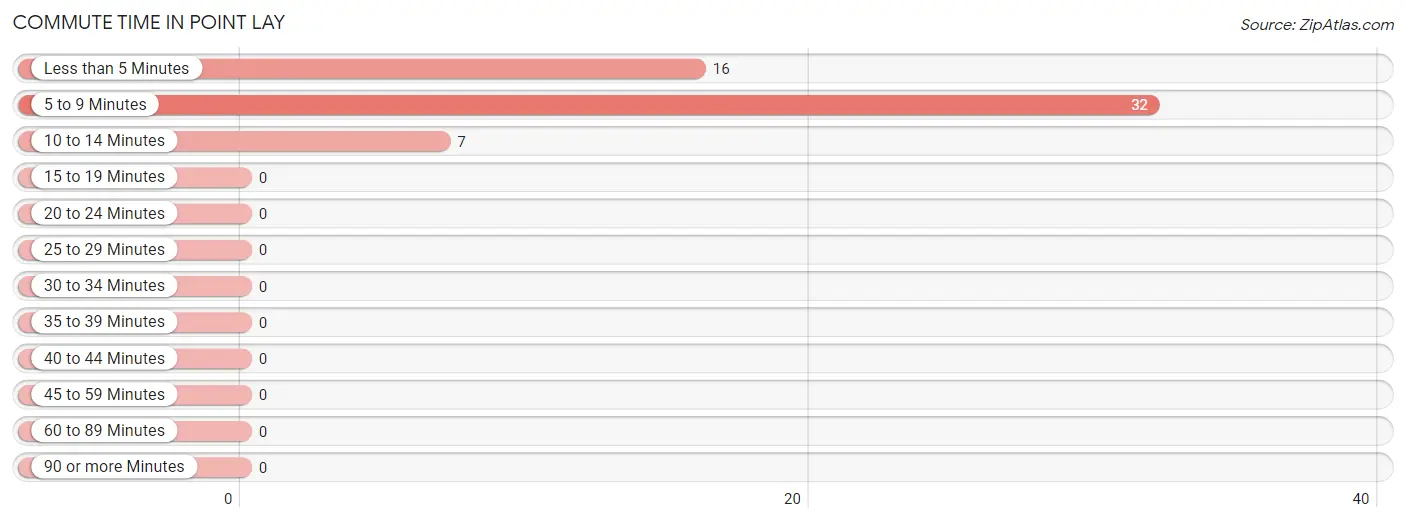
| Commute Time | # Commuters | % Commuters |
| Less than 5 Minutes | 16 | 29.1% |
| 5 to 9 Minutes | 32 | 58.2% |
| 10 to 14 Minutes | 7 | 12.7% |
| 15 to 19 Minutes | 0 | 0.0% |
| 20 to 24 Minutes | 0 | 0.0% |
| 25 to 29 Minutes | 0 | 0.0% |
| 30 to 34 Minutes | 0 | 0.0% |
| 35 to 39 Minutes | 0 | 0.0% |
| 40 to 44 Minutes | 0 | 0.0% |
| 45 to 59 Minutes | 0 | 0.0% |
| 60 to 89 Minutes | 0 | 0.0% |
| 90 or more Minutes | 0 | 0.0% |
Commute Time by Sex in Point Lay
The most common commute times in Point Lay are 5 to 9 minutes (14 commuters, 48.3%) for males and 5 to 9 minutes (18 commuters, 69.2%) for females.
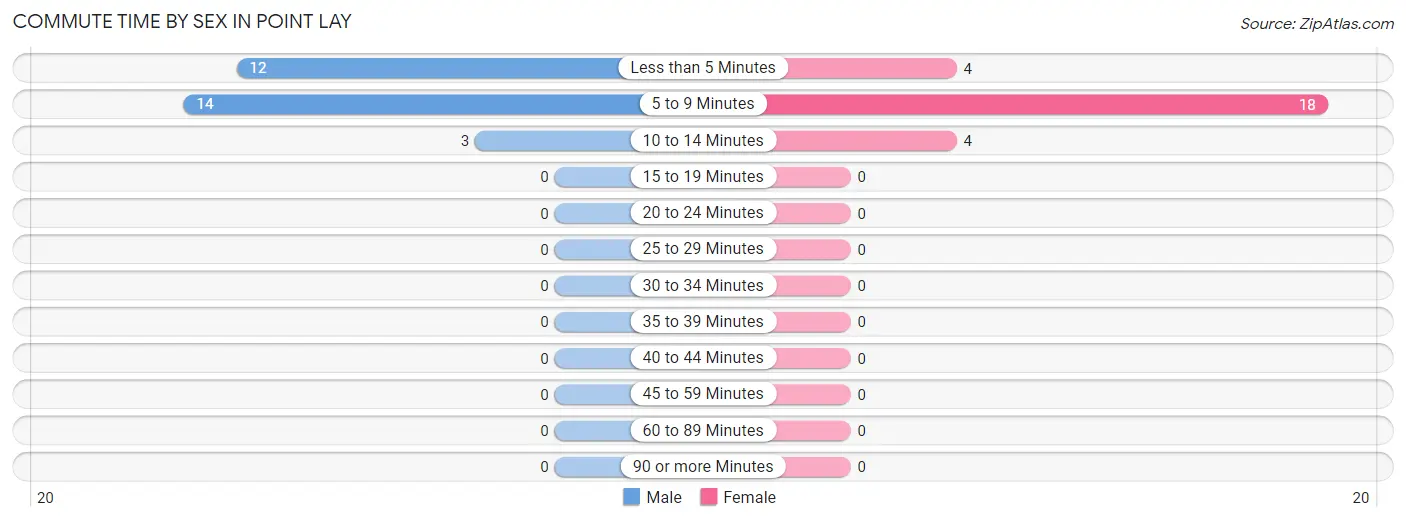
| Commute Time | Male | Female |
| Less than 5 Minutes | 12 (41.4%) | 4 (15.4%) |
| 5 to 9 Minutes | 14 (48.3%) | 18 (69.2%) |
| 10 to 14 Minutes | 3 (10.3%) | 4 (15.4%) |
| 15 to 19 Minutes | 0 (0.0%) | 0 (0.0%) |
| 20 to 24 Minutes | 0 (0.0%) | 0 (0.0%) |
| 25 to 29 Minutes | 0 (0.0%) | 0 (0.0%) |
| 30 to 34 Minutes | 0 (0.0%) | 0 (0.0%) |
| 35 to 39 Minutes | 0 (0.0%) | 0 (0.0%) |
| 40 to 44 Minutes | 0 (0.0%) | 0 (0.0%) |
| 45 to 59 Minutes | 0 (0.0%) | 0 (0.0%) |
| 60 to 89 Minutes | 0 (0.0%) | 0 (0.0%) |
| 90 or more Minutes | 0 (0.0%) | 0 (0.0%) |
Time of Departure to Work by Sex in Point Lay
The most frequent times of departure to work in Point Lay are 8:00 AM to 8:29 AM (19, 65.5%) for males and 8:00 AM to 8:29 AM (16, 61.5%) for females.
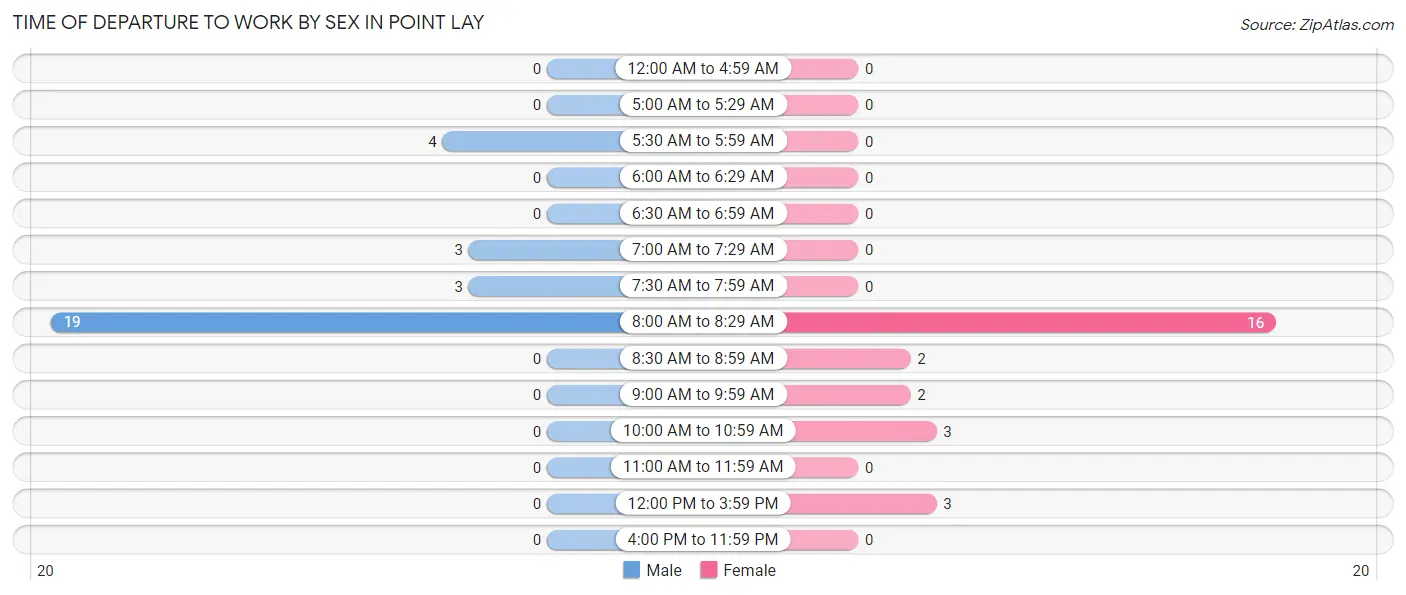
| Time of Departure | Male | Female |
| 12:00 AM to 4:59 AM | 0 (0.0%) | 0 (0.0%) |
| 5:00 AM to 5:29 AM | 0 (0.0%) | 0 (0.0%) |
| 5:30 AM to 5:59 AM | 4 (13.8%) | 0 (0.0%) |
| 6:00 AM to 6:29 AM | 0 (0.0%) | 0 (0.0%) |
| 6:30 AM to 6:59 AM | 0 (0.0%) | 0 (0.0%) |
| 7:00 AM to 7:29 AM | 3 (10.3%) | 0 (0.0%) |
| 7:30 AM to 7:59 AM | 3 (10.3%) | 0 (0.0%) |
| 8:00 AM to 8:29 AM | 19 (65.5%) | 16 (61.5%) |
| 8:30 AM to 8:59 AM | 0 (0.0%) | 2 (7.7%) |
| 9:00 AM to 9:59 AM | 0 (0.0%) | 2 (7.7%) |
| 10:00 AM to 10:59 AM | 0 (0.0%) | 3 (11.5%) |
| 11:00 AM to 11:59 AM | 0 (0.0%) | 0 (0.0%) |
| 12:00 PM to 3:59 PM | 0 (0.0%) | 3 (11.5%) |
| 4:00 PM to 11:59 PM | 0 (0.0%) | 0 (0.0%) |
| Total | 29 (100.0%) | 26 (100.0%) |
Housing Occupancy in Point Lay
Occupancy by Ownership in Point Lay
Of the total 43 dwellings in Point Lay, owner-occupied units account for 24 (55.8%), while renter-occupied units make up 19 (44.2%).
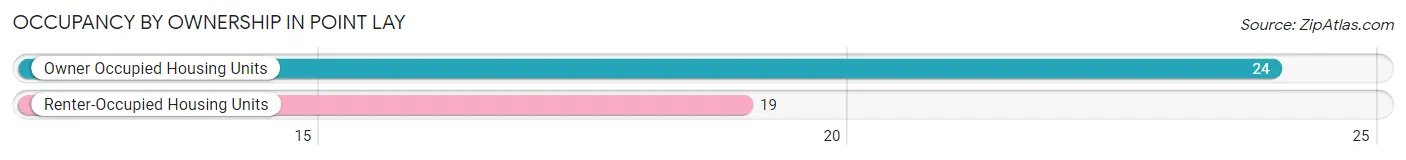
| Occupancy | # Housing Units | % Housing Units |
| Owner Occupied Housing Units | 24 | 55.8% |
| Renter-Occupied Housing Units | 19 | 44.2% |
| Total Occupied Housing Units | 43 | 100.0% |
Occupancy by Household Size in Point Lay
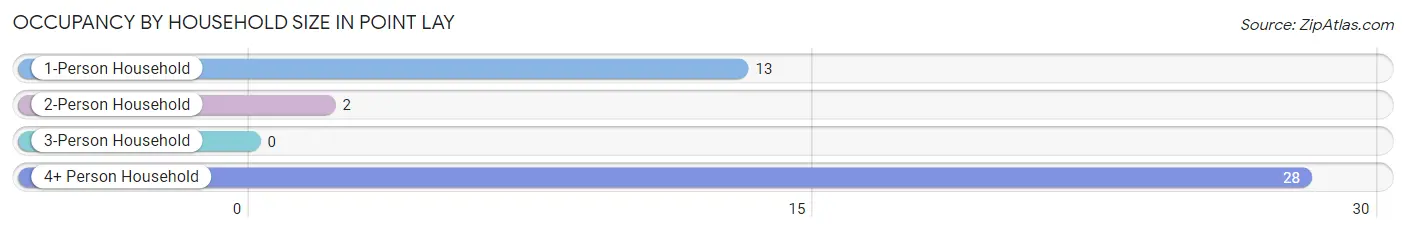
| Household Size | # Housing Units | % Housing Units |
| 1-Person Household | 13 | 30.2% |
| 2-Person Household | 2 | 4.6% |
| 3-Person Household | 0 | 0.0% |
| 4+ Person Household | 28 | 65.1% |
| Total Housing Units | 43 | 100.0% |
Occupancy by Ownership by Household Size in Point Lay
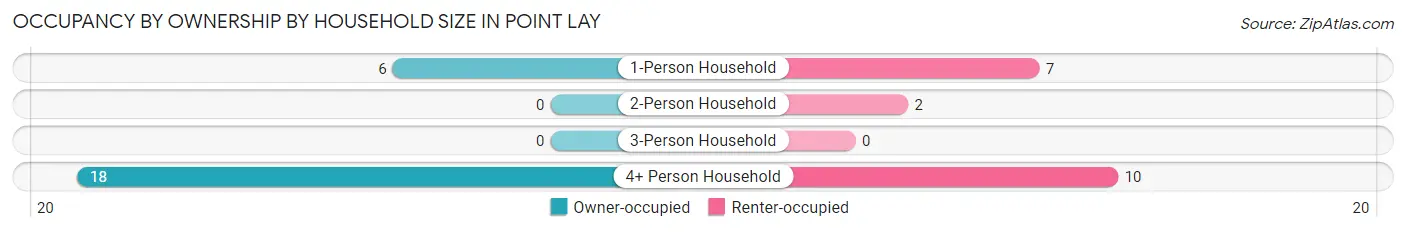
| Household Size | Owner-occupied | Renter-occupied |
| 1-Person Household | 6 (46.2%) | 7 (53.8%) |
| 2-Person Household | 0 (0.0%) | 2 (100.0%) |
| 3-Person Household | 0 (0.0%) | 0 (0.0%) |
| 4+ Person Household | 18 (64.3%) | 10 (35.7%) |
| Total Housing Units | 24 (55.8%) | 19 (44.2%) |
Occupancy by Educational Attainment in Point Lay
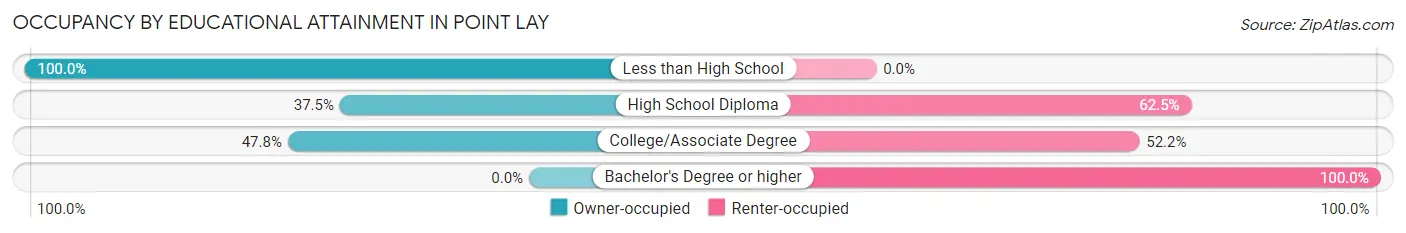
| Household Size | Owner-occupied | Renter-occupied |
| Less than High School | 10 (100.0%) | 0 (0.0%) |
| High School Diploma | 3 (37.5%) | 5 (62.5%) |
| College/Associate Degree | 11 (47.8%) | 12 (52.2%) |
| Bachelor's Degree or higher | 0 (0.0%) | 2 (100.0%) |
Occupancy by Age of Householder in Point Lay
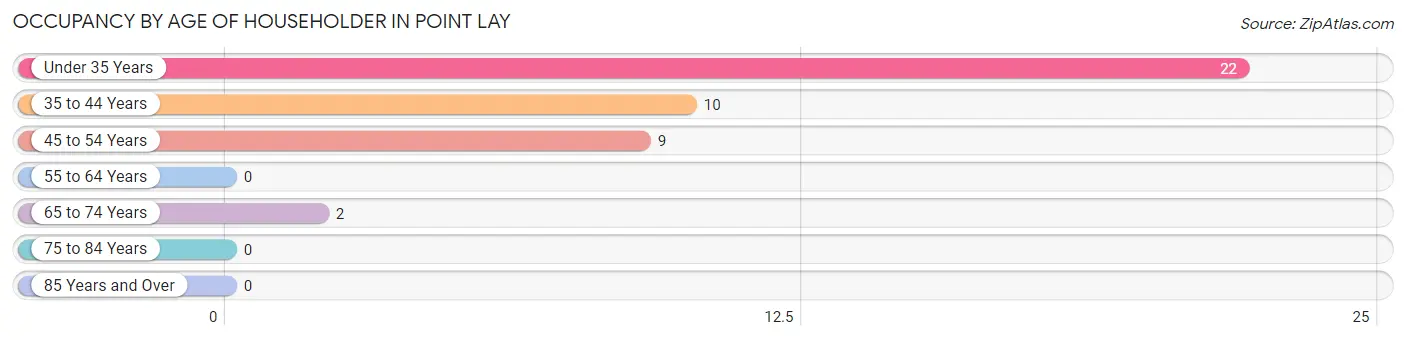
| Age Bracket | # Households | % Households |
| Under 35 Years | 22 | 51.2% |
| 35 to 44 Years | 10 | 23.3% |
| 45 to 54 Years | 9 | 20.9% |
| 55 to 64 Years | 0 | 0.0% |
| 65 to 74 Years | 2 | 4.6% |
| 75 to 84 Years | 0 | 0.0% |
| 85 Years and Over | 0 | 0.0% |
| Total | 43 | 100.0% |
Housing Finances in Point Lay
Median Income by Occupancy in Point Lay
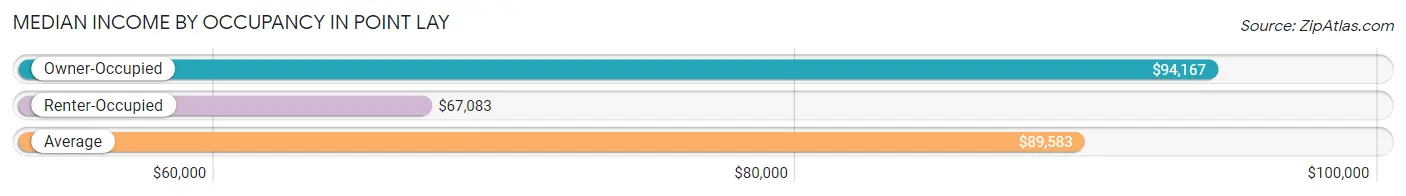
| Occupancy Type | # Households | Median Income |
| Owner-Occupied | 24 (55.8%) | $94,167 |
| Renter-Occupied | 19 (44.2%) | $67,083 |
| Average | 43 (100.0%) | $89,583 |
Occupancy by Householder Income Bracket in Point Lay
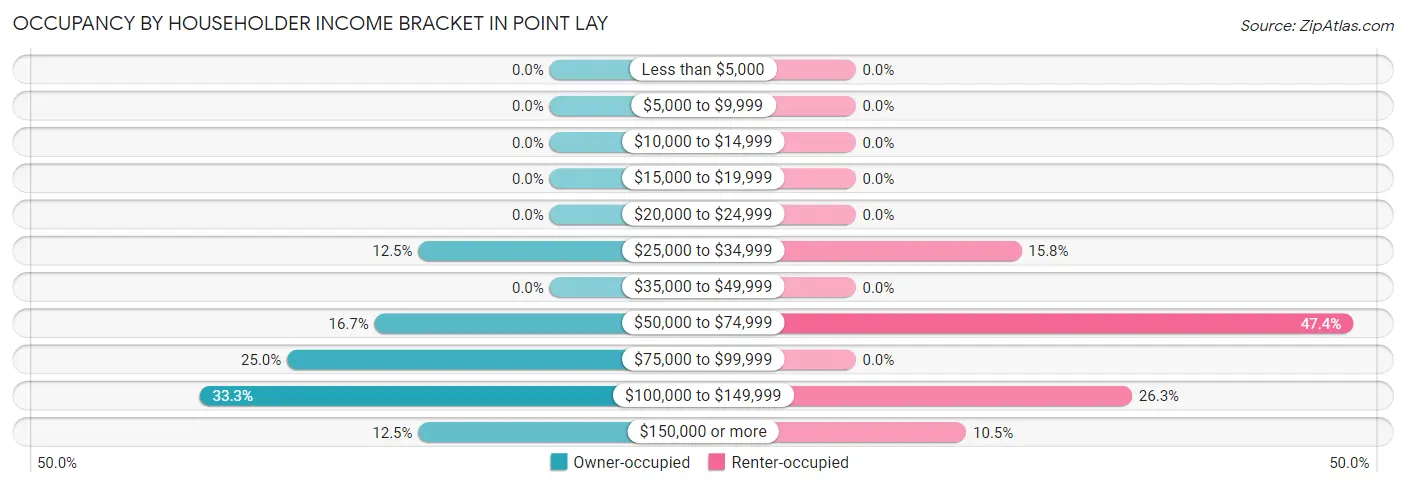
| Income Bracket | Owner-occupied | Renter-occupied |
| Less than $5,000 | 0 (0.0%) | 0 (0.0%) |
| $5,000 to $9,999 | 0 (0.0%) | 0 (0.0%) |
| $10,000 to $14,999 | 0 (0.0%) | 0 (0.0%) |
| $15,000 to $19,999 | 0 (0.0%) | 0 (0.0%) |
| $20,000 to $24,999 | 0 (0.0%) | 0 (0.0%) |
| $25,000 to $34,999 | 3 (12.5%) | 3 (15.8%) |
| $35,000 to $49,999 | 0 (0.0%) | 0 (0.0%) |
| $50,000 to $74,999 | 4 (16.7%) | 9 (47.4%) |
| $75,000 to $99,999 | 6 (25.0%) | 0 (0.0%) |
| $100,000 to $149,999 | 8 (33.3%) | 5 (26.3%) |
| $150,000 or more | 3 (12.5%) | 2 (10.5%) |
| Total | 24 (100.0%) | 19 (100.0%) |
Monthly Housing Cost Tiers in Point Lay
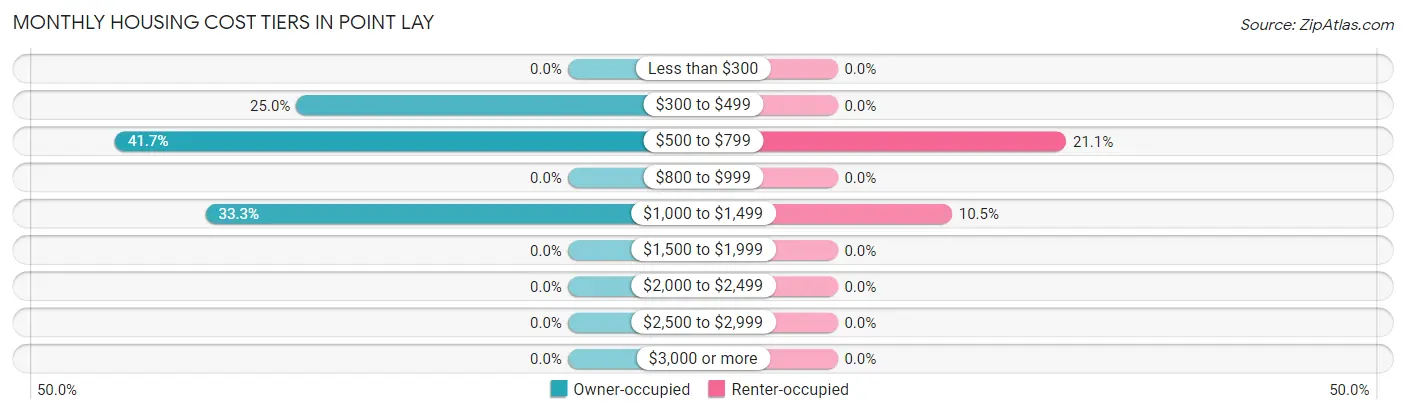
| Monthly Cost | Owner-occupied | Renter-occupied |
| Less than $300 | 0 (0.0%) | 0 (0.0%) |
| $300 to $499 | 6 (25.0%) | 0 (0.0%) |
| $500 to $799 | 10 (41.7%) | 4 (21.0%) |
| $800 to $999 | 0 (0.0%) | 0 (0.0%) |
| $1,000 to $1,499 | 8 (33.3%) | 2 (10.5%) |
| $1,500 to $1,999 | 0 (0.0%) | 0 (0.0%) |
| $2,000 to $2,499 | 0 (0.0%) | 0 (0.0%) |
| $2,500 to $2,999 | 0 (0.0%) | 0 (0.0%) |
| $3,000 or more | 0 (0.0%) | 0 (0.0%) |
| Total | 24 (100.0%) | 19 (100.0%) |
Physical Housing Characteristics in Point Lay
Housing Structures in Point Lay
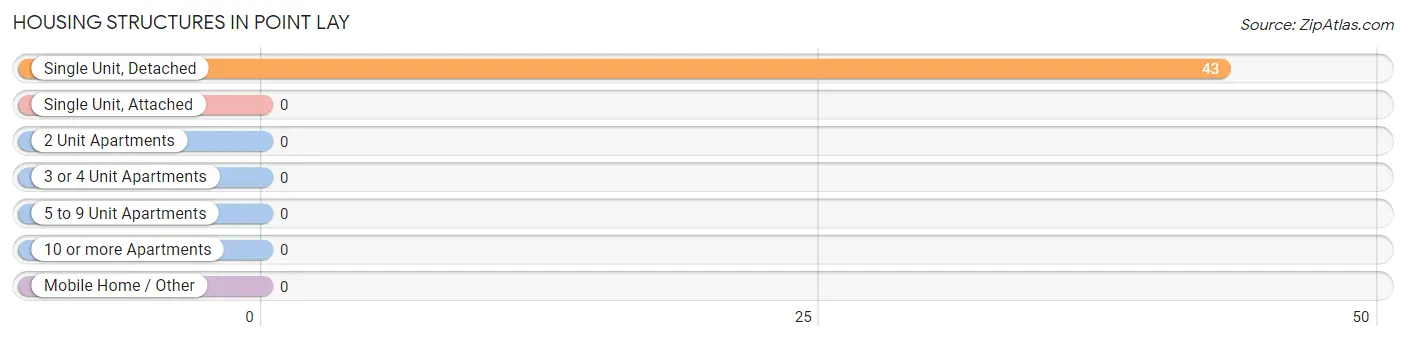
| Structure Type | # Housing Units | % Housing Units |
| Single Unit, Detached | 43 | 100.0% |
| Single Unit, Attached | 0 | 0.0% |
| 2 Unit Apartments | 0 | 0.0% |
| 3 or 4 Unit Apartments | 0 | 0.0% |
| 5 to 9 Unit Apartments | 0 | 0.0% |
| 10 or more Apartments | 0 | 0.0% |
| Mobile Home / Other | 0 | 0.0% |
| Total | 43 | 100.0% |
Housing Structures by Occupancy in Point Lay
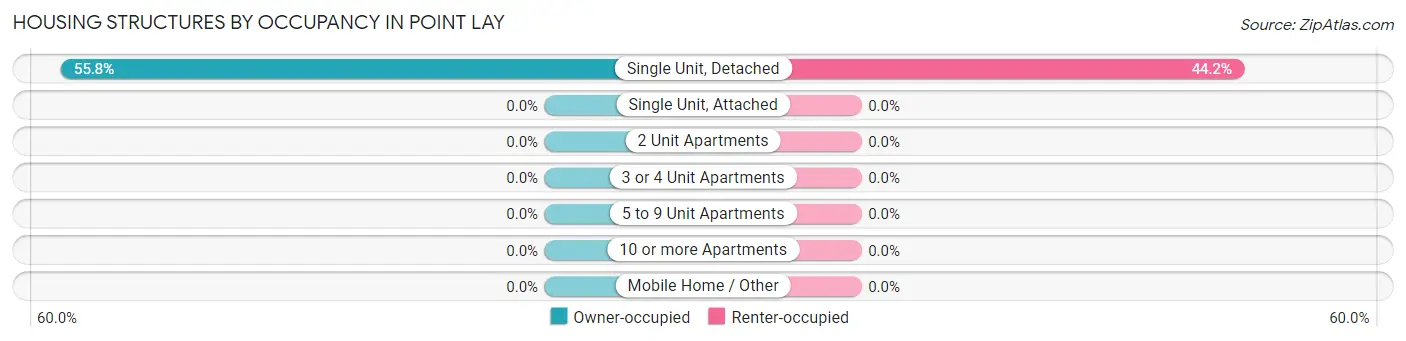
| Structure Type | Owner-occupied | Renter-occupied |
| Single Unit, Detached | 24 (55.8%) | 19 (44.2%) |
| Single Unit, Attached | 0 (0.0%) | 0 (0.0%) |
| 2 Unit Apartments | 0 (0.0%) | 0 (0.0%) |
| 3 or 4 Unit Apartments | 0 (0.0%) | 0 (0.0%) |
| 5 to 9 Unit Apartments | 0 (0.0%) | 0 (0.0%) |
| 10 or more Apartments | 0 (0.0%) | 0 (0.0%) |
| Mobile Home / Other | 0 (0.0%) | 0 (0.0%) |
| Total | 24 (55.8%) | 19 (44.2%) |
Housing Structures by Number of Rooms in Point Lay
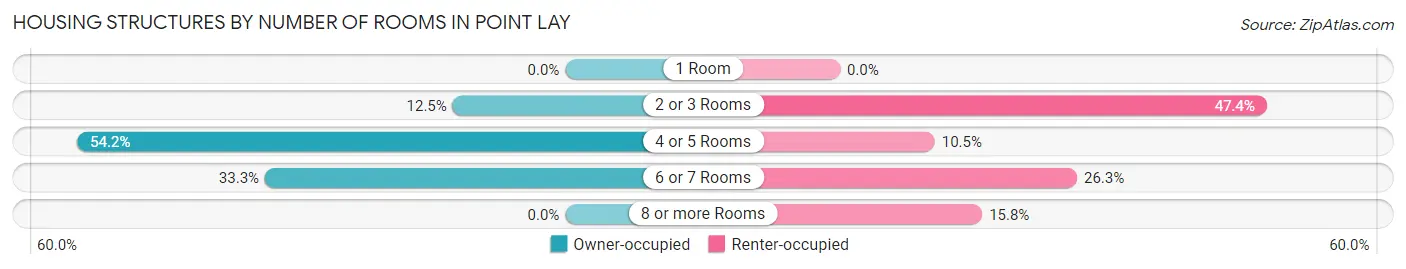
| Number of Rooms | Owner-occupied | Renter-occupied |
| 1 Room | 0 (0.0%) | 0 (0.0%) |
| 2 or 3 Rooms | 3 (12.5%) | 9 (47.4%) |
| 4 or 5 Rooms | 13 (54.2%) | 2 (10.5%) |
| 6 or 7 Rooms | 8 (33.3%) | 5 (26.3%) |
| 8 or more Rooms | 0 (0.0%) | 3 (15.8%) |
| Total | 24 (100.0%) | 19 (100.0%) |
Housing Structure by Heating Type in Point Lay
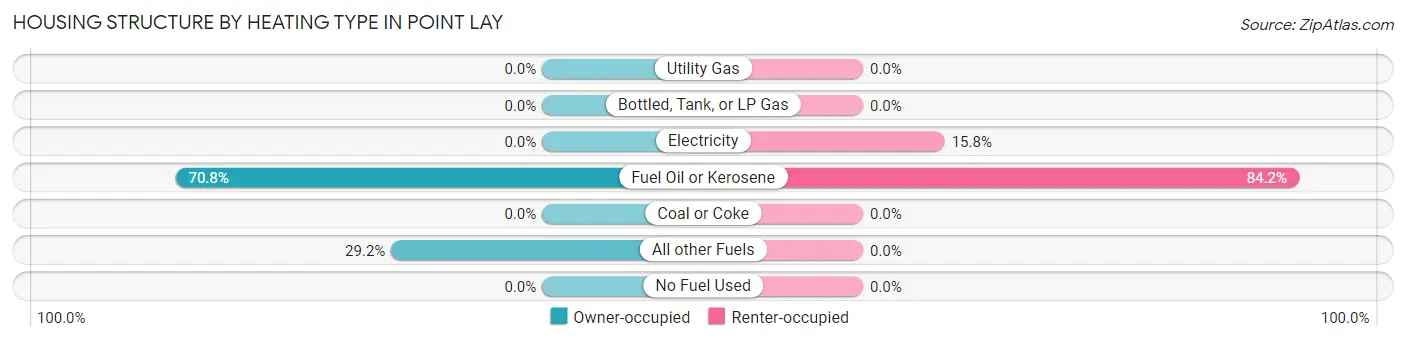
| Heating Type | Owner-occupied | Renter-occupied |
| Utility Gas | 0 (0.0%) | 0 (0.0%) |
| Bottled, Tank, or LP Gas | 0 (0.0%) | 0 (0.0%) |
| Electricity | 0 (0.0%) | 3 (15.8%) |
| Fuel Oil or Kerosene | 17 (70.8%) | 16 (84.2%) |
| Coal or Coke | 0 (0.0%) | 0 (0.0%) |
| All other Fuels | 7 (29.2%) | 0 (0.0%) |
| No Fuel Used | 0 (0.0%) | 0 (0.0%) |
| Total | 24 (100.0%) | 19 (100.0%) |
Household Vehicle Usage in Point Lay
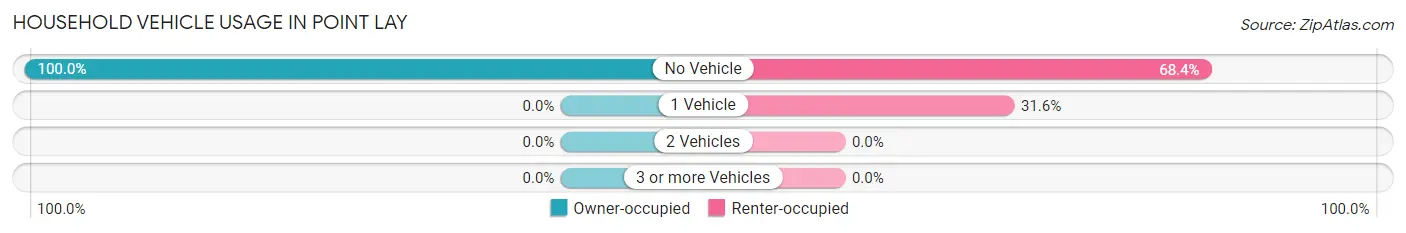
| Vehicles per Household | Owner-occupied | Renter-occupied |
| No Vehicle | 24 (100.0%) | 13 (68.4%) |
| 1 Vehicle | 0 (0.0%) | 6 (31.6%) |
| 2 Vehicles | 0 (0.0%) | 0 (0.0%) |
| 3 or more Vehicles | 0 (0.0%) | 0 (0.0%) |
| Total | 24 (100.0%) | 19 (100.0%) |
Real Estate & Mortgages in Point Lay
Real Estate and Mortgage Overview in Point Lay
| Characteristic | Without Mortgage | With Mortgage |
| Housing Units | 16 | 8 |
| Median Property Value | $116,700 | $0 |
| Median Household Income | $88,333 | $0 |
| Monthly Housing Costs | $550 | $0 |
| Real Estate Taxes | $2,250 | $8 |
Property Value by Mortgage Status in Point Lay
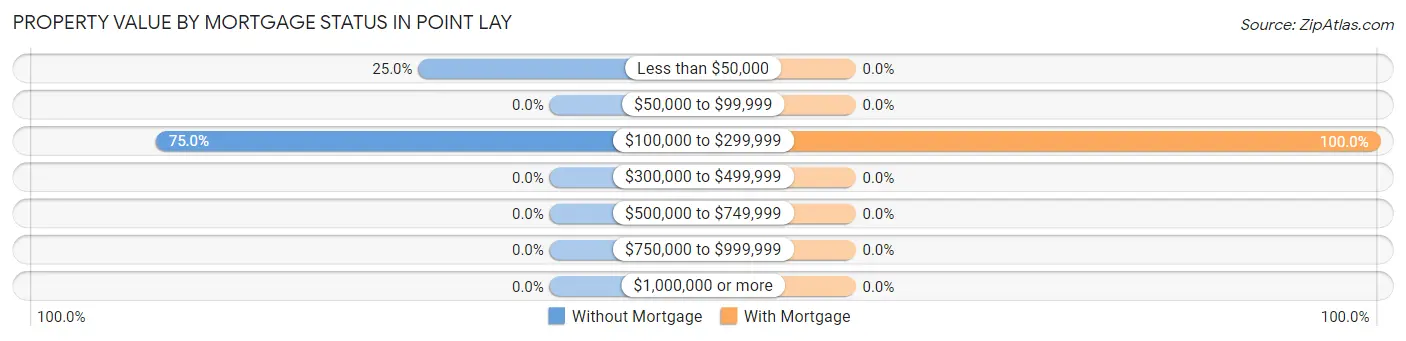
| Property Value | Without Mortgage | With Mortgage |
| Less than $50,000 | 4 (25.0%) | 0 (0.0%) |
| $50,000 to $99,999 | 0 (0.0%) | 0 (0.0%) |
| $100,000 to $299,999 | 12 (75.0%) | 8 (100.0%) |
| $300,000 to $499,999 | 0 (0.0%) | 0 (0.0%) |
| $500,000 to $749,999 | 0 (0.0%) | 0 (0.0%) |
| $750,000 to $999,999 | 0 (0.0%) | 0 (0.0%) |
| $1,000,000 or more | 0 (0.0%) | 0 (0.0%) |
| Total | 16 (100.0%) | 8 (100.0%) |
Household Income by Mortgage Status in Point Lay
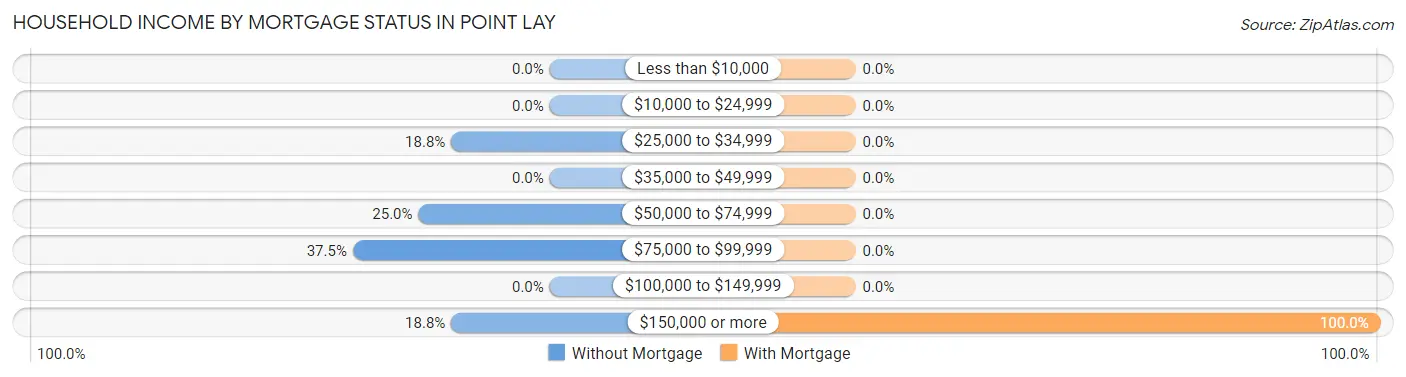
| Household Income | Without Mortgage | With Mortgage |
| Less than $10,000 | 0 (0.0%) | 0 (0.0%) |
| $10,000 to $24,999 | 0 (0.0%) | 0 (0.0%) |
| $25,000 to $34,999 | 3 (18.8%) | 0 (0.0%) |
| $35,000 to $49,999 | 0 (0.0%) | 0 (0.0%) |
| $50,000 to $74,999 | 4 (25.0%) | 0 (0.0%) |
| $75,000 to $99,999 | 6 (37.5%) | 0 (0.0%) |
| $100,000 to $149,999 | 0 (0.0%) | 0 (0.0%) |
| $150,000 or more | 3 (18.8%) | 8 (100.0%) |
| Total | 16 (100.0%) | 8 (100.0%) |
Property Value to Household Income Ratio in Point Lay
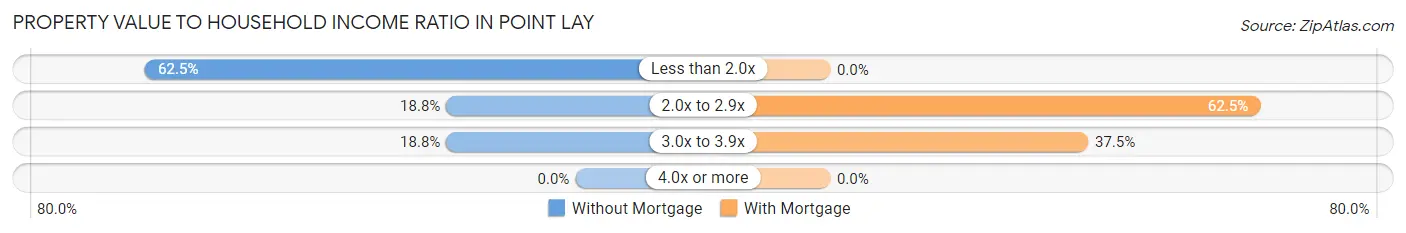
| Value-to-Income Ratio | Without Mortgage | With Mortgage |
| Less than 2.0x | 10 (62.5%) | 0 (0.0%) |
| 2.0x to 2.9x | 3 (18.8%) | 5 (62.5%) |
| 3.0x to 3.9x | 3 (18.8%) | 3 (37.5%) |
| 4.0x or more | 0 (0.0%) | 0 (0.0%) |
| Total | 16 (100.0%) | 8 (100.0%) |
Real Estate Taxes by Mortgage Status in Point Lay
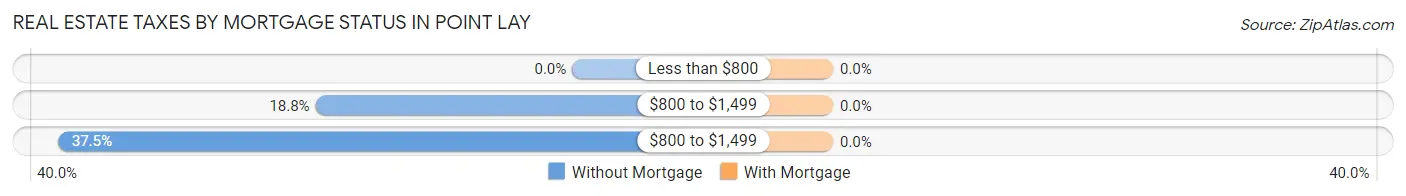
| Property Taxes | Without Mortgage | With Mortgage |
| Less than $800 | 0 (0.0%) | 0 (0.0%) |
| $800 to $1,499 | 3 (18.8%) | 0 (0.0%) |
| $800 to $1,499 | 6 (37.5%) | 0 (0.0%) |
| Total | 16 (100.0%) | 8 (100.0%) |
Health & Disability in Point Lay
Health Insurance Coverage by Age in Point Lay
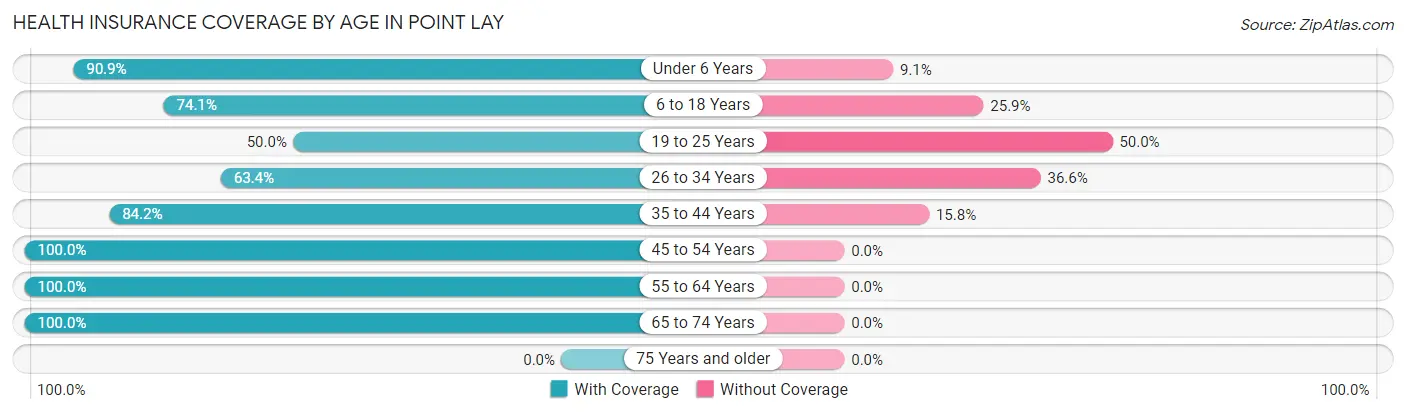
| Age Bracket | With Coverage | Without Coverage |
| Under 6 Years | 20 (90.9%) | 2 (9.1%) |
| 6 to 18 Years | 40 (74.1%) | 14 (25.9%) |
| 19 to 25 Years | 7 (50.0%) | 7 (50.0%) |
| 26 to 34 Years | 26 (63.4%) | 15 (36.6%) |
| 35 to 44 Years | 16 (84.2%) | 3 (15.8%) |
| 45 to 54 Years | 12 (100.0%) | 0 (0.0%) |
| 55 to 64 Years | 4 (100.0%) | 0 (0.0%) |
| 65 to 74 Years | 6 (100.0%) | 0 (0.0%) |
| 75 Years and older | 0 (0.0%) | 0 (0.0%) |
| Total | 131 (76.2%) | 41 (23.8%) |
Health Insurance Coverage by Citizenship Status in Point Lay
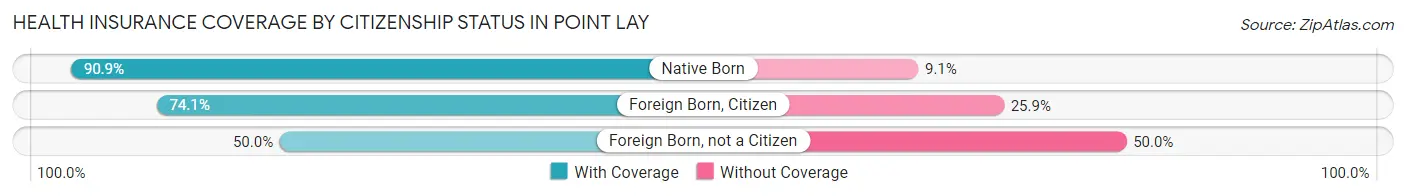
| Citizenship Status | With Coverage | Without Coverage |
| Native Born | 20 (90.9%) | 2 (9.1%) |
| Foreign Born, Citizen | 40 (74.1%) | 14 (25.9%) |
| Foreign Born, not a Citizen | 7 (50.0%) | 7 (50.0%) |
Health Insurance Coverage by Household Income in Point Lay
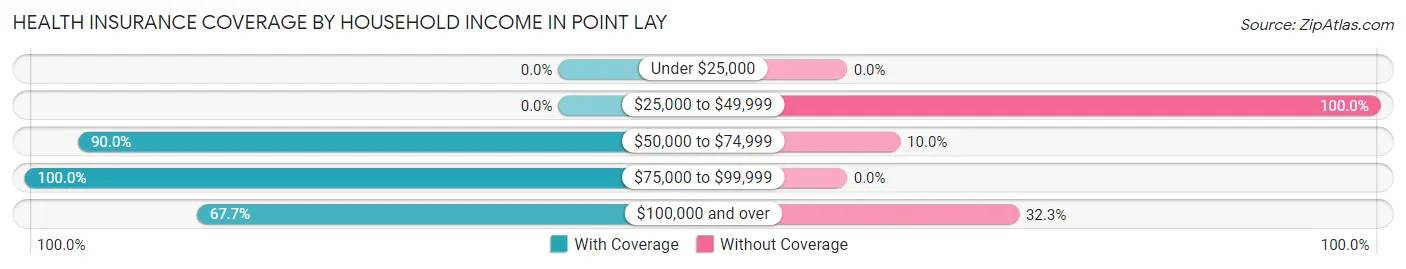
| Household Income | With Coverage | Without Coverage |
| Under $25,000 | 0 (0.0%) | 0 (0.0%) |
| $25,000 to $49,999 | 0 (0.0%) | 6 (100.0%) |
| $50,000 to $74,999 | 45 (90.0%) | 5 (10.0%) |
| $75,000 to $99,999 | 23 (100.0%) | 0 (0.0%) |
| $100,000 and over | 63 (67.7%) | 30 (32.3%) |
Public vs Private Health Insurance Coverage by Age in Point Lay
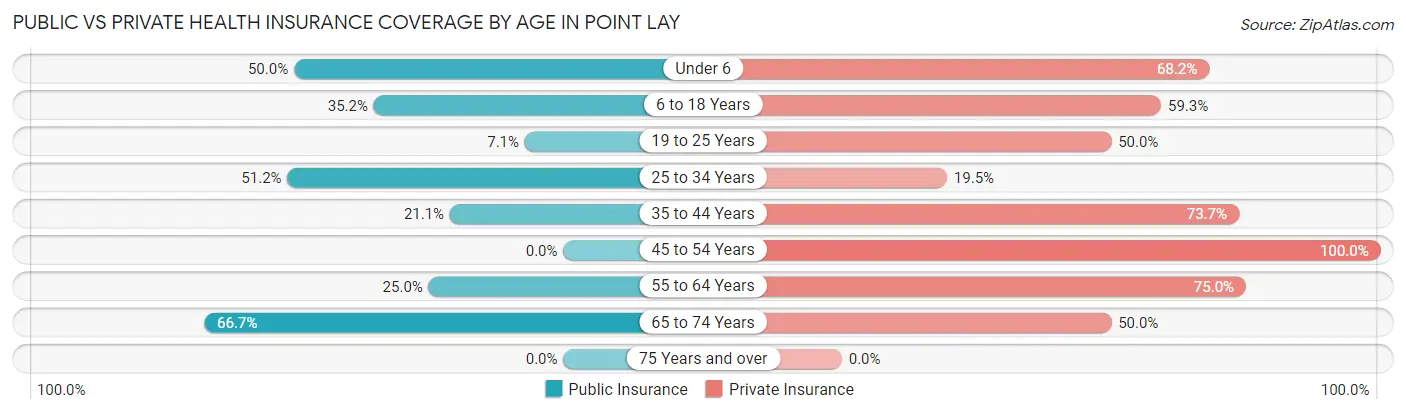
| Age Bracket | Public Insurance | Private Insurance |
| Under 6 | 11 (50.0%) | 15 (68.2%) |
| 6 to 18 Years | 19 (35.2%) | 32 (59.3%) |
| 19 to 25 Years | 1 (7.1%) | 7 (50.0%) |
| 25 to 34 Years | 21 (51.2%) | 8 (19.5%) |
| 35 to 44 Years | 4 (21.0%) | 14 (73.7%) |
| 45 to 54 Years | 0 (0.0%) | 12 (100.0%) |
| 55 to 64 Years | 1 (25.0%) | 3 (75.0%) |
| 65 to 74 Years | 4 (66.7%) | 3 (50.0%) |
| 75 Years and over | 0 (0.0%) | 0 (0.0%) |
| Total | 61 (35.5%) | 94 (54.6%) |
Disability Status by Sex by Age in Point Lay
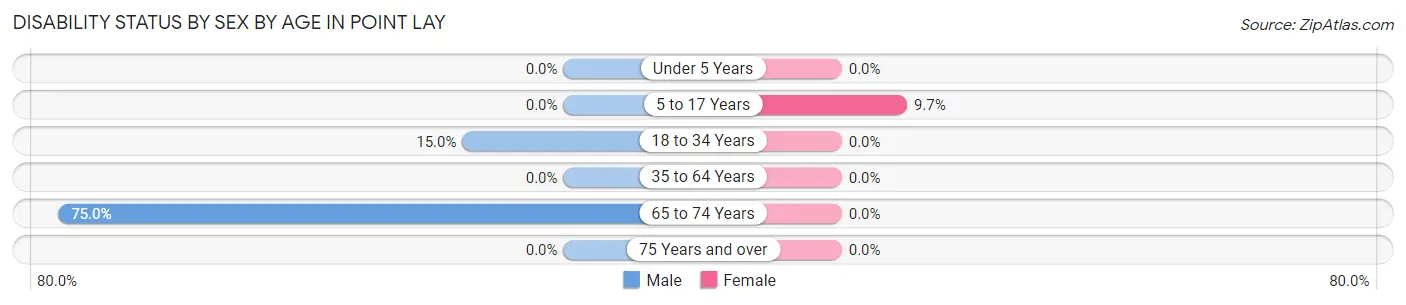
| Age Bracket | Male | Female |
| Under 5 Years | 0 (0.0%) | 0 (0.0%) |
| 5 to 17 Years | 0 (0.0%) | 3 (9.7%) |
| 18 to 34 Years | 6 (15.0%) | 0 (0.0%) |
| 35 to 64 Years | 0 (0.0%) | 0 (0.0%) |
| 65 to 74 Years | 3 (75.0%) | 0 (0.0%) |
| 75 Years and over | 0 (0.0%) | 0 (0.0%) |
Disability Class by Sex by Age in Point Lay
Disability Class: Hearing Difficulty
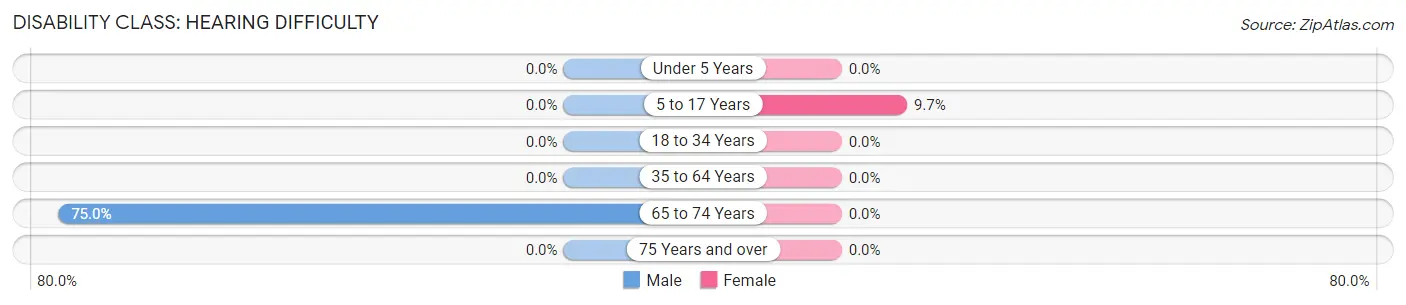
| Age Bracket | Male | Female |
| Under 5 Years | 0 (0.0%) | 0 (0.0%) |
| 5 to 17 Years | 0 (0.0%) | 3 (9.7%) |
| 18 to 34 Years | 0 (0.0%) | 0 (0.0%) |
| 35 to 64 Years | 0 (0.0%) | 0 (0.0%) |
| 65 to 74 Years | 3 (75.0%) | 0 (0.0%) |
| 75 Years and over | 0 (0.0%) | 0 (0.0%) |
Disability Class: Vision Difficulty
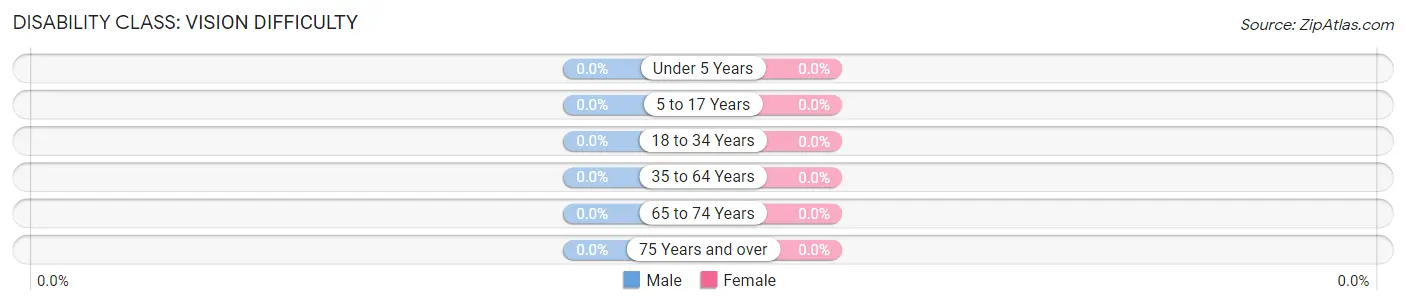
| Age Bracket | Male | Female |
| Under 5 Years | 0 (0.0%) | 0 (0.0%) |
| 5 to 17 Years | 0 (0.0%) | 0 (0.0%) |
| 18 to 34 Years | 0 (0.0%) | 0 (0.0%) |
| 35 to 64 Years | 0 (0.0%) | 0 (0.0%) |
| 65 to 74 Years | 0 (0.0%) | 0 (0.0%) |
| 75 Years and over | 0 (0.0%) | 0 (0.0%) |
Disability Class: Cognitive Difficulty
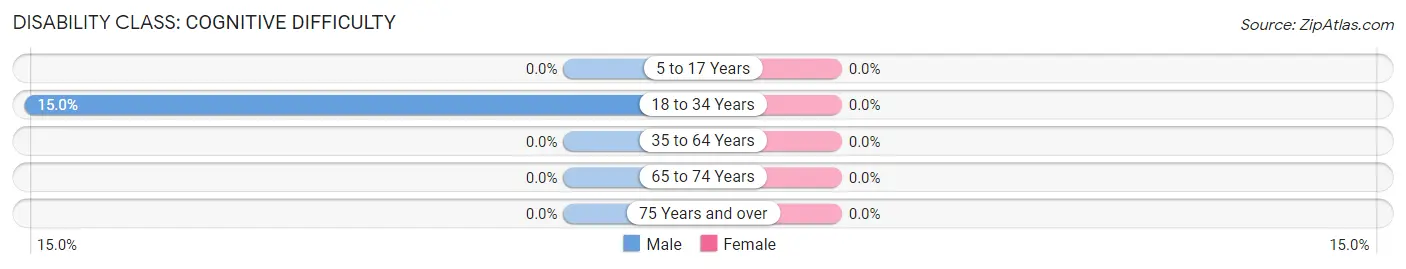
| Age Bracket | Male | Female |
| 5 to 17 Years | 0 (0.0%) | 0 (0.0%) |
| 18 to 34 Years | 6 (15.0%) | 0 (0.0%) |
| 35 to 64 Years | 0 (0.0%) | 0 (0.0%) |
| 65 to 74 Years | 0 (0.0%) | 0 (0.0%) |
| 75 Years and over | 0 (0.0%) | 0 (0.0%) |
Disability Class: Ambulatory Difficulty
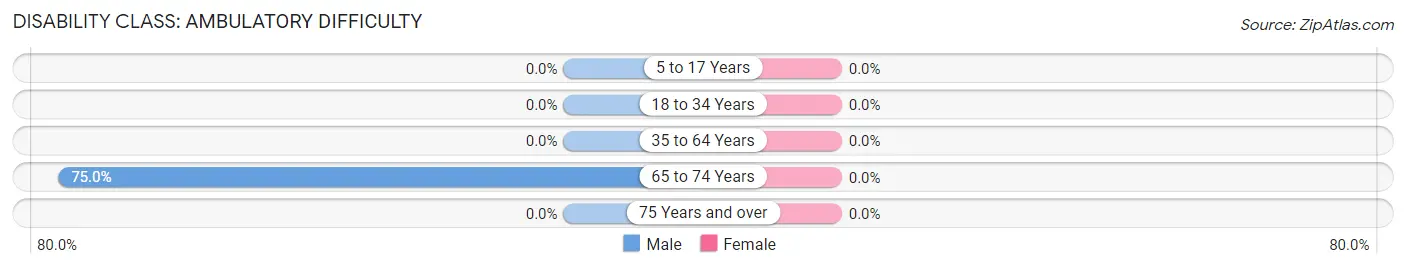
| Age Bracket | Male | Female |
| 5 to 17 Years | 0 (0.0%) | 0 (0.0%) |
| 18 to 34 Years | 0 (0.0%) | 0 (0.0%) |
| 35 to 64 Years | 0 (0.0%) | 0 (0.0%) |
| 65 to 74 Years | 3 (75.0%) | 0 (0.0%) |
| 75 Years and over | 0 (0.0%) | 0 (0.0%) |
Disability Class: Self-Care Difficulty
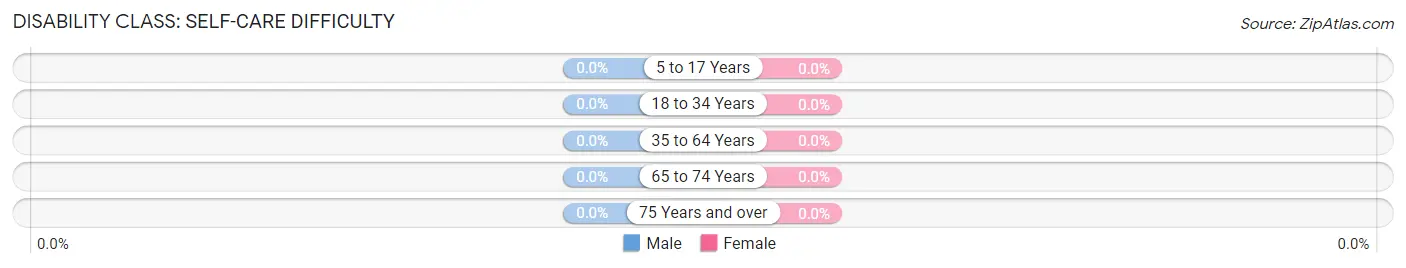
| Age Bracket | Male | Female |
| 5 to 17 Years | 0 (0.0%) | 0 (0.0%) |
| 18 to 34 Years | 0 (0.0%) | 0 (0.0%) |
| 35 to 64 Years | 0 (0.0%) | 0 (0.0%) |
| 65 to 74 Years | 0 (0.0%) | 0 (0.0%) |
| 75 Years and over | 0 (0.0%) | 0 (0.0%) |
Technology Access in Point Lay
Computing Device Access in Point Lay
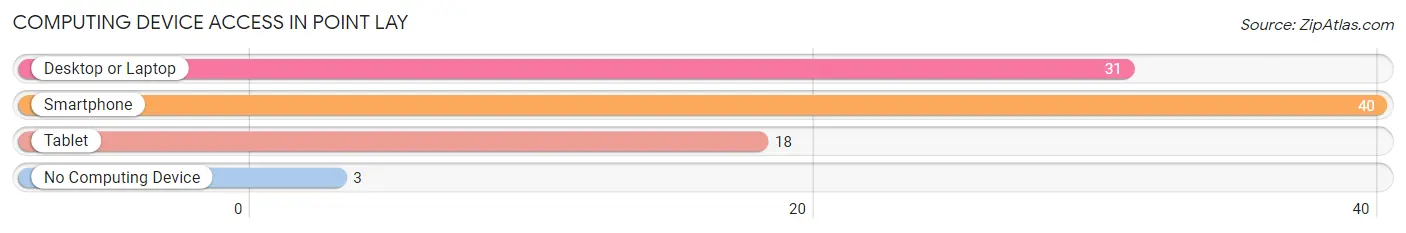
| Device Type | # Households | % Households |
| Desktop or Laptop | 31 | 72.1% |
| Smartphone | 40 | 93.0% |
| Tablet | 18 | 41.9% |
| No Computing Device | 3 | 7.0% |
| Total | 43 | 100.0% |
Internet Access in Point Lay
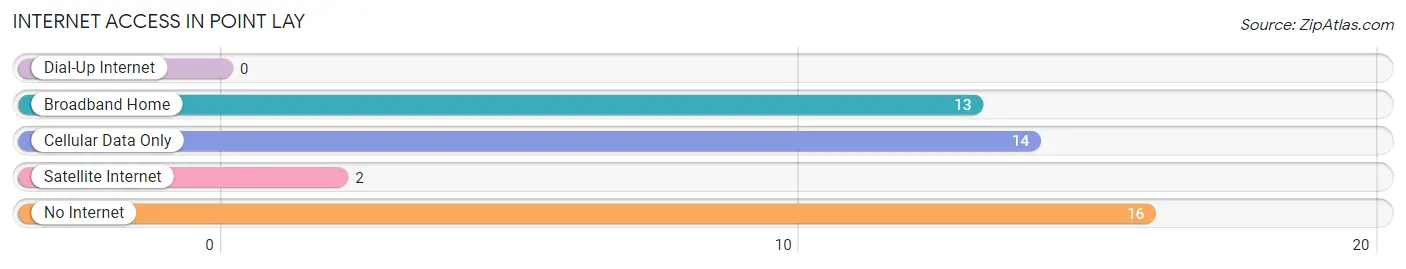
| Internet Type | # Households | % Households |
| Dial-Up Internet | 0 | 0.0% |
| Broadband Home | 13 | 30.2% |
| Cellular Data Only | 14 | 32.6% |
| Satellite Internet | 2 | 4.6% |
| No Internet | 16 | 37.2% |
| Total | 43 | 100.0% |
Point Lay Summary
Point Lay is a small Inupiat Eskimo village located on the Chukchi Sea coast of the North Slope Borough in Alaska. It is located approximately 280 miles northwest of Barrow, Alaska, and is the westernmost community in the United States. The population of Point Lay was reported to be 229 in the 2010 census.
Geography
Point Lay is located on the Chukchi Sea coast of the North Slope Borough in Alaska. It is located approximately 280 miles northwest of Barrow, Alaska, and is the westernmost community in the United States. The village is situated on a small, flat, sandy spit of land that juts out into the Chukchi Sea. The land is surrounded by tundra and is subject to extreme weather conditions. The average temperature in Point Lay is -14°F in the winter and 50°F in the summer.
Economy
The economy of Point Lay is largely based on subsistence activities such as hunting, fishing, and gathering. The village is also home to a small commercial fishing fleet that harvests crab, salmon, and other fish from the Chukchi Sea. The village also receives income from oil and gas development in the region.
Demographics
The population of Point Lay was reported to be 229 in the 2010 census. The majority of the population is of Inupiat Eskimo descent. The median age of the population is 24.7 years, and the median household income is $45,000.
History
Point Lay has been inhabited by the Inupiat Eskimos for centuries. The village was first recorded by Europeans in 1826, when a Russian explorer named Fyodor Litke visited the area. The village was officially established in the early 1900s, when the U.S. government relocated several Inupiat families from the nearby village of Kivalina to Point Lay. The village has since grown and is now home to 229 people.
Common Questions
What is Per Capita Income in Point Lay?
Per Capita income in Point Lay is $25,499.
What is the Median Family Income in Point Lay?
Median Family Income in Point Lay is $115,000.
What is the Median Household income in Point Lay?
Median Household Income in Point Lay is $89,583.
What is Income or Wage Gap in Point Lay?
Income or Wage Gap in Point Lay is 32.4%.
Women in Point Lay earn 67.6 cents for every dollar earned by a man.
What is Inequality or Gini Index in Point Lay?
Inequality or Gini Index in Point Lay is 0.32.
What is the Total Population of Point Lay?
Total Population of Point Lay is 172.
What is the Total Male Population of Point Lay?
Total Male Population of Point Lay is 98.
What is the Total Female Population of Point Lay?
Total Female Population of Point Lay is 74.
What is the Ratio of Males per 100 Females in Point Lay?
There are 132.43 Males per 100 Females in Point Lay.
What is the Ratio of Females per 100 Males in Point Lay?
There are 75.51 Females per 100 Males in Point Lay.
What is the Median Population Age in Point Lay?
Median Population Age in Point Lay is 23.8 Years.
What is the Average Family Size in Point Lay
Average Family Size in Point Lay is 5.0 People.
What is the Average Household Size in Point Lay
Average Household Size in Point Lay is 4.0 People.
How Large is the Labor Force in Point Lay?
There are 67 People in the Labor Forcein in Point Lay.
What is the Percentage of People in the Labor Force in Point Lay?
58.8% of People are in the Labor Force in Point Lay.
What is the Unemployment Rate in Point Lay?
Unemployment Rate in Point Lay is 7.5%.