Newport, MN Map & Demographics
Newport Map
Newport Overview
$35,732
PER CAPITA INCOME
$59,293
AVG FAMILY INCOME
$62,039
AVG HOUSEHOLD INCOME
21.7%
WAGE / INCOME GAP [ % ]
78.3¢/ $1
WAGE / INCOME GAP [ $ ]
0.44
INEQUALITY / GINI INDEX
4,163
TOTAL POPULATION
2,251
MALE POPULATION
1,912
FEMALE POPULATION
117.73
MALES / 100 FEMALES
84.94
FEMALES / 100 MALES
38.1
MEDIAN AGE
2.8
AVG FAMILY SIZE
2.2
AVG HOUSEHOLD SIZE
2,272
LABOR FORCE [ PEOPLE ]
65.4%
PERCENT IN LABOR FORCE
3.6%
UNEMPLOYMENT RATE
Newport Zip Codes
Newport Area Codes
Income in Newport
Income Overview in Newport
Per Capita Income in Newport is $35,732, while median incomes of families and households are $59,293 and $62,039 respectively.
| Characteristic | Number | Measure |
| Per Capita Income | 4,163 | $35,732 |
| Median Family Income | 1,025 | $59,293 |
| Mean Family Income | 1,025 | $88,890 |
| Median Household Income | 1,849 | $62,039 |
| Mean Household Income | 1,849 | $83,325 |
| Income Deficit | 1,025 | $0 |
| Wage / Income Gap (%) | 4,163 | 21.74% |
| Wage / Income Gap ($) | 4,163 | 78.26¢ per $1 |
| Gini / Inequality Index | 4,163 | 0.44 |
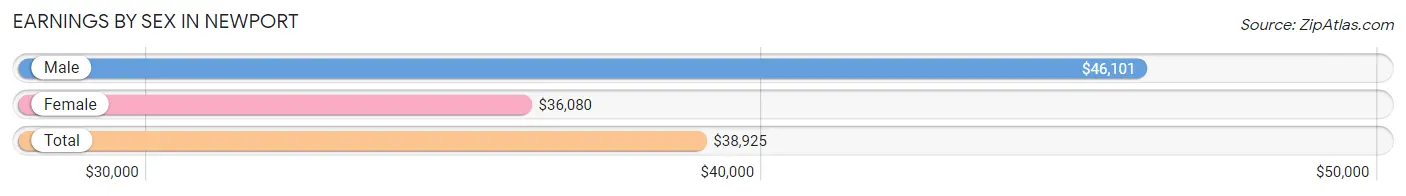
Earnings by Sex in Newport
Average Earnings in Newport are $38,925, $46,101 for men and $36,080 for women, a difference of 21.7%.
| Sex | Number | Average Earnings |
| Male | 1,274 (55.4%) | $46,101 |
| Female | 1,025 (44.6%) | $36,080 |
| Total | 2,299 (100.0%) | $38,925 |
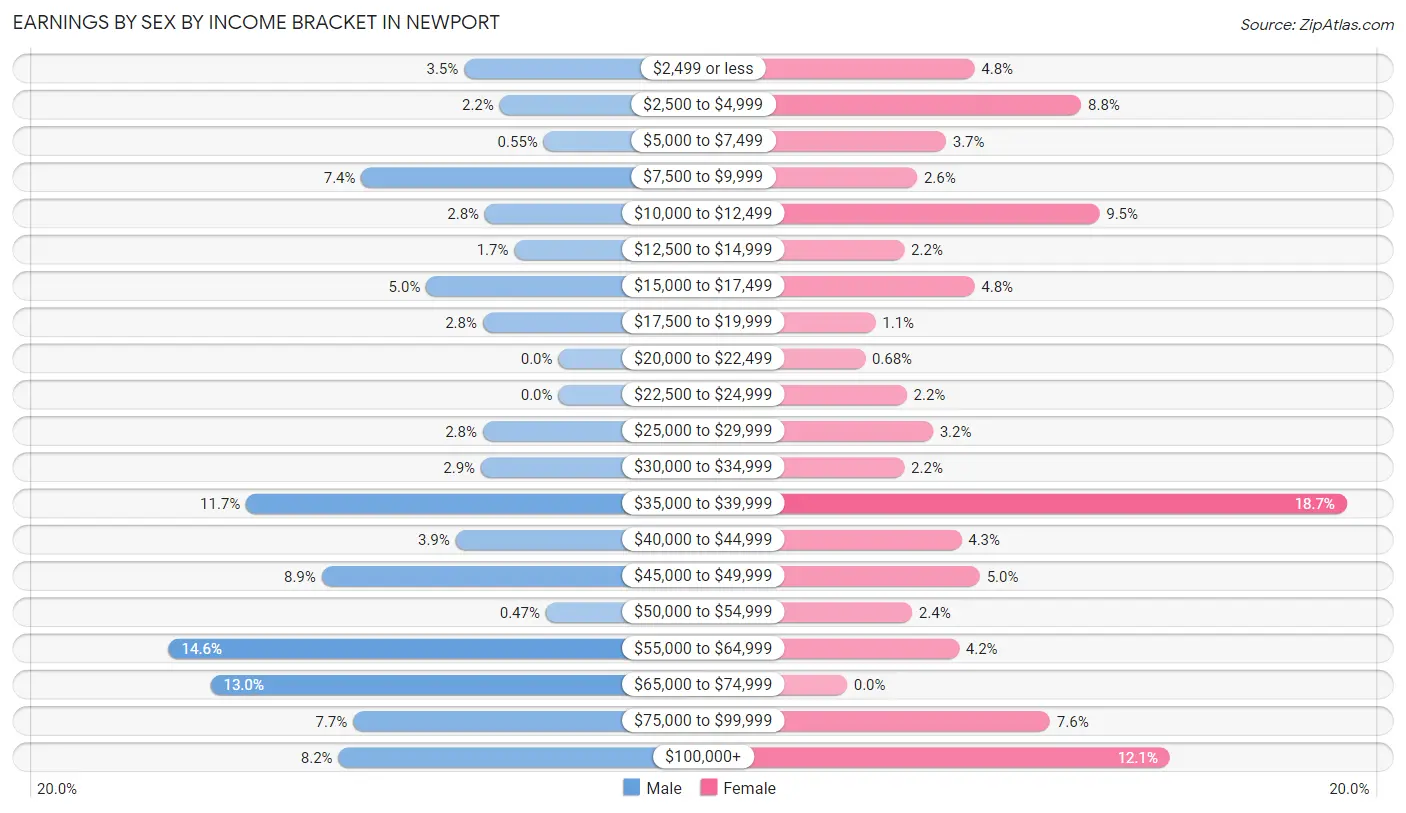
Earnings by Sex by Income Bracket in Newport
The most common earnings brackets in Newport are $55,000 to $64,999 for men (186 | 14.6%) and $35,000 to $39,999 for women (192 | 18.7%).
| Income | Male | Female |
| $2,499 or less | 45 (3.5%) | 49 (4.8%) |
| $2,500 to $4,999 | 28 (2.2%) | 90 (8.8%) |
| $5,000 to $7,499 | 7 (0.5%) | 38 (3.7%) |
| $7,500 to $9,999 | 94 (7.4%) | 27 (2.6%) |
| $10,000 to $12,499 | 35 (2.8%) | 97 (9.5%) |
| $12,500 to $14,999 | 21 (1.7%) | 22 (2.1%) |
| $15,000 to $17,499 | 63 (5.0%) | 49 (4.8%) |
| $17,500 to $19,999 | 36 (2.8%) | 11 (1.1%) |
| $20,000 to $22,499 | 0 (0.0%) | 7 (0.7%) |
| $22,500 to $24,999 | 0 (0.0%) | 23 (2.2%) |
| $25,000 to $29,999 | 36 (2.8%) | 33 (3.2%) |
| $30,000 to $34,999 | 37 (2.9%) | 22 (2.1%) |
| $35,000 to $39,999 | 149 (11.7%) | 192 (18.7%) |
| $40,000 to $44,999 | 49 (3.8%) | 44 (4.3%) |
| $45,000 to $49,999 | 113 (8.9%) | 51 (5.0%) |
| $50,000 to $54,999 | 6 (0.5%) | 25 (2.4%) |
| $55,000 to $64,999 | 186 (14.6%) | 43 (4.2%) |
| $65,000 to $74,999 | 166 (13.0%) | 0 (0.0%) |
| $75,000 to $99,999 | 98 (7.7%) | 78 (7.6%) |
| $100,000+ | 105 (8.2%) | 124 (12.1%) |
| Total | 1,274 (100.0%) | 1,025 (100.0%) |
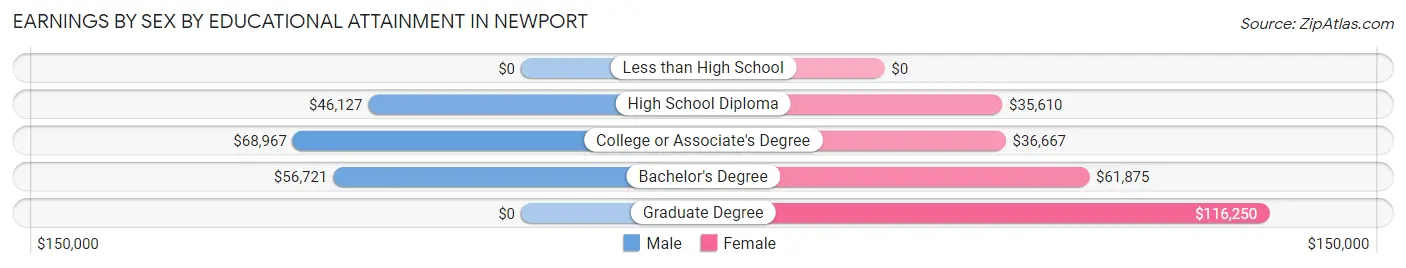
Earnings by Sex by Educational Attainment in Newport
Average earnings in Newport are $55,758 for men and $43,214 for women, a difference of 22.5%. Men with an educational attainment of college or associate's degree enjoy the highest average annual earnings of $68,967, while those with high school diploma education earn the least with $46,127. Women with an educational attainment of graduate degree earn the most with the average annual earnings of $116,250, while those with high school diploma education have the smallest earnings of $35,610.
| Educational Attainment | Male Income | Female Income |
| Less than High School | - | - |
| High School Diploma | $46,127 | $35,610 |
| College or Associate's Degree | $68,967 | $36,667 |
| Bachelor's Degree | $56,721 | $61,875 |
| Graduate Degree | - | - |
| Total | $55,758 | $43,214 |
Family Income in Newport
Family Income Brackets in Newport
According to the Newport family income data, there are 304 families falling into the $35,000 to $49,999 income range, which is the most common income bracket and makes up 29.7% of all families. Conversely, the less than $10,000 income bracket is the least frequent group with only 7 families (0.7%) belonging to this category.
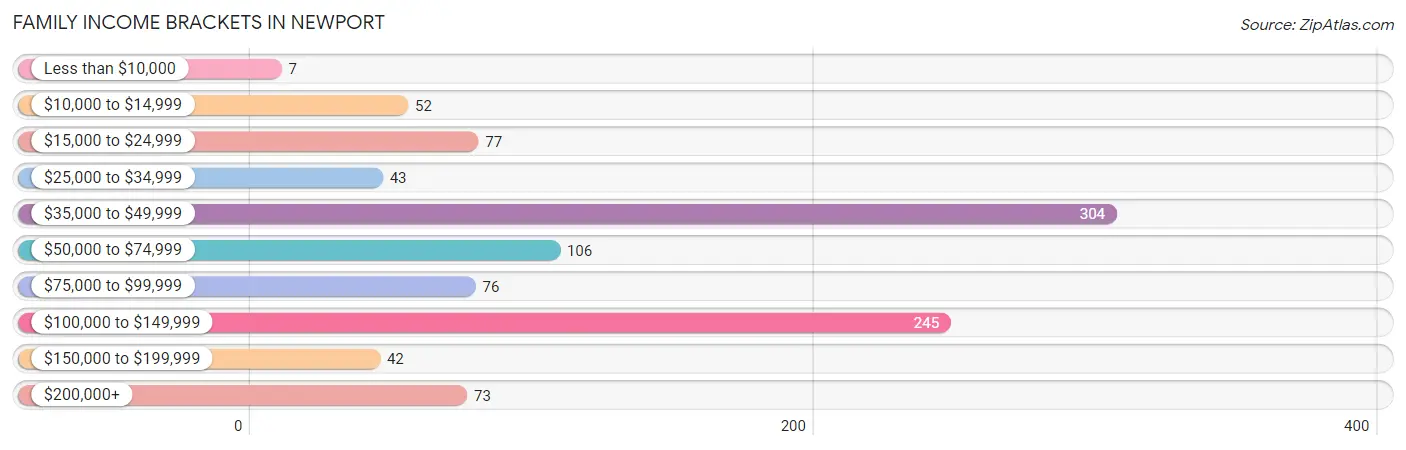
| Income Bracket | # Families | % Families |
| Less than $10,000 | 7 | 0.7% |
| $10,000 to $14,999 | 52 | 5.1% |
| $15,000 to $24,999 | 77 | 7.5% |
| $25,000 to $34,999 | 43 | 4.2% |
| $35,000 to $49,999 | 304 | 29.7% |
| $50,000 to $74,999 | 106 | 10.3% |
| $75,000 to $99,999 | 76 | 7.4% |
| $100,000 to $149,999 | 245 | 23.9% |
| $150,000 to $199,999 | 42 | 4.1% |
| $200,000+ | 73 | 7.1% |
Family Income by Famaliy Size in Newport
5-person families (46 | 4.5%) account for the highest median family income in Newport with $137,045 per family, while 3-person families (219 | 21.4%) have the highest median income of $34,174 per family member.
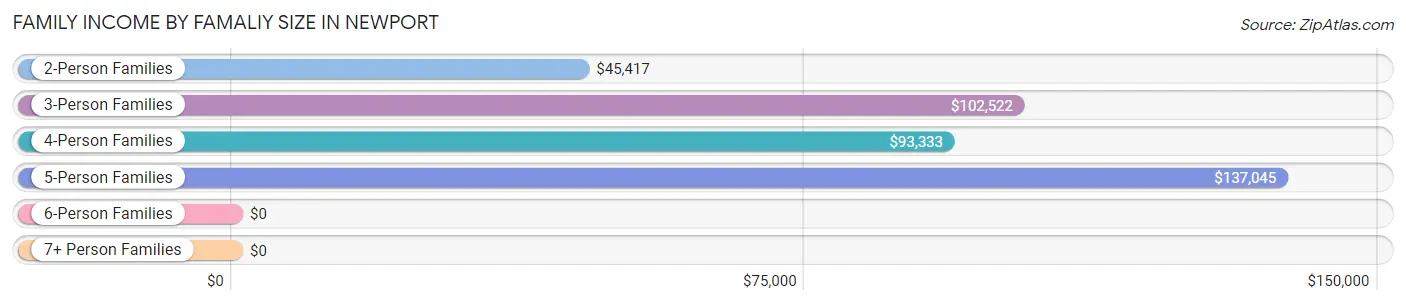
| Income Bracket | # Families | Median Income |
| 2-Person Families | 568 (55.4%) | $45,417 |
| 3-Person Families | 219 (21.4%) | $102,522 |
| 4-Person Families | 192 (18.7%) | $93,333 |
| 5-Person Families | 46 (4.5%) | $137,045 |
| 6-Person Families | 0 (0.0%) | $0 |
| 7+ Person Families | 0 (0.0%) | $0 |
| Total | 1,025 (100.0%) | $59,293 |
Family Income by Number of Earners in Newport
The median family income in Newport is $59,293, with families comprising 3+ earners (121) having the highest median family income of $145,469, while families with no earners (217) have the lowest median family income of $45,099, accounting for 11.8% and 21.2% of families, respectively.
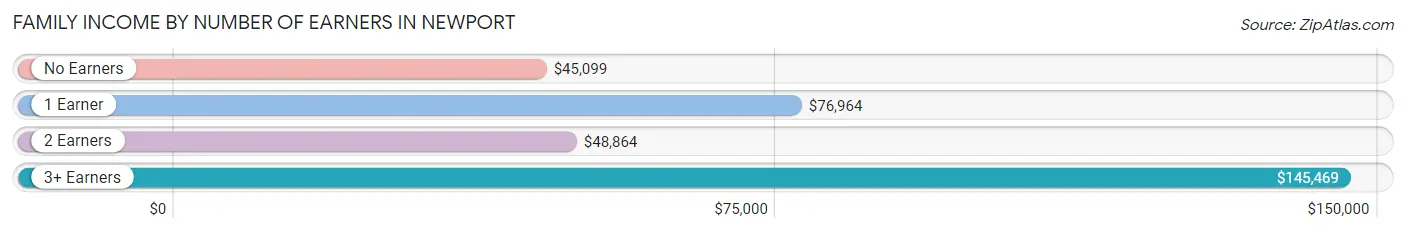
| Number of Earners | # Families | Median Income |
| No Earners | 217 (21.2%) | $45,099 |
| 1 Earner | 337 (32.9%) | $76,964 |
| 2 Earners | 350 (34.2%) | $48,864 |
| 3+ Earners | 121 (11.8%) | $145,469 |
| Total | 1,025 (100.0%) | $59,293 |
Household Income in Newport
Household Income Brackets in Newport
With 390 households falling in the category, the $35,000 to $49,999 income range is the most frequent in Newport, accounting for 21.1% of all households. In contrast, only 76 households (4.1%) fall into the less than $10,000 income bracket, making it the least populous group.
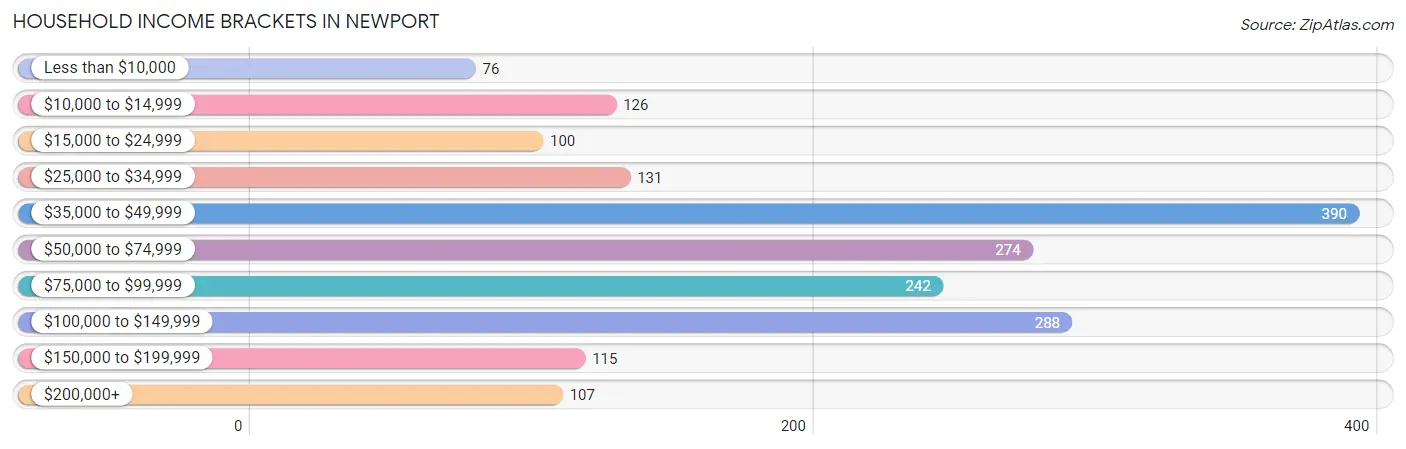
| Income Bracket | # Households | % Households |
| Less than $10,000 | 76 | 4.1% |
| $10,000 to $14,999 | 126 | 6.8% |
| $15,000 to $24,999 | 100 | 5.4% |
| $25,000 to $34,999 | 131 | 7.1% |
| $35,000 to $49,999 | 390 | 21.1% |
| $50,000 to $74,999 | 274 | 14.8% |
| $75,000 to $99,999 | 242 | 13.1% |
| $100,000 to $149,999 | 288 | 15.6% |
| $150,000 to $199,999 | 115 | 6.2% |
| $200,000+ | 107 | 5.8% |
Household Income by Householder Age in Newport
The median household income in Newport is $62,039, with the highest median household income of $92,917 found in the 25 to 44 years age bracket for the primary householder. A total of 636 households (34.4%) fall into this category. Meanwhile, the 65+ years age bracket for the primary householder has the lowest median household income of $31,920, with 491 households (26.6%) in this group.
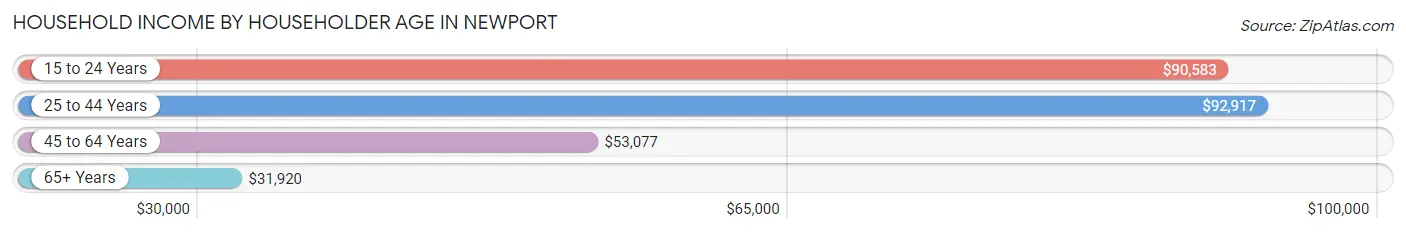
| Income Bracket | # Households | Median Income |
| 15 to 24 Years | 222 (12.0%) | $90,583 |
| 25 to 44 Years | 636 (34.4%) | $92,917 |
| 45 to 64 Years | 500 (27.0%) | $53,077 |
| 65+ Years | 491 (26.6%) | $31,920 |
| Total | 1,849 (100.0%) | $62,039 |
Poverty in Newport
Income Below Poverty by Sex and Age in Newport
With 5.6% poverty level for males and 13.1% for females among the residents of Newport, 75 year old and over males and 15 year old females are the most vulnerable to poverty, with 34 males (23.8%) and 30 females (100.0%) in their respective age groups living below the poverty level.
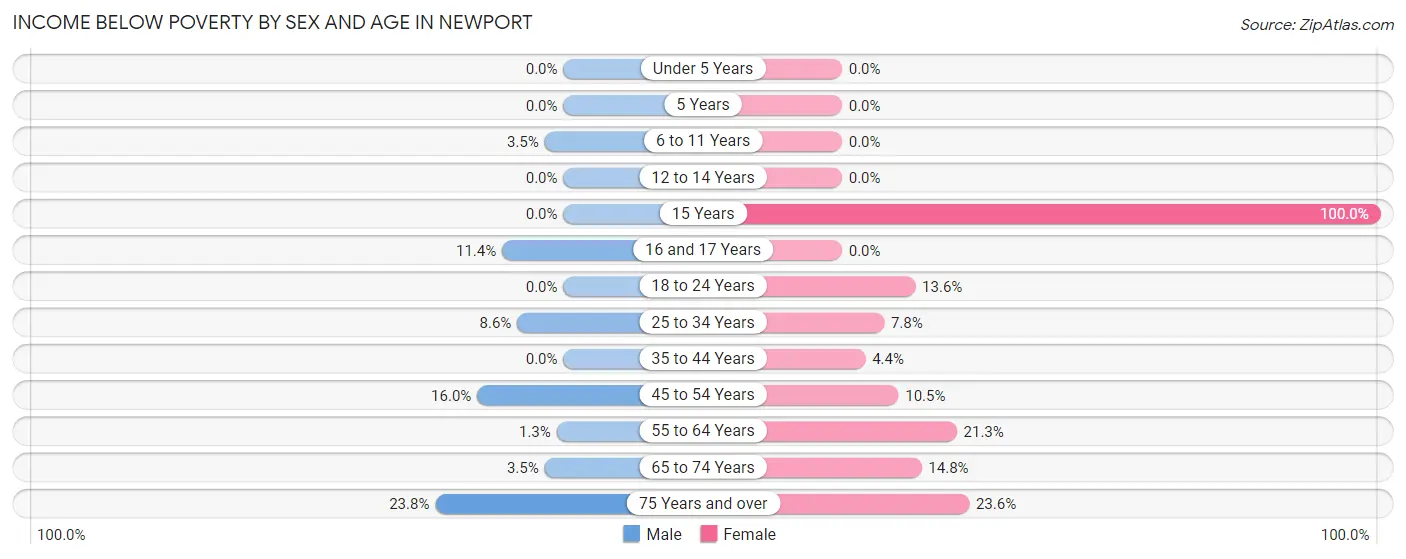
| Age Bracket | Male | Female |
| Under 5 Years | 0 (0.0%) | 0 (0.0%) |
| 5 Years | 0 (0.0%) | 0 (0.0%) |
| 6 to 11 Years | 7 (3.5%) | 0 (0.0%) |
| 12 to 14 Years | 0 (0.0%) | 0 (0.0%) |
| 15 Years | 0 (0.0%) | 30 (100.0%) |
| 16 and 17 Years | 14 (11.4%) | 0 (0.0%) |
| 18 to 24 Years | 0 (0.0%) | 44 (13.6%) |
| 25 to 34 Years | 21 (8.6%) | 22 (7.8%) |
| 35 to 44 Years | 0 (0.0%) | 13 (4.3%) |
| 45 to 54 Years | 36 (16.0%) | 17 (10.5%) |
| 55 to 64 Years | 4 (1.3%) | 39 (21.3%) |
| 65 to 74 Years | 6 (3.5%) | 30 (14.8%) |
| 75 Years and over | 34 (23.8%) | 55 (23.6%) |
| Total | 122 (5.6%) | 250 (13.1%) |
Income Above Poverty by Sex and Age in Newport
According to the poverty statistics in Newport, males aged under 5 years and females aged under 5 years are the age groups that are most secure financially, with 100.0% of males and 100.0% of females in these age groups living above the poverty line.
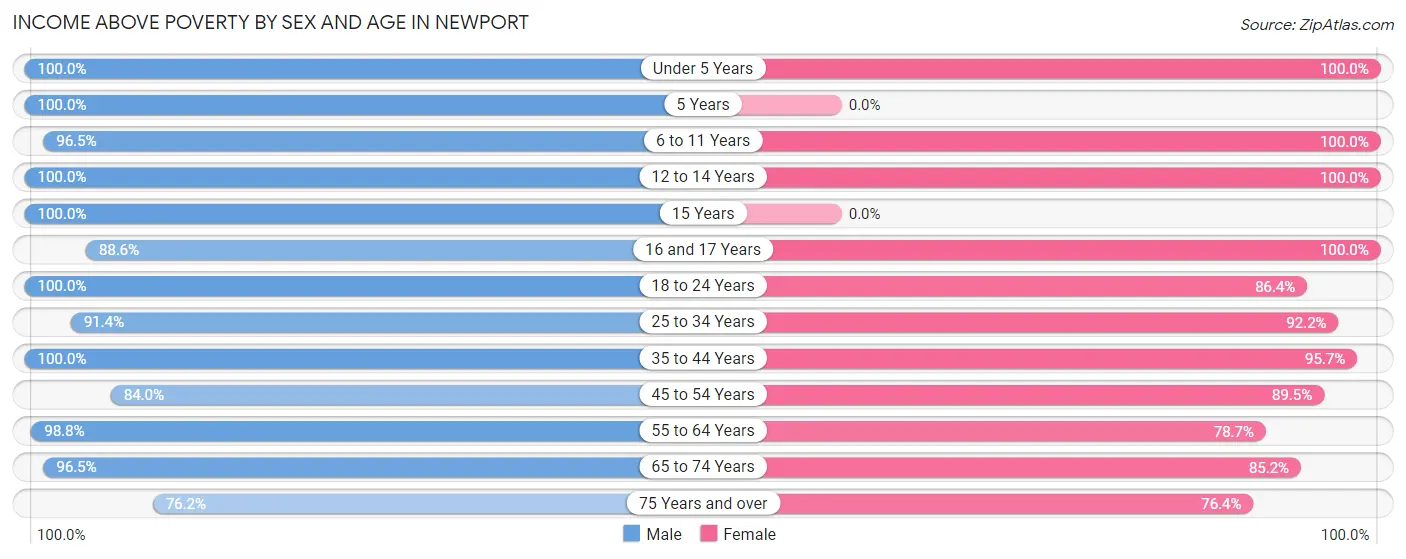
| Age Bracket | Male | Female |
| Under 5 Years | 115 (100.0%) | 53 (100.0%) |
| 5 Years | 44 (100.0%) | 0 (0.0%) |
| 6 to 11 Years | 194 (96.5%) | 76 (100.0%) |
| 12 to 14 Years | 23 (100.0%) | 44 (100.0%) |
| 15 Years | 42 (100.0%) | 0 (0.0%) |
| 16 and 17 Years | 109 (88.6%) | 25 (100.0%) |
| 18 to 24 Years | 225 (100.0%) | 279 (86.4%) |
| 25 to 34 Years | 224 (91.4%) | 259 (92.2%) |
| 35 to 44 Years | 313 (100.0%) | 286 (95.7%) |
| 45 to 54 Years | 189 (84.0%) | 145 (89.5%) |
| 55 to 64 Years | 315 (98.8%) | 144 (78.7%) |
| 65 to 74 Years | 166 (96.5%) | 173 (85.2%) |
| 75 Years and over | 109 (76.2%) | 178 (76.4%) |
| Total | 2,068 (94.4%) | 1,662 (86.9%) |
Income Below Poverty Among Married-Couple Families in Newport
The poverty statistics for married-couple families in Newport show that 7.6% or 57 of the total 747 families live below the poverty line. Families with no children have the highest poverty rate of 13.1%, comprising of 57 families. On the other hand, families with 1 or 2 children have the lowest poverty rate of 0.0%, which includes 0 families.
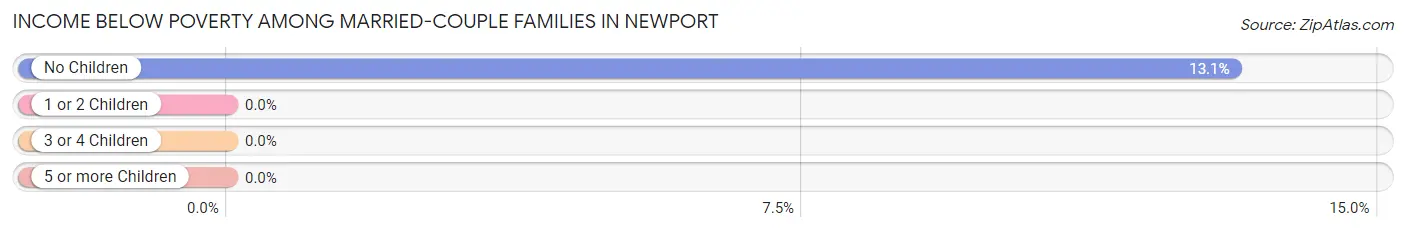
| Children | Above Poverty | Below Poverty |
| No Children | 378 (86.9%) | 57 (13.1%) |
| 1 or 2 Children | 280 (100.0%) | 0 (0.0%) |
| 3 or 4 Children | 32 (100.0%) | 0 (0.0%) |
| 5 or more Children | 0 (0.0%) | 0 (0.0%) |
| Total | 690 (92.4%) | 57 (7.6%) |
Income Below Poverty Among Single-Parent Households in Newport
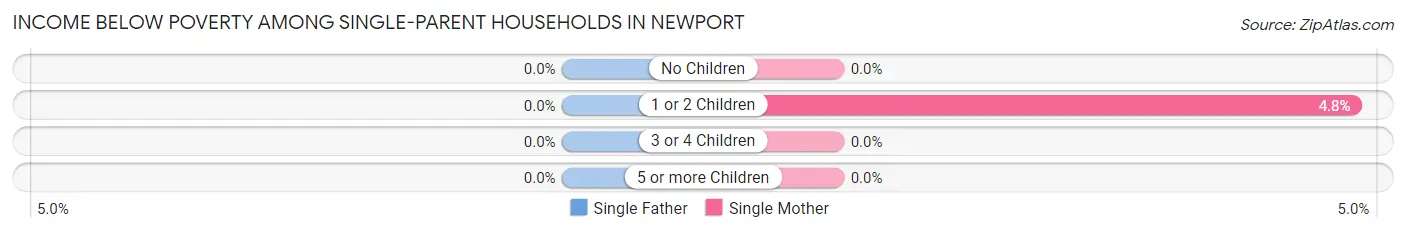
| Children | Single Father | Single Mother |
| No Children | 0 (0.0%) | 0 (0.0%) |
| 1 or 2 Children | 0 (0.0%) | 7 (4.8%) |
| 3 or 4 Children | 0 (0.0%) | 0 (0.0%) |
| 5 or more Children | 0 (0.0%) | 0 (0.0%) |
| Total | 0 (0.0%) | 7 (4.0%) |
Income Below Poverty Among Married-Couple vs Single-Parent Households in Newport
The poverty data for Newport shows that 57 of the married-couple family households (7.6%) and 7 of the single-parent households (2.5%) are living below the poverty level. Within the married-couple family households, those with no children have the highest poverty rate, with 57 households (13.1%) falling below the poverty line. Among the single-parent households, those with 1 or 2 children have the highest poverty rate, with 7 household (4.2%) living below poverty.
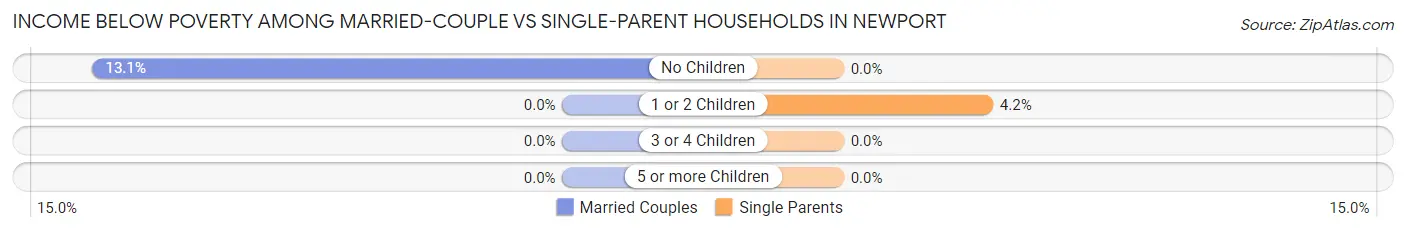
| Children | Married-Couple Families | Single-Parent Households |
| No Children | 57 (13.1%) | 0 (0.0%) |
| 1 or 2 Children | 0 (0.0%) | 7 (4.2%) |
| 3 or 4 Children | 0 (0.0%) | 0 (0.0%) |
| 5 or more Children | 0 (0.0%) | 0 (0.0%) |
| Total | 57 (7.6%) | 7 (2.5%) |
Race in Newport
The most populous races in Newport are White / Caucasian (3,109 | 74.7%), Asian (473 | 11.4%), and Hispanic or Latino (429 | 10.3%).
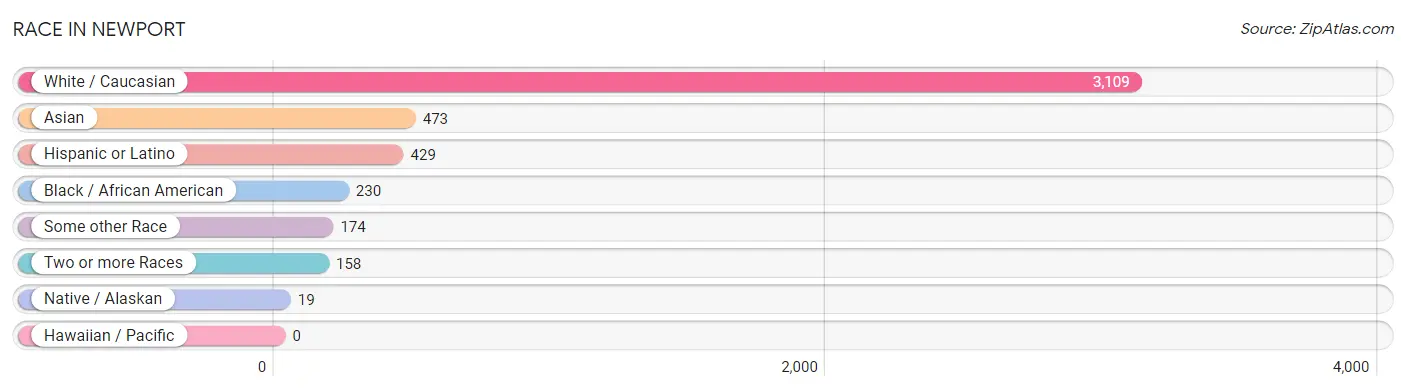
| Race | # Population | % Population |
| Asian | 473 | 11.4% |
| Black / African American | 230 | 5.5% |
| Hawaiian / Pacific | 0 | 0.0% |
| Hispanic or Latino | 429 | 10.3% |
| Native / Alaskan | 19 | 0.5% |
| White / Caucasian | 3,109 | 74.7% |
| Two or more Races | 158 | 3.8% |
| Some other Race | 174 | 4.2% |
| Total | 4,163 | 100.0% |
Ancestry in Newport
The most populous ancestries reported in Newport are German (1,360 | 32.7%), Norwegian (559 | 13.4%), Bangladeshi (354 | 8.5%), Swedish (345 | 8.3%), and Mexican (285 | 6.9%), together accounting for 69.7% of all Newport residents.
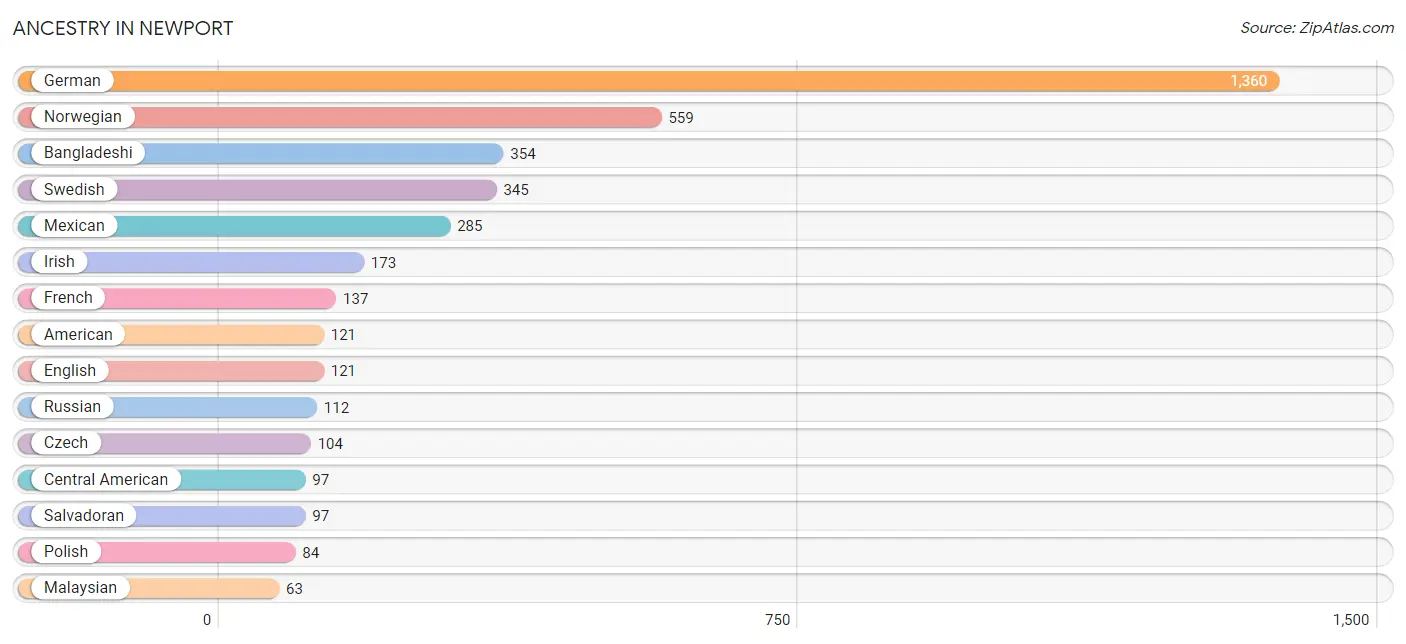
| Ancestry | # Population | % Population |
| American | 121 | 2.9% |
| Argentinean | 22 | 0.5% |
| Armenian | 7 | 0.2% |
| Bangladeshi | 354 | 8.5% |
| Central American | 97 | 2.3% |
| Czech | 104 | 2.5% |
| Danish | 31 | 0.7% |
| Dutch | 33 | 0.8% |
| English | 121 | 2.9% |
| European | 43 | 1.0% |
| Finnish | 8 | 0.2% |
| French | 137 | 3.3% |
| French Canadian | 44 | 1.1% |
| German | 1,360 | 32.7% |
| Hungarian | 14 | 0.3% |
| Indian (Asian) | 29 | 0.7% |
| Irish | 173 | 4.2% |
| Iroquois | 20 | 0.5% |
| Italian | 43 | 1.0% |
| Kenyan | 33 | 0.8% |
| Malaysian | 63 | 1.5% |
| Mexican | 285 | 6.9% |
| Mexican American Indian | 19 | 0.5% |
| Northern European | 24 | 0.6% |
| Norwegian | 559 | 13.4% |
| Pakistani | 17 | 0.4% |
| Polish | 84 | 2.0% |
| Russian | 112 | 2.7% |
| Salvadoran | 97 | 2.3% |
| Scandinavian | 44 | 1.1% |
| Scottish | 45 | 1.1% |
| South American | 22 | 0.5% |
| Subsaharan African | 33 | 0.8% |
| Swedish | 345 | 8.3% |
| Swiss | 63 | 1.5% |
| Thai | 16 | 0.4% |
| Ukrainian | 5 | 0.1% | View All 37 Rows |
Immigrants in Newport
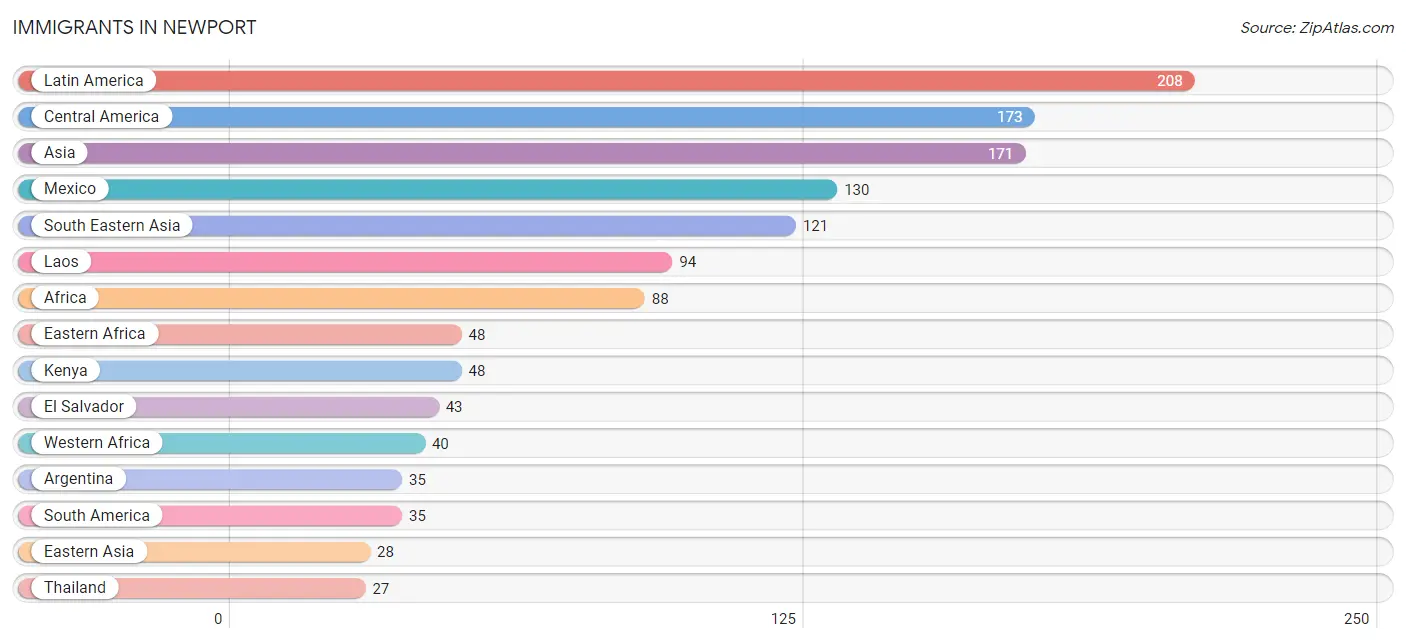
The most numerous immigrant groups reported in Newport came from Latin America (208 | 5.0%), Central America (173 | 4.2%), Asia (171 | 4.1%), Mexico (130 | 3.1%), and South Eastern Asia (121 | 2.9%), together accounting for 19.3% of all Newport residents.
| Immigration Origin | # Population | % Population |
| Africa | 88 | 2.1% |
| Argentina | 35 | 0.8% |
| Asia | 171 | 4.1% |
| Central America | 173 | 4.2% |
| China | 17 | 0.4% |
| Eastern Africa | 48 | 1.1% |
| Eastern Asia | 28 | 0.7% |
| El Salvador | 43 | 1.0% |
| Europe | 14 | 0.3% |
| France | 14 | 0.3% |
| Hong Kong | 17 | 0.4% |
| India | 16 | 0.4% |
| Japan | 5 | 0.1% |
| Kazakhstan | 6 | 0.1% |
| Kenya | 48 | 1.1% |
| Korea | 6 | 0.1% |
| Laos | 94 | 2.3% |
| Latin America | 208 | 5.0% |
| Mexico | 130 | 3.1% |
| South America | 35 | 0.8% |
| South Central Asia | 22 | 0.5% |
| South Eastern Asia | 121 | 2.9% |
| Thailand | 27 | 0.6% |
| Western Africa | 40 | 1.0% |
| Western Europe | 14 | 0.3% | View All 25 Rows |
Sex and Age in Newport
Sex and Age in Newport
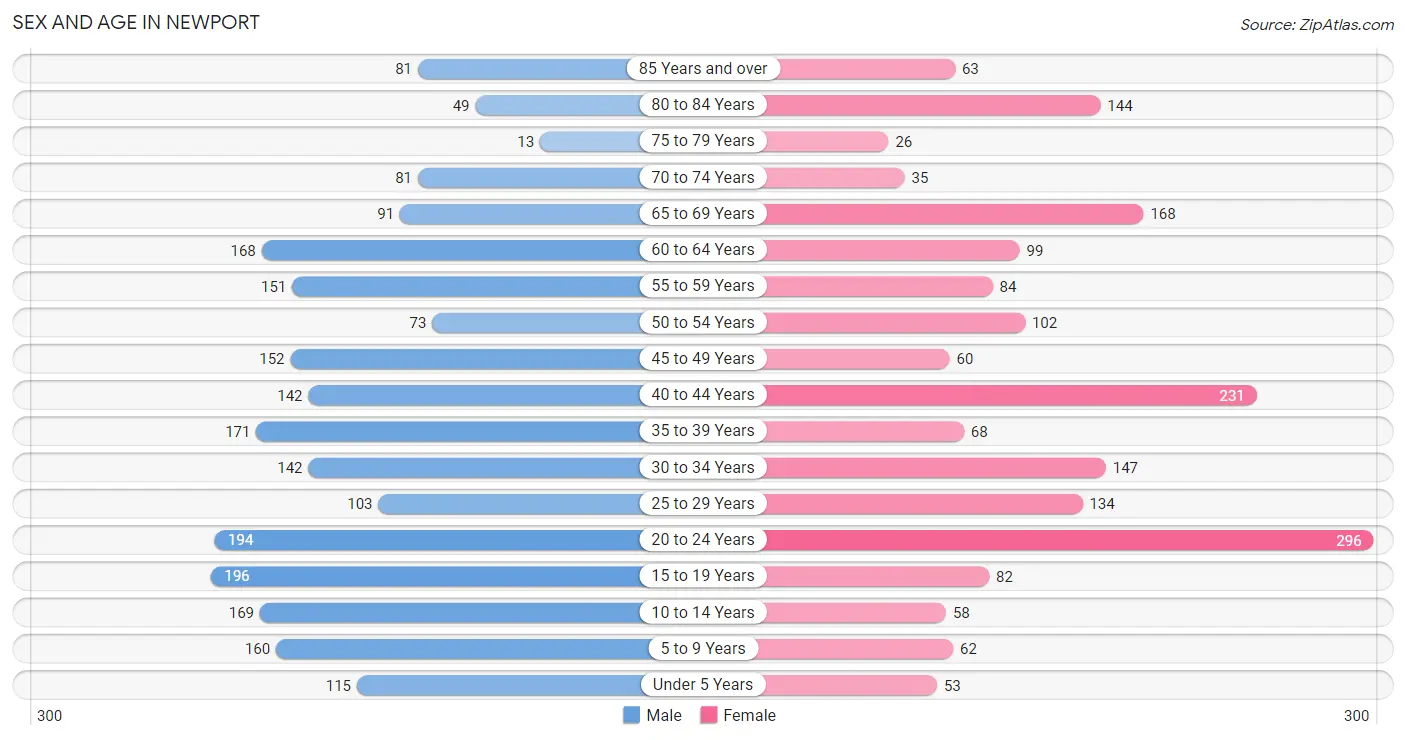
The most populous age groups in Newport are 15 to 19 Years (196 | 8.7%) for men and 20 to 24 Years (296 | 15.5%) for women.
| Age Bracket | Male | Female |
| Under 5 Years | 115 (5.1%) | 53 (2.8%) |
| 5 to 9 Years | 160 (7.1%) | 62 (3.2%) |
| 10 to 14 Years | 169 (7.5%) | 58 (3.0%) |
| 15 to 19 Years | 196 (8.7%) | 82 (4.3%) |
| 20 to 24 Years | 194 (8.6%) | 296 (15.5%) |
| 25 to 29 Years | 103 (4.6%) | 134 (7.0%) |
| 30 to 34 Years | 142 (6.3%) | 147 (7.7%) |
| 35 to 39 Years | 171 (7.6%) | 68 (3.6%) |
| 40 to 44 Years | 142 (6.3%) | 231 (12.1%) |
| 45 to 49 Years | 152 (6.8%) | 60 (3.1%) |
| 50 to 54 Years | 73 (3.2%) | 102 (5.3%) |
| 55 to 59 Years | 151 (6.7%) | 84 (4.4%) |
| 60 to 64 Years | 168 (7.5%) | 99 (5.2%) |
| 65 to 69 Years | 91 (4.0%) | 168 (8.8%) |
| 70 to 74 Years | 81 (3.6%) | 35 (1.8%) |
| 75 to 79 Years | 13 (0.6%) | 26 (1.4%) |
| 80 to 84 Years | 49 (2.2%) | 144 (7.5%) |
| 85 Years and over | 81 (3.6%) | 63 (3.3%) |
| Total | 2,251 (100.0%) | 1,912 (100.0%) |
Families and Households in Newport
Median Family Size in Newport
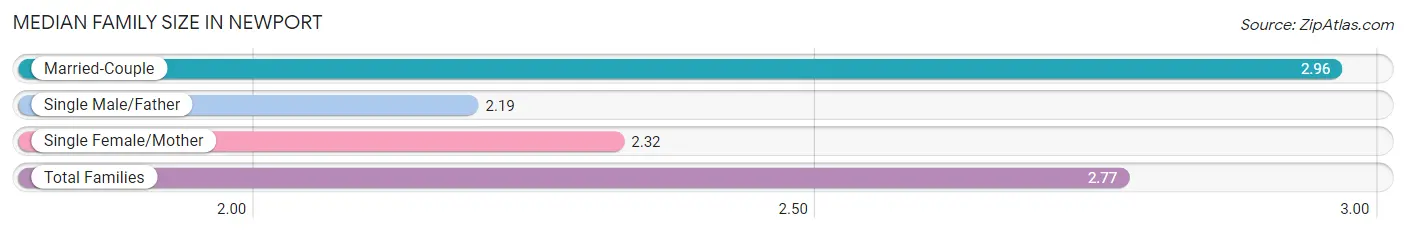
The median family size in Newport is 2.77 persons per family, with married-couple families (747 | 72.9%) accounting for the largest median family size of 2.96 persons per family. On the other hand, single male/father families (102 | 10.0%) represent the smallest median family size with 2.19 persons per family.
| Family Type | # Families | Family Size |
| Married-Couple | 747 (72.9%) | 2.96 |
| Single Male/Father | 102 (10.0%) | 2.19 |
| Single Female/Mother | 176 (17.2%) | 2.32 |
| Total Families | 1,025 (100.0%) | 2.77 |
Median Household Size in Newport
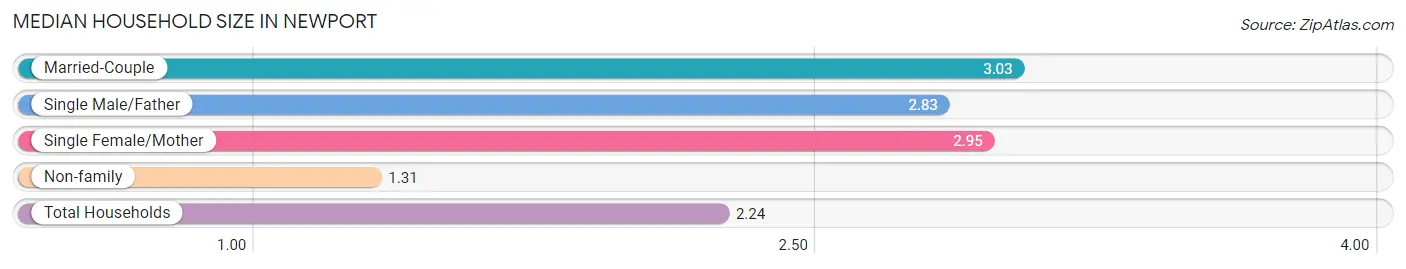
The median household size in Newport is 2.24 persons per household, with married-couple households (747 | 40.4%) accounting for the largest median household size of 3.03 persons per household. non-family households (824 | 44.6%) represent the smallest median household size with 1.31 persons per household.
| Household Type | # Households | Household Size |
| Married-Couple | 747 (40.4%) | 3.03 |
| Single Male/Father | 102 (5.5%) | 2.83 |
| Single Female/Mother | 176 (9.5%) | 2.95 |
| Non-family | 824 (44.6%) | 1.31 |
| Total Households | 1,849 (100.0%) | 2.24 |
Household Size by Marriage Status in Newport
Out of a total of 1,849 households in Newport, 1,025 (55.4%) are family households, while 824 (44.6%) are nonfamily households. The most numerous type of family households are 2-person households, comprising 422, and the most common type of nonfamily households are 1-person households, comprising 578.
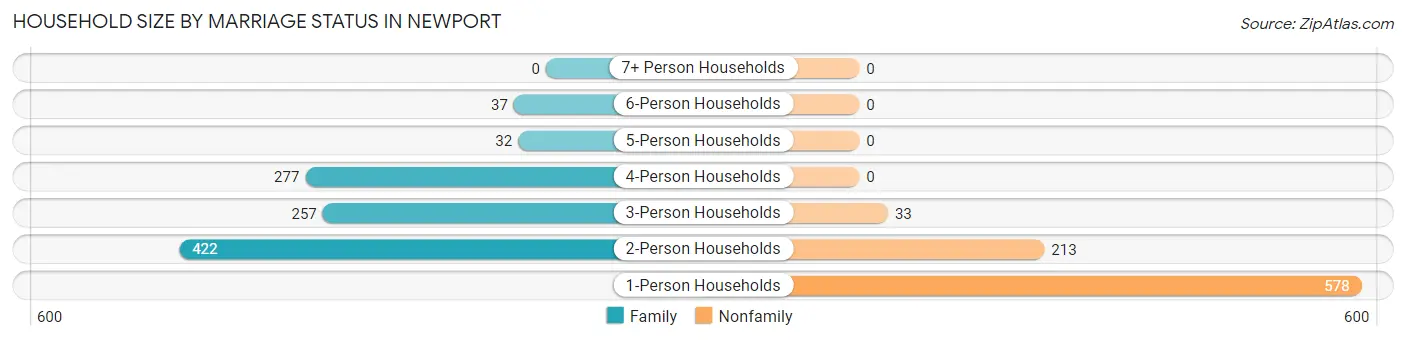
| Household Size | Family Households | Nonfamily Households |
| 1-Person Households | - | 578 (31.3%) |
| 2-Person Households | 422 (22.8%) | 213 (11.5%) |
| 3-Person Households | 257 (13.9%) | 33 (1.8%) |
| 4-Person Households | 277 (15.0%) | 0 (0.0%) |
| 5-Person Households | 32 (1.7%) | 0 (0.0%) |
| 6-Person Households | 37 (2.0%) | 0 (0.0%) |
| 7+ Person Households | 0 (0.0%) | 0 (0.0%) |
| Total | 1,025 (55.4%) | 824 (44.6%) |
Female Fertility in Newport
Fertility by Age in Newport
Average fertility rate in Newport is 55.0 births per 1,000 women. Women in the age bracket of 20 to 34 years have the highest fertility rate with 88.0 births per 1,000 women. Women in the age bracket of 20 to 34 years acount for 89.5% of all women with births.
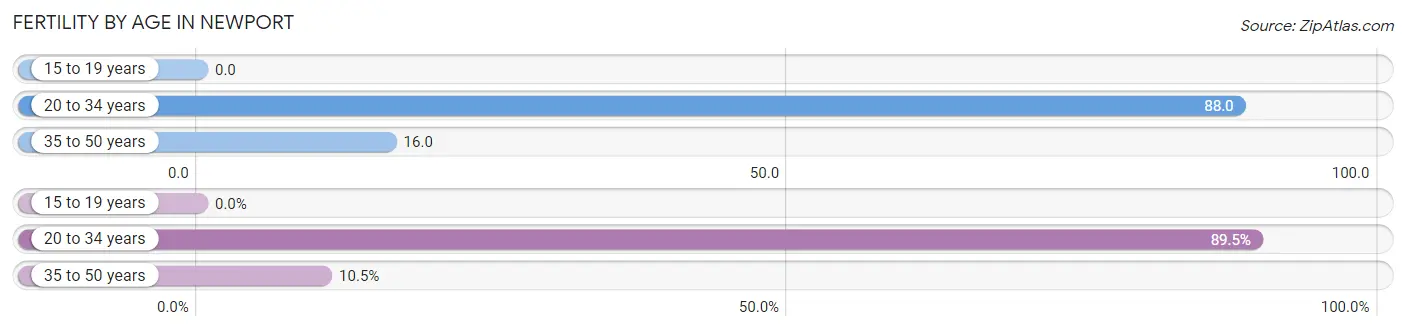
| Age Bracket | Women with Births | Births / 1,000 Women |
| 15 to 19 years | 0 (0.0%) | 0.0 |
| 20 to 34 years | 51 (89.5%) | 88.0 |
| 35 to 50 years | 6 (10.5%) | 16.0 |
| Total | 57 (100.0%) | 55.0 |
Fertility by Age by Marriage Status in Newport
63.2% of women with births (57) in Newport are married. The highest percentage of unmarried women with births falls into 20 to 34 years age bracket with 41.2% of them unmarried at the time of birth, while the lowest percentage of unmarried women with births belong to 35 to 50 years age bracket with 0.0% of them unmarried.
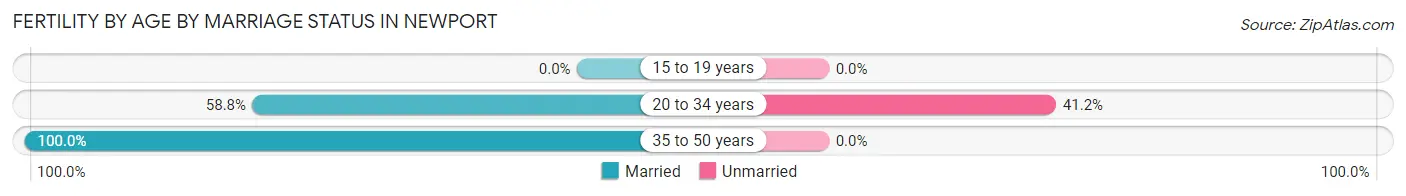
| Age Bracket | Married | Unmarried |
| 15 to 19 years | 0 (0.0%) | 0 (0.0%) |
| 20 to 34 years | 30 (58.8%) | 21 (41.2%) |
| 35 to 50 years | 6 (100.0%) | 0 (0.0%) |
| Total | 36 (63.2%) | 21 (36.8%) |
Fertility by Education in Newport
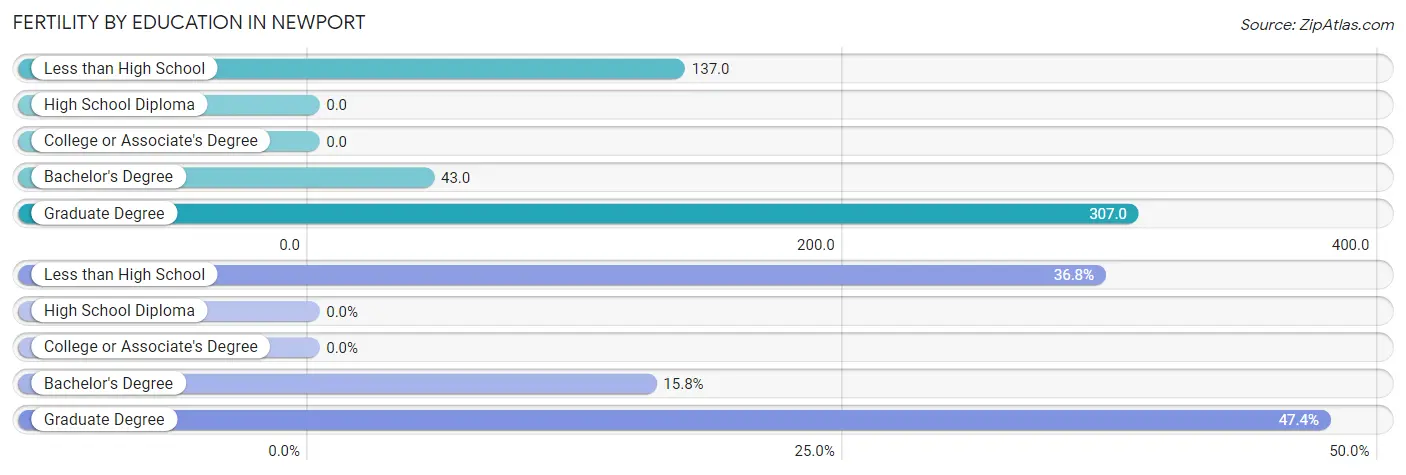
| Educational Attainment | Women with Births | Births / 1,000 Women |
| Less than High School | 21 (36.8%) | 137.0 |
| High School Diploma | 0 (0.0%) | 0.0 |
| College or Associate's Degree | 0 (0.0%) | 0.0 |
| Bachelor's Degree | 9 (15.8%) | 43.0 |
| Graduate Degree | 27 (47.4%) | 307.0 |
| Total | 57 (100.0%) | 55.0 |
Fertility by Education by Marriage Status in Newport
36.8% of women with births in Newport are unmarried. Women with the educational attainment of less than high school are most likely to be married with 100.0% of them married at childbirth, while women with the educational attainment of graduate degree are least likely to be married with 77.8% of them unmarried at childbirth.
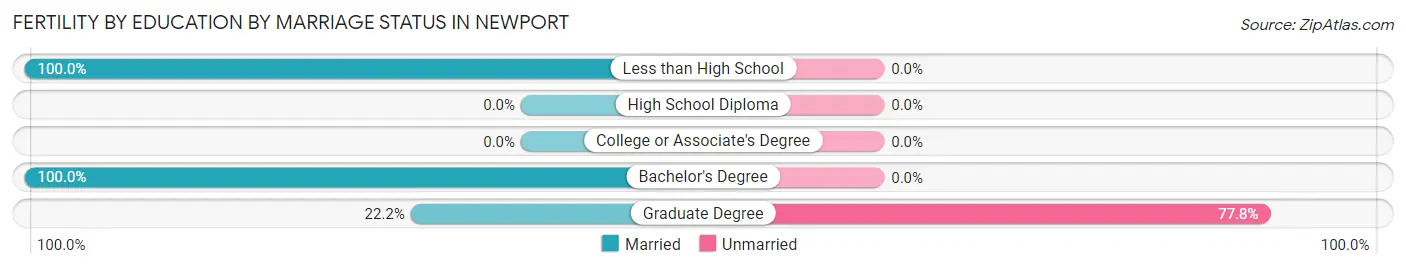
| Educational Attainment | Married | Unmarried |
| Less than High School | 21 (100.0%) | 0 (0.0%) |
| High School Diploma | 0 (0.0%) | 0 (0.0%) |
| College or Associate's Degree | 0 (0.0%) | 0 (0.0%) |
| Bachelor's Degree | 9 (100.0%) | 0 (0.0%) |
| Graduate Degree | 6 (22.2%) | 21 (77.8%) |
| Total | 36 (63.2%) | 21 (36.8%) |
Employment Characteristics in Newport
Employment by Class of Employer in Newport
Among the 2,183 employed individuals in Newport, private company employees (1,708 | 78.2%), not-for-profit organizations (151 | 6.9%), and self-employed (incorporated) (99 | 4.5%) make up the most common classes of employment.
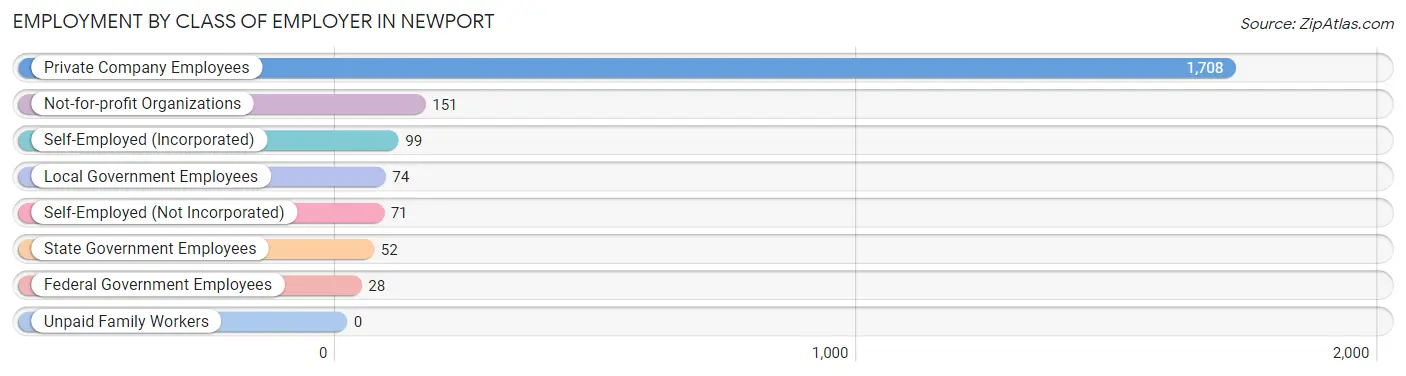
| Employer Class | # Employees | % Employees |
| Private Company Employees | 1,708 | 78.2% |
| Self-Employed (Incorporated) | 99 | 4.5% |
| Self-Employed (Not Incorporated) | 71 | 3.3% |
| Not-for-profit Organizations | 151 | 6.9% |
| Local Government Employees | 74 | 3.4% |
| State Government Employees | 52 | 2.4% |
| Federal Government Employees | 28 | 1.3% |
| Unpaid Family Workers | 0 | 0.0% |
| Total | 2,183 | 100.0% |
Employment Status by Age in Newport
According to the labor force statistics for Newport, out of the total population over 16 years of age (3,474), 65.4% or 2,272 individuals are in the labor force, with 3.6% or 82 of them unemployed. The age group with the highest labor force participation rate is 25 to 29 years, with 96.6% or 229 individuals in the labor force. Within the labor force, the 30 to 34 years age range has the highest percentage of unemployed individuals, with 16.0% or 44 of them being unemployed.
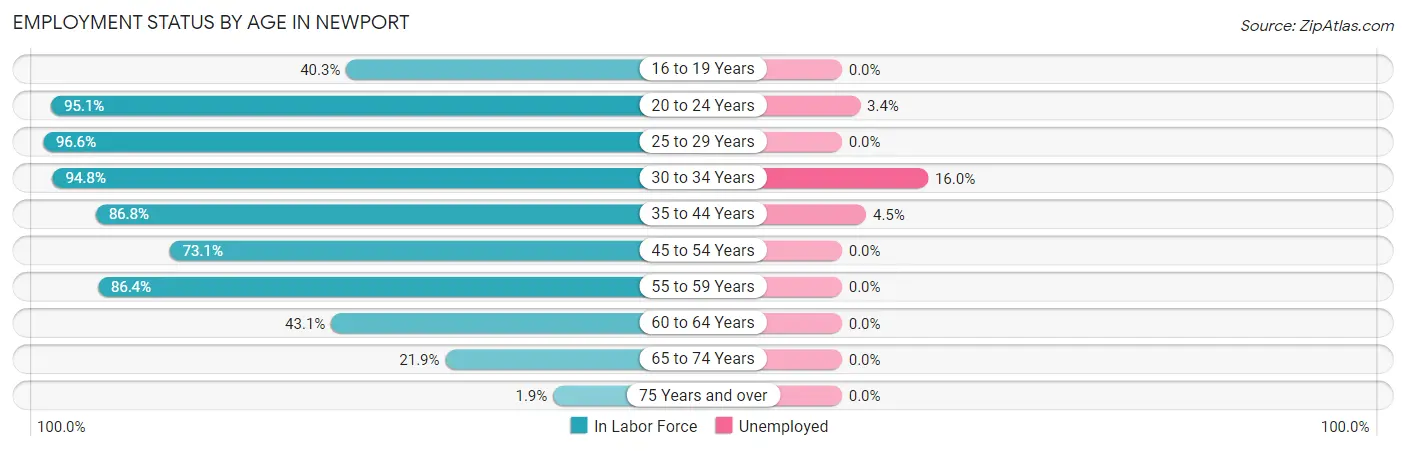
| Age Bracket | In Labor Force | Unemployed |
| 16 to 19 Years | 83 (40.3%) | 0 (0.0%) |
| 20 to 24 Years | 466 (95.1%) | 16 (3.4%) |
| 25 to 29 Years | 229 (96.6%) | 0 (0.0%) |
| 30 to 34 Years | 274 (94.8%) | 44 (16.0%) |
| 35 to 44 Years | 531 (86.8%) | 24 (4.5%) |
| 45 to 54 Years | 283 (73.1%) | 0 (0.0%) |
| 55 to 59 Years | 203 (86.4%) | 0 (0.0%) |
| 60 to 64 Years | 115 (43.1%) | 0 (0.0%) |
| 65 to 74 Years | 82 (21.9%) | 0 (0.0%) |
| 75 Years and over | 7 (1.9%) | 0 (0.0%) |
| Total | 2,272 (65.4%) | 82 (3.6%) |
Employment Status by Educational Attainment in Newport
According to labor force statistics for Newport, 80.7% of individuals (1,636) out of the total population between 25 and 64 years of age (2,027) are in the labor force, with 4.1% or 67 of them being unemployed. The group with the highest labor force participation rate are those with the educational attainment of bachelor's degree or higher, with 85.0% or 539 individuals in the labor force. Within the labor force, individuals with less than high school education have the highest percentage of unemployment, with 32.3% or 21 of them being unemployed.
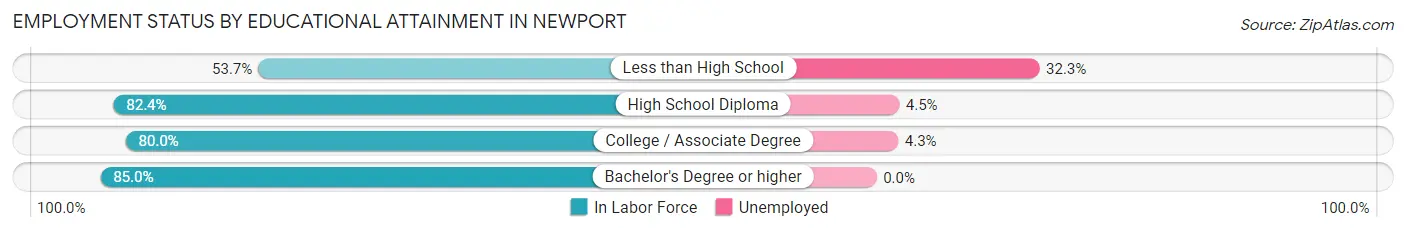
| Educational Attainment | In Labor Force | Unemployed |
| Less than High School | 65 (53.7%) | 39 (32.3%) |
| High School Diploma | 467 (82.4%) | 26 (4.5%) |
| College / Associate Degree | 564 (80.0%) | 30 (4.3%) |
| Bachelor's Degree or higher | 539 (85.0%) | 0 (0.0%) |
| Total | 1,636 (80.7%) | 83 (4.1%) |
Employment Occupations by Sex in Newport
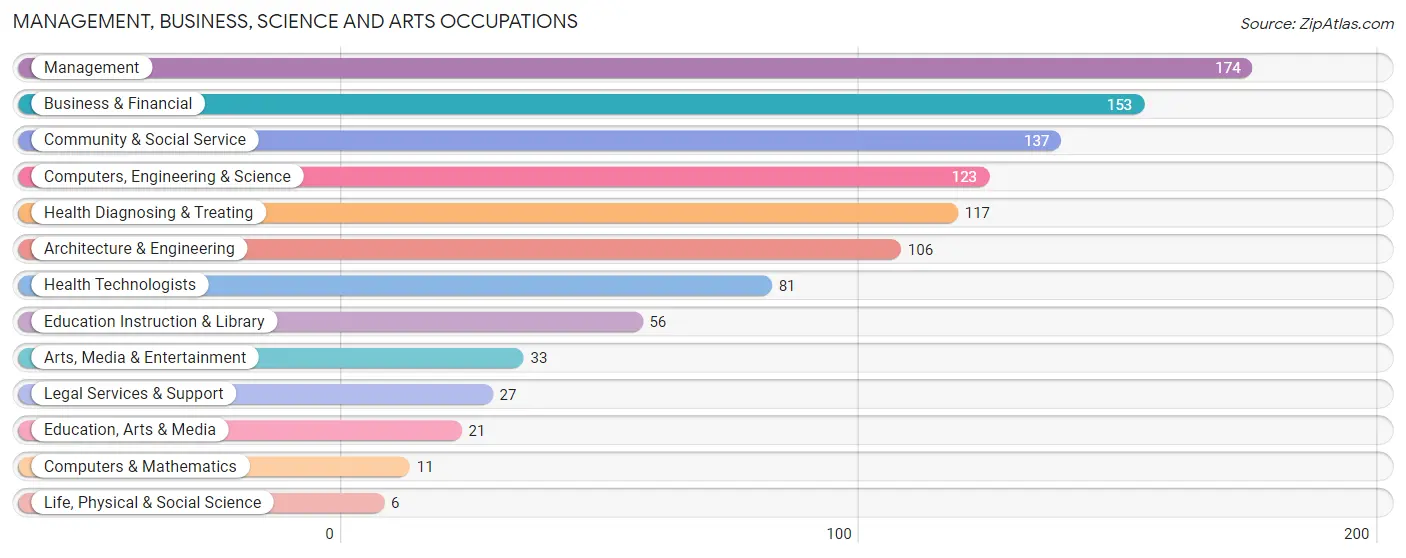
Management, Business, Science and Arts Occupations
The most common Management, Business, Science and Arts occupations in Newport are Management (174 | 8.0%), Business & Financial (153 | 7.0%), Community & Social Service (137 | 6.3%), Computers, Engineering & Science (123 | 5.6%), and Health Diagnosing & Treating (117 | 5.4%).
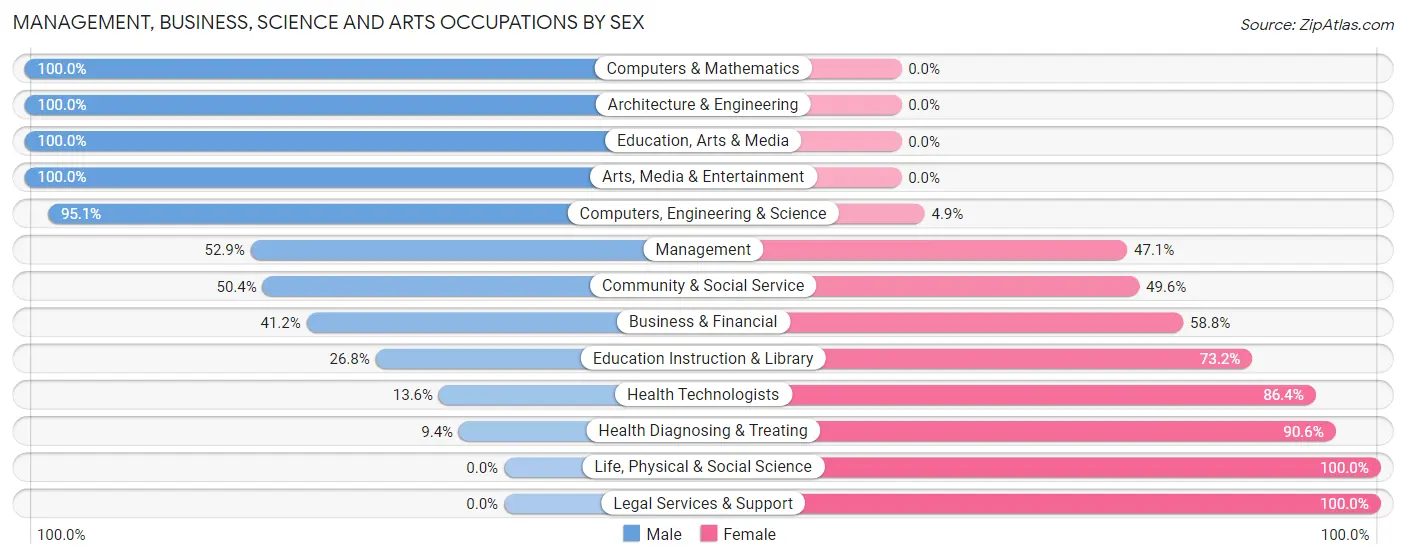
Management, Business, Science and Arts Occupations by Sex
Within the Management, Business, Science and Arts occupations in Newport, the most male-oriented occupations are Computers & Mathematics (100.0%), Architecture & Engineering (100.0%), and Education, Arts & Media (100.0%), while the most female-oriented occupations are Life, Physical & Social Science (100.0%), Legal Services & Support (100.0%), and Health Diagnosing & Treating (90.6%).
| Occupation | Male | Female |
| Management | 92 (52.9%) | 82 (47.1%) |
| Business & Financial | 63 (41.2%) | 90 (58.8%) |
| Computers, Engineering & Science | 117 (95.1%) | 6 (4.9%) |
| Computers & Mathematics | 11 (100.0%) | 0 (0.0%) |
| Architecture & Engineering | 106 (100.0%) | 0 (0.0%) |
| Life, Physical & Social Science | 0 (0.0%) | 6 (100.0%) |
| Community & Social Service | 69 (50.4%) | 68 (49.6%) |
| Education, Arts & Media | 21 (100.0%) | 0 (0.0%) |
| Legal Services & Support | 0 (0.0%) | 27 (100.0%) |
| Education Instruction & Library | 15 (26.8%) | 41 (73.2%) |
| Arts, Media & Entertainment | 33 (100.0%) | 0 (0.0%) |
| Health Diagnosing & Treating | 11 (9.4%) | 106 (90.6%) |
| Health Technologists | 11 (13.6%) | 70 (86.4%) |
| Total (Category) | 352 (50.0%) | 352 (50.0%) |
| Total (Overall) | 1,203 (55.2%) | 976 (44.8%) |
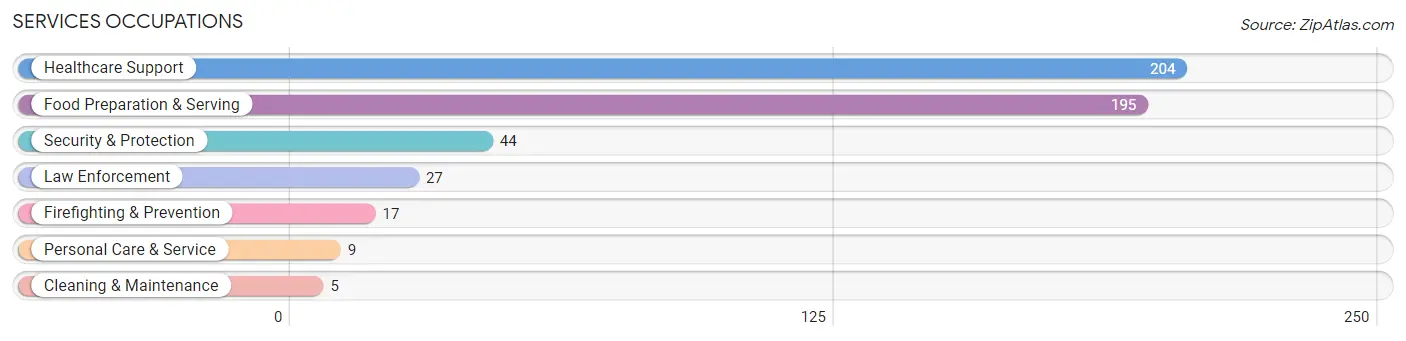
Services Occupations
The most common Services occupations in Newport are Healthcare Support (204 | 9.4%), Food Preparation & Serving (195 | 8.9%), Security & Protection (44 | 2.0%), Law Enforcement (27 | 1.2%), and Firefighting & Prevention (17 | 0.8%).
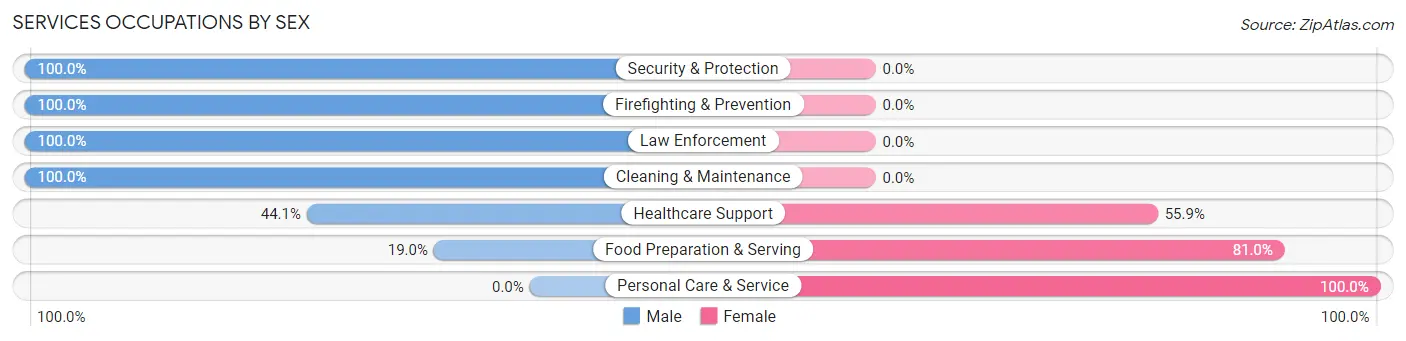
Services Occupations by Sex
Within the Services occupations in Newport, the most male-oriented occupations are Security & Protection (100.0%), Firefighting & Prevention (100.0%), and Law Enforcement (100.0%), while the most female-oriented occupations are Personal Care & Service (100.0%), Food Preparation & Serving (81.0%), and Healthcare Support (55.9%).
| Occupation | Male | Female |
| Healthcare Support | 90 (44.1%) | 114 (55.9%) |
| Security & Protection | 44 (100.0%) | 0 (0.0%) |
| Firefighting & Prevention | 17 (100.0%) | 0 (0.0%) |
| Law Enforcement | 27 (100.0%) | 0 (0.0%) |
| Food Preparation & Serving | 37 (19.0%) | 158 (81.0%) |
| Cleaning & Maintenance | 5 (100.0%) | 0 (0.0%) |
| Personal Care & Service | 0 (0.0%) | 9 (100.0%) |
| Total (Category) | 176 (38.5%) | 281 (61.5%) |
| Total (Overall) | 1,203 (55.2%) | 976 (44.8%) |
Sales and Office Occupations
The most common Sales and Office occupations in Newport are Office & Administration (282 | 12.9%), and Sales & Related (178 | 8.2%).
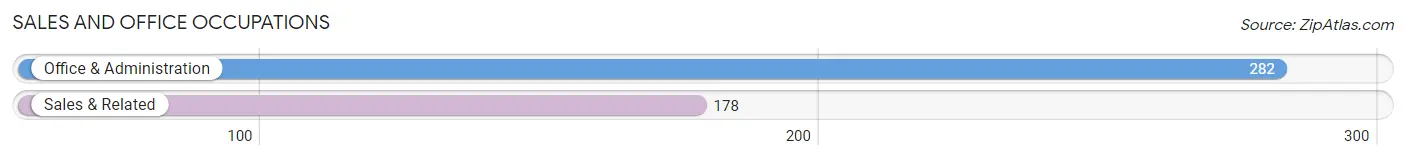
Sales and Office Occupations by Sex
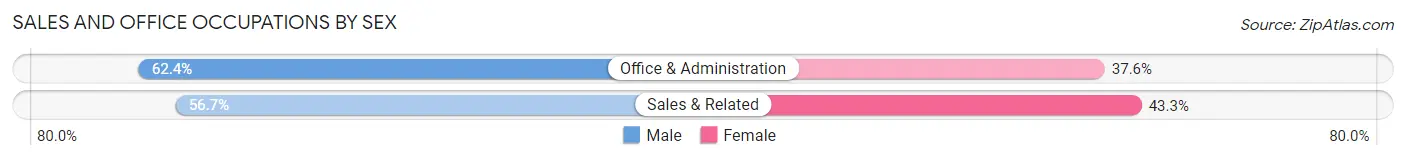
| Occupation | Male | Female |
| Sales & Related | 101 (56.7%) | 77 (43.3%) |
| Office & Administration | 176 (62.4%) | 106 (37.6%) |
| Total (Category) | 277 (60.2%) | 183 (39.8%) |
| Total (Overall) | 1,203 (55.2%) | 976 (44.8%) |
Natural Resources, Construction and Maintenance Occupations
The most common Natural Resources, Construction and Maintenance occupations in Newport are Construction & Extraction (125 | 5.7%), and Installation, Maintenance & Repair (62 | 2.9%).
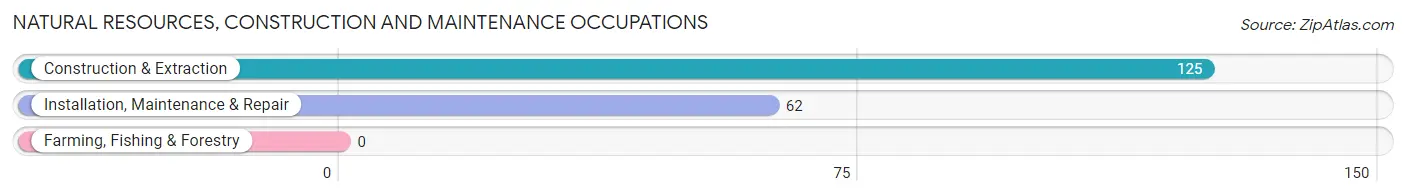
Natural Resources, Construction and Maintenance Occupations by Sex
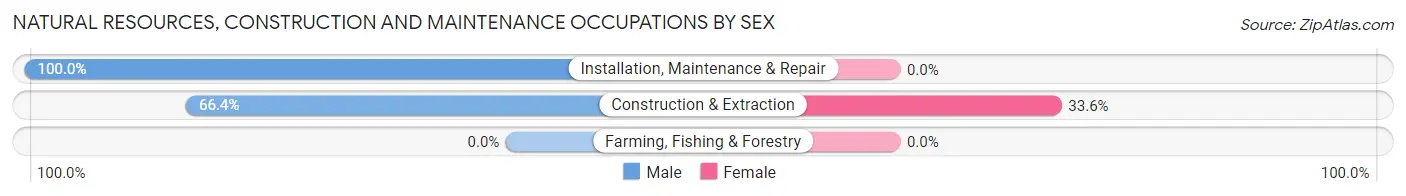
| Occupation | Male | Female |
| Farming, Fishing & Forestry | 0 (0.0%) | 0 (0.0%) |
| Construction & Extraction | 83 (66.4%) | 42 (33.6%) |
| Installation, Maintenance & Repair | 62 (100.0%) | 0 (0.0%) |
| Total (Category) | 145 (77.5%) | 42 (22.5%) |
| Total (Overall) | 1,203 (55.2%) | 976 (44.8%) |
Production, Transportation and Moving Occupations
The most common Production, Transportation and Moving occupations in Newport are Production (307 | 14.1%), Transportation (39 | 1.8%), and Material Moving (25 | 1.1%).
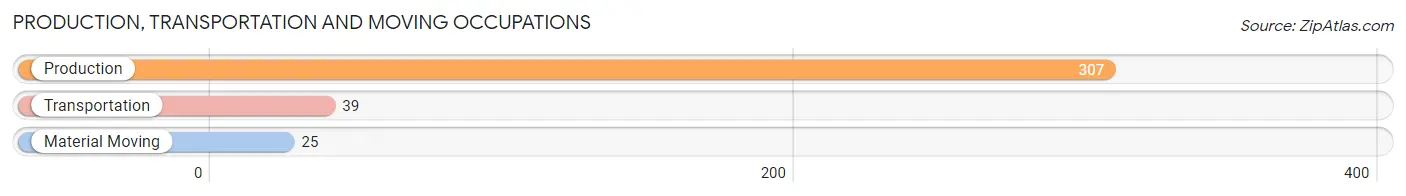
Production, Transportation and Moving Occupations by Sex
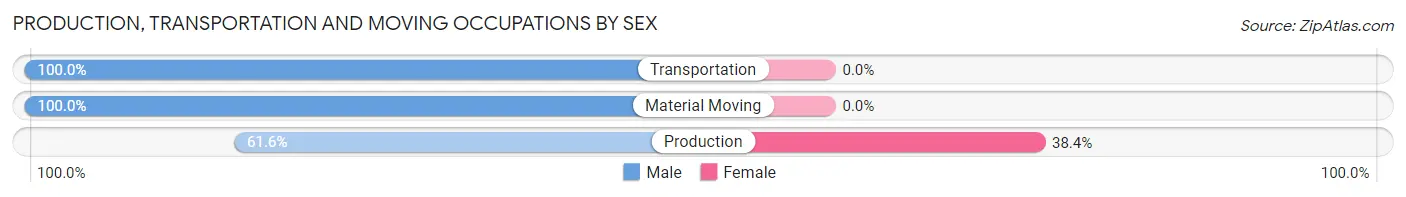
| Occupation | Male | Female |
| Production | 189 (61.6%) | 118 (38.4%) |
| Transportation | 39 (100.0%) | 0 (0.0%) |
| Material Moving | 25 (100.0%) | 0 (0.0%) |
| Total (Category) | 253 (68.2%) | 118 (31.8%) |
| Total (Overall) | 1,203 (55.2%) | 976 (44.8%) |
Employment Industries by Sex in Newport
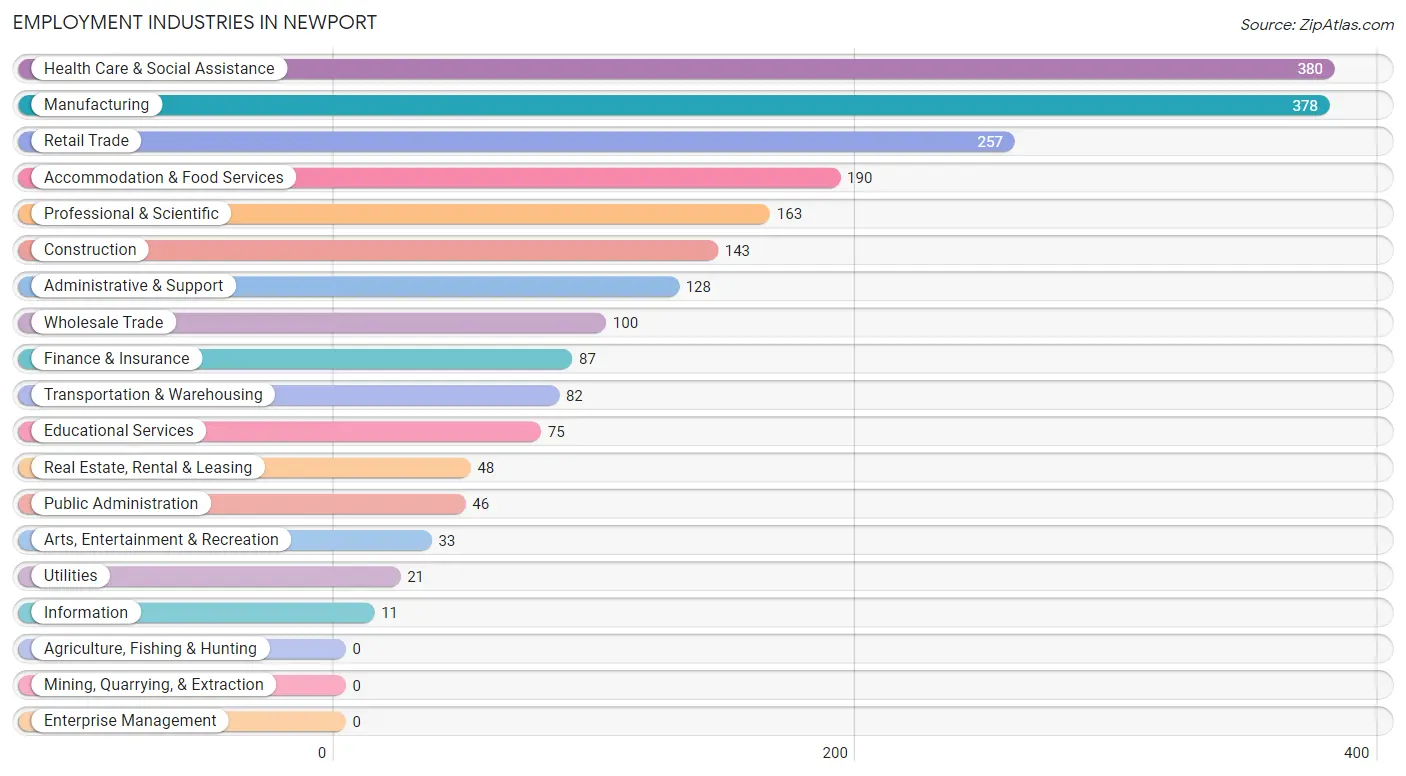
Employment Industries in Newport
The major employment industries in Newport include Health Care & Social Assistance (380 | 17.4%), Manufacturing (378 | 17.3%), Retail Trade (257 | 11.8%), Accommodation & Food Services (190 | 8.7%), and Professional & Scientific (163 | 7.5%).
Employment Industries by Sex in Newport
The Newport industries that see more men than women are Arts, Entertainment & Recreation (100.0%), Public Administration (100.0%), and Wholesale Trade (96.0%), whereas the industries that tend to have a higher number of women are Information (100.0%), Accommodation & Food Services (90.0%), and Finance & Insurance (73.6%).
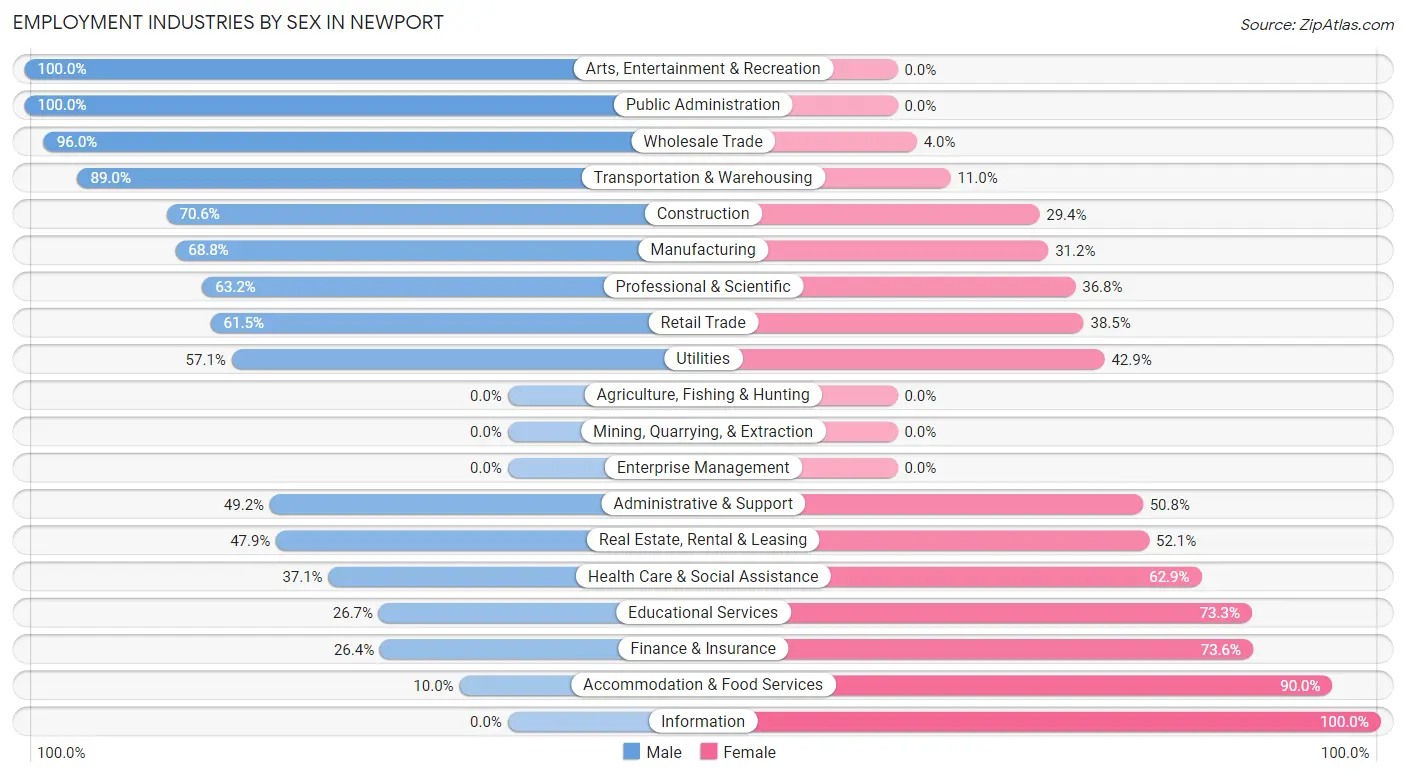
| Industry | Male | Female |
| Agriculture, Fishing & Hunting | 0 (0.0%) | 0 (0.0%) |
| Mining, Quarrying, & Extraction | 0 (0.0%) | 0 (0.0%) |
| Construction | 101 (70.6%) | 42 (29.4%) |
| Manufacturing | 260 (68.8%) | 118 (31.2%) |
| Wholesale Trade | 96 (96.0%) | 4 (4.0%) |
| Retail Trade | 158 (61.5%) | 99 (38.5%) |
| Transportation & Warehousing | 73 (89.0%) | 9 (11.0%) |
| Utilities | 12 (57.1%) | 9 (42.9%) |
| Information | 0 (0.0%) | 11 (100.0%) |
| Finance & Insurance | 23 (26.4%) | 64 (73.6%) |
| Real Estate, Rental & Leasing | 23 (47.9%) | 25 (52.1%) |
| Professional & Scientific | 103 (63.2%) | 60 (36.8%) |
| Enterprise Management | 0 (0.0%) | 0 (0.0%) |
| Administrative & Support | 63 (49.2%) | 65 (50.8%) |
| Educational Services | 20 (26.7%) | 55 (73.3%) |
| Health Care & Social Assistance | 141 (37.1%) | 239 (62.9%) |
| Arts, Entertainment & Recreation | 33 (100.0%) | 0 (0.0%) |
| Accommodation & Food Services | 19 (10.0%) | 171 (90.0%) |
| Public Administration | 46 (100.0%) | 0 (0.0%) |
| Total | 1,203 (55.2%) | 976 (44.8%) |
Education in Newport
School Enrollment in Newport
The most common levels of schooling among the 825 students in Newport are high school (266 | 32.2%), middle school (181 | 21.9%), and elementary school (126 | 15.3%).
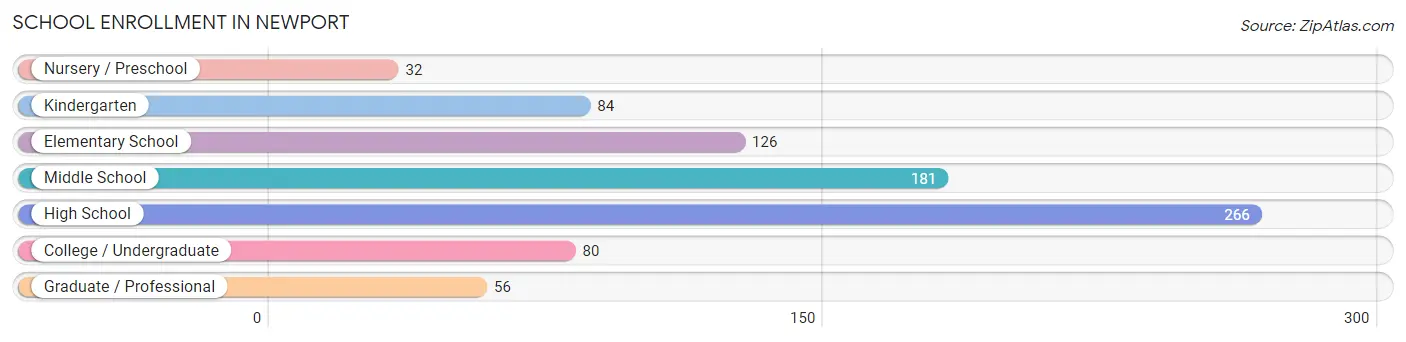
| School Level | # Students | % Students |
| Nursery / Preschool | 32 | 3.9% |
| Kindergarten | 84 | 10.2% |
| Elementary School | 126 | 15.3% |
| Middle School | 181 | 21.9% |
| High School | 266 | 32.2% |
| College / Undergraduate | 80 | 9.7% |
| Graduate / Professional | 56 | 6.8% |
| Total | 825 | 100.0% |
School Enrollment by Age by Funding Source in Newport
Out of a total of 825 students who are enrolled in schools in Newport, 64 (7.8%) attend a private institution, while the remaining 761 (92.2%) are enrolled in public schools. The age group of 35 years and over has the highest likelihood of being enrolled in private schools, with 22 (81.5% in the age bracket) enrolled. Conversely, the age group of 5 to 9 year old has the lowest likelihood of being enrolled in a private school, with 222 (100.0% in the age bracket) attending a public institution.
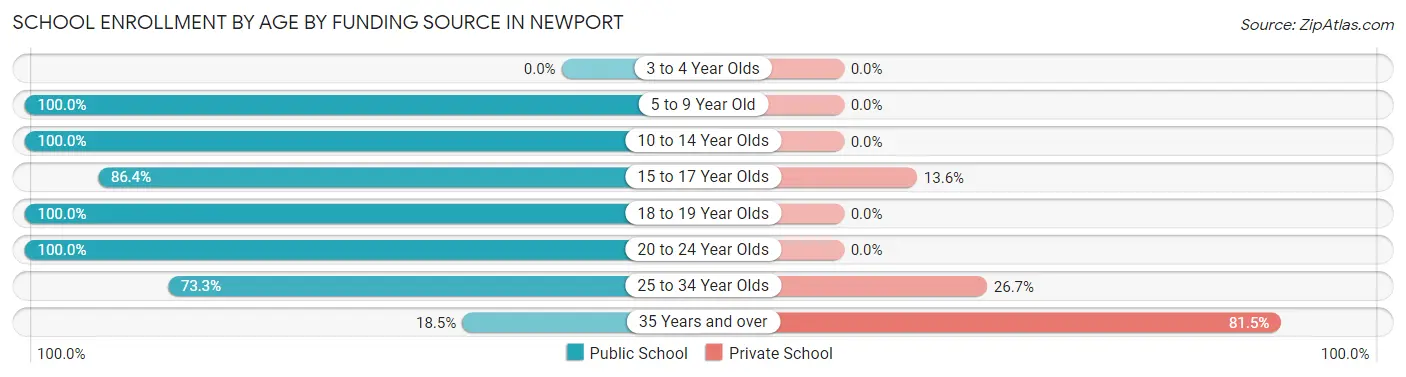
| Age Bracket | Public School | Private School |
| 3 to 4 Year Olds | 0 (0.0%) | 0 (0.0%) |
| 5 to 9 Year Old | 222 (100.0%) | 0 (0.0%) |
| 10 to 14 Year Olds | 216 (100.0%) | 0 (0.0%) |
| 15 to 17 Year Olds | 190 (86.4%) | 30 (13.6%) |
| 18 to 19 Year Olds | 31 (100.0%) | 0 (0.0%) |
| 20 to 24 Year Olds | 64 (100.0%) | 0 (0.0%) |
| 25 to 34 Year Olds | 33 (73.3%) | 12 (26.7%) |
| 35 Years and over | 5 (18.5%) | 22 (81.5%) |
| Total | 761 (92.2%) | 64 (7.8%) |
Educational Attainment by Field of Study in Newport
Business (201 | 27.1%), bio, nature & agricultural (80 | 10.8%), arts & humanities (70 | 9.4%), science & technology (66 | 8.9%), and engineering (59 | 8.0%) are the most common fields of study among 742 individuals in Newport who have obtained a bachelor's degree or higher.
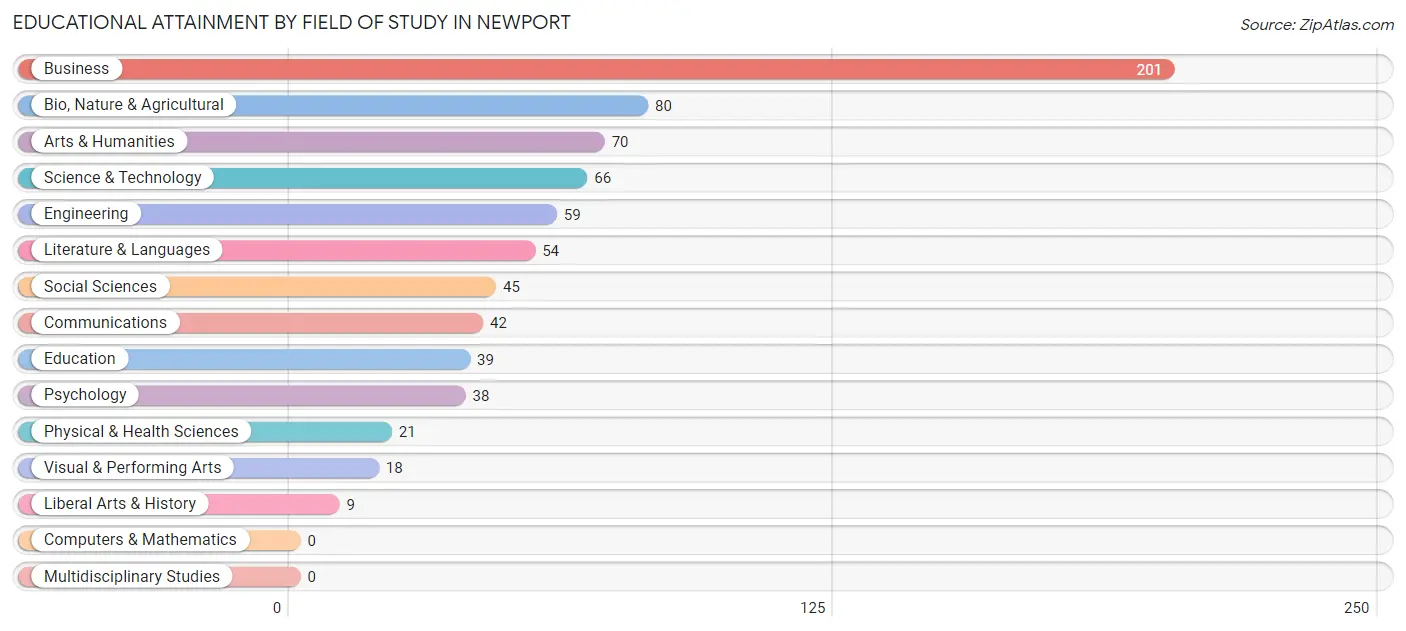
| Field of Study | # Graduates | % Graduates |
| Computers & Mathematics | 0 | 0.0% |
| Bio, Nature & Agricultural | 80 | 10.8% |
| Physical & Health Sciences | 21 | 2.8% |
| Psychology | 38 | 5.1% |
| Social Sciences | 45 | 6.1% |
| Engineering | 59 | 8.0% |
| Multidisciplinary Studies | 0 | 0.0% |
| Science & Technology | 66 | 8.9% |
| Business | 201 | 27.1% |
| Education | 39 | 5.3% |
| Literature & Languages | 54 | 7.3% |
| Liberal Arts & History | 9 | 1.2% |
| Visual & Performing Arts | 18 | 2.4% |
| Communications | 42 | 5.7% |
| Arts & Humanities | 70 | 9.4% |
| Total | 742 | 100.0% |
Transportation & Commute in Newport
Vehicle Availability by Sex in Newport
The most prevalent vehicle ownership categories in Newport are males with 2 vehicles (508, accounting for 41.8%) and females with 2 vehicles (493, making up 52.5%).
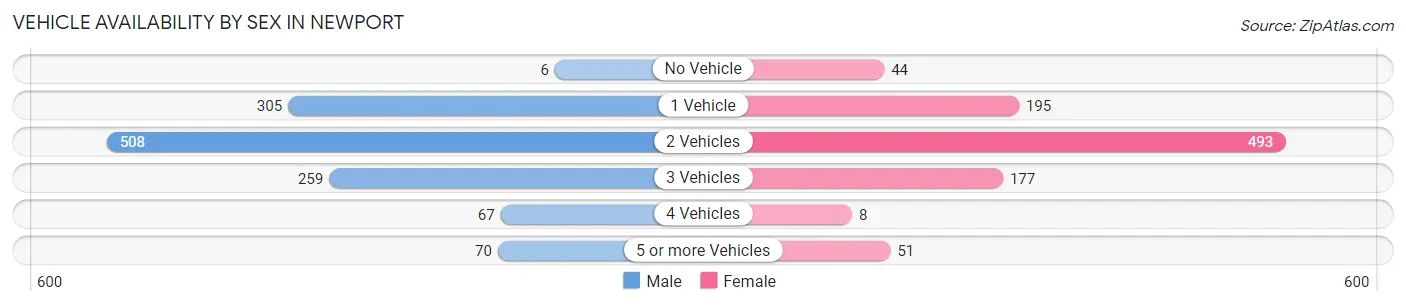
| Vehicles Available | Male | Female |
| No Vehicle | 6 (0.5%) | 44 (4.5%) |
| 1 Vehicle | 305 (25.1%) | 195 (20.1%) |
| 2 Vehicles | 508 (41.8%) | 493 (50.9%) |
| 3 Vehicles | 259 (21.3%) | 177 (18.3%) |
| 4 Vehicles | 67 (5.5%) | 8 (0.8%) |
| 5 or more Vehicles | 70 (5.8%) | 51 (5.3%) |
| Total | 1,215 (100.0%) | 968 (100.0%) |
Commute Time in Newport
The most frequently occuring commute durations in Newport are 10 to 14 minutes (364 commuters, 18.9%), 20 to 24 minutes (351 commuters, 18.2%), and 15 to 19 minutes (263 commuters, 13.6%).
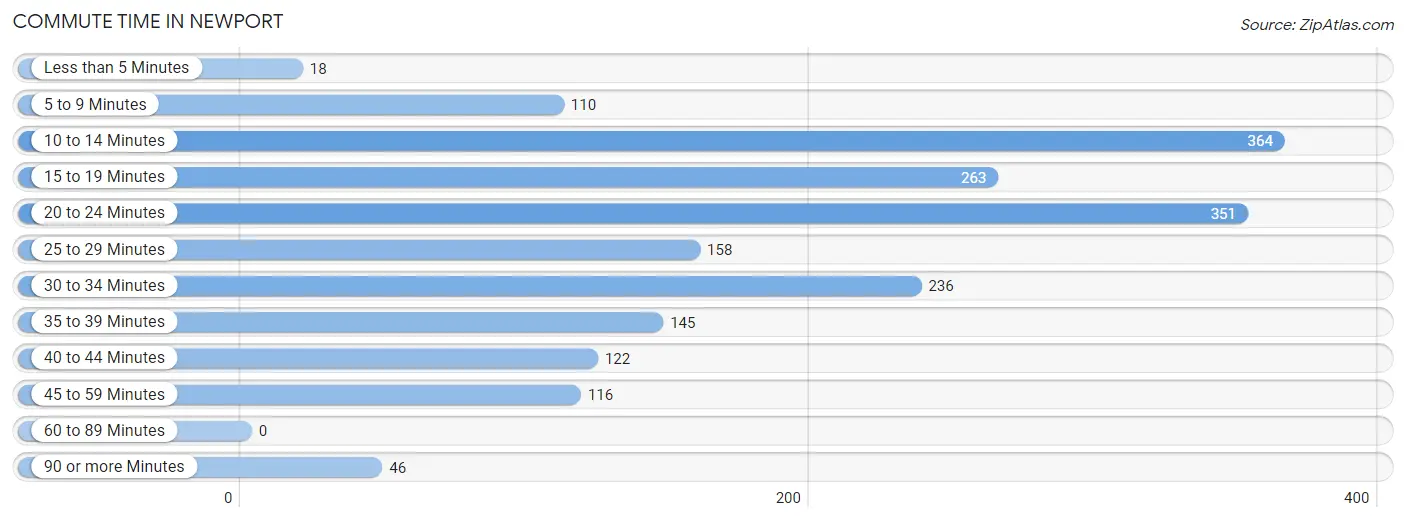
| Commute Time | # Commuters | % Commuters |
| Less than 5 Minutes | 18 | 0.9% |
| 5 to 9 Minutes | 110 | 5.7% |
| 10 to 14 Minutes | 364 | 18.9% |
| 15 to 19 Minutes | 263 | 13.6% |
| 20 to 24 Minutes | 351 | 18.2% |
| 25 to 29 Minutes | 158 | 8.2% |
| 30 to 34 Minutes | 236 | 12.2% |
| 35 to 39 Minutes | 145 | 7.5% |
| 40 to 44 Minutes | 122 | 6.3% |
| 45 to 59 Minutes | 116 | 6.0% |
| 60 to 89 Minutes | 0 | 0.0% |
| 90 or more Minutes | 46 | 2.4% |
Commute Time by Sex in Newport
The most common commute times in Newport are 20 to 24 minutes (291 commuters, 26.6%) for males and 10 to 14 minutes (240 commuters, 28.7%) for females.
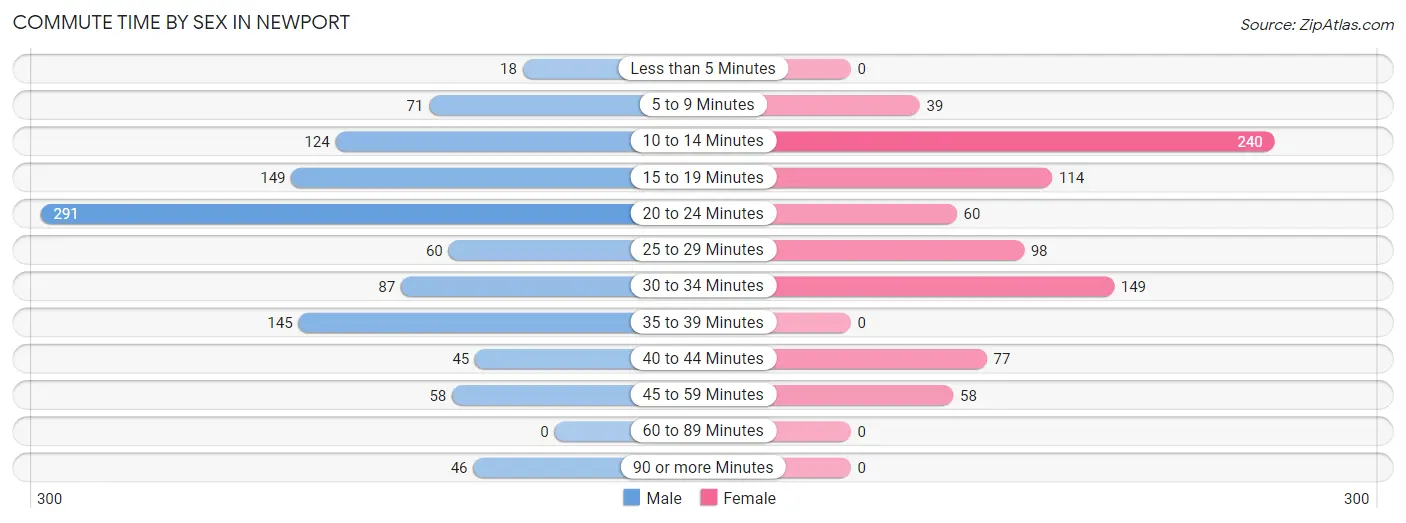
| Commute Time | Male | Female |
| Less than 5 Minutes | 18 (1.7%) | 0 (0.0%) |
| 5 to 9 Minutes | 71 (6.5%) | 39 (4.7%) |
| 10 to 14 Minutes | 124 (11.3%) | 240 (28.7%) |
| 15 to 19 Minutes | 149 (13.6%) | 114 (13.7%) |
| 20 to 24 Minutes | 291 (26.6%) | 60 (7.2%) |
| 25 to 29 Minutes | 60 (5.5%) | 98 (11.7%) |
| 30 to 34 Minutes | 87 (8.0%) | 149 (17.8%) |
| 35 to 39 Minutes | 145 (13.3%) | 0 (0.0%) |
| 40 to 44 Minutes | 45 (4.1%) | 77 (9.2%) |
| 45 to 59 Minutes | 58 (5.3%) | 58 (7.0%) |
| 60 to 89 Minutes | 0 (0.0%) | 0 (0.0%) |
| 90 or more Minutes | 46 (4.2%) | 0 (0.0%) |
Time of Departure to Work by Sex in Newport
The most frequent times of departure to work in Newport are 7:00 AM to 7:29 AM (165, 15.1%) for males and 4:00 PM to 11:59 PM (202, 24.2%) for females.
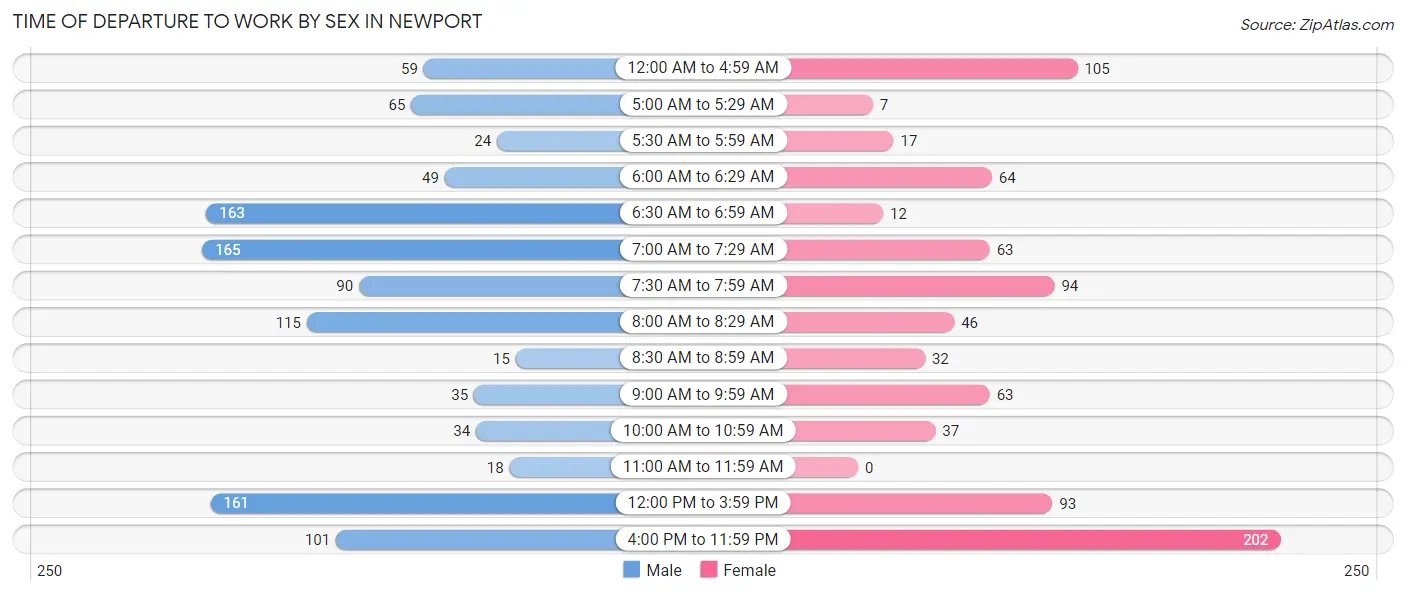
| Time of Departure | Male | Female |
| 12:00 AM to 4:59 AM | 59 (5.4%) | 105 (12.6%) |
| 5:00 AM to 5:29 AM | 65 (5.9%) | 7 (0.8%) |
| 5:30 AM to 5:59 AM | 24 (2.2%) | 17 (2.0%) |
| 6:00 AM to 6:29 AM | 49 (4.5%) | 64 (7.7%) |
| 6:30 AM to 6:59 AM | 163 (14.9%) | 12 (1.4%) |
| 7:00 AM to 7:29 AM | 165 (15.1%) | 63 (7.5%) |
| 7:30 AM to 7:59 AM | 90 (8.2%) | 94 (11.3%) |
| 8:00 AM to 8:29 AM | 115 (10.5%) | 46 (5.5%) |
| 8:30 AM to 8:59 AM | 15 (1.4%) | 32 (3.8%) |
| 9:00 AM to 9:59 AM | 35 (3.2%) | 63 (7.5%) |
| 10:00 AM to 10:59 AM | 34 (3.1%) | 37 (4.4%) |
| 11:00 AM to 11:59 AM | 18 (1.7%) | 0 (0.0%) |
| 12:00 PM to 3:59 PM | 161 (14.7%) | 93 (11.1%) |
| 4:00 PM to 11:59 PM | 101 (9.2%) | 202 (24.2%) |
| Total | 1,094 (100.0%) | 835 (100.0%) |
Housing Occupancy in Newport
Occupancy by Ownership in Newport
Of the total 1,849 dwellings in Newport, owner-occupied units account for 1,236 (66.8%), while renter-occupied units make up 613 (33.2%).
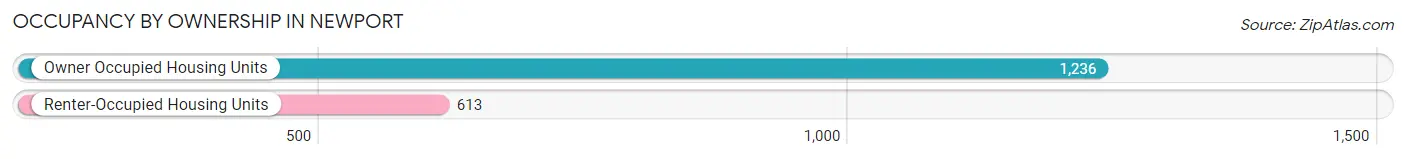
| Occupancy | # Housing Units | % Housing Units |
| Owner Occupied Housing Units | 1,236 | 66.8% |
| Renter-Occupied Housing Units | 613 | 33.2% |
| Total Occupied Housing Units | 1,849 | 100.0% |
Occupancy by Household Size in Newport
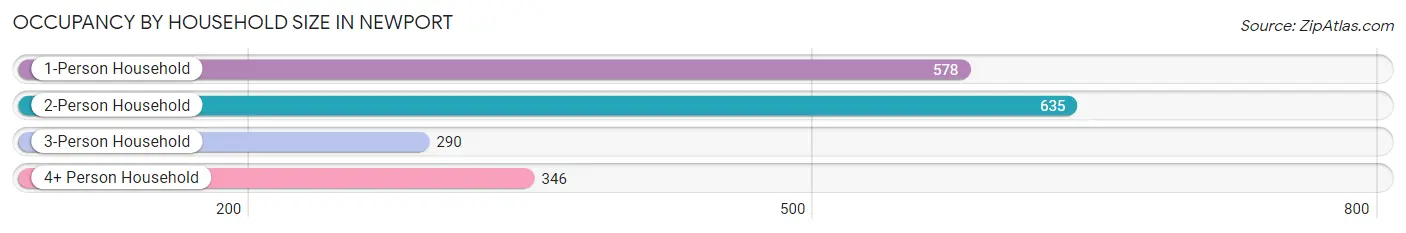
| Household Size | # Housing Units | % Housing Units |
| 1-Person Household | 578 | 31.3% |
| 2-Person Household | 635 | 34.3% |
| 3-Person Household | 290 | 15.7% |
| 4+ Person Household | 346 | 18.7% |
| Total Housing Units | 1,849 | 100.0% |
Occupancy by Ownership by Household Size in Newport
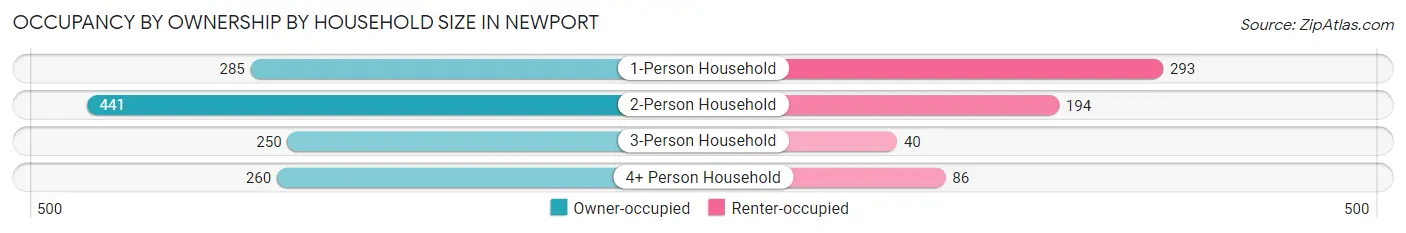
| Household Size | Owner-occupied | Renter-occupied |
| 1-Person Household | 285 (49.3%) | 293 (50.7%) |
| 2-Person Household | 441 (69.5%) | 194 (30.5%) |
| 3-Person Household | 250 (86.2%) | 40 (13.8%) |
| 4+ Person Household | 260 (75.1%) | 86 (24.9%) |
| Total Housing Units | 1,236 (66.8%) | 613 (33.2%) |
Occupancy by Educational Attainment in Newport
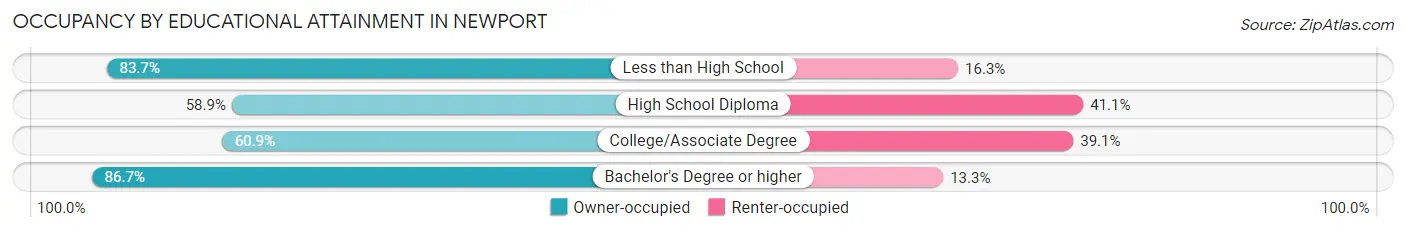
| Household Size | Owner-occupied | Renter-occupied |
| Less than High School | 103 (83.7%) | 20 (16.3%) |
| High School Diploma | 340 (58.9%) | 237 (41.1%) |
| College/Associate Degree | 480 (60.9%) | 308 (39.1%) |
| Bachelor's Degree or higher | 313 (86.7%) | 48 (13.3%) |
Occupancy by Age of Householder in Newport
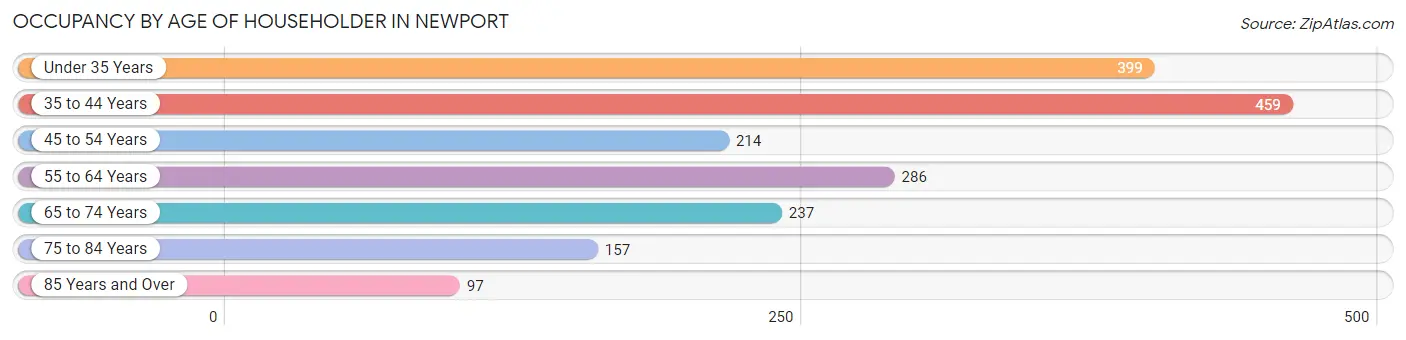
| Age Bracket | # Households | % Households |
| Under 35 Years | 399 | 21.6% |
| 35 to 44 Years | 459 | 24.8% |
| 45 to 54 Years | 214 | 11.6% |
| 55 to 64 Years | 286 | 15.5% |
| 65 to 74 Years | 237 | 12.8% |
| 75 to 84 Years | 157 | 8.5% |
| 85 Years and Over | 97 | 5.2% |
| Total | 1,849 | 100.0% |
Housing Finances in Newport
Median Income by Occupancy in Newport
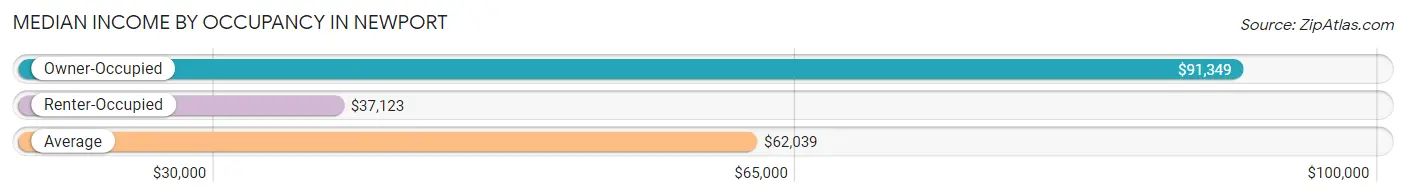
| Occupancy Type | # Households | Median Income |
| Owner-Occupied | 1,236 (66.8%) | $91,349 |
| Renter-Occupied | 613 (33.2%) | $37,123 |
| Average | 1,849 (100.0%) | $62,039 |
Occupancy by Householder Income Bracket in Newport
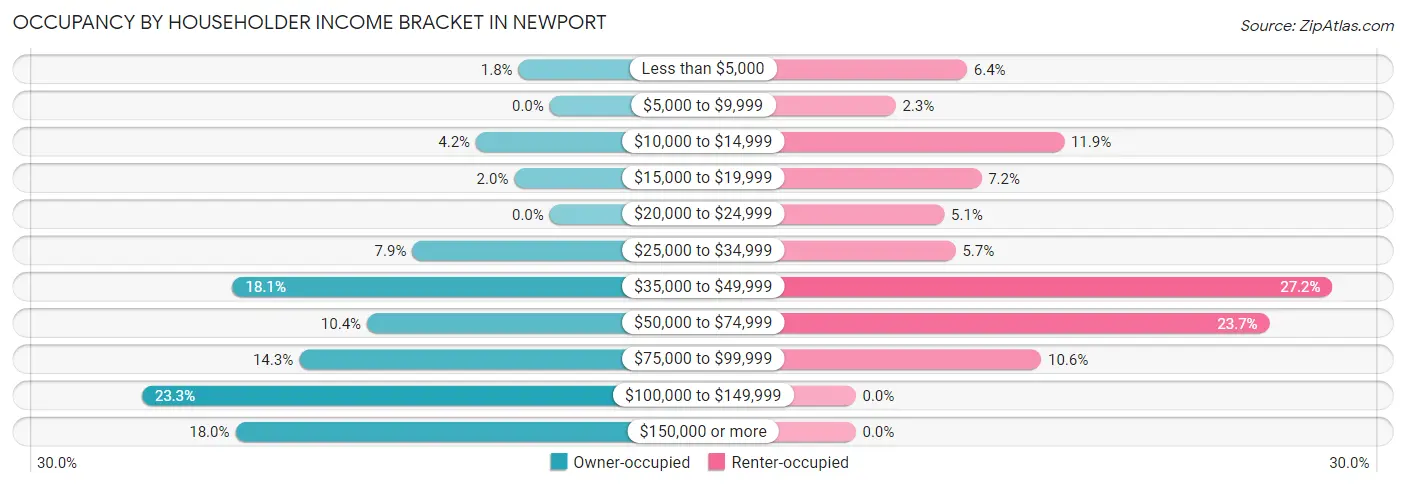
| Income Bracket | Owner-occupied | Renter-occupied |
| Less than $5,000 | 22 (1.8%) | 39 (6.4%) |
| $5,000 to $9,999 | 0 (0.0%) | 14 (2.3%) |
| $10,000 to $14,999 | 52 (4.2%) | 73 (11.9%) |
| $15,000 to $19,999 | 25 (2.0%) | 44 (7.2%) |
| $20,000 to $24,999 | 0 (0.0%) | 31 (5.1%) |
| $25,000 to $34,999 | 97 (7.9%) | 35 (5.7%) |
| $35,000 to $49,999 | 224 (18.1%) | 167 (27.2%) |
| $50,000 to $74,999 | 129 (10.4%) | 145 (23.6%) |
| $75,000 to $99,999 | 177 (14.3%) | 65 (10.6%) |
| $100,000 to $149,999 | 288 (23.3%) | 0 (0.0%) |
| $150,000 or more | 222 (18.0%) | 0 (0.0%) |
| Total | 1,236 (100.0%) | 613 (100.0%) |
Monthly Housing Cost Tiers in Newport
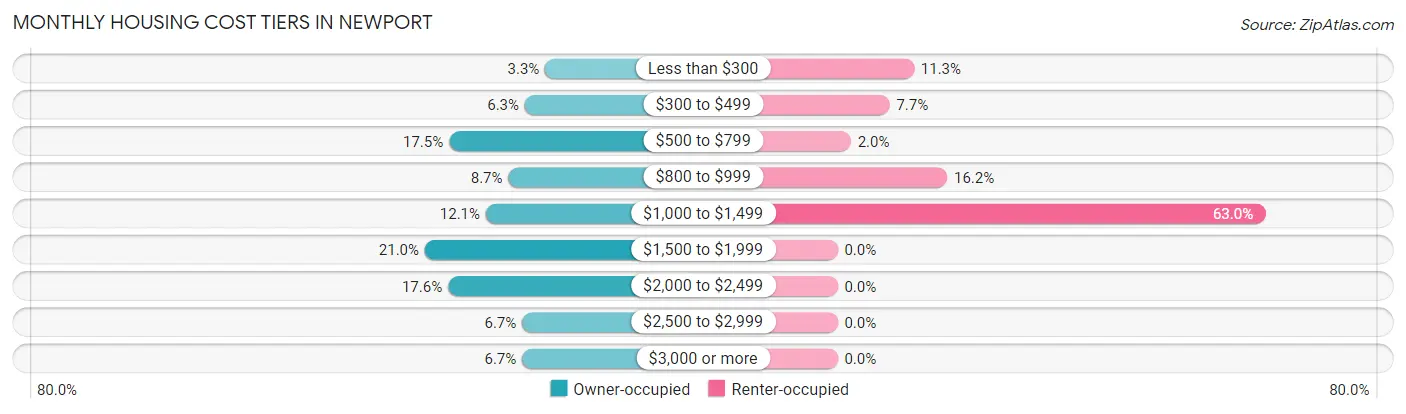
| Monthly Cost | Owner-occupied | Renter-occupied |
| Less than $300 | 41 (3.3%) | 69 (11.3%) |
| $300 to $499 | 78 (6.3%) | 47 (7.7%) |
| $500 to $799 | 216 (17.5%) | 12 (2.0%) |
| $800 to $999 | 108 (8.7%) | 99 (16.2%) |
| $1,000 to $1,499 | 149 (12.1%) | 386 (63.0%) |
| $1,500 to $1,999 | 260 (21.0%) | 0 (0.0%) |
| $2,000 to $2,499 | 218 (17.6%) | 0 (0.0%) |
| $2,500 to $2,999 | 83 (6.7%) | 0 (0.0%) |
| $3,000 or more | 83 (6.7%) | 0 (0.0%) |
| Total | 1,236 (100.0%) | 613 (100.0%) |
Physical Housing Characteristics in Newport
Housing Structures in Newport
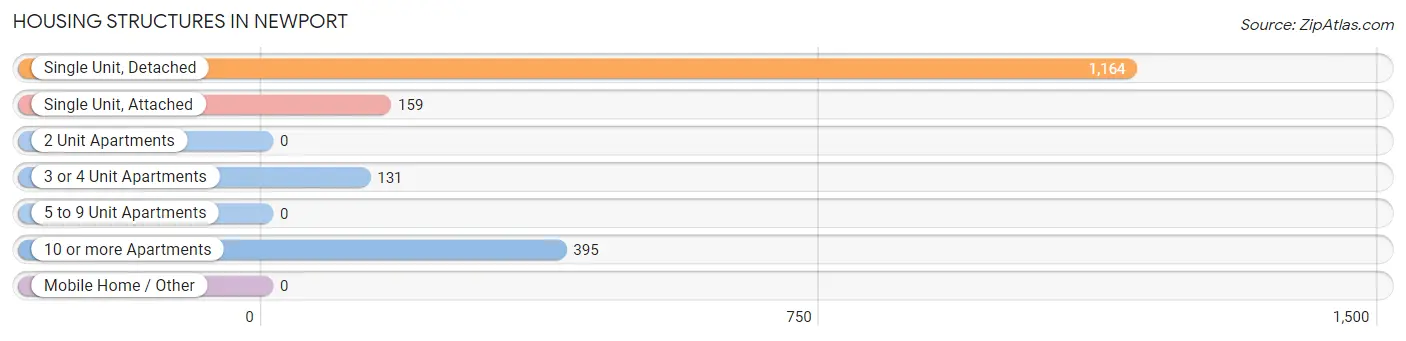
| Structure Type | # Housing Units | % Housing Units |
| Single Unit, Detached | 1,164 | 62.9% |
| Single Unit, Attached | 159 | 8.6% |
| 2 Unit Apartments | 0 | 0.0% |
| 3 or 4 Unit Apartments | 131 | 7.1% |
| 5 to 9 Unit Apartments | 0 | 0.0% |
| 10 or more Apartments | 395 | 21.4% |
| Mobile Home / Other | 0 | 0.0% |
| Total | 1,849 | 100.0% |
Housing Structures by Occupancy in Newport
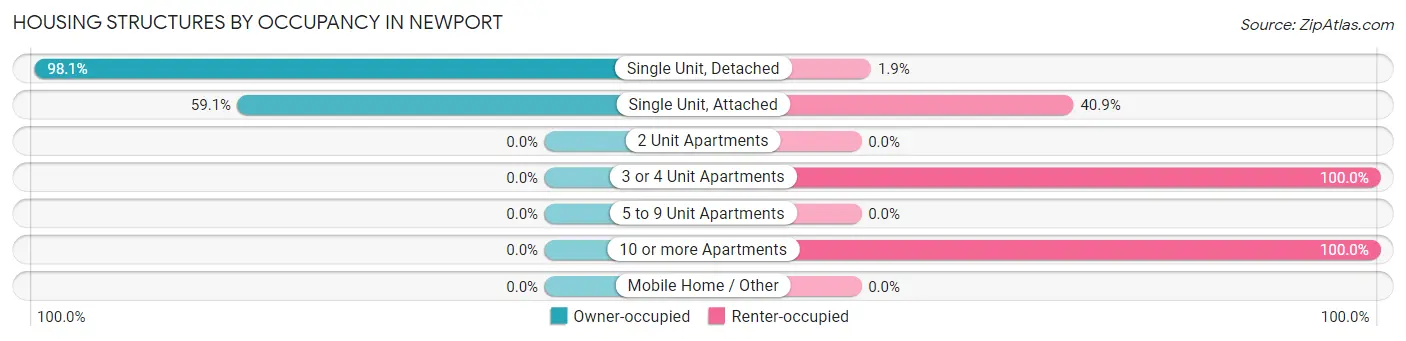
| Structure Type | Owner-occupied | Renter-occupied |
| Single Unit, Detached | 1,142 (98.1%) | 22 (1.9%) |
| Single Unit, Attached | 94 (59.1%) | 65 (40.9%) |
| 2 Unit Apartments | 0 (0.0%) | 0 (0.0%) |
| 3 or 4 Unit Apartments | 0 (0.0%) | 131 (100.0%) |
| 5 to 9 Unit Apartments | 0 (0.0%) | 0 (0.0%) |
| 10 or more Apartments | 0 (0.0%) | 395 (100.0%) |
| Mobile Home / Other | 0 (0.0%) | 0 (0.0%) |
| Total | 1,236 (66.8%) | 613 (33.2%) |
Housing Structures by Number of Rooms in Newport
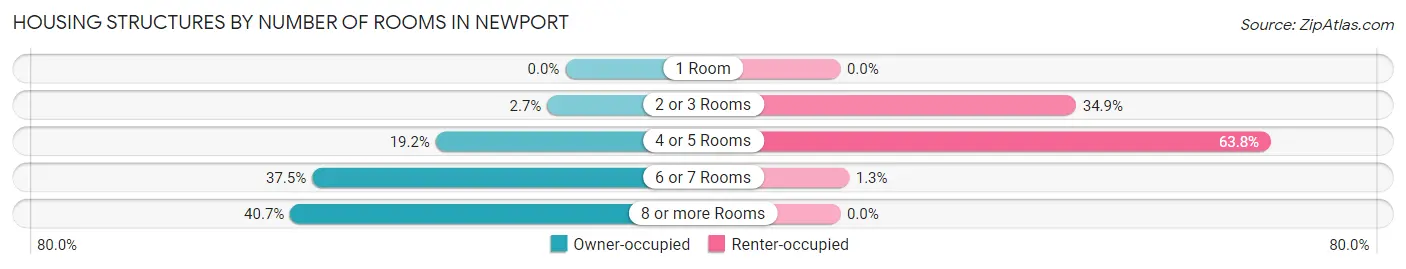
| Number of Rooms | Owner-occupied | Renter-occupied |
| 1 Room | 0 (0.0%) | 0 (0.0%) |
| 2 or 3 Rooms | 33 (2.7%) | 214 (34.9%) |
| 4 or 5 Rooms | 237 (19.2%) | 391 (63.8%) |
| 6 or 7 Rooms | 463 (37.5%) | 8 (1.3%) |
| 8 or more Rooms | 503 (40.7%) | 0 (0.0%) |
| Total | 1,236 (100.0%) | 613 (100.0%) |
Housing Structure by Heating Type in Newport
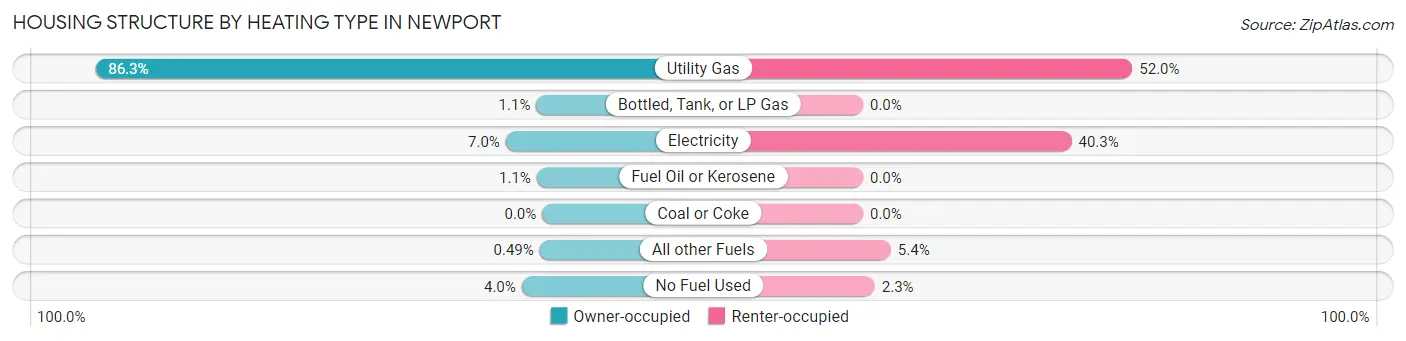
| Heating Type | Owner-occupied | Renter-occupied |
| Utility Gas | 1,067 (86.3%) | 319 (52.0%) |
| Bottled, Tank, or LP Gas | 14 (1.1%) | 0 (0.0%) |
| Electricity | 87 (7.0%) | 247 (40.3%) |
| Fuel Oil or Kerosene | 13 (1.1%) | 0 (0.0%) |
| Coal or Coke | 0 (0.0%) | 0 (0.0%) |
| All other Fuels | 6 (0.5%) | 33 (5.4%) |
| No Fuel Used | 49 (4.0%) | 14 (2.3%) |
| Total | 1,236 (100.0%) | 613 (100.0%) |
Household Vehicle Usage in Newport
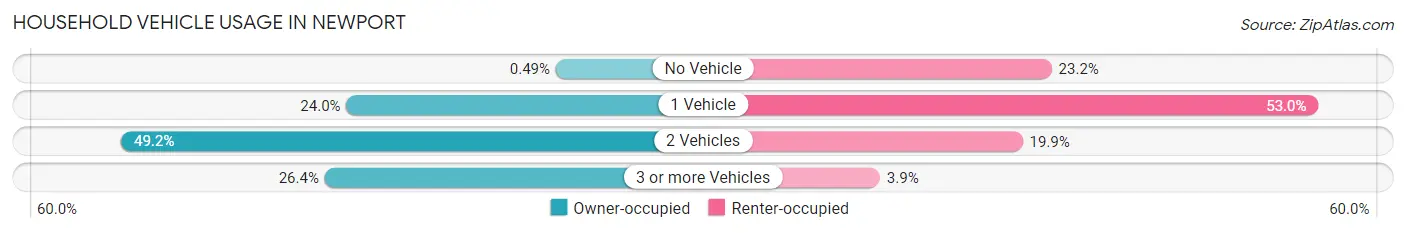
| Vehicles per Household | Owner-occupied | Renter-occupied |
| No Vehicle | 6 (0.5%) | 142 (23.2%) |
| 1 Vehicle | 296 (23.9%) | 325 (53.0%) |
| 2 Vehicles | 608 (49.2%) | 122 (19.9%) |
| 3 or more Vehicles | 326 (26.4%) | 24 (3.9%) |
| Total | 1,236 (100.0%) | 613 (100.0%) |
Real Estate & Mortgages in Newport
Real Estate and Mortgage Overview in Newport
| Characteristic | Without Mortgage | With Mortgage |
| Housing Units | 426 | 810 |
| Median Property Value | $288,400 | $305,200 |
| Median Household Income | $71,786 | $180 |
| Monthly Housing Costs | $678 | $83 |
| Real Estate Taxes | $3,496 | $0 |
Property Value by Mortgage Status in Newport
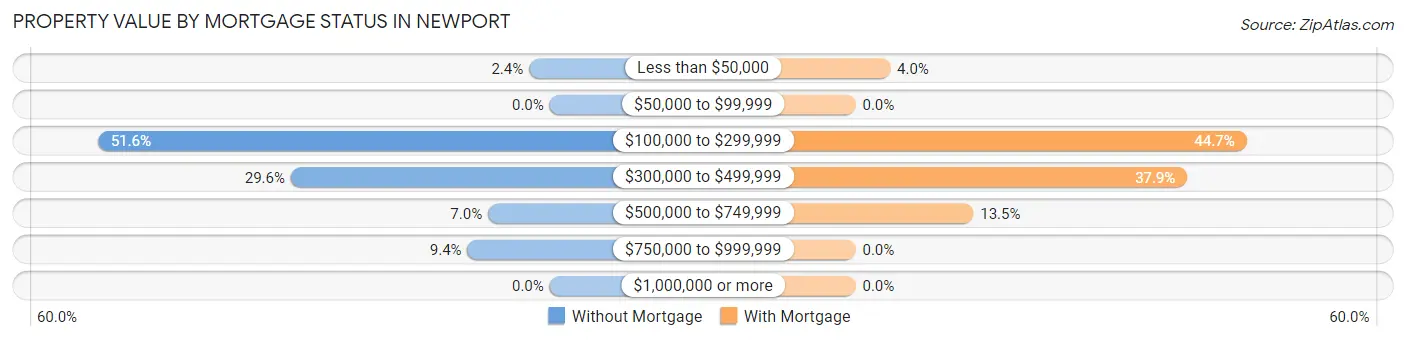
| Property Value | Without Mortgage | With Mortgage |
| Less than $50,000 | 10 (2.4%) | 32 (4.0%) |
| $50,000 to $99,999 | 0 (0.0%) | 0 (0.0%) |
| $100,000 to $299,999 | 220 (51.6%) | 362 (44.7%) |
| $300,000 to $499,999 | 126 (29.6%) | 307 (37.9%) |
| $500,000 to $749,999 | 30 (7.0%) | 109 (13.5%) |
| $750,000 to $999,999 | 40 (9.4%) | 0 (0.0%) |
| $1,000,000 or more | 0 (0.0%) | 0 (0.0%) |
| Total | 426 (100.0%) | 810 (100.0%) |
Household Income by Mortgage Status in Newport
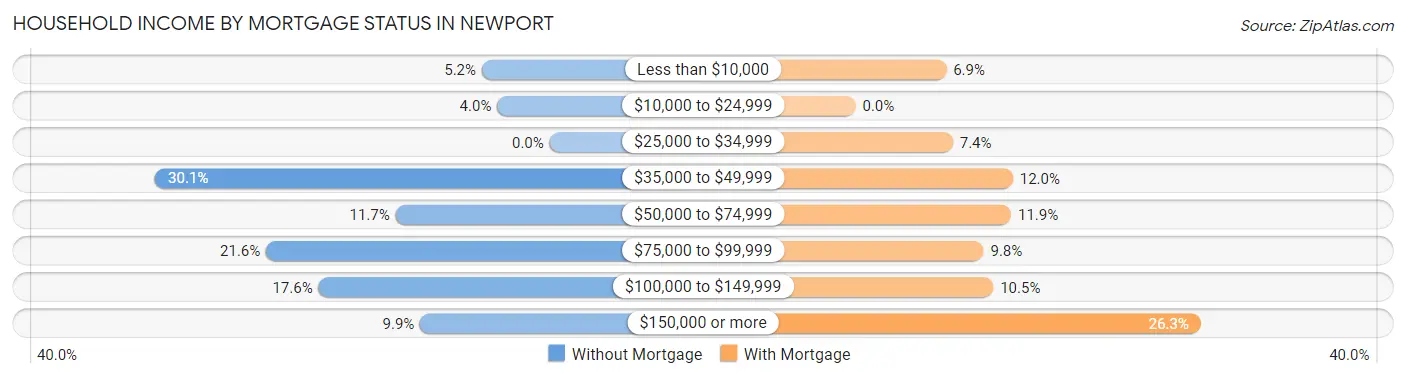
| Household Income | Without Mortgage | With Mortgage |
| Less than $10,000 | 22 (5.2%) | 56 (6.9%) |
| $10,000 to $24,999 | 17 (4.0%) | 0 (0.0%) |
| $25,000 to $34,999 | 0 (0.0%) | 60 (7.4%) |
| $35,000 to $49,999 | 128 (30.0%) | 97 (12.0%) |
| $50,000 to $74,999 | 50 (11.7%) | 96 (11.8%) |
| $75,000 to $99,999 | 92 (21.6%) | 79 (9.8%) |
| $100,000 to $149,999 | 75 (17.6%) | 85 (10.5%) |
| $150,000 or more | 42 (9.9%) | 213 (26.3%) |
| Total | 426 (100.0%) | 810 (100.0%) |
Property Value to Household Income Ratio in Newport
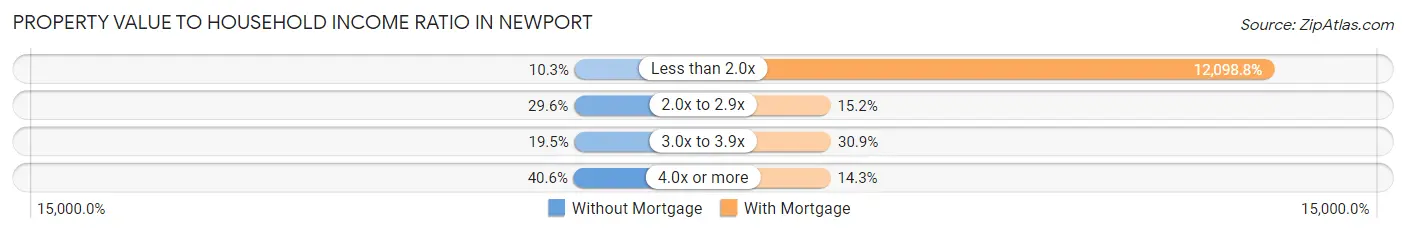
| Value-to-Income Ratio | Without Mortgage | With Mortgage |
| Less than 2.0x | 44 (10.3%) | 98,000 (12,098.8%) |
| 2.0x to 2.9x | 126 (29.6%) | 123 (15.2%) |
| 3.0x to 3.9x | 83 (19.5%) | 250 (30.9%) |
| 4.0x or more | 173 (40.6%) | 116 (14.3%) |
| Total | 426 (100.0%) | 810 (100.0%) |
Real Estate Taxes by Mortgage Status in Newport
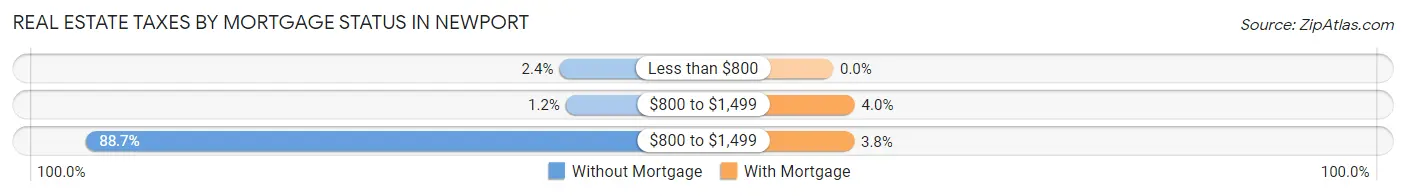
| Property Taxes | Without Mortgage | With Mortgage |
| Less than $800 | 10 (2.4%) | 0 (0.0%) |
| $800 to $1,499 | 5 (1.2%) | 32 (4.0%) |
| $800 to $1,499 | 378 (88.7%) | 31 (3.8%) |
| Total | 426 (100.0%) | 810 (100.0%) |
Health & Disability in Newport
Health Insurance Coverage by Age in Newport
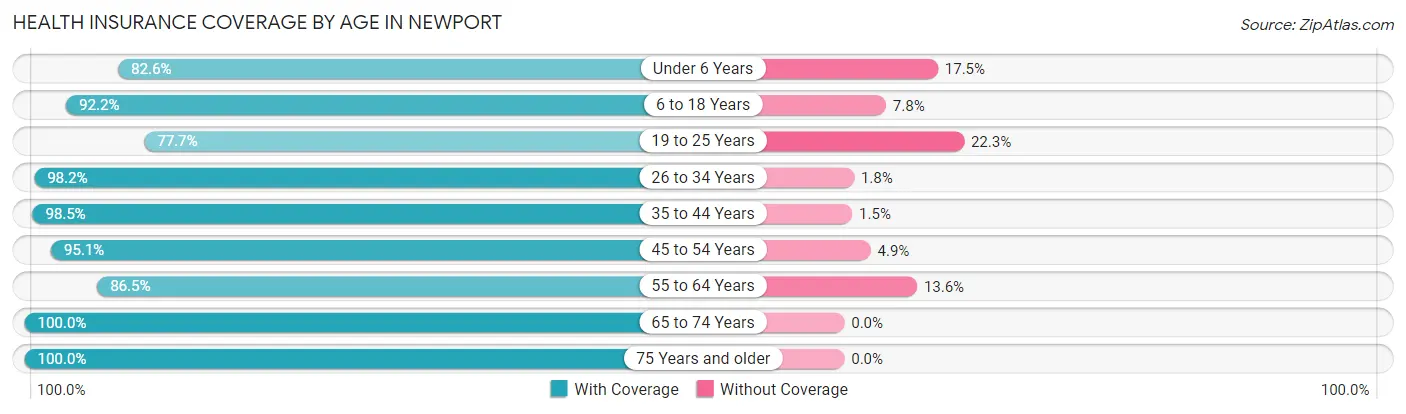
| Age Bracket | With Coverage | Without Coverage |
| Under 6 Years | 175 (82.6%) | 37 (17.4%) |
| 6 to 18 Years | 630 (92.2%) | 53 (7.8%) |
| 19 to 25 Years | 435 (77.7%) | 125 (22.3%) |
| 26 to 34 Years | 436 (98.2%) | 8 (1.8%) |
| 35 to 44 Years | 603 (98.5%) | 9 (1.5%) |
| 45 to 54 Years | 368 (95.1%) | 19 (4.9%) |
| 55 to 64 Years | 434 (86.5%) | 68 (13.6%) |
| 65 to 74 Years | 375 (100.0%) | 0 (0.0%) |
| 75 Years and older | 376 (100.0%) | 0 (0.0%) |
| Total | 3,832 (92.3%) | 319 (7.7%) |
Health Insurance Coverage by Citizenship Status in Newport
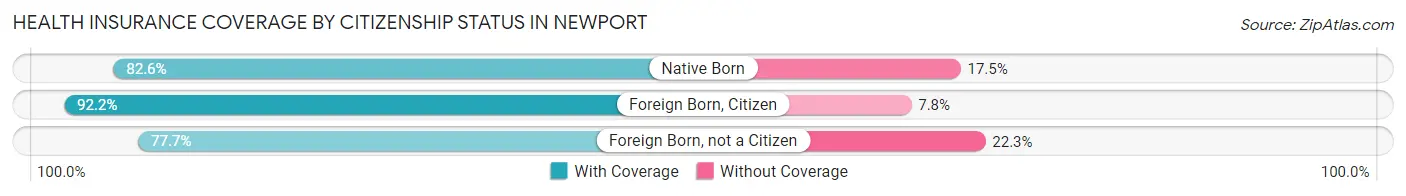
| Citizenship Status | With Coverage | Without Coverage |
| Native Born | 175 (82.6%) | 37 (17.4%) |
| Foreign Born, Citizen | 630 (92.2%) | 53 (7.8%) |
| Foreign Born, not a Citizen | 435 (77.7%) | 125 (22.3%) |
Health Insurance Coverage by Household Income in Newport
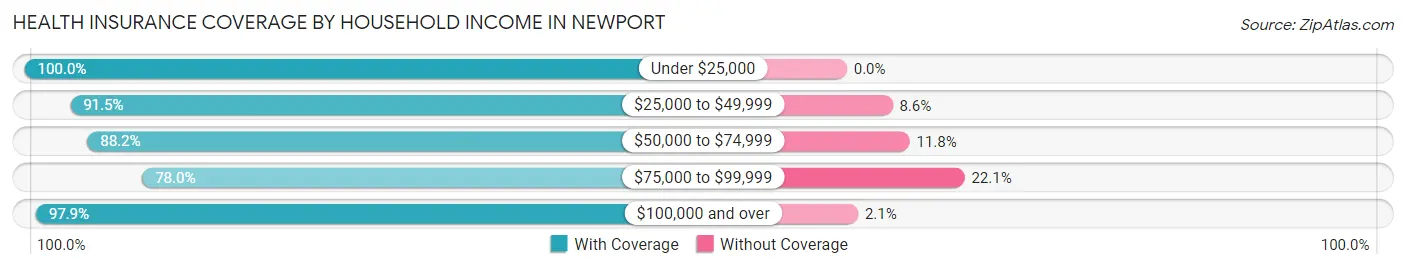
| Household Income | With Coverage | Without Coverage |
| Under $25,000 | 371 (100.0%) | 0 (0.0%) |
| $25,000 to $49,999 | 1,006 (91.4%) | 94 (8.6%) |
| $50,000 to $74,999 | 510 (88.2%) | 68 (11.8%) |
| $75,000 to $99,999 | 442 (77.9%) | 125 (22.1%) |
| $100,000 and over | 1,490 (97.9%) | 32 (2.1%) |
Public vs Private Health Insurance Coverage by Age in Newport
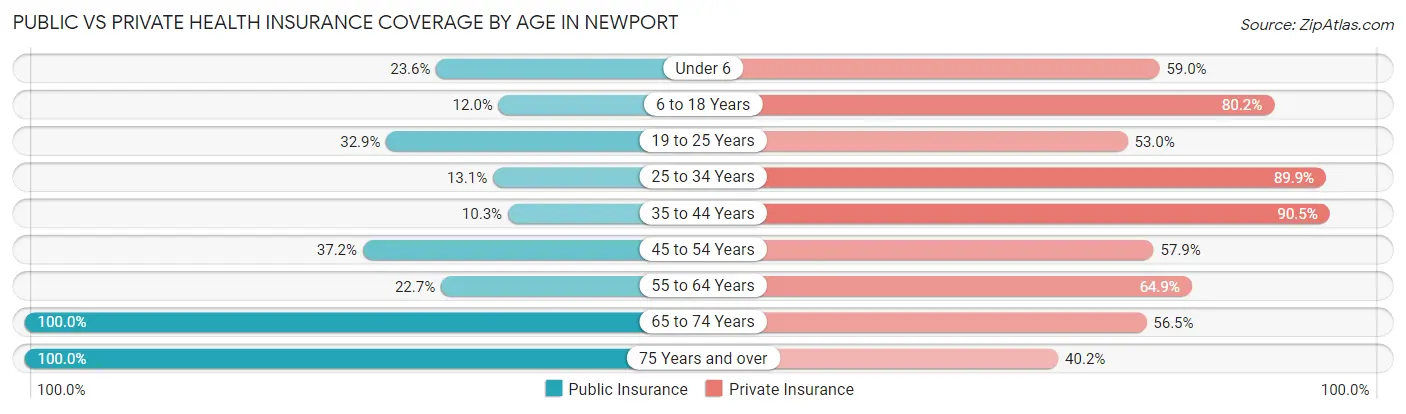
| Age Bracket | Public Insurance | Private Insurance |
| Under 6 | 50 (23.6%) | 125 (59.0%) |
| 6 to 18 Years | 82 (12.0%) | 548 (80.2%) |
| 19 to 25 Years | 184 (32.9%) | 297 (53.0%) |
| 25 to 34 Years | 58 (13.1%) | 399 (89.9%) |
| 35 to 44 Years | 63 (10.3%) | 554 (90.5%) |
| 45 to 54 Years | 144 (37.2%) | 224 (57.9%) |
| 55 to 64 Years | 114 (22.7%) | 326 (64.9%) |
| 65 to 74 Years | 375 (100.0%) | 212 (56.5%) |
| 75 Years and over | 376 (100.0%) | 151 (40.2%) |
| Total | 1,446 (34.8%) | 2,836 (68.3%) |
Disability Status by Sex by Age in Newport
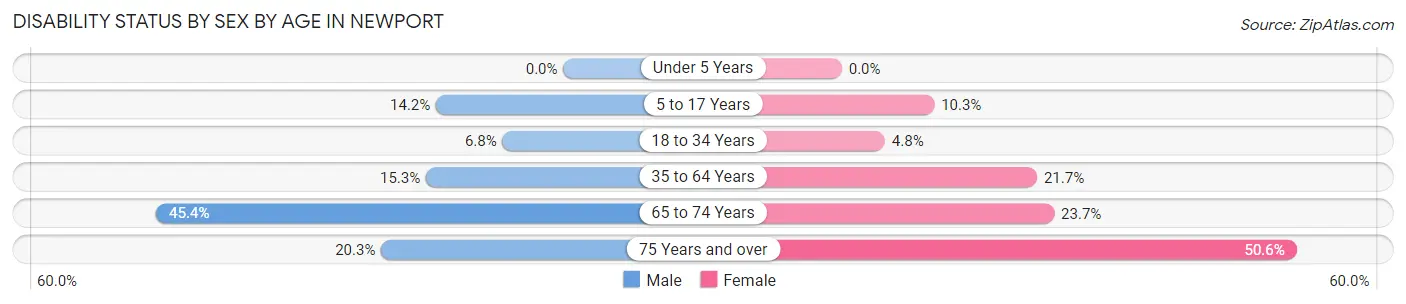
| Age Bracket | Male | Female |
| Under 5 Years | 0 (0.0%) | 0 (0.0%) |
| 5 to 17 Years | 70 (14.2%) | 18 (10.3%) |
| 18 to 34 Years | 31 (6.8%) | 29 (4.8%) |
| 35 to 64 Years | 131 (15.3%) | 140 (21.7%) |
| 65 to 74 Years | 78 (45.4%) | 48 (23.6%) |
| 75 Years and over | 29 (20.3%) | 118 (50.6%) |
Disability Class by Sex by Age in Newport
Disability Class: Hearing Difficulty
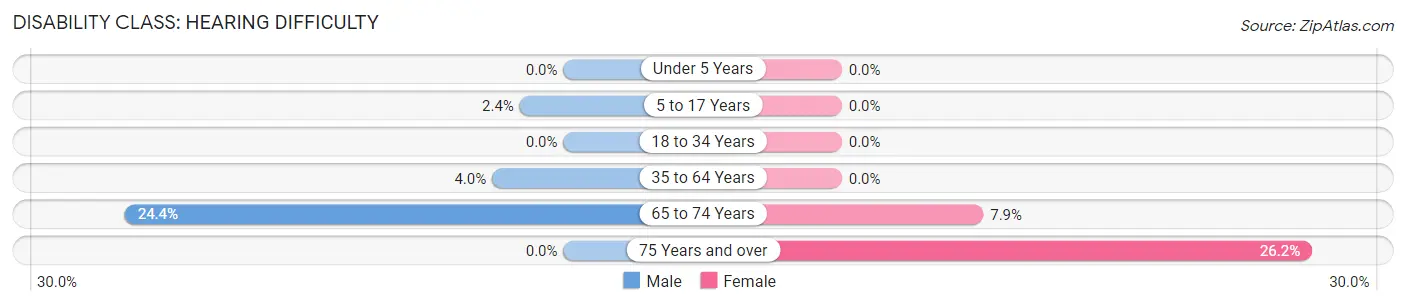
| Age Bracket | Male | Female |
| Under 5 Years | 0 (0.0%) | 0 (0.0%) |
| 5 to 17 Years | 12 (2.4%) | 0 (0.0%) |
| 18 to 34 Years | 0 (0.0%) | 0 (0.0%) |
| 35 to 64 Years | 34 (4.0%) | 0 (0.0%) |
| 65 to 74 Years | 42 (24.4%) | 16 (7.9%) |
| 75 Years and over | 0 (0.0%) | 61 (26.2%) |
Disability Class: Vision Difficulty
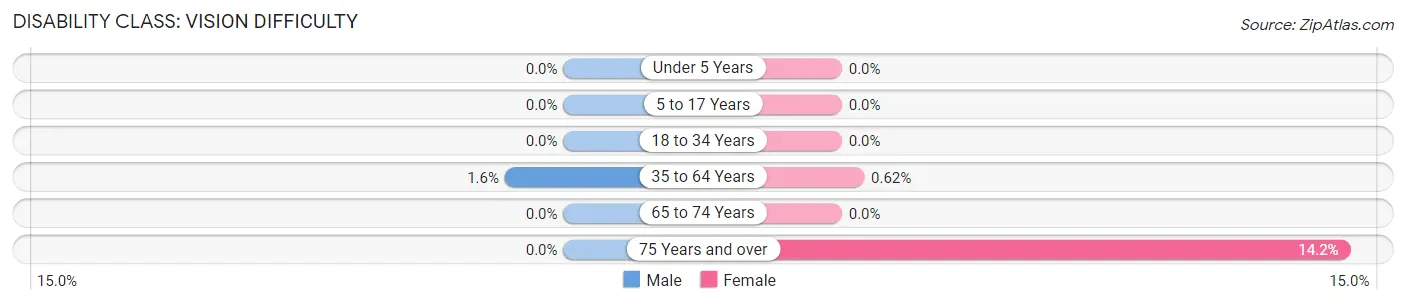
| Age Bracket | Male | Female |
| Under 5 Years | 0 (0.0%) | 0 (0.0%) |
| 5 to 17 Years | 0 (0.0%) | 0 (0.0%) |
| 18 to 34 Years | 0 (0.0%) | 0 (0.0%) |
| 35 to 64 Years | 14 (1.6%) | 4 (0.6%) |
| 65 to 74 Years | 0 (0.0%) | 0 (0.0%) |
| 75 Years and over | 0 (0.0%) | 33 (14.2%) |
Disability Class: Cognitive Difficulty
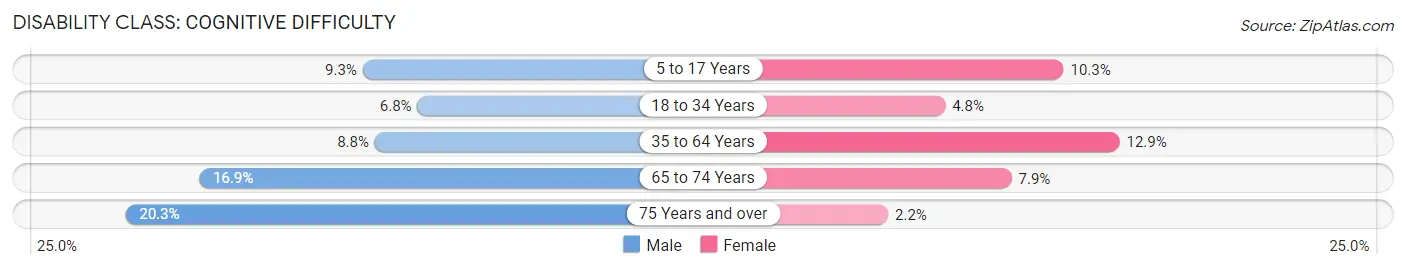
| Age Bracket | Male | Female |
| 5 to 17 Years | 46 (9.3%) | 18 (10.3%) |
| 18 to 34 Years | 31 (6.8%) | 29 (4.8%) |
| 35 to 64 Years | 75 (8.7%) | 83 (12.9%) |
| 65 to 74 Years | 29 (16.9%) | 16 (7.9%) |
| 75 Years and over | 29 (20.3%) | 5 (2.1%) |
Disability Class: Ambulatory Difficulty
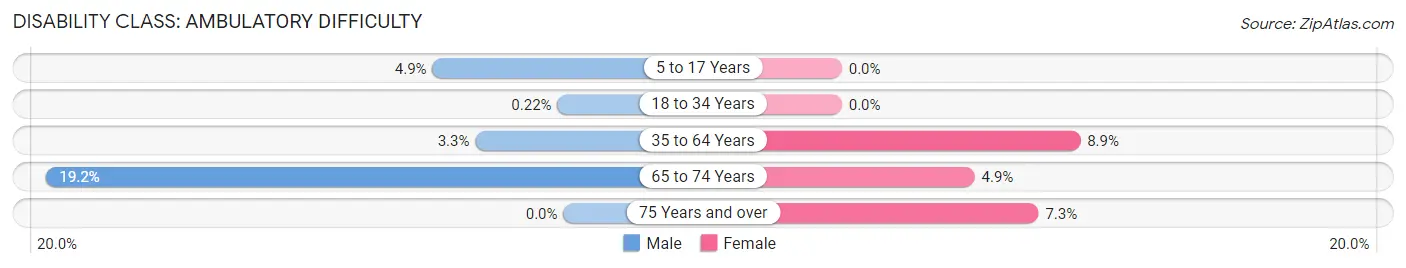
| Age Bracket | Male | Female |
| 5 to 17 Years | 24 (4.9%) | 0 (0.0%) |
| 18 to 34 Years | 1 (0.2%) | 0 (0.0%) |
| 35 to 64 Years | 28 (3.3%) | 57 (8.8%) |
| 65 to 74 Years | 33 (19.2%) | 10 (4.9%) |
| 75 Years and over | 0 (0.0%) | 17 (7.3%) |
Disability Class: Self-Care Difficulty
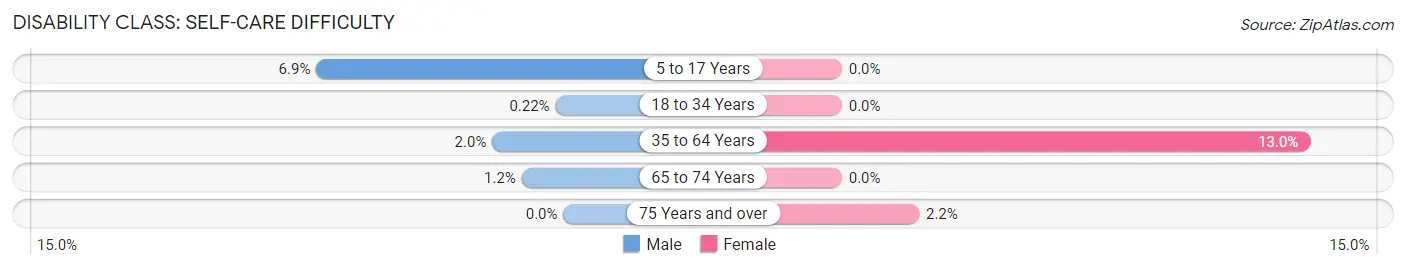
| Age Bracket | Male | Female |
| 5 to 17 Years | 34 (6.9%) | 0 (0.0%) |
| 18 to 34 Years | 1 (0.2%) | 0 (0.0%) |
| 35 to 64 Years | 17 (2.0%) | 84 (13.0%) |
| 65 to 74 Years | 2 (1.2%) | 0 (0.0%) |
| 75 Years and over | 0 (0.0%) | 5 (2.1%) |
Technology Access in Newport
Computing Device Access in Newport
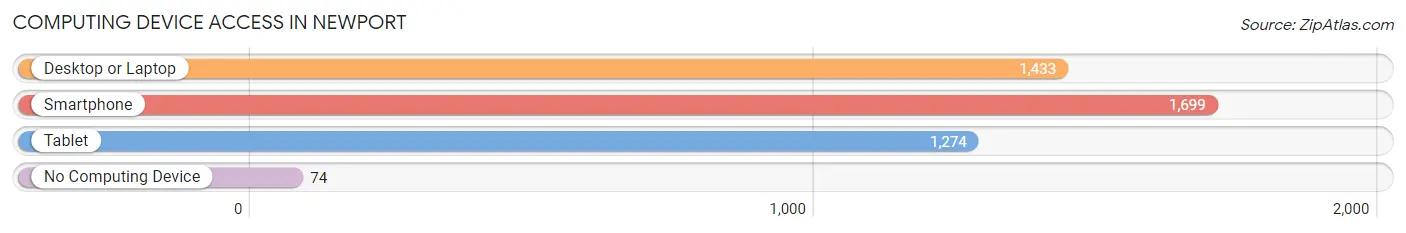
| Device Type | # Households | % Households |
| Desktop or Laptop | 1,433 | 77.5% |
| Smartphone | 1,699 | 91.9% |
| Tablet | 1,274 | 68.9% |
| No Computing Device | 74 | 4.0% |
| Total | 1,849 | 100.0% |
Internet Access in Newport
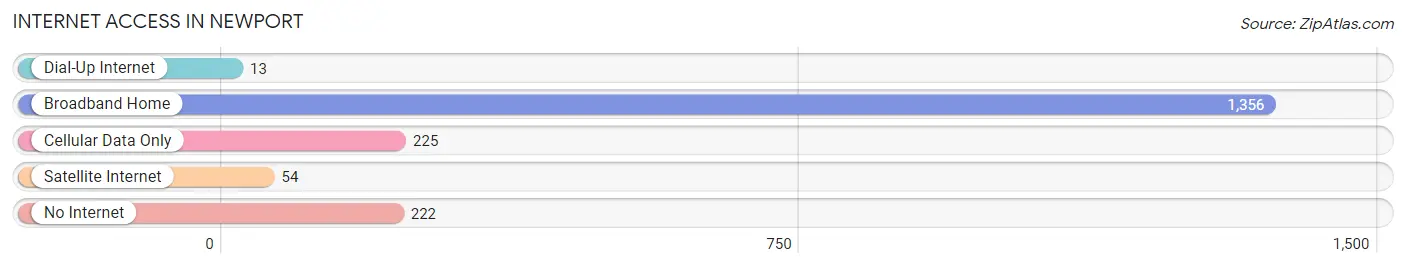
| Internet Type | # Households | % Households |
| Dial-Up Internet | 13 | 0.7% |
| Broadband Home | 1,356 | 73.3% |
| Cellular Data Only | 225 | 12.2% |
| Satellite Internet | 54 | 2.9% |
| No Internet | 222 | 12.0% |
| Total | 1,849 | 100.0% |
Newport Summary
Newport is a city located in Washington County, Minnesota, United States. The population was 4,589 at the 2010 census. It is located on the Mississippi River, just south of St. Paul.
History
The area that is now Newport was first settled in 1844 by a group of French-Canadian immigrants. The settlement was originally called St. Paul des Prairie, but was later changed to Newport in 1854. The name was chosen to honor the city of Newport, Rhode Island.
In 1856 the first post office was established in Newport The city was incorporated in 1858
In the late 19th century, Newport was a popular destination for wealthy St. Paul residents who wanted to escape the city for the summer. The city was home to several large resorts, including the Newport Hotel, which was built in 1883.
Geography
Newport is located at the confluence of the Mississippi and St. Croix Rivers. The city is situated on the east bank of the Mississippi River, just south of St. Paul.
The city has a total area of 4.2 square miles, of which 4.1 square miles is land and 0.1 square miles is water.
Economy
Newport’s economy is largely based on tourism and retail. The city is home to several large retail stores, including Target, Walmart, and Kohl’s.
The city is also home to several manufacturing companies, including 3M, which has a large plant in Newport.
Demographics
As of the 2010 census, there were 4,589 people, 1,845 households, and 1,093 families residing in the city. The population density was 1,118.2 people per square mile. The racial makeup of the city was 87.2% White, 5.2% African American, 0.7% Native American, 1.7% Asian, 0.1% Pacific Islander, 2.7% from other races, and 2.4% from two or more races. Hispanic or Latino of any race were 5.3% of the population.
The median income for a household in the city was $50,902, and the median income for a family was $60,902. The per capita income for the city was $25,902. About 6.2% of families and 8.2% of the population were below the poverty line, including 11.2% of those under age 18 and 5.2% of those age 65 or over.
Common Questions
What is Per Capita Income in Newport?
Per Capita income in Newport is $35,732.
What is the Median Family Income in Newport?
Median Family Income in Newport is $59,293.
What is the Median Household income in Newport?
Median Household Income in Newport is $62,039.
What is Income or Wage Gap in Newport?
Income or Wage Gap in Newport is 21.7%.
Women in Newport earn 78.3 cents for every dollar earned by a man.
What is Inequality or Gini Index in Newport?
Inequality or Gini Index in Newport is 0.44.
What is the Total Population of Newport?
Total Population of Newport is 4,163.
What is the Total Male Population of Newport?
Total Male Population of Newport is 2,251.
What is the Total Female Population of Newport?
Total Female Population of Newport is 1,912.
What is the Ratio of Males per 100 Females in Newport?
There are 117.73 Males per 100 Females in Newport.
What is the Ratio of Females per 100 Males in Newport?
There are 84.94 Females per 100 Males in Newport.
What is the Median Population Age in Newport?
Median Population Age in Newport is 38.1 Years.
What is the Average Family Size in Newport
Average Family Size in Newport is 2.8 People.
What is the Average Household Size in Newport
Average Household Size in Newport is 2.2 People.
How Large is the Labor Force in Newport?
There are 2,272 People in the Labor Forcein in Newport.
What is the Percentage of People in the Labor Force in Newport?
65.4% of People are in the Labor Force in Newport.
What is the Unemployment Rate in Newport?
Unemployment Rate in Newport is 3.6%.