Swepsonville, NC Map & Demographics
Swepsonville Map
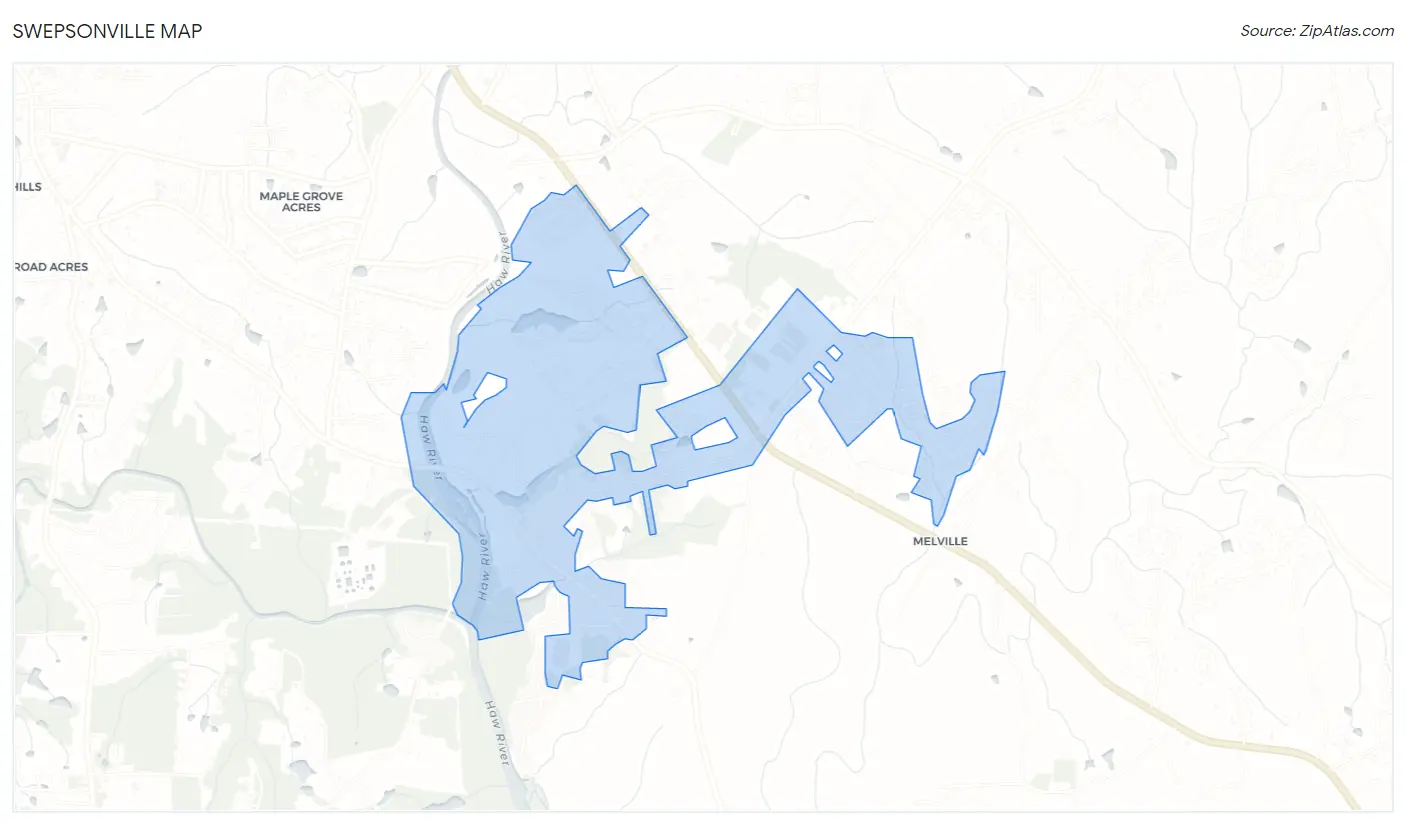
Swepsonville Overview
$36,625
PER CAPITA INCOME
$103,523
AVG FAMILY INCOME
$84,737
AVG HOUSEHOLD INCOME
9.0%
WAGE / INCOME GAP [ % ]
91.0¢/ $1
WAGE / INCOME GAP [ $ ]
0.35
INEQUALITY / GINI INDEX
2,464
TOTAL POPULATION
1,256
MALE POPULATION
1,208
FEMALE POPULATION
103.97
MALES / 100 FEMALES
96.18
FEMALES / 100 MALES
36.4
MEDIAN AGE
3.2
AVG FAMILY SIZE
2.7
AVG HOUSEHOLD SIZE
1,330
LABOR FORCE [ PEOPLE ]
69.0%
PERCENT IN LABOR FORCE
4.4%
UNEMPLOYMENT RATE
Income in Swepsonville
Income Overview in Swepsonville
Per Capita Income in Swepsonville is $36,625, while median incomes of families and households are $103,523 and $84,737 respectively.
| Characteristic | Number | Measure |
| Per Capita Income | 2,464 | $36,625 |
| Median Family Income | 651 | $103,523 |
| Mean Family Income | 651 | $107,543 |
| Median Household Income | 912 | $84,737 |
| Mean Household Income | 912 | $94,159 |
| Income Deficit | 651 | $0 |
| Wage / Income Gap (%) | 2,464 | 9.04% |
| Wage / Income Gap ($) | 2,464 | 90.96¢ per $1 |
| Gini / Inequality Index | 2,464 | 0.35 |
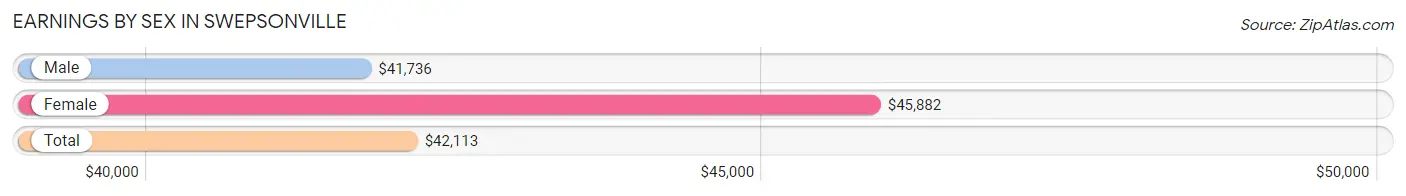
Earnings by Sex in Swepsonville
Average Earnings in Swepsonville are $42,113, $41,736 for men and $45,882 for women, a difference of 9.0%.
| Sex | Number | Average Earnings |
| Male | 813 (57.2%) | $41,736 |
| Female | 608 (42.8%) | $45,882 |
| Total | 1,421 (100.0%) | $42,113 |
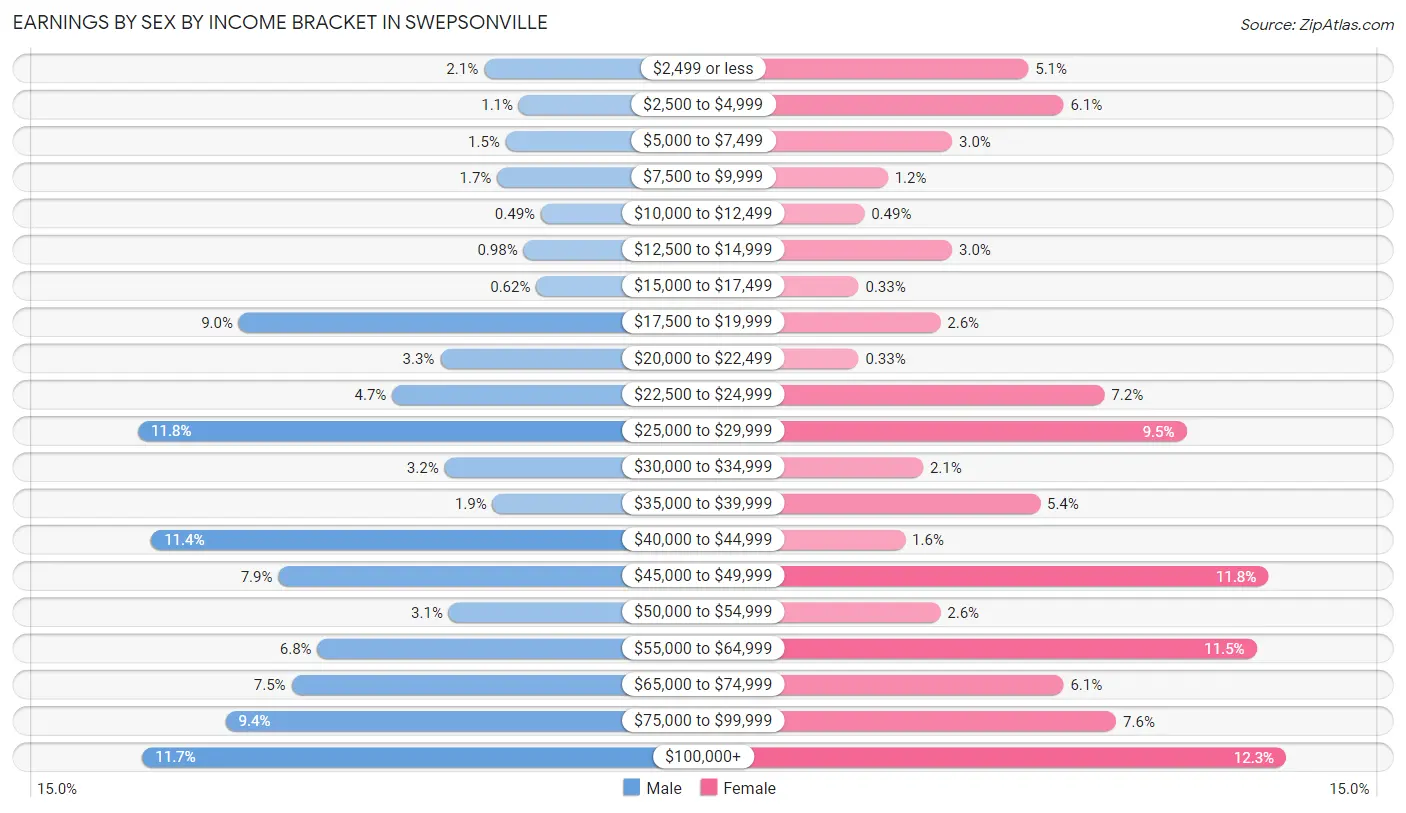
Earnings by Sex by Income Bracket in Swepsonville
The most common earnings brackets in Swepsonville are $25,000 to $29,999 for men (96 | 11.8%) and $100,000+ for women (75 | 12.3%).
| Income | Male | Female |
| $2,499 or less | 17 (2.1%) | 31 (5.1%) |
| $2,500 to $4,999 | 9 (1.1%) | 37 (6.1%) |
| $5,000 to $7,499 | 12 (1.5%) | 18 (3.0%) |
| $7,500 to $9,999 | 14 (1.7%) | 7 (1.1%) |
| $10,000 to $12,499 | 4 (0.5%) | 3 (0.5%) |
| $12,500 to $14,999 | 8 (1.0%) | 18 (3.0%) |
| $15,000 to $17,499 | 5 (0.6%) | 2 (0.3%) |
| $17,500 to $19,999 | 73 (9.0%) | 16 (2.6%) |
| $20,000 to $22,499 | 27 (3.3%) | 2 (0.3%) |
| $22,500 to $24,999 | 38 (4.7%) | 44 (7.2%) |
| $25,000 to $29,999 | 96 (11.8%) | 58 (9.5%) |
| $30,000 to $34,999 | 26 (3.2%) | 13 (2.1%) |
| $35,000 to $39,999 | 15 (1.8%) | 33 (5.4%) |
| $40,000 to $44,999 | 93 (11.4%) | 10 (1.6%) |
| $45,000 to $49,999 | 64 (7.9%) | 72 (11.8%) |
| $50,000 to $54,999 | 25 (3.1%) | 16 (2.6%) |
| $55,000 to $64,999 | 55 (6.8%) | 70 (11.5%) |
| $65,000 to $74,999 | 61 (7.5%) | 37 (6.1%) |
| $75,000 to $99,999 | 76 (9.3%) | 46 (7.6%) |
| $100,000+ | 95 (11.7%) | 75 (12.3%) |
| Total | 813 (100.0%) | 608 (100.0%) |
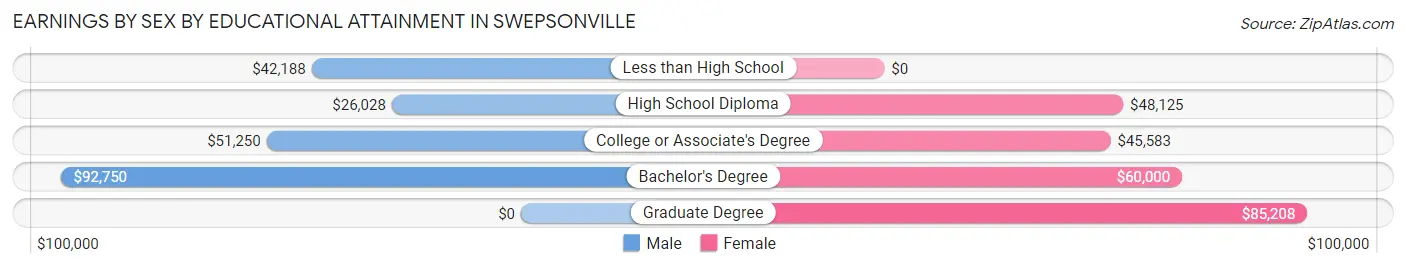
Earnings by Sex by Educational Attainment in Swepsonville
Average earnings in Swepsonville are $42,403 for men and $48,882 for women, a difference of 13.3%. Men with an educational attainment of bachelor's degree enjoy the highest average annual earnings of $92,750, while those with high school diploma education earn the least with $26,028. Women with an educational attainment of graduate degree earn the most with the average annual earnings of $85,208, while those with college or associate's degree education have the smallest earnings of $45,583.
| Educational Attainment | Male Income | Female Income |
| Less than High School | $42,188 | $0 |
| High School Diploma | $26,028 | $48,125 |
| College or Associate's Degree | $51,250 | $45,583 |
| Bachelor's Degree | $92,750 | $60,000 |
| Graduate Degree | - | - |
| Total | $42,403 | $48,882 |
Family Income in Swepsonville
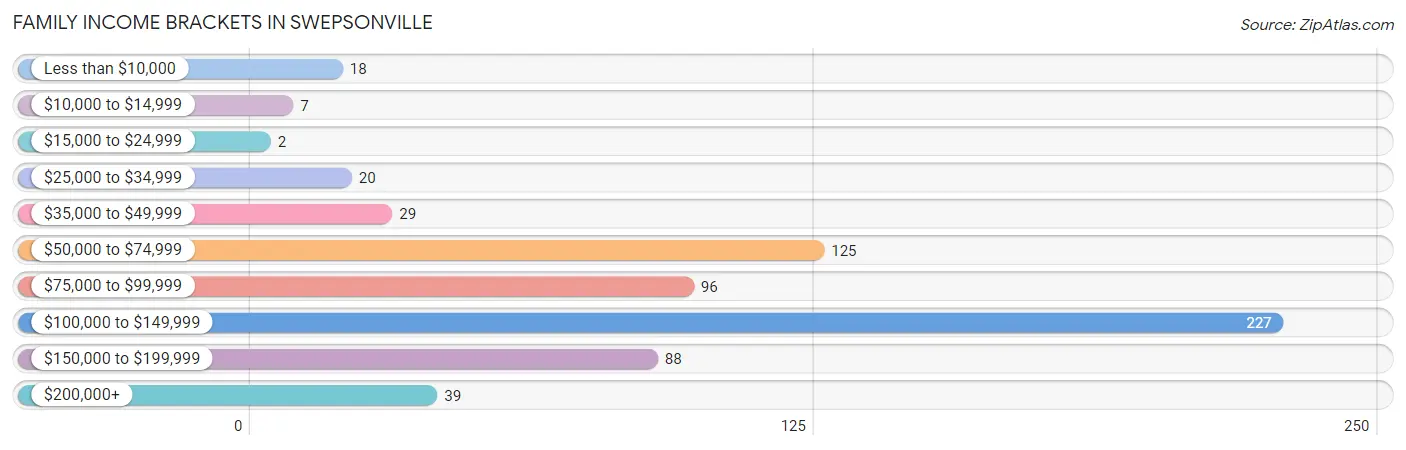
Family Income Brackets in Swepsonville
According to the Swepsonville family income data, there are 227 families falling into the $100,000 to $149,999 income range, which is the most common income bracket and makes up 34.9% of all families. Conversely, the $15,000 to $24,999 income bracket is the least frequent group with only 2 families (0.3%) belonging to this category.
| Income Bracket | # Families | % Families |
| Less than $10,000 | 18 | 2.8% |
| $10,000 to $14,999 | 7 | 1.1% |
| $15,000 to $24,999 | 2 | 0.3% |
| $25,000 to $34,999 | 20 | 3.1% |
| $35,000 to $49,999 | 29 | 4.5% |
| $50,000 to $74,999 | 125 | 19.2% |
| $75,000 to $99,999 | 96 | 14.7% |
| $100,000 to $149,999 | 227 | 34.9% |
| $150,000 to $199,999 | 88 | 13.5% |
| $200,000+ | 39 | 6.0% |
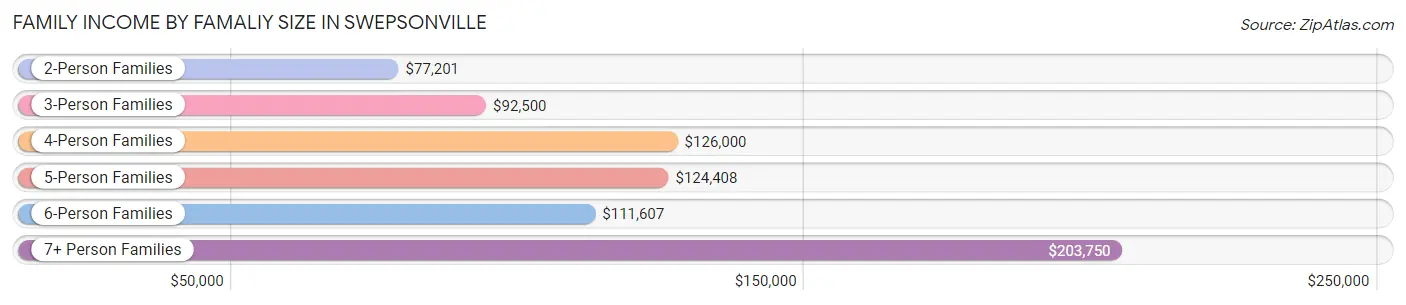
Family Income by Famaliy Size in Swepsonville
7+ person families (12 | 1.8%) account for the highest median family income in Swepsonville with $203,750 per family, while 2-person families (345 | 53.0%) have the highest median income of $38,600 per family member.
| Income Bracket | # Families | Median Income |
| 2-Person Families | 345 (53.0%) | $77,201 |
| 3-Person Families | 140 (21.5%) | $92,500 |
| 4-Person Families | 72 (11.1%) | $126,000 |
| 5-Person Families | 63 (9.7%) | $124,408 |
| 6-Person Families | 19 (2.9%) | $111,607 |
| 7+ Person Families | 12 (1.8%) | $203,750 |
| Total | 651 (100.0%) | $103,523 |
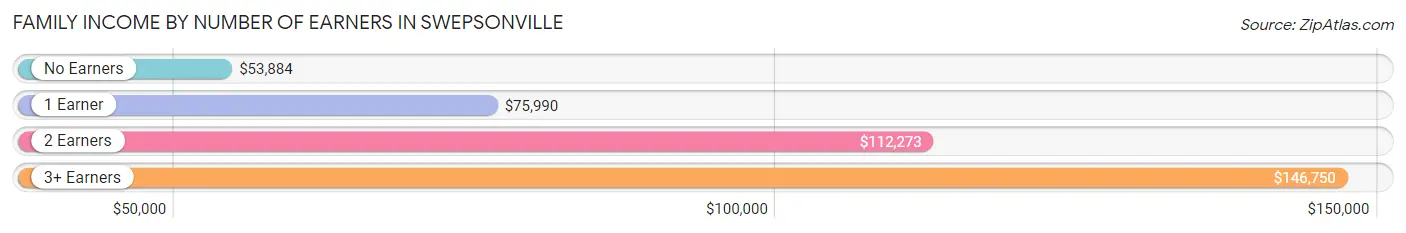
Family Income by Number of Earners in Swepsonville
The median family income in Swepsonville is $103,523, with families comprising 3+ earners (65) having the highest median family income of $146,750, while families with no earners (101) have the lowest median family income of $53,884, accounting for 10.0% and 15.5% of families, respectively.
| Number of Earners | # Families | Median Income |
| No Earners | 101 (15.5%) | $53,884 |
| 1 Earner | 151 (23.2%) | $75,990 |
| 2 Earners | 334 (51.3%) | $112,273 |
| 3+ Earners | 65 (10.0%) | $146,750 |
| Total | 651 (100.0%) | $103,523 |
Household Income in Swepsonville
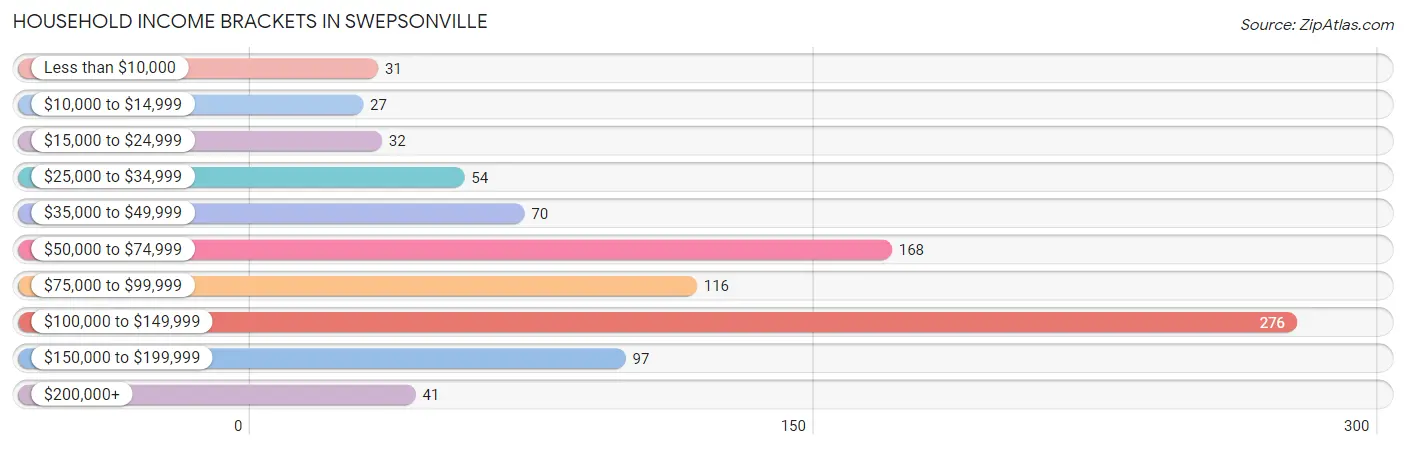
Household Income Brackets in Swepsonville
With 276 households falling in the category, the $100,000 to $149,999 income range is the most frequent in Swepsonville, accounting for 30.3% of all households. In contrast, only 27 households (3.0%) fall into the $10,000 to $14,999 income bracket, making it the least populous group.
| Income Bracket | # Households | % Households |
| Less than $10,000 | 31 | 3.4% |
| $10,000 to $14,999 | 27 | 3.0% |
| $15,000 to $24,999 | 32 | 3.5% |
| $25,000 to $34,999 | 54 | 5.9% |
| $35,000 to $49,999 | 70 | 7.7% |
| $50,000 to $74,999 | 168 | 18.4% |
| $75,000 to $99,999 | 116 | 12.7% |
| $100,000 to $149,999 | 276 | 30.3% |
| $150,000 to $199,999 | 97 | 10.6% |
| $200,000+ | 41 | 4.5% |
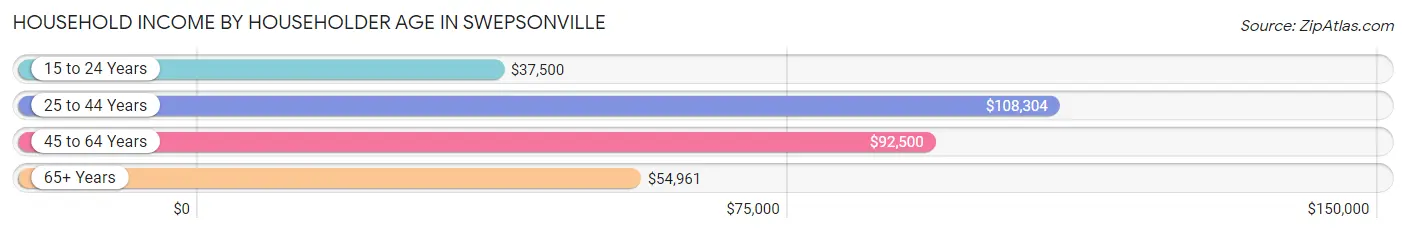
Household Income by Householder Age in Swepsonville
The median household income in Swepsonville is $84,737, with the highest median household income of $108,304 found in the 25 to 44 years age bracket for the primary householder. A total of 367 households (40.2%) fall into this category. Meanwhile, the 15 to 24 years age bracket for the primary householder has the lowest median household income of $37,500, with 28 households (3.1%) in this group.
| Income Bracket | # Households | Median Income |
| 15 to 24 Years | 28 (3.1%) | $37,500 |
| 25 to 44 Years | 367 (40.2%) | $108,304 |
| 45 to 64 Years | 282 (30.9%) | $92,500 |
| 65+ Years | 235 (25.8%) | $54,961 |
| Total | 912 (100.0%) | $84,737 |
Poverty in Swepsonville
Income Below Poverty by Sex and Age in Swepsonville
With 5.3% poverty level for males and 4.0% for females among the residents of Swepsonville, under 5 year old males and 65 to 74 year old females are the most vulnerable to poverty, with 27 males (18.0%) and 15 females (12.7%) in their respective age groups living below the poverty level.
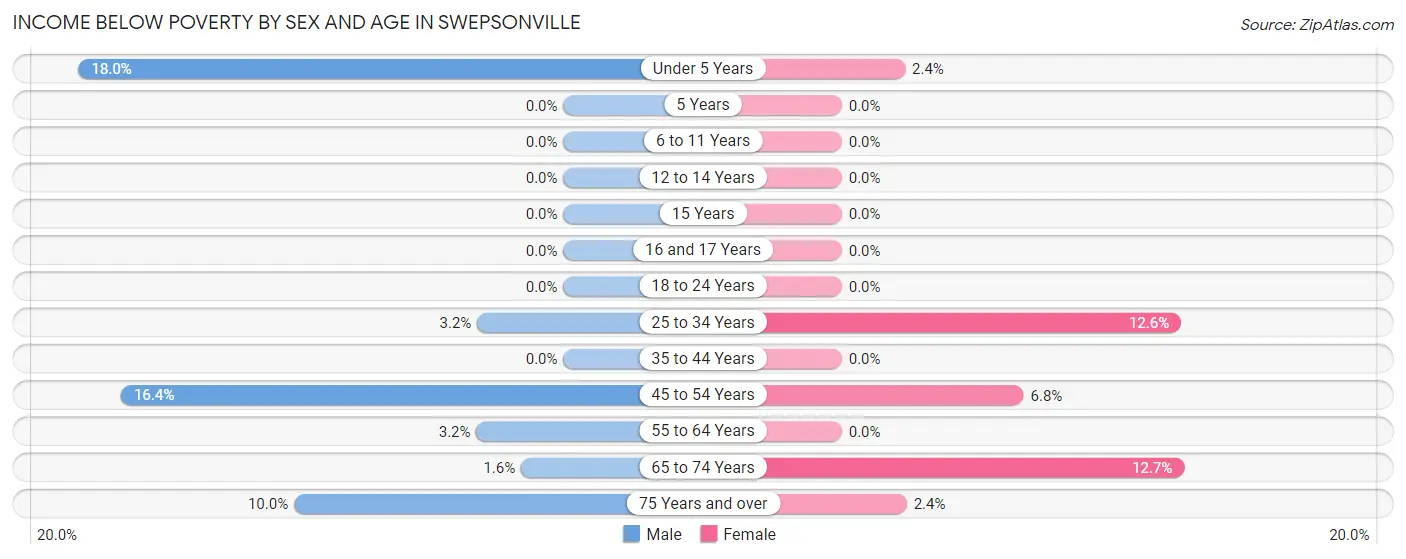
| Age Bracket | Male | Female |
| Under 5 Years | 27 (18.0%) | 2 (2.4%) |
| 5 Years | 0 (0.0%) | 0 (0.0%) |
| 6 to 11 Years | 0 (0.0%) | 0 (0.0%) |
| 12 to 14 Years | 0 (0.0%) | 0 (0.0%) |
| 15 Years | 0 (0.0%) | 0 (0.0%) |
| 16 and 17 Years | 0 (0.0%) | 0 (0.0%) |
| 18 to 24 Years | 0 (0.0%) | 0 (0.0%) |
| 25 to 34 Years | 7 (3.2%) | 18 (12.6%) |
| 35 to 44 Years | 0 (0.0%) | 0 (0.0%) |
| 45 to 54 Years | 22 (16.4%) | 11 (6.8%) |
| 55 to 64 Years | 3 (3.2%) | 0 (0.0%) |
| 65 to 74 Years | 2 (1.6%) | 15 (12.7%) |
| 75 Years and over | 5 (10.0%) | 2 (2.4%) |
| Total | 66 (5.3%) | 48 (4.0%) |
Income Above Poverty by Sex and Age in Swepsonville
According to the poverty statistics in Swepsonville, males aged 5 years and females aged 5 years are the age groups that are most secure financially, with 100.0% of males and 100.0% of females in these age groups living above the poverty line.
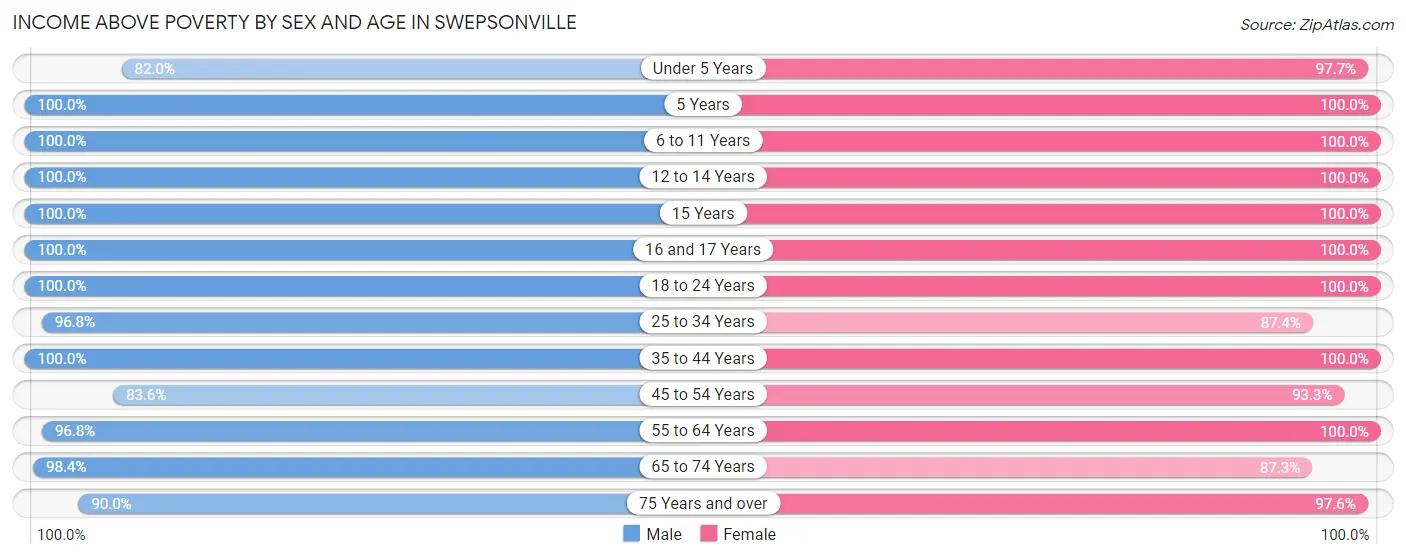
| Age Bracket | Male | Female |
| Under 5 Years | 123 (82.0%) | 83 (97.7%) |
| 5 Years | 13 (100.0%) | 63 (100.0%) |
| 6 to 11 Years | 43 (100.0%) | 78 (100.0%) |
| 12 to 14 Years | 16 (100.0%) | 45 (100.0%) |
| 15 Years | 19 (100.0%) | 16 (100.0%) |
| 16 and 17 Years | 16 (100.0%) | 28 (100.0%) |
| 18 to 24 Years | 98 (100.0%) | 69 (100.0%) |
| 25 to 34 Years | 212 (96.8%) | 125 (87.4%) |
| 35 to 44 Years | 274 (100.0%) | 226 (100.0%) |
| 45 to 54 Years | 112 (83.6%) | 152 (93.2%) |
| 55 to 64 Years | 90 (96.8%) | 87 (100.0%) |
| 65 to 74 Years | 125 (98.4%) | 103 (87.3%) |
| 75 Years and over | 45 (90.0%) | 81 (97.6%) |
| Total | 1,186 (94.7%) | 1,156 (96.0%) |
Income Below Poverty Among Married-Couple Families in Swepsonville
The poverty statistics for married-couple families in Swepsonville show that 0.4% or 2 of the total 502 families live below the poverty line. Families with no children have the highest poverty rate of 0.7%, comprising of 2 families. On the other hand, families with 1 or 2 children have the lowest poverty rate of 0.0%, which includes 0 families.
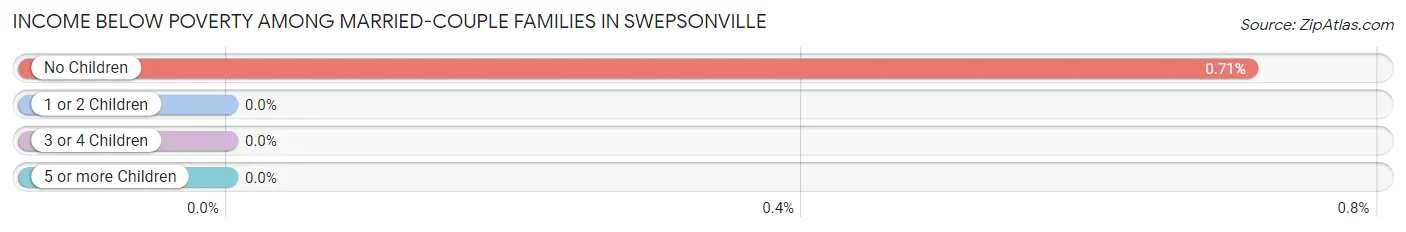
| Children | Above Poverty | Below Poverty |
| No Children | 281 (99.3%) | 2 (0.7%) |
| 1 or 2 Children | 153 (100.0%) | 0 (0.0%) |
| 3 or 4 Children | 63 (100.0%) | 0 (0.0%) |
| 5 or more Children | 3 (100.0%) | 0 (0.0%) |
| Total | 500 (99.6%) | 2 (0.4%) |
Income Below Poverty Among Single-Parent Households in Swepsonville
According to the poverty data in Swepsonville, 63.6% or 7 single-father households and 13.0% or 18 single-mother households are living below the poverty line. Among single-father households, those with no children have the highest poverty rate, with 7 households (100.0%) experiencing poverty. Likewise, among single-mother households, those with 1 or 2 children have the highest poverty rate, with 18 households (33.3%) falling below the poverty line.
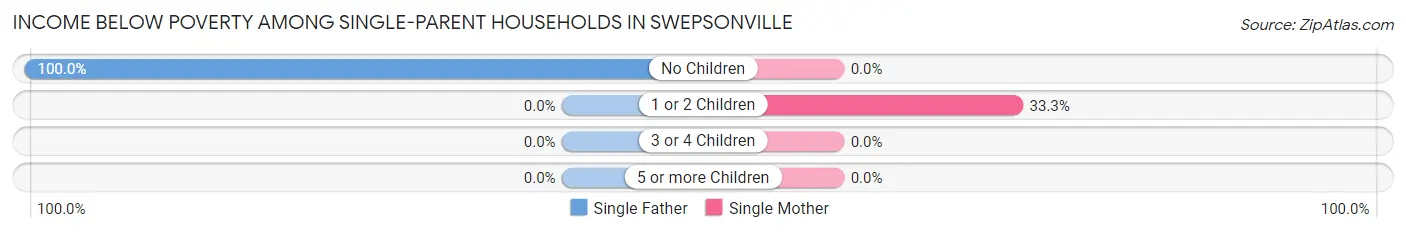
| Children | Single Father | Single Mother |
| No Children | 7 (100.0%) | 0 (0.0%) |
| 1 or 2 Children | 0 (0.0%) | 18 (33.3%) |
| 3 or 4 Children | 0 (0.0%) | 0 (0.0%) |
| 5 or more Children | 0 (0.0%) | 0 (0.0%) |
| Total | 7 (63.6%) | 18 (13.0%) |
Income Below Poverty Among Married-Couple vs Single-Parent Households in Swepsonville
The poverty data for Swepsonville shows that 2 of the married-couple family households (0.4%) and 25 of the single-parent households (16.8%) are living below the poverty level. Within the married-couple family households, those with no children have the highest poverty rate, with 2 households (0.7%) falling below the poverty line. Among the single-parent households, those with 1 or 2 children have the highest poverty rate, with 18 household (31.0%) living below poverty.
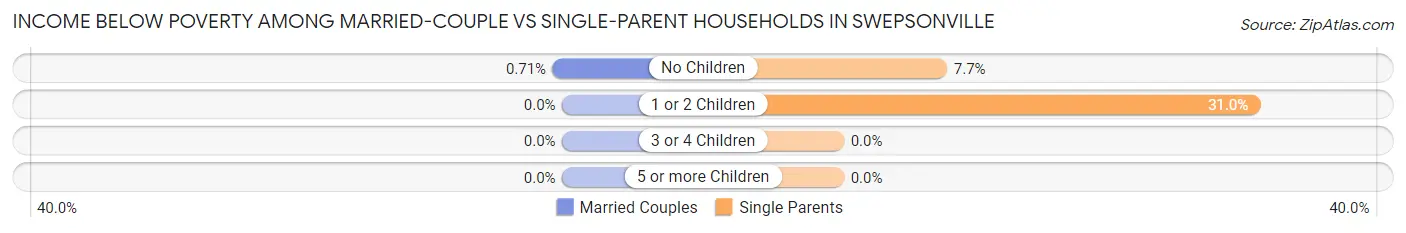
| Children | Married-Couple Families | Single-Parent Households |
| No Children | 2 (0.7%) | 7 (7.7%) |
| 1 or 2 Children | 0 (0.0%) | 18 (31.0%) |
| 3 or 4 Children | 0 (0.0%) | 0 (0.0%) |
| 5 or more Children | 0 (0.0%) | 0 (0.0%) |
| Total | 2 (0.4%) | 25 (16.8%) |
Race in Swepsonville
The most populous races in Swepsonville are White / Caucasian (1,755 | 71.2%), Black / African American (401 | 16.3%), and Hispanic or Latino (240 | 9.7%).
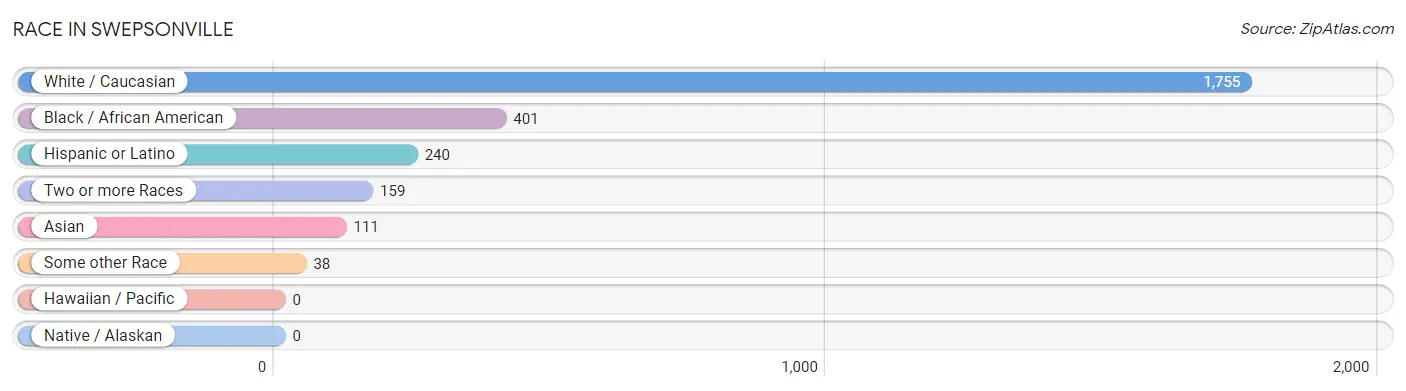
| Race | # Population | % Population |
| Asian | 111 | 4.5% |
| Black / African American | 401 | 16.3% |
| Hawaiian / Pacific | 0 | 0.0% |
| Hispanic or Latino | 240 | 9.7% |
| Native / Alaskan | 0 | 0.0% |
| White / Caucasian | 1,755 | 71.2% |
| Two or more Races | 159 | 6.5% |
| Some other Race | 38 | 1.5% |
| Total | 2,464 | 100.0% |
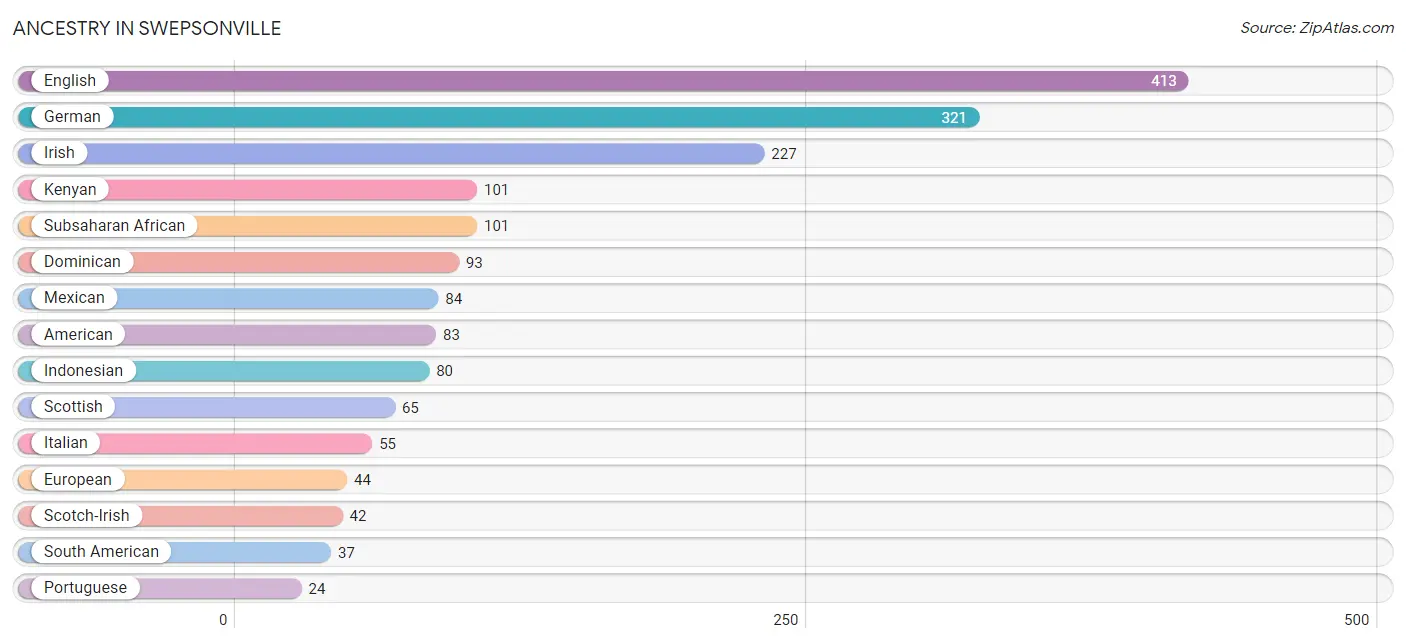
Ancestry in Swepsonville
The most populous ancestries reported in Swepsonville are English (413 | 16.8%), German (321 | 13.0%), Irish (227 | 9.2%), Kenyan (101 | 4.1%), and Subsaharan African (101 | 4.1%), together accounting for 47.2% of all Swepsonville residents.
| Ancestry | # Population | % Population |
| Afghan | 19 | 0.8% |
| American | 83 | 3.4% |
| Arab | 11 | 0.4% |
| Blackfeet | 18 | 0.7% |
| Brazilian | 13 | 0.5% |
| Burmese | 12 | 0.5% |
| Canadian | 2 | 0.1% |
| Central American | 12 | 0.5% |
| Cherokee | 3 | 0.1% |
| Chilean | 16 | 0.6% |
| Colombian | 21 | 0.9% |
| Cuban | 13 | 0.5% |
| Czechoslovakian | 3 | 0.1% |
| Danish | 4 | 0.2% |
| Dominican | 93 | 3.8% |
| Dutch | 11 | 0.4% |
| Eastern European | 6 | 0.2% |
| English | 413 | 16.8% |
| European | 44 | 1.8% |
| French | 17 | 0.7% |
| French Canadian | 12 | 0.5% |
| German | 321 | 13.0% |
| Hungarian | 4 | 0.2% |
| Icelander | 3 | 0.1% |
| Indonesian | 80 | 3.3% |
| Irish | 227 | 9.2% |
| Italian | 55 | 2.2% |
| Japanese | 1 | 0.0% |
| Kenyan | 101 | 4.1% |
| Lebanese | 11 | 0.4% |
| Mexican | 84 | 3.4% |
| Norwegian | 3 | 0.1% |
| Polish | 12 | 0.5% |
| Portuguese | 24 | 1.0% |
| Salvadoran | 12 | 0.5% |
| Scandinavian | 11 | 0.4% |
| Scotch-Irish | 42 | 1.7% |
| Scottish | 65 | 2.6% |
| South American | 37 | 1.5% |
| Spaniard | 1 | 0.0% |
| Subsaharan African | 101 | 4.1% |
| Thai | 21 | 0.9% |
| Ukrainian | 5 | 0.2% |
| Welsh | 10 | 0.4% | View All 44 Rows |
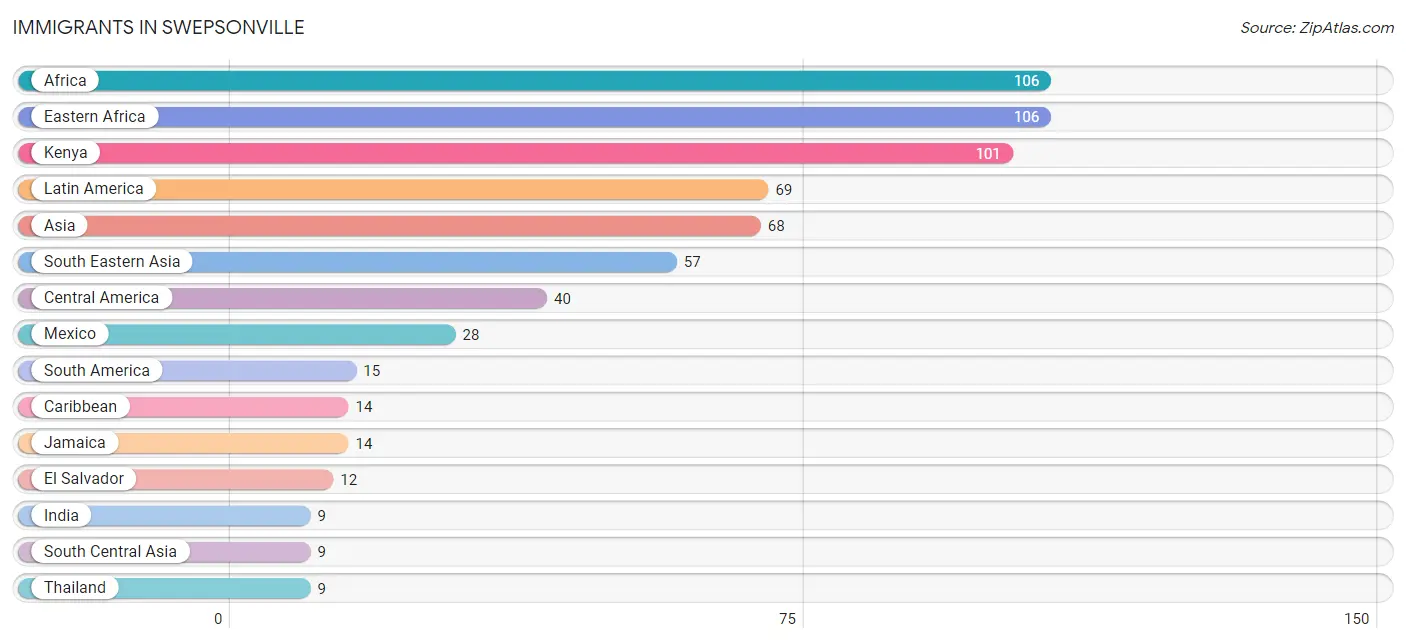
Immigrants in Swepsonville
The most numerous immigrant groups reported in Swepsonville came from Africa (106 | 4.3%), Eastern Africa (106 | 4.3%), Kenya (101 | 4.1%), Latin America (69 | 2.8%), and Asia (68 | 2.8%), together accounting for 18.3% of all Swepsonville residents.
| Immigration Origin | # Population | % Population |
| Africa | 106 | 4.3% |
| Asia | 68 | 2.8% |
| Brazil | 7 | 0.3% |
| Caribbean | 14 | 0.6% |
| Central America | 40 | 1.6% |
| China | 2 | 0.1% |
| Colombia | 8 | 0.3% |
| Eastern Africa | 106 | 4.3% |
| Eastern Asia | 2 | 0.1% |
| El Salvador | 12 | 0.5% |
| Ethiopia | 5 | 0.2% |
| Europe | 6 | 0.2% |
| Germany | 5 | 0.2% |
| India | 9 | 0.4% |
| Jamaica | 14 | 0.6% |
| Kenya | 101 | 4.1% |
| Latin America | 69 | 2.8% |
| Mexico | 28 | 1.1% |
| South America | 15 | 0.6% |
| South Central Asia | 9 | 0.4% |
| South Eastern Asia | 57 | 2.3% |
| Southern Europe | 1 | 0.0% |
| Spain | 1 | 0.0% |
| Thailand | 9 | 0.4% |
| Western Europe | 5 | 0.2% | View All 25 Rows |
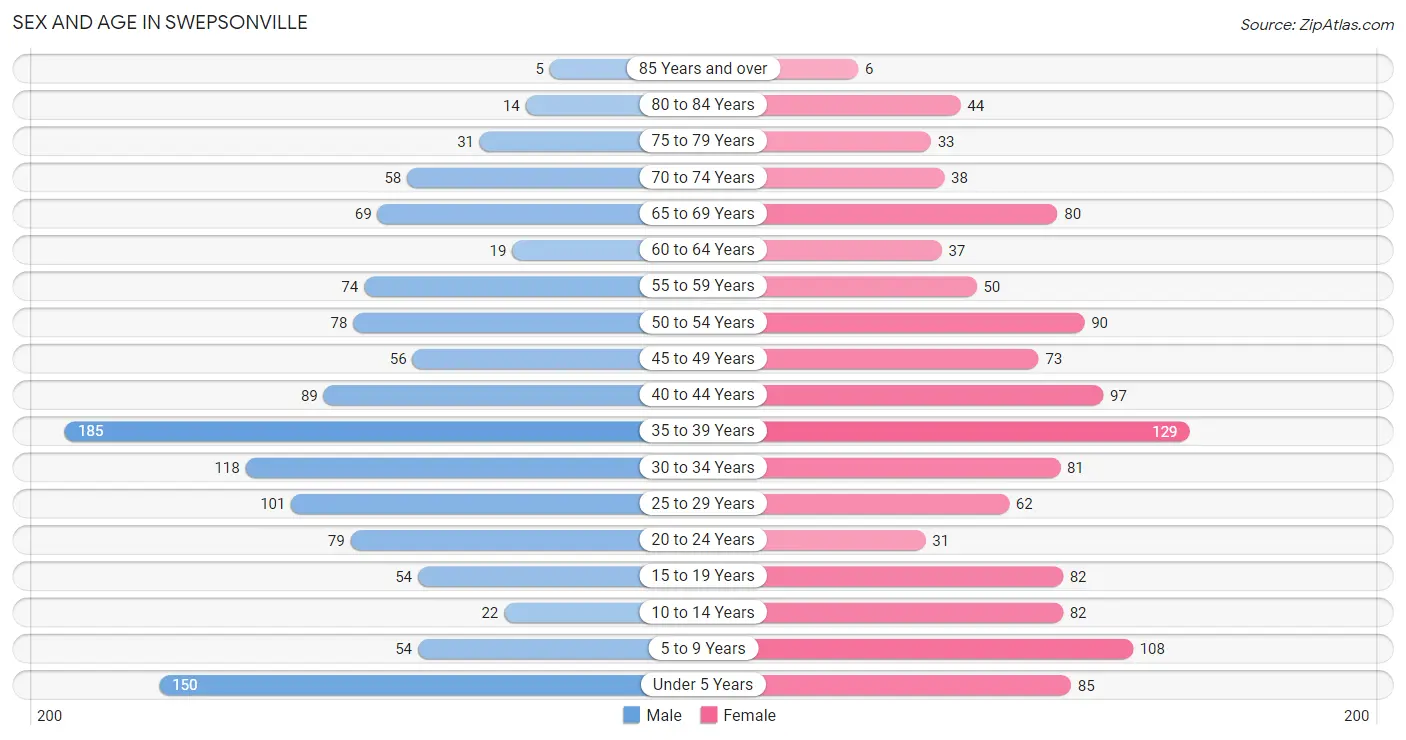
Sex and Age in Swepsonville
Sex and Age in Swepsonville
The most populous age groups in Swepsonville are 35 to 39 Years (185 | 14.7%) for men and 35 to 39 Years (129 | 10.7%) for women.
| Age Bracket | Male | Female |
| Under 5 Years | 150 (11.9%) | 85 (7.0%) |
| 5 to 9 Years | 54 (4.3%) | 108 (8.9%) |
| 10 to 14 Years | 22 (1.8%) | 82 (6.8%) |
| 15 to 19 Years | 54 (4.3%) | 82 (6.8%) |
| 20 to 24 Years | 79 (6.3%) | 31 (2.6%) |
| 25 to 29 Years | 101 (8.0%) | 62 (5.1%) |
| 30 to 34 Years | 118 (9.4%) | 81 (6.7%) |
| 35 to 39 Years | 185 (14.7%) | 129 (10.7%) |
| 40 to 44 Years | 89 (7.1%) | 97 (8.0%) |
| 45 to 49 Years | 56 (4.5%) | 73 (6.0%) |
| 50 to 54 Years | 78 (6.2%) | 90 (7.4%) |
| 55 to 59 Years | 74 (5.9%) | 50 (4.1%) |
| 60 to 64 Years | 19 (1.5%) | 37 (3.1%) |
| 65 to 69 Years | 69 (5.5%) | 80 (6.6%) |
| 70 to 74 Years | 58 (4.6%) | 38 (3.2%) |
| 75 to 79 Years | 31 (2.5%) | 33 (2.7%) |
| 80 to 84 Years | 14 (1.1%) | 44 (3.6%) |
| 85 Years and over | 5 (0.4%) | 6 (0.5%) |
| Total | 1,256 (100.0%) | 1,208 (100.0%) |
Families and Households in Swepsonville
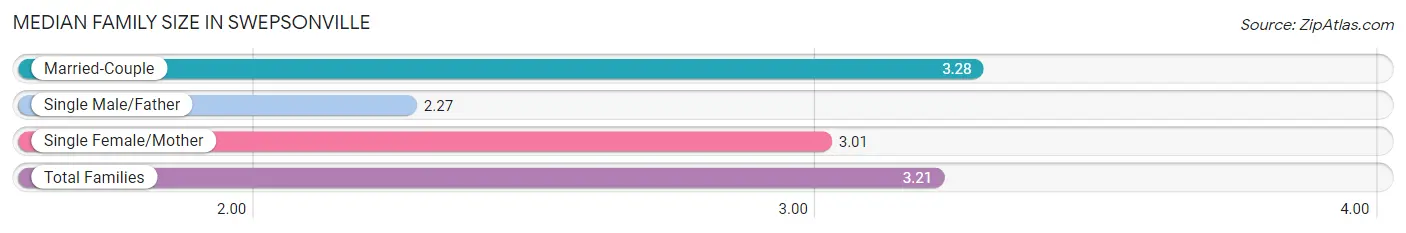
Median Family Size in Swepsonville
The median family size in Swepsonville is 3.21 persons per family, with married-couple families (502 | 77.1%) accounting for the largest median family size of 3.28 persons per family. On the other hand, single male/father families (11 | 1.7%) represent the smallest median family size with 2.27 persons per family.
| Family Type | # Families | Family Size |
| Married-Couple | 502 (77.1%) | 3.28 |
| Single Male/Father | 11 (1.7%) | 2.27 |
| Single Female/Mother | 138 (21.2%) | 3.01 |
| Total Families | 651 (100.0%) | 3.21 |
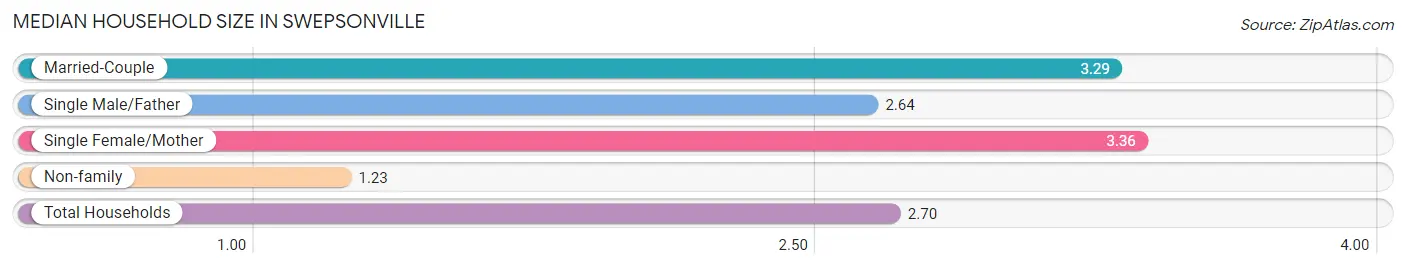
Median Household Size in Swepsonville
The median household size in Swepsonville is 2.70 persons per household, with single female/mother households (138 | 15.1%) accounting for the largest median household size of 3.36 persons per household. non-family households (261 | 28.6%) represent the smallest median household size with 1.23 persons per household.
| Household Type | # Households | Household Size |
| Married-Couple | 502 (55.0%) | 3.29 |
| Single Male/Father | 11 (1.2%) | 2.64 |
| Single Female/Mother | 138 (15.1%) | 3.36 |
| Non-family | 261 (28.6%) | 1.23 |
| Total Households | 912 (100.0%) | 2.70 |
Household Size by Marriage Status in Swepsonville
Out of a total of 912 households in Swepsonville, 651 (71.4%) are family households, while 261 (28.6%) are nonfamily households. The most numerous type of family households are 2-person households, comprising 308, and the most common type of nonfamily households are 1-person households, comprising 212.
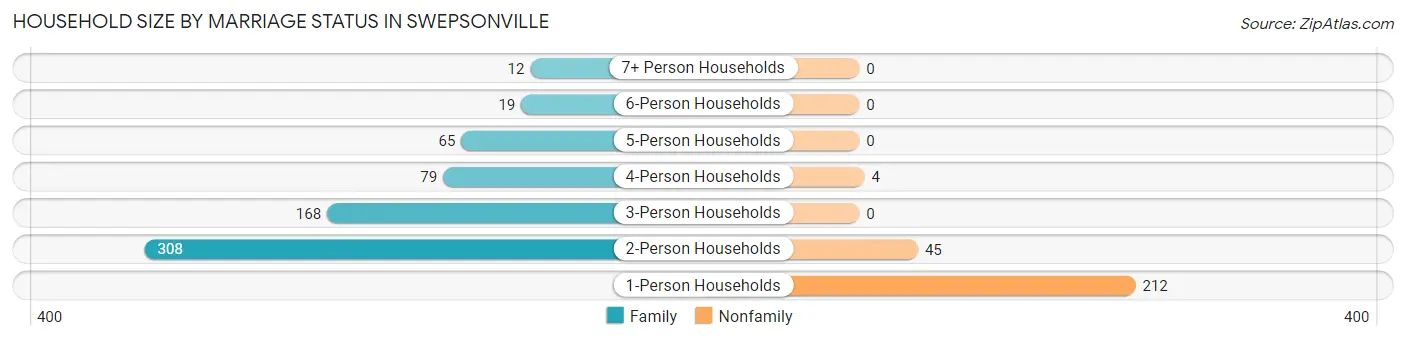
| Household Size | Family Households | Nonfamily Households |
| 1-Person Households | - | 212 (23.3%) |
| 2-Person Households | 308 (33.8%) | 45 (4.9%) |
| 3-Person Households | 168 (18.4%) | 0 (0.0%) |
| 4-Person Households | 79 (8.7%) | 4 (0.4%) |
| 5-Person Households | 65 (7.1%) | 0 (0.0%) |
| 6-Person Households | 19 (2.1%) | 0 (0.0%) |
| 7+ Person Households | 12 (1.3%) | 0 (0.0%) |
| Total | 651 (71.4%) | 261 (28.6%) |
Female Fertility in Swepsonville
Fertility by Age in Swepsonville
Average fertility rate in Swepsonville is 14.0 births per 1,000 women. Women in the age bracket of 20 to 34 years have the highest fertility rate with 46.0 births per 1,000 women. Women in the age bracket of 20 to 34 years acount for 100.0% of all women with births.
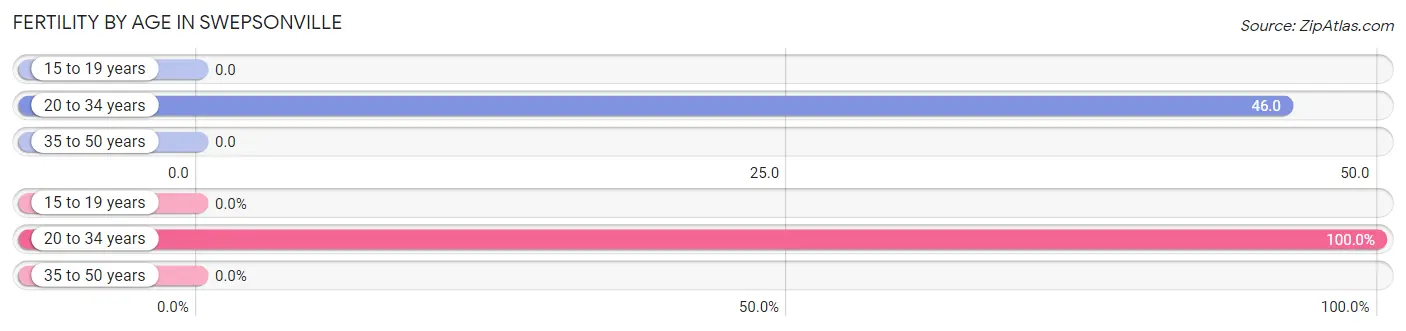
| Age Bracket | Women with Births | Births / 1,000 Women |
| 15 to 19 years | 0 (0.0%) | 0.0 |
| 20 to 34 years | 8 (100.0%) | 46.0 |
| 35 to 50 years | 0 (0.0%) | 0.0 |
| Total | 8 (100.0%) | 14.0 |
Fertility by Age by Marriage Status in Swepsonville
50.0% of women with births (8) in Swepsonville are married. The highest percentage of unmarried women with births falls into 20 to 34 years age bracket with 50.0% of them unmarried at the time of birth, while the lowest percentage of unmarried women with births belong to 20 to 34 years age bracket with 50.0% of them unmarried.
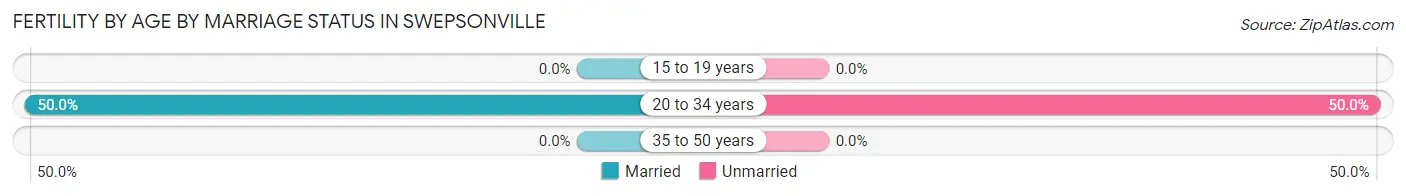
| Age Bracket | Married | Unmarried |
| 15 to 19 years | 0 (0.0%) | 0 (0.0%) |
| 20 to 34 years | 4 (50.0%) | 4 (50.0%) |
| 35 to 50 years | 0 (0.0%) | 0 (0.0%) |
| Total | 4 (50.0%) | 4 (50.0%) |
Fertility by Education in Swepsonville
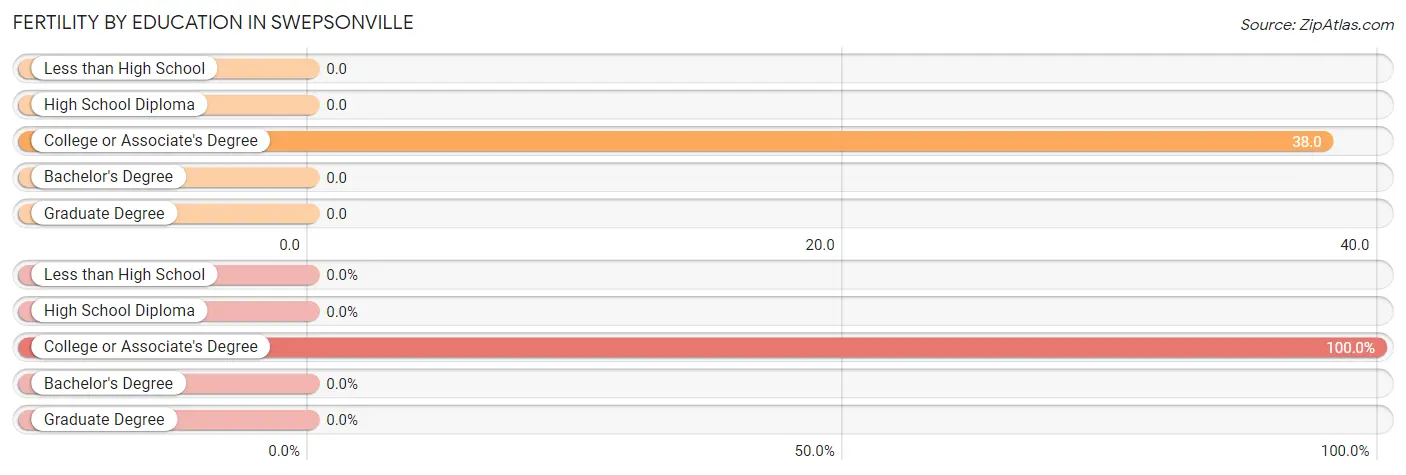
| Educational Attainment | Women with Births | Births / 1,000 Women |
| Less than High School | 0 (0.0%) | 0.0 |
| High School Diploma | 0 (0.0%) | 0.0 |
| College or Associate's Degree | 8 (100.0%) | 38.0 |
| Bachelor's Degree | 0 (0.0%) | 0.0 |
| Graduate Degree | 0 (0.0%) | 0.0 |
| Total | 8 (100.0%) | 14.0 |
Fertility by Education by Marriage Status in Swepsonville
50.0% of women with births in Swepsonville are unmarried. Women with the educational attainment of college or associate's degree are most likely to be married with 50.0% of them married at childbirth, while women with the educational attainment of college or associate's degree are least likely to be married with 50.0% of them unmarried at childbirth.
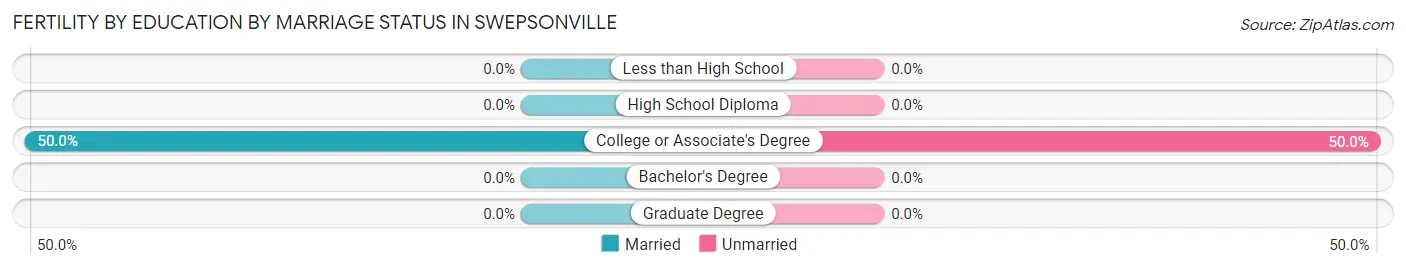
| Educational Attainment | Married | Unmarried |
| Less than High School | 0 (0.0%) | 0 (0.0%) |
| High School Diploma | 0 (0.0%) | 0 (0.0%) |
| College or Associate's Degree | 4 (50.0%) | 4 (50.0%) |
| Bachelor's Degree | 0 (0.0%) | 0 (0.0%) |
| Graduate Degree | 0 (0.0%) | 0 (0.0%) |
| Total | 4 (50.0%) | 4 (50.0%) |
Employment Characteristics in Swepsonville
Employment by Class of Employer in Swepsonville
Among the 1,251 employed individuals in Swepsonville, private company employees (712 | 56.9%), state government employees (184 | 14.7%), and local government employees (117 | 9.3%) make up the most common classes of employment.
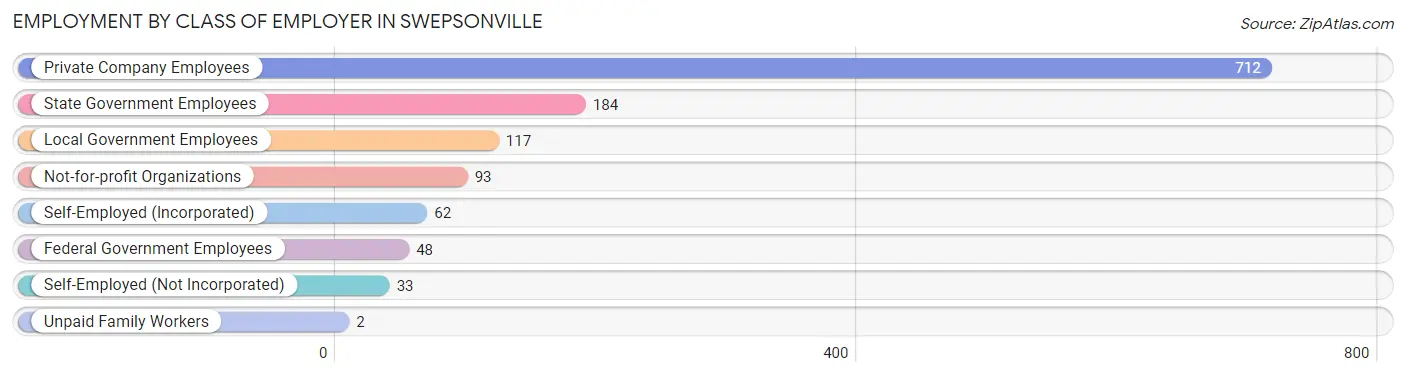
| Employer Class | # Employees | % Employees |
| Private Company Employees | 712 | 56.9% |
| Self-Employed (Incorporated) | 62 | 5.0% |
| Self-Employed (Not Incorporated) | 33 | 2.6% |
| Not-for-profit Organizations | 93 | 7.4% |
| Local Government Employees | 117 | 9.3% |
| State Government Employees | 184 | 14.7% |
| Federal Government Employees | 48 | 3.8% |
| Unpaid Family Workers | 2 | 0.2% |
| Total | 1,251 | 100.0% |
Employment Status by Age in Swepsonville
According to the labor force statistics for Swepsonville, out of the total population over 16 years of age (1,928), 69.0% or 1,330 individuals are in the labor force, with 4.4% or 59 of them unemployed. The age group with the highest labor force participation rate is 55 to 59 years, with 93.5% or 116 individuals in the labor force. Within the labor force, the 16 to 19 years age range has the highest percentage of unemployed individuals, with 20.8% or 10 of them being unemployed.
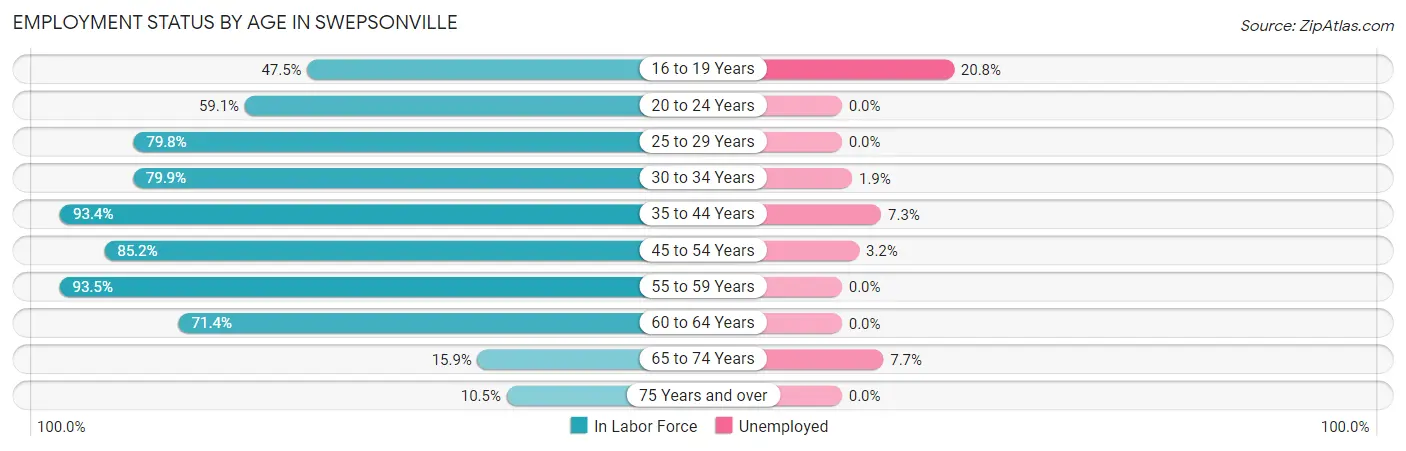
| Age Bracket | In Labor Force | Unemployed |
| 16 to 19 Years | 48 (47.5%) | 10 (20.8%) |
| 20 to 24 Years | 65 (59.1%) | 0 (0.0%) |
| 25 to 29 Years | 130 (79.8%) | 0 (0.0%) |
| 30 to 34 Years | 159 (79.9%) | 3 (1.9%) |
| 35 to 44 Years | 467 (93.4%) | 34 (7.3%) |
| 45 to 54 Years | 253 (85.2%) | 8 (3.2%) |
| 55 to 59 Years | 116 (93.5%) | 0 (0.0%) |
| 60 to 64 Years | 40 (71.4%) | 0 (0.0%) |
| 65 to 74 Years | 39 (15.9%) | 3 (7.7%) |
| 75 Years and over | 14 (10.5%) | 0 (0.0%) |
| Total | 1,330 (69.0%) | 59 (4.4%) |
Employment Status by Educational Attainment in Swepsonville
According to labor force statistics for Swepsonville, 87.0% of individuals (1,165) out of the total population between 25 and 64 years of age (1,339) are in the labor force, with 3.9% or 45 of them being unemployed. The group with the highest labor force participation rate are those with the educational attainment of high school diploma, with 91.5% or 292 individuals in the labor force. Within the labor force, individuals with high school diploma education have the highest percentage of unemployment, with 13.4% or 39 of them being unemployed.
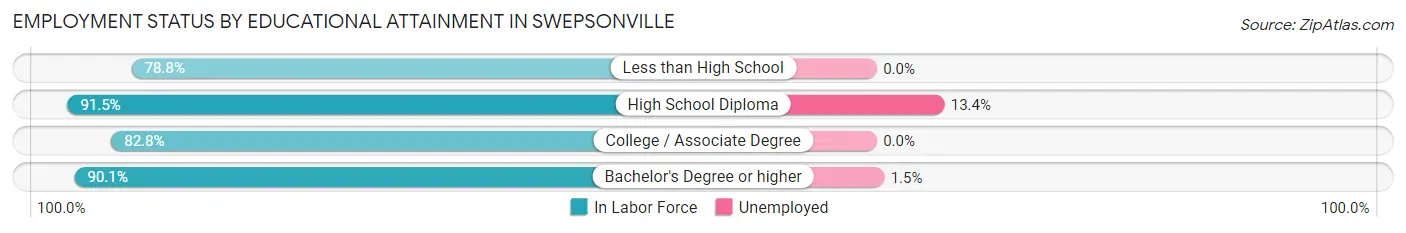
| Educational Attainment | In Labor Force | Unemployed |
| Less than High School | 82 (78.8%) | 0 (0.0%) |
| High School Diploma | 292 (91.5%) | 43 (13.4%) |
| College / Associate Degree | 389 (82.8%) | 0 (0.0%) |
| Bachelor's Degree or higher | 402 (90.1%) | 7 (1.5%) |
| Total | 1,165 (87.0%) | 52 (3.9%) |
Employment Occupations by Sex in Swepsonville
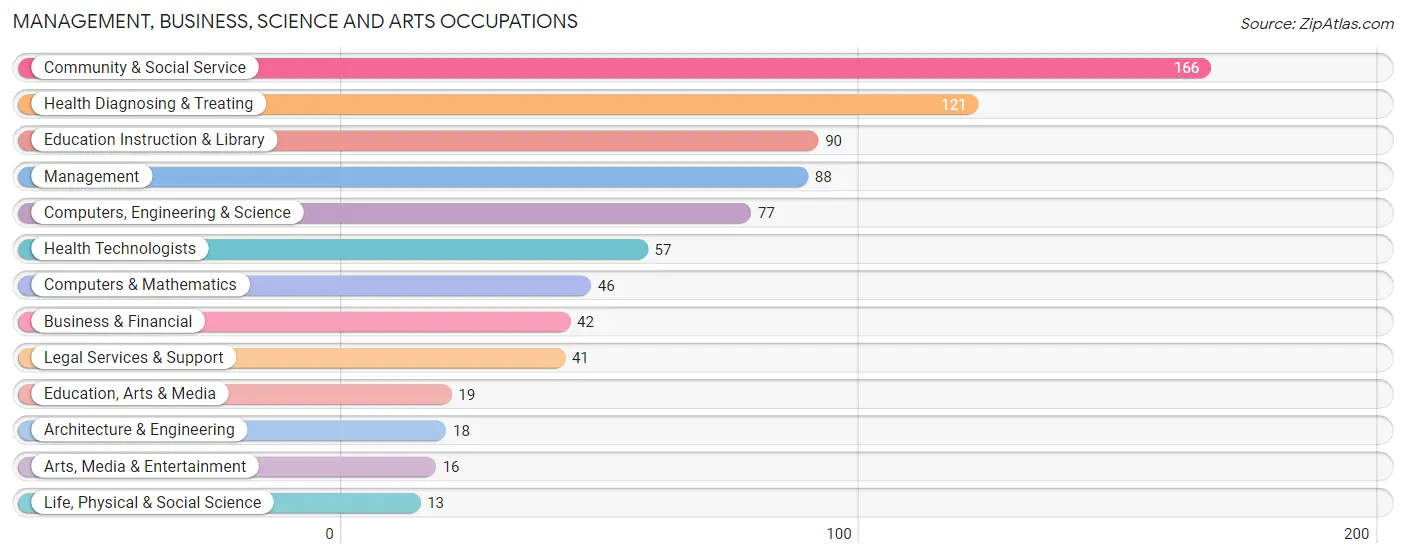
Management, Business, Science and Arts Occupations
The most common Management, Business, Science and Arts occupations in Swepsonville are Community & Social Service (166 | 13.1%), Health Diagnosing & Treating (121 | 9.5%), Education Instruction & Library (90 | 7.1%), Management (88 | 6.9%), and Computers, Engineering & Science (77 | 6.1%).
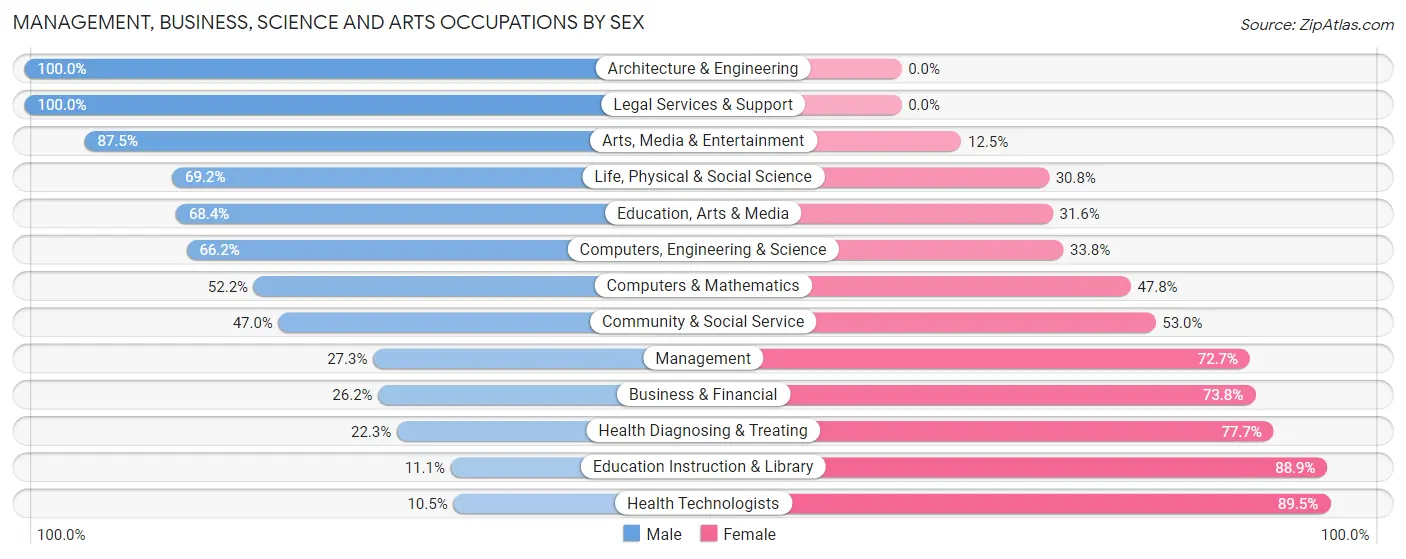
Management, Business, Science and Arts Occupations by Sex
Within the Management, Business, Science and Arts occupations in Swepsonville, the most male-oriented occupations are Architecture & Engineering (100.0%), Legal Services & Support (100.0%), and Arts, Media & Entertainment (87.5%), while the most female-oriented occupations are Health Technologists (89.5%), Education Instruction & Library (88.9%), and Health Diagnosing & Treating (77.7%).
| Occupation | Male | Female |
| Management | 24 (27.3%) | 64 (72.7%) |
| Business & Financial | 11 (26.2%) | 31 (73.8%) |
| Computers, Engineering & Science | 51 (66.2%) | 26 (33.8%) |
| Computers & Mathematics | 24 (52.2%) | 22 (47.8%) |
| Architecture & Engineering | 18 (100.0%) | 0 (0.0%) |
| Life, Physical & Social Science | 9 (69.2%) | 4 (30.8%) |
| Community & Social Service | 78 (47.0%) | 88 (53.0%) |
| Education, Arts & Media | 13 (68.4%) | 6 (31.6%) |
| Legal Services & Support | 41 (100.0%) | 0 (0.0%) |
| Education Instruction & Library | 10 (11.1%) | 80 (88.9%) |
| Arts, Media & Entertainment | 14 (87.5%) | 2 (12.5%) |
| Health Diagnosing & Treating | 27 (22.3%) | 94 (77.7%) |
| Health Technologists | 6 (10.5%) | 51 (89.5%) |
| Total (Category) | 191 (38.7%) | 303 (61.3%) |
| Total (Overall) | 730 (57.5%) | 539 (42.5%) |
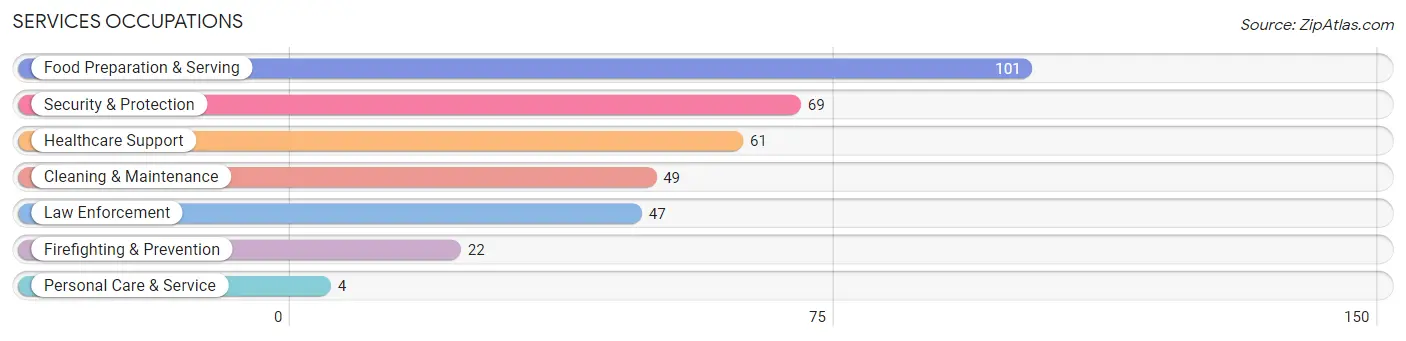
Services Occupations
The most common Services occupations in Swepsonville are Food Preparation & Serving (101 | 8.0%), Security & Protection (69 | 5.4%), Healthcare Support (61 | 4.8%), Cleaning & Maintenance (49 | 3.9%), and Law Enforcement (47 | 3.7%).
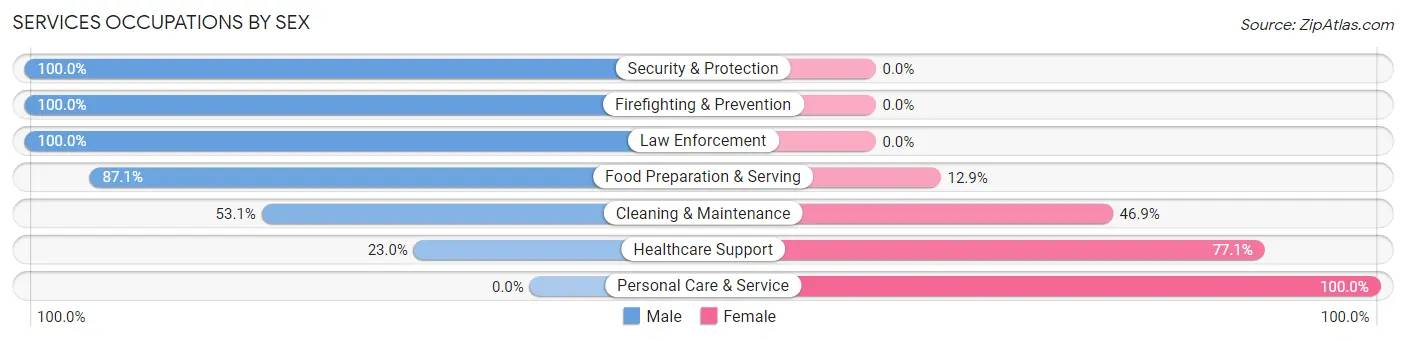
Services Occupations by Sex
Within the Services occupations in Swepsonville, the most male-oriented occupations are Security & Protection (100.0%), Firefighting & Prevention (100.0%), and Law Enforcement (100.0%), while the most female-oriented occupations are Personal Care & Service (100.0%), Healthcare Support (77.0%), and Cleaning & Maintenance (46.9%).
| Occupation | Male | Female |
| Healthcare Support | 14 (23.0%) | 47 (77.0%) |
| Security & Protection | 69 (100.0%) | 0 (0.0%) |
| Firefighting & Prevention | 22 (100.0%) | 0 (0.0%) |
| Law Enforcement | 47 (100.0%) | 0 (0.0%) |
| Food Preparation & Serving | 88 (87.1%) | 13 (12.9%) |
| Cleaning & Maintenance | 26 (53.1%) | 23 (46.9%) |
| Personal Care & Service | 0 (0.0%) | 4 (100.0%) |
| Total (Category) | 197 (69.4%) | 87 (30.6%) |
| Total (Overall) | 730 (57.5%) | 539 (42.5%) |
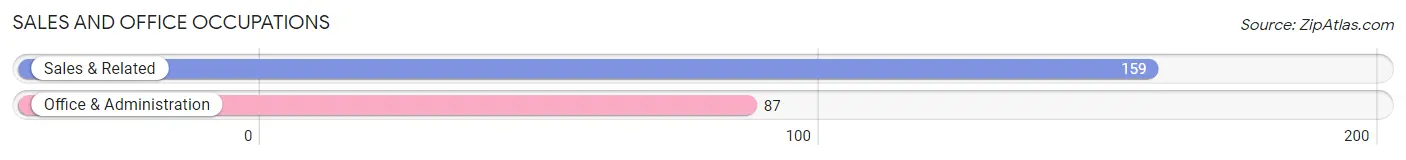
Sales and Office Occupations
The most common Sales and Office occupations in Swepsonville are Sales & Related (159 | 12.5%), and Office & Administration (87 | 6.9%).
Sales and Office Occupations by Sex
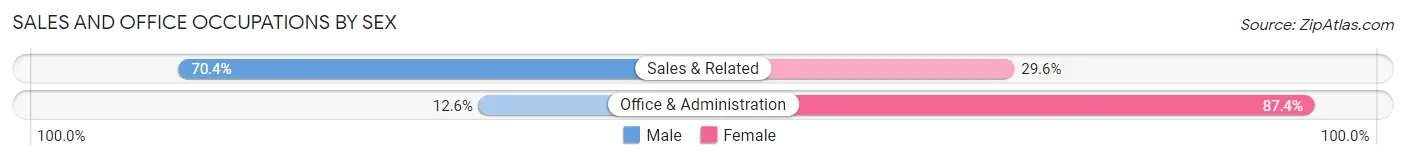
| Occupation | Male | Female |
| Sales & Related | 112 (70.4%) | 47 (29.6%) |
| Office & Administration | 11 (12.6%) | 76 (87.4%) |
| Total (Category) | 123 (50.0%) | 123 (50.0%) |
| Total (Overall) | 730 (57.5%) | 539 (42.5%) |
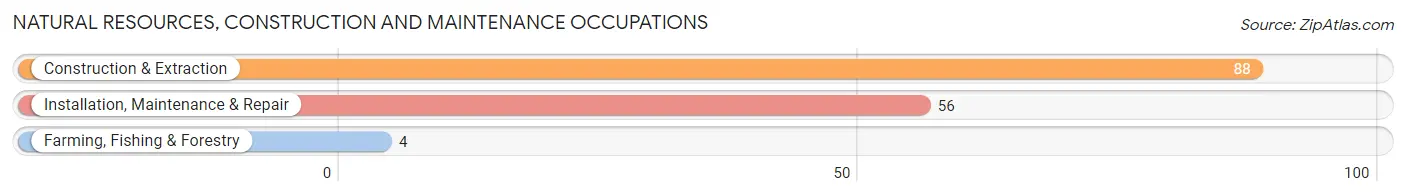
Natural Resources, Construction and Maintenance Occupations
The most common Natural Resources, Construction and Maintenance occupations in Swepsonville are Construction & Extraction (88 | 6.9%), Installation, Maintenance & Repair (56 | 4.4%), and Farming, Fishing & Forestry (4 | 0.3%).
Natural Resources, Construction and Maintenance Occupations by Sex
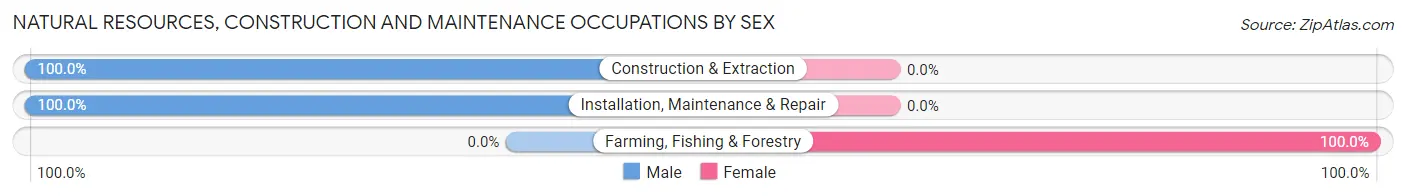
| Occupation | Male | Female |
| Farming, Fishing & Forestry | 0 (0.0%) | 4 (100.0%) |
| Construction & Extraction | 88 (100.0%) | 0 (0.0%) |
| Installation, Maintenance & Repair | 56 (100.0%) | 0 (0.0%) |
| Total (Category) | 144 (97.3%) | 4 (2.7%) |
| Total (Overall) | 730 (57.5%) | 539 (42.5%) |
Production, Transportation and Moving Occupations
The most common Production, Transportation and Moving occupations in Swepsonville are Production (46 | 3.6%), Material Moving (41 | 3.2%), and Transportation (10 | 0.8%).
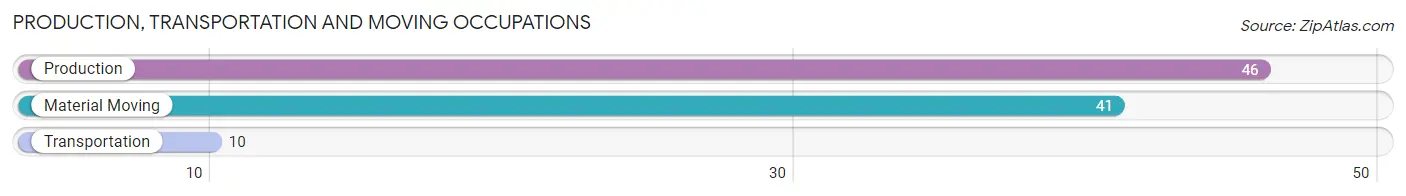
Production, Transportation and Moving Occupations by Sex
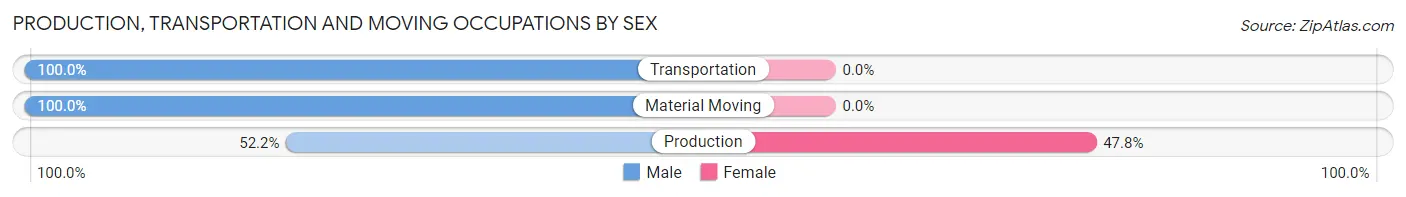
| Occupation | Male | Female |
| Production | 24 (52.2%) | 22 (47.8%) |
| Transportation | 10 (100.0%) | 0 (0.0%) |
| Material Moving | 41 (100.0%) | 0 (0.0%) |
| Total (Category) | 75 (77.3%) | 22 (22.7%) |
| Total (Overall) | 730 (57.5%) | 539 (42.5%) |
Employment Industries by Sex in Swepsonville
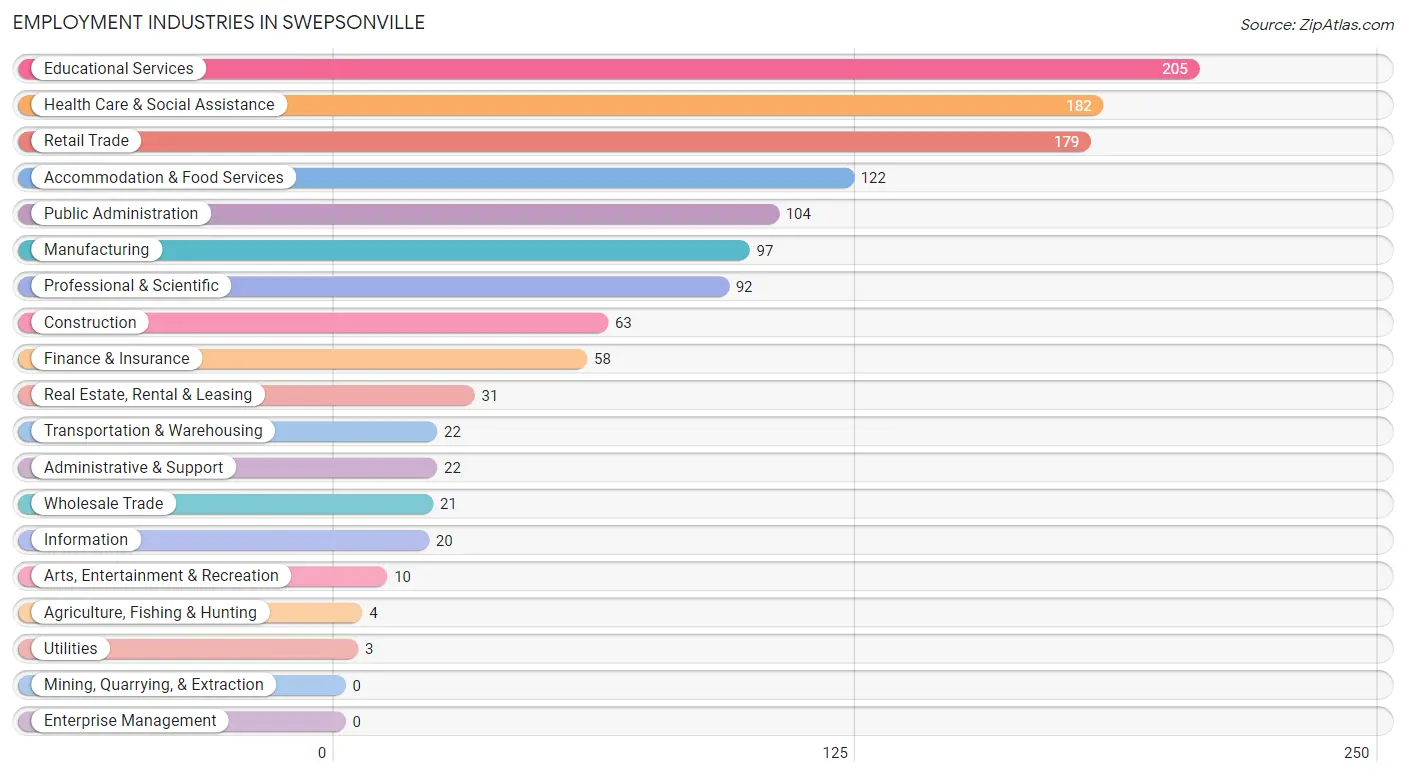
Employment Industries in Swepsonville
The major employment industries in Swepsonville include Educational Services (205 | 16.2%), Health Care & Social Assistance (182 | 14.3%), Retail Trade (179 | 14.1%), Accommodation & Food Services (122 | 9.6%), and Public Administration (104 | 8.2%).
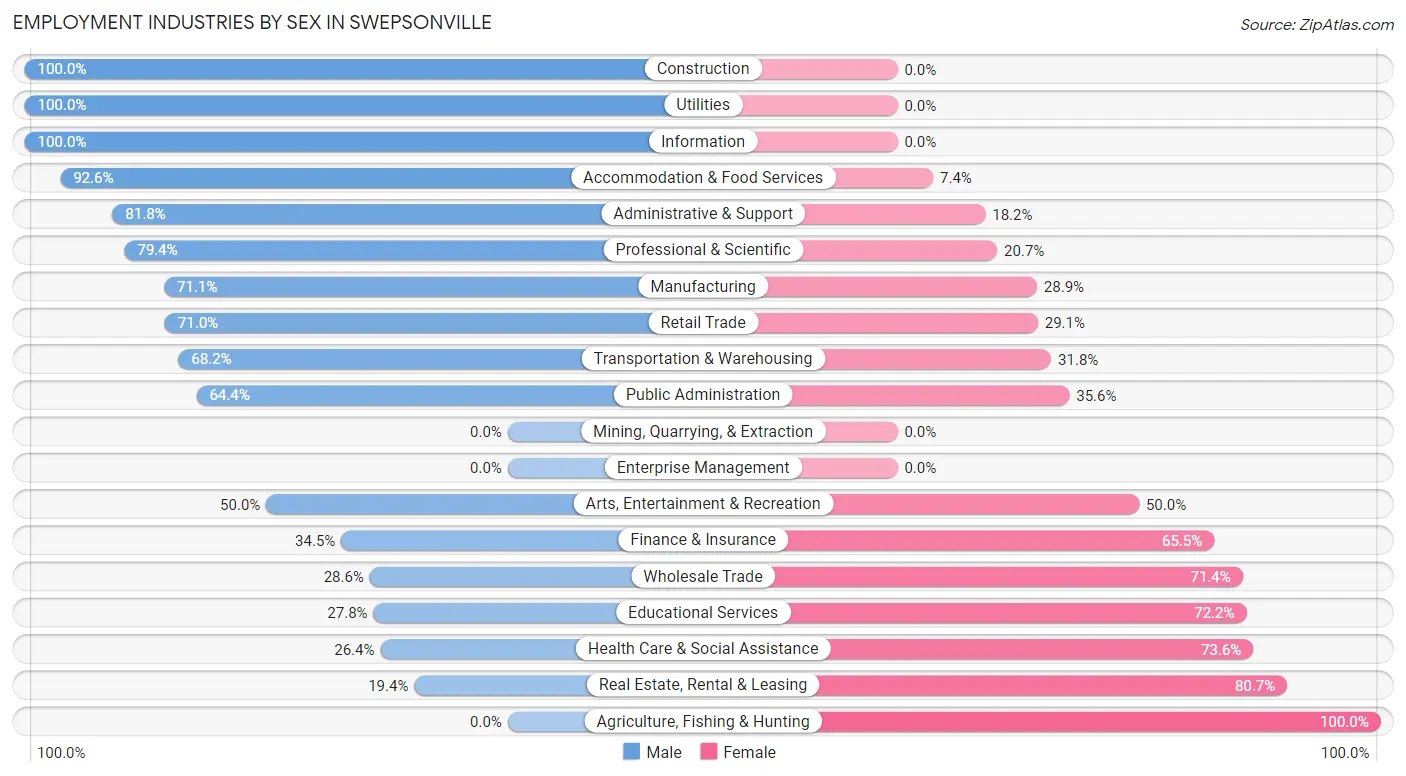
Employment Industries by Sex in Swepsonville
The Swepsonville industries that see more men than women are Construction (100.0%), Utilities (100.0%), and Information (100.0%), whereas the industries that tend to have a higher number of women are Agriculture, Fishing & Hunting (100.0%), Real Estate, Rental & Leasing (80.6%), and Health Care & Social Assistance (73.6%).
| Industry | Male | Female |
| Agriculture, Fishing & Hunting | 0 (0.0%) | 4 (100.0%) |
| Mining, Quarrying, & Extraction | 0 (0.0%) | 0 (0.0%) |
| Construction | 63 (100.0%) | 0 (0.0%) |
| Manufacturing | 69 (71.1%) | 28 (28.9%) |
| Wholesale Trade | 6 (28.6%) | 15 (71.4%) |
| Retail Trade | 127 (71.0%) | 52 (29.0%) |
| Transportation & Warehousing | 15 (68.2%) | 7 (31.8%) |
| Utilities | 3 (100.0%) | 0 (0.0%) |
| Information | 20 (100.0%) | 0 (0.0%) |
| Finance & Insurance | 20 (34.5%) | 38 (65.5%) |
| Real Estate, Rental & Leasing | 6 (19.4%) | 25 (80.6%) |
| Professional & Scientific | 73 (79.3%) | 19 (20.6%) |
| Enterprise Management | 0 (0.0%) | 0 (0.0%) |
| Administrative & Support | 18 (81.8%) | 4 (18.2%) |
| Educational Services | 57 (27.8%) | 148 (72.2%) |
| Health Care & Social Assistance | 48 (26.4%) | 134 (73.6%) |
| Arts, Entertainment & Recreation | 5 (50.0%) | 5 (50.0%) |
| Accommodation & Food Services | 113 (92.6%) | 9 (7.4%) |
| Public Administration | 67 (64.4%) | 37 (35.6%) |
| Total | 730 (57.5%) | 539 (42.5%) |
Education in Swepsonville
School Enrollment in Swepsonville
The most common levels of schooling among the 553 students in Swepsonville are college / undergraduate (122 | 22.1%), elementary school (112 | 20.3%), and high school (110 | 19.9%).
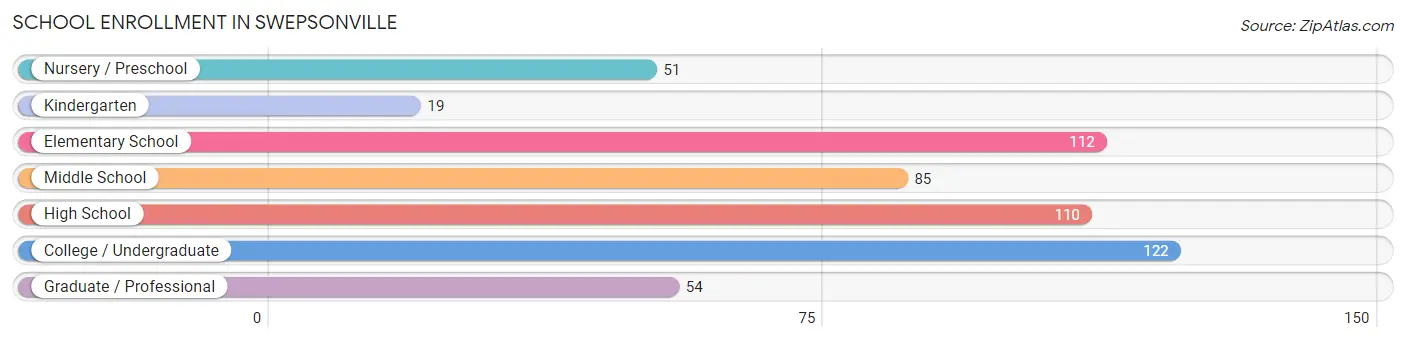
| School Level | # Students | % Students |
| Nursery / Preschool | 51 | 9.2% |
| Kindergarten | 19 | 3.4% |
| Elementary School | 112 | 20.3% |
| Middle School | 85 | 15.4% |
| High School | 110 | 19.9% |
| College / Undergraduate | 122 | 22.1% |
| Graduate / Professional | 54 | 9.8% |
| Total | 553 | 100.0% |
School Enrollment by Age by Funding Source in Swepsonville
Out of a total of 553 students who are enrolled in schools in Swepsonville, 152 (27.5%) attend a private institution, while the remaining 401 (72.5%) are enrolled in public schools. The age group of 3 to 4 year olds has the highest likelihood of being enrolled in private schools, with 17 (58.6% in the age bracket) enrolled. Conversely, the age group of 20 to 24 year olds has the lowest likelihood of being enrolled in a private school, with 48 (100.0% in the age bracket) attending a public institution.
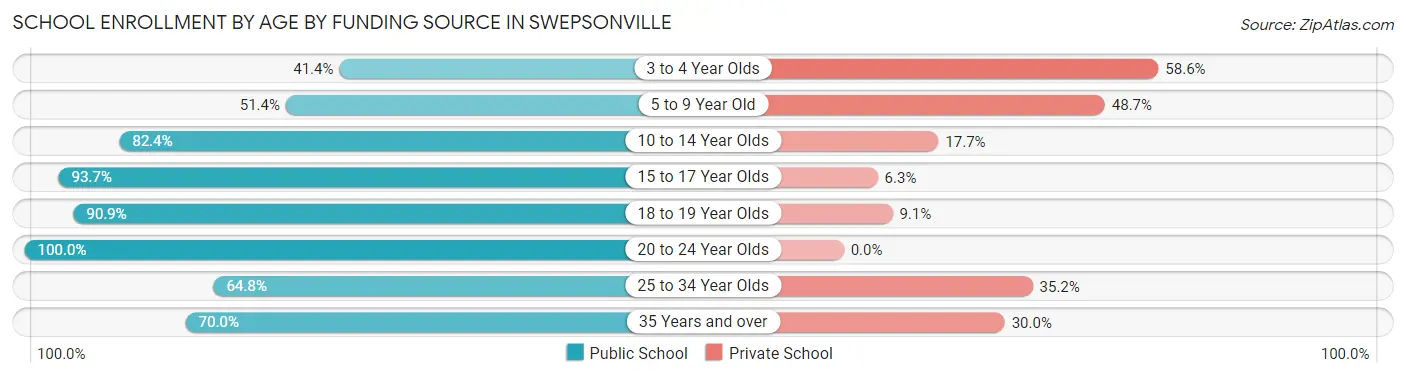
| Age Bracket | Public School | Private School |
| 3 to 4 Year Olds | 12 (41.4%) | 17 (58.6%) |
| 5 to 9 Year Old | 76 (51.3%) | 72 (48.6%) |
| 10 to 14 Year Olds | 84 (82.4%) | 18 (17.6%) |
| 15 to 17 Year Olds | 74 (93.7%) | 5 (6.3%) |
| 18 to 19 Year Olds | 30 (90.9%) | 3 (9.1%) |
| 20 to 24 Year Olds | 48 (100.0%) | 0 (0.0%) |
| 25 to 34 Year Olds | 35 (64.8%) | 19 (35.2%) |
| 35 Years and over | 42 (70.0%) | 18 (30.0%) |
| Total | 401 (72.5%) | 152 (27.5%) |
Educational Attainment by Field of Study in Swepsonville
Business (89 | 15.5%), bio, nature & agricultural (60 | 10.4%), psychology (58 | 10.1%), science & technology (58 | 10.1%), and education (52 | 9.1%) are the most common fields of study among 574 individuals in Swepsonville who have obtained a bachelor's degree or higher.
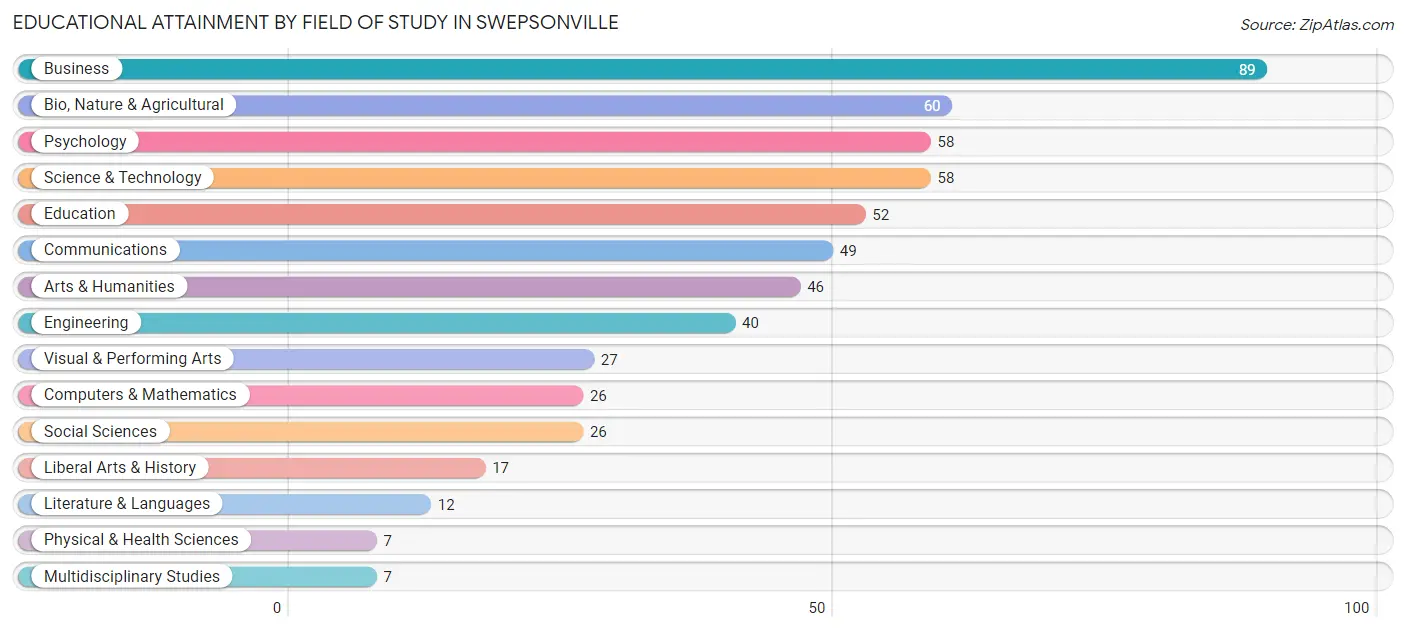
| Field of Study | # Graduates | % Graduates |
| Computers & Mathematics | 26 | 4.5% |
| Bio, Nature & Agricultural | 60 | 10.4% |
| Physical & Health Sciences | 7 | 1.2% |
| Psychology | 58 | 10.1% |
| Social Sciences | 26 | 4.5% |
| Engineering | 40 | 7.0% |
| Multidisciplinary Studies | 7 | 1.2% |
| Science & Technology | 58 | 10.1% |
| Business | 89 | 15.5% |
| Education | 52 | 9.1% |
| Literature & Languages | 12 | 2.1% |
| Liberal Arts & History | 17 | 3.0% |
| Visual & Performing Arts | 27 | 4.7% |
| Communications | 49 | 8.5% |
| Arts & Humanities | 46 | 8.0% |
| Total | 574 | 100.0% |
Transportation & Commute in Swepsonville
Vehicle Availability by Sex in Swepsonville
The most prevalent vehicle ownership categories in Swepsonville are males with 2 vehicles (354, accounting for 48.4%) and females with 2 vehicles (231, making up 68.1%).
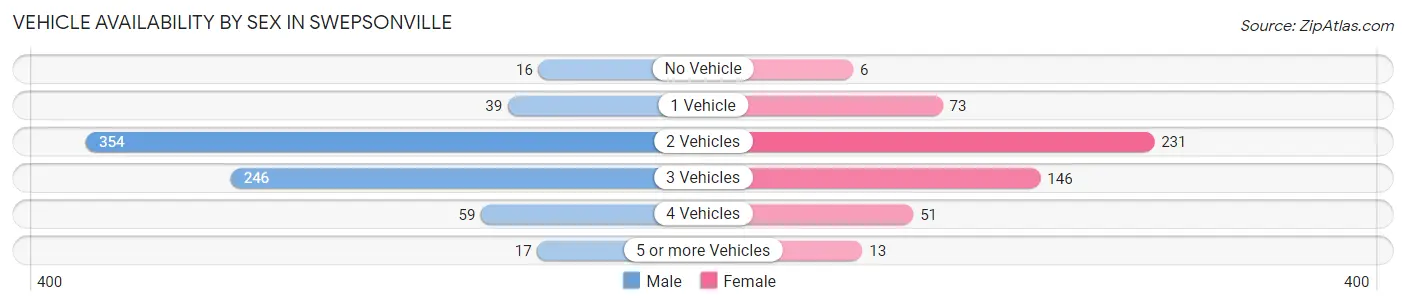
| Vehicles Available | Male | Female |
| No Vehicle | 16 (2.2%) | 6 (1.1%) |
| 1 Vehicle | 39 (5.3%) | 73 (14.0%) |
| 2 Vehicles | 354 (48.4%) | 231 (44.4%) |
| 3 Vehicles | 246 (33.7%) | 146 (28.1%) |
| 4 Vehicles | 59 (8.1%) | 51 (9.8%) |
| 5 or more Vehicles | 17 (2.3%) | 13 (2.5%) |
| Total | 731 (100.0%) | 520 (100.0%) |
Commute Time in Swepsonville
The most frequently occuring commute durations in Swepsonville are 30 to 34 minutes (449 commuters, 40.5%), 10 to 14 minutes (105 commuters, 9.5%), and 45 to 59 minutes (99 commuters, 8.9%).
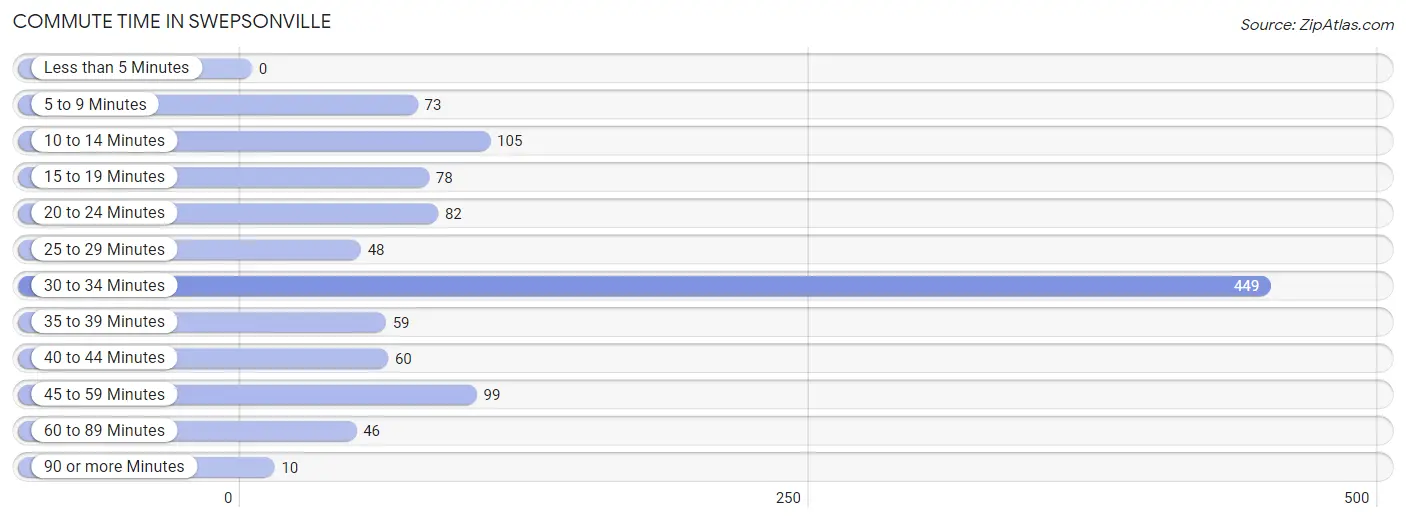
| Commute Time | # Commuters | % Commuters |
| Less than 5 Minutes | 0 | 0.0% |
| 5 to 9 Minutes | 73 | 6.6% |
| 10 to 14 Minutes | 105 | 9.5% |
| 15 to 19 Minutes | 78 | 7.0% |
| 20 to 24 Minutes | 82 | 7.4% |
| 25 to 29 Minutes | 48 | 4.3% |
| 30 to 34 Minutes | 449 | 40.5% |
| 35 to 39 Minutes | 59 | 5.3% |
| 40 to 44 Minutes | 60 | 5.4% |
| 45 to 59 Minutes | 99 | 8.9% |
| 60 to 89 Minutes | 46 | 4.2% |
| 90 or more Minutes | 10 | 0.9% |
Commute Time by Sex in Swepsonville
The most common commute times in Swepsonville are 30 to 34 minutes (267 commuters, 40.6%) for males and 30 to 34 minutes (182 commuters, 40.4%) for females.
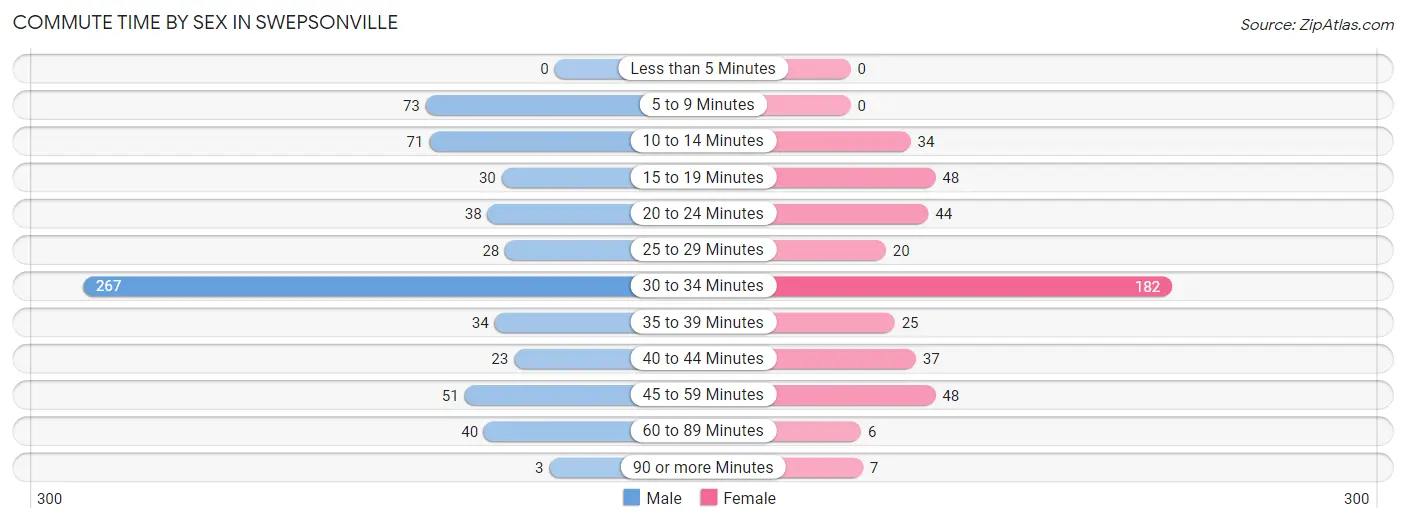
| Commute Time | Male | Female |
| Less than 5 Minutes | 0 (0.0%) | 0 (0.0%) |
| 5 to 9 Minutes | 73 (11.1%) | 0 (0.0%) |
| 10 to 14 Minutes | 71 (10.8%) | 34 (7.5%) |
| 15 to 19 Minutes | 30 (4.6%) | 48 (10.6%) |
| 20 to 24 Minutes | 38 (5.8%) | 44 (9.8%) |
| 25 to 29 Minutes | 28 (4.3%) | 20 (4.4%) |
| 30 to 34 Minutes | 267 (40.6%) | 182 (40.4%) |
| 35 to 39 Minutes | 34 (5.2%) | 25 (5.5%) |
| 40 to 44 Minutes | 23 (3.5%) | 37 (8.2%) |
| 45 to 59 Minutes | 51 (7.7%) | 48 (10.6%) |
| 60 to 89 Minutes | 40 (6.1%) | 6 (1.3%) |
| 90 or more Minutes | 3 (0.5%) | 7 (1.5%) |
Time of Departure to Work by Sex in Swepsonville
The most frequent times of departure to work in Swepsonville are 6:30 AM to 6:59 AM (123, 18.7%) for males and 7:00 AM to 7:29 AM (123, 27.3%) for females.
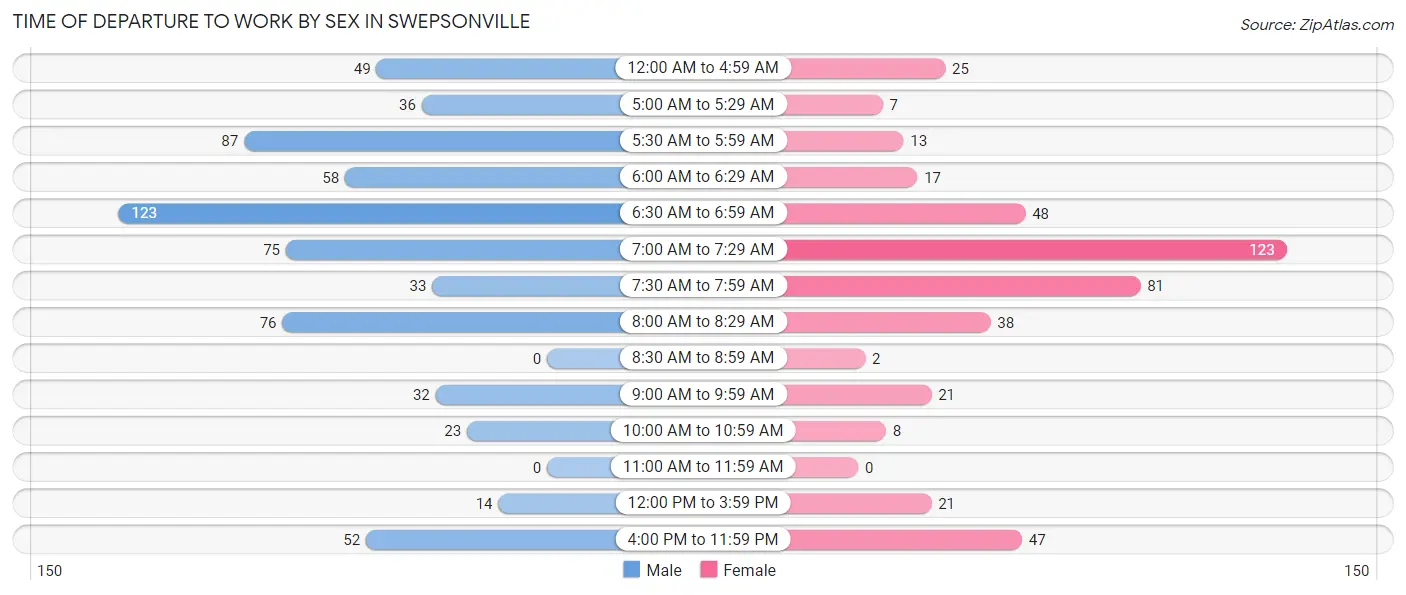
| Time of Departure | Male | Female |
| 12:00 AM to 4:59 AM | 49 (7.4%) | 25 (5.5%) |
| 5:00 AM to 5:29 AM | 36 (5.5%) | 7 (1.5%) |
| 5:30 AM to 5:59 AM | 87 (13.2%) | 13 (2.9%) |
| 6:00 AM to 6:29 AM | 58 (8.8%) | 17 (3.8%) |
| 6:30 AM to 6:59 AM | 123 (18.7%) | 48 (10.6%) |
| 7:00 AM to 7:29 AM | 75 (11.4%) | 123 (27.3%) |
| 7:30 AM to 7:59 AM | 33 (5.0%) | 81 (18.0%) |
| 8:00 AM to 8:29 AM | 76 (11.6%) | 38 (8.4%) |
| 8:30 AM to 8:59 AM | 0 (0.0%) | 2 (0.4%) |
| 9:00 AM to 9:59 AM | 32 (4.9%) | 21 (4.7%) |
| 10:00 AM to 10:59 AM | 23 (3.5%) | 8 (1.8%) |
| 11:00 AM to 11:59 AM | 0 (0.0%) | 0 (0.0%) |
| 12:00 PM to 3:59 PM | 14 (2.1%) | 21 (4.7%) |
| 4:00 PM to 11:59 PM | 52 (7.9%) | 47 (10.4%) |
| Total | 658 (100.0%) | 451 (100.0%) |
Housing Occupancy in Swepsonville
Occupancy by Ownership in Swepsonville
Of the total 912 dwellings in Swepsonville, owner-occupied units account for 825 (90.5%), while renter-occupied units make up 87 (9.5%).
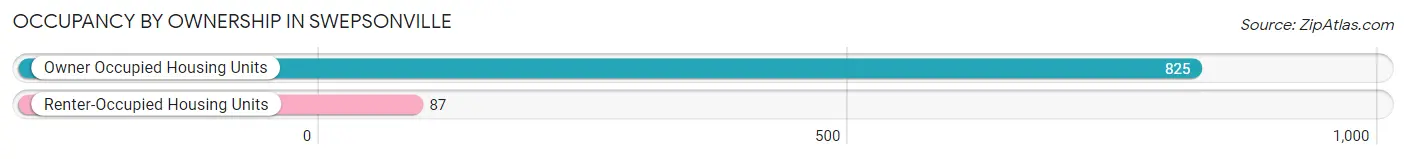
| Occupancy | # Housing Units | % Housing Units |
| Owner Occupied Housing Units | 825 | 90.5% |
| Renter-Occupied Housing Units | 87 | 9.5% |
| Total Occupied Housing Units | 912 | 100.0% |
Occupancy by Household Size in Swepsonville
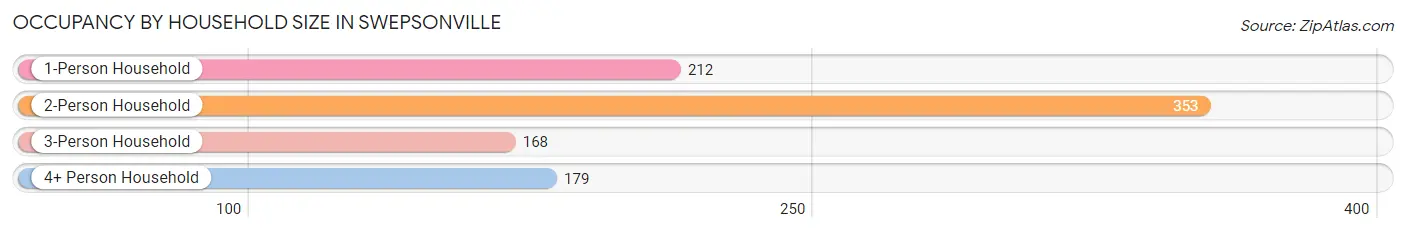
| Household Size | # Housing Units | % Housing Units |
| 1-Person Household | 212 | 23.3% |
| 2-Person Household | 353 | 38.7% |
| 3-Person Household | 168 | 18.4% |
| 4+ Person Household | 179 | 19.6% |
| Total Housing Units | 912 | 100.0% |
Occupancy by Ownership by Household Size in Swepsonville
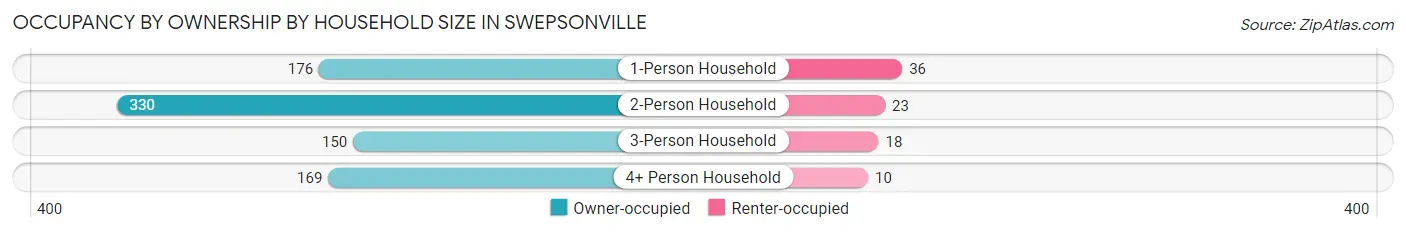
| Household Size | Owner-occupied | Renter-occupied |
| 1-Person Household | 176 (83.0%) | 36 (17.0%) |
| 2-Person Household | 330 (93.5%) | 23 (6.5%) |
| 3-Person Household | 150 (89.3%) | 18 (10.7%) |
| 4+ Person Household | 169 (94.4%) | 10 (5.6%) |
| Total Housing Units | 825 (90.5%) | 87 (9.5%) |
Occupancy by Educational Attainment in Swepsonville
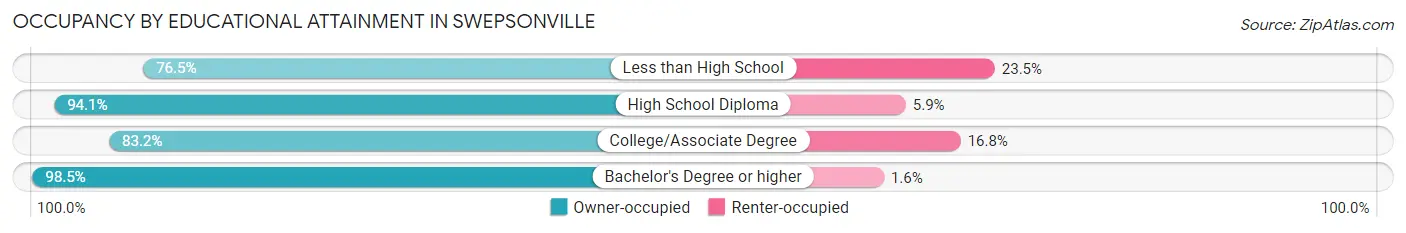
| Household Size | Owner-occupied | Renter-occupied |
| Less than High School | 39 (76.5%) | 12 (23.5%) |
| High School Diploma | 176 (94.1%) | 11 (5.9%) |
| College/Associate Degree | 293 (83.2%) | 59 (16.8%) |
| Bachelor's Degree or higher | 317 (98.5%) | 5 (1.5%) |
Occupancy by Age of Householder in Swepsonville
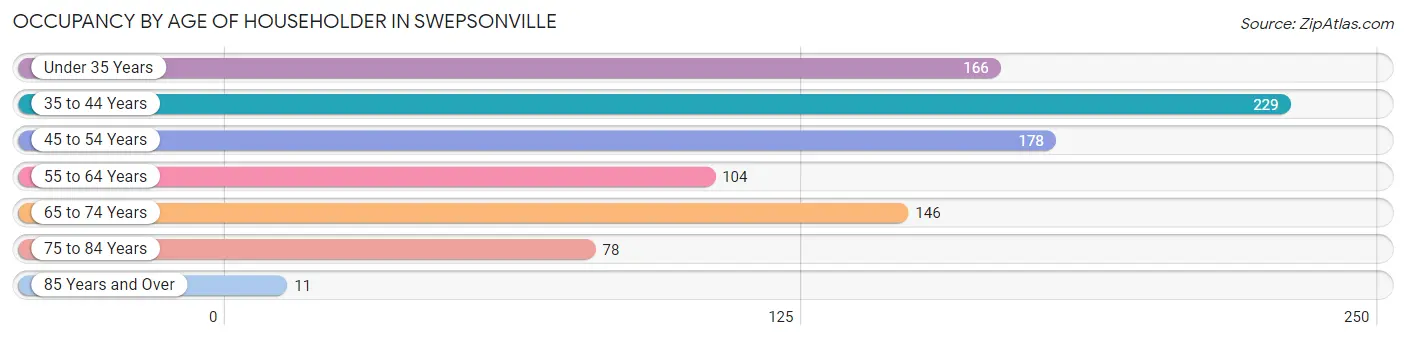
| Age Bracket | # Households | % Households |
| Under 35 Years | 166 | 18.2% |
| 35 to 44 Years | 229 | 25.1% |
| 45 to 54 Years | 178 | 19.5% |
| 55 to 64 Years | 104 | 11.4% |
| 65 to 74 Years | 146 | 16.0% |
| 75 to 84 Years | 78 | 8.6% |
| 85 Years and Over | 11 | 1.2% |
| Total | 912 | 100.0% |
Housing Finances in Swepsonville
Median Income by Occupancy in Swepsonville
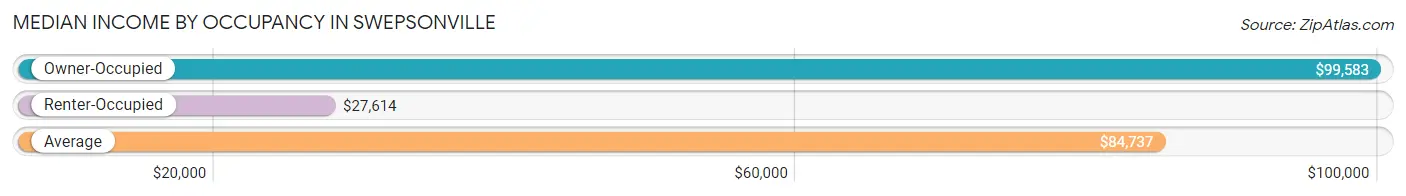
| Occupancy Type | # Households | Median Income |
| Owner-Occupied | 825 (90.5%) | $99,583 |
| Renter-Occupied | 87 (9.5%) | $27,614 |
| Average | 912 (100.0%) | $84,737 |
Occupancy by Householder Income Bracket in Swepsonville
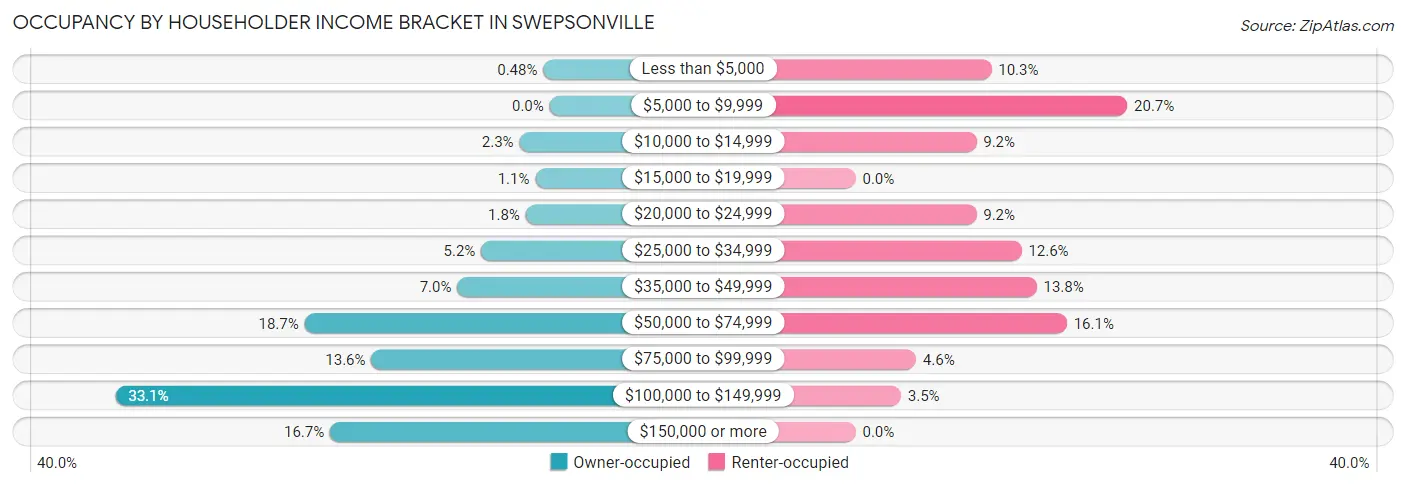
| Income Bracket | Owner-occupied | Renter-occupied |
| Less than $5,000 | 4 (0.5%) | 9 (10.3%) |
| $5,000 to $9,999 | 0 (0.0%) | 18 (20.7%) |
| $10,000 to $14,999 | 19 (2.3%) | 8 (9.2%) |
| $15,000 to $19,999 | 9 (1.1%) | 0 (0.0%) |
| $20,000 to $24,999 | 15 (1.8%) | 8 (9.2%) |
| $25,000 to $34,999 | 43 (5.2%) | 11 (12.6%) |
| $35,000 to $49,999 | 58 (7.0%) | 12 (13.8%) |
| $50,000 to $74,999 | 154 (18.7%) | 14 (16.1%) |
| $75,000 to $99,999 | 112 (13.6%) | 4 (4.6%) |
| $100,000 to $149,999 | 273 (33.1%) | 3 (3.5%) |
| $150,000 or more | 138 (16.7%) | 0 (0.0%) |
| Total | 825 (100.0%) | 87 (100.0%) |
Monthly Housing Cost Tiers in Swepsonville
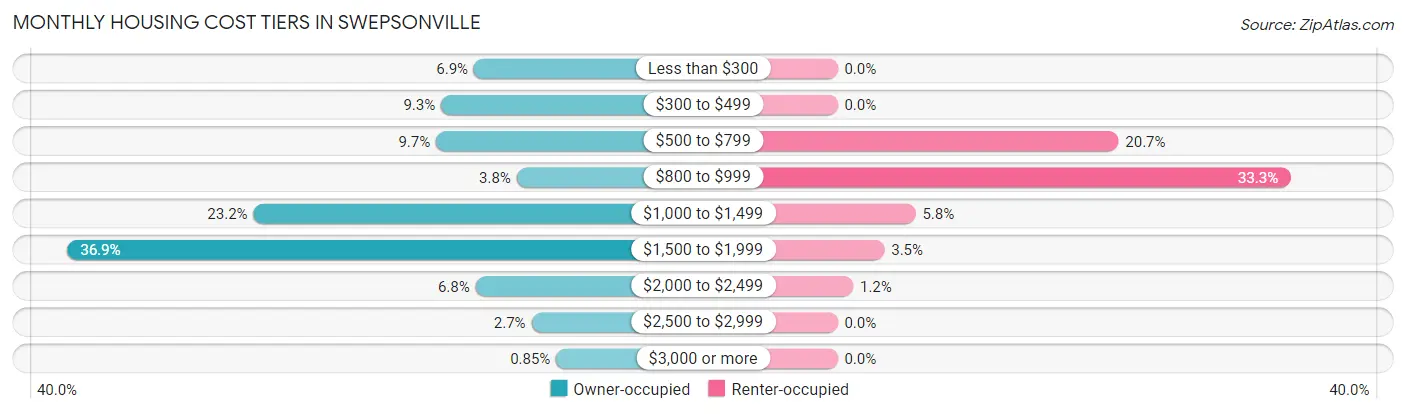
| Monthly Cost | Owner-occupied | Renter-occupied |
| Less than $300 | 57 (6.9%) | 0 (0.0%) |
| $300 to $499 | 77 (9.3%) | 0 (0.0%) |
| $500 to $799 | 80 (9.7%) | 18 (20.7%) |
| $800 to $999 | 31 (3.8%) | 29 (33.3%) |
| $1,000 to $1,499 | 191 (23.2%) | 5 (5.8%) |
| $1,500 to $1,999 | 304 (36.8%) | 3 (3.5%) |
| $2,000 to $2,499 | 56 (6.8%) | 1 (1.1%) |
| $2,500 to $2,999 | 22 (2.7%) | 0 (0.0%) |
| $3,000 or more | 7 (0.9%) | 0 (0.0%) |
| Total | 825 (100.0%) | 87 (100.0%) |
Physical Housing Characteristics in Swepsonville
Housing Structures in Swepsonville
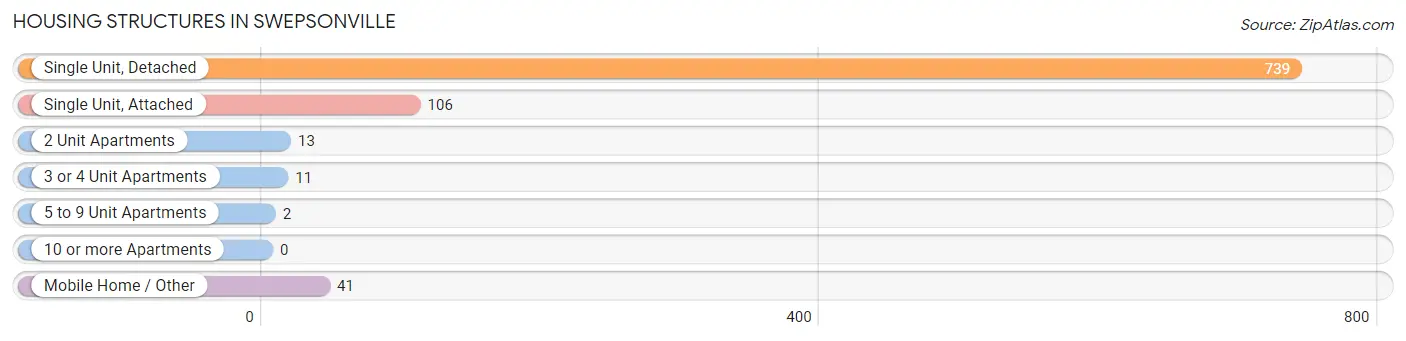
| Structure Type | # Housing Units | % Housing Units |
| Single Unit, Detached | 739 | 81.0% |
| Single Unit, Attached | 106 | 11.6% |
| 2 Unit Apartments | 13 | 1.4% |
| 3 or 4 Unit Apartments | 11 | 1.2% |
| 5 to 9 Unit Apartments | 2 | 0.2% |
| 10 or more Apartments | 0 | 0.0% |
| Mobile Home / Other | 41 | 4.5% |
| Total | 912 | 100.0% |
Housing Structures by Occupancy in Swepsonville
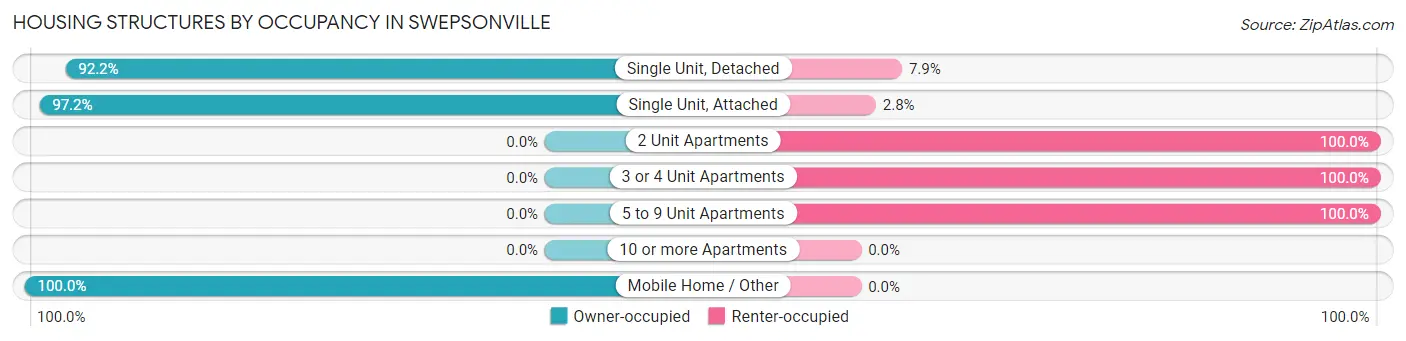
| Structure Type | Owner-occupied | Renter-occupied |
| Single Unit, Detached | 681 (92.1%) | 58 (7.9%) |
| Single Unit, Attached | 103 (97.2%) | 3 (2.8%) |
| 2 Unit Apartments | 0 (0.0%) | 13 (100.0%) |
| 3 or 4 Unit Apartments | 0 (0.0%) | 11 (100.0%) |
| 5 to 9 Unit Apartments | 0 (0.0%) | 2 (100.0%) |
| 10 or more Apartments | 0 (0.0%) | 0 (0.0%) |
| Mobile Home / Other | 41 (100.0%) | 0 (0.0%) |
| Total | 825 (90.5%) | 87 (9.5%) |
Housing Structures by Number of Rooms in Swepsonville
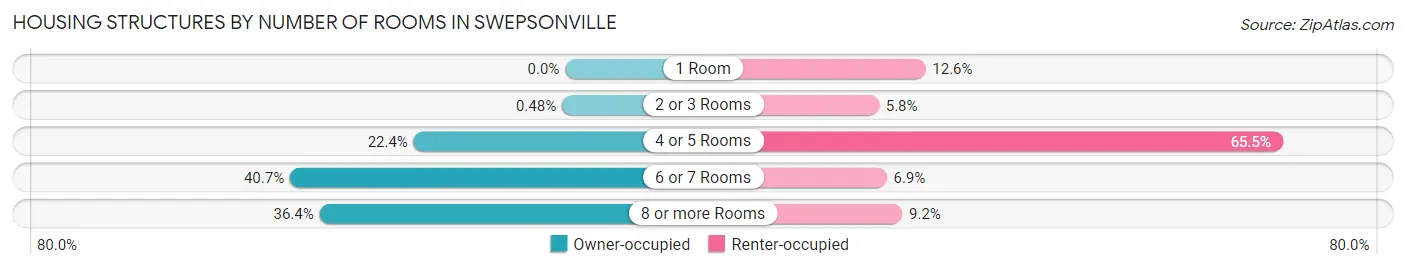
| Number of Rooms | Owner-occupied | Renter-occupied |
| 1 Room | 0 (0.0%) | 11 (12.6%) |
| 2 or 3 Rooms | 4 (0.5%) | 5 (5.8%) |
| 4 or 5 Rooms | 185 (22.4%) | 57 (65.5%) |
| 6 or 7 Rooms | 336 (40.7%) | 6 (6.9%) |
| 8 or more Rooms | 300 (36.4%) | 8 (9.2%) |
| Total | 825 (100.0%) | 87 (100.0%) |
Housing Structure by Heating Type in Swepsonville
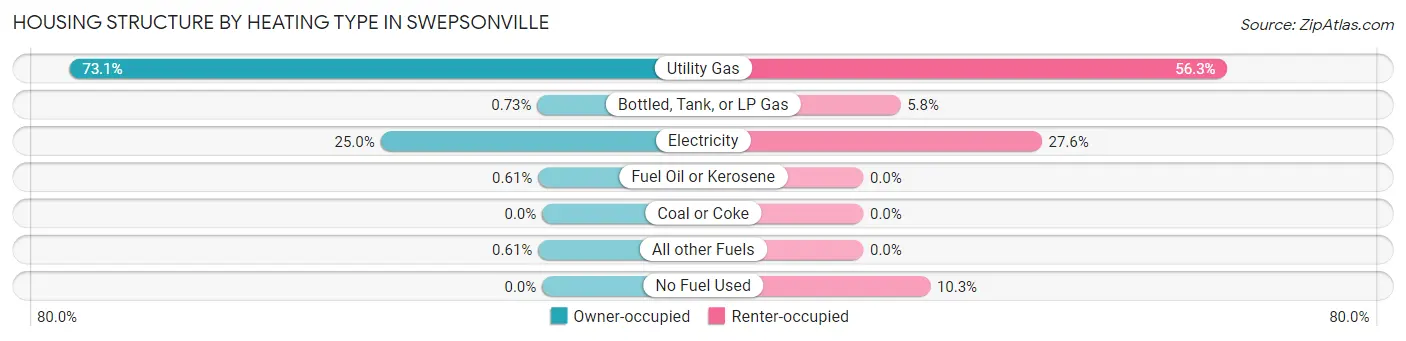
| Heating Type | Owner-occupied | Renter-occupied |
| Utility Gas | 603 (73.1%) | 49 (56.3%) |
| Bottled, Tank, or LP Gas | 6 (0.7%) | 5 (5.8%) |
| Electricity | 206 (25.0%) | 24 (27.6%) |
| Fuel Oil or Kerosene | 5 (0.6%) | 0 (0.0%) |
| Coal or Coke | 0 (0.0%) | 0 (0.0%) |
| All other Fuels | 5 (0.6%) | 0 (0.0%) |
| No Fuel Used | 0 (0.0%) | 9 (10.3%) |
| Total | 825 (100.0%) | 87 (100.0%) |
Household Vehicle Usage in Swepsonville
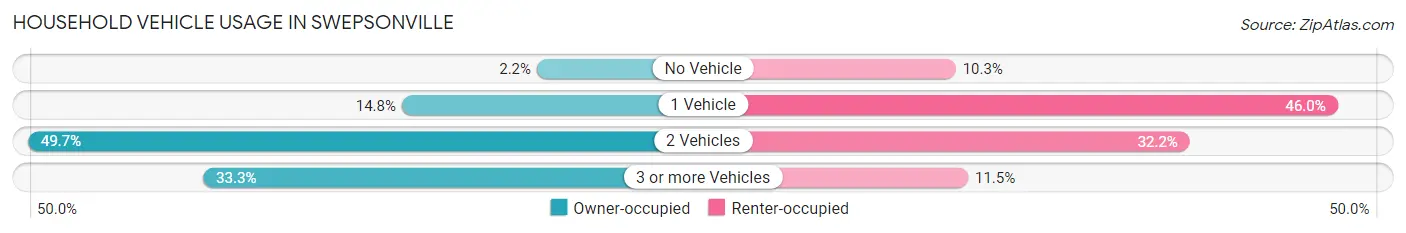
| Vehicles per Household | Owner-occupied | Renter-occupied |
| No Vehicle | 18 (2.2%) | 9 (10.3%) |
| 1 Vehicle | 122 (14.8%) | 40 (46.0%) |
| 2 Vehicles | 410 (49.7%) | 28 (32.2%) |
| 3 or more Vehicles | 275 (33.3%) | 10 (11.5%) |
| Total | 825 (100.0%) | 87 (100.0%) |
Real Estate & Mortgages in Swepsonville
Real Estate and Mortgage Overview in Swepsonville
| Characteristic | Without Mortgage | With Mortgage |
| Housing Units | 187 | 638 |
| Median Property Value | $205,000 | $271,700 |
| Median Household Income | $58,125 | $127 |
| Monthly Housing Costs | $413 | $7 |
| Real Estate Taxes | $1,250 | $5 |
Property Value by Mortgage Status in Swepsonville
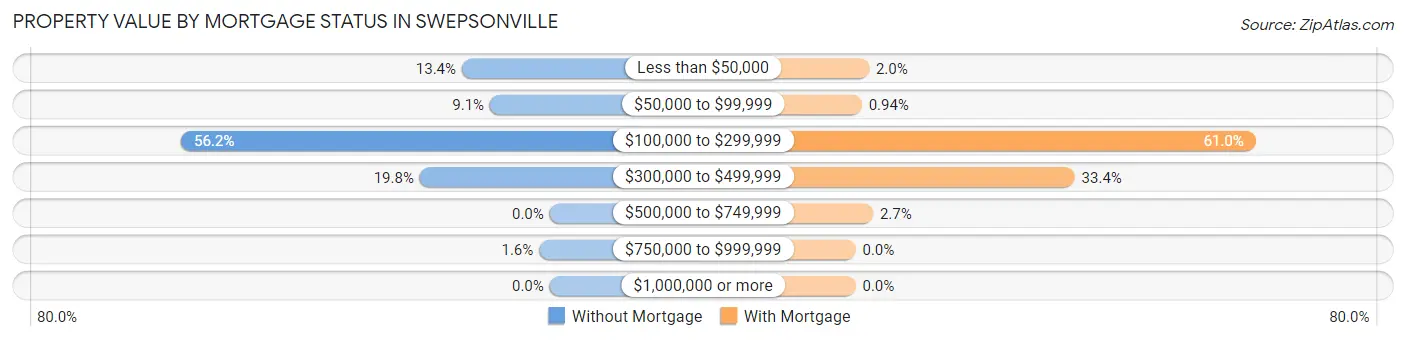
| Property Value | Without Mortgage | With Mortgage |
| Less than $50,000 | 25 (13.4%) | 13 (2.0%) |
| $50,000 to $99,999 | 17 (9.1%) | 6 (0.9%) |
| $100,000 to $299,999 | 105 (56.1%) | 389 (61.0%) |
| $300,000 to $499,999 | 37 (19.8%) | 213 (33.4%) |
| $500,000 to $749,999 | 0 (0.0%) | 17 (2.7%) |
| $750,000 to $999,999 | 3 (1.6%) | 0 (0.0%) |
| $1,000,000 or more | 0 (0.0%) | 0 (0.0%) |
| Total | 187 (100.0%) | 638 (100.0%) |
Household Income by Mortgage Status in Swepsonville
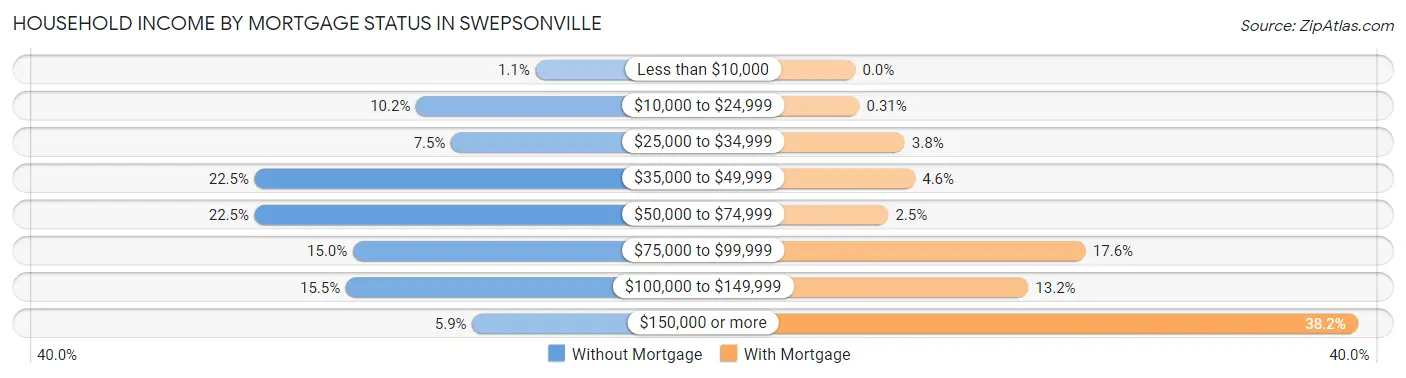
| Household Income | Without Mortgage | With Mortgage |
| Less than $10,000 | 2 (1.1%) | 0 (0.0%) |
| $10,000 to $24,999 | 19 (10.2%) | 2 (0.3%) |
| $25,000 to $34,999 | 14 (7.5%) | 24 (3.8%) |
| $35,000 to $49,999 | 42 (22.5%) | 29 (4.5%) |
| $50,000 to $74,999 | 42 (22.5%) | 16 (2.5%) |
| $75,000 to $99,999 | 28 (15.0%) | 112 (17.5%) |
| $100,000 to $149,999 | 29 (15.5%) | 84 (13.2%) |
| $150,000 or more | 11 (5.9%) | 244 (38.2%) |
| Total | 187 (100.0%) | 638 (100.0%) |
Property Value to Household Income Ratio in Swepsonville
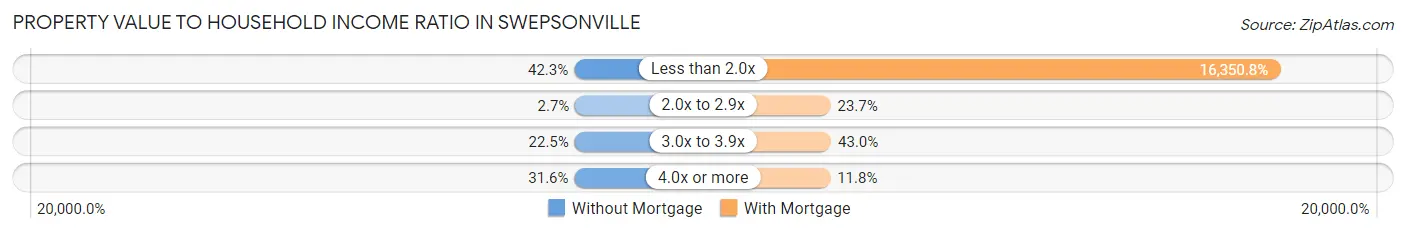
| Value-to-Income Ratio | Without Mortgage | With Mortgage |
| Less than 2.0x | 79 (42.2%) | 104,318 (16,350.8%) |
| 2.0x to 2.9x | 5 (2.7%) | 151 (23.7%) |
| 3.0x to 3.9x | 42 (22.5%) | 274 (42.9%) |
| 4.0x or more | 59 (31.6%) | 75 (11.8%) |
| Total | 187 (100.0%) | 638 (100.0%) |
Real Estate Taxes by Mortgage Status in Swepsonville
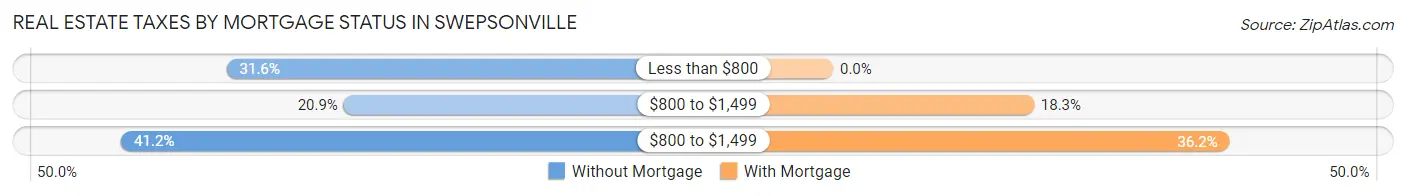
| Property Taxes | Without Mortgage | With Mortgage |
| Less than $800 | 59 (31.6%) | 0 (0.0%) |
| $800 to $1,499 | 39 (20.9%) | 117 (18.3%) |
| $800 to $1,499 | 77 (41.2%) | 231 (36.2%) |
| Total | 187 (100.0%) | 638 (100.0%) |
Health & Disability in Swepsonville
Health Insurance Coverage by Age in Swepsonville
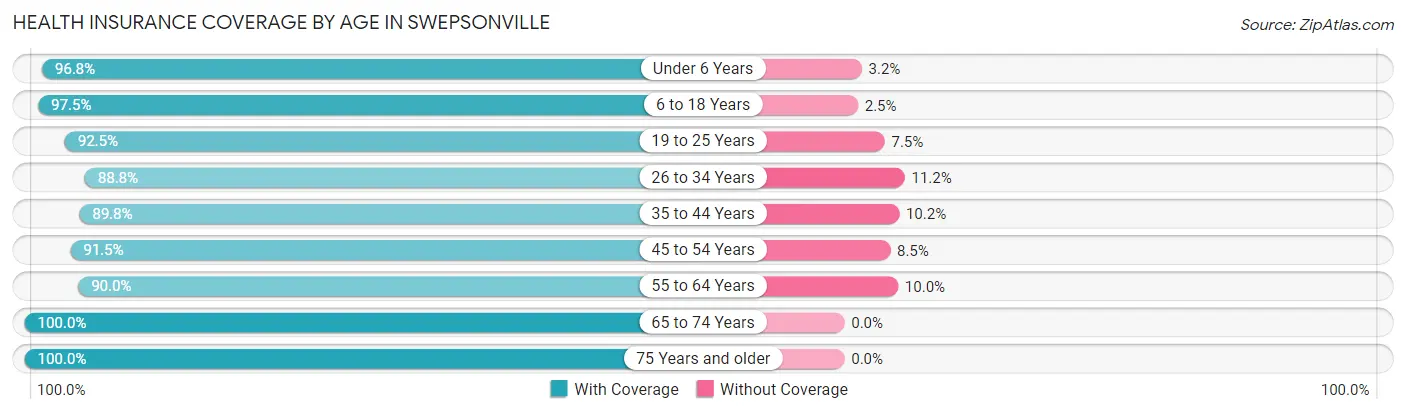
| Age Bracket | With Coverage | Without Coverage |
| Under 6 Years | 301 (96.8%) | 10 (3.2%) |
| 6 to 18 Years | 271 (97.5%) | 7 (2.5%) |
| 19 to 25 Years | 234 (92.5%) | 19 (7.5%) |
| 26 to 34 Years | 237 (88.8%) | 30 (11.2%) |
| 35 to 44 Years | 449 (89.8%) | 51 (10.2%) |
| 45 to 54 Years | 268 (91.5%) | 25 (8.5%) |
| 55 to 64 Years | 162 (90.0%) | 18 (10.0%) |
| 65 to 74 Years | 245 (100.0%) | 0 (0.0%) |
| 75 Years and older | 133 (100.0%) | 0 (0.0%) |
| Total | 2,300 (93.5%) | 160 (6.5%) |
Health Insurance Coverage by Citizenship Status in Swepsonville
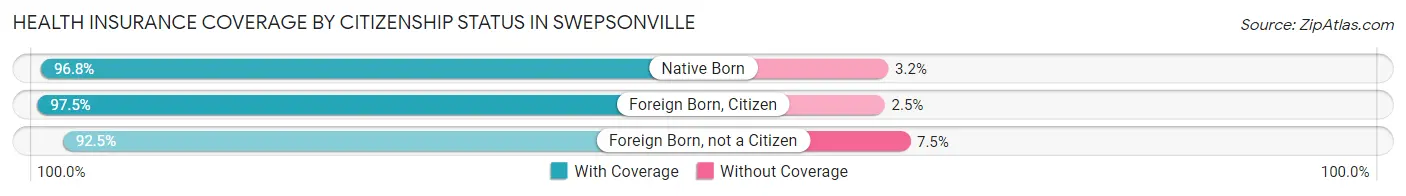
| Citizenship Status | With Coverage | Without Coverage |
| Native Born | 301 (96.8%) | 10 (3.2%) |
| Foreign Born, Citizen | 271 (97.5%) | 7 (2.5%) |
| Foreign Born, not a Citizen | 234 (92.5%) | 19 (7.5%) |
Health Insurance Coverage by Household Income in Swepsonville
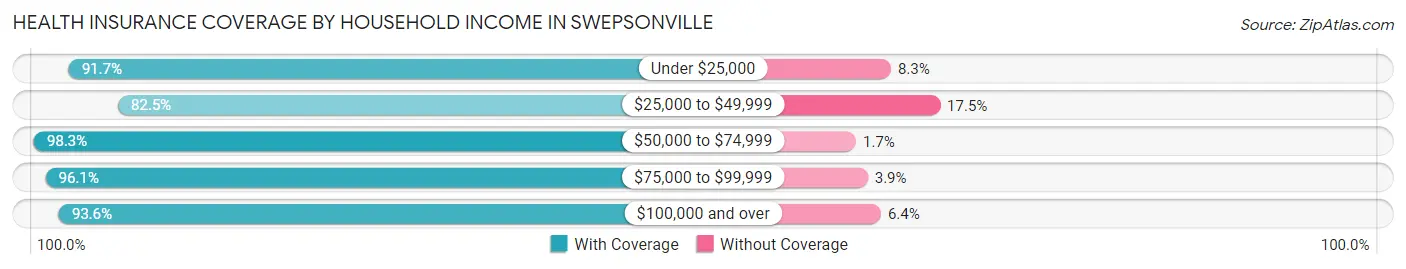
| Household Income | With Coverage | Without Coverage |
| Under $25,000 | 122 (91.7%) | 11 (8.3%) |
| $25,000 to $49,999 | 184 (82.5%) | 39 (17.5%) |
| $50,000 to $74,999 | 339 (98.3%) | 6 (1.7%) |
| $75,000 to $99,999 | 342 (96.1%) | 14 (3.9%) |
| $100,000 and over | 1,313 (93.6%) | 90 (6.4%) |
Public vs Private Health Insurance Coverage by Age in Swepsonville
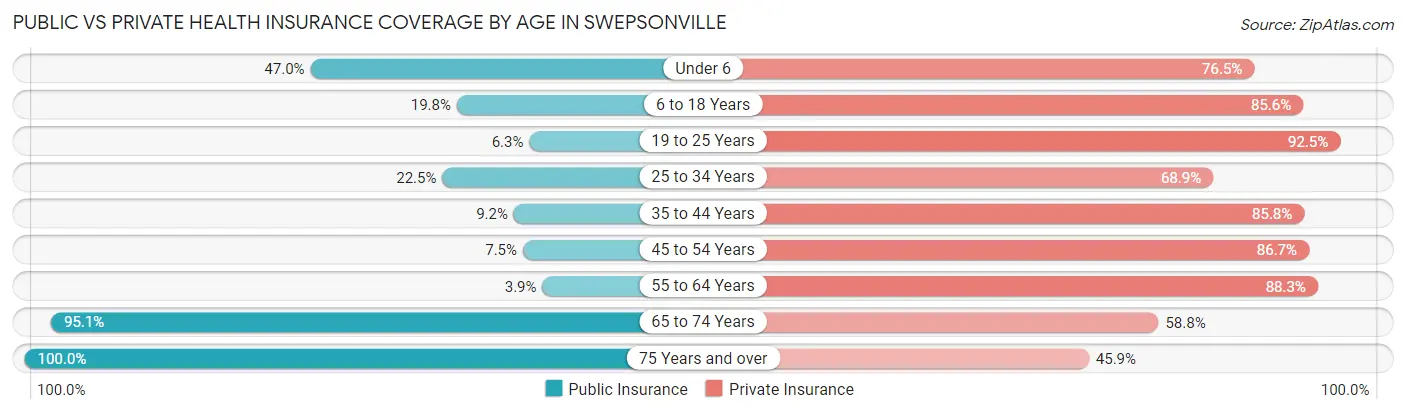
| Age Bracket | Public Insurance | Private Insurance |
| Under 6 | 146 (46.9%) | 238 (76.5%) |
| 6 to 18 Years | 55 (19.8%) | 238 (85.6%) |
| 19 to 25 Years | 16 (6.3%) | 234 (92.5%) |
| 25 to 34 Years | 60 (22.5%) | 184 (68.9%) |
| 35 to 44 Years | 46 (9.2%) | 429 (85.8%) |
| 45 to 54 Years | 22 (7.5%) | 254 (86.7%) |
| 55 to 64 Years | 7 (3.9%) | 159 (88.3%) |
| 65 to 74 Years | 233 (95.1%) | 144 (58.8%) |
| 75 Years and over | 133 (100.0%) | 61 (45.9%) |
| Total | 718 (29.2%) | 1,941 (78.9%) |
Disability Status by Sex by Age in Swepsonville
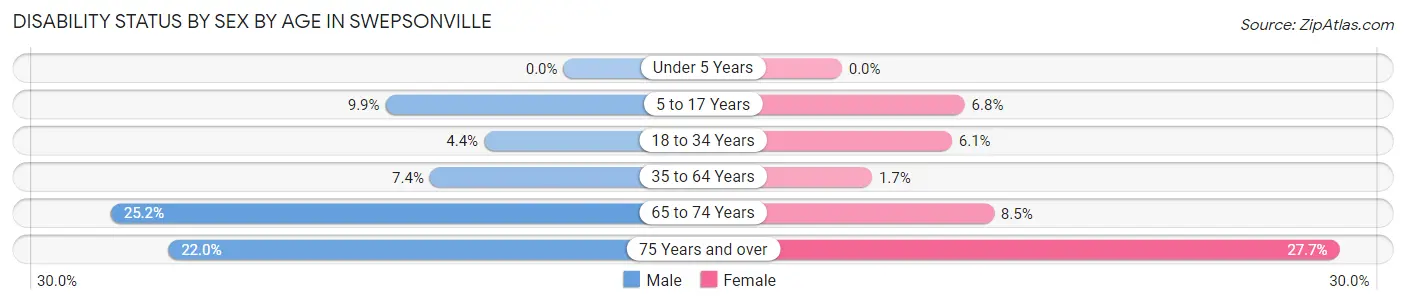
| Age Bracket | Male | Female |
| Under 5 Years | 0 (0.0%) | 0 (0.0%) |
| 5 to 17 Years | 11 (9.9%) | 16 (6.8%) |
| 18 to 34 Years | 14 (4.4%) | 13 (6.1%) |
| 35 to 64 Years | 37 (7.4%) | 8 (1.7%) |
| 65 to 74 Years | 32 (25.2%) | 10 (8.5%) |
| 75 Years and over | 11 (22.0%) | 23 (27.7%) |
Disability Class by Sex by Age in Swepsonville
Disability Class: Hearing Difficulty
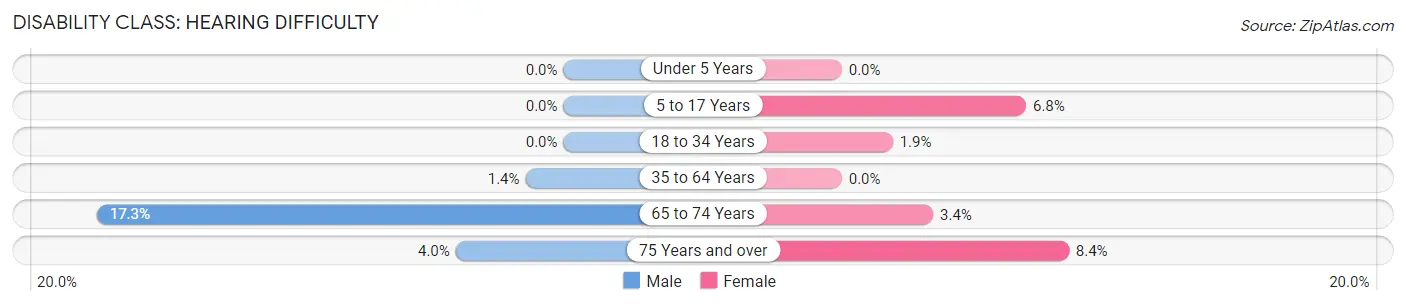
| Age Bracket | Male | Female |
| Under 5 Years | 0 (0.0%) | 0 (0.0%) |
| 5 to 17 Years | 0 (0.0%) | 16 (6.8%) |
| 18 to 34 Years | 0 (0.0%) | 4 (1.9%) |
| 35 to 64 Years | 7 (1.4%) | 0 (0.0%) |
| 65 to 74 Years | 22 (17.3%) | 4 (3.4%) |
| 75 Years and over | 2 (4.0%) | 7 (8.4%) |
Disability Class: Vision Difficulty
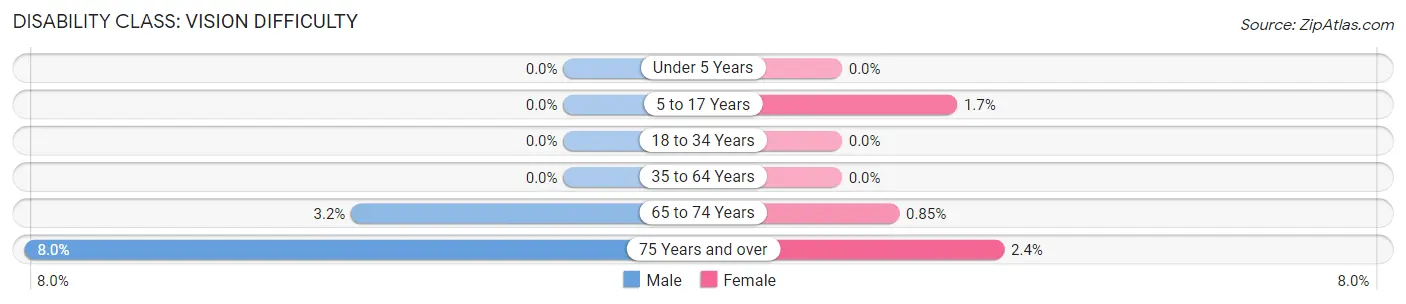
| Age Bracket | Male | Female |
| Under 5 Years | 0 (0.0%) | 0 (0.0%) |
| 5 to 17 Years | 0 (0.0%) | 4 (1.7%) |
| 18 to 34 Years | 0 (0.0%) | 0 (0.0%) |
| 35 to 64 Years | 0 (0.0%) | 0 (0.0%) |
| 65 to 74 Years | 4 (3.2%) | 1 (0.9%) |
| 75 Years and over | 4 (8.0%) | 2 (2.4%) |
Disability Class: Cognitive Difficulty
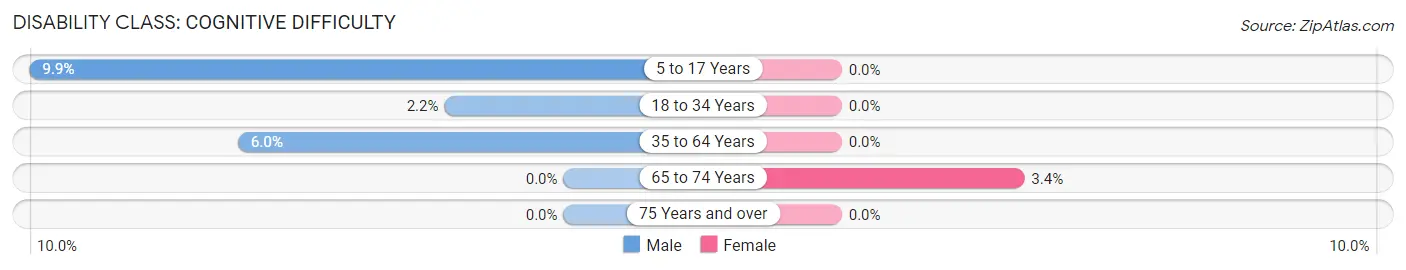
| Age Bracket | Male | Female |
| 5 to 17 Years | 11 (9.9%) | 0 (0.0%) |
| 18 to 34 Years | 7 (2.2%) | 0 (0.0%) |
| 35 to 64 Years | 30 (6.0%) | 0 (0.0%) |
| 65 to 74 Years | 0 (0.0%) | 4 (3.4%) |
| 75 Years and over | 0 (0.0%) | 0 (0.0%) |
Disability Class: Ambulatory Difficulty
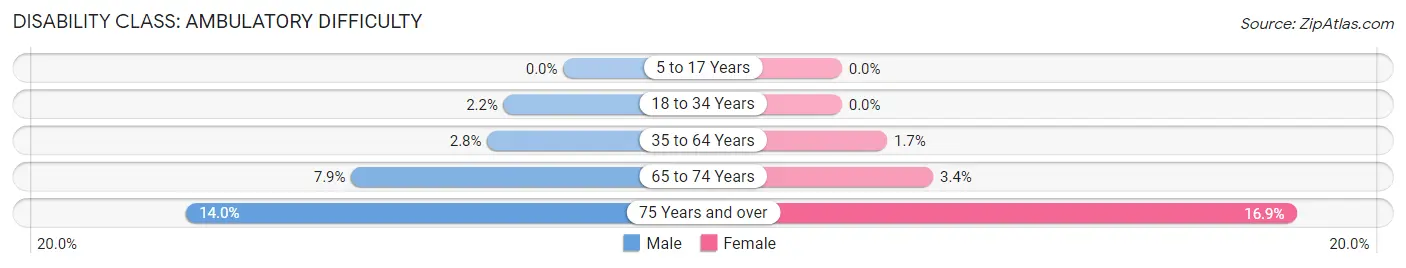
| Age Bracket | Male | Female |
| 5 to 17 Years | 0 (0.0%) | 0 (0.0%) |
| 18 to 34 Years | 7 (2.2%) | 0 (0.0%) |
| 35 to 64 Years | 14 (2.8%) | 8 (1.7%) |
| 65 to 74 Years | 10 (7.9%) | 4 (3.4%) |
| 75 Years and over | 7 (14.0%) | 14 (16.9%) |
Disability Class: Self-Care Difficulty
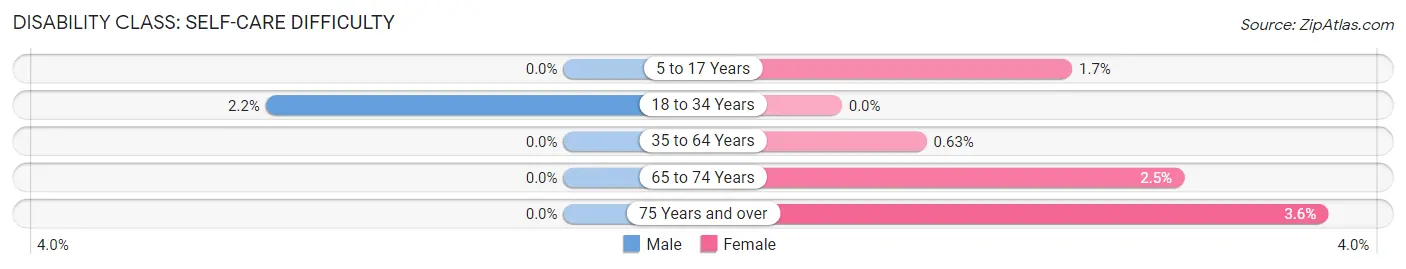
| Age Bracket | Male | Female |
| 5 to 17 Years | 0 (0.0%) | 4 (1.7%) |
| 18 to 34 Years | 7 (2.2%) | 0 (0.0%) |
| 35 to 64 Years | 0 (0.0%) | 3 (0.6%) |
| 65 to 74 Years | 0 (0.0%) | 3 (2.5%) |
| 75 Years and over | 0 (0.0%) | 3 (3.6%) |
Technology Access in Swepsonville
Computing Device Access in Swepsonville
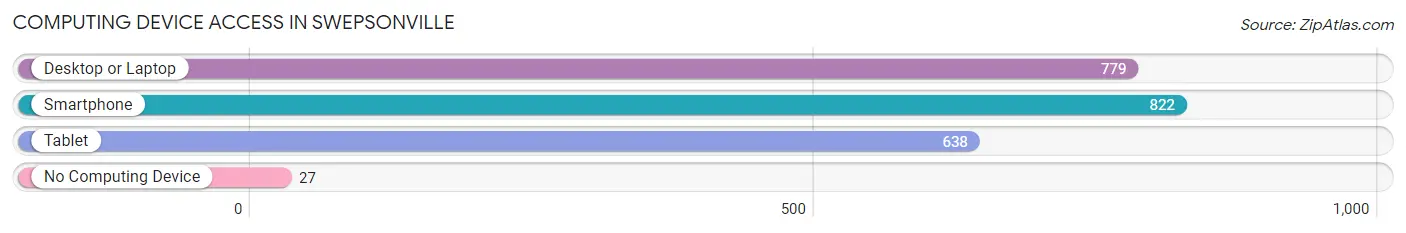
| Device Type | # Households | % Households |
| Desktop or Laptop | 779 | 85.4% |
| Smartphone | 822 | 90.1% |
| Tablet | 638 | 70.0% |
| No Computing Device | 27 | 3.0% |
| Total | 912 | 100.0% |
Internet Access in Swepsonville
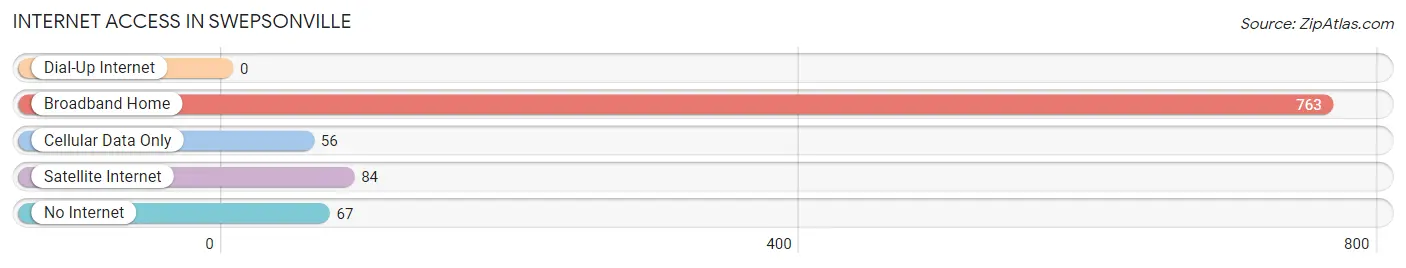
| Internet Type | # Households | % Households |
| Dial-Up Internet | 0 | 0.0% |
| Broadband Home | 763 | 83.7% |
| Cellular Data Only | 56 | 6.1% |
| Satellite Internet | 84 | 9.2% |
| No Internet | 67 | 7.3% |
| Total | 912 | 100.0% |
Swepsonville Summary
Sweepsonville is a small town located in Alamance County, North Carolina. It is situated in the Piedmont region of the state, approximately 25 miles east of Greensboro. The town was founded in 1845 and is named after the Sweeps family, who were among the first settlers in the area.
Geography
Sweepsonville is located in the Piedmont region of North Carolina, which is characterized by rolling hills and valleys. The town is situated on the banks of the Haw River, which flows through the area. The town is located at an elevation of approximately 500 feet above sea level. The climate in the area is generally mild, with temperatures ranging from the mid-50s in the winter to the mid-80s in the summer.
The town is located in the heart of Alamance County, which is home to a number of small towns and cities. The nearest major city is Greensboro, which is located approximately 25 miles to the west. The nearest airport is the Piedmont Triad International Airport, which is located approximately 40 miles to the west.
Demographics
As of the 2010 census, Sweepsonville had a population of 1,845. The racial makeup of the town was 87.3% White, 8.2% African American, 0.7% Native American, 0.4% Asian, 0.1% Pacific Islander, and 2.3% from other races. Hispanic or Latino of any race were 3.2% of the population.
The median household income in Sweepsonville was $37,917, and the median family income was $45,938. The per capita income for the town was $19,845. About 11.3% of families and 14.2% of the population were below the poverty line, including 18.2% of those under age 18 and 8.3% of those age 65 or over.
Economy
Sweepsonville is a small, rural town with a largely agricultural economy. The town is home to a number of small businesses, including a grocery store, a hardware store, and a few restaurants. The town is also home to a number of small manufacturing companies, including a furniture manufacturer and a textile mill.
The town is also home to a number of farms, which produce a variety of crops, including corn, soybeans, and tobacco. The town is also home to a number of wineries, which produce a variety of wines.
Conclusion
Sweepsonville is a small, rural town located in Alamance County, North Carolina. The town is situated in the Piedmont region of the state, and is home to a population of approximately 1,845 people. The town has a largely agricultural economy, with a number of small businesses and manufacturing companies. The town is also home to a number of farms and wineries, which produce a variety of crops and wines.
Common Questions
What is Per Capita Income in Swepsonville?
Per Capita income in Swepsonville is $36,625.
What is the Median Family Income in Swepsonville?
Median Family Income in Swepsonville is $103,523.
What is the Median Household income in Swepsonville?
Median Household Income in Swepsonville is $84,737.
What is Income or Wage Gap in Swepsonville?
Income or Wage Gap in Swepsonville is 9.0%.
Women in Swepsonville earn 91.0 cents for every dollar earned by a man.
What is Inequality or Gini Index in Swepsonville?
Inequality or Gini Index in Swepsonville is 0.35.
What is the Total Population of Swepsonville?
Total Population of Swepsonville is 2,464.
What is the Total Male Population of Swepsonville?
Total Male Population of Swepsonville is 1,256.
What is the Total Female Population of Swepsonville?
Total Female Population of Swepsonville is 1,208.
What is the Ratio of Males per 100 Females in Swepsonville?
There are 103.97 Males per 100 Females in Swepsonville.
What is the Ratio of Females per 100 Males in Swepsonville?
There are 96.18 Females per 100 Males in Swepsonville.
What is the Median Population Age in Swepsonville?
Median Population Age in Swepsonville is 36.4 Years.
What is the Average Family Size in Swepsonville
Average Family Size in Swepsonville is 3.2 People.
What is the Average Household Size in Swepsonville
Average Household Size in Swepsonville is 2.7 People.
How Large is the Labor Force in Swepsonville?
There are 1,330 People in the Labor Forcein in Swepsonville.
What is the Percentage of People in the Labor Force in Swepsonville?
69.0% of People are in the Labor Force in Swepsonville.
What is the Unemployment Rate in Swepsonville?
Unemployment Rate in Swepsonville is 4.4%.