Bethel, MN Map & Demographics
Bethel Map
Bethel Overview
$39,335
PER CAPITA INCOME
$106,500
AVG FAMILY INCOME
$98,333
AVG HOUSEHOLD INCOME
30.6%
WAGE / INCOME GAP [ % ]
69.4¢/ $1
WAGE / INCOME GAP [ $ ]
0.24
INEQUALITY / GINI INDEX
470
TOTAL POPULATION
256
MALE POPULATION
214
FEMALE POPULATION
119.63
MALES / 100 FEMALES
83.59
FEMALES / 100 MALES
41.4
MEDIAN AGE
2.9
AVG FAMILY SIZE
2.6
AVG HOUSEHOLD SIZE
299
LABOR FORCE [ PEOPLE ]
74.9%
PERCENT IN LABOR FORCE
5.0%
UNEMPLOYMENT RATE
Bethel Zip Codes
Income in Bethel
Income Overview in Bethel
Per Capita Income in Bethel is $39,335, while median incomes of families and households are $106,500 and $98,333 respectively.
| Characteristic | Number | Measure |
| Per Capita Income | 470 | $39,335 |
| Median Family Income | 122 | $106,500 |
| Mean Family Income | 122 | $99,928 |
| Median Household Income | 182 | $98,333 |
| Mean Household Income | 182 | $98,914 |
| Income Deficit | 122 | $0 |
| Wage / Income Gap (%) | 470 | 30.58% |
| Wage / Income Gap ($) | 470 | 69.42¢ per $1 |
| Gini / Inequality Index | 470 | 0.24 |
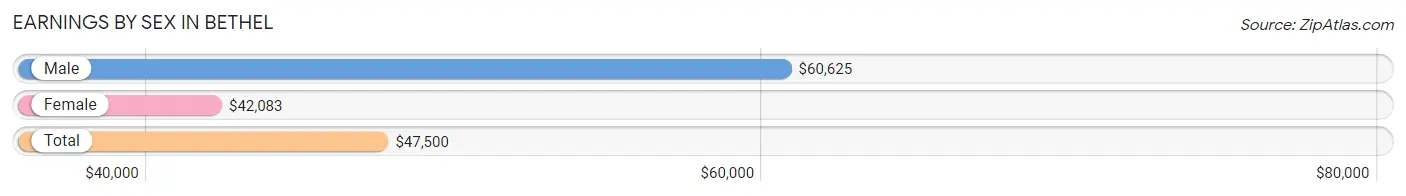
Earnings by Sex in Bethel
Average Earnings in Bethel are $47,500, $60,625 for men and $42,083 for women, a difference of 30.6%.
| Sex | Number | Average Earnings |
| Male | 186 (60.8%) | $60,625 |
| Female | 120 (39.2%) | $42,083 |
| Total | 306 (100.0%) | $47,500 |
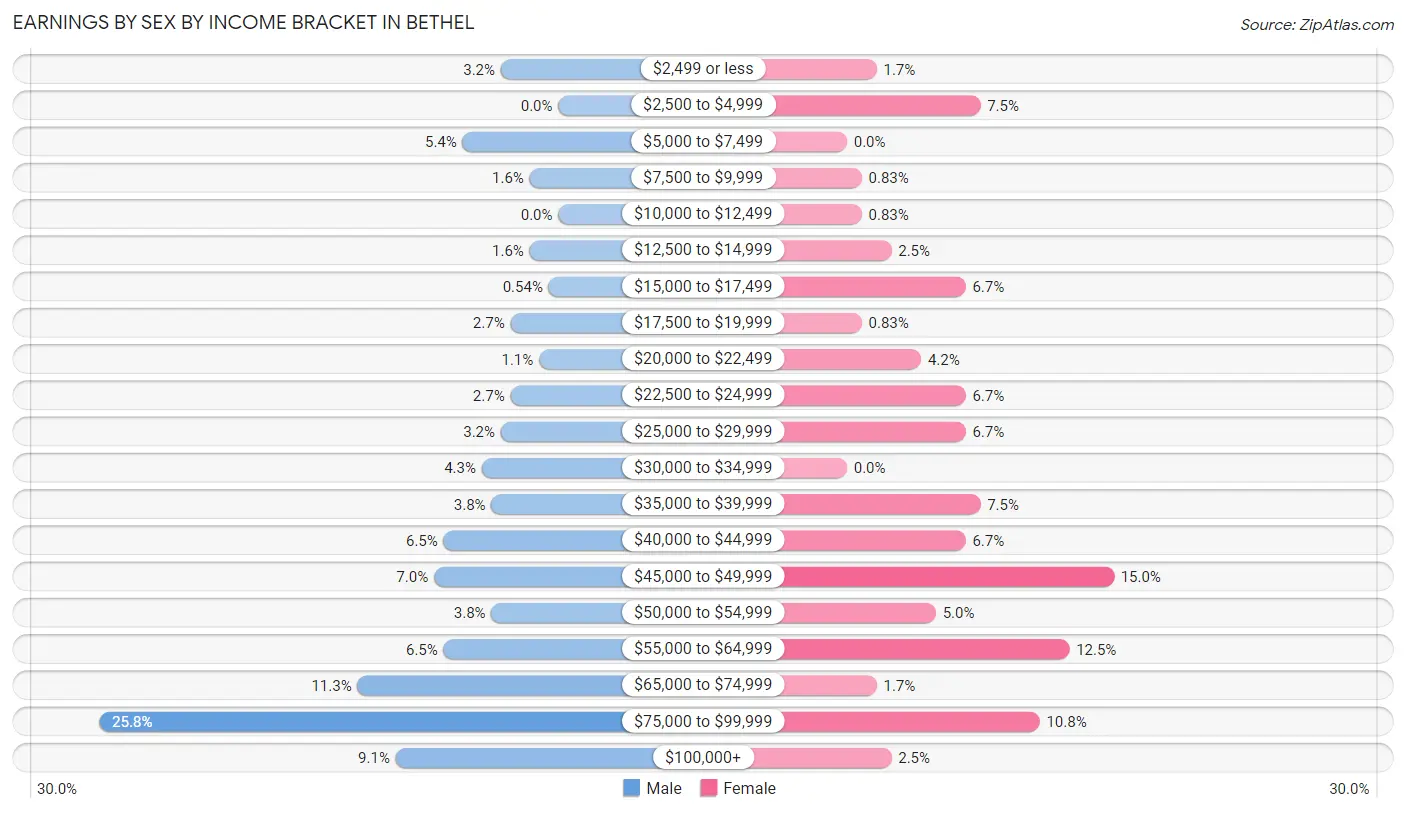
Earnings by Sex by Income Bracket in Bethel
The most common earnings brackets in Bethel are $75,000 to $99,999 for men (48 | 25.8%) and $45,000 to $49,999 for women (18 | 15.0%).
| Income | Male | Female |
| $2,499 or less | 6 (3.2%) | 2 (1.7%) |
| $2,500 to $4,999 | 0 (0.0%) | 9 (7.5%) |
| $5,000 to $7,499 | 10 (5.4%) | 0 (0.0%) |
| $7,500 to $9,999 | 3 (1.6%) | 1 (0.8%) |
| $10,000 to $12,499 | 0 (0.0%) | 1 (0.8%) |
| $12,500 to $14,999 | 3 (1.6%) | 3 (2.5%) |
| $15,000 to $17,499 | 1 (0.5%) | 8 (6.7%) |
| $17,500 to $19,999 | 5 (2.7%) | 1 (0.8%) |
| $20,000 to $22,499 | 2 (1.1%) | 5 (4.2%) |
| $22,500 to $24,999 | 5 (2.7%) | 8 (6.7%) |
| $25,000 to $29,999 | 6 (3.2%) | 8 (6.7%) |
| $30,000 to $34,999 | 8 (4.3%) | 0 (0.0%) |
| $35,000 to $39,999 | 7 (3.8%) | 9 (7.5%) |
| $40,000 to $44,999 | 12 (6.5%) | 8 (6.7%) |
| $45,000 to $49,999 | 13 (7.0%) | 18 (15.0%) |
| $50,000 to $54,999 | 7 (3.8%) | 6 (5.0%) |
| $55,000 to $64,999 | 12 (6.5%) | 15 (12.5%) |
| $65,000 to $74,999 | 21 (11.3%) | 2 (1.7%) |
| $75,000 to $99,999 | 48 (25.8%) | 13 (10.8%) |
| $100,000+ | 17 (9.1%) | 3 (2.5%) |
| Total | 186 (100.0%) | 120 (100.0%) |
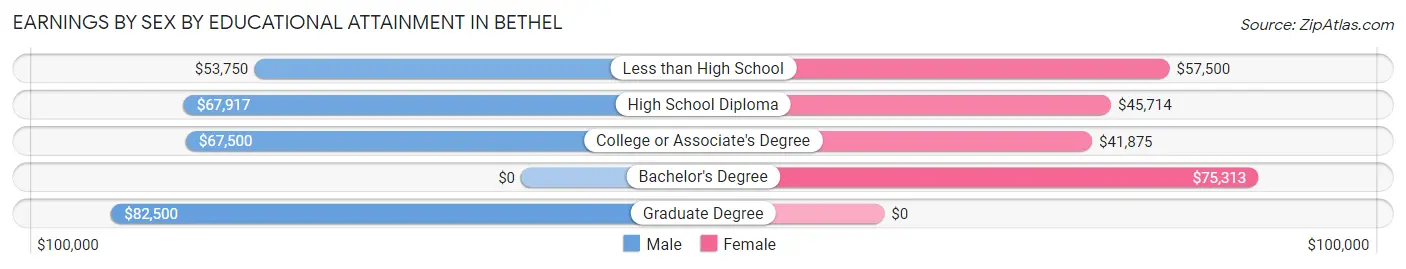
Earnings by Sex by Educational Attainment in Bethel
Average earnings in Bethel are $67,292 for men and $45,667 for women, a difference of 32.1%. Men with an educational attainment of graduate degree enjoy the highest average annual earnings of $82,500, while those with less than high school education earn the least with $53,750. Women with an educational attainment of bachelor's degree earn the most with the average annual earnings of $75,313, while those with college or associate's degree education have the smallest earnings of $41,875.
| Educational Attainment | Male Income | Female Income |
| Less than High School | $53,750 | $57,500 |
| High School Diploma | $67,917 | $45,714 |
| College or Associate's Degree | $67,500 | $41,875 |
| Bachelor's Degree | - | - |
| Graduate Degree | $82,500 | $0 |
| Total | $67,292 | $45,667 |
Family Income in Bethel
Family Income Brackets in Bethel
According to the Bethel family income data, there are 51 families falling into the $100,000 to $149,999 income range, which is the most common income bracket and makes up 41.8% of all families.
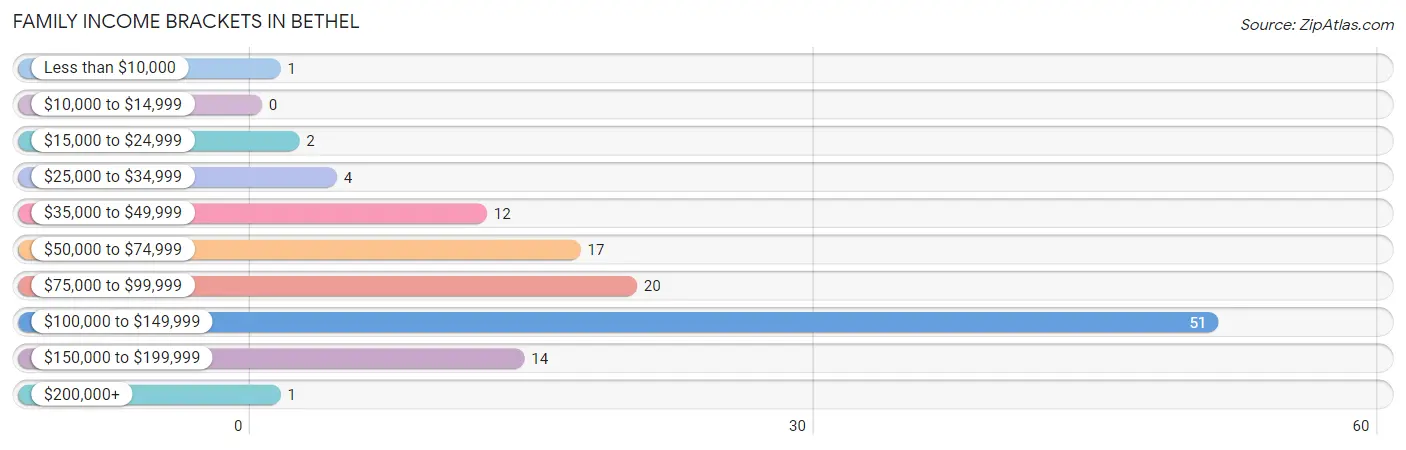
| Income Bracket | # Families | % Families |
| Less than $10,000 | 1 | 0.8% |
| $10,000 to $14,999 | 0 | 0.0% |
| $15,000 to $24,999 | 2 | 1.6% |
| $25,000 to $34,999 | 4 | 3.3% |
| $35,000 to $49,999 | 12 | 9.8% |
| $50,000 to $74,999 | 17 | 13.9% |
| $75,000 to $99,999 | 20 | 16.4% |
| $100,000 to $149,999 | 51 | 41.8% |
| $150,000 to $199,999 | 14 | 11.5% |
| $200,000+ | 1 | 0.8% |
Family Income by Famaliy Size in Bethel
5-person families (12 | 9.8%) account for the highest median family income in Bethel with $125,000 per family, while 2-person families (63 | 51.6%) have the highest median income of $52,656 per family member.
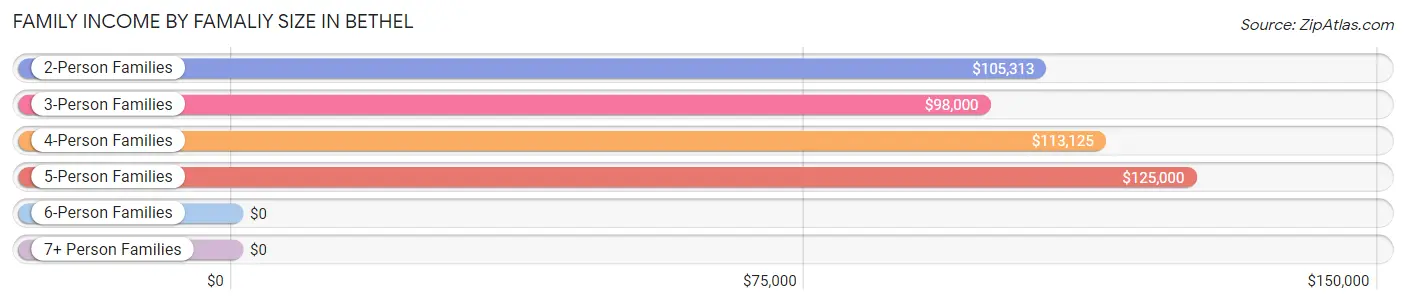
| Income Bracket | # Families | Median Income |
| 2-Person Families | 63 (51.6%) | $105,313 |
| 3-Person Families | 22 (18.0%) | $98,000 |
| 4-Person Families | 25 (20.5%) | $113,125 |
| 5-Person Families | 12 (9.8%) | $125,000 |
| 6-Person Families | 0 (0.0%) | $0 |
| 7+ Person Families | 0 (0.0%) | $0 |
| Total | 122 (100.0%) | $106,500 |
Family Income by Number of Earners in Bethel
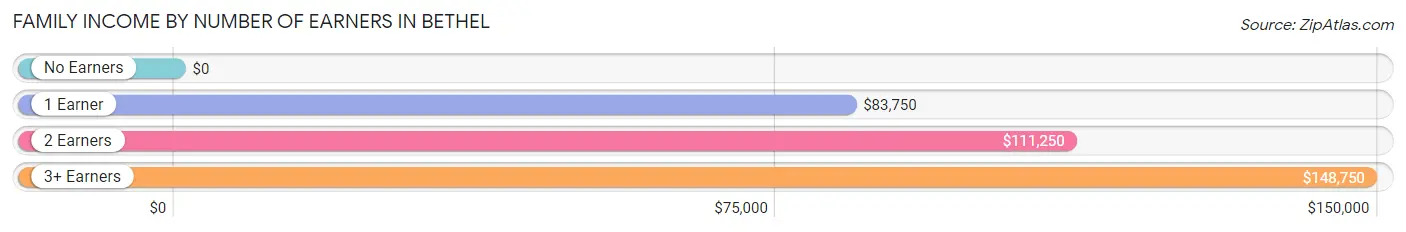
| Number of Earners | # Families | Median Income |
| No Earners | 6 (4.9%) | $0 |
| 1 Earner | 34 (27.9%) | $83,750 |
| 2 Earners | 74 (60.7%) | $111,250 |
| 3+ Earners | 8 (6.6%) | $148,750 |
| Total | 122 (100.0%) | $106,500 |
Household Income in Bethel
Household Income Brackets in Bethel
With 65 households falling in the category, the $100,000 to $149,999 income range is the most frequent in Bethel, accounting for 35.7% of all households.
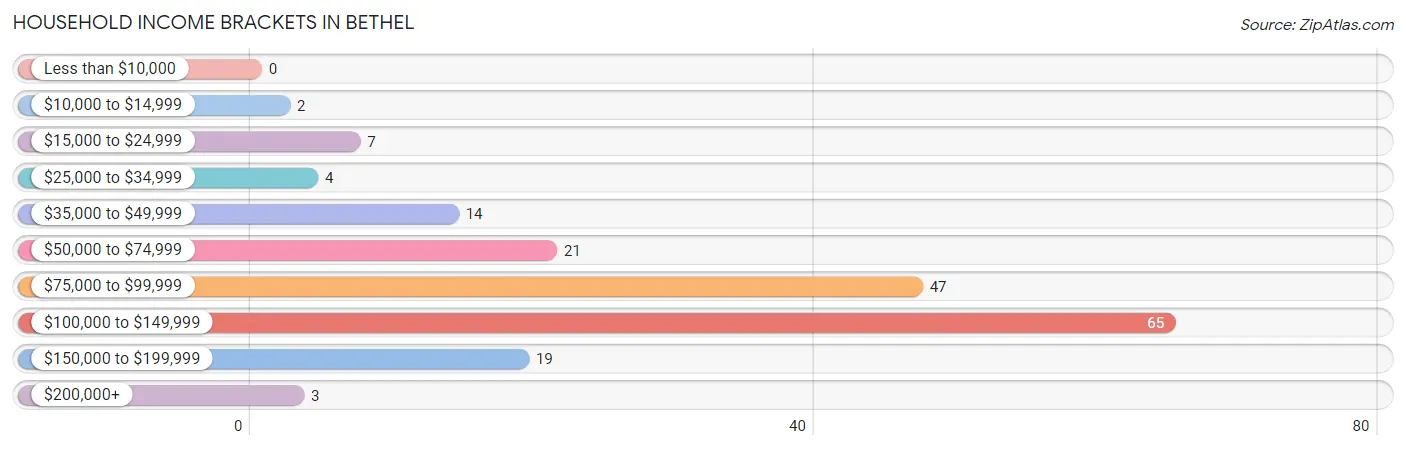
| Income Bracket | # Households | % Households |
| Less than $10,000 | 0 | 0.0% |
| $10,000 to $14,999 | 2 | 1.1% |
| $15,000 to $24,999 | 7 | 3.8% |
| $25,000 to $34,999 | 4 | 2.2% |
| $35,000 to $49,999 | 14 | 7.7% |
| $50,000 to $74,999 | 21 | 11.5% |
| $75,000 to $99,999 | 47 | 25.8% |
| $100,000 to $149,999 | 65 | 35.7% |
| $150,000 to $199,999 | 19 | 10.4% |
| $200,000+ | 3 | 1.6% |
Household Income by Householder Age in Bethel
The median household income in Bethel is $98,333, with the highest median household income of $109,375 found in the 25 to 44 years age bracket for the primary householder. A total of 64 households (35.2%) fall into this category. Meanwhile, the 15 to 24 years age bracket for the primary householder has the lowest median household income of $0, with 4 households (2.2%) in this group.
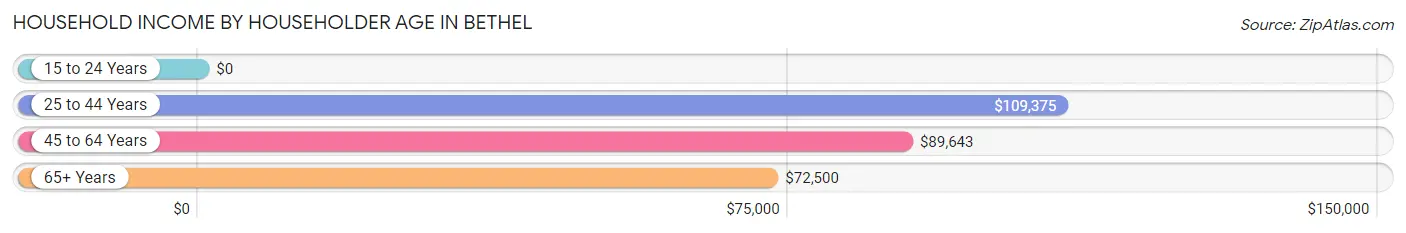
| Income Bracket | # Households | Median Income |
| 15 to 24 Years | 4 (2.2%) | $0 |
| 25 to 44 Years | 64 (35.2%) | $109,375 |
| 45 to 64 Years | 102 (56.0%) | $89,643 |
| 65+ Years | 12 (6.6%) | $72,500 |
| Total | 182 (100.0%) | $98,333 |
Poverty in Bethel
Income Below Poverty by Sex and Age in Bethel
With 3.2% poverty level for males and 5.6% for females among the residents of Bethel, 65 to 74 year old males and 55 to 64 year old females are the most vulnerable to poverty, with 1 males (10.0%) and 9 females (18.0%) in their respective age groups living below the poverty level.
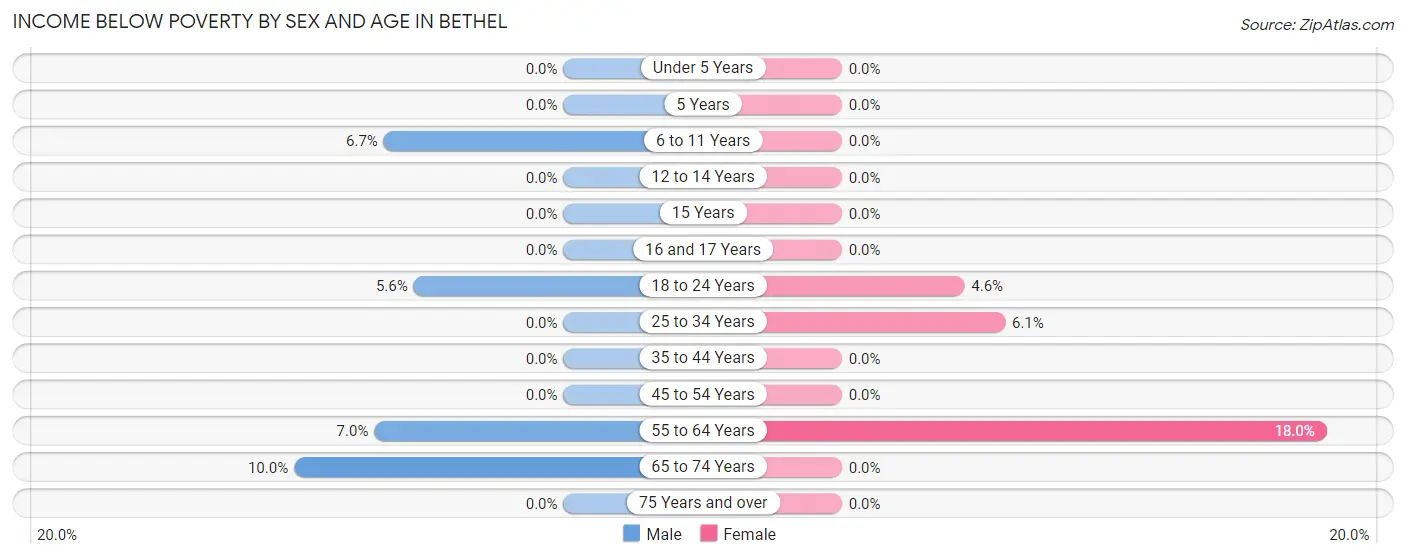
| Age Bracket | Male | Female |
| Under 5 Years | 0 (0.0%) | 0 (0.0%) |
| 5 Years | 0 (0.0%) | 0 (0.0%) |
| 6 to 11 Years | 1 (6.7%) | 0 (0.0%) |
| 12 to 14 Years | 0 (0.0%) | 0 (0.0%) |
| 15 Years | 0 (0.0%) | 0 (0.0%) |
| 16 and 17 Years | 0 (0.0%) | 0 (0.0%) |
| 18 to 24 Years | 2 (5.6%) | 1 (4.5%) |
| 25 to 34 Years | 0 (0.0%) | 2 (6.1%) |
| 35 to 44 Years | 0 (0.0%) | 0 (0.0%) |
| 45 to 54 Years | 0 (0.0%) | 0 (0.0%) |
| 55 to 64 Years | 4 (7.0%) | 9 (18.0%) |
| 65 to 74 Years | 1 (10.0%) | 0 (0.0%) |
| 75 Years and over | 0 (0.0%) | 0 (0.0%) |
| Total | 8 (3.2%) | 12 (5.6%) |
Income Above Poverty by Sex and Age in Bethel
According to the poverty statistics in Bethel, males aged under 5 years and females aged under 5 years are the age groups that are most secure financially, with 100.0% of males and 100.0% of females in these age groups living above the poverty line.
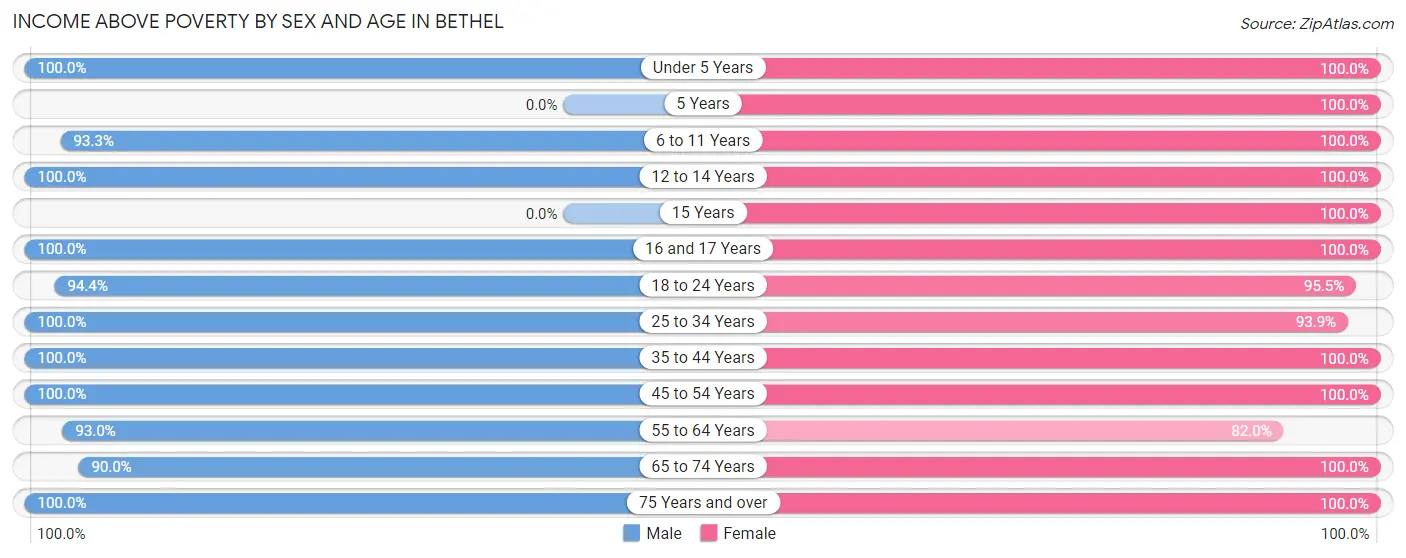
| Age Bracket | Male | Female |
| Under 5 Years | 6 (100.0%) | 15 (100.0%) |
| 5 Years | 0 (0.0%) | 4 (100.0%) |
| 6 to 11 Years | 14 (93.3%) | 12 (100.0%) |
| 12 to 14 Years | 8 (100.0%) | 5 (100.0%) |
| 15 Years | 0 (0.0%) | 3 (100.0%) |
| 16 and 17 Years | 2 (100.0%) | 2 (100.0%) |
| 18 to 24 Years | 34 (94.4%) | 21 (95.5%) |
| 25 to 34 Years | 40 (100.0%) | 31 (93.9%) |
| 35 to 44 Years | 30 (100.0%) | 22 (100.0%) |
| 45 to 54 Years | 47 (100.0%) | 35 (100.0%) |
| 55 to 64 Years | 53 (93.0%) | 41 (82.0%) |
| 65 to 74 Years | 9 (90.0%) | 9 (100.0%) |
| 75 Years and over | 3 (100.0%) | 1 (100.0%) |
| Total | 246 (96.9%) | 201 (94.4%) |
Income Below Poverty Among Married-Couple Families in Bethel
The poverty statistics for married-couple families in Bethel show that 1.9% or 2 of the total 104 families live below the poverty line. Families with no children have the highest poverty rate of 3.2%, comprising of 2 families. On the other hand, families with 1 or 2 children have the lowest poverty rate of 0.0%, which includes 0 families.
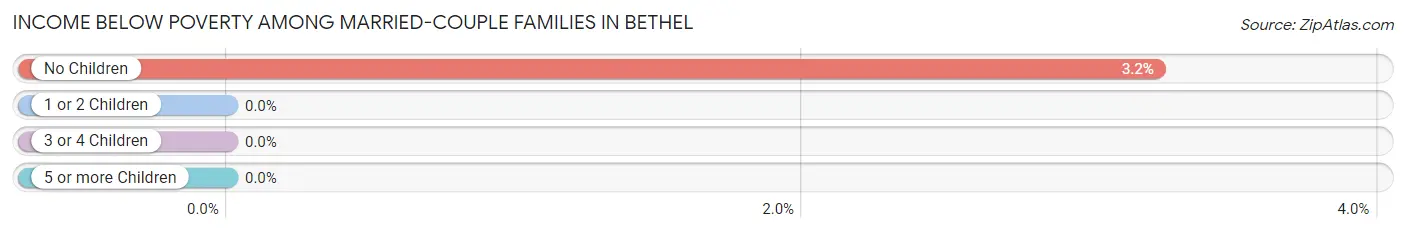
| Children | Above Poverty | Below Poverty |
| No Children | 60 (96.8%) | 2 (3.2%) |
| 1 or 2 Children | 34 (100.0%) | 0 (0.0%) |
| 3 or 4 Children | 8 (100.0%) | 0 (0.0%) |
| 5 or more Children | 0 (0.0%) | 0 (0.0%) |
| Total | 102 (98.1%) | 2 (1.9%) |
Income Below Poverty Among Single-Parent Households in Bethel
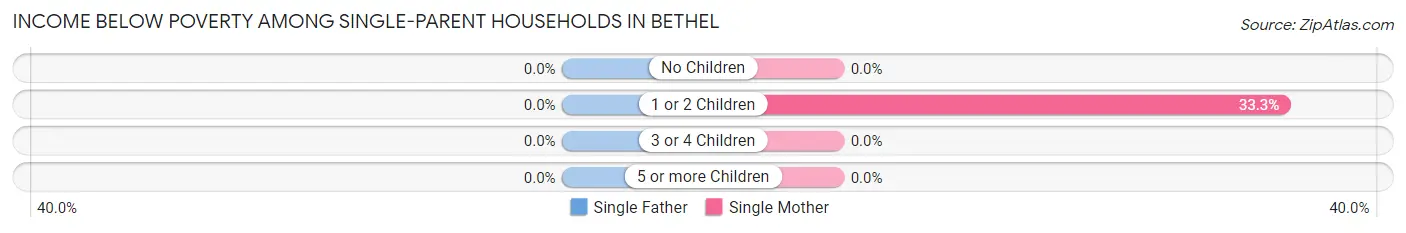
| Children | Single Father | Single Mother |
| No Children | 0 (0.0%) | 0 (0.0%) |
| 1 or 2 Children | 0 (0.0%) | 1 (33.3%) |
| 3 or 4 Children | 0 (0.0%) | 0 (0.0%) |
| 5 or more Children | 0 (0.0%) | 0 (0.0%) |
| Total | 0 (0.0%) | 1 (14.3%) |
Income Below Poverty Among Married-Couple vs Single-Parent Households in Bethel
The poverty data for Bethel shows that 2 of the married-couple family households (1.9%) and 1 of the single-parent households (5.6%) are living below the poverty level. Within the married-couple family households, those with no children have the highest poverty rate, with 2 households (3.2%) falling below the poverty line. Among the single-parent households, those with 1 or 2 children have the highest poverty rate, with 1 household (14.3%) living below poverty.
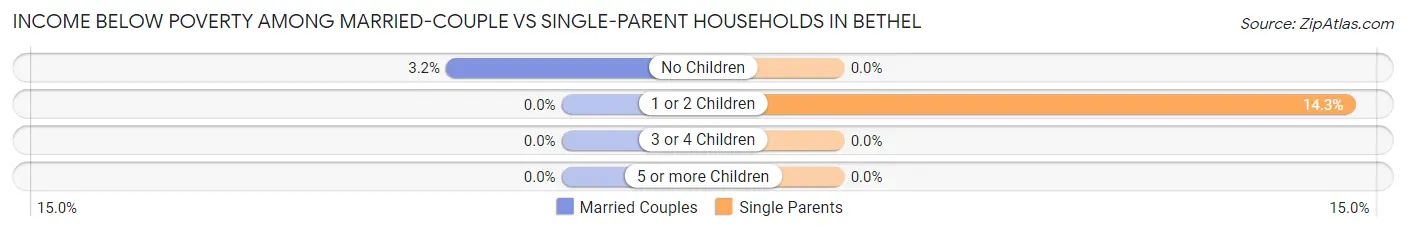
| Children | Married-Couple Families | Single-Parent Households |
| No Children | 2 (3.2%) | 0 (0.0%) |
| 1 or 2 Children | 0 (0.0%) | 1 (14.3%) |
| 3 or 4 Children | 0 (0.0%) | 0 (0.0%) |
| 5 or more Children | 0 (0.0%) | 0 (0.0%) |
| Total | 2 (1.9%) | 1 (5.6%) |
Race in Bethel
The most populous races in Bethel are White / Caucasian (422 | 89.8%), Two or more Races (24 | 5.1%), and Asian (18 | 3.8%).
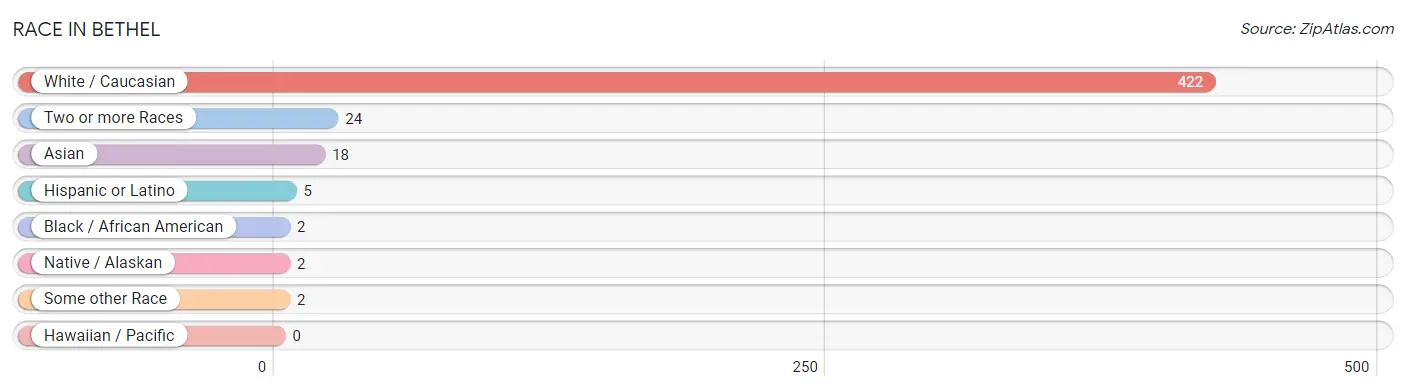
| Race | # Population | % Population |
| Asian | 18 | 3.8% |
| Black / African American | 2 | 0.4% |
| Hawaiian / Pacific | 0 | 0.0% |
| Hispanic or Latino | 5 | 1.1% |
| Native / Alaskan | 2 | 0.4% |
| White / Caucasian | 422 | 89.8% |
| Two or more Races | 24 | 5.1% |
| Some other Race | 2 | 0.4% |
| Total | 470 | 100.0% |
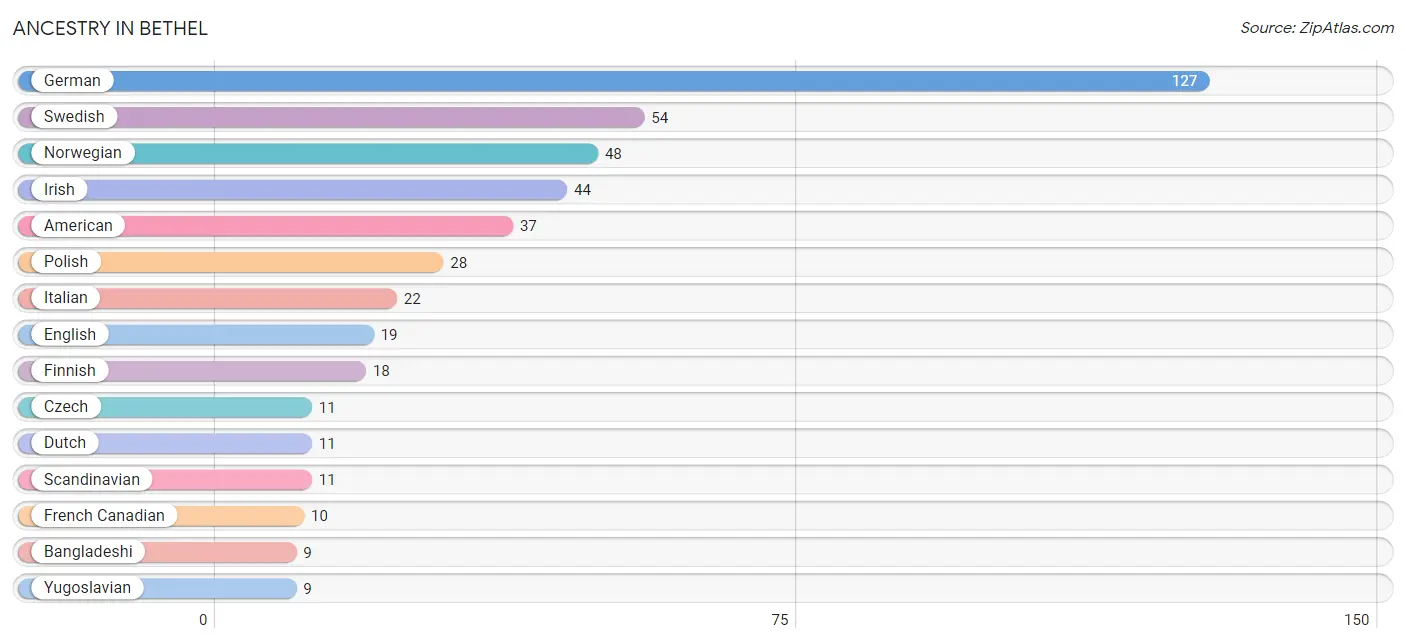
Ancestry in Bethel
The most populous ancestries reported in Bethel are German (127 | 27.0%), Swedish (54 | 11.5%), Norwegian (48 | 10.2%), Irish (44 | 9.4%), and American (37 | 7.9%), together accounting for 65.9% of all Bethel residents.
| Ancestry | # Population | % Population |
| American | 37 | 7.9% |
| Austrian | 4 | 0.9% |
| Bangladeshi | 9 | 1.9% |
| British | 1 | 0.2% |
| Burmese | 1 | 0.2% |
| Central American | 2 | 0.4% |
| Chippewa | 3 | 0.6% |
| Czech | 11 | 2.3% |
| Danish | 8 | 1.7% |
| Dutch | 11 | 2.3% |
| Eastern European | 1 | 0.2% |
| English | 19 | 4.0% |
| European | 2 | 0.4% |
| Finnish | 18 | 3.8% |
| French | 3 | 0.6% |
| French Canadian | 10 | 2.1% |
| German | 127 | 27.0% |
| Greek | 1 | 0.2% |
| Guatemalan | 2 | 0.4% |
| Hungarian | 5 | 1.1% |
| Irish | 44 | 9.4% |
| Italian | 22 | 4.7% |
| Kenyan | 5 | 1.1% |
| Korean | 4 | 0.9% |
| Mexican | 3 | 0.6% |
| Norwegian | 48 | 10.2% |
| Polish | 28 | 6.0% |
| Portuguese | 2 | 0.4% |
| Scandinavian | 11 | 2.3% |
| Scottish | 6 | 1.3% |
| Slovak | 4 | 0.9% |
| Sri Lankan | 4 | 0.9% |
| Subsaharan African | 5 | 1.1% |
| Swedish | 54 | 11.5% |
| Ukrainian | 2 | 0.4% |
| Yugoslavian | 9 | 1.9% | View All 36 Rows |
Immigrants in Bethel
The most numerous immigrant groups reported in Bethel came from Asia (9 | 1.9%), South Eastern Asia (8 | 1.7%), Philippines (4 | 0.9%), Vietnam (4 | 0.9%), and Central America (2 | 0.4%), together accounting for 5.7% of all Bethel residents.
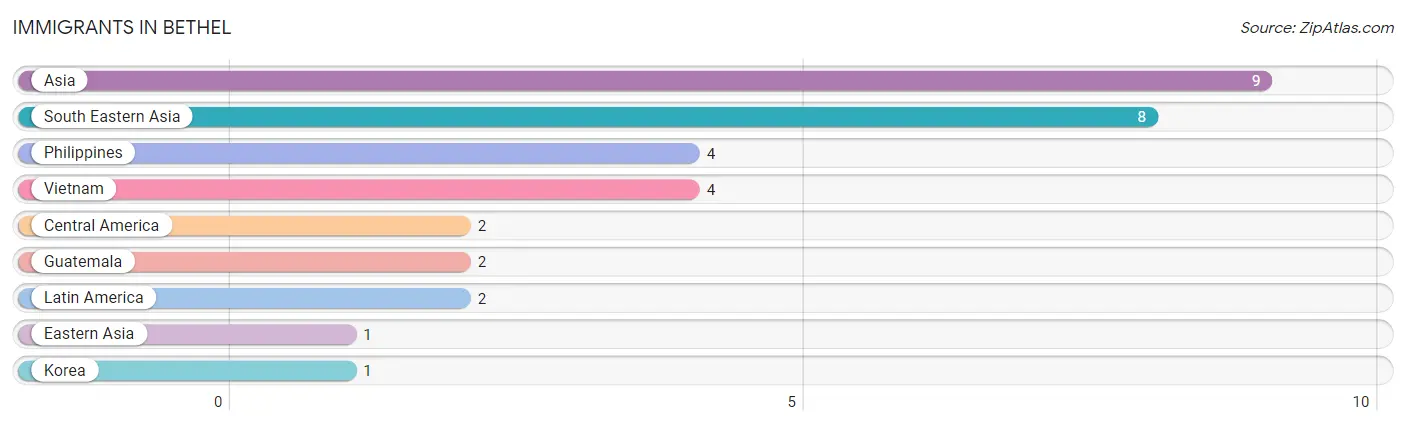
| Immigration Origin | # Population | % Population |
| Asia | 9 | 1.9% |
| Central America | 2 | 0.4% |
| Eastern Asia | 1 | 0.2% |
| Guatemala | 2 | 0.4% |
| Korea | 1 | 0.2% |
| Latin America | 2 | 0.4% |
| Philippines | 4 | 0.9% |
| South Eastern Asia | 8 | 1.7% |
| Vietnam | 4 | 0.9% | View All 9 Rows |
Sex and Age in Bethel
Sex and Age in Bethel
The most populous age groups in Bethel are 55 to 59 Years (33 | 12.9%) for men and 60 to 64 Years (28 | 13.1%) for women.
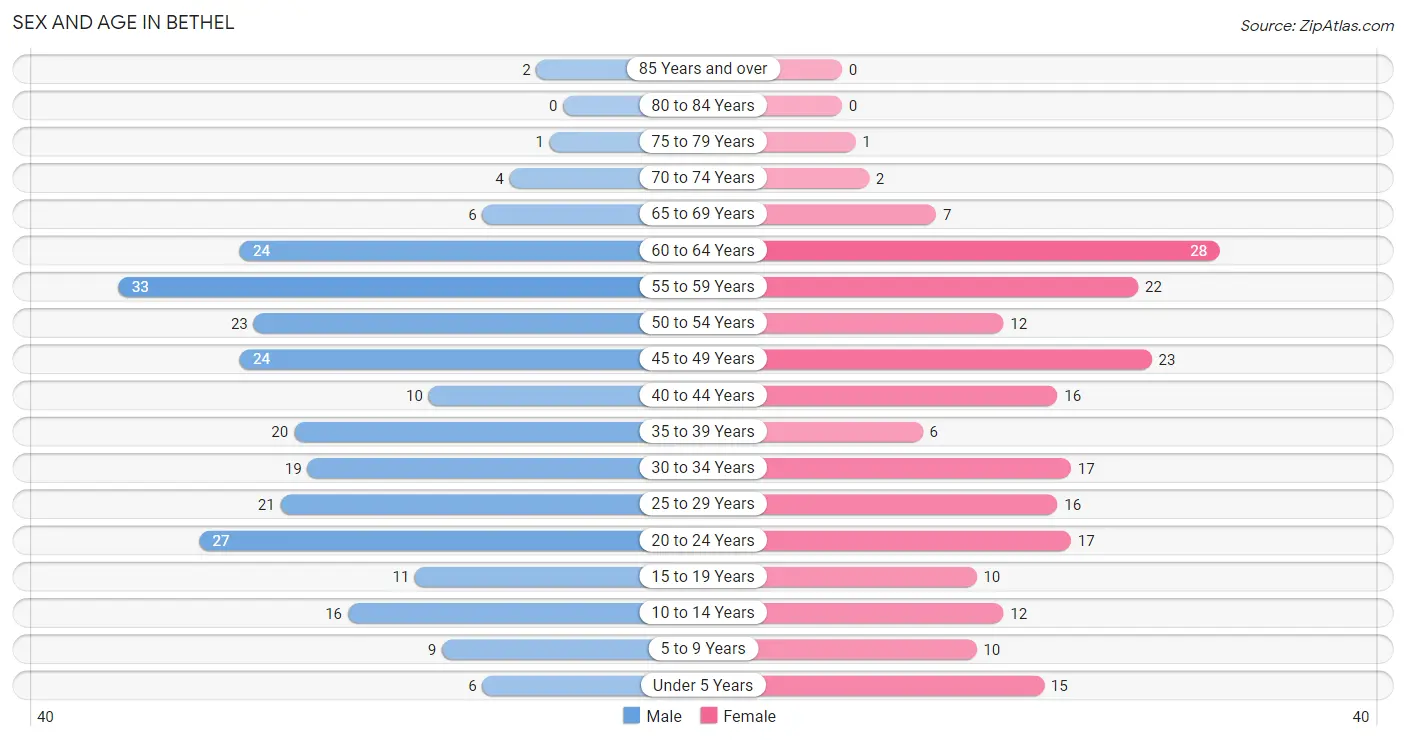
| Age Bracket | Male | Female |
| Under 5 Years | 6 (2.3%) | 15 (7.0%) |
| 5 to 9 Years | 9 (3.5%) | 10 (4.7%) |
| 10 to 14 Years | 16 (6.2%) | 12 (5.6%) |
| 15 to 19 Years | 11 (4.3%) | 10 (4.7%) |
| 20 to 24 Years | 27 (10.5%) | 17 (7.9%) |
| 25 to 29 Years | 21 (8.2%) | 16 (7.5%) |
| 30 to 34 Years | 19 (7.4%) | 17 (7.9%) |
| 35 to 39 Years | 20 (7.8%) | 6 (2.8%) |
| 40 to 44 Years | 10 (3.9%) | 16 (7.5%) |
| 45 to 49 Years | 24 (9.4%) | 23 (10.7%) |
| 50 to 54 Years | 23 (9.0%) | 12 (5.6%) |
| 55 to 59 Years | 33 (12.9%) | 22 (10.3%) |
| 60 to 64 Years | 24 (9.4%) | 28 (13.1%) |
| 65 to 69 Years | 6 (2.3%) | 7 (3.3%) |
| 70 to 74 Years | 4 (1.6%) | 2 (0.9%) |
| 75 to 79 Years | 1 (0.4%) | 1 (0.5%) |
| 80 to 84 Years | 0 (0.0%) | 0 (0.0%) |
| 85 Years and over | 2 (0.8%) | 0 (0.0%) |
| Total | 256 (100.0%) | 214 (100.0%) |
Families and Households in Bethel
Median Family Size in Bethel
The median family size in Bethel is 2.92 persons per family, with married-couple families (104 | 85.3%) accounting for the largest median family size of 2.97 persons per family. On the other hand, single female/mother families (7 | 5.7%) represent the smallest median family size with 2.29 persons per family.
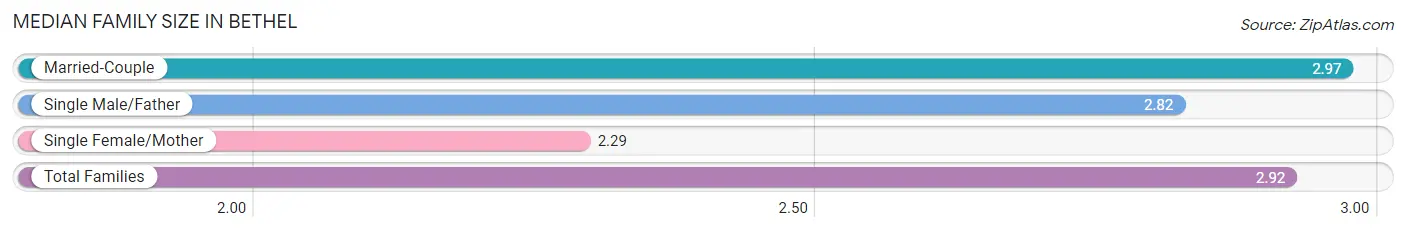
| Family Type | # Families | Family Size |
| Married-Couple | 104 (85.3%) | 2.97 |
| Single Male/Father | 11 (9.0%) | 2.82 |
| Single Female/Mother | 7 (5.7%) | 2.29 |
| Total Families | 122 (100.0%) | 2.92 |
Median Household Size in Bethel
The median household size in Bethel is 2.58 persons per household, with single male/father households (11 | 6.0%) accounting for the largest median household size of 4 persons per household. non-family households (60 | 33.0%) represent the smallest median household size with 1.53 persons per household.
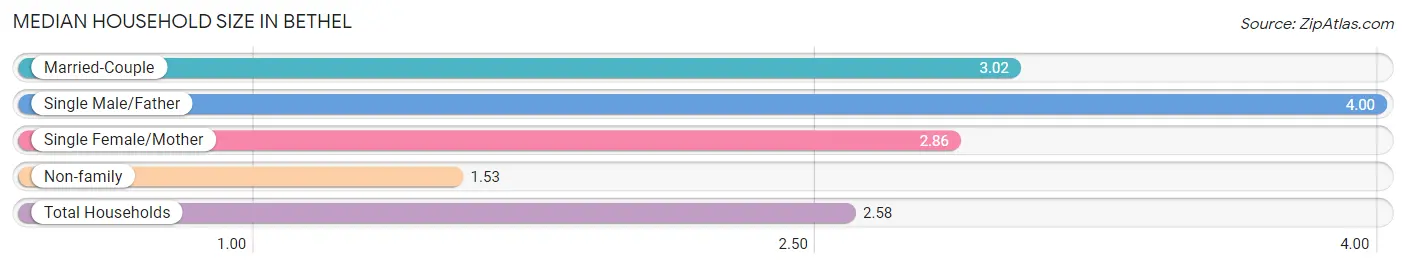
| Household Type | # Households | Household Size |
| Married-Couple | 104 (57.1%) | 3.02 |
| Single Male/Father | 11 (6.0%) | 4.00 |
| Single Female/Mother | 7 (3.8%) | 2.86 |
| Non-family | 60 (33.0%) | 1.53 |
| Total Households | 182 (100.0%) | 2.58 |
Household Size by Marriage Status in Bethel
Out of a total of 182 households in Bethel, 122 (67.0%) are family households, while 60 (33.0%) are nonfamily households. The most numerous type of family households are 2-person households, comprising 51, and the most common type of nonfamily households are 1-person households, comprising 30.
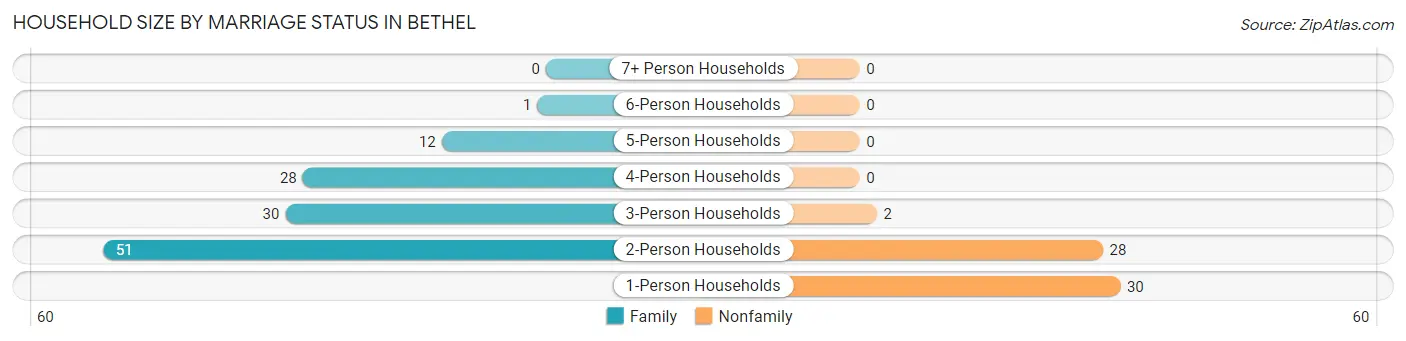
| Household Size | Family Households | Nonfamily Households |
| 1-Person Households | - | 30 (16.5%) |
| 2-Person Households | 51 (28.0%) | 28 (15.4%) |
| 3-Person Households | 30 (16.5%) | 2 (1.1%) |
| 4-Person Households | 28 (15.4%) | 0 (0.0%) |
| 5-Person Households | 12 (6.6%) | 0 (0.0%) |
| 6-Person Households | 1 (0.5%) | 0 (0.0%) |
| 7+ Person Households | 0 (0.0%) | 0 (0.0%) |
| Total | 122 (67.0%) | 60 (33.0%) |
Female Fertility in Bethel
Fertility by Age in Bethel
Average fertility rate in Bethel is 66.0 births per 1,000 women. Women in the age bracket of 20 to 34 years have the highest fertility rate with 120.0 births per 1,000 women. Women in the age bracket of 20 to 34 years acount for 85.7% of all women with births.
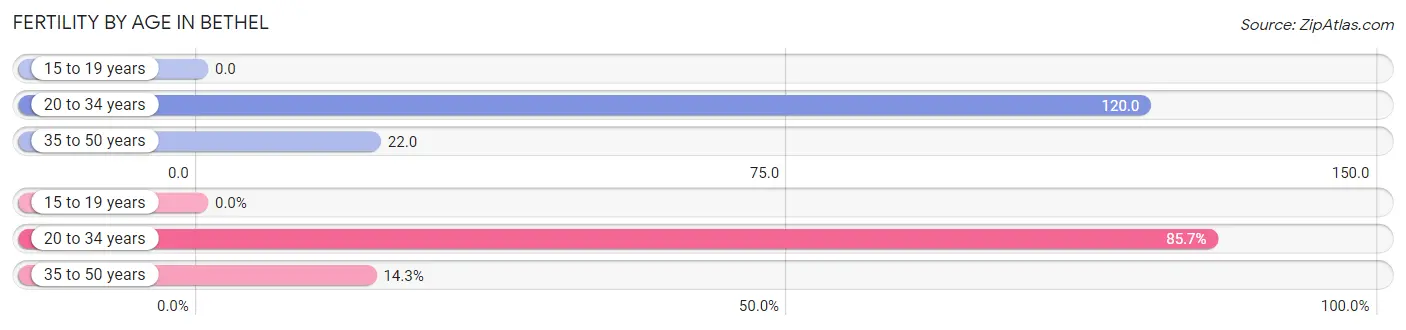
| Age Bracket | Women with Births | Births / 1,000 Women |
| 15 to 19 years | 0 (0.0%) | 0.0 |
| 20 to 34 years | 6 (85.7%) | 120.0 |
| 35 to 50 years | 1 (14.3%) | 22.0 |
| Total | 7 (100.0%) | 66.0 |
Fertility by Age by Marriage Status in Bethel
85.7% of women with births (7) in Bethel are married. The highest percentage of unmarried women with births falls into 20 to 34 years age bracket with 16.7% of them unmarried at the time of birth, while the lowest percentage of unmarried women with births belong to 35 to 50 years age bracket with 0.0% of them unmarried.
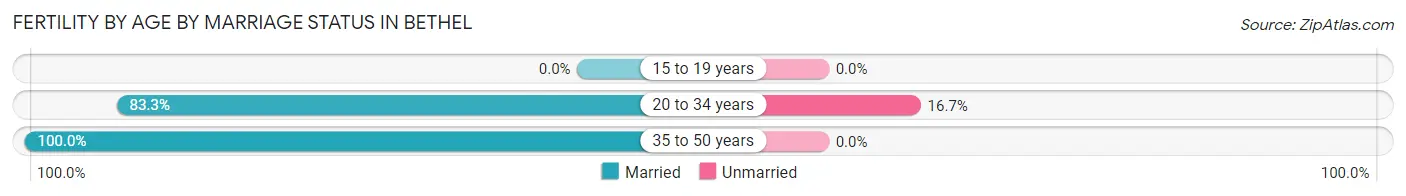
| Age Bracket | Married | Unmarried |
| 15 to 19 years | 0 (0.0%) | 0 (0.0%) |
| 20 to 34 years | 5 (83.3%) | 1 (16.7%) |
| 35 to 50 years | 1 (100.0%) | 0 (0.0%) |
| Total | 6 (85.7%) | 1 (14.3%) |
Fertility by Education in Bethel
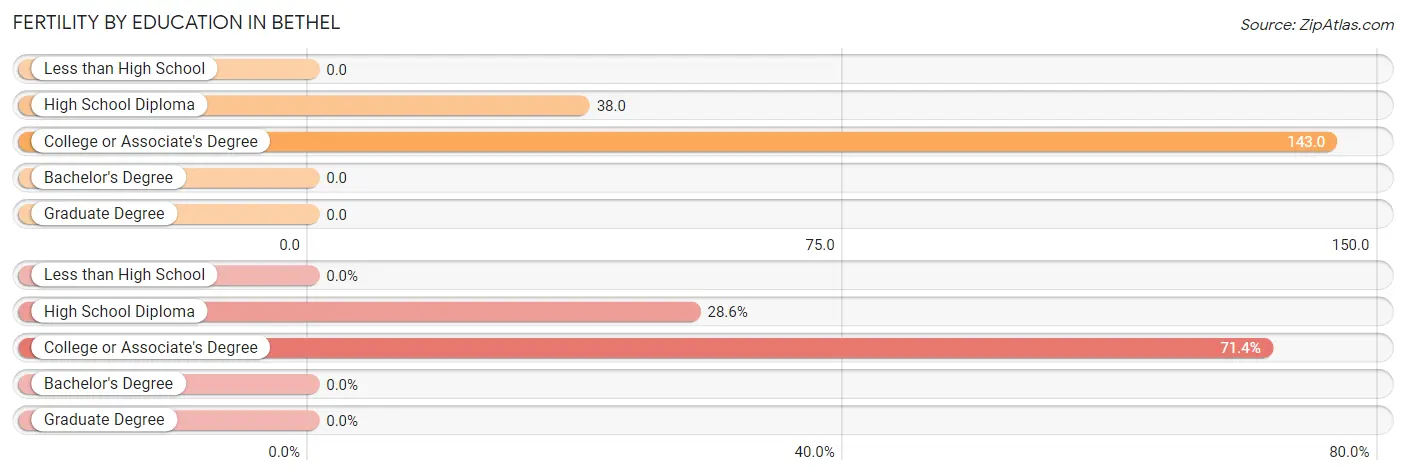
| Educational Attainment | Women with Births | Births / 1,000 Women |
| Less than High School | 0 (0.0%) | 0.0 |
| High School Diploma | 2 (28.6%) | 38.0 |
| College or Associate's Degree | 5 (71.4%) | 143.0 |
| Bachelor's Degree | 0 (0.0%) | 0.0 |
| Graduate Degree | 0 (0.0%) | 0.0 |
| Total | 7 (100.0%) | 66.0 |
Fertility by Education by Marriage Status in Bethel
14.3% of women with births in Bethel are unmarried. Women with the educational attainment of college or associate's degree are most likely to be married with 100.0% of them married at childbirth, while women with the educational attainment of high school diploma are least likely to be married with 50.0% of them unmarried at childbirth.
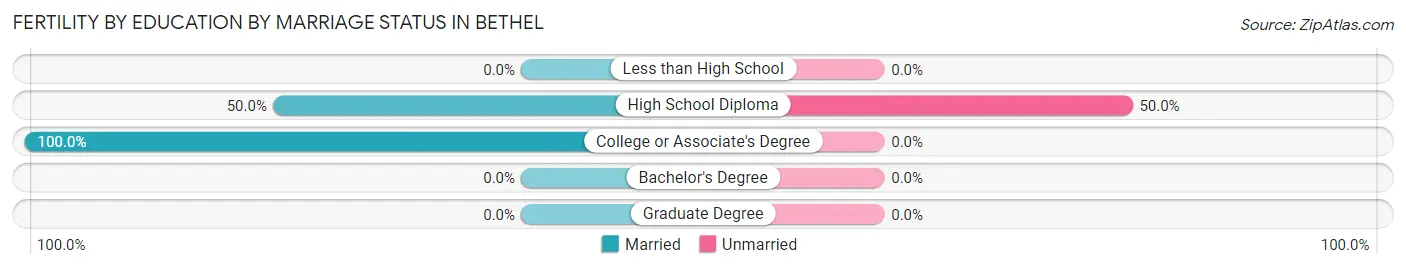
| Educational Attainment | Married | Unmarried |
| Less than High School | 0 (0.0%) | 0 (0.0%) |
| High School Diploma | 1 (50.0%) | 1 (50.0%) |
| College or Associate's Degree | 5 (100.0%) | 0 (0.0%) |
| Bachelor's Degree | 0 (0.0%) | 0 (0.0%) |
| Graduate Degree | 0 (0.0%) | 0 (0.0%) |
| Total | 6 (85.7%) | 1 (14.3%) |
Employment Characteristics in Bethel
Employment by Class of Employer in Bethel
Among the 278 employed individuals in Bethel, private company employees (214 | 77.0%), not-for-profit organizations (21 | 7.5%), and local government employees (14 | 5.0%) make up the most common classes of employment.
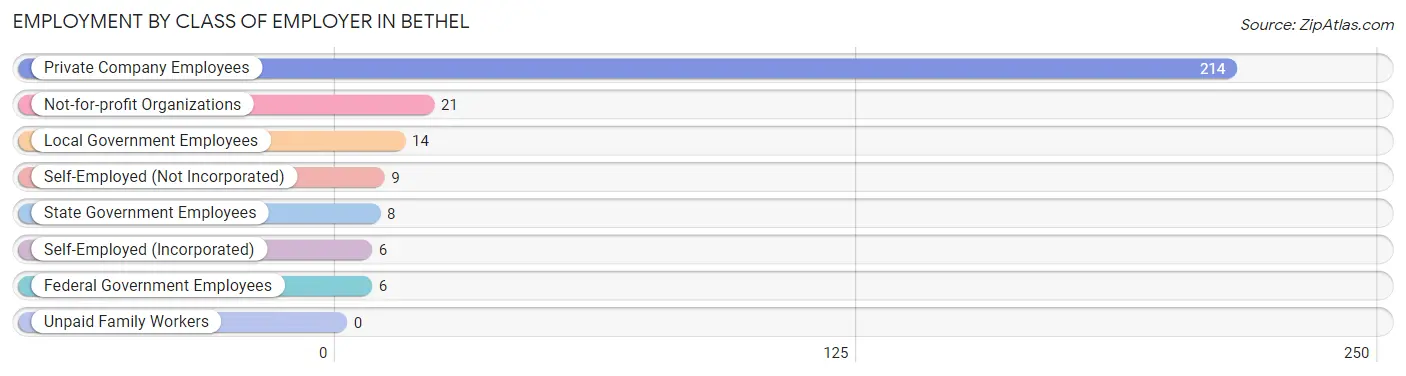
| Employer Class | # Employees | % Employees |
| Private Company Employees | 214 | 77.0% |
| Self-Employed (Incorporated) | 6 | 2.2% |
| Self-Employed (Not Incorporated) | 9 | 3.2% |
| Not-for-profit Organizations | 21 | 7.5% |
| Local Government Employees | 14 | 5.0% |
| State Government Employees | 8 | 2.9% |
| Federal Government Employees | 6 | 2.2% |
| Unpaid Family Workers | 0 | 0.0% |
| Total | 278 | 100.0% |
Employment Status by Age in Bethel
According to the labor force statistics for Bethel, out of the total population over 16 years of age (399), 74.9% or 299 individuals are in the labor force, with 5.0% or 15 of them unemployed. The age group with the highest labor force participation rate is 45 to 54 years, with 87.8% or 72 individuals in the labor force. Within the labor force, the 55 to 59 years age range has the highest percentage of unemployed individuals, with 10.4% or 5 of them being unemployed.
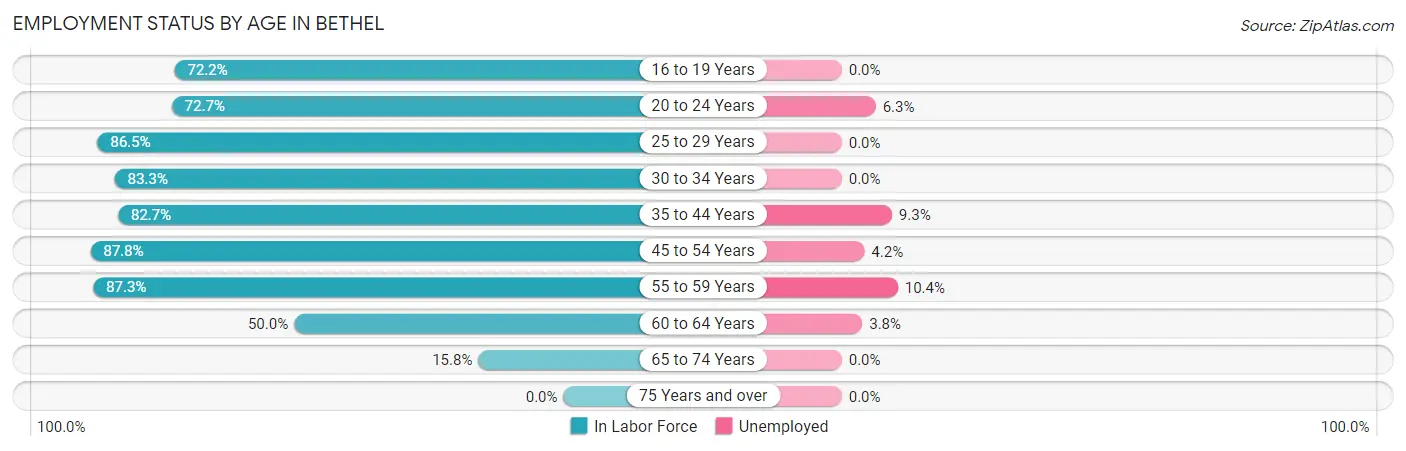
| Age Bracket | In Labor Force | Unemployed |
| 16 to 19 Years | 13 (72.2%) | 0 (0.0%) |
| 20 to 24 Years | 32 (72.7%) | 2 (6.3%) |
| 25 to 29 Years | 32 (86.5%) | 0 (0.0%) |
| 30 to 34 Years | 30 (83.3%) | 0 (0.0%) |
| 35 to 44 Years | 43 (82.7%) | 4 (9.3%) |
| 45 to 54 Years | 72 (87.8%) | 3 (4.2%) |
| 55 to 59 Years | 48 (87.3%) | 5 (10.4%) |
| 60 to 64 Years | 26 (50.0%) | 1 (3.8%) |
| 65 to 74 Years | 3 (15.8%) | 0 (0.0%) |
| 75 Years and over | 0 (0.0%) | 0 (0.0%) |
| Total | 299 (74.9%) | 15 (5.0%) |
Employment Status by Educational Attainment in Bethel
According to labor force statistics for Bethel, 79.9% of individuals (251) out of the total population between 25 and 64 years of age (314) are in the labor force, with 5.2% or 13 of them being unemployed. The group with the highest labor force participation rate are those with the educational attainment of bachelor's degree or higher, with 94.4% or 34 individuals in the labor force. Within the labor force, individuals with high school diploma education have the highest percentage of unemployment, with 7.1% or 7 of them being unemployed.
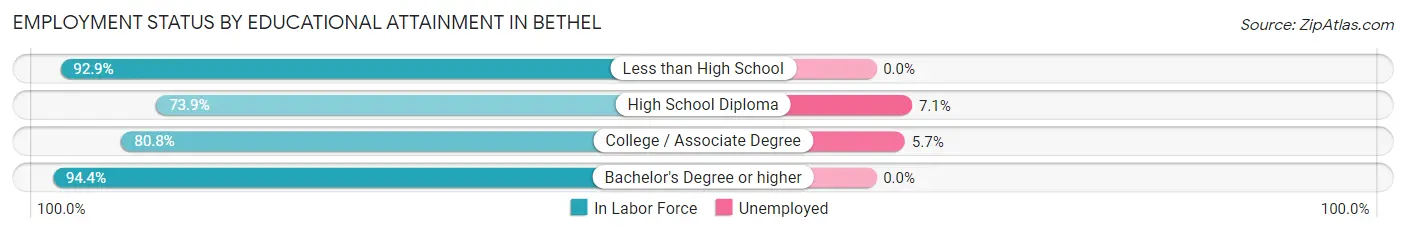
| Educational Attainment | In Labor Force | Unemployed |
| Less than High School | 13 (92.9%) | 0 (0.0%) |
| High School Diploma | 99 (73.9%) | 10 (7.1%) |
| College / Associate Degree | 105 (80.8%) | 7 (5.7%) |
| Bachelor's Degree or higher | 34 (94.4%) | 0 (0.0%) |
| Total | 251 (79.9%) | 16 (5.2%) |
Employment Occupations by Sex in Bethel
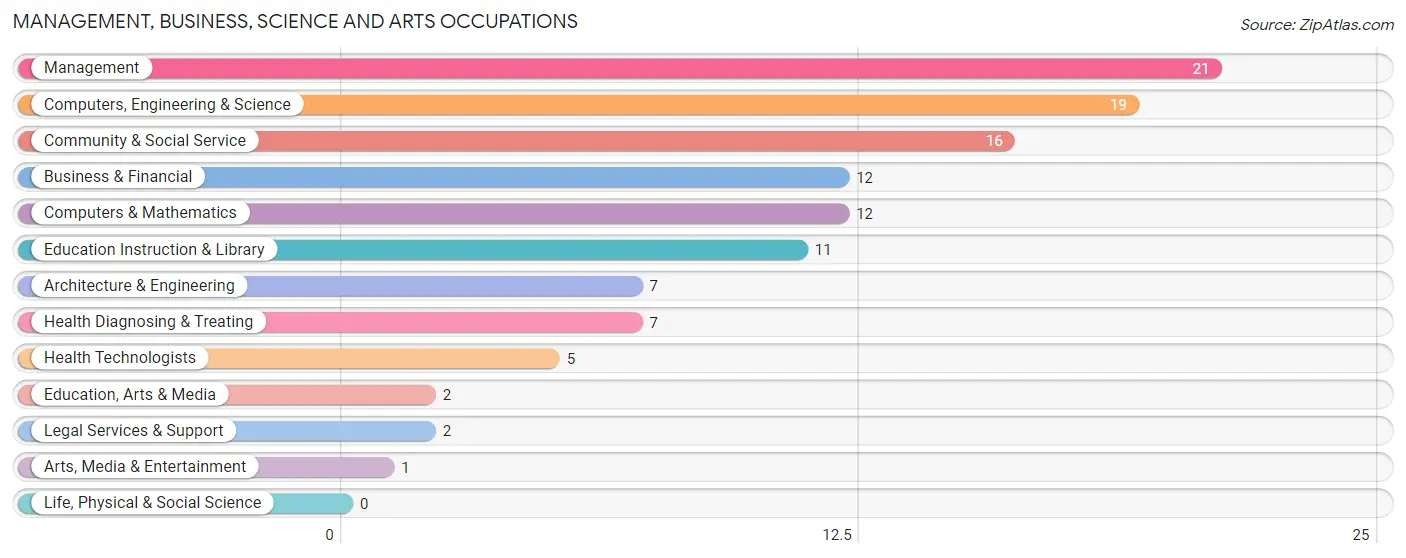
Management, Business, Science and Arts Occupations
The most common Management, Business, Science and Arts occupations in Bethel are Management (21 | 7.4%), Computers, Engineering & Science (19 | 6.7%), Community & Social Service (16 | 5.6%), Business & Financial (12 | 4.2%), and Computers & Mathematics (12 | 4.2%).
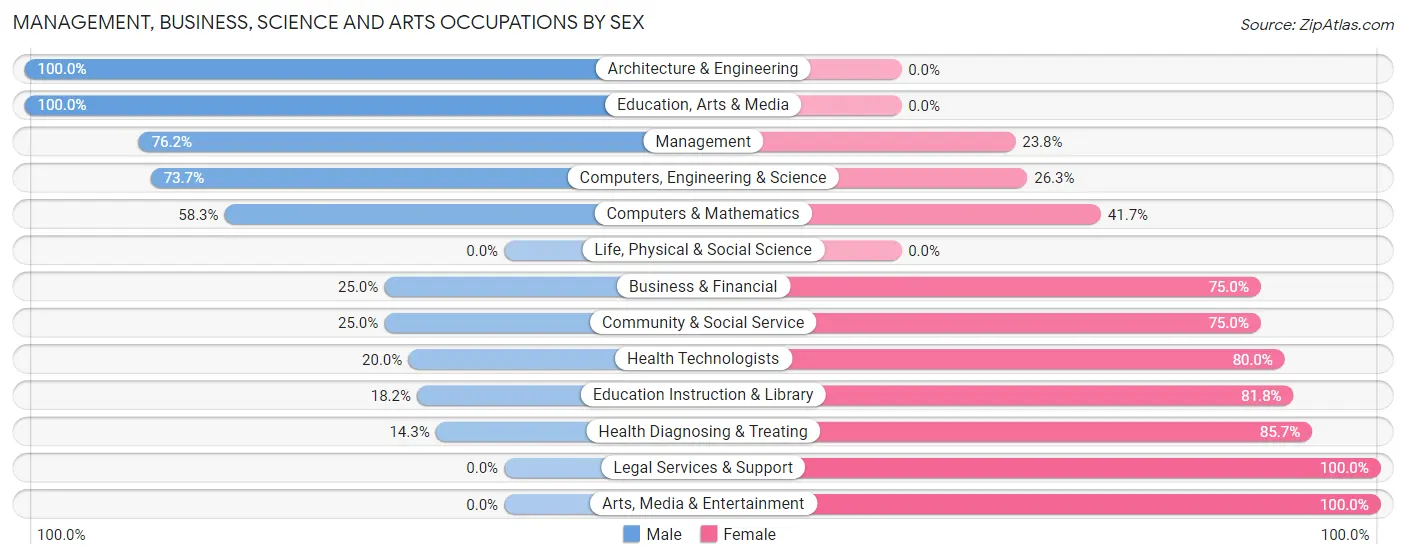
Management, Business, Science and Arts Occupations by Sex
Within the Management, Business, Science and Arts occupations in Bethel, the most male-oriented occupations are Architecture & Engineering (100.0%), Education, Arts & Media (100.0%), and Management (76.2%), while the most female-oriented occupations are Legal Services & Support (100.0%), Arts, Media & Entertainment (100.0%), and Health Diagnosing & Treating (85.7%).
| Occupation | Male | Female |
| Management | 16 (76.2%) | 5 (23.8%) |
| Business & Financial | 3 (25.0%) | 9 (75.0%) |
| Computers, Engineering & Science | 14 (73.7%) | 5 (26.3%) |
| Computers & Mathematics | 7 (58.3%) | 5 (41.7%) |
| Architecture & Engineering | 7 (100.0%) | 0 (0.0%) |
| Life, Physical & Social Science | 0 (0.0%) | 0 (0.0%) |
| Community & Social Service | 4 (25.0%) | 12 (75.0%) |
| Education, Arts & Media | 2 (100.0%) | 0 (0.0%) |
| Legal Services & Support | 0 (0.0%) | 2 (100.0%) |
| Education Instruction & Library | 2 (18.2%) | 9 (81.8%) |
| Arts, Media & Entertainment | 0 (0.0%) | 1 (100.0%) |
| Health Diagnosing & Treating | 1 (14.3%) | 6 (85.7%) |
| Health Technologists | 1 (20.0%) | 4 (80.0%) |
| Total (Category) | 38 (50.7%) | 37 (49.3%) |
| Total (Overall) | 173 (60.9%) | 111 (39.1%) |
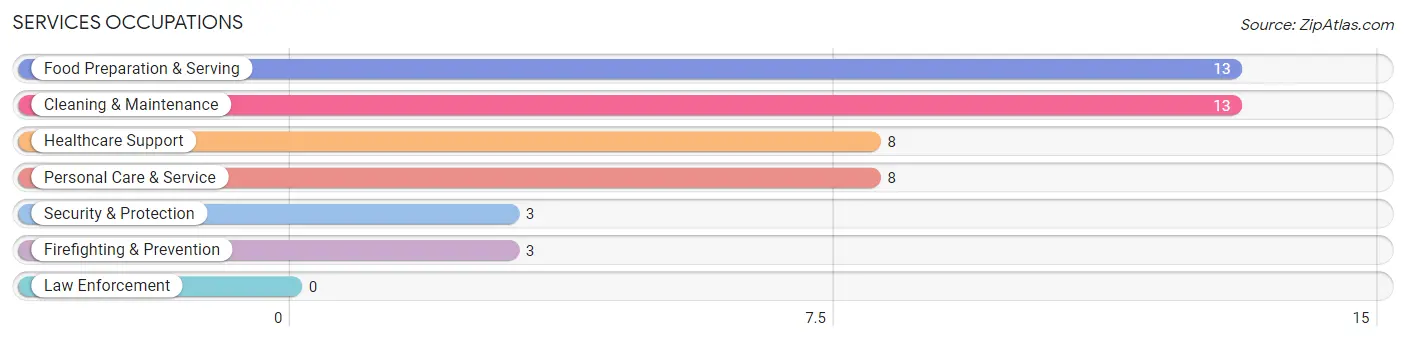
Services Occupations
The most common Services occupations in Bethel are Food Preparation & Serving (13 | 4.6%), Cleaning & Maintenance (13 | 4.6%), Healthcare Support (8 | 2.8%), Personal Care & Service (8 | 2.8%), and Security & Protection (3 | 1.1%).
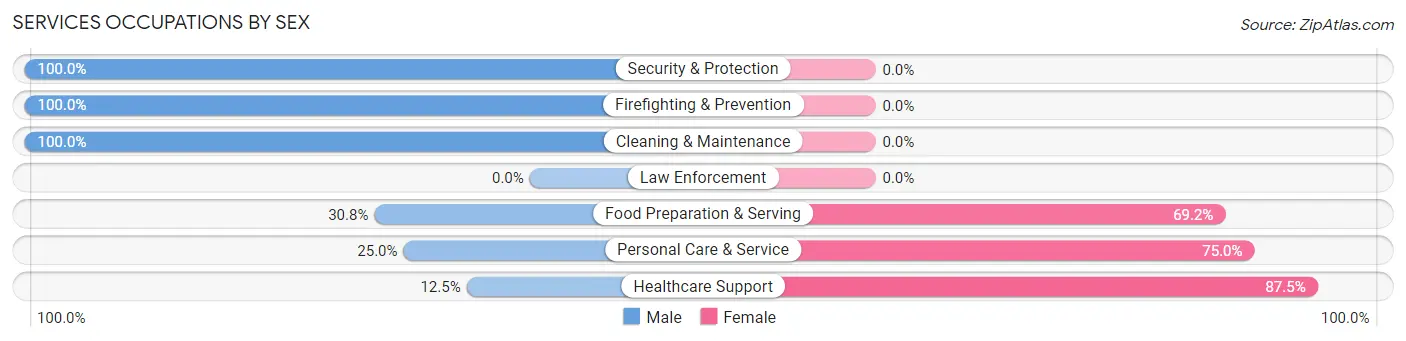
Services Occupations by Sex
Within the Services occupations in Bethel, the most male-oriented occupations are Security & Protection (100.0%), Firefighting & Prevention (100.0%), and Cleaning & Maintenance (100.0%), while the most female-oriented occupations are Healthcare Support (87.5%), Personal Care & Service (75.0%), and Food Preparation & Serving (69.2%).
| Occupation | Male | Female |
| Healthcare Support | 1 (12.5%) | 7 (87.5%) |
| Security & Protection | 3 (100.0%) | 0 (0.0%) |
| Firefighting & Prevention | 3 (100.0%) | 0 (0.0%) |
| Law Enforcement | 0 (0.0%) | 0 (0.0%) |
| Food Preparation & Serving | 4 (30.8%) | 9 (69.2%) |
| Cleaning & Maintenance | 13 (100.0%) | 0 (0.0%) |
| Personal Care & Service | 2 (25.0%) | 6 (75.0%) |
| Total (Category) | 23 (51.1%) | 22 (48.9%) |
| Total (Overall) | 173 (60.9%) | 111 (39.1%) |
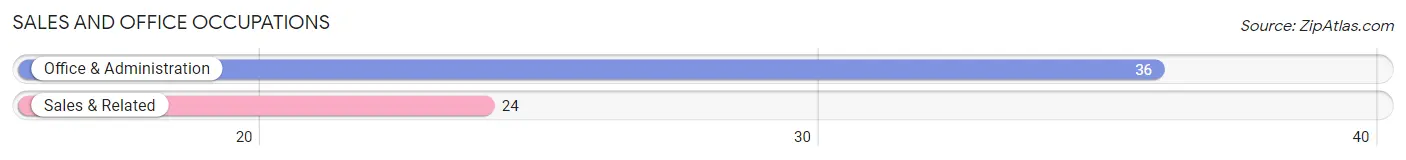
Sales and Office Occupations
The most common Sales and Office occupations in Bethel are Office & Administration (36 | 12.7%), and Sales & Related (24 | 8.5%).
Sales and Office Occupations by Sex
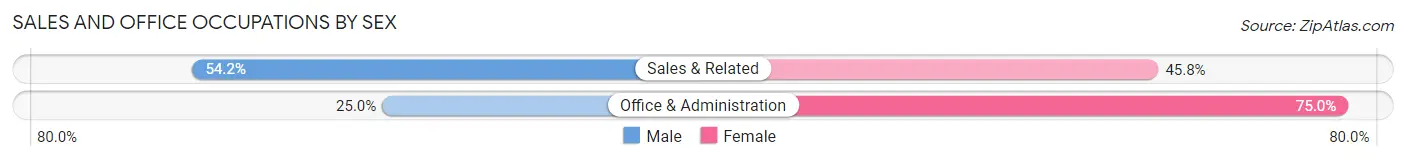
| Occupation | Male | Female |
| Sales & Related | 13 (54.2%) | 11 (45.8%) |
| Office & Administration | 9 (25.0%) | 27 (75.0%) |
| Total (Category) | 22 (36.7%) | 38 (63.3%) |
| Total (Overall) | 173 (60.9%) | 111 (39.1%) |
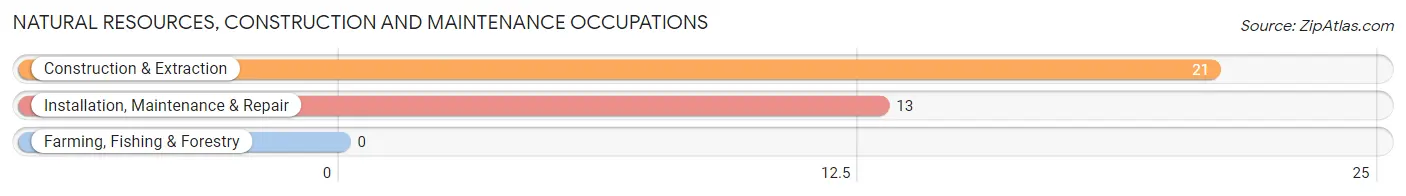
Natural Resources, Construction and Maintenance Occupations
The most common Natural Resources, Construction and Maintenance occupations in Bethel are Construction & Extraction (21 | 7.4%), and Installation, Maintenance & Repair (13 | 4.6%).
Natural Resources, Construction and Maintenance Occupations by Sex
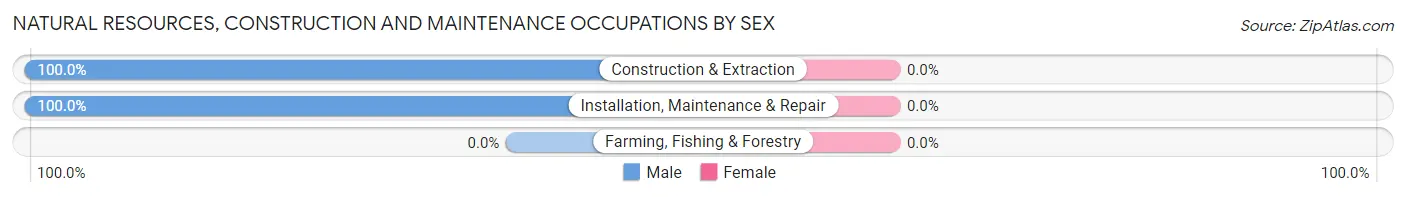
| Occupation | Male | Female |
| Farming, Fishing & Forestry | 0 (0.0%) | 0 (0.0%) |
| Construction & Extraction | 21 (100.0%) | 0 (0.0%) |
| Installation, Maintenance & Repair | 13 (100.0%) | 0 (0.0%) |
| Total (Category) | 34 (100.0%) | 0 (0.0%) |
| Total (Overall) | 173 (60.9%) | 111 (39.1%) |
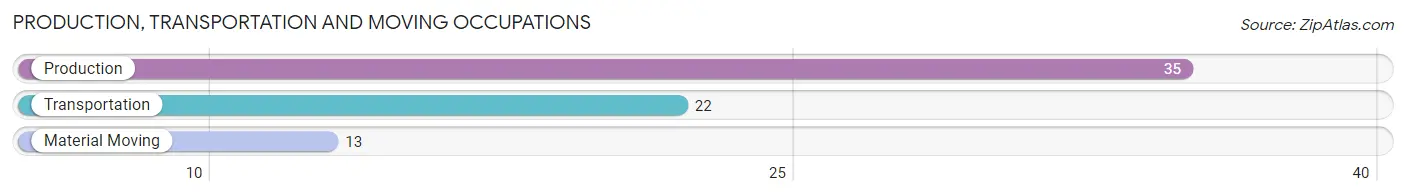
Production, Transportation and Moving Occupations
The most common Production, Transportation and Moving occupations in Bethel are Production (35 | 12.3%), Transportation (22 | 7.7%), and Material Moving (13 | 4.6%).
Production, Transportation and Moving Occupations by Sex
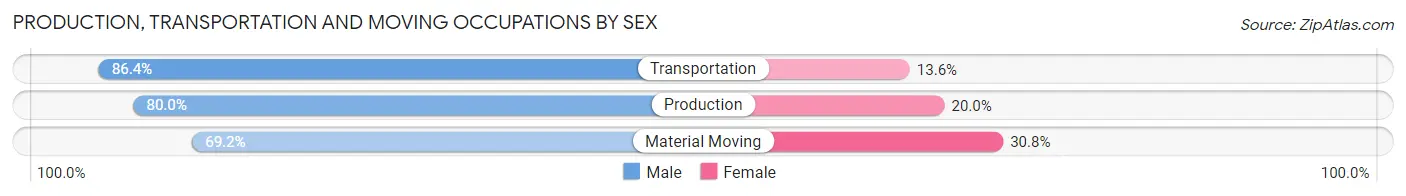
| Occupation | Male | Female |
| Production | 28 (80.0%) | 7 (20.0%) |
| Transportation | 19 (86.4%) | 3 (13.6%) |
| Material Moving | 9 (69.2%) | 4 (30.8%) |
| Total (Category) | 56 (80.0%) | 14 (20.0%) |
| Total (Overall) | 173 (60.9%) | 111 (39.1%) |
Employment Industries by Sex in Bethel
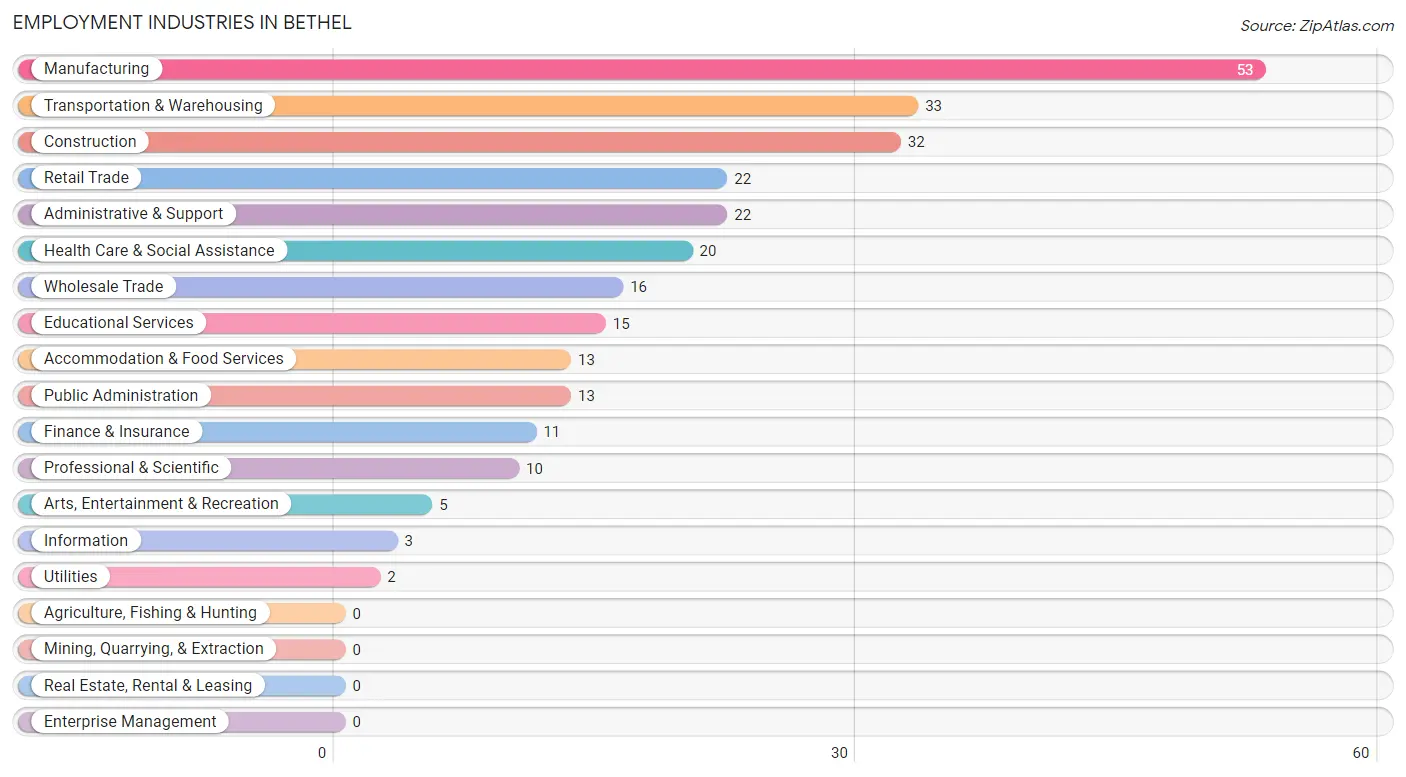
Employment Industries in Bethel
The major employment industries in Bethel include Manufacturing (53 | 18.7%), Transportation & Warehousing (33 | 11.6%), Construction (32 | 11.3%), Retail Trade (22 | 7.7%), and Administrative & Support (22 | 7.7%).
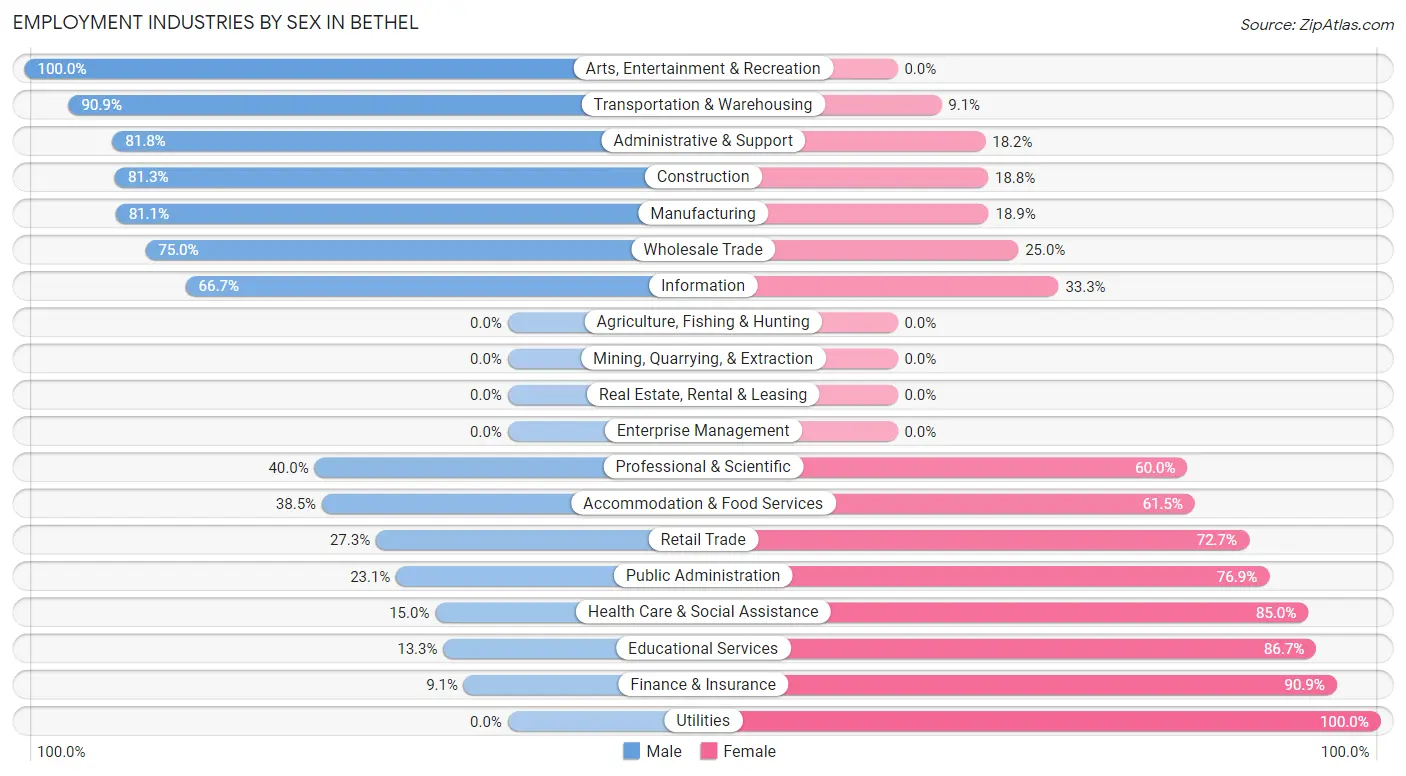
Employment Industries by Sex in Bethel
The Bethel industries that see more men than women are Arts, Entertainment & Recreation (100.0%), Transportation & Warehousing (90.9%), and Administrative & Support (81.8%), whereas the industries that tend to have a higher number of women are Utilities (100.0%), Finance & Insurance (90.9%), and Educational Services (86.7%).
| Industry | Male | Female |
| Agriculture, Fishing & Hunting | 0 (0.0%) | 0 (0.0%) |
| Mining, Quarrying, & Extraction | 0 (0.0%) | 0 (0.0%) |
| Construction | 26 (81.2%) | 6 (18.8%) |
| Manufacturing | 43 (81.1%) | 10 (18.9%) |
| Wholesale Trade | 12 (75.0%) | 4 (25.0%) |
| Retail Trade | 6 (27.3%) | 16 (72.7%) |
| Transportation & Warehousing | 30 (90.9%) | 3 (9.1%) |
| Utilities | 0 (0.0%) | 2 (100.0%) |
| Information | 2 (66.7%) | 1 (33.3%) |
| Finance & Insurance | 1 (9.1%) | 10 (90.9%) |
| Real Estate, Rental & Leasing | 0 (0.0%) | 0 (0.0%) |
| Professional & Scientific | 4 (40.0%) | 6 (60.0%) |
| Enterprise Management | 0 (0.0%) | 0 (0.0%) |
| Administrative & Support | 18 (81.8%) | 4 (18.2%) |
| Educational Services | 2 (13.3%) | 13 (86.7%) |
| Health Care & Social Assistance | 3 (15.0%) | 17 (85.0%) |
| Arts, Entertainment & Recreation | 5 (100.0%) | 0 (0.0%) |
| Accommodation & Food Services | 5 (38.5%) | 8 (61.5%) |
| Public Administration | 3 (23.1%) | 10 (76.9%) |
| Total | 173 (60.9%) | 111 (39.1%) |
Education in Bethel
School Enrollment in Bethel
The most common levels of schooling among the 77 students in Bethel are middle school (24 | 31.2%), college / undergraduate (16 | 20.8%), and elementary school (15 | 19.5%).

| School Level | # Students | % Students |
| Nursery / Preschool | 2 | 2.6% |
| Kindergarten | 3 | 3.9% |
| Elementary School | 15 | 19.5% |
| Middle School | 24 | 31.2% |
| High School | 14 | 18.2% |
| College / Undergraduate | 16 | 20.8% |
| Graduate / Professional | 3 | 3.9% |
| Total | 77 | 100.0% |
School Enrollment by Age by Funding Source in Bethel
Out of a total of 77 students who are enrolled in schools in Bethel, 4 (5.2%) attend a private institution, while the remaining 73 (94.8%) are enrolled in public schools. The age group of 35 years and over has the highest likelihood of being enrolled in private schools, with 4 (66.7% in the age bracket) enrolled. Conversely, the age group of 5 to 9 year old has the lowest likelihood of being enrolled in a private school, with 17 (100.0% in the age bracket) attending a public institution.
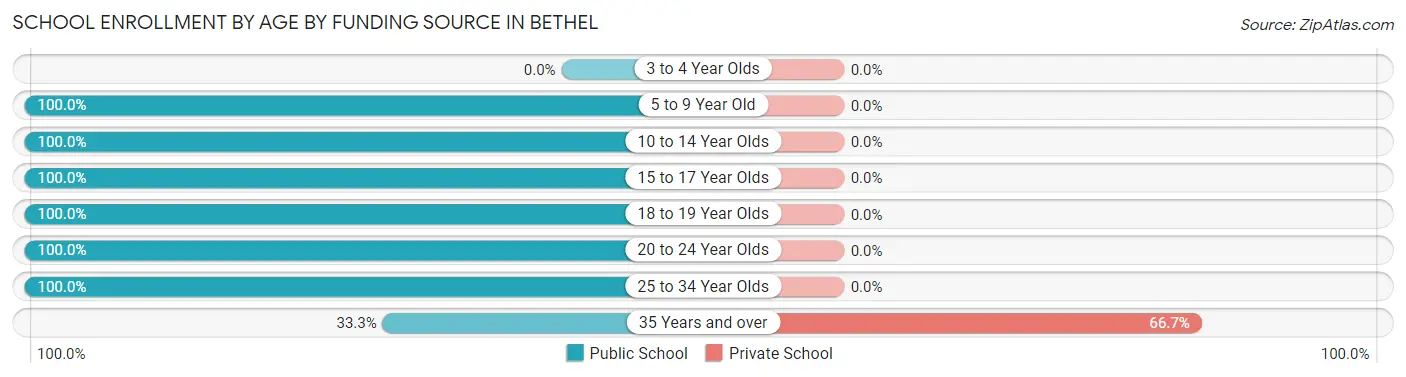
| Age Bracket | Public School | Private School |
| 3 to 4 Year Olds | 0 (0.0%) | 0 (0.0%) |
| 5 to 9 Year Old | 17 (100.0%) | 0 (0.0%) |
| 10 to 14 Year Olds | 28 (100.0%) | 0 (0.0%) |
| 15 to 17 Year Olds | 7 (100.0%) | 0 (0.0%) |
| 18 to 19 Year Olds | 4 (100.0%) | 0 (0.0%) |
| 20 to 24 Year Olds | 12 (100.0%) | 0 (0.0%) |
| 25 to 34 Year Olds | 3 (100.0%) | 0 (0.0%) |
| 35 Years and over | 2 (33.3%) | 4 (66.7%) |
| Total | 73 (94.8%) | 4 (5.2%) |
Educational Attainment by Field of Study in Bethel
Business (12 | 24.5%), psychology (7 | 14.3%), education (7 | 14.3%), communications (6 | 12.2%), and computers & mathematics (4 | 8.2%) are the most common fields of study among 49 individuals in Bethel who have obtained a bachelor's degree or higher.
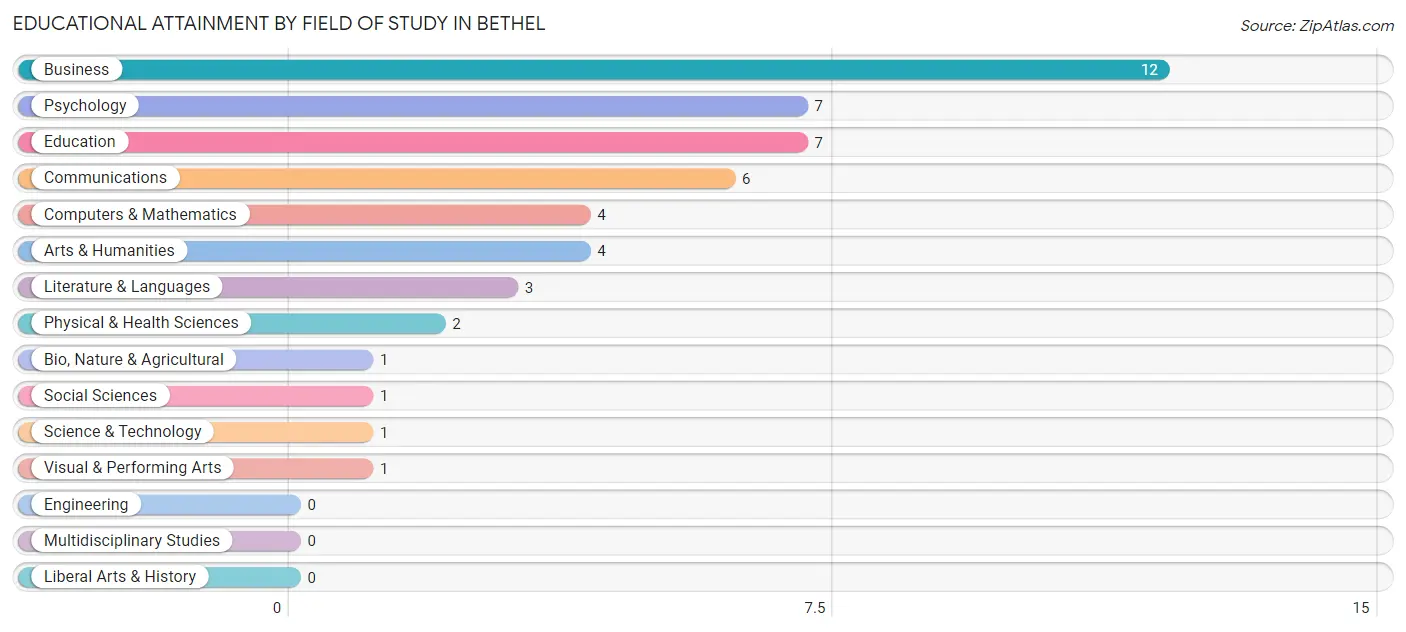
| Field of Study | # Graduates | % Graduates |
| Computers & Mathematics | 4 | 8.2% |
| Bio, Nature & Agricultural | 1 | 2.0% |
| Physical & Health Sciences | 2 | 4.1% |
| Psychology | 7 | 14.3% |
| Social Sciences | 1 | 2.0% |
| Engineering | 0 | 0.0% |
| Multidisciplinary Studies | 0 | 0.0% |
| Science & Technology | 1 | 2.0% |
| Business | 12 | 24.5% |
| Education | 7 | 14.3% |
| Literature & Languages | 3 | 6.1% |
| Liberal Arts & History | 0 | 0.0% |
| Visual & Performing Arts | 1 | 2.0% |
| Communications | 6 | 12.2% |
| Arts & Humanities | 4 | 8.2% |
| Total | 49 | 100.0% |
Transportation & Commute in Bethel
Vehicle Availability by Sex in Bethel
The most prevalent vehicle ownership categories in Bethel are males with 2 vehicles (68, accounting for 40.2%) and females with 2 vehicles (45, making up 62.4%).
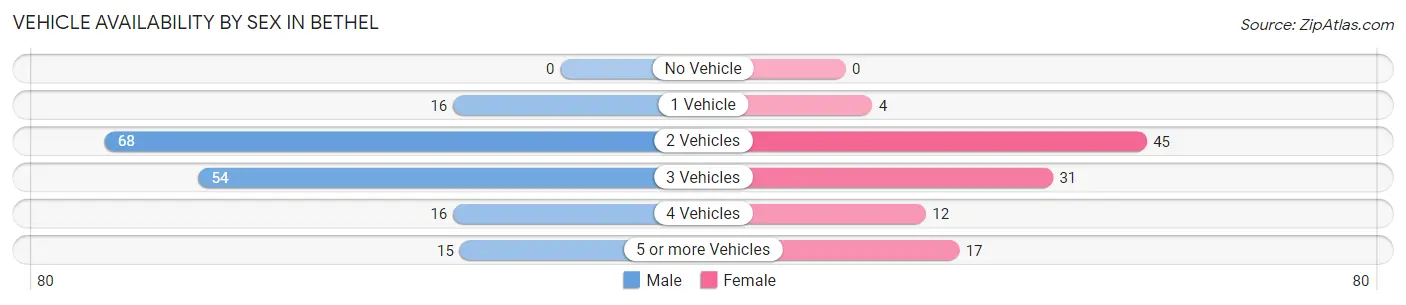
| Vehicles Available | Male | Female |
| No Vehicle | 0 (0.0%) | 0 (0.0%) |
| 1 Vehicle | 16 (9.5%) | 4 (3.7%) |
| 2 Vehicles | 68 (40.2%) | 45 (41.3%) |
| 3 Vehicles | 54 (32.0%) | 31 (28.4%) |
| 4 Vehicles | 16 (9.5%) | 12 (11.0%) |
| 5 or more Vehicles | 15 (8.9%) | 17 (15.6%) |
| Total | 169 (100.0%) | 109 (100.0%) |
Commute Time in Bethel
The most frequently occuring commute durations in Bethel are 45 to 59 minutes (53 commuters, 19.6%), 30 to 34 minutes (46 commuters, 17.0%), and 60 to 89 minutes (31 commuters, 11.4%).
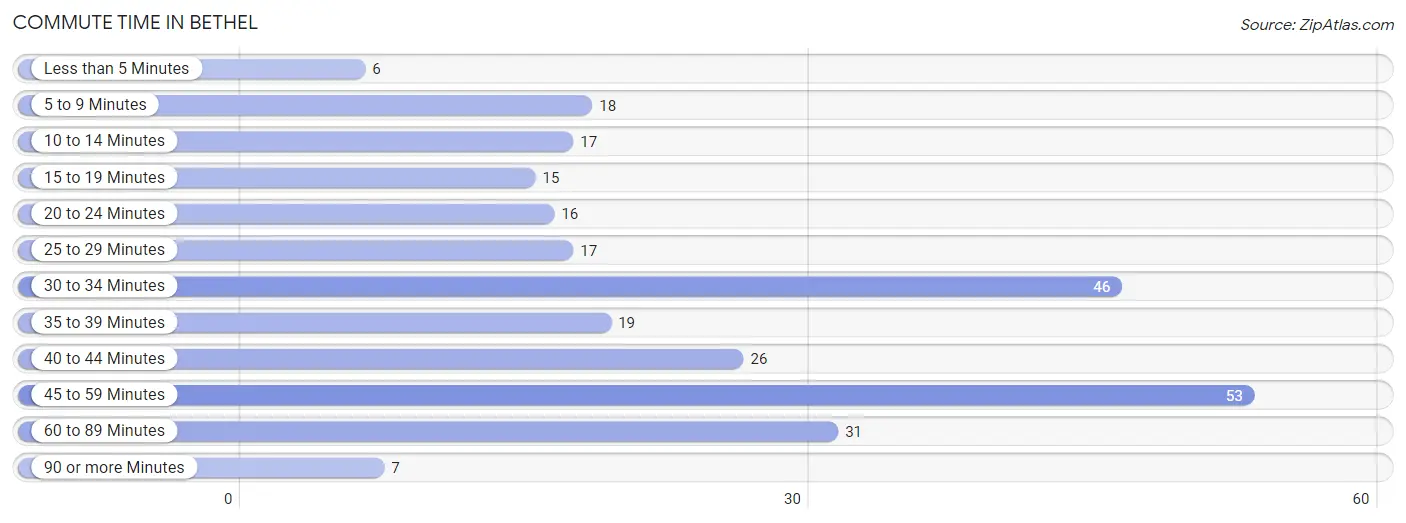
| Commute Time | # Commuters | % Commuters |
| Less than 5 Minutes | 6 | 2.2% |
| 5 to 9 Minutes | 18 | 6.6% |
| 10 to 14 Minutes | 17 | 6.3% |
| 15 to 19 Minutes | 15 | 5.5% |
| 20 to 24 Minutes | 16 | 5.9% |
| 25 to 29 Minutes | 17 | 6.3% |
| 30 to 34 Minutes | 46 | 17.0% |
| 35 to 39 Minutes | 19 | 7.0% |
| 40 to 44 Minutes | 26 | 9.6% |
| 45 to 59 Minutes | 53 | 19.6% |
| 60 to 89 Minutes | 31 | 11.4% |
| 90 or more Minutes | 7 | 2.6% |
Commute Time by Sex in Bethel
The most common commute times in Bethel are 45 to 59 minutes (40 commuters, 24.2%) for males and 30 to 34 minutes (18 commuters, 17.0%) for females.
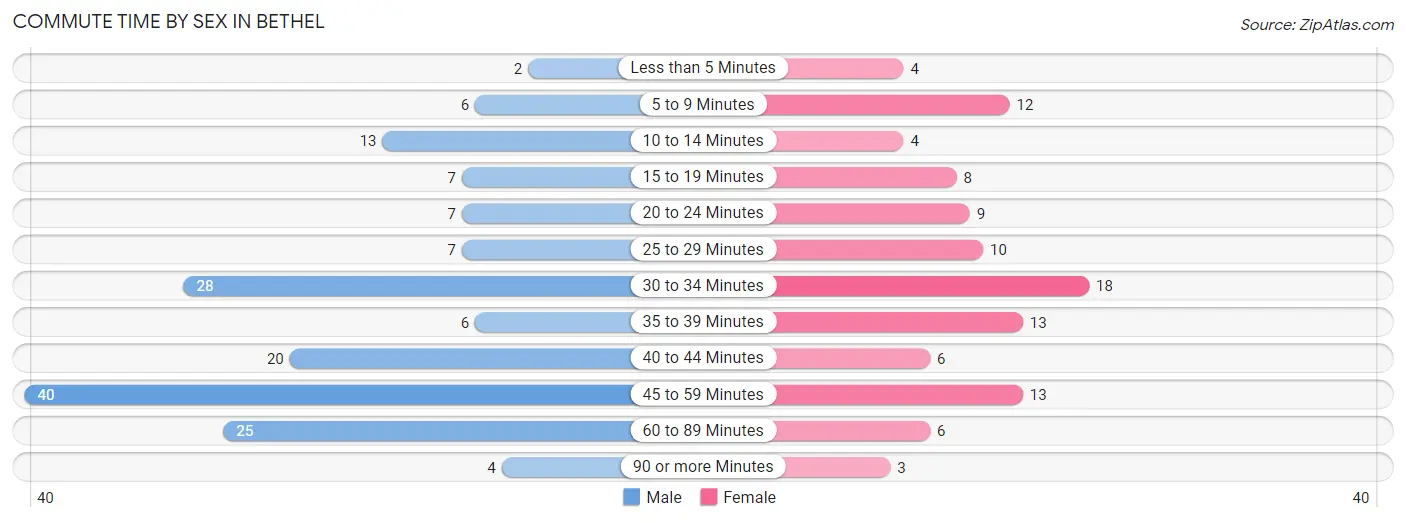
| Commute Time | Male | Female |
| Less than 5 Minutes | 2 (1.2%) | 4 (3.8%) |
| 5 to 9 Minutes | 6 (3.6%) | 12 (11.3%) |
| 10 to 14 Minutes | 13 (7.9%) | 4 (3.8%) |
| 15 to 19 Minutes | 7 (4.2%) | 8 (7.5%) |
| 20 to 24 Minutes | 7 (4.2%) | 9 (8.5%) |
| 25 to 29 Minutes | 7 (4.2%) | 10 (9.4%) |
| 30 to 34 Minutes | 28 (17.0%) | 18 (17.0%) |
| 35 to 39 Minutes | 6 (3.6%) | 13 (12.3%) |
| 40 to 44 Minutes | 20 (12.1%) | 6 (5.7%) |
| 45 to 59 Minutes | 40 (24.2%) | 13 (12.3%) |
| 60 to 89 Minutes | 25 (15.1%) | 6 (5.7%) |
| 90 or more Minutes | 4 (2.4%) | 3 (2.8%) |
Time of Departure to Work by Sex in Bethel
The most frequent times of departure to work in Bethel are 6:00 AM to 6:29 AM (22, 13.3%) for males and 6:30 AM to 6:59 AM (21, 19.8%) for females.
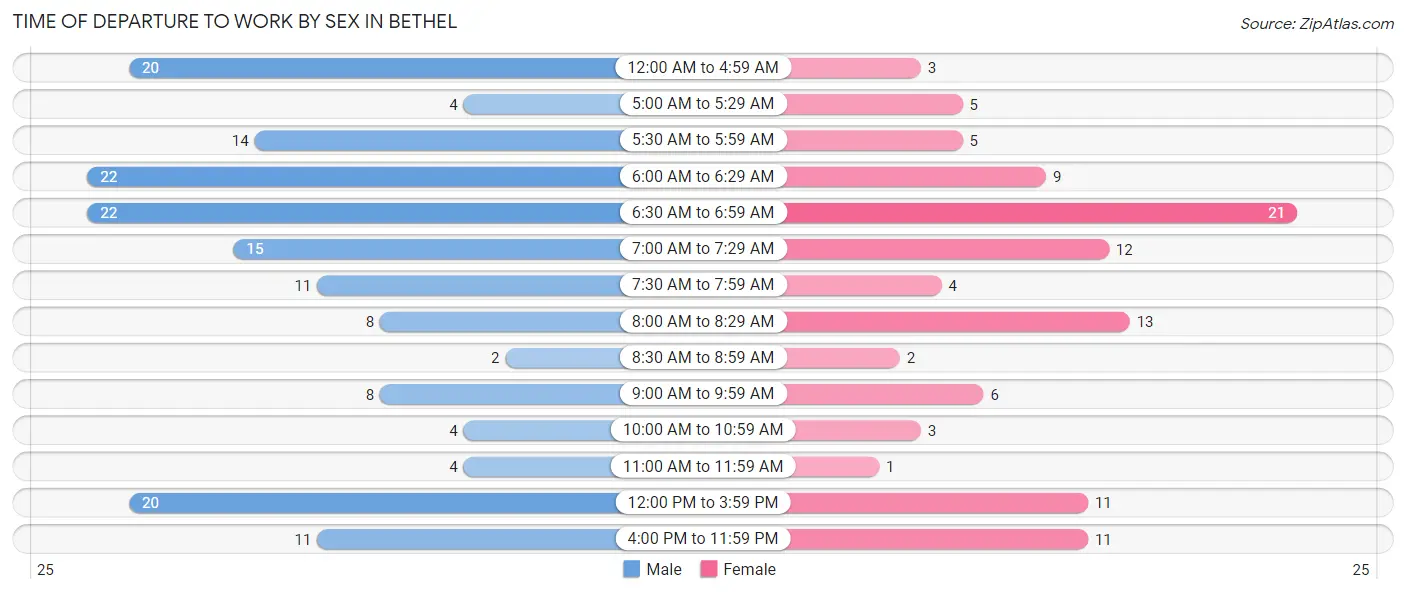
| Time of Departure | Male | Female |
| 12:00 AM to 4:59 AM | 20 (12.1%) | 3 (2.8%) |
| 5:00 AM to 5:29 AM | 4 (2.4%) | 5 (4.7%) |
| 5:30 AM to 5:59 AM | 14 (8.5%) | 5 (4.7%) |
| 6:00 AM to 6:29 AM | 22 (13.3%) | 9 (8.5%) |
| 6:30 AM to 6:59 AM | 22 (13.3%) | 21 (19.8%) |
| 7:00 AM to 7:29 AM | 15 (9.1%) | 12 (11.3%) |
| 7:30 AM to 7:59 AM | 11 (6.7%) | 4 (3.8%) |
| 8:00 AM to 8:29 AM | 8 (4.9%) | 13 (12.3%) |
| 8:30 AM to 8:59 AM | 2 (1.2%) | 2 (1.9%) |
| 9:00 AM to 9:59 AM | 8 (4.9%) | 6 (5.7%) |
| 10:00 AM to 10:59 AM | 4 (2.4%) | 3 (2.8%) |
| 11:00 AM to 11:59 AM | 4 (2.4%) | 1 (0.9%) |
| 12:00 PM to 3:59 PM | 20 (12.1%) | 11 (10.4%) |
| 4:00 PM to 11:59 PM | 11 (6.7%) | 11 (10.4%) |
| Total | 165 (100.0%) | 106 (100.0%) |
Housing Occupancy in Bethel
Occupancy by Ownership in Bethel
Of the total 182 dwellings in Bethel, owner-occupied units account for 150 (82.4%), while renter-occupied units make up 32 (17.6%).
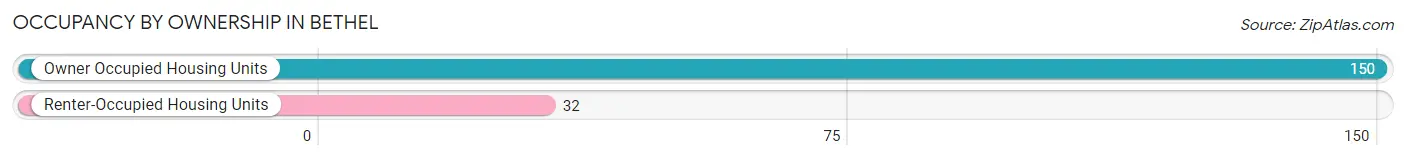
| Occupancy | # Housing Units | % Housing Units |
| Owner Occupied Housing Units | 150 | 82.4% |
| Renter-Occupied Housing Units | 32 | 17.6% |
| Total Occupied Housing Units | 182 | 100.0% |
Occupancy by Household Size in Bethel
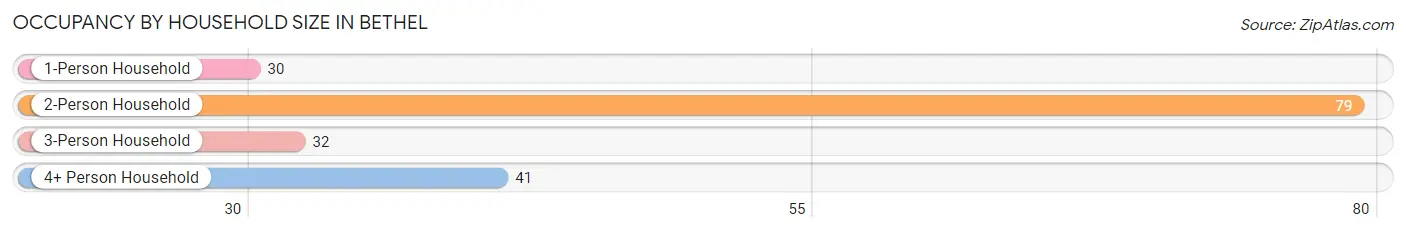
| Household Size | # Housing Units | % Housing Units |
| 1-Person Household | 30 | 16.5% |
| 2-Person Household | 79 | 43.4% |
| 3-Person Household | 32 | 17.6% |
| 4+ Person Household | 41 | 22.5% |
| Total Housing Units | 182 | 100.0% |
Occupancy by Ownership by Household Size in Bethel
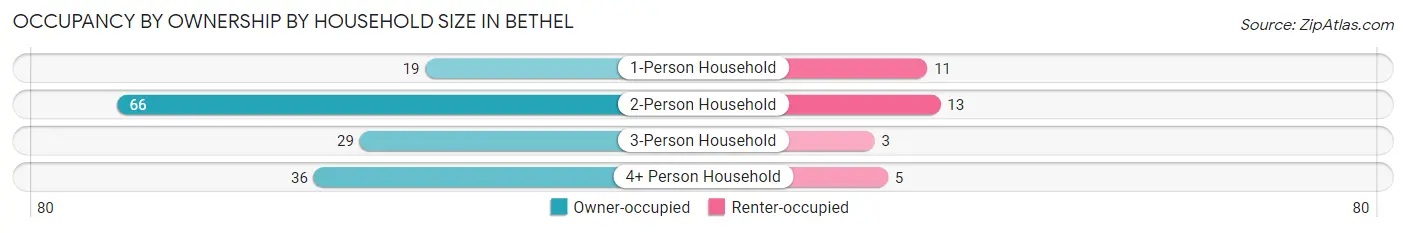
| Household Size | Owner-occupied | Renter-occupied |
| 1-Person Household | 19 (63.3%) | 11 (36.7%) |
| 2-Person Household | 66 (83.5%) | 13 (16.5%) |
| 3-Person Household | 29 (90.6%) | 3 (9.4%) |
| 4+ Person Household | 36 (87.8%) | 5 (12.2%) |
| Total Housing Units | 150 (82.4%) | 32 (17.6%) |
Occupancy by Educational Attainment in Bethel
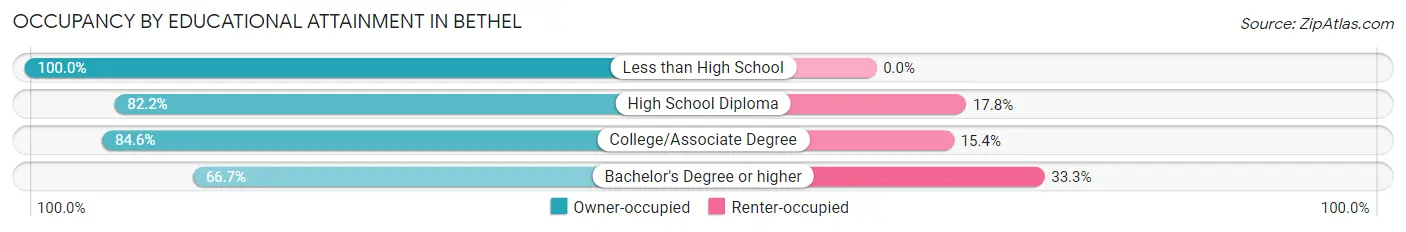
| Household Size | Owner-occupied | Renter-occupied |
| Less than High School | 10 (100.0%) | 0 (0.0%) |
| High School Diploma | 60 (82.2%) | 13 (17.8%) |
| College/Associate Degree | 66 (84.6%) | 12 (15.4%) |
| Bachelor's Degree or higher | 14 (66.7%) | 7 (33.3%) |
Occupancy by Age of Householder in Bethel
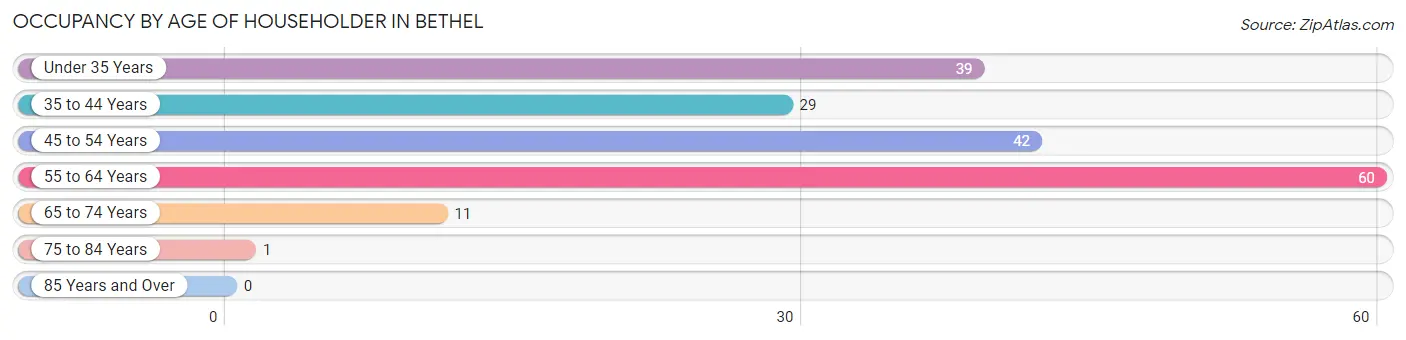
| Age Bracket | # Households | % Households |
| Under 35 Years | 39 | 21.4% |
| 35 to 44 Years | 29 | 15.9% |
| 45 to 54 Years | 42 | 23.1% |
| 55 to 64 Years | 60 | 33.0% |
| 65 to 74 Years | 11 | 6.0% |
| 75 to 84 Years | 1 | 0.5% |
| 85 Years and Over | 0 | 0.0% |
| Total | 182 | 100.0% |
Housing Finances in Bethel
Median Income by Occupancy in Bethel
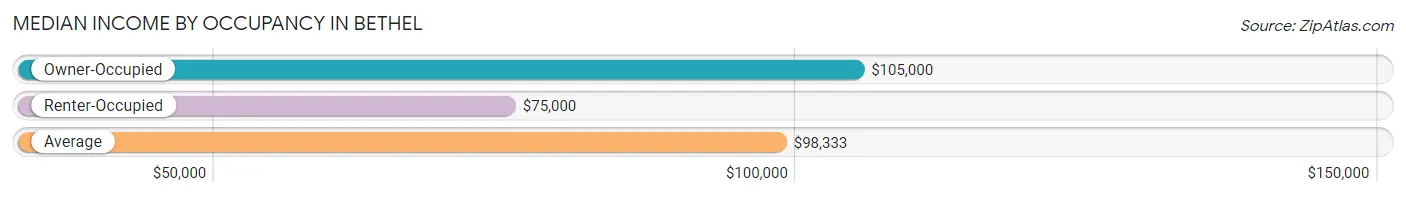
| Occupancy Type | # Households | Median Income |
| Owner-Occupied | 150 (82.4%) | $105,000 |
| Renter-Occupied | 32 (17.6%) | $75,000 |
| Average | 182 (100.0%) | $98,333 |
Occupancy by Householder Income Bracket in Bethel
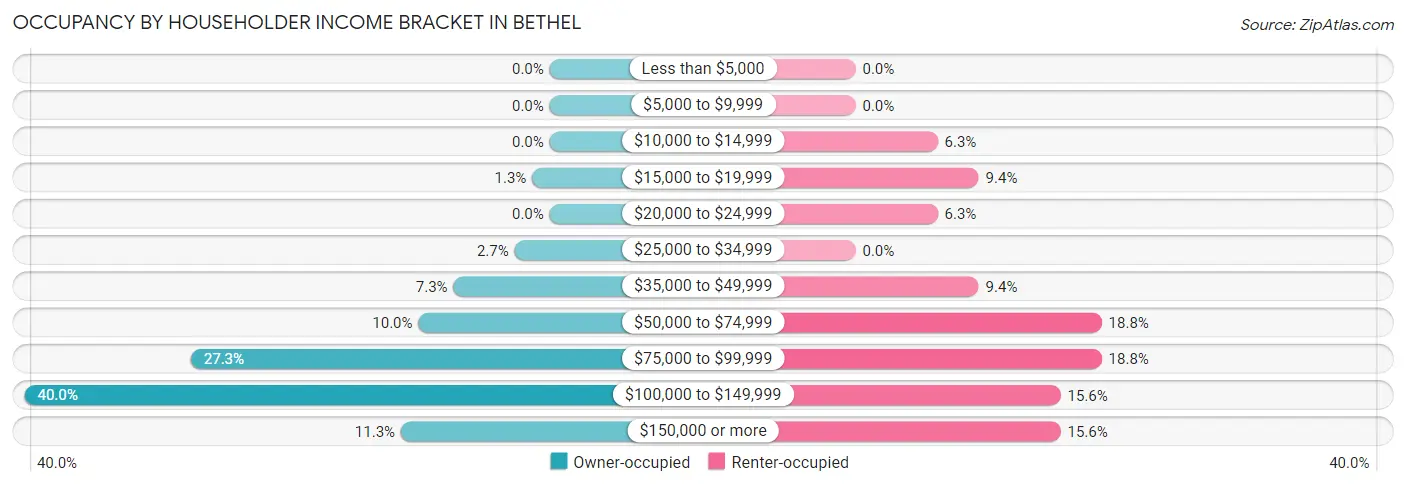
| Income Bracket | Owner-occupied | Renter-occupied |
| Less than $5,000 | 0 (0.0%) | 0 (0.0%) |
| $5,000 to $9,999 | 0 (0.0%) | 0 (0.0%) |
| $10,000 to $14,999 | 0 (0.0%) | 2 (6.2%) |
| $15,000 to $19,999 | 2 (1.3%) | 3 (9.4%) |
| $20,000 to $24,999 | 0 (0.0%) | 2 (6.2%) |
| $25,000 to $34,999 | 4 (2.7%) | 0 (0.0%) |
| $35,000 to $49,999 | 11 (7.3%) | 3 (9.4%) |
| $50,000 to $74,999 | 15 (10.0%) | 6 (18.8%) |
| $75,000 to $99,999 | 41 (27.3%) | 6 (18.8%) |
| $100,000 to $149,999 | 60 (40.0%) | 5 (15.6%) |
| $150,000 or more | 17 (11.3%) | 5 (15.6%) |
| Total | 150 (100.0%) | 32 (100.0%) |
Monthly Housing Cost Tiers in Bethel
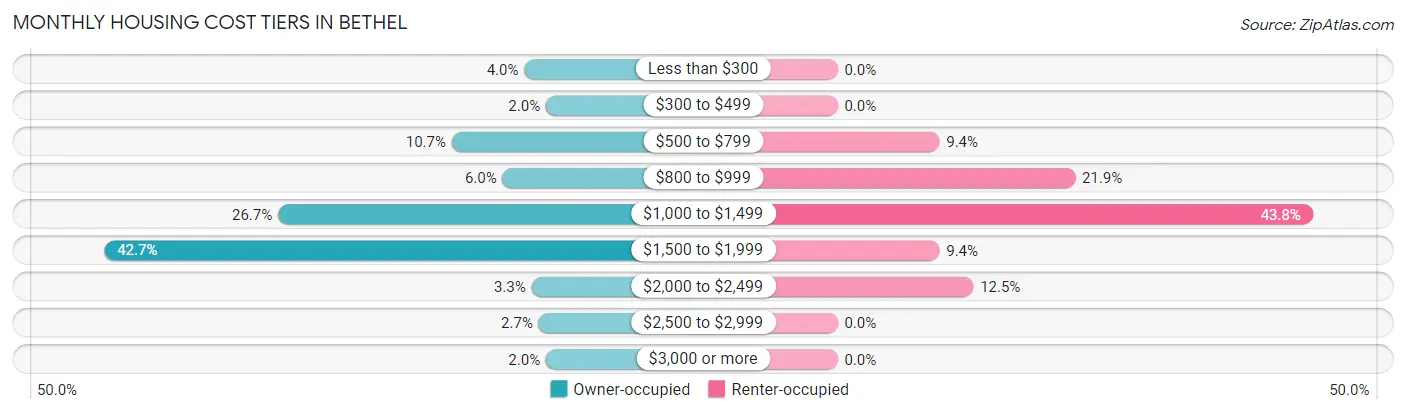
| Monthly Cost | Owner-occupied | Renter-occupied |
| Less than $300 | 6 (4.0%) | 0 (0.0%) |
| $300 to $499 | 3 (2.0%) | 0 (0.0%) |
| $500 to $799 | 16 (10.7%) | 3 (9.4%) |
| $800 to $999 | 9 (6.0%) | 7 (21.9%) |
| $1,000 to $1,499 | 40 (26.7%) | 14 (43.8%) |
| $1,500 to $1,999 | 64 (42.7%) | 3 (9.4%) |
| $2,000 to $2,499 | 5 (3.3%) | 4 (12.5%) |
| $2,500 to $2,999 | 4 (2.7%) | 0 (0.0%) |
| $3,000 or more | 3 (2.0%) | 0 (0.0%) |
| Total | 150 (100.0%) | 32 (100.0%) |
Physical Housing Characteristics in Bethel
Housing Structures in Bethel
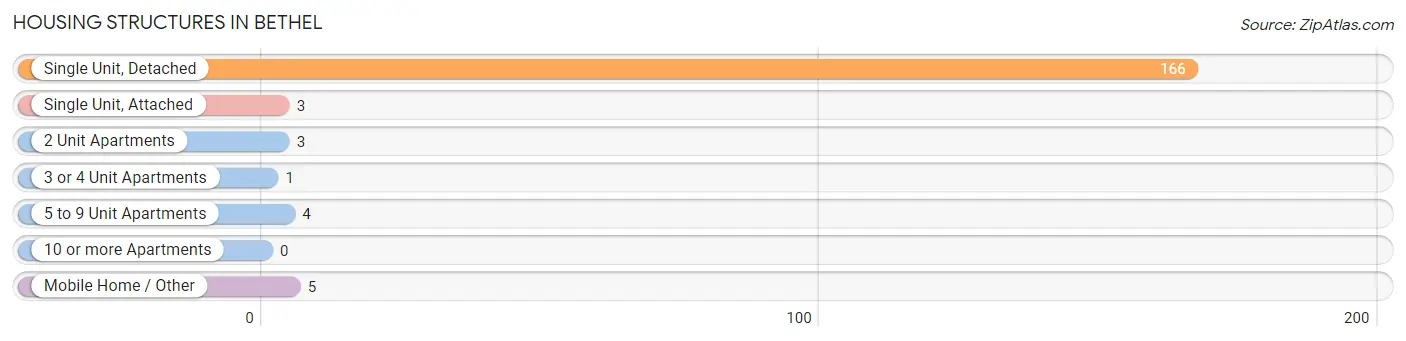
| Structure Type | # Housing Units | % Housing Units |
| Single Unit, Detached | 166 | 91.2% |
| Single Unit, Attached | 3 | 1.7% |
| 2 Unit Apartments | 3 | 1.7% |
| 3 or 4 Unit Apartments | 1 | 0.5% |
| 5 to 9 Unit Apartments | 4 | 2.2% |
| 10 or more Apartments | 0 | 0.0% |
| Mobile Home / Other | 5 | 2.8% |
| Total | 182 | 100.0% |
Housing Structures by Occupancy in Bethel
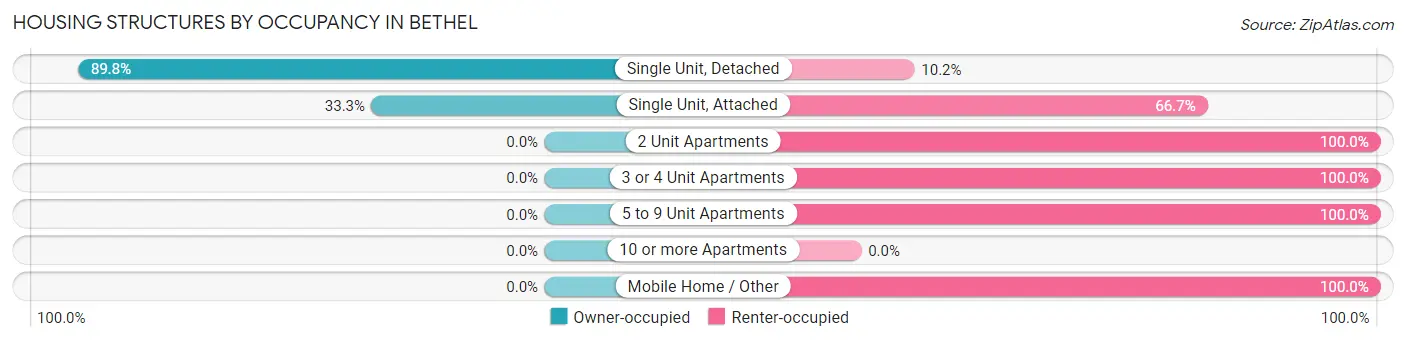
| Structure Type | Owner-occupied | Renter-occupied |
| Single Unit, Detached | 149 (89.8%) | 17 (10.2%) |
| Single Unit, Attached | 1 (33.3%) | 2 (66.7%) |
| 2 Unit Apartments | 0 (0.0%) | 3 (100.0%) |
| 3 or 4 Unit Apartments | 0 (0.0%) | 1 (100.0%) |
| 5 to 9 Unit Apartments | 0 (0.0%) | 4 (100.0%) |
| 10 or more Apartments | 0 (0.0%) | 0 (0.0%) |
| Mobile Home / Other | 0 (0.0%) | 5 (100.0%) |
| Total | 150 (82.4%) | 32 (17.6%) |
Housing Structures by Number of Rooms in Bethel
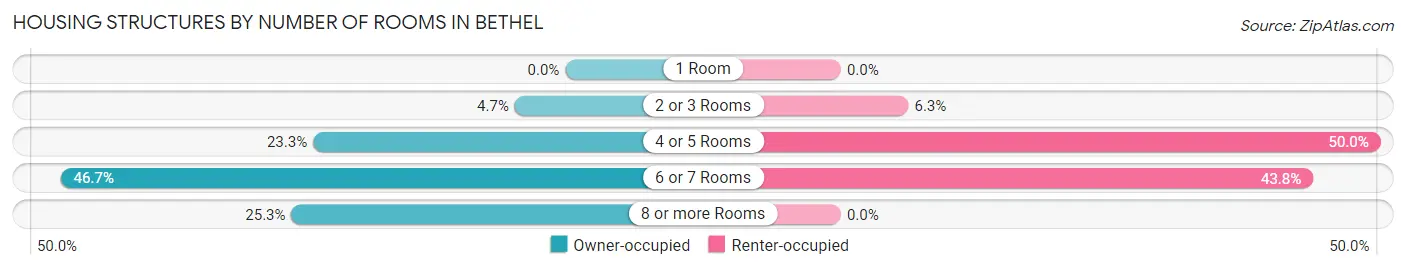
| Number of Rooms | Owner-occupied | Renter-occupied |
| 1 Room | 0 (0.0%) | 0 (0.0%) |
| 2 or 3 Rooms | 7 (4.7%) | 2 (6.2%) |
| 4 or 5 Rooms | 35 (23.3%) | 16 (50.0%) |
| 6 or 7 Rooms | 70 (46.7%) | 14 (43.8%) |
| 8 or more Rooms | 38 (25.3%) | 0 (0.0%) |
| Total | 150 (100.0%) | 32 (100.0%) |
Housing Structure by Heating Type in Bethel
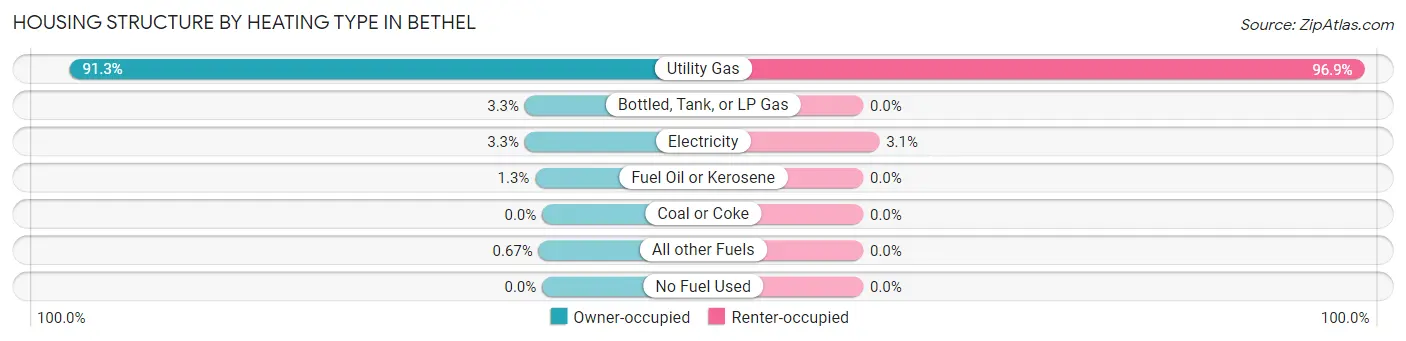
| Heating Type | Owner-occupied | Renter-occupied |
| Utility Gas | 137 (91.3%) | 31 (96.9%) |
| Bottled, Tank, or LP Gas | 5 (3.3%) | 0 (0.0%) |
| Electricity | 5 (3.3%) | 1 (3.1%) |
| Fuel Oil or Kerosene | 2 (1.3%) | 0 (0.0%) |
| Coal or Coke | 0 (0.0%) | 0 (0.0%) |
| All other Fuels | 1 (0.7%) | 0 (0.0%) |
| No Fuel Used | 0 (0.0%) | 0 (0.0%) |
| Total | 150 (100.0%) | 32 (100.0%) |
Household Vehicle Usage in Bethel
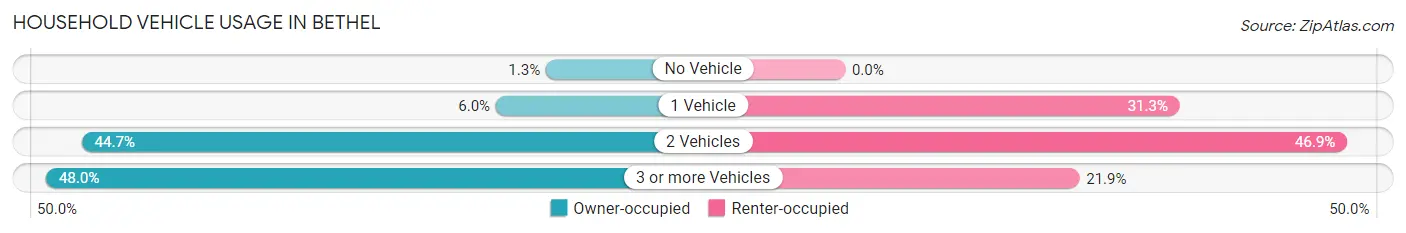
| Vehicles per Household | Owner-occupied | Renter-occupied |
| No Vehicle | 2 (1.3%) | 0 (0.0%) |
| 1 Vehicle | 9 (6.0%) | 10 (31.2%) |
| 2 Vehicles | 67 (44.7%) | 15 (46.9%) |
| 3 or more Vehicles | 72 (48.0%) | 7 (21.9%) |
| Total | 150 (100.0%) | 32 (100.0%) |
Real Estate & Mortgages in Bethel
Real Estate and Mortgage Overview in Bethel
| Characteristic | Without Mortgage | With Mortgage |
| Housing Units | 22 | 128 |
| Median Property Value | $216,700 | $240,000 |
| Median Household Income | $106,250 | $17 |
| Monthly Housing Costs | $533 | $3 |
| Real Estate Taxes | $2,136 | $5 |
Property Value by Mortgage Status in Bethel
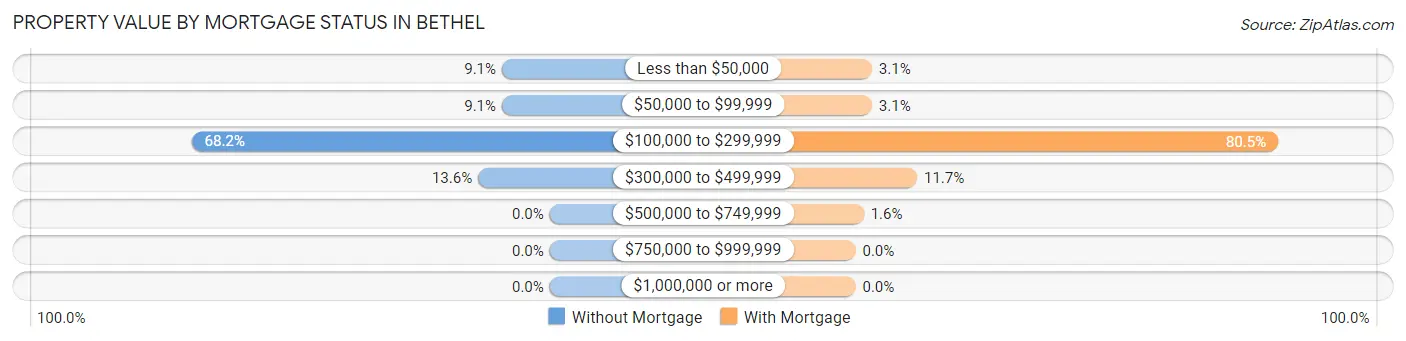
| Property Value | Without Mortgage | With Mortgage |
| Less than $50,000 | 2 (9.1%) | 4 (3.1%) |
| $50,000 to $99,999 | 2 (9.1%) | 4 (3.1%) |
| $100,000 to $299,999 | 15 (68.2%) | 103 (80.5%) |
| $300,000 to $499,999 | 3 (13.6%) | 15 (11.7%) |
| $500,000 to $749,999 | 0 (0.0%) | 2 (1.6%) |
| $750,000 to $999,999 | 0 (0.0%) | 0 (0.0%) |
| $1,000,000 or more | 0 (0.0%) | 0 (0.0%) |
| Total | 22 (100.0%) | 128 (100.0%) |
Household Income by Mortgage Status in Bethel
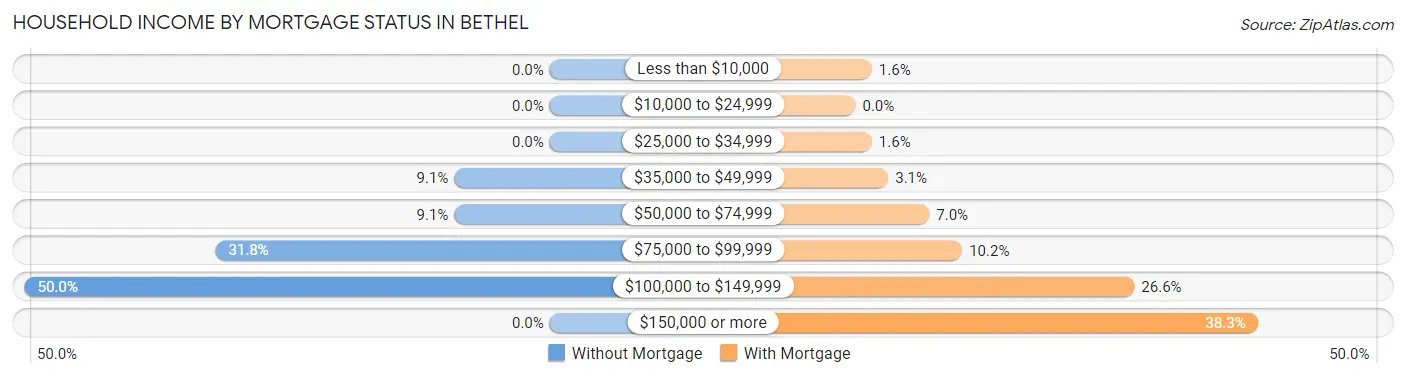
| Household Income | Without Mortgage | With Mortgage |
| Less than $10,000 | 0 (0.0%) | 2 (1.6%) |
| $10,000 to $24,999 | 0 (0.0%) | 0 (0.0%) |
| $25,000 to $34,999 | 0 (0.0%) | 2 (1.6%) |
| $35,000 to $49,999 | 2 (9.1%) | 4 (3.1%) |
| $50,000 to $74,999 | 2 (9.1%) | 9 (7.0%) |
| $75,000 to $99,999 | 7 (31.8%) | 13 (10.2%) |
| $100,000 to $149,999 | 11 (50.0%) | 34 (26.6%) |
| $150,000 or more | 0 (0.0%) | 49 (38.3%) |
| Total | 22 (100.0%) | 128 (100.0%) |
Property Value to Household Income Ratio in Bethel
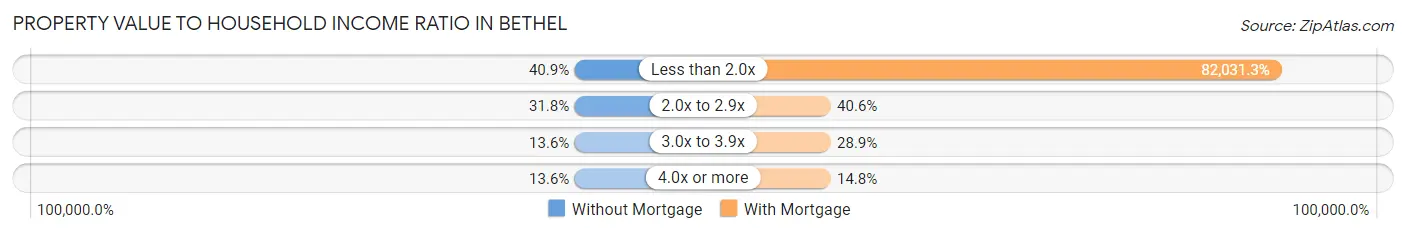
| Value-to-Income Ratio | Without Mortgage | With Mortgage |
| Less than 2.0x | 9 (40.9%) | 105,000 (82,031.2%) |
| 2.0x to 2.9x | 7 (31.8%) | 52 (40.6%) |
| 3.0x to 3.9x | 3 (13.6%) | 37 (28.9%) |
| 4.0x or more | 3 (13.6%) | 19 (14.8%) |
| Total | 22 (100.0%) | 128 (100.0%) |
Real Estate Taxes by Mortgage Status in Bethel
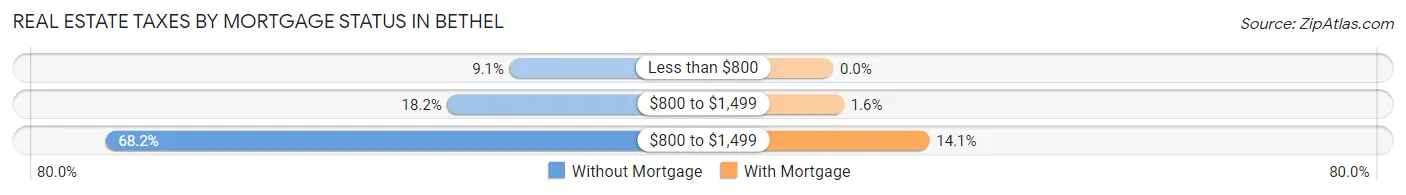
| Property Taxes | Without Mortgage | With Mortgage |
| Less than $800 | 2 (9.1%) | 0 (0.0%) |
| $800 to $1,499 | 4 (18.2%) | 2 (1.6%) |
| $800 to $1,499 | 15 (68.2%) | 18 (14.1%) |
| Total | 22 (100.0%) | 128 (100.0%) |
Health & Disability in Bethel
Health Insurance Coverage by Age in Bethel
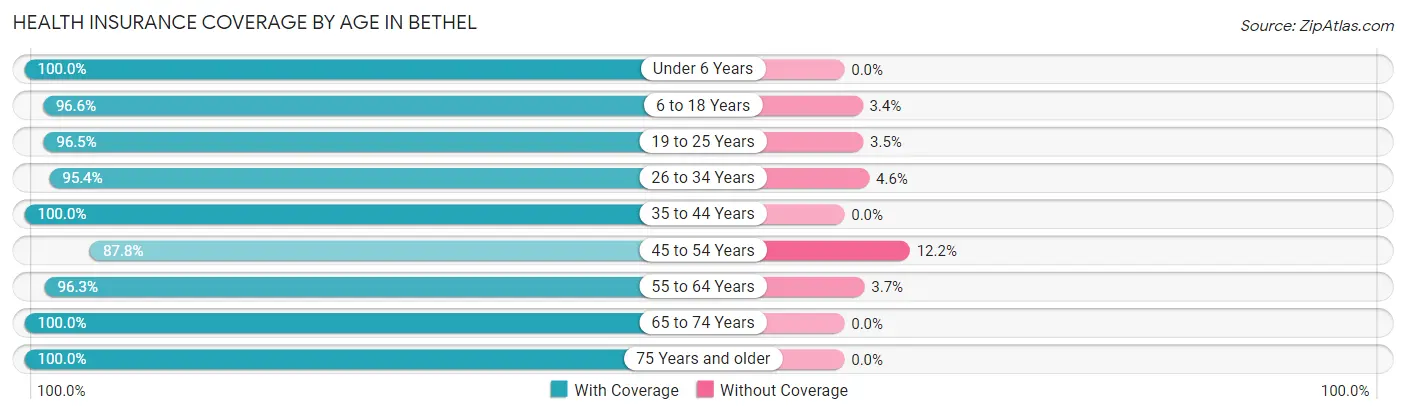
| Age Bracket | With Coverage | Without Coverage |
| Under 6 Years | 25 (100.0%) | 0 (0.0%) |
| 6 to 18 Years | 57 (96.6%) | 2 (3.4%) |
| 19 to 25 Years | 55 (96.5%) | 2 (3.5%) |
| 26 to 34 Years | 62 (95.4%) | 3 (4.6%) |
| 35 to 44 Years | 52 (100.0%) | 0 (0.0%) |
| 45 to 54 Years | 72 (87.8%) | 10 (12.2%) |
| 55 to 64 Years | 103 (96.3%) | 4 (3.7%) |
| 65 to 74 Years | 19 (100.0%) | 0 (0.0%) |
| 75 Years and older | 4 (100.0%) | 0 (0.0%) |
| Total | 449 (95.5%) | 21 (4.5%) |
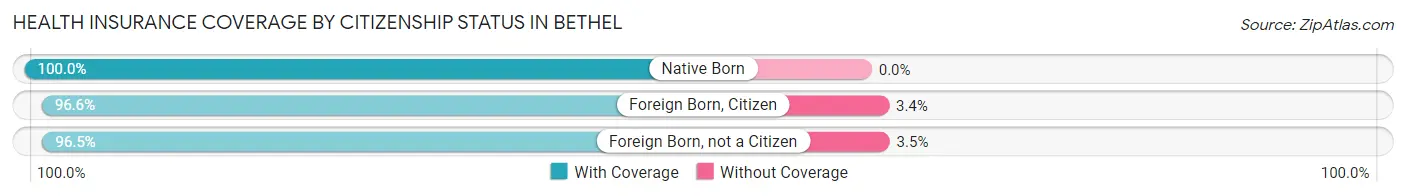
Health Insurance Coverage by Citizenship Status in Bethel
| Citizenship Status | With Coverage | Without Coverage |
| Native Born | 25 (100.0%) | 0 (0.0%) |
| Foreign Born, Citizen | 57 (96.6%) | 2 (3.4%) |
| Foreign Born, not a Citizen | 55 (96.5%) | 2 (3.5%) |
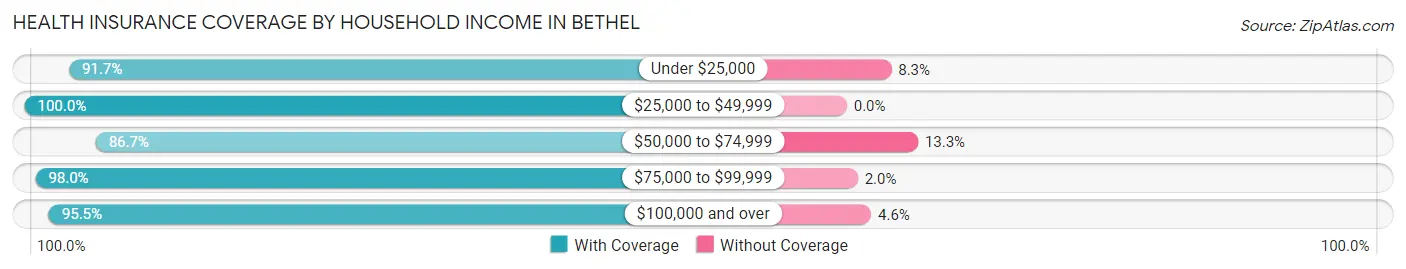
Health Insurance Coverage by Household Income in Bethel
| Household Income | With Coverage | Without Coverage |
| Under $25,000 | 11 (91.7%) | 1 (8.3%) |
| $25,000 to $49,999 | 51 (100.0%) | 0 (0.0%) |
| $50,000 to $74,999 | 39 (86.7%) | 6 (13.3%) |
| $75,000 to $99,999 | 96 (98.0%) | 2 (2.0%) |
| $100,000 and over | 252 (95.5%) | 12 (4.5%) |
Public vs Private Health Insurance Coverage by Age in Bethel
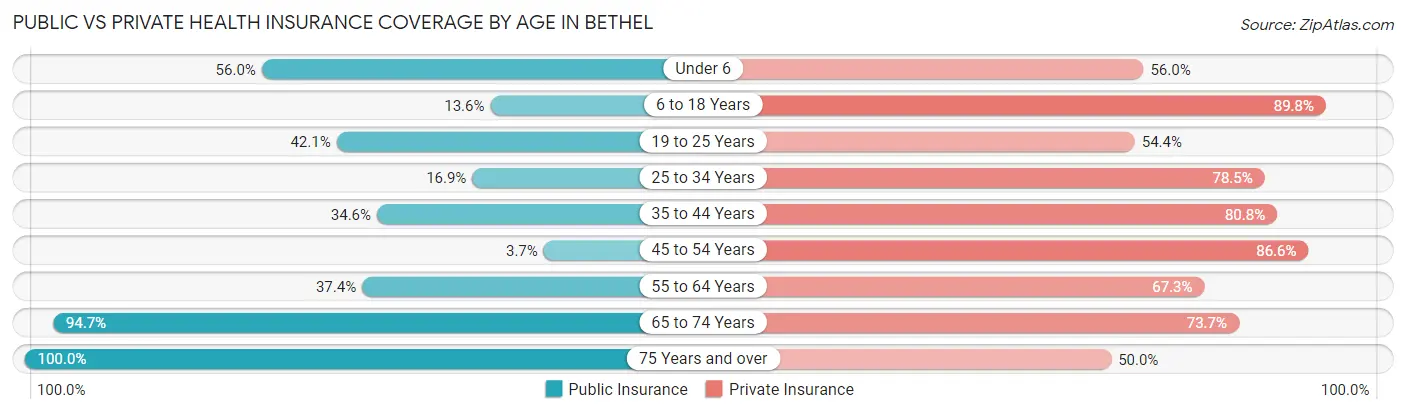
| Age Bracket | Public Insurance | Private Insurance |
| Under 6 | 14 (56.0%) | 14 (56.0%) |
| 6 to 18 Years | 8 (13.6%) | 53 (89.8%) |
| 19 to 25 Years | 24 (42.1%) | 31 (54.4%) |
| 25 to 34 Years | 11 (16.9%) | 51 (78.5%) |
| 35 to 44 Years | 18 (34.6%) | 42 (80.8%) |
| 45 to 54 Years | 3 (3.7%) | 71 (86.6%) |
| 55 to 64 Years | 40 (37.4%) | 72 (67.3%) |
| 65 to 74 Years | 18 (94.7%) | 14 (73.7%) |
| 75 Years and over | 4 (100.0%) | 2 (50.0%) |
| Total | 140 (29.8%) | 350 (74.5%) |
Disability Status by Sex by Age in Bethel
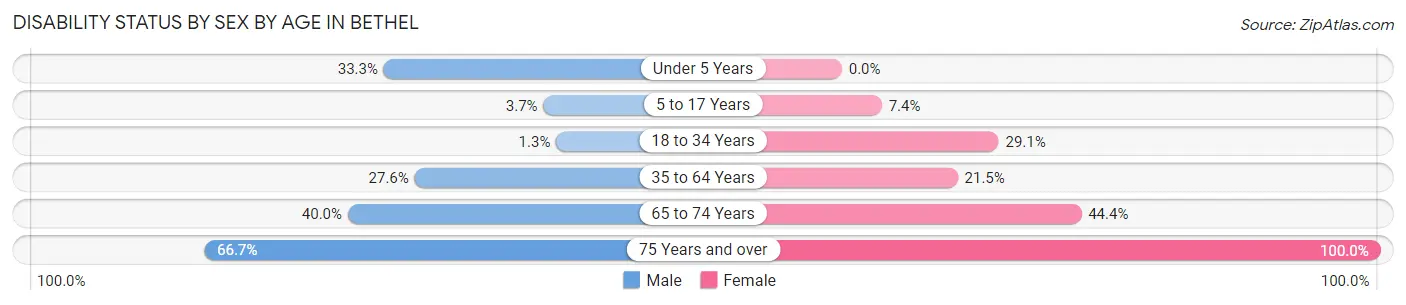
| Age Bracket | Male | Female |
| Under 5 Years | 2 (33.3%) | 0 (0.0%) |
| 5 to 17 Years | 1 (3.7%) | 2 (7.4%) |
| 18 to 34 Years | 1 (1.3%) | 16 (29.1%) |
| 35 to 64 Years | 37 (27.6%) | 23 (21.5%) |
| 65 to 74 Years | 4 (40.0%) | 4 (44.4%) |
| 75 Years and over | 2 (66.7%) | 1 (100.0%) |
Disability Class by Sex by Age in Bethel
Disability Class: Hearing Difficulty
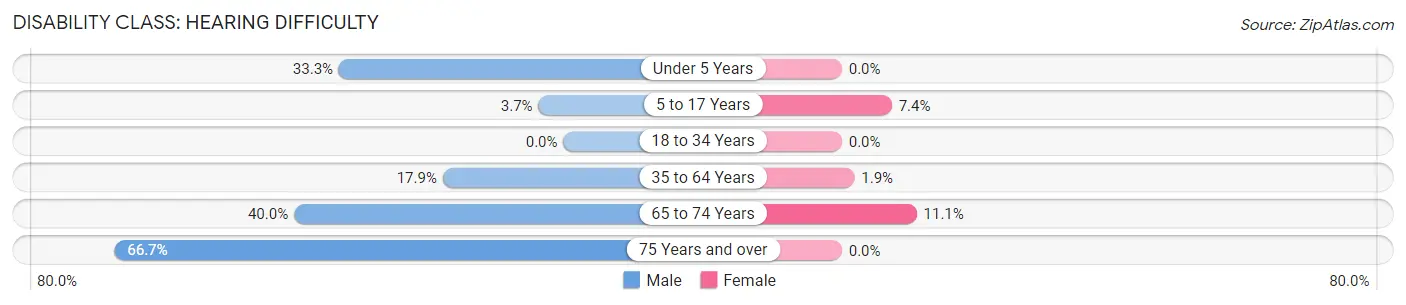
| Age Bracket | Male | Female |
| Under 5 Years | 2 (33.3%) | 0 (0.0%) |
| 5 to 17 Years | 1 (3.7%) | 2 (7.4%) |
| 18 to 34 Years | 0 (0.0%) | 0 (0.0%) |
| 35 to 64 Years | 24 (17.9%) | 2 (1.9%) |
| 65 to 74 Years | 4 (40.0%) | 1 (11.1%) |
| 75 Years and over | 2 (66.7%) | 0 (0.0%) |
Disability Class: Vision Difficulty
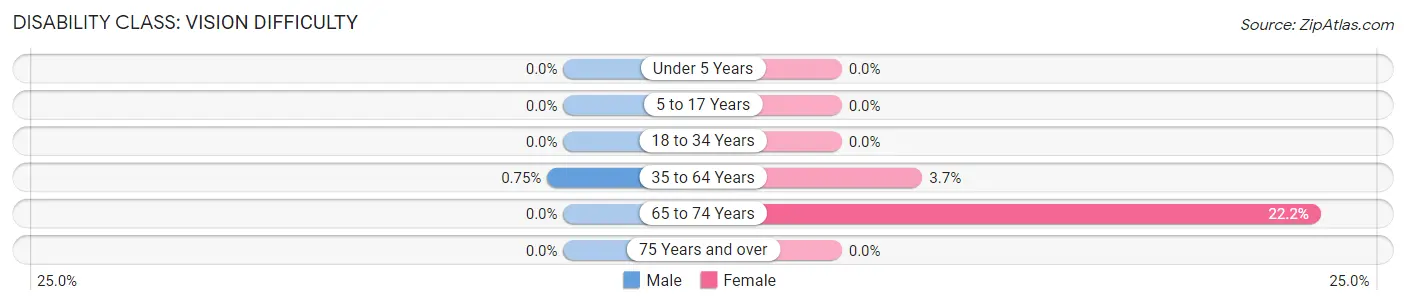
| Age Bracket | Male | Female |
| Under 5 Years | 0 (0.0%) | 0 (0.0%) |
| 5 to 17 Years | 0 (0.0%) | 0 (0.0%) |
| 18 to 34 Years | 0 (0.0%) | 0 (0.0%) |
| 35 to 64 Years | 1 (0.7%) | 4 (3.7%) |
| 65 to 74 Years | 0 (0.0%) | 2 (22.2%) |
| 75 Years and over | 0 (0.0%) | 0 (0.0%) |
Disability Class: Cognitive Difficulty
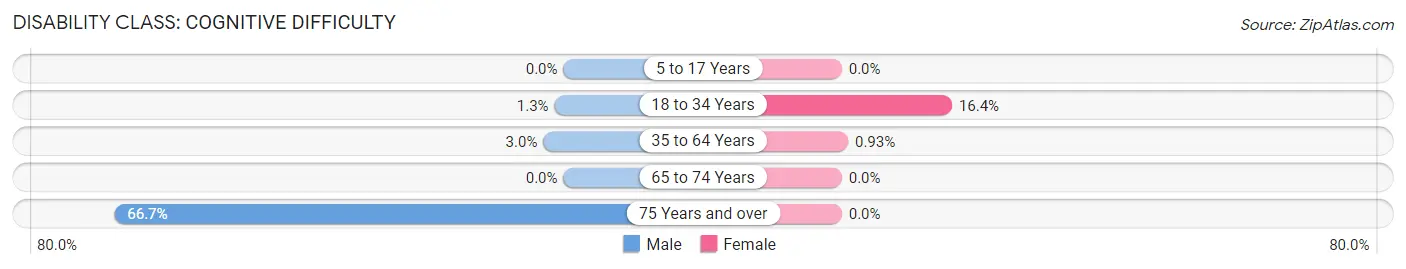
| Age Bracket | Male | Female |
| 5 to 17 Years | 0 (0.0%) | 0 (0.0%) |
| 18 to 34 Years | 1 (1.3%) | 9 (16.4%) |
| 35 to 64 Years | 4 (3.0%) | 1 (0.9%) |
| 65 to 74 Years | 0 (0.0%) | 0 (0.0%) |
| 75 Years and over | 2 (66.7%) | 0 (0.0%) |
Disability Class: Ambulatory Difficulty
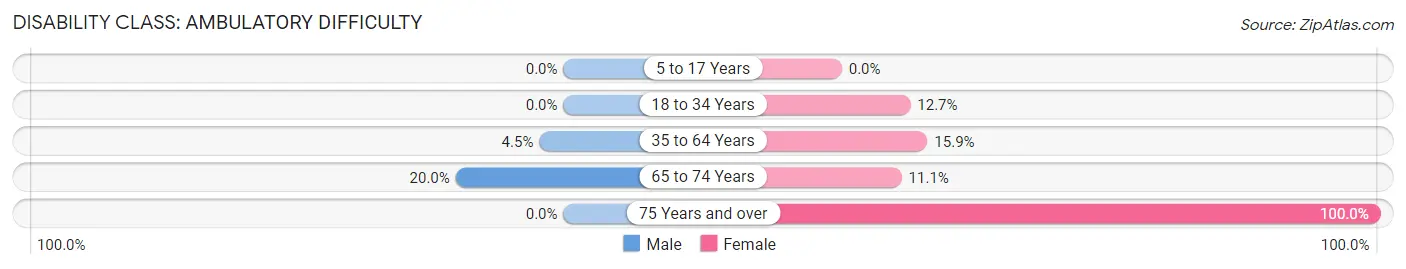
| Age Bracket | Male | Female |
| 5 to 17 Years | 0 (0.0%) | 0 (0.0%) |
| 18 to 34 Years | 0 (0.0%) | 7 (12.7%) |
| 35 to 64 Years | 6 (4.5%) | 17 (15.9%) |
| 65 to 74 Years | 2 (20.0%) | 1 (11.1%) |
| 75 Years and over | 0 (0.0%) | 1 (100.0%) |
Disability Class: Self-Care Difficulty
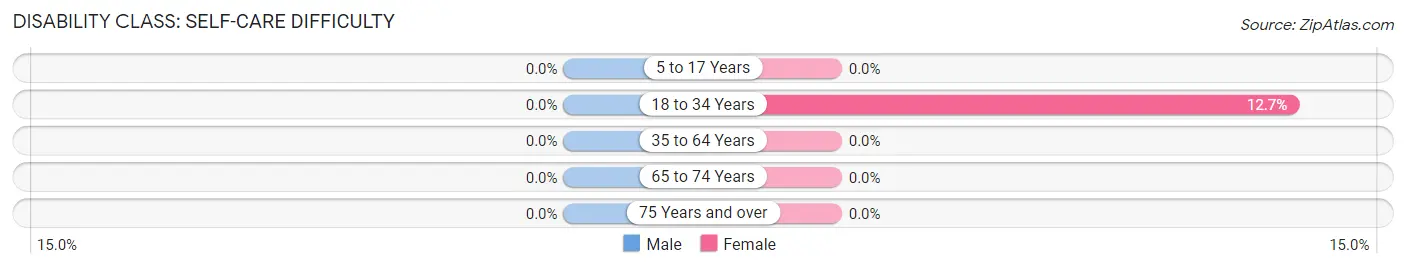
| Age Bracket | Male | Female |
| 5 to 17 Years | 0 (0.0%) | 0 (0.0%) |
| 18 to 34 Years | 0 (0.0%) | 7 (12.7%) |
| 35 to 64 Years | 0 (0.0%) | 0 (0.0%) |
| 65 to 74 Years | 0 (0.0%) | 0 (0.0%) |
| 75 Years and over | 0 (0.0%) | 0 (0.0%) |
Technology Access in Bethel
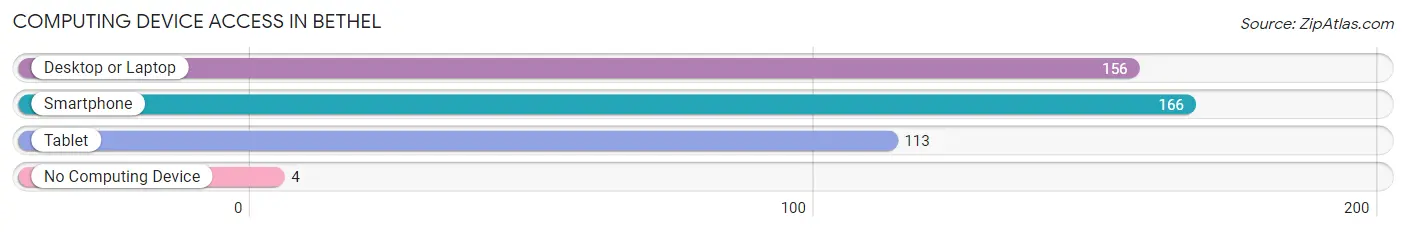
Computing Device Access in Bethel
| Device Type | # Households | % Households |
| Desktop or Laptop | 156 | 85.7% |
| Smartphone | 166 | 91.2% |
| Tablet | 113 | 62.1% |
| No Computing Device | 4 | 2.2% |
| Total | 182 | 100.0% |
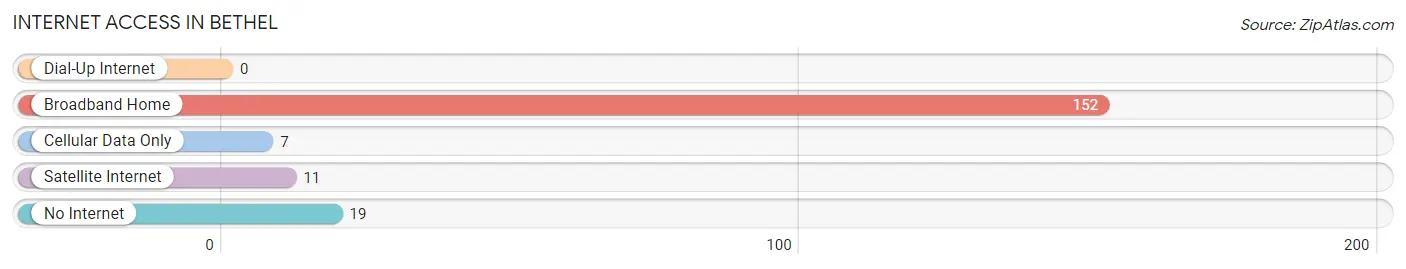
Internet Access in Bethel
| Internet Type | # Households | % Households |
| Dial-Up Internet | 0 | 0.0% |
| Broadband Home | 152 | 83.5% |
| Cellular Data Only | 7 | 3.8% |
| Satellite Internet | 11 | 6.0% |
| No Internet | 19 | 10.4% |
| Total | 182 | 100.0% |
Bethel Summary
Bethel, Minnesota is a small city located in Anoka County, Minnesota. It is situated on the banks of the Mississippi River, just north of the Twin Cities metropolitan area. The city has a population of approximately 8,000 people and is part of the larger Twin Cities metropolitan area.
History
Bethel was first settled in 1855 by a group of Swedish immigrants. The city was named after the biblical city of Bethel, which is mentioned in the Old Testament. The settlers were attracted to the area due to its fertile soil and abundant natural resources. The city was officially incorporated in 1858 and quickly grew to become a thriving agricultural community.
In the late 19th century, Bethel began to experience a period of industrialization. The city was home to several factories, including a flour mill, a sawmill, and a brickyard. The city also became a popular destination for tourists, who were drawn to the area’s natural beauty and recreational opportunities.
Geography
Bethel is located in Anoka County, Minnesota, on the banks of the Mississippi River. The city is situated just north of the Twin Cities metropolitan area and is part of the larger Minneapolis-St. Paul metropolitan area. The city covers an area of approximately 4.5 square miles and has a population of 8,000 people.
The city is located in a region of rolling hills and is surrounded by several lakes, including Lake George, Lake Elmo, and Lake Minnetonka. The city is also home to several parks, including Bethel Park, which is located on the banks of the Mississippi River.
Economy
Bethel’s economy is largely based on agriculture and tourism. The city is home to several farms, which produce a variety of crops, including corn, soybeans, and wheat. The city is also home to several tourist attractions, including the Bethel Historical Society Museum and the Bethel Arts Center.
The city is also home to several businesses, including a variety of retail stores, restaurants, and hotels. The city is also home to several manufacturing companies, including a paper mill and a printing company.
Demographics
As of the 2010 census, Bethel had a population of 8,000 people. The city has a median age of 38.7 years and a median household income of $50,000. The city is predominantly white, with approximately 90% of the population identifying as Caucasian. The city also has a large Hispanic population, with approximately 10% of the population identifying as Hispanic or Latino.
Conclusion
Bethel, Minnesota is a small city located in Anoka County, Minnesota. It is situated on the banks of the Mississippi River, just north of the Twin Cities metropolitan area. The city has a population of approximately 8,000 people and is part of the larger Twin Cities metropolitan area. The city’s economy is largely based on agriculture and tourism, and the city is home to several businesses, including a variety of retail stores, restaurants, and hotels. The city is predominantly white, with approximately 90% of the population identifying as Caucasian. The city also has a large Hispanic population, with approximately 10% of the population identifying as Hispanic or Latino.
Common Questions
What is Per Capita Income in Bethel?
Per Capita income in Bethel is $39,335.
What is the Median Family Income in Bethel?
Median Family Income in Bethel is $106,500.
What is the Median Household income in Bethel?
Median Household Income in Bethel is $98,333.
What is Income or Wage Gap in Bethel?
Income or Wage Gap in Bethel is 30.6%.
Women in Bethel earn 69.4 cents for every dollar earned by a man.
What is Inequality or Gini Index in Bethel?
Inequality or Gini Index in Bethel is 0.24.
What is the Total Population of Bethel?
Total Population of Bethel is 470.
What is the Total Male Population of Bethel?
Total Male Population of Bethel is 256.
What is the Total Female Population of Bethel?
Total Female Population of Bethel is 214.
What is the Ratio of Males per 100 Females in Bethel?
There are 119.63 Males per 100 Females in Bethel.
What is the Ratio of Females per 100 Males in Bethel?
There are 83.59 Females per 100 Males in Bethel.
What is the Median Population Age in Bethel?
Median Population Age in Bethel is 41.4 Years.
What is the Average Family Size in Bethel
Average Family Size in Bethel is 2.9 People.
What is the Average Household Size in Bethel
Average Household Size in Bethel is 2.6 People.
How Large is the Labor Force in Bethel?
There are 299 People in the Labor Forcein in Bethel.
What is the Percentage of People in the Labor Force in Bethel?
74.9% of People are in the Labor Force in Bethel.
What is the Unemployment Rate in Bethel?
Unemployment Rate in Bethel is 5.0%.