Prospect, LA Map & Demographics
Prospect Map
Prospect Overview
$15,217
PER CAPITA INCOME
$46,500
AVG FAMILY INCOME
$46,313
AVG HOUSEHOLD INCOME
0.13
INEQUALITY / GINI INDEX
220
TOTAL POPULATION
110
MALE POPULATION
110
FEMALE POPULATION
100.00
MALES / 100 FEMALES
100.00
FEMALES / 100 MALES
47.6
MEDIAN AGE
3.2
AVG FAMILY SIZE
3.1
AVG HOUSEHOLD SIZE
88
LABOR FORCE [ PEOPLE ]
63.8%
PERCENT IN LABOR FORCE
Income in Prospect
Income Overview in Prospect
Per Capita Income in Prospect is $15,217, while median incomes of families and households are $46,500 and $46,313 respectively.
| Characteristic | Number | Measure |
| Per Capita Income | 220 | $15,217 |
| Median Family Income | 66 | $46,500 |
| Mean Family Income | 66 | $46,370 |
| Median Household Income | 72 | $46,313 |
| Mean Household Income | 72 | $45,990 |
| Income Deficit | 66 | $0 |
| Wage / Income Gap (%) | 220 | 0.00% |
| Wage / Income Gap ($) | 220 | 100.00¢ per $1 |
| Gini / Inequality Index | 220 | 0.13 |
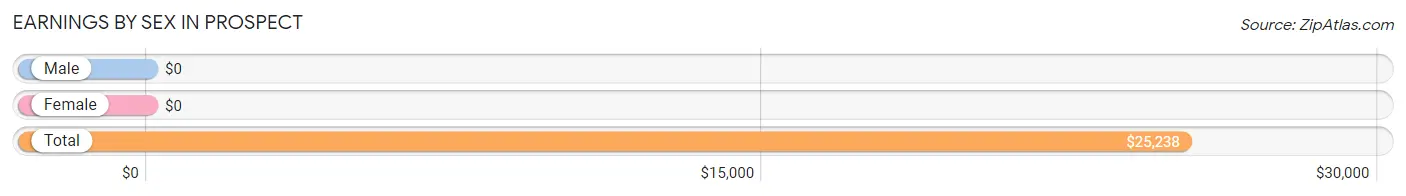
Earnings by Sex in Prospect
| Sex | Number | Average Earnings |
| Male | 48 (54.5%) | $0 |
| Female | 40 (45.5%) | $0 |
| Total | 88 (100.0%) | $25,238 |
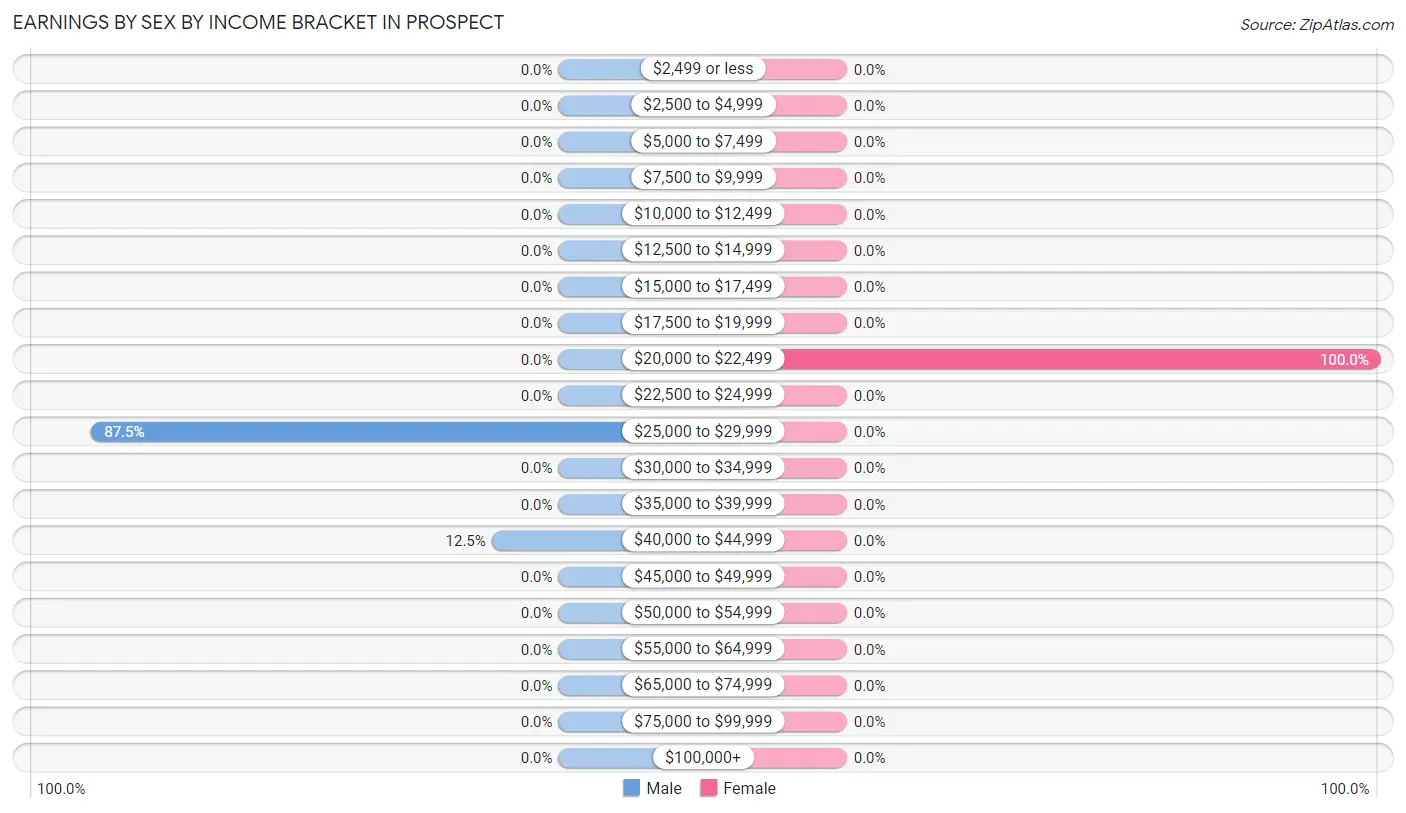
Earnings by Sex by Income Bracket in Prospect
The most common earnings brackets in Prospect are $25,000 to $29,999 for men (42 | 87.5%) and $20,000 to $22,499 for women (40 | 100.0%).
| Income | Male | Female |
| $2,499 or less | 0 (0.0%) | 0 (0.0%) |
| $2,500 to $4,999 | 0 (0.0%) | 0 (0.0%) |
| $5,000 to $7,499 | 0 (0.0%) | 0 (0.0%) |
| $7,500 to $9,999 | 0 (0.0%) | 0 (0.0%) |
| $10,000 to $12,499 | 0 (0.0%) | 0 (0.0%) |
| $12,500 to $14,999 | 0 (0.0%) | 0 (0.0%) |
| $15,000 to $17,499 | 0 (0.0%) | 0 (0.0%) |
| $17,500 to $19,999 | 0 (0.0%) | 0 (0.0%) |
| $20,000 to $22,499 | 0 (0.0%) | 40 (100.0%) |
| $22,500 to $24,999 | 0 (0.0%) | 0 (0.0%) |
| $25,000 to $29,999 | 42 (87.5%) | 0 (0.0%) |
| $30,000 to $34,999 | 0 (0.0%) | 0 (0.0%) |
| $35,000 to $39,999 | 0 (0.0%) | 0 (0.0%) |
| $40,000 to $44,999 | 6 (12.5%) | 0 (0.0%) |
| $45,000 to $49,999 | 0 (0.0%) | 0 (0.0%) |
| $50,000 to $54,999 | 0 (0.0%) | 0 (0.0%) |
| $55,000 to $64,999 | 0 (0.0%) | 0 (0.0%) |
| $65,000 to $74,999 | 0 (0.0%) | 0 (0.0%) |
| $75,000 to $99,999 | 0 (0.0%) | 0 (0.0%) |
| $100,000+ | 0 (0.0%) | 0 (0.0%) |
| Total | 48 (100.0%) | 40 (100.0%) |
Earnings by Sex by Educational Attainment in Prospect
| Educational Attainment | Male Income | Female Income |
| Less than High School | - | - |
| High School Diploma | - | - |
| College or Associate's Degree | - | - |
| Bachelor's Degree | - | - |
| Graduate Degree | - | - |
| Total | - | - |
Family Income in Prospect
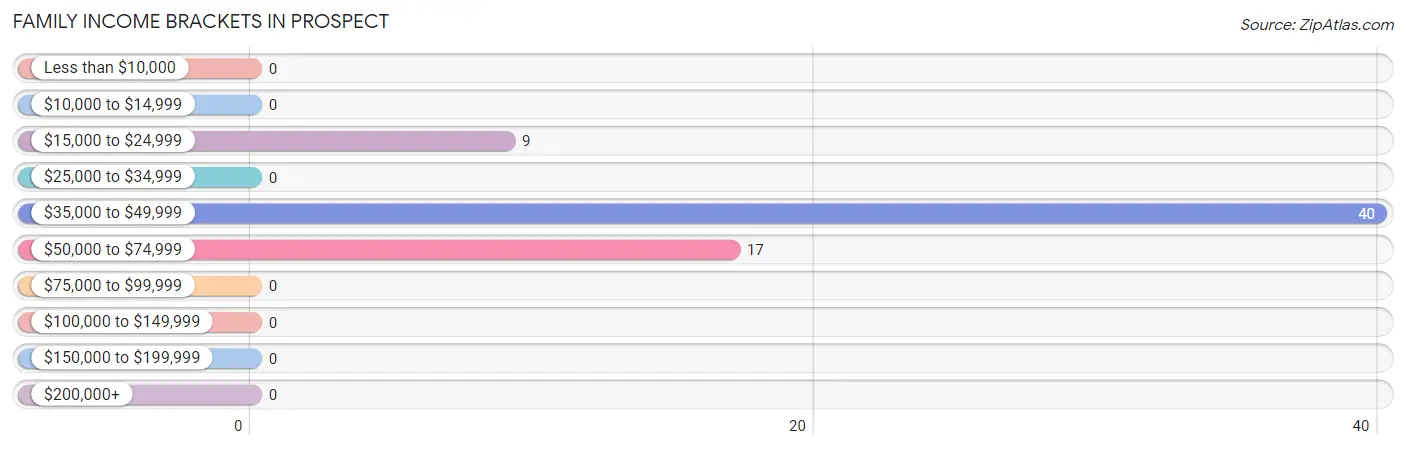
Family Income Brackets in Prospect
According to the Prospect family income data, there are 40 families falling into the $35,000 to $49,999 income range, which is the most common income bracket and makes up 60.6% of all families.
| Income Bracket | # Families | % Families |
| Less than $10,000 | 0 | 0.0% |
| $10,000 to $14,999 | 0 | 0.0% |
| $15,000 to $24,999 | 9 | 13.6% |
| $25,000 to $34,999 | 0 | 0.0% |
| $35,000 to $49,999 | 40 | 60.6% |
| $50,000 to $74,999 | 17 | 25.8% |
| $75,000 to $99,999 | 0 | 0.0% |
| $100,000 to $149,999 | 0 | 0.0% |
| $150,000 to $199,999 | 0 | 0.0% |
| $200,000+ | 0 | 0.0% |
Family Income by Famaliy Size in Prospect
| Income Bracket | # Families | Median Income |
| 2-Person Families | 26 (39.4%) | $0 |
| 3-Person Families | 0 (0.0%) | $0 |
| 4-Person Families | 40 (60.6%) | $0 |
| 5-Person Families | 0 (0.0%) | $0 |
| 6-Person Families | 0 (0.0%) | $0 |
| 7+ Person Families | 0 (0.0%) | $0 |
| Total | 66 (100.0%) | $46,500 |
Family Income by Number of Earners in Prospect
| Number of Earners | # Families | Median Income |
| No Earners | 26 (39.4%) | $0 |
| 1 Earner | 0 (0.0%) | $0 |
| 2 Earners | 40 (60.6%) | $0 |
| 3+ Earners | 0 (0.0%) | $0 |
| Total | 66 (100.0%) | $46,500 |
Household Income in Prospect
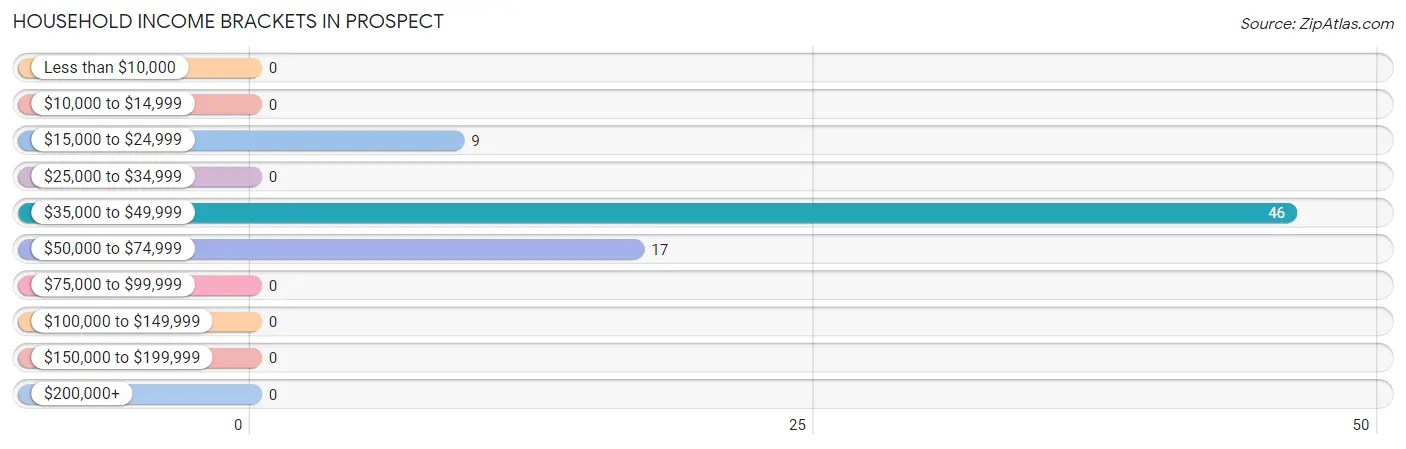
Household Income Brackets in Prospect
With 46 households falling in the category, the $35,000 to $49,999 income range is the most frequent in Prospect, accounting for 63.9% of all households.
| Income Bracket | # Households | % Households |
| Less than $10,000 | 0 | 0.0% |
| $10,000 to $14,999 | 0 | 0.0% |
| $15,000 to $24,999 | 9 | 12.5% |
| $25,000 to $34,999 | 0 | 0.0% |
| $35,000 to $49,999 | 46 | 63.9% |
| $50,000 to $74,999 | 17 | 23.6% |
| $75,000 to $99,999 | 0 | 0.0% |
| $100,000 to $149,999 | 0 | 0.0% |
| $150,000 to $199,999 | 0 | 0.0% |
| $200,000+ | 0 | 0.0% |
Household Income by Householder Age in Prospect
| Income Bracket | # Households | Median Income |
| 15 to 24 Years | 6 (8.3%) | $0 |
| 25 to 44 Years | 0 (0.0%) | $0 |
| 45 to 64 Years | 40 (55.6%) | $0 |
| 65+ Years | 26 (36.1%) | $0 |
| Total | 72 (100.0%) | $46,313 |
Poverty in Prospect
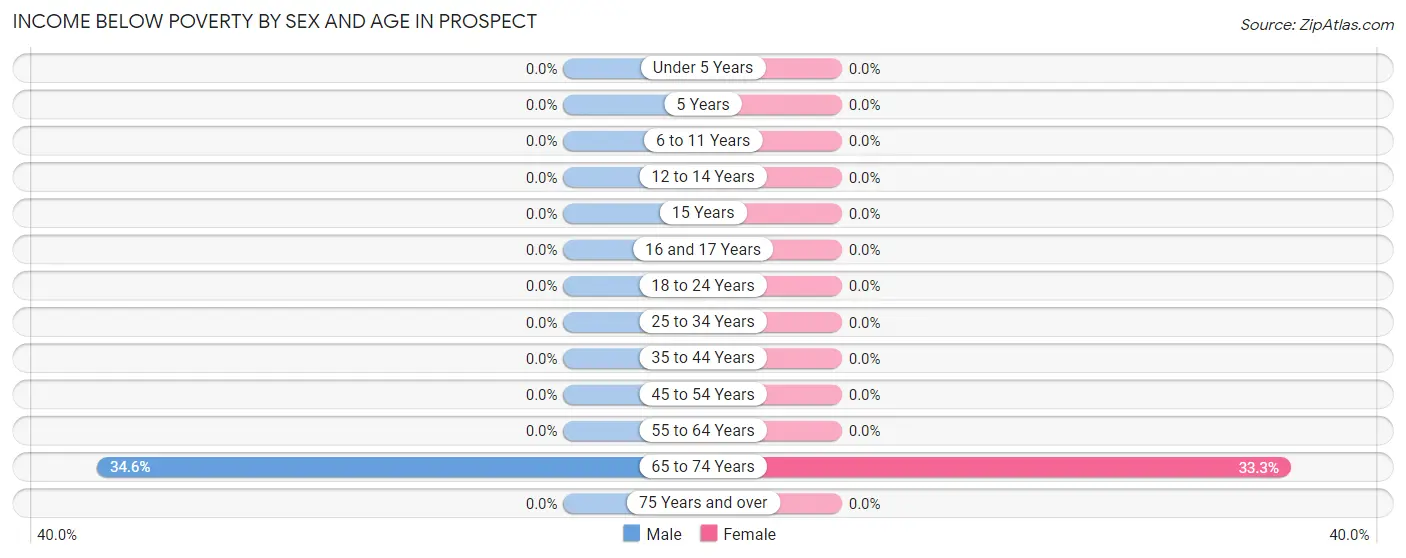
Income Below Poverty by Sex and Age in Prospect
With 8.2% poverty level for males and 7.3% for females among the residents of Prospect, 65 to 74 year old males and 65 to 74 year old females are the most vulnerable to poverty, with 9 males (34.6%) and 8 females (33.3%) in their respective age groups living below the poverty level.
| Age Bracket | Male | Female |
| Under 5 Years | 0 (0.0%) | 0 (0.0%) |
| 5 Years | 0 (0.0%) | 0 (0.0%) |
| 6 to 11 Years | 0 (0.0%) | 0 (0.0%) |
| 12 to 14 Years | 0 (0.0%) | 0 (0.0%) |
| 15 Years | 0 (0.0%) | 0 (0.0%) |
| 16 and 17 Years | 0 (0.0%) | 0 (0.0%) |
| 18 to 24 Years | 0 (0.0%) | 0 (0.0%) |
| 25 to 34 Years | 0 (0.0%) | 0 (0.0%) |
| 35 to 44 Years | 0 (0.0%) | 0 (0.0%) |
| 45 to 54 Years | 0 (0.0%) | 0 (0.0%) |
| 55 to 64 Years | 0 (0.0%) | 0 (0.0%) |
| 65 to 74 Years | 9 (34.6%) | 8 (33.3%) |
| 75 Years and over | 0 (0.0%) | 0 (0.0%) |
| Total | 9 (8.2%) | 8 (7.3%) |
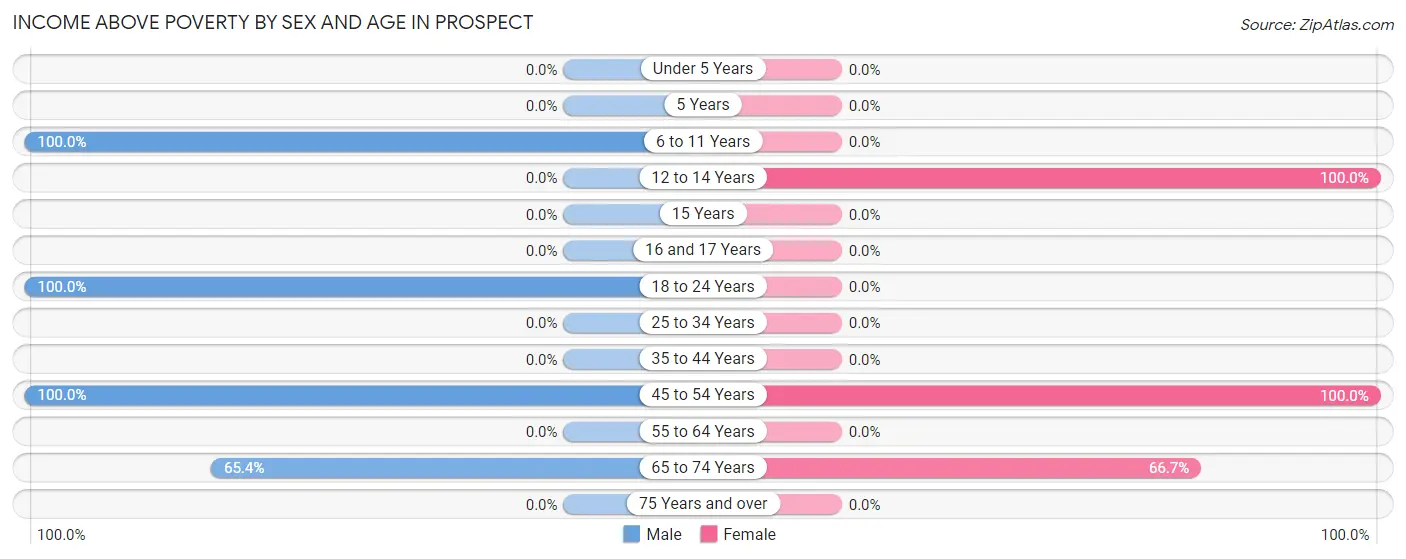
Income Above Poverty by Sex and Age in Prospect
According to the poverty statistics in Prospect, males aged 6 to 11 years and females aged 12 to 14 years are the age groups that are most secure financially, with 100.0% of males and 100.0% of females in these age groups living above the poverty line.
| Age Bracket | Male | Female |
| Under 5 Years | 0 (0.0%) | 0 (0.0%) |
| 5 Years | 0 (0.0%) | 0 (0.0%) |
| 6 to 11 Years | 36 (100.0%) | 0 (0.0%) |
| 12 to 14 Years | 0 (0.0%) | 46 (100.0%) |
| 15 Years | 0 (0.0%) | 0 (0.0%) |
| 16 and 17 Years | 0 (0.0%) | 0 (0.0%) |
| 18 to 24 Years | 6 (100.0%) | 0 (0.0%) |
| 25 to 34 Years | 0 (0.0%) | 0 (0.0%) |
| 35 to 44 Years | 0 (0.0%) | 0 (0.0%) |
| 45 to 54 Years | 42 (100.0%) | 40 (100.0%) |
| 55 to 64 Years | 0 (0.0%) | 0 (0.0%) |
| 65 to 74 Years | 17 (65.4%) | 16 (66.7%) |
| 75 Years and over | 0 (0.0%) | 0 (0.0%) |
| Total | 101 (91.8%) | 102 (92.7%) |
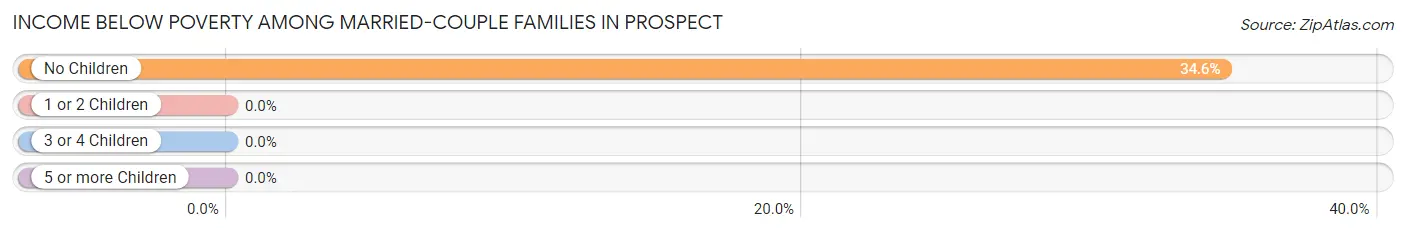
Income Below Poverty Among Married-Couple Families in Prospect
The poverty statistics for married-couple families in Prospect show that 13.6% or 9 of the total 66 families live below the poverty line. Families with no children have the highest poverty rate of 34.6%, comprising of 9 families. On the other hand, families with 1 or 2 children have the lowest poverty rate of 0.0%, which includes 0 families.
| Children | Above Poverty | Below Poverty |
| No Children | 17 (65.4%) | 9 (34.6%) |
| 1 or 2 Children | 40 (100.0%) | 0 (0.0%) |
| 3 or 4 Children | 0 (0.0%) | 0 (0.0%) |
| 5 or more Children | 0 (0.0%) | 0 (0.0%) |
| Total | 57 (86.4%) | 9 (13.6%) |
Income Below Poverty Among Single-Parent Households in Prospect
| Children | Single Father | Single Mother |
| No Children | 0 (0.0%) | 0 (0.0%) |
| 1 or 2 Children | 0 (0.0%) | 0 (0.0%) |
| 3 or 4 Children | 0 (0.0%) | 0 (0.0%) |
| 5 or more Children | 0 (0.0%) | 0 (0.0%) |
| Total | 0 (0.0%) | 0 (0.0%) |
Income Below Poverty Among Married-Couple vs Single-Parent Households in Prospect
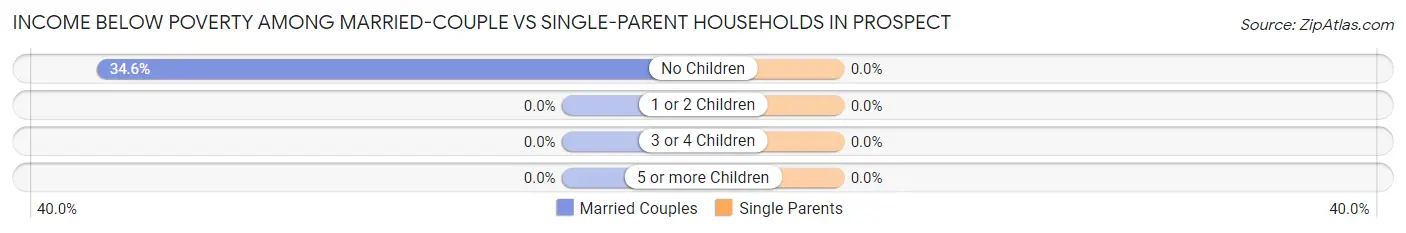
| Children | Married-Couple Families | Single-Parent Households |
| No Children | 9 (34.6%) | 0 (0.0%) |
| 1 or 2 Children | 0 (0.0%) | 0 (0.0%) |
| 3 or 4 Children | 0 (0.0%) | 0 (0.0%) |
| 5 or more Children | 0 (0.0%) | 0 (0.0%) |
| Total | 9 (13.6%) | 0 (0.0%) |
Race in Prospect
The most populous races in Prospect are , and White / Caucasian (220 | 100.0%).
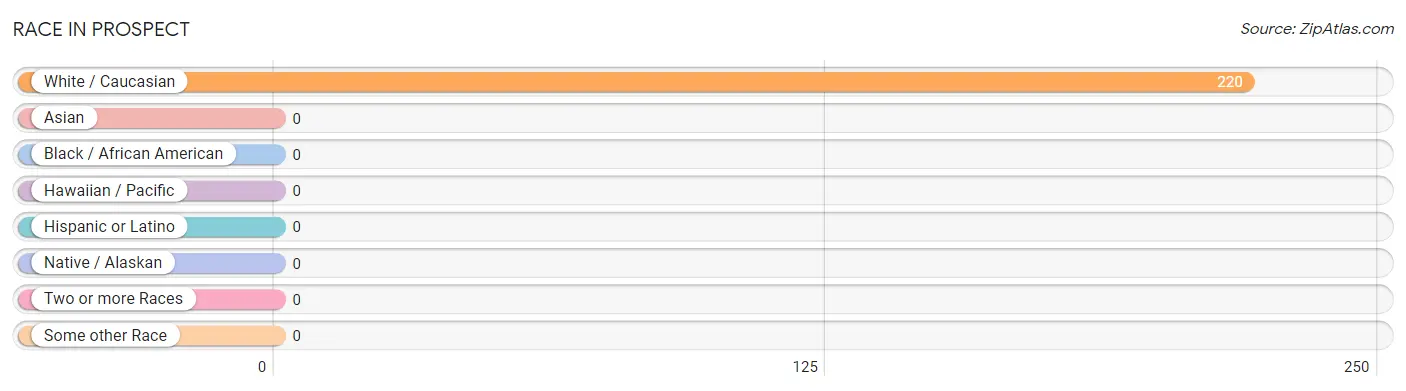
| Race | # Population | % Population |
| Asian | 0 | 0.0% |
| Black / African American | 0 | 0.0% |
| Hawaiian / Pacific | 0 | 0.0% |
| Hispanic or Latino | 0 | 0.0% |
| Native / Alaskan | 0 | 0.0% |
| White / Caucasian | 220 | 100.0% |
| Two or more Races | 0 | 0.0% |
| Some other Race | 0 | 0.0% |
| Total | 220 | 100.0% |
Ancestry in Prospect
The most populous ancestries reported in Prospect are English (23 | 10.4%), French (23 | 10.4%), and Irish (16 | 7.3%), together accounting for 28.2% of all Prospect residents.
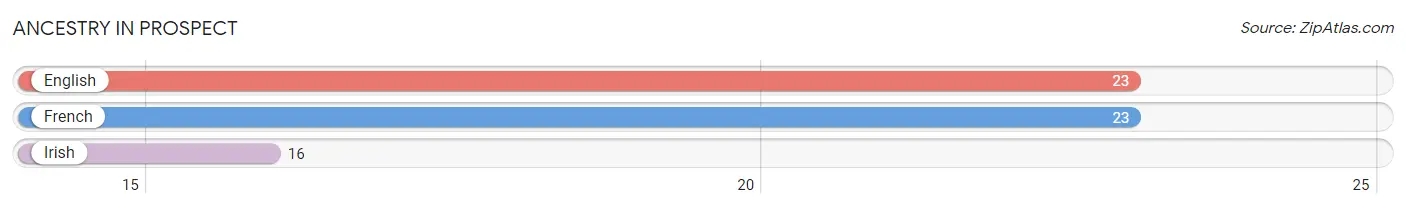
| Ancestry | # Population | % Population |
| English | 23 | 10.4% |
| French | 23 | 10.4% |
| Irish | 16 | 7.3% | View All 3 Rows |
Immigrants in Prospect

| Immigration Origin | # Population | % Population | View All 0 Rows |
Sex and Age in Prospect
Sex and Age in Prospect
The most populous age groups in Prospect are 50 to 54 Years (42 | 38.2%) for men and 10 to 14 Years (46 | 41.8%) for women.
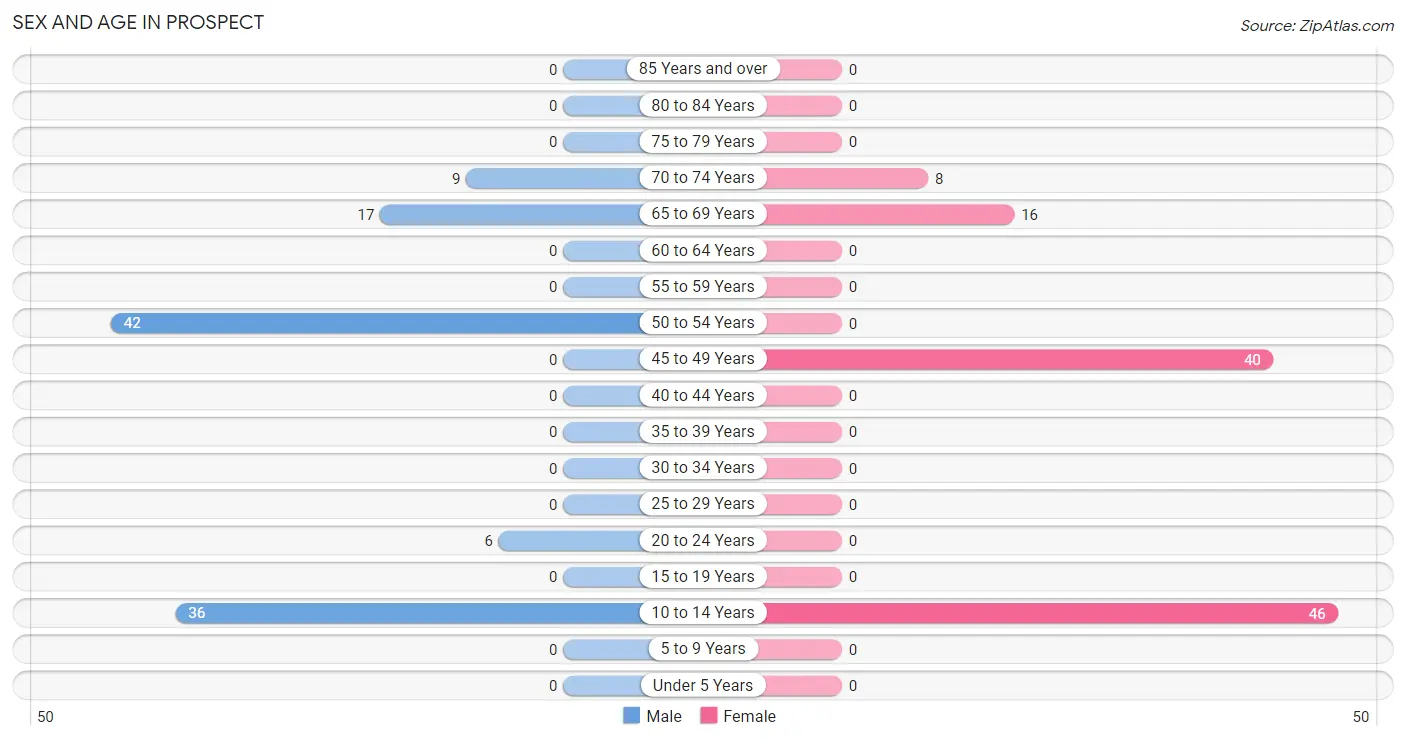
| Age Bracket | Male | Female |
| Under 5 Years | 0 (0.0%) | 0 (0.0%) |
| 5 to 9 Years | 0 (0.0%) | 0 (0.0%) |
| 10 to 14 Years | 36 (32.7%) | 46 (41.8%) |
| 15 to 19 Years | 0 (0.0%) | 0 (0.0%) |
| 20 to 24 Years | 6 (5.4%) | 0 (0.0%) |
| 25 to 29 Years | 0 (0.0%) | 0 (0.0%) |
| 30 to 34 Years | 0 (0.0%) | 0 (0.0%) |
| 35 to 39 Years | 0 (0.0%) | 0 (0.0%) |
| 40 to 44 Years | 0 (0.0%) | 0 (0.0%) |
| 45 to 49 Years | 0 (0.0%) | 40 (36.4%) |
| 50 to 54 Years | 42 (38.2%) | 0 (0.0%) |
| 55 to 59 Years | 0 (0.0%) | 0 (0.0%) |
| 60 to 64 Years | 0 (0.0%) | 0 (0.0%) |
| 65 to 69 Years | 17 (15.4%) | 16 (14.5%) |
| 70 to 74 Years | 9 (8.2%) | 8 (7.3%) |
| 75 to 79 Years | 0 (0.0%) | 0 (0.0%) |
| 80 to 84 Years | 0 (0.0%) | 0 (0.0%) |
| 85 Years and over | 0 (0.0%) | 0 (0.0%) |
| Total | 110 (100.0%) | 110 (100.0%) |
Families and Households in Prospect
Median Family Size in Prospect
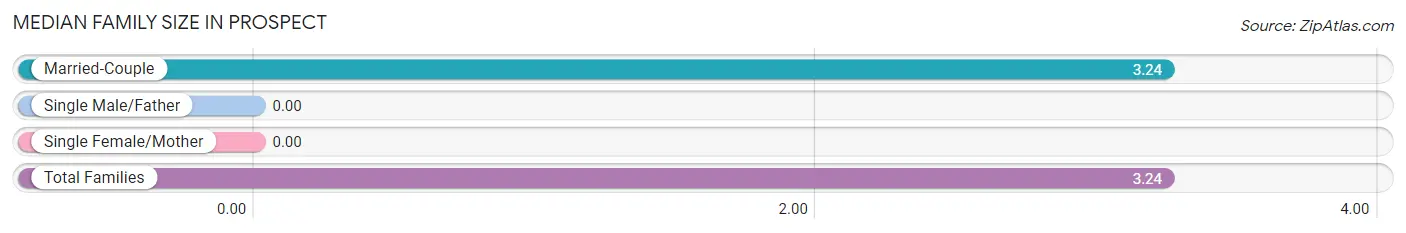
| Family Type | # Families | Family Size |
| Married-Couple | 66 (100.0%) | 3.24 |
| Single Male/Father | 0 (0.0%) | - |
| Single Female/Mother | 0 (0.0%) | - |
| Total Families | 66 (100.0%) | 3.24 |
Median Household Size in Prospect
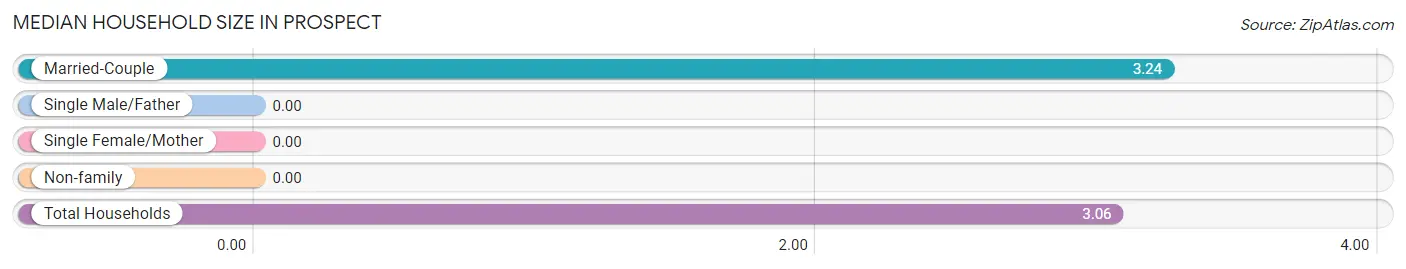
| Household Type | # Households | Household Size |
| Married-Couple | 66 (91.7%) | 3.24 |
| Single Male/Father | 0 (0.0%) | - |
| Single Female/Mother | 0 (0.0%) | - |
| Non-family | 6 (8.3%) | - |
| Total Households | 72 (100.0%) | 3.06 |
Household Size by Marriage Status in Prospect
Out of a total of 72 households in Prospect, 66 (91.7%) are family households, while 6 (8.3%) are nonfamily households. The most numerous type of family households are 4-person households, comprising 40, and the most common type of nonfamily households are 1-person households, comprising 6.
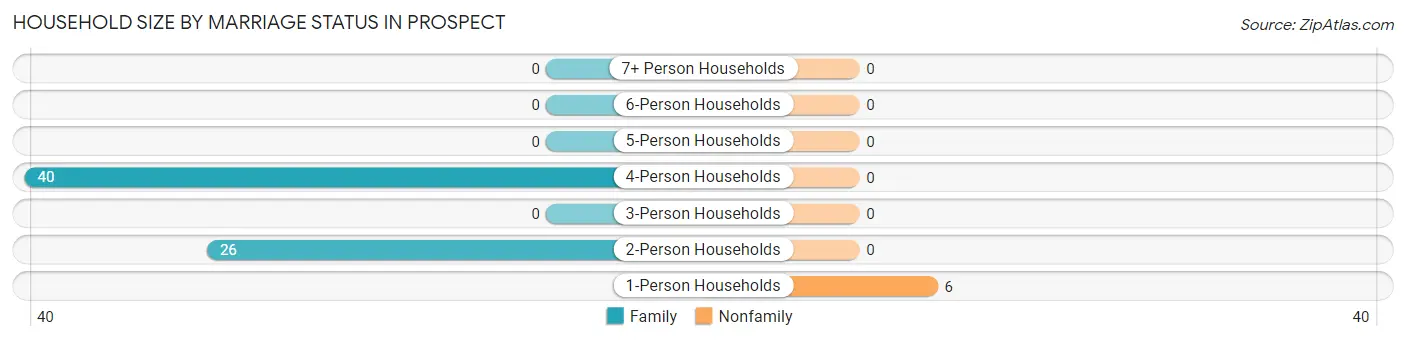
| Household Size | Family Households | Nonfamily Households |
| 1-Person Households | - | 6 (8.3%) |
| 2-Person Households | 26 (36.1%) | 0 (0.0%) |
| 3-Person Households | 0 (0.0%) | 0 (0.0%) |
| 4-Person Households | 40 (55.6%) | 0 (0.0%) |
| 5-Person Households | 0 (0.0%) | 0 (0.0%) |
| 6-Person Households | 0 (0.0%) | 0 (0.0%) |
| 7+ Person Households | 0 (0.0%) | 0 (0.0%) |
| Total | 66 (91.7%) | 6 (8.3%) |
Female Fertility in Prospect
Fertility by Age in Prospect
| Age Bracket | Women with Births | Births / 1,000 Women |
| 15 to 19 years | 0 (0.0%) | 0.0 |
| 20 to 34 years | 0 (0.0%) | 0.0 |
| 35 to 50 years | 0 (0.0%) | 0.0 |
| Total | 0 (0.0%) | 0.0 |
Fertility by Age by Marriage Status in Prospect
| Age Bracket | Married | Unmarried |
| 15 to 19 years | 0 (0.0%) | 0 (0.0%) |
| 20 to 34 years | 0 (0.0%) | 0 (0.0%) |
| 35 to 50 years | 0 (0.0%) | 0 (0.0%) |
| Total | 0 (0.0%) | 0 (0.0%) |
Fertility by Education in Prospect
| Educational Attainment | Women with Births | Births / 1,000 Women |
| Less than High School | 0 (0.0%) | 0.0 |
| High School Diploma | 0 (0.0%) | 0.0 |
| College or Associate's Degree | 0 (0.0%) | 0.0 |
| Bachelor's Degree | 0 (0.0%) | 0.0 |
| Graduate Degree | 0 (0.0%) | 0.0 |
| Total | 0 (0.0%) | 0.0 |
Fertility by Education by Marriage Status in Prospect
| Educational Attainment | Married | Unmarried |
| Less than High School | 0 (0.0%) | 0 (0.0%) |
| High School Diploma | 0 (0.0%) | 0 (0.0%) |
| College or Associate's Degree | 0 (0.0%) | 0 (0.0%) |
| Bachelor's Degree | 0 (0.0%) | 0 (0.0%) |
| Graduate Degree | 0 (0.0%) | 0 (0.0%) |
| Total | 0 (0.0%) | 0 (0.0%) |
Employment Characteristics in Prospect
Employment by Class of Employer in Prospect
Among the 88 employed individuals in Prospect, self-employed (not incorporated) (82 | 93.2%), and local government employees (6 | 6.8%) make up the most common classes of employment.
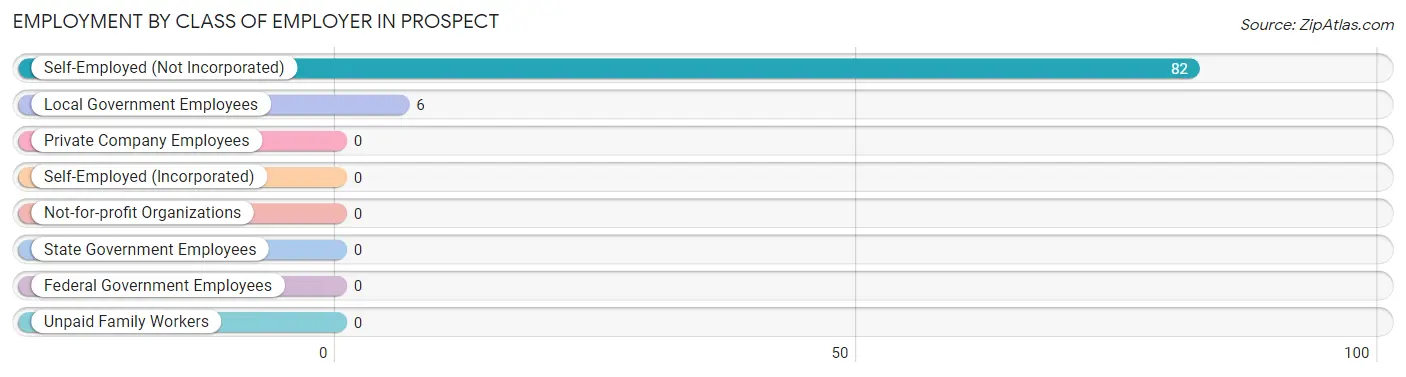
| Employer Class | # Employees | % Employees |
| Private Company Employees | 0 | 0.0% |
| Self-Employed (Incorporated) | 0 | 0.0% |
| Self-Employed (Not Incorporated) | 82 | 93.2% |
| Not-for-profit Organizations | 0 | 0.0% |
| Local Government Employees | 6 | 6.8% |
| State Government Employees | 0 | 0.0% |
| Federal Government Employees | 0 | 0.0% |
| Unpaid Family Workers | 0 | 0.0% |
| Total | 88 | 100.0% |
Employment Status by Age in Prospect
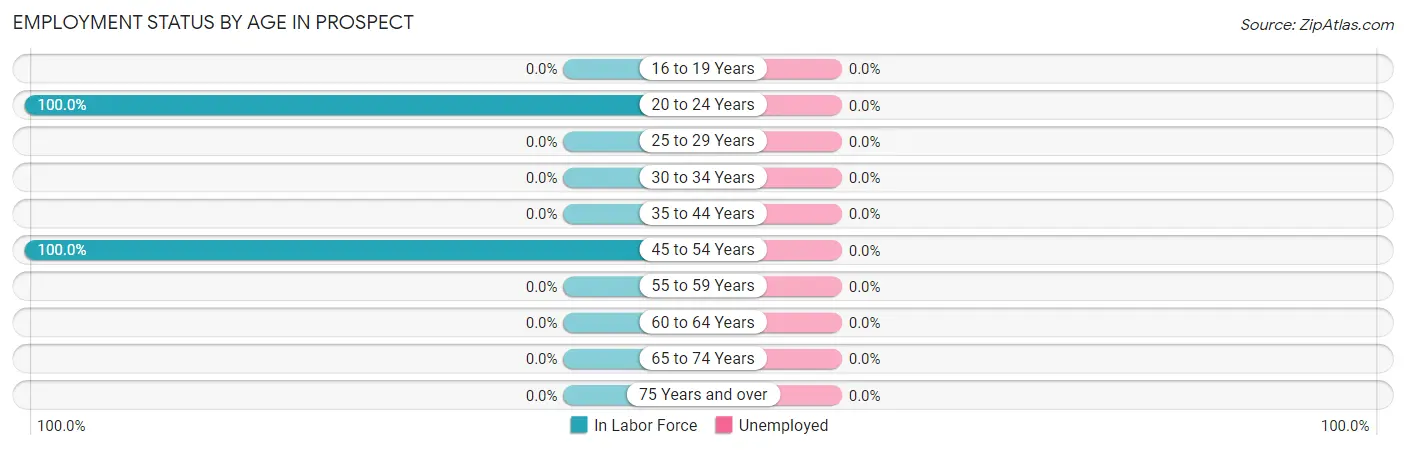
| Age Bracket | In Labor Force | Unemployed |
| 16 to 19 Years | 0 (0.0%) | 0 (0.0%) |
| 20 to 24 Years | 6 (100.0%) | 0 (0.0%) |
| 25 to 29 Years | 0 (0.0%) | 0 (0.0%) |
| 30 to 34 Years | 0 (0.0%) | 0 (0.0%) |
| 35 to 44 Years | 0 (0.0%) | 0 (0.0%) |
| 45 to 54 Years | 82 (100.0%) | 0 (0.0%) |
| 55 to 59 Years | 0 (0.0%) | 0 (0.0%) |
| 60 to 64 Years | 0 (0.0%) | 0 (0.0%) |
| 65 to 74 Years | 0 (0.0%) | 0 (0.0%) |
| 75 Years and over | 0 (0.0%) | 0 (0.0%) |
| Total | 88 (63.8%) | 0 (0.0%) |
Employment Status by Educational Attainment in Prospect
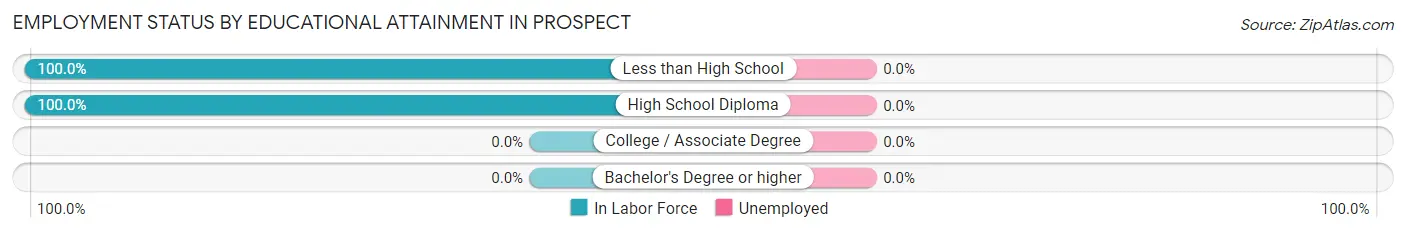
| Educational Attainment | In Labor Force | Unemployed |
| Less than High School | 42 (100.0%) | 0 (0.0%) |
| High School Diploma | 40 (100.0%) | 0 (0.0%) |
| College / Associate Degree | 0 (0.0%) | 0 (0.0%) |
| Bachelor's Degree or higher | 0 (0.0%) | 0 (0.0%) |
| Total | 82 (100.0%) | 0 (0.0%) |
Employment Occupations by Sex in Prospect
Management, Business, Science and Arts Occupations
The most common Management, Business, Science and Arts occupations in Prospect are Community & Social Service (6 | 6.8%), and Education Instruction & Library (6 | 6.8%).
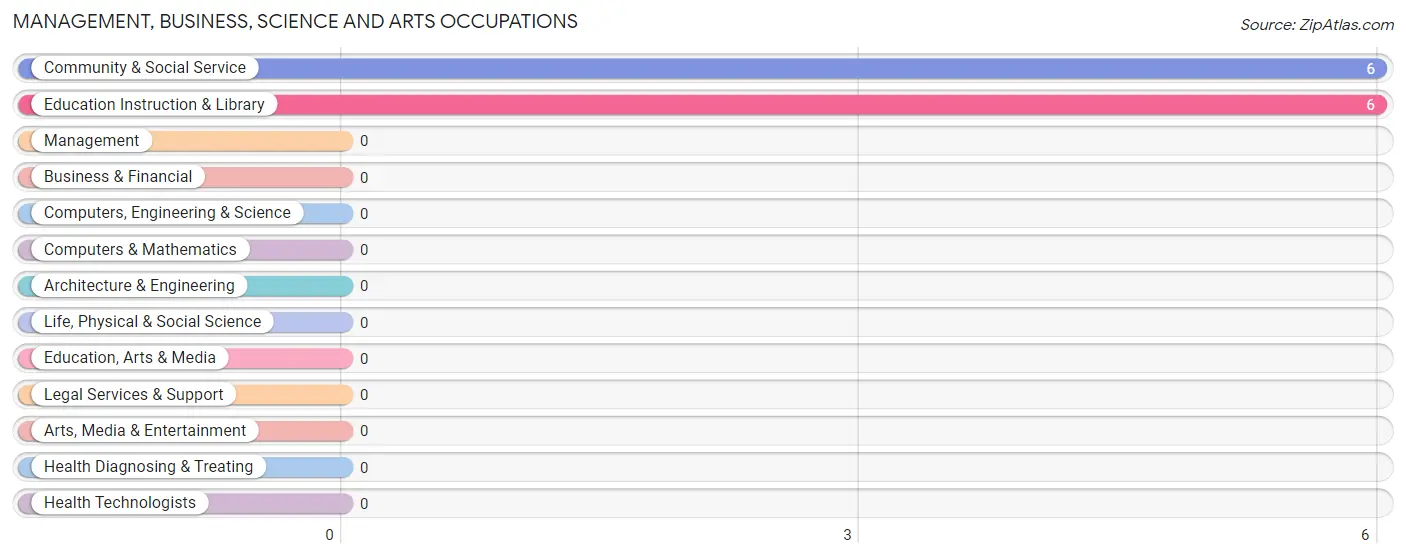
Management, Business, Science and Arts Occupations by Sex
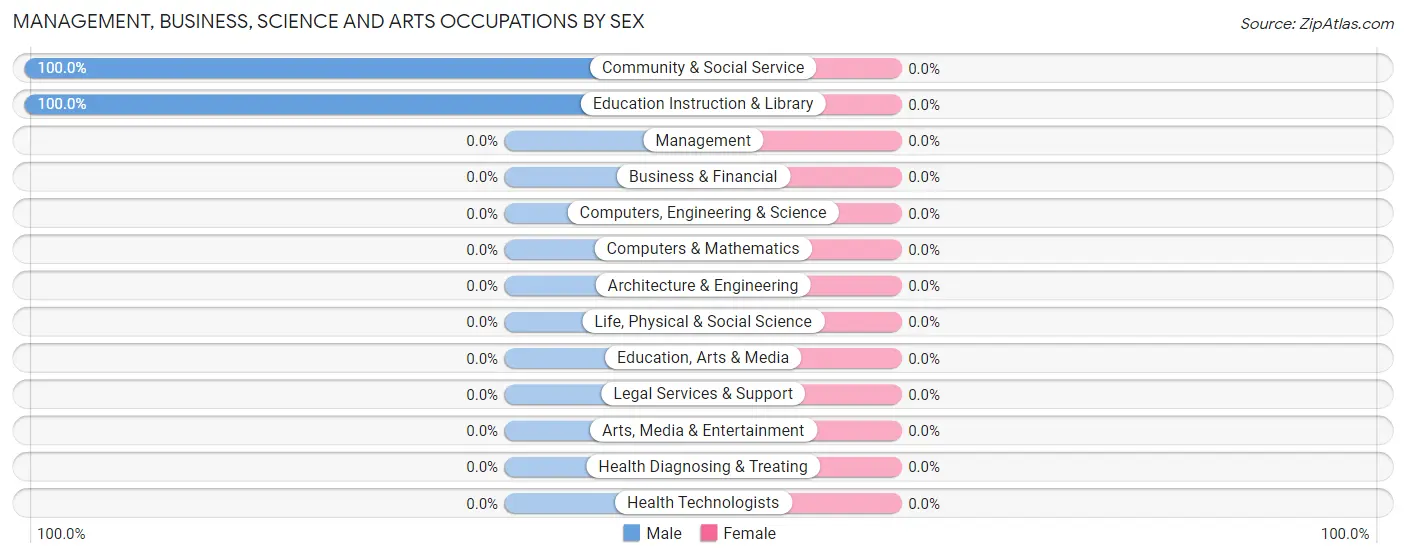
| Occupation | Male | Female |
| Management | 0 (0.0%) | 0 (0.0%) |
| Business & Financial | 0 (0.0%) | 0 (0.0%) |
| Computers, Engineering & Science | 0 (0.0%) | 0 (0.0%) |
| Computers & Mathematics | 0 (0.0%) | 0 (0.0%) |
| Architecture & Engineering | 0 (0.0%) | 0 (0.0%) |
| Life, Physical & Social Science | 0 (0.0%) | 0 (0.0%) |
| Community & Social Service | 6 (100.0%) | 0 (0.0%) |
| Education, Arts & Media | 0 (0.0%) | 0 (0.0%) |
| Legal Services & Support | 0 (0.0%) | 0 (0.0%) |
| Education Instruction & Library | 6 (100.0%) | 0 (0.0%) |
| Arts, Media & Entertainment | 0 (0.0%) | 0 (0.0%) |
| Health Diagnosing & Treating | 0 (0.0%) | 0 (0.0%) |
| Health Technologists | 0 (0.0%) | 0 (0.0%) |
| Total (Category) | 6 (100.0%) | 0 (0.0%) |
| Total (Overall) | 48 (54.5%) | 40 (45.5%) |
Services Occupations
The most common Services occupations in Prospect are , and Cleaning & Maintenance (42 | 47.7%).
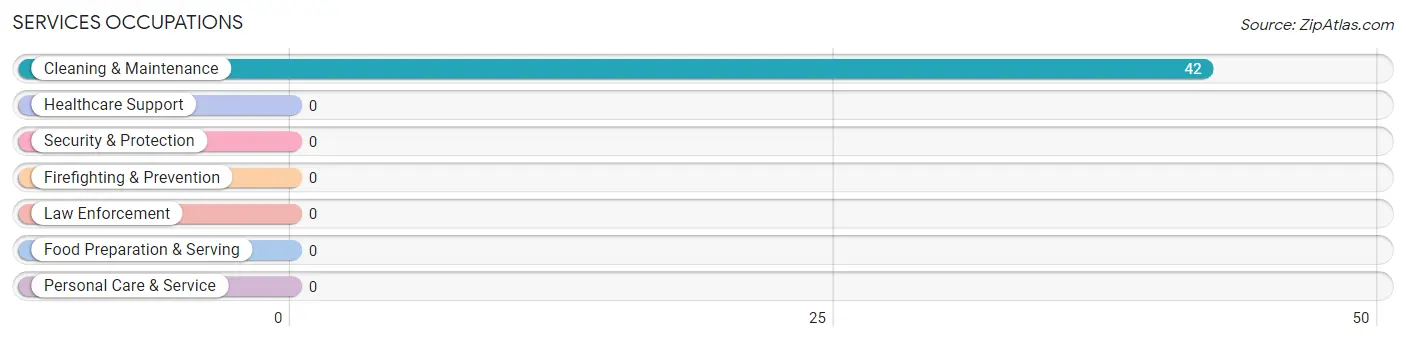
Services Occupations by Sex
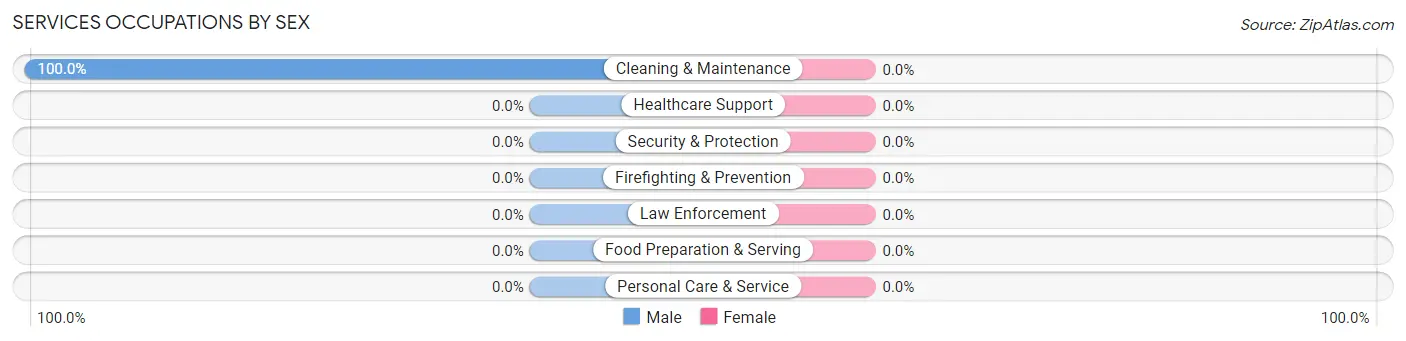
| Occupation | Male | Female |
| Healthcare Support | 0 (0.0%) | 0 (0.0%) |
| Security & Protection | 0 (0.0%) | 0 (0.0%) |
| Firefighting & Prevention | 0 (0.0%) | 0 (0.0%) |
| Law Enforcement | 0 (0.0%) | 0 (0.0%) |
| Food Preparation & Serving | 0 (0.0%) | 0 (0.0%) |
| Cleaning & Maintenance | 42 (100.0%) | 0 (0.0%) |
| Personal Care & Service | 0 (0.0%) | 0 (0.0%) |
| Total (Category) | 42 (100.0%) | 0 (0.0%) |
| Total (Overall) | 48 (54.5%) | 40 (45.5%) |
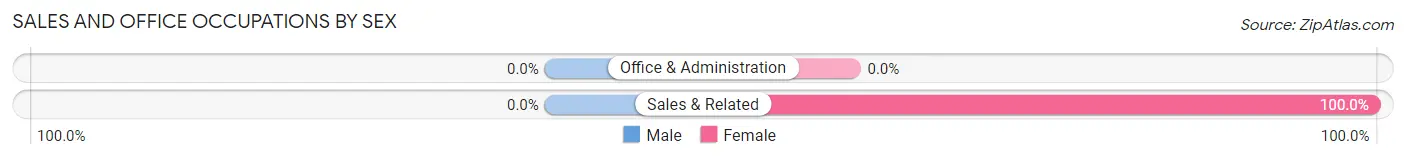
Sales and Office Occupations
The most common Sales and Office occupations in Prospect are , and Sales & Related (40 | 45.5%).
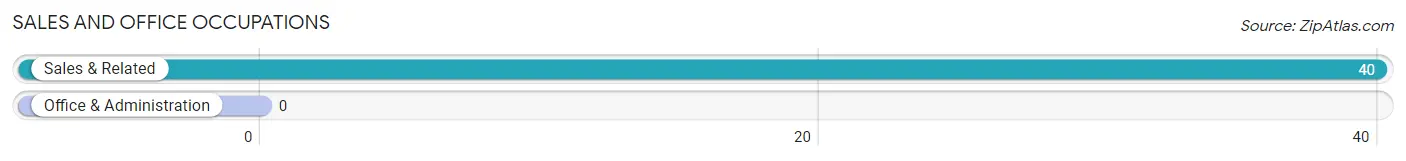
Sales and Office Occupations by Sex
| Occupation | Male | Female |
| Sales & Related | 0 (0.0%) | 40 (100.0%) |
| Office & Administration | 0 (0.0%) | 0 (0.0%) |
| Total (Category) | 0 (0.0%) | 40 (100.0%) |
| Total (Overall) | 48 (54.5%) | 40 (45.5%) |
Natural Resources, Construction and Maintenance Occupations
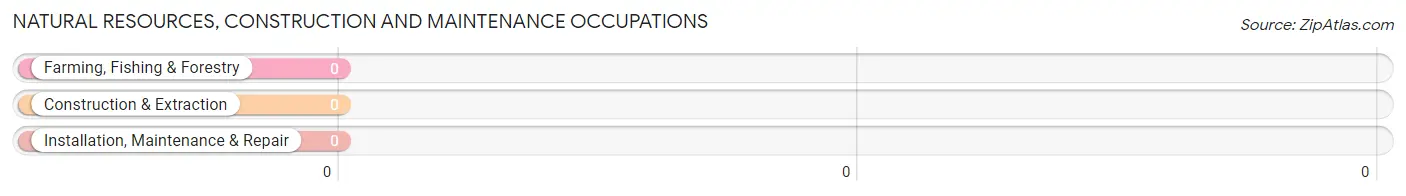
Natural Resources, Construction and Maintenance Occupations by Sex
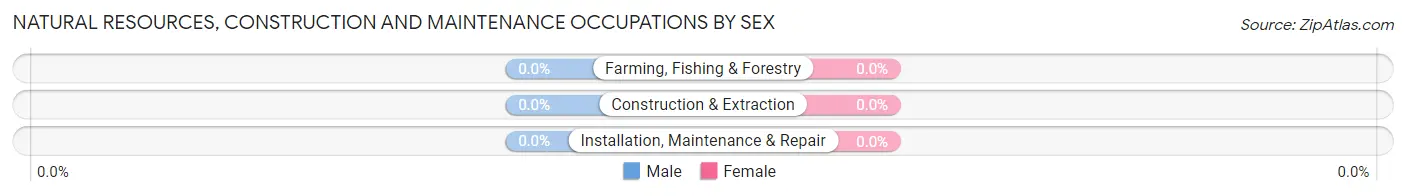
| Occupation | Male | Female |
| Farming, Fishing & Forestry | 0 (0.0%) | 0 (0.0%) |
| Construction & Extraction | 0 (0.0%) | 0 (0.0%) |
| Installation, Maintenance & Repair | 0 (0.0%) | 0 (0.0%) |
| Total (Category) | 0 (0.0%) | 0 (0.0%) |
| Total (Overall) | 48 (54.5%) | 40 (45.5%) |
Production, Transportation and Moving Occupations
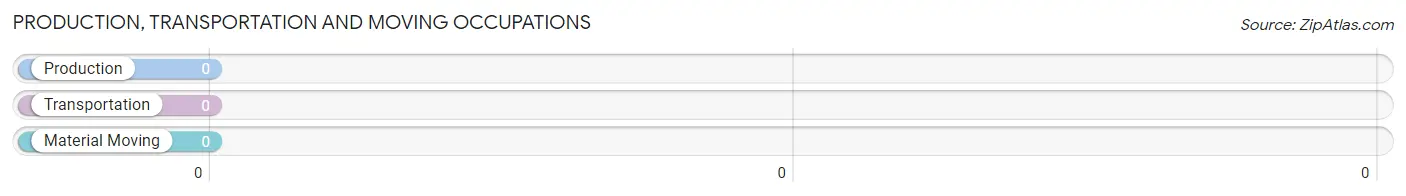
Production, Transportation and Moving Occupations by Sex
| Occupation | Male | Female |
| Production | 0 (0.0%) | 0 (0.0%) |
| Transportation | 0 (0.0%) | 0 (0.0%) |
| Material Moving | 0 (0.0%) | 0 (0.0%) |
| Total (Category) | 0 (0.0%) | 0 (0.0%) |
| Total (Overall) | 48 (54.5%) | 40 (45.5%) |
Employment Industries by Sex in Prospect
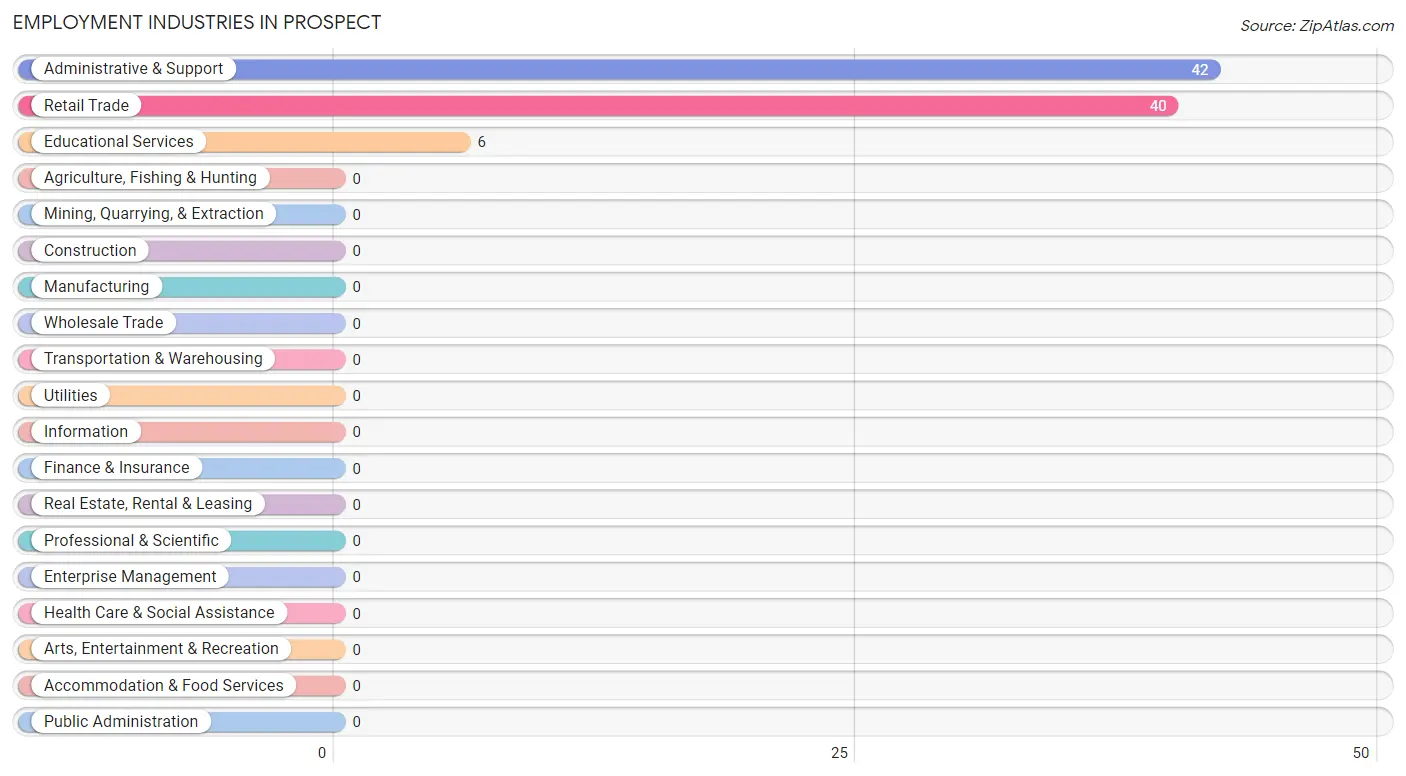
Employment Industries in Prospect
The major employment industries in Prospect include Administrative & Support (42 | 47.7%), Retail Trade (40 | 45.5%), and Educational Services (6 | 6.8%).
Employment Industries by Sex in Prospect
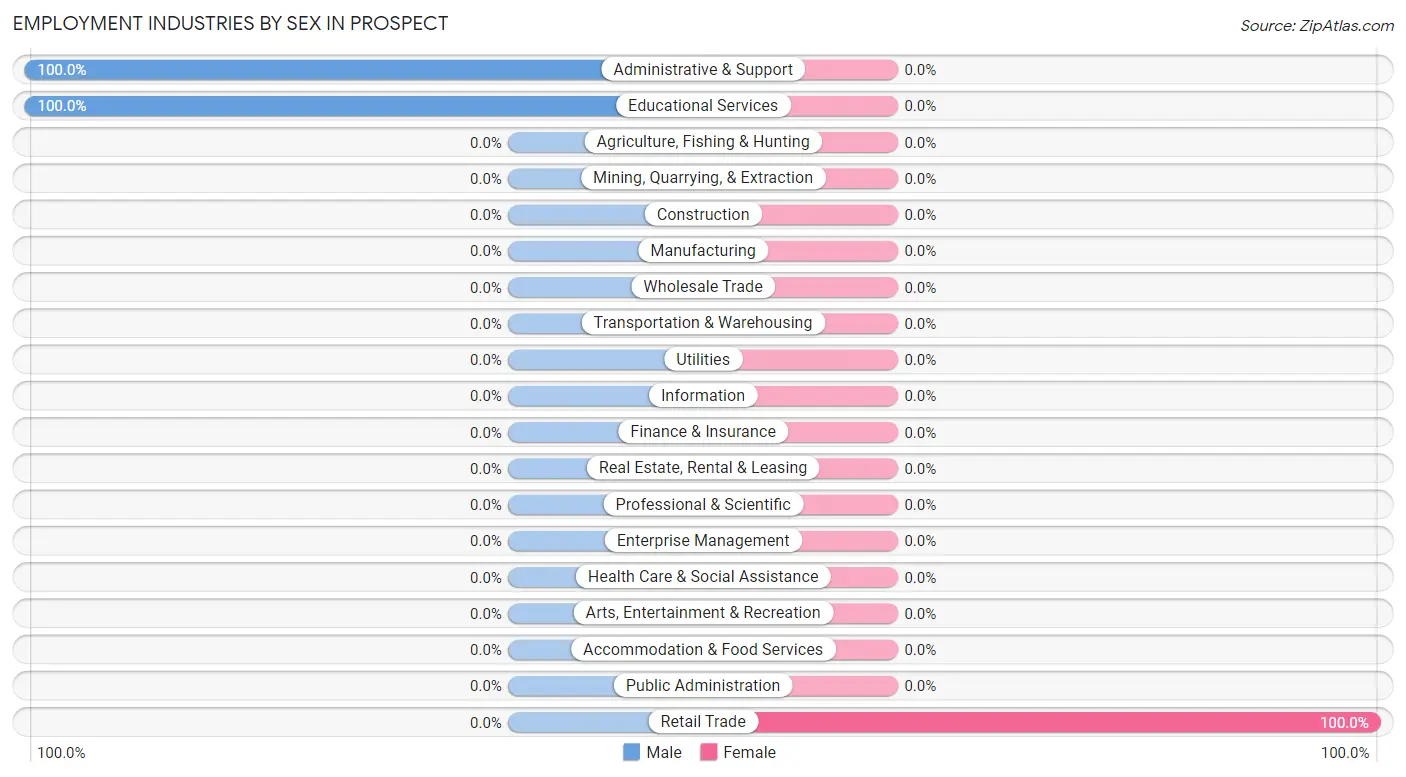
| Industry | Male | Female |
| Agriculture, Fishing & Hunting | 0 (0.0%) | 0 (0.0%) |
| Mining, Quarrying, & Extraction | 0 (0.0%) | 0 (0.0%) |
| Construction | 0 (0.0%) | 0 (0.0%) |
| Manufacturing | 0 (0.0%) | 0 (0.0%) |
| Wholesale Trade | 0 (0.0%) | 0 (0.0%) |
| Retail Trade | 0 (0.0%) | 40 (100.0%) |
| Transportation & Warehousing | 0 (0.0%) | 0 (0.0%) |
| Utilities | 0 (0.0%) | 0 (0.0%) |
| Information | 0 (0.0%) | 0 (0.0%) |
| Finance & Insurance | 0 (0.0%) | 0 (0.0%) |
| Real Estate, Rental & Leasing | 0 (0.0%) | 0 (0.0%) |
| Professional & Scientific | 0 (0.0%) | 0 (0.0%) |
| Enterprise Management | 0 (0.0%) | 0 (0.0%) |
| Administrative & Support | 42 (100.0%) | 0 (0.0%) |
| Educational Services | 6 (100.0%) | 0 (0.0%) |
| Health Care & Social Assistance | 0 (0.0%) | 0 (0.0%) |
| Arts, Entertainment & Recreation | 0 (0.0%) | 0 (0.0%) |
| Accommodation & Food Services | 0 (0.0%) | 0 (0.0%) |
| Public Administration | 0 (0.0%) | 0 (0.0%) |
| Total | 48 (54.5%) | 40 (45.5%) |
Education in Prospect
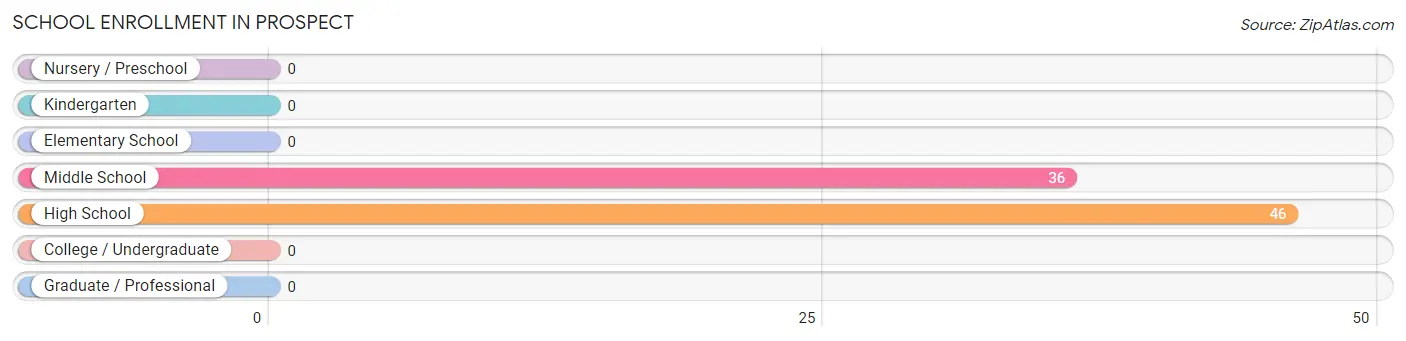
School Enrollment in Prospect
The most common levels of schooling among the 82 students in Prospect are high school (46 | 56.1%), and middle school (36 | 43.9%).
| School Level | # Students | % Students |
| Nursery / Preschool | 0 | 0.0% |
| Kindergarten | 0 | 0.0% |
| Elementary School | 0 | 0.0% |
| Middle School | 36 | 43.9% |
| High School | 46 | 56.1% |
| College / Undergraduate | 0 | 0.0% |
| Graduate / Professional | 0 | 0.0% |
| Total | 82 | 100.0% |
School Enrollment by Age by Funding Source in Prospect
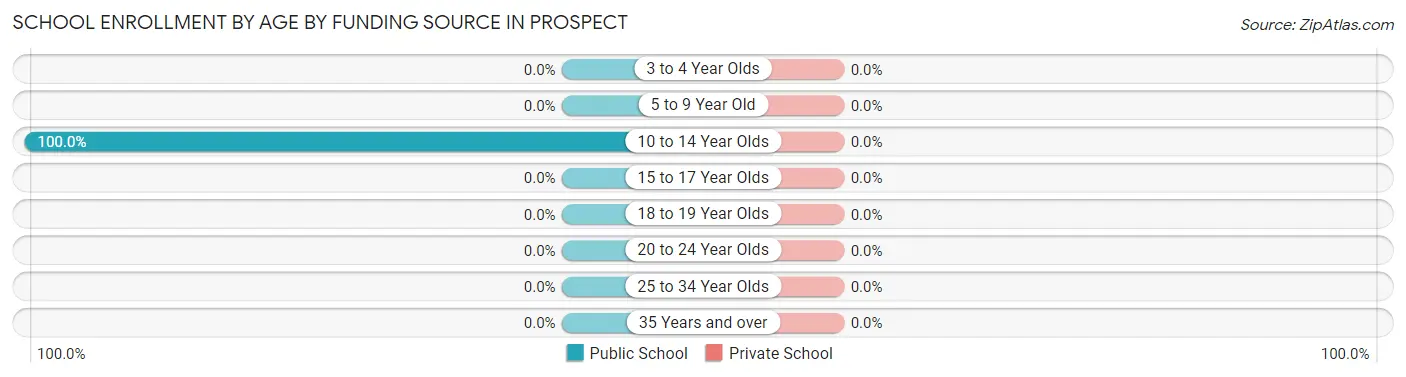
| Age Bracket | Public School | Private School |
| 3 to 4 Year Olds | 0 (0.0%) | 0 (0.0%) |
| 5 to 9 Year Old | 0 (0.0%) | 0 (0.0%) |
| 10 to 14 Year Olds | 82 (100.0%) | 0 (0.0%) |
| 15 to 17 Year Olds | 0 (0.0%) | 0 (0.0%) |
| 18 to 19 Year Olds | 0 (0.0%) | 0 (0.0%) |
| 20 to 24 Year Olds | 0 (0.0%) | 0 (0.0%) |
| 25 to 34 Year Olds | 0 (0.0%) | 0 (0.0%) |
| 35 Years and over | 0 (0.0%) | 0 (0.0%) |
| Total | 82 (100.0%) | 0 (0.0%) |
Educational Attainment by Field of Study in Prospect
, and education (16 | 100.0%) are the most common fields of study among 16 individuals in Prospect who have obtained a bachelor's degree or higher.
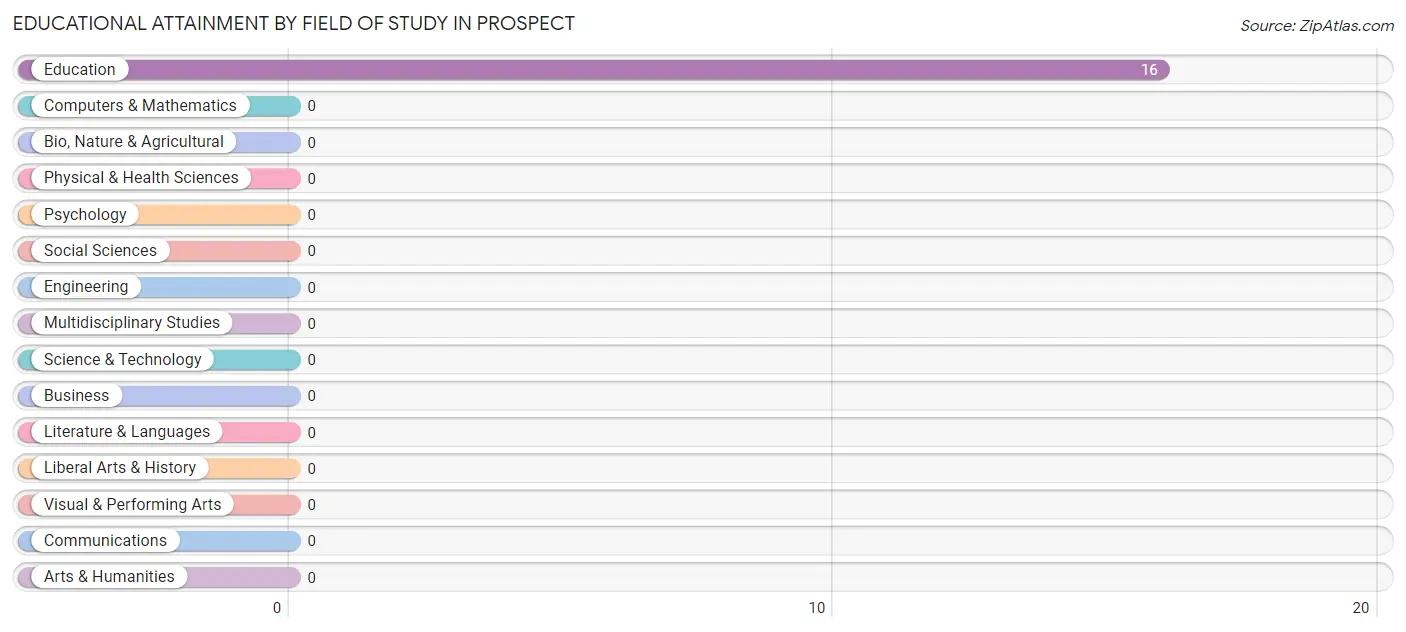
| Field of Study | # Graduates | % Graduates |
| Computers & Mathematics | 0 | 0.0% |
| Bio, Nature & Agricultural | 0 | 0.0% |
| Physical & Health Sciences | 0 | 0.0% |
| Psychology | 0 | 0.0% |
| Social Sciences | 0 | 0.0% |
| Engineering | 0 | 0.0% |
| Multidisciplinary Studies | 0 | 0.0% |
| Science & Technology | 0 | 0.0% |
| Business | 0 | 0.0% |
| Education | 16 | 100.0% |
| Literature & Languages | 0 | 0.0% |
| Liberal Arts & History | 0 | 0.0% |
| Visual & Performing Arts | 0 | 0.0% |
| Communications | 0 | 0.0% |
| Arts & Humanities | 0 | 0.0% |
| Total | 16 | 100.0% |
Transportation & Commute in Prospect
Vehicle Availability by Sex in Prospect
The most prevalent vehicle ownership categories in Prospect are males with 2 vehicles (42, accounting for 87.5%) and females with 2 vehicles (40, making up 105.0%).
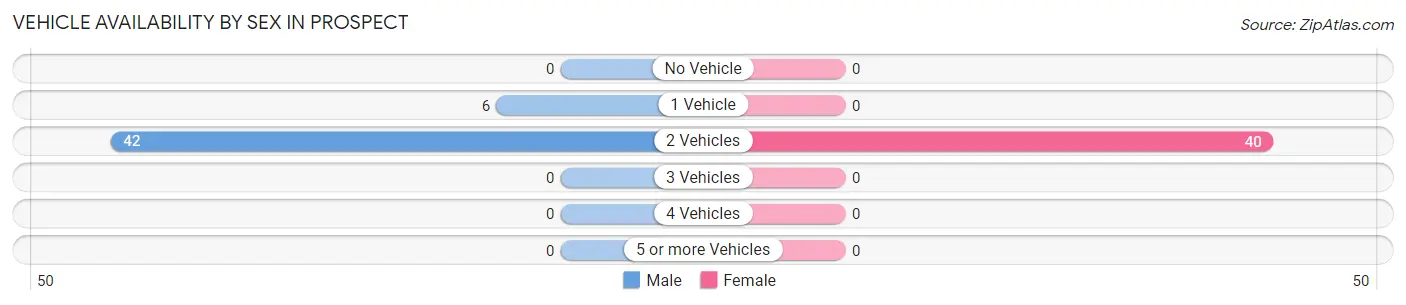
| Vehicles Available | Male | Female |
| No Vehicle | 0 (0.0%) | 0 (0.0%) |
| 1 Vehicle | 6 (12.5%) | 0 (0.0%) |
| 2 Vehicles | 42 (87.5%) | 40 (100.0%) |
| 3 Vehicles | 0 (0.0%) | 0 (0.0%) |
| 4 Vehicles | 0 (0.0%) | 0 (0.0%) |
| 5 or more Vehicles | 0 (0.0%) | 0 (0.0%) |
| Total | 48 (100.0%) | 40 (100.0%) |
Commute Time in Prospect
The most frequently occuring commute durations in Prospect are 10 to 14 minutes (88 commuters, 100.0%), less than 5 minutes (0 commuters, 0.0%), and 5 to 9 minutes (0 commuters, 0.0%).
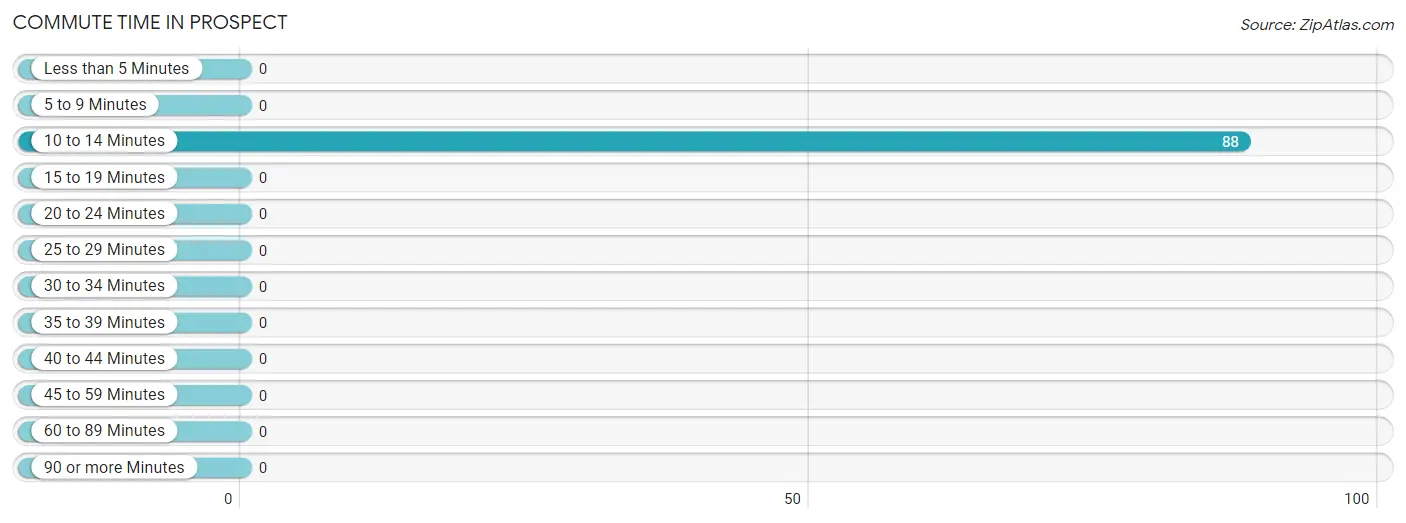
| Commute Time | # Commuters | % Commuters |
| Less than 5 Minutes | 0 | 0.0% |
| 5 to 9 Minutes | 0 | 0.0% |
| 10 to 14 Minutes | 88 | 100.0% |
| 15 to 19 Minutes | 0 | 0.0% |
| 20 to 24 Minutes | 0 | 0.0% |
| 25 to 29 Minutes | 0 | 0.0% |
| 30 to 34 Minutes | 0 | 0.0% |
| 35 to 39 Minutes | 0 | 0.0% |
| 40 to 44 Minutes | 0 | 0.0% |
| 45 to 59 Minutes | 0 | 0.0% |
| 60 to 89 Minutes | 0 | 0.0% |
| 90 or more Minutes | 0 | 0.0% |
Commute Time by Sex in Prospect
The most common commute times in Prospect are 10 to 14 minutes (48 commuters, 100.0%) for males and 10 to 14 minutes (40 commuters, 100.0%) for females.
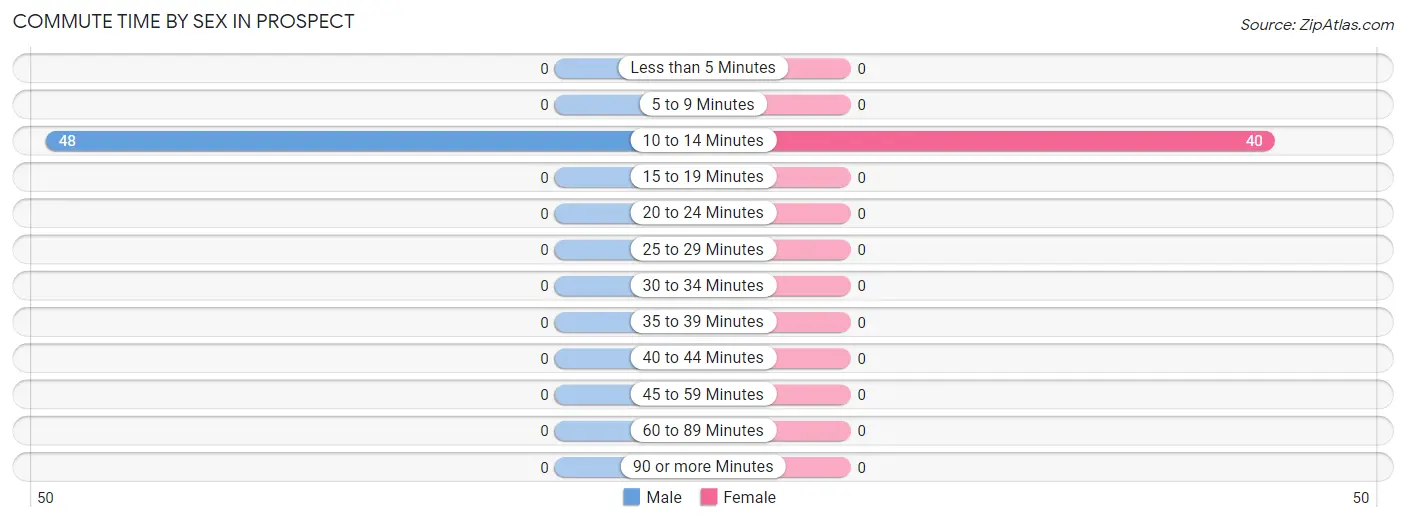
| Commute Time | Male | Female |
| Less than 5 Minutes | 0 (0.0%) | 0 (0.0%) |
| 5 to 9 Minutes | 0 (0.0%) | 0 (0.0%) |
| 10 to 14 Minutes | 48 (100.0%) | 40 (100.0%) |
| 15 to 19 Minutes | 0 (0.0%) | 0 (0.0%) |
| 20 to 24 Minutes | 0 (0.0%) | 0 (0.0%) |
| 25 to 29 Minutes | 0 (0.0%) | 0 (0.0%) |
| 30 to 34 Minutes | 0 (0.0%) | 0 (0.0%) |
| 35 to 39 Minutes | 0 (0.0%) | 0 (0.0%) |
| 40 to 44 Minutes | 0 (0.0%) | 0 (0.0%) |
| 45 to 59 Minutes | 0 (0.0%) | 0 (0.0%) |
| 60 to 89 Minutes | 0 (0.0%) | 0 (0.0%) |
| 90 or more Minutes | 0 (0.0%) | 0 (0.0%) |
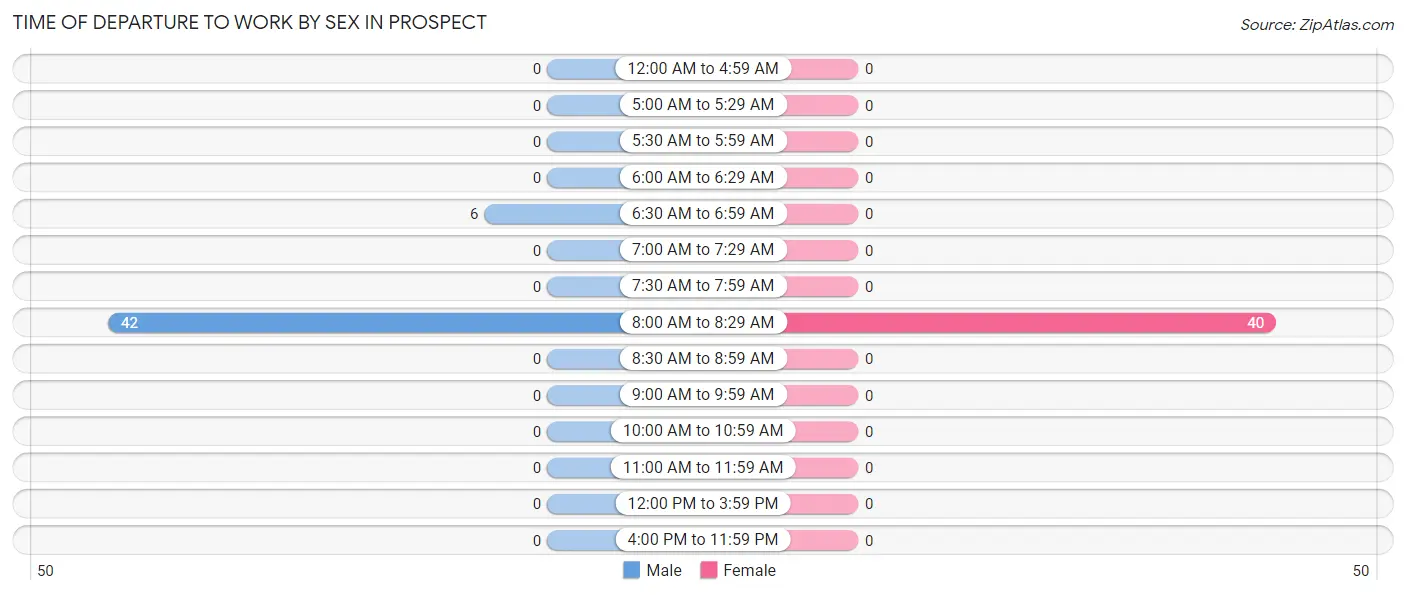
Time of Departure to Work by Sex in Prospect
The most frequent times of departure to work in Prospect are 8:00 AM to 8:29 AM (42, 87.5%) for males and 8:00 AM to 8:29 AM (40, 100.0%) for females.
| Time of Departure | Male | Female |
| 12:00 AM to 4:59 AM | 0 (0.0%) | 0 (0.0%) |
| 5:00 AM to 5:29 AM | 0 (0.0%) | 0 (0.0%) |
| 5:30 AM to 5:59 AM | 0 (0.0%) | 0 (0.0%) |
| 6:00 AM to 6:29 AM | 0 (0.0%) | 0 (0.0%) |
| 6:30 AM to 6:59 AM | 6 (12.5%) | 0 (0.0%) |
| 7:00 AM to 7:29 AM | 0 (0.0%) | 0 (0.0%) |
| 7:30 AM to 7:59 AM | 0 (0.0%) | 0 (0.0%) |
| 8:00 AM to 8:29 AM | 42 (87.5%) | 40 (100.0%) |
| 8:30 AM to 8:59 AM | 0 (0.0%) | 0 (0.0%) |
| 9:00 AM to 9:59 AM | 0 (0.0%) | 0 (0.0%) |
| 10:00 AM to 10:59 AM | 0 (0.0%) | 0 (0.0%) |
| 11:00 AM to 11:59 AM | 0 (0.0%) | 0 (0.0%) |
| 12:00 PM to 3:59 PM | 0 (0.0%) | 0 (0.0%) |
| 4:00 PM to 11:59 PM | 0 (0.0%) | 0 (0.0%) |
| Total | 48 (100.0%) | 40 (100.0%) |
Housing Occupancy in Prospect
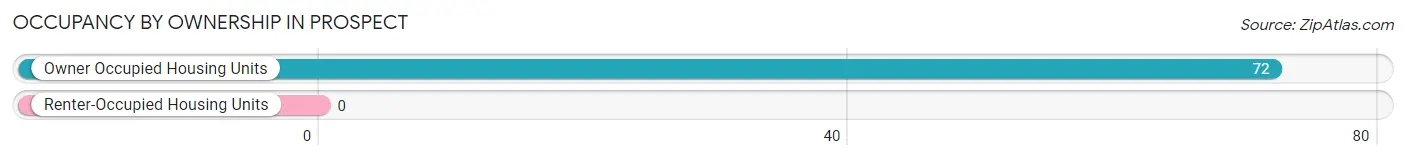
Occupancy by Ownership in Prospect
Of the total 72 dwellings in Prospect, owner-occupied units account for 72 (100.0%), while renter-occupied units make up 0 (0.0%).
| Occupancy | # Housing Units | % Housing Units |
| Owner Occupied Housing Units | 72 | 100.0% |
| Renter-Occupied Housing Units | 0 | 0.0% |
| Total Occupied Housing Units | 72 | 100.0% |
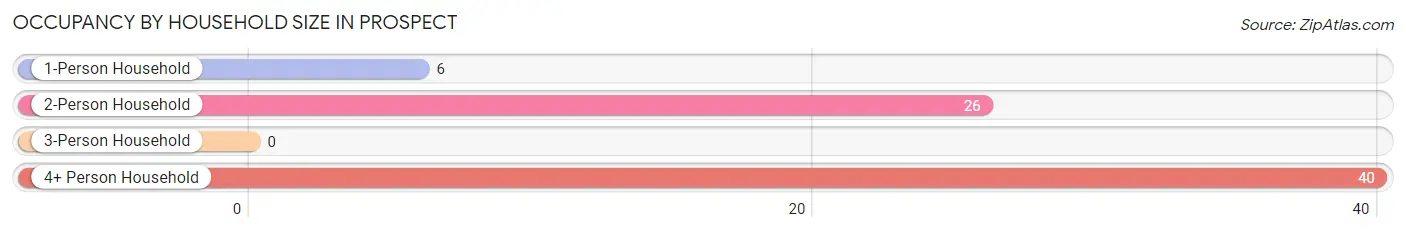
Occupancy by Household Size in Prospect
| Household Size | # Housing Units | % Housing Units |
| 1-Person Household | 6 | 8.3% |
| 2-Person Household | 26 | 36.1% |
| 3-Person Household | 0 | 0.0% |
| 4+ Person Household | 40 | 55.6% |
| Total Housing Units | 72 | 100.0% |
Occupancy by Ownership by Household Size in Prospect
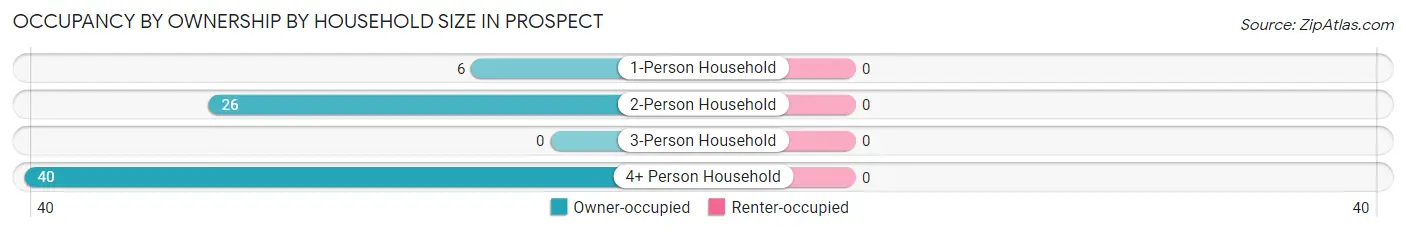
| Household Size | Owner-occupied | Renter-occupied |
| 1-Person Household | 6 (100.0%) | 0 (0.0%) |
| 2-Person Household | 26 (100.0%) | 0 (0.0%) |
| 3-Person Household | 0 (0.0%) | 0 (0.0%) |
| 4+ Person Household | 40 (100.0%) | 0 (0.0%) |
| Total Housing Units | 72 (100.0%) | 0 (0.0%) |
Occupancy by Educational Attainment in Prospect
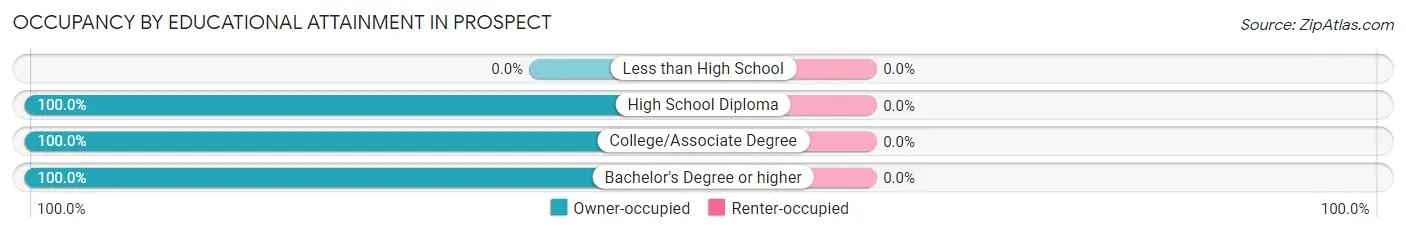
| Household Size | Owner-occupied | Renter-occupied |
| Less than High School | 0 (0.0%) | 0 (0.0%) |
| High School Diploma | 49 (100.0%) | 0 (0.0%) |
| College/Associate Degree | 17 (100.0%) | 0 (0.0%) |
| Bachelor's Degree or higher | 6 (100.0%) | 0 (0.0%) |
Occupancy by Age of Householder in Prospect
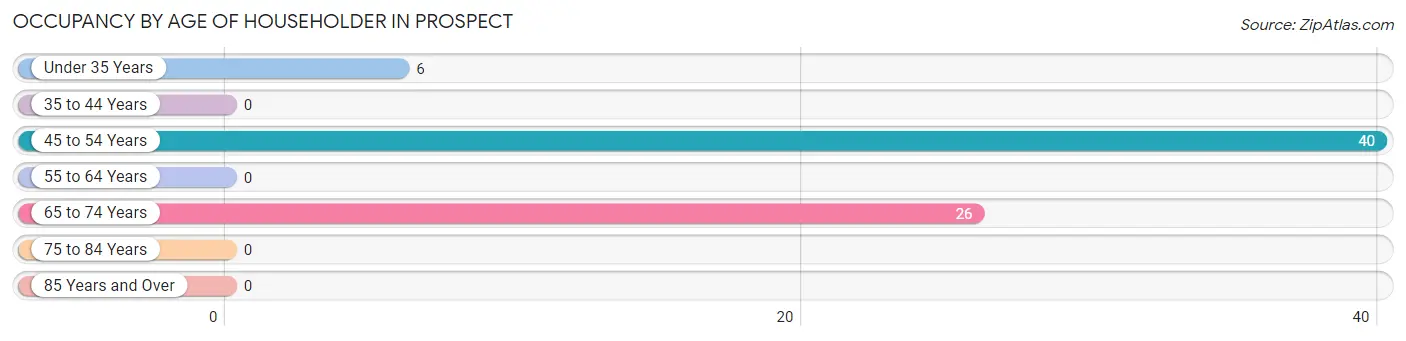
| Age Bracket | # Households | % Households |
| Under 35 Years | 6 | 8.3% |
| 35 to 44 Years | 0 | 0.0% |
| 45 to 54 Years | 40 | 55.6% |
| 55 to 64 Years | 0 | 0.0% |
| 65 to 74 Years | 26 | 36.1% |
| 75 to 84 Years | 0 | 0.0% |
| 85 Years and Over | 0 | 0.0% |
| Total | 72 | 100.0% |
Housing Finances in Prospect
Median Income by Occupancy in Prospect
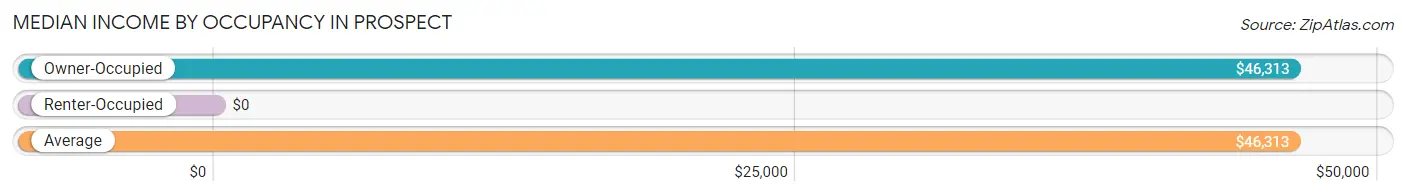
| Occupancy Type | # Households | Median Income |
| Owner-Occupied | 72 (100.0%) | $46,313 |
| Renter-Occupied | 0 (0.0%) | $0 |
| Average | 72 (100.0%) | $46,313 |
Occupancy by Householder Income Bracket in Prospect
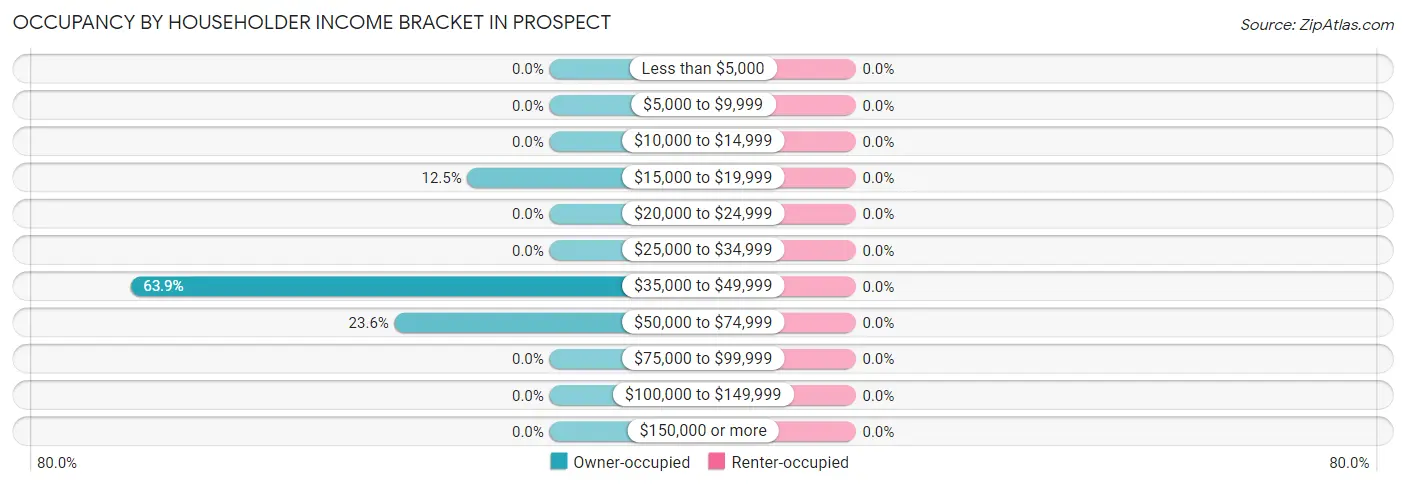
| Income Bracket | Owner-occupied | Renter-occupied |
| Less than $5,000 | 0 (0.0%) | 0 (0.0%) |
| $5,000 to $9,999 | 0 (0.0%) | 0 (0.0%) |
| $10,000 to $14,999 | 0 (0.0%) | 0 (0.0%) |
| $15,000 to $19,999 | 9 (12.5%) | 0 (0.0%) |
| $20,000 to $24,999 | 0 (0.0%) | 0 (0.0%) |
| $25,000 to $34,999 | 0 (0.0%) | 0 (0.0%) |
| $35,000 to $49,999 | 46 (63.9%) | 0 (0.0%) |
| $50,000 to $74,999 | 17 (23.6%) | 0 (0.0%) |
| $75,000 to $99,999 | 0 (0.0%) | 0 (0.0%) |
| $100,000 to $149,999 | 0 (0.0%) | 0 (0.0%) |
| $150,000 or more | 0 (0.0%) | 0 (0.0%) |
| Total | 72 (100.0%) | 0 (0.0%) |
Monthly Housing Cost Tiers in Prospect
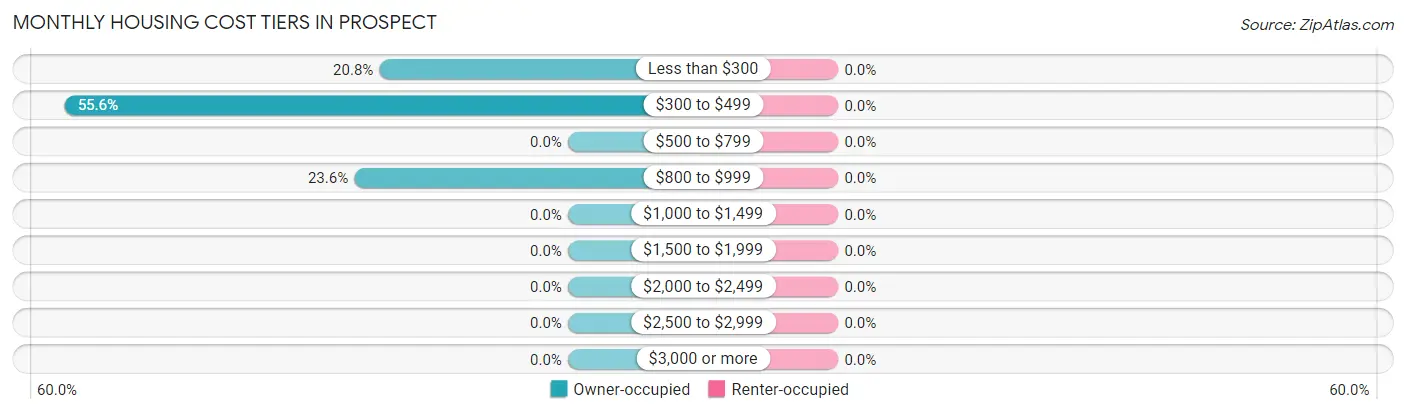
| Monthly Cost | Owner-occupied | Renter-occupied |
| Less than $300 | 15 (20.8%) | 0 (0.0%) |
| $300 to $499 | 40 (55.6%) | 0 (0.0%) |
| $500 to $799 | 0 (0.0%) | 0 (0.0%) |
| $800 to $999 | 17 (23.6%) | 0 (0.0%) |
| $1,000 to $1,499 | 0 (0.0%) | 0 (0.0%) |
| $1,500 to $1,999 | 0 (0.0%) | 0 (0.0%) |
| $2,000 to $2,499 | 0 (0.0%) | 0 (0.0%) |
| $2,500 to $2,999 | 0 (0.0%) | 0 (0.0%) |
| $3,000 or more | 0 (0.0%) | 0 (0.0%) |
| Total | 72 (100.0%) | 0 (0.0%) |
Physical Housing Characteristics in Prospect
Housing Structures in Prospect
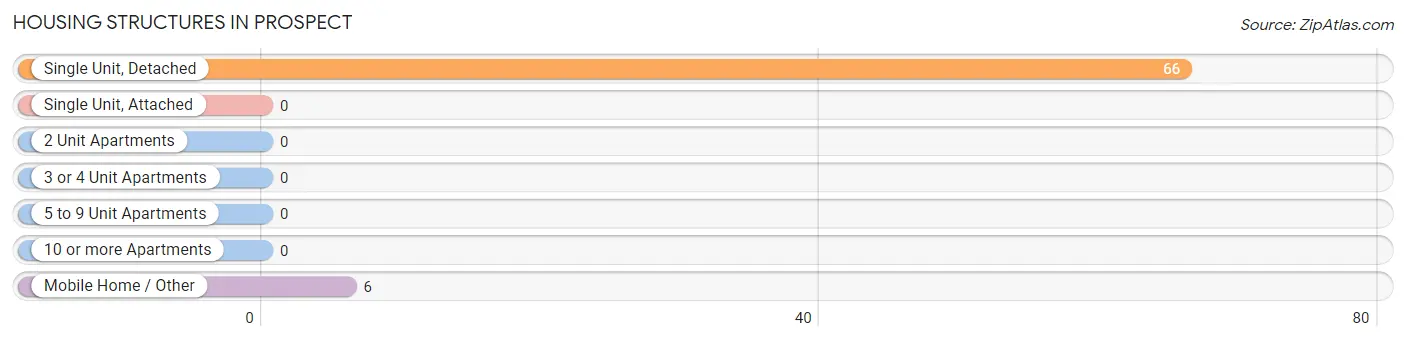
| Structure Type | # Housing Units | % Housing Units |
| Single Unit, Detached | 66 | 91.7% |
| Single Unit, Attached | 0 | 0.0% |
| 2 Unit Apartments | 0 | 0.0% |
| 3 or 4 Unit Apartments | 0 | 0.0% |
| 5 to 9 Unit Apartments | 0 | 0.0% |
| 10 or more Apartments | 0 | 0.0% |
| Mobile Home / Other | 6 | 8.3% |
| Total | 72 | 100.0% |
Housing Structures by Occupancy in Prospect
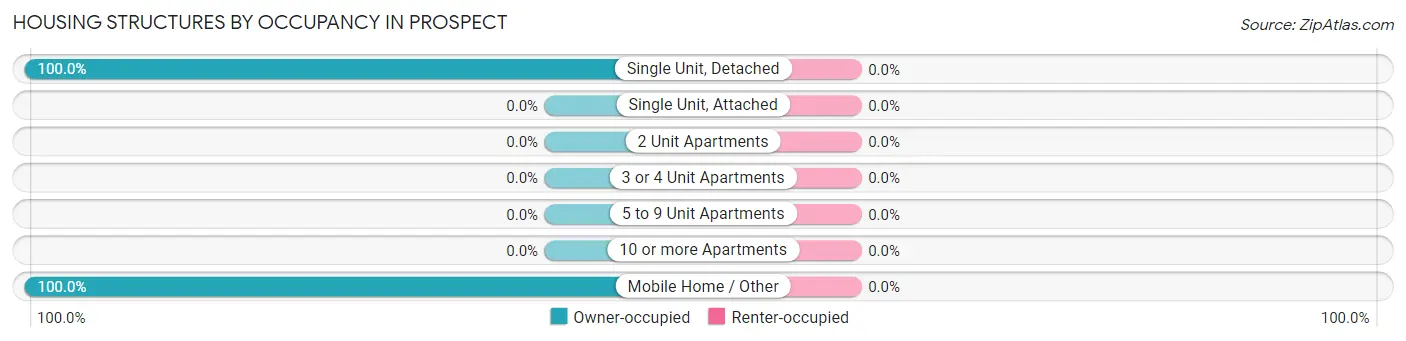
| Structure Type | Owner-occupied | Renter-occupied |
| Single Unit, Detached | 66 (100.0%) | 0 (0.0%) |
| Single Unit, Attached | 0 (0.0%) | 0 (0.0%) |
| 2 Unit Apartments | 0 (0.0%) | 0 (0.0%) |
| 3 or 4 Unit Apartments | 0 (0.0%) | 0 (0.0%) |
| 5 to 9 Unit Apartments | 0 (0.0%) | 0 (0.0%) |
| 10 or more Apartments | 0 (0.0%) | 0 (0.0%) |
| Mobile Home / Other | 6 (100.0%) | 0 (0.0%) |
| Total | 72 (100.0%) | 0 (0.0%) |
Housing Structures by Number of Rooms in Prospect
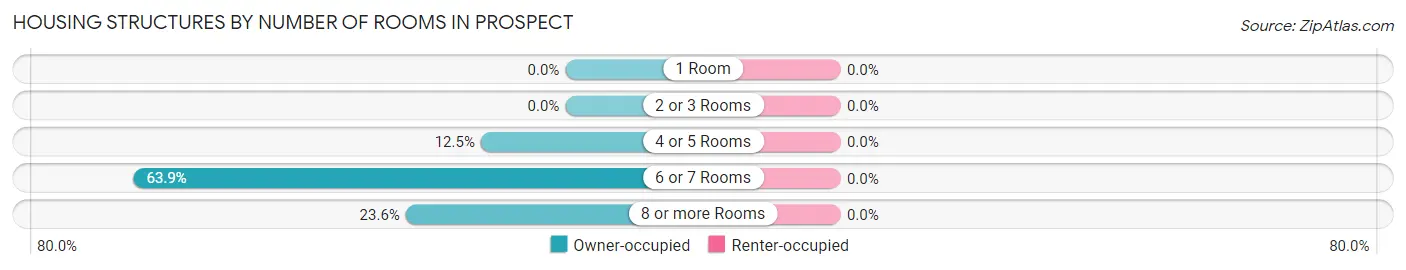
| Number of Rooms | Owner-occupied | Renter-occupied |
| 1 Room | 0 (0.0%) | 0 (0.0%) |
| 2 or 3 Rooms | 0 (0.0%) | 0 (0.0%) |
| 4 or 5 Rooms | 9 (12.5%) | 0 (0.0%) |
| 6 or 7 Rooms | 46 (63.9%) | 0 (0.0%) |
| 8 or more Rooms | 17 (23.6%) | 0 (0.0%) |
| Total | 72 (100.0%) | 0 (0.0%) |
Housing Structure by Heating Type in Prospect
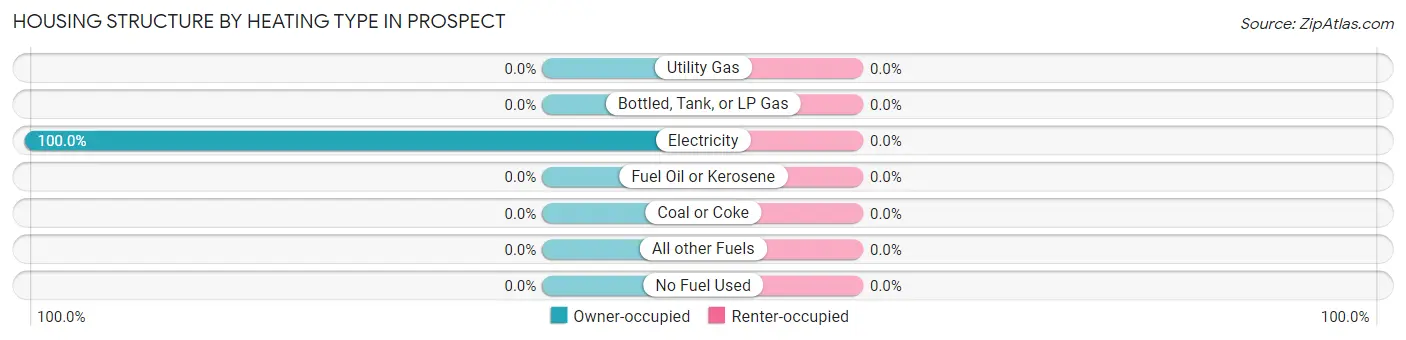
| Heating Type | Owner-occupied | Renter-occupied |
| Utility Gas | 0 (0.0%) | 0 (0.0%) |
| Bottled, Tank, or LP Gas | 0 (0.0%) | 0 (0.0%) |
| Electricity | 72 (100.0%) | 0 (0.0%) |
| Fuel Oil or Kerosene | 0 (0.0%) | 0 (0.0%) |
| Coal or Coke | 0 (0.0%) | 0 (0.0%) |
| All other Fuels | 0 (0.0%) | 0 (0.0%) |
| No Fuel Used | 0 (0.0%) | 0 (0.0%) |
| Total | 72 (100.0%) | 0 (0.0%) |
Household Vehicle Usage in Prospect
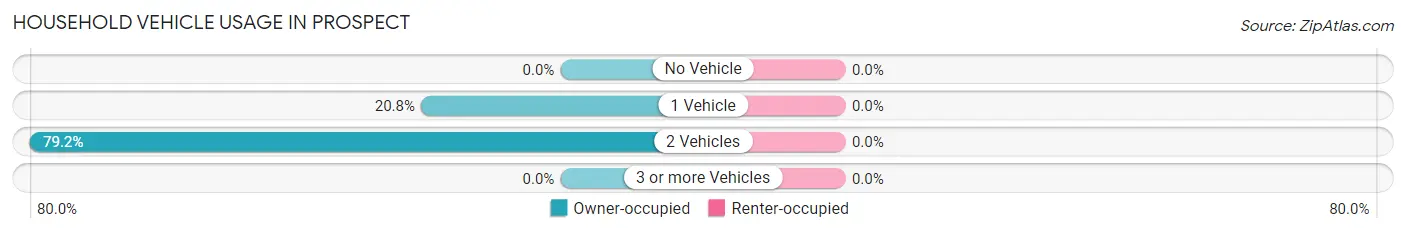
| Vehicles per Household | Owner-occupied | Renter-occupied |
| No Vehicle | 0 (0.0%) | 0 (0.0%) |
| 1 Vehicle | 15 (20.8%) | 0 (0.0%) |
| 2 Vehicles | 57 (79.2%) | 0 (0.0%) |
| 3 or more Vehicles | 0 (0.0%) | 0 (0.0%) |
| Total | 72 (100.0%) | 0 (0.0%) |
Real Estate & Mortgages in Prospect
Real Estate and Mortgage Overview in Prospect
| Characteristic | Without Mortgage | With Mortgage |
| Housing Units | 55 | 17 |
| Median Property Value | $157,800 | $0 |
| Median Household Income | $45,781 | $0 |
| Monthly Housing Costs | $431 | $0 |
| Real Estate Taxes | - | - |
Property Value by Mortgage Status in Prospect
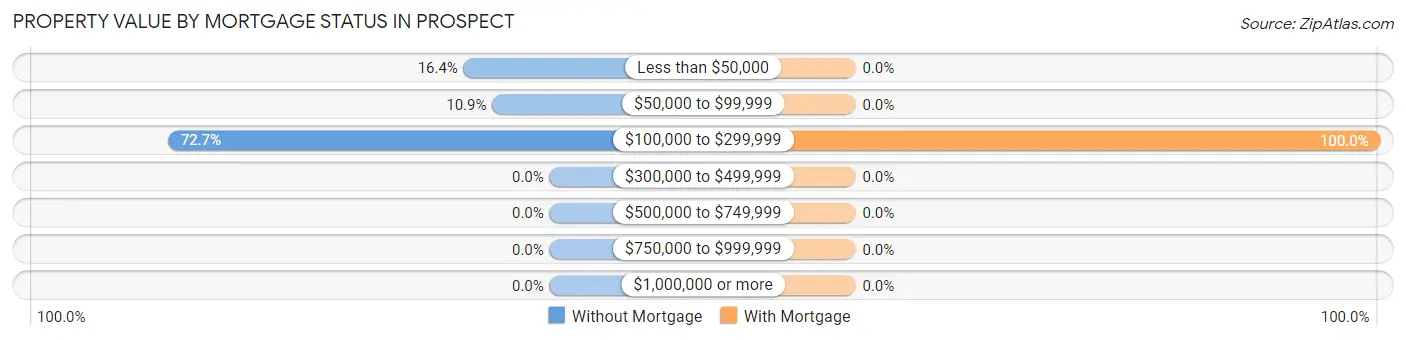
| Property Value | Without Mortgage | With Mortgage |
| Less than $50,000 | 9 (16.4%) | 0 (0.0%) |
| $50,000 to $99,999 | 6 (10.9%) | 0 (0.0%) |
| $100,000 to $299,999 | 40 (72.7%) | 17 (100.0%) |
| $300,000 to $499,999 | 0 (0.0%) | 0 (0.0%) |
| $500,000 to $749,999 | 0 (0.0%) | 0 (0.0%) |
| $750,000 to $999,999 | 0 (0.0%) | 0 (0.0%) |
| $1,000,000 or more | 0 (0.0%) | 0 (0.0%) |
| Total | 55 (100.0%) | 17 (100.0%) |
Household Income by Mortgage Status in Prospect
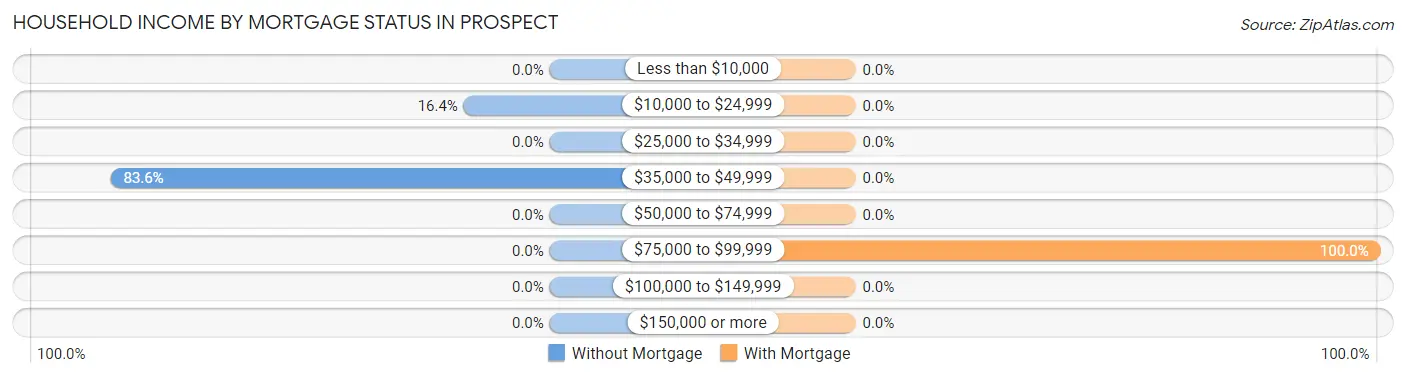
| Household Income | Without Mortgage | With Mortgage |
| Less than $10,000 | 0 (0.0%) | 0 (0.0%) |
| $10,000 to $24,999 | 9 (16.4%) | 0 (0.0%) |
| $25,000 to $34,999 | 0 (0.0%) | 0 (0.0%) |
| $35,000 to $49,999 | 46 (83.6%) | 0 (0.0%) |
| $50,000 to $74,999 | 0 (0.0%) | 0 (0.0%) |
| $75,000 to $99,999 | 0 (0.0%) | 17 (100.0%) |
| $100,000 to $149,999 | 0 (0.0%) | 0 (0.0%) |
| $150,000 or more | 0 (0.0%) | 0 (0.0%) |
| Total | 55 (100.0%) | 17 (100.0%) |
Property Value to Household Income Ratio in Prospect
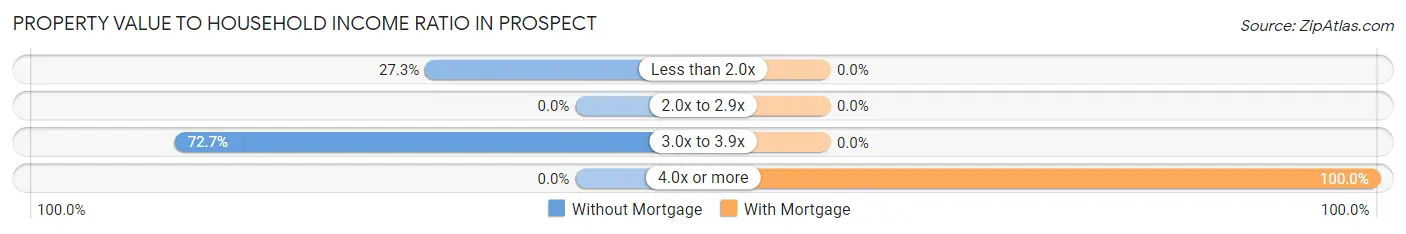
| Value-to-Income Ratio | Without Mortgage | With Mortgage |
| Less than 2.0x | 15 (27.3%) | 0 (0.0%) |
| 2.0x to 2.9x | 0 (0.0%) | 0 (0.0%) |
| 3.0x to 3.9x | 40 (72.7%) | 0 (0.0%) |
| 4.0x or more | 0 (0.0%) | 17 (100.0%) |
| Total | 55 (100.0%) | 17 (100.0%) |
Real Estate Taxes by Mortgage Status in Prospect
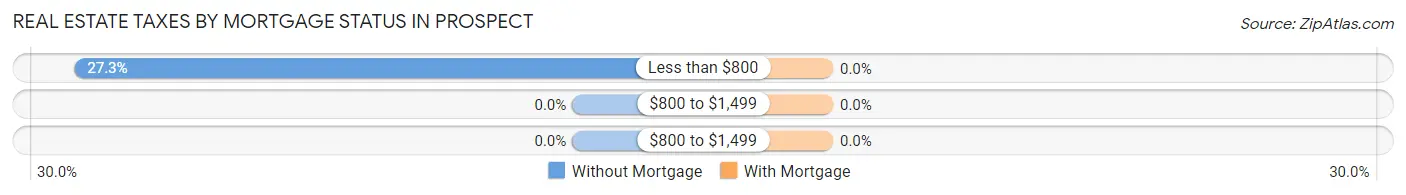
| Property Taxes | Without Mortgage | With Mortgage |
| Less than $800 | 15 (27.3%) | 0 (0.0%) |
| $800 to $1,499 | 0 (0.0%) | 0 (0.0%) |
| $800 to $1,499 | 0 (0.0%) | 0 (0.0%) |
| Total | 55 (100.0%) | 17 (100.0%) |
Health & Disability in Prospect
Health Insurance Coverage by Age in Prospect
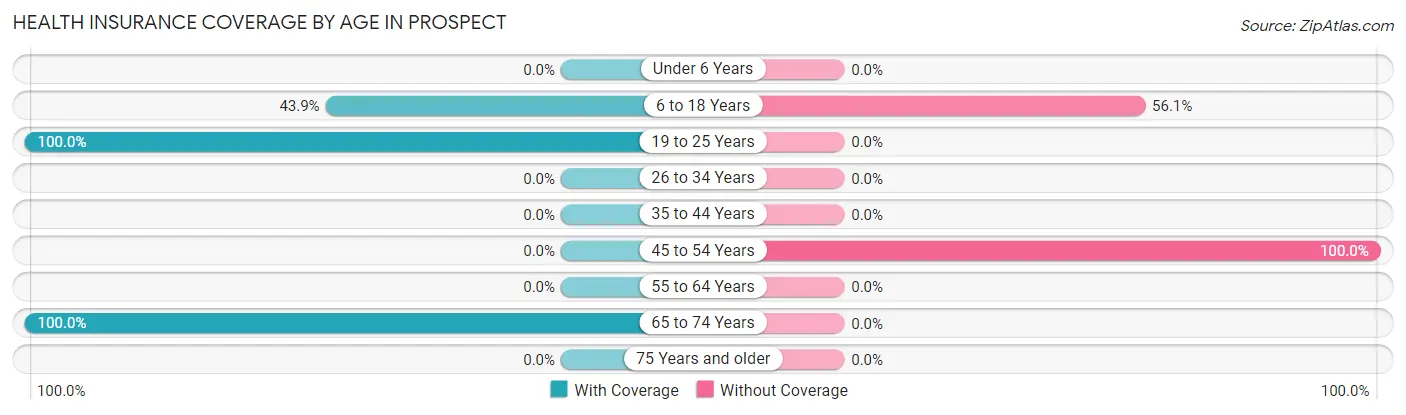
| Age Bracket | With Coverage | Without Coverage |
| Under 6 Years | 0 (0.0%) | 0 (0.0%) |
| 6 to 18 Years | 36 (43.9%) | 46 (56.1%) |
| 19 to 25 Years | 6 (100.0%) | 0 (0.0%) |
| 26 to 34 Years | 0 (0.0%) | 0 (0.0%) |
| 35 to 44 Years | 0 (0.0%) | 0 (0.0%) |
| 45 to 54 Years | 0 (0.0%) | 82 (100.0%) |
| 55 to 64 Years | 0 (0.0%) | 0 (0.0%) |
| 65 to 74 Years | 50 (100.0%) | 0 (0.0%) |
| 75 Years and older | 0 (0.0%) | 0 (0.0%) |
| Total | 92 (41.8%) | 128 (58.2%) |
Health Insurance Coverage by Citizenship Status in Prospect
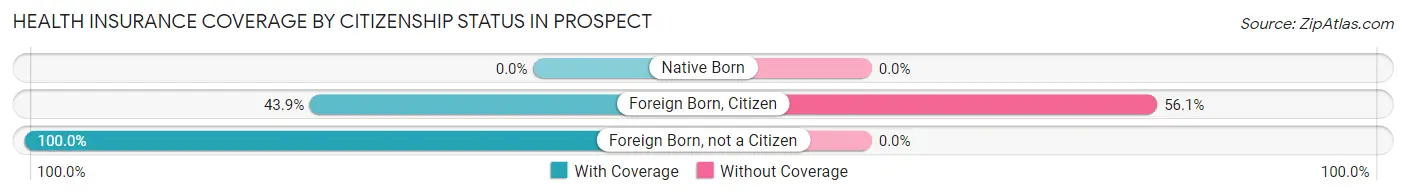
| Citizenship Status | With Coverage | Without Coverage |
| Native Born | 0 (0.0%) | 0 (0.0%) |
| Foreign Born, Citizen | 36 (43.9%) | 46 (56.1%) |
| Foreign Born, not a Citizen | 6 (100.0%) | 0 (0.0%) |
Health Insurance Coverage by Household Income in Prospect
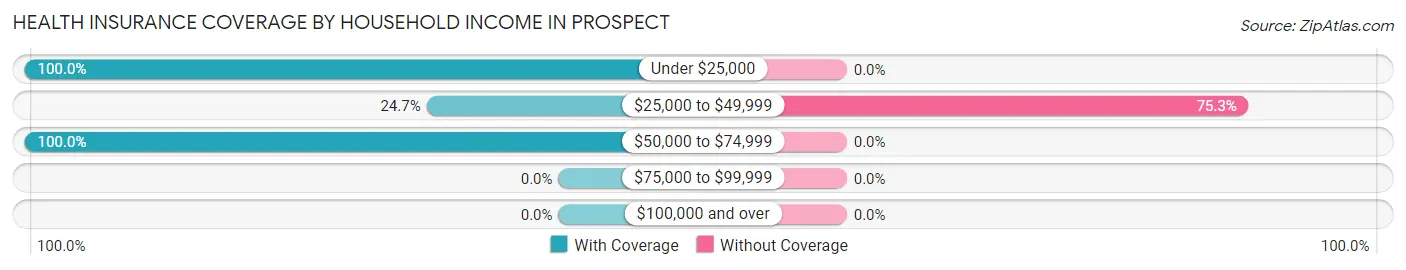
| Household Income | With Coverage | Without Coverage |
| Under $25,000 | 17 (100.0%) | 0 (0.0%) |
| $25,000 to $49,999 | 42 (24.7%) | 128 (75.3%) |
| $50,000 to $74,999 | 33 (100.0%) | 0 (0.0%) |
| $75,000 to $99,999 | 0 (0.0%) | 0 (0.0%) |
| $100,000 and over | 0 (0.0%) | 0 (0.0%) |
Public vs Private Health Insurance Coverage by Age in Prospect
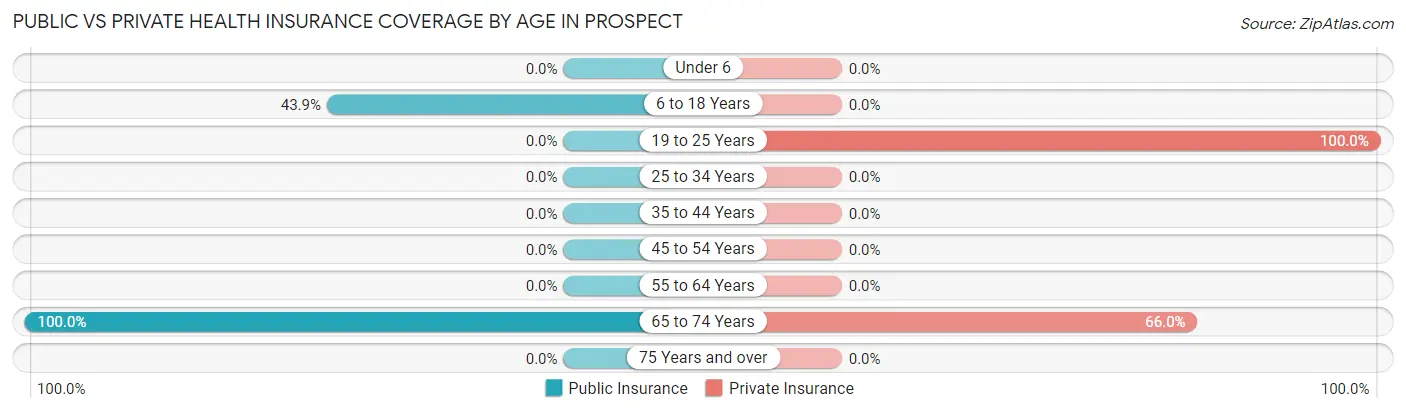
| Age Bracket | Public Insurance | Private Insurance |
| Under 6 | 0 (0.0%) | 0 (0.0%) |
| 6 to 18 Years | 36 (43.9%) | 0 (0.0%) |
| 19 to 25 Years | 0 (0.0%) | 6 (100.0%) |
| 25 to 34 Years | 0 (0.0%) | 0 (0.0%) |
| 35 to 44 Years | 0 (0.0%) | 0 (0.0%) |
| 45 to 54 Years | 0 (0.0%) | 0 (0.0%) |
| 55 to 64 Years | 0 (0.0%) | 0 (0.0%) |
| 65 to 74 Years | 50 (100.0%) | 33 (66.0%) |
| 75 Years and over | 0 (0.0%) | 0 (0.0%) |
| Total | 86 (39.1%) | 39 (17.7%) |
Disability Status by Sex by Age in Prospect
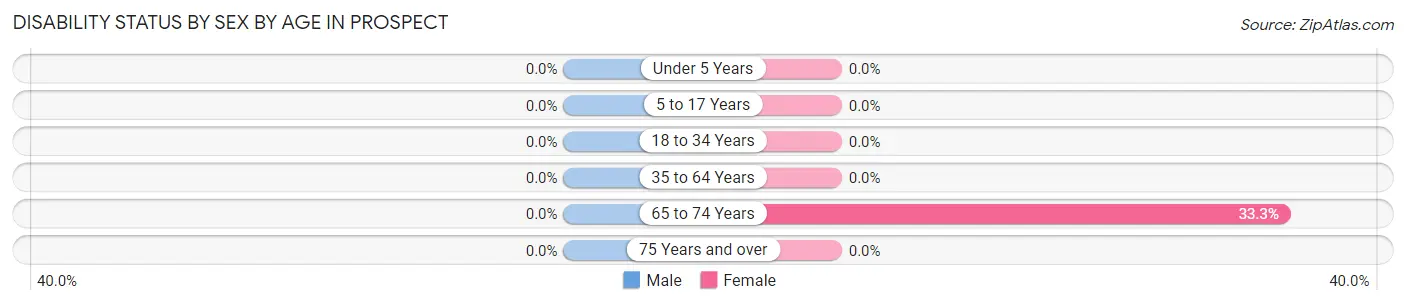
| Age Bracket | Male | Female |
| Under 5 Years | 0 (0.0%) | 0 (0.0%) |
| 5 to 17 Years | 0 (0.0%) | 0 (0.0%) |
| 18 to 34 Years | 0 (0.0%) | 0 (0.0%) |
| 35 to 64 Years | 0 (0.0%) | 0 (0.0%) |
| 65 to 74 Years | 0 (0.0%) | 8 (33.3%) |
| 75 Years and over | 0 (0.0%) | 0 (0.0%) |
Disability Class by Sex by Age in Prospect
Disability Class: Hearing Difficulty
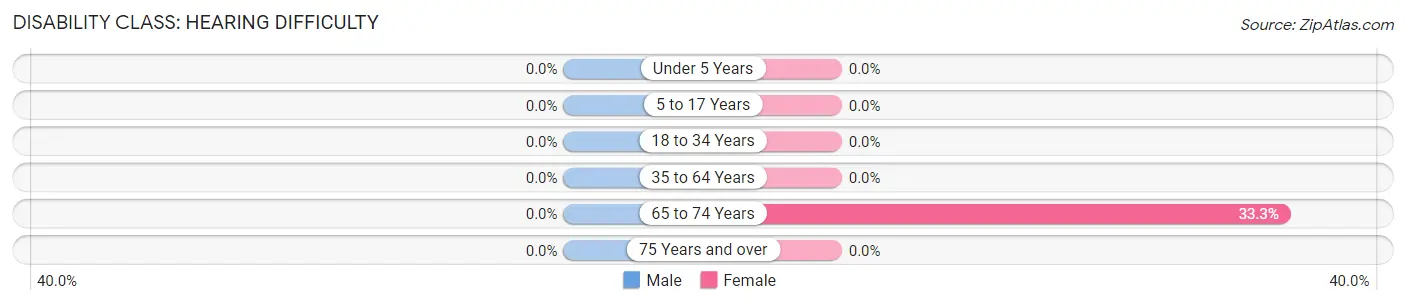
| Age Bracket | Male | Female |
| Under 5 Years | 0 (0.0%) | 0 (0.0%) |
| 5 to 17 Years | 0 (0.0%) | 0 (0.0%) |
| 18 to 34 Years | 0 (0.0%) | 0 (0.0%) |
| 35 to 64 Years | 0 (0.0%) | 0 (0.0%) |
| 65 to 74 Years | 0 (0.0%) | 8 (33.3%) |
| 75 Years and over | 0 (0.0%) | 0 (0.0%) |
Disability Class: Vision Difficulty
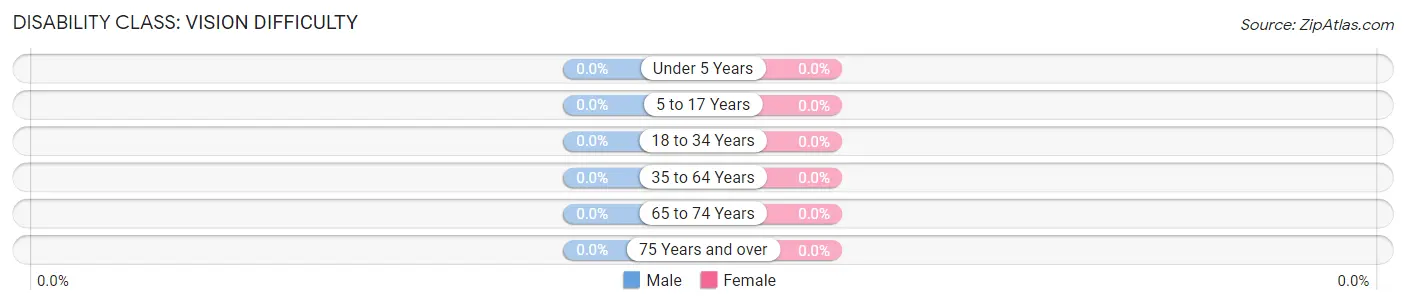
| Age Bracket | Male | Female |
| Under 5 Years | 0 (0.0%) | 0 (0.0%) |
| 5 to 17 Years | 0 (0.0%) | 0 (0.0%) |
| 18 to 34 Years | 0 (0.0%) | 0 (0.0%) |
| 35 to 64 Years | 0 (0.0%) | 0 (0.0%) |
| 65 to 74 Years | 0 (0.0%) | 0 (0.0%) |
| 75 Years and over | 0 (0.0%) | 0 (0.0%) |
Disability Class: Cognitive Difficulty
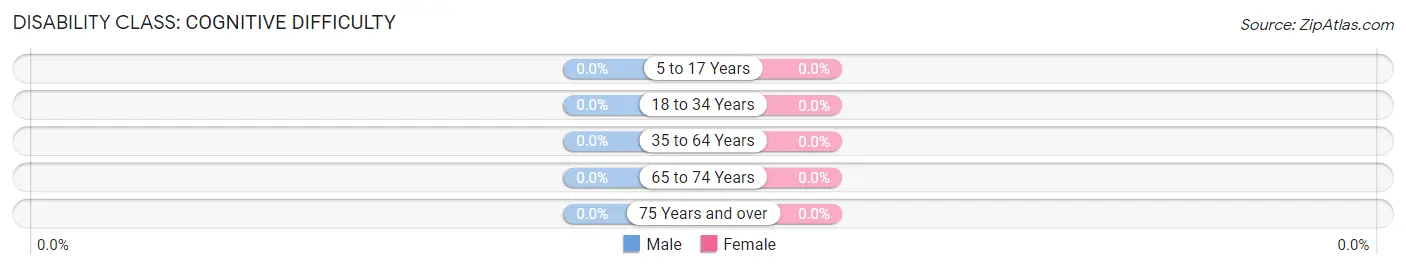
| Age Bracket | Male | Female |
| 5 to 17 Years | 0 (0.0%) | 0 (0.0%) |
| 18 to 34 Years | 0 (0.0%) | 0 (0.0%) |
| 35 to 64 Years | 0 (0.0%) | 0 (0.0%) |
| 65 to 74 Years | 0 (0.0%) | 0 (0.0%) |
| 75 Years and over | 0 (0.0%) | 0 (0.0%) |
Disability Class: Ambulatory Difficulty
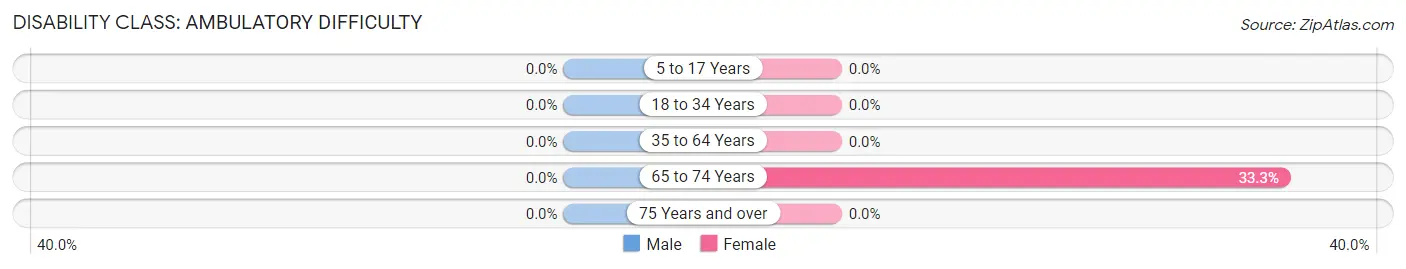
| Age Bracket | Male | Female |
| 5 to 17 Years | 0 (0.0%) | 0 (0.0%) |
| 18 to 34 Years | 0 (0.0%) | 0 (0.0%) |
| 35 to 64 Years | 0 (0.0%) | 0 (0.0%) |
| 65 to 74 Years | 0 (0.0%) | 8 (33.3%) |
| 75 Years and over | 0 (0.0%) | 0 (0.0%) |
Disability Class: Self-Care Difficulty
| Age Bracket | Male | Female |
| 5 to 17 Years | 0 (0.0%) | 0 (0.0%) |
| 18 to 34 Years | 0 (0.0%) | 0 (0.0%) |
| 35 to 64 Years | 0 (0.0%) | 0 (0.0%) |
| 65 to 74 Years | 0 (0.0%) | 0 (0.0%) |
| 75 Years and over | 0 (0.0%) | 0 (0.0%) |
Technology Access in Prospect
Computing Device Access in Prospect
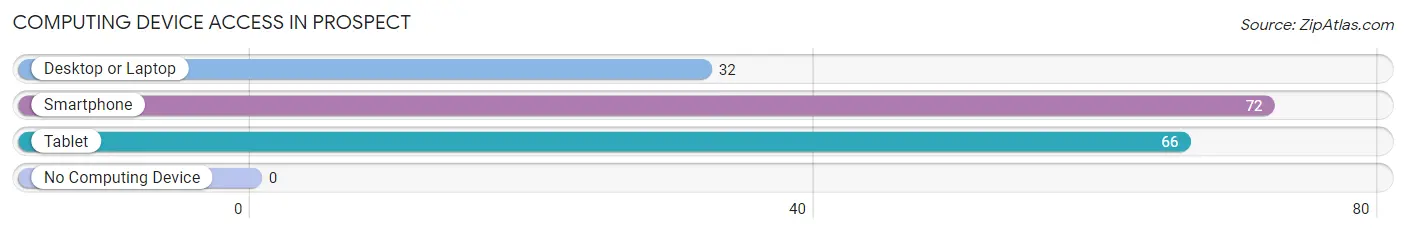
| Device Type | # Households | % Households |
| Desktop or Laptop | 32 | 44.4% |
| Smartphone | 72 | 100.0% |
| Tablet | 66 | 91.7% |
| No Computing Device | 0 | 0.0% |
| Total | 72 | 100.0% |
Internet Access in Prospect
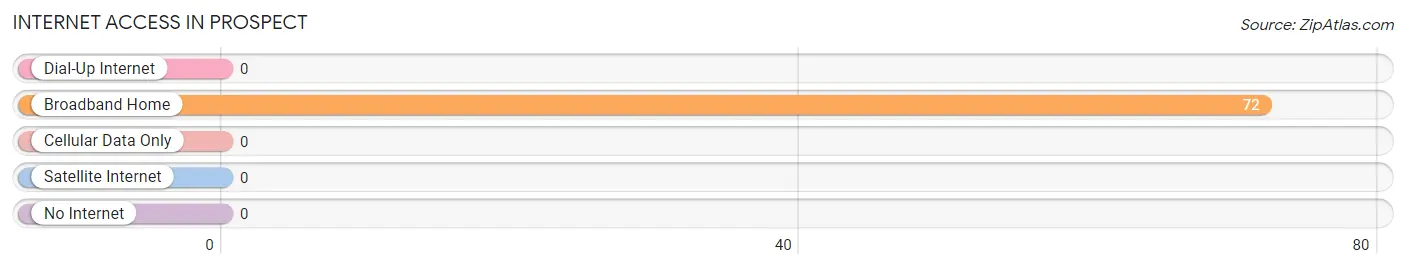
| Internet Type | # Households | % Households |
| Dial-Up Internet | 0 | 0.0% |
| Broadband Home | 72 | 100.0% |
| Cellular Data Only | 0 | 0.0% |
| Satellite Internet | 0 | 0.0% |
| No Internet | 0 | 0.0% |
| Total | 72 | 100.0% |
Prospect Summary
Prospect is a small unincorporated community located in the parish of East Baton Rouge, Louisiana. It is situated on the banks of the Mississippi River, approximately 20 miles north of Baton Rouge. The community is home to a population of approximately 1,000 people, and is known for its rural charm and close-knit community.
History
Prospect was first settled in the early 1800s by French settlers who were attracted to the area by its fertile soil and abundant natural resources. The community was originally known as “La Pointe”, and was later renamed “Prospect” in 1845. The name was chosen to reflect the area’s potential for growth and prosperity.
In the late 1800s, Prospect became a popular destination for wealthy plantation owners who wanted to escape the hustle and bustle of Baton Rouge. The community was known for its peaceful atmosphere and picturesque views of the Mississippi River.
In the early 1900s, Prospect began to experience a period of growth and development. The community was home to several businesses, including a general store, a post office, and a sawmill. The sawmill was particularly important to the local economy, as it provided employment for many of the area’s residents.
Geography
Prospect is located in East Baton Rouge Parish, approximately 20 miles north of Baton Rouge. The community is situated on the banks of the Mississippi River, and is surrounded by lush forests and rolling hills. The area is known for its natural beauty, and is home to a variety of wildlife, including deer, wild turkeys, and bald eagles.
Economy
The economy of Prospect is largely based on agriculture and forestry. The area is home to several farms, which produce a variety of crops, including corn, soybeans, and cotton. The community is also home to several sawmills, which provide employment for many of the area’s residents.
In addition to agriculture and forestry, Prospect is home to several small businesses, including a general store, a post office, and a gas station. The community is also home to a number of restaurants, which serve a variety of local and regional dishes.
Demographics
As of the 2010 census, Prospect had a population of 1,000 people. The racial makeup of the community was 97.7% White, 0.7% African American, 0.3% Native American, 0.2% Asian, and 1.1% from other races. The median household income was $37,500, and the median age was 37.
Conclusion
Prospect is a small unincorporated community located in East Baton Rouge Parish, Louisiana. The community is situated on the banks of the Mississippi River, and is known for its rural charm and close-knit community. The economy of Prospect is largely based on agriculture and forestry, and the area is home to several small businesses. As of the 2010 census, Prospect had a population of 1,000 people, and the median household income was $37,500.
Common Questions
What is Per Capita Income in Prospect?
Per Capita income in Prospect is $15,217.
What is the Median Family Income in Prospect?
Median Family Income in Prospect is $46,500.
What is the Median Household income in Prospect?
Median Household Income in Prospect is $46,313.
What is Inequality or Gini Index in Prospect?
Inequality or Gini Index in Prospect is 0.13.
What is the Total Population of Prospect?
Total Population of Prospect is 220.
What is the Total Male Population of Prospect?
Total Male Population of Prospect is 110.
What is the Total Female Population of Prospect?
Total Female Population of Prospect is 110.
What is the Ratio of Males per 100 Females in Prospect?
There are 100.00 Males per 100 Females in Prospect.
What is the Ratio of Females per 100 Males in Prospect?
There are 100.00 Females per 100 Males in Prospect.
What is the Median Population Age in Prospect?
Median Population Age in Prospect is 47.6 Years.
What is the Average Family Size in Prospect
Average Family Size in Prospect is 3.2 People.
What is the Average Household Size in Prospect
Average Household Size in Prospect is 3.1 People.
How Large is the Labor Force in Prospect?
There are 88 People in the Labor Forcein in Prospect.
What is the Percentage of People in the Labor Force in Prospect?
63.8% of People are in the Labor Force in Prospect.