Wagon Mound, NM Map & Demographics
Wagon Mound Map
Wagon Mound Overview
$28,647
PER CAPITA INCOME
$41,602
AVG FAMILY INCOME
$41,192
AVG HOUSEHOLD INCOME
72.6%
WAGE / INCOME GAP [ % ]
27.4¢/ $1
WAGE / INCOME GAP [ $ ]
0.39
INEQUALITY / GINI INDEX
491
TOTAL POPULATION
212
MALE POPULATION
279
FEMALE POPULATION
75.99
MALES / 100 FEMALES
131.60
FEMALES / 100 MALES
62.6
MEDIAN AGE
2.3
AVG FAMILY SIZE
1.8
AVG HOUSEHOLD SIZE
179
LABOR FORCE [ PEOPLE ]
40.6%
PERCENT IN LABOR FORCE
7.3%
UNEMPLOYMENT RATE
Wagon Mound Zip Codes
Income in Wagon Mound
Income Overview in Wagon Mound
Per Capita Income in Wagon Mound is $28,647, while median incomes of families and households are $41,602 and $41,192 respectively.
| Characteristic | Number | Measure |
| Per Capita Income | 491 | $28,647 |
| Median Family Income | 145 | $41,602 |
| Mean Family Income | 145 | $58,326 |
| Median Household Income | 270 | $41,192 |
| Mean Household Income | 270 | $47,925 |
| Income Deficit | 145 | $0 |
| Wage / Income Gap (%) | 491 | 72.63% |
| Wage / Income Gap ($) | 491 | 27.37¢ per $1 |
| Gini / Inequality Index | 491 | 0.39 |
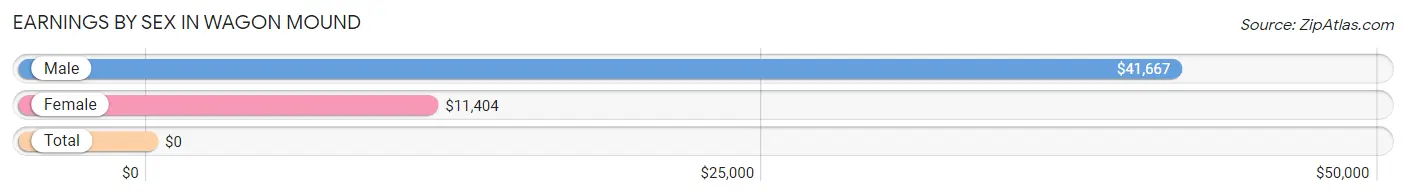
Earnings by Sex in Wagon Mound
| Sex | Number | Average Earnings |
| Male | 74 (41.1%) | $41,667 |
| Female | 106 (58.9%) | $11,404 |
| Total | 180 (100.0%) | $0 |
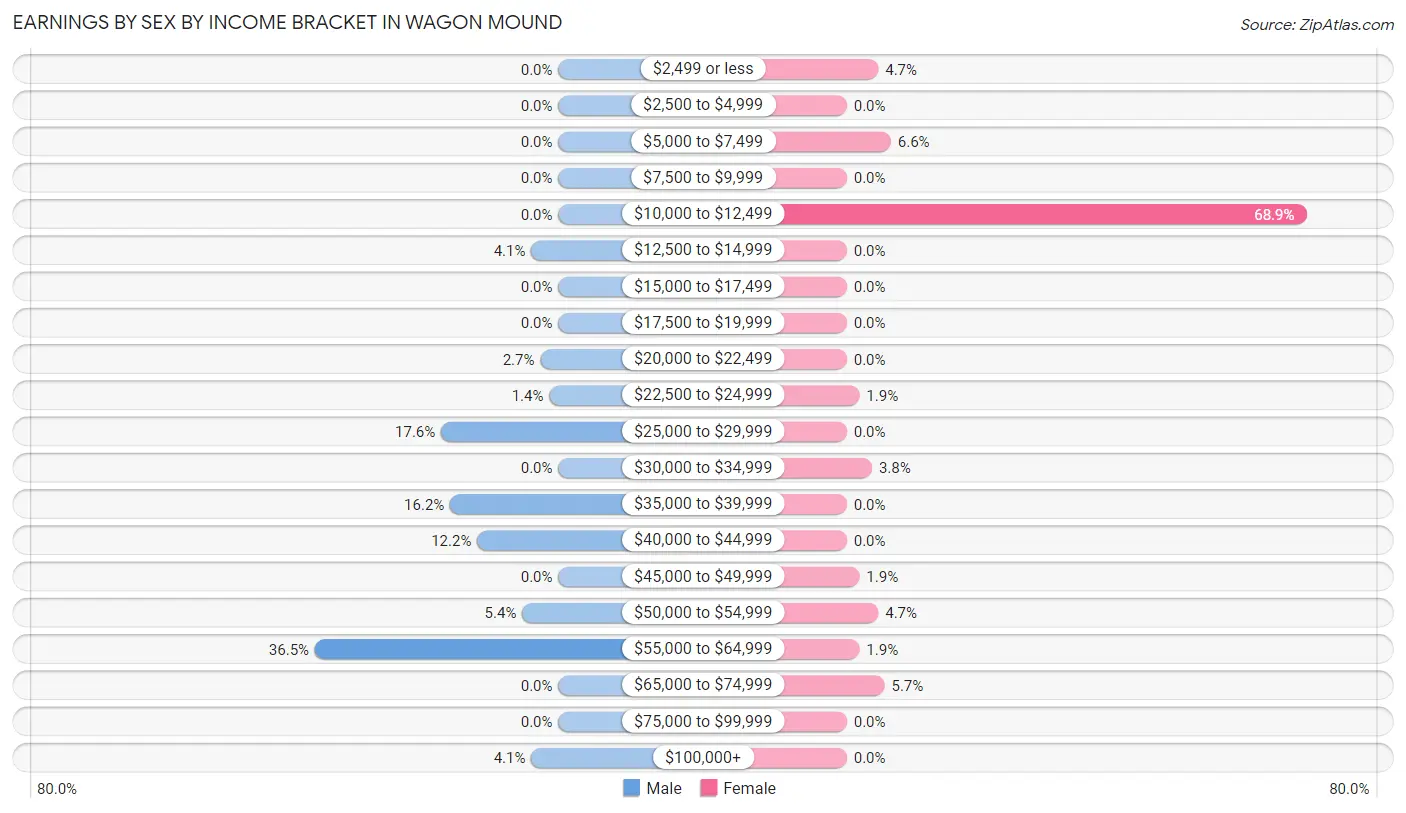
Earnings by Sex by Income Bracket in Wagon Mound
The most common earnings brackets in Wagon Mound are $55,000 to $64,999 for men (27 | 36.5%) and $10,000 to $12,499 for women (73 | 68.9%).
| Income | Male | Female |
| $2,499 or less | 0 (0.0%) | 5 (4.7%) |
| $2,500 to $4,999 | 0 (0.0%) | 0 (0.0%) |
| $5,000 to $7,499 | 0 (0.0%) | 7 (6.6%) |
| $7,500 to $9,999 | 0 (0.0%) | 0 (0.0%) |
| $10,000 to $12,499 | 0 (0.0%) | 73 (68.9%) |
| $12,500 to $14,999 | 3 (4.1%) | 0 (0.0%) |
| $15,000 to $17,499 | 0 (0.0%) | 0 (0.0%) |
| $17,500 to $19,999 | 0 (0.0%) | 0 (0.0%) |
| $20,000 to $22,499 | 2 (2.7%) | 0 (0.0%) |
| $22,500 to $24,999 | 1 (1.3%) | 2 (1.9%) |
| $25,000 to $29,999 | 13 (17.6%) | 0 (0.0%) |
| $30,000 to $34,999 | 0 (0.0%) | 4 (3.8%) |
| $35,000 to $39,999 | 12 (16.2%) | 0 (0.0%) |
| $40,000 to $44,999 | 9 (12.2%) | 0 (0.0%) |
| $45,000 to $49,999 | 0 (0.0%) | 2 (1.9%) |
| $50,000 to $54,999 | 4 (5.4%) | 5 (4.7%) |
| $55,000 to $64,999 | 27 (36.5%) | 2 (1.9%) |
| $65,000 to $74,999 | 0 (0.0%) | 6 (5.7%) |
| $75,000 to $99,999 | 0 (0.0%) | 0 (0.0%) |
| $100,000+ | 3 (4.1%) | 0 (0.0%) |
| Total | 74 (100.0%) | 106 (100.0%) |
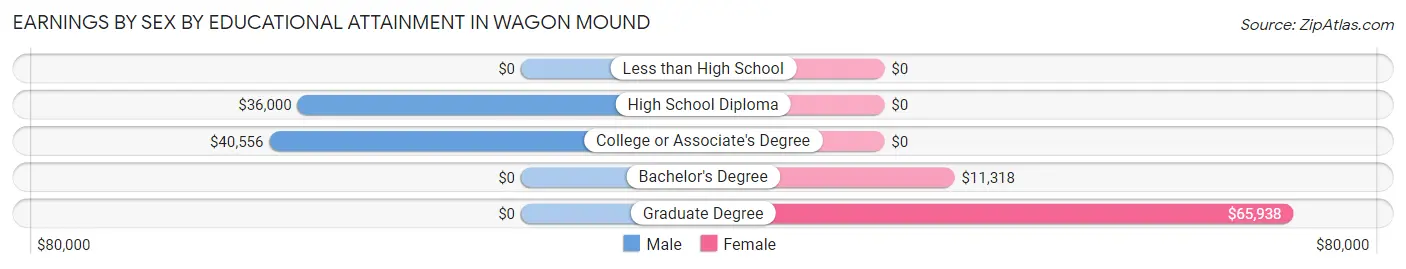
Earnings by Sex by Educational Attainment in Wagon Mound
Average earnings in Wagon Mound are $41,667 for men and $11,404 for women, a difference of 72.6%. Men with an educational attainment of college or associate's degree enjoy the highest average annual earnings of $40,556, while those with high school diploma education earn the least with $36,000. Women with an educational attainment of graduate degree earn the most with the average annual earnings of $65,938, while those with bachelor's degree education have the smallest earnings of $11,318.
| Educational Attainment | Male Income | Female Income |
| Less than High School | - | - |
| High School Diploma | $36,000 | $0 |
| College or Associate's Degree | $40,556 | $0 |
| Bachelor's Degree | - | - |
| Graduate Degree | - | - |
| Total | $41,667 | $11,404 |
Family Income in Wagon Mound
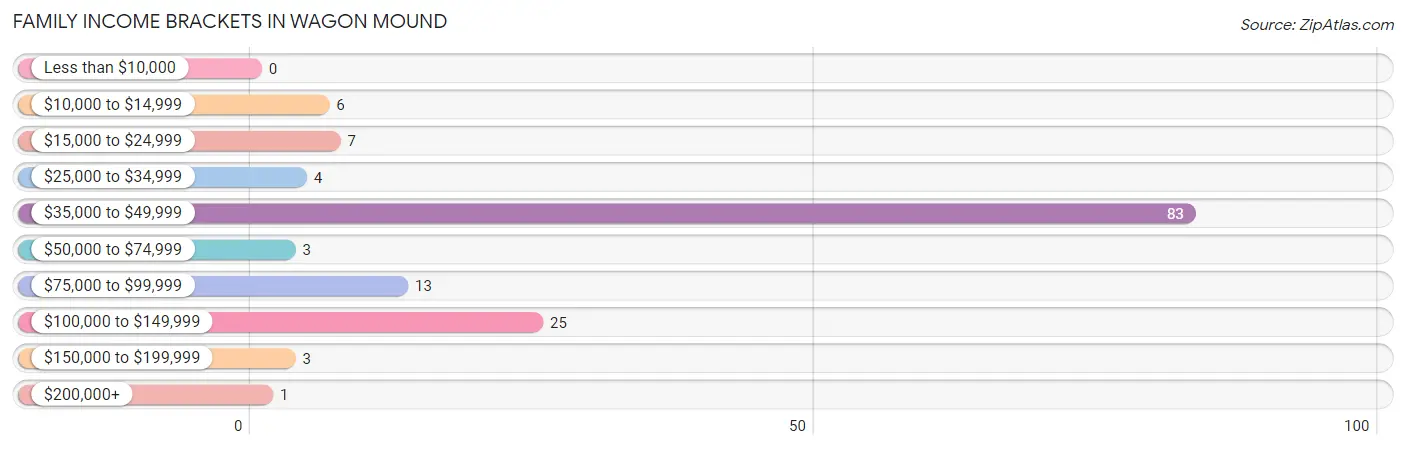
Family Income Brackets in Wagon Mound
According to the Wagon Mound family income data, there are 83 families falling into the $35,000 to $49,999 income range, which is the most common income bracket and makes up 57.2% of all families.
| Income Bracket | # Families | % Families |
| Less than $10,000 | 0 | 0.0% |
| $10,000 to $14,999 | 6 | 4.1% |
| $15,000 to $24,999 | 7 | 4.8% |
| $25,000 to $34,999 | 4 | 2.8% |
| $35,000 to $49,999 | 83 | 57.2% |
| $50,000 to $74,999 | 3 | 2.1% |
| $75,000 to $99,999 | 13 | 9.0% |
| $100,000 to $149,999 | 25 | 17.2% |
| $150,000 to $199,999 | 3 | 2.1% |
| $200,000+ | 1 | 0.7% |
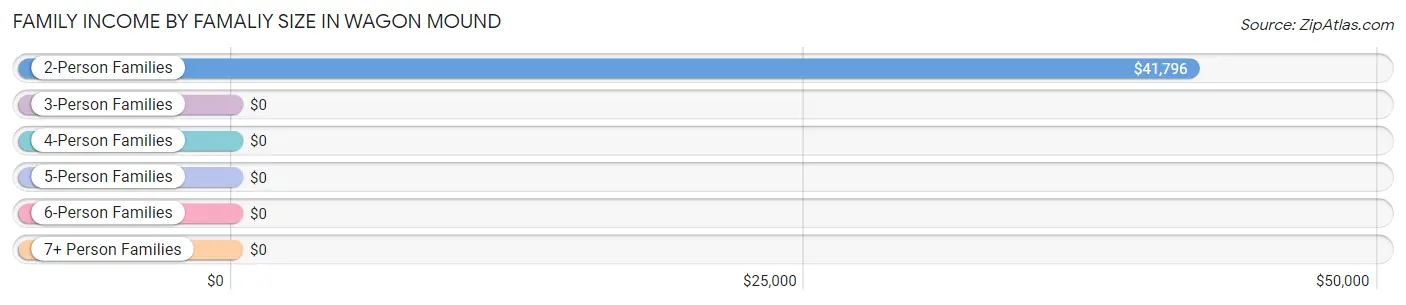
Family Income by Famaliy Size in Wagon Mound
2-person families (128 | 88.3%) account for the highest median family income in Wagon Mound with $41,796 per family, while 2-person families (128 | 88.3%) have the highest median income of $20,898 per family member.
| Income Bracket | # Families | Median Income |
| 2-Person Families | 128 (88.3%) | $41,796 |
| 3-Person Families | 13 (9.0%) | $0 |
| 4-Person Families | 4 (2.8%) | $0 |
| 5-Person Families | 0 (0.0%) | $0 |
| 6-Person Families | 0 (0.0%) | $0 |
| 7+ Person Families | 0 (0.0%) | $0 |
| Total | 145 (100.0%) | $41,602 |
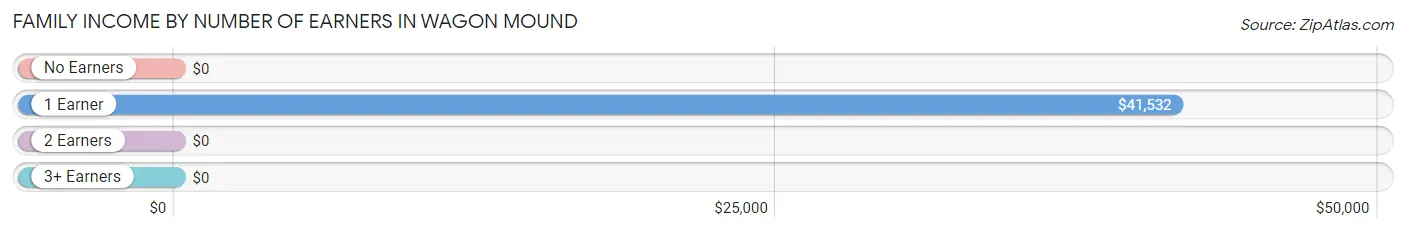
Family Income by Number of Earners in Wagon Mound
| Number of Earners | # Families | Median Income |
| No Earners | 25 (17.2%) | $0 |
| 1 Earner | 115 (79.3%) | $41,532 |
| 2 Earners | 5 (3.5%) | $0 |
| 3+ Earners | 0 (0.0%) | $0 |
| Total | 145 (100.0%) | $41,602 |
Household Income in Wagon Mound
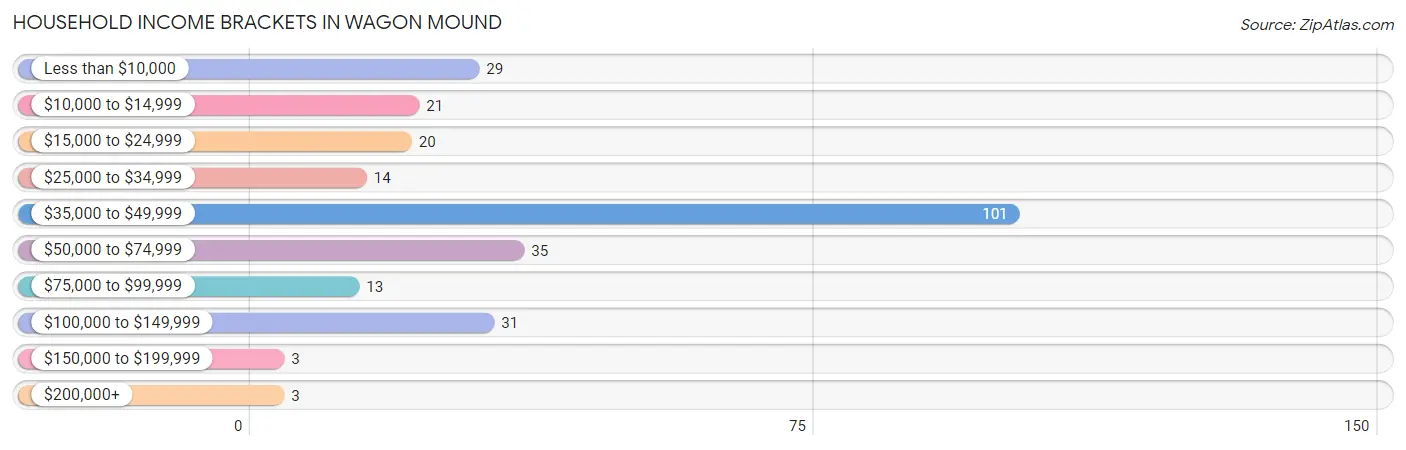
Household Income Brackets in Wagon Mound
With 101 households falling in the category, the $35,000 to $49,999 income range is the most frequent in Wagon Mound, accounting for 37.4% of all households. In contrast, only 3 households (1.1%) fall into the $150,000 to $199,999 income bracket, making it the least populous group.
| Income Bracket | # Households | % Households |
| Less than $10,000 | 29 | 10.7% |
| $10,000 to $14,999 | 21 | 7.8% |
| $15,000 to $24,999 | 20 | 7.4% |
| $25,000 to $34,999 | 14 | 5.2% |
| $35,000 to $49,999 | 101 | 37.4% |
| $50,000 to $74,999 | 35 | 13.0% |
| $75,000 to $99,999 | 13 | 4.8% |
| $100,000 to $149,999 | 31 | 11.5% |
| $150,000 to $199,999 | 3 | 1.1% |
| $200,000+ | 3 | 1.1% |
Household Income by Householder Age in Wagon Mound
The median household income in Wagon Mound is $41,192, with the highest median household income of $41,916 found in the 65+ years age bracket for the primary householder. A total of 182 households (67.4%) fall into this category.
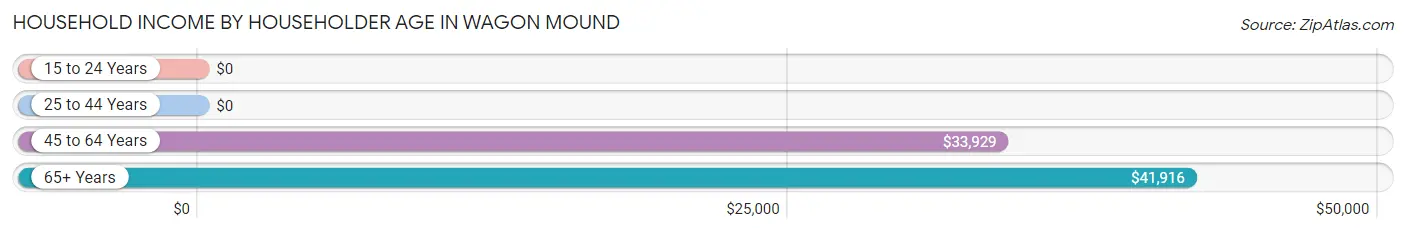
| Income Bracket | # Households | Median Income |
| 15 to 24 Years | 0 (0.0%) | $0 |
| 25 to 44 Years | 34 (12.6%) | $0 |
| 45 to 64 Years | 54 (20.0%) | $33,929 |
| 65+ Years | 182 (67.4%) | $41,916 |
| Total | 270 (100.0%) | $41,192 |
Poverty in Wagon Mound
Income Below Poverty by Sex and Age in Wagon Mound
With 20.3% poverty level for males and 13.8% for females among the residents of Wagon Mound, 35 to 44 year old males and 5 year old females are the most vulnerable to poverty, with 18 males (42.9%) and 3 females (100.0%) in their respective age groups living below the poverty level.
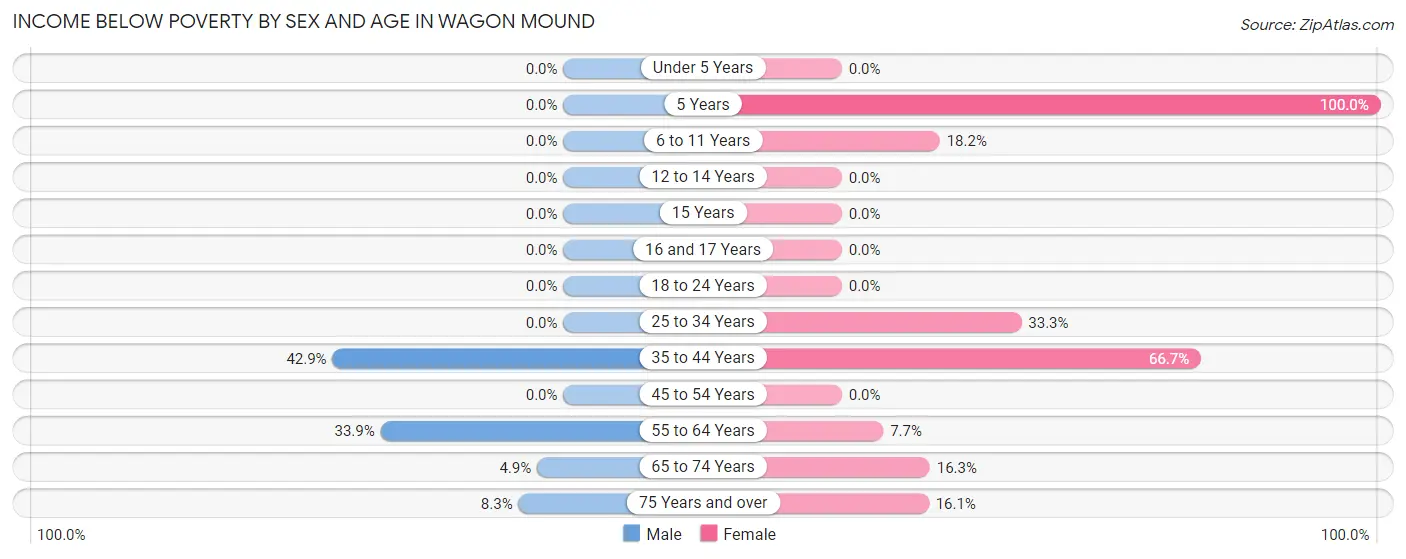
| Age Bracket | Male | Female |
| Under 5 Years | 0 (0.0%) | 0 (0.0%) |
| 5 Years | 0 (0.0%) | 3 (100.0%) |
| 6 to 11 Years | 0 (0.0%) | 2 (18.2%) |
| 12 to 14 Years | 0 (0.0%) | 0 (0.0%) |
| 15 Years | 0 (0.0%) | 0 (0.0%) |
| 16 and 17 Years | 0 (0.0%) | 0 (0.0%) |
| 18 to 24 Years | 0 (0.0%) | 0 (0.0%) |
| 25 to 34 Years | 0 (0.0%) | 2 (33.3%) |
| 35 to 44 Years | 18 (42.9%) | 4 (66.7%) |
| 45 to 54 Years | 0 (0.0%) | 0 (0.0%) |
| 55 to 64 Years | 19 (33.9%) | 8 (7.7%) |
| 65 to 74 Years | 4 (4.9%) | 8 (16.3%) |
| 75 Years and over | 1 (8.3%) | 10 (16.1%) |
| Total | 42 (20.3%) | 37 (13.8%) |
Income Above Poverty by Sex and Age in Wagon Mound
According to the poverty statistics in Wagon Mound, males aged 25 to 34 years and females aged under 5 years are the age groups that are most secure financially, with 100.0% of males and 100.0% of females in these age groups living above the poverty line.
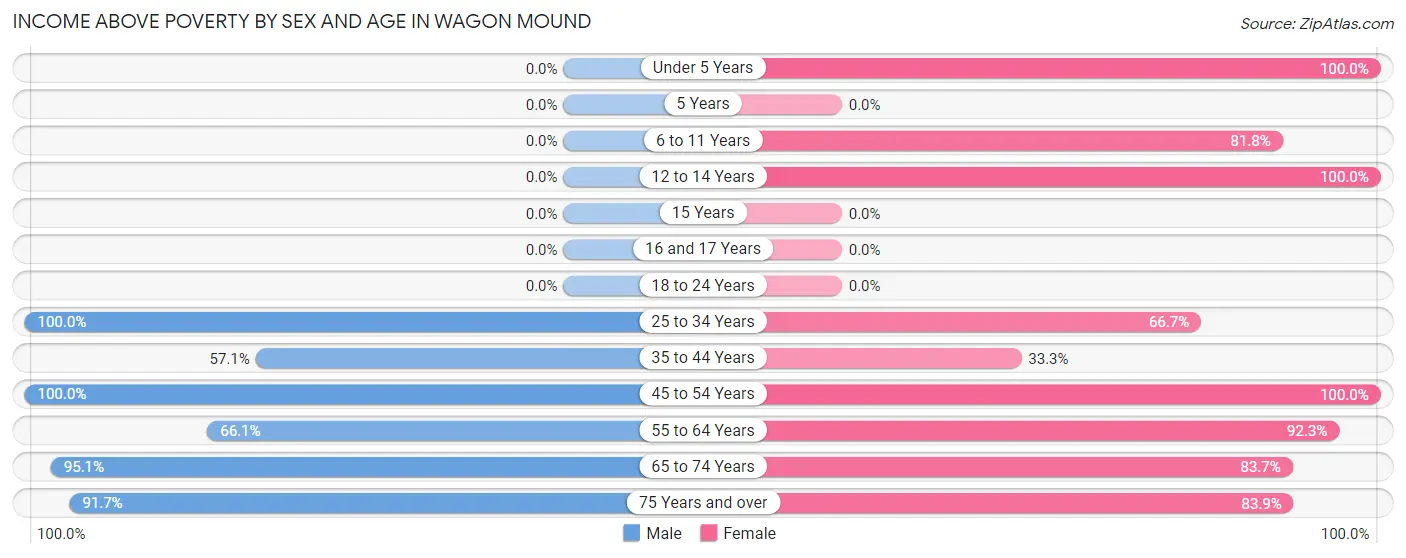
| Age Bracket | Male | Female |
| Under 5 Years | 0 (0.0%) | 13 (100.0%) |
| 5 Years | 0 (0.0%) | 0 (0.0%) |
| 6 to 11 Years | 0 (0.0%) | 9 (81.8%) |
| 12 to 14 Years | 0 (0.0%) | 8 (100.0%) |
| 15 Years | 0 (0.0%) | 0 (0.0%) |
| 16 and 17 Years | 0 (0.0%) | 0 (0.0%) |
| 18 to 24 Years | 0 (0.0%) | 0 (0.0%) |
| 25 to 34 Years | 10 (100.0%) | 4 (66.7%) |
| 35 to 44 Years | 24 (57.1%) | 2 (33.3%) |
| 45 to 54 Years | 5 (100.0%) | 7 (100.0%) |
| 55 to 64 Years | 37 (66.1%) | 96 (92.3%) |
| 65 to 74 Years | 78 (95.1%) | 41 (83.7%) |
| 75 Years and over | 11 (91.7%) | 52 (83.9%) |
| Total | 165 (79.7%) | 232 (86.3%) |
Income Below Poverty Among Married-Couple Families in Wagon Mound
The poverty statistics for married-couple families in Wagon Mound show that 4.8% or 3 of the total 62 families live below the poverty line. Families with no children have the highest poverty rate of 4.8%, comprising of 3 families. On the other hand, families with no children have the lowest poverty rate of 4.8%, which includes 3 families.
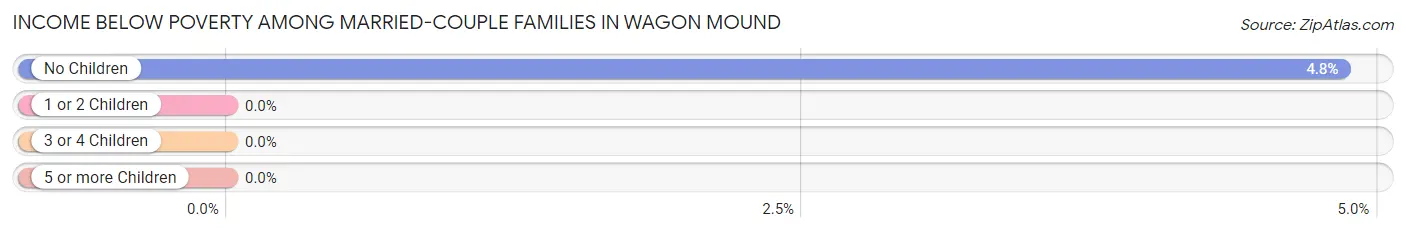
| Children | Above Poverty | Below Poverty |
| No Children | 59 (95.2%) | 3 (4.8%) |
| 1 or 2 Children | 0 (0.0%) | 0 (0.0%) |
| 3 or 4 Children | 0 (0.0%) | 0 (0.0%) |
| 5 or more Children | 0 (0.0%) | 0 (0.0%) |
| Total | 59 (95.2%) | 3 (4.8%) |
Income Below Poverty Among Single-Parent Households in Wagon Mound
According to the poverty data in Wagon Mound, 11.1% or 4 single-father households and 2.1% or 1 single-mother households are living below the poverty line. Among single-father households, those with 1 or 2 children have the highest poverty rate, with 4 households (28.6%) experiencing poverty. Likewise, among single-mother households, those with no children have the highest poverty rate, with 1 households (2.3%) falling below the poverty line.
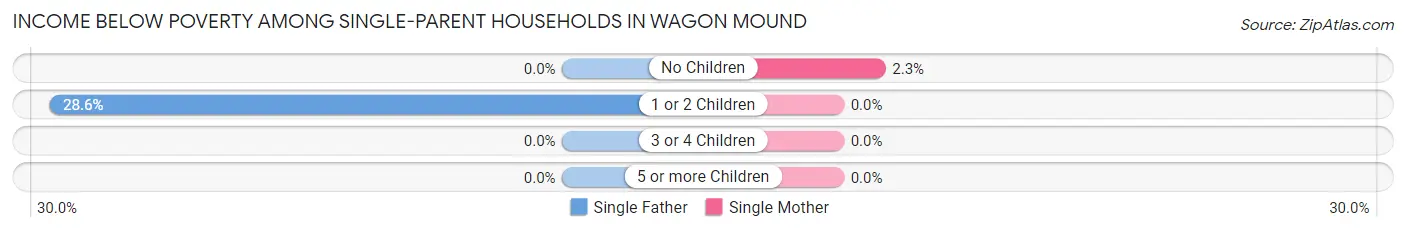
| Children | Single Father | Single Mother |
| No Children | 0 (0.0%) | 1 (2.3%) |
| 1 or 2 Children | 4 (28.6%) | 0 (0.0%) |
| 3 or 4 Children | 0 (0.0%) | 0 (0.0%) |
| 5 or more Children | 0 (0.0%) | 0 (0.0%) |
| Total | 4 (11.1%) | 1 (2.1%) |
Income Below Poverty Among Married-Couple vs Single-Parent Households in Wagon Mound
The poverty data for Wagon Mound shows that 3 of the married-couple family households (4.8%) and 5 of the single-parent households (6.0%) are living below the poverty level. Within the married-couple family households, those with no children have the highest poverty rate, with 3 households (4.8%) falling below the poverty line. Among the single-parent households, those with 1 or 2 children have the highest poverty rate, with 4 household (22.2%) living below poverty.
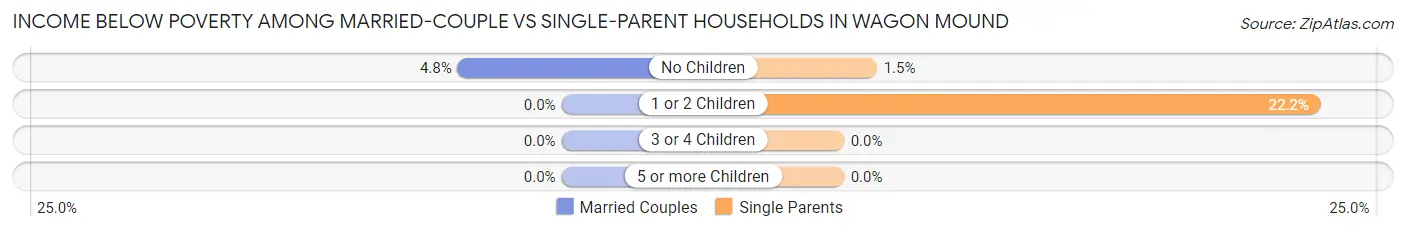
| Children | Married-Couple Families | Single-Parent Households |
| No Children | 3 (4.8%) | 1 (1.5%) |
| 1 or 2 Children | 0 (0.0%) | 4 (22.2%) |
| 3 or 4 Children | 0 (0.0%) | 0 (0.0%) |
| 5 or more Children | 0 (0.0%) | 0 (0.0%) |
| Total | 3 (4.8%) | 5 (6.0%) |
Race in Wagon Mound
The most populous races in Wagon Mound are Hispanic or Latino (336 | 68.4%), White / Caucasian (235 | 47.9%), and Some other Race (186 | 37.9%).
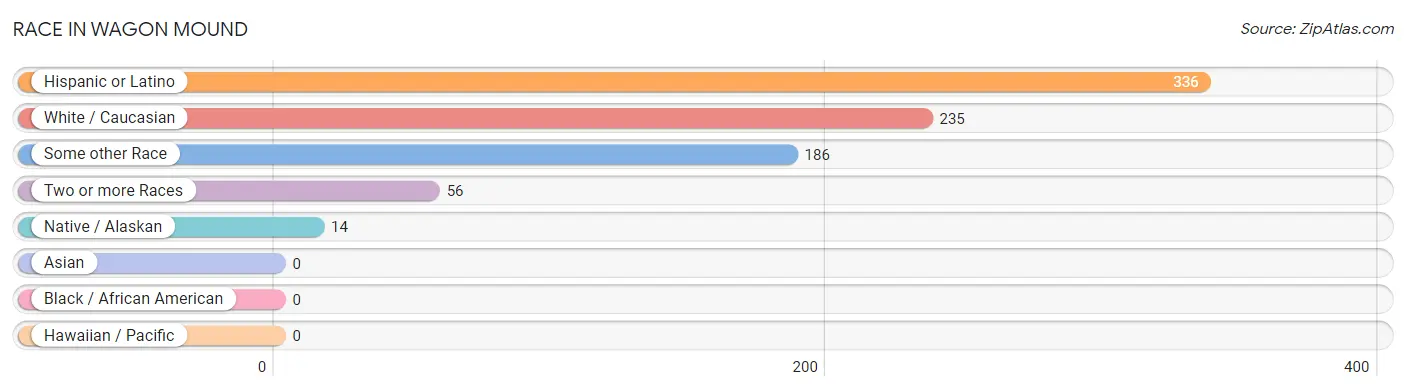
| Race | # Population | % Population |
| Asian | 0 | 0.0% |
| Black / African American | 0 | 0.0% |
| Hawaiian / Pacific | 0 | 0.0% |
| Hispanic or Latino | 336 | 68.4% |
| Native / Alaskan | 14 | 2.9% |
| White / Caucasian | 235 | 47.9% |
| Two or more Races | 56 | 11.4% |
| Some other Race | 186 | 37.9% |
| Total | 491 | 100.0% |
Ancestry in Wagon Mound
The most populous ancestries reported in Wagon Mound are French (126 | 25.7%), Norwegian (113 | 23.0%), Mexican (106 | 21.6%), Spanish (105 | 21.4%), and Hungarian (39 | 7.9%), together accounting for 99.6% of all Wagon Mound residents.
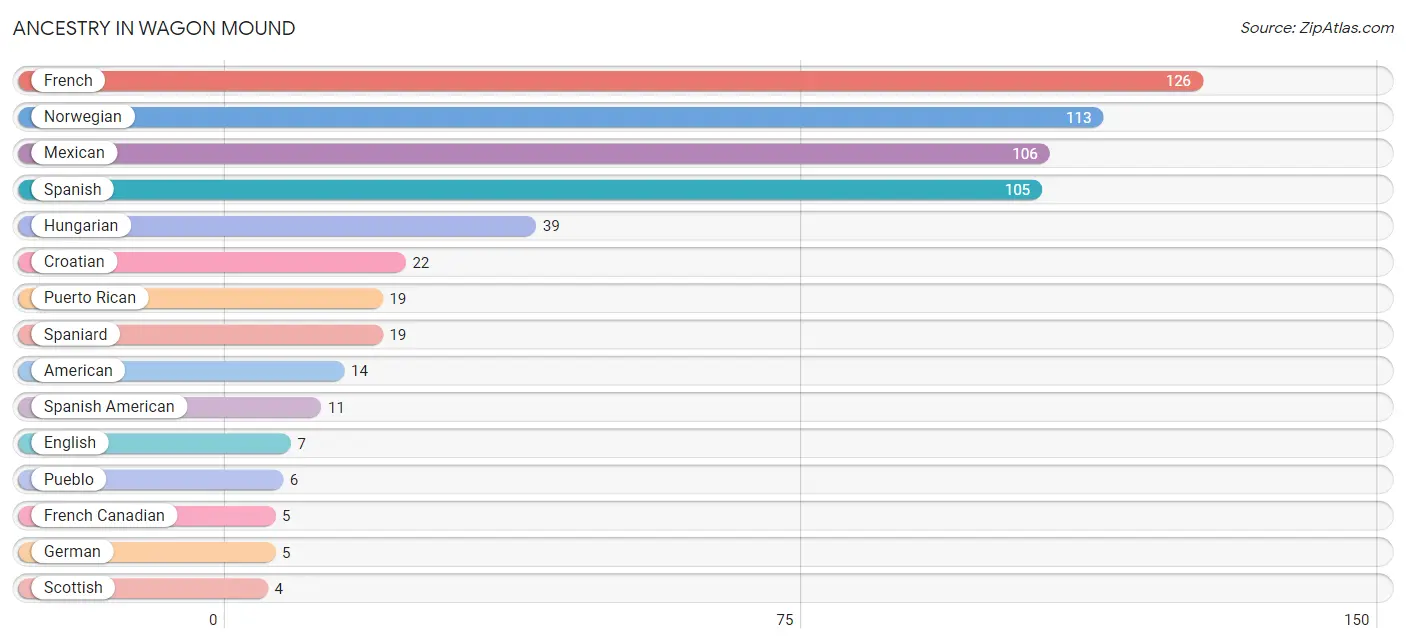
| Ancestry | # Population | % Population |
| American | 14 | 2.9% |
| Central American Indian | 2 | 0.4% |
| Croatian | 22 | 4.5% |
| English | 7 | 1.4% |
| French | 126 | 25.7% |
| French Canadian | 5 | 1.0% |
| German | 5 | 1.0% |
| Greek | 3 | 0.6% |
| Hungarian | 39 | 7.9% |
| Irish | 2 | 0.4% |
| Mexican | 106 | 21.6% |
| Norwegian | 113 | 23.0% |
| Pueblo | 6 | 1.2% |
| Puerto Rican | 19 | 3.9% |
| Scottish | 4 | 0.8% |
| Spaniard | 19 | 3.9% |
| Spanish | 105 | 21.4% |
| Spanish American | 11 | 2.2% |
| West Indian | 2 | 0.4% | View All 19 Rows |
Immigrants in Wagon Mound

| Immigration Origin | # Population | % Population | View All 0 Rows |
Sex and Age in Wagon Mound
Sex and Age in Wagon Mound
The most populous age groups in Wagon Mound are 70 to 74 Years (62 | 29.2%) for men and 60 to 64 Years (84 | 30.1%) for women.
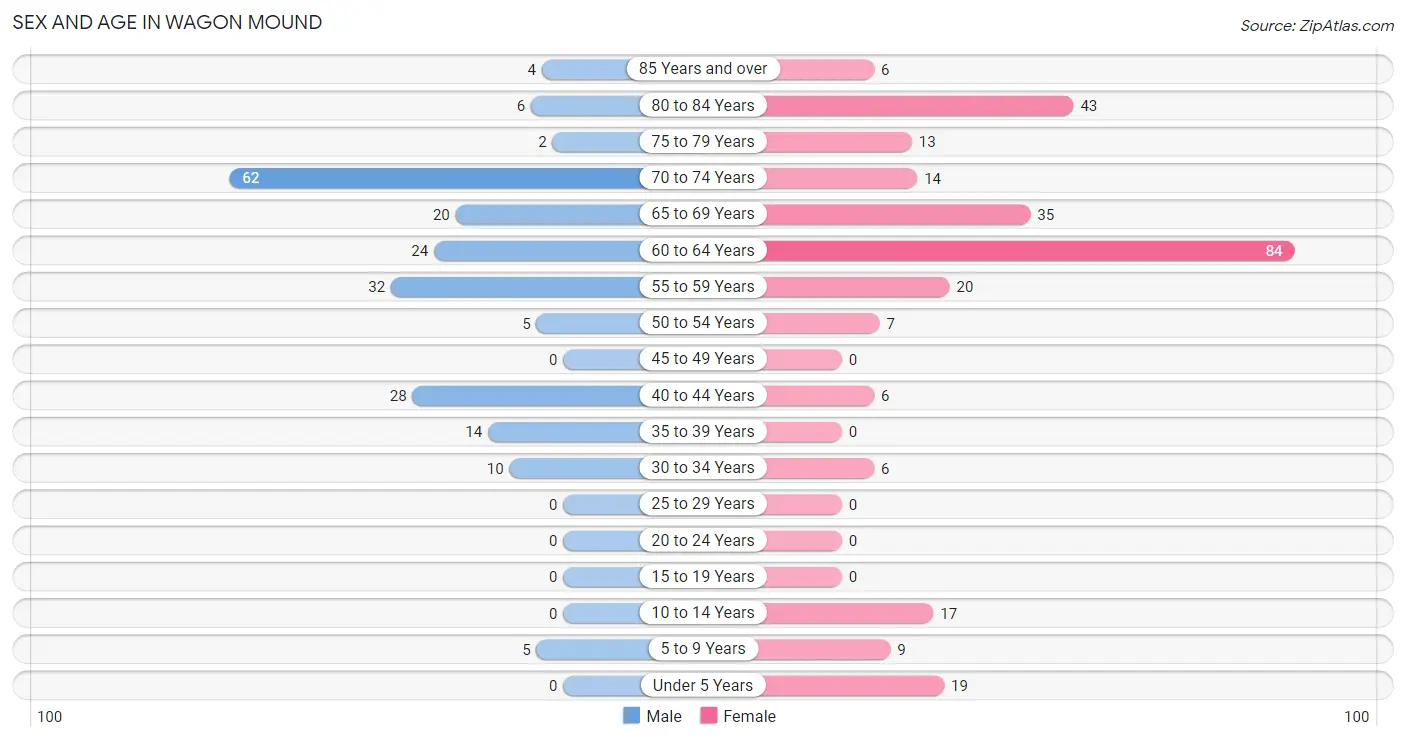
| Age Bracket | Male | Female |
| Under 5 Years | 0 (0.0%) | 19 (6.8%) |
| 5 to 9 Years | 5 (2.4%) | 9 (3.2%) |
| 10 to 14 Years | 0 (0.0%) | 17 (6.1%) |
| 15 to 19 Years | 0 (0.0%) | 0 (0.0%) |
| 20 to 24 Years | 0 (0.0%) | 0 (0.0%) |
| 25 to 29 Years | 0 (0.0%) | 0 (0.0%) |
| 30 to 34 Years | 10 (4.7%) | 6 (2.1%) |
| 35 to 39 Years | 14 (6.6%) | 0 (0.0%) |
| 40 to 44 Years | 28 (13.2%) | 6 (2.1%) |
| 45 to 49 Years | 0 (0.0%) | 0 (0.0%) |
| 50 to 54 Years | 5 (2.4%) | 7 (2.5%) |
| 55 to 59 Years | 32 (15.1%) | 20 (7.2%) |
| 60 to 64 Years | 24 (11.3%) | 84 (30.1%) |
| 65 to 69 Years | 20 (9.4%) | 35 (12.5%) |
| 70 to 74 Years | 62 (29.2%) | 14 (5.0%) |
| 75 to 79 Years | 2 (0.9%) | 13 (4.7%) |
| 80 to 84 Years | 6 (2.8%) | 43 (15.4%) |
| 85 Years and over | 4 (1.9%) | 6 (2.1%) |
| Total | 212 (100.0%) | 279 (100.0%) |
Families and Households in Wagon Mound
Median Family Size in Wagon Mound
The median family size in Wagon Mound is 2.26 persons per family, with single female/mother families (47 | 32.4%) accounting for the largest median family size of 3.15 persons per family. On the other hand, married-couple families (62 | 42.8%) represent the smallest median family size with 1.61 persons per family.
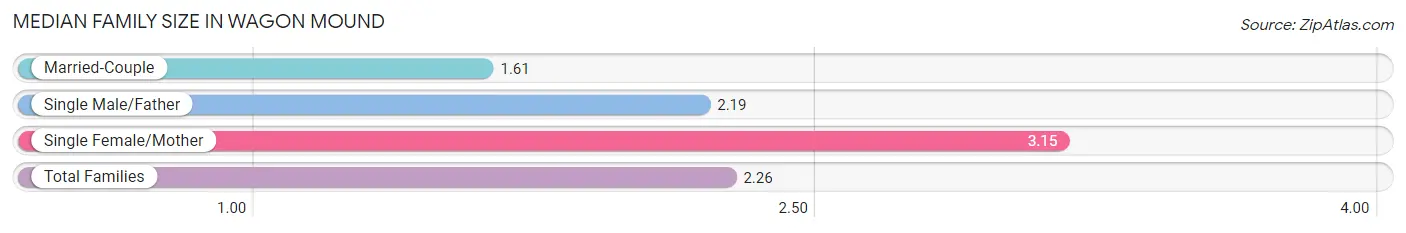
| Family Type | # Families | Family Size |
| Married-Couple | 62 (42.8%) | 1.61 |
| Single Male/Father | 36 (24.8%) | 2.19 |
| Single Female/Mother | 47 (32.4%) | 3.15 |
| Total Families | 145 (100.0%) | 2.26 |
Median Household Size in Wagon Mound
The median household size in Wagon Mound is 1.82 persons per household, with single female/mother households (47 | 17.4%) accounting for the largest median household size of 3.15 persons per household. non-family households (125 | 46.3%) represent the smallest median household size with 1.31 persons per household.
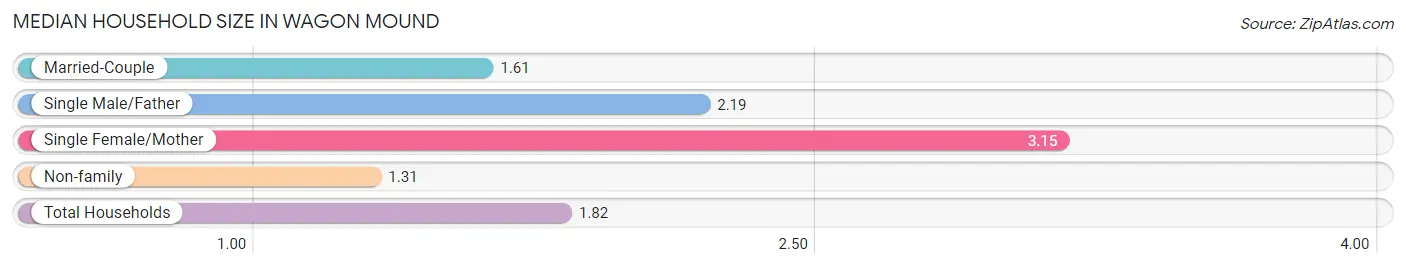
| Household Type | # Households | Household Size |
| Married-Couple | 62 (23.0%) | 1.61 |
| Single Male/Father | 36 (13.3%) | 2.19 |
| Single Female/Mother | 47 (17.4%) | 3.15 |
| Non-family | 125 (46.3%) | 1.31 |
| Total Households | 270 (100.0%) | 1.82 |
Household Size by Marriage Status in Wagon Mound
Out of a total of 270 households in Wagon Mound, 145 (53.7%) are family households, while 125 (46.3%) are nonfamily households. The most numerous type of family households are 2-person households, comprising 128, and the most common type of nonfamily households are 1-person households, comprising 109.
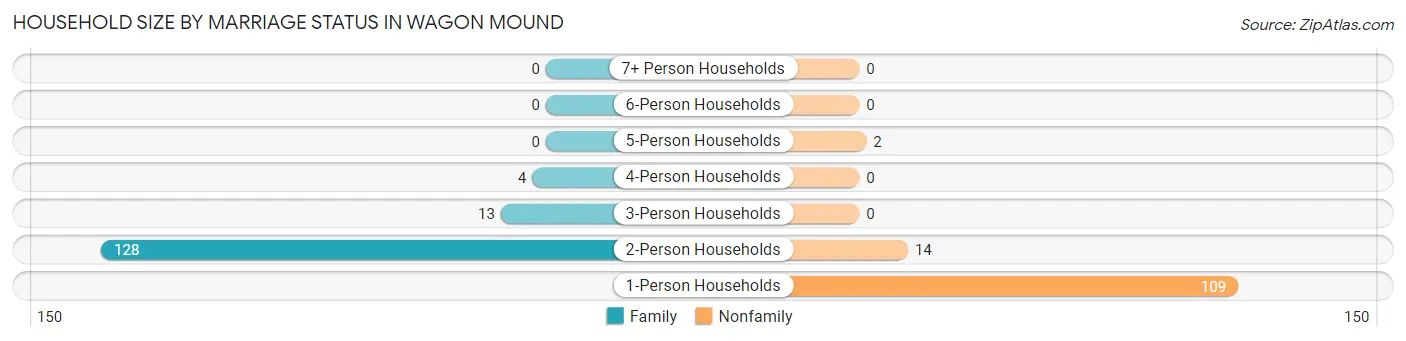
| Household Size | Family Households | Nonfamily Households |
| 1-Person Households | - | 109 (40.4%) |
| 2-Person Households | 128 (47.4%) | 14 (5.2%) |
| 3-Person Households | 13 (4.8%) | 0 (0.0%) |
| 4-Person Households | 4 (1.5%) | 0 (0.0%) |
| 5-Person Households | 0 (0.0%) | 2 (0.7%) |
| 6-Person Households | 0 (0.0%) | 0 (0.0%) |
| 7+ Person Households | 0 (0.0%) | 0 (0.0%) |
| Total | 145 (53.7%) | 125 (46.3%) |
Female Fertility in Wagon Mound
Fertility by Age in Wagon Mound
| Age Bracket | Women with Births | Births / 1,000 Women |
| 15 to 19 years | 0 (0.0%) | 0.0 |
| 20 to 34 years | 0 (0.0%) | 0.0 |
| 35 to 50 years | 0 (0.0%) | 0.0 |
| Total | 0 (0.0%) | 0.0 |
Fertility by Age by Marriage Status in Wagon Mound
| Age Bracket | Married | Unmarried |
| 15 to 19 years | 0 (0.0%) | 0 (0.0%) |
| 20 to 34 years | 0 (0.0%) | 0 (0.0%) |
| 35 to 50 years | 0 (0.0%) | 0 (0.0%) |
| Total | 0 (0.0%) | 0 (0.0%) |
Fertility by Education in Wagon Mound
| Educational Attainment | Women with Births | Births / 1,000 Women |
| Less than High School | 0 (0.0%) | 0.0 |
| High School Diploma | 0 (0.0%) | 0.0 |
| College or Associate's Degree | 0 (0.0%) | 0.0 |
| Bachelor's Degree | 0 (0.0%) | 0.0 |
| Graduate Degree | 0 (0.0%) | 0.0 |
| Total | 0 (0.0%) | 0.0 |
Fertility by Education by Marriage Status in Wagon Mound
| Educational Attainment | Married | Unmarried |
| Less than High School | 0 (0.0%) | 0 (0.0%) |
| High School Diploma | 0 (0.0%) | 0 (0.0%) |
| College or Associate's Degree | 0 (0.0%) | 0 (0.0%) |
| Bachelor's Degree | 0 (0.0%) | 0 (0.0%) |
| Graduate Degree | 0 (0.0%) | 0 (0.0%) |
| Total | 0 (0.0%) | 0 (0.0%) |
Employment Characteristics in Wagon Mound
Employment by Class of Employer in Wagon Mound
Among the 166 employed individuals in Wagon Mound, private company employees (88 | 53.0%), state government employees (46 | 27.7%), and local government employees (29 | 17.5%) make up the most common classes of employment.
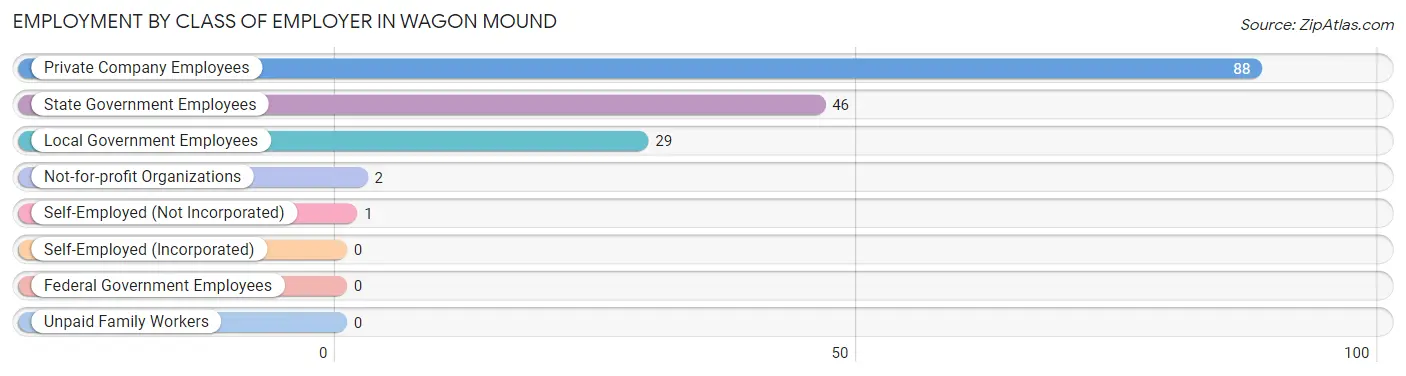
| Employer Class | # Employees | % Employees |
| Private Company Employees | 88 | 53.0% |
| Self-Employed (Incorporated) | 0 | 0.0% |
| Self-Employed (Not Incorporated) | 1 | 0.6% |
| Not-for-profit Organizations | 2 | 1.2% |
| Local Government Employees | 29 | 17.5% |
| State Government Employees | 46 | 27.7% |
| Federal Government Employees | 0 | 0.0% |
| Unpaid Family Workers | 0 | 0.0% |
| Total | 166 | 100.0% |
Employment Status by Age in Wagon Mound
According to the labor force statistics for Wagon Mound, out of the total population over 16 years of age (441), 40.6% or 179 individuals are in the labor force, with 7.3% or 13 of them unemployed. The age group with the highest labor force participation rate is 60 to 64 years, with 90.7% or 98 individuals in the labor force. Within the labor force, the 35 to 44 years age range has the highest percentage of unemployed individuals, with 84.6% or 11 of them being unemployed.
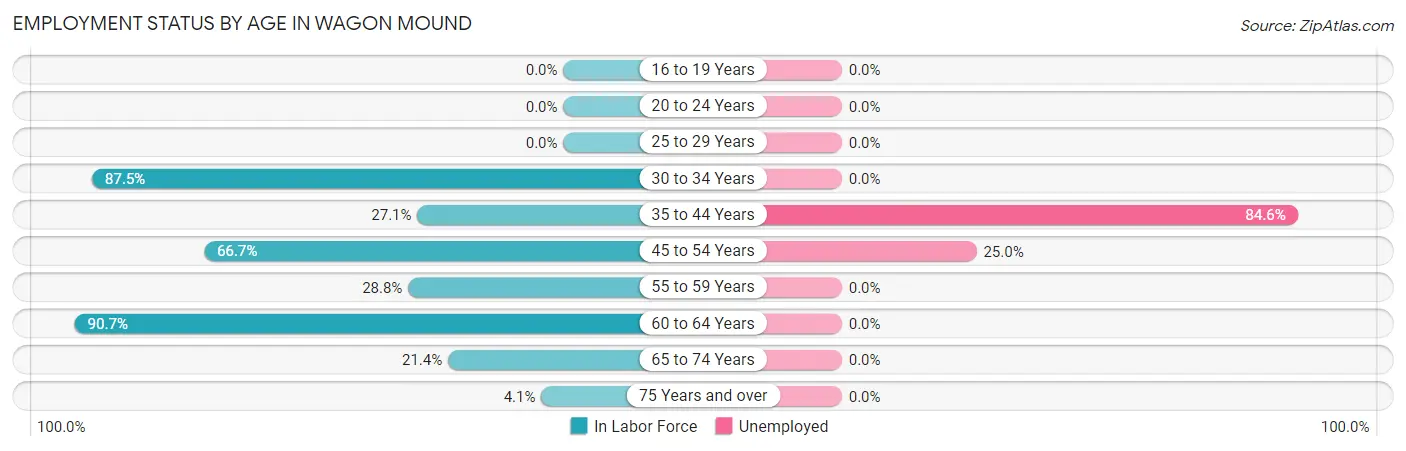
| Age Bracket | In Labor Force | Unemployed |
| 16 to 19 Years | 0 (0.0%) | 0 (0.0%) |
| 20 to 24 Years | 0 (0.0%) | 0 (0.0%) |
| 25 to 29 Years | 0 (0.0%) | 0 (0.0%) |
| 30 to 34 Years | 14 (87.5%) | 0 (0.0%) |
| 35 to 44 Years | 13 (27.1%) | 11 (84.6%) |
| 45 to 54 Years | 8 (66.7%) | 2 (25.0%) |
| 55 to 59 Years | 15 (28.8%) | 0 (0.0%) |
| 60 to 64 Years | 98 (90.7%) | 0 (0.0%) |
| 65 to 74 Years | 28 (21.4%) | 0 (0.0%) |
| 75 Years and over | 3 (4.1%) | 0 (0.0%) |
| Total | 179 (40.6%) | 13 (7.3%) |
Employment Status by Educational Attainment in Wagon Mound
According to labor force statistics for Wagon Mound, 62.7% of individuals (148) out of the total population between 25 and 64 years of age (236) are in the labor force, with 8.8% or 13 of them being unemployed. The group with the highest labor force participation rate are those with the educational attainment of bachelor's degree or higher, with 93.3% or 98 individuals in the labor force. Within the labor force, individuals with college / associate degree education have the highest percentage of unemployment, with 54.2% or 13 of them being unemployed.
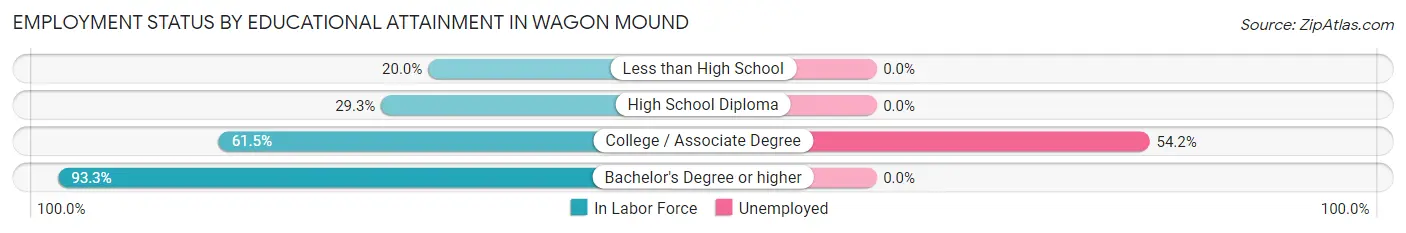
| Educational Attainment | In Labor Force | Unemployed |
| Less than High School | 2 (20.0%) | 0 (0.0%) |
| High School Diploma | 24 (29.3%) | 0 (0.0%) |
| College / Associate Degree | 24 (61.5%) | 21 (54.2%) |
| Bachelor's Degree or higher | 98 (93.3%) | 0 (0.0%) |
| Total | 148 (62.7%) | 21 (8.8%) |
Employment Occupations by Sex in Wagon Mound
Management, Business, Science and Arts Occupations
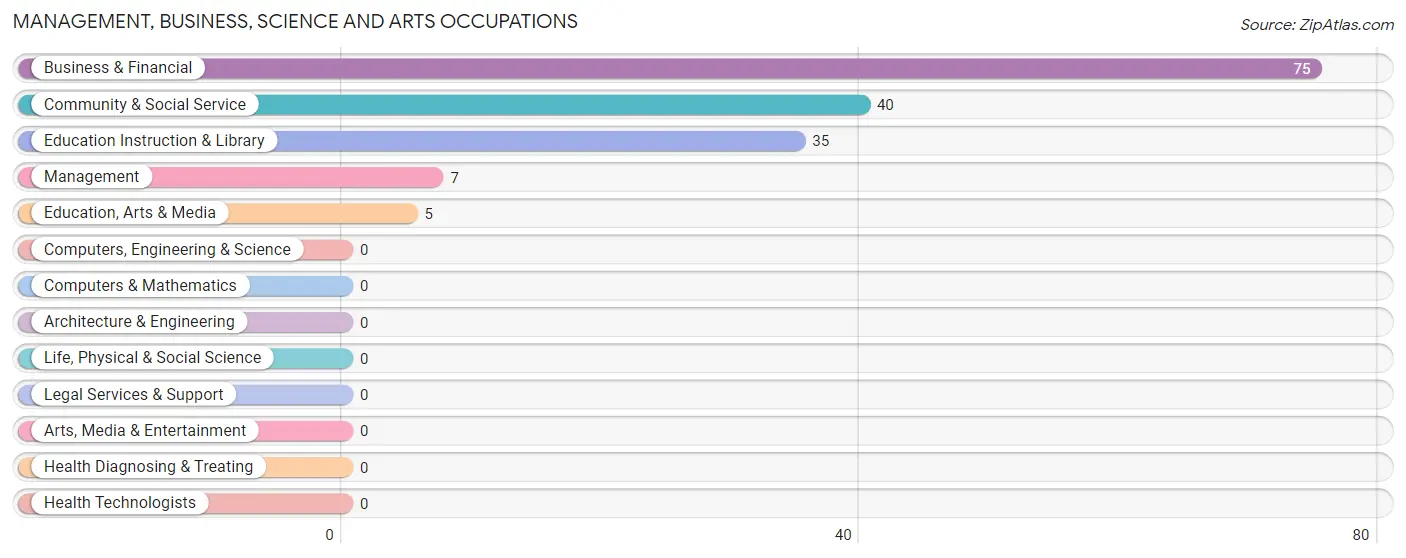
The most common Management, Business, Science and Arts occupations in Wagon Mound are Business & Financial (75 | 45.2%), Community & Social Service (40 | 24.1%), Education Instruction & Library (35 | 21.1%), Management (7 | 4.2%), and Education, Arts & Media (5 | 3.0%).
Management, Business, Science and Arts Occupations by Sex
Within the Management, Business, Science and Arts occupations in Wagon Mound, the most male-oriented occupations are Education Instruction & Library (85.7%), Community & Social Service (82.5%), and Education, Arts & Media (60.0%), while the most female-oriented occupations are Business & Financial (100.0%), Management (57.1%), and Education, Arts & Media (40.0%).
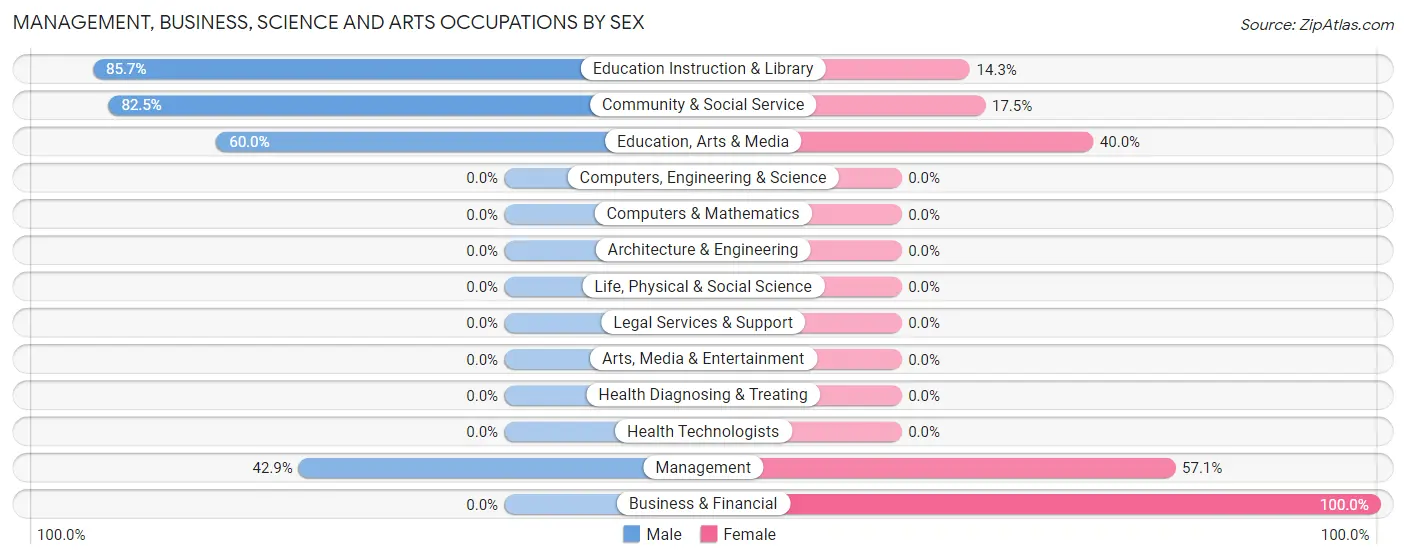
| Occupation | Male | Female |
| Management | 3 (42.9%) | 4 (57.1%) |
| Business & Financial | 0 (0.0%) | 75 (100.0%) |
| Computers, Engineering & Science | 0 (0.0%) | 0 (0.0%) |
| Computers & Mathematics | 0 (0.0%) | 0 (0.0%) |
| Architecture & Engineering | 0 (0.0%) | 0 (0.0%) |
| Life, Physical & Social Science | 0 (0.0%) | 0 (0.0%) |
| Community & Social Service | 33 (82.5%) | 7 (17.5%) |
| Education, Arts & Media | 3 (60.0%) | 2 (40.0%) |
| Legal Services & Support | 0 (0.0%) | 0 (0.0%) |
| Education Instruction & Library | 30 (85.7%) | 5 (14.3%) |
| Arts, Media & Entertainment | 0 (0.0%) | 0 (0.0%) |
| Health Diagnosing & Treating | 0 (0.0%) | 0 (0.0%) |
| Health Technologists | 0 (0.0%) | 0 (0.0%) |
| Total (Category) | 36 (29.5%) | 86 (70.5%) |
| Total (Overall) | 63 (38.0%) | 103 (62.1%) |
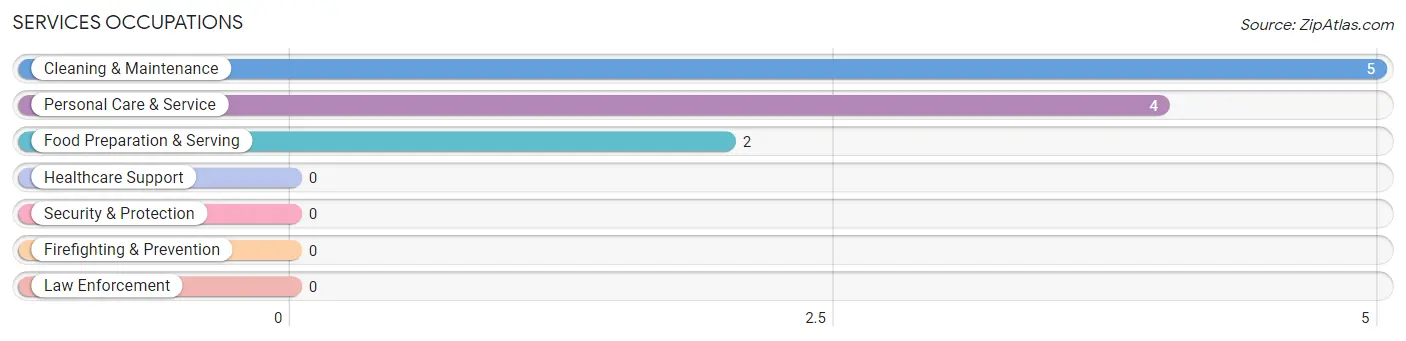
Services Occupations
The most common Services occupations in Wagon Mound are Cleaning & Maintenance (5 | 3.0%), Personal Care & Service (4 | 2.4%), and Food Preparation & Serving (2 | 1.2%).
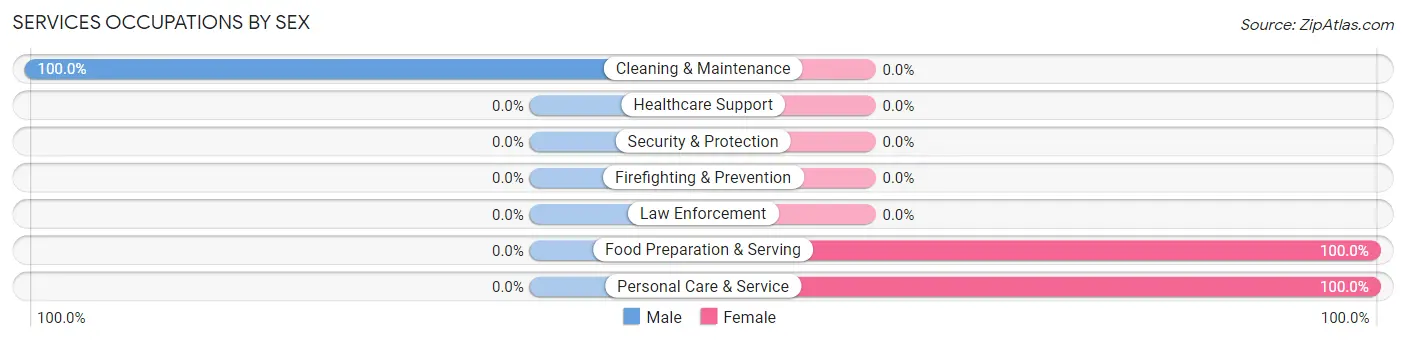
Services Occupations by Sex
| Occupation | Male | Female |
| Healthcare Support | 0 (0.0%) | 0 (0.0%) |
| Security & Protection | 0 (0.0%) | 0 (0.0%) |
| Firefighting & Prevention | 0 (0.0%) | 0 (0.0%) |
| Law Enforcement | 0 (0.0%) | 0 (0.0%) |
| Food Preparation & Serving | 0 (0.0%) | 2 (100.0%) |
| Cleaning & Maintenance | 5 (100.0%) | 0 (0.0%) |
| Personal Care & Service | 0 (0.0%) | 4 (100.0%) |
| Total (Category) | 5 (45.5%) | 6 (54.5%) |
| Total (Overall) | 63 (38.0%) | 103 (62.1%) |
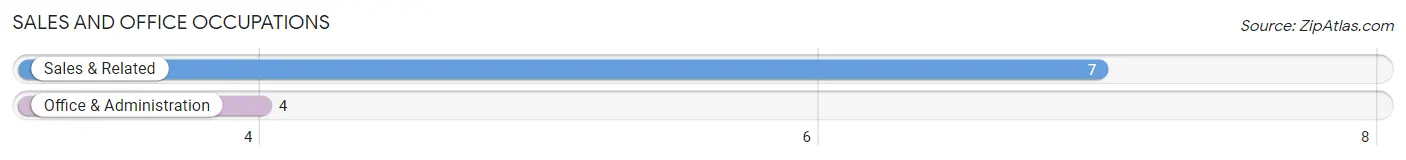
Sales and Office Occupations
The most common Sales and Office occupations in Wagon Mound are Sales & Related (7 | 4.2%), and Office & Administration (4 | 2.4%).
Sales and Office Occupations by Sex
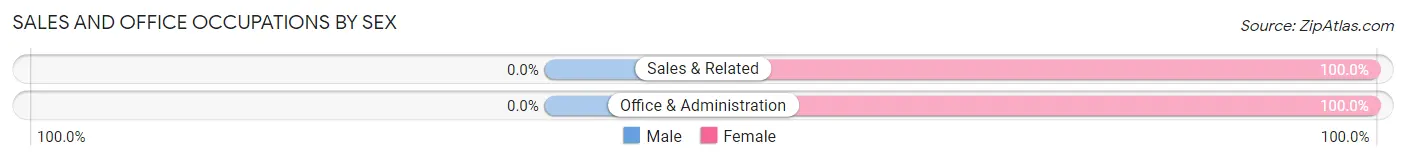
| Occupation | Male | Female |
| Sales & Related | 0 (0.0%) | 7 (100.0%) |
| Office & Administration | 0 (0.0%) | 4 (100.0%) |
| Total (Category) | 0 (0.0%) | 11 (100.0%) |
| Total (Overall) | 63 (38.0%) | 103 (62.1%) |
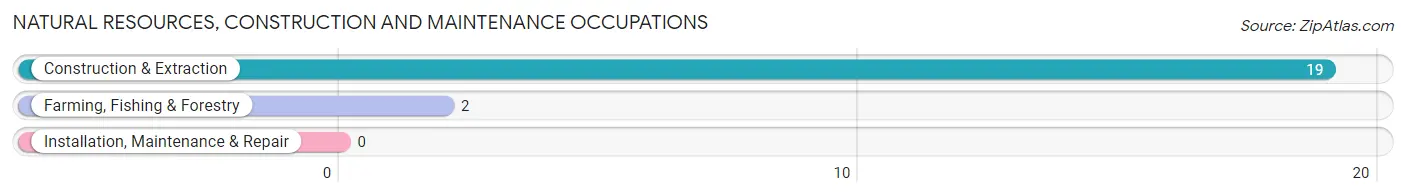
Natural Resources, Construction and Maintenance Occupations
The most common Natural Resources, Construction and Maintenance occupations in Wagon Mound are Construction & Extraction (19 | 11.5%), and Farming, Fishing & Forestry (2 | 1.2%).
Natural Resources, Construction and Maintenance Occupations by Sex
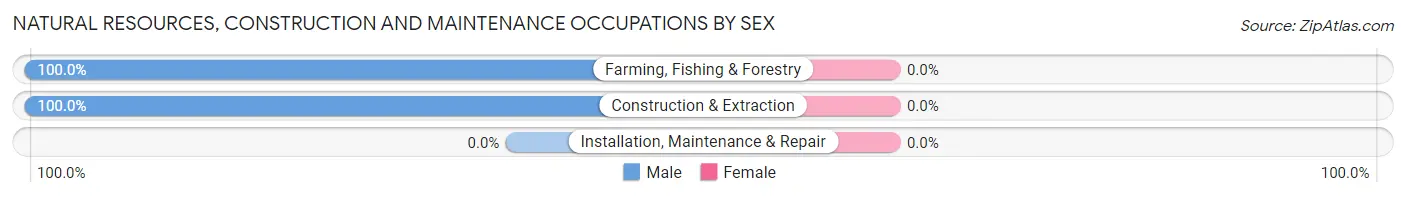
| Occupation | Male | Female |
| Farming, Fishing & Forestry | 2 (100.0%) | 0 (0.0%) |
| Construction & Extraction | 19 (100.0%) | 0 (0.0%) |
| Installation, Maintenance & Repair | 0 (0.0%) | 0 (0.0%) |
| Total (Category) | 21 (100.0%) | 0 (0.0%) |
| Total (Overall) | 63 (38.0%) | 103 (62.1%) |
Production, Transportation and Moving Occupations
The most common Production, Transportation and Moving occupations in Wagon Mound are , and Transportation (1 | 0.6%).
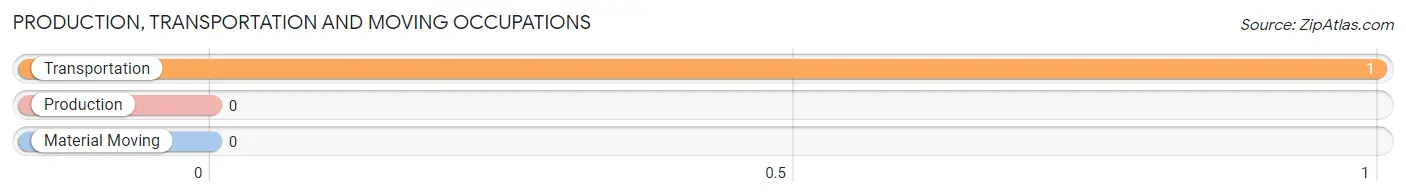
Production, Transportation and Moving Occupations by Sex
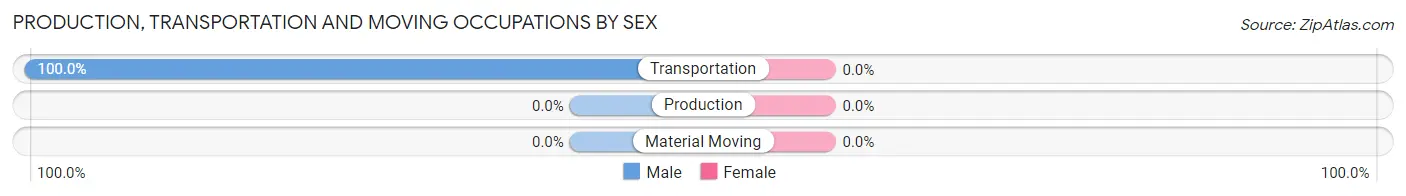
| Occupation | Male | Female |
| Production | 0 (0.0%) | 0 (0.0%) |
| Transportation | 1 (100.0%) | 0 (0.0%) |
| Material Moving | 0 (0.0%) | 0 (0.0%) |
| Total (Category) | 1 (100.0%) | 0 (0.0%) |
| Total (Overall) | 63 (38.0%) | 103 (62.1%) |
Employment Industries by Sex in Wagon Mound
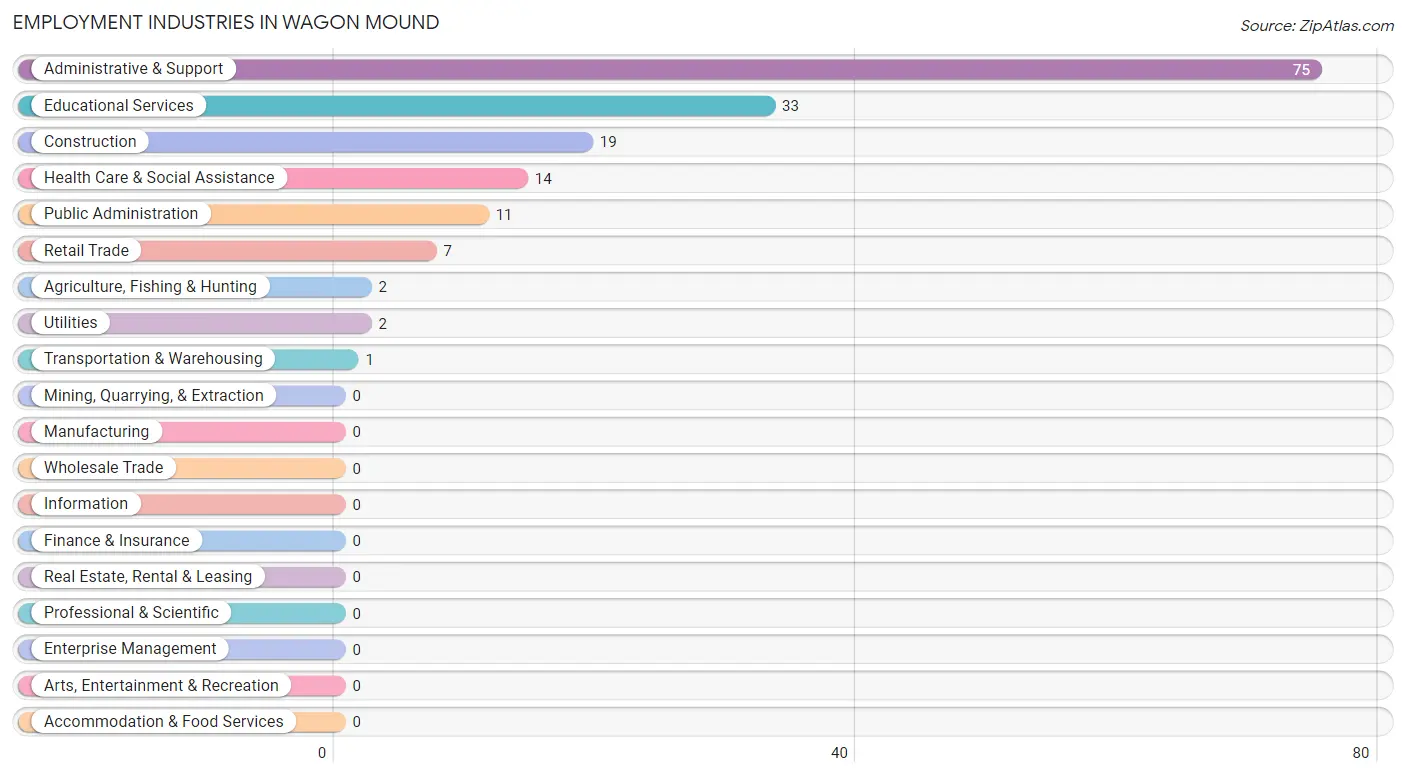
Employment Industries in Wagon Mound
The major employment industries in Wagon Mound include Administrative & Support (75 | 45.2%), Educational Services (33 | 19.9%), Construction (19 | 11.5%), Health Care & Social Assistance (14 | 8.4%), and Public Administration (11 | 6.6%).
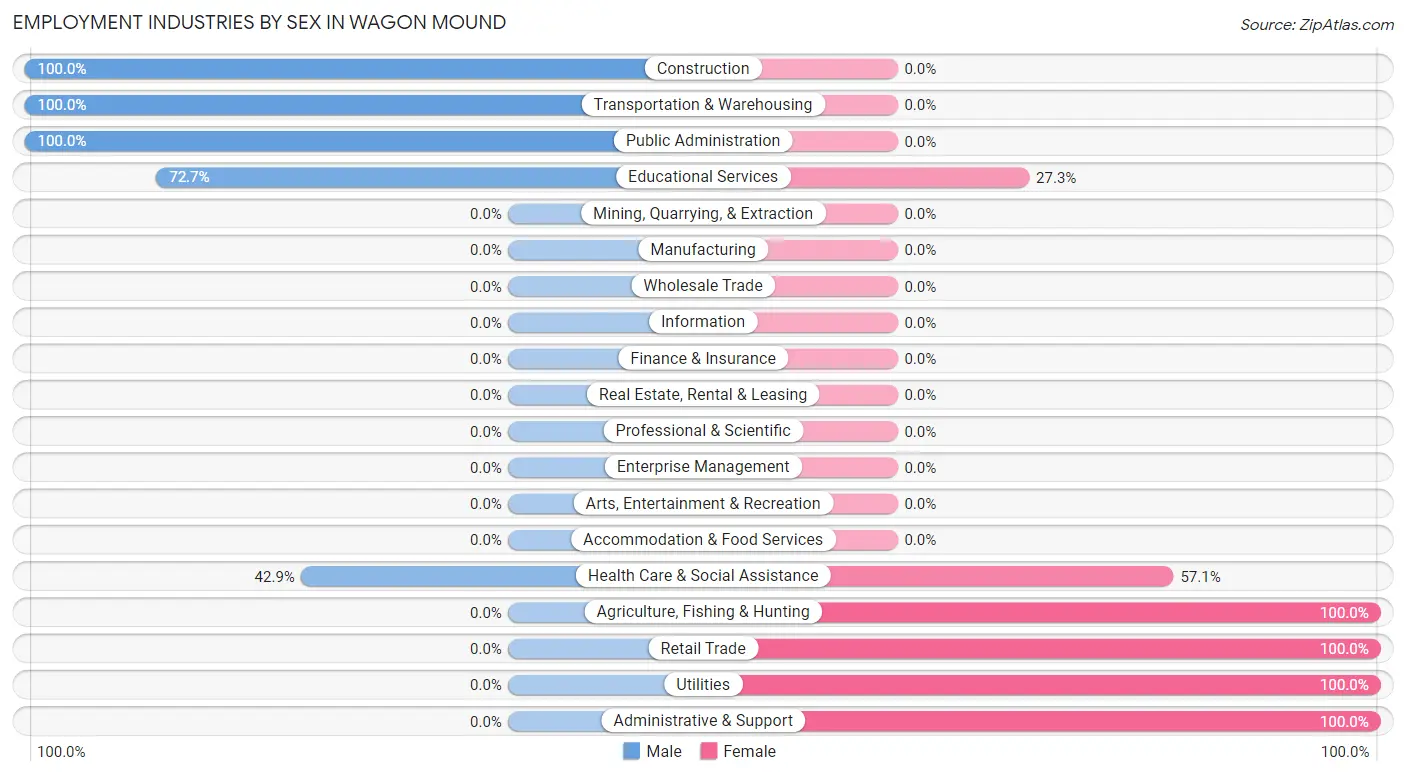
Employment Industries by Sex in Wagon Mound
The Wagon Mound industries that see more men than women are Construction (100.0%), Transportation & Warehousing (100.0%), and Public Administration (100.0%), whereas the industries that tend to have a higher number of women are Agriculture, Fishing & Hunting (100.0%), Retail Trade (100.0%), and Utilities (100.0%).
| Industry | Male | Female |
| Agriculture, Fishing & Hunting | 0 (0.0%) | 2 (100.0%) |
| Mining, Quarrying, & Extraction | 0 (0.0%) | 0 (0.0%) |
| Construction | 19 (100.0%) | 0 (0.0%) |
| Manufacturing | 0 (0.0%) | 0 (0.0%) |
| Wholesale Trade | 0 (0.0%) | 0 (0.0%) |
| Retail Trade | 0 (0.0%) | 7 (100.0%) |
| Transportation & Warehousing | 1 (100.0%) | 0 (0.0%) |
| Utilities | 0 (0.0%) | 2 (100.0%) |
| Information | 0 (0.0%) | 0 (0.0%) |
| Finance & Insurance | 0 (0.0%) | 0 (0.0%) |
| Real Estate, Rental & Leasing | 0 (0.0%) | 0 (0.0%) |
| Professional & Scientific | 0 (0.0%) | 0 (0.0%) |
| Enterprise Management | 0 (0.0%) | 0 (0.0%) |
| Administrative & Support | 0 (0.0%) | 75 (100.0%) |
| Educational Services | 24 (72.7%) | 9 (27.3%) |
| Health Care & Social Assistance | 6 (42.9%) | 8 (57.1%) |
| Arts, Entertainment & Recreation | 0 (0.0%) | 0 (0.0%) |
| Accommodation & Food Services | 0 (0.0%) | 0 (0.0%) |
| Public Administration | 11 (100.0%) | 0 (0.0%) |
| Total | 63 (38.0%) | 103 (62.1%) |
Education in Wagon Mound
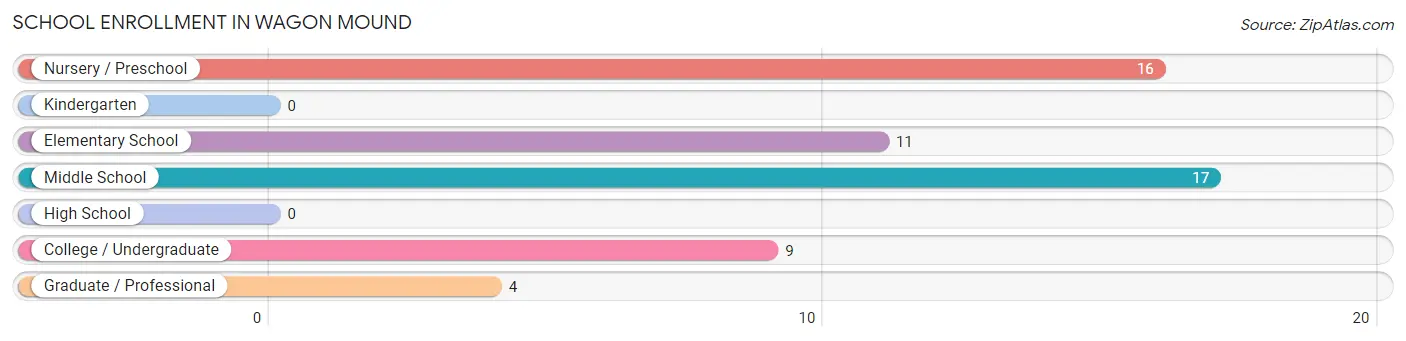
School Enrollment in Wagon Mound
The most common levels of schooling among the 57 students in Wagon Mound are middle school (17 | 29.8%), nursery / preschool (16 | 28.1%), and elementary school (11 | 19.3%).
| School Level | # Students | % Students |
| Nursery / Preschool | 16 | 28.1% |
| Kindergarten | 0 | 0.0% |
| Elementary School | 11 | 19.3% |
| Middle School | 17 | 29.8% |
| High School | 0 | 0.0% |
| College / Undergraduate | 9 | 15.8% |
| Graduate / Professional | 4 | 7.0% |
| Total | 57 | 100.0% |
School Enrollment by Age by Funding Source in Wagon Mound
Out of a total of 57 students who are enrolled in schools in Wagon Mound, 2 (3.5%) attend a private institution, while the remaining 55 (96.5%) are enrolled in public schools. The age group of 35 years and over has the highest likelihood of being enrolled in private schools, with 2 (15.4% in the age bracket) enrolled. Conversely, the age group of 3 to 4 year olds has the lowest likelihood of being enrolled in a private school, with 13 (100.0% in the age bracket) attending a public institution.
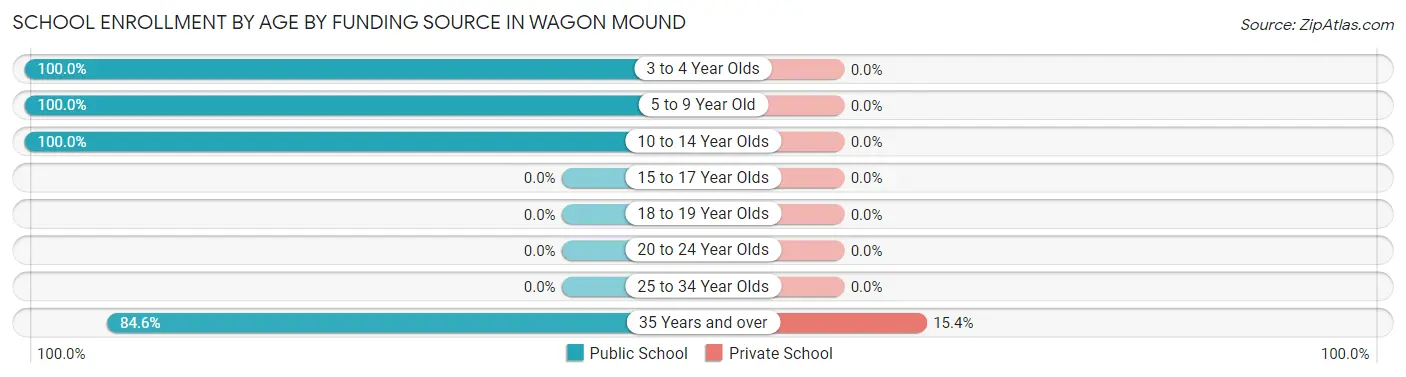
| Age Bracket | Public School | Private School |
| 3 to 4 Year Olds | 13 (100.0%) | 0 (0.0%) |
| 5 to 9 Year Old | 14 (100.0%) | 0 (0.0%) |
| 10 to 14 Year Olds | 17 (100.0%) | 0 (0.0%) |
| 15 to 17 Year Olds | 0 (0.0%) | 0 (0.0%) |
| 18 to 19 Year Olds | 0 (0.0%) | 0 (0.0%) |
| 20 to 24 Year Olds | 0 (0.0%) | 0 (0.0%) |
| 25 to 34 Year Olds | 0 (0.0%) | 0 (0.0%) |
| 35 Years and over | 11 (84.6%) | 2 (15.4%) |
| Total | 55 (96.5%) | 2 (3.5%) |
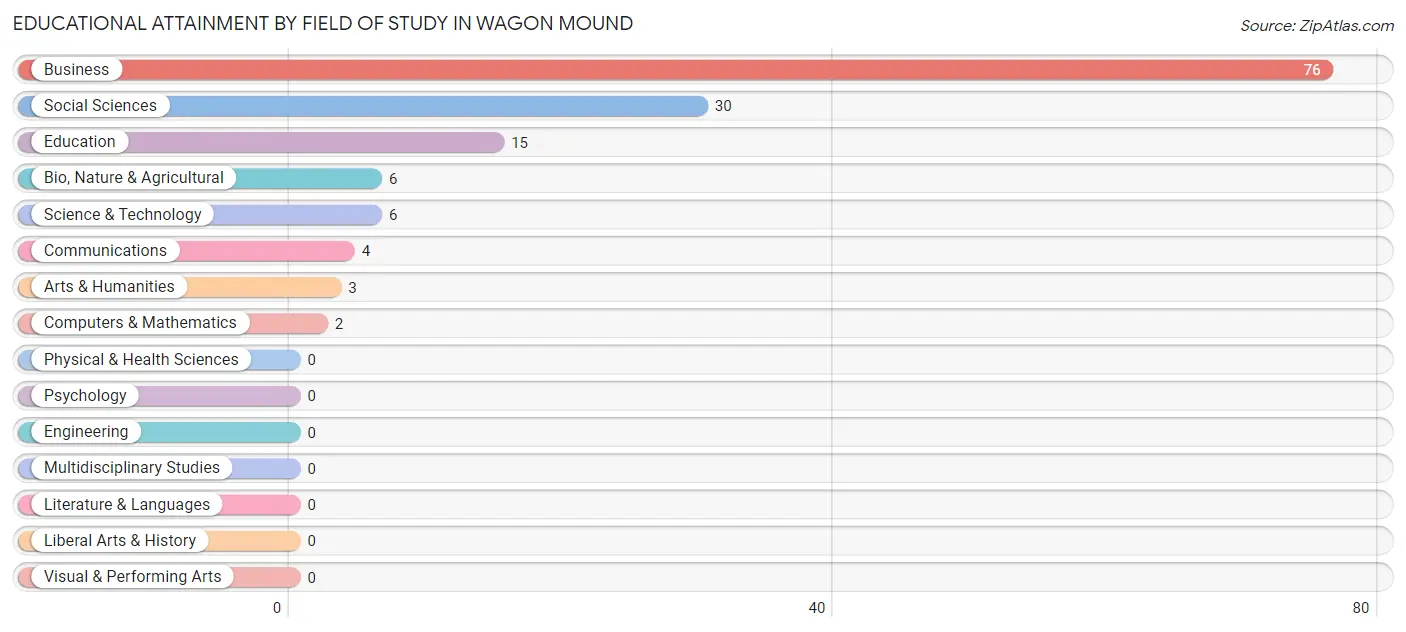
Educational Attainment by Field of Study in Wagon Mound
Business (76 | 53.5%), social sciences (30 | 21.1%), education (15 | 10.6%), bio, nature & agricultural (6 | 4.2%), and science & technology (6 | 4.2%) are the most common fields of study among 142 individuals in Wagon Mound who have obtained a bachelor's degree or higher.
| Field of Study | # Graduates | % Graduates |
| Computers & Mathematics | 2 | 1.4% |
| Bio, Nature & Agricultural | 6 | 4.2% |
| Physical & Health Sciences | 0 | 0.0% |
| Psychology | 0 | 0.0% |
| Social Sciences | 30 | 21.1% |
| Engineering | 0 | 0.0% |
| Multidisciplinary Studies | 0 | 0.0% |
| Science & Technology | 6 | 4.2% |
| Business | 76 | 53.5% |
| Education | 15 | 10.6% |
| Literature & Languages | 0 | 0.0% |
| Liberal Arts & History | 0 | 0.0% |
| Visual & Performing Arts | 0 | 0.0% |
| Communications | 4 | 2.8% |
| Arts & Humanities | 3 | 2.1% |
| Total | 142 | 100.0% |
Transportation & Commute in Wagon Mound
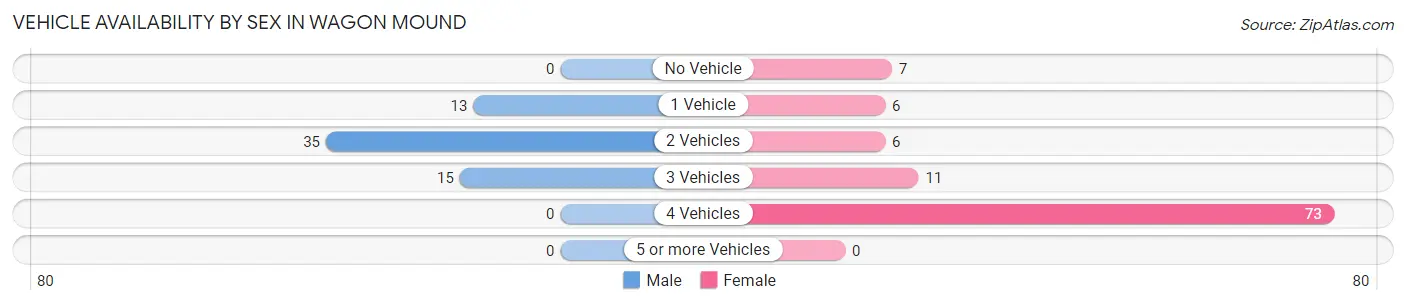
Vehicle Availability by Sex in Wagon Mound
The most prevalent vehicle ownership categories in Wagon Mound are males with 2 vehicles (35, accounting for 55.6%) and females with 2 vehicles (6, making up 34.0%).
| Vehicles Available | Male | Female |
| No Vehicle | 0 (0.0%) | 7 (6.8%) |
| 1 Vehicle | 13 (20.6%) | 6 (5.8%) |
| 2 Vehicles | 35 (55.6%) | 6 (5.8%) |
| 3 Vehicles | 15 (23.8%) | 11 (10.7%) |
| 4 Vehicles | 0 (0.0%) | 73 (70.9%) |
| 5 or more Vehicles | 0 (0.0%) | 0 (0.0%) |
| Total | 63 (100.0%) | 103 (100.0%) |
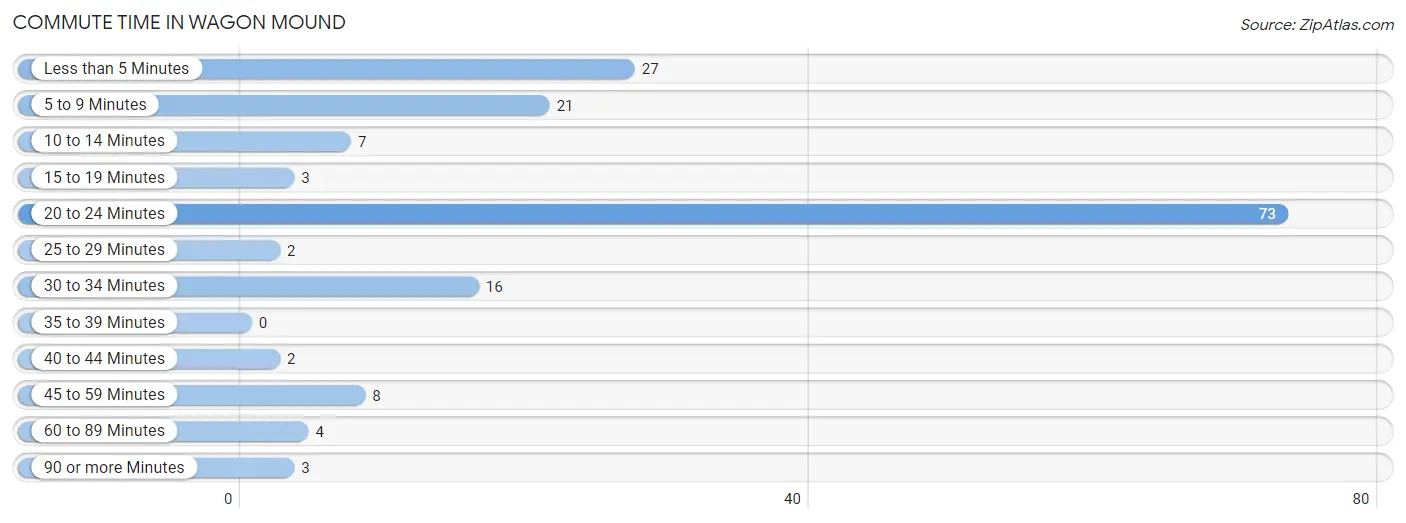
Commute Time in Wagon Mound
The most frequently occuring commute durations in Wagon Mound are 20 to 24 minutes (73 commuters, 44.0%), less than 5 minutes (27 commuters, 16.3%), and 5 to 9 minutes (21 commuters, 12.7%).
| Commute Time | # Commuters | % Commuters |
| Less than 5 Minutes | 27 | 16.3% |
| 5 to 9 Minutes | 21 | 12.7% |
| 10 to 14 Minutes | 7 | 4.2% |
| 15 to 19 Minutes | 3 | 1.8% |
| 20 to 24 Minutes | 73 | 44.0% |
| 25 to 29 Minutes | 2 | 1.2% |
| 30 to 34 Minutes | 16 | 9.6% |
| 35 to 39 Minutes | 0 | 0.0% |
| 40 to 44 Minutes | 2 | 1.2% |
| 45 to 59 Minutes | 8 | 4.8% |
| 60 to 89 Minutes | 4 | 2.4% |
| 90 or more Minutes | 3 | 1.8% |
Commute Time by Sex in Wagon Mound
The most common commute times in Wagon Mound are less than 5 minutes (27 commuters, 42.9%) for males and 20 to 24 minutes (73 commuters, 70.9%) for females.
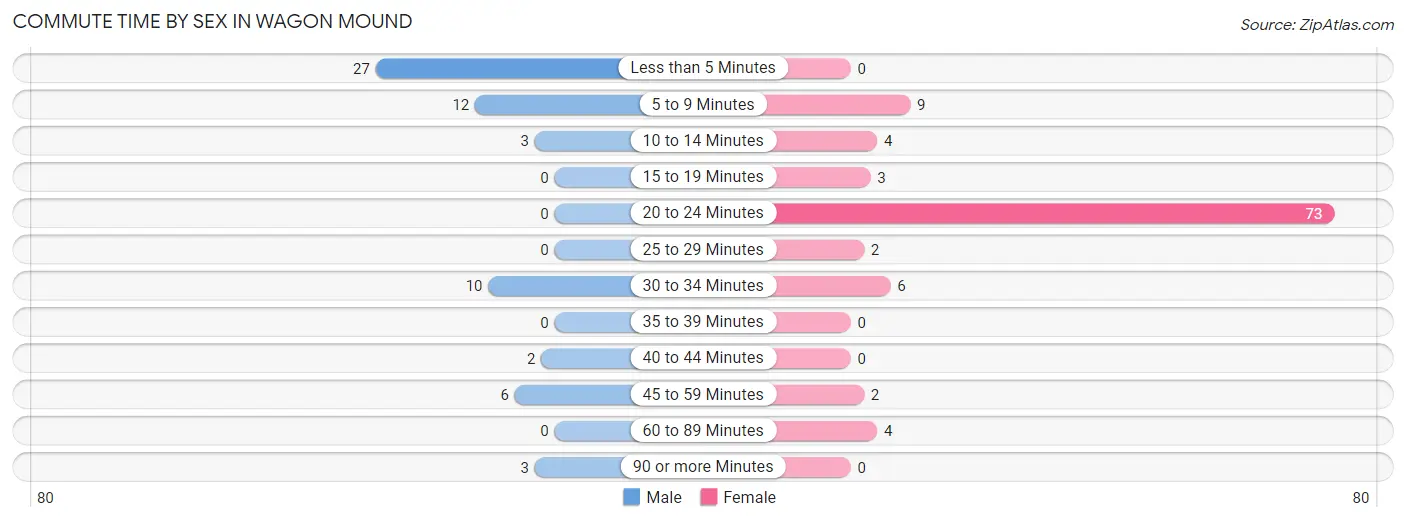
| Commute Time | Male | Female |
| Less than 5 Minutes | 27 (42.9%) | 0 (0.0%) |
| 5 to 9 Minutes | 12 (19.1%) | 9 (8.7%) |
| 10 to 14 Minutes | 3 (4.8%) | 4 (3.9%) |
| 15 to 19 Minutes | 0 (0.0%) | 3 (2.9%) |
| 20 to 24 Minutes | 0 (0.0%) | 73 (70.9%) |
| 25 to 29 Minutes | 0 (0.0%) | 2 (1.9%) |
| 30 to 34 Minutes | 10 (15.9%) | 6 (5.8%) |
| 35 to 39 Minutes | 0 (0.0%) | 0 (0.0%) |
| 40 to 44 Minutes | 2 (3.2%) | 0 (0.0%) |
| 45 to 59 Minutes | 6 (9.5%) | 2 (1.9%) |
| 60 to 89 Minutes | 0 (0.0%) | 4 (3.9%) |
| 90 or more Minutes | 3 (4.8%) | 0 (0.0%) |
Time of Departure to Work by Sex in Wagon Mound
The most frequent times of departure to work in Wagon Mound are 7:00 AM to 7:29 AM (22, 34.9%) for males and 6:30 AM to 6:59 AM (88, 85.4%) for females.
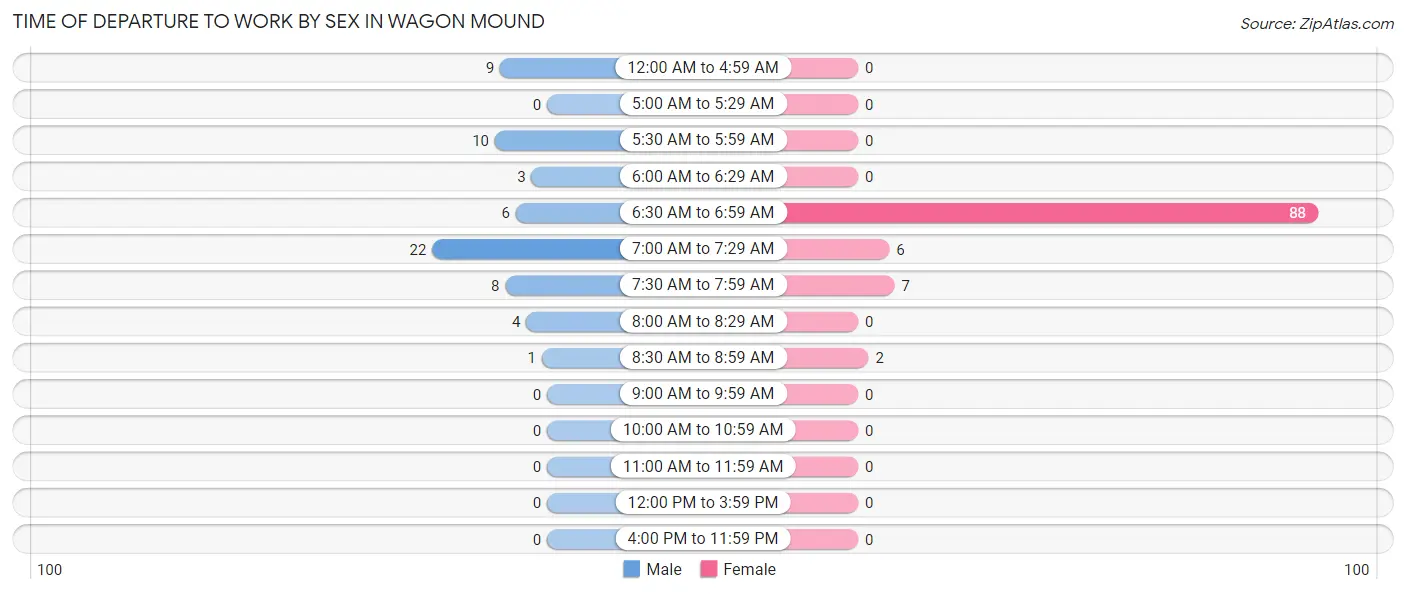
| Time of Departure | Male | Female |
| 12:00 AM to 4:59 AM | 9 (14.3%) | 0 (0.0%) |
| 5:00 AM to 5:29 AM | 0 (0.0%) | 0 (0.0%) |
| 5:30 AM to 5:59 AM | 10 (15.9%) | 0 (0.0%) |
| 6:00 AM to 6:29 AM | 3 (4.8%) | 0 (0.0%) |
| 6:30 AM to 6:59 AM | 6 (9.5%) | 88 (85.4%) |
| 7:00 AM to 7:29 AM | 22 (34.9%) | 6 (5.8%) |
| 7:30 AM to 7:59 AM | 8 (12.7%) | 7 (6.8%) |
| 8:00 AM to 8:29 AM | 4 (6.4%) | 0 (0.0%) |
| 8:30 AM to 8:59 AM | 1 (1.6%) | 2 (1.9%) |
| 9:00 AM to 9:59 AM | 0 (0.0%) | 0 (0.0%) |
| 10:00 AM to 10:59 AM | 0 (0.0%) | 0 (0.0%) |
| 11:00 AM to 11:59 AM | 0 (0.0%) | 0 (0.0%) |
| 12:00 PM to 3:59 PM | 0 (0.0%) | 0 (0.0%) |
| 4:00 PM to 11:59 PM | 0 (0.0%) | 0 (0.0%) |
| Total | 63 (100.0%) | 103 (100.0%) |
Housing Occupancy in Wagon Mound
Occupancy by Ownership in Wagon Mound
Of the total 270 dwellings in Wagon Mound, owner-occupied units account for 203 (75.2%), while renter-occupied units make up 67 (24.8%).
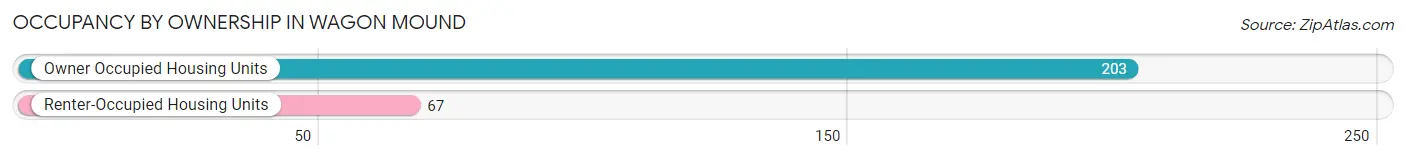
| Occupancy | # Housing Units | % Housing Units |
| Owner Occupied Housing Units | 203 | 75.2% |
| Renter-Occupied Housing Units | 67 | 24.8% |
| Total Occupied Housing Units | 270 | 100.0% |
Occupancy by Household Size in Wagon Mound
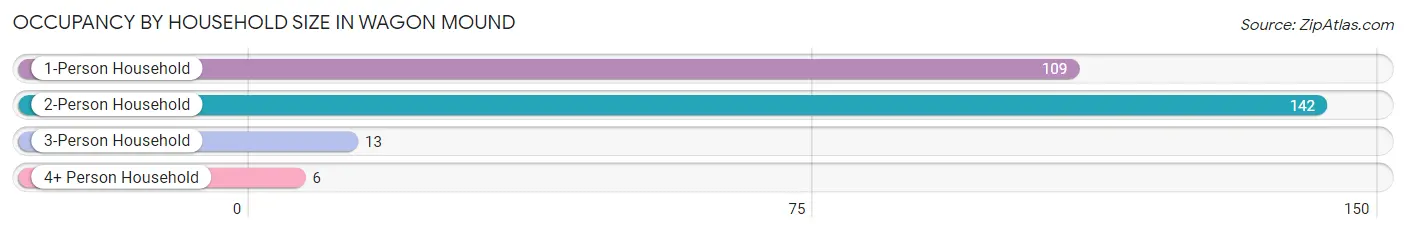
| Household Size | # Housing Units | % Housing Units |
| 1-Person Household | 109 | 40.4% |
| 2-Person Household | 142 | 52.6% |
| 3-Person Household | 13 | 4.8% |
| 4+ Person Household | 6 | 2.2% |
| Total Housing Units | 270 | 100.0% |
Occupancy by Ownership by Household Size in Wagon Mound
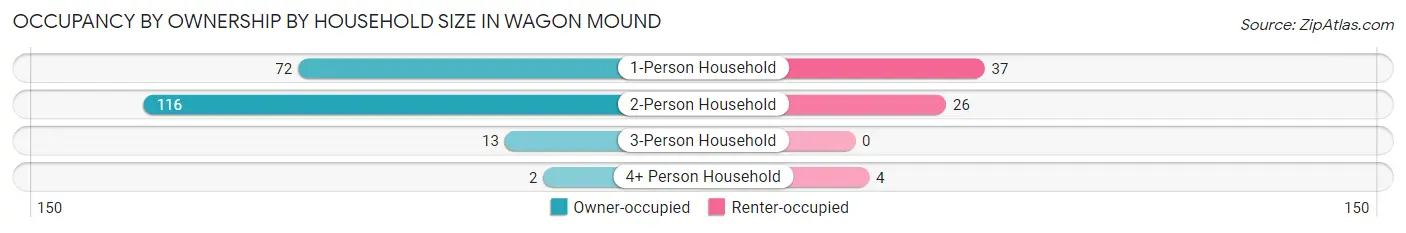
| Household Size | Owner-occupied | Renter-occupied |
| 1-Person Household | 72 (66.1%) | 37 (33.9%) |
| 2-Person Household | 116 (81.7%) | 26 (18.3%) |
| 3-Person Household | 13 (100.0%) | 0 (0.0%) |
| 4+ Person Household | 2 (33.3%) | 4 (66.7%) |
| Total Housing Units | 203 (75.2%) | 67 (24.8%) |
Occupancy by Educational Attainment in Wagon Mound
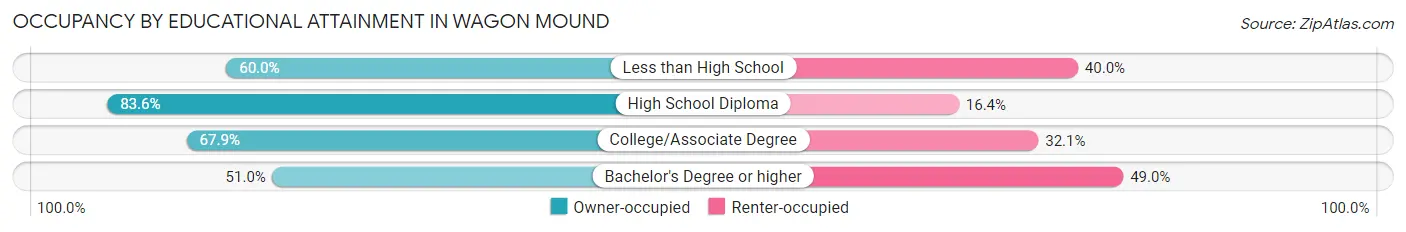
| Household Size | Owner-occupied | Renter-occupied |
| Less than High School | 6 (60.0%) | 4 (40.0%) |
| High School Diploma | 153 (83.6%) | 30 (16.4%) |
| College/Associate Degree | 19 (67.9%) | 9 (32.1%) |
| Bachelor's Degree or higher | 25 (51.0%) | 24 (49.0%) |
Occupancy by Age of Householder in Wagon Mound
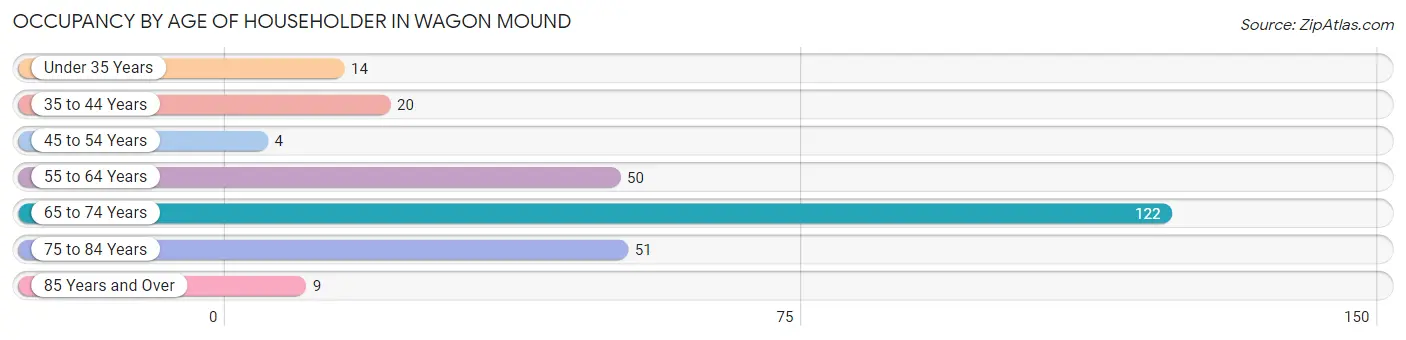
| Age Bracket | # Households | % Households |
| Under 35 Years | 14 | 5.2% |
| 35 to 44 Years | 20 | 7.4% |
| 45 to 54 Years | 4 | 1.5% |
| 55 to 64 Years | 50 | 18.5% |
| 65 to 74 Years | 122 | 45.2% |
| 75 to 84 Years | 51 | 18.9% |
| 85 Years and Over | 9 | 3.3% |
| Total | 270 | 100.0% |
Housing Finances in Wagon Mound
Median Income by Occupancy in Wagon Mound
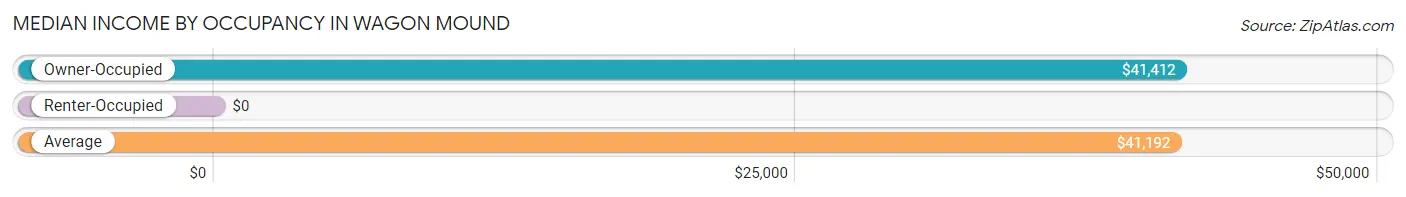
| Occupancy Type | # Households | Median Income |
| Owner-Occupied | 203 (75.2%) | $41,412 |
| Renter-Occupied | 67 (24.8%) | $0 |
| Average | 270 (100.0%) | $41,192 |
Occupancy by Householder Income Bracket in Wagon Mound
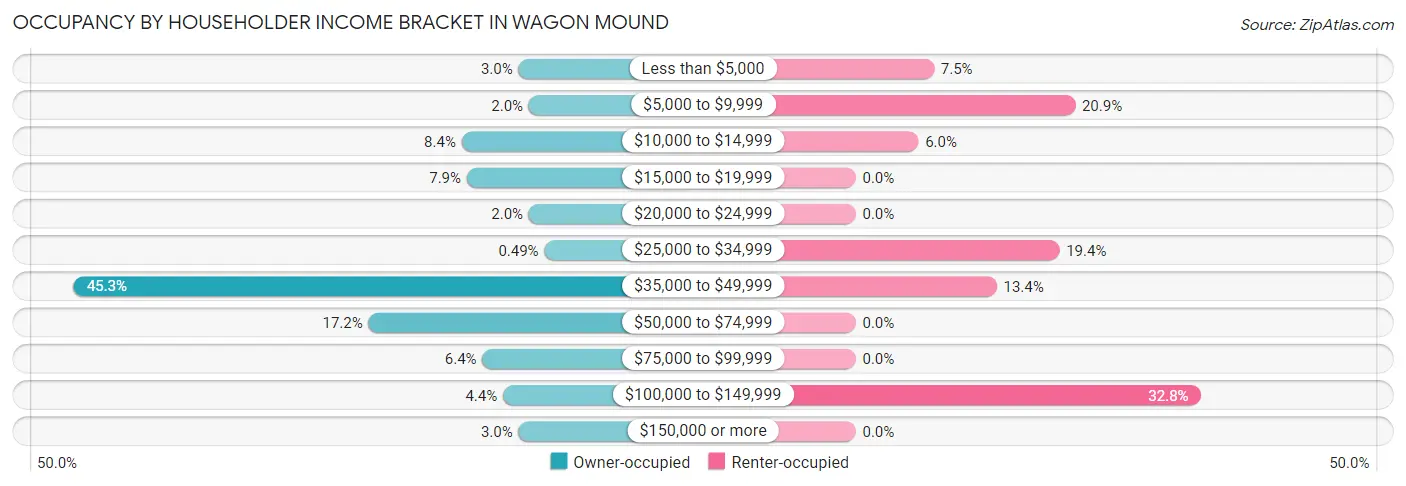
| Income Bracket | Owner-occupied | Renter-occupied |
| Less than $5,000 | 6 (3.0%) | 5 (7.5%) |
| $5,000 to $9,999 | 4 (2.0%) | 14 (20.9%) |
| $10,000 to $14,999 | 17 (8.4%) | 4 (6.0%) |
| $15,000 to $19,999 | 16 (7.9%) | 0 (0.0%) |
| $20,000 to $24,999 | 4 (2.0%) | 0 (0.0%) |
| $25,000 to $34,999 | 1 (0.5%) | 13 (19.4%) |
| $35,000 to $49,999 | 92 (45.3%) | 9 (13.4%) |
| $50,000 to $74,999 | 35 (17.2%) | 0 (0.0%) |
| $75,000 to $99,999 | 13 (6.4%) | 0 (0.0%) |
| $100,000 to $149,999 | 9 (4.4%) | 22 (32.8%) |
| $150,000 or more | 6 (3.0%) | 0 (0.0%) |
| Total | 203 (100.0%) | 67 (100.0%) |
Monthly Housing Cost Tiers in Wagon Mound
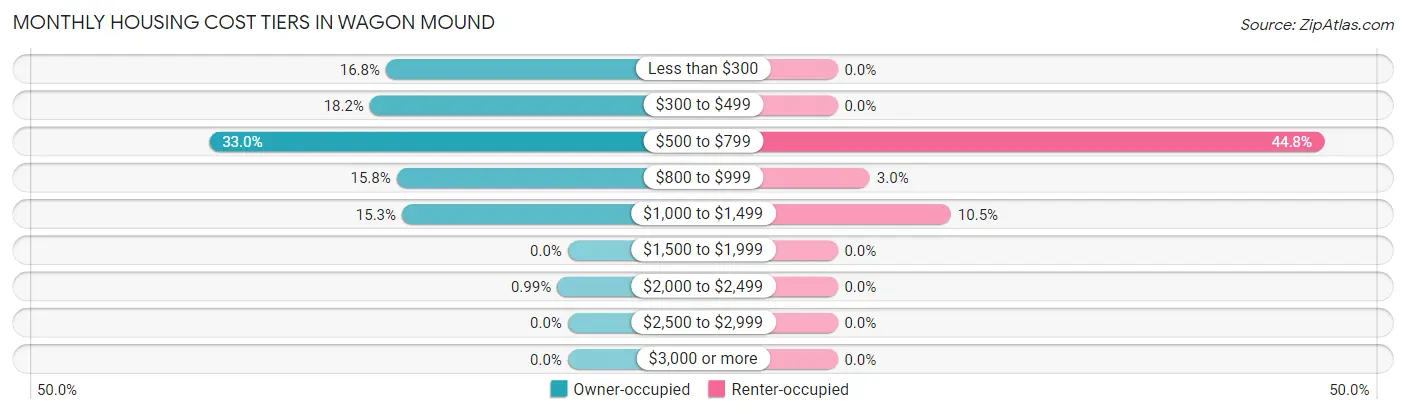
| Monthly Cost | Owner-occupied | Renter-occupied |
| Less than $300 | 34 (16.8%) | 0 (0.0%) |
| $300 to $499 | 37 (18.2%) | 0 (0.0%) |
| $500 to $799 | 67 (33.0%) | 30 (44.8%) |
| $800 to $999 | 32 (15.8%) | 2 (3.0%) |
| $1,000 to $1,499 | 31 (15.3%) | 7 (10.4%) |
| $1,500 to $1,999 | 0 (0.0%) | 0 (0.0%) |
| $2,000 to $2,499 | 2 (1.0%) | 0 (0.0%) |
| $2,500 to $2,999 | 0 (0.0%) | 0 (0.0%) |
| $3,000 or more | 0 (0.0%) | 0 (0.0%) |
| Total | 203 (100.0%) | 67 (100.0%) |
Physical Housing Characteristics in Wagon Mound
Housing Structures in Wagon Mound
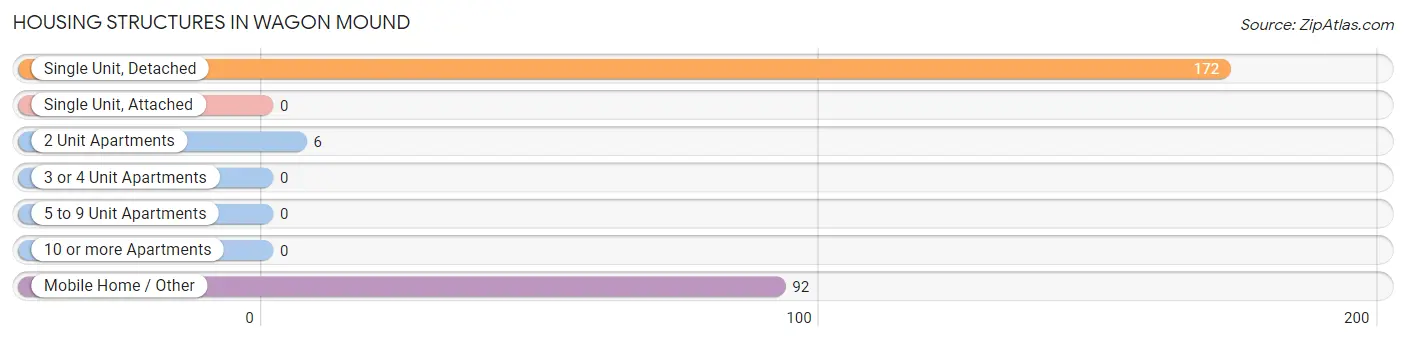
| Structure Type | # Housing Units | % Housing Units |
| Single Unit, Detached | 172 | 63.7% |
| Single Unit, Attached | 0 | 0.0% |
| 2 Unit Apartments | 6 | 2.2% |
| 3 or 4 Unit Apartments | 0 | 0.0% |
| 5 to 9 Unit Apartments | 0 | 0.0% |
| 10 or more Apartments | 0 | 0.0% |
| Mobile Home / Other | 92 | 34.1% |
| Total | 270 | 100.0% |
Housing Structures by Occupancy in Wagon Mound
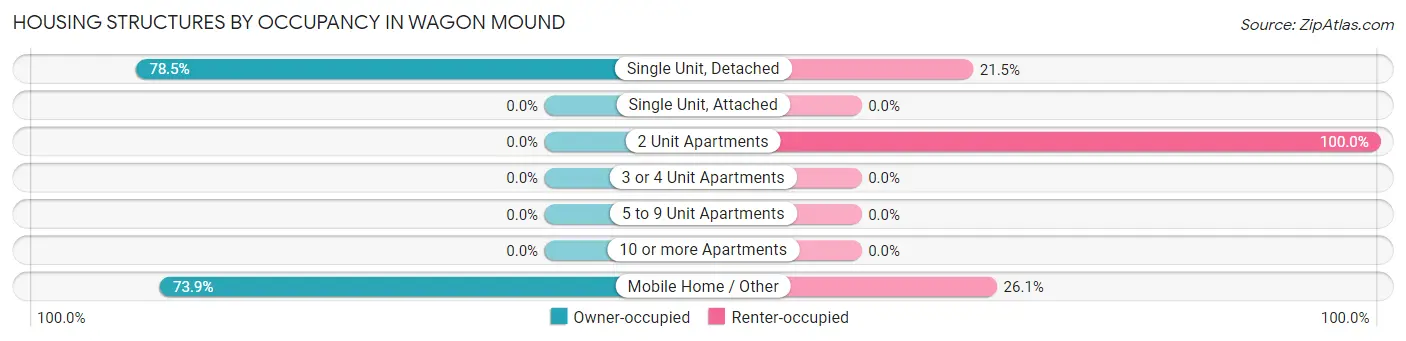
| Structure Type | Owner-occupied | Renter-occupied |
| Single Unit, Detached | 135 (78.5%) | 37 (21.5%) |
| Single Unit, Attached | 0 (0.0%) | 0 (0.0%) |
| 2 Unit Apartments | 0 (0.0%) | 6 (100.0%) |
| 3 or 4 Unit Apartments | 0 (0.0%) | 0 (0.0%) |
| 5 to 9 Unit Apartments | 0 (0.0%) | 0 (0.0%) |
| 10 or more Apartments | 0 (0.0%) | 0 (0.0%) |
| Mobile Home / Other | 68 (73.9%) | 24 (26.1%) |
| Total | 203 (75.2%) | 67 (24.8%) |
Housing Structures by Number of Rooms in Wagon Mound
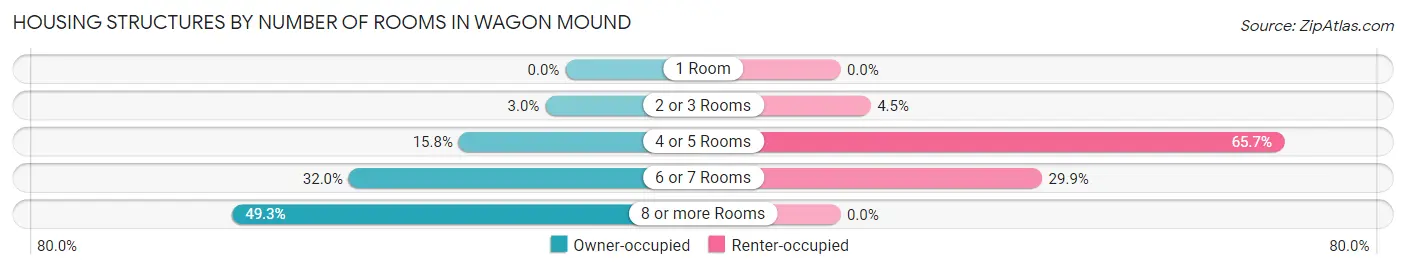
| Number of Rooms | Owner-occupied | Renter-occupied |
| 1 Room | 0 (0.0%) | 0 (0.0%) |
| 2 or 3 Rooms | 6 (3.0%) | 3 (4.5%) |
| 4 or 5 Rooms | 32 (15.8%) | 44 (65.7%) |
| 6 or 7 Rooms | 65 (32.0%) | 20 (29.8%) |
| 8 or more Rooms | 100 (49.3%) | 0 (0.0%) |
| Total | 203 (100.0%) | 67 (100.0%) |
Housing Structure by Heating Type in Wagon Mound
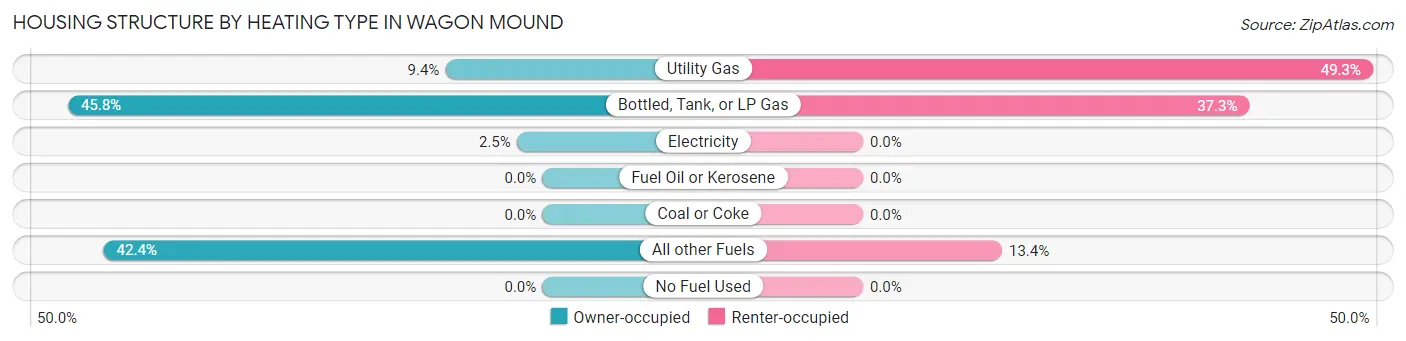
| Heating Type | Owner-occupied | Renter-occupied |
| Utility Gas | 19 (9.4%) | 33 (49.2%) |
| Bottled, Tank, or LP Gas | 93 (45.8%) | 25 (37.3%) |
| Electricity | 5 (2.5%) | 0 (0.0%) |
| Fuel Oil or Kerosene | 0 (0.0%) | 0 (0.0%) |
| Coal or Coke | 0 (0.0%) | 0 (0.0%) |
| All other Fuels | 86 (42.4%) | 9 (13.4%) |
| No Fuel Used | 0 (0.0%) | 0 (0.0%) |
| Total | 203 (100.0%) | 67 (100.0%) |
Household Vehicle Usage in Wagon Mound
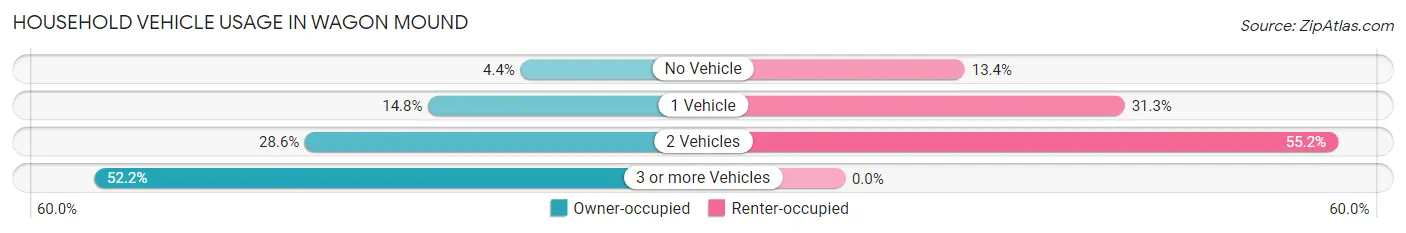
| Vehicles per Household | Owner-occupied | Renter-occupied |
| No Vehicle | 9 (4.4%) | 9 (13.4%) |
| 1 Vehicle | 30 (14.8%) | 21 (31.3%) |
| 2 Vehicles | 58 (28.6%) | 37 (55.2%) |
| 3 or more Vehicles | 106 (52.2%) | 0 (0.0%) |
| Total | 203 (100.0%) | 67 (100.0%) |
Real Estate & Mortgages in Wagon Mound
Real Estate and Mortgage Overview in Wagon Mound
| Characteristic | Without Mortgage | With Mortgage |
| Housing Units | 165 | 38 |
| Median Property Value | $59,200 | $186,700 |
| Median Household Income | $41,386 | $0 |
| Monthly Housing Costs | $603 | $0 |
| Real Estate Taxes | $541 | $0 |
Property Value by Mortgage Status in Wagon Mound
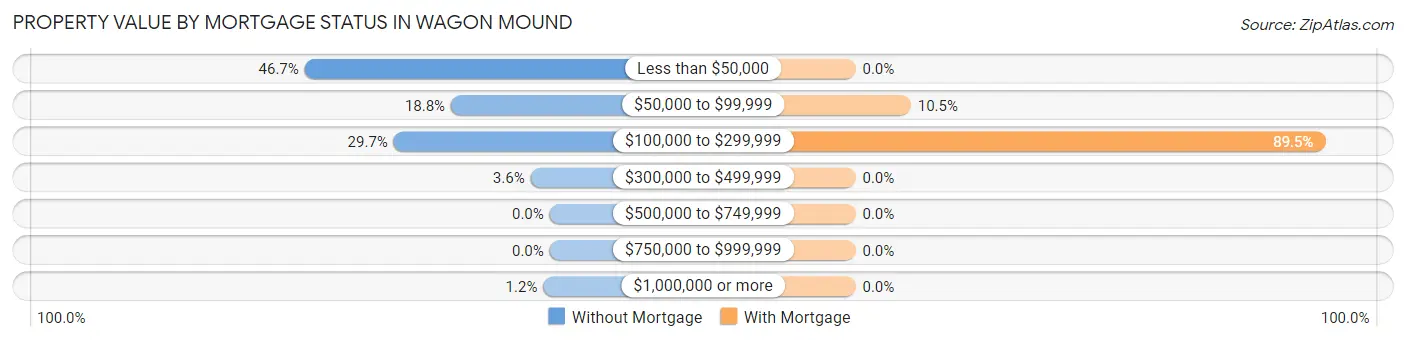
| Property Value | Without Mortgage | With Mortgage |
| Less than $50,000 | 77 (46.7%) | 0 (0.0%) |
| $50,000 to $99,999 | 31 (18.8%) | 4 (10.5%) |
| $100,000 to $299,999 | 49 (29.7%) | 34 (89.5%) |
| $300,000 to $499,999 | 6 (3.6%) | 0 (0.0%) |
| $500,000 to $749,999 | 0 (0.0%) | 0 (0.0%) |
| $750,000 to $999,999 | 0 (0.0%) | 0 (0.0%) |
| $1,000,000 or more | 2 (1.2%) | 0 (0.0%) |
| Total | 165 (100.0%) | 38 (100.0%) |
Household Income by Mortgage Status in Wagon Mound
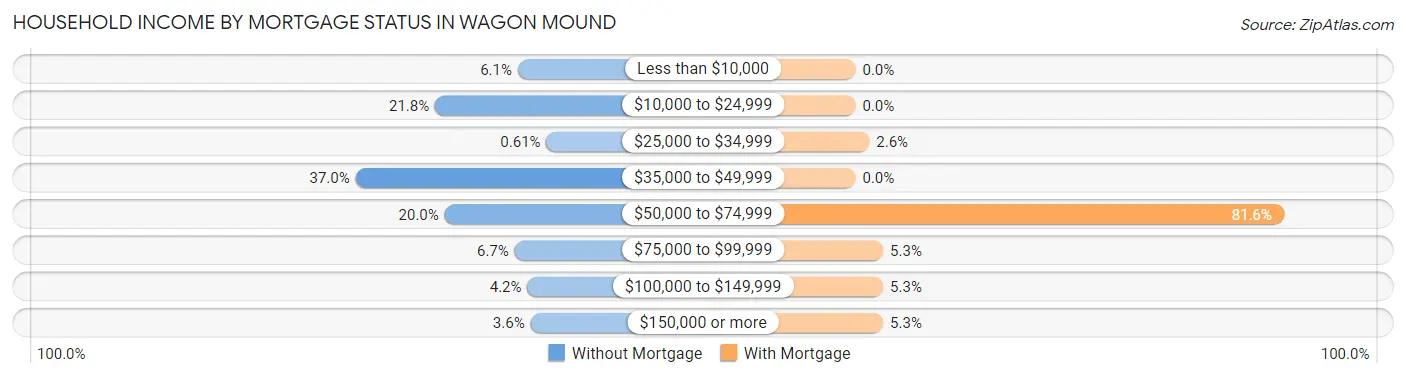
| Household Income | Without Mortgage | With Mortgage |
| Less than $10,000 | 10 (6.1%) | 0 (0.0%) |
| $10,000 to $24,999 | 36 (21.8%) | 0 (0.0%) |
| $25,000 to $34,999 | 1 (0.6%) | 1 (2.6%) |
| $35,000 to $49,999 | 61 (37.0%) | 0 (0.0%) |
| $50,000 to $74,999 | 33 (20.0%) | 31 (81.6%) |
| $75,000 to $99,999 | 11 (6.7%) | 2 (5.3%) |
| $100,000 to $149,999 | 7 (4.2%) | 2 (5.3%) |
| $150,000 or more | 6 (3.6%) | 2 (5.3%) |
| Total | 165 (100.0%) | 38 (100.0%) |
Property Value to Household Income Ratio in Wagon Mound
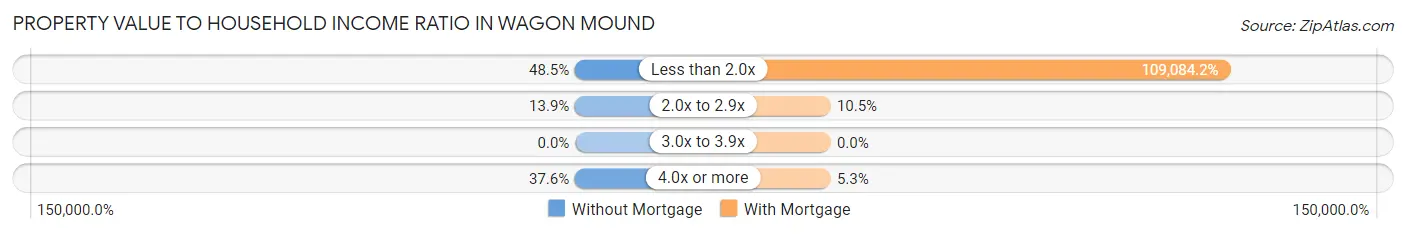
| Value-to-Income Ratio | Without Mortgage | With Mortgage |
| Less than 2.0x | 80 (48.5%) | 41,452 (109,084.2%) |
| 2.0x to 2.9x | 23 (13.9%) | 4 (10.5%) |
| 3.0x to 3.9x | 0 (0.0%) | 0 (0.0%) |
| 4.0x or more | 62 (37.6%) | 2 (5.3%) |
| Total | 165 (100.0%) | 38 (100.0%) |
Real Estate Taxes by Mortgage Status in Wagon Mound
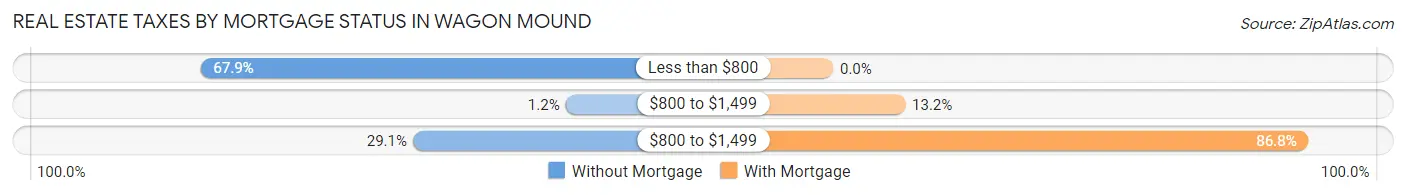
| Property Taxes | Without Mortgage | With Mortgage |
| Less than $800 | 112 (67.9%) | 0 (0.0%) |
| $800 to $1,499 | 2 (1.2%) | 5 (13.2%) |
| $800 to $1,499 | 48 (29.1%) | 33 (86.8%) |
| Total | 165 (100.0%) | 38 (100.0%) |
Health & Disability in Wagon Mound
Health Insurance Coverage by Age in Wagon Mound
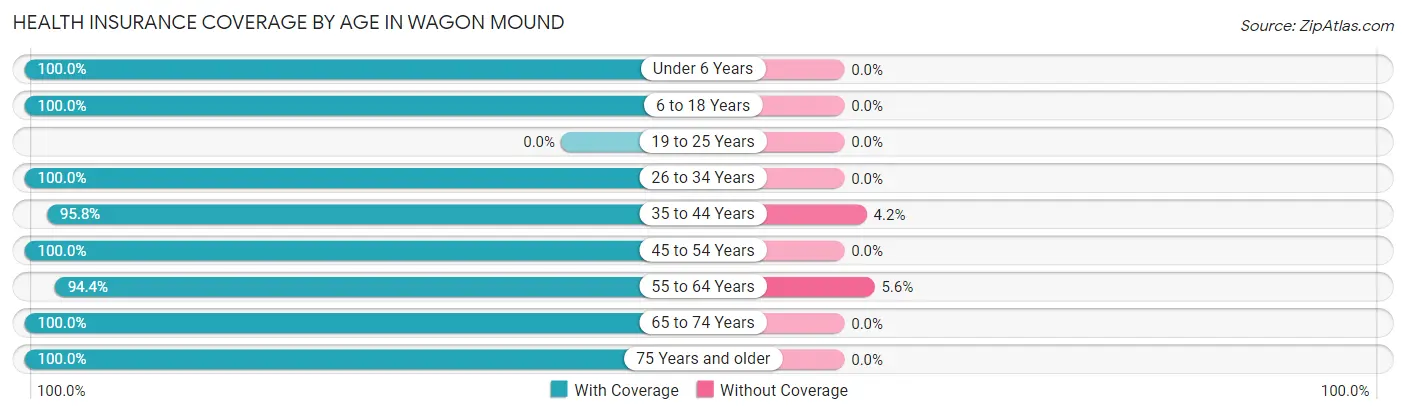
| Age Bracket | With Coverage | Without Coverage |
| Under 6 Years | 22 (100.0%) | 0 (0.0%) |
| 6 to 18 Years | 28 (100.0%) | 0 (0.0%) |
| 19 to 25 Years | 0 (0.0%) | 0 (0.0%) |
| 26 to 34 Years | 16 (100.0%) | 0 (0.0%) |
| 35 to 44 Years | 46 (95.8%) | 2 (4.2%) |
| 45 to 54 Years | 12 (100.0%) | 0 (0.0%) |
| 55 to 64 Years | 151 (94.4%) | 9 (5.6%) |
| 65 to 74 Years | 131 (100.0%) | 0 (0.0%) |
| 75 Years and older | 74 (100.0%) | 0 (0.0%) |
| Total | 480 (97.8%) | 11 (2.2%) |
Health Insurance Coverage by Citizenship Status in Wagon Mound
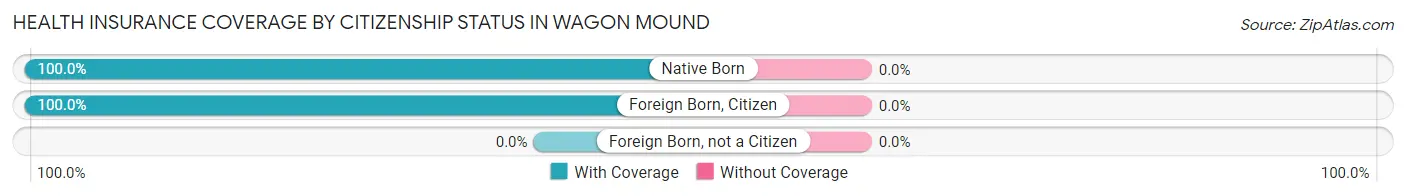
| Citizenship Status | With Coverage | Without Coverage |
| Native Born | 22 (100.0%) | 0 (0.0%) |
| Foreign Born, Citizen | 28 (100.0%) | 0 (0.0%) |
| Foreign Born, not a Citizen | 0 (0.0%) | 0 (0.0%) |
Health Insurance Coverage by Household Income in Wagon Mound
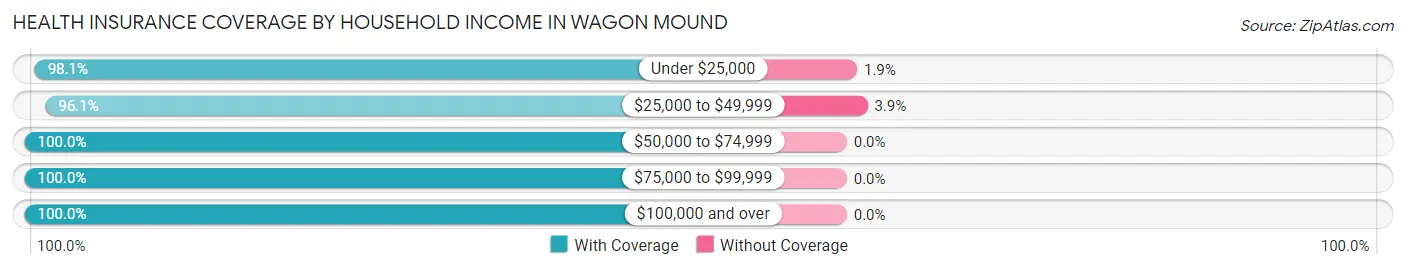
| Household Income | With Coverage | Without Coverage |
| Under $25,000 | 103 (98.1%) | 2 (1.9%) |
| $25,000 to $49,999 | 223 (96.1%) | 9 (3.9%) |
| $50,000 to $74,999 | 38 (100.0%) | 0 (0.0%) |
| $75,000 to $99,999 | 28 (100.0%) | 0 (0.0%) |
| $100,000 and over | 88 (100.0%) | 0 (0.0%) |
Public vs Private Health Insurance Coverage by Age in Wagon Mound
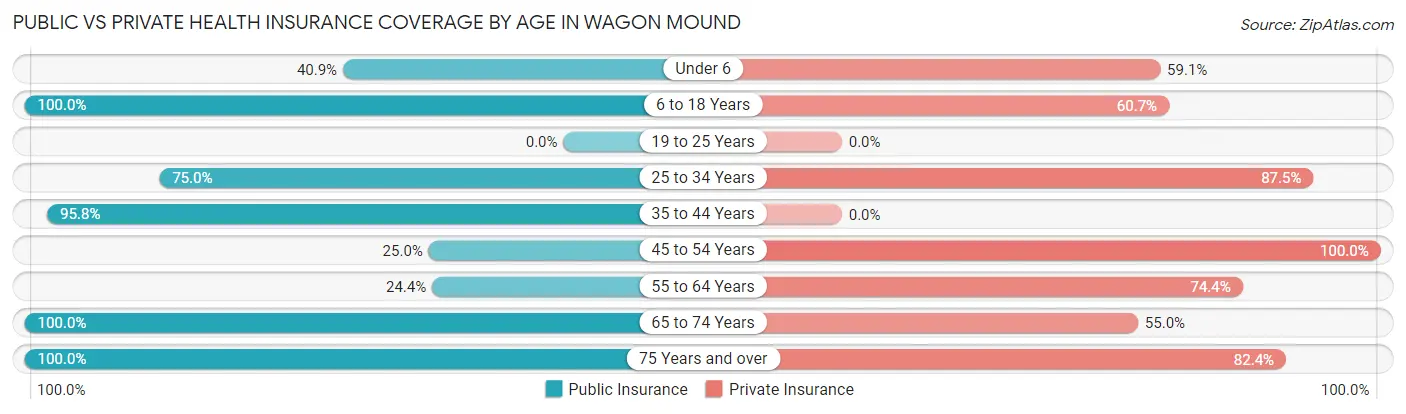
| Age Bracket | Public Insurance | Private Insurance |
| Under 6 | 9 (40.9%) | 13 (59.1%) |
| 6 to 18 Years | 28 (100.0%) | 17 (60.7%) |
| 19 to 25 Years | 0 (0.0%) | 0 (0.0%) |
| 25 to 34 Years | 12 (75.0%) | 14 (87.5%) |
| 35 to 44 Years | 46 (95.8%) | 0 (0.0%) |
| 45 to 54 Years | 3 (25.0%) | 12 (100.0%) |
| 55 to 64 Years | 39 (24.4%) | 119 (74.4%) |
| 65 to 74 Years | 131 (100.0%) | 72 (55.0%) |
| 75 Years and over | 74 (100.0%) | 61 (82.4%) |
| Total | 342 (69.7%) | 308 (62.7%) |
Disability Status by Sex by Age in Wagon Mound
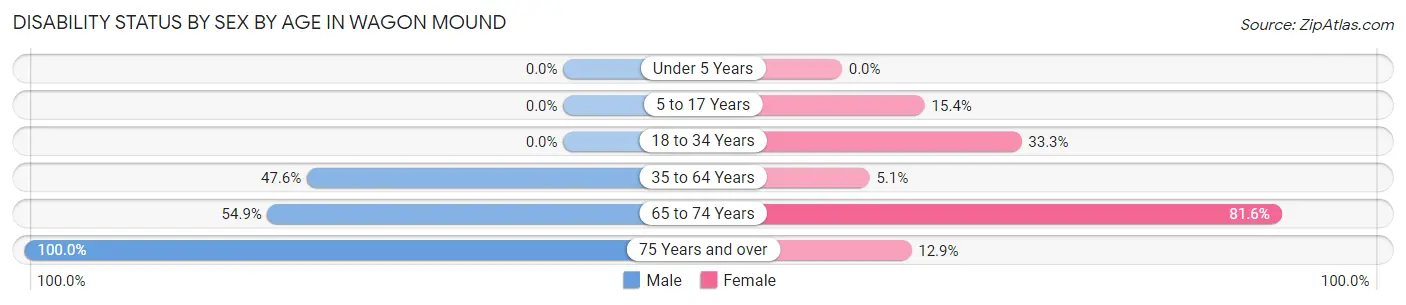
| Age Bracket | Male | Female |
| Under 5 Years | 0 (0.0%) | 0 (0.0%) |
| 5 to 17 Years | 0 (0.0%) | 4 (15.4%) |
| 18 to 34 Years | 0 (0.0%) | 2 (33.3%) |
| 35 to 64 Years | 49 (47.6%) | 6 (5.1%) |
| 65 to 74 Years | 45 (54.9%) | 40 (81.6%) |
| 75 Years and over | 12 (100.0%) | 8 (12.9%) |
Disability Class by Sex by Age in Wagon Mound
Disability Class: Hearing Difficulty
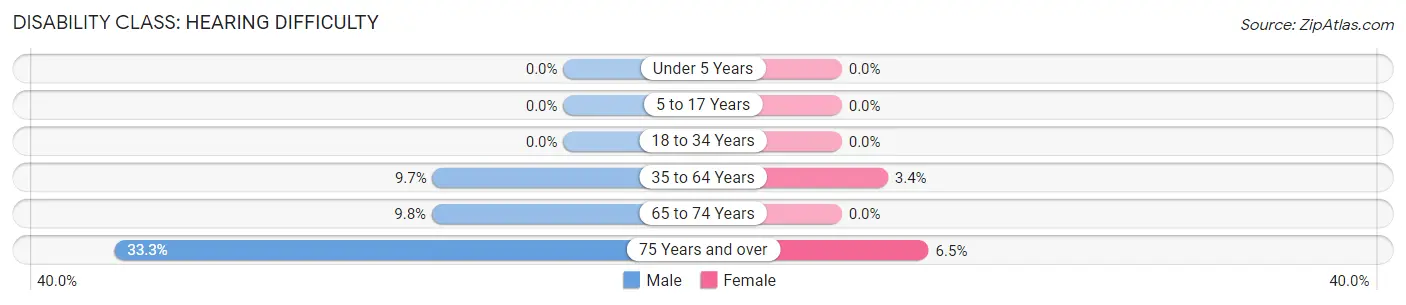
| Age Bracket | Male | Female |
| Under 5 Years | 0 (0.0%) | 0 (0.0%) |
| 5 to 17 Years | 0 (0.0%) | 0 (0.0%) |
| 18 to 34 Years | 0 (0.0%) | 0 (0.0%) |
| 35 to 64 Years | 10 (9.7%) | 4 (3.4%) |
| 65 to 74 Years | 8 (9.8%) | 0 (0.0%) |
| 75 Years and over | 4 (33.3%) | 4 (6.5%) |
Disability Class: Vision Difficulty
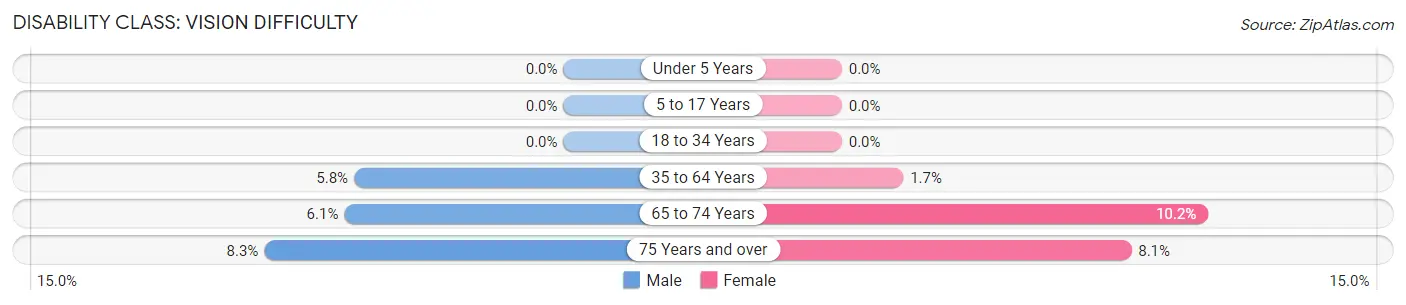
| Age Bracket | Male | Female |
| Under 5 Years | 0 (0.0%) | 0 (0.0%) |
| 5 to 17 Years | 0 (0.0%) | 0 (0.0%) |
| 18 to 34 Years | 0 (0.0%) | 0 (0.0%) |
| 35 to 64 Years | 6 (5.8%) | 2 (1.7%) |
| 65 to 74 Years | 5 (6.1%) | 5 (10.2%) |
| 75 Years and over | 1 (8.3%) | 5 (8.1%) |
Disability Class: Cognitive Difficulty
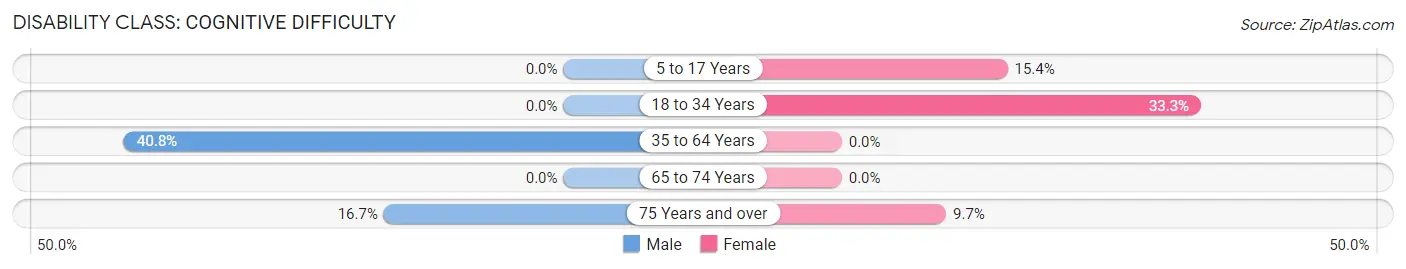
| Age Bracket | Male | Female |
| 5 to 17 Years | 0 (0.0%) | 4 (15.4%) |
| 18 to 34 Years | 0 (0.0%) | 2 (33.3%) |
| 35 to 64 Years | 42 (40.8%) | 0 (0.0%) |
| 65 to 74 Years | 0 (0.0%) | 0 (0.0%) |
| 75 Years and over | 2 (16.7%) | 6 (9.7%) |
Disability Class: Ambulatory Difficulty
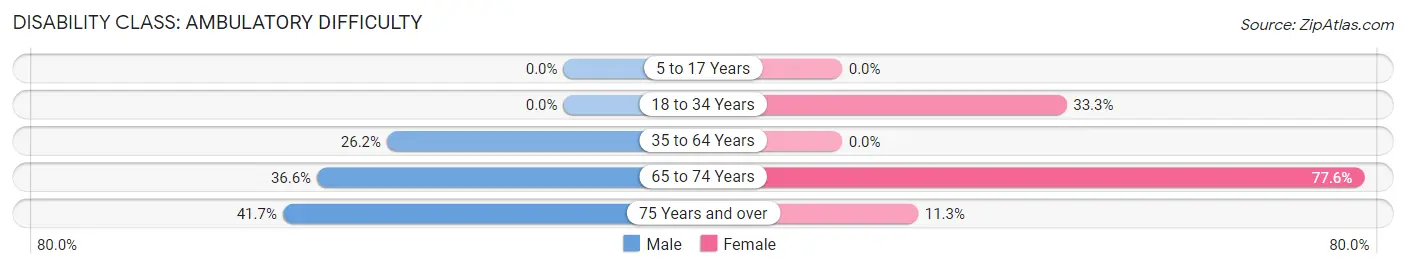
| Age Bracket | Male | Female |
| 5 to 17 Years | 0 (0.0%) | 0 (0.0%) |
| 18 to 34 Years | 0 (0.0%) | 2 (33.3%) |
| 35 to 64 Years | 27 (26.2%) | 0 (0.0%) |
| 65 to 74 Years | 30 (36.6%) | 38 (77.5%) |
| 75 Years and over | 5 (41.7%) | 7 (11.3%) |
Disability Class: Self-Care Difficulty
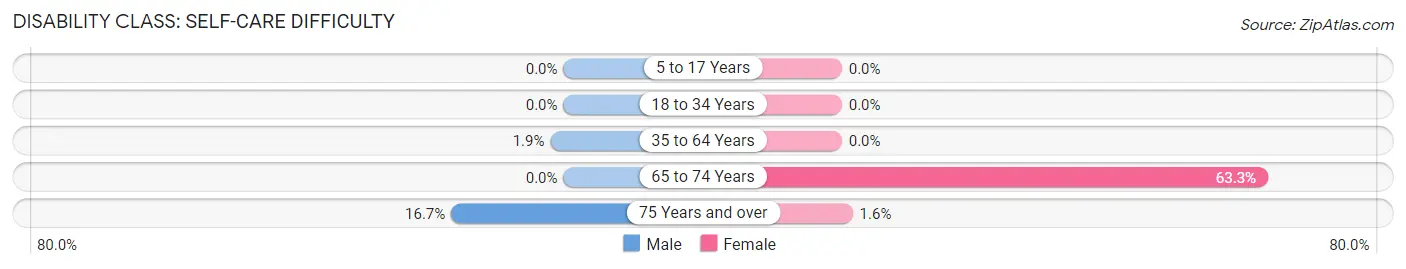
| Age Bracket | Male | Female |
| 5 to 17 Years | 0 (0.0%) | 0 (0.0%) |
| 18 to 34 Years | 0 (0.0%) | 0 (0.0%) |
| 35 to 64 Years | 2 (1.9%) | 0 (0.0%) |
| 65 to 74 Years | 0 (0.0%) | 31 (63.3%) |
| 75 Years and over | 2 (16.7%) | 1 (1.6%) |
Technology Access in Wagon Mound
Computing Device Access in Wagon Mound
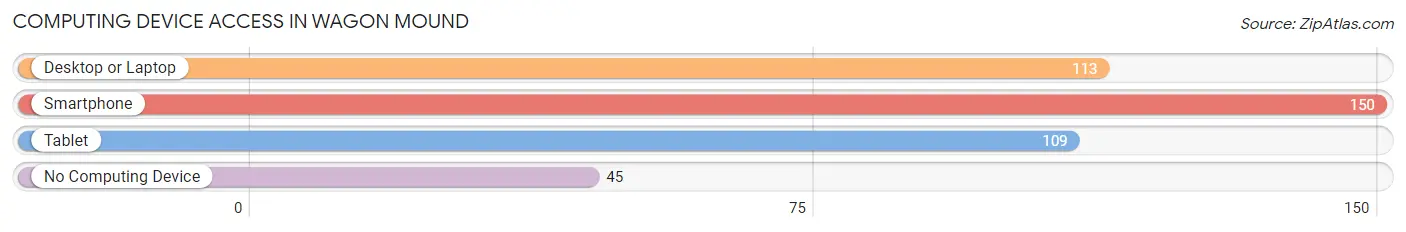
| Device Type | # Households | % Households |
| Desktop or Laptop | 113 | 41.8% |
| Smartphone | 150 | 55.6% |
| Tablet | 109 | 40.4% |
| No Computing Device | 45 | 16.7% |
| Total | 270 | 100.0% |
Internet Access in Wagon Mound
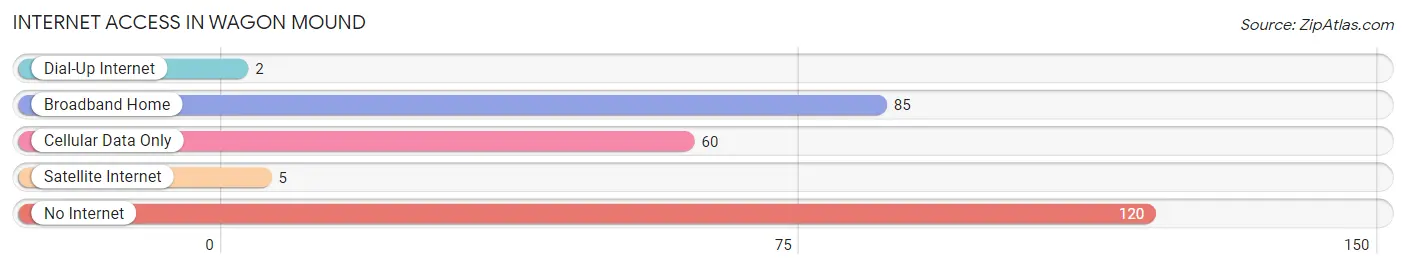
| Internet Type | # Households | % Households |
| Dial-Up Internet | 2 | 0.7% |
| Broadband Home | 85 | 31.5% |
| Cellular Data Only | 60 | 22.2% |
| Satellite Internet | 5 | 1.8% |
| No Internet | 120 | 44.4% |
| Total | 270 | 100.0% |
Wagon Mound Summary
Wagon Mound is a small village located in Mora County, New Mexico. It is situated on the banks of the Canadian River, approximately 40 miles east of Las Vegas. The village was founded in 1876 by a group of settlers from the nearby town of Las Vegas. The name of the village was derived from a nearby hill that resembled a wagon wheel.
Geography
Wagon Mound is located in the eastern part of Mora County, New Mexico. It is situated on the banks of the Canadian River, approximately 40 miles east of Las Vegas. The village is located at an elevation of 6,000 feet above sea level. The climate in the area is semi-arid, with hot summers and cold winters. The average annual precipitation is approximately 12 inches.
The village is surrounded by rolling hills and grasslands. The nearby Canadian River provides a source of water for the village. The area is also home to a variety of wildlife, including deer, elk, antelope, and wild turkeys.
History
Wagon Mound was founded in 1876 by a group of settlers from the nearby town of Las Vegas. The name of the village was derived from a nearby hill that resembled a wagon wheel. The settlers were attracted to the area due to its fertile soil and abundant water supply.
The village quickly grew and by the early 1900s, it had become a thriving community. The village was home to several businesses, including a general store, a blacksmith shop, and a saloon. The village also had a school, a post office, and a church.
In the early 1900s, the village was a popular stop for travelers on the Santa Fe Trail. The village was also a popular destination for hunters and trappers.
Economy
The economy of Wagon Mound is largely based on agriculture. The village is home to several farms, which produce a variety of crops, including alfalfa, corn, wheat, and hay. The village also has a small manufacturing sector, which produces a variety of products, including furniture, clothing, and leather goods.
The village is also home to several small businesses, including restaurants, grocery stores, and gas stations. The village also has a small tourism industry, which attracts visitors from around the region.
Demographics
As of the 2010 census, the population of Wagon Mound was 545. The village is predominantly Hispanic, with approximately 95% of the population identifying as Hispanic or Latino. The median household income in the village is approximately $30,000. The median age of the population is approximately 40 years old.
Conclusion
Wagon Mound is a small village located in Mora County, New Mexico. It was founded in 1876 by a group of settlers from the nearby town of Las Vegas. The village is situated on the banks of the Canadian River and is surrounded by rolling hills and grasslands. The economy of the village is largely based on agriculture, with a small manufacturing and tourism sector. The population of the village is predominantly Hispanic, with a median household income of approximately $30,000.
Common Questions
What is Per Capita Income in Wagon Mound?
Per Capita income in Wagon Mound is $28,647.
What is the Median Family Income in Wagon Mound?
Median Family Income in Wagon Mound is $41,602.
What is the Median Household income in Wagon Mound?
Median Household Income in Wagon Mound is $41,192.
What is Income or Wage Gap in Wagon Mound?
Income or Wage Gap in Wagon Mound is 72.6%.
Women in Wagon Mound earn 27.4 cents for every dollar earned by a man.
What is Inequality or Gini Index in Wagon Mound?
Inequality or Gini Index in Wagon Mound is 0.39.
What is the Total Population of Wagon Mound?
Total Population of Wagon Mound is 491.
What is the Total Male Population of Wagon Mound?
Total Male Population of Wagon Mound is 212.
What is the Total Female Population of Wagon Mound?
Total Female Population of Wagon Mound is 279.
What is the Ratio of Males per 100 Females in Wagon Mound?
There are 75.99 Males per 100 Females in Wagon Mound.
What is the Ratio of Females per 100 Males in Wagon Mound?
There are 131.60 Females per 100 Males in Wagon Mound.
What is the Median Population Age in Wagon Mound?
Median Population Age in Wagon Mound is 62.6 Years.
What is the Average Family Size in Wagon Mound
Average Family Size in Wagon Mound is 2.3 People.
What is the Average Household Size in Wagon Mound
Average Household Size in Wagon Mound is 1.8 People.
How Large is the Labor Force in Wagon Mound?
There are 179 People in the Labor Forcein in Wagon Mound.
What is the Percentage of People in the Labor Force in Wagon Mound?
40.6% of People are in the Labor Force in Wagon Mound.
What is the Unemployment Rate in Wagon Mound?
Unemployment Rate in Wagon Mound is 7.3%.