Lime Village, AK Map & Demographics
Lime Village Map
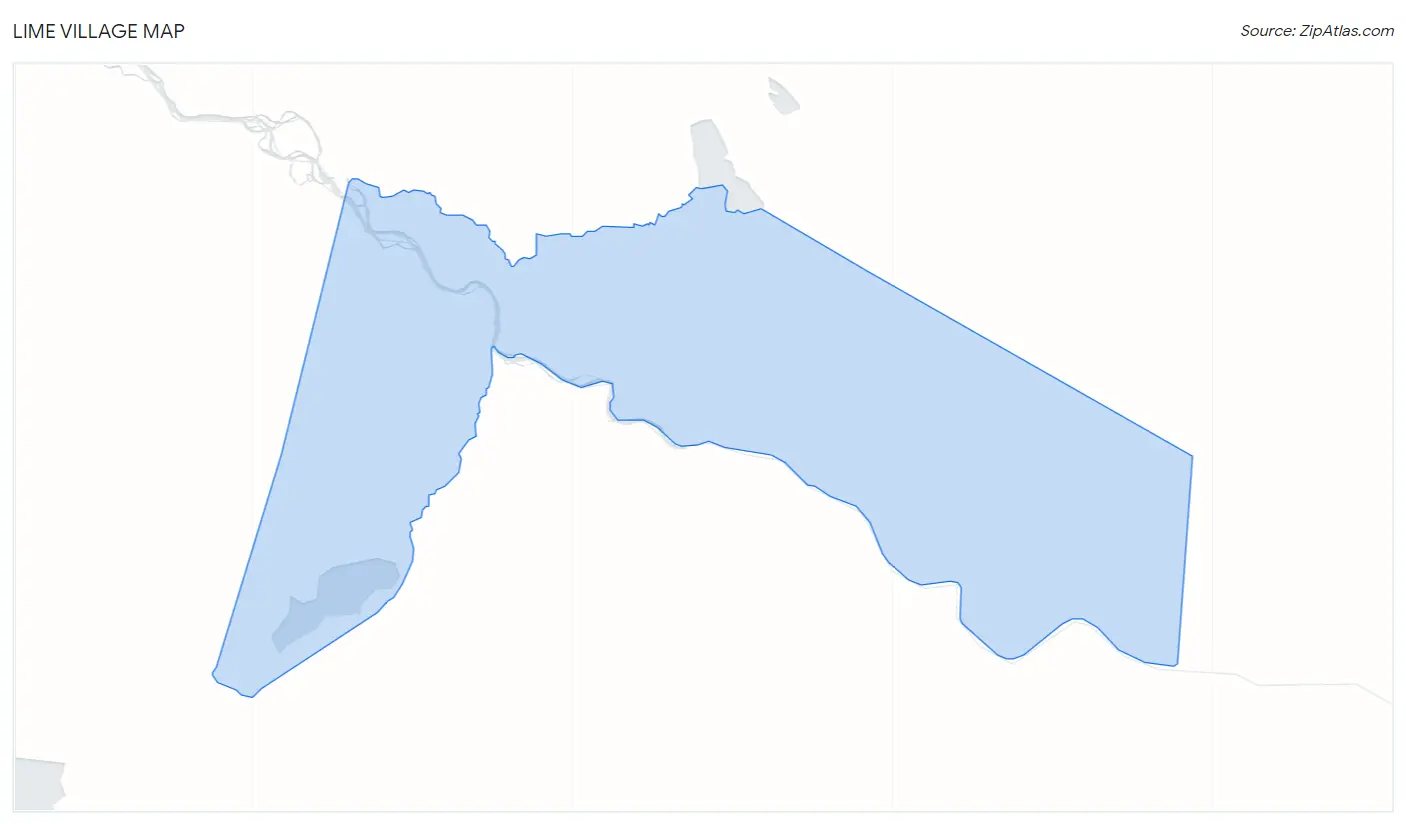
Lime Village Overview
$15,911
PER CAPITA INCOME
0.20
INEQUALITY / GINI INDEX
9
TOTAL POPULATION
6
MALE POPULATION
3
FEMALE POPULATION
200.00
MALES / 100 FEMALES
50.00
FEMALES / 100 MALES
53.2
MEDIAN AGE
3.5
AVG FAMILY SIZE
2.2
AVG HOUSEHOLD SIZE
4
LABOR FORCE [ PEOPLE ]
44.4%
PERCENT IN LABOR FORCE
50.0%
UNEMPLOYMENT RATE
Income in Lime Village
Income Overview in Lime Village
| Characteristic | Number | Measure |
| Per Capita Income | 9 | $15,911 |
| Median Family Income | 2 | $0 |
| Mean Family Income | 2 | $0 |
| Median Household Income | 4 | $0 |
| Mean Household Income | 4 | $0 |
| Income Deficit | 2 | $0 |
| Wage / Income Gap (%) | 9 | 0.00% |
| Wage / Income Gap ($) | 9 | 100.00¢ per $1 |
| Gini / Inequality Index | 9 | 0.20 |
Earnings by Sex in Lime Village
| Sex | Number | Average Earnings |
| Male | 4 (100.0%) | $0 |
| Female | 0 (0.0%) | $0 |
| Total | 4 (100.0%) | $0 |
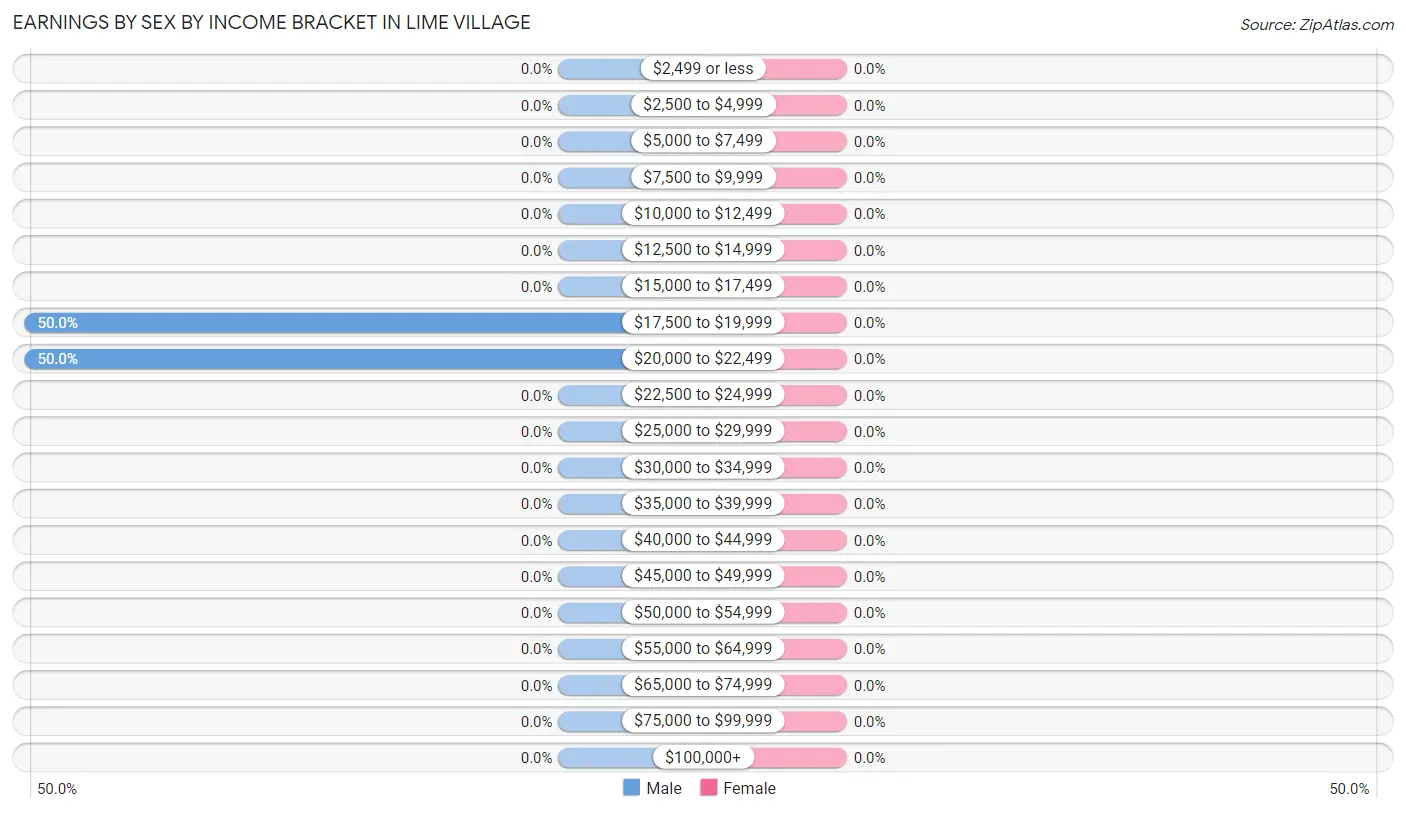
Earnings by Sex by Income Bracket in Lime Village
| Income | Male | Female |
| $2,499 or less | 0 (0.0%) | 0 (0.0%) |
| $2,500 to $4,999 | 0 (0.0%) | 0 (0.0%) |
| $5,000 to $7,499 | 0 (0.0%) | 0 (0.0%) |
| $7,500 to $9,999 | 0 (0.0%) | 0 (0.0%) |
| $10,000 to $12,499 | 0 (0.0%) | 0 (0.0%) |
| $12,500 to $14,999 | 0 (0.0%) | 0 (0.0%) |
| $15,000 to $17,499 | 0 (0.0%) | 0 (0.0%) |
| $17,500 to $19,999 | 2 (50.0%) | 0 (0.0%) |
| $20,000 to $22,499 | 2 (50.0%) | 0 (0.0%) |
| $22,500 to $24,999 | 0 (0.0%) | 0 (0.0%) |
| $25,000 to $29,999 | 0 (0.0%) | 0 (0.0%) |
| $30,000 to $34,999 | 0 (0.0%) | 0 (0.0%) |
| $35,000 to $39,999 | 0 (0.0%) | 0 (0.0%) |
| $40,000 to $44,999 | 0 (0.0%) | 0 (0.0%) |
| $45,000 to $49,999 | 0 (0.0%) | 0 (0.0%) |
| $50,000 to $54,999 | 0 (0.0%) | 0 (0.0%) |
| $55,000 to $64,999 | 0 (0.0%) | 0 (0.0%) |
| $65,000 to $74,999 | 0 (0.0%) | 0 (0.0%) |
| $75,000 to $99,999 | 0 (0.0%) | 0 (0.0%) |
| $100,000+ | 0 (0.0%) | 0 (0.0%) |
| Total | 4 (100.0%) | 0 (0.0%) |
Earnings by Sex by Educational Attainment in Lime Village
| Educational Attainment | Male Income | Female Income |
| Less than High School | - | - |
| High School Diploma | - | - |
| College or Associate's Degree | - | - |
| Bachelor's Degree | - | - |
| Graduate Degree | - | - |
| Total | - | - |
Family Income in Lime Village
Family Income Brackets in Lime Village
According to the Lime Village family income data, there are 2 families falling into the $35,000 to $49,999 income range, which is the most common income bracket and makes up 100.0% of all families.
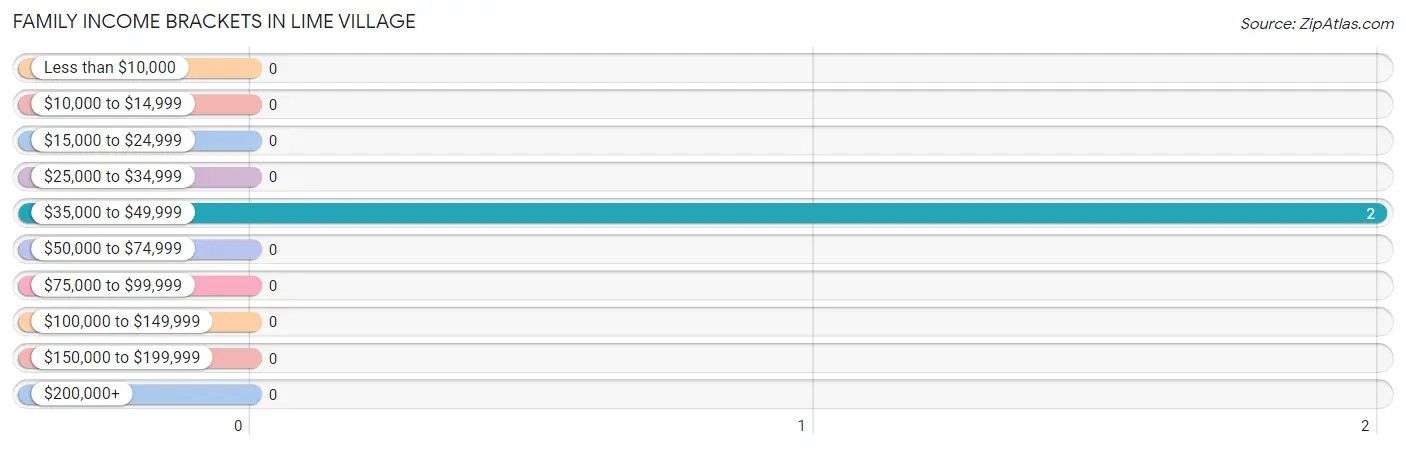
| Income Bracket | # Families | % Families |
| Less than $10,000 | 0 | 0.0% |
| $10,000 to $14,999 | 0 | 0.0% |
| $15,000 to $24,999 | 0 | 0.0% |
| $25,000 to $34,999 | 0 | 0.0% |
| $35,000 to $49,999 | 2 | 100.0% |
| $50,000 to $74,999 | 0 | 0.0% |
| $75,000 to $99,999 | 0 | 0.0% |
| $100,000 to $149,999 | 0 | 0.0% |
| $150,000 to $199,999 | 0 | 0.0% |
| $200,000+ | 0 | 0.0% |
Family Income by Famaliy Size in Lime Village
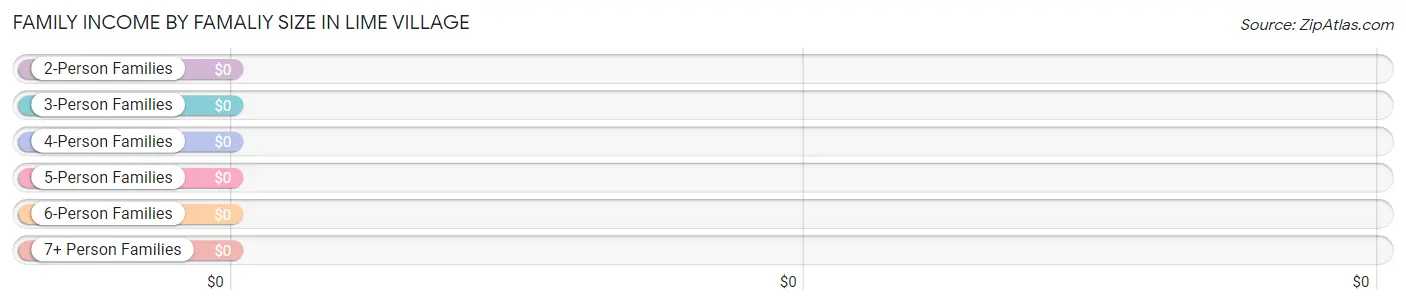
| Income Bracket | # Families | Median Income |
| 2-Person Families | 0 (0.0%) | $0 |
| 3-Person Families | 2 (100.0%) | $0 |
| 4-Person Families | 0 (0.0%) | $0 |
| 5-Person Families | 0 (0.0%) | $0 |
| 6-Person Families | 0 (0.0%) | $0 |
| 7+ Person Families | 0 (0.0%) | $0 |
| Total | 2 (100.0%) | $0 |
Family Income by Number of Earners in Lime Village
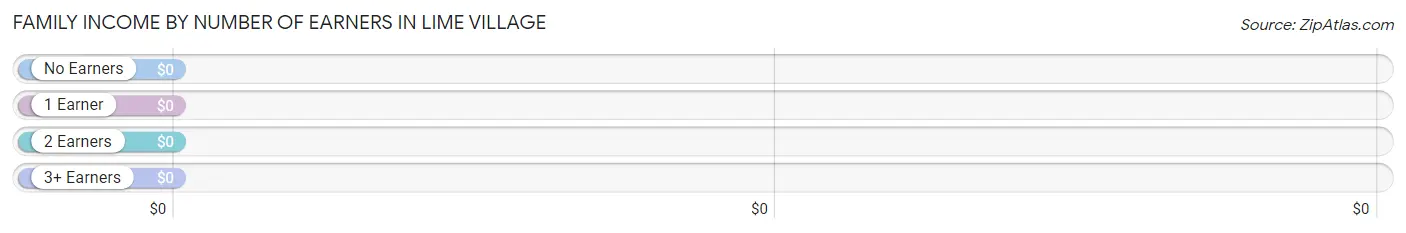
| Number of Earners | # Families | Median Income |
| No Earners | 0 (0.0%) | $0 |
| 1 Earner | 2 (100.0%) | $0 |
| 2 Earners | 0 (0.0%) | $0 |
| 3+ Earners | 0 (0.0%) | $0 |
| Total | 2 (100.0%) | $0 |
Household Income in Lime Village
Household Income Brackets in Lime Village
With 2 households falling in the category, the $15,000 to $24,999 income range is the most frequent in Lime Village, accounting for 50.0% of all households.
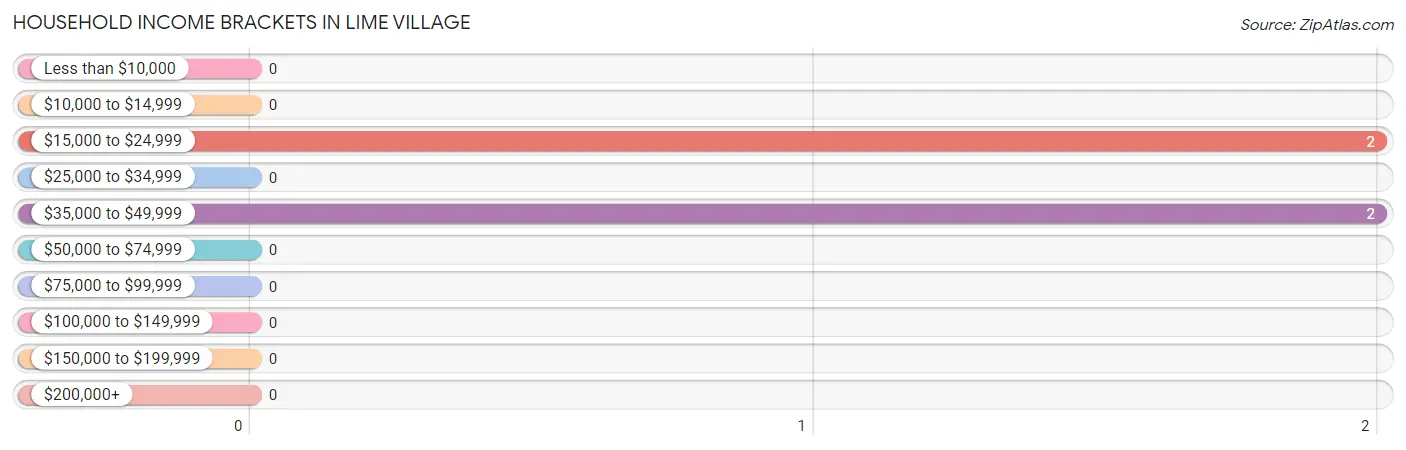
| Income Bracket | # Households | % Households |
| Less than $10,000 | 0 | 0.0% |
| $10,000 to $14,999 | 0 | 0.0% |
| $15,000 to $24,999 | 2 | 50.0% |
| $25,000 to $34,999 | 0 | 0.0% |
| $35,000 to $49,999 | 2 | 50.0% |
| $50,000 to $74,999 | 0 | 0.0% |
| $75,000 to $99,999 | 0 | 0.0% |
| $100,000 to $149,999 | 0 | 0.0% |
| $150,000 to $199,999 | 0 | 0.0% |
| $200,000+ | 0 | 0.0% |
Household Income by Householder Age in Lime Village
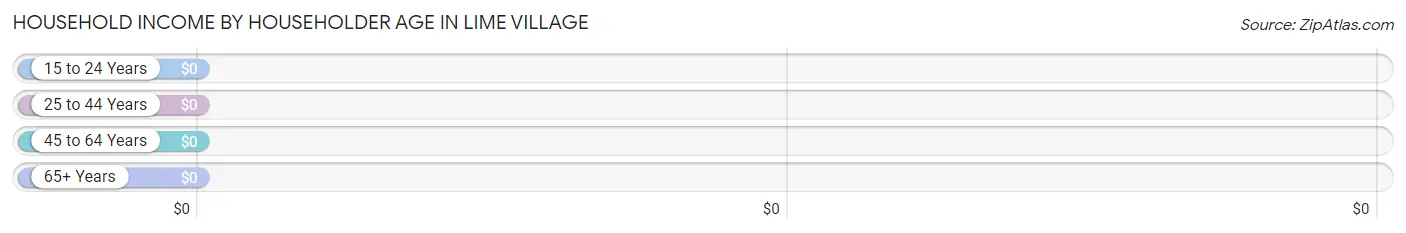
| Income Bracket | # Households | Median Income |
| 15 to 24 Years | 2 (50.0%) | $0 |
| 25 to 44 Years | 0 (0.0%) | $0 |
| 45 to 64 Years | 0 (0.0%) | $0 |
| 65+ Years | 2 (50.0%) | $0 |
| Total | 4 (100.0%) | $0 |
Poverty in Lime Village
Income Below Poverty by Sex and Age in Lime Village
| Age Bracket | Male | Female |
| Under 5 Years | 0 (0.0%) | 0 (0.0%) |
| 5 Years | 0 (0.0%) | 0 (0.0%) |
| 6 to 11 Years | 0 (0.0%) | 0 (0.0%) |
| 12 to 14 Years | 0 (0.0%) | 0 (0.0%) |
| 15 Years | 0 (0.0%) | 0 (0.0%) |
| 16 and 17 Years | 0 (0.0%) | 0 (0.0%) |
| 18 to 24 Years | 0 (0.0%) | 0 (0.0%) |
| 25 to 34 Years | 0 (0.0%) | 0 (0.0%) |
| 35 to 44 Years | 0 (0.0%) | 0 (0.0%) |
| 45 to 54 Years | 0 (0.0%) | 0 (0.0%) |
| 55 to 64 Years | 0 (0.0%) | 0 (0.0%) |
| 65 to 74 Years | 0 (0.0%) | 0 (0.0%) |
| 75 Years and over | 0 (0.0%) | 0 (0.0%) |
| Total | 0 (0.0%) | 0 (0.0%) |
Income Above Poverty by Sex and Age in Lime Village
According to the poverty statistics in Lime Village, males aged 18 to 24 years and females aged 45 to 54 years are the age groups that are most secure financially, with 100.0% of males and 100.0% of females in these age groups living above the poverty line.
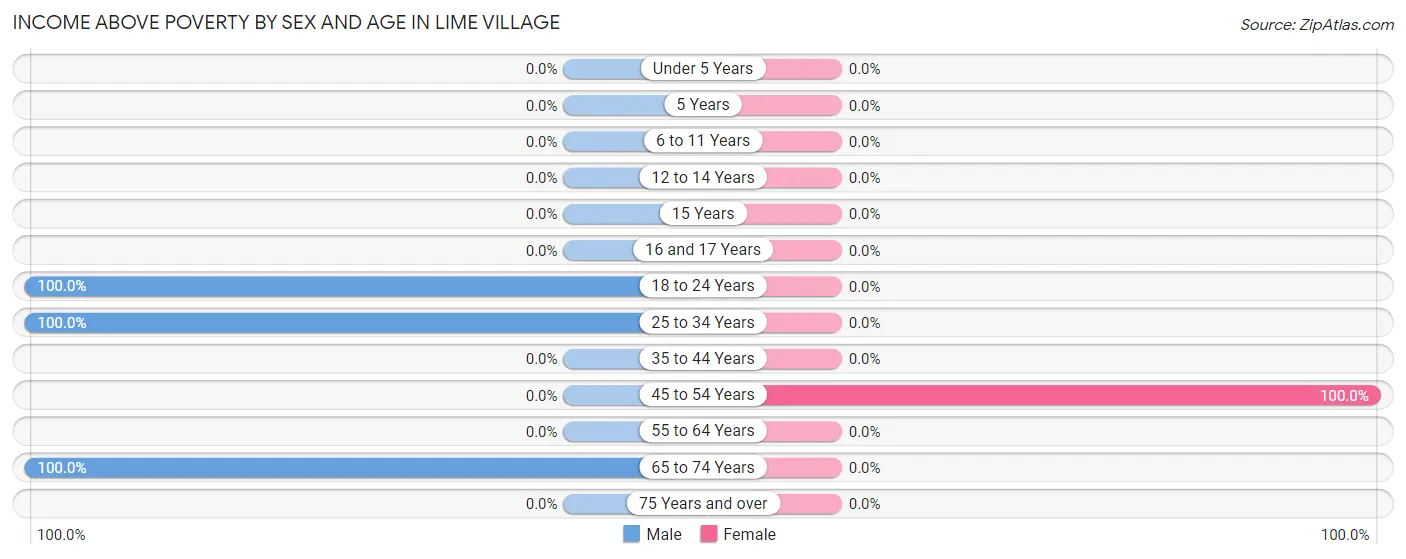
| Age Bracket | Male | Female |
| Under 5 Years | 0 (0.0%) | 0 (0.0%) |
| 5 Years | 0 (0.0%) | 0 (0.0%) |
| 6 to 11 Years | 0 (0.0%) | 0 (0.0%) |
| 12 to 14 Years | 0 (0.0%) | 0 (0.0%) |
| 15 Years | 0 (0.0%) | 0 (0.0%) |
| 16 and 17 Years | 0 (0.0%) | 0 (0.0%) |
| 18 to 24 Years | 2 (100.0%) | 0 (0.0%) |
| 25 to 34 Years | 2 (100.0%) | 0 (0.0%) |
| 35 to 44 Years | 0 (0.0%) | 0 (0.0%) |
| 45 to 54 Years | 0 (0.0%) | 3 (100.0%) |
| 55 to 64 Years | 0 (0.0%) | 0 (0.0%) |
| 65 to 74 Years | 2 (100.0%) | 0 (0.0%) |
| 75 Years and over | 0 (0.0%) | 0 (0.0%) |
| Total | 6 (100.0%) | 3 (100.0%) |
Income Below Poverty Among Married-Couple Families in Lime Village
| Children | Above Poverty | Below Poverty |
| No Children | 2 (100.0%) | 0 (0.0%) |
| 1 or 2 Children | 0 (0.0%) | 0 (0.0%) |
| 3 or 4 Children | 0 (0.0%) | 0 (0.0%) |
| 5 or more Children | 0 (0.0%) | 0 (0.0%) |
| Total | 2 (100.0%) | 0 (0.0%) |
Income Below Poverty Among Single-Parent Households in Lime Village
| Children | Single Father | Single Mother |
| No Children | 0 (0.0%) | 0 (0.0%) |
| 1 or 2 Children | 0 (0.0%) | 0 (0.0%) |
| 3 or 4 Children | 0 (0.0%) | 0 (0.0%) |
| 5 or more Children | 0 (0.0%) | 0 (0.0%) |
| Total | 0 (0.0%) | 0 (0.0%) |
Income Below Poverty Among Married-Couple vs Single-Parent Households in Lime Village
| Children | Married-Couple Families | Single-Parent Households |
| No Children | 0 (0.0%) | 0 (0.0%) |
| 1 or 2 Children | 0 (0.0%) | 0 (0.0%) |
| 3 or 4 Children | 0 (0.0%) | 0 (0.0%) |
| 5 or more Children | 0 (0.0%) | 0 (0.0%) |
| Total | 0 (0.0%) | 0 (0.0%) |
Race in Lime Village
The most populous races in Lime Village are Native / Alaskan (7 | 77.8%), and Two or more Races (2 | 22.2%).
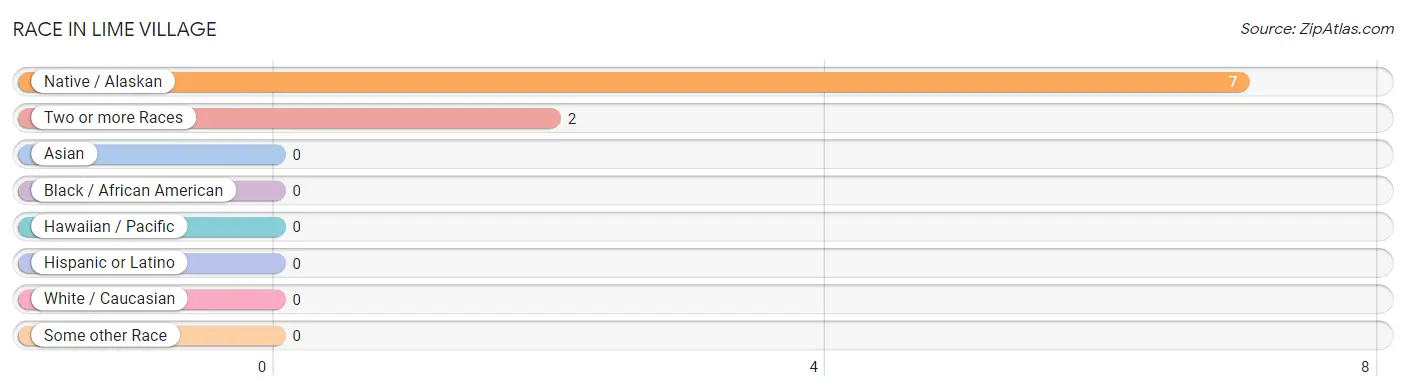
| Race | # Population | % Population |
| Asian | 0 | 0.0% |
| Black / African American | 0 | 0.0% |
| Hawaiian / Pacific | 0 | 0.0% |
| Hispanic or Latino | 0 | 0.0% |
| Native / Alaskan | 7 | 77.8% |
| White / Caucasian | 0 | 0.0% |
| Two or more Races | 2 | 22.2% |
| Some other Race | 0 | 0.0% |
| Total | 9 | 100.0% |
Ancestry in Lime Village
The most populous ancestries reported in Lime Village are Aleut (7 | 77.8%), and Alaskan Athabascan (2 | 22.2%), together accounting for 100.0% of all Lime Village residents.
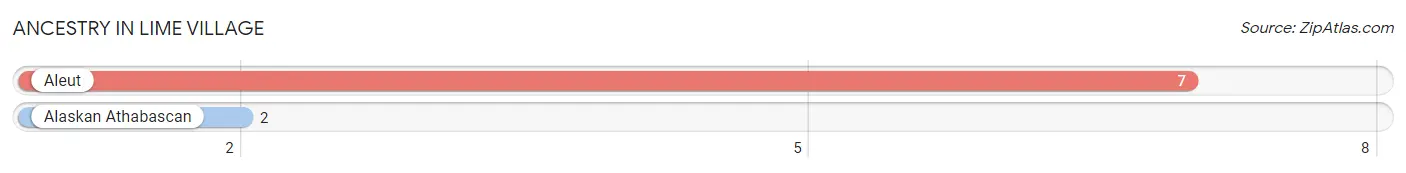
| Ancestry | # Population | % Population |
| Alaskan Athabascan | 2 | 22.2% |
| Aleut | 7 | 77.8% | View All 2 Rows |
Immigrants in Lime Village

| Immigration Origin | # Population | % Population | View All 0 Rows |
Sex and Age in Lime Village
Sex and Age in Lime Village
The most populous age groups in Lime Village are 20 to 24 Years (2 | 33.3%) for men and 50 to 54 Years (3 | 100.0%) for women.
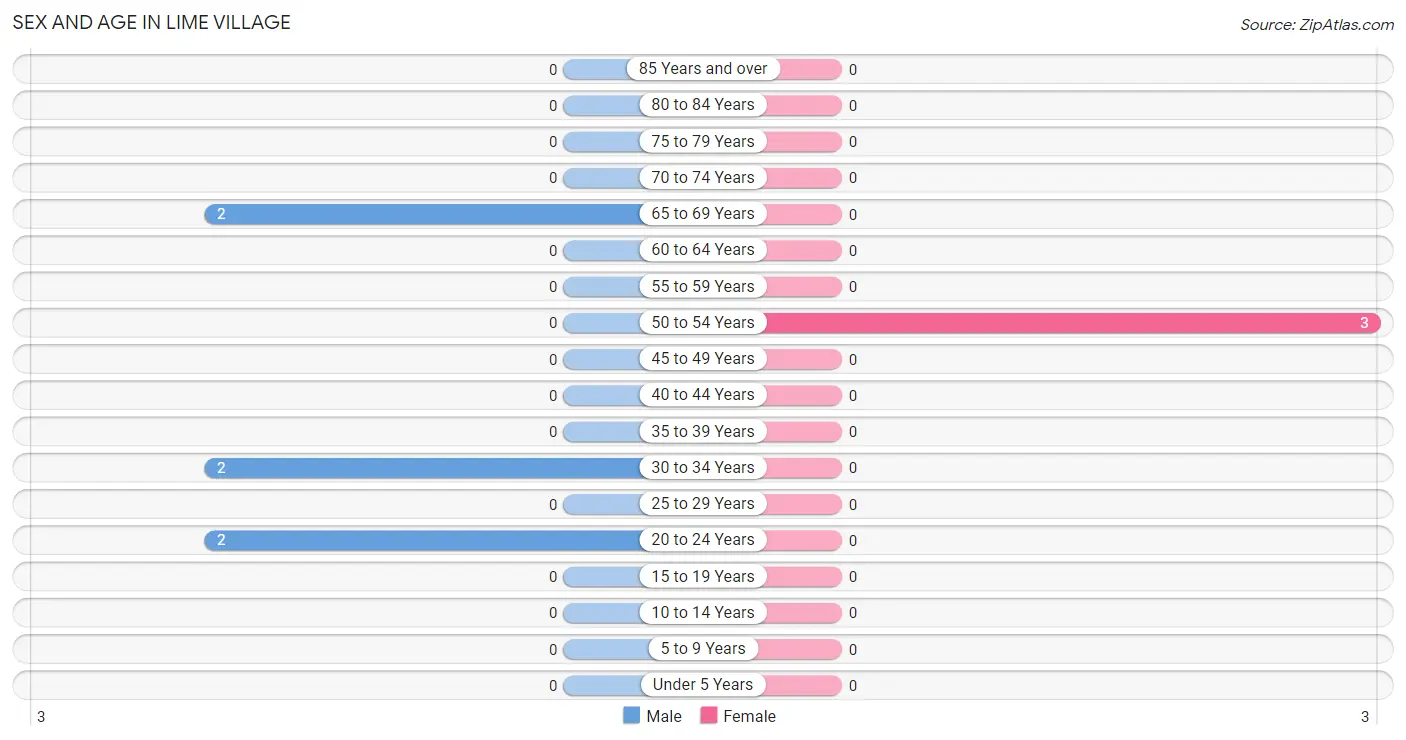
| Age Bracket | Male | Female |
| Under 5 Years | 0 (0.0%) | 0 (0.0%) |
| 5 to 9 Years | 0 (0.0%) | 0 (0.0%) |
| 10 to 14 Years | 0 (0.0%) | 0 (0.0%) |
| 15 to 19 Years | 0 (0.0%) | 0 (0.0%) |
| 20 to 24 Years | 2 (33.3%) | 0 (0.0%) |
| 25 to 29 Years | 0 (0.0%) | 0 (0.0%) |
| 30 to 34 Years | 2 (33.3%) | 0 (0.0%) |
| 35 to 39 Years | 0 (0.0%) | 0 (0.0%) |
| 40 to 44 Years | 0 (0.0%) | 0 (0.0%) |
| 45 to 49 Years | 0 (0.0%) | 0 (0.0%) |
| 50 to 54 Years | 0 (0.0%) | 3 (100.0%) |
| 55 to 59 Years | 0 (0.0%) | 0 (0.0%) |
| 60 to 64 Years | 0 (0.0%) | 0 (0.0%) |
| 65 to 69 Years | 2 (33.3%) | 0 (0.0%) |
| 70 to 74 Years | 0 (0.0%) | 0 (0.0%) |
| 75 to 79 Years | 0 (0.0%) | 0 (0.0%) |
| 80 to 84 Years | 0 (0.0%) | 0 (0.0%) |
| 85 Years and over | 0 (0.0%) | 0 (0.0%) |
| Total | 6 (100.0%) | 3 (100.0%) |
Families and Households in Lime Village
Median Family Size in Lime Village
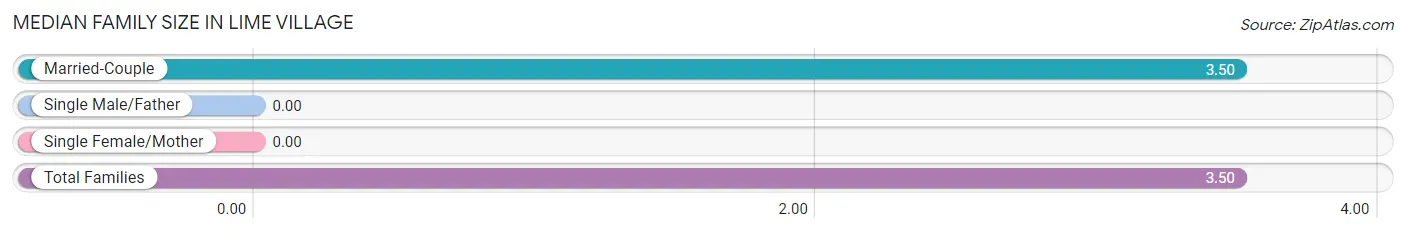
| Family Type | # Families | Family Size |
| Married-Couple | 2 (100.0%) | 3.50 |
| Single Male/Father | 0 (0.0%) | - |
| Single Female/Mother | 0 (0.0%) | - |
| Total Families | 2 (100.0%) | 3.50 |
Median Household Size in Lime Village
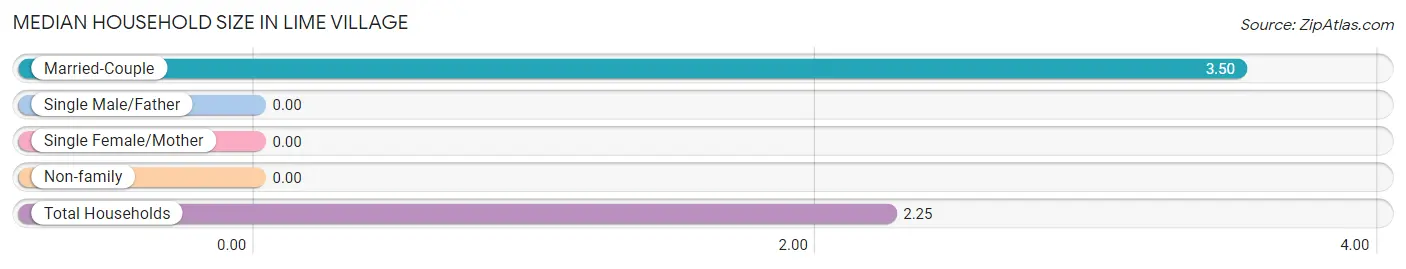
| Household Type | # Households | Household Size |
| Married-Couple | 2 (50.0%) | 3.50 |
| Single Male/Father | 0 (0.0%) | - |
| Single Female/Mother | 0 (0.0%) | - |
| Non-family | 2 (50.0%) | - |
| Total Households | 4 (100.0%) | 2.25 |
Household Size by Marriage Status in Lime Village
Out of a total of 4 households in Lime Village, 2 (50.0%) are family households, while 2 (50.0%) are nonfamily households. The most numerous type of family households are 3-person households, comprising 2, and the most common type of nonfamily households are 1-person households, comprising 2.
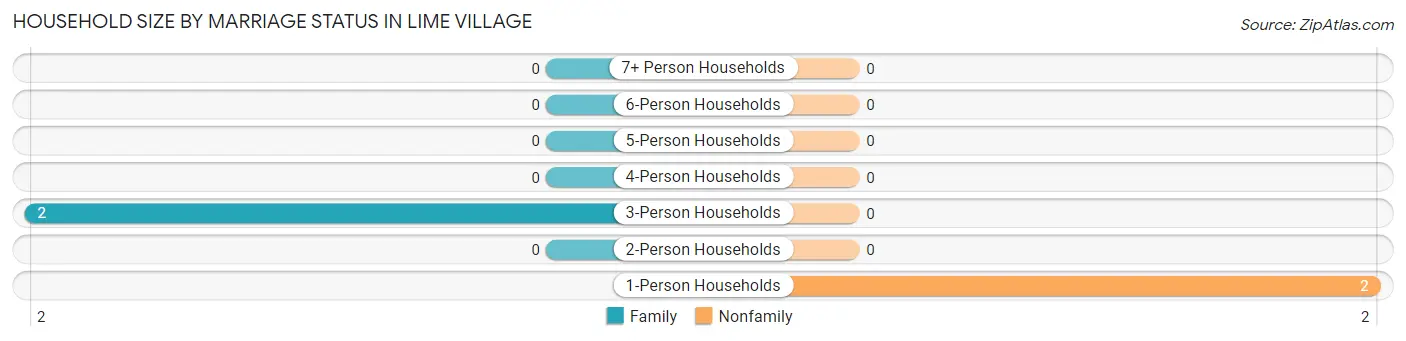
| Household Size | Family Households | Nonfamily Households |
| 1-Person Households | - | 2 (50.0%) |
| 2-Person Households | 0 (0.0%) | 0 (0.0%) |
| 3-Person Households | 2 (50.0%) | 0 (0.0%) |
| 4-Person Households | 0 (0.0%) | 0 (0.0%) |
| 5-Person Households | 0 (0.0%) | 0 (0.0%) |
| 6-Person Households | 0 (0.0%) | 0 (0.0%) |
| 7+ Person Households | 0 (0.0%) | 0 (0.0%) |
| Total | 2 (50.0%) | 2 (50.0%) |
Female Fertility in Lime Village
Fertility by Age in Lime Village
| Age Bracket | Women with Births | Births / 1,000 Women |
| 15 to 19 years | 0 (0.0%) | 0.0 |
| 20 to 34 years | 0 (0.0%) | 0.0 |
| 35 to 50 years | 0 (0.0%) | 0.0 |
| Total | 0 (0.0%) | 0.0 |
Fertility by Age by Marriage Status in Lime Village
| Age Bracket | Married | Unmarried |
| 15 to 19 years | 0 (0.0%) | 0 (0.0%) |
| 20 to 34 years | 0 (0.0%) | 0 (0.0%) |
| 35 to 50 years | 0 (0.0%) | 0 (0.0%) |
| Total | 0 (0.0%) | 0 (0.0%) |
Fertility by Education in Lime Village
| Educational Attainment | Women with Births | Births / 1,000 Women |
| Less than High School | 0 (0.0%) | 0.0 |
| High School Diploma | 0 (0.0%) | 0.0 |
| College or Associate's Degree | 0 (0.0%) | 0.0 |
| Bachelor's Degree | 0 (0.0%) | 0.0 |
| Graduate Degree | 0 (0.0%) | 0.0 |
| Total | 0 (0.0%) | 0.0 |
Fertility by Education by Marriage Status in Lime Village
| Educational Attainment | Married | Unmarried |
| Less than High School | 0 (0.0%) | 0 (0.0%) |
| High School Diploma | 0 (0.0%) | 0 (0.0%) |
| College or Associate's Degree | 0 (0.0%) | 0 (0.0%) |
| Bachelor's Degree | 0 (0.0%) | 0 (0.0%) |
| Graduate Degree | 0 (0.0%) | 0 (0.0%) |
| Total | 0 (0.0%) | 0 (0.0%) |
Employment Characteristics in Lime Village
Employment by Class of Employer in Lime Village
Among the 2 employed individuals in Lime Village, , and local government employees (2 | 100.0%) make up the most common classes of employment.
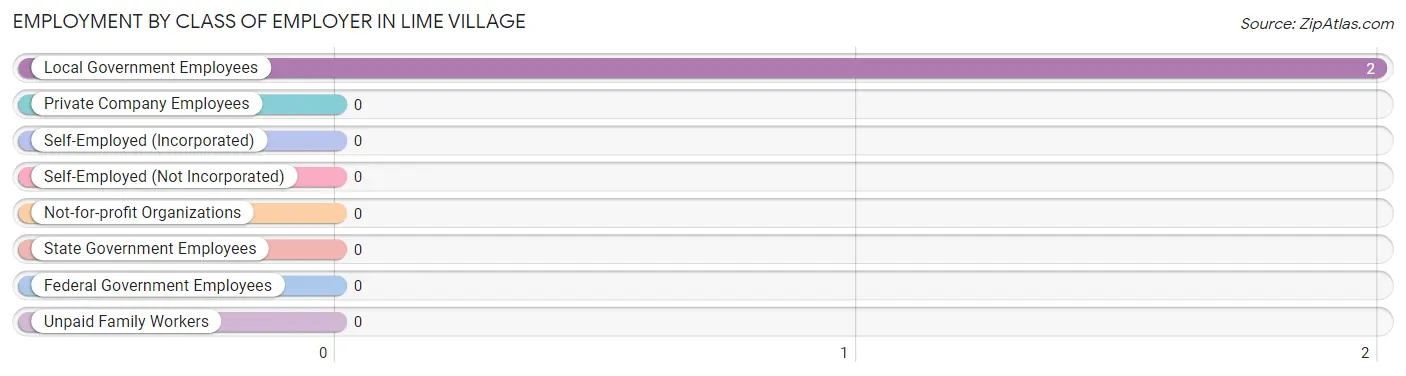
| Employer Class | # Employees | % Employees |
| Private Company Employees | 0 | 0.0% |
| Self-Employed (Incorporated) | 0 | 0.0% |
| Self-Employed (Not Incorporated) | 0 | 0.0% |
| Not-for-profit Organizations | 0 | 0.0% |
| Local Government Employees | 2 | 100.0% |
| State Government Employees | 0 | 0.0% |
| Federal Government Employees | 0 | 0.0% |
| Unpaid Family Workers | 0 | 0.0% |
| Total | 2 | 100.0% |
Employment Status by Age in Lime Village
According to the labor force statistics for Lime Village, out of the total population over 16 years of age (9), 44.4% or 4 individuals are in the labor force, with 50.0% or 2 of them unemployed. The age group with the highest labor force participation rate is 20 to 24 years, with 100.0% or 2 individuals in the labor force. Within the labor force, the 20 to 24 years age range has the highest percentage of unemployed individuals, with 100.0% or 2 of them being unemployed.
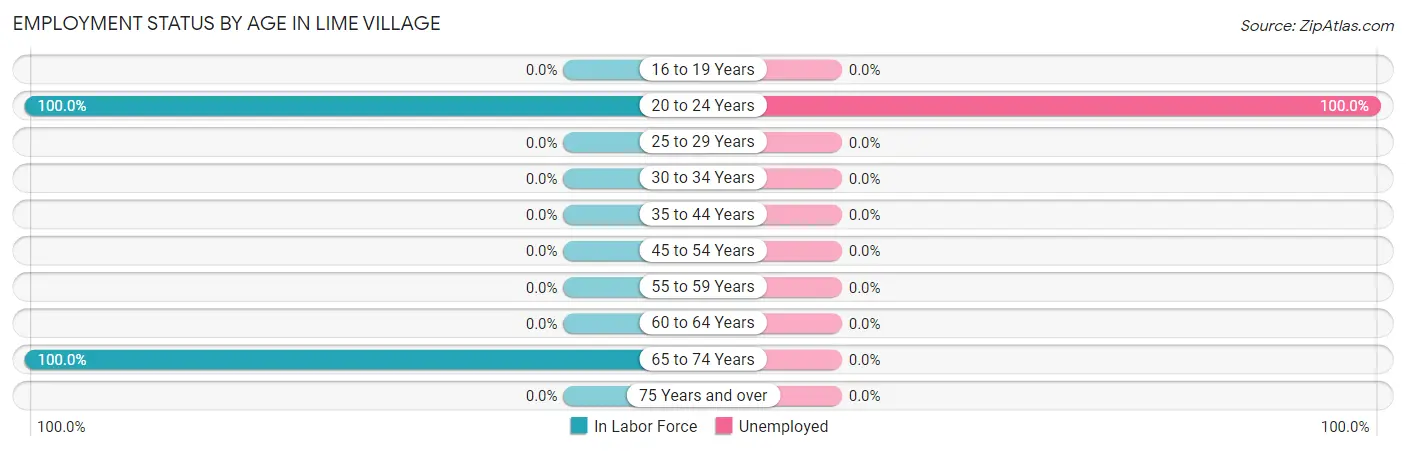
| Age Bracket | In Labor Force | Unemployed |
| 16 to 19 Years | 0 (0.0%) | 0 (0.0%) |
| 20 to 24 Years | 2 (100.0%) | 2 (100.0%) |
| 25 to 29 Years | 0 (0.0%) | 0 (0.0%) |
| 30 to 34 Years | 0 (0.0%) | 0 (0.0%) |
| 35 to 44 Years | 0 (0.0%) | 0 (0.0%) |
| 45 to 54 Years | 0 (0.0%) | 0 (0.0%) |
| 55 to 59 Years | 0 (0.0%) | 0 (0.0%) |
| 60 to 64 Years | 0 (0.0%) | 0 (0.0%) |
| 65 to 74 Years | 2 (100.0%) | 0 (0.0%) |
| 75 Years and over | 0 (0.0%) | 0 (0.0%) |
| Total | 4 (44.4%) | 2 (50.0%) |
Employment Status by Educational Attainment in Lime Village
| Educational Attainment | In Labor Force | Unemployed |
| Less than High School | 0 (0.0%) | 0 (0.0%) |
| High School Diploma | 0 (0.0%) | 0 (0.0%) |
| College / Associate Degree | 0 (0.0%) | 0 (0.0%) |
| Bachelor's Degree or higher | 0 (0.0%) | 0 (0.0%) |
| Total | 0 (0.0%) | 0 (0.0%) |
Employment Occupations by Sex in Lime Village
Management, Business, Science and Arts Occupations
Management, Business, Science and Arts Occupations by Sex
| Occupation | Male | Female |
| Management | 0 (0.0%) | 0 (0.0%) |
| Business & Financial | 0 (0.0%) | 0 (0.0%) |
| Computers, Engineering & Science | 0 (0.0%) | 0 (0.0%) |
| Computers & Mathematics | 0 (0.0%) | 0 (0.0%) |
| Architecture & Engineering | 0 (0.0%) | 0 (0.0%) |
| Life, Physical & Social Science | 0 (0.0%) | 0 (0.0%) |
| Community & Social Service | 0 (0.0%) | 0 (0.0%) |
| Education, Arts & Media | 0 (0.0%) | 0 (0.0%) |
| Legal Services & Support | 0 (0.0%) | 0 (0.0%) |
| Education Instruction & Library | 0 (0.0%) | 0 (0.0%) |
| Arts, Media & Entertainment | 0 (0.0%) | 0 (0.0%) |
| Health Diagnosing & Treating | 0 (0.0%) | 0 (0.0%) |
| Health Technologists | 0 (0.0%) | 0 (0.0%) |
| Total (Category) | 0 (0.0%) | 0 (0.0%) |
| Total (Overall) | 2 (100.0%) | 0 (0.0%) |
Services Occupations
Services Occupations by Sex
| Occupation | Male | Female |
| Healthcare Support | 0 (0.0%) | 0 (0.0%) |
| Security & Protection | 0 (0.0%) | 0 (0.0%) |
| Firefighting & Prevention | 0 (0.0%) | 0 (0.0%) |
| Law Enforcement | 0 (0.0%) | 0 (0.0%) |
| Food Preparation & Serving | 0 (0.0%) | 0 (0.0%) |
| Cleaning & Maintenance | 0 (0.0%) | 0 (0.0%) |
| Personal Care & Service | 0 (0.0%) | 0 (0.0%) |
| Total (Category) | 0 (0.0%) | 0 (0.0%) |
| Total (Overall) | 2 (100.0%) | 0 (0.0%) |
Sales and Office Occupations
Sales and Office Occupations by Sex
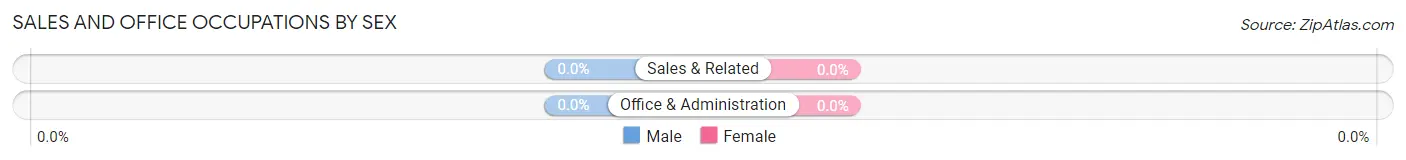
| Occupation | Male | Female |
| Sales & Related | 0 (0.0%) | 0 (0.0%) |
| Office & Administration | 0 (0.0%) | 0 (0.0%) |
| Total (Category) | 0 (0.0%) | 0 (0.0%) |
| Total (Overall) | 2 (100.0%) | 0 (0.0%) |
Natural Resources, Construction and Maintenance Occupations
Natural Resources, Construction and Maintenance Occupations by Sex
| Occupation | Male | Female |
| Farming, Fishing & Forestry | 0 (0.0%) | 0 (0.0%) |
| Construction & Extraction | 0 (0.0%) | 0 (0.0%) |
| Installation, Maintenance & Repair | 0 (0.0%) | 0 (0.0%) |
| Total (Category) | 0 (0.0%) | 0 (0.0%) |
| Total (Overall) | 2 (100.0%) | 0 (0.0%) |
Production, Transportation and Moving Occupations
The most common Production, Transportation and Moving occupations in Lime Village are , and Transportation (2 | 100.0%).
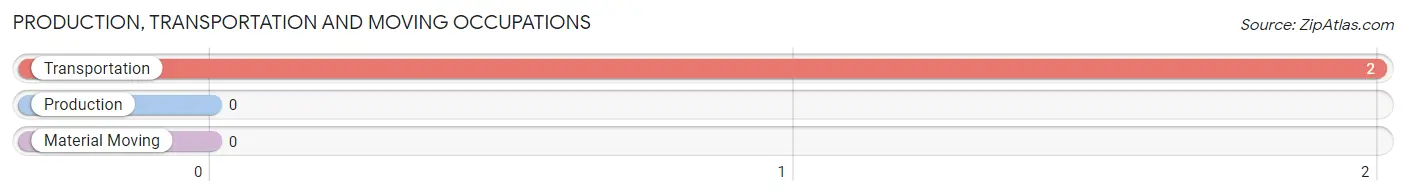
Production, Transportation and Moving Occupations by Sex
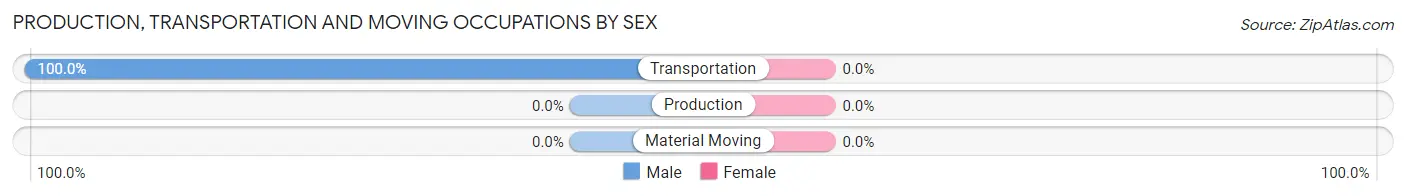
| Occupation | Male | Female |
| Production | 0 (0.0%) | 0 (0.0%) |
| Transportation | 2 (100.0%) | 0 (0.0%) |
| Material Moving | 0 (0.0%) | 0 (0.0%) |
| Total (Category) | 2 (100.0%) | 0 (0.0%) |
| Total (Overall) | 2 (100.0%) | 0 (0.0%) |
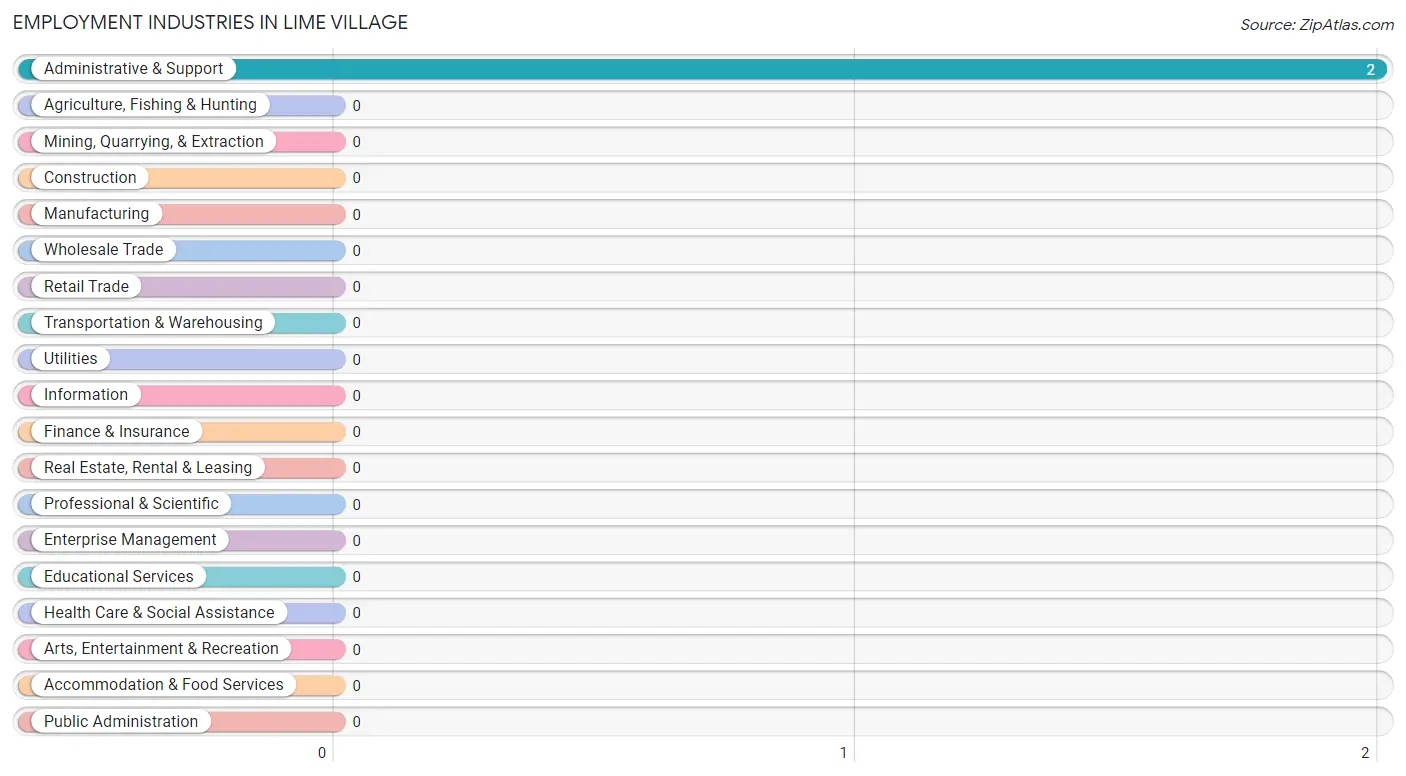
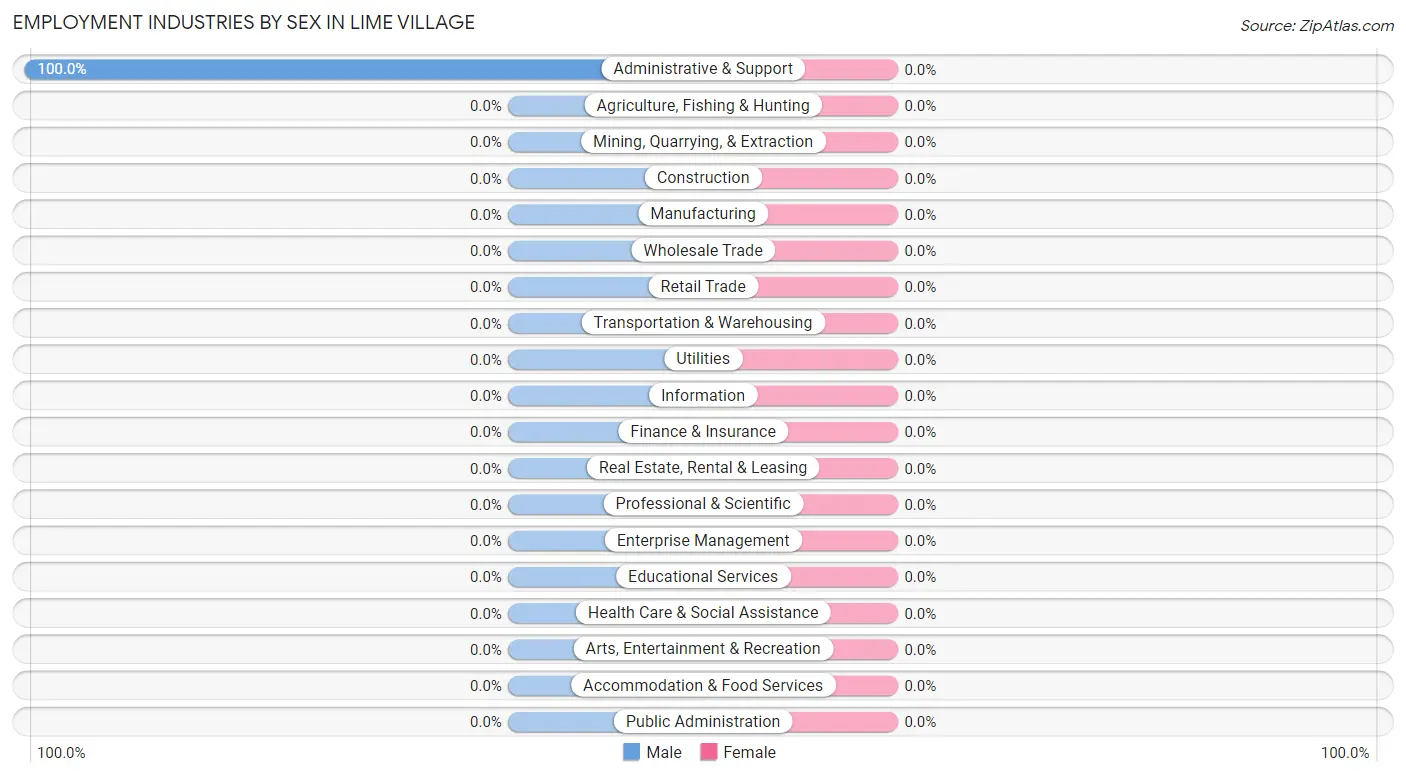
Employment Industries by Sex in Lime Village
Employment Industries in Lime Village
The major employment industries in Lime Village include , and Administrative & Support (2 | 100.0%).
Employment Industries by Sex in Lime Village
| Industry | Male | Female |
| Agriculture, Fishing & Hunting | 0 (0.0%) | 0 (0.0%) |
| Mining, Quarrying, & Extraction | 0 (0.0%) | 0 (0.0%) |
| Construction | 0 (0.0%) | 0 (0.0%) |
| Manufacturing | 0 (0.0%) | 0 (0.0%) |
| Wholesale Trade | 0 (0.0%) | 0 (0.0%) |
| Retail Trade | 0 (0.0%) | 0 (0.0%) |
| Transportation & Warehousing | 0 (0.0%) | 0 (0.0%) |
| Utilities | 0 (0.0%) | 0 (0.0%) |
| Information | 0 (0.0%) | 0 (0.0%) |
| Finance & Insurance | 0 (0.0%) | 0 (0.0%) |
| Real Estate, Rental & Leasing | 0 (0.0%) | 0 (0.0%) |
| Professional & Scientific | 0 (0.0%) | 0 (0.0%) |
| Enterprise Management | 0 (0.0%) | 0 (0.0%) |
| Administrative & Support | 2 (100.0%) | 0 (0.0%) |
| Educational Services | 0 (0.0%) | 0 (0.0%) |
| Health Care & Social Assistance | 0 (0.0%) | 0 (0.0%) |
| Arts, Entertainment & Recreation | 0 (0.0%) | 0 (0.0%) |
| Accommodation & Food Services | 0 (0.0%) | 0 (0.0%) |
| Public Administration | 0 (0.0%) | 0 (0.0%) |
| Total | 2 (100.0%) | 0 (0.0%) |
Education in Lime Village
School Enrollment in Lime Village
| School Level | # Students | % Students |
| Nursery / Preschool | 0 | 0.0% |
| Kindergarten | 0 | 0.0% |
| Elementary School | 0 | 0.0% |
| Middle School | 0 | 0.0% |
| High School | 0 | 0.0% |
| College / Undergraduate | 0 | 0.0% |
| Graduate / Professional | 0 | 0.0% |
| Total | 0 | 0.0% |
School Enrollment by Age by Funding Source in Lime Village
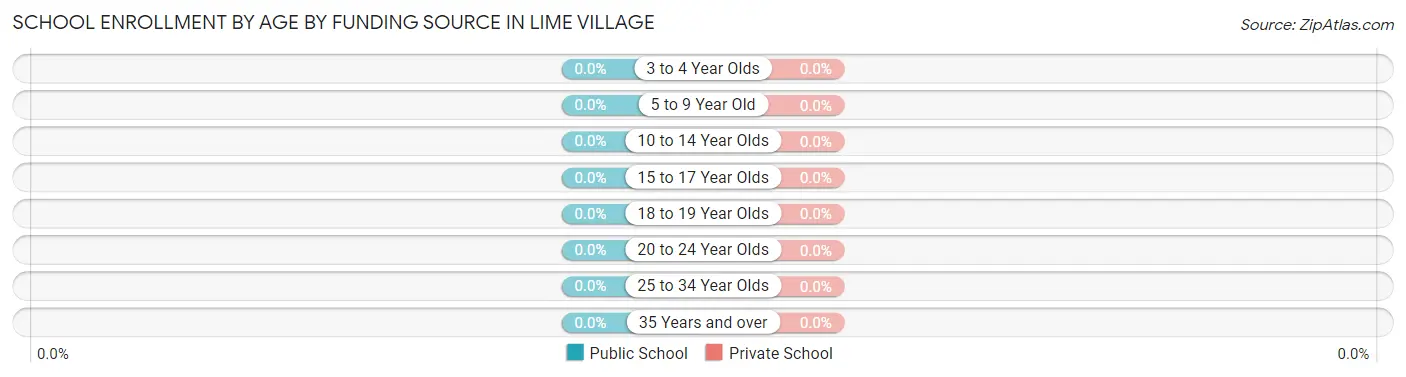
| Age Bracket | Public School | Private School |
| 3 to 4 Year Olds | 0 (0.0%) | 0 (0.0%) |
| 5 to 9 Year Old | 0 (0.0%) | 0 (0.0%) |
| 10 to 14 Year Olds | 0 (0.0%) | 0 (0.0%) |
| 15 to 17 Year Olds | 0 (0.0%) | 0 (0.0%) |
| 18 to 19 Year Olds | 0 (0.0%) | 0 (0.0%) |
| 20 to 24 Year Olds | 0 (0.0%) | 0 (0.0%) |
| 25 to 34 Year Olds | 0 (0.0%) | 0 (0.0%) |
| 35 Years and over | 0 (0.0%) | 0 (0.0%) |
| Total | 0 (0.0%) | 0 (0.0%) |
Educational Attainment by Field of Study in Lime Village
| Field of Study | # Graduates | % Graduates |
| Computers & Mathematics | 0 | 0.0% |
| Bio, Nature & Agricultural | 0 | 0.0% |
| Physical & Health Sciences | 0 | 0.0% |
| Psychology | 0 | 0.0% |
| Social Sciences | 0 | 0.0% |
| Engineering | 0 | 0.0% |
| Multidisciplinary Studies | 0 | 0.0% |
| Science & Technology | 0 | 0.0% |
| Business | 0 | 0.0% |
| Education | 0 | 0.0% |
| Literature & Languages | 0 | 0.0% |
| Liberal Arts & History | 0 | 0.0% |
| Visual & Performing Arts | 0 | 0.0% |
| Communications | 0 | 0.0% |
| Arts & Humanities | 0 | 0.0% |
| Total | 0 | 0.0% |
Transportation & Commute in Lime Village
Vehicle Availability by Sex in Lime Village
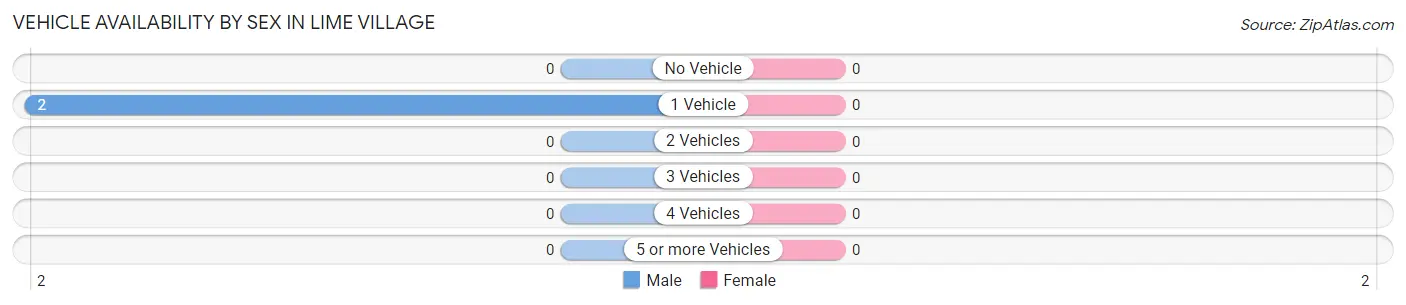
| Vehicles Available | Male | Female |
| No Vehicle | 0 (0.0%) | 0 (0.0%) |
| 1 Vehicle | 2 (100.0%) | 0 (0.0%) |
| 2 Vehicles | 0 (0.0%) | 0 (0.0%) |
| 3 Vehicles | 0 (0.0%) | 0 (0.0%) |
| 4 Vehicles | 0 (0.0%) | 0 (0.0%) |
| 5 or more Vehicles | 0 (0.0%) | 0 (0.0%) |
| Total | 2 (100.0%) | 0 (0.0%) |
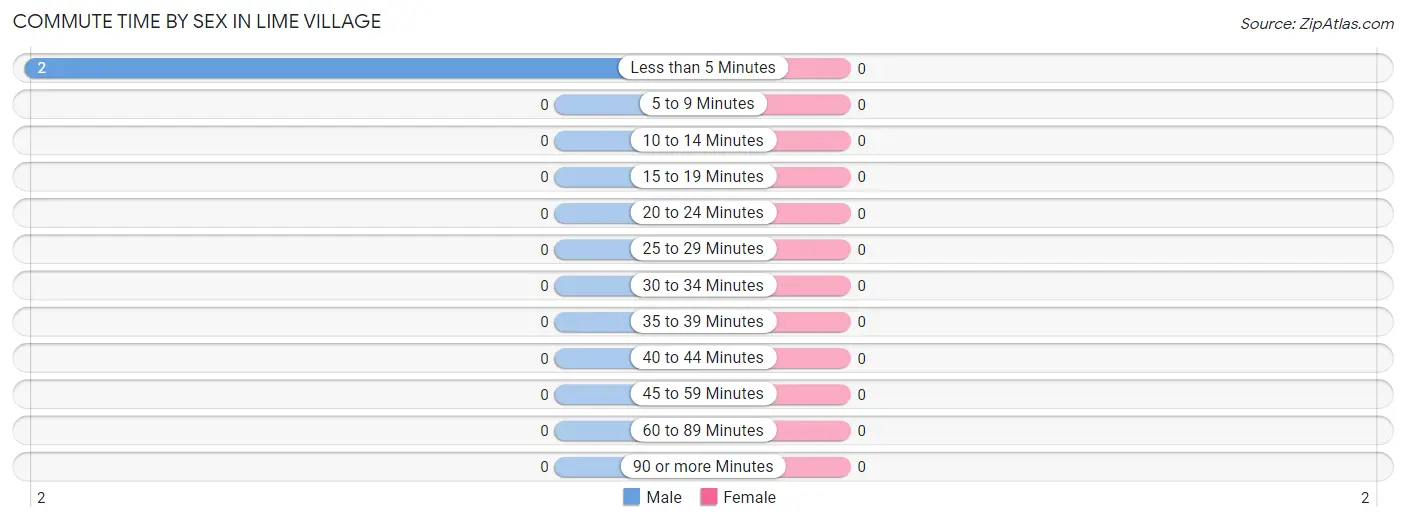
Commute Time in Lime Village
The most frequently occuring commute durations in Lime Village are less than 5 minutes (2 commuters, 100.0%), 5 to 9 minutes (0 commuters, 0.0%), and 10 to 14 minutes (0 commuters, 0.0%).
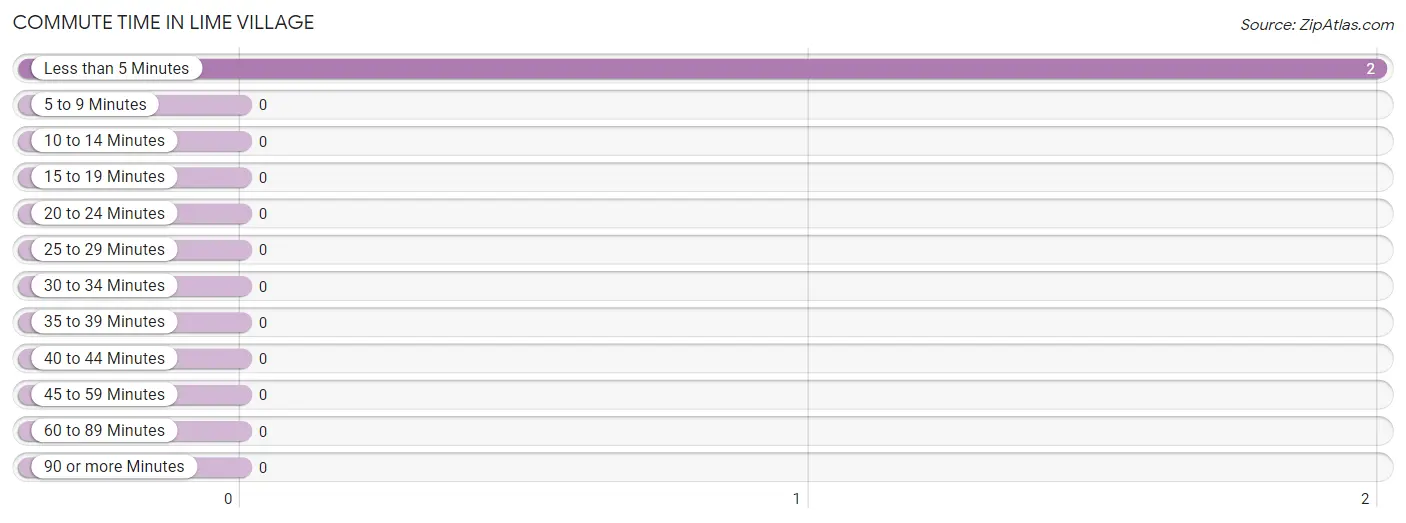
| Commute Time | # Commuters | % Commuters |
| Less than 5 Minutes | 2 | 100.0% |
| 5 to 9 Minutes | 0 | 0.0% |
| 10 to 14 Minutes | 0 | 0.0% |
| 15 to 19 Minutes | 0 | 0.0% |
| 20 to 24 Minutes | 0 | 0.0% |
| 25 to 29 Minutes | 0 | 0.0% |
| 30 to 34 Minutes | 0 | 0.0% |
| 35 to 39 Minutes | 0 | 0.0% |
| 40 to 44 Minutes | 0 | 0.0% |
| 45 to 59 Minutes | 0 | 0.0% |
| 60 to 89 Minutes | 0 | 0.0% |
| 90 or more Minutes | 0 | 0.0% |
Commute Time by Sex in Lime Village
| Commute Time | Male | Female |
| Less than 5 Minutes | 2 (100.0%) | 0 (0.0%) |
| 5 to 9 Minutes | 0 (0.0%) | 0 (0.0%) |
| 10 to 14 Minutes | 0 (0.0%) | 0 (0.0%) |
| 15 to 19 Minutes | 0 (0.0%) | 0 (0.0%) |
| 20 to 24 Minutes | 0 (0.0%) | 0 (0.0%) |
| 25 to 29 Minutes | 0 (0.0%) | 0 (0.0%) |
| 30 to 34 Minutes | 0 (0.0%) | 0 (0.0%) |
| 35 to 39 Minutes | 0 (0.0%) | 0 (0.0%) |
| 40 to 44 Minutes | 0 (0.0%) | 0 (0.0%) |
| 45 to 59 Minutes | 0 (0.0%) | 0 (0.0%) |
| 60 to 89 Minutes | 0 (0.0%) | 0 (0.0%) |
| 90 or more Minutes | 0 (0.0%) | 0 (0.0%) |
Time of Departure to Work by Sex in Lime Village
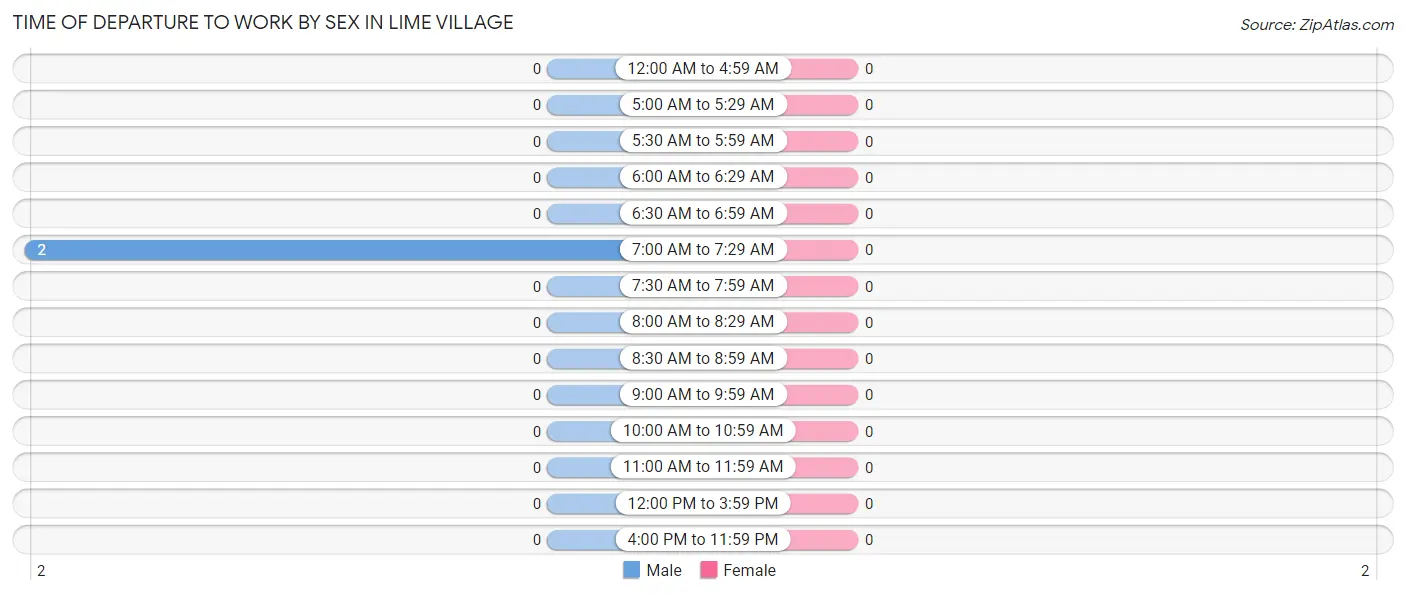
| Time of Departure | Male | Female |
| 12:00 AM to 4:59 AM | 0 (0.0%) | 0 (0.0%) |
| 5:00 AM to 5:29 AM | 0 (0.0%) | 0 (0.0%) |
| 5:30 AM to 5:59 AM | 0 (0.0%) | 0 (0.0%) |
| 6:00 AM to 6:29 AM | 0 (0.0%) | 0 (0.0%) |
| 6:30 AM to 6:59 AM | 0 (0.0%) | 0 (0.0%) |
| 7:00 AM to 7:29 AM | 2 (100.0%) | 0 (0.0%) |
| 7:30 AM to 7:59 AM | 0 (0.0%) | 0 (0.0%) |
| 8:00 AM to 8:29 AM | 0 (0.0%) | 0 (0.0%) |
| 8:30 AM to 8:59 AM | 0 (0.0%) | 0 (0.0%) |
| 9:00 AM to 9:59 AM | 0 (0.0%) | 0 (0.0%) |
| 10:00 AM to 10:59 AM | 0 (0.0%) | 0 (0.0%) |
| 11:00 AM to 11:59 AM | 0 (0.0%) | 0 (0.0%) |
| 12:00 PM to 3:59 PM | 0 (0.0%) | 0 (0.0%) |
| 4:00 PM to 11:59 PM | 0 (0.0%) | 0 (0.0%) |
| Total | 2 (100.0%) | 0 (0.0%) |
Housing Occupancy in Lime Village
Occupancy by Ownership in Lime Village
Of the total 4 dwellings in Lime Village, owner-occupied units account for 2 (50.0%), while renter-occupied units make up 2 (50.0%).
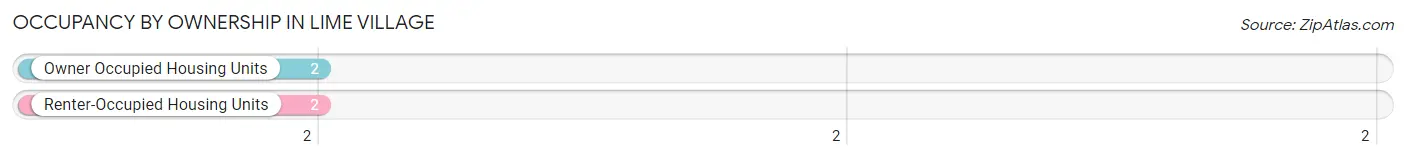
| Occupancy | # Housing Units | % Housing Units |
| Owner Occupied Housing Units | 2 | 50.0% |
| Renter-Occupied Housing Units | 2 | 50.0% |
| Total Occupied Housing Units | 4 | 100.0% |
Occupancy by Household Size in Lime Village
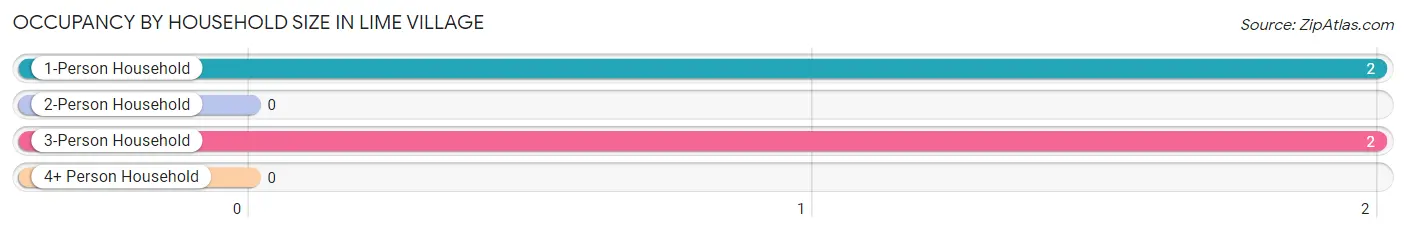
| Household Size | # Housing Units | % Housing Units |
| 1-Person Household | 2 | 50.0% |
| 2-Person Household | 0 | 0.0% |
| 3-Person Household | 2 | 50.0% |
| 4+ Person Household | 0 | 0.0% |
| Total Housing Units | 4 | 100.0% |
Occupancy by Ownership by Household Size in Lime Village
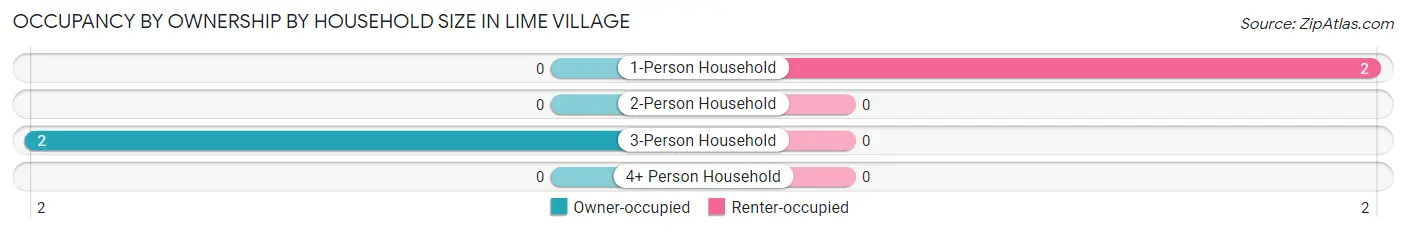
| Household Size | Owner-occupied | Renter-occupied |
| 1-Person Household | 0 (0.0%) | 2 (100.0%) |
| 2-Person Household | 0 (0.0%) | 0 (0.0%) |
| 3-Person Household | 2 (100.0%) | 0 (0.0%) |
| 4+ Person Household | 0 (0.0%) | 0 (0.0%) |
| Total Housing Units | 2 (50.0%) | 2 (50.0%) |
Occupancy by Educational Attainment in Lime Village
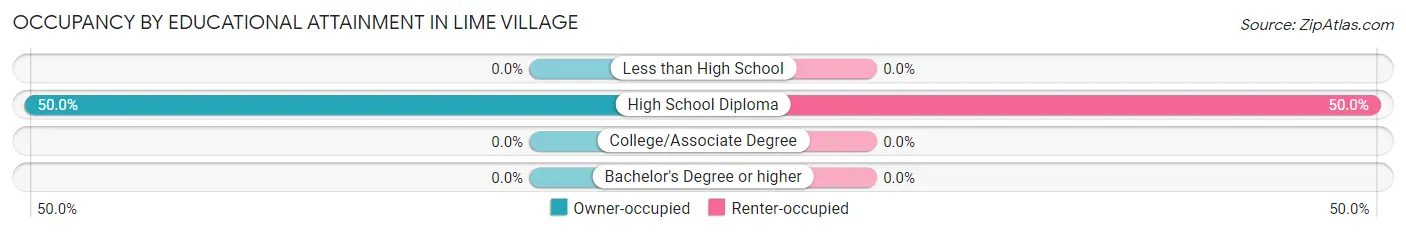
| Household Size | Owner-occupied | Renter-occupied |
| Less than High School | 0 (0.0%) | 0 (0.0%) |
| High School Diploma | 2 (50.0%) | 2 (50.0%) |
| College/Associate Degree | 0 (0.0%) | 0 (0.0%) |
| Bachelor's Degree or higher | 0 (0.0%) | 0 (0.0%) |
Occupancy by Age of Householder in Lime Village
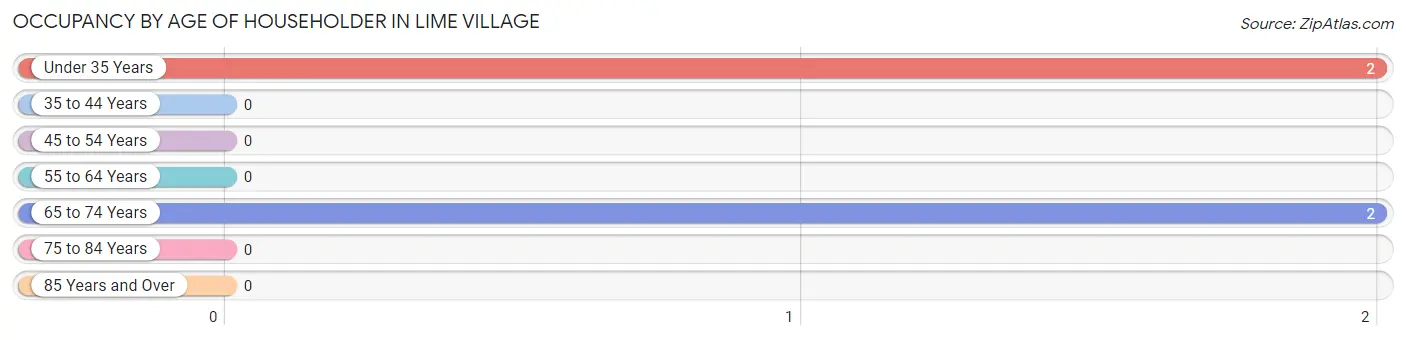
| Age Bracket | # Households | % Households |
| Under 35 Years | 2 | 50.0% |
| 35 to 44 Years | 0 | 0.0% |
| 45 to 54 Years | 0 | 0.0% |
| 55 to 64 Years | 0 | 0.0% |
| 65 to 74 Years | 2 | 50.0% |
| 75 to 84 Years | 0 | 0.0% |
| 85 Years and Over | 0 | 0.0% |
| Total | 4 | 100.0% |
Housing Finances in Lime Village
Median Income by Occupancy in Lime Village
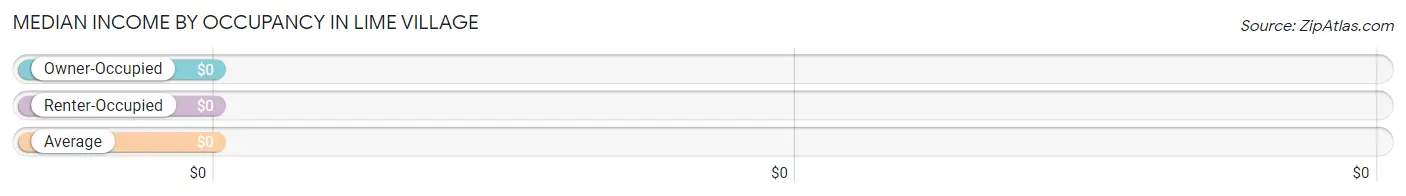
| Occupancy Type | # Households | Median Income |
| Owner-Occupied | 2 (50.0%) | $0 |
| Renter-Occupied | 2 (50.0%) | $0 |
| Average | 4 (100.0%) | $0 |
Occupancy by Householder Income Bracket in Lime Village
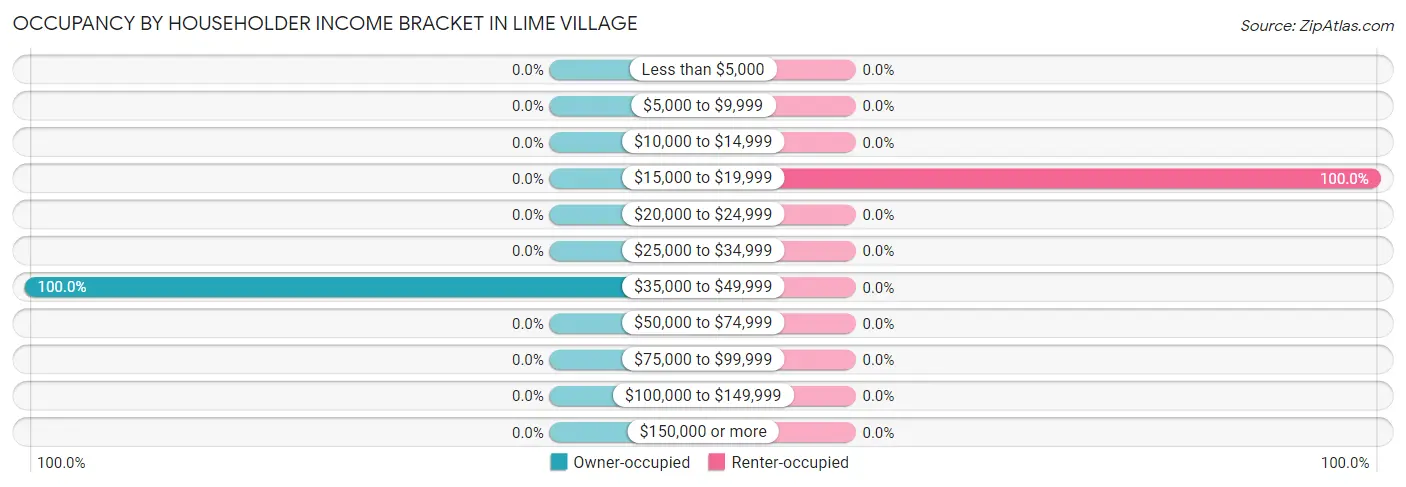
| Income Bracket | Owner-occupied | Renter-occupied |
| Less than $5,000 | 0 (0.0%) | 0 (0.0%) |
| $5,000 to $9,999 | 0 (0.0%) | 0 (0.0%) |
| $10,000 to $14,999 | 0 (0.0%) | 0 (0.0%) |
| $15,000 to $19,999 | 0 (0.0%) | 2 (100.0%) |
| $20,000 to $24,999 | 0 (0.0%) | 0 (0.0%) |
| $25,000 to $34,999 | 0 (0.0%) | 0 (0.0%) |
| $35,000 to $49,999 | 2 (100.0%) | 0 (0.0%) |
| $50,000 to $74,999 | 0 (0.0%) | 0 (0.0%) |
| $75,000 to $99,999 | 0 (0.0%) | 0 (0.0%) |
| $100,000 to $149,999 | 0 (0.0%) | 0 (0.0%) |
| $150,000 or more | 0 (0.0%) | 0 (0.0%) |
| Total | 2 (100.0%) | 2 (100.0%) |
Monthly Housing Cost Tiers in Lime Village
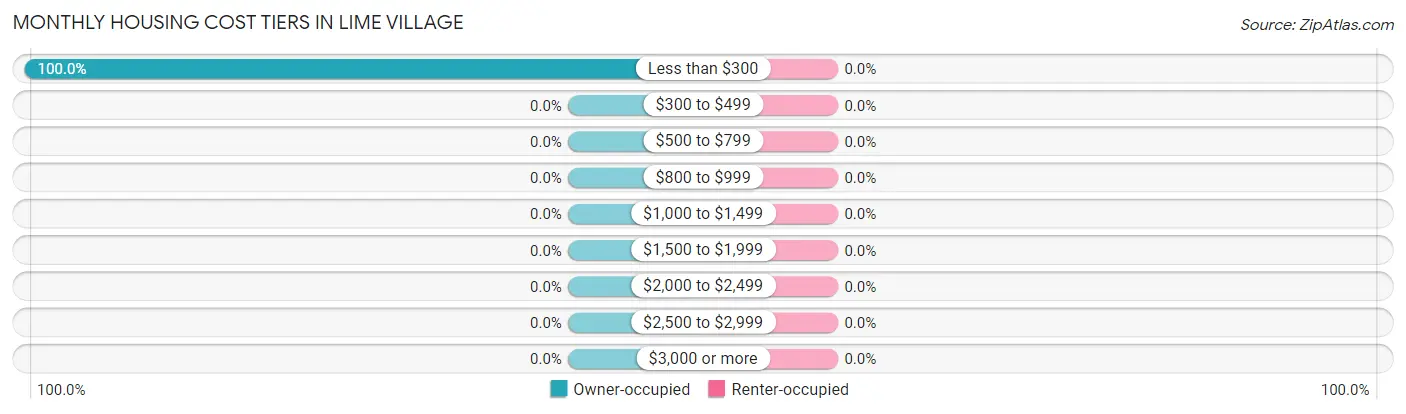
| Monthly Cost | Owner-occupied | Renter-occupied |
| Less than $300 | 2 (100.0%) | 0 (0.0%) |
| $300 to $499 | 0 (0.0%) | 0 (0.0%) |
| $500 to $799 | 0 (0.0%) | 0 (0.0%) |
| $800 to $999 | 0 (0.0%) | 0 (0.0%) |
| $1,000 to $1,499 | 0 (0.0%) | 0 (0.0%) |
| $1,500 to $1,999 | 0 (0.0%) | 0 (0.0%) |
| $2,000 to $2,499 | 0 (0.0%) | 0 (0.0%) |
| $2,500 to $2,999 | 0 (0.0%) | 0 (0.0%) |
| $3,000 or more | 0 (0.0%) | 0 (0.0%) |
| Total | 2 (100.0%) | 2 (100.0%) |
Physical Housing Characteristics in Lime Village
Housing Structures in Lime Village
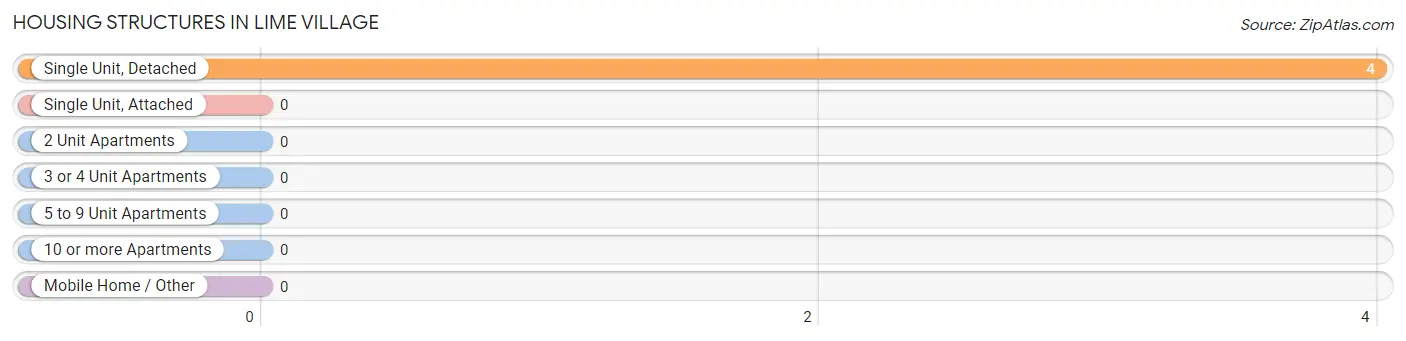
| Structure Type | # Housing Units | % Housing Units |
| Single Unit, Detached | 4 | 100.0% |
| Single Unit, Attached | 0 | 0.0% |
| 2 Unit Apartments | 0 | 0.0% |
| 3 or 4 Unit Apartments | 0 | 0.0% |
| 5 to 9 Unit Apartments | 0 | 0.0% |
| 10 or more Apartments | 0 | 0.0% |
| Mobile Home / Other | 0 | 0.0% |
| Total | 4 | 100.0% |
Housing Structures by Occupancy in Lime Village
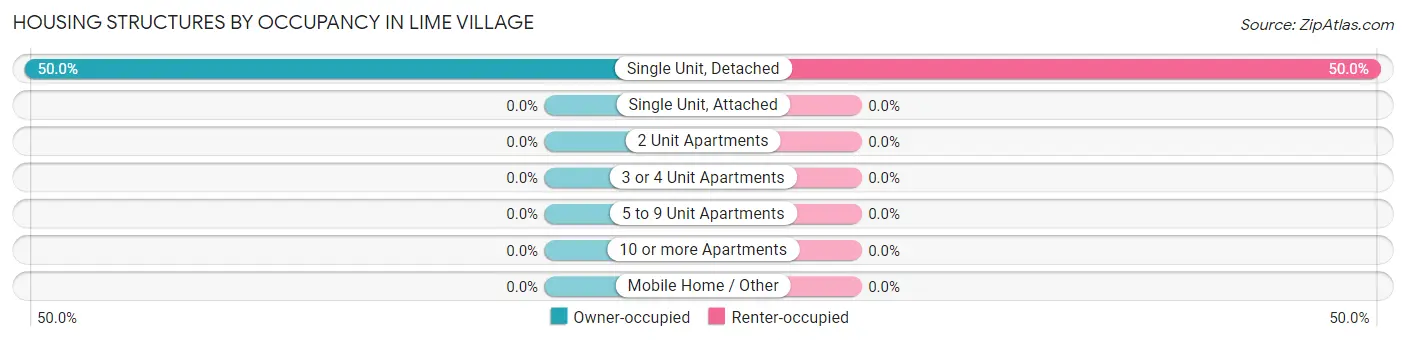
| Structure Type | Owner-occupied | Renter-occupied |
| Single Unit, Detached | 2 (50.0%) | 2 (50.0%) |
| Single Unit, Attached | 0 (0.0%) | 0 (0.0%) |
| 2 Unit Apartments | 0 (0.0%) | 0 (0.0%) |
| 3 or 4 Unit Apartments | 0 (0.0%) | 0 (0.0%) |
| 5 to 9 Unit Apartments | 0 (0.0%) | 0 (0.0%) |
| 10 or more Apartments | 0 (0.0%) | 0 (0.0%) |
| Mobile Home / Other | 0 (0.0%) | 0 (0.0%) |
| Total | 2 (50.0%) | 2 (50.0%) |
Housing Structures by Number of Rooms in Lime Village
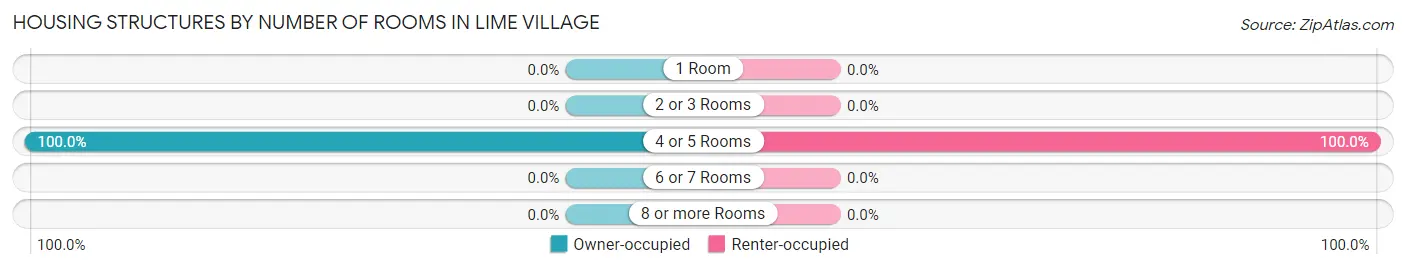
| Number of Rooms | Owner-occupied | Renter-occupied |
| 1 Room | 0 (0.0%) | 0 (0.0%) |
| 2 or 3 Rooms | 0 (0.0%) | 0 (0.0%) |
| 4 or 5 Rooms | 2 (100.0%) | 2 (100.0%) |
| 6 or 7 Rooms | 0 (0.0%) | 0 (0.0%) |
| 8 or more Rooms | 0 (0.0%) | 0 (0.0%) |
| Total | 2 (100.0%) | 2 (100.0%) |
Housing Structure by Heating Type in Lime Village
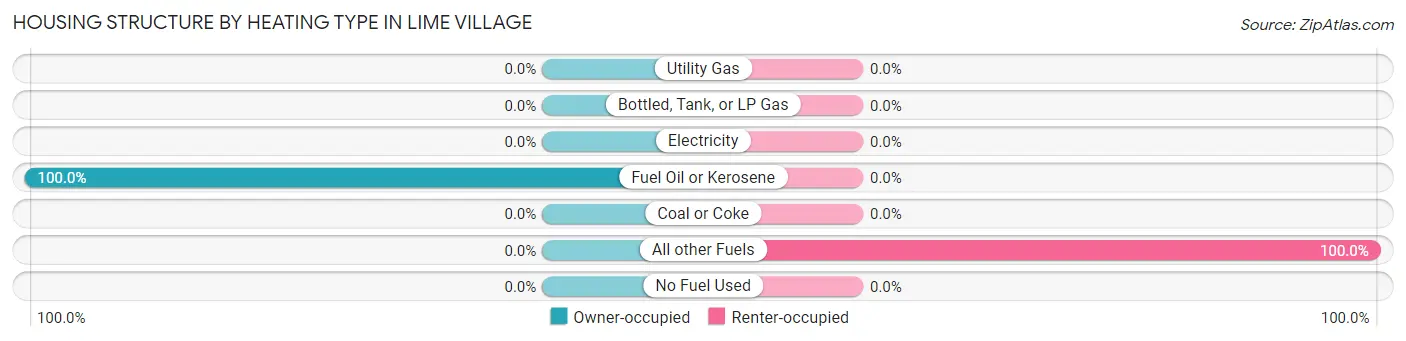
| Heating Type | Owner-occupied | Renter-occupied |
| Utility Gas | 0 (0.0%) | 0 (0.0%) |
| Bottled, Tank, or LP Gas | 0 (0.0%) | 0 (0.0%) |
| Electricity | 0 (0.0%) | 0 (0.0%) |
| Fuel Oil or Kerosene | 2 (100.0%) | 0 (0.0%) |
| Coal or Coke | 0 (0.0%) | 0 (0.0%) |
| All other Fuels | 0 (0.0%) | 2 (100.0%) |
| No Fuel Used | 0 (0.0%) | 0 (0.0%) |
| Total | 2 (100.0%) | 2 (100.0%) |
Household Vehicle Usage in Lime Village
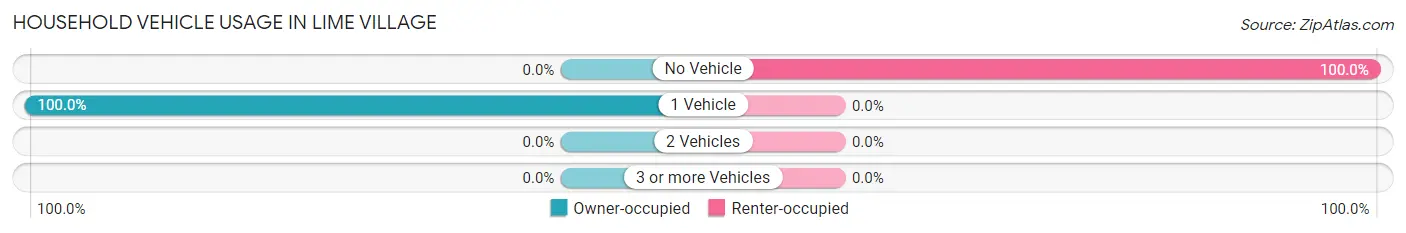
| Vehicles per Household | Owner-occupied | Renter-occupied |
| No Vehicle | 0 (0.0%) | 2 (100.0%) |
| 1 Vehicle | 2 (100.0%) | 0 (0.0%) |
| 2 Vehicles | 0 (0.0%) | 0 (0.0%) |
| 3 or more Vehicles | 0 (0.0%) | 0 (0.0%) |
| Total | 2 (100.0%) | 2 (100.0%) |
Real Estate & Mortgages in Lime Village
Real Estate and Mortgage Overview in Lime Village
| Characteristic | Without Mortgage | With Mortgage |
| Housing Units | 2 | 0 |
| Median Property Value | - | - |
| Median Household Income | - | - |
| Monthly Housing Costs | - | - |
| Real Estate Taxes | - | - |
Property Value by Mortgage Status in Lime Village
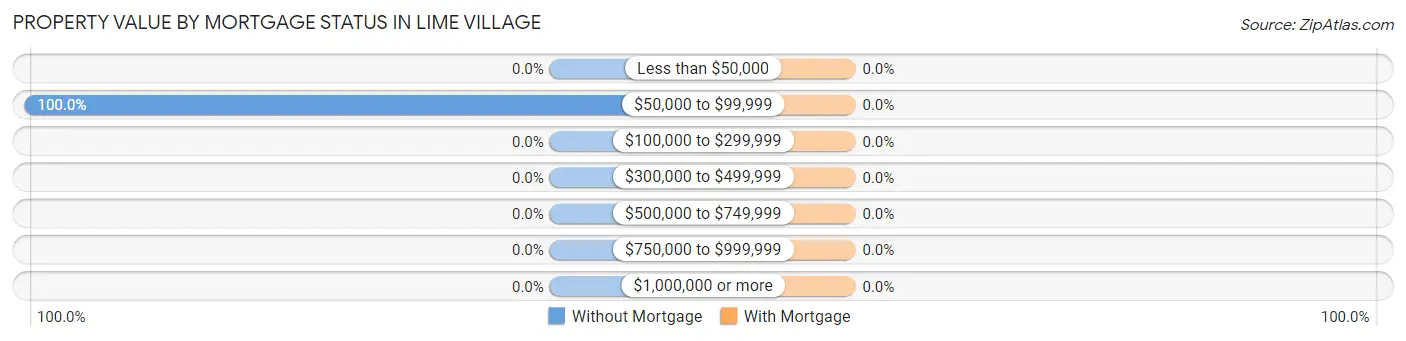
| Property Value | Without Mortgage | With Mortgage |
| Less than $50,000 | 0 (0.0%) | 0 (0.0%) |
| $50,000 to $99,999 | 2 (100.0%) | 0 (0.0%) |
| $100,000 to $299,999 | 0 (0.0%) | 0 (0.0%) |
| $300,000 to $499,999 | 0 (0.0%) | 0 (0.0%) |
| $500,000 to $749,999 | 0 (0.0%) | 0 (0.0%) |
| $750,000 to $999,999 | 0 (0.0%) | 0 (0.0%) |
| $1,000,000 or more | 0 (0.0%) | 0 (0.0%) |
| Total | 2 (100.0%) | 0 (0.0%) |
Household Income by Mortgage Status in Lime Village
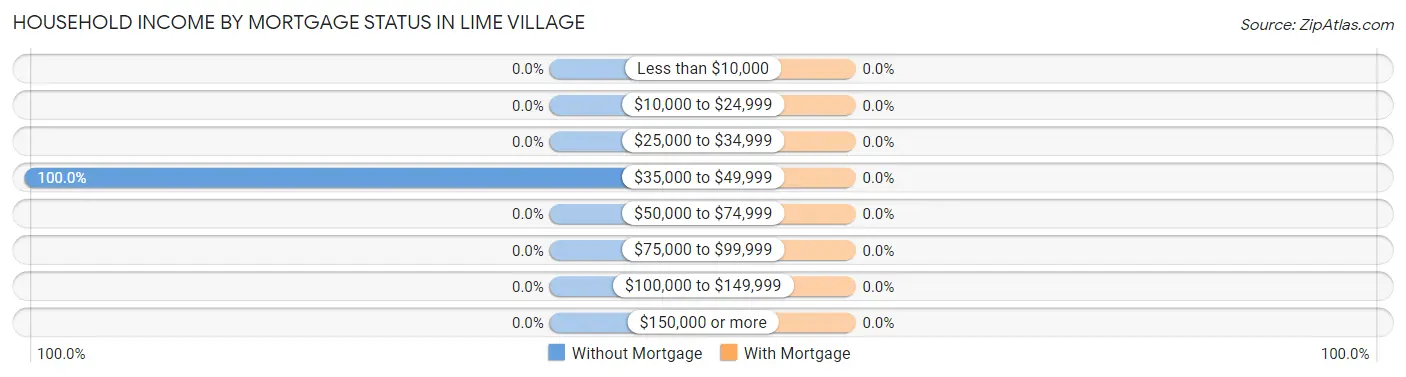
| Household Income | Without Mortgage | With Mortgage |
| Less than $10,000 | 0 (0.0%) | 0 (0.0%) |
| $10,000 to $24,999 | 0 (0.0%) | 0 (0.0%) |
| $25,000 to $34,999 | 0 (0.0%) | 0 (0.0%) |
| $35,000 to $49,999 | 2 (100.0%) | 0 (0.0%) |
| $50,000 to $74,999 | 0 (0.0%) | 0 (0.0%) |
| $75,000 to $99,999 | 0 (0.0%) | 0 (0.0%) |
| $100,000 to $149,999 | 0 (0.0%) | 0 (0.0%) |
| $150,000 or more | 0 (0.0%) | 0 (0.0%) |
| Total | 2 (100.0%) | 0 (0.0%) |
Property Value to Household Income Ratio in Lime Village
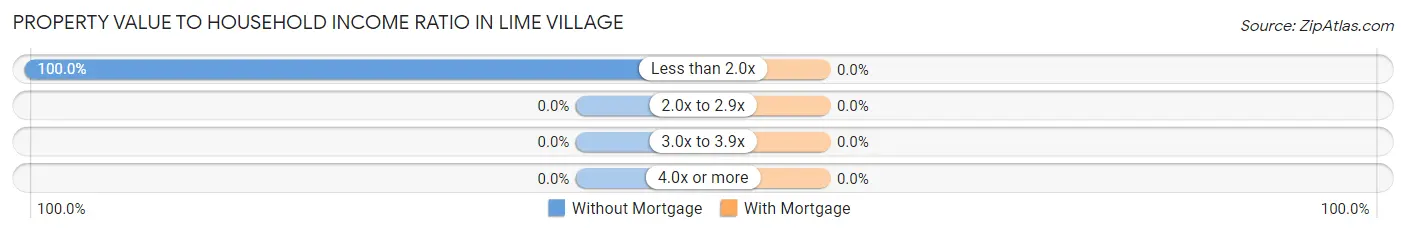
| Value-to-Income Ratio | Without Mortgage | With Mortgage |
| Less than 2.0x | 2 (100.0%) | 0 (0.0%) |
| 2.0x to 2.9x | 0 (0.0%) | 0 (0.0%) |
| 3.0x to 3.9x | 0 (0.0%) | 0 (0.0%) |
| 4.0x or more | 0 (0.0%) | 0 (0.0%) |
| Total | 2 (100.0%) | 0 (0.0%) |
Real Estate Taxes by Mortgage Status in Lime Village
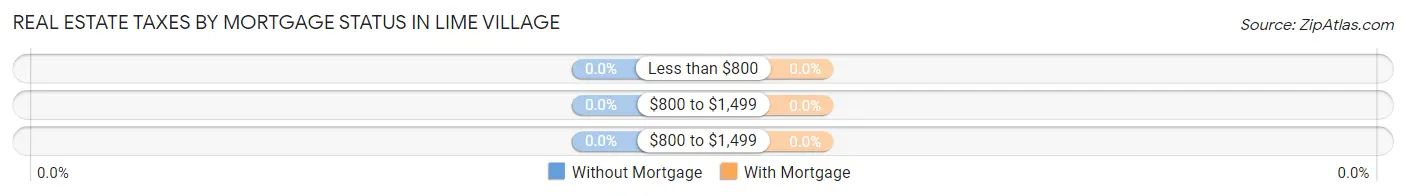
| Property Taxes | Without Mortgage | With Mortgage |
| Less than $800 | 0 (0.0%) | 0 (0.0%) |
| $800 to $1,499 | 0 (0.0%) | 0 (0.0%) |
| $800 to $1,499 | 0 (0.0%) | 0 (0.0%) |
| Total | 2 (100.0%) | 0 (0.0%) |
Health & Disability in Lime Village
Health Insurance Coverage by Age in Lime Village
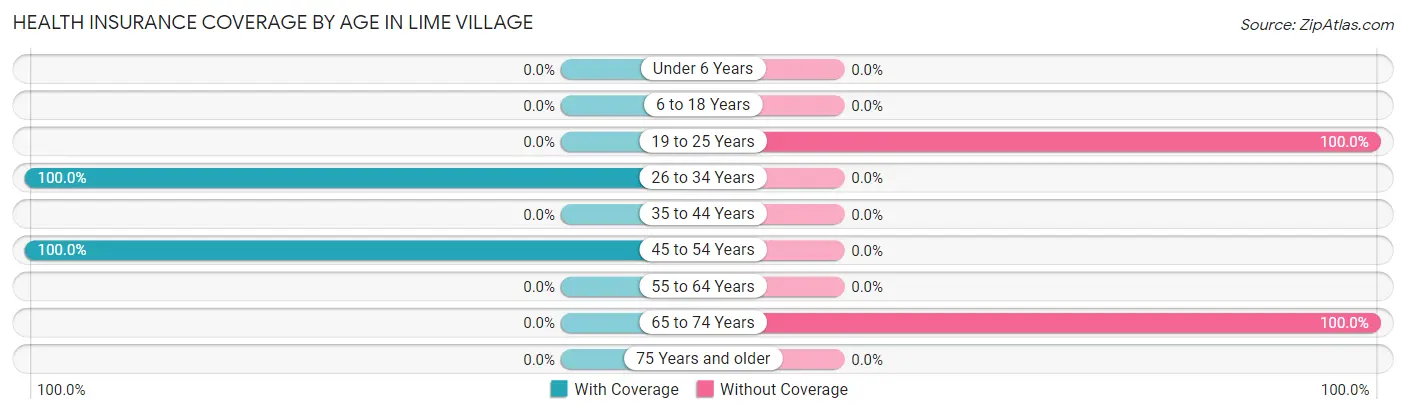
| Age Bracket | With Coverage | Without Coverage |
| Under 6 Years | 0 (0.0%) | 0 (0.0%) |
| 6 to 18 Years | 0 (0.0%) | 0 (0.0%) |
| 19 to 25 Years | 0 (0.0%) | 2 (100.0%) |
| 26 to 34 Years | 2 (100.0%) | 0 (0.0%) |
| 35 to 44 Years | 0 (0.0%) | 0 (0.0%) |
| 45 to 54 Years | 3 (100.0%) | 0 (0.0%) |
| 55 to 64 Years | 0 (0.0%) | 0 (0.0%) |
| 65 to 74 Years | 0 (0.0%) | 2 (100.0%) |
| 75 Years and older | 0 (0.0%) | 0 (0.0%) |
| Total | 5 (55.6%) | 4 (44.4%) |
Health Insurance Coverage by Citizenship Status in Lime Village
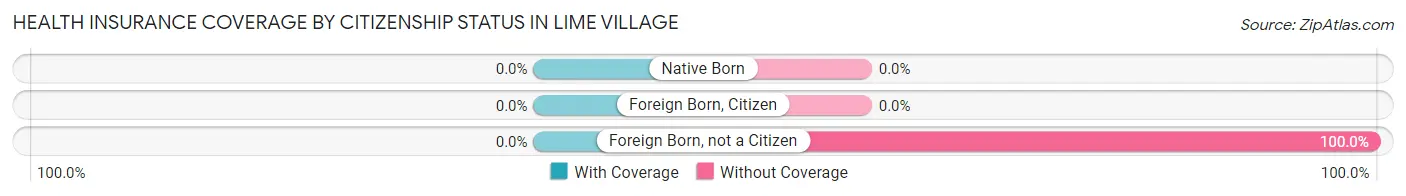
| Citizenship Status | With Coverage | Without Coverage |
| Native Born | 0 (0.0%) | 0 (0.0%) |
| Foreign Born, Citizen | 0 (0.0%) | 0 (0.0%) |
| Foreign Born, not a Citizen | 0 (0.0%) | 2 (100.0%) |
Health Insurance Coverage by Household Income in Lime Village
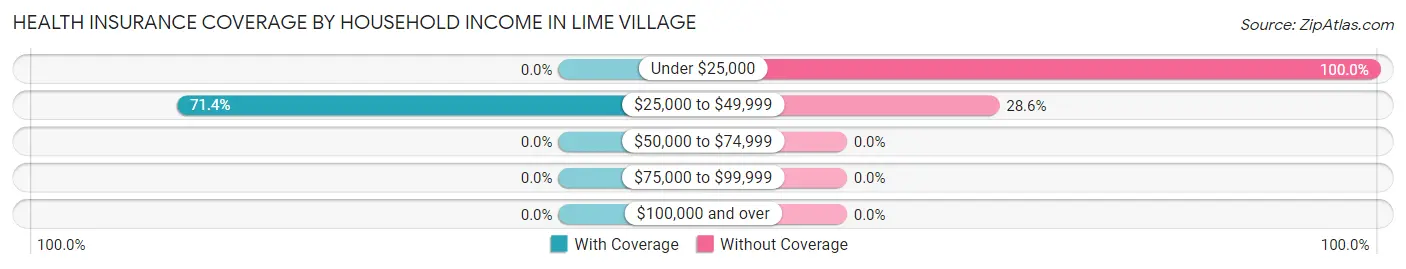
| Household Income | With Coverage | Without Coverage |
| Under $25,000 | 0 (0.0%) | 2 (100.0%) |
| $25,000 to $49,999 | 5 (71.4%) | 2 (28.6%) |
| $50,000 to $74,999 | 0 (0.0%) | 0 (0.0%) |
| $75,000 to $99,999 | 0 (0.0%) | 0 (0.0%) |
| $100,000 and over | 0 (0.0%) | 0 (0.0%) |
Public vs Private Health Insurance Coverage by Age in Lime Village
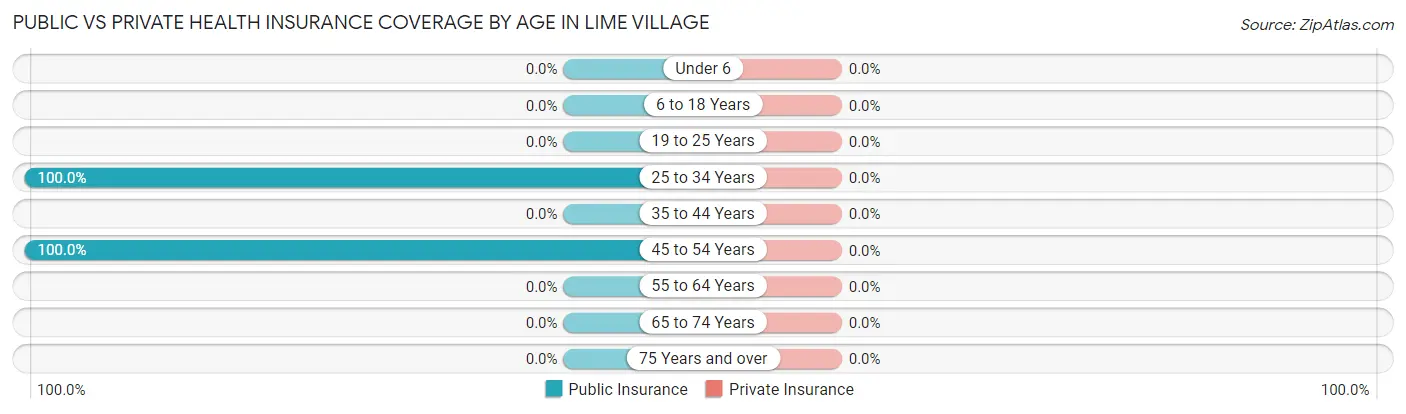
| Age Bracket | Public Insurance | Private Insurance |
| Under 6 | 0 (0.0%) | 0 (0.0%) |
| 6 to 18 Years | 0 (0.0%) | 0 (0.0%) |
| 19 to 25 Years | 0 (0.0%) | 0 (0.0%) |
| 25 to 34 Years | 2 (100.0%) | 0 (0.0%) |
| 35 to 44 Years | 0 (0.0%) | 0 (0.0%) |
| 45 to 54 Years | 3 (100.0%) | 0 (0.0%) |
| 55 to 64 Years | 0 (0.0%) | 0 (0.0%) |
| 65 to 74 Years | 0 (0.0%) | 0 (0.0%) |
| 75 Years and over | 0 (0.0%) | 0 (0.0%) |
| Total | 5 (55.6%) | 0 (0.0%) |
Disability Status by Sex by Age in Lime Village
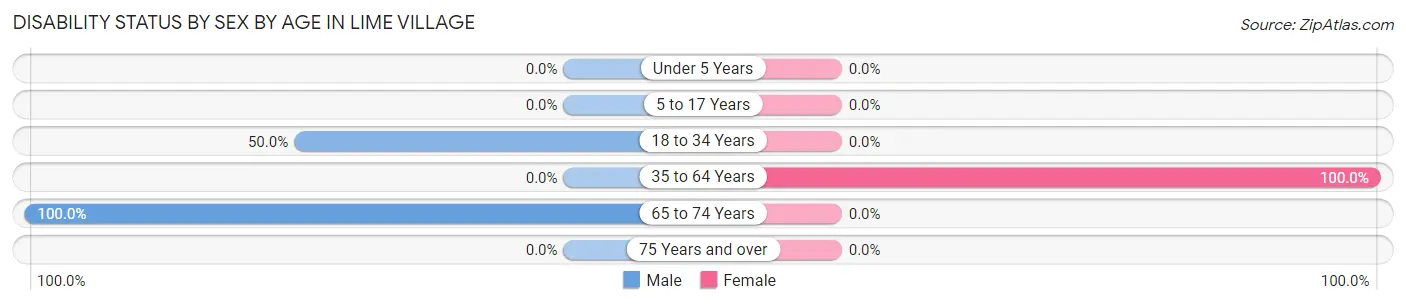
| Age Bracket | Male | Female |
| Under 5 Years | 0 (0.0%) | 0 (0.0%) |
| 5 to 17 Years | 0 (0.0%) | 0 (0.0%) |
| 18 to 34 Years | 2 (50.0%) | 0 (0.0%) |
| 35 to 64 Years | 0 (0.0%) | 3 (100.0%) |
| 65 to 74 Years | 2 (100.0%) | 0 (0.0%) |
| 75 Years and over | 0 (0.0%) | 0 (0.0%) |
Disability Class by Sex by Age in Lime Village
Disability Class: Hearing Difficulty
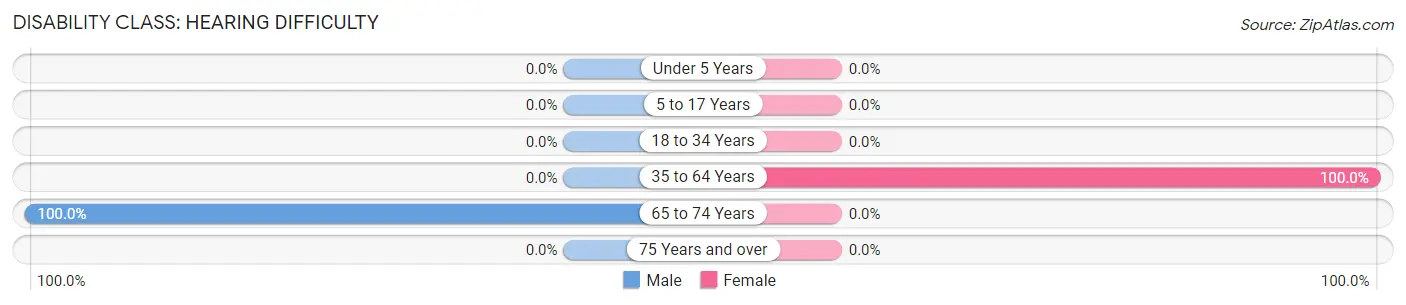
| Age Bracket | Male | Female |
| Under 5 Years | 0 (0.0%) | 0 (0.0%) |
| 5 to 17 Years | 0 (0.0%) | 0 (0.0%) |
| 18 to 34 Years | 0 (0.0%) | 0 (0.0%) |
| 35 to 64 Years | 0 (0.0%) | 3 (100.0%) |
| 65 to 74 Years | 2 (100.0%) | 0 (0.0%) |
| 75 Years and over | 0 (0.0%) | 0 (0.0%) |
Disability Class: Vision Difficulty
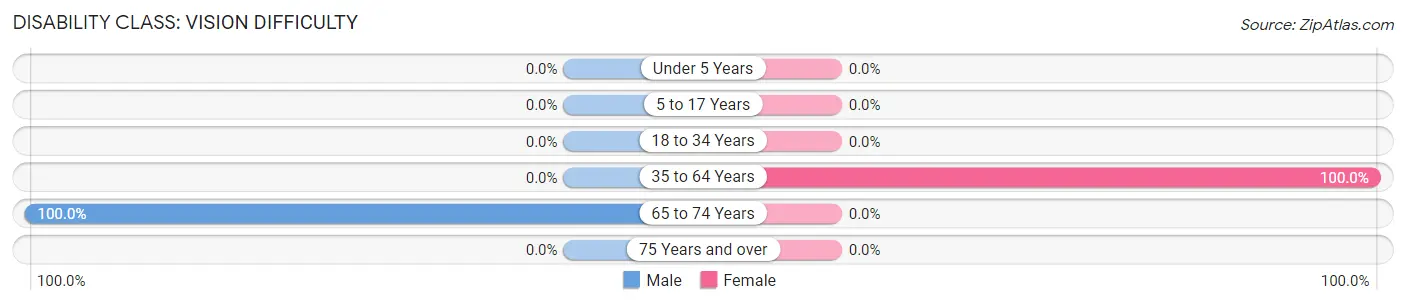
| Age Bracket | Male | Female |
| Under 5 Years | 0 (0.0%) | 0 (0.0%) |
| 5 to 17 Years | 0 (0.0%) | 0 (0.0%) |
| 18 to 34 Years | 0 (0.0%) | 0 (0.0%) |
| 35 to 64 Years | 0 (0.0%) | 3 (100.0%) |
| 65 to 74 Years | 2 (100.0%) | 0 (0.0%) |
| 75 Years and over | 0 (0.0%) | 0 (0.0%) |
Disability Class: Cognitive Difficulty
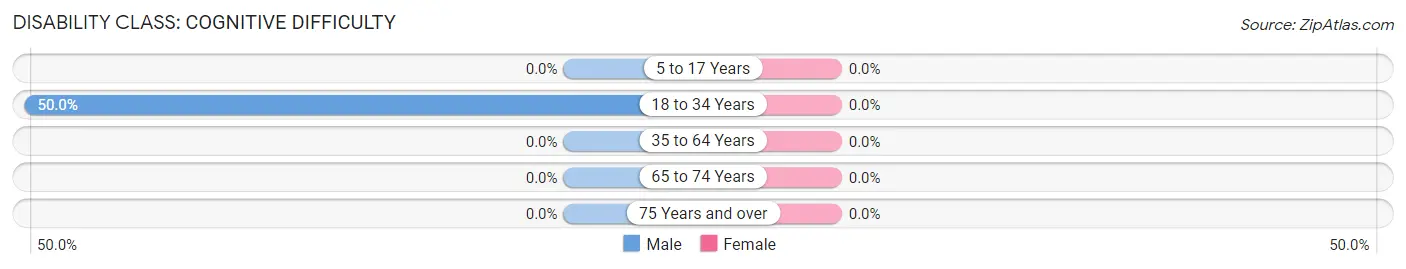
| Age Bracket | Male | Female |
| 5 to 17 Years | 0 (0.0%) | 0 (0.0%) |
| 18 to 34 Years | 2 (50.0%) | 0 (0.0%) |
| 35 to 64 Years | 0 (0.0%) | 0 (0.0%) |
| 65 to 74 Years | 0 (0.0%) | 0 (0.0%) |
| 75 Years and over | 0 (0.0%) | 0 (0.0%) |
Disability Class: Ambulatory Difficulty
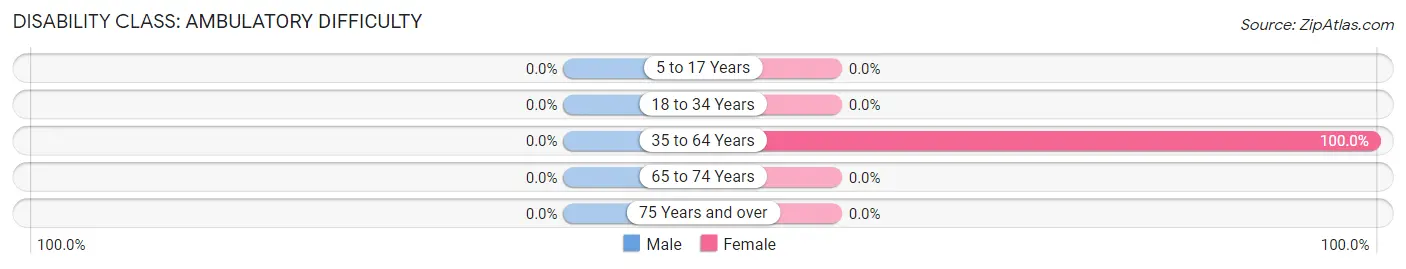
| Age Bracket | Male | Female |
| 5 to 17 Years | 0 (0.0%) | 0 (0.0%) |
| 18 to 34 Years | 0 (0.0%) | 0 (0.0%) |
| 35 to 64 Years | 0 (0.0%) | 3 (100.0%) |
| 65 to 74 Years | 0 (0.0%) | 0 (0.0%) |
| 75 Years and over | 0 (0.0%) | 0 (0.0%) |
Disability Class: Self-Care Difficulty
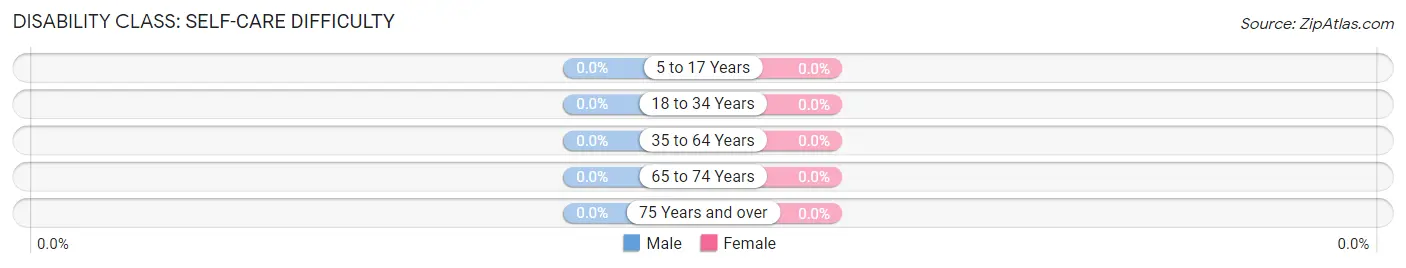
| Age Bracket | Male | Female |
| 5 to 17 Years | 0 (0.0%) | 0 (0.0%) |
| 18 to 34 Years | 0 (0.0%) | 0 (0.0%) |
| 35 to 64 Years | 0 (0.0%) | 0 (0.0%) |
| 65 to 74 Years | 0 (0.0%) | 0 (0.0%) |
| 75 Years and over | 0 (0.0%) | 0 (0.0%) |
Technology Access in Lime Village
Computing Device Access in Lime Village
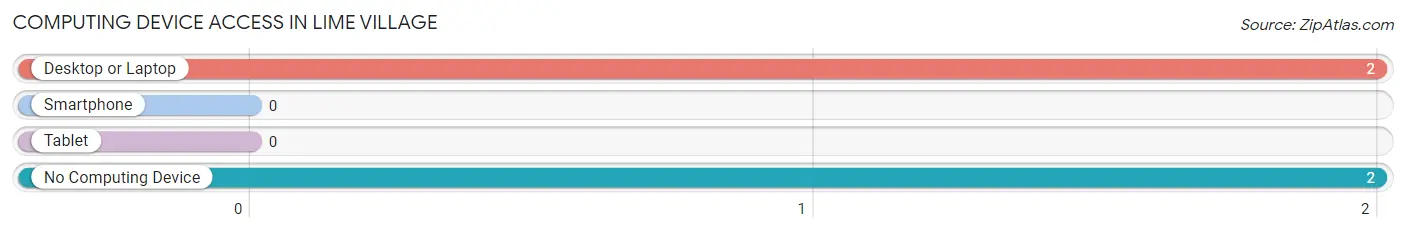
| Device Type | # Households | % Households |
| Desktop or Laptop | 2 | 50.0% |
| Smartphone | 0 | 0.0% |
| Tablet | 0 | 0.0% |
| No Computing Device | 2 | 50.0% |
| Total | 4 | 100.0% |
Internet Access in Lime Village
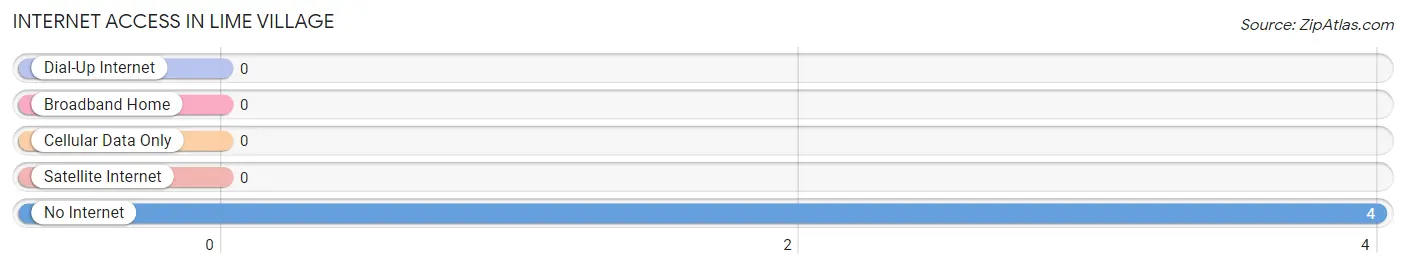
| Internet Type | # Households | % Households |
| Dial-Up Internet | 0 | 0.0% |
| Broadband Home | 0 | 0.0% |
| Cellular Data Only | 0 | 0.0% |
| Satellite Internet | 0 | 0.0% |
| No Internet | 4 | 100.0% |
| Total | 4 | 100.0% |
Lime Village Summary
Lime Village is a small unincorporated community located in the Yukon-Koyukuk Census Area of Alaska. It is situated on the south bank of the Lime River, approximately 40 miles east of the Kuskokwim River. The village is home to the Lime Village Traditional Council, a federally recognized tribe of the Yup'ik Eskimo people.
History
The Yup'ik Eskimos have lived in the area around Lime Village for thousands of years. The village was first established in the late 1800s as a trading post for the local Yup'ik people. The village was named after the nearby Lime River, which was named by a prospector in the early 1900s.
In the early 1900s, the village was a popular stop for prospectors and miners who were searching for gold in the area. The village was also a popular stop for trappers and fur traders.
In the 1950s, the village was connected to the outside world by a road that connected it to the nearby town of Anvik. This allowed for increased trade and commerce with the outside world.
Geography
Lime Village is located in the Yukon-Koyukuk Census Area of Alaska. It is situated on the south bank of the Lime River, approximately 40 miles east of the Kuskokwim River. The village is located in a remote area of Alaska, and is only accessible by air or by boat.
The climate in Lime Village is subarctic, with cold winters and mild summers. The average temperature in the summer is around 50°F, and the average temperature in the winter is around -20°F.
The village is surrounded by mountains and forests, and is home to a variety of wildlife, including moose, caribou, bears, and wolves.
Economy
The economy of Lime Village is largely based on subsistence activities, such as hunting, fishing, and trapping. The village is also home to a small commercial fishing industry, which provides employment for some of the residents.
The village is home to a small store, which provides basic supplies to the residents. The store is also a popular stop for tourists who are visiting the area.
Demographics
As of the 2010 census, the population of Lime Village was 129. The population is primarily Yup'ik Eskimo, and the primary language spoken is Yup'ik.
The median household income in Lime Village is $25,000, and the median age is 33. The unemployment rate is high, at around 40%.
Conclusion
Lime Village is a small unincorporated community located in the Yukon-Koyukuk Census Area of Alaska. It is home to the Lime Village Traditional Council, a federally recognized tribe of the Yup'ik Eskimo people. The economy of the village is largely based on subsistence activities, such as hunting, fishing, and trapping. The population of the village is primarily Yup'ik Eskimo, and the primary language spoken is Yup'ik. The median household income in Lime Village is $25,000, and the median age is 33. The unemployment rate is high, at around 40%.
Common Questions
What is Per Capita Income in Lime Village?
Per Capita income in Lime Village is $15,911.
What is Inequality or Gini Index in Lime Village?
Inequality or Gini Index in Lime Village is 0.20.
What is the Total Population of Lime Village?
Total Population of Lime Village is 9.
What is the Total Male Population of Lime Village?
Total Male Population of Lime Village is 6.
What is the Total Female Population of Lime Village?
Total Female Population of Lime Village is 3.
What is the Ratio of Males per 100 Females in Lime Village?
There are 200.00 Males per 100 Females in Lime Village.
What is the Ratio of Females per 100 Males in Lime Village?
There are 50.00 Females per 100 Males in Lime Village.
What is the Median Population Age in Lime Village?
Median Population Age in Lime Village is 53.2 Years.
What is the Average Family Size in Lime Village
Average Family Size in Lime Village is 3.5 People.
What is the Average Household Size in Lime Village
Average Household Size in Lime Village is 2.2 People.
How Large is the Labor Force in Lime Village?
There are 4 People in the Labor Forcein in Lime Village.
What is the Percentage of People in the Labor Force in Lime Village?
44.4% of People are in the Labor Force in Lime Village.
What is the Unemployment Rate in Lime Village?
Unemployment Rate in Lime Village is 50.0%.