Little Eagle, SD Map & Demographics
Little Eagle Map
Little Eagle Overview
$4,483
PER CAPITA INCOME
$23,000
AVG FAMILY INCOME
$18,750
AVG HOUSEHOLD INCOME
$14,486
FAMILY INCOME DEFICIT
0.38
INEQUALITY / GINI INDEX
343
TOTAL POPULATION
157
MALE POPULATION
186
FEMALE POPULATION
84.41
MALES / 100 FEMALES
118.47
FEMALES / 100 MALES
21.9
MEDIAN AGE
5.6
AVG FAMILY SIZE
4.9
AVG HOUSEHOLD SIZE
78
LABOR FORCE [ PEOPLE ]
37.1%
PERCENT IN LABOR FORCE
69.2%
UNEMPLOYMENT RATE
Little Eagle Zip Codes
Little Eagle Area Codes
Income in Little Eagle
Income Overview in Little Eagle
Per Capita Income in Little Eagle is $4,483, while median incomes of families and households are $23,000 and $18,750 respectively.
| Characteristic | Number | Measure |
| Per Capita Income | 343 | $4,483 |
| Median Family Income | 58 | $23,000 |
| Mean Family Income | 58 | $23,366 |
| Median Household Income | 70 | $18,750 |
| Mean Household Income | 70 | $20,753 |
| Income Deficit | 58 | $14,486 |
| Wage / Income Gap (%) | 343 | 0.00% |
| Wage / Income Gap ($) | 343 | 100.00¢ per $1 |
| Gini / Inequality Index | 343 | 0.38 |
Earnings by Sex in Little Eagle
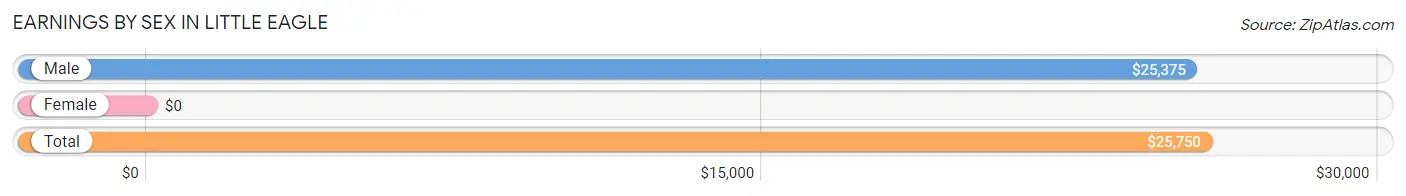
| Sex | Number | Average Earnings |
| Male | 25 (69.4%) | $25,375 |
| Female | 11 (30.6%) | $0 |
| Total | 36 (100.0%) | $25,750 |
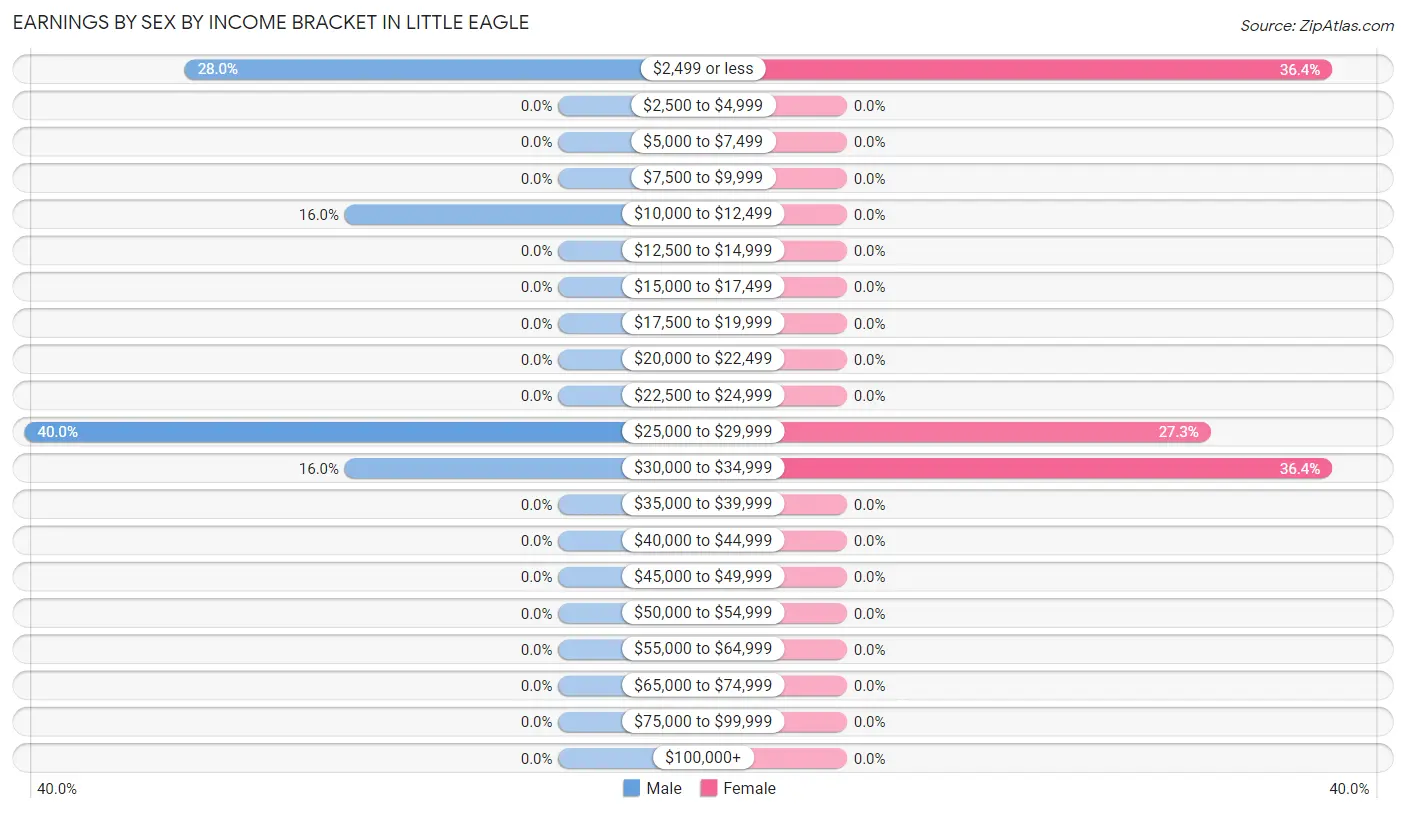
Earnings by Sex by Income Bracket in Little Eagle
The most common earnings brackets in Little Eagle are $25,000 to $29,999 for men (10 | 40.0%) and $2,499 or less for women (4 | 36.4%).
| Income | Male | Female |
| $2,499 or less | 7 (28.0%) | 4 (36.4%) |
| $2,500 to $4,999 | 0 (0.0%) | 0 (0.0%) |
| $5,000 to $7,499 | 0 (0.0%) | 0 (0.0%) |
| $7,500 to $9,999 | 0 (0.0%) | 0 (0.0%) |
| $10,000 to $12,499 | 4 (16.0%) | 0 (0.0%) |
| $12,500 to $14,999 | 0 (0.0%) | 0 (0.0%) |
| $15,000 to $17,499 | 0 (0.0%) | 0 (0.0%) |
| $17,500 to $19,999 | 0 (0.0%) | 0 (0.0%) |
| $20,000 to $22,499 | 0 (0.0%) | 0 (0.0%) |
| $22,500 to $24,999 | 0 (0.0%) | 0 (0.0%) |
| $25,000 to $29,999 | 10 (40.0%) | 3 (27.3%) |
| $30,000 to $34,999 | 4 (16.0%) | 4 (36.4%) |
| $35,000 to $39,999 | 0 (0.0%) | 0 (0.0%) |
| $40,000 to $44,999 | 0 (0.0%) | 0 (0.0%) |
| $45,000 to $49,999 | 0 (0.0%) | 0 (0.0%) |
| $50,000 to $54,999 | 0 (0.0%) | 0 (0.0%) |
| $55,000 to $64,999 | 0 (0.0%) | 0 (0.0%) |
| $65,000 to $74,999 | 0 (0.0%) | 0 (0.0%) |
| $75,000 to $99,999 | 0 (0.0%) | 0 (0.0%) |
| $100,000+ | 0 (0.0%) | 0 (0.0%) |
| Total | 25 (100.0%) | 11 (100.0%) |
Earnings by Sex by Educational Attainment in Little Eagle
| Educational Attainment | Male Income | Female Income |
| Less than High School | - | - |
| High School Diploma | - | - |
| College or Associate's Degree | - | - |
| Bachelor's Degree | - | - |
| Graduate Degree | - | - |
| Total | $25,750 | $0 |
Family Income in Little Eagle
Family Income Brackets in Little Eagle
According to the Little Eagle family income data, there are 18 families falling into the $15,000 to $24,999 income range, which is the most common income bracket and makes up 31.0% of all families.
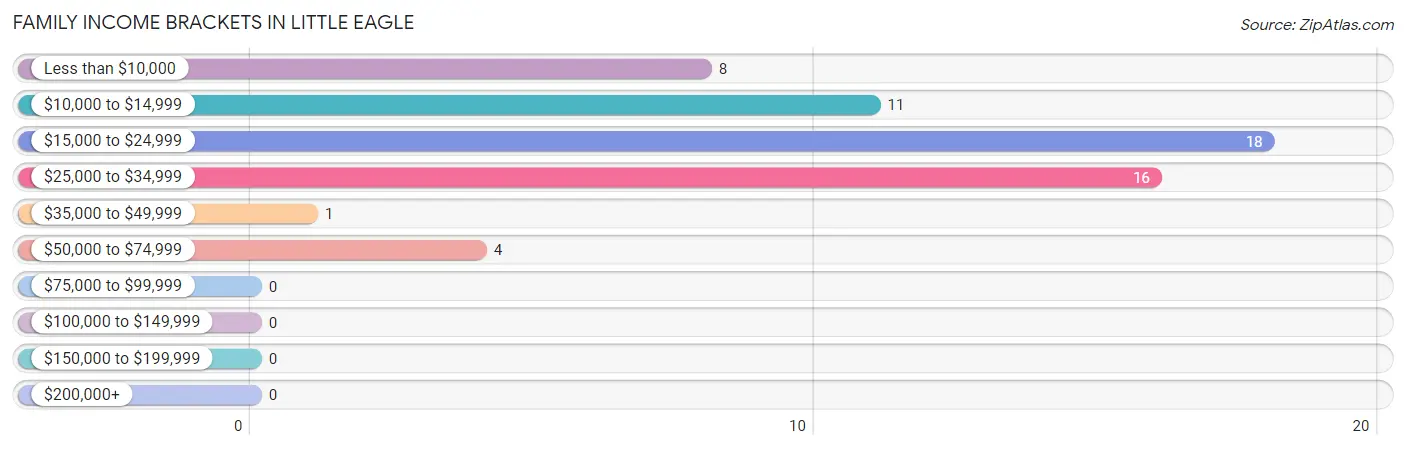
| Income Bracket | # Families | % Families |
| Less than $10,000 | 8 | 13.8% |
| $10,000 to $14,999 | 11 | 19.0% |
| $15,000 to $24,999 | 18 | 31.0% |
| $25,000 to $34,999 | 16 | 27.6% |
| $35,000 to $49,999 | 1 | 1.7% |
| $50,000 to $74,999 | 4 | 6.9% |
| $75,000 to $99,999 | 0 | 0.0% |
| $100,000 to $149,999 | 0 | 0.0% |
| $150,000 to $199,999 | 0 | 0.0% |
| $200,000+ | 0 | 0.0% |
Family Income by Famaliy Size in Little Eagle
7+ person families (11 | 19.0%) account for the highest median family income in Little Eagle with $18,438 per family, while 7+ person families (11 | 19.0%) have the highest median income of $2,634 per family member.
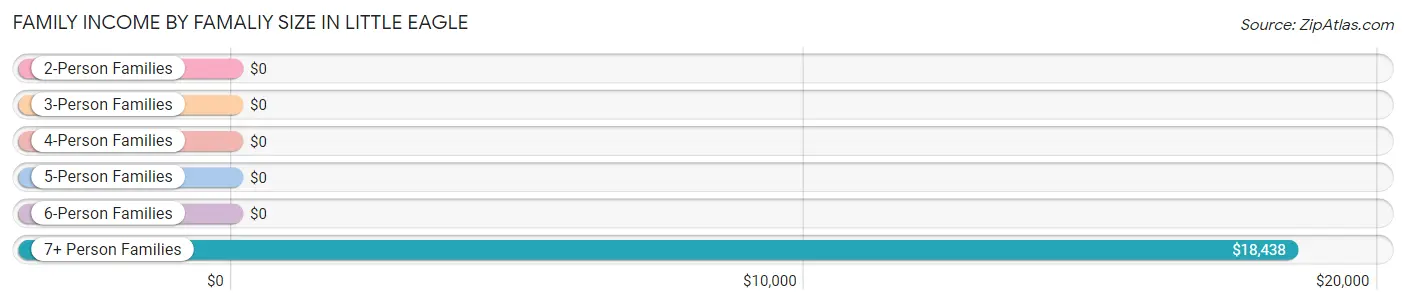
| Income Bracket | # Families | Median Income |
| 2-Person Families | 4 (6.9%) | $0 |
| 3-Person Families | 21 (36.2%) | $0 |
| 4-Person Families | 7 (12.1%) | $0 |
| 5-Person Families | 14 (24.1%) | $0 |
| 6-Person Families | 1 (1.7%) | $0 |
| 7+ Person Families | 11 (19.0%) | $18,438 |
| Total | 58 (100.0%) | $23,000 |
Family Income by Number of Earners in Little Eagle
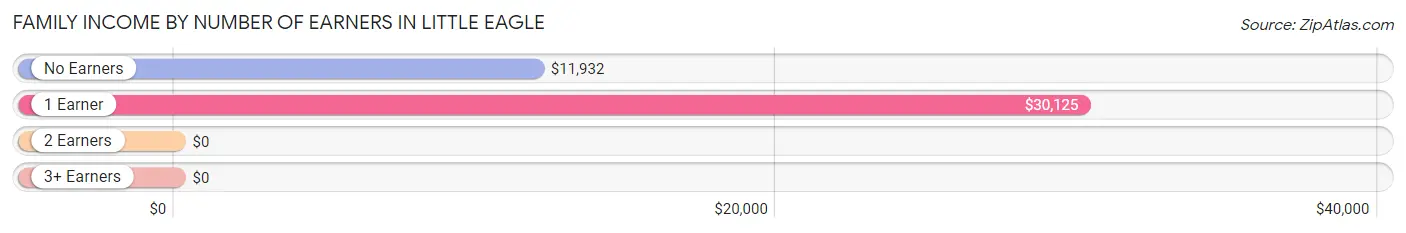
| Number of Earners | # Families | Median Income |
| No Earners | 33 (56.9%) | $11,932 |
| 1 Earner | 21 (36.2%) | $30,125 |
| 2 Earners | 0 (0.0%) | $0 |
| 3+ Earners | 4 (6.9%) | $0 |
| Total | 58 (100.0%) | $23,000 |
Household Income in Little Eagle
Household Income Brackets in Little Eagle
With 18 households falling in the category, the $15,000 to $24,999 income range is the most frequent in Little Eagle, accounting for 25.7% of all households.
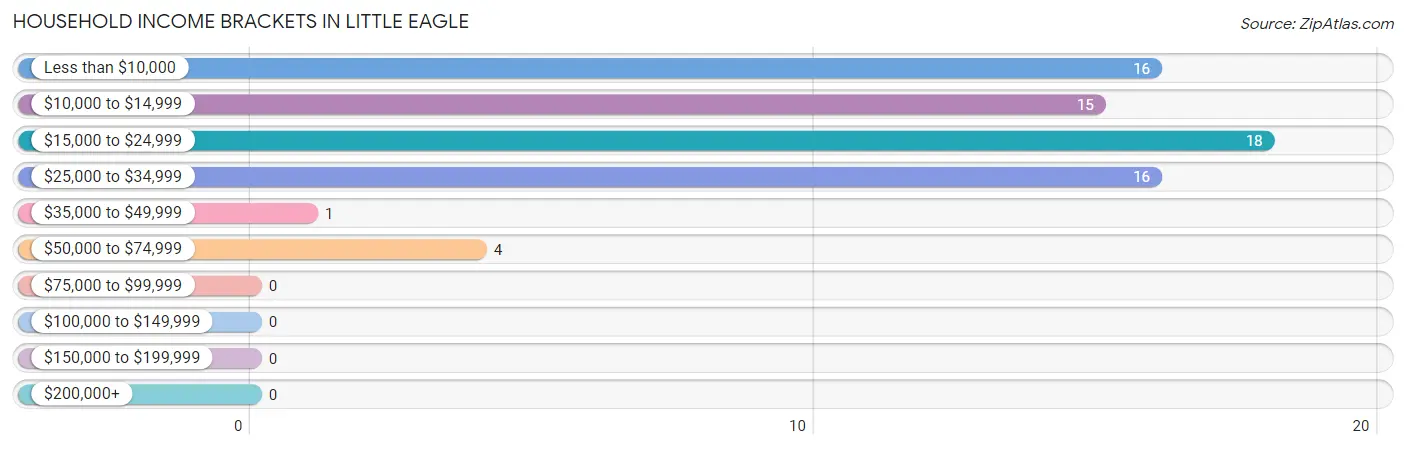
| Income Bracket | # Households | % Households |
| Less than $10,000 | 16 | 22.9% |
| $10,000 to $14,999 | 15 | 21.4% |
| $15,000 to $24,999 | 18 | 25.7% |
| $25,000 to $34,999 | 16 | 22.9% |
| $35,000 to $49,999 | 1 | 1.4% |
| $50,000 to $74,999 | 4 | 5.7% |
| $75,000 to $99,999 | 0 | 0.0% |
| $100,000 to $149,999 | 0 | 0.0% |
| $150,000 to $199,999 | 0 | 0.0% |
| $200,000+ | 0 | 0.0% |
Household Income by Householder Age in Little Eagle
The median household income in Little Eagle is $18,750, with the highest median household income of $18,438 found in the 25 to 44 years age bracket for the primary householder. A total of 25 households (35.7%) fall into this category.
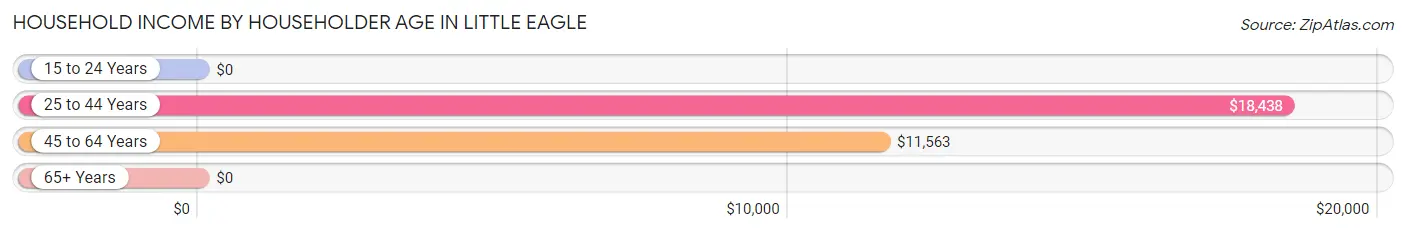
| Income Bracket | # Households | Median Income |
| 15 to 24 Years | 0 (0.0%) | $0 |
| 25 to 44 Years | 25 (35.7%) | $18,438 |
| 45 to 64 Years | 34 (48.6%) | $11,563 |
| 65+ Years | 11 (15.7%) | $0 |
| Total | 70 (100.0%) | $18,750 |
Poverty in Little Eagle
Income Below Poverty by Sex and Age in Little Eagle
With 77.7% poverty level for males and 95.7% for females among the residents of Little Eagle, under 5 year old males and under 5 year old females are the most vulnerable to poverty, with 42 males (100.0%) and 33 females (100.0%) in their respective age groups living below the poverty level.
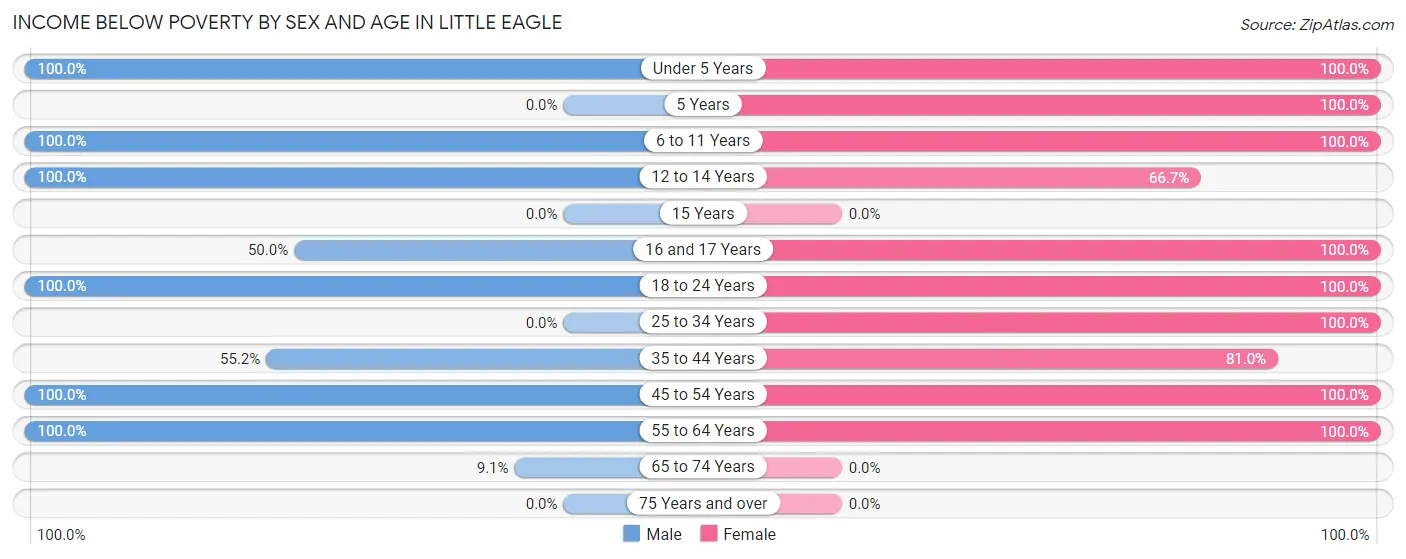
| Age Bracket | Male | Female |
| Under 5 Years | 42 (100.0%) | 33 (100.0%) |
| 5 Years | 0 (0.0%) | 4 (100.0%) |
| 6 to 11 Years | 13 (100.0%) | 20 (100.0%) |
| 12 to 14 Years | 9 (100.0%) | 8 (66.7%) |
| 15 Years | 0 (0.0%) | 0 (0.0%) |
| 16 and 17 Years | 3 (50.0%) | 11 (100.0%) |
| 18 to 24 Years | 6 (100.0%) | 32 (100.0%) |
| 25 to 34 Years | 0 (0.0%) | 21 (100.0%) |
| 35 to 44 Years | 16 (55.2%) | 17 (80.9%) |
| 45 to 54 Years | 20 (100.0%) | 21 (100.0%) |
| 55 to 64 Years | 12 (100.0%) | 11 (100.0%) |
| 65 to 74 Years | 1 (9.1%) | 0 (0.0%) |
| 75 Years and over | 0 (0.0%) | 0 (0.0%) |
| Total | 122 (77.7%) | 178 (95.7%) |
Income Above Poverty by Sex and Age in Little Eagle
According to the poverty statistics in Little Eagle, males aged 25 to 34 years and females aged 12 to 14 years are the age groups that are most secure financially, with 100.0% of males and 33.3% of females in these age groups living above the poverty line.
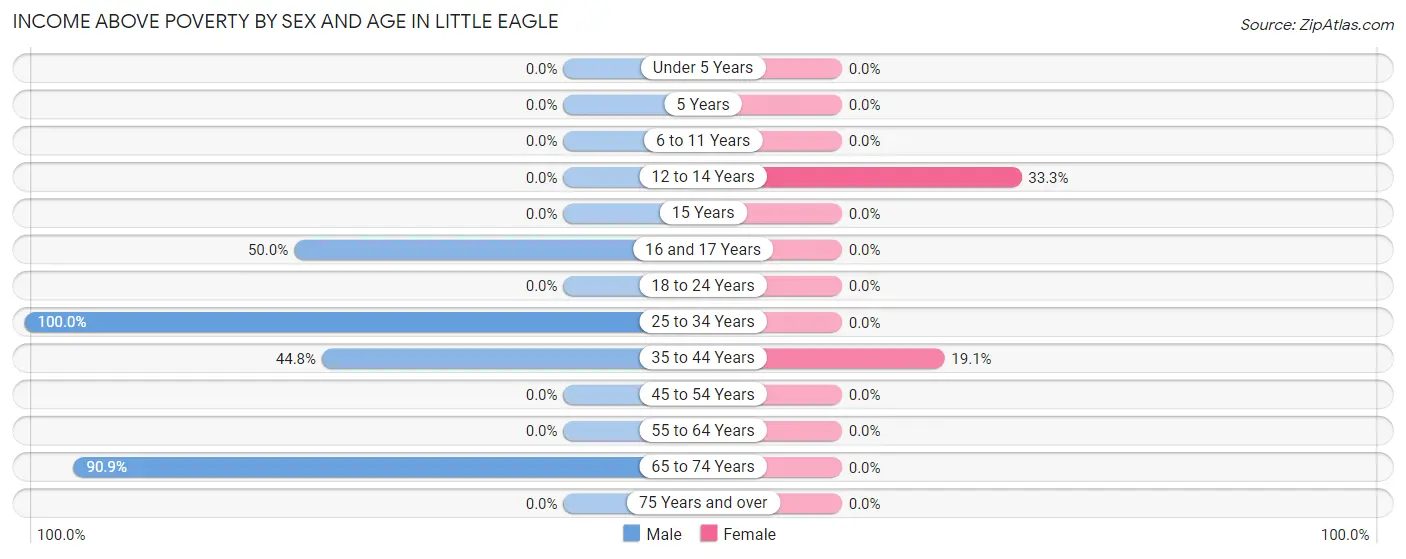
| Age Bracket | Male | Female |
| Under 5 Years | 0 (0.0%) | 0 (0.0%) |
| 5 Years | 0 (0.0%) | 0 (0.0%) |
| 6 to 11 Years | 0 (0.0%) | 0 (0.0%) |
| 12 to 14 Years | 0 (0.0%) | 4 (33.3%) |
| 15 Years | 0 (0.0%) | 0 (0.0%) |
| 16 and 17 Years | 3 (50.0%) | 0 (0.0%) |
| 18 to 24 Years | 0 (0.0%) | 0 (0.0%) |
| 25 to 34 Years | 9 (100.0%) | 0 (0.0%) |
| 35 to 44 Years | 13 (44.8%) | 4 (19.1%) |
| 45 to 54 Years | 0 (0.0%) | 0 (0.0%) |
| 55 to 64 Years | 0 (0.0%) | 0 (0.0%) |
| 65 to 74 Years | 10 (90.9%) | 0 (0.0%) |
| 75 Years and over | 0 (0.0%) | 0 (0.0%) |
| Total | 35 (22.3%) | 8 (4.3%) |
Income Below Poverty Among Married-Couple Families in Little Eagle
The poverty statistics for married-couple families in Little Eagle show that 82.6% or 19 of the total 23 families live below the poverty line. Families with no children have the highest poverty rate of 100.0%, comprising of 4 families. On the other hand, families with 1 or 2 children have the lowest poverty rate of 78.9%, which includes 15 families.
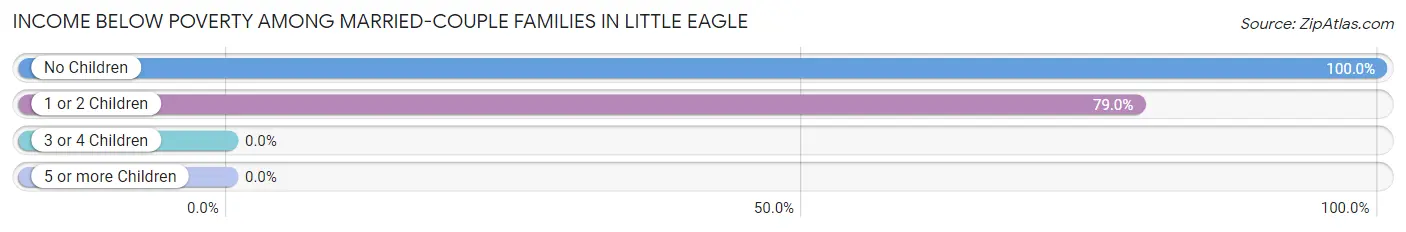
| Children | Above Poverty | Below Poverty |
| No Children | 0 (0.0%) | 4 (100.0%) |
| 1 or 2 Children | 4 (21.0%) | 15 (78.9%) |
| 3 or 4 Children | 0 (0.0%) | 0 (0.0%) |
| 5 or more Children | 0 (0.0%) | 0 (0.0%) |
| Total | 4 (17.4%) | 19 (82.6%) |
Income Below Poverty Among Single-Parent Households in Little Eagle
According to the poverty data in Little Eagle, 58.3% or 14 single-father households and 100.0% or 11 single-mother households are living below the poverty line. Among single-father households, those with 1 or 2 children have the highest poverty rate, with 3 households (100.0%) experiencing poverty. Likewise, among single-mother households, those with 3 or 4 children have the highest poverty rate, with 3 households (100.0%) falling below the poverty line.
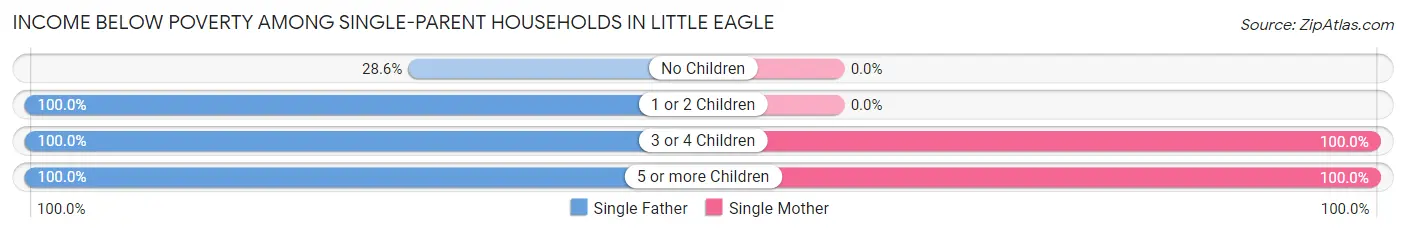
| Children | Single Father | Single Mother |
| No Children | 4 (28.6%) | 0 (0.0%) |
| 1 or 2 Children | 3 (100.0%) | 0 (0.0%) |
| 3 or 4 Children | 4 (100.0%) | 3 (100.0%) |
| 5 or more Children | 3 (100.0%) | 8 (100.0%) |
| Total | 14 (58.3%) | 11 (100.0%) |
Income Below Poverty Among Married-Couple vs Single-Parent Households in Little Eagle
The poverty data for Little Eagle shows that 19 of the married-couple family households (82.6%) and 25 of the single-parent households (71.4%) are living below the poverty level. Within the married-couple family households, those with no children have the highest poverty rate, with 4 households (100.0%) falling below the poverty line. Among the single-parent households, those with 1 or 2 children have the highest poverty rate, with 3 household (100.0%) living below poverty.
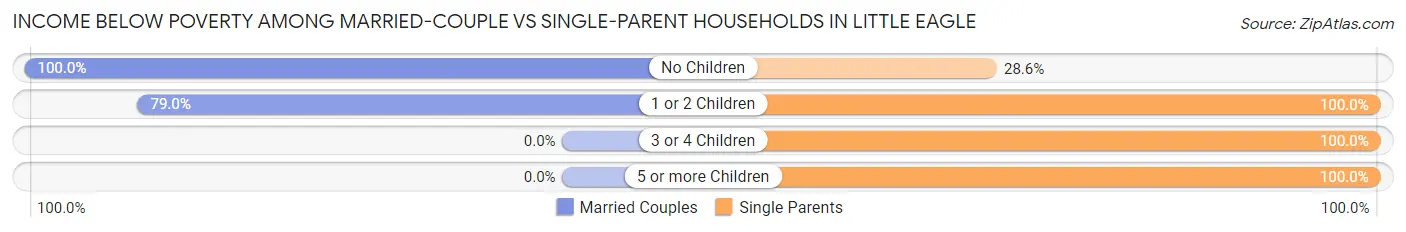
| Children | Married-Couple Families | Single-Parent Households |
| No Children | 4 (100.0%) | 4 (28.6%) |
| 1 or 2 Children | 15 (78.9%) | 3 (100.0%) |
| 3 or 4 Children | 0 (0.0%) | 7 (100.0%) |
| 5 or more Children | 0 (0.0%) | 11 (100.0%) |
| Total | 19 (82.6%) | 25 (71.4%) |
Race in Little Eagle
The most populous races in Little Eagle are Native / Alaskan (339 | 98.8%), Hispanic or Latino (4 | 1.2%), and White / Caucasian (4 | 1.2%).
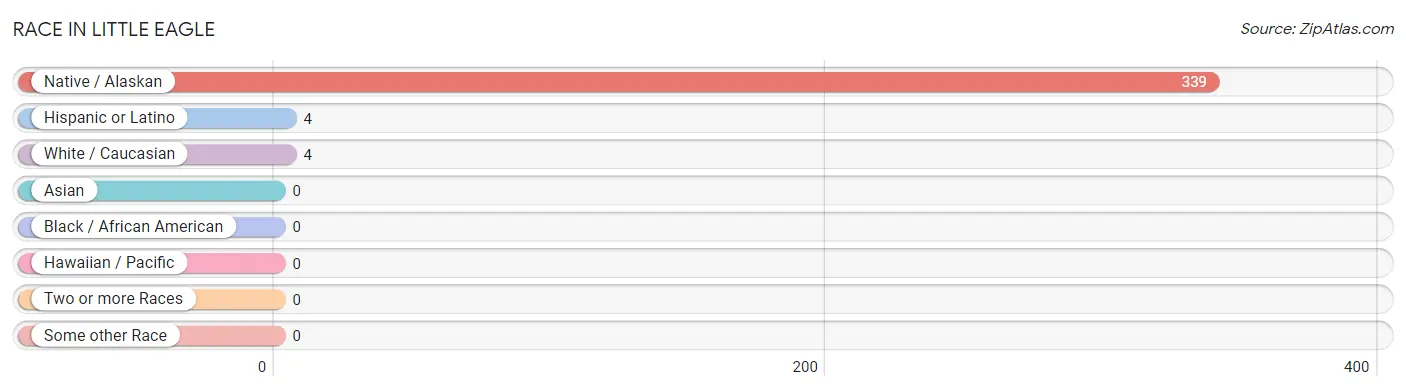
| Race | # Population | % Population |
| Asian | 0 | 0.0% |
| Black / African American | 0 | 0.0% |
| Hawaiian / Pacific | 0 | 0.0% |
| Hispanic or Latino | 4 | 1.2% |
| Native / Alaskan | 339 | 98.8% |
| White / Caucasian | 4 | 1.2% |
| Two or more Races | 0 | 0.0% |
| Some other Race | 0 | 0.0% |
| Total | 343 | 100.0% |
Ancestry in Little Eagle
The most populous ancestries reported in Little Eagle are Sioux (305 | 88.9%), American (4 | 1.2%), Irish (4 | 1.2%), and Mexican (4 | 1.2%), together accounting for 92.4% of all Little Eagle residents.
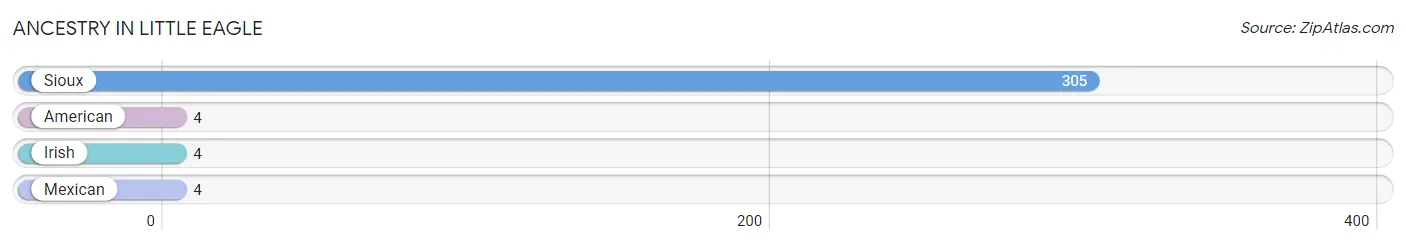
| Ancestry | # Population | % Population |
| American | 4 | 1.2% |
| Irish | 4 | 1.2% |
| Mexican | 4 | 1.2% |
| Sioux | 305 | 88.9% | View All 4 Rows |
Immigrants in Little Eagle

| Immigration Origin | # Population | % Population | View All 0 Rows |
Sex and Age in Little Eagle
Sex and Age in Little Eagle
The most populous age groups in Little Eagle are Under 5 Years (42 | 26.8%) for men and Under 5 Years (33 | 17.7%) for women.
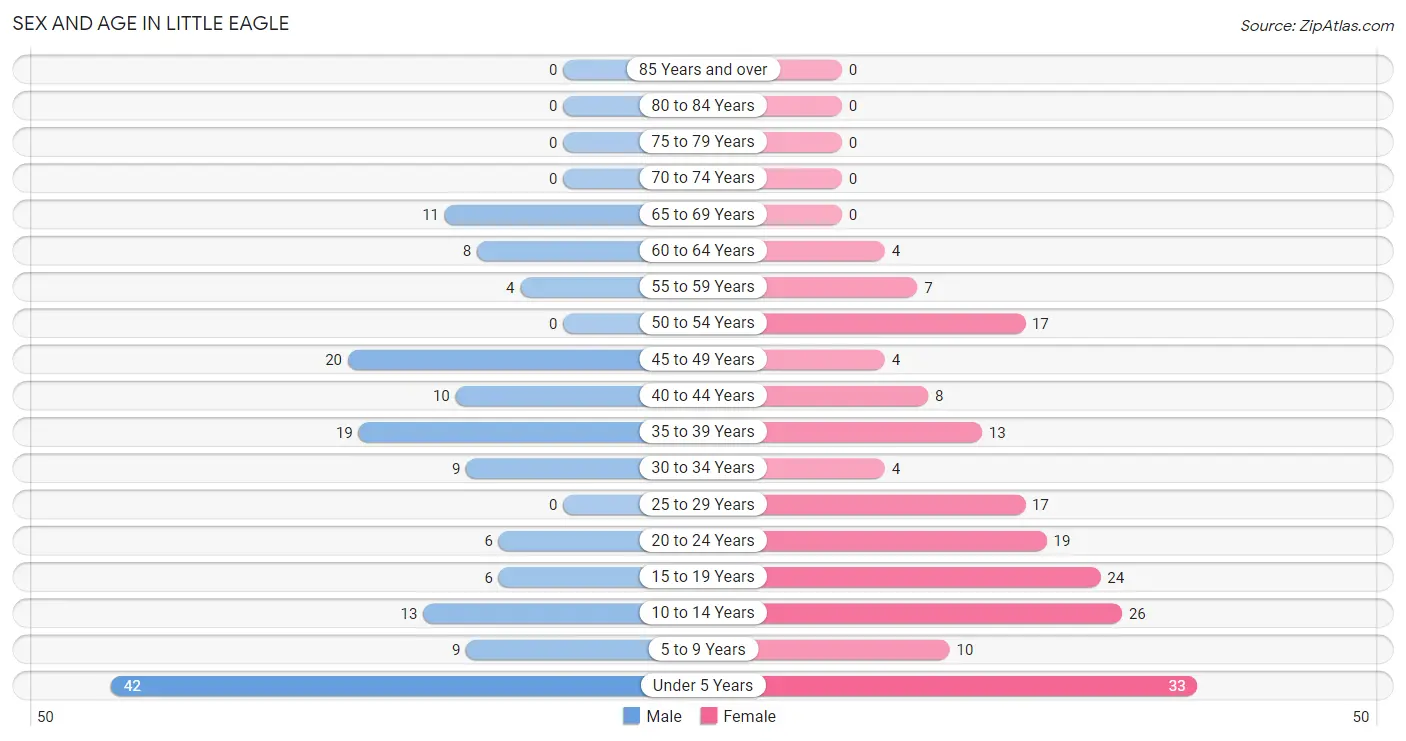
| Age Bracket | Male | Female |
| Under 5 Years | 42 (26.8%) | 33 (17.7%) |
| 5 to 9 Years | 9 (5.7%) | 10 (5.4%) |
| 10 to 14 Years | 13 (8.3%) | 26 (14.0%) |
| 15 to 19 Years | 6 (3.8%) | 24 (12.9%) |
| 20 to 24 Years | 6 (3.8%) | 19 (10.2%) |
| 25 to 29 Years | 0 (0.0%) | 17 (9.1%) |
| 30 to 34 Years | 9 (5.7%) | 4 (2.1%) |
| 35 to 39 Years | 19 (12.1%) | 13 (7.0%) |
| 40 to 44 Years | 10 (6.4%) | 8 (4.3%) |
| 45 to 49 Years | 20 (12.7%) | 4 (2.1%) |
| 50 to 54 Years | 0 (0.0%) | 17 (9.1%) |
| 55 to 59 Years | 4 (2.5%) | 7 (3.8%) |
| 60 to 64 Years | 8 (5.1%) | 4 (2.1%) |
| 65 to 69 Years | 11 (7.0%) | 0 (0.0%) |
| 70 to 74 Years | 0 (0.0%) | 0 (0.0%) |
| 75 to 79 Years | 0 (0.0%) | 0 (0.0%) |
| 80 to 84 Years | 0 (0.0%) | 0 (0.0%) |
| 85 Years and over | 0 (0.0%) | 0 (0.0%) |
| Total | 157 (100.0%) | 186 (100.0%) |
Families and Households in Little Eagle
Median Family Size in Little Eagle
The median family size in Little Eagle is 5.60 persons per family, with single female/mother families (11 | 19.0%) accounting for the largest median family size of 12.45 persons per family. On the other hand, married-couple families (23 | 39.7%) represent the smallest median family size with 3.83 persons per family.
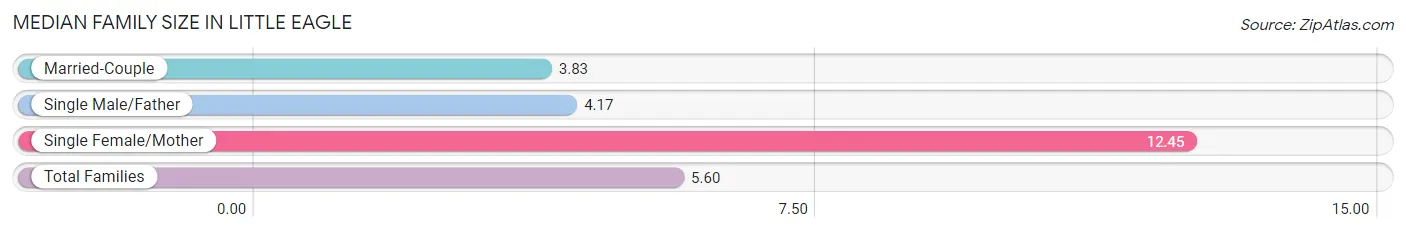
| Family Type | # Families | Family Size |
| Married-Couple | 23 (39.7%) | 3.83 |
| Single Male/Father | 24 (41.4%) | 4.17 |
| Single Female/Mother | 11 (19.0%) | 12.45 |
| Total Families | 58 (100.0%) | 5.60 |
Median Household Size in Little Eagle
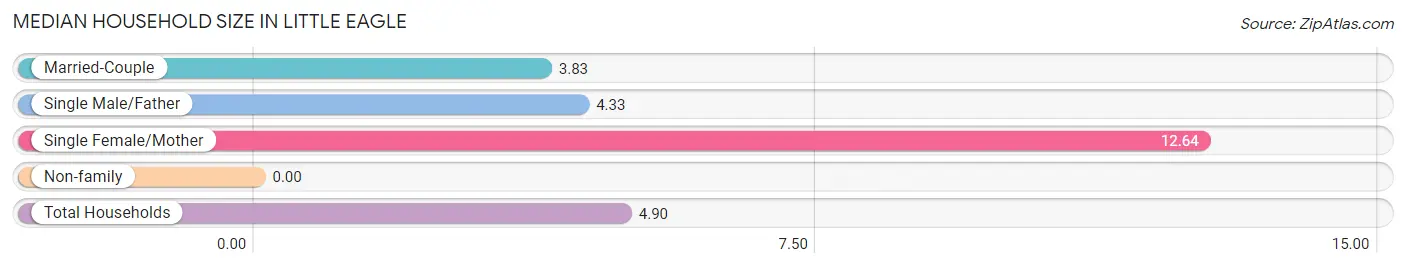
| Household Type | # Households | Household Size |
| Married-Couple | 23 (32.9%) | 3.83 |
| Single Male/Father | 24 (34.3%) | 4.33 |
| Single Female/Mother | 11 (15.7%) | 12.64 |
| Non-family | 12 (17.1%) | - |
| Total Households | 70 (100.0%) | 4.90 |
Household Size by Marriage Status in Little Eagle
Out of a total of 70 households in Little Eagle, 58 (82.9%) are family households, while 12 (17.1%) are nonfamily households. The most numerous type of family households are 3-person households, comprising 18, and the most common type of nonfamily households are 1-person households, comprising 12.
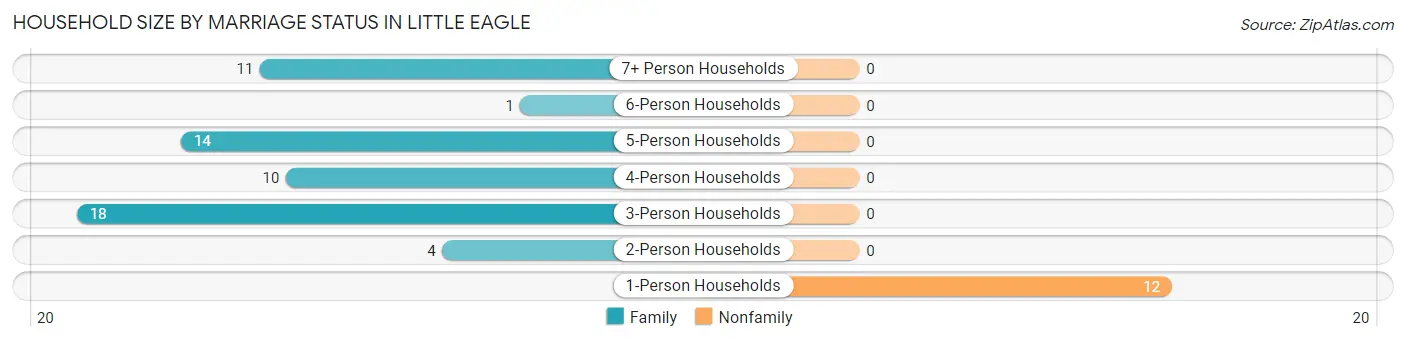
| Household Size | Family Households | Nonfamily Households |
| 1-Person Households | - | 12 (17.1%) |
| 2-Person Households | 4 (5.7%) | 0 (0.0%) |
| 3-Person Households | 18 (25.7%) | 0 (0.0%) |
| 4-Person Households | 10 (14.3%) | 0 (0.0%) |
| 5-Person Households | 14 (20.0%) | 0 (0.0%) |
| 6-Person Households | 1 (1.4%) | 0 (0.0%) |
| 7+ Person Households | 11 (15.7%) | 0 (0.0%) |
| Total | 58 (82.9%) | 12 (17.1%) |
Female Fertility in Little Eagle
Fertility by Age in Little Eagle
Average fertility rate in Little Eagle is 118.0 births per 1,000 women. Women in the age bracket of 20 to 34 years have the highest fertility rate with 275.0 births per 1,000 women. Women in the age bracket of 20 to 34 years acount for 100.0% of all women with births.
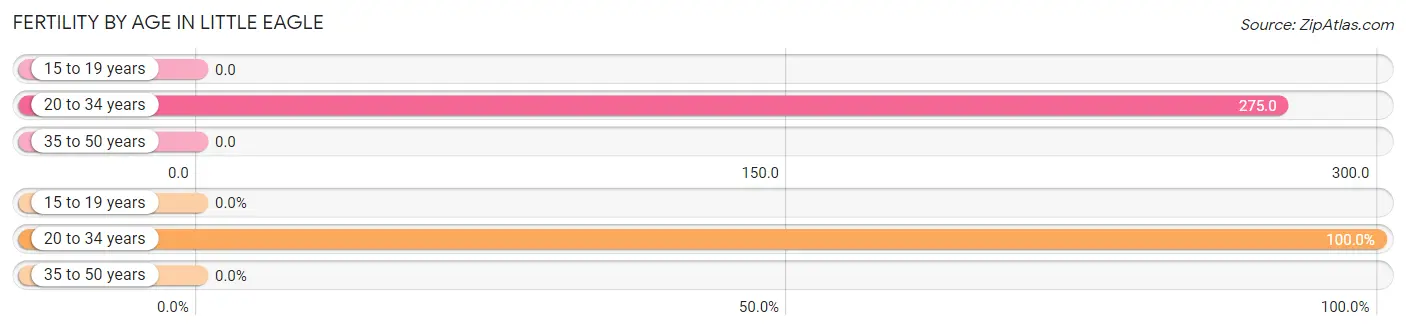
| Age Bracket | Women with Births | Births / 1,000 Women |
| 15 to 19 years | 0 (0.0%) | 0.0 |
| 20 to 34 years | 11 (100.0%) | 275.0 |
| 35 to 50 years | 0 (0.0%) | 0.0 |
| Total | 11 (100.0%) | 118.0 |
Fertility by Age by Marriage Status in Little Eagle
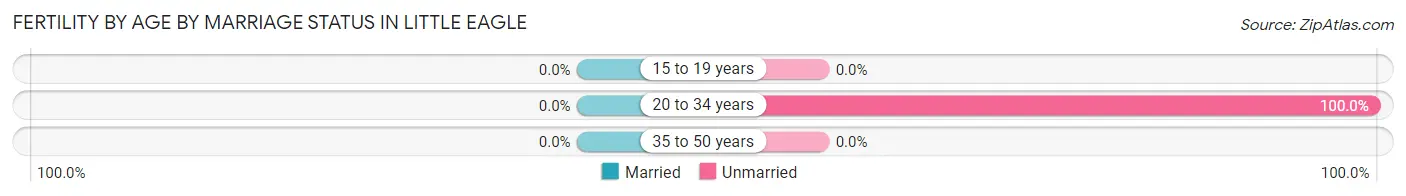
| Age Bracket | Married | Unmarried |
| 15 to 19 years | 0 (0.0%) | 0 (0.0%) |
| 20 to 34 years | 0 (0.0%) | 11 (100.0%) |
| 35 to 50 years | 0 (0.0%) | 0 (0.0%) |
| Total | 0 (0.0%) | 11 (100.0%) |
Fertility by Education in Little Eagle
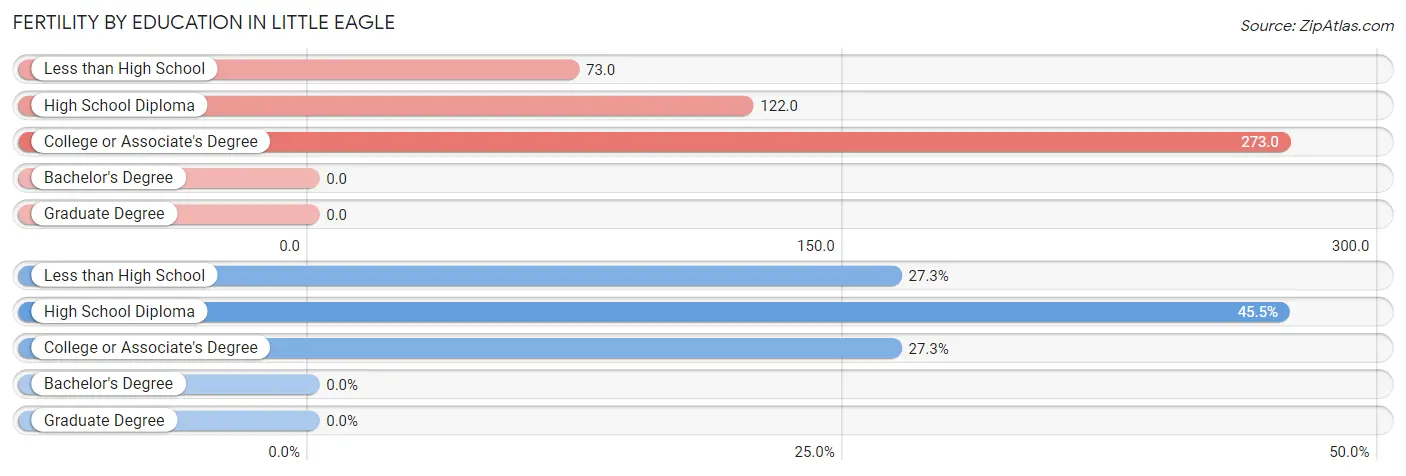
| Educational Attainment | Women with Births | Births / 1,000 Women |
| Less than High School | 3 (27.3%) | 73.0 |
| High School Diploma | 5 (45.5%) | 122.0 |
| College or Associate's Degree | 3 (27.3%) | 273.0 |
| Bachelor's Degree | 0 (0.0%) | 0.0 |
| Graduate Degree | 0 (0.0%) | 0.0 |
| Total | 11 (100.0%) | 118.0 |
Fertility by Education by Marriage Status in Little Eagle
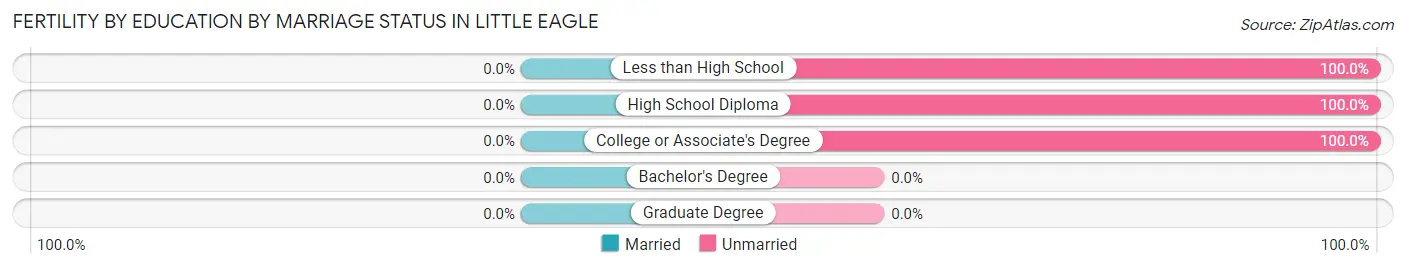
| Educational Attainment | Married | Unmarried |
| Less than High School | 0 (0.0%) | 3 (100.0%) |
| High School Diploma | 0 (0.0%) | 5 (100.0%) |
| College or Associate's Degree | 0 (0.0%) | 3 (100.0%) |
| Bachelor's Degree | 0 (0.0%) | 0 (0.0%) |
| Graduate Degree | 0 (0.0%) | 0 (0.0%) |
| Total | 0 (0.0%) | 11 (100.0%) |
Employment Characteristics in Little Eagle
Employment by Class of Employer in Little Eagle
Among the 24 employed individuals in Little Eagle, local government employees (14 | 58.3%), and private company employees (10 | 41.7%) make up the most common classes of employment.
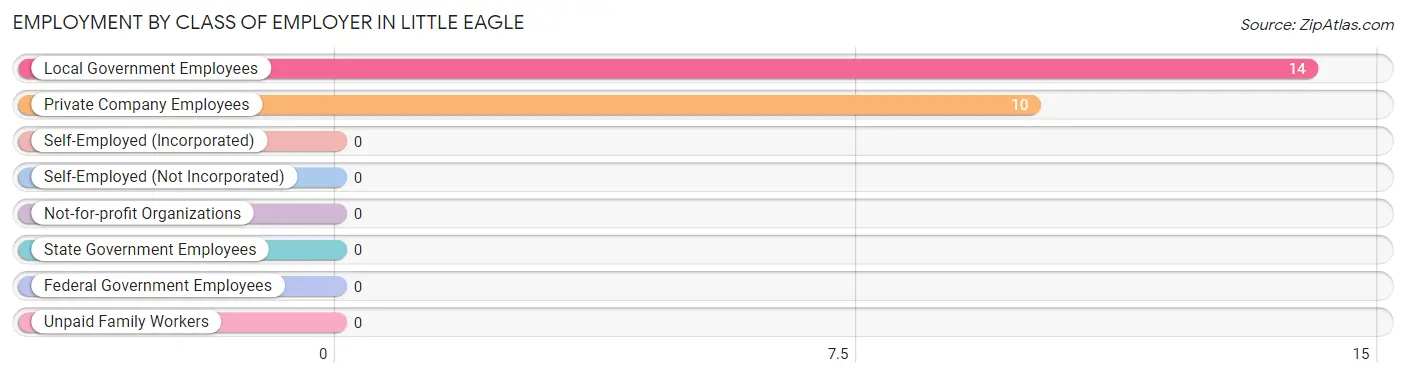
| Employer Class | # Employees | % Employees |
| Private Company Employees | 10 | 41.7% |
| Self-Employed (Incorporated) | 0 | 0.0% |
| Self-Employed (Not Incorporated) | 0 | 0.0% |
| Not-for-profit Organizations | 0 | 0.0% |
| Local Government Employees | 14 | 58.3% |
| State Government Employees | 0 | 0.0% |
| Federal Government Employees | 0 | 0.0% |
| Unpaid Family Workers | 0 | 0.0% |
| Total | 24 | 100.0% |
Employment Status by Age in Little Eagle
According to the labor force statistics for Little Eagle, out of the total population over 16 years of age (210), 37.1% or 78 individuals are in the labor force, with 69.2% or 54 of them unemployed. The age group with the highest labor force participation rate is 35 to 44 years, with 70.0% or 35 individuals in the labor force. Within the labor force, the 20 to 24 years age range has the highest percentage of unemployed individuals, with 100.0% or 16 of them being unemployed.
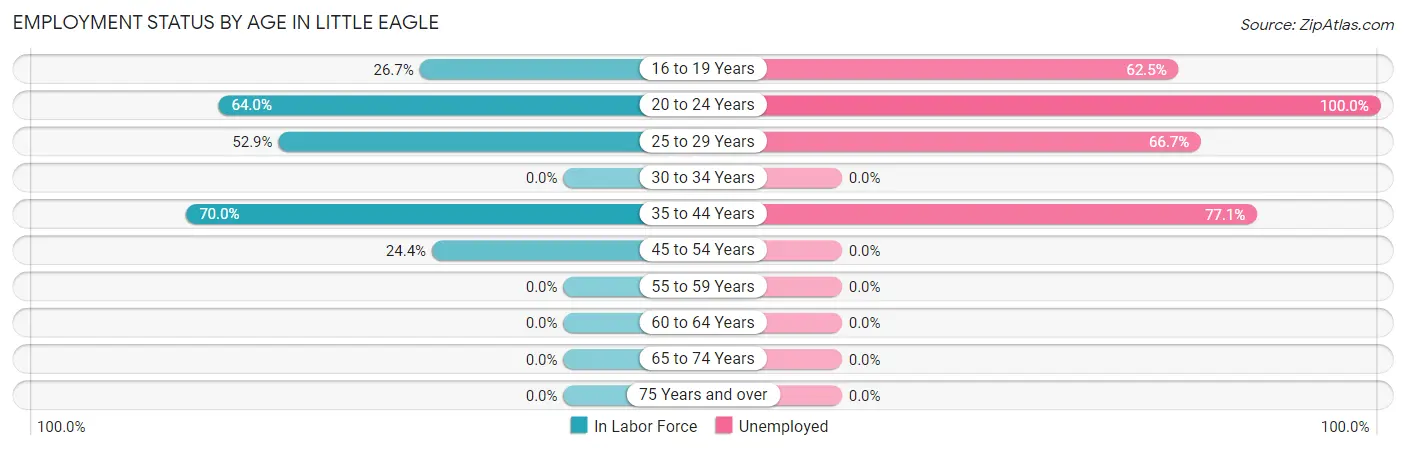
| Age Bracket | In Labor Force | Unemployed |
| 16 to 19 Years | 8 (26.7%) | 5 (62.5%) |
| 20 to 24 Years | 16 (64.0%) | 16 (100.0%) |
| 25 to 29 Years | 9 (52.9%) | 6 (66.7%) |
| 30 to 34 Years | 0 (0.0%) | 0 (0.0%) |
| 35 to 44 Years | 35 (70.0%) | 27 (77.1%) |
| 45 to 54 Years | 10 (24.4%) | 0 (0.0%) |
| 55 to 59 Years | 0 (0.0%) | 0 (0.0%) |
| 60 to 64 Years | 0 (0.0%) | 0 (0.0%) |
| 65 to 74 Years | 0 (0.0%) | 0 (0.0%) |
| 75 Years and over | 0 (0.0%) | 0 (0.0%) |
| Total | 78 (37.1%) | 54 (69.2%) |
Employment Status by Educational Attainment in Little Eagle
According to labor force statistics for Little Eagle, 37.5% of individuals (54) out of the total population between 25 and 64 years of age (144) are in the labor force, with 61.1% or 33 of them being unemployed. The group with the highest labor force participation rate are those with the educational attainment of college / associate degree, with 72.2% or 13 individuals in the labor force. Within the labor force, individuals with less than high school education have the highest percentage of unemployment, with 77.8% or 14 of them being unemployed.
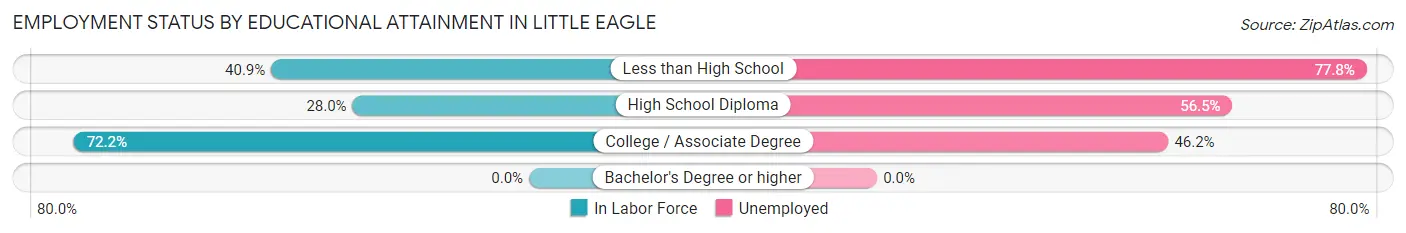
| Educational Attainment | In Labor Force | Unemployed |
| Less than High School | 18 (40.9%) | 34 (77.8%) |
| High School Diploma | 23 (28.0%) | 46 (56.5%) |
| College / Associate Degree | 13 (72.2%) | 8 (46.2%) |
| Bachelor's Degree or higher | 0 (0.0%) | 0 (0.0%) |
| Total | 54 (37.5%) | 88 (61.1%) |
Employment Occupations by Sex in Little Eagle
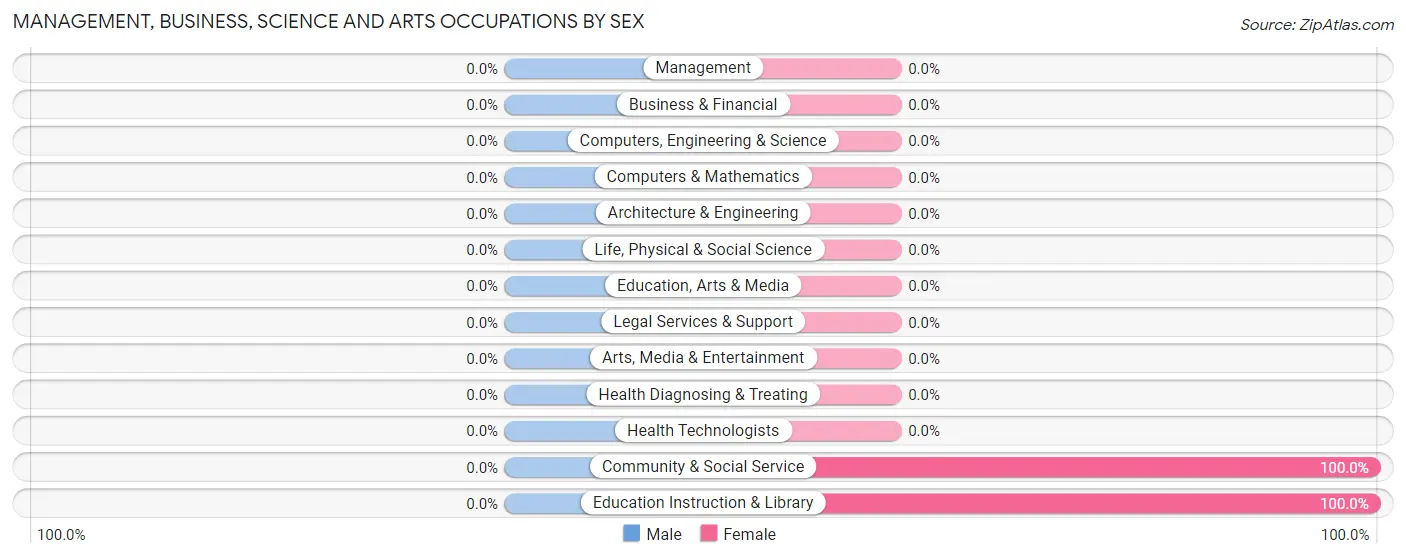
Management, Business, Science and Arts Occupations
The most common Management, Business, Science and Arts occupations in Little Eagle are Community & Social Service (4 | 16.7%), and Education Instruction & Library (4 | 16.7%).

Management, Business, Science and Arts Occupations by Sex
| Occupation | Male | Female |
| Management | 0 (0.0%) | 0 (0.0%) |
| Business & Financial | 0 (0.0%) | 0 (0.0%) |
| Computers, Engineering & Science | 0 (0.0%) | 0 (0.0%) |
| Computers & Mathematics | 0 (0.0%) | 0 (0.0%) |
| Architecture & Engineering | 0 (0.0%) | 0 (0.0%) |
| Life, Physical & Social Science | 0 (0.0%) | 0 (0.0%) |
| Community & Social Service | 0 (0.0%) | 4 (100.0%) |
| Education, Arts & Media | 0 (0.0%) | 0 (0.0%) |
| Legal Services & Support | 0 (0.0%) | 0 (0.0%) |
| Education Instruction & Library | 0 (0.0%) | 4 (100.0%) |
| Arts, Media & Entertainment | 0 (0.0%) | 0 (0.0%) |
| Health Diagnosing & Treating | 0 (0.0%) | 0 (0.0%) |
| Health Technologists | 0 (0.0%) | 0 (0.0%) |
| Total (Category) | 0 (0.0%) | 4 (100.0%) |
| Total (Overall) | 17 (70.8%) | 7 (29.2%) |
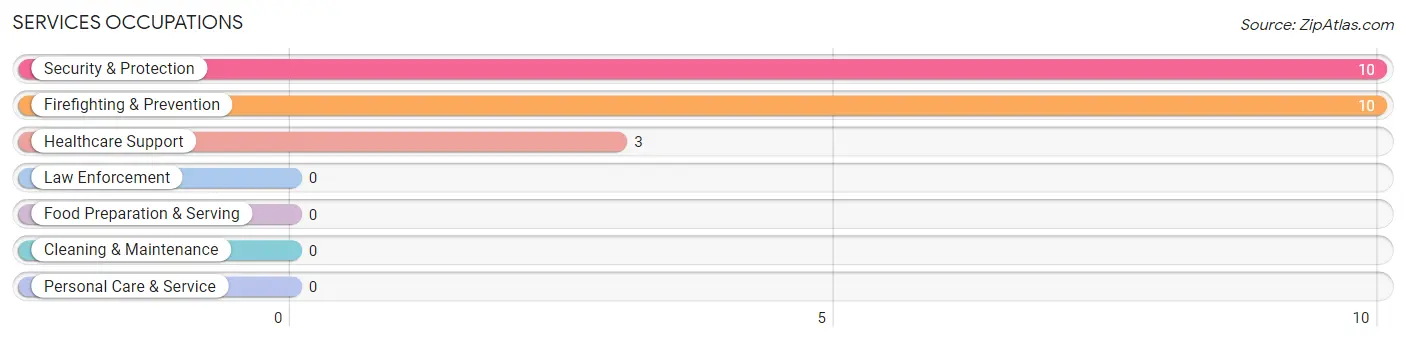
Services Occupations
The most common Services occupations in Little Eagle are Security & Protection (10 | 41.7%), Firefighting & Prevention (10 | 41.7%), and Healthcare Support (3 | 12.5%).
Services Occupations by Sex
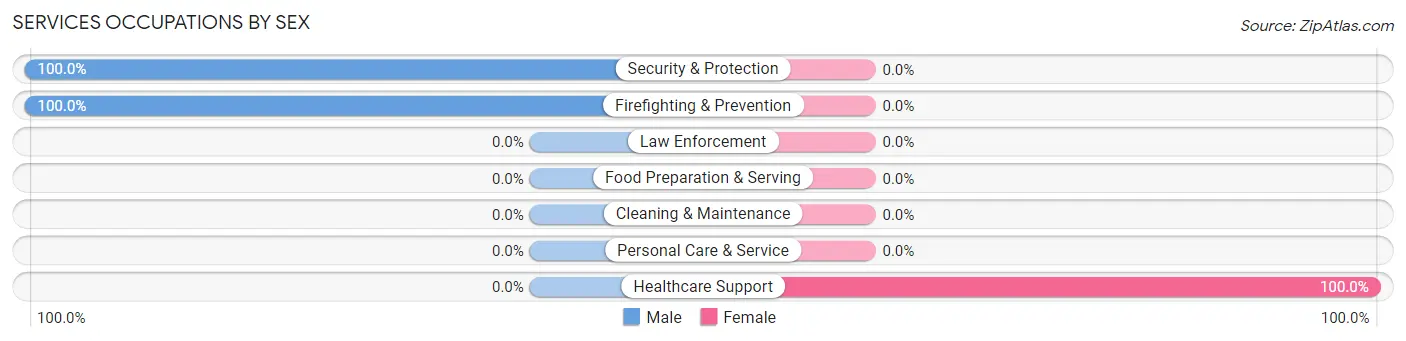
| Occupation | Male | Female |
| Healthcare Support | 0 (0.0%) | 3 (100.0%) |
| Security & Protection | 10 (100.0%) | 0 (0.0%) |
| Firefighting & Prevention | 10 (100.0%) | 0 (0.0%) |
| Law Enforcement | 0 (0.0%) | 0 (0.0%) |
| Food Preparation & Serving | 0 (0.0%) | 0 (0.0%) |
| Cleaning & Maintenance | 0 (0.0%) | 0 (0.0%) |
| Personal Care & Service | 0 (0.0%) | 0 (0.0%) |
| Total (Category) | 10 (76.9%) | 3 (23.1%) |
| Total (Overall) | 17 (70.8%) | 7 (29.2%) |
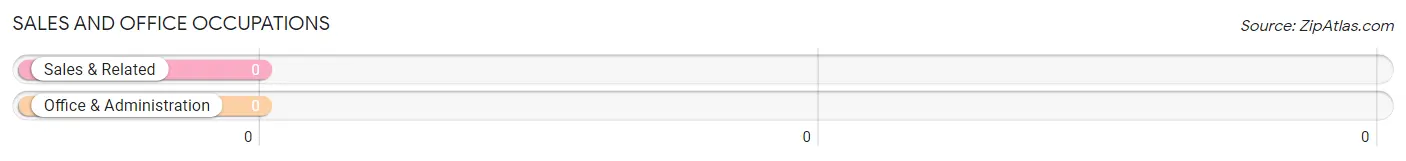
Sales and Office Occupations
Sales and Office Occupations by Sex
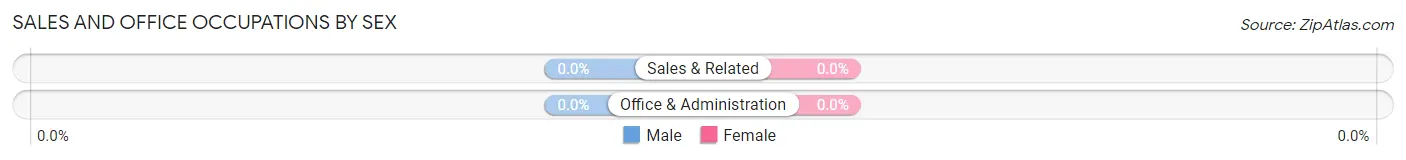
| Occupation | Male | Female |
| Sales & Related | 0 (0.0%) | 0 (0.0%) |
| Office & Administration | 0 (0.0%) | 0 (0.0%) |
| Total (Category) | 0 (0.0%) | 0 (0.0%) |
| Total (Overall) | 17 (70.8%) | 7 (29.2%) |
Natural Resources, Construction and Maintenance Occupations
Natural Resources, Construction and Maintenance Occupations by Sex
| Occupation | Male | Female |
| Farming, Fishing & Forestry | 0 (0.0%) | 0 (0.0%) |
| Construction & Extraction | 0 (0.0%) | 0 (0.0%) |
| Installation, Maintenance & Repair | 0 (0.0%) | 0 (0.0%) |
| Total (Category) | 0 (0.0%) | 0 (0.0%) |
| Total (Overall) | 17 (70.8%) | 7 (29.2%) |
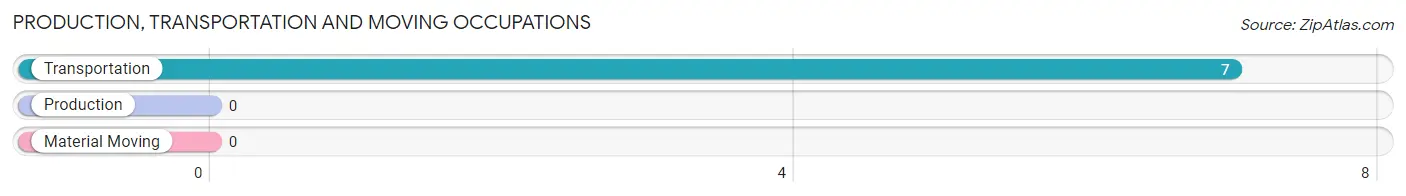
Production, Transportation and Moving Occupations
The most common Production, Transportation and Moving occupations in Little Eagle are , and Transportation (7 | 29.2%).
Production, Transportation and Moving Occupations by Sex
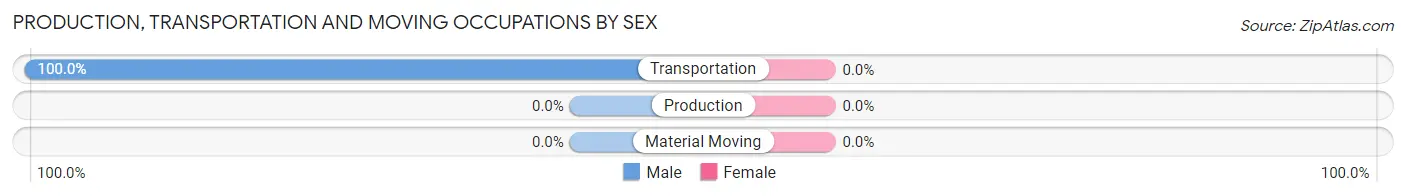
| Occupation | Male | Female |
| Production | 0 (0.0%) | 0 (0.0%) |
| Transportation | 7 (100.0%) | 0 (0.0%) |
| Material Moving | 0 (0.0%) | 0 (0.0%) |
| Total (Category) | 7 (100.0%) | 0 (0.0%) |
| Total (Overall) | 17 (70.8%) | 7 (29.2%) |
Employment Industries by Sex in Little Eagle
Employment Industries in Little Eagle
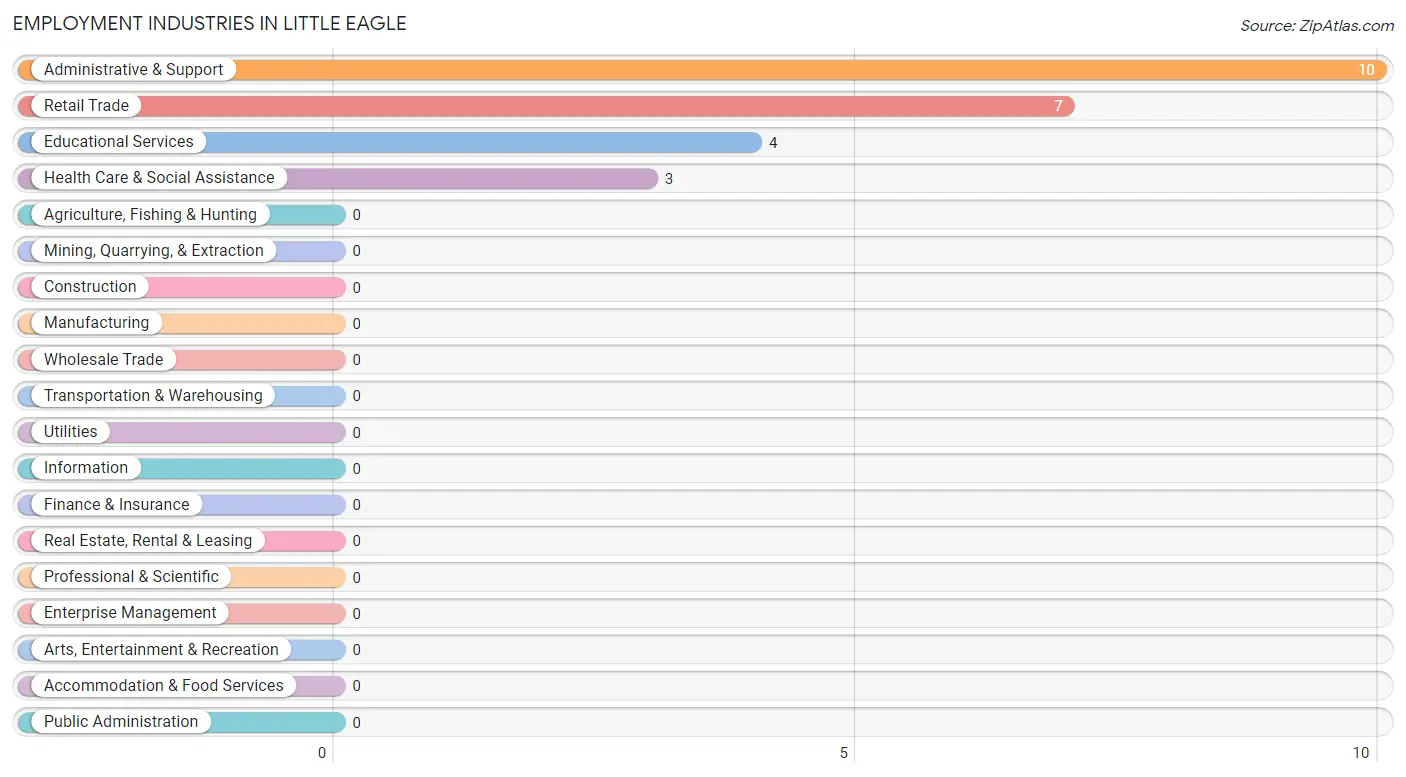
The major employment industries in Little Eagle include Administrative & Support (10 | 41.7%), Retail Trade (7 | 29.2%), Educational Services (4 | 16.7%), and Health Care & Social Assistance (3 | 12.5%).
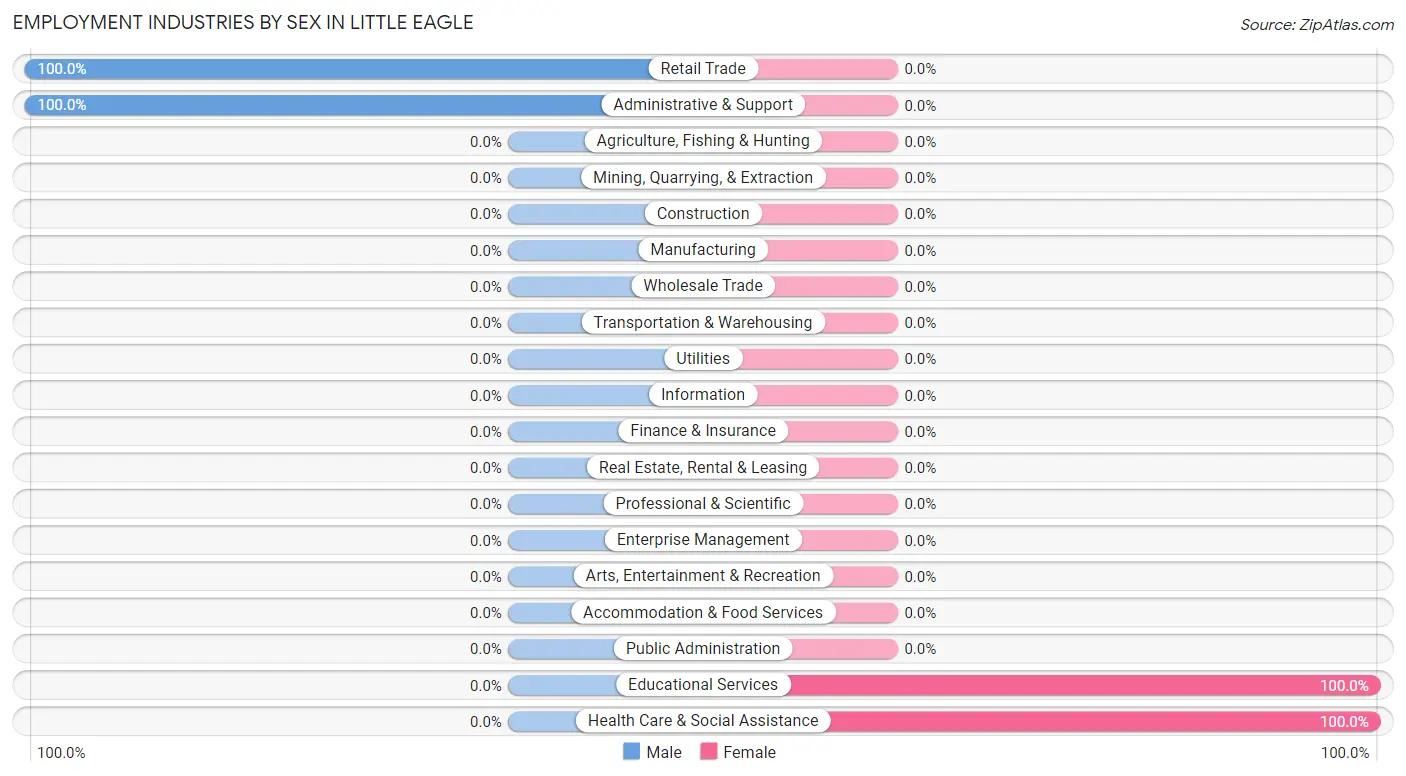
Employment Industries by Sex in Little Eagle
The Little Eagle industries that see more men than women are Retail Trade (100.0%), and Administrative & Support (100.0%), whereas the industries that tend to have a higher number of women are Educational Services (100.0%), and Health Care & Social Assistance (100.0%).
| Industry | Male | Female |
| Agriculture, Fishing & Hunting | 0 (0.0%) | 0 (0.0%) |
| Mining, Quarrying, & Extraction | 0 (0.0%) | 0 (0.0%) |
| Construction | 0 (0.0%) | 0 (0.0%) |
| Manufacturing | 0 (0.0%) | 0 (0.0%) |
| Wholesale Trade | 0 (0.0%) | 0 (0.0%) |
| Retail Trade | 7 (100.0%) | 0 (0.0%) |
| Transportation & Warehousing | 0 (0.0%) | 0 (0.0%) |
| Utilities | 0 (0.0%) | 0 (0.0%) |
| Information | 0 (0.0%) | 0 (0.0%) |
| Finance & Insurance | 0 (0.0%) | 0 (0.0%) |
| Real Estate, Rental & Leasing | 0 (0.0%) | 0 (0.0%) |
| Professional & Scientific | 0 (0.0%) | 0 (0.0%) |
| Enterprise Management | 0 (0.0%) | 0 (0.0%) |
| Administrative & Support | 10 (100.0%) | 0 (0.0%) |
| Educational Services | 0 (0.0%) | 4 (100.0%) |
| Health Care & Social Assistance | 0 (0.0%) | 3 (100.0%) |
| Arts, Entertainment & Recreation | 0 (0.0%) | 0 (0.0%) |
| Accommodation & Food Services | 0 (0.0%) | 0 (0.0%) |
| Public Administration | 0 (0.0%) | 0 (0.0%) |
| Total | 17 (70.8%) | 7 (29.2%) |
Education in Little Eagle
School Enrollment in Little Eagle
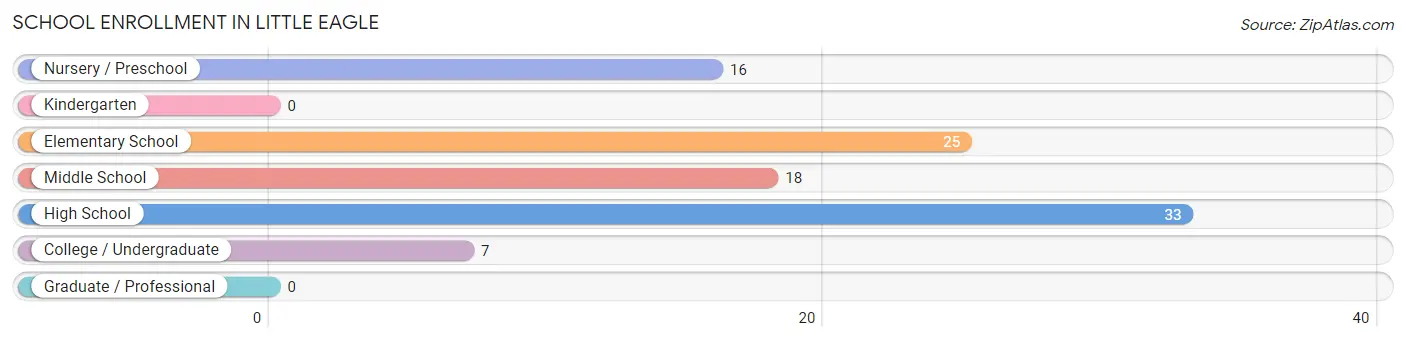
The most common levels of schooling among the 99 students in Little Eagle are high school (33 | 33.3%), elementary school (25 | 25.3%), and middle school (18 | 18.2%).
| School Level | # Students | % Students |
| Nursery / Preschool | 16 | 16.2% |
| Kindergarten | 0 | 0.0% |
| Elementary School | 25 | 25.3% |
| Middle School | 18 | 18.2% |
| High School | 33 | 33.3% |
| College / Undergraduate | 7 | 7.1% |
| Graduate / Professional | 0 | 0.0% |
| Total | 99 | 100.0% |
School Enrollment by Age by Funding Source in Little Eagle
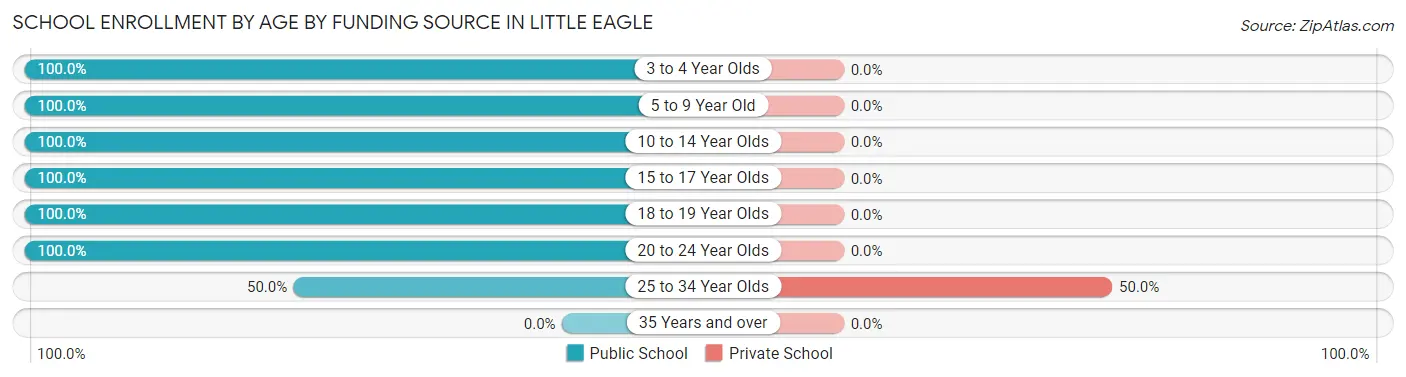
Out of a total of 99 students who are enrolled in schools in Little Eagle, 3 (3.0%) attend a private institution, while the remaining 96 (97.0%) are enrolled in public schools. The age group of 25 to 34 year olds has the highest likelihood of being enrolled in private schools, with 3 (50.0% in the age bracket) enrolled. Conversely, the age group of 3 to 4 year olds has the lowest likelihood of being enrolled in a private school, with 16 (100.0% in the age bracket) attending a public institution.
| Age Bracket | Public School | Private School |
| 3 to 4 Year Olds | 16 (100.0%) | 0 (0.0%) |
| 5 to 9 Year Old | 16 (100.0%) | 0 (0.0%) |
| 10 to 14 Year Olds | 35 (100.0%) | 0 (0.0%) |
| 15 to 17 Year Olds | 14 (100.0%) | 0 (0.0%) |
| 18 to 19 Year Olds | 8 (100.0%) | 0 (0.0%) |
| 20 to 24 Year Olds | 4 (100.0%) | 0 (0.0%) |
| 25 to 34 Year Olds | 3 (50.0%) | 3 (50.0%) |
| 35 Years and over | 0 (0.0%) | 0 (0.0%) |
| Total | 96 (97.0%) | 3 (3.0%) |
Educational Attainment by Field of Study in Little Eagle
| Field of Study | # Graduates | % Graduates |
| Computers & Mathematics | 0 | 0.0% |
| Bio, Nature & Agricultural | 0 | 0.0% |
| Physical & Health Sciences | 0 | 0.0% |
| Psychology | 0 | 0.0% |
| Social Sciences | 0 | 0.0% |
| Engineering | 0 | 0.0% |
| Multidisciplinary Studies | 0 | 0.0% |
| Science & Technology | 0 | 0.0% |
| Business | 0 | 0.0% |
| Education | 0 | 0.0% |
| Literature & Languages | 0 | 0.0% |
| Liberal Arts & History | 0 | 0.0% |
| Visual & Performing Arts | 0 | 0.0% |
| Communications | 0 | 0.0% |
| Arts & Humanities | 0 | 0.0% |
| Total | 0 | 0.0% |
Transportation & Commute in Little Eagle
Vehicle Availability by Sex in Little Eagle
The most prevalent vehicle ownership categories in Little Eagle are males with 2 vehicles (10, accounting for 58.8%) and females with 2 vehicles (0, making up 142.9%).
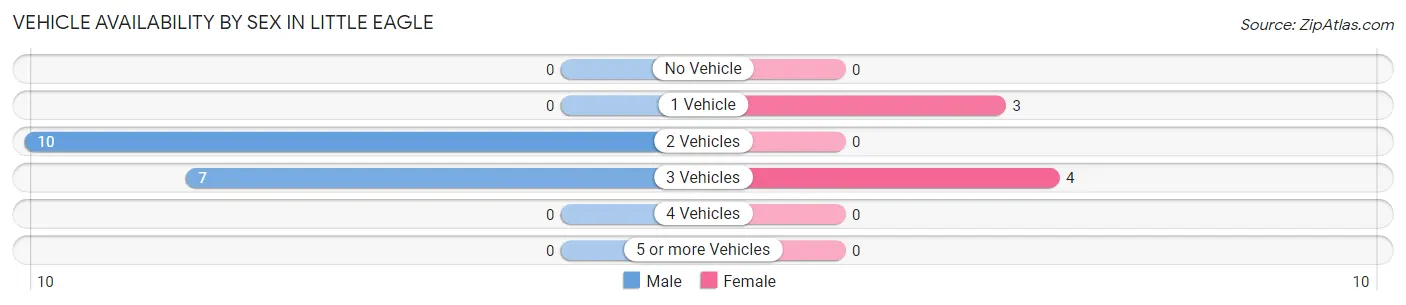
| Vehicles Available | Male | Female |
| No Vehicle | 0 (0.0%) | 0 (0.0%) |
| 1 Vehicle | 0 (0.0%) | 3 (42.9%) |
| 2 Vehicles | 10 (58.8%) | 0 (0.0%) |
| 3 Vehicles | 7 (41.2%) | 4 (57.1%) |
| 4 Vehicles | 0 (0.0%) | 0 (0.0%) |
| 5 or more Vehicles | 0 (0.0%) | 0 (0.0%) |
| Total | 17 (100.0%) | 7 (100.0%) |
Commute Time in Little Eagle
The most frequently occuring commute durations in Little Eagle are 15 to 19 minutes (11 commuters, 45.8%), 45 to 59 minutes (10 commuters, 41.7%), and 30 to 34 minutes (3 commuters, 12.5%).
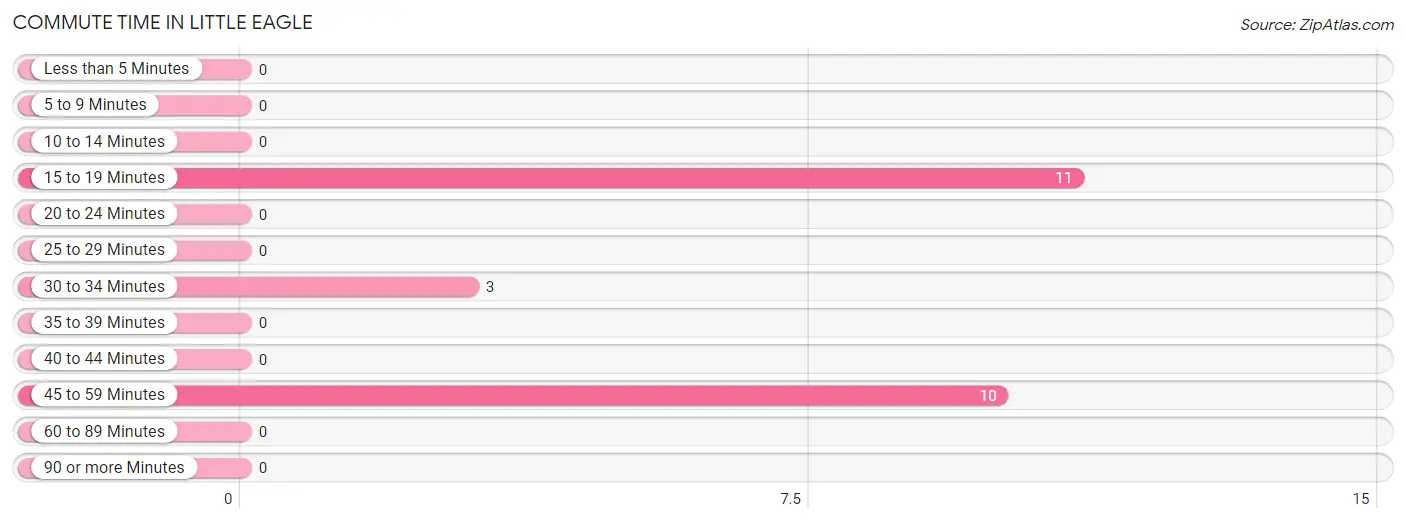
| Commute Time | # Commuters | % Commuters |
| Less than 5 Minutes | 0 | 0.0% |
| 5 to 9 Minutes | 0 | 0.0% |
| 10 to 14 Minutes | 0 | 0.0% |
| 15 to 19 Minutes | 11 | 45.8% |
| 20 to 24 Minutes | 0 | 0.0% |
| 25 to 29 Minutes | 0 | 0.0% |
| 30 to 34 Minutes | 3 | 12.5% |
| 35 to 39 Minutes | 0 | 0.0% |
| 40 to 44 Minutes | 0 | 0.0% |
| 45 to 59 Minutes | 10 | 41.7% |
| 60 to 89 Minutes | 0 | 0.0% |
| 90 or more Minutes | 0 | 0.0% |
Commute Time by Sex in Little Eagle
The most common commute times in Little Eagle are 45 to 59 minutes (10 commuters, 58.8%) for males and 15 to 19 minutes (4 commuters, 57.1%) for females.
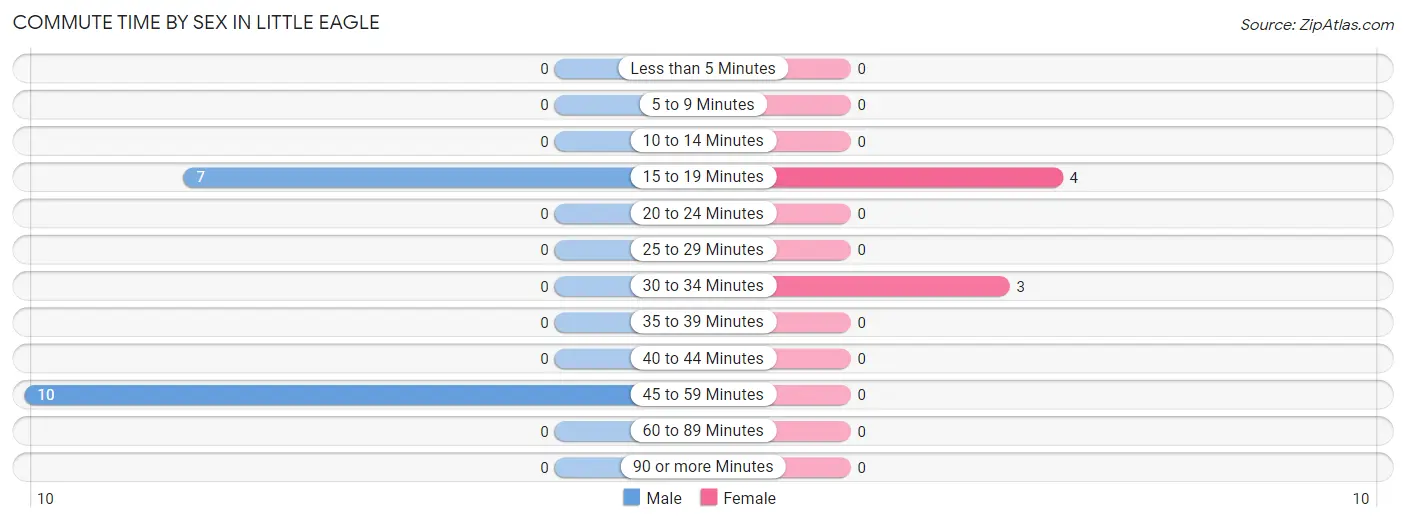
| Commute Time | Male | Female |
| Less than 5 Minutes | 0 (0.0%) | 0 (0.0%) |
| 5 to 9 Minutes | 0 (0.0%) | 0 (0.0%) |
| 10 to 14 Minutes | 0 (0.0%) | 0 (0.0%) |
| 15 to 19 Minutes | 7 (41.2%) | 4 (57.1%) |
| 20 to 24 Minutes | 0 (0.0%) | 0 (0.0%) |
| 25 to 29 Minutes | 0 (0.0%) | 0 (0.0%) |
| 30 to 34 Minutes | 0 (0.0%) | 3 (42.9%) |
| 35 to 39 Minutes | 0 (0.0%) | 0 (0.0%) |
| 40 to 44 Minutes | 0 (0.0%) | 0 (0.0%) |
| 45 to 59 Minutes | 10 (58.8%) | 0 (0.0%) |
| 60 to 89 Minutes | 0 (0.0%) | 0 (0.0%) |
| 90 or more Minutes | 0 (0.0%) | 0 (0.0%) |
Time of Departure to Work by Sex in Little Eagle
The most frequent times of departure to work in Little Eagle are 7:00 AM to 7:29 AM (14, 82.4%) for males and 7:00 AM to 7:29 AM (4, 57.1%) for females.
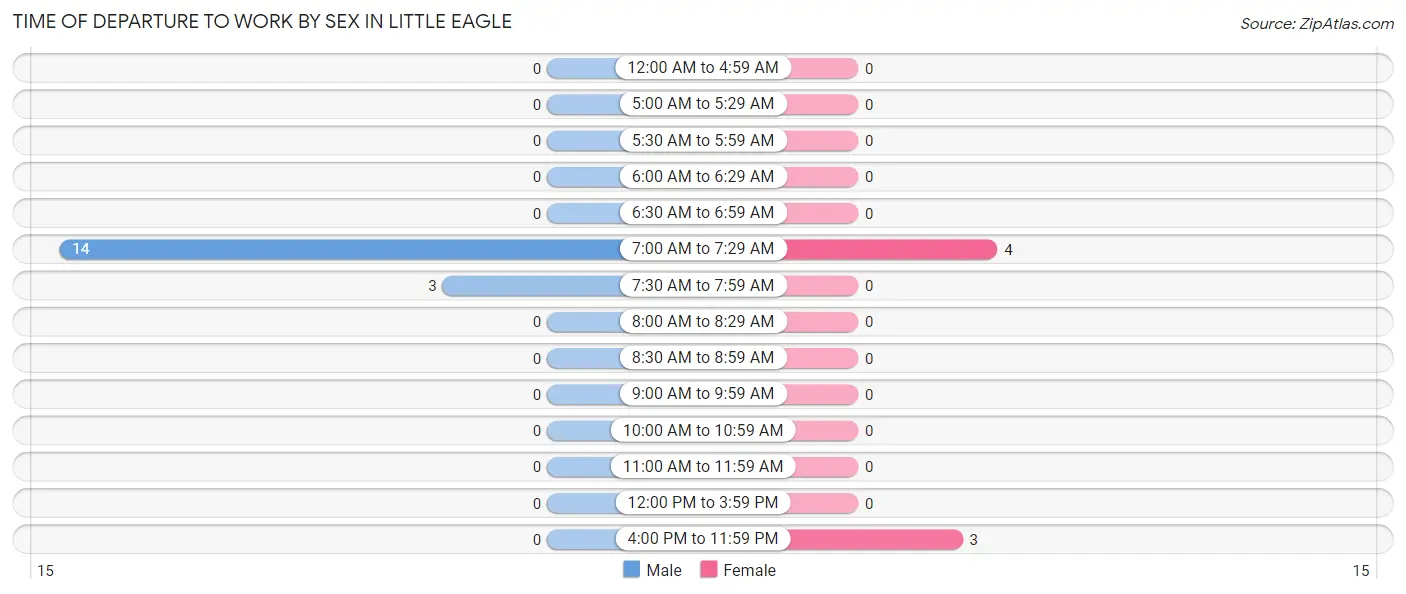
| Time of Departure | Male | Female |
| 12:00 AM to 4:59 AM | 0 (0.0%) | 0 (0.0%) |
| 5:00 AM to 5:29 AM | 0 (0.0%) | 0 (0.0%) |
| 5:30 AM to 5:59 AM | 0 (0.0%) | 0 (0.0%) |
| 6:00 AM to 6:29 AM | 0 (0.0%) | 0 (0.0%) |
| 6:30 AM to 6:59 AM | 0 (0.0%) | 0 (0.0%) |
| 7:00 AM to 7:29 AM | 14 (82.4%) | 4 (57.1%) |
| 7:30 AM to 7:59 AM | 3 (17.6%) | 0 (0.0%) |
| 8:00 AM to 8:29 AM | 0 (0.0%) | 0 (0.0%) |
| 8:30 AM to 8:59 AM | 0 (0.0%) | 0 (0.0%) |
| 9:00 AM to 9:59 AM | 0 (0.0%) | 0 (0.0%) |
| 10:00 AM to 10:59 AM | 0 (0.0%) | 0 (0.0%) |
| 11:00 AM to 11:59 AM | 0 (0.0%) | 0 (0.0%) |
| 12:00 PM to 3:59 PM | 0 (0.0%) | 0 (0.0%) |
| 4:00 PM to 11:59 PM | 0 (0.0%) | 3 (42.9%) |
| Total | 17 (100.0%) | 7 (100.0%) |
Housing Occupancy in Little Eagle
Occupancy by Ownership in Little Eagle
Of the total 70 dwellings in Little Eagle, owner-occupied units account for 5 (7.1%), while renter-occupied units make up 65 (92.9%).
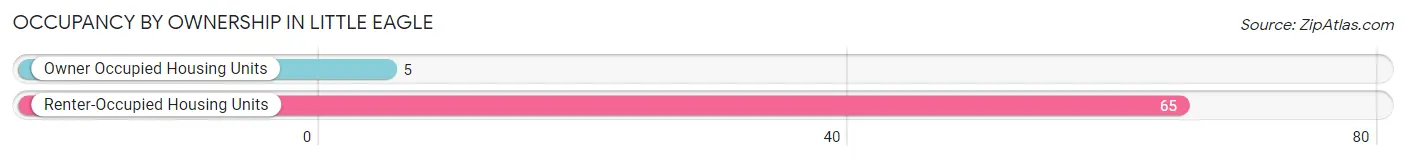
| Occupancy | # Housing Units | % Housing Units |
| Owner Occupied Housing Units | 5 | 7.1% |
| Renter-Occupied Housing Units | 65 | 92.9% |
| Total Occupied Housing Units | 70 | 100.0% |
Occupancy by Household Size in Little Eagle
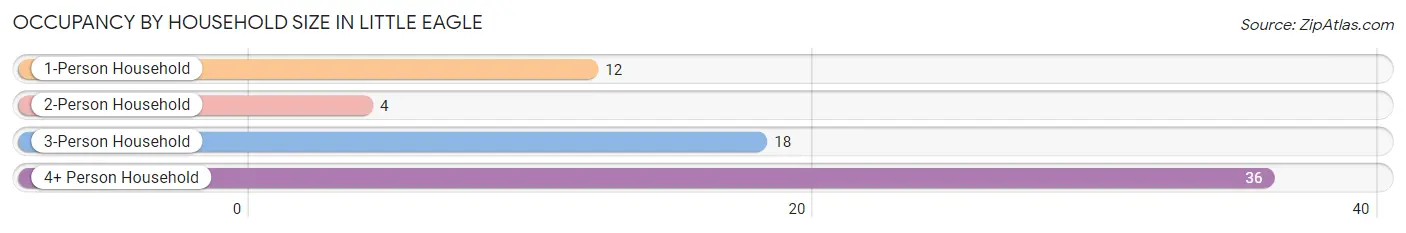
| Household Size | # Housing Units | % Housing Units |
| 1-Person Household | 12 | 17.1% |
| 2-Person Household | 4 | 5.7% |
| 3-Person Household | 18 | 25.7% |
| 4+ Person Household | 36 | 51.4% |
| Total Housing Units | 70 | 100.0% |
Occupancy by Ownership by Household Size in Little Eagle
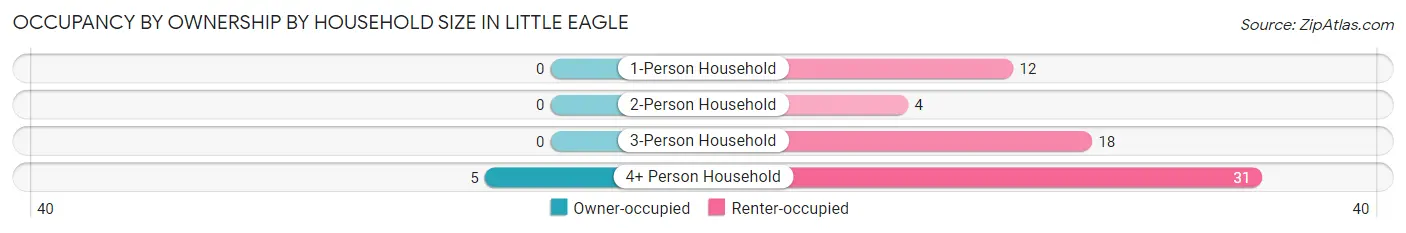
| Household Size | Owner-occupied | Renter-occupied |
| 1-Person Household | 0 (0.0%) | 12 (100.0%) |
| 2-Person Household | 0 (0.0%) | 4 (100.0%) |
| 3-Person Household | 0 (0.0%) | 18 (100.0%) |
| 4+ Person Household | 5 (13.9%) | 31 (86.1%) |
| Total Housing Units | 5 (7.1%) | 65 (92.9%) |
Occupancy by Educational Attainment in Little Eagle
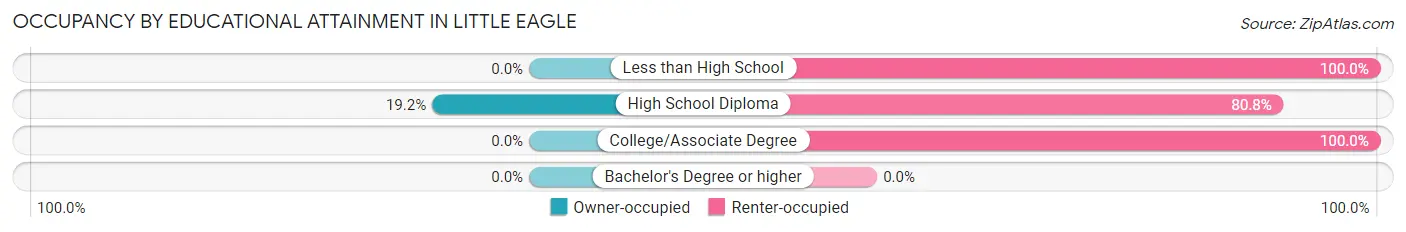
| Household Size | Owner-occupied | Renter-occupied |
| Less than High School | 0 (0.0%) | 23 (100.0%) |
| High School Diploma | 5 (19.2%) | 21 (80.8%) |
| College/Associate Degree | 0 (0.0%) | 21 (100.0%) |
| Bachelor's Degree or higher | 0 (0.0%) | 0 (0.0%) |
Occupancy by Age of Householder in Little Eagle
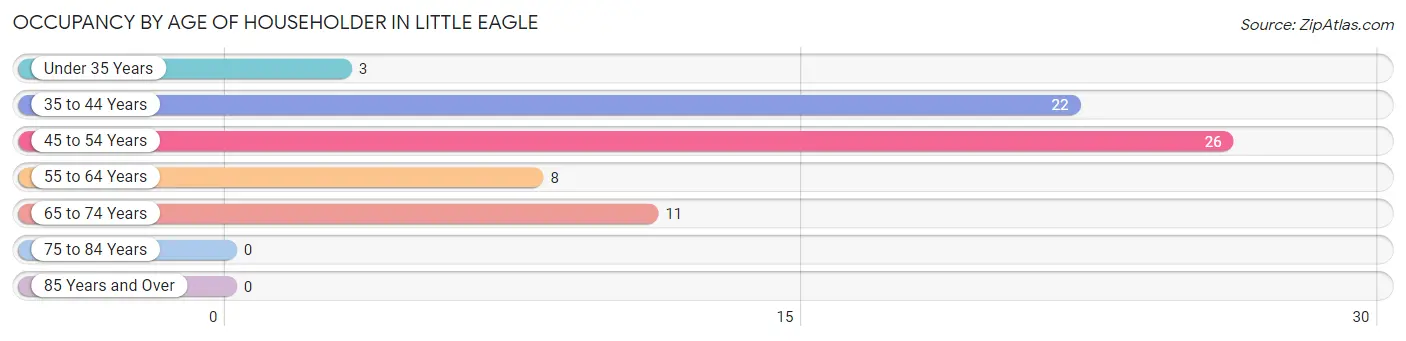
| Age Bracket | # Households | % Households |
| Under 35 Years | 3 | 4.3% |
| 35 to 44 Years | 22 | 31.4% |
| 45 to 54 Years | 26 | 37.1% |
| 55 to 64 Years | 8 | 11.4% |
| 65 to 74 Years | 11 | 15.7% |
| 75 to 84 Years | 0 | 0.0% |
| 85 Years and Over | 0 | 0.0% |
| Total | 70 | 100.0% |
Housing Finances in Little Eagle
Median Income by Occupancy in Little Eagle
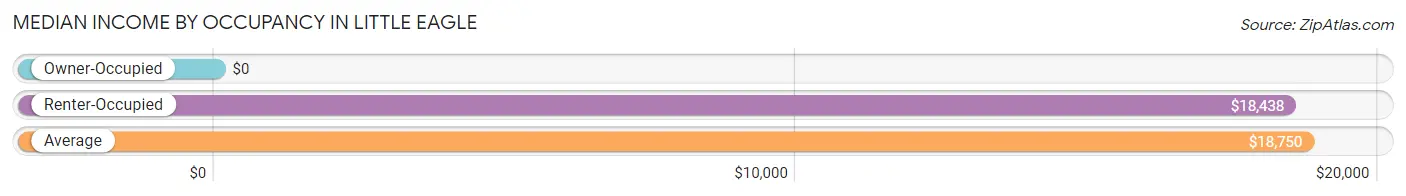
| Occupancy Type | # Households | Median Income |
| Owner-Occupied | 5 (7.1%) | $0 |
| Renter-Occupied | 65 (92.9%) | $18,438 |
| Average | 70 (100.0%) | $18,750 |
Occupancy by Householder Income Bracket in Little Eagle
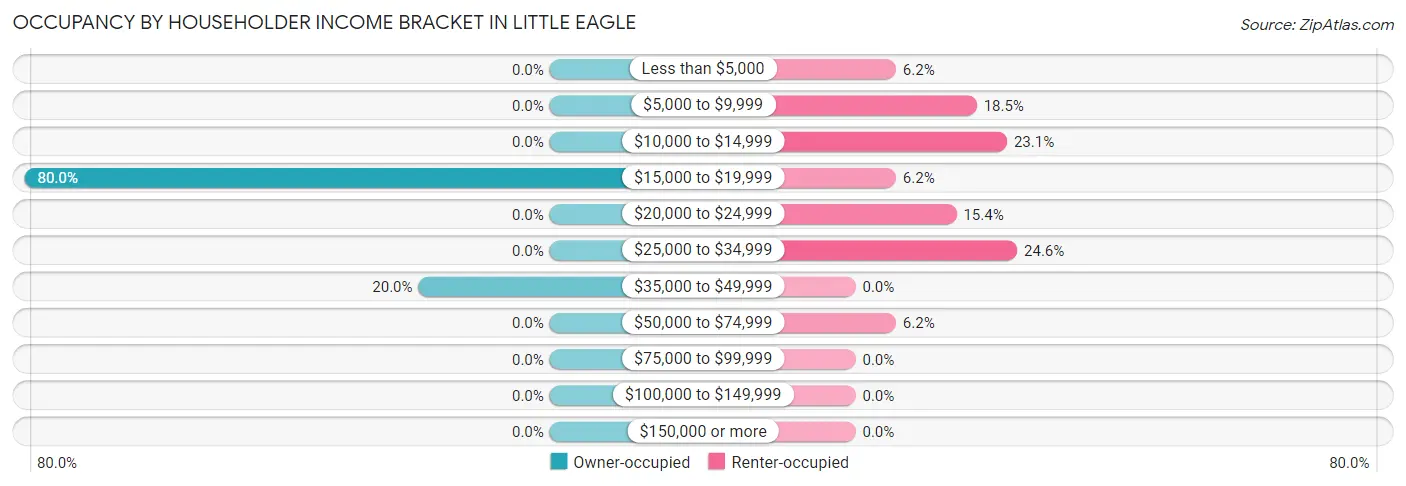
| Income Bracket | Owner-occupied | Renter-occupied |
| Less than $5,000 | 0 (0.0%) | 4 (6.1%) |
| $5,000 to $9,999 | 0 (0.0%) | 12 (18.5%) |
| $10,000 to $14,999 | 0 (0.0%) | 15 (23.1%) |
| $15,000 to $19,999 | 4 (80.0%) | 4 (6.1%) |
| $20,000 to $24,999 | 0 (0.0%) | 10 (15.4%) |
| $25,000 to $34,999 | 0 (0.0%) | 16 (24.6%) |
| $35,000 to $49,999 | 1 (20.0%) | 0 (0.0%) |
| $50,000 to $74,999 | 0 (0.0%) | 4 (6.1%) |
| $75,000 to $99,999 | 0 (0.0%) | 0 (0.0%) |
| $100,000 to $149,999 | 0 (0.0%) | 0 (0.0%) |
| $150,000 or more | 0 (0.0%) | 0 (0.0%) |
| Total | 5 (100.0%) | 65 (100.0%) |
Monthly Housing Cost Tiers in Little Eagle
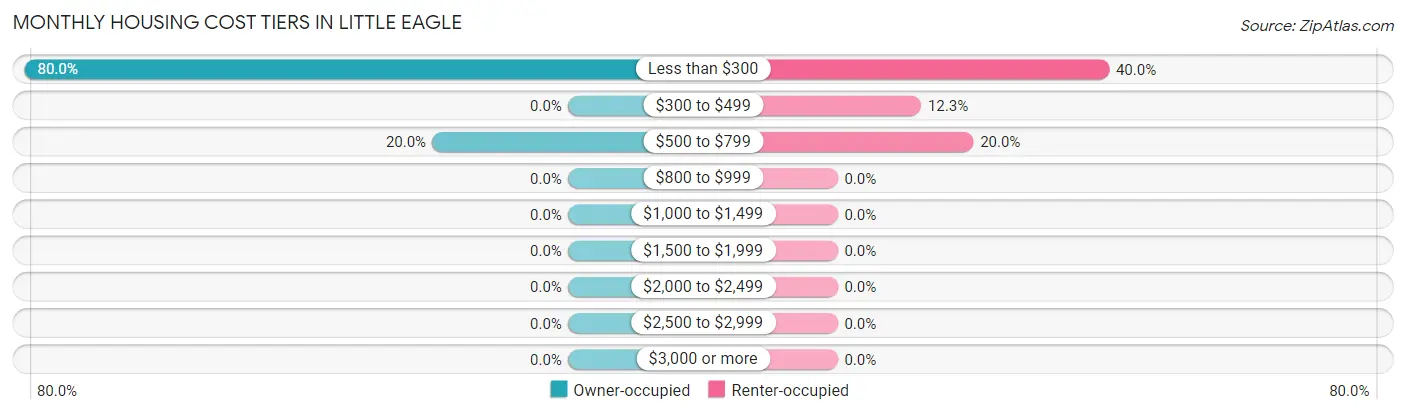
| Monthly Cost | Owner-occupied | Renter-occupied |
| Less than $300 | 4 (80.0%) | 26 (40.0%) |
| $300 to $499 | 0 (0.0%) | 8 (12.3%) |
| $500 to $799 | 1 (20.0%) | 13 (20.0%) |
| $800 to $999 | 0 (0.0%) | 0 (0.0%) |
| $1,000 to $1,499 | 0 (0.0%) | 0 (0.0%) |
| $1,500 to $1,999 | 0 (0.0%) | 0 (0.0%) |
| $2,000 to $2,499 | 0 (0.0%) | 0 (0.0%) |
| $2,500 to $2,999 | 0 (0.0%) | 0 (0.0%) |
| $3,000 or more | 0 (0.0%) | 0 (0.0%) |
| Total | 5 (100.0%) | 65 (100.0%) |
Physical Housing Characteristics in Little Eagle
Housing Structures in Little Eagle
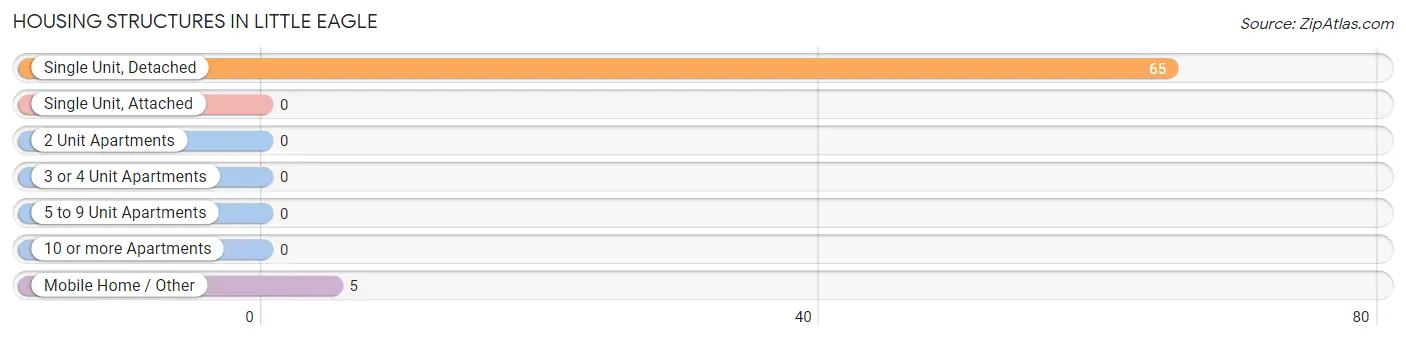
| Structure Type | # Housing Units | % Housing Units |
| Single Unit, Detached | 65 | 92.9% |
| Single Unit, Attached | 0 | 0.0% |
| 2 Unit Apartments | 0 | 0.0% |
| 3 or 4 Unit Apartments | 0 | 0.0% |
| 5 to 9 Unit Apartments | 0 | 0.0% |
| 10 or more Apartments | 0 | 0.0% |
| Mobile Home / Other | 5 | 7.1% |
| Total | 70 | 100.0% |
Housing Structures by Occupancy in Little Eagle
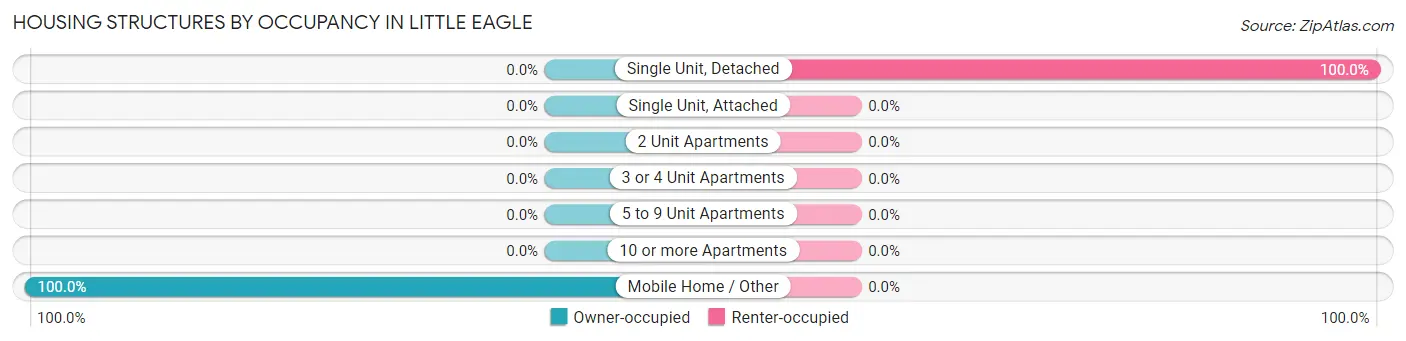
| Structure Type | Owner-occupied | Renter-occupied |
| Single Unit, Detached | 0 (0.0%) | 65 (100.0%) |
| Single Unit, Attached | 0 (0.0%) | 0 (0.0%) |
| 2 Unit Apartments | 0 (0.0%) | 0 (0.0%) |
| 3 or 4 Unit Apartments | 0 (0.0%) | 0 (0.0%) |
| 5 to 9 Unit Apartments | 0 (0.0%) | 0 (0.0%) |
| 10 or more Apartments | 0 (0.0%) | 0 (0.0%) |
| Mobile Home / Other | 5 (100.0%) | 0 (0.0%) |
| Total | 5 (7.1%) | 65 (92.9%) |
Housing Structures by Number of Rooms in Little Eagle
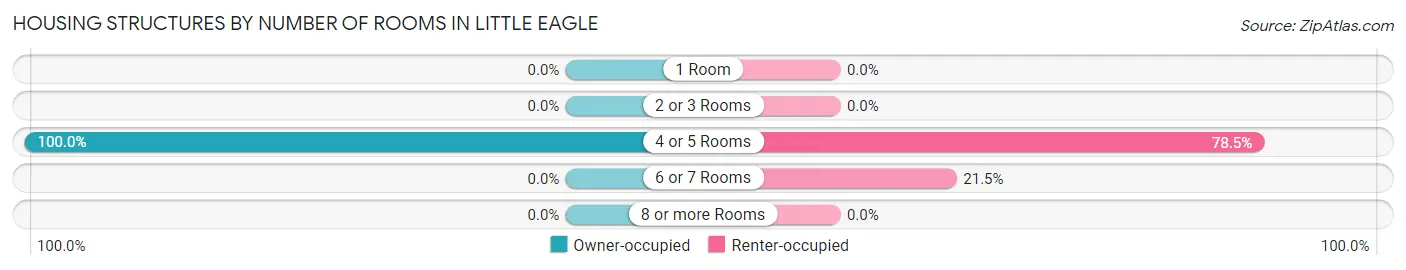
| Number of Rooms | Owner-occupied | Renter-occupied |
| 1 Room | 0 (0.0%) | 0 (0.0%) |
| 2 or 3 Rooms | 0 (0.0%) | 0 (0.0%) |
| 4 or 5 Rooms | 5 (100.0%) | 51 (78.5%) |
| 6 or 7 Rooms | 0 (0.0%) | 14 (21.5%) |
| 8 or more Rooms | 0 (0.0%) | 0 (0.0%) |
| Total | 5 (100.0%) | 65 (100.0%) |
Housing Structure by Heating Type in Little Eagle
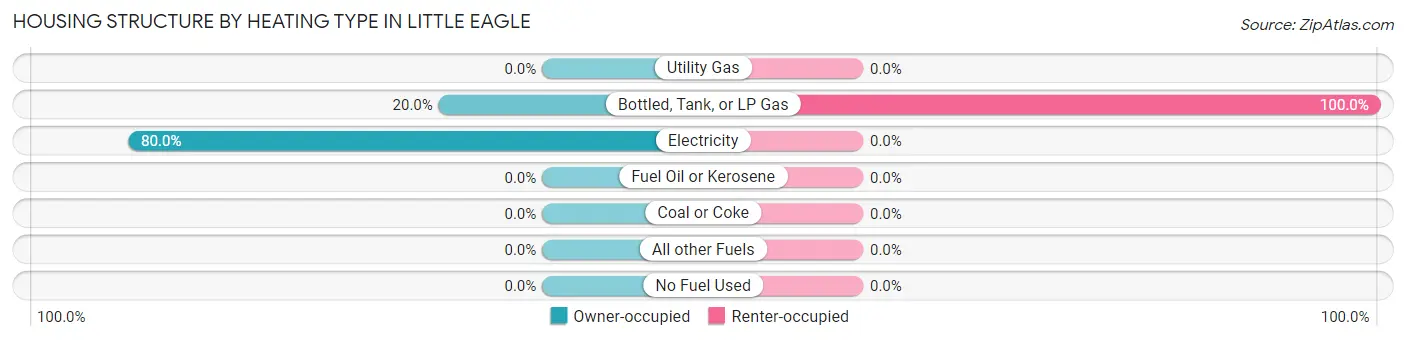
| Heating Type | Owner-occupied | Renter-occupied |
| Utility Gas | 0 (0.0%) | 0 (0.0%) |
| Bottled, Tank, or LP Gas | 1 (20.0%) | 65 (100.0%) |
| Electricity | 4 (80.0%) | 0 (0.0%) |
| Fuel Oil or Kerosene | 0 (0.0%) | 0 (0.0%) |
| Coal or Coke | 0 (0.0%) | 0 (0.0%) |
| All other Fuels | 0 (0.0%) | 0 (0.0%) |
| No Fuel Used | 0 (0.0%) | 0 (0.0%) |
| Total | 5 (100.0%) | 65 (100.0%) |
Household Vehicle Usage in Little Eagle
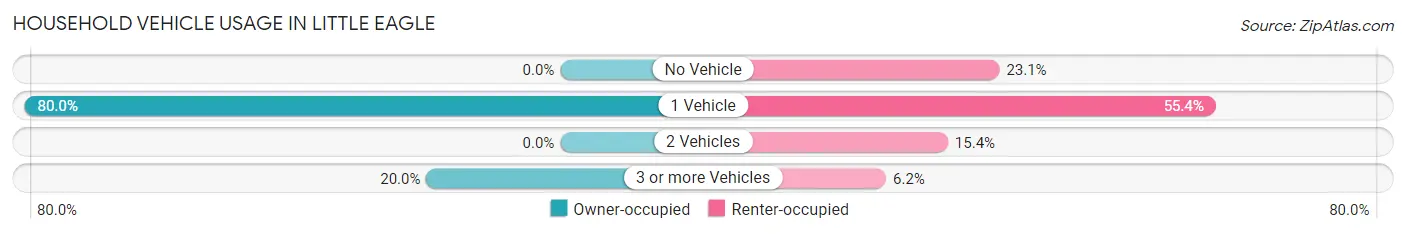
| Vehicles per Household | Owner-occupied | Renter-occupied |
| No Vehicle | 0 (0.0%) | 15 (23.1%) |
| 1 Vehicle | 4 (80.0%) | 36 (55.4%) |
| 2 Vehicles | 0 (0.0%) | 10 (15.4%) |
| 3 or more Vehicles | 1 (20.0%) | 4 (6.1%) |
| Total | 5 (100.0%) | 65 (100.0%) |
Real Estate & Mortgages in Little Eagle
Real Estate and Mortgage Overview in Little Eagle
| Characteristic | Without Mortgage | With Mortgage |
| Housing Units | 4 | 1 |
| Median Property Value | - | - |
| Median Household Income | - | - |
| Monthly Housing Costs | - | - |
| Real Estate Taxes | - | - |
Property Value by Mortgage Status in Little Eagle
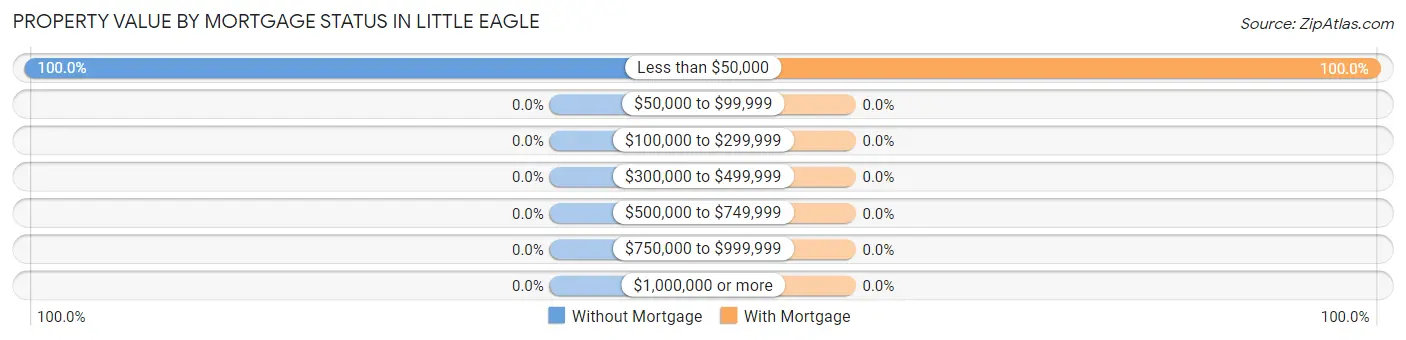
| Property Value | Without Mortgage | With Mortgage |
| Less than $50,000 | 4 (100.0%) | 1 (100.0%) |
| $50,000 to $99,999 | 0 (0.0%) | 0 (0.0%) |
| $100,000 to $299,999 | 0 (0.0%) | 0 (0.0%) |
| $300,000 to $499,999 | 0 (0.0%) | 0 (0.0%) |
| $500,000 to $749,999 | 0 (0.0%) | 0 (0.0%) |
| $750,000 to $999,999 | 0 (0.0%) | 0 (0.0%) |
| $1,000,000 or more | 0 (0.0%) | 0 (0.0%) |
| Total | 4 (100.0%) | 1 (100.0%) |
Household Income by Mortgage Status in Little Eagle
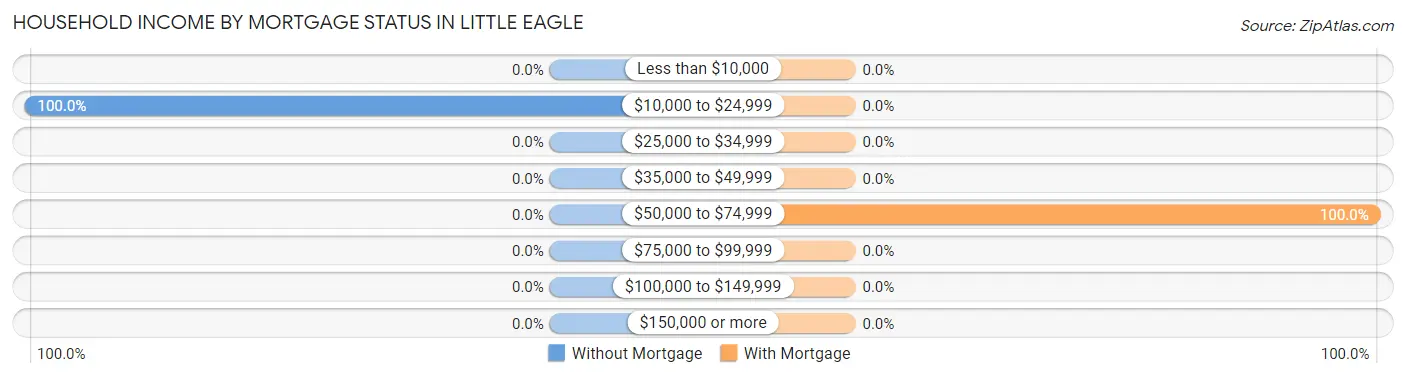
| Household Income | Without Mortgage | With Mortgage |
| Less than $10,000 | 0 (0.0%) | 0 (0.0%) |
| $10,000 to $24,999 | 4 (100.0%) | 0 (0.0%) |
| $25,000 to $34,999 | 0 (0.0%) | 0 (0.0%) |
| $35,000 to $49,999 | 0 (0.0%) | 0 (0.0%) |
| $50,000 to $74,999 | 0 (0.0%) | 1 (100.0%) |
| $75,000 to $99,999 | 0 (0.0%) | 0 (0.0%) |
| $100,000 to $149,999 | 0 (0.0%) | 0 (0.0%) |
| $150,000 or more | 0 (0.0%) | 0 (0.0%) |
| Total | 4 (100.0%) | 1 (100.0%) |
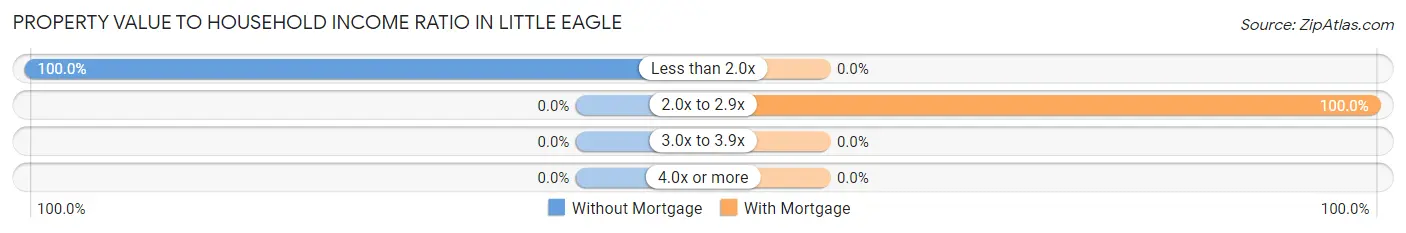
Property Value to Household Income Ratio in Little Eagle
| Value-to-Income Ratio | Without Mortgage | With Mortgage |
| Less than 2.0x | 4 (100.0%) | 0 (0.0%) |
| 2.0x to 2.9x | 0 (0.0%) | 1 (100.0%) |
| 3.0x to 3.9x | 0 (0.0%) | 0 (0.0%) |
| 4.0x or more | 0 (0.0%) | 0 (0.0%) |
| Total | 4 (100.0%) | 1 (100.0%) |
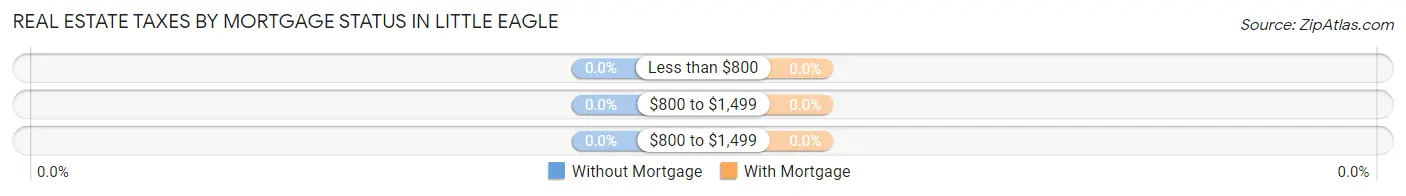
Real Estate Taxes by Mortgage Status in Little Eagle
| Property Taxes | Without Mortgage | With Mortgage |
| Less than $800 | 0 (0.0%) | 0 (0.0%) |
| $800 to $1,499 | 0 (0.0%) | 0 (0.0%) |
| $800 to $1,499 | 0 (0.0%) | 0 (0.0%) |
| Total | 4 (100.0%) | 1 (100.0%) |
Health & Disability in Little Eagle
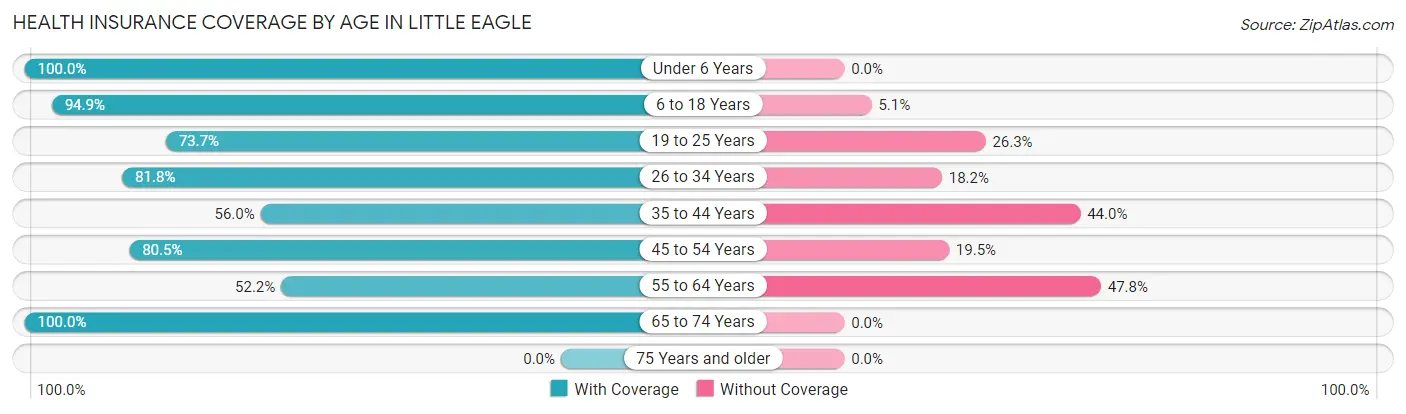
Health Insurance Coverage by Age in Little Eagle
| Age Bracket | With Coverage | Without Coverage |
| Under 6 Years | 79 (100.0%) | 0 (0.0%) |
| 6 to 18 Years | 75 (94.9%) | 4 (5.1%) |
| 19 to 25 Years | 28 (73.7%) | 10 (26.3%) |
| 26 to 34 Years | 18 (81.8%) | 4 (18.2%) |
| 35 to 44 Years | 28 (56.0%) | 22 (44.0%) |
| 45 to 54 Years | 33 (80.5%) | 8 (19.5%) |
| 55 to 64 Years | 12 (52.2%) | 11 (47.8%) |
| 65 to 74 Years | 11 (100.0%) | 0 (0.0%) |
| 75 Years and older | 0 (0.0%) | 0 (0.0%) |
| Total | 284 (82.8%) | 59 (17.2%) |
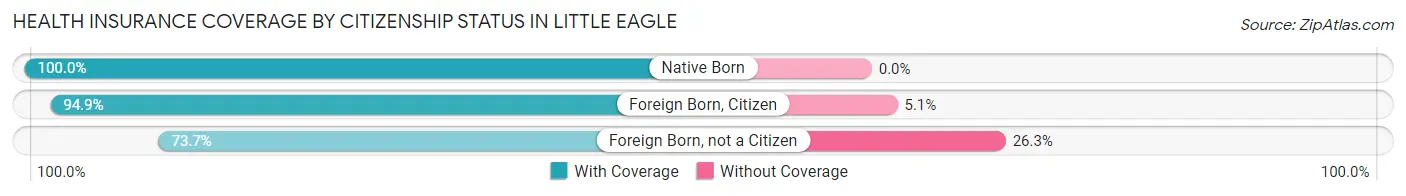
Health Insurance Coverage by Citizenship Status in Little Eagle
| Citizenship Status | With Coverage | Without Coverage |
| Native Born | 79 (100.0%) | 0 (0.0%) |
| Foreign Born, Citizen | 75 (94.9%) | 4 (5.1%) |
| Foreign Born, not a Citizen | 28 (73.7%) | 10 (26.3%) |
Health Insurance Coverage by Household Income in Little Eagle
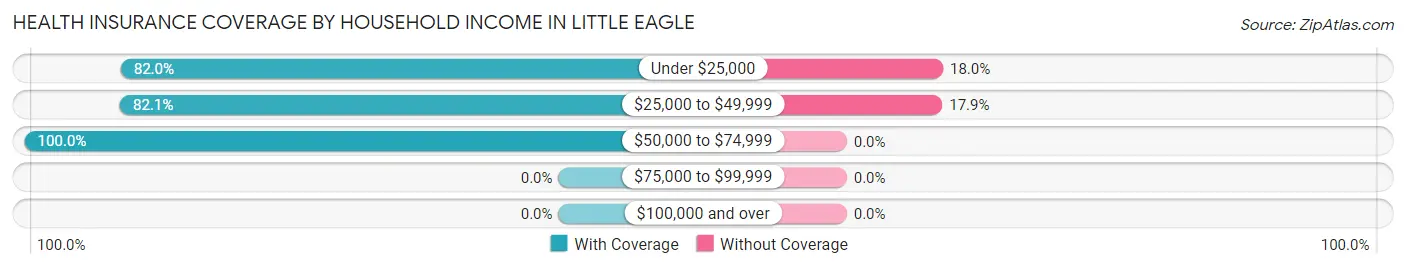
| Household Income | With Coverage | Without Coverage |
| Under $25,000 | 191 (82.0%) | 42 (18.0%) |
| $25,000 to $49,999 | 78 (82.1%) | 17 (17.9%) |
| $50,000 to $74,999 | 15 (100.0%) | 0 (0.0%) |
| $75,000 to $99,999 | 0 (0.0%) | 0 (0.0%) |
| $100,000 and over | 0 (0.0%) | 0 (0.0%) |
Public vs Private Health Insurance Coverage by Age in Little Eagle
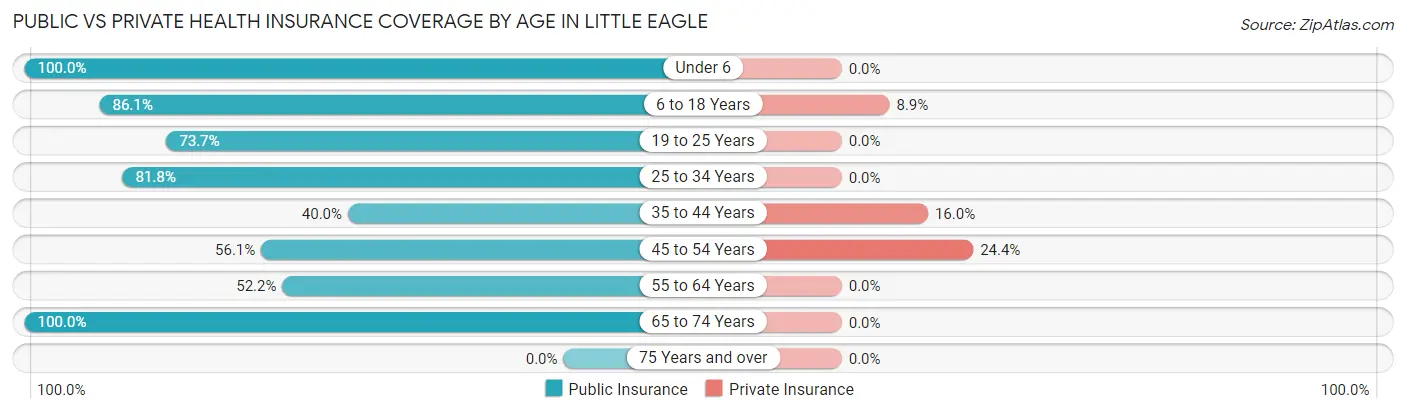
| Age Bracket | Public Insurance | Private Insurance |
| Under 6 | 79 (100.0%) | 0 (0.0%) |
| 6 to 18 Years | 68 (86.1%) | 7 (8.9%) |
| 19 to 25 Years | 28 (73.7%) | 0 (0.0%) |
| 25 to 34 Years | 18 (81.8%) | 0 (0.0%) |
| 35 to 44 Years | 20 (40.0%) | 8 (16.0%) |
| 45 to 54 Years | 23 (56.1%) | 10 (24.4%) |
| 55 to 64 Years | 12 (52.2%) | 0 (0.0%) |
| 65 to 74 Years | 11 (100.0%) | 0 (0.0%) |
| 75 Years and over | 0 (0.0%) | 0 (0.0%) |
| Total | 259 (75.5%) | 25 (7.3%) |
Disability Status by Sex by Age in Little Eagle
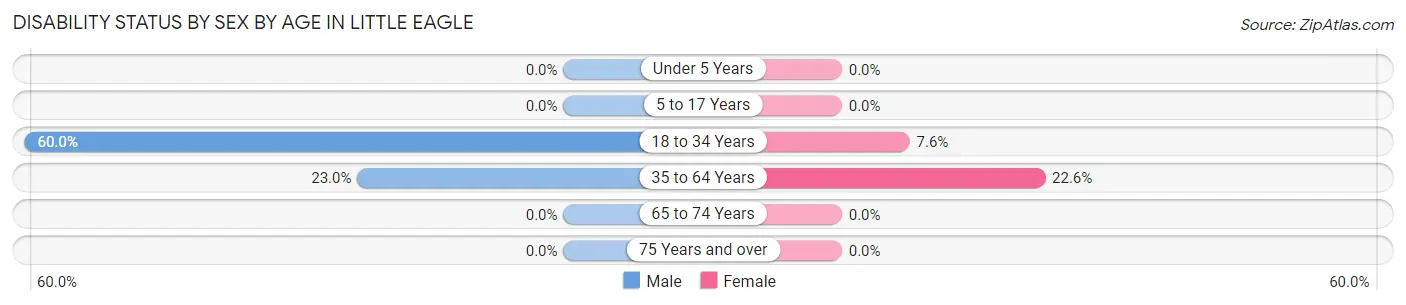
| Age Bracket | Male | Female |
| Under 5 Years | 0 (0.0%) | 0 (0.0%) |
| 5 to 17 Years | 0 (0.0%) | 0 (0.0%) |
| 18 to 34 Years | 9 (60.0%) | 4 (7.5%) |
| 35 to 64 Years | 14 (23.0%) | 12 (22.6%) |
| 65 to 74 Years | 0 (0.0%) | 0 (0.0%) |
| 75 Years and over | 0 (0.0%) | 0 (0.0%) |
Disability Class by Sex by Age in Little Eagle
Disability Class: Hearing Difficulty
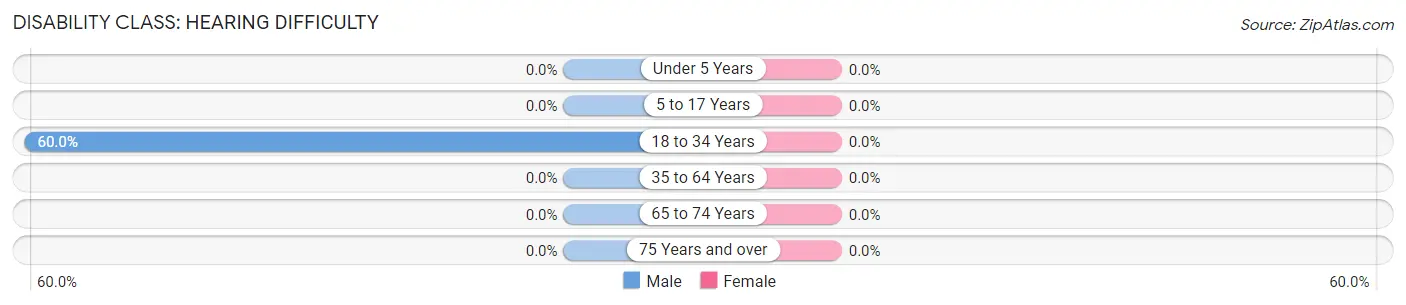
| Age Bracket | Male | Female |
| Under 5 Years | 0 (0.0%) | 0 (0.0%) |
| 5 to 17 Years | 0 (0.0%) | 0 (0.0%) |
| 18 to 34 Years | 9 (60.0%) | 0 (0.0%) |
| 35 to 64 Years | 0 (0.0%) | 0 (0.0%) |
| 65 to 74 Years | 0 (0.0%) | 0 (0.0%) |
| 75 Years and over | 0 (0.0%) | 0 (0.0%) |
Disability Class: Vision Difficulty
| Age Bracket | Male | Female |
| Under 5 Years | 0 (0.0%) | 0 (0.0%) |
| 5 to 17 Years | 0 (0.0%) | 0 (0.0%) |
| 18 to 34 Years | 0 (0.0%) | 0 (0.0%) |
| 35 to 64 Years | 0 (0.0%) | 0 (0.0%) |
| 65 to 74 Years | 0 (0.0%) | 0 (0.0%) |
| 75 Years and over | 0 (0.0%) | 0 (0.0%) |
Disability Class: Cognitive Difficulty
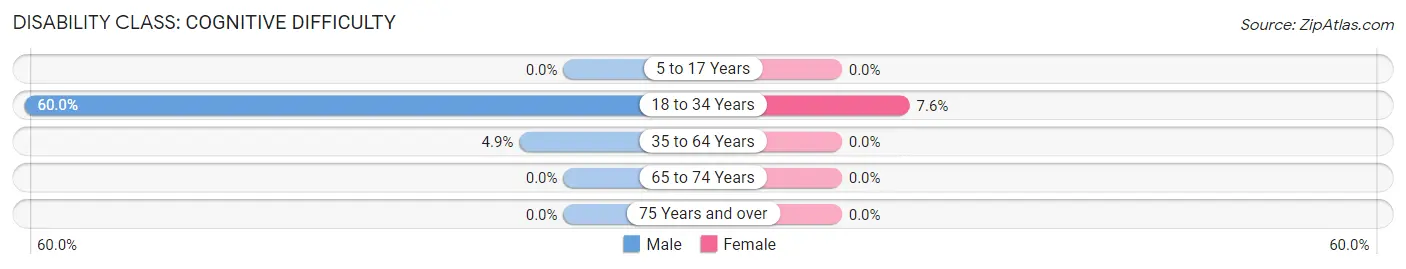
| Age Bracket | Male | Female |
| 5 to 17 Years | 0 (0.0%) | 0 (0.0%) |
| 18 to 34 Years | 9 (60.0%) | 4 (7.5%) |
| 35 to 64 Years | 3 (4.9%) | 0 (0.0%) |
| 65 to 74 Years | 0 (0.0%) | 0 (0.0%) |
| 75 Years and over | 0 (0.0%) | 0 (0.0%) |
Disability Class: Ambulatory Difficulty
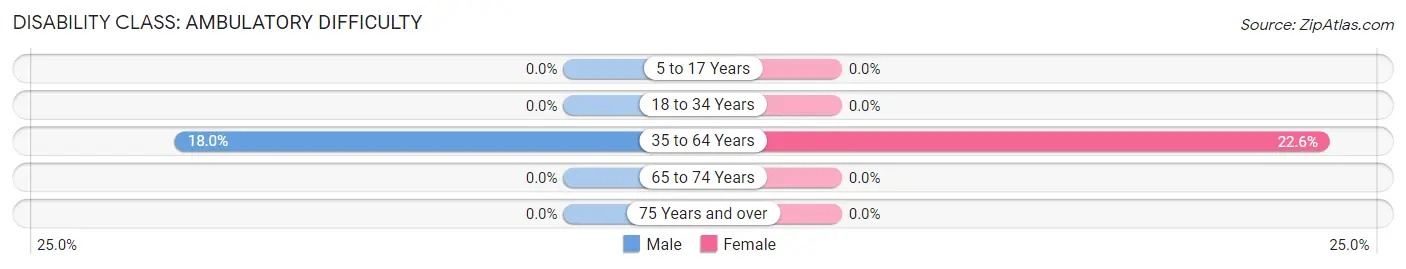
| Age Bracket | Male | Female |
| 5 to 17 Years | 0 (0.0%) | 0 (0.0%) |
| 18 to 34 Years | 0 (0.0%) | 0 (0.0%) |
| 35 to 64 Years | 11 (18.0%) | 12 (22.6%) |
| 65 to 74 Years | 0 (0.0%) | 0 (0.0%) |
| 75 Years and over | 0 (0.0%) | 0 (0.0%) |
Disability Class: Self-Care Difficulty
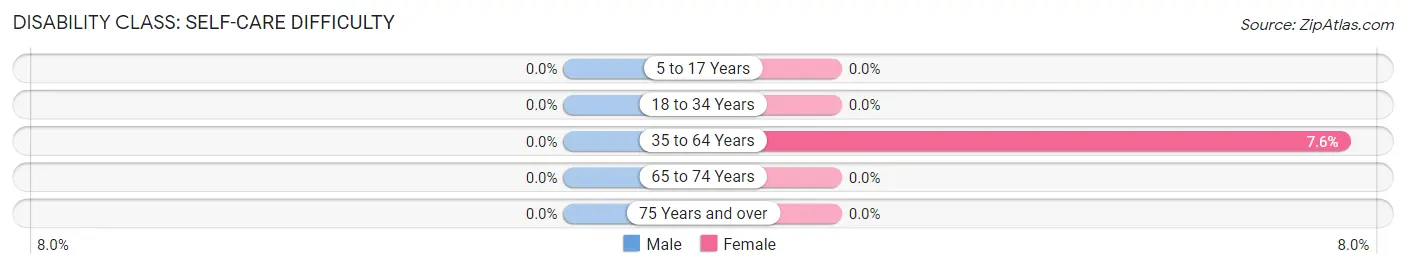
| Age Bracket | Male | Female |
| 5 to 17 Years | 0 (0.0%) | 0 (0.0%) |
| 18 to 34 Years | 0 (0.0%) | 0 (0.0%) |
| 35 to 64 Years | 0 (0.0%) | 4 (7.5%) |
| 65 to 74 Years | 0 (0.0%) | 0 (0.0%) |
| 75 Years and over | 0 (0.0%) | 0 (0.0%) |
Technology Access in Little Eagle
Computing Device Access in Little Eagle
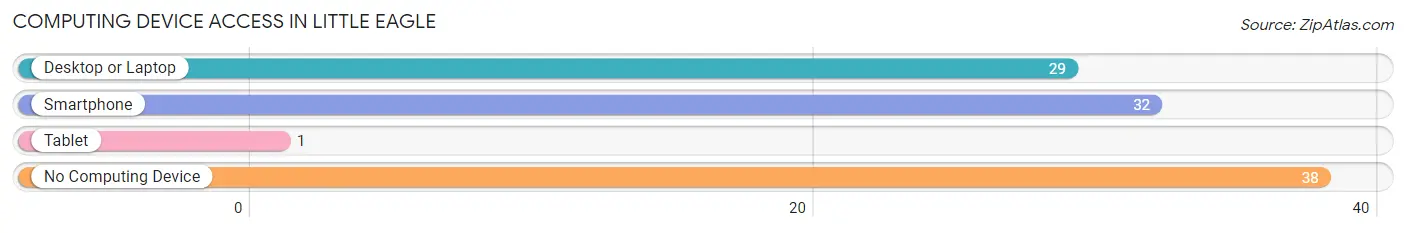
| Device Type | # Households | % Households |
| Desktop or Laptop | 29 | 41.4% |
| Smartphone | 32 | 45.7% |
| Tablet | 1 | 1.4% |
| No Computing Device | 38 | 54.3% |
| Total | 70 | 100.0% |
Internet Access in Little Eagle
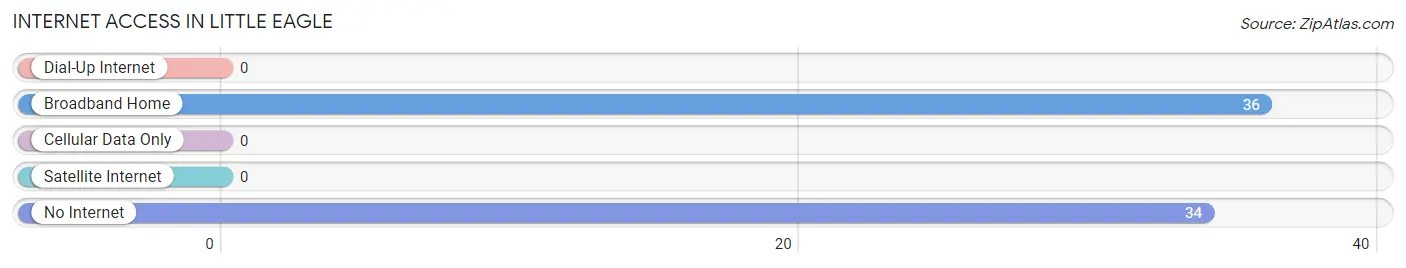
| Internet Type | # Households | % Households |
| Dial-Up Internet | 0 | 0.0% |
| Broadband Home | 36 | 51.4% |
| Cellular Data Only | 0 | 0.0% |
| Satellite Internet | 0 | 0.0% |
| No Internet | 34 | 48.6% |
| Total | 70 | 100.0% |
Little Eagle Summary
History
Little Eagle is a small town located in Corson County, South Dakota. It is situated on the Standing Rock Indian Reservation, and is home to the Standing Rock Sioux Tribe. The town was founded in the late 19th century, and was originally known as “Little Eagle’s Village”. The name was changed to Little Eagle in the early 20th century.
The town was originally a trading post for the Standing Rock Sioux Tribe, and was a popular destination for traders and travelers. The town was also a popular stop for steamboats traveling up and down the Missouri River. In the early 20th century, the town was home to a number of businesses, including a hotel, a general store, a post office, and a blacksmith shop.
In the late 19th century, the town was also home to a number of churches, including the Little Eagle Presbyterian Church, which was founded in 1891. The church was the first Presbyterian church in the area, and was a popular destination for missionaries and travelers.
In the early 20th century, the town was home to a number of schools, including the Little Eagle Indian School, which was founded in 1902. The school was a boarding school for Native American children, and was operated by the Bureau of Indian Affairs. The school was closed in the 1950s, and the building is now used as a community center.
Geography
Little Eagle is located in the northern part of Corson County, South Dakota. The town is situated on the Standing Rock Indian Reservation, and is surrounded by rolling hills and prairies. The town is located on the banks of the Missouri River, and is approximately 25 miles north of the city of Mobridge.
The town is located in a semi-arid climate, with hot summers and cold winters. The average annual temperature is around 50 degrees Fahrenheit, and the average annual precipitation is around 16 inches.
Economy
The economy of Little Eagle is largely based on agriculture and tourism. The town is home to a number of farms, which produce a variety of crops, including wheat, corn, and soybeans. The town is also home to a number of tourist attractions, including the Standing Rock Sioux Museum, the Little Eagle Indian School, and the Little Eagle Presbyterian Church.
The town is also home to a number of businesses, including a grocery store, a gas station, a hardware store, and a restaurant. The town is also home to a number of government offices, including the Standing Rock Sioux Tribal Office, the Bureau of Indian Affairs, and the Little Eagle Post Office.
Demographics
As of the 2010 census, the population of Little Eagle was 545. The town is predominantly Native American, with the majority of the population being members of the Standing Rock Sioux Tribe. The town also has a small population of non-Native Americans, including African Americans, Hispanics, and Asians.
The median household income in Little Eagle is $25,000, and the median home value is $50,000. The town has a high poverty rate, with nearly 40% of the population living below the poverty line. The town also has a high unemployment rate, with nearly 20% of the population unemployed.
Common Questions
What is Per Capita Income in Little Eagle?
Per Capita income in Little Eagle is $4,483.
What is the Median Family Income in Little Eagle?
Median Family Income in Little Eagle is $23,000.
What is the Median Household income in Little Eagle?
Median Household Income in Little Eagle is $18,750.
What is Family Income Deficit in Little Eagle?
Family Income Deficit in Little Eagle is $14,486.
Families that are below poverty line in Little Eagle earn $14,486 less on average than the poverty threshold level.
What is Inequality or Gini Index in Little Eagle?
Inequality or Gini Index in Little Eagle is 0.38.
What is the Total Population of Little Eagle?
Total Population of Little Eagle is 343.
What is the Total Male Population of Little Eagle?
Total Male Population of Little Eagle is 157.
What is the Total Female Population of Little Eagle?
Total Female Population of Little Eagle is 186.
What is the Ratio of Males per 100 Females in Little Eagle?
There are 84.41 Males per 100 Females in Little Eagle.
What is the Ratio of Females per 100 Males in Little Eagle?
There are 118.47 Females per 100 Males in Little Eagle.
What is the Median Population Age in Little Eagle?
Median Population Age in Little Eagle is 21.9 Years.
What is the Average Family Size in Little Eagle
Average Family Size in Little Eagle is 5.6 People.
What is the Average Household Size in Little Eagle
Average Household Size in Little Eagle is 4.9 People.
How Large is the Labor Force in Little Eagle?
There are 78 People in the Labor Forcein in Little Eagle.
What is the Percentage of People in the Labor Force in Little Eagle?
37.1% of People are in the Labor Force in Little Eagle.
What is the Unemployment Rate in Little Eagle?
Unemployment Rate in Little Eagle is 69.2%.