Zip Codes with the Highest Percentage of Population Employed in Administrative & Support Services in the United States
RELATED REPORTS & OPTIONS
Administrative & Support Services
United States
Compare Zip Codes
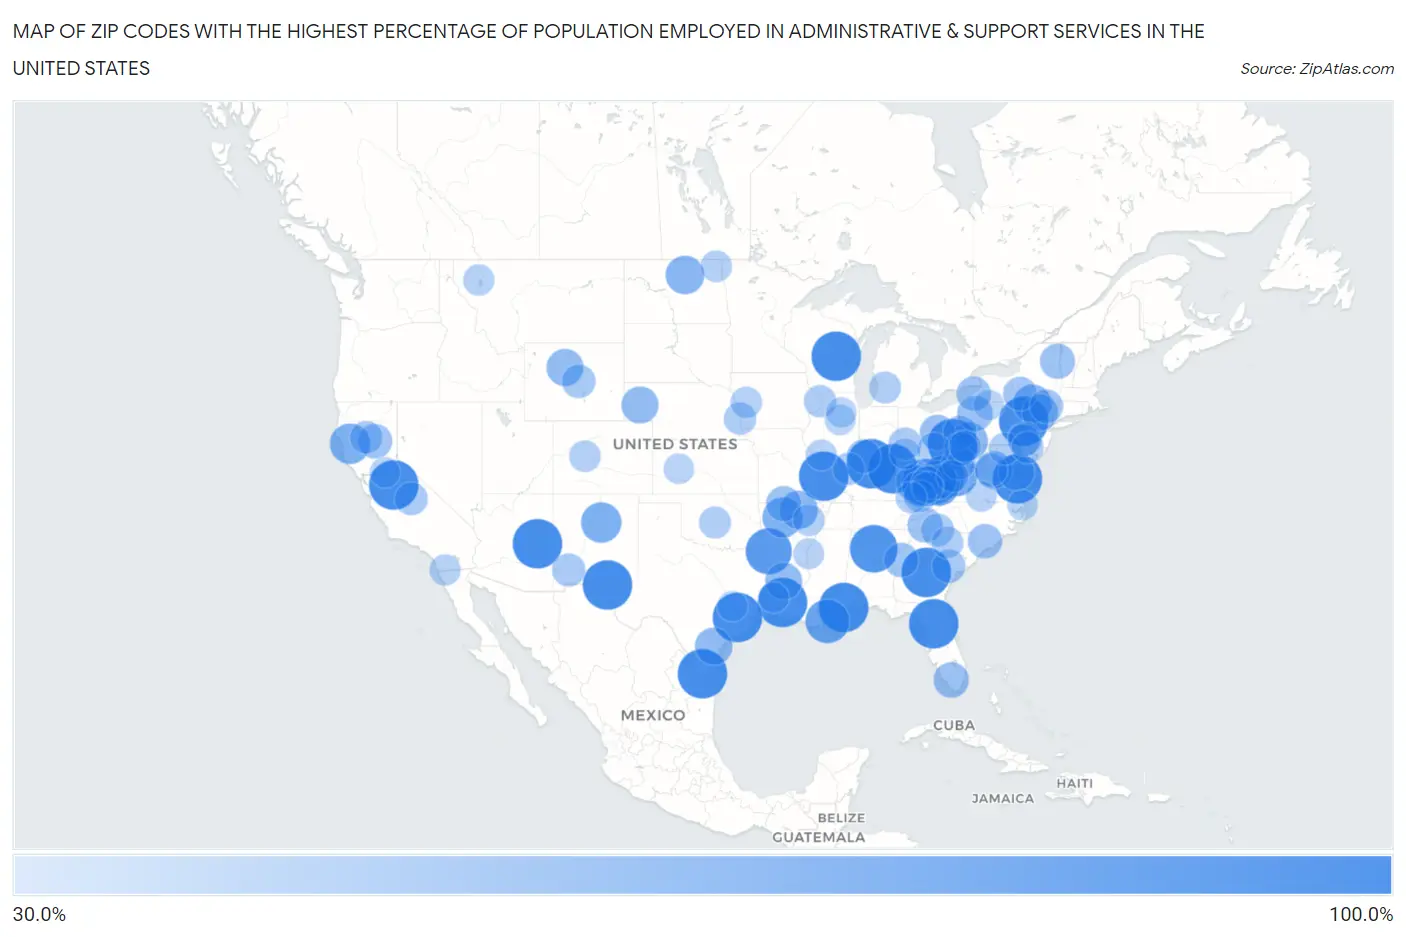
Map of Zip Codes with the Highest Percentage of Population Employed in Administrative & Support Services in the United States
30.0%
100.0%
Zip Codes with the Highest Percentage of Population Employed in Administrative & Support Services in the United States
| Zip Code | % Employed | vs State | vs National | |
| 1. | 54946 | 100.0% | 3.3%(+96.7)#1 | 4.1%(+95.9)#1 |
| 2. | 30454 | 100.0% | 4.8%(+95.2)#1 | 4.1%(+95.9)#2 |
| 3. | 70654 | 100.0% | 3.8%(+96.2)#1 | 4.1%(+95.9)#3 |
| 4. | 22432 | 100.0% | 4.1%(+95.9)#1 | 4.1%(+95.9)#4 |
| 5. | 47437 | 100.0% | 3.5%(+96.5)#1 | 4.1%(+95.9)#5 |
| 6. | 79847 | 100.0% | 4.4%(+95.6)#1 | 4.1%(+95.9)#6 |
| 7. | 18223 | 100.0% | 3.6%(+96.4)#1 | 4.1%(+95.9)#7 |
| 8. | 78565 | 100.0% | 4.4%(+95.6)#2 | 4.1%(+95.9)#8 |
| 9. | 95325 | 100.0% | 4.6%(+95.4)#1 | 4.1%(+95.9)#9 |
| 10. | 40058 | 100.0% | 4.0%(+96.0)#1 | 4.1%(+95.9)#10 |
| 11. | 39595 | 100.0% | 3.4%(+96.6)#1 | 4.1%(+95.9)#11 |
| 12. | 77473 | 100.0% | 4.4%(+95.6)#3 | 4.1%(+95.9)#12 |
| 13. | 32634 | 100.0% | 5.9%(+94.1)#1 | 4.1%(+95.9)#13 |
| 14. | 43914 | 100.0% | 3.7%(+96.3)#1 | 4.1%(+95.9)#14 |
| 15. | 62261 | 100.0% | 4.0%(+96.0)#1 | 4.1%(+95.9)#15 |
| 16. | 85902 | 100.0% | 5.4%(+94.6)#1 | 4.1%(+95.9)#16 |
| 17. | 35013 | 93.3% | 4.0%(+89.4)#1 | 4.1%(+89.2)#17 |
| 18. | 41607 | 91.5% | 4.0%(+87.6)#2 | 4.1%(+87.4)#18 |
| 19. | 71859 | 88.6% | 3.4%(+85.1)#1 | 4.1%(+84.4)#19 |
| 20. | 70082 | 81.3% | 3.8%(+77.6)#2 | 4.1%(+77.2)#20 |
| 21. | 25688 | 80.4% | 3.4%(+77.0)#1 | 4.1%(+76.3)#21 |
| 22. | 25204 | 80.0% | 3.4%(+76.6)#2 | 4.1%(+75.9)#22 |
| 23. | 25972 | 76.7% | 3.4%(+73.3)#3 | 4.1%(+72.6)#23 |
| 24. | 24862 | 73.6% | 3.4%(+70.2)#4 | 4.1%(+69.5)#24 |
| 25. | 87562 | 69.3% | 3.9%(+65.4)#1 | 4.1%(+65.2)#25 |
| 26. | 95429 | 69.2% | 4.6%(+64.7)#2 | 4.1%(+65.1)#26 |
| 27. | 72686 | 67.9% | 3.4%(+64.5)#2 | 4.1%(+63.8)#27 |
| 28. | 18455 | 63.6% | 3.6%(+60.1)#2 | 4.1%(+59.5)#28 |
| 29. | 58343 | 63.6% | 2.5%(+61.1)#1 | 4.1%(+59.5)#29 |
| 30. | 25647 | 63.3% | 3.4%(+59.9)#5 | 4.1%(+59.2)#30 |
| 31. | 15435 | 62.5% | 3.6%(+58.9)#3 | 4.1%(+58.4)#31 |
| 32. | 72573 | 62.2% | 3.4%(+58.8)#3 | 4.1%(+58.1)#32 |
| 33. | 78352 | 59.7% | 4.4%(+55.3)#4 | 4.1%(+55.5)#33 |
| 34. | 22729 | 59.1% | 4.1%(+55.0)#2 | 4.1%(+55.0)#34 |
| 35. | 82430 | 58.3% | 2.4%(+55.9)#1 | 4.1%(+54.2)#35 |
| 36. | 69331 | 58.3% | 3.4%(+55.0)#1 | 4.1%(+54.2)#36 |
| 37. | 71410 | 57.9% | 3.8%(+54.1)#3 | 4.1%(+53.7)#37 |
| 38. | 18340 | 55.6% | 3.6%(+52.0)#4 | 4.1%(+51.4)#38 |
| 39. | 20667 | 55.3% | 4.2%(+51.1)#1 | 4.1%(+51.1)#39 |
| 40. | 41397 | 55.1% | 4.0%(+51.1)#3 | 4.1%(+50.9)#40 |
| 41. | 41729 | 54.5% | 4.0%(+50.6)#4 | 4.1%(+50.4)#41 |
| 42. | 34141 | 53.3% | 5.9%(+47.5)#2 | 4.1%(+49.2)#42 |
| 43. | 43805 | 53.1% | 3.7%(+49.4)#2 | 4.1%(+49.0)#43 |
| 44. | 16361 | 52.9% | 3.6%(+49.4)#5 | 4.1%(+48.8)#44 |
| 45. | 72668 | 52.5% | 3.4%(+49.1)#4 | 4.1%(+48.4)#45 |
| 46. | 12998 | 51.9% | 3.7%(+48.2)#1 | 4.1%(+47.7)#46 |
| 47. | 28708 | 51.2% | 4.3%(+47.0)#1 | 4.1%(+47.1)#47 |
| 48. | 14166 | 50.0% | 3.7%(+46.3)#2 | 4.1%(+45.9)#48 |
| 49. | 95978 | 50.0% | 4.6%(+45.4)#3 | 4.1%(+45.9)#49 |
| 50. | 30229 | 50.0% | 4.8%(+45.2)#2 | 4.1%(+45.9)#50 |
| 51. | 28424 | 50.0% | 4.3%(+45.7)#2 | 4.1%(+45.9)#51 |
| 52. | 26376 | 49.3% | 3.4%(+45.9)#6 | 4.1%(+45.1)#52 |
| 53. | 15078 | 48.1% | 3.6%(+44.6)#6 | 4.1%(+44.0)#53 |
| 54. | 26572 | 48.1% | 3.4%(+44.7)#7 | 4.1%(+44.0)#54 |
| 55. | 47445 | 47.9% | 3.5%(+44.4)#2 | 4.1%(+43.8)#55 |
| 56. | 13784 | 47.9% | 3.7%(+44.2)#3 | 4.1%(+43.8)#56 |
| 57. | 19316 | 47.9% | 3.6%(+44.3)#7 | 4.1%(+43.7)#57 |
| 58. | 12489 | 47.6% | 3.7%(+43.9)#4 | 4.1%(+43.5)#58 |
| 59. | 82638 | 47.1% | 2.4%(+44.6)#2 | 4.1%(+42.9)#59 |
| 60. | 29923 | 46.5% | 4.8%(+41.7)#1 | 4.1%(+42.4)#60 |
| 61. | 88034 | 45.3% | 3.9%(+41.4)#2 | 4.1%(+41.2)#61 |
| 62. | 93641 | 45.0% | 4.6%(+40.4)#4 | 4.1%(+40.9)#62 |
| 63. | 29378 | 44.9% | 4.8%(+40.1)#2 | 4.1%(+40.7)#63 |
| 64. | 96078 | 44.3% | 4.6%(+39.7)#5 | 4.1%(+40.1)#64 |
| 65. | 22731 | 43.8% | 4.1%(+39.7)#3 | 4.1%(+39.6)#65 |
| 66. | 45428 | 43.8% | 3.7%(+40.0)#3 | 4.1%(+39.6)#66 |
| 67. | 43111 | 43.5% | 3.7%(+39.8)#4 | 4.1%(+39.3)#67 |
| 68. | 21762 | 43.0% | 4.2%(+38.7)#2 | 4.1%(+38.8)#68 |
| 69. | 41621 | 42.9% | 4.0%(+38.9)#5 | 4.1%(+38.7)#69 |
| 70. | 52771 | 42.9% | 3.0%(+39.8)#1 | 4.1%(+38.7)#70 |
| 71. | 68056 | 42.9% | 3.4%(+39.5)#2 | 4.1%(+38.7)#71 |
| 72. | 19369 | 42.4% | 3.6%(+38.8)#8 | 4.1%(+38.3)#72 |
| 73. | 25942 | 42.3% | 3.4%(+38.9)#8 | 4.1%(+38.2)#73 |
| 74. | 62843 | 42.1% | 4.0%(+38.1)#2 | 4.1%(+38.0)#74 |
| 75. | 19733 | 41.9% | 4.4%(+37.5)#1 | 4.1%(+37.7)#75 |
| 76. | 40865 | 41.9% | 4.0%(+37.9)#6 | 4.1%(+37.7)#76 |
| 77. | 26546 | 41.8% | 3.4%(+38.3)#9 | 4.1%(+37.6)#77 |
| 78. | 73097 | 41.5% | 3.6%(+37.9)#1 | 4.1%(+37.4)#78 |
| 79. | 49335 | 41.3% | 3.7%(+37.5)#1 | 4.1%(+37.1)#79 |
| 80. | 29122 | 41.2% | 4.8%(+36.3)#3 | 4.1%(+37.0)#80 |
| 81. | 72005 | 40.9% | 3.4%(+37.5)#5 | 4.1%(+36.8)#81 |
| 82. | 41606 | 40.7% | 4.0%(+36.8)#7 | 4.1%(+36.6)#82 |
| 83. | 81612 | 40.2% | 4.1%(+36.1)#1 | 4.1%(+36.1)#83 |
| 84. | 40903 | 40.0% | 4.0%(+36.0)#8 | 4.1%(+35.9)#84 |
| 85. | 51520 | 40.0% | 3.0%(+37.0)#2 | 4.1%(+35.9)#85 |
| 86. | 58236 | 40.0% | 2.5%(+37.5)#2 | 4.1%(+35.9)#86 |
| 87. | 59932 | 39.5% | 3.3%(+36.2)#1 | 4.1%(+35.3)#87 |
| 88. | 91980 | 38.9% | 4.6%(+34.3)#6 | 4.1%(+34.7)#88 |
| 89. | 45147 | 38.6% | 3.7%(+34.9)#5 | 4.1%(+34.5)#89 |
| 90. | 62030 | 38.5% | 4.0%(+34.4)#3 | 4.1%(+34.3)#90 |
| 91. | 38772 | 37.7% | 3.4%(+34.3)#2 | 4.1%(+33.6)#91 |
| 92. | 24539 | 37.6% | 4.1%(+33.5)#4 | 4.1%(+33.5)#92 |
| 93. | 70639 | 37.2% | 3.8%(+33.4)#4 | 4.1%(+33.0)#93 |
| 94. | 95225 | 37.1% | 4.6%(+32.5)#7 | 4.1%(+32.9)#94 |
| 95. | 61311 | 37.0% | 4.0%(+33.0)#4 | 4.1%(+32.9)#95 |
| 96. | 16730 | 36.8% | 3.6%(+33.3)#9 | 4.1%(+32.7)#96 |
| 97. | 67518 | 36.8% | 3.2%(+33.7)#1 | 4.1%(+32.7)#97 |
| 98. | 77878 | 36.8% | 4.4%(+32.4)#5 | 4.1%(+32.7)#98 |
| 99. | 60557 | 36.7% | 4.0%(+32.7)#5 | 4.1%(+32.6)#99 |
| 100. | 27917 | 36.7% | 4.3%(+32.4)#3 | 4.1%(+32.5)#100 |
Common Questions
What are the Top 10 Zip Codes with the Highest Percentage of Population Employed in Administrative & Support Services in the United States?
Top 10 Zip Codes with the Highest Percentage of Population Employed in Administrative & Support Services in the United States are:
What zip code has the Highest Percentage of Population Employed in Administrative & Support Services in the United States?
54946 has the Highest Percentage of Population Employed in Administrative & Support Services in the United States with 100.0%.
What is the Percentage of Population Employed in Administrative & Support Services in the United States?
Percentage of Population Employed in Administrative & Support Services in the United States is 4.1%.