Dundarrach, NC Map & Demographics
Dundarrach Map
Dundarrach Overview
$31,721
PER CAPITA INCOME
0.01
INEQUALITY / GINI INDEX
52
TOTAL POPULATION
17
MALE POPULATION
35
FEMALE POPULATION
48.57
MALES / 100 FEMALES
205.88
FEMALES / 100 MALES
46.5
MEDIAN AGE
2.9
AVG FAMILY SIZE
2.9
AVG HOUSEHOLD SIZE
17
LABOR FORCE [ PEOPLE ]
32.7%
PERCENT IN LABOR FORCE
Income in Dundarrach
Income Overview in Dundarrach
| Characteristic | Number | Measure |
| Per Capita Income | 52 | $31,721 |
| Median Family Income | 18 | $0 |
| Mean Family Income | 18 | $0 |
| Median Household Income | 18 | $0 |
| Mean Household Income | 18 | $0 |
| Income Deficit | 18 | $0 |
| Wage / Income Gap (%) | 52 | 0.00% |
| Wage / Income Gap ($) | 52 | 100.00¢ per $1 |
| Gini / Inequality Index | 52 | 0.01 |
Earnings by Sex in Dundarrach
| Sex | Number | Average Earnings |
| Male | 17 (68.0%) | $0 |
| Female | 8 (32.0%) | $0 |
| Total | 25 (100.0%) | $0 |
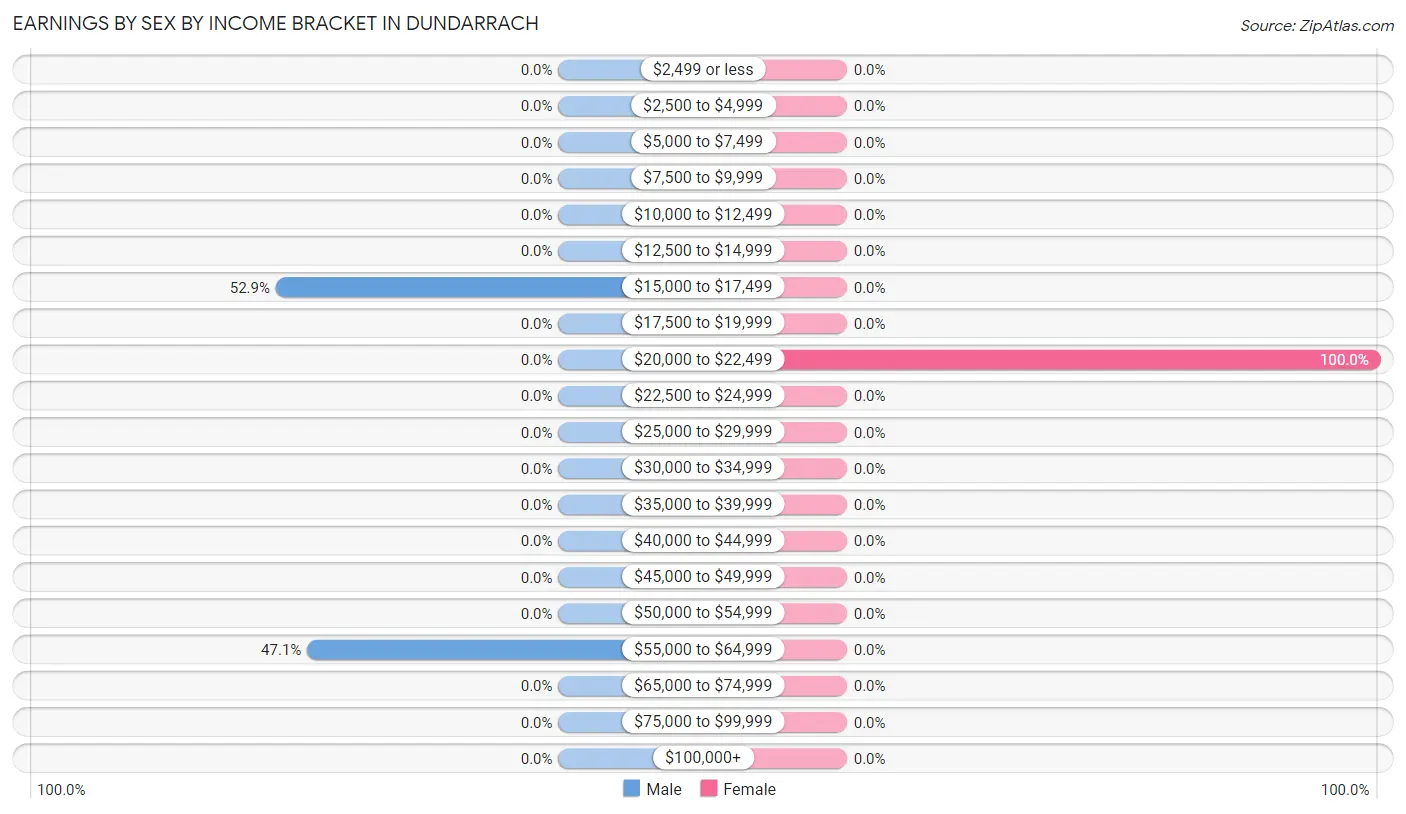
Earnings by Sex by Income Bracket in Dundarrach
The most common earnings brackets in Dundarrach are $15,000 to $17,499 for men (9 | 52.9%) and $20,000 to $22,499 for women (8 | 100.0%).
| Income | Male | Female |
| $2,499 or less | 0 (0.0%) | 0 (0.0%) |
| $2,500 to $4,999 | 0 (0.0%) | 0 (0.0%) |
| $5,000 to $7,499 | 0 (0.0%) | 0 (0.0%) |
| $7,500 to $9,999 | 0 (0.0%) | 0 (0.0%) |
| $10,000 to $12,499 | 0 (0.0%) | 0 (0.0%) |
| $12,500 to $14,999 | 0 (0.0%) | 0 (0.0%) |
| $15,000 to $17,499 | 9 (52.9%) | 0 (0.0%) |
| $17,500 to $19,999 | 0 (0.0%) | 0 (0.0%) |
| $20,000 to $22,499 | 0 (0.0%) | 8 (100.0%) |
| $22,500 to $24,999 | 0 (0.0%) | 0 (0.0%) |
| $25,000 to $29,999 | 0 (0.0%) | 0 (0.0%) |
| $30,000 to $34,999 | 0 (0.0%) | 0 (0.0%) |
| $35,000 to $39,999 | 0 (0.0%) | 0 (0.0%) |
| $40,000 to $44,999 | 0 (0.0%) | 0 (0.0%) |
| $45,000 to $49,999 | 0 (0.0%) | 0 (0.0%) |
| $50,000 to $54,999 | 0 (0.0%) | 0 (0.0%) |
| $55,000 to $64,999 | 8 (47.1%) | 0 (0.0%) |
| $65,000 to $74,999 | 0 (0.0%) | 0 (0.0%) |
| $75,000 to $99,999 | 0 (0.0%) | 0 (0.0%) |
| $100,000+ | 0 (0.0%) | 0 (0.0%) |
| Total | 17 (100.0%) | 8 (100.0%) |
Earnings by Sex by Educational Attainment in Dundarrach
| Educational Attainment | Male Income | Female Income |
| Less than High School | - | - |
| High School Diploma | - | - |
| College or Associate's Degree | - | - |
| Bachelor's Degree | - | - |
| Graduate Degree | - | - |
| Total | - | - |
Family Income in Dundarrach
Family Income Brackets in Dundarrach
According to the Dundarrach family income data, there are 18 families falling into the $75,000 to $99,999 income range, which is the most common income bracket and makes up 100.0% of all families.
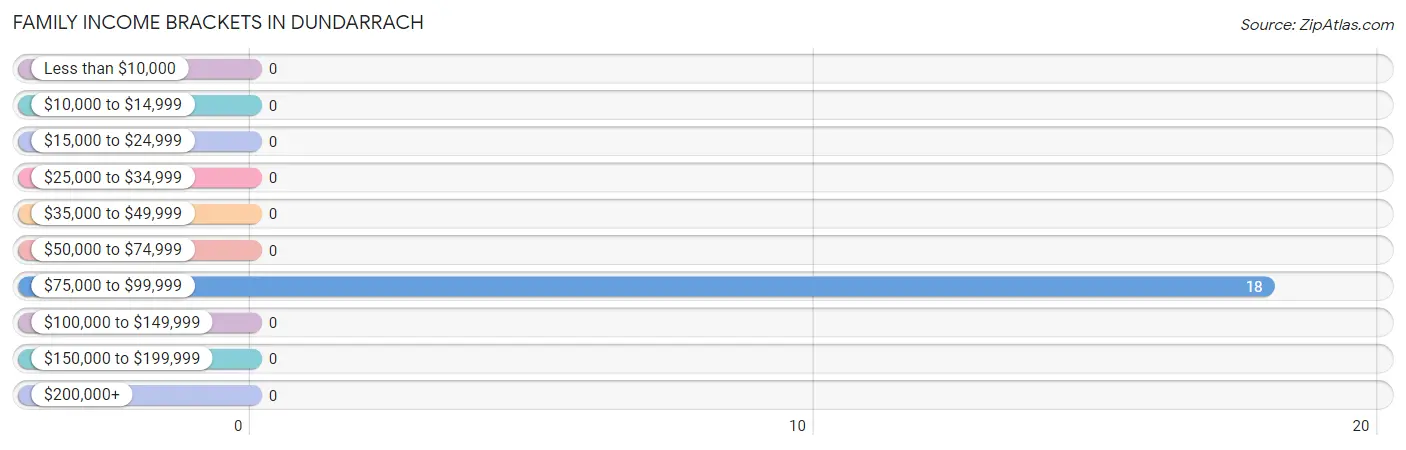
| Income Bracket | # Families | % Families |
| Less than $10,000 | 0 | 0.0% |
| $10,000 to $14,999 | 0 | 0.0% |
| $15,000 to $24,999 | 0 | 0.0% |
| $25,000 to $34,999 | 0 | 0.0% |
| $35,000 to $49,999 | 0 | 0.0% |
| $50,000 to $74,999 | 0 | 0.0% |
| $75,000 to $99,999 | 18 | 100.0% |
| $100,000 to $149,999 | 0 | 0.0% |
| $150,000 to $199,999 | 0 | 0.0% |
| $200,000+ | 0 | 0.0% |
Family Income by Famaliy Size in Dundarrach
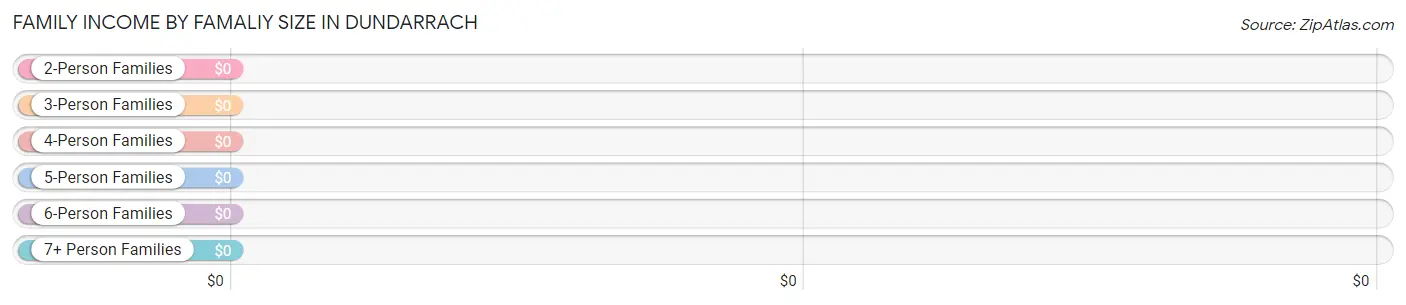
| Income Bracket | # Families | Median Income |
| 2-Person Families | 9 (50.0%) | $0 |
| 3-Person Families | 9 (50.0%) | $0 |
| 4-Person Families | 0 (0.0%) | $0 |
| 5-Person Families | 0 (0.0%) | $0 |
| 6-Person Families | 0 (0.0%) | $0 |
| 7+ Person Families | 0 (0.0%) | $0 |
| Total | 18 (100.0%) | $0 |
Family Income by Number of Earners in Dundarrach
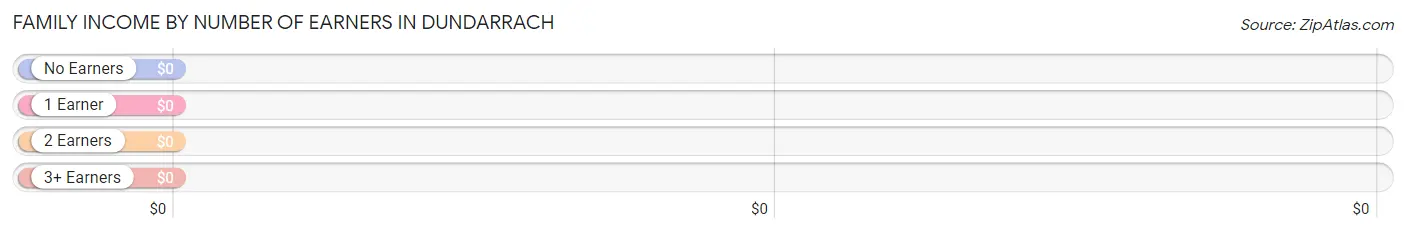
| Number of Earners | # Families | Median Income |
| No Earners | 0 (0.0%) | $0 |
| 1 Earner | 9 (50.0%) | $0 |
| 2 Earners | 9 (50.0%) | $0 |
| 3+ Earners | 0 (0.0%) | $0 |
| Total | 18 (100.0%) | $0 |
Household Income in Dundarrach
Household Income Brackets in Dundarrach
With 18 households falling in the category, the $75,000 to $99,999 income range is the most frequent in Dundarrach, accounting for 100.0% of all households.
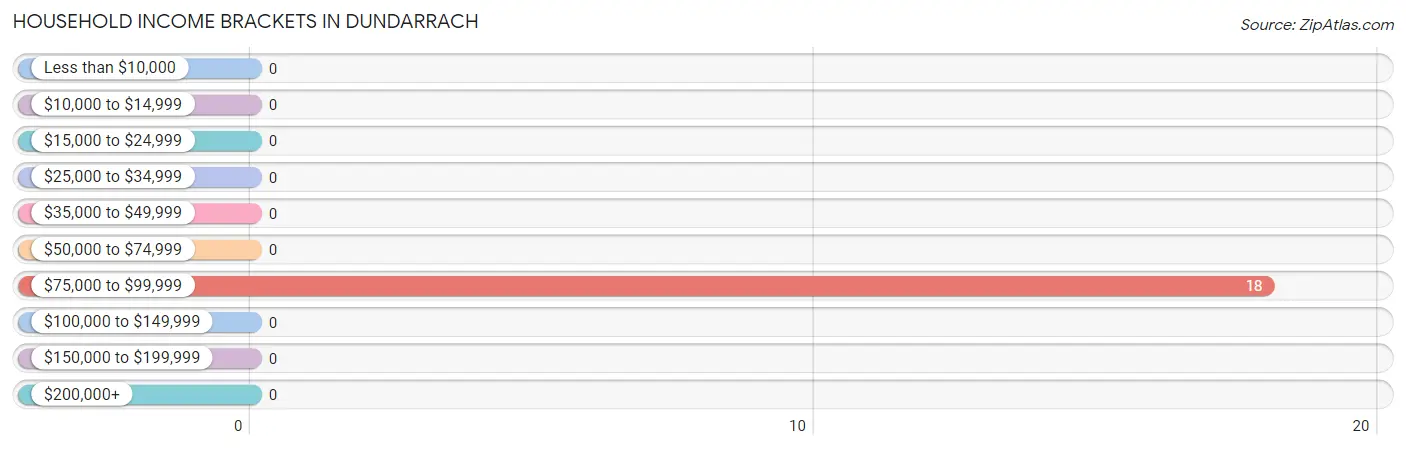
| Income Bracket | # Households | % Households |
| Less than $10,000 | 0 | 0.0% |
| $10,000 to $14,999 | 0 | 0.0% |
| $15,000 to $24,999 | 0 | 0.0% |
| $25,000 to $34,999 | 0 | 0.0% |
| $35,000 to $49,999 | 0 | 0.0% |
| $50,000 to $74,999 | 0 | 0.0% |
| $75,000 to $99,999 | 18 | 100.0% |
| $100,000 to $149,999 | 0 | 0.0% |
| $150,000 to $199,999 | 0 | 0.0% |
| $200,000+ | 0 | 0.0% |
Household Income by Householder Age in Dundarrach
| Income Bracket | # Households | Median Income |
| 15 to 24 Years | 0 (0.0%) | $0 |
| 25 to 44 Years | 0 (0.0%) | $0 |
| 45 to 64 Years | 18 (100.0%) | $0 |
| 65+ Years | 0 (0.0%) | $0 |
| Total | 18 (100.0%) | $0 |
Poverty in Dundarrach
Income Below Poverty by Sex and Age in Dundarrach
| Age Bracket | Male | Female |
| Under 5 Years | 0 (0.0%) | 0 (0.0%) |
| 5 Years | 0 (0.0%) | 0 (0.0%) |
| 6 to 11 Years | 0 (0.0%) | 0 (0.0%) |
| 12 to 14 Years | 0 (0.0%) | 0 (0.0%) |
| 15 Years | 0 (0.0%) | 0 (0.0%) |
| 16 and 17 Years | 0 (0.0%) | 0 (0.0%) |
| 18 to 24 Years | 0 (0.0%) | 0 (0.0%) |
| 25 to 34 Years | 0 (0.0%) | 0 (0.0%) |
| 35 to 44 Years | 0 (0.0%) | 0 (0.0%) |
| 45 to 54 Years | 0 (0.0%) | 0 (0.0%) |
| 55 to 64 Years | 0 (0.0%) | 0 (0.0%) |
| 65 to 74 Years | 0 (0.0%) | 0 (0.0%) |
| 75 Years and over | 0 (0.0%) | 0 (0.0%) |
| Total | 0 (0.0%) | 0 (0.0%) |
Income Above Poverty by Sex and Age in Dundarrach
According to the poverty statistics in Dundarrach, males aged 45 to 54 years and females aged 25 to 34 years are the age groups that are most secure financially, with 100.0% of males and 100.0% of females in these age groups living above the poverty line.
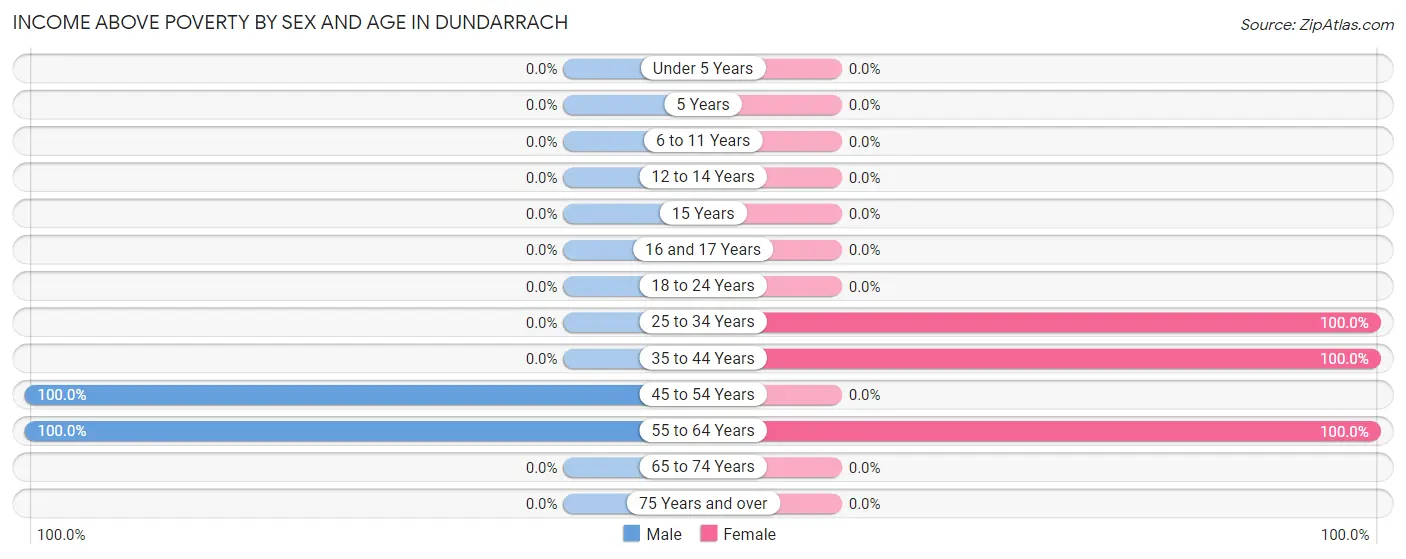
| Age Bracket | Male | Female |
| Under 5 Years | 0 (0.0%) | 0 (0.0%) |
| 5 Years | 0 (0.0%) | 0 (0.0%) |
| 6 to 11 Years | 0 (0.0%) | 0 (0.0%) |
| 12 to 14 Years | 0 (0.0%) | 0 (0.0%) |
| 15 Years | 0 (0.0%) | 0 (0.0%) |
| 16 and 17 Years | 0 (0.0%) | 0 (0.0%) |
| 18 to 24 Years | 0 (0.0%) | 0 (0.0%) |
| 25 to 34 Years | 0 (0.0%) | 18 (100.0%) |
| 35 to 44 Years | 0 (0.0%) | 8 (100.0%) |
| 45 to 54 Years | 9 (100.0%) | 0 (0.0%) |
| 55 to 64 Years | 8 (100.0%) | 9 (100.0%) |
| 65 to 74 Years | 0 (0.0%) | 0 (0.0%) |
| 75 Years and over | 0 (0.0%) | 0 (0.0%) |
| Total | 17 (100.0%) | 35 (100.0%) |
Income Below Poverty Among Married-Couple Families in Dundarrach
| Children | Above Poverty | Below Poverty |
| No Children | 18 (100.0%) | 0 (0.0%) |
| 1 or 2 Children | 0 (0.0%) | 0 (0.0%) |
| 3 or 4 Children | 0 (0.0%) | 0 (0.0%) |
| 5 or more Children | 0 (0.0%) | 0 (0.0%) |
| Total | 18 (100.0%) | 0 (0.0%) |
Income Below Poverty Among Single-Parent Households in Dundarrach
| Children | Single Father | Single Mother |
| No Children | 0 (0.0%) | 0 (0.0%) |
| 1 or 2 Children | 0 (0.0%) | 0 (0.0%) |
| 3 or 4 Children | 0 (0.0%) | 0 (0.0%) |
| 5 or more Children | 0 (0.0%) | 0 (0.0%) |
| Total | 0 (0.0%) | 0 (0.0%) |
Income Below Poverty Among Married-Couple vs Single-Parent Households in Dundarrach
| Children | Married-Couple Families | Single-Parent Households |
| No Children | 0 (0.0%) | 0 (0.0%) |
| 1 or 2 Children | 0 (0.0%) | 0 (0.0%) |
| 3 or 4 Children | 0 (0.0%) | 0 (0.0%) |
| 5 or more Children | 0 (0.0%) | 0 (0.0%) |
| Total | 0 (0.0%) | 0 (0.0%) |
Race in Dundarrach
The most populous races in Dundarrach are , and White / Caucasian (52 | 100.0%).
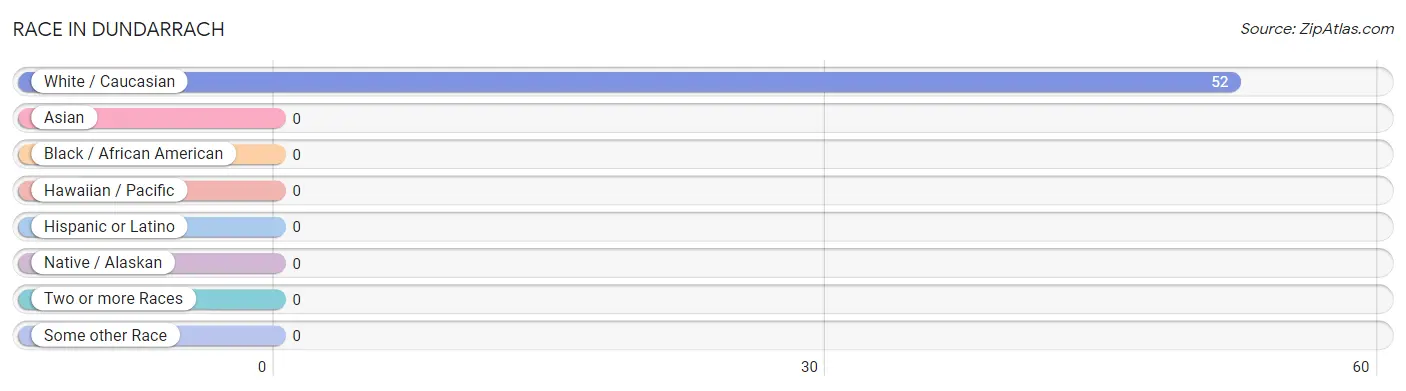
| Race | # Population | % Population |
| Asian | 0 | 0.0% |
| Black / African American | 0 | 0.0% |
| Hawaiian / Pacific | 0 | 0.0% |
| Hispanic or Latino | 0 | 0.0% |
| Native / Alaskan | 0 | 0.0% |
| White / Caucasian | 52 | 100.0% |
| Two or more Races | 0 | 0.0% |
| Some other Race | 0 | 0.0% |
| Total | 52 | 100.0% |
Ancestry in Dundarrach

| Ancestry | # Population | % Population | View All 0 Rows |
Immigrants in Dundarrach

| Immigration Origin | # Population | % Population | View All 0 Rows |
Sex and Age in Dundarrach
Sex and Age in Dundarrach
The most populous age groups in Dundarrach are 45 to 49 Years (9 | 52.9%) for men and 25 to 29 Years (18 | 51.4%) for women.
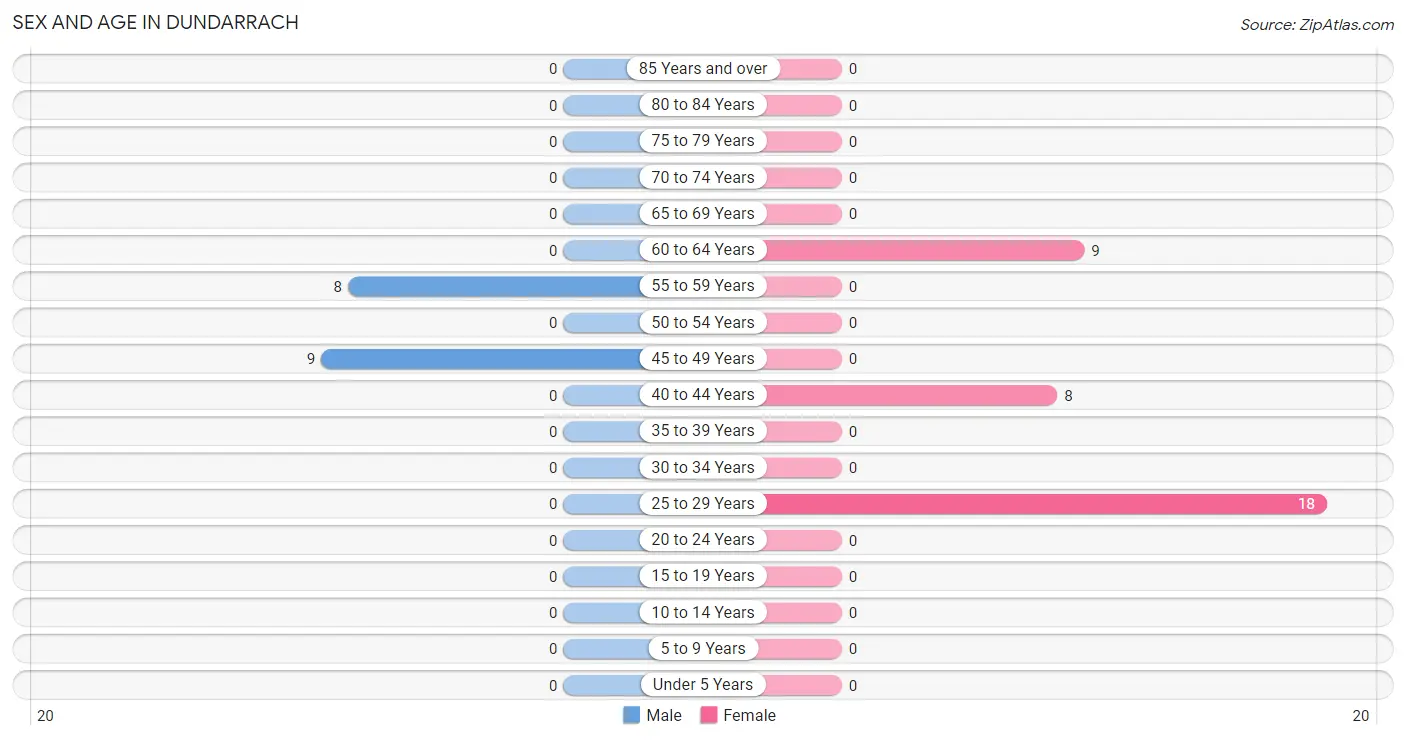
| Age Bracket | Male | Female |
| Under 5 Years | 0 (0.0%) | 0 (0.0%) |
| 5 to 9 Years | 0 (0.0%) | 0 (0.0%) |
| 10 to 14 Years | 0 (0.0%) | 0 (0.0%) |
| 15 to 19 Years | 0 (0.0%) | 0 (0.0%) |
| 20 to 24 Years | 0 (0.0%) | 0 (0.0%) |
| 25 to 29 Years | 0 (0.0%) | 18 (51.4%) |
| 30 to 34 Years | 0 (0.0%) | 0 (0.0%) |
| 35 to 39 Years | 0 (0.0%) | 0 (0.0%) |
| 40 to 44 Years | 0 (0.0%) | 8 (22.9%) |
| 45 to 49 Years | 9 (52.9%) | 0 (0.0%) |
| 50 to 54 Years | 0 (0.0%) | 0 (0.0%) |
| 55 to 59 Years | 8 (47.1%) | 0 (0.0%) |
| 60 to 64 Years | 0 (0.0%) | 9 (25.7%) |
| 65 to 69 Years | 0 (0.0%) | 0 (0.0%) |
| 70 to 74 Years | 0 (0.0%) | 0 (0.0%) |
| 75 to 79 Years | 0 (0.0%) | 0 (0.0%) |
| 80 to 84 Years | 0 (0.0%) | 0 (0.0%) |
| 85 Years and over | 0 (0.0%) | 0 (0.0%) |
| Total | 17 (100.0%) | 35 (100.0%) |
Families and Households in Dundarrach
Median Family Size in Dundarrach
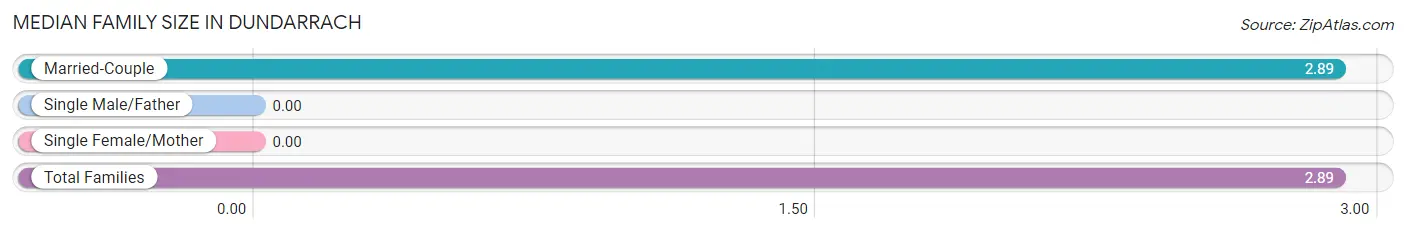
| Family Type | # Families | Family Size |
| Married-Couple | 18 (100.0%) | 2.89 |
| Single Male/Father | 0 (0.0%) | - |
| Single Female/Mother | 0 (0.0%) | - |
| Total Families | 18 (100.0%) | 2.89 |
Median Household Size in Dundarrach
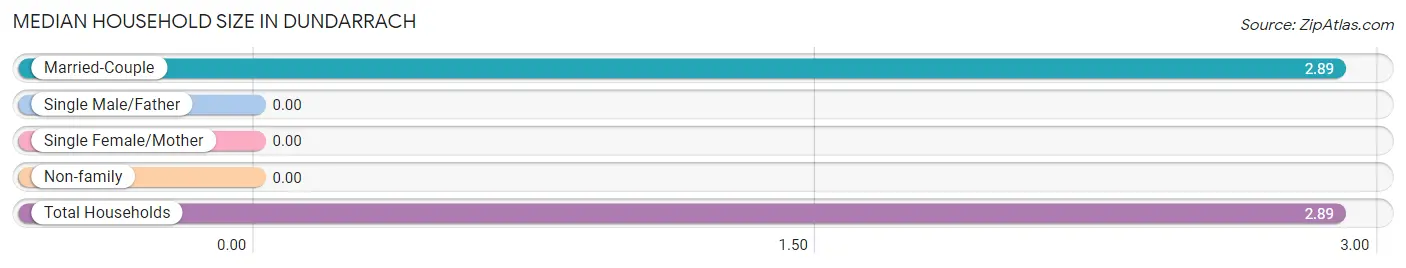
| Household Type | # Households | Household Size |
| Married-Couple | 18 (100.0%) | 2.89 |
| Single Male/Father | 0 (0.0%) | - |
| Single Female/Mother | 0 (0.0%) | - |
| Non-family | 0 (0.0%) | - |
| Total Households | 18 (100.0%) | 2.89 |
Household Size by Marriage Status in Dundarrach
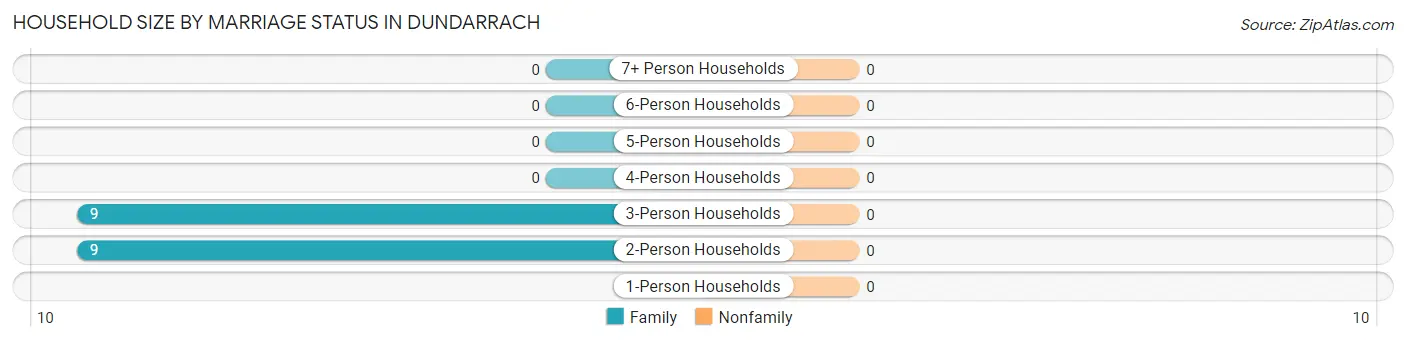
| Household Size | Family Households | Nonfamily Households |
| 1-Person Households | - | 0 (0.0%) |
| 2-Person Households | 9 (50.0%) | 0 (0.0%) |
| 3-Person Households | 9 (50.0%) | 0 (0.0%) |
| 4-Person Households | 0 (0.0%) | 0 (0.0%) |
| 5-Person Households | 0 (0.0%) | 0 (0.0%) |
| 6-Person Households | 0 (0.0%) | 0 (0.0%) |
| 7+ Person Households | 0 (0.0%) | 0 (0.0%) |
| Total | 18 (100.0%) | 0 (0.0%) |
Female Fertility in Dundarrach
Fertility by Age in Dundarrach
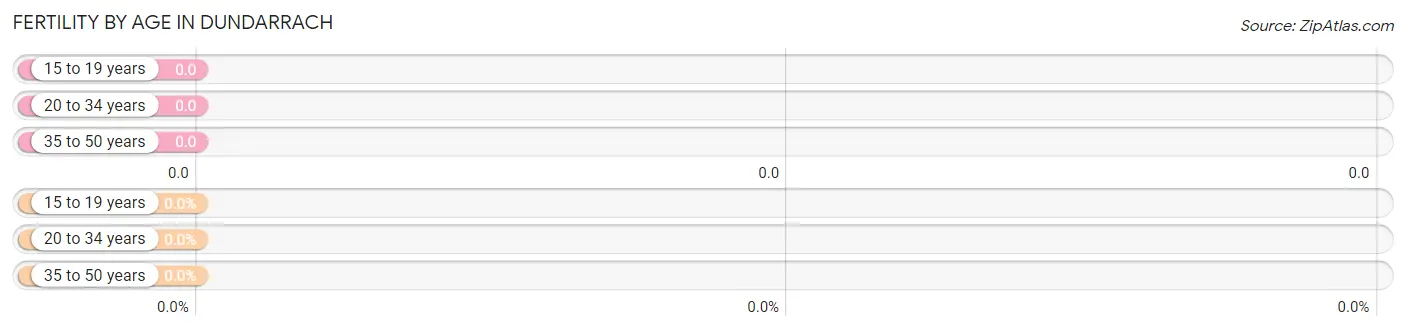
| Age Bracket | Women with Births | Births / 1,000 Women |
| 15 to 19 years | 0 (0.0%) | 0.0 |
| 20 to 34 years | 0 (0.0%) | 0.0 |
| 35 to 50 years | 0 (0.0%) | 0.0 |
| Total | 0 (0.0%) | 0.0 |
Fertility by Age by Marriage Status in Dundarrach
| Age Bracket | Married | Unmarried |
| 15 to 19 years | 0 (0.0%) | 0 (0.0%) |
| 20 to 34 years | 0 (0.0%) | 0 (0.0%) |
| 35 to 50 years | 0 (0.0%) | 0 (0.0%) |
| Total | 0 (0.0%) | 0 (0.0%) |
Fertility by Education in Dundarrach
| Educational Attainment | Women with Births | Births / 1,000 Women |
| Less than High School | 0 (0.0%) | 0.0 |
| High School Diploma | 0 (0.0%) | 0.0 |
| College or Associate's Degree | 0 (0.0%) | 0.0 |
| Bachelor's Degree | 0 (0.0%) | 0.0 |
| Graduate Degree | 0 (0.0%) | 0.0 |
| Total | 0 (0.0%) | 0.0 |
Fertility by Education by Marriage Status in Dundarrach
| Educational Attainment | Married | Unmarried |
| Less than High School | 0 (0.0%) | 0 (0.0%) |
| High School Diploma | 0 (0.0%) | 0 (0.0%) |
| College or Associate's Degree | 0 (0.0%) | 0 (0.0%) |
| Bachelor's Degree | 0 (0.0%) | 0 (0.0%) |
| Graduate Degree | 0 (0.0%) | 0 (0.0%) |
| Total | 0 (0.0%) | 0 (0.0%) |
Employment Characteristics in Dundarrach
Employment by Class of Employer in Dundarrach
Among the 17 employed individuals in Dundarrach, self-employed (not incorporated) (9 | 52.9%), and private company employees (8 | 47.1%) make up the most common classes of employment.
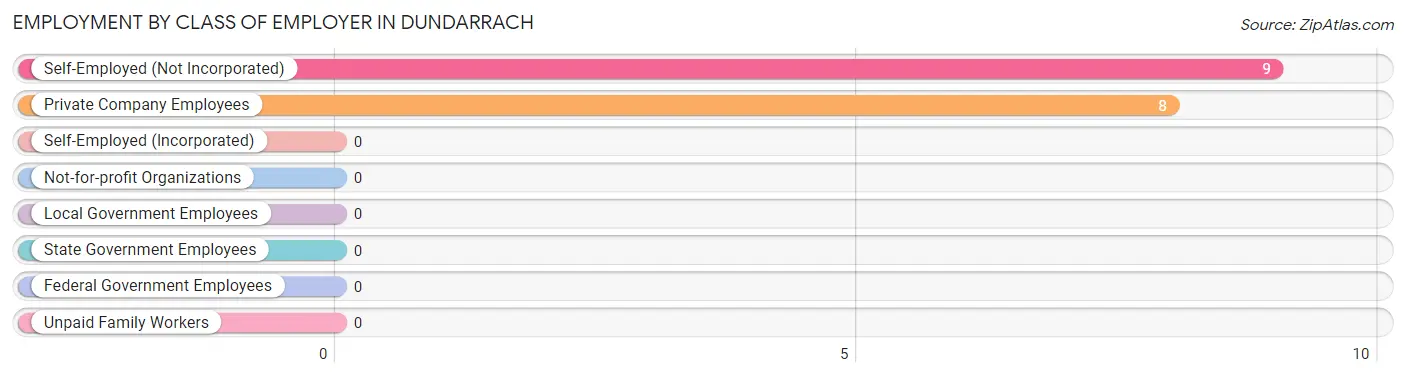
| Employer Class | # Employees | % Employees |
| Private Company Employees | 8 | 47.1% |
| Self-Employed (Incorporated) | 0 | 0.0% |
| Self-Employed (Not Incorporated) | 9 | 52.9% |
| Not-for-profit Organizations | 0 | 0.0% |
| Local Government Employees | 0 | 0.0% |
| State Government Employees | 0 | 0.0% |
| Federal Government Employees | 0 | 0.0% |
| Unpaid Family Workers | 0 | 0.0% |
| Total | 17 | 100.0% |
Employment Status by Age in Dundarrach
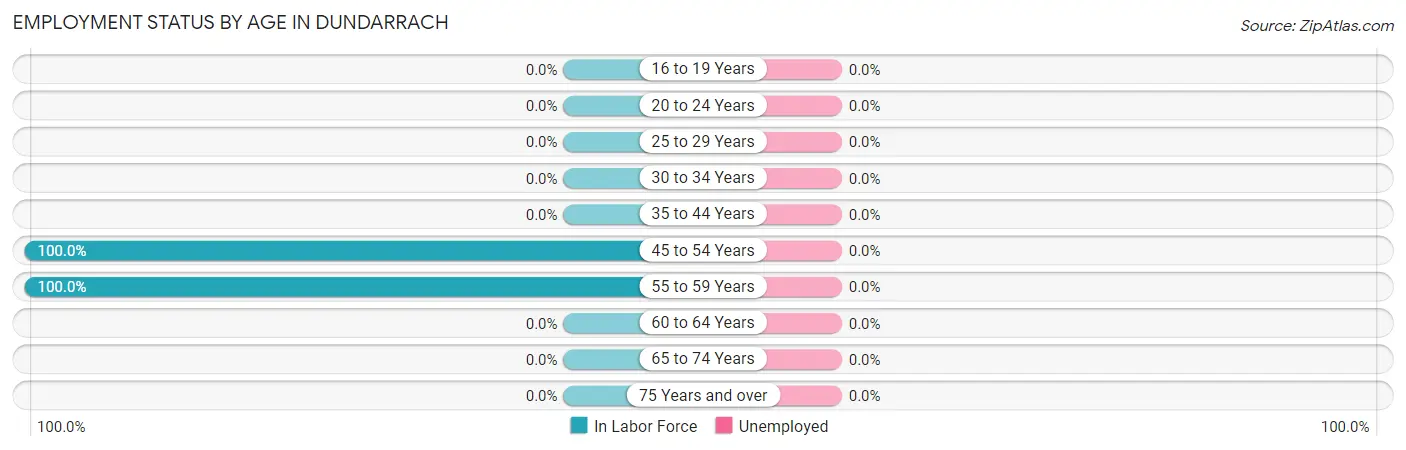
| Age Bracket | In Labor Force | Unemployed |
| 16 to 19 Years | 0 (0.0%) | 0 (0.0%) |
| 20 to 24 Years | 0 (0.0%) | 0 (0.0%) |
| 25 to 29 Years | 0 (0.0%) | 0 (0.0%) |
| 30 to 34 Years | 0 (0.0%) | 0 (0.0%) |
| 35 to 44 Years | 0 (0.0%) | 0 (0.0%) |
| 45 to 54 Years | 9 (100.0%) | 0 (0.0%) |
| 55 to 59 Years | 8 (100.0%) | 0 (0.0%) |
| 60 to 64 Years | 0 (0.0%) | 0 (0.0%) |
| 65 to 74 Years | 0 (0.0%) | 0 (0.0%) |
| 75 Years and over | 0 (0.0%) | 0 (0.0%) |
| Total | 17 (32.7%) | 0 (0.0%) |
Employment Status by Educational Attainment in Dundarrach
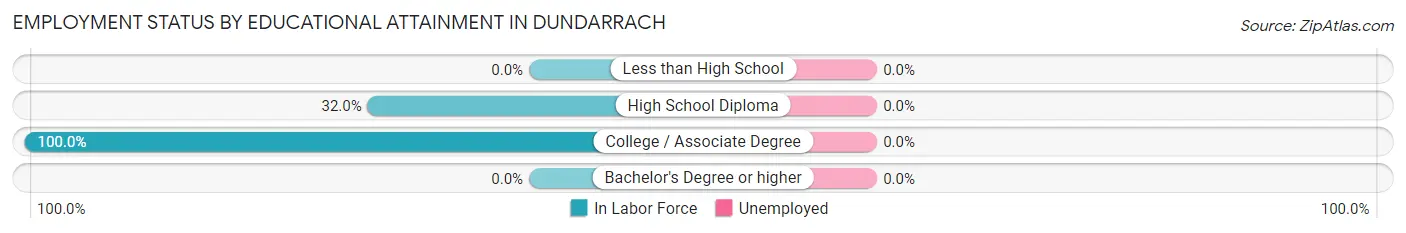
| Educational Attainment | In Labor Force | Unemployed |
| Less than High School | 0 (0.0%) | 0 (0.0%) |
| High School Diploma | 8 (32.0%) | 0 (0.0%) |
| College / Associate Degree | 9 (100.0%) | 0 (0.0%) |
| Bachelor's Degree or higher | 0 (0.0%) | 0 (0.0%) |
| Total | 17 (32.7%) | 0 (0.0%) |
Employment Occupations by Sex in Dundarrach
Management, Business, Science and Arts Occupations
The most common Management, Business, Science and Arts occupations in Dundarrach are , and Management (8 | 47.1%).
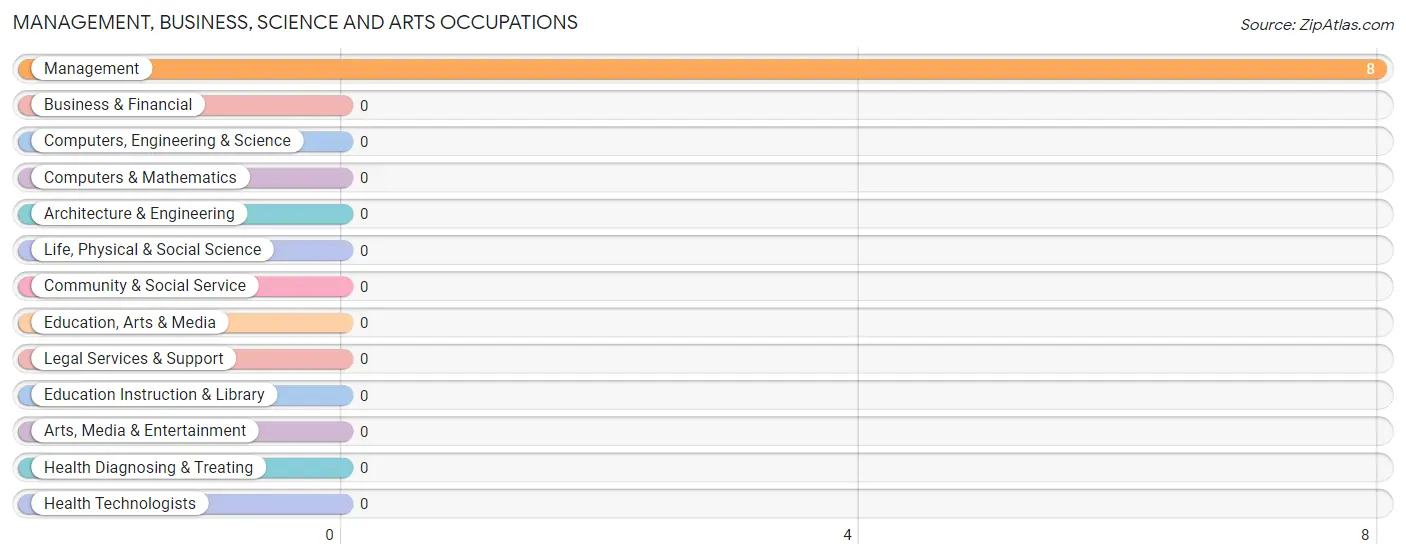
Management, Business, Science and Arts Occupations by Sex
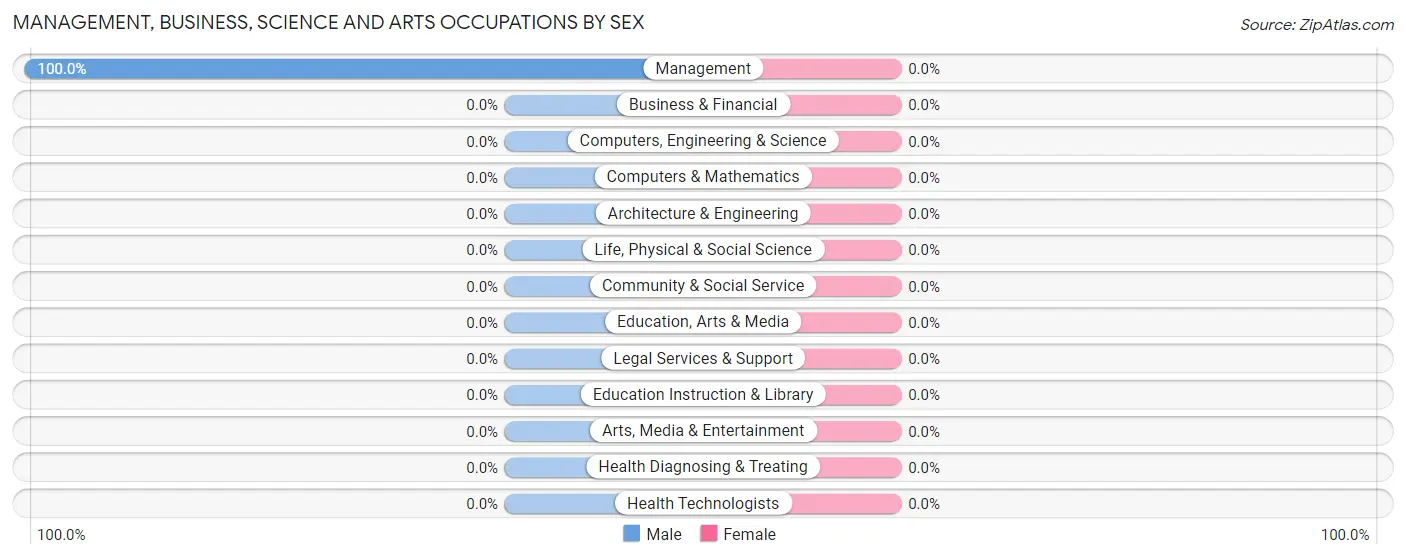
| Occupation | Male | Female |
| Management | 8 (100.0%) | 0 (0.0%) |
| Business & Financial | 0 (0.0%) | 0 (0.0%) |
| Computers, Engineering & Science | 0 (0.0%) | 0 (0.0%) |
| Computers & Mathematics | 0 (0.0%) | 0 (0.0%) |
| Architecture & Engineering | 0 (0.0%) | 0 (0.0%) |
| Life, Physical & Social Science | 0 (0.0%) | 0 (0.0%) |
| Community & Social Service | 0 (0.0%) | 0 (0.0%) |
| Education, Arts & Media | 0 (0.0%) | 0 (0.0%) |
| Legal Services & Support | 0 (0.0%) | 0 (0.0%) |
| Education Instruction & Library | 0 (0.0%) | 0 (0.0%) |
| Arts, Media & Entertainment | 0 (0.0%) | 0 (0.0%) |
| Health Diagnosing & Treating | 0 (0.0%) | 0 (0.0%) |
| Health Technologists | 0 (0.0%) | 0 (0.0%) |
| Total (Category) | 8 (100.0%) | 0 (0.0%) |
| Total (Overall) | 17 (100.0%) | 0 (0.0%) |
Services Occupations
Services Occupations by Sex
| Occupation | Male | Female |
| Healthcare Support | 0 (0.0%) | 0 (0.0%) |
| Security & Protection | 0 (0.0%) | 0 (0.0%) |
| Firefighting & Prevention | 0 (0.0%) | 0 (0.0%) |
| Law Enforcement | 0 (0.0%) | 0 (0.0%) |
| Food Preparation & Serving | 0 (0.0%) | 0 (0.0%) |
| Cleaning & Maintenance | 0 (0.0%) | 0 (0.0%) |
| Personal Care & Service | 0 (0.0%) | 0 (0.0%) |
| Total (Category) | 0 (0.0%) | 0 (0.0%) |
| Total (Overall) | 17 (100.0%) | 0 (0.0%) |
Sales and Office Occupations
The most common Sales and Office occupations in Dundarrach are , and Sales & Related (9 | 52.9%).
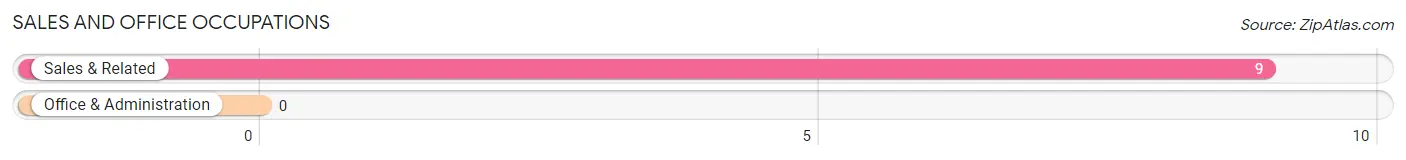
Sales and Office Occupations by Sex
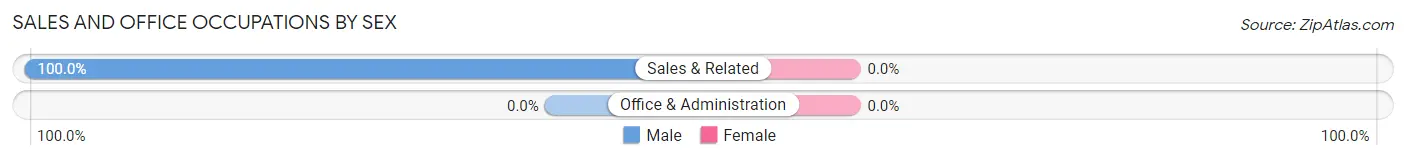
| Occupation | Male | Female |
| Sales & Related | 9 (100.0%) | 0 (0.0%) |
| Office & Administration | 0 (0.0%) | 0 (0.0%) |
| Total (Category) | 9 (100.0%) | 0 (0.0%) |
| Total (Overall) | 17 (100.0%) | 0 (0.0%) |
Natural Resources, Construction and Maintenance Occupations
Natural Resources, Construction and Maintenance Occupations by Sex
| Occupation | Male | Female |
| Farming, Fishing & Forestry | 0 (0.0%) | 0 (0.0%) |
| Construction & Extraction | 0 (0.0%) | 0 (0.0%) |
| Installation, Maintenance & Repair | 0 (0.0%) | 0 (0.0%) |
| Total (Category) | 0 (0.0%) | 0 (0.0%) |
| Total (Overall) | 17 (100.0%) | 0 (0.0%) |
Production, Transportation and Moving Occupations
Production, Transportation and Moving Occupations by Sex
| Occupation | Male | Female |
| Production | 0 (0.0%) | 0 (0.0%) |
| Transportation | 0 (0.0%) | 0 (0.0%) |
| Material Moving | 0 (0.0%) | 0 (0.0%) |
| Total (Category) | 0 (0.0%) | 0 (0.0%) |
| Total (Overall) | 17 (100.0%) | 0 (0.0%) |
Employment Industries by Sex in Dundarrach
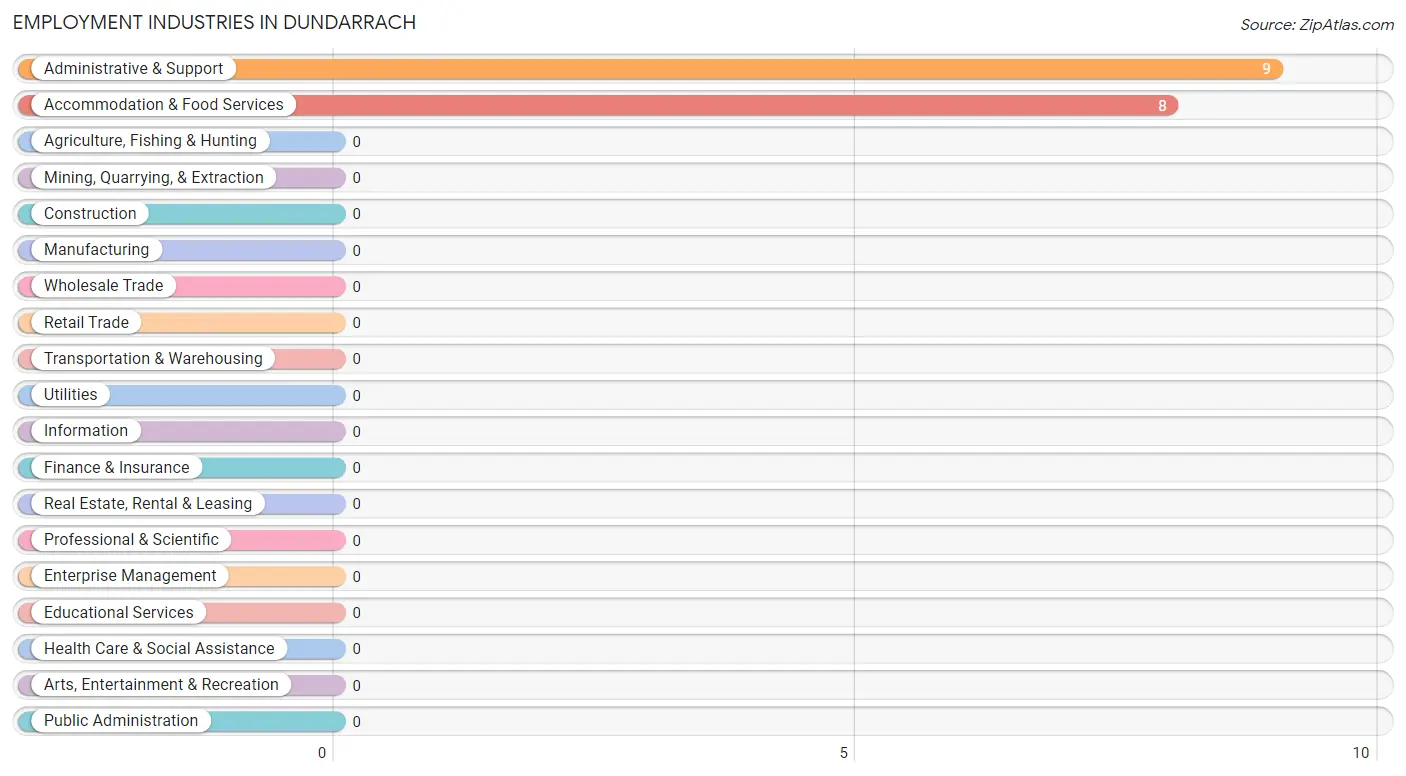
Employment Industries in Dundarrach
The major employment industries in Dundarrach include Administrative & Support (9 | 52.9%), and Accommodation & Food Services (8 | 47.1%).
Employment Industries by Sex in Dundarrach
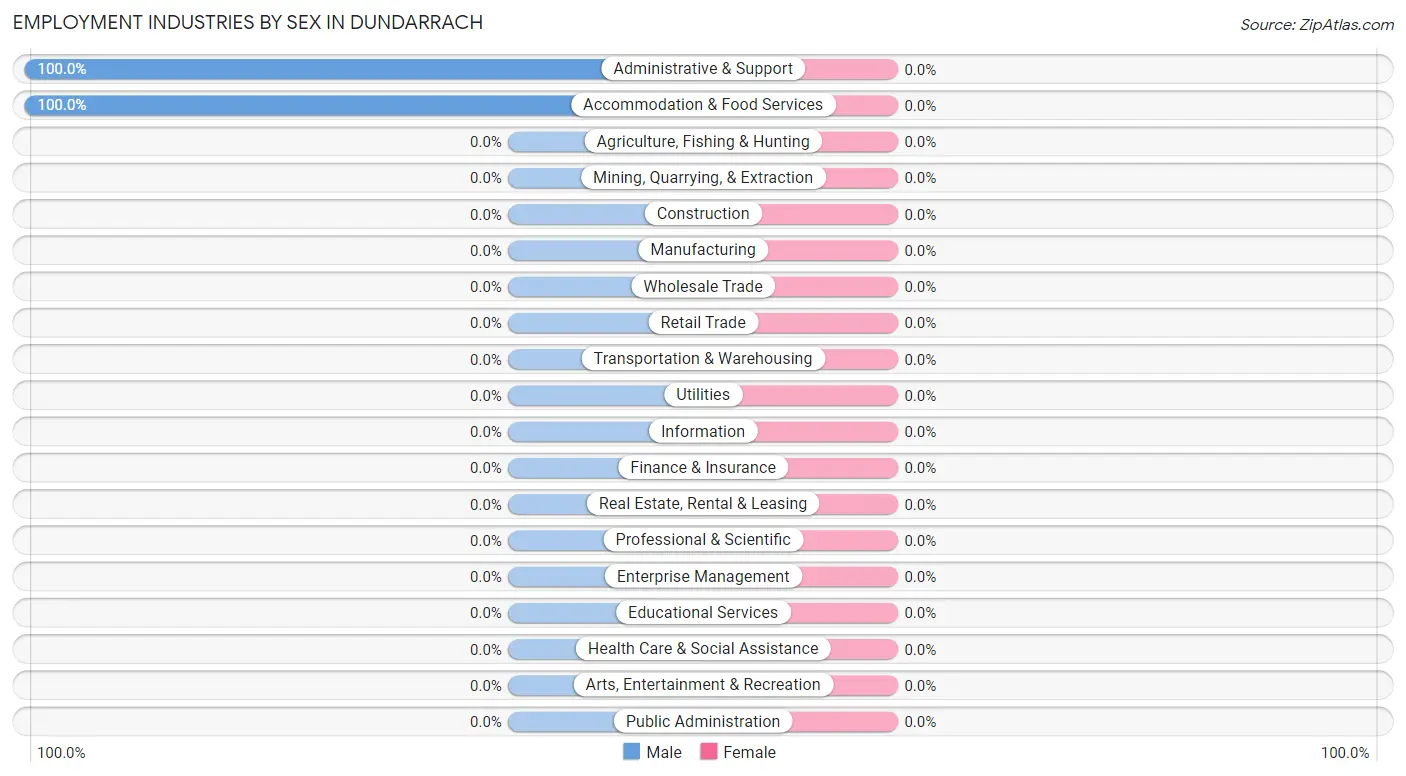
| Industry | Male | Female |
| Agriculture, Fishing & Hunting | 0 (0.0%) | 0 (0.0%) |
| Mining, Quarrying, & Extraction | 0 (0.0%) | 0 (0.0%) |
| Construction | 0 (0.0%) | 0 (0.0%) |
| Manufacturing | 0 (0.0%) | 0 (0.0%) |
| Wholesale Trade | 0 (0.0%) | 0 (0.0%) |
| Retail Trade | 0 (0.0%) | 0 (0.0%) |
| Transportation & Warehousing | 0 (0.0%) | 0 (0.0%) |
| Utilities | 0 (0.0%) | 0 (0.0%) |
| Information | 0 (0.0%) | 0 (0.0%) |
| Finance & Insurance | 0 (0.0%) | 0 (0.0%) |
| Real Estate, Rental & Leasing | 0 (0.0%) | 0 (0.0%) |
| Professional & Scientific | 0 (0.0%) | 0 (0.0%) |
| Enterprise Management | 0 (0.0%) | 0 (0.0%) |
| Administrative & Support | 9 (100.0%) | 0 (0.0%) |
| Educational Services | 0 (0.0%) | 0 (0.0%) |
| Health Care & Social Assistance | 0 (0.0%) | 0 (0.0%) |
| Arts, Entertainment & Recreation | 0 (0.0%) | 0 (0.0%) |
| Accommodation & Food Services | 8 (100.0%) | 0 (0.0%) |
| Public Administration | 0 (0.0%) | 0 (0.0%) |
| Total | 17 (100.0%) | 0 (0.0%) |
Education in Dundarrach
School Enrollment in Dundarrach
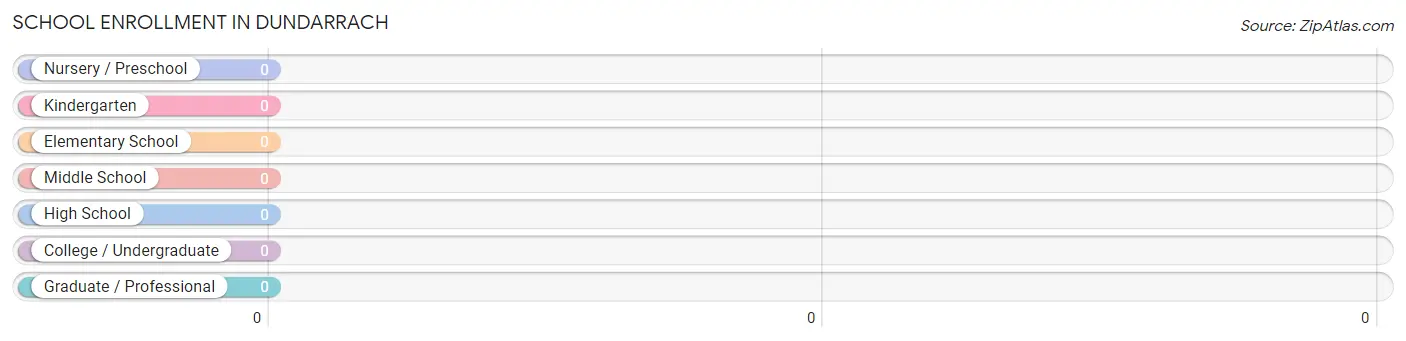
| School Level | # Students | % Students |
| Nursery / Preschool | 0 | 0.0% |
| Kindergarten | 0 | 0.0% |
| Elementary School | 0 | 0.0% |
| Middle School | 0 | 0.0% |
| High School | 0 | 0.0% |
| College / Undergraduate | 0 | 0.0% |
| Graduate / Professional | 0 | 0.0% |
| Total | 0 | 0.0% |
School Enrollment by Age by Funding Source in Dundarrach
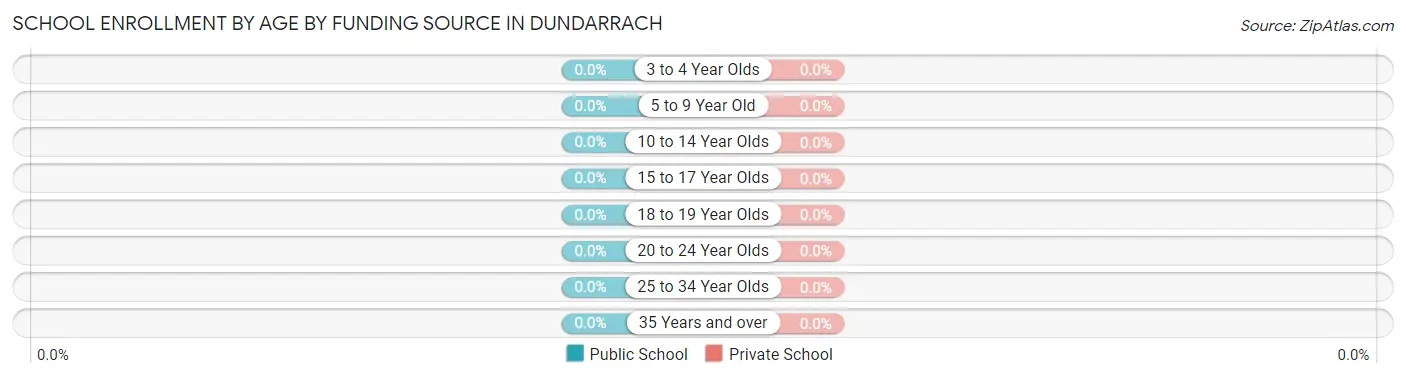
| Age Bracket | Public School | Private School |
| 3 to 4 Year Olds | 0 (0.0%) | 0 (0.0%) |
| 5 to 9 Year Old | 0 (0.0%) | 0 (0.0%) |
| 10 to 14 Year Olds | 0 (0.0%) | 0 (0.0%) |
| 15 to 17 Year Olds | 0 (0.0%) | 0 (0.0%) |
| 18 to 19 Year Olds | 0 (0.0%) | 0 (0.0%) |
| 20 to 24 Year Olds | 0 (0.0%) | 0 (0.0%) |
| 25 to 34 Year Olds | 0 (0.0%) | 0 (0.0%) |
| 35 Years and over | 0 (0.0%) | 0 (0.0%) |
| Total | 0 (0.0%) | 0 (0.0%) |
Educational Attainment by Field of Study in Dundarrach
| Field of Study | # Graduates | % Graduates |
| Computers & Mathematics | 0 | 0.0% |
| Bio, Nature & Agricultural | 0 | 0.0% |
| Physical & Health Sciences | 0 | 0.0% |
| Psychology | 0 | 0.0% |
| Social Sciences | 0 | 0.0% |
| Engineering | 0 | 0.0% |
| Multidisciplinary Studies | 0 | 0.0% |
| Science & Technology | 0 | 0.0% |
| Business | 0 | 0.0% |
| Education | 0 | 0.0% |
| Literature & Languages | 0 | 0.0% |
| Liberal Arts & History | 0 | 0.0% |
| Visual & Performing Arts | 0 | 0.0% |
| Communications | 0 | 0.0% |
| Arts & Humanities | 0 | 0.0% |
| Total | 0 | 0.0% |
Transportation & Commute in Dundarrach
Vehicle Availability by Sex in Dundarrach
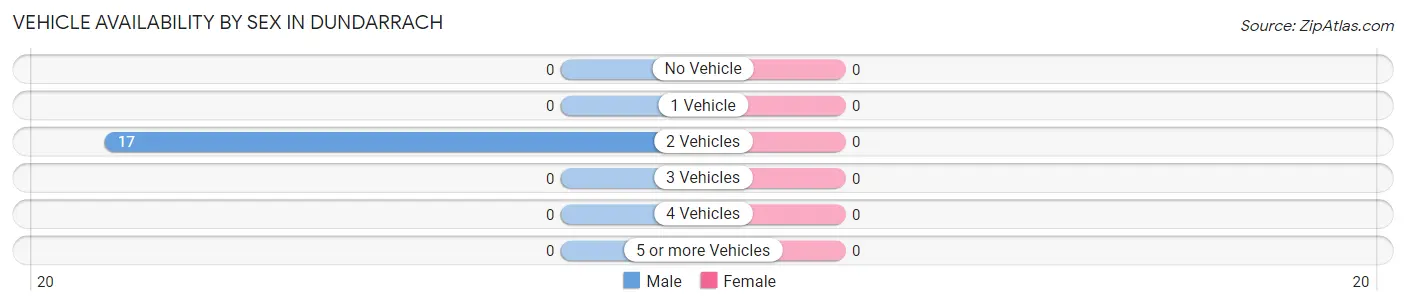
| Vehicles Available | Male | Female |
| No Vehicle | 0 (0.0%) | 0 (0.0%) |
| 1 Vehicle | 0 (0.0%) | 0 (0.0%) |
| 2 Vehicles | 17 (100.0%) | 0 (0.0%) |
| 3 Vehicles | 0 (0.0%) | 0 (0.0%) |
| 4 Vehicles | 0 (0.0%) | 0 (0.0%) |
| 5 or more Vehicles | 0 (0.0%) | 0 (0.0%) |
| Total | 17 (100.0%) | 0 (0.0%) |
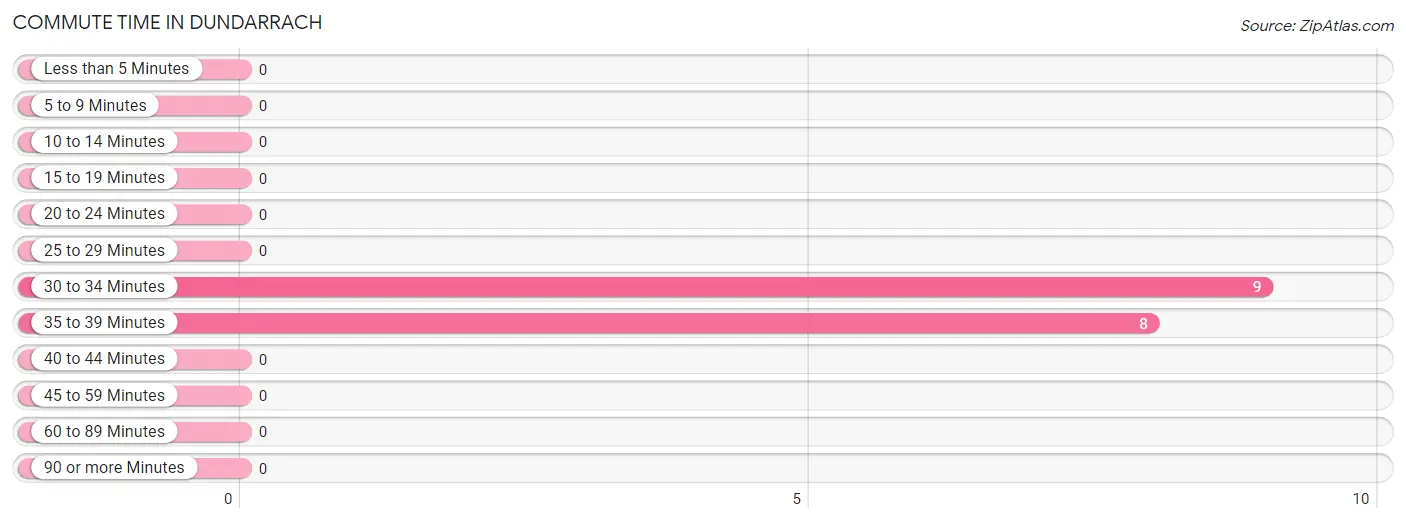
Commute Time in Dundarrach
The most frequently occuring commute durations in Dundarrach are 30 to 34 minutes (9 commuters, 52.9%), 35 to 39 minutes (8 commuters, 47.1%), and less than 5 minutes (0 commuters, 0.0%).
| Commute Time | # Commuters | % Commuters |
| Less than 5 Minutes | 0 | 0.0% |
| 5 to 9 Minutes | 0 | 0.0% |
| 10 to 14 Minutes | 0 | 0.0% |
| 15 to 19 Minutes | 0 | 0.0% |
| 20 to 24 Minutes | 0 | 0.0% |
| 25 to 29 Minutes | 0 | 0.0% |
| 30 to 34 Minutes | 9 | 52.9% |
| 35 to 39 Minutes | 8 | 47.1% |
| 40 to 44 Minutes | 0 | 0.0% |
| 45 to 59 Minutes | 0 | 0.0% |
| 60 to 89 Minutes | 0 | 0.0% |
| 90 or more Minutes | 0 | 0.0% |
Commute Time by Sex in Dundarrach
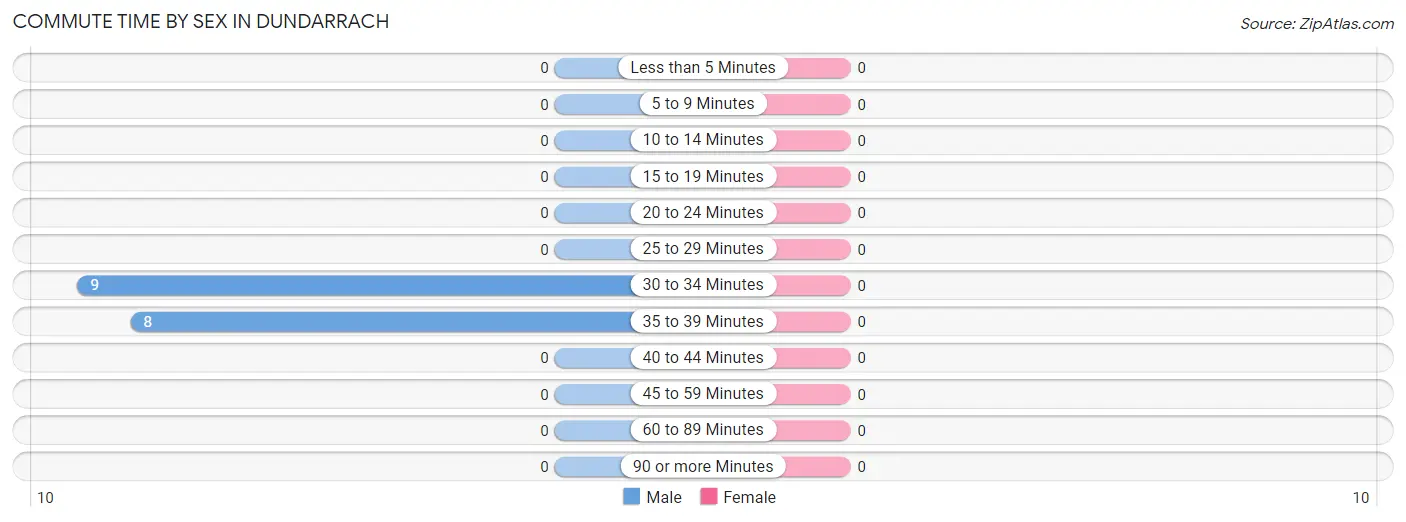
| Commute Time | Male | Female |
| Less than 5 Minutes | 0 (0.0%) | 0 (0.0%) |
| 5 to 9 Minutes | 0 (0.0%) | 0 (0.0%) |
| 10 to 14 Minutes | 0 (0.0%) | 0 (0.0%) |
| 15 to 19 Minutes | 0 (0.0%) | 0 (0.0%) |
| 20 to 24 Minutes | 0 (0.0%) | 0 (0.0%) |
| 25 to 29 Minutes | 0 (0.0%) | 0 (0.0%) |
| 30 to 34 Minutes | 9 (52.9%) | 0 (0.0%) |
| 35 to 39 Minutes | 8 (47.1%) | 0 (0.0%) |
| 40 to 44 Minutes | 0 (0.0%) | 0 (0.0%) |
| 45 to 59 Minutes | 0 (0.0%) | 0 (0.0%) |
| 60 to 89 Minutes | 0 (0.0%) | 0 (0.0%) |
| 90 or more Minutes | 0 (0.0%) | 0 (0.0%) |
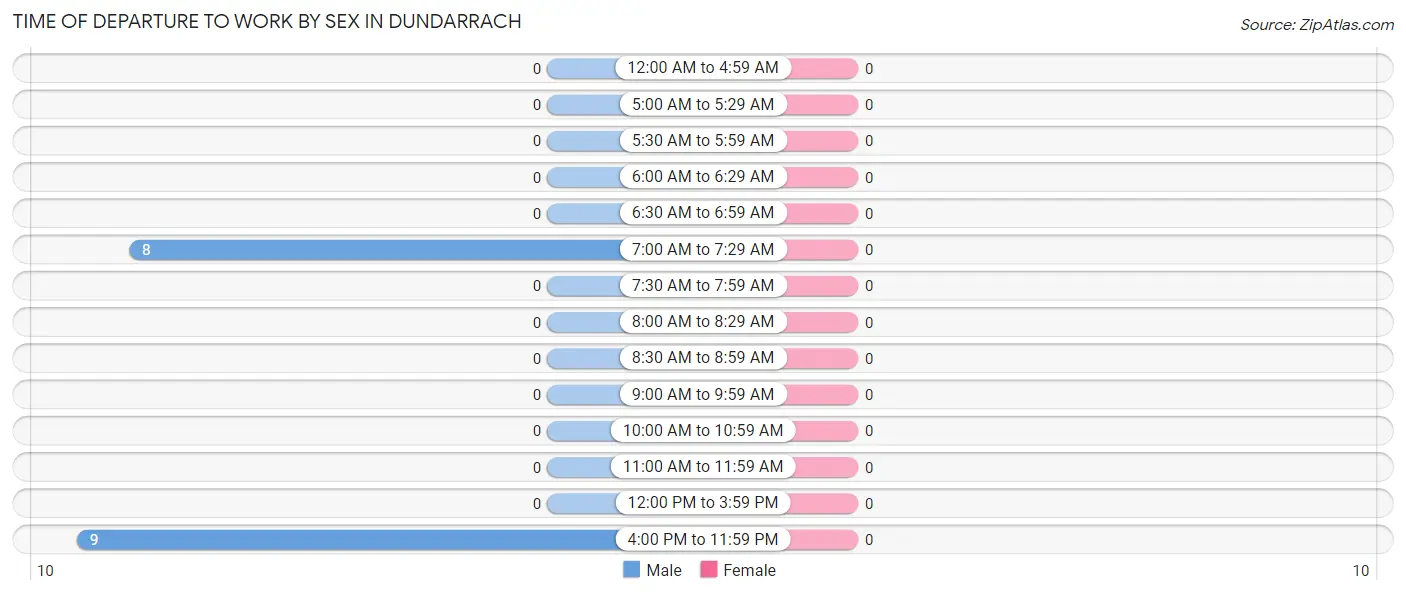
Time of Departure to Work by Sex in Dundarrach
| Time of Departure | Male | Female |
| 12:00 AM to 4:59 AM | 0 (0.0%) | 0 (0.0%) |
| 5:00 AM to 5:29 AM | 0 (0.0%) | 0 (0.0%) |
| 5:30 AM to 5:59 AM | 0 (0.0%) | 0 (0.0%) |
| 6:00 AM to 6:29 AM | 0 (0.0%) | 0 (0.0%) |
| 6:30 AM to 6:59 AM | 0 (0.0%) | 0 (0.0%) |
| 7:00 AM to 7:29 AM | 8 (47.1%) | 0 (0.0%) |
| 7:30 AM to 7:59 AM | 0 (0.0%) | 0 (0.0%) |
| 8:00 AM to 8:29 AM | 0 (0.0%) | 0 (0.0%) |
| 8:30 AM to 8:59 AM | 0 (0.0%) | 0 (0.0%) |
| 9:00 AM to 9:59 AM | 0 (0.0%) | 0 (0.0%) |
| 10:00 AM to 10:59 AM | 0 (0.0%) | 0 (0.0%) |
| 11:00 AM to 11:59 AM | 0 (0.0%) | 0 (0.0%) |
| 12:00 PM to 3:59 PM | 0 (0.0%) | 0 (0.0%) |
| 4:00 PM to 11:59 PM | 9 (52.9%) | 0 (0.0%) |
| Total | 17 (100.0%) | 0 (0.0%) |
Housing Occupancy in Dundarrach
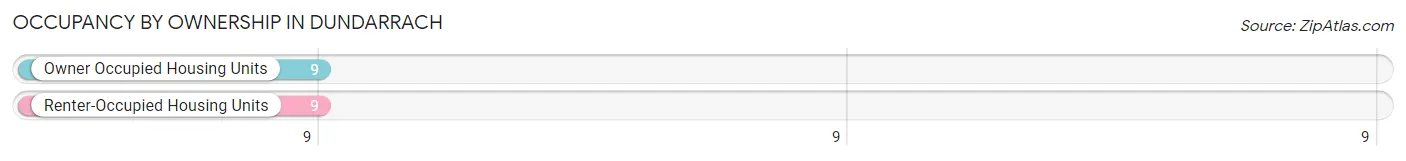
Occupancy by Ownership in Dundarrach
Of the total 18 dwellings in Dundarrach, owner-occupied units account for 9 (50.0%), while renter-occupied units make up 9 (50.0%).
| Occupancy | # Housing Units | % Housing Units |
| Owner Occupied Housing Units | 9 | 50.0% |
| Renter-Occupied Housing Units | 9 | 50.0% |
| Total Occupied Housing Units | 18 | 100.0% |
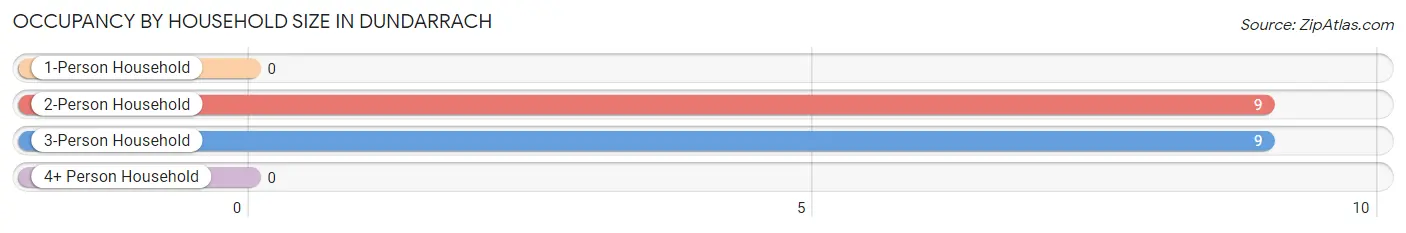
Occupancy by Household Size in Dundarrach
| Household Size | # Housing Units | % Housing Units |
| 1-Person Household | 0 | 0.0% |
| 2-Person Household | 9 | 50.0% |
| 3-Person Household | 9 | 50.0% |
| 4+ Person Household | 0 | 0.0% |
| Total Housing Units | 18 | 100.0% |
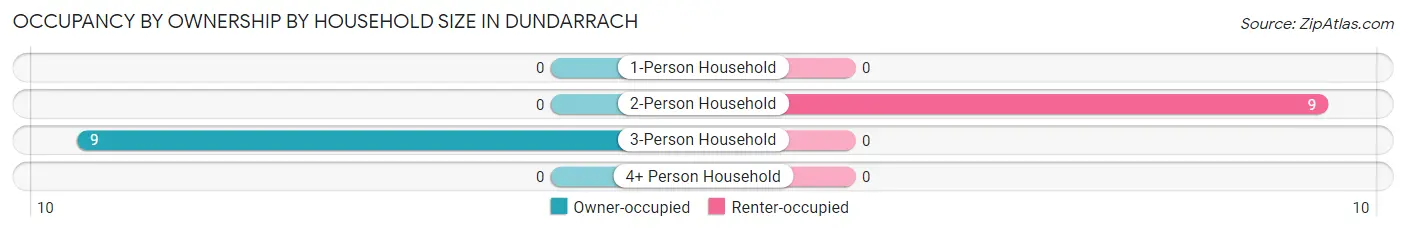
Occupancy by Ownership by Household Size in Dundarrach
| Household Size | Owner-occupied | Renter-occupied |
| 1-Person Household | 0 (0.0%) | 0 (0.0%) |
| 2-Person Household | 0 (0.0%) | 9 (100.0%) |
| 3-Person Household | 9 (100.0%) | 0 (0.0%) |
| 4+ Person Household | 0 (0.0%) | 0 (0.0%) |
| Total Housing Units | 9 (50.0%) | 9 (50.0%) |
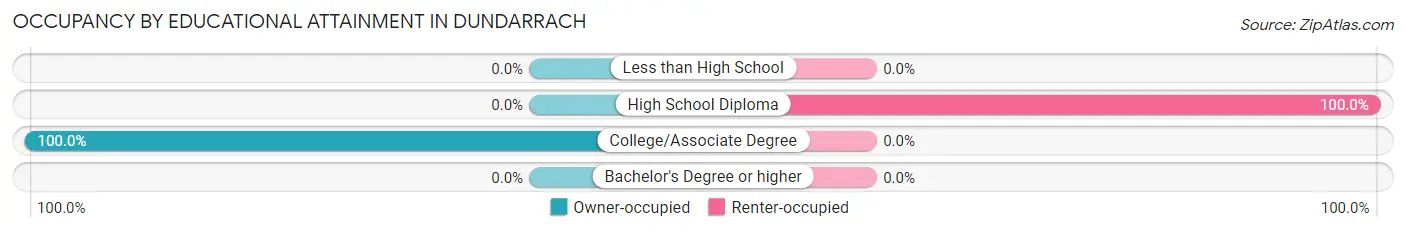
Occupancy by Educational Attainment in Dundarrach
| Household Size | Owner-occupied | Renter-occupied |
| Less than High School | 0 (0.0%) | 0 (0.0%) |
| High School Diploma | 0 (0.0%) | 9 (100.0%) |
| College/Associate Degree | 9 (100.0%) | 0 (0.0%) |
| Bachelor's Degree or higher | 0 (0.0%) | 0 (0.0%) |
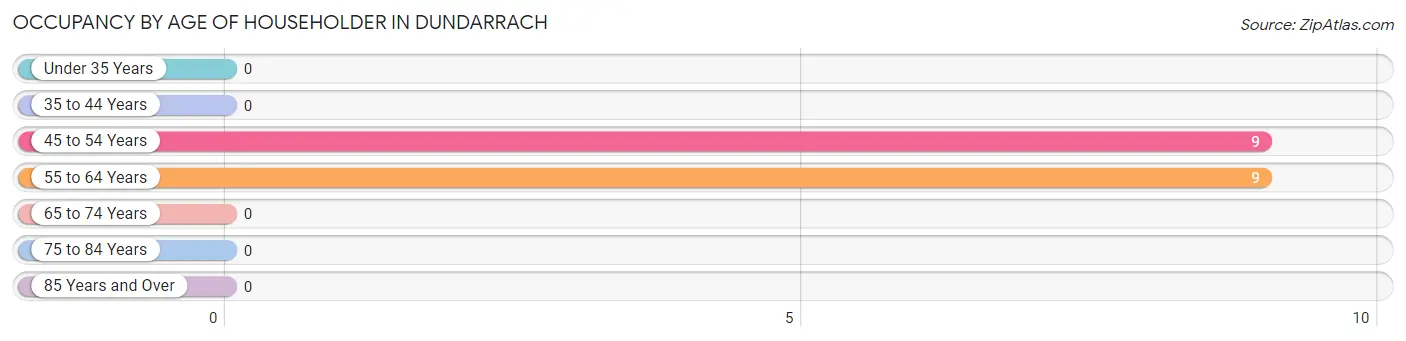
Occupancy by Age of Householder in Dundarrach
| Age Bracket | # Households | % Households |
| Under 35 Years | 0 | 0.0% |
| 35 to 44 Years | 0 | 0.0% |
| 45 to 54 Years | 9 | 50.0% |
| 55 to 64 Years | 9 | 50.0% |
| 65 to 74 Years | 0 | 0.0% |
| 75 to 84 Years | 0 | 0.0% |
| 85 Years and Over | 0 | 0.0% |
| Total | 18 | 100.0% |
Housing Finances in Dundarrach
Median Income by Occupancy in Dundarrach
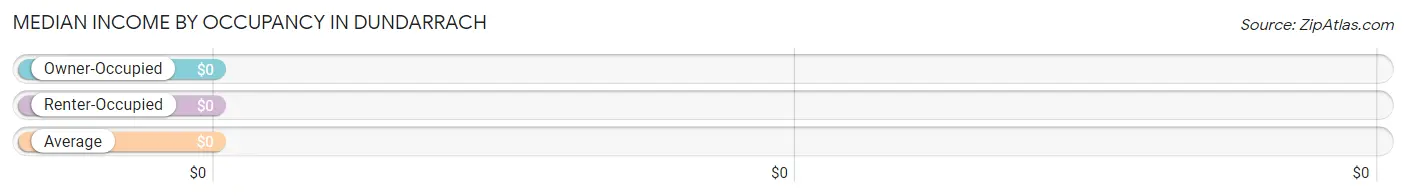
| Occupancy Type | # Households | Median Income |
| Owner-Occupied | 9 (50.0%) | $0 |
| Renter-Occupied | 9 (50.0%) | $0 |
| Average | 18 (100.0%) | $0 |
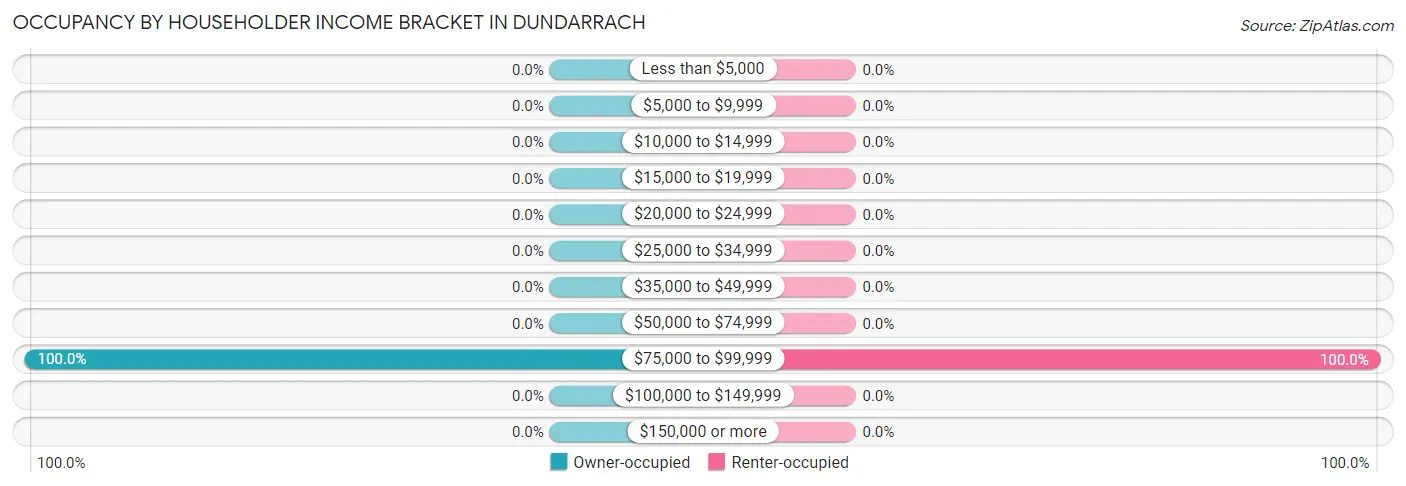
Occupancy by Householder Income Bracket in Dundarrach
| Income Bracket | Owner-occupied | Renter-occupied |
| Less than $5,000 | 0 (0.0%) | 0 (0.0%) |
| $5,000 to $9,999 | 0 (0.0%) | 0 (0.0%) |
| $10,000 to $14,999 | 0 (0.0%) | 0 (0.0%) |
| $15,000 to $19,999 | 0 (0.0%) | 0 (0.0%) |
| $20,000 to $24,999 | 0 (0.0%) | 0 (0.0%) |
| $25,000 to $34,999 | 0 (0.0%) | 0 (0.0%) |
| $35,000 to $49,999 | 0 (0.0%) | 0 (0.0%) |
| $50,000 to $74,999 | 0 (0.0%) | 0 (0.0%) |
| $75,000 to $99,999 | 9 (100.0%) | 9 (100.0%) |
| $100,000 to $149,999 | 0 (0.0%) | 0 (0.0%) |
| $150,000 or more | 0 (0.0%) | 0 (0.0%) |
| Total | 9 (100.0%) | 9 (100.0%) |
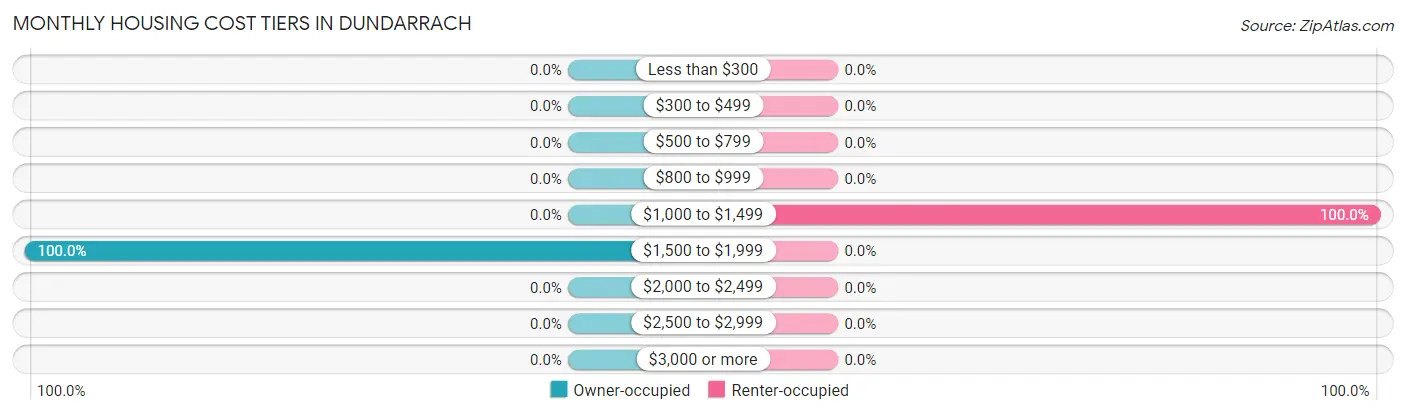
Monthly Housing Cost Tiers in Dundarrach
| Monthly Cost | Owner-occupied | Renter-occupied |
| Less than $300 | 0 (0.0%) | 0 (0.0%) |
| $300 to $499 | 0 (0.0%) | 0 (0.0%) |
| $500 to $799 | 0 (0.0%) | 0 (0.0%) |
| $800 to $999 | 0 (0.0%) | 0 (0.0%) |
| $1,000 to $1,499 | 0 (0.0%) | 9 (100.0%) |
| $1,500 to $1,999 | 9 (100.0%) | 0 (0.0%) |
| $2,000 to $2,499 | 0 (0.0%) | 0 (0.0%) |
| $2,500 to $2,999 | 0 (0.0%) | 0 (0.0%) |
| $3,000 or more | 0 (0.0%) | 0 (0.0%) |
| Total | 9 (100.0%) | 9 (100.0%) |
Physical Housing Characteristics in Dundarrach
Housing Structures in Dundarrach

| Structure Type | # Housing Units | % Housing Units |
| Single Unit, Detached | 18 | 100.0% |
| Single Unit, Attached | 0 | 0.0% |
| 2 Unit Apartments | 0 | 0.0% |
| 3 or 4 Unit Apartments | 0 | 0.0% |
| 5 to 9 Unit Apartments | 0 | 0.0% |
| 10 or more Apartments | 0 | 0.0% |
| Mobile Home / Other | 0 | 0.0% |
| Total | 18 | 100.0% |
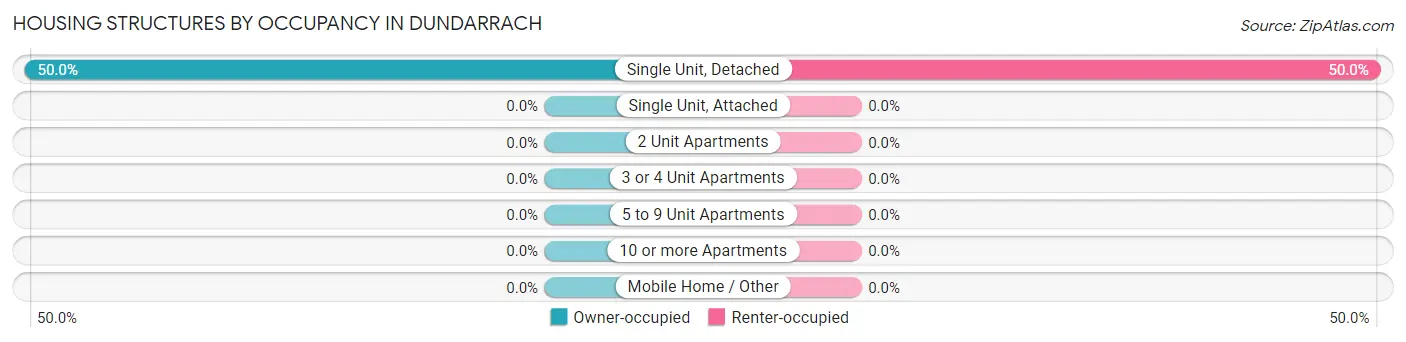
Housing Structures by Occupancy in Dundarrach
| Structure Type | Owner-occupied | Renter-occupied |
| Single Unit, Detached | 9 (50.0%) | 9 (50.0%) |
| Single Unit, Attached | 0 (0.0%) | 0 (0.0%) |
| 2 Unit Apartments | 0 (0.0%) | 0 (0.0%) |
| 3 or 4 Unit Apartments | 0 (0.0%) | 0 (0.0%) |
| 5 to 9 Unit Apartments | 0 (0.0%) | 0 (0.0%) |
| 10 or more Apartments | 0 (0.0%) | 0 (0.0%) |
| Mobile Home / Other | 0 (0.0%) | 0 (0.0%) |
| Total | 9 (50.0%) | 9 (50.0%) |
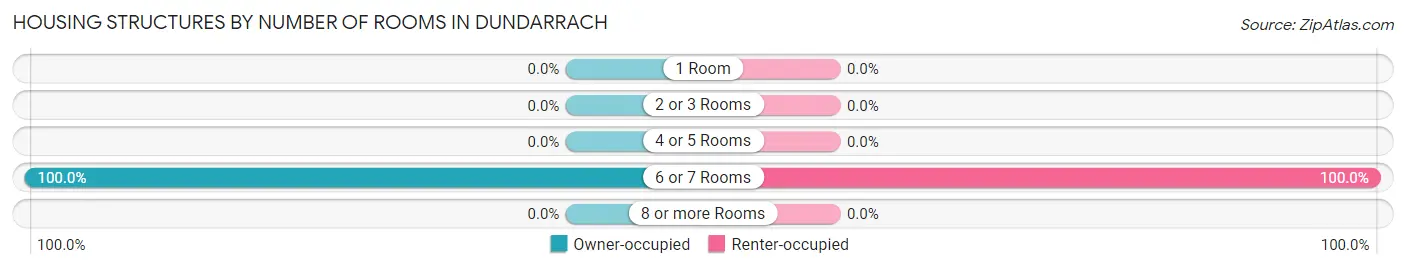
Housing Structures by Number of Rooms in Dundarrach
| Number of Rooms | Owner-occupied | Renter-occupied |
| 1 Room | 0 (0.0%) | 0 (0.0%) |
| 2 or 3 Rooms | 0 (0.0%) | 0 (0.0%) |
| 4 or 5 Rooms | 0 (0.0%) | 0 (0.0%) |
| 6 or 7 Rooms | 9 (100.0%) | 9 (100.0%) |
| 8 or more Rooms | 0 (0.0%) | 0 (0.0%) |
| Total | 9 (100.0%) | 9 (100.0%) |
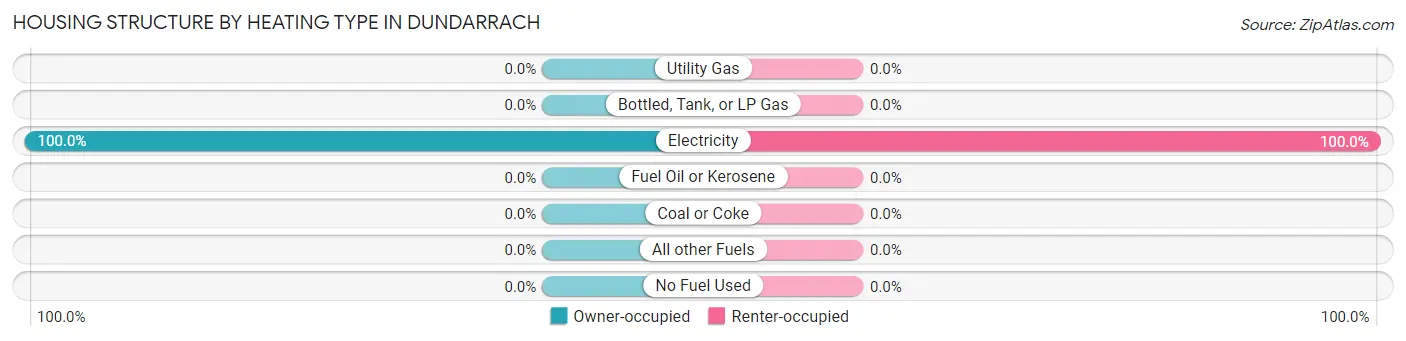
Housing Structure by Heating Type in Dundarrach
| Heating Type | Owner-occupied | Renter-occupied |
| Utility Gas | 0 (0.0%) | 0 (0.0%) |
| Bottled, Tank, or LP Gas | 0 (0.0%) | 0 (0.0%) |
| Electricity | 9 (100.0%) | 9 (100.0%) |
| Fuel Oil or Kerosene | 0 (0.0%) | 0 (0.0%) |
| Coal or Coke | 0 (0.0%) | 0 (0.0%) |
| All other Fuels | 0 (0.0%) | 0 (0.0%) |
| No Fuel Used | 0 (0.0%) | 0 (0.0%) |
| Total | 9 (100.0%) | 9 (100.0%) |
Household Vehicle Usage in Dundarrach
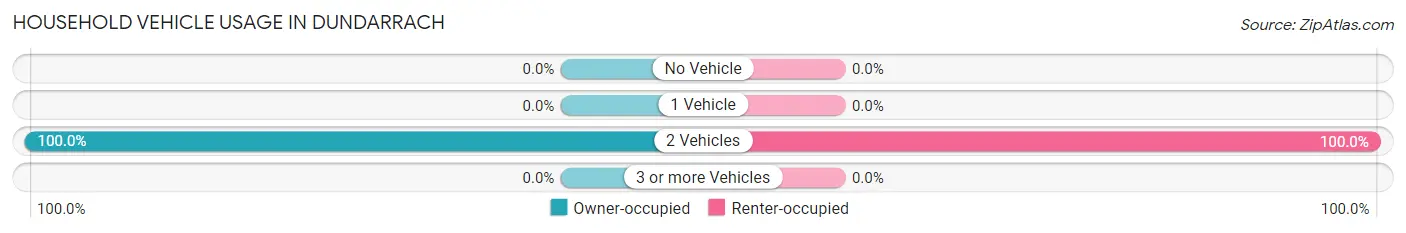
| Vehicles per Household | Owner-occupied | Renter-occupied |
| No Vehicle | 0 (0.0%) | 0 (0.0%) |
| 1 Vehicle | 0 (0.0%) | 0 (0.0%) |
| 2 Vehicles | 9 (100.0%) | 9 (100.0%) |
| 3 or more Vehicles | 0 (0.0%) | 0 (0.0%) |
| Total | 9 (100.0%) | 9 (100.0%) |
Real Estate & Mortgages in Dundarrach
Real Estate and Mortgage Overview in Dundarrach
| Characteristic | Without Mortgage | With Mortgage |
| Housing Units | 0 | 9 |
| Median Property Value | - | - |
| Median Household Income | - | - |
| Monthly Housing Costs | - | - |
| Real Estate Taxes | - | - |
Property Value by Mortgage Status in Dundarrach
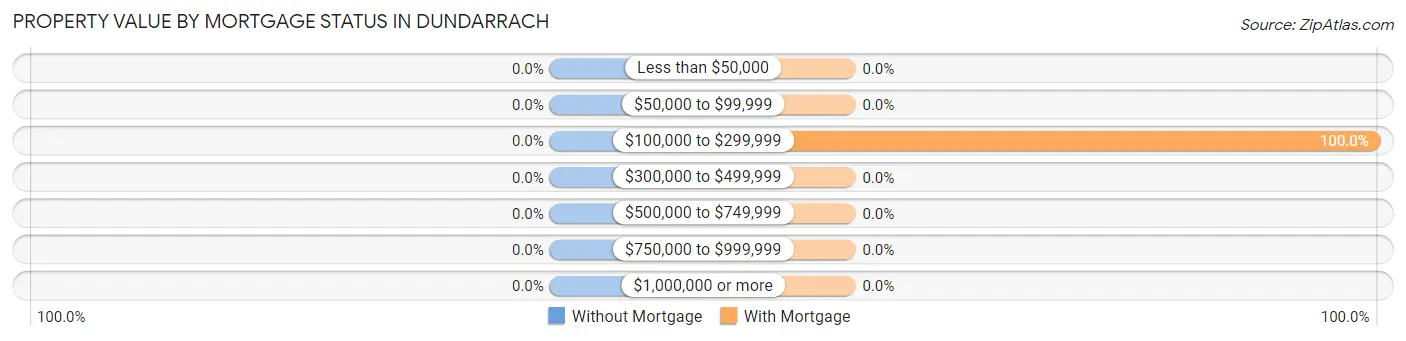
| Property Value | Without Mortgage | With Mortgage |
| Less than $50,000 | 0 (0.0%) | 0 (0.0%) |
| $50,000 to $99,999 | 0 (0.0%) | 0 (0.0%) |
| $100,000 to $299,999 | 0 (0.0%) | 9 (100.0%) |
| $300,000 to $499,999 | 0 (0.0%) | 0 (0.0%) |
| $500,000 to $749,999 | 0 (0.0%) | 0 (0.0%) |
| $750,000 to $999,999 | 0 (0.0%) | 0 (0.0%) |
| $1,000,000 or more | 0 (0.0%) | 0 (0.0%) |
| Total | 0 (0.0%) | 9 (100.0%) |
Household Income by Mortgage Status in Dundarrach
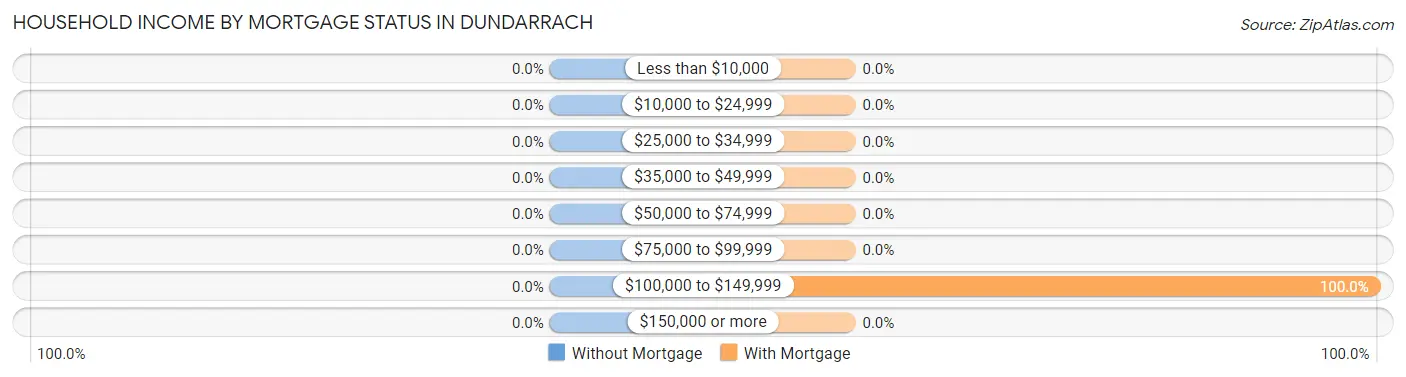
| Household Income | Without Mortgage | With Mortgage |
| Less than $10,000 | 0 (0.0%) | 0 (0.0%) |
| $10,000 to $24,999 | 0 (0.0%) | 0 (0.0%) |
| $25,000 to $34,999 | 0 (0.0%) | 0 (0.0%) |
| $35,000 to $49,999 | 0 (0.0%) | 0 (0.0%) |
| $50,000 to $74,999 | 0 (0.0%) | 0 (0.0%) |
| $75,000 to $99,999 | 0 (0.0%) | 0 (0.0%) |
| $100,000 to $149,999 | 0 (0.0%) | 9 (100.0%) |
| $150,000 or more | 0 (0.0%) | 0 (0.0%) |
| Total | 0 (0.0%) | 9 (100.0%) |
Property Value to Household Income Ratio in Dundarrach
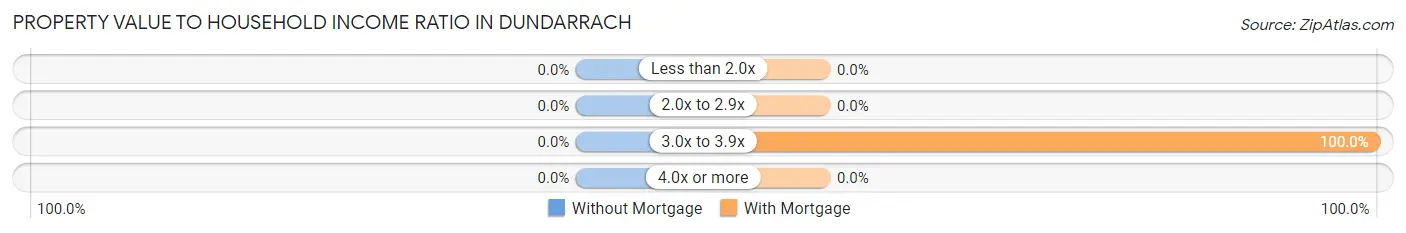
| Value-to-Income Ratio | Without Mortgage | With Mortgage |
| Less than 2.0x | 0 (0.0%) | 0 (0.0%) |
| 2.0x to 2.9x | 0 (0.0%) | 0 (0.0%) |
| 3.0x to 3.9x | 0 (0.0%) | 9 (100.0%) |
| 4.0x or more | 0 (0.0%) | 0 (0.0%) |
| Total | 0 (0.0%) | 9 (100.0%) |
Real Estate Taxes by Mortgage Status in Dundarrach
| Property Taxes | Without Mortgage | With Mortgage |
| Less than $800 | 0 (0.0%) | 0 (0.0%) |
| $800 to $1,499 | 0 (0.0%) | 0 (0.0%) |
| $800 to $1,499 | 0 (0.0%) | 0 (0.0%) |
| Total | 0 (0.0%) | 9 (100.0%) |
Health & Disability in Dundarrach
Health Insurance Coverage by Age in Dundarrach
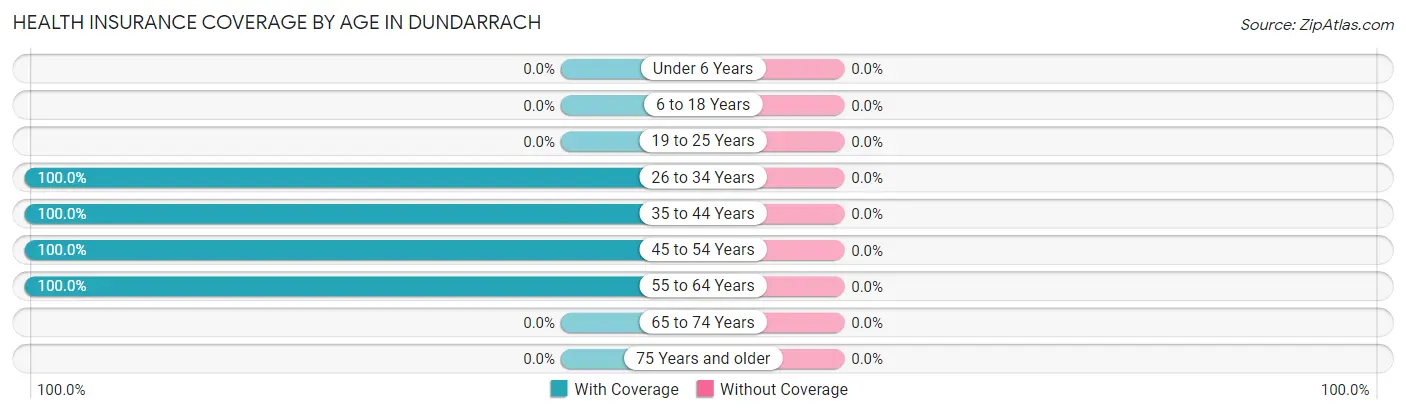
| Age Bracket | With Coverage | Without Coverage |
| Under 6 Years | 0 (0.0%) | 0 (0.0%) |
| 6 to 18 Years | 0 (0.0%) | 0 (0.0%) |
| 19 to 25 Years | 0 (0.0%) | 0 (0.0%) |
| 26 to 34 Years | 18 (100.0%) | 0 (0.0%) |
| 35 to 44 Years | 8 (100.0%) | 0 (0.0%) |
| 45 to 54 Years | 9 (100.0%) | 0 (0.0%) |
| 55 to 64 Years | 17 (100.0%) | 0 (0.0%) |
| 65 to 74 Years | 0 (0.0%) | 0 (0.0%) |
| 75 Years and older | 0 (0.0%) | 0 (0.0%) |
| Total | 52 (100.0%) | 0 (0.0%) |
Health Insurance Coverage by Citizenship Status in Dundarrach
| Citizenship Status | With Coverage | Without Coverage |
| Native Born | 0 (0.0%) | 0 (0.0%) |
| Foreign Born, Citizen | 0 (0.0%) | 0 (0.0%) |
| Foreign Born, not a Citizen | 0 (0.0%) | 0 (0.0%) |
Health Insurance Coverage by Household Income in Dundarrach
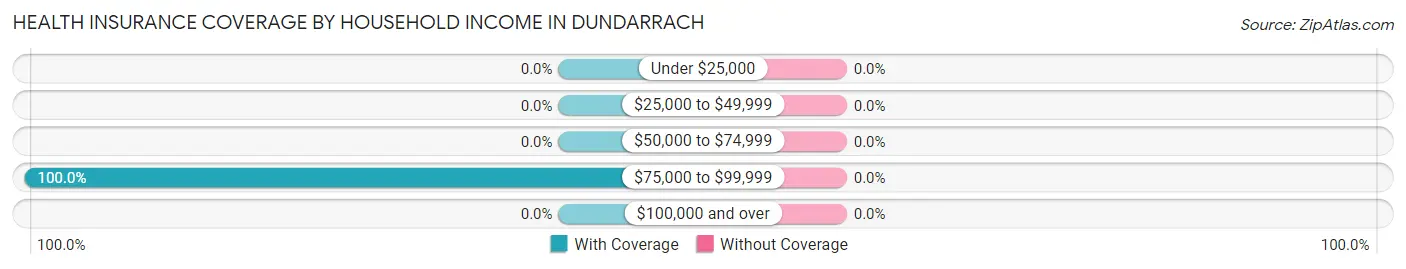
| Household Income | With Coverage | Without Coverage |
| Under $25,000 | 0 (0.0%) | 0 (0.0%) |
| $25,000 to $49,999 | 0 (0.0%) | 0 (0.0%) |
| $50,000 to $74,999 | 0 (0.0%) | 0 (0.0%) |
| $75,000 to $99,999 | 52 (100.0%) | 0 (0.0%) |
| $100,000 and over | 0 (0.0%) | 0 (0.0%) |
Public vs Private Health Insurance Coverage by Age in Dundarrach
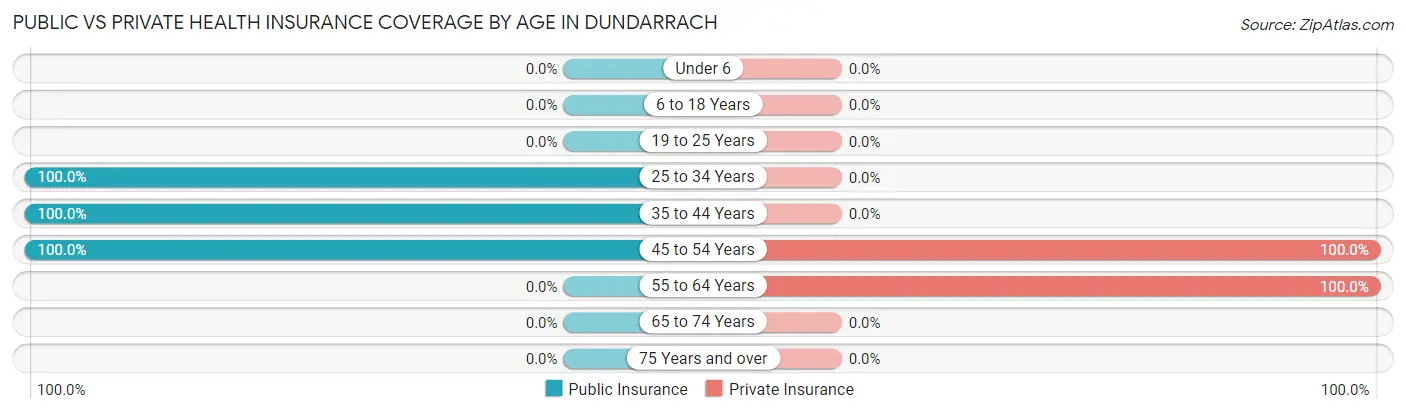
| Age Bracket | Public Insurance | Private Insurance |
| Under 6 | 0 (0.0%) | 0 (0.0%) |
| 6 to 18 Years | 0 (0.0%) | 0 (0.0%) |
| 19 to 25 Years | 0 (0.0%) | 0 (0.0%) |
| 25 to 34 Years | 18 (100.0%) | 0 (0.0%) |
| 35 to 44 Years | 8 (100.0%) | 0 (0.0%) |
| 45 to 54 Years | 9 (100.0%) | 9 (100.0%) |
| 55 to 64 Years | 0 (0.0%) | 17 (100.0%) |
| 65 to 74 Years | 0 (0.0%) | 0 (0.0%) |
| 75 Years and over | 0 (0.0%) | 0 (0.0%) |
| Total | 35 (67.3%) | 26 (50.0%) |
Disability Status by Sex by Age in Dundarrach
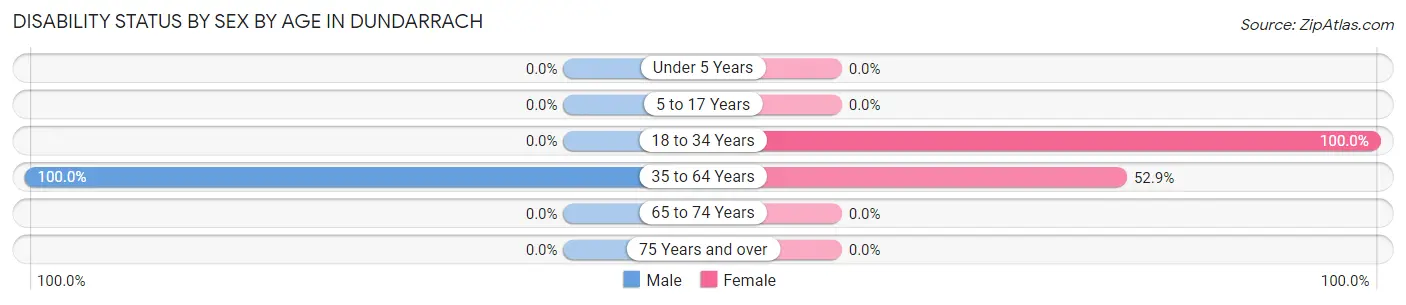
| Age Bracket | Male | Female |
| Under 5 Years | 0 (0.0%) | 0 (0.0%) |
| 5 to 17 Years | 0 (0.0%) | 0 (0.0%) |
| 18 to 34 Years | 0 (0.0%) | 18 (100.0%) |
| 35 to 64 Years | 17 (100.0%) | 9 (52.9%) |
| 65 to 74 Years | 0 (0.0%) | 0 (0.0%) |
| 75 Years and over | 0 (0.0%) | 0 (0.0%) |
Disability Class by Sex by Age in Dundarrach
Disability Class: Hearing Difficulty
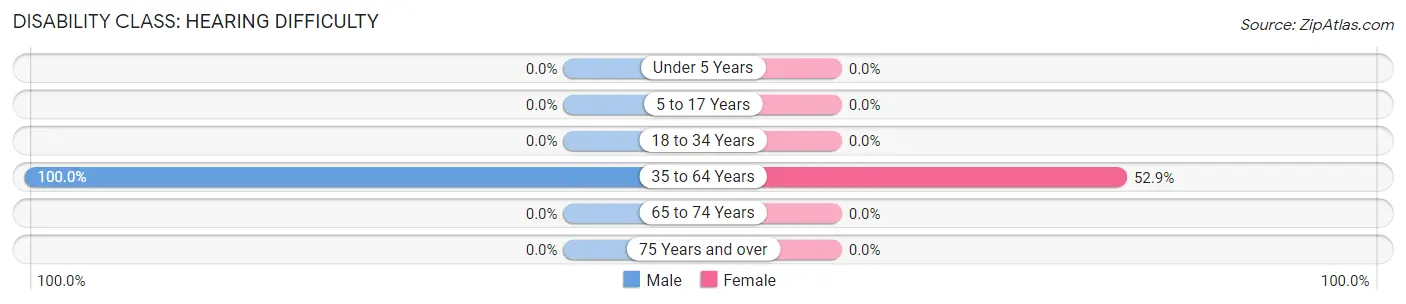
| Age Bracket | Male | Female |
| Under 5 Years | 0 (0.0%) | 0 (0.0%) |
| 5 to 17 Years | 0 (0.0%) | 0 (0.0%) |
| 18 to 34 Years | 0 (0.0%) | 0 (0.0%) |
| 35 to 64 Years | 17 (100.0%) | 9 (52.9%) |
| 65 to 74 Years | 0 (0.0%) | 0 (0.0%) |
| 75 Years and over | 0 (0.0%) | 0 (0.0%) |
Disability Class: Vision Difficulty
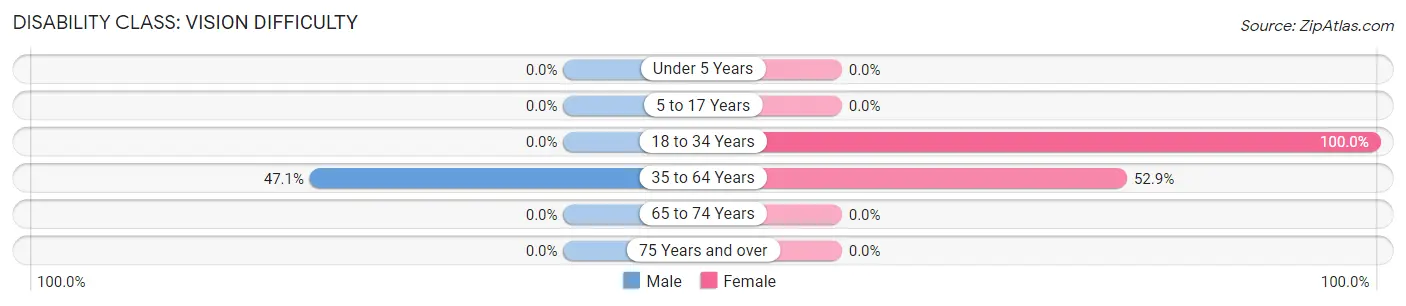
| Age Bracket | Male | Female |
| Under 5 Years | 0 (0.0%) | 0 (0.0%) |
| 5 to 17 Years | 0 (0.0%) | 0 (0.0%) |
| 18 to 34 Years | 0 (0.0%) | 18 (100.0%) |
| 35 to 64 Years | 8 (47.1%) | 9 (52.9%) |
| 65 to 74 Years | 0 (0.0%) | 0 (0.0%) |
| 75 Years and over | 0 (0.0%) | 0 (0.0%) |
Disability Class: Cognitive Difficulty
| Age Bracket | Male | Female |
| 5 to 17 Years | 0 (0.0%) | 0 (0.0%) |
| 18 to 34 Years | 0 (0.0%) | 0 (0.0%) |
| 35 to 64 Years | 0 (0.0%) | 0 (0.0%) |
| 65 to 74 Years | 0 (0.0%) | 0 (0.0%) |
| 75 Years and over | 0 (0.0%) | 0 (0.0%) |
Disability Class: Ambulatory Difficulty
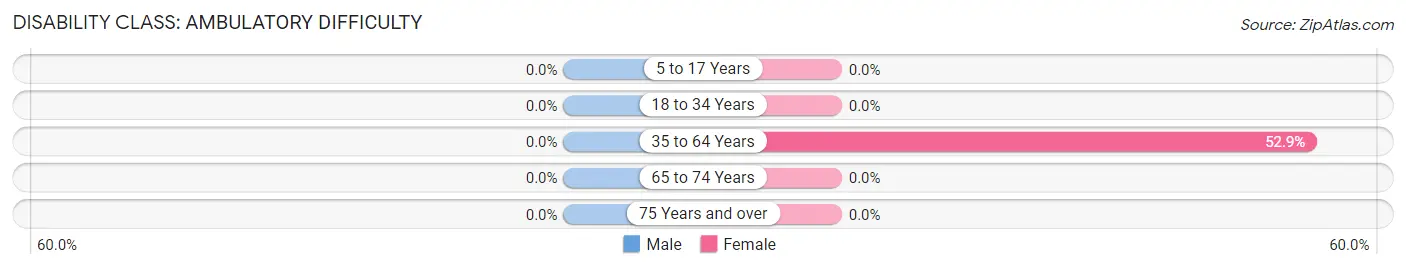
| Age Bracket | Male | Female |
| 5 to 17 Years | 0 (0.0%) | 0 (0.0%) |
| 18 to 34 Years | 0 (0.0%) | 0 (0.0%) |
| 35 to 64 Years | 0 (0.0%) | 9 (52.9%) |
| 65 to 74 Years | 0 (0.0%) | 0 (0.0%) |
| 75 Years and over | 0 (0.0%) | 0 (0.0%) |
Disability Class: Self-Care Difficulty
| Age Bracket | Male | Female |
| 5 to 17 Years | 0 (0.0%) | 0 (0.0%) |
| 18 to 34 Years | 0 (0.0%) | 0 (0.0%) |
| 35 to 64 Years | 0 (0.0%) | 0 (0.0%) |
| 65 to 74 Years | 0 (0.0%) | 0 (0.0%) |
| 75 Years and over | 0 (0.0%) | 0 (0.0%) |
Technology Access in Dundarrach
Computing Device Access in Dundarrach
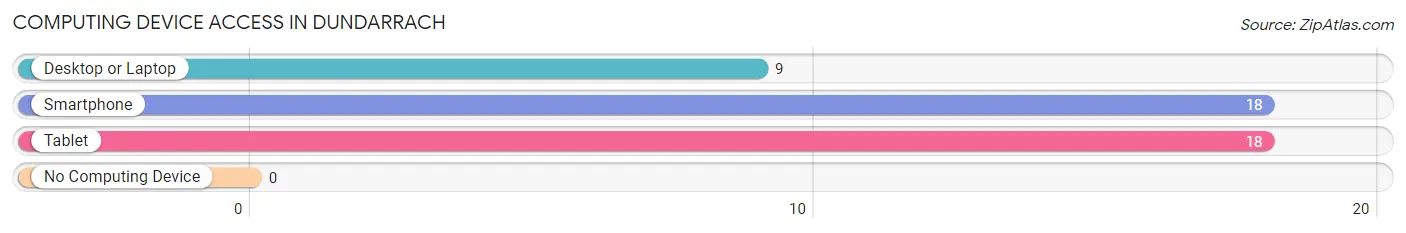
| Device Type | # Households | % Households |
| Desktop or Laptop | 9 | 50.0% |
| Smartphone | 18 | 100.0% |
| Tablet | 18 | 100.0% |
| No Computing Device | 0 | 0.0% |
| Total | 18 | 100.0% |
Internet Access in Dundarrach
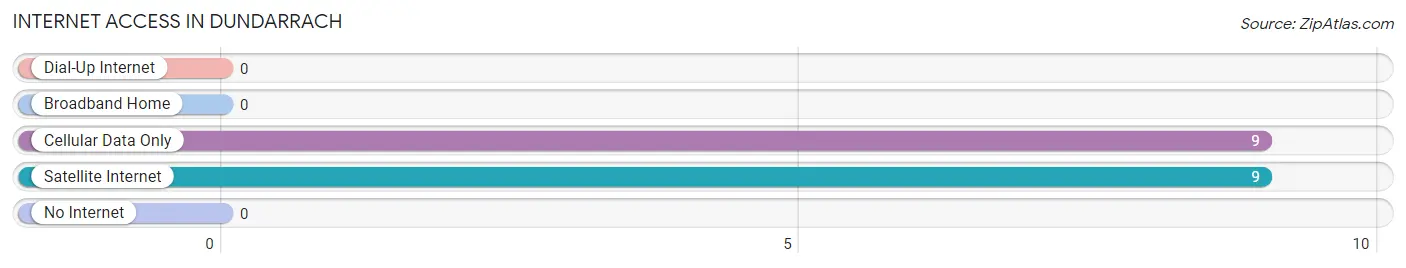
| Internet Type | # Households | % Households |
| Dial-Up Internet | 0 | 0.0% |
| Broadband Home | 0 | 0.0% |
| Cellular Data Only | 9 | 50.0% |
| Satellite Internet | 9 | 50.0% |
| No Internet | 0 | 0.0% |
| Total | 18 | 100.0% |
Dundarrach Summary
Dundarrach is a small unincorporated community located in Hoke County, North Carolina. It is situated in the Sandhills region of the state, approximately 20 miles south of the city of Fayetteville. The population of Dundarrach was estimated to be around 1,000 in 2020.
History
Dundarrach was first settled in the late 1700s by Scottish immigrants who had come to the area in search of a better life. The town was named after the Scottish town of Dundarrach, which is located in Aberdeenshire. The first settlers in Dundarrach were primarily farmers, and the town quickly grew to become a thriving agricultural community.
In the early 1900s, Dundarrach began to experience a period of growth and development. The town was incorporated in 1909, and the first mayor was elected in 1910. During this time, the town saw the construction of several new businesses, including a general store, a post office, and a bank.
In the mid-1900s, Dundarrach experienced a period of decline. The town’s population began to decline as people moved away in search of better economic opportunities. The town’s economy was further weakened by the Great Depression and World War II.
In the late 1900s, Dundarrach began to experience a period of revitalization. The town’s population began to increase as people moved back to the area in search of a better quality of life. The town’s economy also began to improve as new businesses opened and existing businesses expanded.
Geography
Dundarrach is located in the Sandhills region of North Carolina. The town is situated in the southeastern part of Hoke County, approximately 20 miles south of the city of Fayetteville. The town is located at an elevation of approximately 200 feet above sea level.
The town is situated in a rural area, surrounded by farmland and forests. The nearest major city is Fayetteville, which is located approximately 20 miles to the north. The nearest major highway is Interstate 95, which is located approximately 25 miles to the east.
Economy
The economy of Dundarrach is primarily based on agriculture. The town is home to several farms, which produce a variety of crops, including corn, soybeans, and cotton. The town is also home to several businesses, including a general store, a post office, and a bank.
The town is also home to several manufacturing companies, which produce a variety of products, including furniture, textiles, and paper products. The town is also home to several service-based businesses, including restaurants, hotels, and auto repair shops.
Demographics
The population of Dundarrach was estimated to be around 1,000 in 2020. The town is predominantly white, with approximately 95% of the population identifying as such. The town is also home to a small Hispanic population, with approximately 5% of the population identifying as such.
The median household income in Dundarrach is approximately $35,000 per year. The median home value in the town is approximately $150,000. The town has a poverty rate of approximately 15%, which is slightly higher than the national average.
Common Questions
What is Per Capita Income in Dundarrach?
Per Capita income in Dundarrach is $31,721.
What is Inequality or Gini Index in Dundarrach?
Inequality or Gini Index in Dundarrach is 0.01.
What is the Total Population of Dundarrach?
Total Population of Dundarrach is 52.
What is the Total Male Population of Dundarrach?
Total Male Population of Dundarrach is 17.
What is the Total Female Population of Dundarrach?
Total Female Population of Dundarrach is 35.
What is the Ratio of Males per 100 Females in Dundarrach?
There are 48.57 Males per 100 Females in Dundarrach.
What is the Ratio of Females per 100 Males in Dundarrach?
There are 205.88 Females per 100 Males in Dundarrach.
What is the Median Population Age in Dundarrach?
Median Population Age in Dundarrach is 46.5 Years.
What is the Average Family Size in Dundarrach
Average Family Size in Dundarrach is 2.9 People.
What is the Average Household Size in Dundarrach
Average Household Size in Dundarrach is 2.9 People.
How Large is the Labor Force in Dundarrach?
There are 17 People in the Labor Forcein in Dundarrach.
What is the Percentage of People in the Labor Force in Dundarrach?
32.7% of People are in the Labor Force in Dundarrach.