Goldston, NC Map & Demographics
Goldston Map
Goldston Overview
$22,666
PER CAPITA INCOME
$37,278
AVG HOUSEHOLD INCOME
0.38
INEQUALITY / GINI INDEX
375
TOTAL POPULATION
187
MALE POPULATION
188
FEMALE POPULATION
99.47
MALES / 100 FEMALES
100.53
FEMALES / 100 MALES
32.9
MEDIAN AGE
3.4
AVG FAMILY SIZE
3.0
AVG HOUSEHOLD SIZE
228
LABOR FORCE [ PEOPLE ]
75.2%
PERCENT IN LABOR FORCE
Goldston Zip Codes
Goldston Area Codes
Income in Goldston
Income Overview in Goldston
| Characteristic | Number | Measure |
| Per Capita Income | 375 | $22,666 |
| Median Family Income | 102 | $0 |
| Mean Family Income | 102 | $70,703 |
| Median Household Income | 126 | $37,278 |
| Mean Household Income | 126 | $62,655 |
| Income Deficit | 102 | $0 |
| Wage / Income Gap (%) | 375 | 0.00% |
| Wage / Income Gap ($) | 375 | 100.00¢ per $1 |
| Gini / Inequality Index | 375 | 0.38 |
Earnings by Sex in Goldston
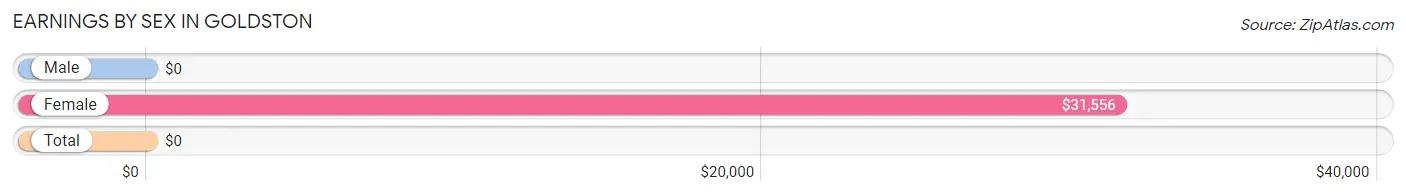
| Sex | Number | Average Earnings |
| Male | 142 (60.2%) | $0 |
| Female | 94 (39.8%) | $31,556 |
| Total | 236 (100.0%) | $0 |
Earnings by Sex by Income Bracket in Goldston
The most common earnings brackets in Goldston are $5,000 to $7,499 for men (102 | 71.8%) and $30,000 to $34,999 for women (50 | 53.2%).
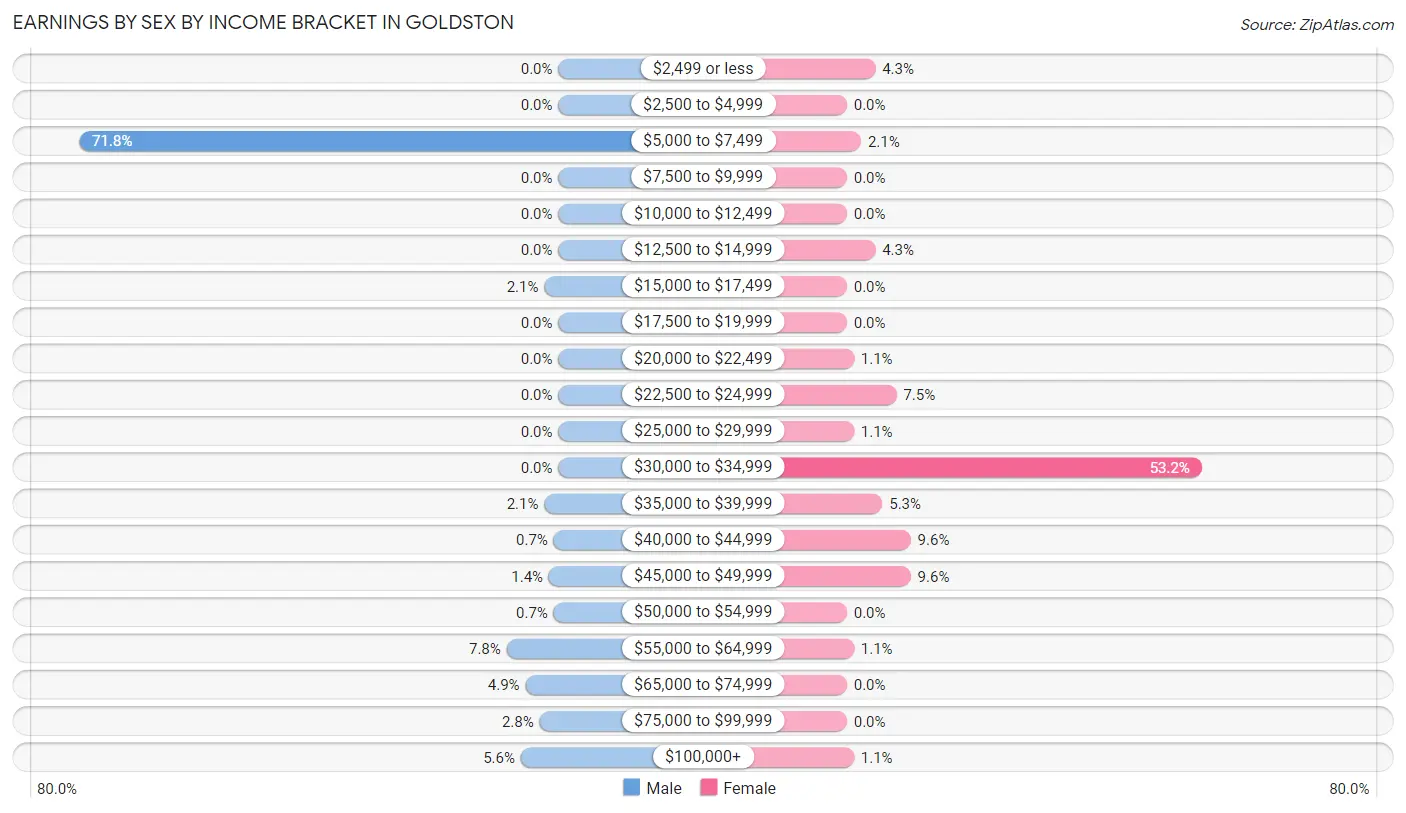
| Income | Male | Female |
| $2,499 or less | 0 (0.0%) | 4 (4.3%) |
| $2,500 to $4,999 | 0 (0.0%) | 0 (0.0%) |
| $5,000 to $7,499 | 102 (71.8%) | 2 (2.1%) |
| $7,500 to $9,999 | 0 (0.0%) | 0 (0.0%) |
| $10,000 to $12,499 | 0 (0.0%) | 0 (0.0%) |
| $12,500 to $14,999 | 0 (0.0%) | 4 (4.3%) |
| $15,000 to $17,499 | 3 (2.1%) | 0 (0.0%) |
| $17,500 to $19,999 | 0 (0.0%) | 0 (0.0%) |
| $20,000 to $22,499 | 0 (0.0%) | 1 (1.1%) |
| $22,500 to $24,999 | 0 (0.0%) | 7 (7.4%) |
| $25,000 to $29,999 | 0 (0.0%) | 1 (1.1%) |
| $30,000 to $34,999 | 0 (0.0%) | 50 (53.2%) |
| $35,000 to $39,999 | 3 (2.1%) | 5 (5.3%) |
| $40,000 to $44,999 | 1 (0.7%) | 9 (9.6%) |
| $45,000 to $49,999 | 2 (1.4%) | 9 (9.6%) |
| $50,000 to $54,999 | 1 (0.7%) | 0 (0.0%) |
| $55,000 to $64,999 | 11 (7.7%) | 1 (1.1%) |
| $65,000 to $74,999 | 7 (4.9%) | 0 (0.0%) |
| $75,000 to $99,999 | 4 (2.8%) | 0 (0.0%) |
| $100,000+ | 8 (5.6%) | 1 (1.1%) |
| Total | 142 (100.0%) | 94 (100.0%) |
Earnings by Sex by Educational Attainment in Goldston
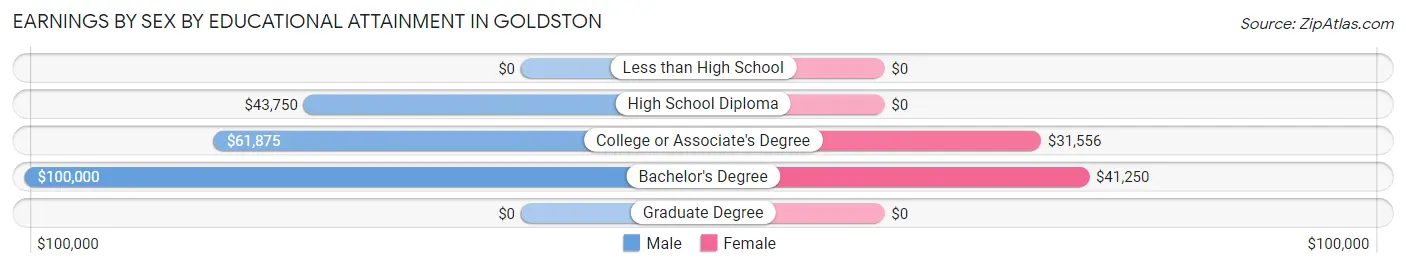
| Educational Attainment | Male Income | Female Income |
| Less than High School | - | - |
| High School Diploma | $43,750 | $0 |
| College or Associate's Degree | $61,875 | $31,556 |
| Bachelor's Degree | $100,000 | $41,250 |
| Graduate Degree | - | - |
| Total | - | - |
Family Income in Goldston
Family Income Brackets in Goldston
According to the Goldston family income data, there are 54 families falling into the $35,000 to $49,999 income range, which is the most common income bracket and makes up 52.9% of all families.
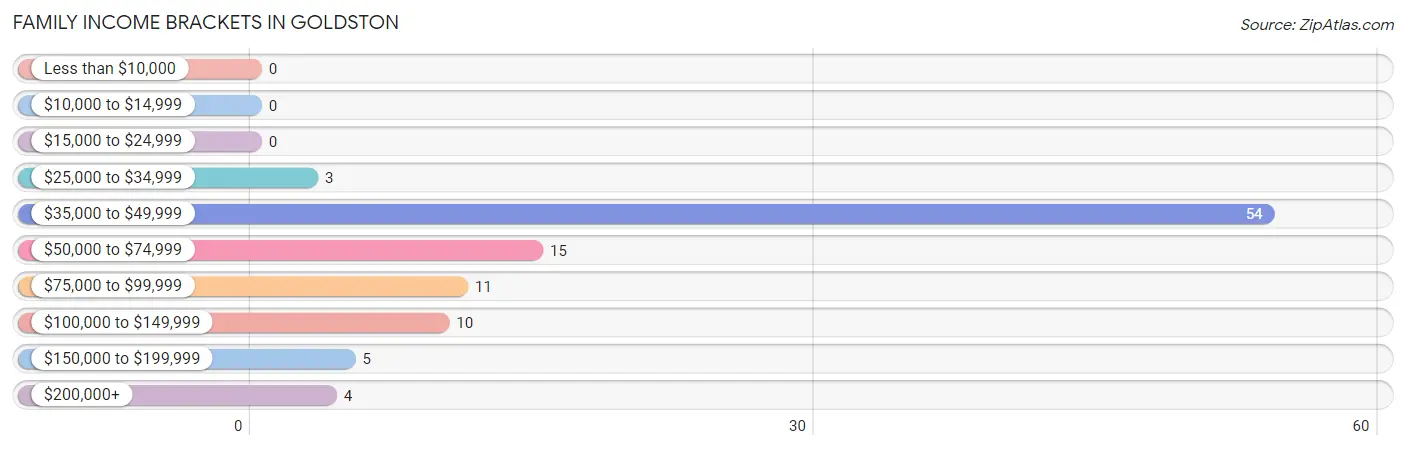
| Income Bracket | # Families | % Families |
| Less than $10,000 | 0 | 0.0% |
| $10,000 to $14,999 | 0 | 0.0% |
| $15,000 to $24,999 | 0 | 0.0% |
| $25,000 to $34,999 | 3 | 2.9% |
| $35,000 to $49,999 | 54 | 52.9% |
| $50,000 to $74,999 | 15 | 14.7% |
| $75,000 to $99,999 | 11 | 10.8% |
| $100,000 to $149,999 | 10 | 9.8% |
| $150,000 to $199,999 | 5 | 4.9% |
| $200,000+ | 4 | 3.9% |
Family Income by Famaliy Size in Goldston
2-person families (37 | 36.3%) account for the highest median family income in Goldston with $82,813 per family, while 2-person families (37 | 36.3%) have the highest median income of $41,406 per family member.
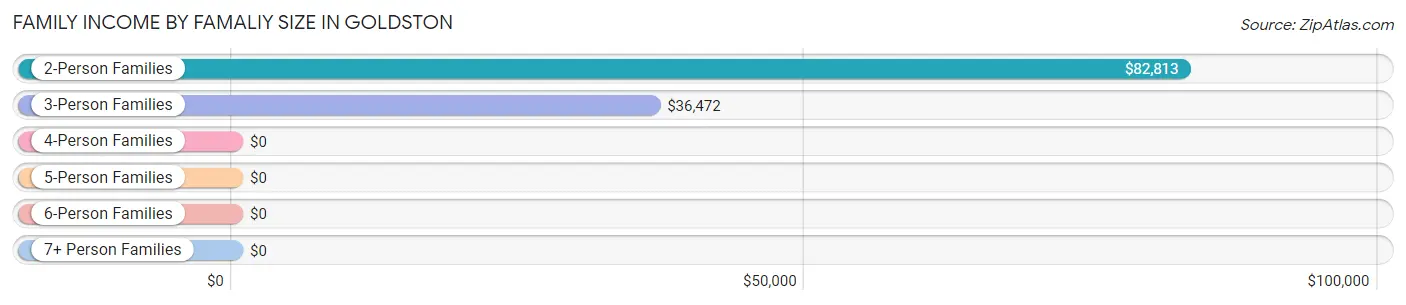
| Income Bracket | # Families | Median Income |
| 2-Person Families | 37 (36.3%) | $82,813 |
| 3-Person Families | 53 (52.0%) | $36,472 |
| 4-Person Families | 2 (2.0%) | $0 |
| 5-Person Families | 6 (5.9%) | $0 |
| 6-Person Families | 4 (3.9%) | $0 |
| 7+ Person Families | 0 (0.0%) | $0 |
| Total | 102 (100.0%) | $0 |
Family Income by Number of Earners in Goldston
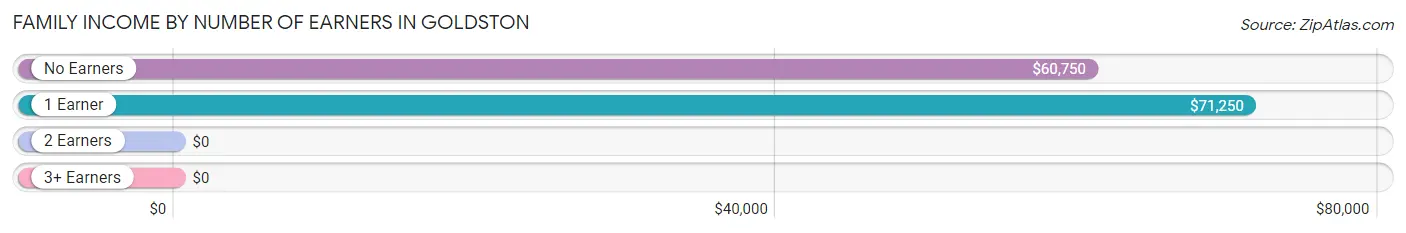
| Number of Earners | # Families | Median Income |
| No Earners | 13 (12.8%) | $60,750 |
| 1 Earner | 17 (16.7%) | $71,250 |
| 2 Earners | 72 (70.6%) | $0 |
| 3+ Earners | 0 (0.0%) | $0 |
| Total | 102 (100.0%) | $0 |
Household Income in Goldston
Household Income Brackets in Goldston
With 55 households falling in the category, the $35,000 to $49,999 income range is the most frequent in Goldston, accounting for 43.6% of all households.
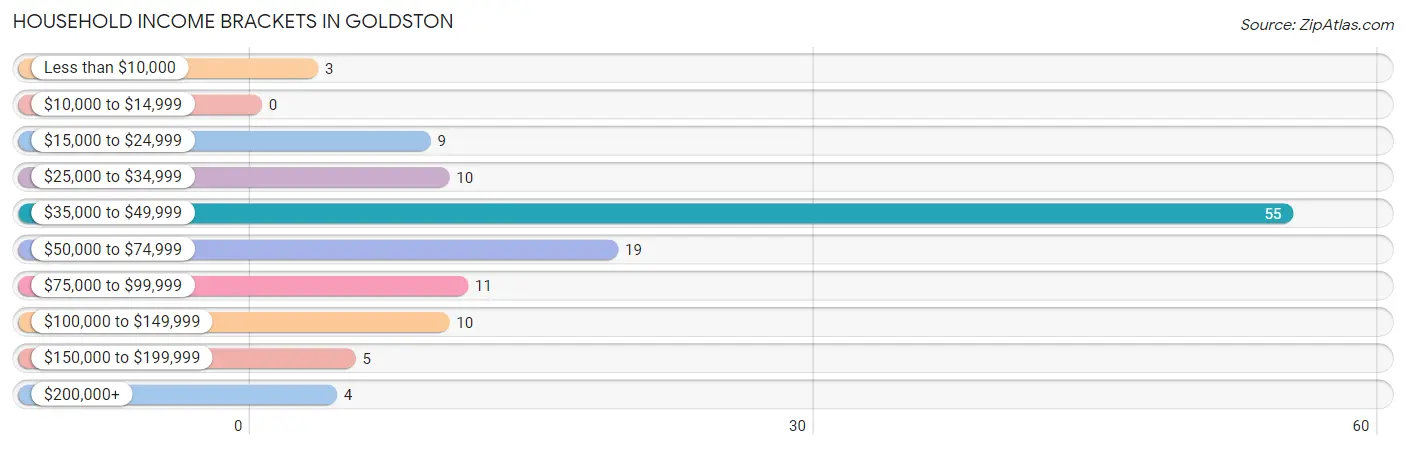
| Income Bracket | # Households | % Households |
| Less than $10,000 | 3 | 2.4% |
| $10,000 to $14,999 | 0 | 0.0% |
| $15,000 to $24,999 | 9 | 7.1% |
| $25,000 to $34,999 | 10 | 7.9% |
| $35,000 to $49,999 | 55 | 43.7% |
| $50,000 to $74,999 | 19 | 15.1% |
| $75,000 to $99,999 | 11 | 8.7% |
| $100,000 to $149,999 | 10 | 7.9% |
| $150,000 to $199,999 | 5 | 4.0% |
| $200,000+ | 4 | 3.2% |
Household Income by Householder Age in Goldston
The median household income in Goldston is $37,278, with the highest median household income of $101,250 found in the 25 to 44 years age bracket for the primary householder. A total of 17 households (13.5%) fall into this category. Meanwhile, the 15 to 24 years age bracket for the primary householder has the lowest median household income of $0, with 4 households (3.2%) in this group.
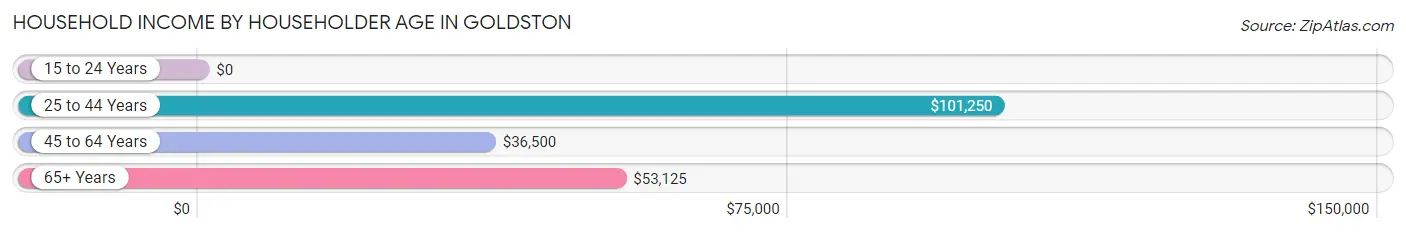
| Income Bracket | # Households | Median Income |
| 15 to 24 Years | 4 (3.2%) | $0 |
| 25 to 44 Years | 17 (13.5%) | $101,250 |
| 45 to 64 Years | 72 (57.1%) | $36,500 |
| 65+ Years | 33 (26.2%) | $53,125 |
| Total | 126 (100.0%) | $37,278 |
Poverty in Goldston
Income Below Poverty by Sex and Age in Goldston
With 2.7% poverty level for males and 10.6% for females among the residents of Goldston, under 5 year old males and 18 to 24 year old females are the most vulnerable to poverty, with 2 males (33.3%) and 10 females (100.0%) in their respective age groups living below the poverty level.
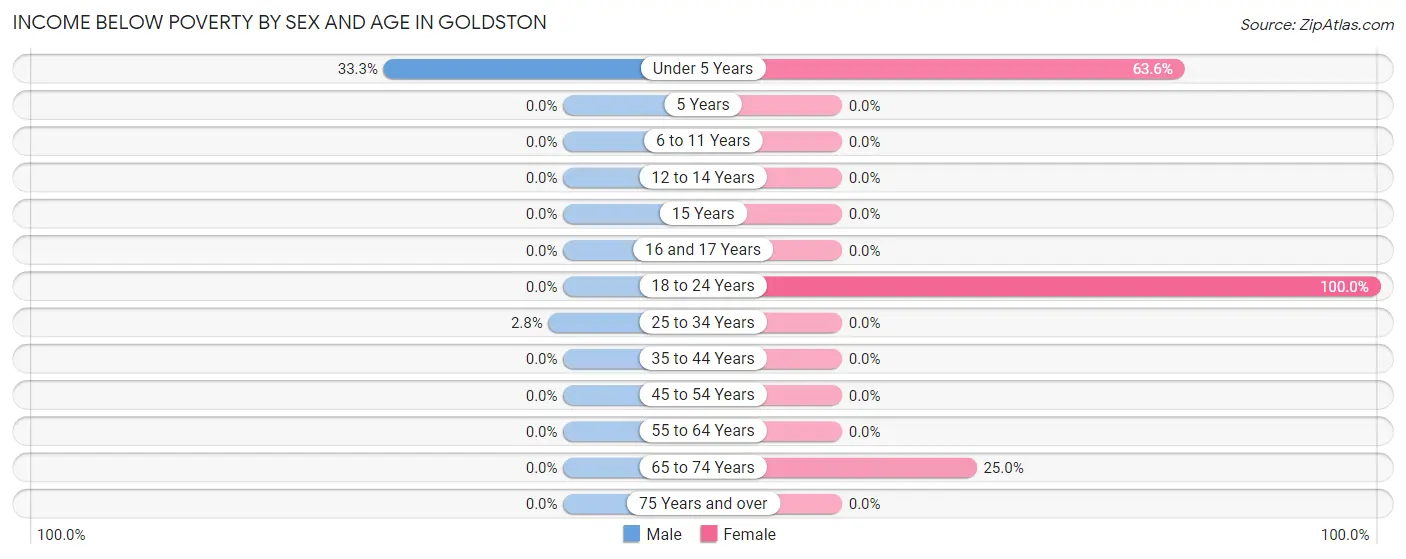
| Age Bracket | Male | Female |
| Under 5 Years | 2 (33.3%) | 7 (63.6%) |
| 5 Years | 0 (0.0%) | 0 (0.0%) |
| 6 to 11 Years | 0 (0.0%) | 0 (0.0%) |
| 12 to 14 Years | 0 (0.0%) | 0 (0.0%) |
| 15 Years | 0 (0.0%) | 0 (0.0%) |
| 16 and 17 Years | 0 (0.0%) | 0 (0.0%) |
| 18 to 24 Years | 0 (0.0%) | 10 (100.0%) |
| 25 to 34 Years | 3 (2.8%) | 0 (0.0%) |
| 35 to 44 Years | 0 (0.0%) | 0 (0.0%) |
| 45 to 54 Years | 0 (0.0%) | 0 (0.0%) |
| 55 to 64 Years | 0 (0.0%) | 0 (0.0%) |
| 65 to 74 Years | 0 (0.0%) | 3 (25.0%) |
| 75 Years and over | 0 (0.0%) | 0 (0.0%) |
| Total | 5 (2.7%) | 20 (10.6%) |
Income Above Poverty by Sex and Age in Goldston
According to the poverty statistics in Goldston, males aged 6 to 11 years and females aged 5 years are the age groups that are most secure financially, with 100.0% of males and 100.0% of females in these age groups living above the poverty line.
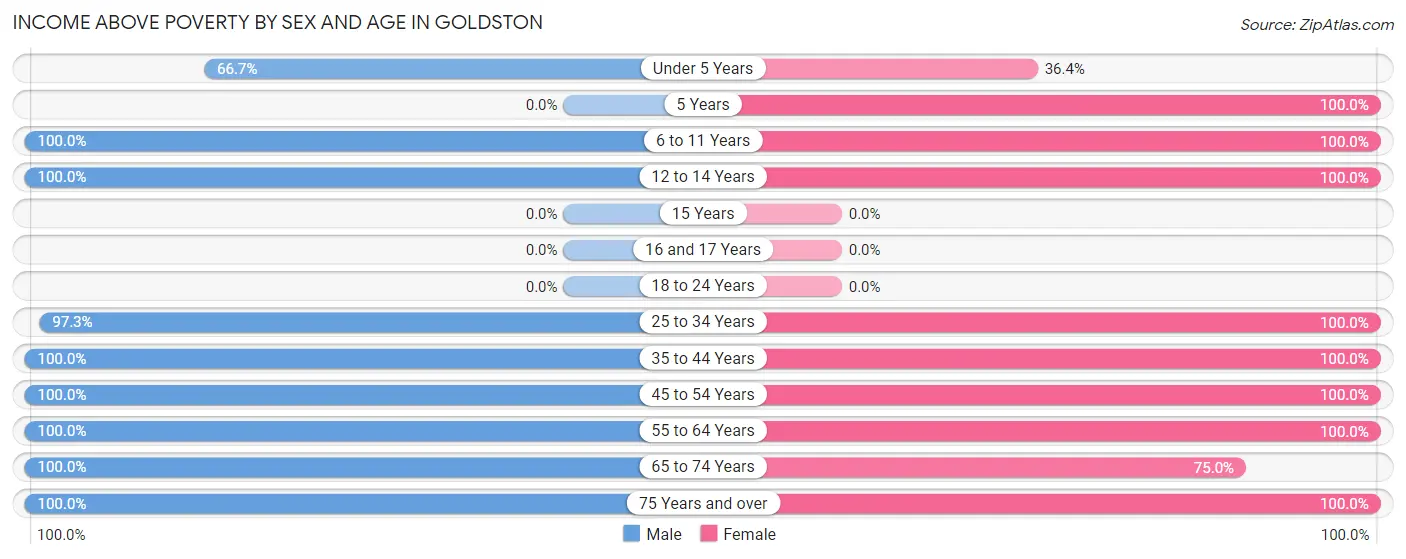
| Age Bracket | Male | Female |
| Under 5 Years | 4 (66.7%) | 4 (36.4%) |
| 5 Years | 0 (0.0%) | 4 (100.0%) |
| 6 to 11 Years | 5 (100.0%) | 6 (100.0%) |
| 12 to 14 Years | 5 (100.0%) | 35 (100.0%) |
| 15 Years | 0 (0.0%) | 0 (0.0%) |
| 16 and 17 Years | 0 (0.0%) | 0 (0.0%) |
| 18 to 24 Years | 0 (0.0%) | 0 (0.0%) |
| 25 to 34 Years | 106 (97.3%) | 11 (100.0%) |
| 35 to 44 Years | 14 (100.0%) | 6 (100.0%) |
| 45 to 54 Years | 2 (100.0%) | 13 (100.0%) |
| 55 to 64 Years | 15 (100.0%) | 63 (100.0%) |
| 65 to 74 Years | 7 (100.0%) | 9 (75.0%) |
| 75 Years and over | 24 (100.0%) | 17 (100.0%) |
| Total | 182 (97.3%) | 168 (89.4%) |
Income Below Poverty Among Married-Couple Families in Goldston
The poverty statistics for married-couple families in Goldston show that 8.3% or 4 of the total 48 families live below the poverty line. Families with 3 or 4 children have the highest poverty rate of 44.4%, comprising of 4 families. On the other hand, families with no children have the lowest poverty rate of 0.0%, which includes 0 families.
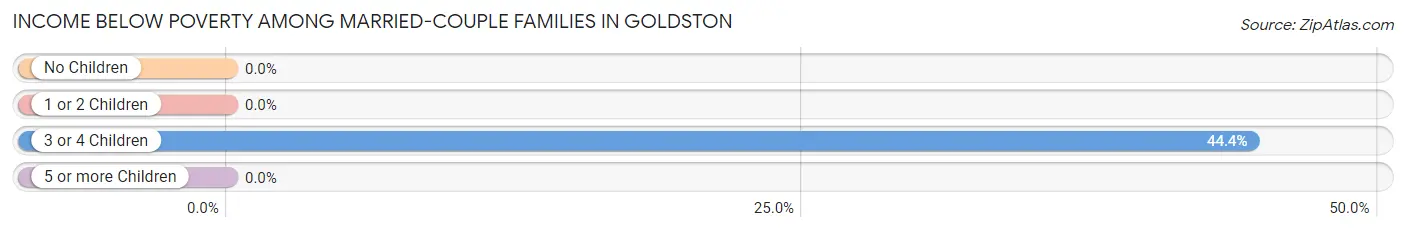
| Children | Above Poverty | Below Poverty |
| No Children | 31 (100.0%) | 0 (0.0%) |
| 1 or 2 Children | 8 (100.0%) | 0 (0.0%) |
| 3 or 4 Children | 5 (55.6%) | 4 (44.4%) |
| 5 or more Children | 0 (0.0%) | 0 (0.0%) |
| Total | 44 (91.7%) | 4 (8.3%) |
Income Below Poverty Among Single-Parent Households in Goldston
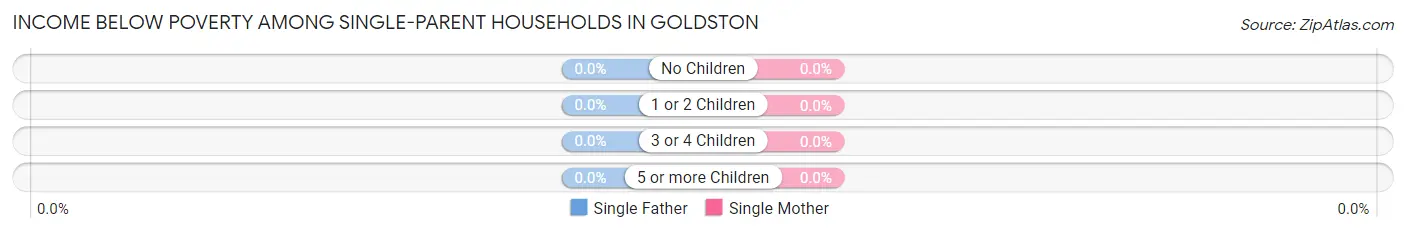
| Children | Single Father | Single Mother |
| No Children | 0 (0.0%) | 0 (0.0%) |
| 1 or 2 Children | 0 (0.0%) | 0 (0.0%) |
| 3 or 4 Children | 0 (0.0%) | 0 (0.0%) |
| 5 or more Children | 0 (0.0%) | 0 (0.0%) |
| Total | 0 (0.0%) | 0 (0.0%) |
Income Below Poverty Among Married-Couple vs Single-Parent Households in Goldston
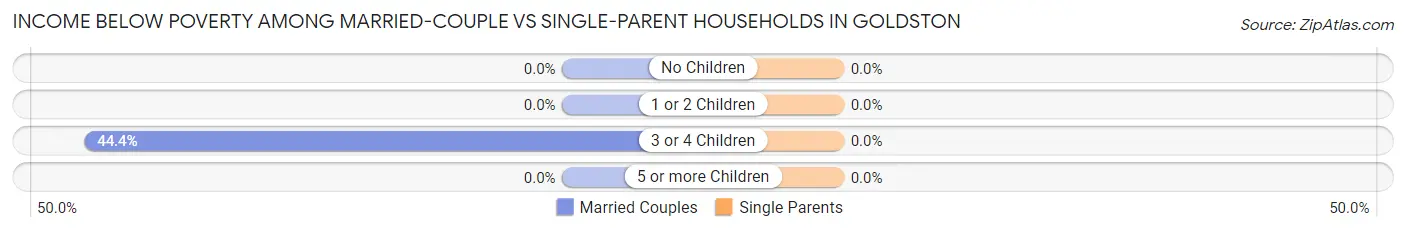
| Children | Married-Couple Families | Single-Parent Households |
| No Children | 0 (0.0%) | 0 (0.0%) |
| 1 or 2 Children | 0 (0.0%) | 0 (0.0%) |
| 3 or 4 Children | 4 (44.4%) | 0 (0.0%) |
| 5 or more Children | 0 (0.0%) | 0 (0.0%) |
| Total | 4 (8.3%) | 0 (0.0%) |
Race in Goldston
The most populous races in Goldston are White / Caucasian (346 | 92.3%), Two or more Races (14 | 3.7%), and Black / African American (9 | 2.4%).
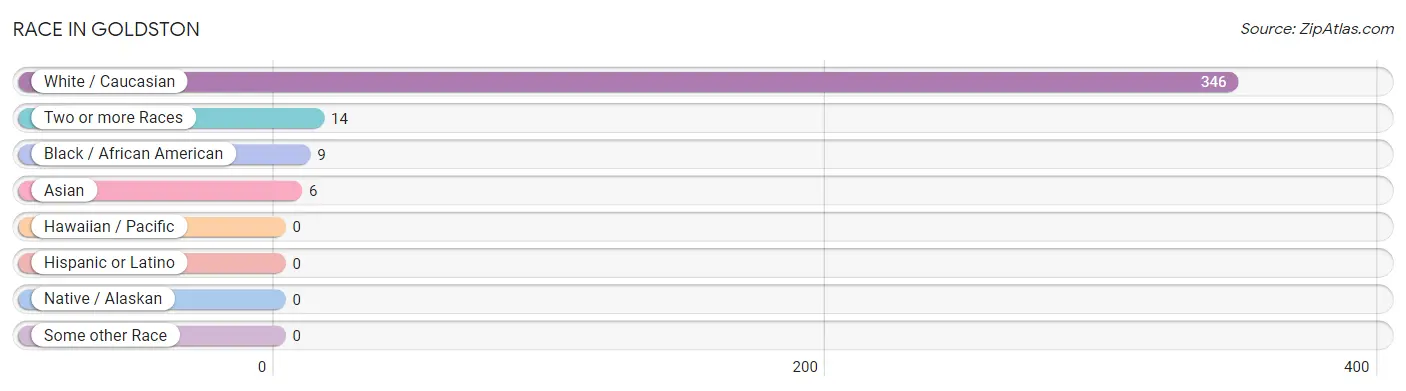
| Race | # Population | % Population |
| Asian | 6 | 1.6% |
| Black / African American | 9 | 2.4% |
| Hawaiian / Pacific | 0 | 0.0% |
| Hispanic or Latino | 0 | 0.0% |
| Native / Alaskan | 0 | 0.0% |
| White / Caucasian | 346 | 92.3% |
| Two or more Races | 14 | 3.7% |
| Some other Race | 0 | 0.0% |
| Total | 375 | 100.0% |
Ancestry in Goldston
The most populous ancestries reported in Goldston are English (35 | 9.3%), German (19 | 5.1%), American (14 | 3.7%), Irish (11 | 2.9%), and Korean (11 | 2.9%), together accounting for 24.0% of all Goldston residents.
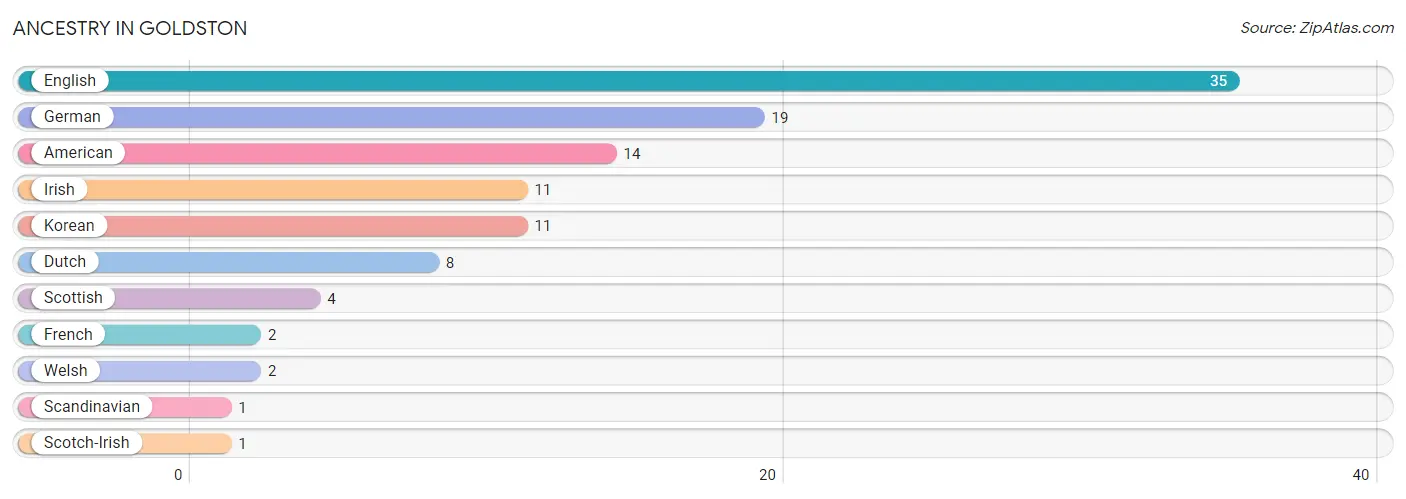
| Ancestry | # Population | % Population |
| American | 14 | 3.7% |
| Dutch | 8 | 2.1% |
| English | 35 | 9.3% |
| French | 2 | 0.5% |
| German | 19 | 5.1% |
| Irish | 11 | 2.9% |
| Korean | 11 | 2.9% |
| Scandinavian | 1 | 0.3% |
| Scotch-Irish | 1 | 0.3% |
| Scottish | 4 | 1.1% |
| Welsh | 2 | 0.5% | View All 11 Rows |
Immigrants in Goldston
The most numerous immigrant groups reported in Goldston came from Asia (1 | 0.3%), Philippines (1 | 0.3%), and South Eastern Asia (1 | 0.3%), together accounting for 0.8% of all Goldston residents.
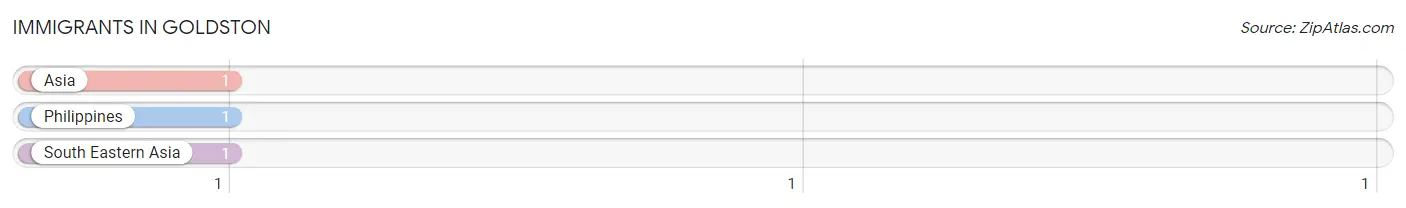
| Immigration Origin | # Population | % Population |
| Asia | 1 | 0.3% |
| Philippines | 1 | 0.3% |
| South Eastern Asia | 1 | 0.3% | View All 3 Rows |
Sex and Age in Goldston
Sex and Age in Goldston
The most populous age groups in Goldston are 30 to 34 Years (103 | 55.1%) for men and 55 to 59 Years (54 | 28.7%) for women.
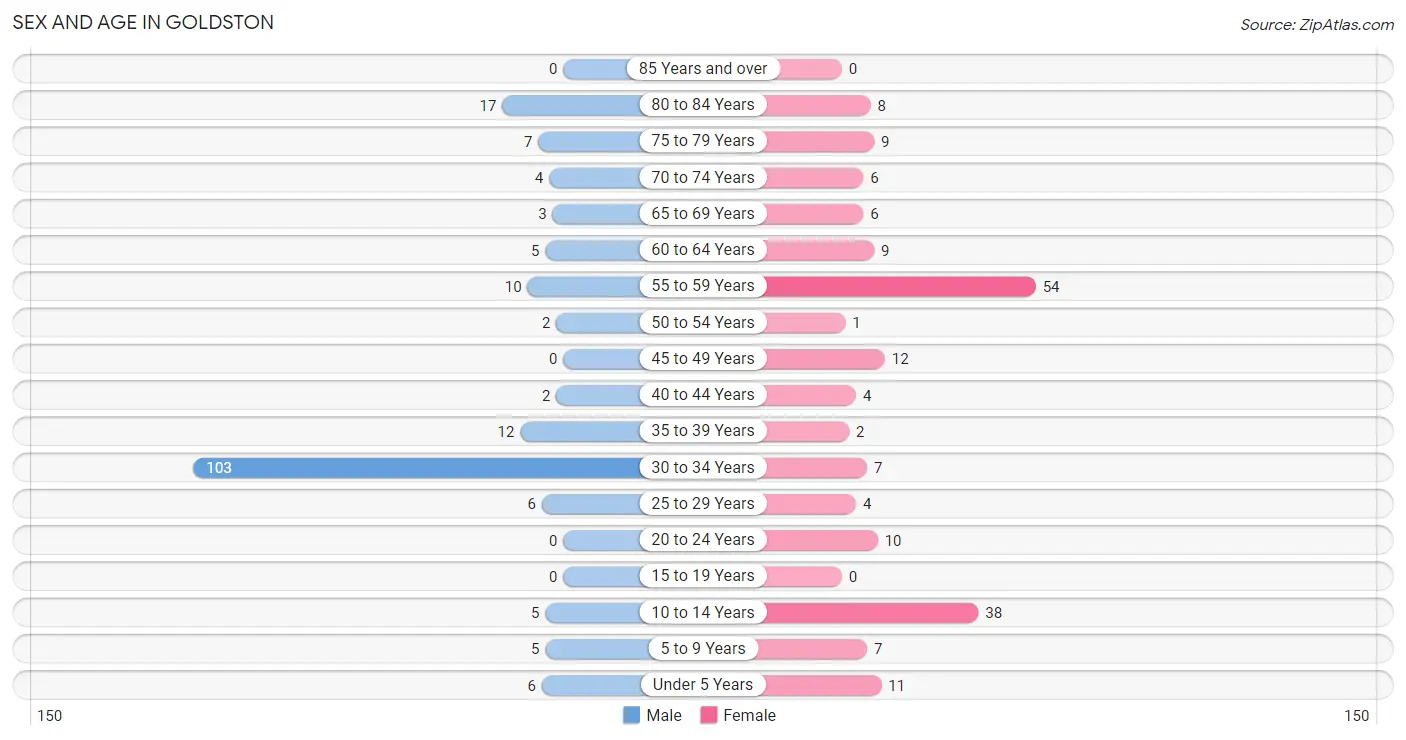
| Age Bracket | Male | Female |
| Under 5 Years | 6 (3.2%) | 11 (5.9%) |
| 5 to 9 Years | 5 (2.7%) | 7 (3.7%) |
| 10 to 14 Years | 5 (2.7%) | 38 (20.2%) |
| 15 to 19 Years | 0 (0.0%) | 0 (0.0%) |
| 20 to 24 Years | 0 (0.0%) | 10 (5.3%) |
| 25 to 29 Years | 6 (3.2%) | 4 (2.1%) |
| 30 to 34 Years | 103 (55.1%) | 7 (3.7%) |
| 35 to 39 Years | 12 (6.4%) | 2 (1.1%) |
| 40 to 44 Years | 2 (1.1%) | 4 (2.1%) |
| 45 to 49 Years | 0 (0.0%) | 12 (6.4%) |
| 50 to 54 Years | 2 (1.1%) | 1 (0.5%) |
| 55 to 59 Years | 10 (5.3%) | 54 (28.7%) |
| 60 to 64 Years | 5 (2.7%) | 9 (4.8%) |
| 65 to 69 Years | 3 (1.6%) | 6 (3.2%) |
| 70 to 74 Years | 4 (2.1%) | 6 (3.2%) |
| 75 to 79 Years | 7 (3.7%) | 9 (4.8%) |
| 80 to 84 Years | 17 (9.1%) | 8 (4.3%) |
| 85 Years and over | 0 (0.0%) | 0 (0.0%) |
| Total | 187 (100.0%) | 188 (100.0%) |
Families and Households in Goldston
Median Family Size in Goldston
The median family size in Goldston is 3.42 persons per family, with single male/father families (2 | 2.0%) accounting for the largest median family size of 4 persons per family. On the other hand, married-couple families (48 | 47.1%) represent the smallest median family size with 3.06 persons per family.
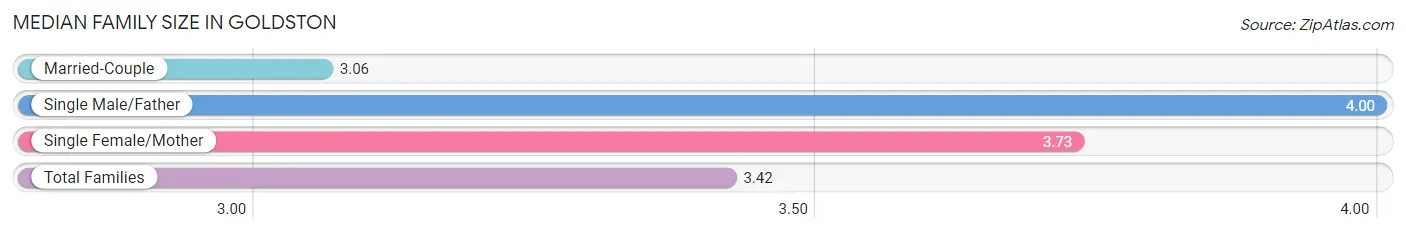
| Family Type | # Families | Family Size |
| Married-Couple | 48 (47.1%) | 3.06 |
| Single Male/Father | 2 (2.0%) | 4.00 |
| Single Female/Mother | 52 (51.0%) | 3.73 |
| Total Families | 102 (100.0%) | 3.42 |
Median Household Size in Goldston
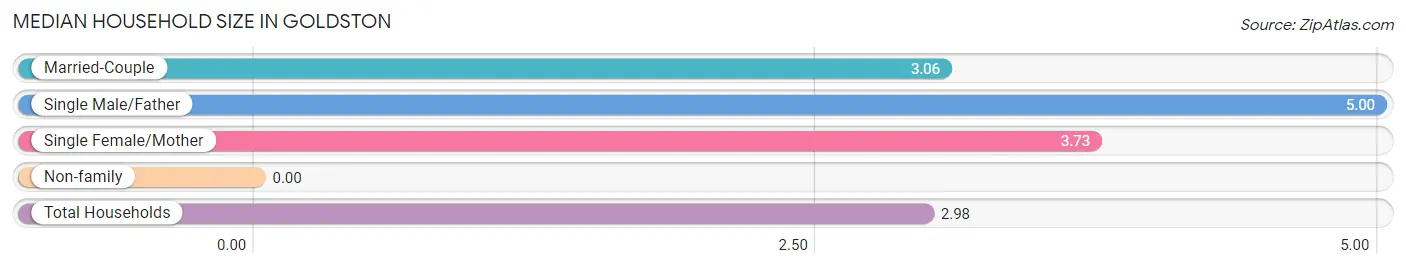
| Household Type | # Households | Household Size |
| Married-Couple | 48 (38.1%) | 3.06 |
| Single Male/Father | 2 (1.6%) | 5.00 |
| Single Female/Mother | 52 (41.3%) | 3.73 |
| Non-family | 24 (19.1%) | - |
| Total Households | 126 (100.0%) | 2.98 |
Household Size by Marriage Status in Goldston
Out of a total of 126 households in Goldston, 102 (80.9%) are family households, while 24 (19.1%) are nonfamily households. The most numerous type of family households are 3-person households, comprising 52, and the most common type of nonfamily households are 1-person households, comprising 24.
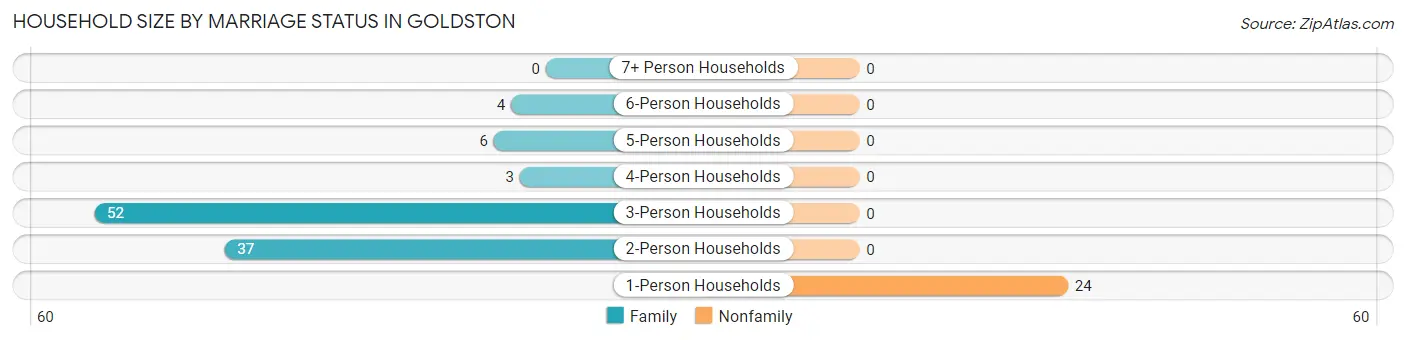
| Household Size | Family Households | Nonfamily Households |
| 1-Person Households | - | 24 (19.1%) |
| 2-Person Households | 37 (29.4%) | 0 (0.0%) |
| 3-Person Households | 52 (41.3%) | 0 (0.0%) |
| 4-Person Households | 3 (2.4%) | 0 (0.0%) |
| 5-Person Households | 6 (4.8%) | 0 (0.0%) |
| 6-Person Households | 4 (3.2%) | 0 (0.0%) |
| 7+ Person Households | 0 (0.0%) | 0 (0.0%) |
| Total | 102 (80.9%) | 24 (19.1%) |
Female Fertility in Goldston
Fertility by Age in Goldston
Average fertility rate in Goldston is 51.0 births per 1,000 women. Women in the age bracket of 20 to 34 years have the highest fertility rate with 95.0 births per 1,000 women. Women in the age bracket of 20 to 34 years acount for 100.0% of all women with births.
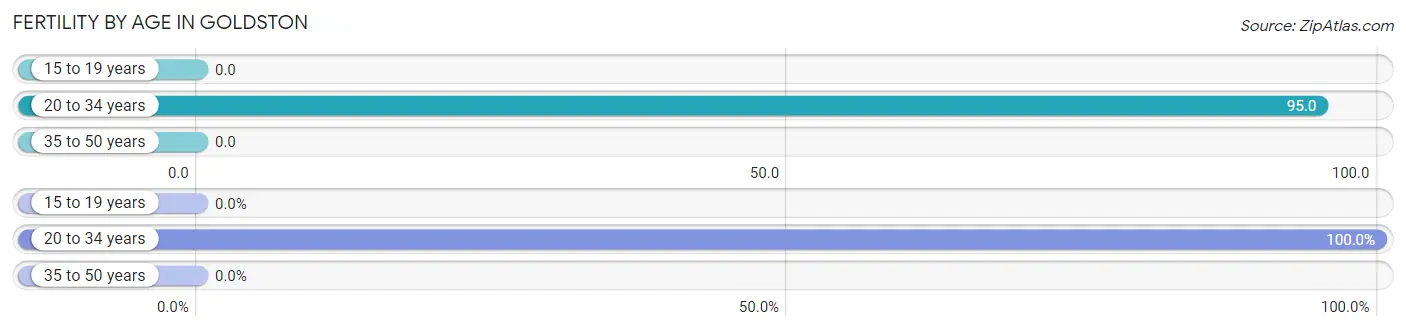
| Age Bracket | Women with Births | Births / 1,000 Women |
| 15 to 19 years | 0 (0.0%) | 0.0 |
| 20 to 34 years | 2 (100.0%) | 95.0 |
| 35 to 50 years | 0 (0.0%) | 0.0 |
| Total | 2 (100.0%) | 51.0 |
Fertility by Age by Marriage Status in Goldston
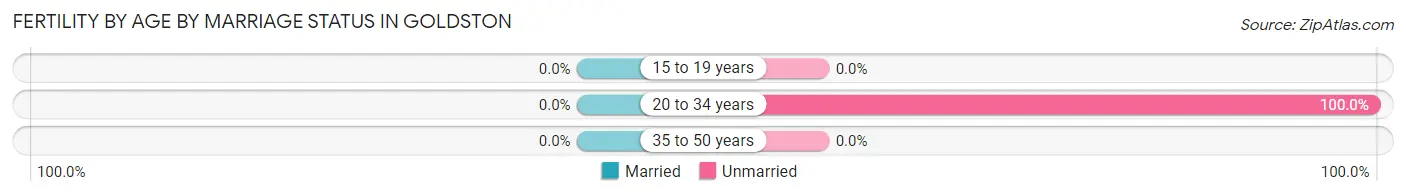
| Age Bracket | Married | Unmarried |
| 15 to 19 years | 0 (0.0%) | 0 (0.0%) |
| 20 to 34 years | 0 (0.0%) | 2 (100.0%) |
| 35 to 50 years | 0 (0.0%) | 0 (0.0%) |
| Total | 0 (0.0%) | 2 (100.0%) |
Fertility by Education in Goldston
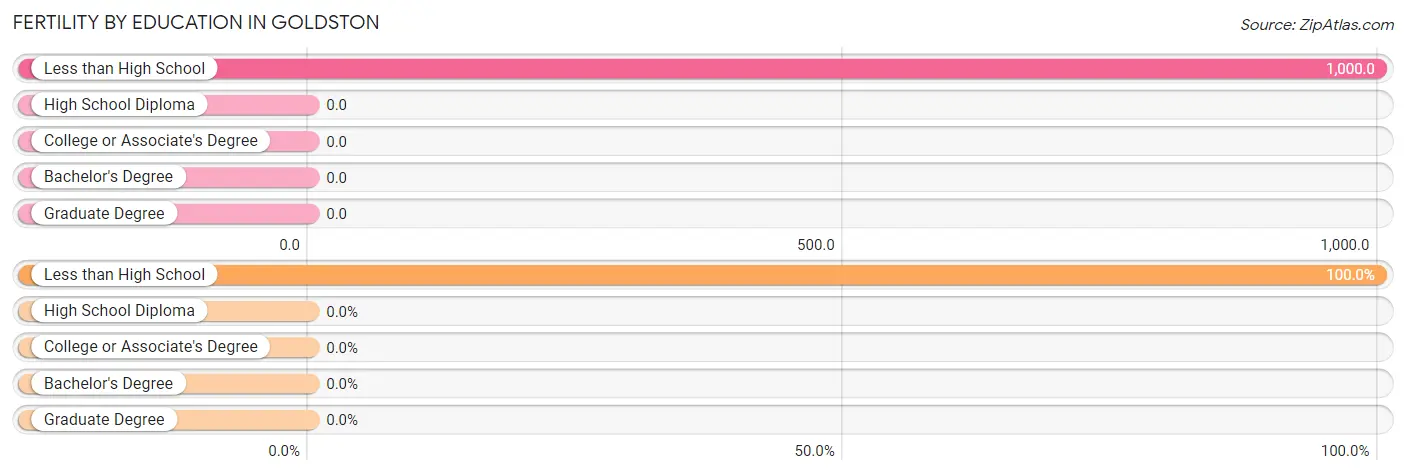
| Educational Attainment | Women with Births | Births / 1,000 Women |
| Less than High School | 2 (100.0%) | 1,000.0 |
| High School Diploma | 0 (0.0%) | 0.0 |
| College or Associate's Degree | 0 (0.0%) | 0.0 |
| Bachelor's Degree | 0 (0.0%) | 0.0 |
| Graduate Degree | 0 (0.0%) | 0.0 |
| Total | 2 (100.0%) | 51.0 |
Fertility by Education by Marriage Status in Goldston
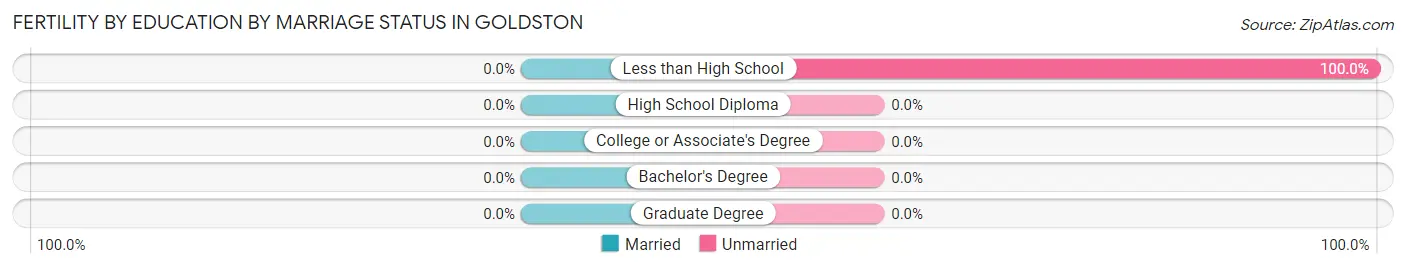
| Educational Attainment | Married | Unmarried |
| Less than High School | 0 (0.0%) | 2 (100.0%) |
| High School Diploma | 0 (0.0%) | 0 (0.0%) |
| College or Associate's Degree | 0 (0.0%) | 0 (0.0%) |
| Bachelor's Degree | 0 (0.0%) | 0 (0.0%) |
| Graduate Degree | 0 (0.0%) | 0 (0.0%) |
| Total | 0 (0.0%) | 2 (100.0%) |
Employment Characteristics in Goldston
Employment by Class of Employer in Goldston
Among the 228 employed individuals in Goldston, private company employees (194 | 85.1%), not-for-profit organizations (10 | 4.4%), and self-employed (not incorporated) (8 | 3.5%) make up the most common classes of employment.
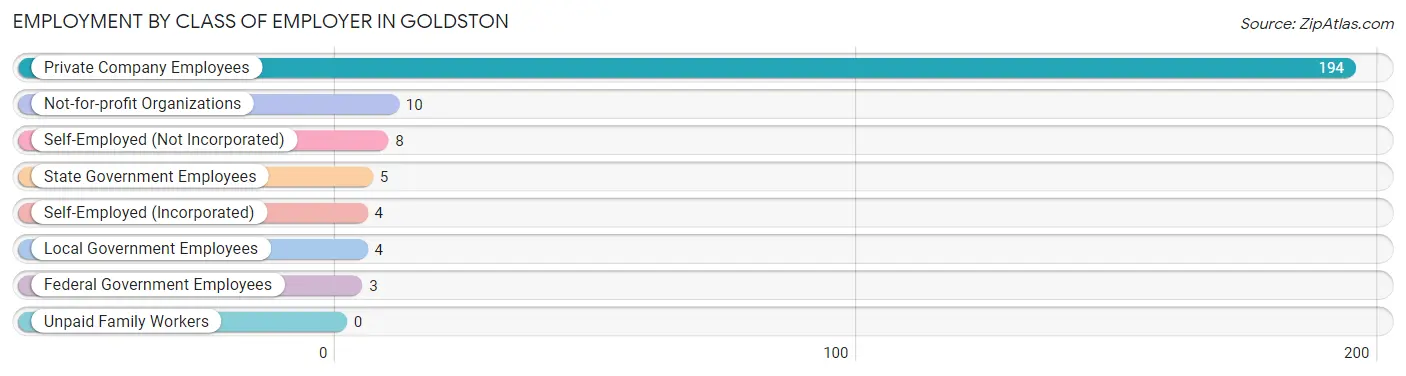
| Employer Class | # Employees | % Employees |
| Private Company Employees | 194 | 85.1% |
| Self-Employed (Incorporated) | 4 | 1.8% |
| Self-Employed (Not Incorporated) | 8 | 3.5% |
| Not-for-profit Organizations | 10 | 4.4% |
| Local Government Employees | 4 | 1.8% |
| State Government Employees | 5 | 2.2% |
| Federal Government Employees | 3 | 1.3% |
| Unpaid Family Workers | 0 | 0.0% |
| Total | 228 | 100.0% |
Employment Status by Age in Goldston
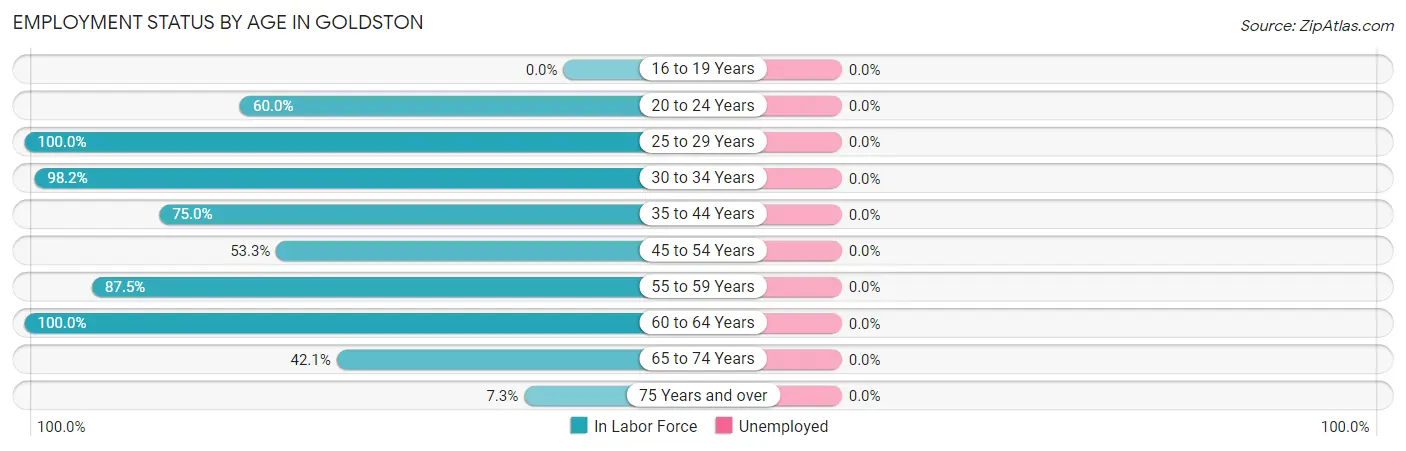
| Age Bracket | In Labor Force | Unemployed |
| 16 to 19 Years | 0 (0.0%) | 0 (0.0%) |
| 20 to 24 Years | 6 (60.0%) | 0 (0.0%) |
| 25 to 29 Years | 10 (100.0%) | 0 (0.0%) |
| 30 to 34 Years | 108 (98.2%) | 0 (0.0%) |
| 35 to 44 Years | 15 (75.0%) | 0 (0.0%) |
| 45 to 54 Years | 8 (53.3%) | 0 (0.0%) |
| 55 to 59 Years | 56 (87.5%) | 0 (0.0%) |
| 60 to 64 Years | 14 (100.0%) | 0 (0.0%) |
| 65 to 74 Years | 8 (42.1%) | 0 (0.0%) |
| 75 Years and over | 3 (7.3%) | 0 (0.0%) |
| Total | 228 (75.2%) | 0 (0.0%) |
Employment Status by Educational Attainment in Goldston
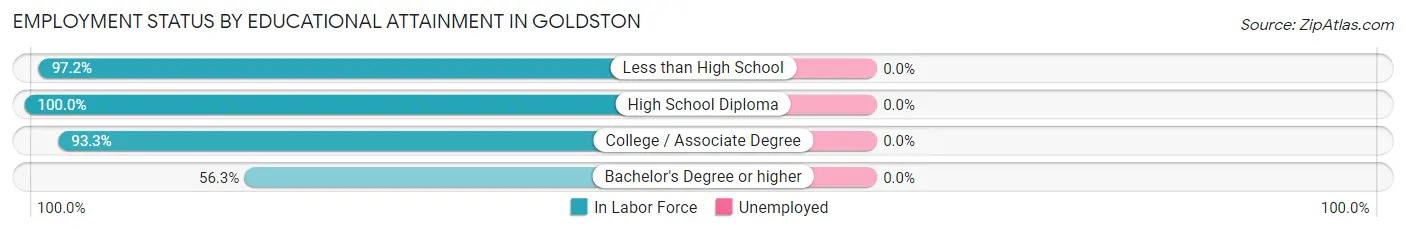
| Educational Attainment | In Labor Force | Unemployed |
| Less than High School | 105 (97.2%) | 0 (0.0%) |
| High School Diploma | 18 (100.0%) | 0 (0.0%) |
| College / Associate Degree | 70 (93.3%) | 0 (0.0%) |
| Bachelor's Degree or higher | 18 (56.3%) | 0 (0.0%) |
| Total | 211 (90.6%) | 0 (0.0%) |
Employment Occupations by Sex in Goldston
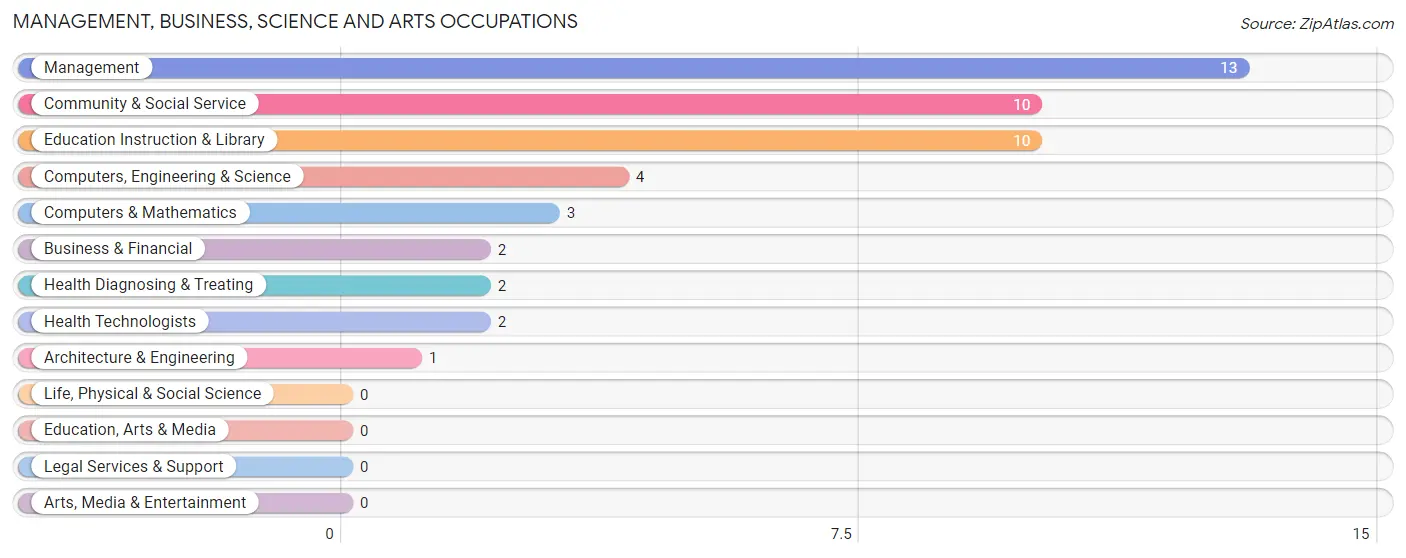
Management, Business, Science and Arts Occupations
The most common Management, Business, Science and Arts occupations in Goldston are Management (13 | 5.8%), Community & Social Service (10 | 4.4%), Education Instruction & Library (10 | 4.4%), Computers, Engineering & Science (4 | 1.8%), and Computers & Mathematics (3 | 1.3%).
Management, Business, Science and Arts Occupations by Sex
Within the Management, Business, Science and Arts occupations in Goldston, the most male-oriented occupations are Business & Financial (100.0%), Architecture & Engineering (100.0%), and Management (92.3%), while the most female-oriented occupations are Computers & Mathematics (100.0%), Community & Social Service (100.0%), and Education Instruction & Library (100.0%).
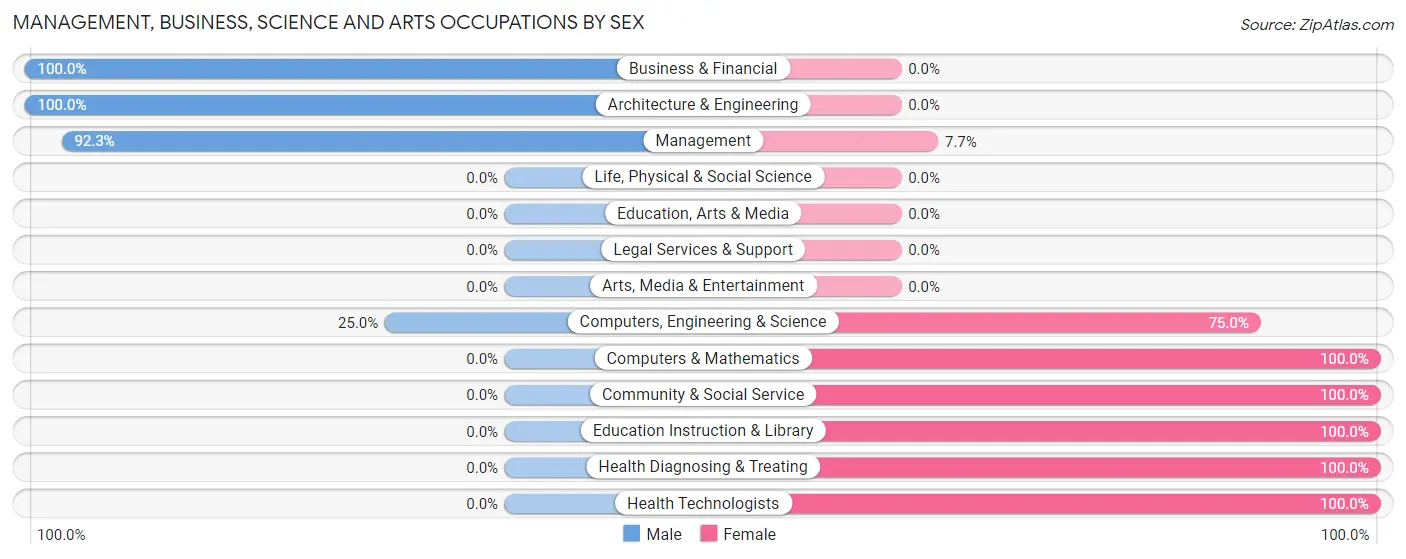
| Occupation | Male | Female |
| Management | 12 (92.3%) | 1 (7.7%) |
| Business & Financial | 2 (100.0%) | 0 (0.0%) |
| Computers, Engineering & Science | 1 (25.0%) | 3 (75.0%) |
| Computers & Mathematics | 0 (0.0%) | 3 (100.0%) |
| Architecture & Engineering | 1 (100.0%) | 0 (0.0%) |
| Life, Physical & Social Science | 0 (0.0%) | 0 (0.0%) |
| Community & Social Service | 0 (0.0%) | 10 (100.0%) |
| Education, Arts & Media | 0 (0.0%) | 0 (0.0%) |
| Legal Services & Support | 0 (0.0%) | 0 (0.0%) |
| Education Instruction & Library | 0 (0.0%) | 10 (100.0%) |
| Arts, Media & Entertainment | 0 (0.0%) | 0 (0.0%) |
| Health Diagnosing & Treating | 0 (0.0%) | 2 (100.0%) |
| Health Technologists | 0 (0.0%) | 2 (100.0%) |
| Total (Category) | 15 (48.4%) | 16 (51.6%) |
| Total (Overall) | 137 (60.6%) | 89 (39.4%) |
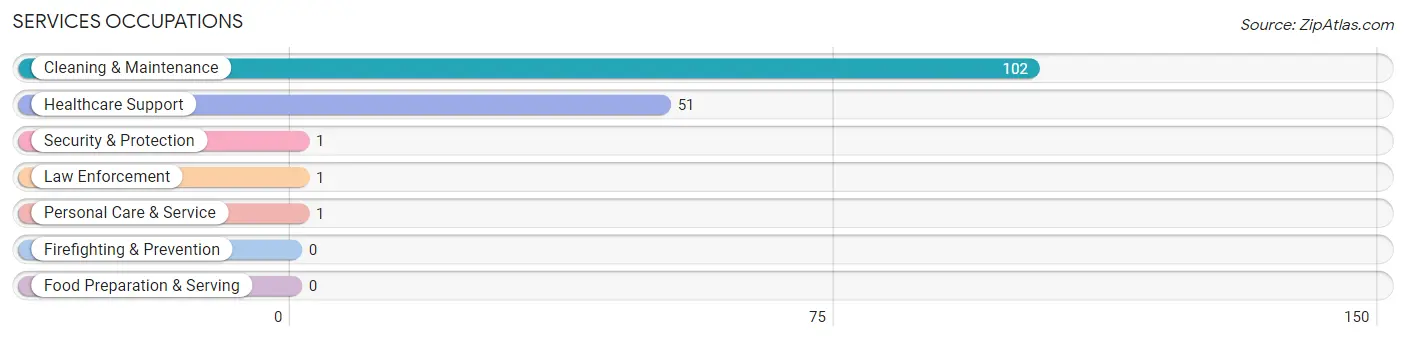
Services Occupations
The most common Services occupations in Goldston are Cleaning & Maintenance (102 | 45.1%), Healthcare Support (51 | 22.6%), Security & Protection (1 | 0.4%), Law Enforcement (1 | 0.4%), and Personal Care & Service (1 | 0.4%).
Services Occupations by Sex
Within the Services occupations in Goldston, the most male-oriented occupations are Security & Protection (100.0%), Law Enforcement (100.0%), and Cleaning & Maintenance (100.0%), while the most female-oriented occupations are Healthcare Support (100.0%), and Personal Care & Service (100.0%).
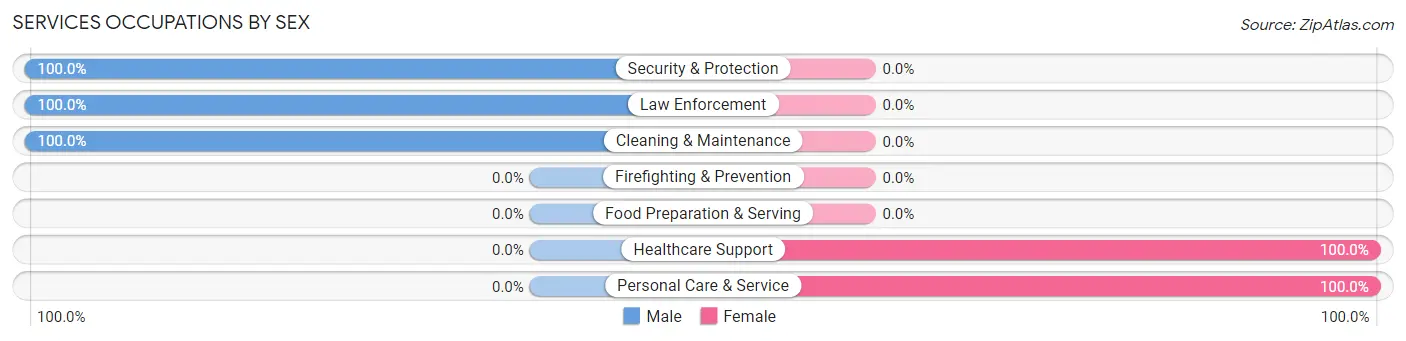
| Occupation | Male | Female |
| Healthcare Support | 0 (0.0%) | 51 (100.0%) |
| Security & Protection | 1 (100.0%) | 0 (0.0%) |
| Firefighting & Prevention | 0 (0.0%) | 0 (0.0%) |
| Law Enforcement | 1 (100.0%) | 0 (0.0%) |
| Food Preparation & Serving | 0 (0.0%) | 0 (0.0%) |
| Cleaning & Maintenance | 102 (100.0%) | 0 (0.0%) |
| Personal Care & Service | 0 (0.0%) | 1 (100.0%) |
| Total (Category) | 103 (66.4%) | 52 (33.6%) |
| Total (Overall) | 137 (60.6%) | 89 (39.4%) |
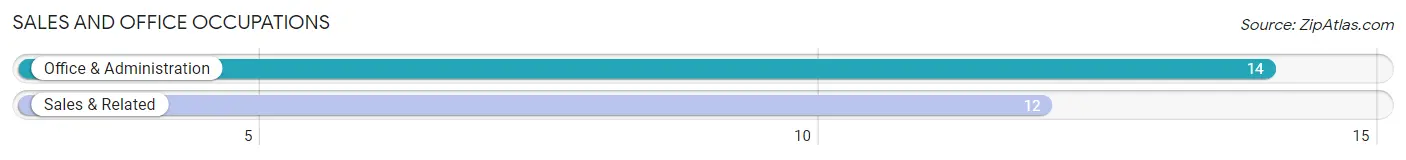
Sales and Office Occupations
The most common Sales and Office occupations in Goldston are Office & Administration (14 | 6.2%), and Sales & Related (12 | 5.3%).
Sales and Office Occupations by Sex
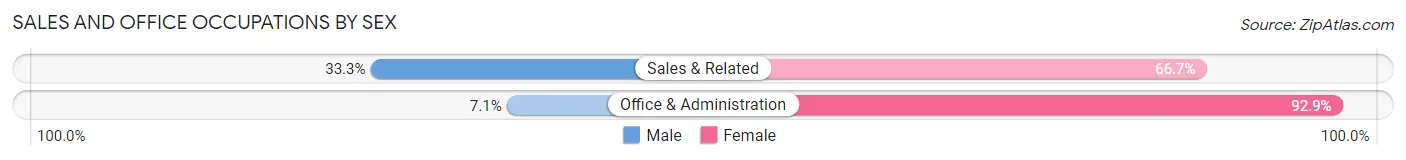
| Occupation | Male | Female |
| Sales & Related | 4 (33.3%) | 8 (66.7%) |
| Office & Administration | 1 (7.1%) | 13 (92.9%) |
| Total (Category) | 5 (19.2%) | 21 (80.8%) |
| Total (Overall) | 137 (60.6%) | 89 (39.4%) |
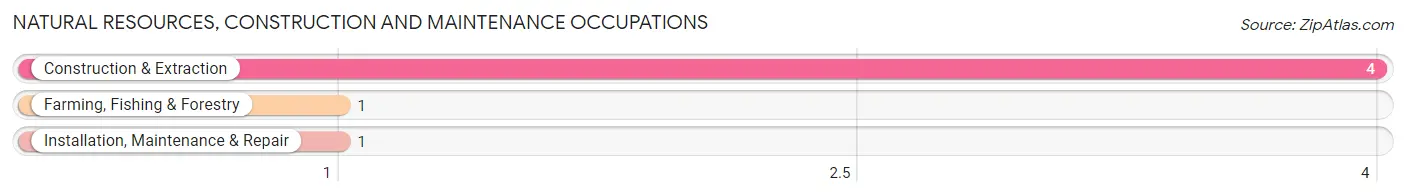
Natural Resources, Construction and Maintenance Occupations
The most common Natural Resources, Construction and Maintenance occupations in Goldston are Construction & Extraction (4 | 1.8%), Farming, Fishing & Forestry (1 | 0.4%), and Installation, Maintenance & Repair (1 | 0.4%).
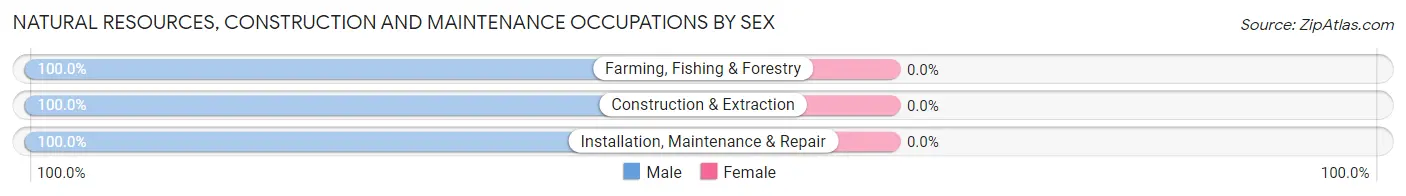
Natural Resources, Construction and Maintenance Occupations by Sex
| Occupation | Male | Female |
| Farming, Fishing & Forestry | 1 (100.0%) | 0 (0.0%) |
| Construction & Extraction | 4 (100.0%) | 0 (0.0%) |
| Installation, Maintenance & Repair | 1 (100.0%) | 0 (0.0%) |
| Total (Category) | 6 (100.0%) | 0 (0.0%) |
| Total (Overall) | 137 (60.6%) | 89 (39.4%) |
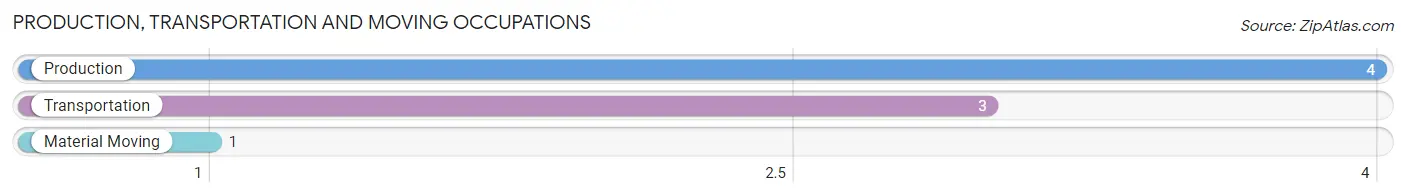
Production, Transportation and Moving Occupations
The most common Production, Transportation and Moving occupations in Goldston are Production (4 | 1.8%), Transportation (3 | 1.3%), and Material Moving (1 | 0.4%).
Production, Transportation and Moving Occupations by Sex
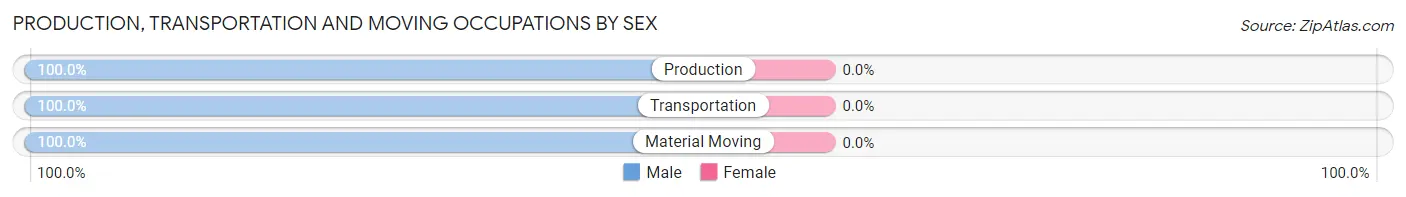
| Occupation | Male | Female |
| Production | 4 (100.0%) | 0 (0.0%) |
| Transportation | 3 (100.0%) | 0 (0.0%) |
| Material Moving | 1 (100.0%) | 0 (0.0%) |
| Total (Category) | 8 (100.0%) | 0 (0.0%) |
| Total (Overall) | 137 (60.6%) | 89 (39.4%) |
Employment Industries by Sex in Goldston
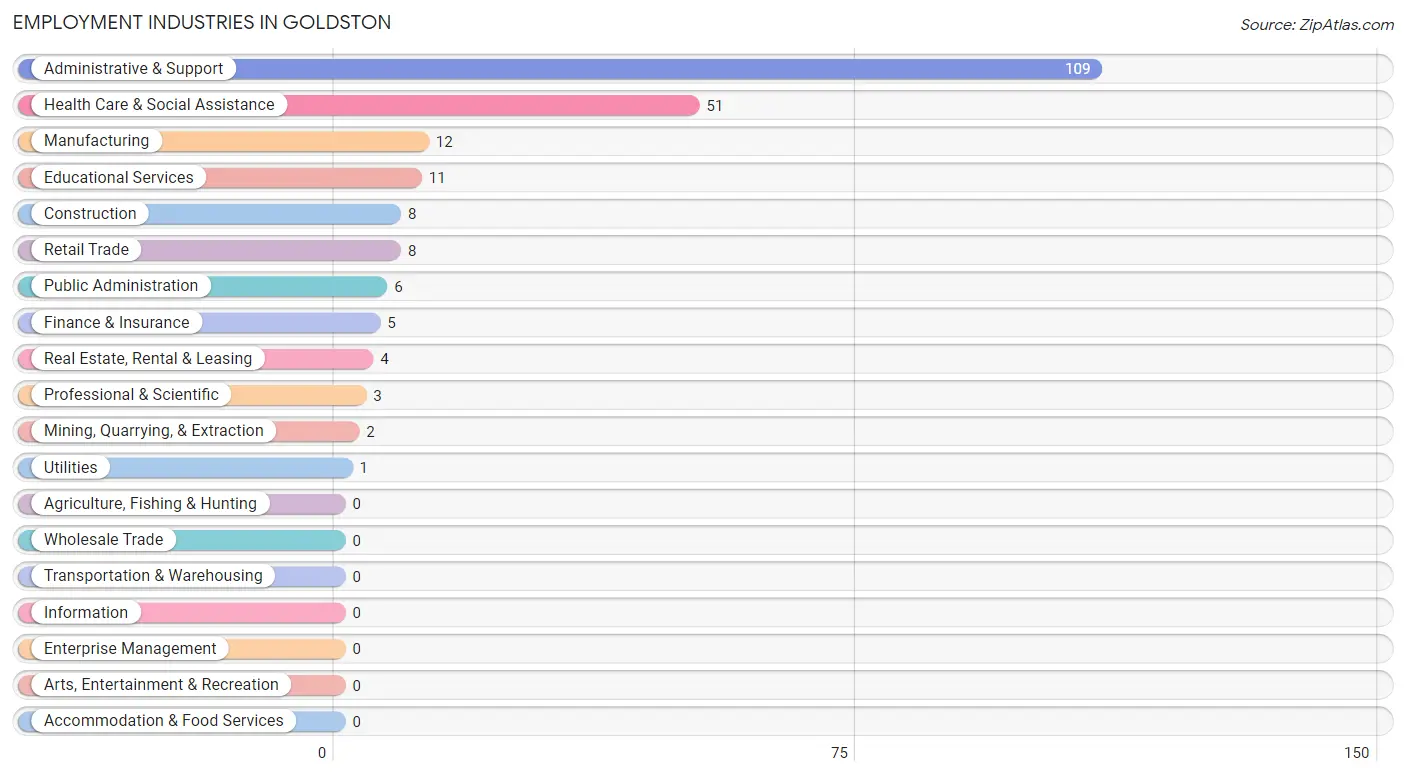
Employment Industries in Goldston
The major employment industries in Goldston include Administrative & Support (109 | 48.2%), Health Care & Social Assistance (51 | 22.6%), Manufacturing (12 | 5.3%), Educational Services (11 | 4.9%), and Construction (8 | 3.5%).
Employment Industries by Sex in Goldston
The Goldston industries that see more men than women are Construction (100.0%), Utilities (100.0%), and Real Estate, Rental & Leasing (100.0%), whereas the industries that tend to have a higher number of women are Mining, Quarrying, & Extraction (100.0%), Retail Trade (100.0%), and Educational Services (100.0%).
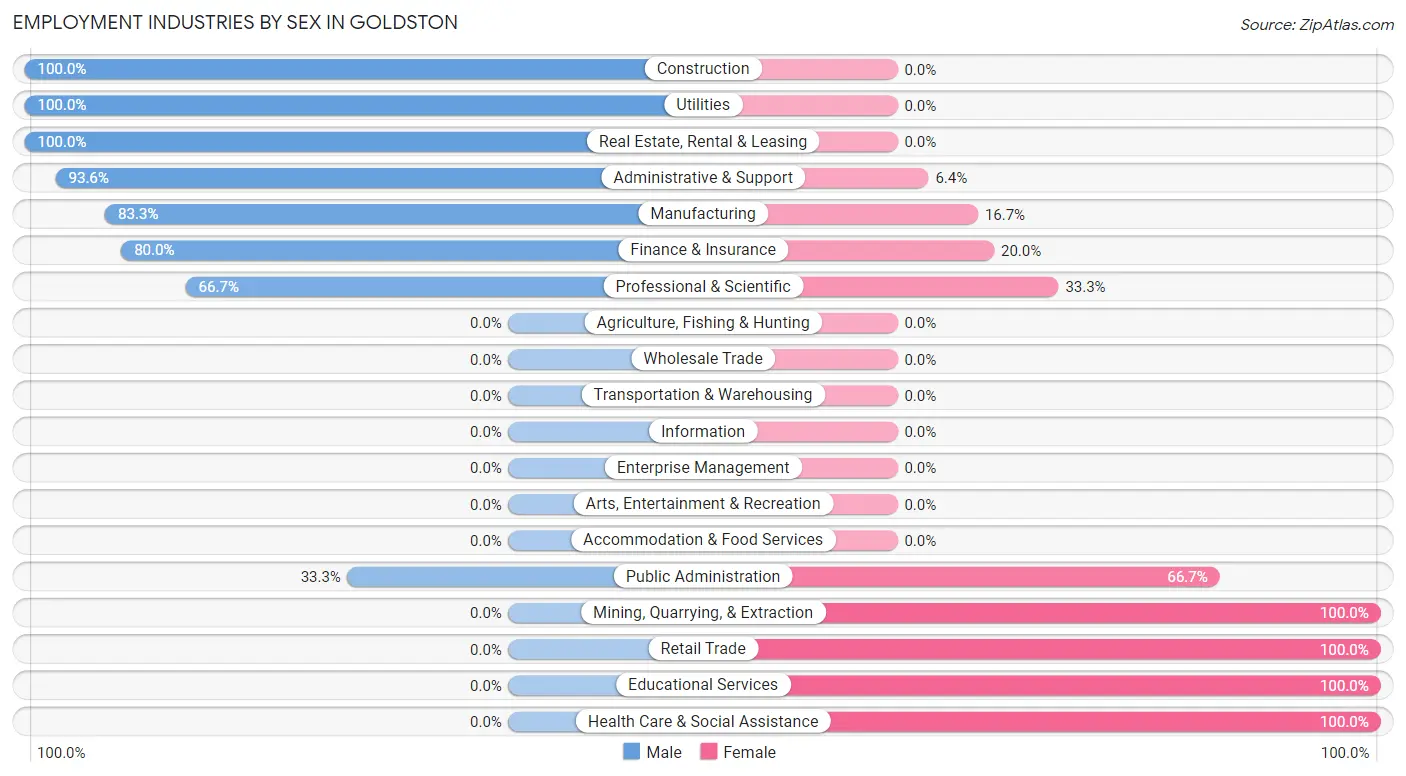
| Industry | Male | Female |
| Agriculture, Fishing & Hunting | 0 (0.0%) | 0 (0.0%) |
| Mining, Quarrying, & Extraction | 0 (0.0%) | 2 (100.0%) |
| Construction | 8 (100.0%) | 0 (0.0%) |
| Manufacturing | 10 (83.3%) | 2 (16.7%) |
| Wholesale Trade | 0 (0.0%) | 0 (0.0%) |
| Retail Trade | 0 (0.0%) | 8 (100.0%) |
| Transportation & Warehousing | 0 (0.0%) | 0 (0.0%) |
| Utilities | 1 (100.0%) | 0 (0.0%) |
| Information | 0 (0.0%) | 0 (0.0%) |
| Finance & Insurance | 4 (80.0%) | 1 (20.0%) |
| Real Estate, Rental & Leasing | 4 (100.0%) | 0 (0.0%) |
| Professional & Scientific | 2 (66.7%) | 1 (33.3%) |
| Enterprise Management | 0 (0.0%) | 0 (0.0%) |
| Administrative & Support | 102 (93.6%) | 7 (6.4%) |
| Educational Services | 0 (0.0%) | 11 (100.0%) |
| Health Care & Social Assistance | 0 (0.0%) | 51 (100.0%) |
| Arts, Entertainment & Recreation | 0 (0.0%) | 0 (0.0%) |
| Accommodation & Food Services | 0 (0.0%) | 0 (0.0%) |
| Public Administration | 2 (33.3%) | 4 (66.7%) |
| Total | 137 (60.6%) | 89 (39.4%) |
Education in Goldston
School Enrollment in Goldston
The most common levels of schooling among the 54 students in Goldston are middle school (39 | 72.2%), elementary school (7 | 13.0%), and kindergarten (4 | 7.4%).
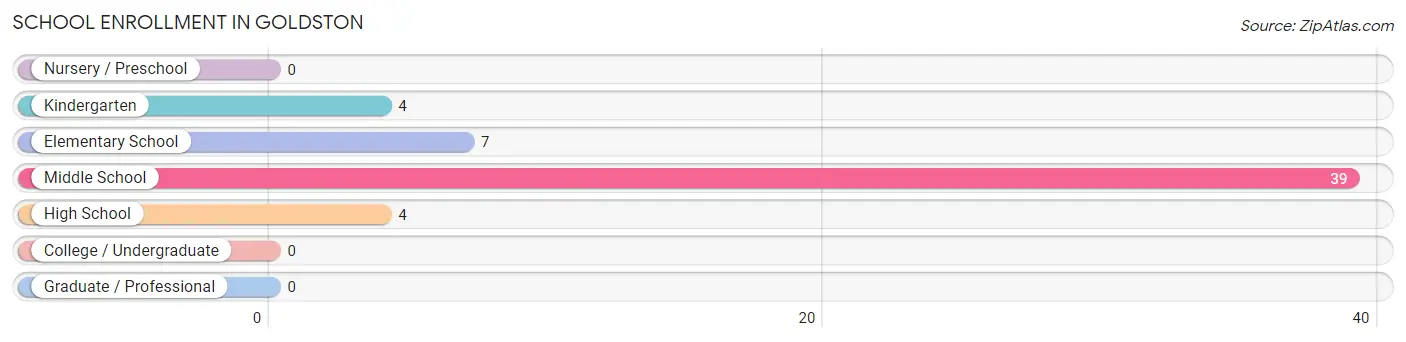
| School Level | # Students | % Students |
| Nursery / Preschool | 0 | 0.0% |
| Kindergarten | 4 | 7.4% |
| Elementary School | 7 | 13.0% |
| Middle School | 39 | 72.2% |
| High School | 4 | 7.4% |
| College / Undergraduate | 0 | 0.0% |
| Graduate / Professional | 0 | 0.0% |
| Total | 54 | 100.0% |
School Enrollment by Age by Funding Source in Goldston
Out of a total of 54 students who are enrolled in schools in Goldston, 31 (57.4%) attend a private institution, while the remaining 23 (42.6%) are enrolled in public schools. The age group of 10 to 14 year olds has the highest likelihood of being enrolled in private schools, with 31 (72.1% in the age bracket) enrolled. Conversely, the age group of 5 to 9 year old has the lowest likelihood of being enrolled in a private school, with 11 (100.0% in the age bracket) attending a public institution.
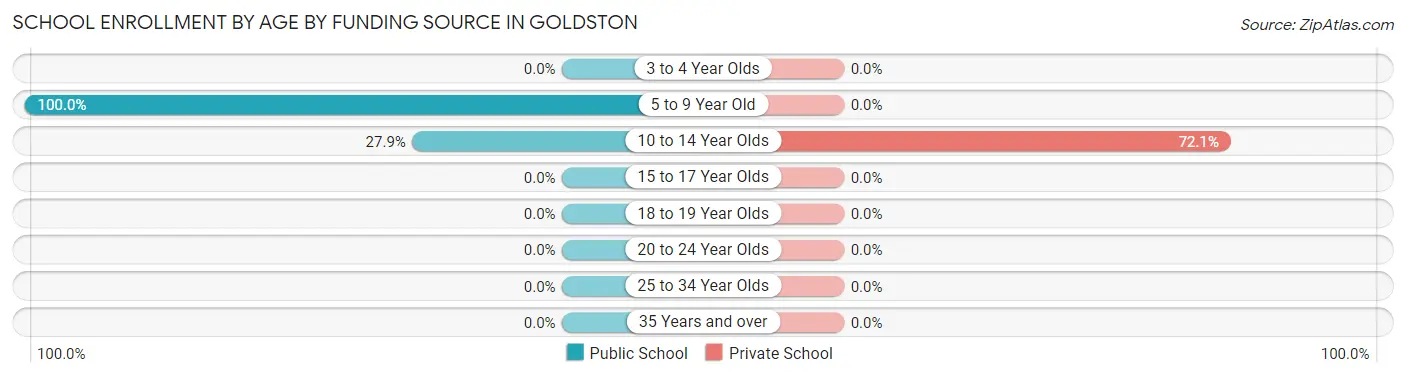
| Age Bracket | Public School | Private School |
| 3 to 4 Year Olds | 0 (0.0%) | 0 (0.0%) |
| 5 to 9 Year Old | 11 (100.0%) | 0 (0.0%) |
| 10 to 14 Year Olds | 12 (27.9%) | 31 (72.1%) |
| 15 to 17 Year Olds | 0 (0.0%) | 0 (0.0%) |
| 18 to 19 Year Olds | 0 (0.0%) | 0 (0.0%) |
| 20 to 24 Year Olds | 0 (0.0%) | 0 (0.0%) |
| 25 to 34 Year Olds | 0 (0.0%) | 0 (0.0%) |
| 35 Years and over | 0 (0.0%) | 0 (0.0%) |
| Total | 23 (42.6%) | 31 (57.4%) |
Educational Attainment by Field of Study in Goldston
Business (13 | 29.5%), arts & humanities (10 | 22.7%), education (7 | 15.9%), bio, nature & agricultural (5 | 11.4%), and communications (5 | 11.4%) are the most common fields of study among 44 individuals in Goldston who have obtained a bachelor's degree or higher.
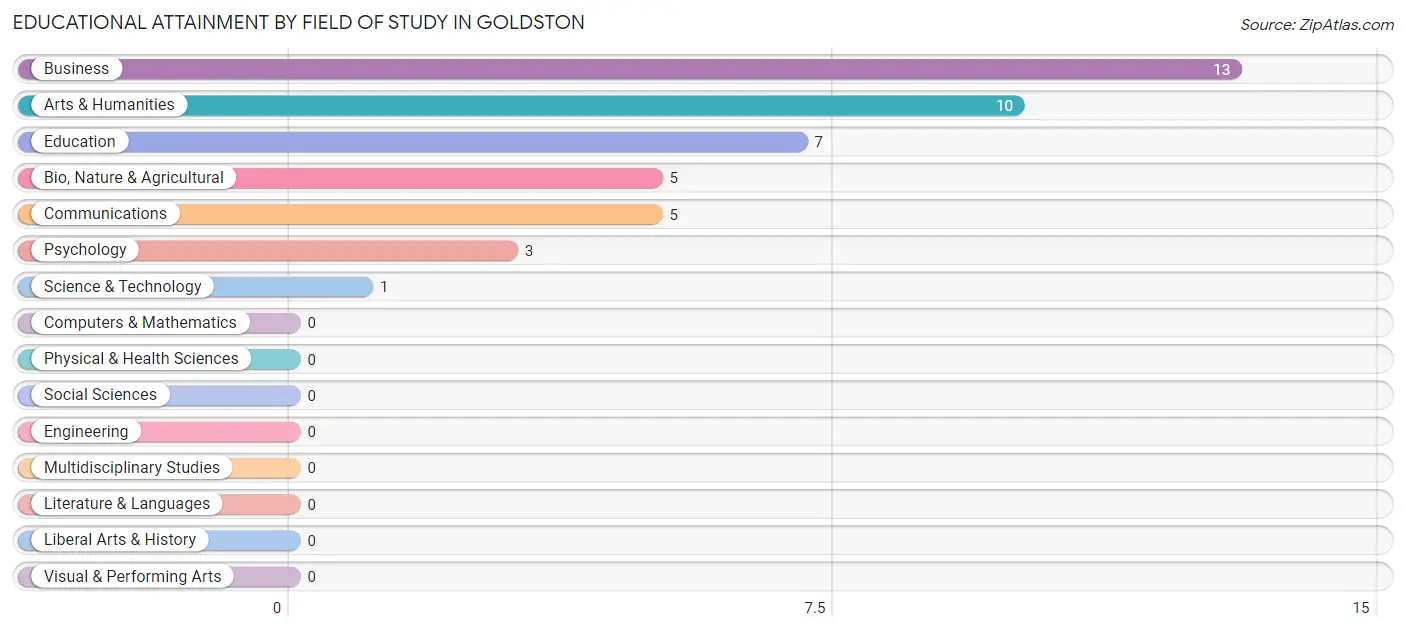
| Field of Study | # Graduates | % Graduates |
| Computers & Mathematics | 0 | 0.0% |
| Bio, Nature & Agricultural | 5 | 11.4% |
| Physical & Health Sciences | 0 | 0.0% |
| Psychology | 3 | 6.8% |
| Social Sciences | 0 | 0.0% |
| Engineering | 0 | 0.0% |
| Multidisciplinary Studies | 0 | 0.0% |
| Science & Technology | 1 | 2.3% |
| Business | 13 | 29.5% |
| Education | 7 | 15.9% |
| Literature & Languages | 0 | 0.0% |
| Liberal Arts & History | 0 | 0.0% |
| Visual & Performing Arts | 0 | 0.0% |
| Communications | 5 | 11.4% |
| Arts & Humanities | 10 | 22.7% |
| Total | 44 | 100.0% |
Transportation & Commute in Goldston
Vehicle Availability by Sex in Goldston
The most prevalent vehicle ownership categories in Goldston are males with 1 vehicle (105, accounting for 75.5%) and females with 1 vehicle (56, making up 118.0%).
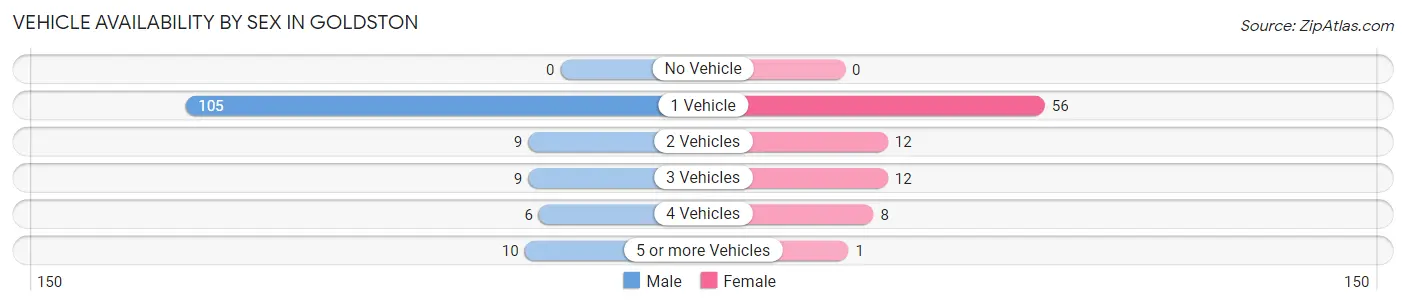
| Vehicles Available | Male | Female |
| No Vehicle | 0 (0.0%) | 0 (0.0%) |
| 1 Vehicle | 105 (75.5%) | 56 (62.9%) |
| 2 Vehicles | 9 (6.5%) | 12 (13.5%) |
| 3 Vehicles | 9 (6.5%) | 12 (13.5%) |
| 4 Vehicles | 6 (4.3%) | 8 (9.0%) |
| 5 or more Vehicles | 10 (7.2%) | 1 (1.1%) |
| Total | 139 (100.0%) | 89 (100.0%) |
Commute Time in Goldston
The most frequently occuring commute durations in Goldston are 30 to 34 minutes (103 commuters, 46.4%), 45 to 59 minutes (46 commuters, 20.7%), and 15 to 19 minutes (21 commuters, 9.5%).
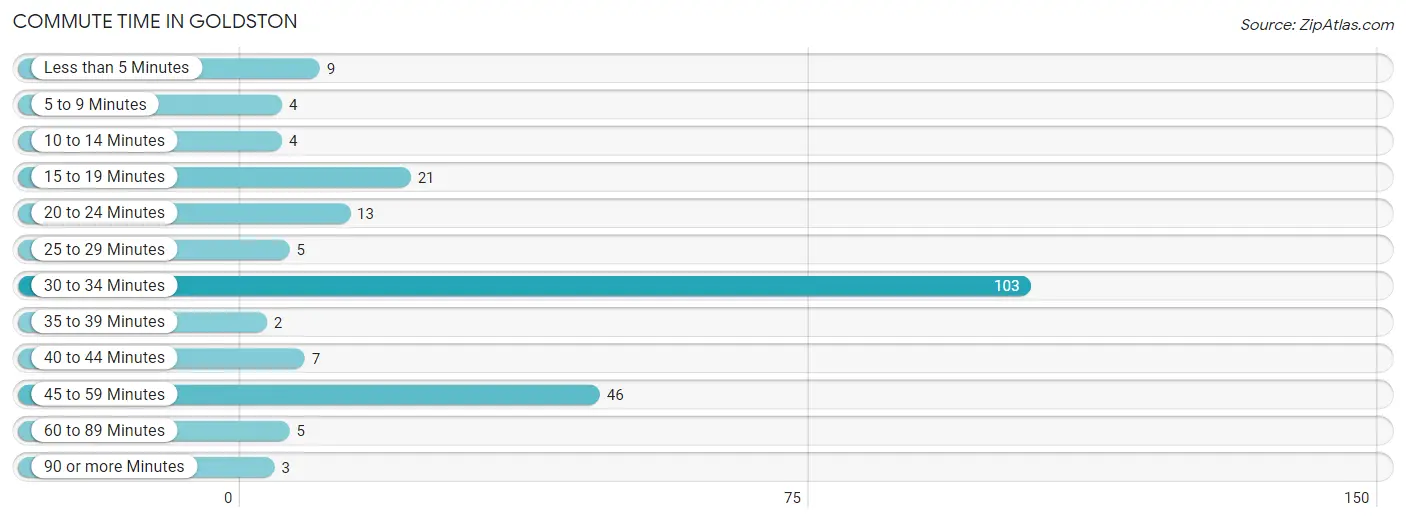
| Commute Time | # Commuters | % Commuters |
| Less than 5 Minutes | 9 | 4.1% |
| 5 to 9 Minutes | 4 | 1.8% |
| 10 to 14 Minutes | 4 | 1.8% |
| 15 to 19 Minutes | 21 | 9.5% |
| 20 to 24 Minutes | 13 | 5.9% |
| 25 to 29 Minutes | 5 | 2.2% |
| 30 to 34 Minutes | 103 | 46.4% |
| 35 to 39 Minutes | 2 | 0.9% |
| 40 to 44 Minutes | 7 | 3.2% |
| 45 to 59 Minutes | 46 | 20.7% |
| 60 to 89 Minutes | 5 | 2.2% |
| 90 or more Minutes | 3 | 1.3% |
Commute Time by Sex in Goldston
The most common commute times in Goldston are 30 to 34 minutes (103 commuters, 74.6%) for males and 45 to 59 minutes (46 commuters, 54.8%) for females.
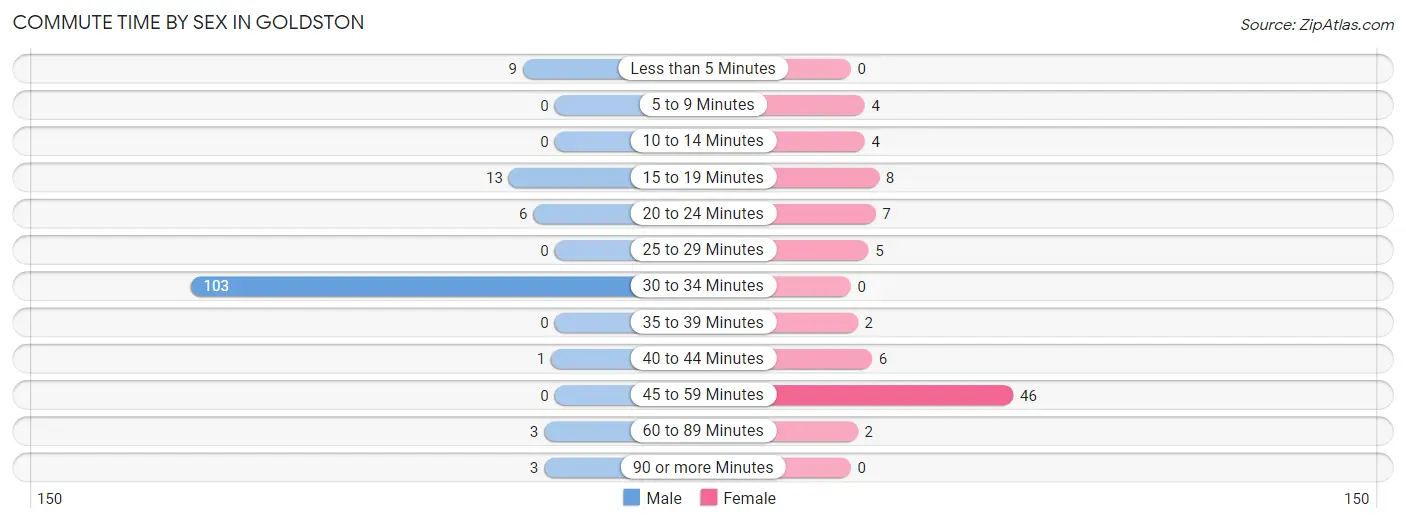
| Commute Time | Male | Female |
| Less than 5 Minutes | 9 (6.5%) | 0 (0.0%) |
| 5 to 9 Minutes | 0 (0.0%) | 4 (4.8%) |
| 10 to 14 Minutes | 0 (0.0%) | 4 (4.8%) |
| 15 to 19 Minutes | 13 (9.4%) | 8 (9.5%) |
| 20 to 24 Minutes | 6 (4.3%) | 7 (8.3%) |
| 25 to 29 Minutes | 0 (0.0%) | 5 (5.9%) |
| 30 to 34 Minutes | 103 (74.6%) | 0 (0.0%) |
| 35 to 39 Minutes | 0 (0.0%) | 2 (2.4%) |
| 40 to 44 Minutes | 1 (0.7%) | 6 (7.1%) |
| 45 to 59 Minutes | 0 (0.0%) | 46 (54.8%) |
| 60 to 89 Minutes | 3 (2.2%) | 2 (2.4%) |
| 90 or more Minutes | 3 (2.2%) | 0 (0.0%) |
Time of Departure to Work by Sex in Goldston
The most frequent times of departure to work in Goldston are 6:00 AM to 6:29 AM (102, 73.9%) for males and 4:00 PM to 11:59 PM (45, 53.6%) for females.
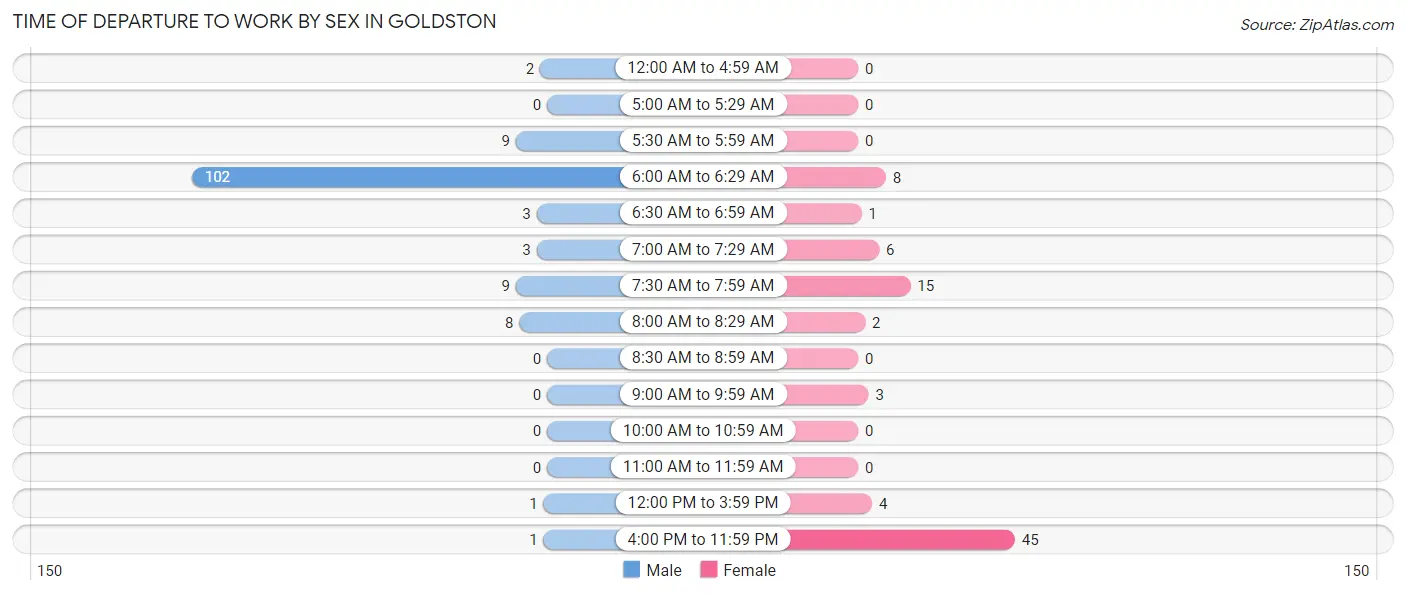
| Time of Departure | Male | Female |
| 12:00 AM to 4:59 AM | 2 (1.5%) | 0 (0.0%) |
| 5:00 AM to 5:29 AM | 0 (0.0%) | 0 (0.0%) |
| 5:30 AM to 5:59 AM | 9 (6.5%) | 0 (0.0%) |
| 6:00 AM to 6:29 AM | 102 (73.9%) | 8 (9.5%) |
| 6:30 AM to 6:59 AM | 3 (2.2%) | 1 (1.2%) |
| 7:00 AM to 7:29 AM | 3 (2.2%) | 6 (7.1%) |
| 7:30 AM to 7:59 AM | 9 (6.5%) | 15 (17.9%) |
| 8:00 AM to 8:29 AM | 8 (5.8%) | 2 (2.4%) |
| 8:30 AM to 8:59 AM | 0 (0.0%) | 0 (0.0%) |
| 9:00 AM to 9:59 AM | 0 (0.0%) | 3 (3.6%) |
| 10:00 AM to 10:59 AM | 0 (0.0%) | 0 (0.0%) |
| 11:00 AM to 11:59 AM | 0 (0.0%) | 0 (0.0%) |
| 12:00 PM to 3:59 PM | 1 (0.7%) | 4 (4.8%) |
| 4:00 PM to 11:59 PM | 1 (0.7%) | 45 (53.6%) |
| Total | 138 (100.0%) | 84 (100.0%) |
Housing Occupancy in Goldston
Occupancy by Ownership in Goldston
Of the total 126 dwellings in Goldston, owner-occupied units account for 106 (84.1%), while renter-occupied units make up 20 (15.9%).
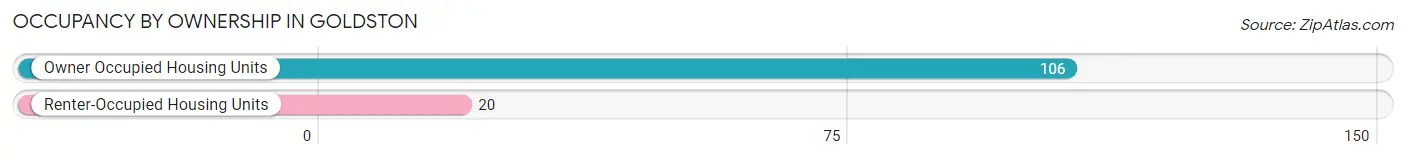
| Occupancy | # Housing Units | % Housing Units |
| Owner Occupied Housing Units | 106 | 84.1% |
| Renter-Occupied Housing Units | 20 | 15.9% |
| Total Occupied Housing Units | 126 | 100.0% |
Occupancy by Household Size in Goldston
| Household Size | # Housing Units | % Housing Units |
| 1-Person Household | 24 | 19.1% |
| 2-Person Household | 37 | 29.4% |
| 3-Person Household | 52 | 41.3% |
| 4+ Person Household | 13 | 10.3% |
| Total Housing Units | 126 | 100.0% |
Occupancy by Ownership by Household Size in Goldston
| Household Size | Owner-occupied | Renter-occupied |
| 1-Person Household | 15 (62.5%) | 9 (37.5%) |
| 2-Person Household | 36 (97.3%) | 1 (2.7%) |
| 3-Person Household | 47 (90.4%) | 5 (9.6%) |
| 4+ Person Household | 8 (61.5%) | 5 (38.5%) |
| Total Housing Units | 106 (84.1%) | 20 (15.9%) |
Occupancy by Educational Attainment in Goldston
| Household Size | Owner-occupied | Renter-occupied |
| Less than High School | 0 (0.0%) | 0 (0.0%) |
| High School Diploma | 17 (54.8%) | 14 (45.2%) |
| College/Associate Degree | 79 (100.0%) | 0 (0.0%) |
| Bachelor's Degree or higher | 10 (62.5%) | 6 (37.5%) |
Occupancy by Age of Householder in Goldston
| Age Bracket | # Households | % Households |
| Under 35 Years | 8 | 6.4% |
| 35 to 44 Years | 13 | 10.3% |
| 45 to 54 Years | 7 | 5.6% |
| 55 to 64 Years | 65 | 51.6% |
| 65 to 74 Years | 9 | 7.1% |
| 75 to 84 Years | 24 | 19.1% |
| 85 Years and Over | 0 | 0.0% |
| Total | 126 | 100.0% |
Housing Finances in Goldston
Median Income by Occupancy in Goldston
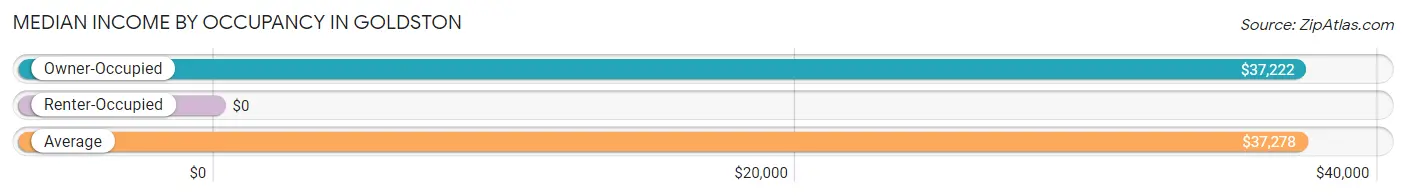
| Occupancy Type | # Households | Median Income |
| Owner-Occupied | 106 (84.1%) | $37,222 |
| Renter-Occupied | 20 (15.9%) | $0 |
| Average | 126 (100.0%) | $37,278 |
Occupancy by Householder Income Bracket in Goldston
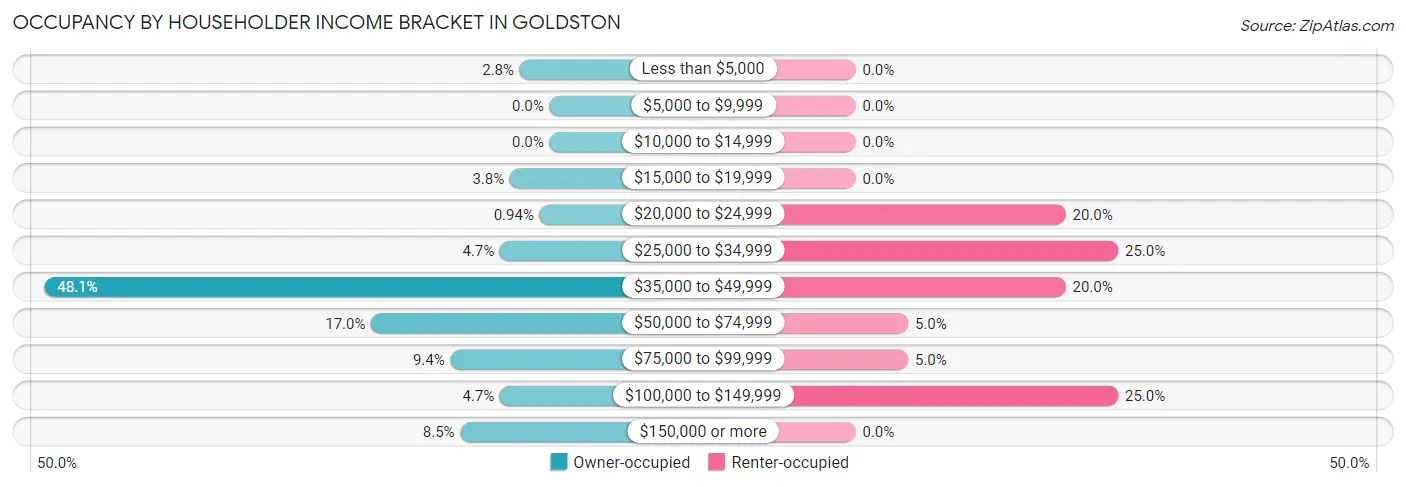
| Income Bracket | Owner-occupied | Renter-occupied |
| Less than $5,000 | 3 (2.8%) | 0 (0.0%) |
| $5,000 to $9,999 | 0 (0.0%) | 0 (0.0%) |
| $10,000 to $14,999 | 0 (0.0%) | 0 (0.0%) |
| $15,000 to $19,999 | 4 (3.8%) | 0 (0.0%) |
| $20,000 to $24,999 | 1 (0.9%) | 4 (20.0%) |
| $25,000 to $34,999 | 5 (4.7%) | 5 (25.0%) |
| $35,000 to $49,999 | 51 (48.1%) | 4 (20.0%) |
| $50,000 to $74,999 | 18 (17.0%) | 1 (5.0%) |
| $75,000 to $99,999 | 10 (9.4%) | 1 (5.0%) |
| $100,000 to $149,999 | 5 (4.7%) | 5 (25.0%) |
| $150,000 or more | 9 (8.5%) | 0 (0.0%) |
| Total | 106 (100.0%) | 20 (100.0%) |
Monthly Housing Cost Tiers in Goldston
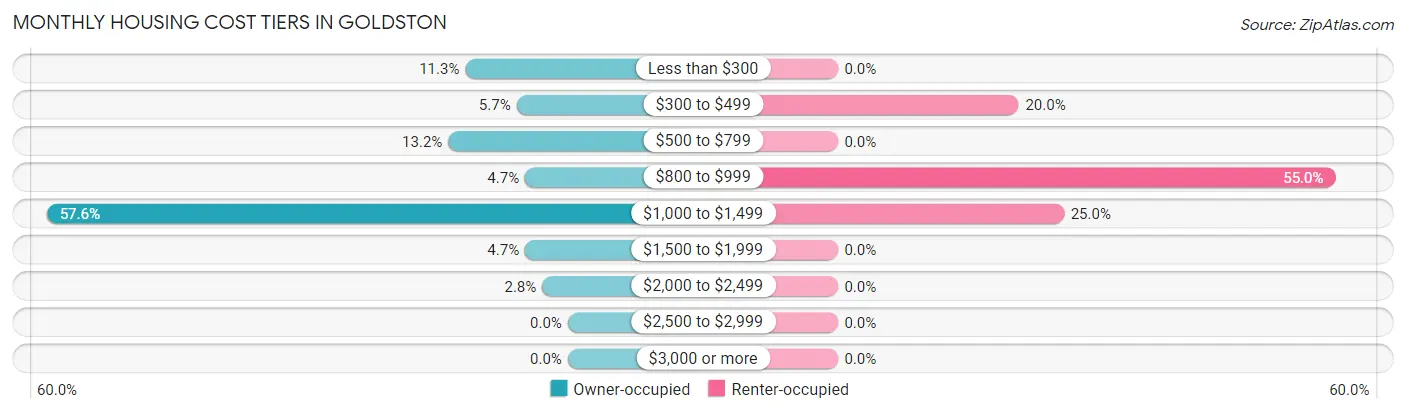
| Monthly Cost | Owner-occupied | Renter-occupied |
| Less than $300 | 12 (11.3%) | 0 (0.0%) |
| $300 to $499 | 6 (5.7%) | 4 (20.0%) |
| $500 to $799 | 14 (13.2%) | 0 (0.0%) |
| $800 to $999 | 5 (4.7%) | 11 (55.0%) |
| $1,000 to $1,499 | 61 (57.6%) | 5 (25.0%) |
| $1,500 to $1,999 | 5 (4.7%) | 0 (0.0%) |
| $2,000 to $2,499 | 3 (2.8%) | 0 (0.0%) |
| $2,500 to $2,999 | 0 (0.0%) | 0 (0.0%) |
| $3,000 or more | 0 (0.0%) | 0 (0.0%) |
| Total | 106 (100.0%) | 20 (100.0%) |
Physical Housing Characteristics in Goldston
Housing Structures in Goldston
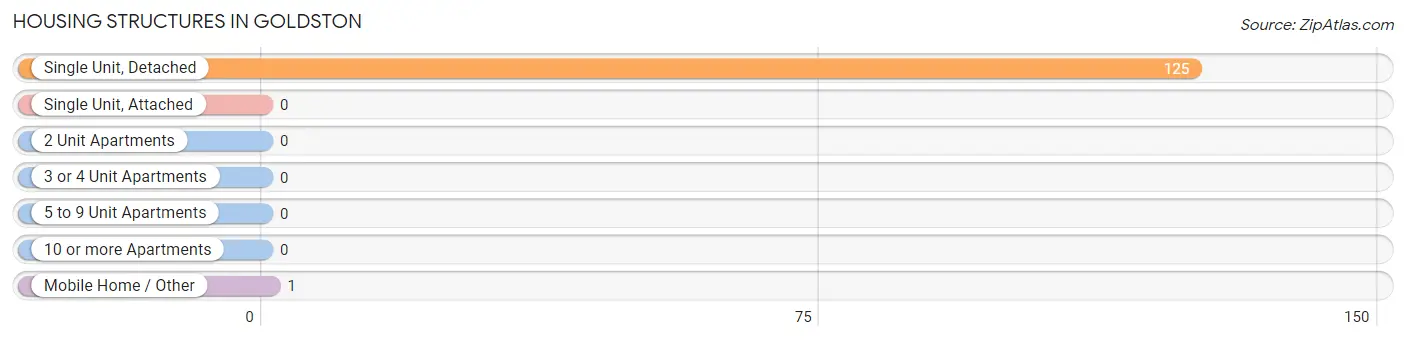
| Structure Type | # Housing Units | % Housing Units |
| Single Unit, Detached | 125 | 99.2% |
| Single Unit, Attached | 0 | 0.0% |
| 2 Unit Apartments | 0 | 0.0% |
| 3 or 4 Unit Apartments | 0 | 0.0% |
| 5 to 9 Unit Apartments | 0 | 0.0% |
| 10 or more Apartments | 0 | 0.0% |
| Mobile Home / Other | 1 | 0.8% |
| Total | 126 | 100.0% |
Housing Structures by Occupancy in Goldston
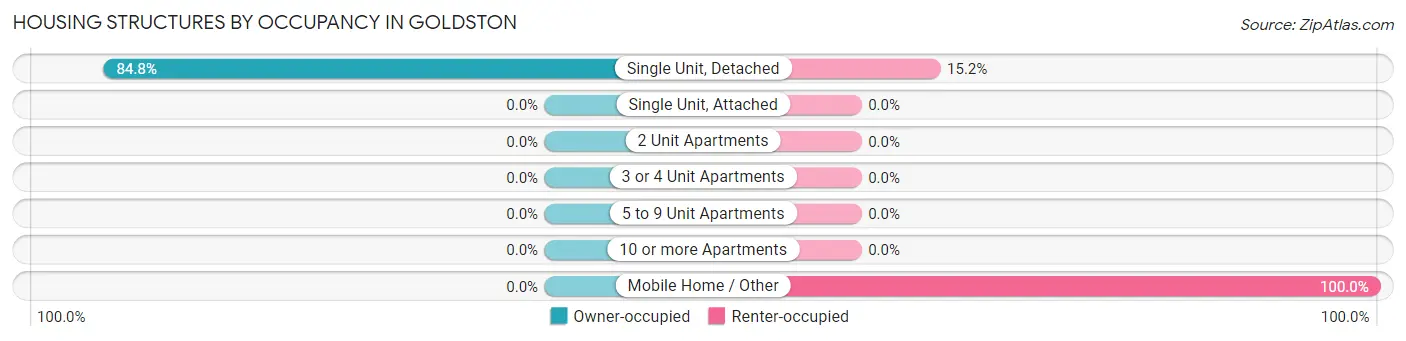
| Structure Type | Owner-occupied | Renter-occupied |
| Single Unit, Detached | 106 (84.8%) | 19 (15.2%) |
| Single Unit, Attached | 0 (0.0%) | 0 (0.0%) |
| 2 Unit Apartments | 0 (0.0%) | 0 (0.0%) |
| 3 or 4 Unit Apartments | 0 (0.0%) | 0 (0.0%) |
| 5 to 9 Unit Apartments | 0 (0.0%) | 0 (0.0%) |
| 10 or more Apartments | 0 (0.0%) | 0 (0.0%) |
| Mobile Home / Other | 0 (0.0%) | 1 (100.0%) |
| Total | 106 (84.1%) | 20 (15.9%) |
Housing Structures by Number of Rooms in Goldston
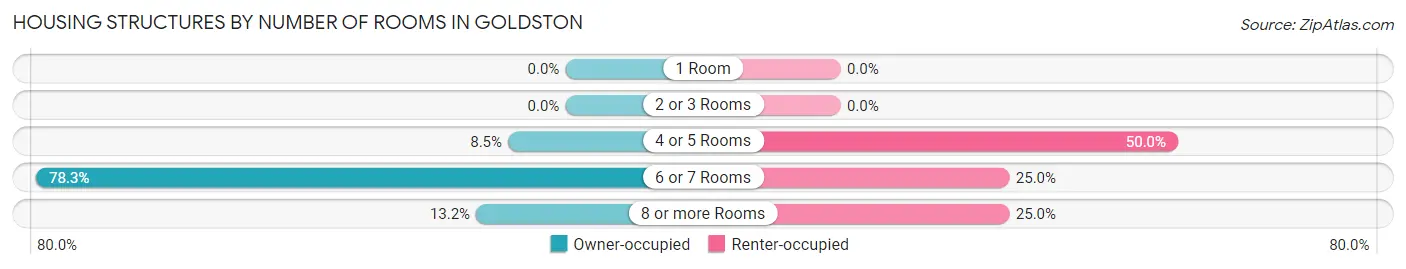
| Number of Rooms | Owner-occupied | Renter-occupied |
| 1 Room | 0 (0.0%) | 0 (0.0%) |
| 2 or 3 Rooms | 0 (0.0%) | 0 (0.0%) |
| 4 or 5 Rooms | 9 (8.5%) | 10 (50.0%) |
| 6 or 7 Rooms | 83 (78.3%) | 5 (25.0%) |
| 8 or more Rooms | 14 (13.2%) | 5 (25.0%) |
| Total | 106 (100.0%) | 20 (100.0%) |
Housing Structure by Heating Type in Goldston
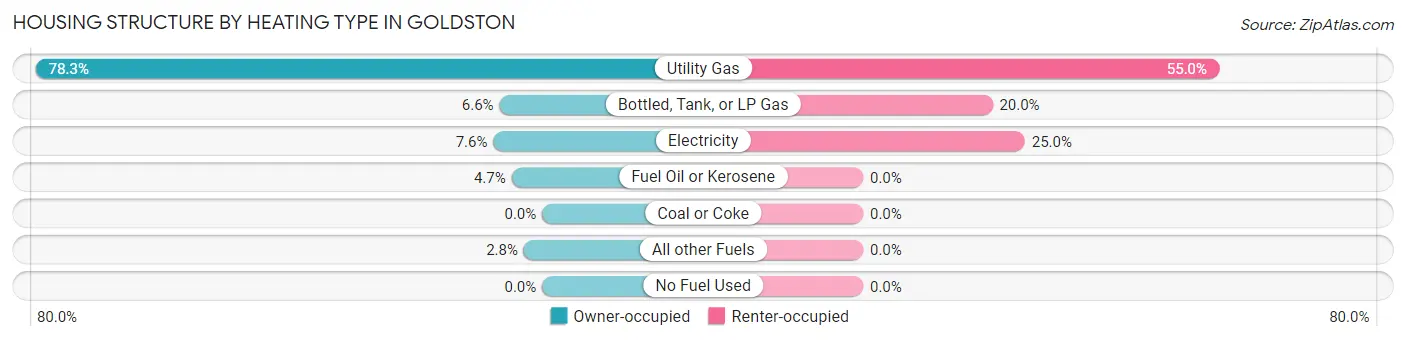
| Heating Type | Owner-occupied | Renter-occupied |
| Utility Gas | 83 (78.3%) | 11 (55.0%) |
| Bottled, Tank, or LP Gas | 7 (6.6%) | 4 (20.0%) |
| Electricity | 8 (7.5%) | 5 (25.0%) |
| Fuel Oil or Kerosene | 5 (4.7%) | 0 (0.0%) |
| Coal or Coke | 0 (0.0%) | 0 (0.0%) |
| All other Fuels | 3 (2.8%) | 0 (0.0%) |
| No Fuel Used | 0 (0.0%) | 0 (0.0%) |
| Total | 106 (100.0%) | 20 (100.0%) |
Household Vehicle Usage in Goldston
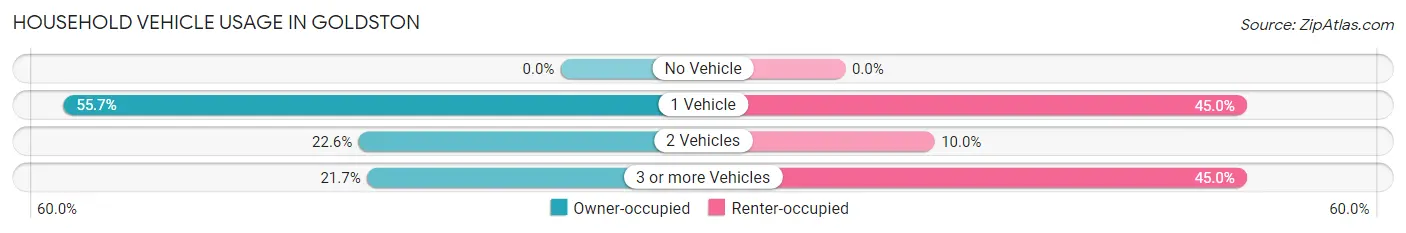
| Vehicles per Household | Owner-occupied | Renter-occupied |
| No Vehicle | 0 (0.0%) | 0 (0.0%) |
| 1 Vehicle | 59 (55.7%) | 9 (45.0%) |
| 2 Vehicles | 24 (22.6%) | 2 (10.0%) |
| 3 or more Vehicles | 23 (21.7%) | 9 (45.0%) |
| Total | 106 (100.0%) | 20 (100.0%) |
Real Estate & Mortgages in Goldston
Real Estate and Mortgage Overview in Goldston
| Characteristic | Without Mortgage | With Mortgage |
| Housing Units | 34 | 72 |
| Median Property Value | $145,800 | $166,000 |
| Median Household Income | $67,500 | $6 |
| Monthly Housing Costs | $500 | $0 |
| Real Estate Taxes | $1,094 | $0 |
Property Value by Mortgage Status in Goldston
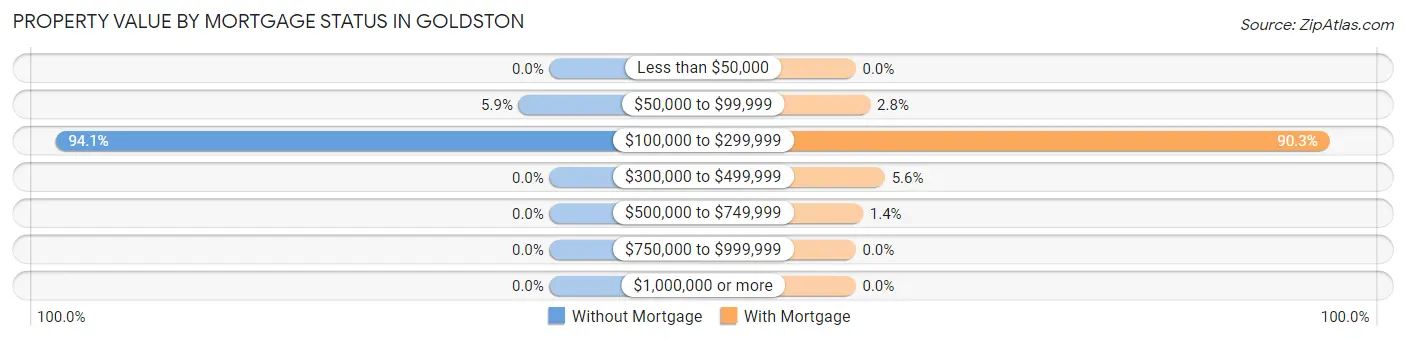
| Property Value | Without Mortgage | With Mortgage |
| Less than $50,000 | 0 (0.0%) | 0 (0.0%) |
| $50,000 to $99,999 | 2 (5.9%) | 2 (2.8%) |
| $100,000 to $299,999 | 32 (94.1%) | 65 (90.3%) |
| $300,000 to $499,999 | 0 (0.0%) | 4 (5.6%) |
| $500,000 to $749,999 | 0 (0.0%) | 1 (1.4%) |
| $750,000 to $999,999 | 0 (0.0%) | 0 (0.0%) |
| $1,000,000 or more | 0 (0.0%) | 0 (0.0%) |
| Total | 34 (100.0%) | 72 (100.0%) |
Household Income by Mortgage Status in Goldston
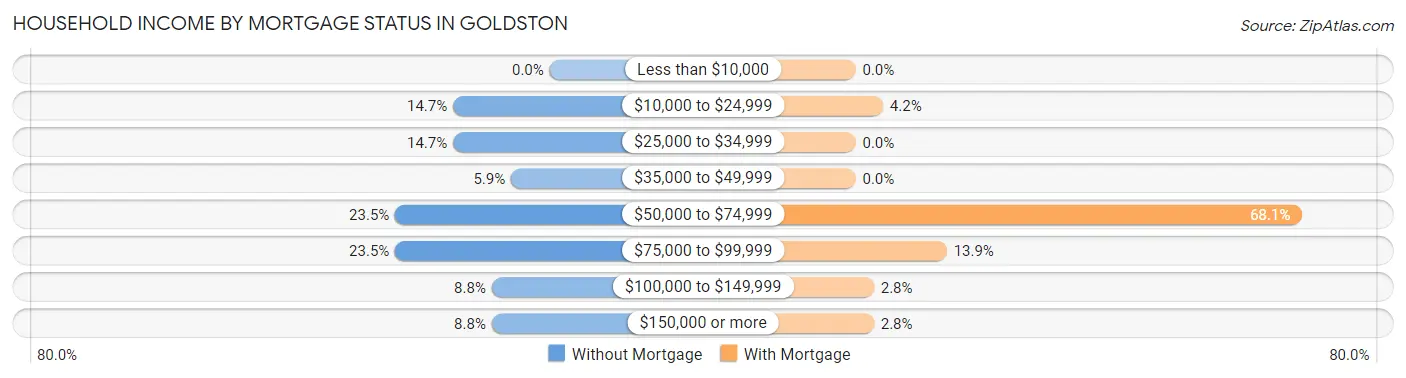
| Household Income | Without Mortgage | With Mortgage |
| Less than $10,000 | 0 (0.0%) | 0 (0.0%) |
| $10,000 to $24,999 | 5 (14.7%) | 3 (4.2%) |
| $25,000 to $34,999 | 5 (14.7%) | 0 (0.0%) |
| $35,000 to $49,999 | 2 (5.9%) | 0 (0.0%) |
| $50,000 to $74,999 | 8 (23.5%) | 49 (68.1%) |
| $75,000 to $99,999 | 8 (23.5%) | 10 (13.9%) |
| $100,000 to $149,999 | 3 (8.8%) | 2 (2.8%) |
| $150,000 or more | 3 (8.8%) | 2 (2.8%) |
| Total | 34 (100.0%) | 72 (100.0%) |
Property Value to Household Income Ratio in Goldston
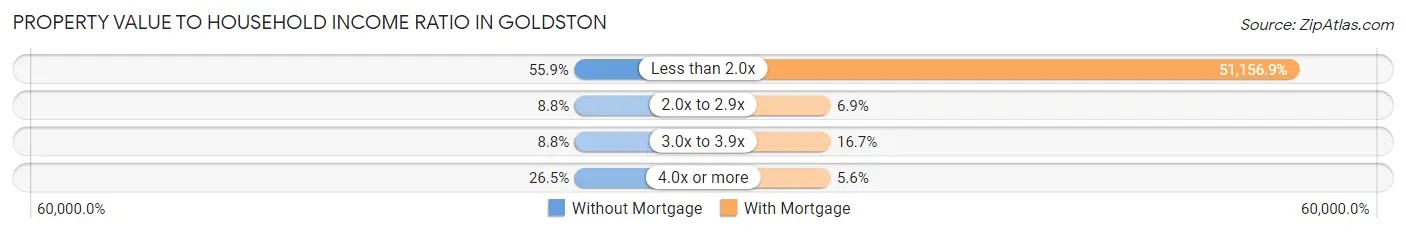
| Value-to-Income Ratio | Without Mortgage | With Mortgage |
| Less than 2.0x | 19 (55.9%) | 36,833 (51,156.9%) |
| 2.0x to 2.9x | 3 (8.8%) | 5 (6.9%) |
| 3.0x to 3.9x | 3 (8.8%) | 12 (16.7%) |
| 4.0x or more | 9 (26.5%) | 4 (5.6%) |
| Total | 34 (100.0%) | 72 (100.0%) |
Real Estate Taxes by Mortgage Status in Goldston
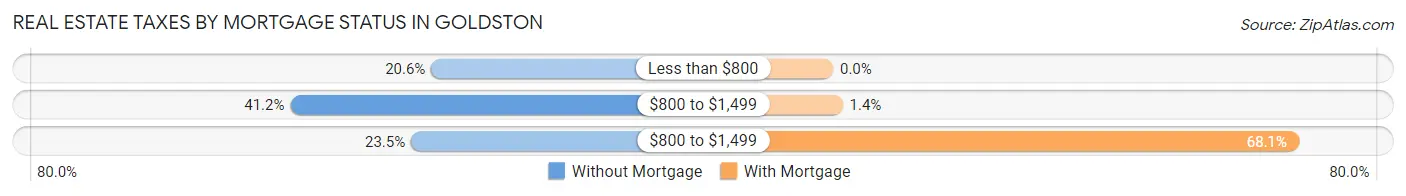
| Property Taxes | Without Mortgage | With Mortgage |
| Less than $800 | 7 (20.6%) | 0 (0.0%) |
| $800 to $1,499 | 14 (41.2%) | 1 (1.4%) |
| $800 to $1,499 | 8 (23.5%) | 49 (68.1%) |
| Total | 34 (100.0%) | 72 (100.0%) |
Health & Disability in Goldston
Health Insurance Coverage by Age in Goldston
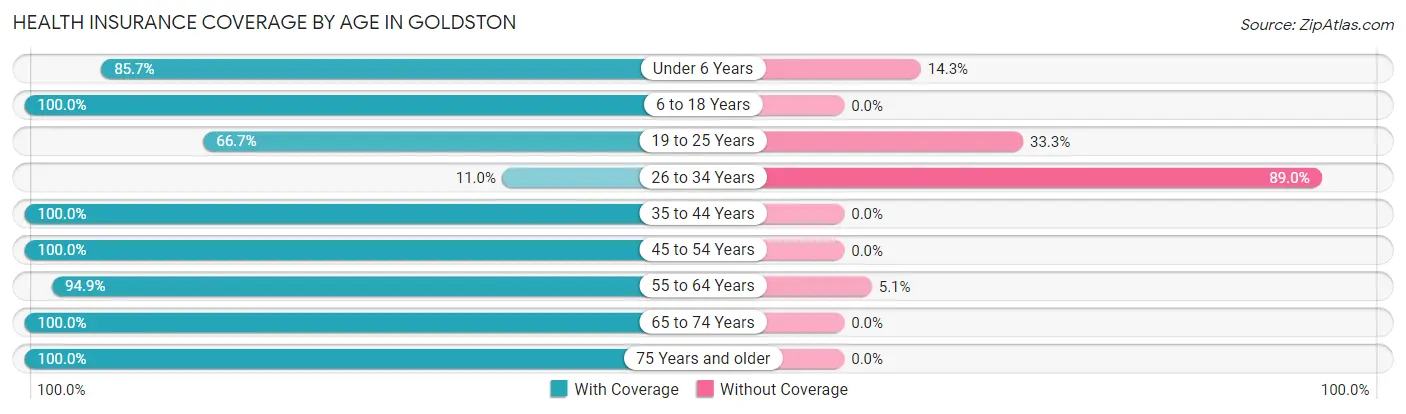
| Age Bracket | With Coverage | Without Coverage |
| Under 6 Years | 18 (85.7%) | 3 (14.3%) |
| 6 to 18 Years | 51 (100.0%) | 0 (0.0%) |
| 19 to 25 Years | 8 (66.7%) | 4 (33.3%) |
| 26 to 34 Years | 13 (11.0%) | 105 (89.0%) |
| 35 to 44 Years | 18 (100.0%) | 0 (0.0%) |
| 45 to 54 Years | 15 (100.0%) | 0 (0.0%) |
| 55 to 64 Years | 74 (94.9%) | 4 (5.1%) |
| 65 to 74 Years | 19 (100.0%) | 0 (0.0%) |
| 75 Years and older | 41 (100.0%) | 0 (0.0%) |
| Total | 257 (68.9%) | 116 (31.1%) |
Health Insurance Coverage by Citizenship Status in Goldston
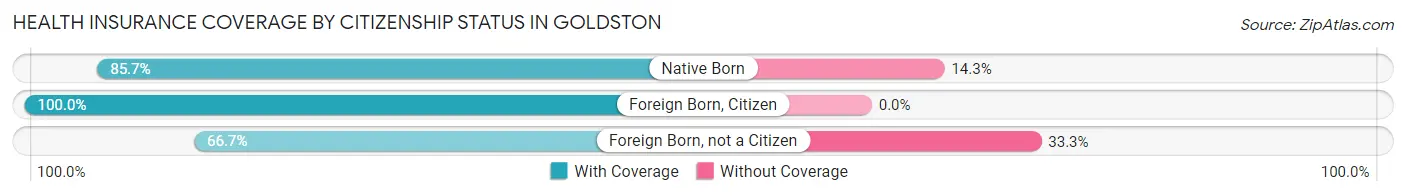
| Citizenship Status | With Coverage | Without Coverage |
| Native Born | 18 (85.7%) | 3 (14.3%) |
| Foreign Born, Citizen | 51 (100.0%) | 0 (0.0%) |
| Foreign Born, not a Citizen | 8 (66.7%) | 4 (33.3%) |
Health Insurance Coverage by Household Income in Goldston
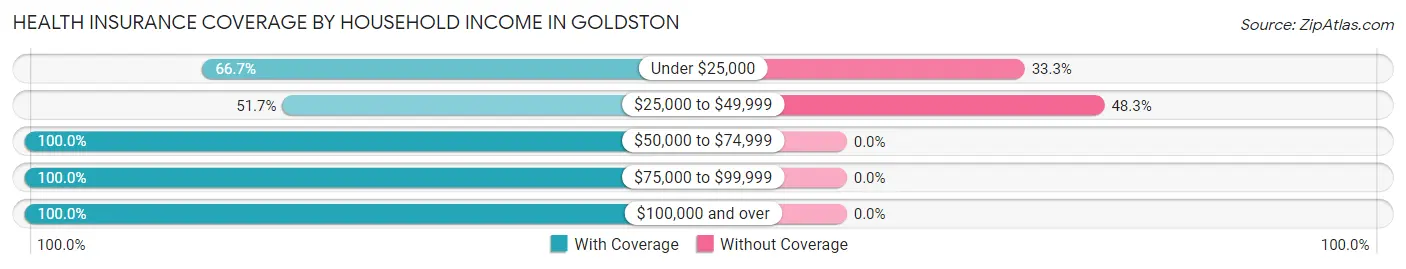
| Household Income | With Coverage | Without Coverage |
| Under $25,000 | 8 (66.7%) | 4 (33.3%) |
| $25,000 to $49,999 | 120 (51.7%) | 112 (48.3%) |
| $50,000 to $74,999 | 46 (100.0%) | 0 (0.0%) |
| $75,000 to $99,999 | 38 (100.0%) | 0 (0.0%) |
| $100,000 and over | 45 (100.0%) | 0 (0.0%) |
Public vs Private Health Insurance Coverage by Age in Goldston
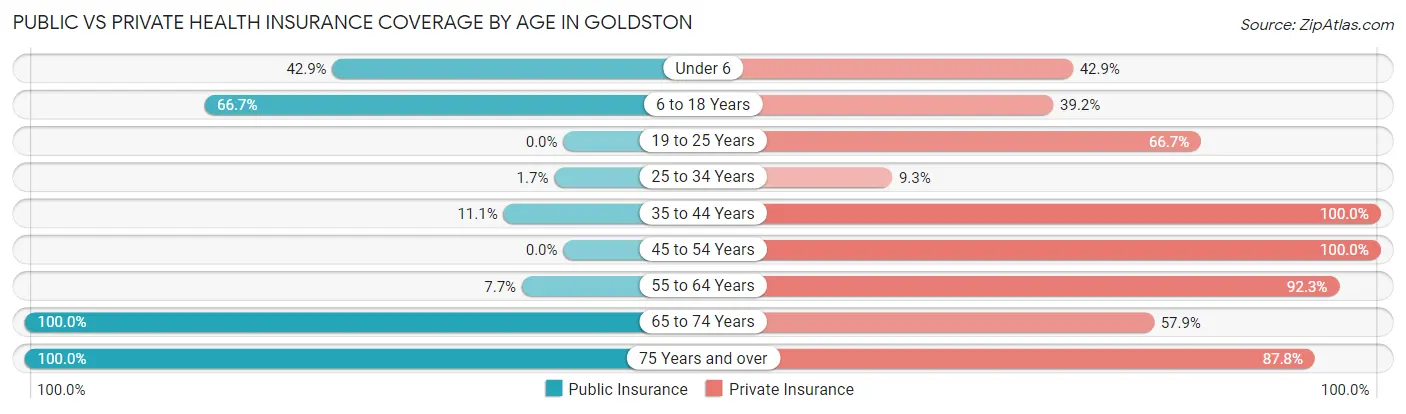
| Age Bracket | Public Insurance | Private Insurance |
| Under 6 | 9 (42.9%) | 9 (42.9%) |
| 6 to 18 Years | 34 (66.7%) | 20 (39.2%) |
| 19 to 25 Years | 0 (0.0%) | 8 (66.7%) |
| 25 to 34 Years | 2 (1.7%) | 11 (9.3%) |
| 35 to 44 Years | 2 (11.1%) | 18 (100.0%) |
| 45 to 54 Years | 0 (0.0%) | 15 (100.0%) |
| 55 to 64 Years | 6 (7.7%) | 72 (92.3%) |
| 65 to 74 Years | 19 (100.0%) | 11 (57.9%) |
| 75 Years and over | 41 (100.0%) | 36 (87.8%) |
| Total | 113 (30.3%) | 200 (53.6%) |
Disability Status by Sex by Age in Goldston
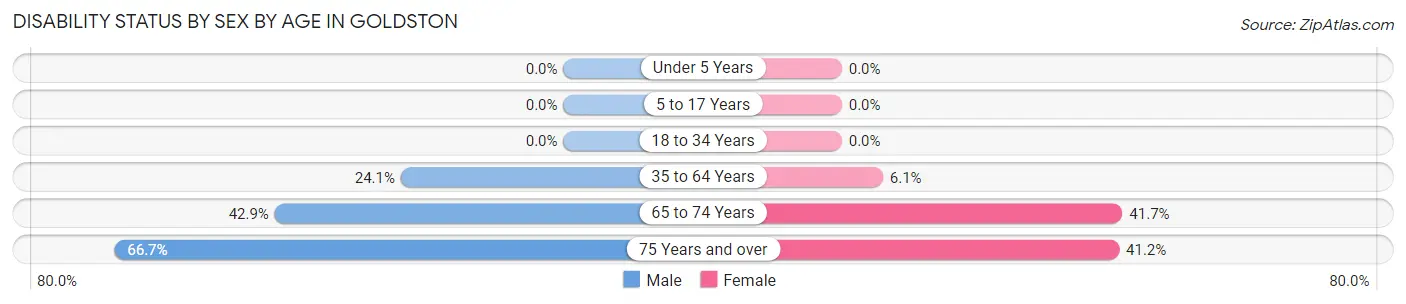
| Age Bracket | Male | Female |
| Under 5 Years | 0 (0.0%) | 0 (0.0%) |
| 5 to 17 Years | 0 (0.0%) | 0 (0.0%) |
| 18 to 34 Years | 0 (0.0%) | 0 (0.0%) |
| 35 to 64 Years | 7 (24.1%) | 5 (6.1%) |
| 65 to 74 Years | 3 (42.9%) | 5 (41.7%) |
| 75 Years and over | 16 (66.7%) | 7 (41.2%) |
Disability Class by Sex by Age in Goldston
Disability Class: Hearing Difficulty
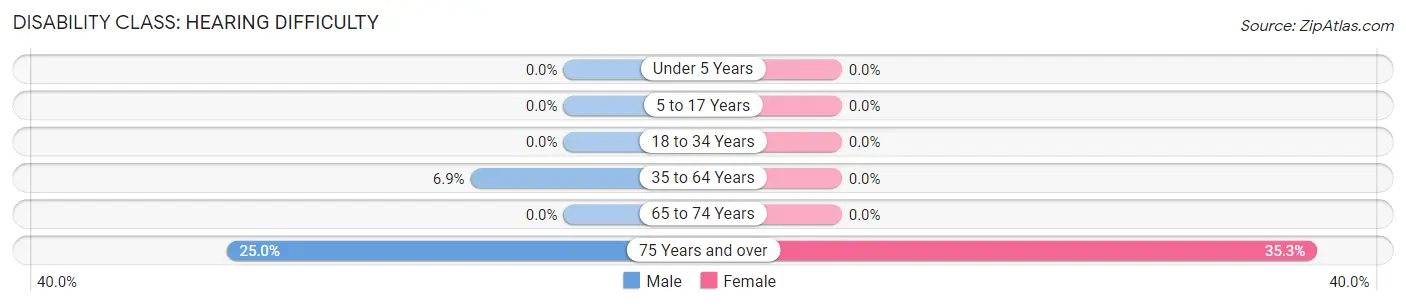
| Age Bracket | Male | Female |
| Under 5 Years | 0 (0.0%) | 0 (0.0%) |
| 5 to 17 Years | 0 (0.0%) | 0 (0.0%) |
| 18 to 34 Years | 0 (0.0%) | 0 (0.0%) |
| 35 to 64 Years | 2 (6.9%) | 0 (0.0%) |
| 65 to 74 Years | 0 (0.0%) | 0 (0.0%) |
| 75 Years and over | 6 (25.0%) | 6 (35.3%) |
Disability Class: Vision Difficulty
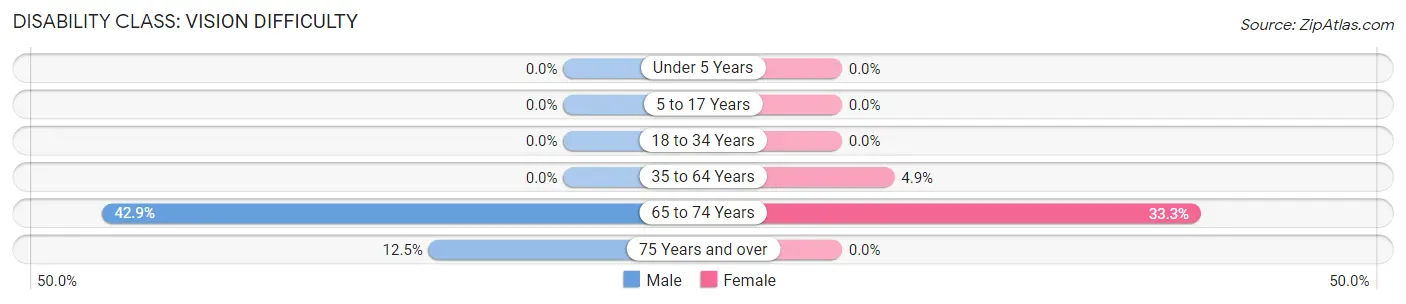
| Age Bracket | Male | Female |
| Under 5 Years | 0 (0.0%) | 0 (0.0%) |
| 5 to 17 Years | 0 (0.0%) | 0 (0.0%) |
| 18 to 34 Years | 0 (0.0%) | 0 (0.0%) |
| 35 to 64 Years | 0 (0.0%) | 4 (4.9%) |
| 65 to 74 Years | 3 (42.9%) | 4 (33.3%) |
| 75 Years and over | 3 (12.5%) | 0 (0.0%) |
Disability Class: Cognitive Difficulty
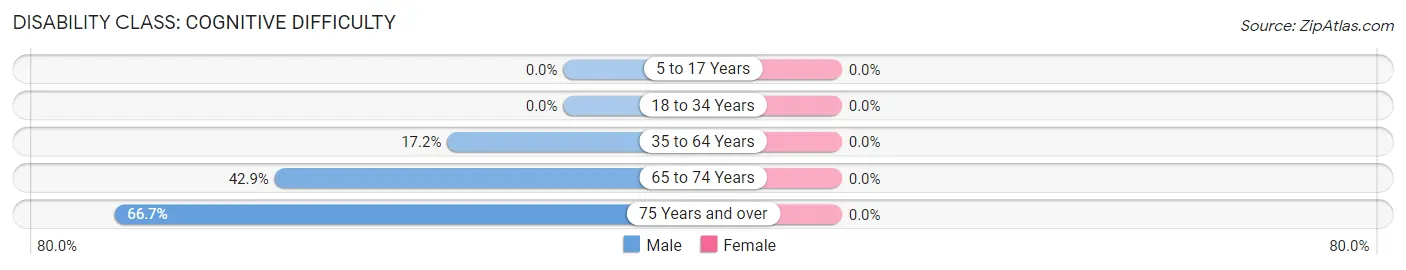
| Age Bracket | Male | Female |
| 5 to 17 Years | 0 (0.0%) | 0 (0.0%) |
| 18 to 34 Years | 0 (0.0%) | 0 (0.0%) |
| 35 to 64 Years | 5 (17.2%) | 0 (0.0%) |
| 65 to 74 Years | 3 (42.9%) | 0 (0.0%) |
| 75 Years and over | 16 (66.7%) | 0 (0.0%) |
Disability Class: Ambulatory Difficulty
| Age Bracket | Male | Female |
| 5 to 17 Years | 0 (0.0%) | 0 (0.0%) |
| 18 to 34 Years | 0 (0.0%) | 0 (0.0%) |
| 35 to 64 Years | 0 (0.0%) | 1 (1.2%) |
| 65 to 74 Years | 0 (0.0%) | 5 (41.7%) |
| 75 Years and over | 16 (66.7%) | 1 (5.9%) |
Disability Class: Self-Care Difficulty
| Age Bracket | Male | Female |
| 5 to 17 Years | 0 (0.0%) | 0 (0.0%) |
| 18 to 34 Years | 0 (0.0%) | 0 (0.0%) |
| 35 to 64 Years | 0 (0.0%) | 1 (1.2%) |
| 65 to 74 Years | 0 (0.0%) | 4 (33.3%) |
| 75 Years and over | 10 (41.7%) | 1 (5.9%) |
Technology Access in Goldston
Computing Device Access in Goldston
| Device Type | # Households | % Households |
| Desktop or Laptop | 54 | 42.9% |
| Smartphone | 98 | 77.8% |
| Tablet | 57 | 45.2% |
| No Computing Device | 16 | 12.7% |
| Total | 126 | 100.0% |
Internet Access in Goldston
| Internet Type | # Households | % Households |
| Dial-Up Internet | 0 | 0.0% |
| Broadband Home | 90 | 71.4% |
| Cellular Data Only | 4 | 3.2% |
| Satellite Internet | 2 | 1.6% |
| No Internet | 27 | 21.4% |
| Total | 126 | 100.0% |
Goldston Summary
Goldston is a small town located in Chatham County, North Carolina. It is situated in the heart of the North Carolina Piedmont region, approximately 30 miles south of Raleigh. The town was founded in 1887 and has a population of approximately 1,000 people.
Geography
Goldston is located in the Piedmont region of North Carolina, which is characterized by rolling hills and flat plains. The town is situated on the banks of the Haw River, which is a tributary of the Cape Fear River. The town is surrounded by farmland and is located near the Uwharrie National Forest. The town is also located near the cities of Sanford, Pittsboro, and Siler City.
Economy
Goldston’s economy is largely based on agriculture. The town is home to several farms, which produce a variety of crops, including corn, soybeans, and tobacco. The town also has a few small businesses, including a grocery store, a hardware store, and a few restaurants.
Demographics
Goldston is a predominantly white town, with approximately 90% of the population being white. The remaining 10% of the population is made up of African Americans, Hispanics, and other ethnicities. The median household income in Goldston is approximately $35,000, which is slightly lower than the national average.
History
Goldston was founded in 1887 by a group of settlers from the nearby town of Pittsboro. The town was named after a local landowner, William Goldston. The town quickly grew and by the early 1900s, it had become a thriving agricultural community. The town was home to several churches, a school, and a post office.
In the 1950s, Goldston began to decline as many of its residents moved away in search of better economic opportunities. The town’s population decreased from 1,000 in 1950 to just over 500 in 2000. In recent years, the town has seen a resurgence in population as people have moved back to the area in search of a more rural lifestyle.
Goldston is a small town with a rich history and a bright future. The town is home to a diverse population and a thriving economy. The town is also located near several major cities, making it an ideal place to live for those who want to be close to the amenities of a larger city while still enjoying the peace and quiet of a small town.
Common Questions
What is Per Capita Income in Goldston?
Per Capita income in Goldston is $22,666.
What is the Median Household income in Goldston?
Median Household Income in Goldston is $37,278.
What is Inequality or Gini Index in Goldston?
Inequality or Gini Index in Goldston is 0.38.
What is the Total Population of Goldston?
Total Population of Goldston is 375.
What is the Total Male Population of Goldston?
Total Male Population of Goldston is 187.
What is the Total Female Population of Goldston?
Total Female Population of Goldston is 188.
What is the Ratio of Males per 100 Females in Goldston?
There are 99.47 Males per 100 Females in Goldston.
What is the Ratio of Females per 100 Males in Goldston?
There are 100.53 Females per 100 Males in Goldston.
What is the Median Population Age in Goldston?
Median Population Age in Goldston is 32.9 Years.
What is the Average Family Size in Goldston
Average Family Size in Goldston is 3.4 People.
What is the Average Household Size in Goldston
Average Household Size in Goldston is 3.0 People.
How Large is the Labor Force in Goldston?
There are 228 People in the Labor Forcein in Goldston.
What is the Percentage of People in the Labor Force in Goldston?
75.2% of People are in the Labor Force in Goldston.