Green Valley Farms, TX Map & Demographics
Green Valley Farms Map
Green Valley Farms Overview
$19,771
PER CAPITA INCOME
0.41
INEQUALITY / GINI INDEX
468
TOTAL POPULATION
239
MALE POPULATION
229
FEMALE POPULATION
104.37
MALES / 100 FEMALES
95.82
FEMALES / 100 MALES
49.2
MEDIAN AGE
3.5
AVG FAMILY SIZE
3.2
AVG HOUSEHOLD SIZE
185
LABOR FORCE [ PEOPLE ]
41.2%
PERCENT IN LABOR FORCE
9.2%
UNEMPLOYMENT RATE
Income in Green Valley Farms
Income Overview in Green Valley Farms
| Characteristic | Number | Measure |
| Per Capita Income | 468 | $19,771 |
| Median Family Income | 115 | $0 |
| Mean Family Income | 115 | $60,314 |
| Median Household Income | 147 | $0 |
| Mean Household Income | 147 | $56,311 |
| Income Deficit | 115 | $0 |
| Wage / Income Gap (%) | 468 | 0.00% |
| Wage / Income Gap ($) | 468 | 100.00¢ per $1 |
| Gini / Inequality Index | 468 | 0.41 |
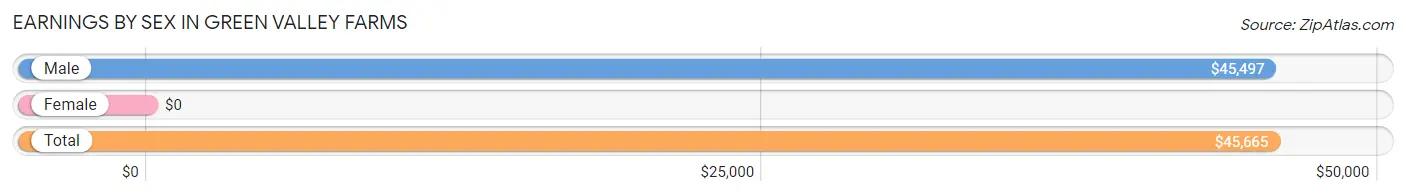
Earnings by Sex in Green Valley Farms
| Sex | Number | Average Earnings |
| Male | 117 (63.2%) | $45,497 |
| Female | 68 (36.8%) | $0 |
| Total | 185 (100.0%) | $45,665 |
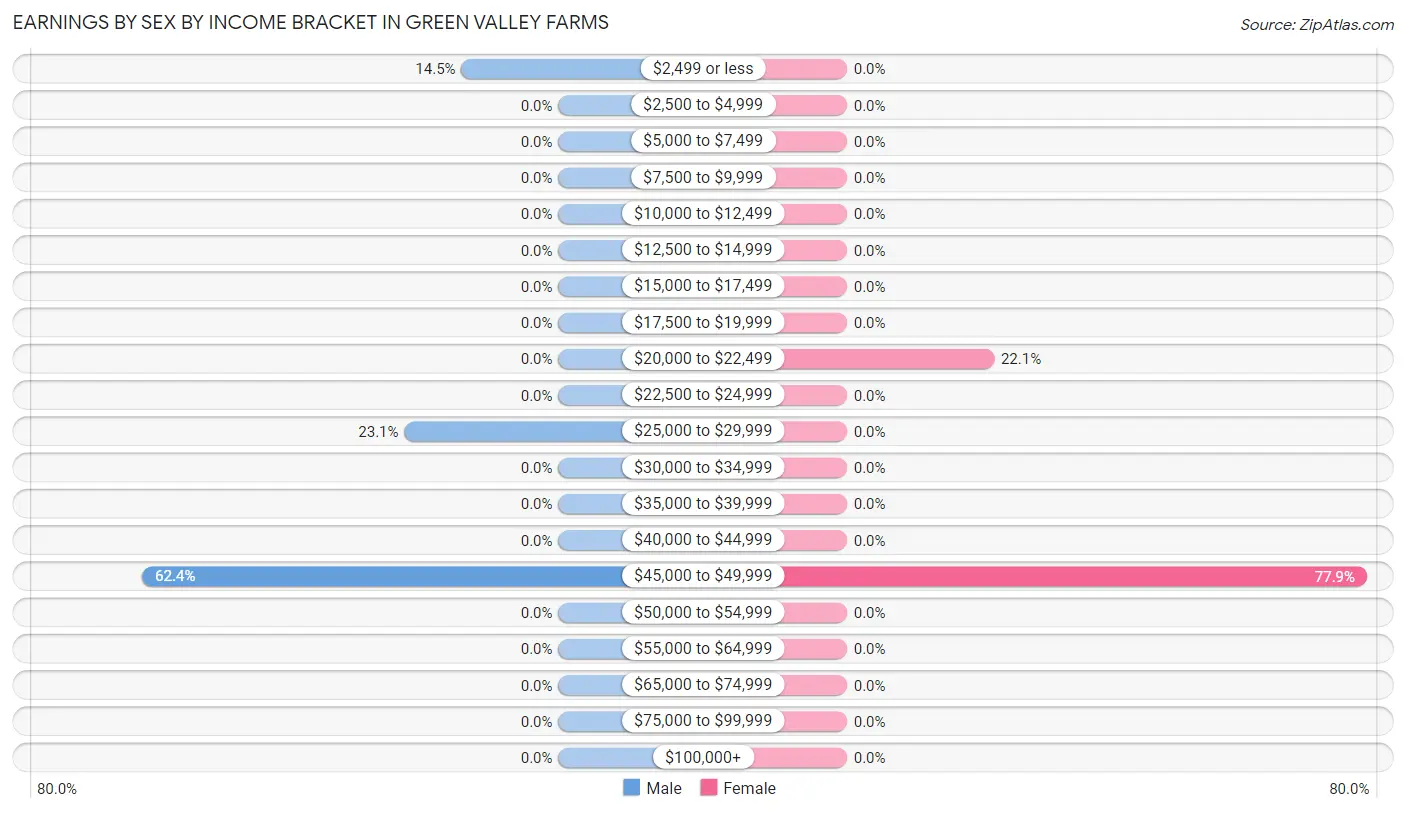
Earnings by Sex by Income Bracket in Green Valley Farms
The most common earnings brackets in Green Valley Farms are $45,000 to $49,999 for men (73 | 62.4%) and $45,000 to $49,999 for women (53 | 77.9%).
| Income | Male | Female |
| $2,499 or less | 17 (14.5%) | 0 (0.0%) |
| $2,500 to $4,999 | 0 (0.0%) | 0 (0.0%) |
| $5,000 to $7,499 | 0 (0.0%) | 0 (0.0%) |
| $7,500 to $9,999 | 0 (0.0%) | 0 (0.0%) |
| $10,000 to $12,499 | 0 (0.0%) | 0 (0.0%) |
| $12,500 to $14,999 | 0 (0.0%) | 0 (0.0%) |
| $15,000 to $17,499 | 0 (0.0%) | 0 (0.0%) |
| $17,500 to $19,999 | 0 (0.0%) | 0 (0.0%) |
| $20,000 to $22,499 | 0 (0.0%) | 15 (22.1%) |
| $22,500 to $24,999 | 0 (0.0%) | 0 (0.0%) |
| $25,000 to $29,999 | 27 (23.1%) | 0 (0.0%) |
| $30,000 to $34,999 | 0 (0.0%) | 0 (0.0%) |
| $35,000 to $39,999 | 0 (0.0%) | 0 (0.0%) |
| $40,000 to $44,999 | 0 (0.0%) | 0 (0.0%) |
| $45,000 to $49,999 | 73 (62.4%) | 53 (77.9%) |
| $50,000 to $54,999 | 0 (0.0%) | 0 (0.0%) |
| $55,000 to $64,999 | 0 (0.0%) | 0 (0.0%) |
| $65,000 to $74,999 | 0 (0.0%) | 0 (0.0%) |
| $75,000 to $99,999 | 0 (0.0%) | 0 (0.0%) |
| $100,000+ | 0 (0.0%) | 0 (0.0%) |
| Total | 117 (100.0%) | 68 (100.0%) |
Earnings by Sex by Educational Attainment in Green Valley Farms
| Educational Attainment | Male Income | Female Income |
| Less than High School | - | - |
| High School Diploma | - | - |
| College or Associate's Degree | - | - |
| Bachelor's Degree | - | - |
| Graduate Degree | - | - |
| Total | $45,771 | $0 |
Family Income in Green Valley Farms
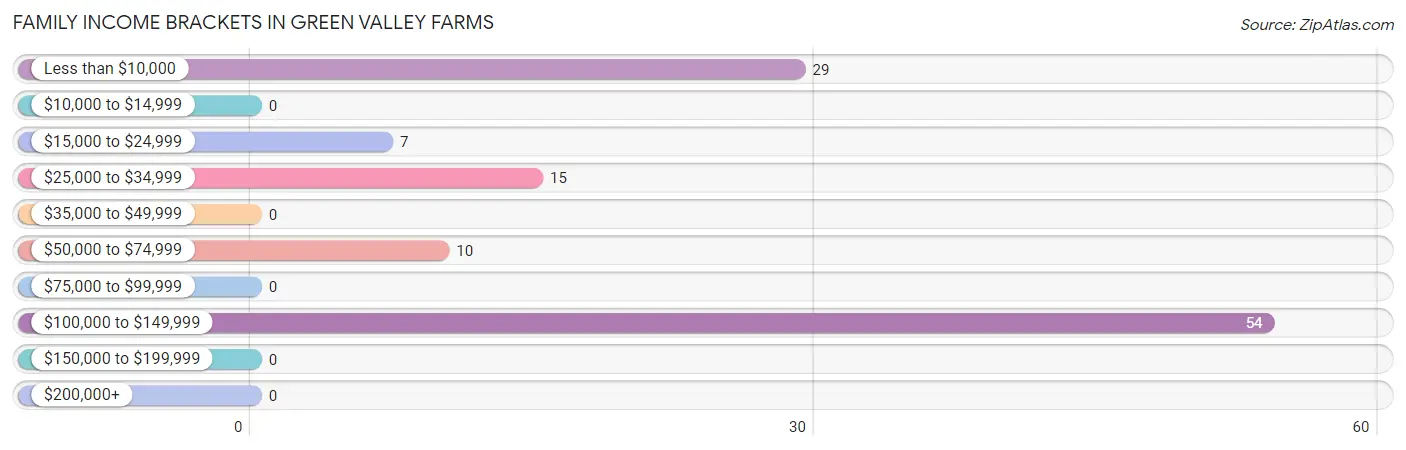
Family Income Brackets in Green Valley Farms
According to the Green Valley Farms family income data, there are 54 families falling into the $100,000 to $149,999 income range, which is the most common income bracket and makes up 47.0% of all families.
| Income Bracket | # Families | % Families |
| Less than $10,000 | 29 | 25.2% |
| $10,000 to $14,999 | 0 | 0.0% |
| $15,000 to $24,999 | 7 | 6.1% |
| $25,000 to $34,999 | 15 | 13.0% |
| $35,000 to $49,999 | 0 | 0.0% |
| $50,000 to $74,999 | 10 | 8.7% |
| $75,000 to $99,999 | 0 | 0.0% |
| $100,000 to $149,999 | 54 | 47.0% |
| $150,000 to $199,999 | 0 | 0.0% |
| $200,000+ | 0 | 0.0% |
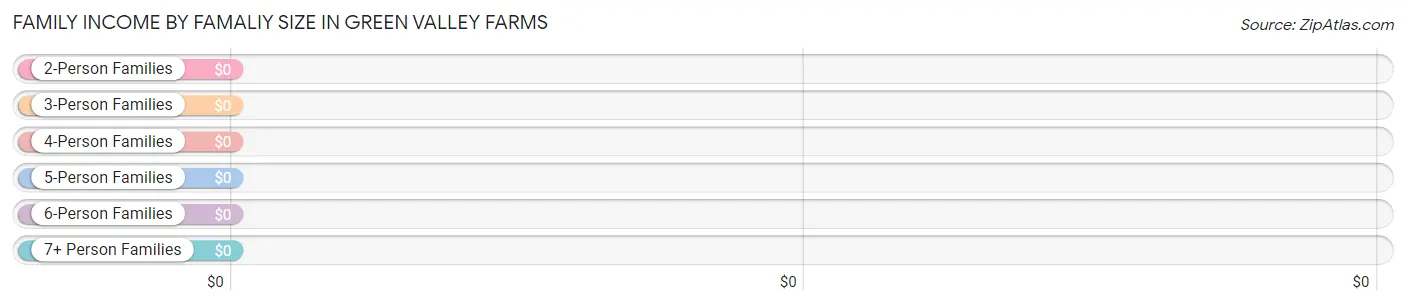
Family Income by Famaliy Size in Green Valley Farms
| Income Bracket | # Families | Median Income |
| 2-Person Families | 36 (31.3%) | $0 |
| 3-Person Families | 25 (21.7%) | $0 |
| 4-Person Families | 54 (47.0%) | $0 |
| 5-Person Families | 0 (0.0%) | $0 |
| 6-Person Families | 0 (0.0%) | $0 |
| 7+ Person Families | 0 (0.0%) | $0 |
| Total | 115 (100.0%) | $0 |
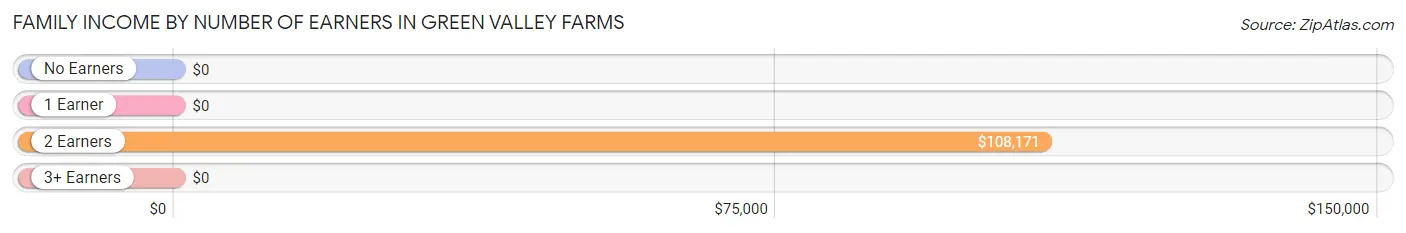
Family Income by Number of Earners in Green Valley Farms
| Number of Earners | # Families | Median Income |
| No Earners | 36 (31.3%) | $0 |
| 1 Earner | 0 (0.0%) | $0 |
| 2 Earners | 79 (68.7%) | $108,171 |
| 3+ Earners | 0 (0.0%) | $0 |
| Total | 115 (100.0%) | $0 |
Household Income in Green Valley Farms
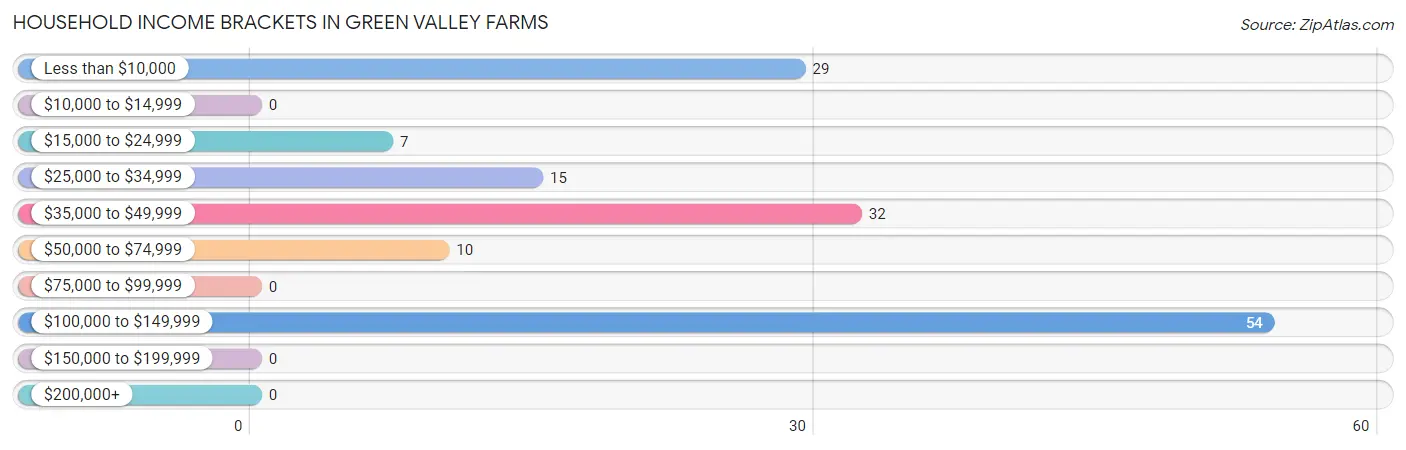
Household Income Brackets in Green Valley Farms
With 54 households falling in the category, the $100,000 to $149,999 income range is the most frequent in Green Valley Farms, accounting for 36.7% of all households.
| Income Bracket | # Households | % Households |
| Less than $10,000 | 29 | 19.7% |
| $10,000 to $14,999 | 0 | 0.0% |
| $15,000 to $24,999 | 7 | 4.8% |
| $25,000 to $34,999 | 15 | 10.2% |
| $35,000 to $49,999 | 32 | 21.8% |
| $50,000 to $74,999 | 10 | 6.8% |
| $75,000 to $99,999 | 0 | 0.0% |
| $100,000 to $149,999 | 54 | 36.7% |
| $150,000 to $199,999 | 0 | 0.0% |
| $200,000+ | 0 | 0.0% |
Household Income by Householder Age in Green Valley Farms
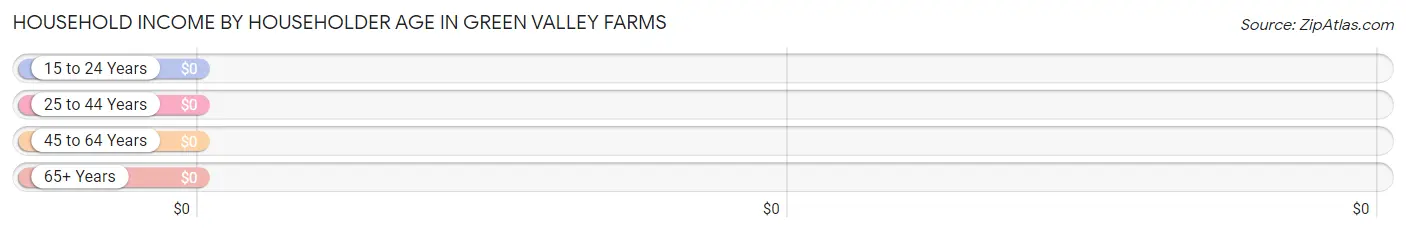
| Income Bracket | # Households | Median Income |
| 15 to 24 Years | 0 (0.0%) | $0 |
| 25 to 44 Years | 0 (0.0%) | $0 |
| 45 to 64 Years | 86 (58.5%) | $0 |
| 65+ Years | 61 (41.5%) | $0 |
| Total | 147 (100.0%) | $0 |
Poverty in Green Valley Farms
Income Below Poverty by Sex and Age in Green Valley Farms
With 12.1% poverty level for males and 11.8% for females among the residents of Green Valley Farms, 55 to 64 year old males and 45 to 54 year old females are the most vulnerable to poverty, with 29 males (100.0%) and 27 females (51.9%) in their respective age groups living below the poverty level.
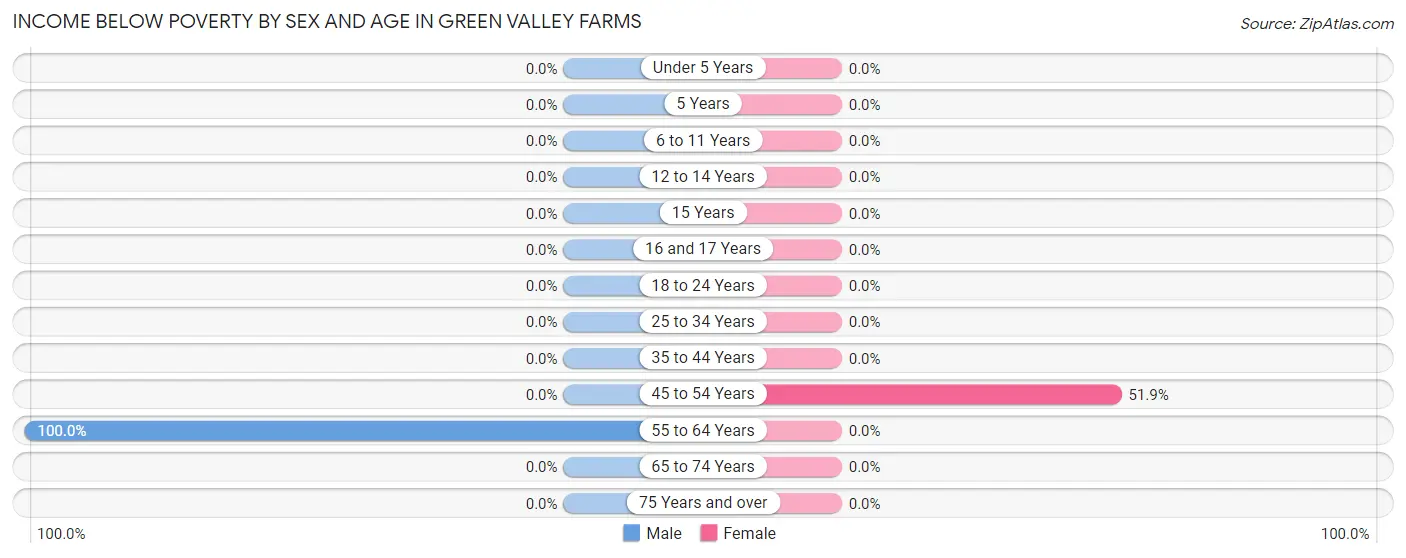
| Age Bracket | Male | Female |
| Under 5 Years | 0 (0.0%) | 0 (0.0%) |
| 5 Years | 0 (0.0%) | 0 (0.0%) |
| 6 to 11 Years | 0 (0.0%) | 0 (0.0%) |
| 12 to 14 Years | 0 (0.0%) | 0 (0.0%) |
| 15 Years | 0 (0.0%) | 0 (0.0%) |
| 16 and 17 Years | 0 (0.0%) | 0 (0.0%) |
| 18 to 24 Years | 0 (0.0%) | 0 (0.0%) |
| 25 to 34 Years | 0 (0.0%) | 0 (0.0%) |
| 35 to 44 Years | 0 (0.0%) | 0 (0.0%) |
| 45 to 54 Years | 0 (0.0%) | 27 (51.9%) |
| 55 to 64 Years | 29 (100.0%) | 0 (0.0%) |
| 65 to 74 Years | 0 (0.0%) | 0 (0.0%) |
| 75 Years and over | 0 (0.0%) | 0 (0.0%) |
| Total | 29 (12.1%) | 27 (11.8%) |
Income Above Poverty by Sex and Age in Green Valley Farms
According to the poverty statistics in Green Valley Farms, males aged 18 to 24 years and females aged 12 to 14 years are the age groups that are most secure financially, with 100.0% of males and 100.0% of females in these age groups living above the poverty line.
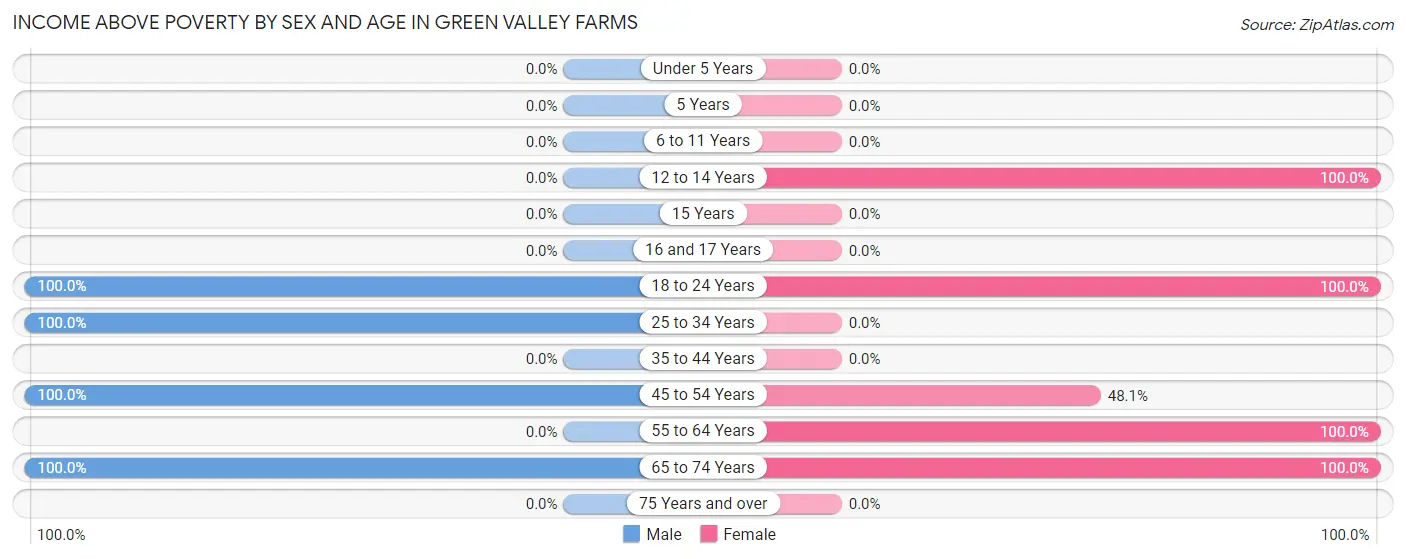
| Age Bracket | Male | Female |
| Under 5 Years | 0 (0.0%) | 0 (0.0%) |
| 5 Years | 0 (0.0%) | 0 (0.0%) |
| 6 to 11 Years | 0 (0.0%) | 0 (0.0%) |
| 12 to 14 Years | 0 (0.0%) | 19 (100.0%) |
| 15 Years | 0 (0.0%) | 0 (0.0%) |
| 16 and 17 Years | 0 (0.0%) | 0 (0.0%) |
| 18 to 24 Years | 16 (100.0%) | 68 (100.0%) |
| 25 to 34 Years | 73 (100.0%) | 0 (0.0%) |
| 35 to 44 Years | 0 (0.0%) | 0 (0.0%) |
| 45 to 54 Years | 60 (100.0%) | 25 (48.1%) |
| 55 to 64 Years | 0 (0.0%) | 83 (100.0%) |
| 65 to 74 Years | 61 (100.0%) | 7 (100.0%) |
| 75 Years and over | 0 (0.0%) | 0 (0.0%) |
| Total | 210 (87.9%) | 202 (88.2%) |
Income Below Poverty Among Married-Couple Families in Green Valley Farms
The poverty statistics for married-couple families in Green Valley Farms show that 25.2% or 29 of the total 115 families live below the poverty line. Families with no children have the highest poverty rate of 29.0%, comprising of 29 families. On the other hand, families with 1 or 2 children have the lowest poverty rate of 0.0%, which includes 0 families.
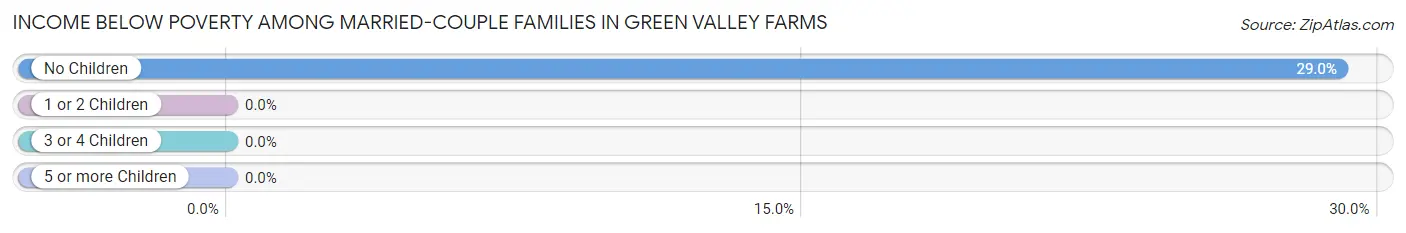
| Children | Above Poverty | Below Poverty |
| No Children | 71 (71.0%) | 29 (29.0%) |
| 1 or 2 Children | 15 (100.0%) | 0 (0.0%) |
| 3 or 4 Children | 0 (0.0%) | 0 (0.0%) |
| 5 or more Children | 0 (0.0%) | 0 (0.0%) |
| Total | 86 (74.8%) | 29 (25.2%) |
Income Below Poverty Among Single-Parent Households in Green Valley Farms
| Children | Single Father | Single Mother |
| No Children | 0 (0.0%) | 0 (0.0%) |
| 1 or 2 Children | 0 (0.0%) | 0 (0.0%) |
| 3 or 4 Children | 0 (0.0%) | 0 (0.0%) |
| 5 or more Children | 0 (0.0%) | 0 (0.0%) |
| Total | 0 (0.0%) | 0 (0.0%) |
Income Below Poverty Among Married-Couple vs Single-Parent Households in Green Valley Farms
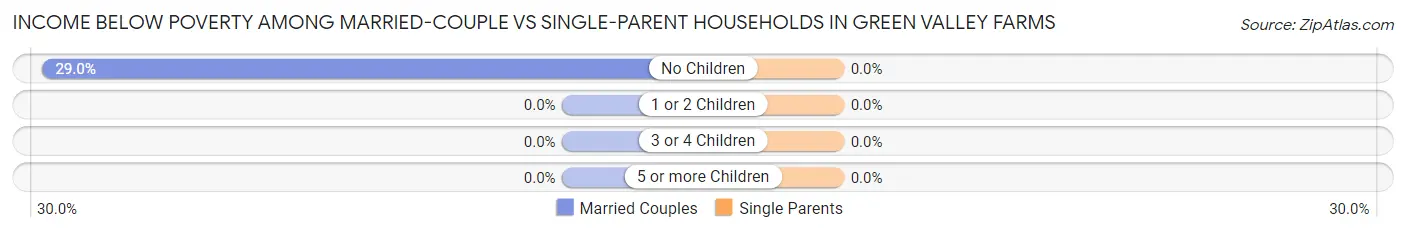
| Children | Married-Couple Families | Single-Parent Households |
| No Children | 29 (29.0%) | 0 (0.0%) |
| 1 or 2 Children | 0 (0.0%) | 0 (0.0%) |
| 3 or 4 Children | 0 (0.0%) | 0 (0.0%) |
| 5 or more Children | 0 (0.0%) | 0 (0.0%) |
| Total | 29 (25.2%) | 0 (0.0%) |
Race in Green Valley Farms
The most populous races in Green Valley Farms are Hispanic or Latino (468 | 100.0%), Two or more Races (310 | 66.2%), and Some other Race (88 | 18.8%).
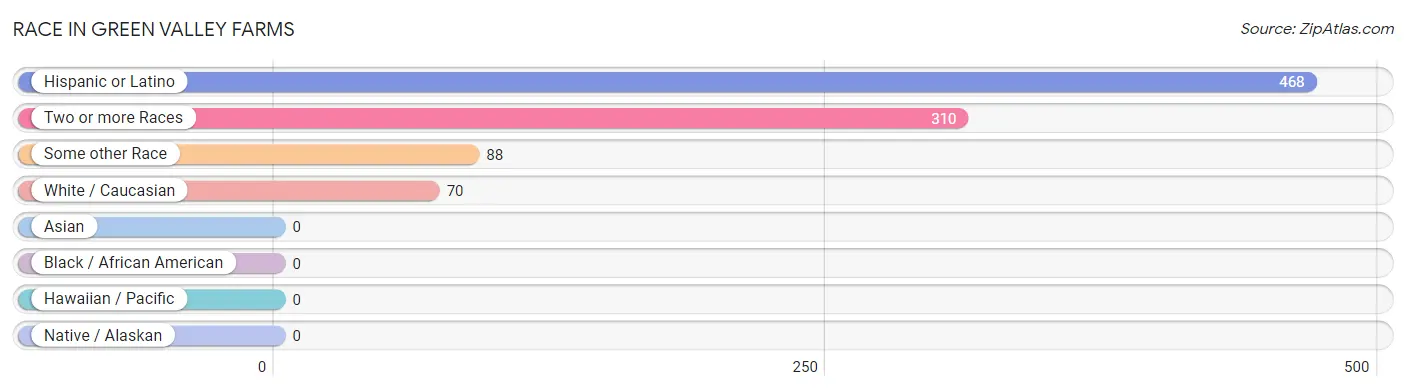
| Race | # Population | % Population |
| Asian | 0 | 0.0% |
| Black / African American | 0 | 0.0% |
| Hawaiian / Pacific | 0 | 0.0% |
| Hispanic or Latino | 468 | 100.0% |
| Native / Alaskan | 0 | 0.0% |
| White / Caucasian | 70 | 15.0% |
| Two or more Races | 310 | 66.2% |
| Some other Race | 88 | 18.8% |
| Total | 468 | 100.0% |
Ancestry in Green Valley Farms
The most populous ancestries reported in Green Valley Farms are , and Mexican (468 | 100.0%), together accounting for 100.0% of all Green Valley Farms residents.

| Ancestry | # Population | % Population |
| Mexican | 468 | 100.0% | View All 1 Rows |
Immigrants in Green Valley Farms
The most numerous immigrant groups reported in Green Valley Farms came from Latin America (171 | 36.5%), Central America (139 | 29.7%), Mexico (109 | 23.3%), Caribbean (32 | 6.8%), and Cuba (32 | 6.8%), together accounting for 103.2% of all Green Valley Farms residents.
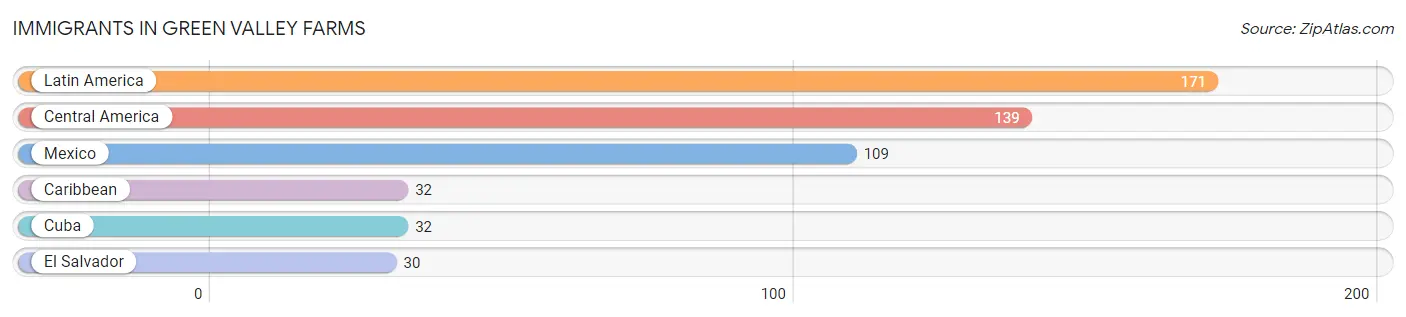
| Immigration Origin | # Population | % Population |
| Caribbean | 32 | 6.8% |
| Central America | 139 | 29.7% |
| Cuba | 32 | 6.8% |
| El Salvador | 30 | 6.4% |
| Latin America | 171 | 36.5% |
| Mexico | 109 | 23.3% | View All 6 Rows |
Sex and Age in Green Valley Farms
Sex and Age in Green Valley Farms
The most populous age groups in Green Valley Farms are 25 to 29 Years (73 | 30.5%) for men and 60 to 64 Years (83 | 36.2%) for women.
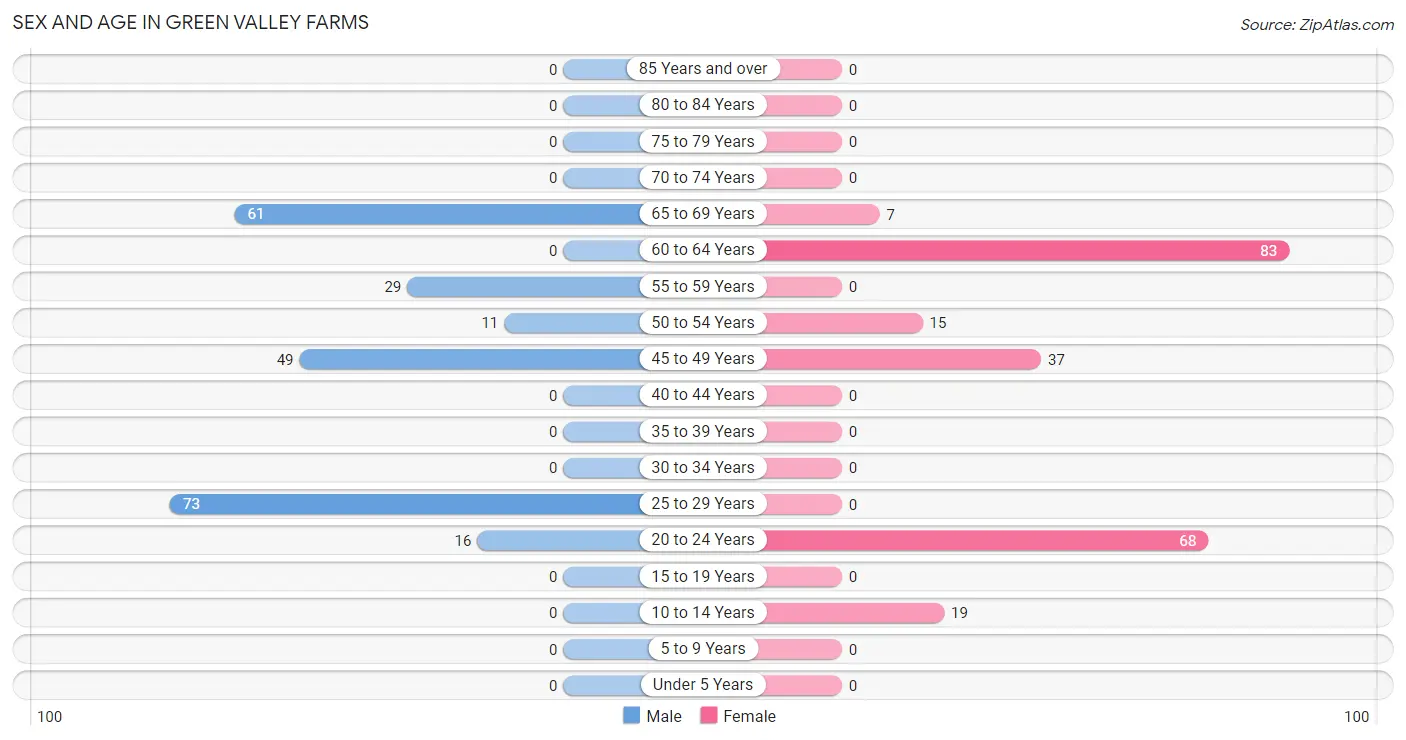
| Age Bracket | Male | Female |
| Under 5 Years | 0 (0.0%) | 0 (0.0%) |
| 5 to 9 Years | 0 (0.0%) | 0 (0.0%) |
| 10 to 14 Years | 0 (0.0%) | 19 (8.3%) |
| 15 to 19 Years | 0 (0.0%) | 0 (0.0%) |
| 20 to 24 Years | 16 (6.7%) | 68 (29.7%) |
| 25 to 29 Years | 73 (30.5%) | 0 (0.0%) |
| 30 to 34 Years | 0 (0.0%) | 0 (0.0%) |
| 35 to 39 Years | 0 (0.0%) | 0 (0.0%) |
| 40 to 44 Years | 0 (0.0%) | 0 (0.0%) |
| 45 to 49 Years | 49 (20.5%) | 37 (16.2%) |
| 50 to 54 Years | 11 (4.6%) | 15 (6.6%) |
| 55 to 59 Years | 29 (12.1%) | 0 (0.0%) |
| 60 to 64 Years | 0 (0.0%) | 83 (36.2%) |
| 65 to 69 Years | 61 (25.5%) | 7 (3.1%) |
| 70 to 74 Years | 0 (0.0%) | 0 (0.0%) |
| 75 to 79 Years | 0 (0.0%) | 0 (0.0%) |
| 80 to 84 Years | 0 (0.0%) | 0 (0.0%) |
| 85 Years and over | 0 (0.0%) | 0 (0.0%) |
| Total | 239 (100.0%) | 229 (100.0%) |
Families and Households in Green Valley Farms
Median Family Size in Green Valley Farms
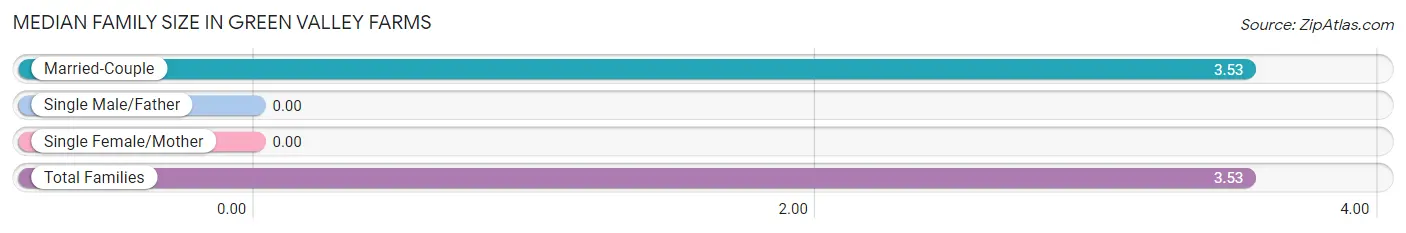
| Family Type | # Families | Family Size |
| Married-Couple | 115 (100.0%) | 3.53 |
| Single Male/Father | 0 (0.0%) | - |
| Single Female/Mother | 0 (0.0%) | - |
| Total Families | 115 (100.0%) | 3.53 |
Median Household Size in Green Valley Farms
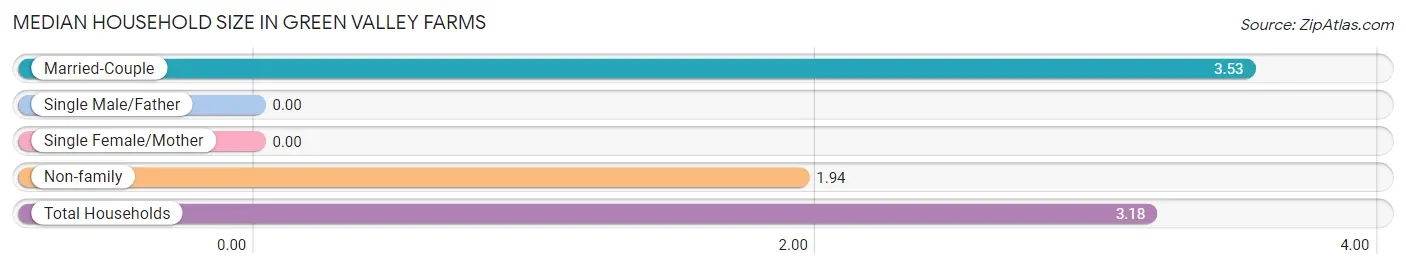
| Household Type | # Households | Household Size |
| Married-Couple | 115 (78.2%) | 3.53 |
| Single Male/Father | 0 (0.0%) | - |
| Single Female/Mother | 0 (0.0%) | - |
| Non-family | 32 (21.8%) | 1.94 |
| Total Households | 147 (100.0%) | 3.18 |
Household Size by Marriage Status in Green Valley Farms
Out of a total of 147 households in Green Valley Farms, 115 (78.2%) are family households, while 32 (21.8%) are nonfamily households. The most numerous type of family households are 4-person households, comprising 54, and the most common type of nonfamily households are 2-person households, comprising 32.
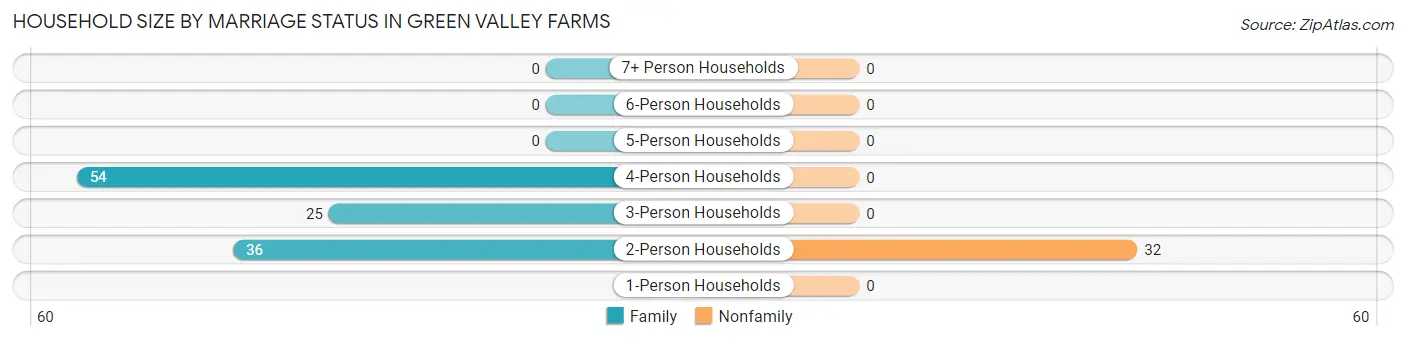
| Household Size | Family Households | Nonfamily Households |
| 1-Person Households | - | 0 (0.0%) |
| 2-Person Households | 36 (24.5%) | 32 (21.8%) |
| 3-Person Households | 25 (17.0%) | 0 (0.0%) |
| 4-Person Households | 54 (36.7%) | 0 (0.0%) |
| 5-Person Households | 0 (0.0%) | 0 (0.0%) |
| 6-Person Households | 0 (0.0%) | 0 (0.0%) |
| 7+ Person Households | 0 (0.0%) | 0 (0.0%) |
| Total | 115 (78.2%) | 32 (21.8%) |
Female Fertility in Green Valley Farms
Fertility by Age in Green Valley Farms
| Age Bracket | Women with Births | Births / 1,000 Women |
| 15 to 19 years | 0 (0.0%) | 0.0 |
| 20 to 34 years | 0 (0.0%) | 0.0 |
| 35 to 50 years | 0 (0.0%) | 0.0 |
| Total | 0 (0.0%) | 0.0 |
Fertility by Age by Marriage Status in Green Valley Farms
| Age Bracket | Married | Unmarried |
| 15 to 19 years | 0 (0.0%) | 0 (0.0%) |
| 20 to 34 years | 0 (0.0%) | 0 (0.0%) |
| 35 to 50 years | 0 (0.0%) | 0 (0.0%) |
| Total | 0 (0.0%) | 0 (0.0%) |
Fertility by Education in Green Valley Farms
| Educational Attainment | Women with Births | Births / 1,000 Women |
| Less than High School | 0 (0.0%) | 0.0 |
| High School Diploma | 0 (0.0%) | 0.0 |
| College or Associate's Degree | 0 (0.0%) | 0.0 |
| Bachelor's Degree | 0 (0.0%) | 0.0 |
| Graduate Degree | 0 (0.0%) | 0.0 |
| Total | 0 (0.0%) | 0.0 |
Fertility by Education by Marriage Status in Green Valley Farms
| Educational Attainment | Married | Unmarried |
| Less than High School | 0 (0.0%) | 0 (0.0%) |
| High School Diploma | 0 (0.0%) | 0 (0.0%) |
| College or Associate's Degree | 0 (0.0%) | 0 (0.0%) |
| Bachelor's Degree | 0 (0.0%) | 0 (0.0%) |
| Graduate Degree | 0 (0.0%) | 0 (0.0%) |
| Total | 0 (0.0%) | 0 (0.0%) |
Employment Characteristics in Green Valley Farms
Employment by Class of Employer in Green Valley Farms
Among the 168 employed individuals in Green Valley Farms, private company employees (157 | 93.4%), and self-employed (not incorporated) (11 | 6.6%) make up the most common classes of employment.
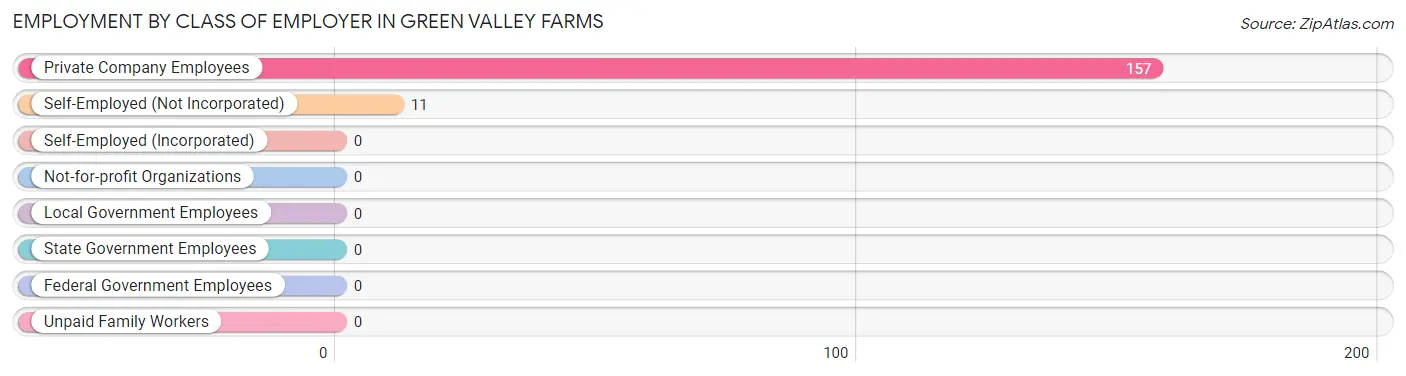
| Employer Class | # Employees | % Employees |
| Private Company Employees | 157 | 93.4% |
| Self-Employed (Incorporated) | 0 | 0.0% |
| Self-Employed (Not Incorporated) | 11 | 6.6% |
| Not-for-profit Organizations | 0 | 0.0% |
| Local Government Employees | 0 | 0.0% |
| State Government Employees | 0 | 0.0% |
| Federal Government Employees | 0 | 0.0% |
| Unpaid Family Workers | 0 | 0.0% |
| Total | 168 | 100.0% |
Employment Status by Age in Green Valley Farms
According to the labor force statistics for Green Valley Farms, out of the total population over 16 years of age (449), 41.2% or 185 individuals are in the labor force, with 9.2% or 17 of them unemployed. The age group with the highest labor force participation rate is 25 to 29 years, with 100.0% or 73 individuals in the labor force. Within the labor force, the 45 to 54 years age range has the highest percentage of unemployed individuals, with 39.5% or 17 of them being unemployed.
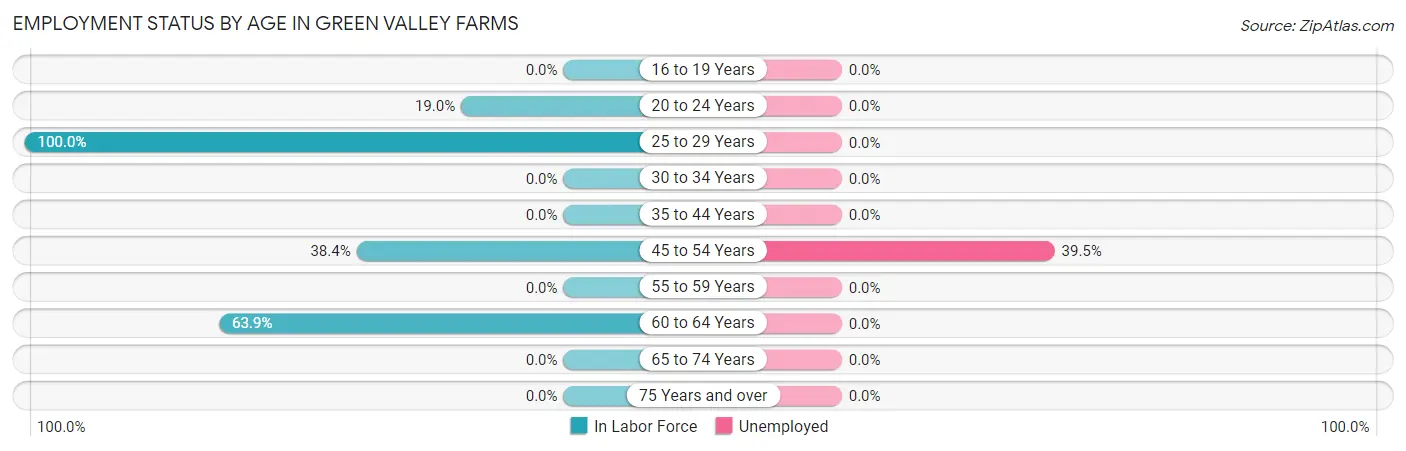
| Age Bracket | In Labor Force | Unemployed |
| 16 to 19 Years | 0 (0.0%) | 0 (0.0%) |
| 20 to 24 Years | 16 (19.0%) | 0 (0.0%) |
| 25 to 29 Years | 73 (100.0%) | 0 (0.0%) |
| 30 to 34 Years | 0 (0.0%) | 0 (0.0%) |
| 35 to 44 Years | 0 (0.0%) | 0 (0.0%) |
| 45 to 54 Years | 43 (38.4%) | 17 (39.5%) |
| 55 to 59 Years | 0 (0.0%) | 0 (0.0%) |
| 60 to 64 Years | 53 (63.9%) | 0 (0.0%) |
| 65 to 74 Years | 0 (0.0%) | 0 (0.0%) |
| 75 Years and over | 0 (0.0%) | 0 (0.0%) |
| Total | 185 (41.2%) | 17 (9.2%) |
Employment Status by Educational Attainment in Green Valley Farms
According to labor force statistics for Green Valley Farms, 56.9% of individuals (169) out of the total population between 25 and 64 years of age (297) are in the labor force, with 10.1% or 17 of them being unemployed. The group with the highest labor force participation rate are those with the educational attainment of college / associate degree, with 100.0% or 105 individuals in the labor force. Within the labor force, individuals with college / associate degree education have the highest percentage of unemployment, with 16.2% or 17 of them being unemployed.
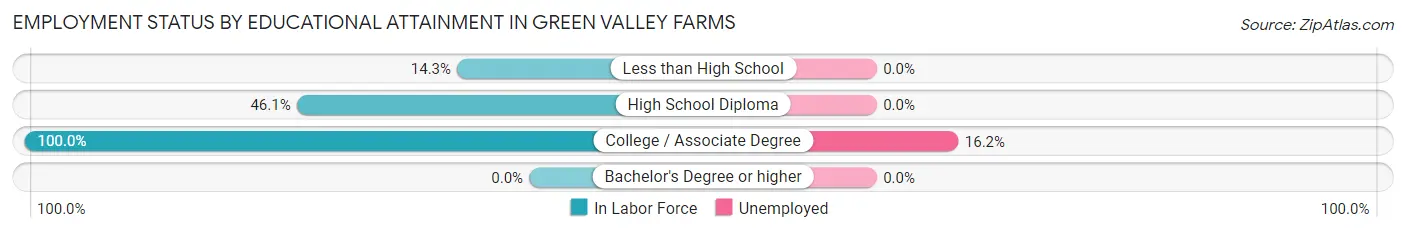
| Educational Attainment | In Labor Force | Unemployed |
| Less than High School | 11 (14.3%) | 0 (0.0%) |
| High School Diploma | 53 (46.1%) | 0 (0.0%) |
| College / Associate Degree | 105 (100.0%) | 17 (16.2%) |
| Bachelor's Degree or higher | 0 (0.0%) | 0 (0.0%) |
| Total | 169 (56.9%) | 30 (10.1%) |
Employment Occupations by Sex in Green Valley Farms
Management, Business, Science and Arts Occupations
The most common Management, Business, Science and Arts occupations in Green Valley Farms are , and Business & Financial (16 | 9.5%).
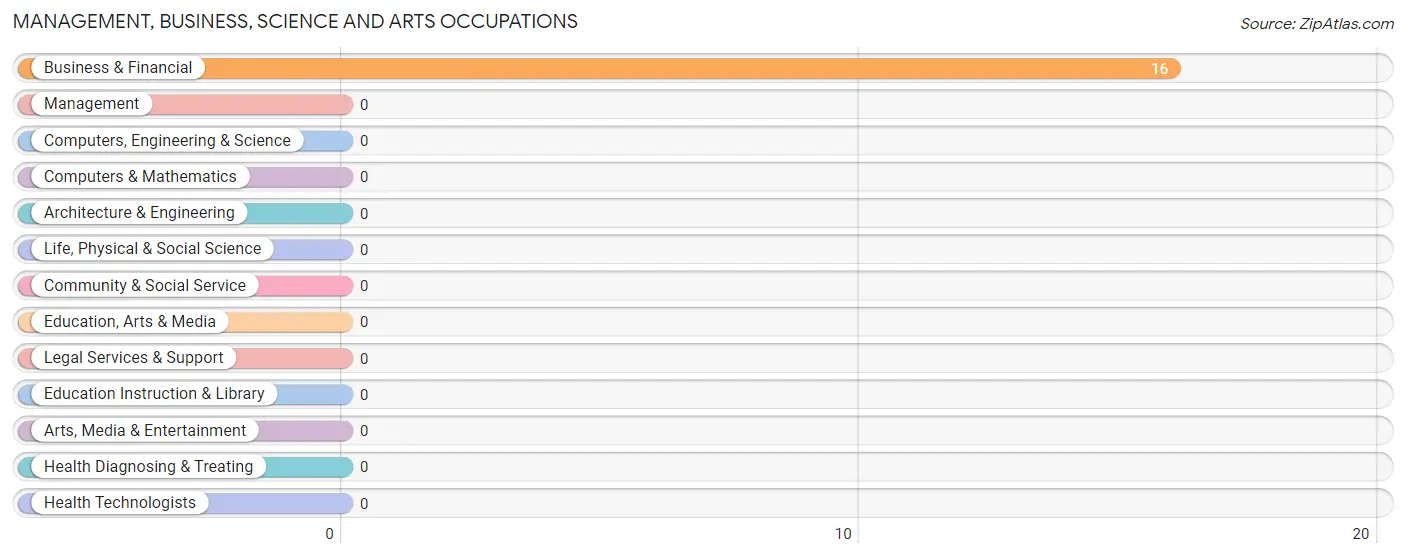
Management, Business, Science and Arts Occupations by Sex
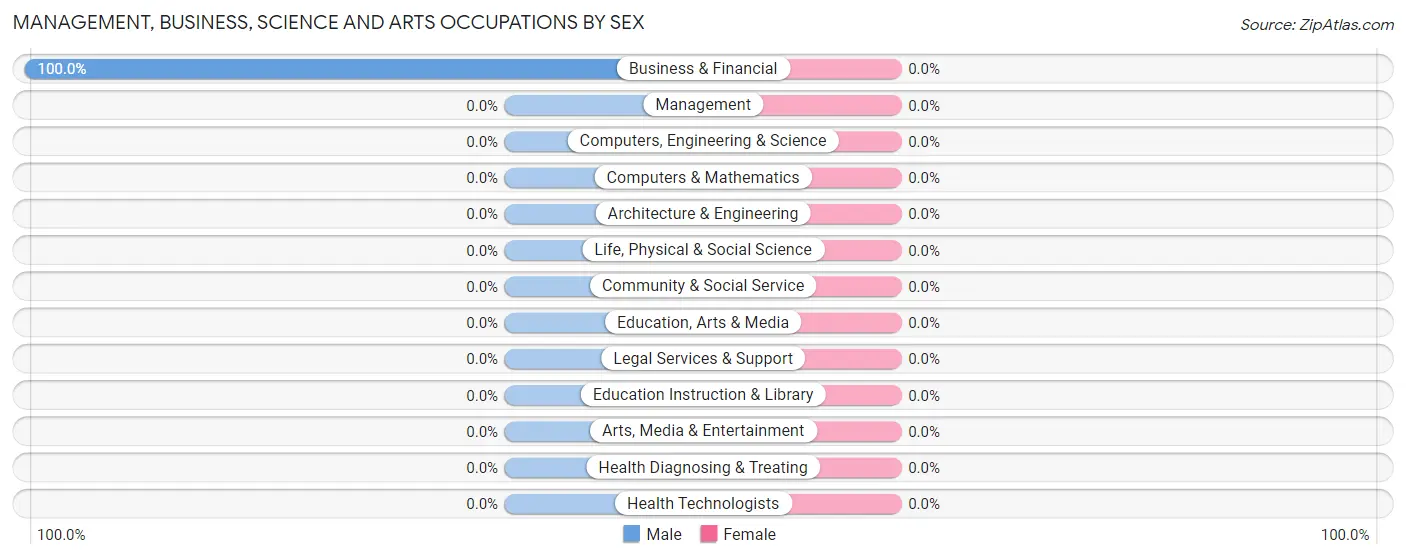
| Occupation | Male | Female |
| Management | 0 (0.0%) | 0 (0.0%) |
| Business & Financial | 16 (100.0%) | 0 (0.0%) |
| Computers, Engineering & Science | 0 (0.0%) | 0 (0.0%) |
| Computers & Mathematics | 0 (0.0%) | 0 (0.0%) |
| Architecture & Engineering | 0 (0.0%) | 0 (0.0%) |
| Life, Physical & Social Science | 0 (0.0%) | 0 (0.0%) |
| Community & Social Service | 0 (0.0%) | 0 (0.0%) |
| Education, Arts & Media | 0 (0.0%) | 0 (0.0%) |
| Legal Services & Support | 0 (0.0%) | 0 (0.0%) |
| Education Instruction & Library | 0 (0.0%) | 0 (0.0%) |
| Arts, Media & Entertainment | 0 (0.0%) | 0 (0.0%) |
| Health Diagnosing & Treating | 0 (0.0%) | 0 (0.0%) |
| Health Technologists | 0 (0.0%) | 0 (0.0%) |
| Total (Category) | 16 (100.0%) | 0 (0.0%) |
| Total (Overall) | 100 (59.5%) | 68 (40.5%) |
Services Occupations
Services Occupations by Sex
| Occupation | Male | Female |
| Healthcare Support | 0 (0.0%) | 0 (0.0%) |
| Security & Protection | 0 (0.0%) | 0 (0.0%) |
| Firefighting & Prevention | 0 (0.0%) | 0 (0.0%) |
| Law Enforcement | 0 (0.0%) | 0 (0.0%) |
| Food Preparation & Serving | 0 (0.0%) | 0 (0.0%) |
| Cleaning & Maintenance | 0 (0.0%) | 0 (0.0%) |
| Personal Care & Service | 0 (0.0%) | 0 (0.0%) |
| Total (Category) | 0 (0.0%) | 0 (0.0%) |
| Total (Overall) | 100 (59.5%) | 68 (40.5%) |
Sales and Office Occupations
The most common Sales and Office occupations in Green Valley Farms are , and Office & Administration (88 | 52.4%).
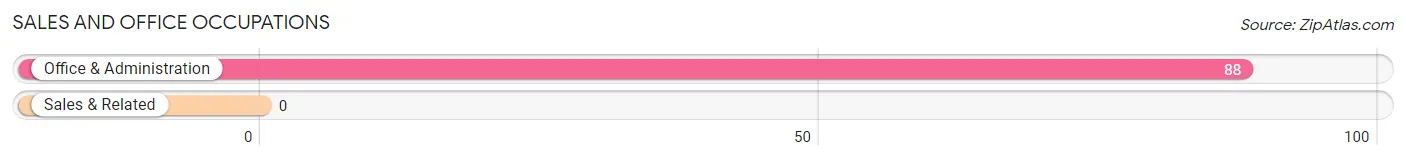
Sales and Office Occupations by Sex

| Occupation | Male | Female |
| Sales & Related | 0 (0.0%) | 0 (0.0%) |
| Office & Administration | 73 (83.0%) | 15 (17.1%) |
| Total (Category) | 73 (83.0%) | 15 (17.1%) |
| Total (Overall) | 100 (59.5%) | 68 (40.5%) |
Natural Resources, Construction and Maintenance Occupations
Natural Resources, Construction and Maintenance Occupations by Sex
| Occupation | Male | Female |
| Farming, Fishing & Forestry | 0 (0.0%) | 0 (0.0%) |
| Construction & Extraction | 0 (0.0%) | 0 (0.0%) |
| Installation, Maintenance & Repair | 0 (0.0%) | 0 (0.0%) |
| Total (Category) | 0 (0.0%) | 0 (0.0%) |
| Total (Overall) | 100 (59.5%) | 68 (40.5%) |
Production, Transportation and Moving Occupations
The most common Production, Transportation and Moving occupations in Green Valley Farms are Material Moving (53 | 31.6%), and Transportation (11 | 6.6%).
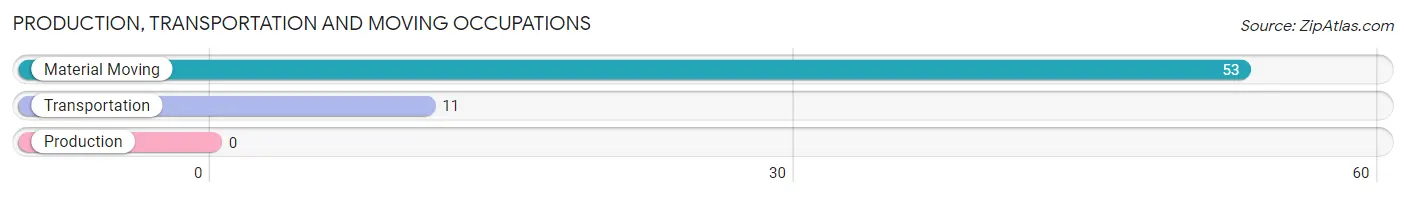
Production, Transportation and Moving Occupations by Sex
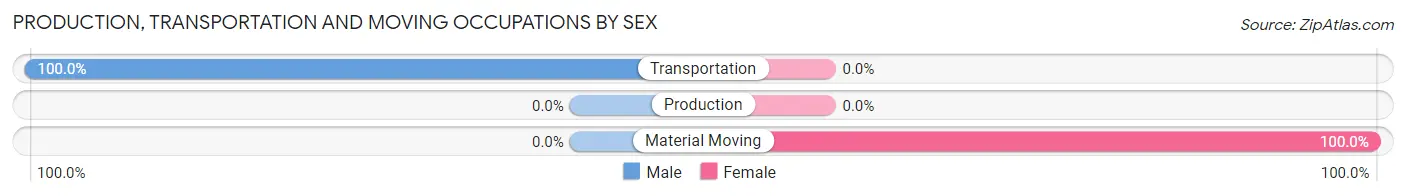
| Occupation | Male | Female |
| Production | 0 (0.0%) | 0 (0.0%) |
| Transportation | 11 (100.0%) | 0 (0.0%) |
| Material Moving | 0 (0.0%) | 53 (100.0%) |
| Total (Category) | 11 (17.2%) | 53 (82.8%) |
| Total (Overall) | 100 (59.5%) | 68 (40.5%) |
Employment Industries by Sex in Green Valley Farms
Employment Industries in Green Valley Farms
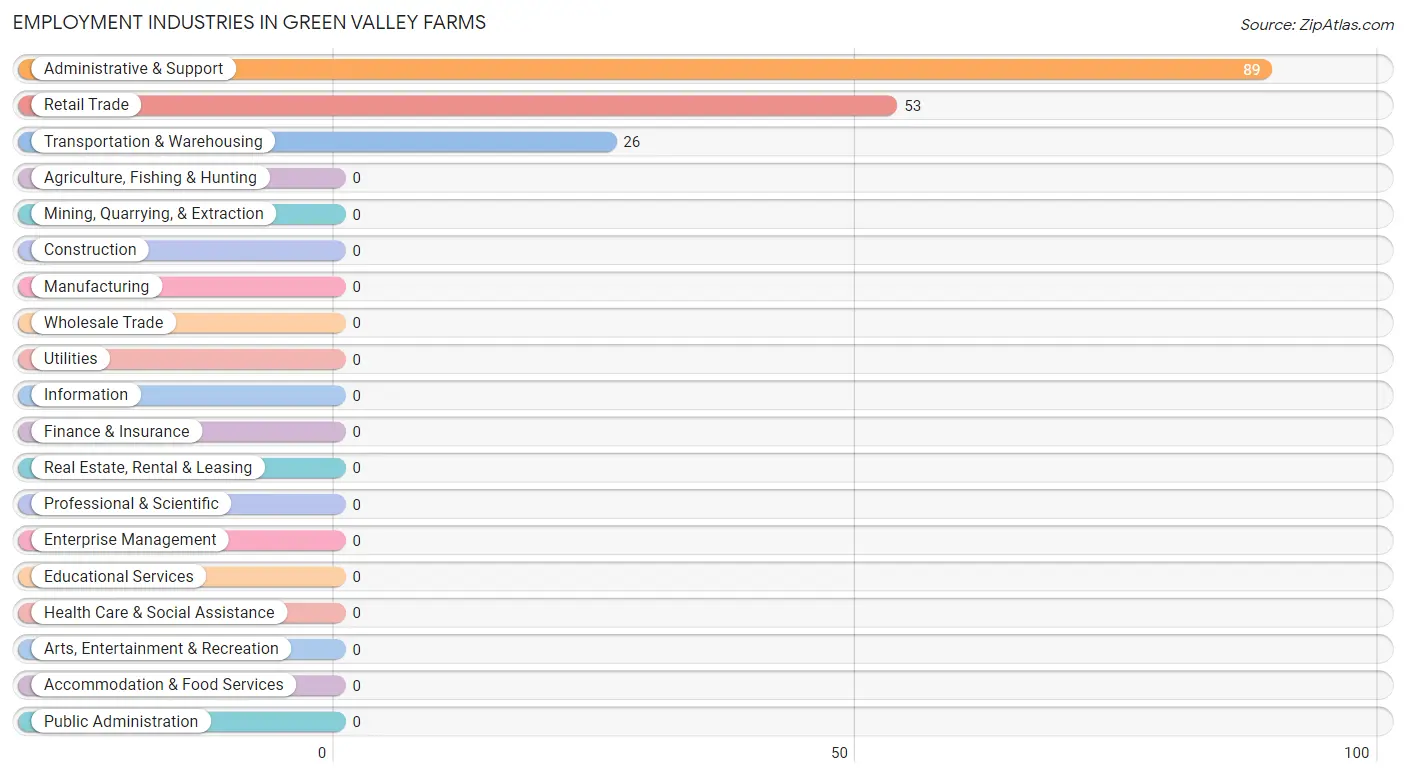
The major employment industries in Green Valley Farms include Administrative & Support (89 | 53.0%), Retail Trade (53 | 31.6%), and Transportation & Warehousing (26 | 15.5%).
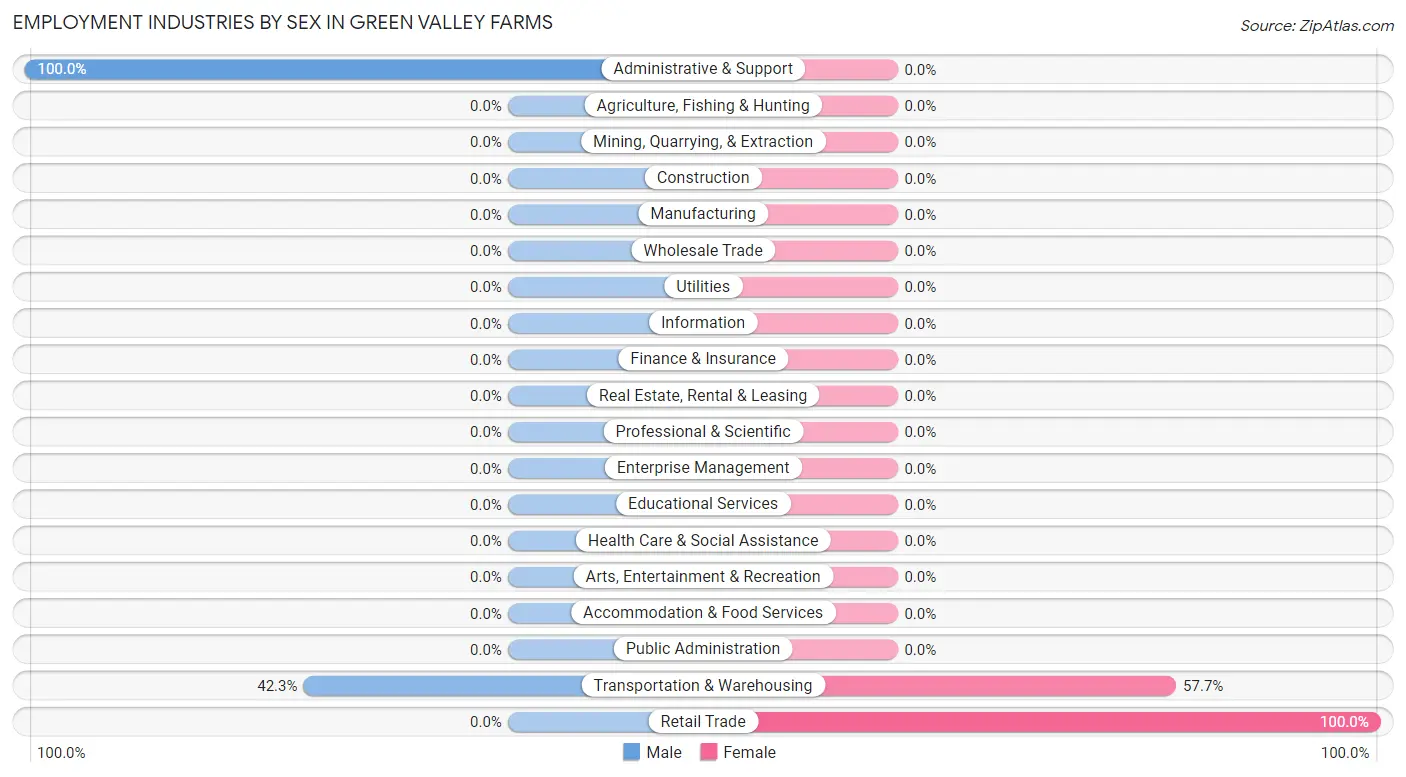
Employment Industries by Sex in Green Valley Farms
The Green Valley Farms industries that see more men than women are Administrative & Support (100.0%), and Transportation & Warehousing (42.3%), whereas the industries that tend to have a higher number of women are Retail Trade (100.0%), and Transportation & Warehousing (57.7%).
| Industry | Male | Female |
| Agriculture, Fishing & Hunting | 0 (0.0%) | 0 (0.0%) |
| Mining, Quarrying, & Extraction | 0 (0.0%) | 0 (0.0%) |
| Construction | 0 (0.0%) | 0 (0.0%) |
| Manufacturing | 0 (0.0%) | 0 (0.0%) |
| Wholesale Trade | 0 (0.0%) | 0 (0.0%) |
| Retail Trade | 0 (0.0%) | 53 (100.0%) |
| Transportation & Warehousing | 11 (42.3%) | 15 (57.7%) |
| Utilities | 0 (0.0%) | 0 (0.0%) |
| Information | 0 (0.0%) | 0 (0.0%) |
| Finance & Insurance | 0 (0.0%) | 0 (0.0%) |
| Real Estate, Rental & Leasing | 0 (0.0%) | 0 (0.0%) |
| Professional & Scientific | 0 (0.0%) | 0 (0.0%) |
| Enterprise Management | 0 (0.0%) | 0 (0.0%) |
| Administrative & Support | 89 (100.0%) | 0 (0.0%) |
| Educational Services | 0 (0.0%) | 0 (0.0%) |
| Health Care & Social Assistance | 0 (0.0%) | 0 (0.0%) |
| Arts, Entertainment & Recreation | 0 (0.0%) | 0 (0.0%) |
| Accommodation & Food Services | 0 (0.0%) | 0 (0.0%) |
| Public Administration | 0 (0.0%) | 0 (0.0%) |
| Total | 100 (59.5%) | 68 (40.5%) |
Education in Green Valley Farms
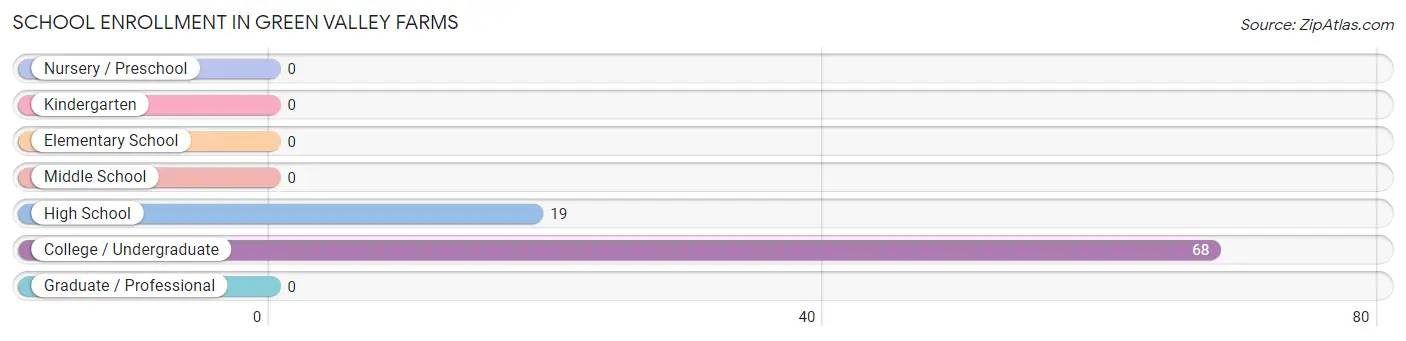
School Enrollment in Green Valley Farms
The most common levels of schooling among the 87 students in Green Valley Farms are college / undergraduate (68 | 78.2%), and high school (19 | 21.8%).
| School Level | # Students | % Students |
| Nursery / Preschool | 0 | 0.0% |
| Kindergarten | 0 | 0.0% |
| Elementary School | 0 | 0.0% |
| Middle School | 0 | 0.0% |
| High School | 19 | 21.8% |
| College / Undergraduate | 68 | 78.2% |
| Graduate / Professional | 0 | 0.0% |
| Total | 87 | 100.0% |
School Enrollment by Age by Funding Source in Green Valley Farms
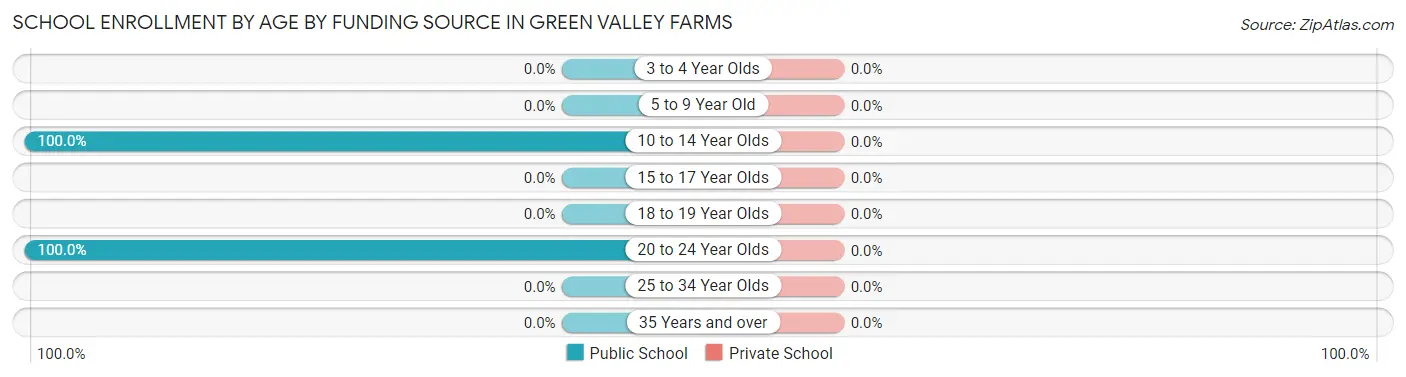
| Age Bracket | Public School | Private School |
| 3 to 4 Year Olds | 0 (0.0%) | 0 (0.0%) |
| 5 to 9 Year Old | 0 (0.0%) | 0 (0.0%) |
| 10 to 14 Year Olds | 19 (100.0%) | 0 (0.0%) |
| 15 to 17 Year Olds | 0 (0.0%) | 0 (0.0%) |
| 18 to 19 Year Olds | 0 (0.0%) | 0 (0.0%) |
| 20 to 24 Year Olds | 68 (100.0%) | 0 (0.0%) |
| 25 to 34 Year Olds | 0 (0.0%) | 0 (0.0%) |
| 35 Years and over | 0 (0.0%) | 0 (0.0%) |
| Total | 87 (100.0%) | 0 (0.0%) |
Educational Attainment by Field of Study in Green Valley Farms
| Field of Study | # Graduates | % Graduates |
| Computers & Mathematics | 0 | 0.0% |
| Bio, Nature & Agricultural | 0 | 0.0% |
| Physical & Health Sciences | 0 | 0.0% |
| Psychology | 0 | 0.0% |
| Social Sciences | 0 | 0.0% |
| Engineering | 0 | 0.0% |
| Multidisciplinary Studies | 0 | 0.0% |
| Science & Technology | 0 | 0.0% |
| Business | 0 | 0.0% |
| Education | 0 | 0.0% |
| Literature & Languages | 0 | 0.0% |
| Liberal Arts & History | 0 | 0.0% |
| Visual & Performing Arts | 0 | 0.0% |
| Communications | 0 | 0.0% |
| Arts & Humanities | 0 | 0.0% |
| Total | 0 | 0.0% |
Transportation & Commute in Green Valley Farms
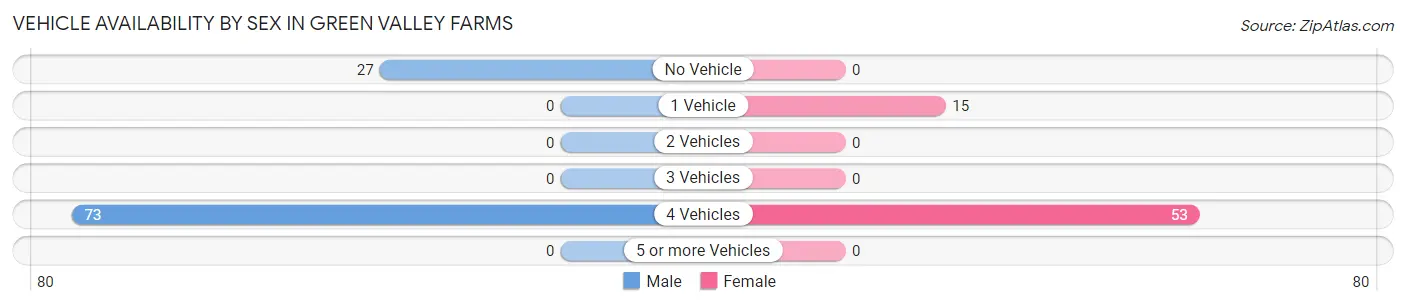
Vehicle Availability by Sex in Green Valley Farms
The most prevalent vehicle ownership categories in Green Valley Farms are males with 4 vehicles (73, accounting for 73.0%) and females with 4 vehicles (53, making up 107.3%).
| Vehicles Available | Male | Female |
| No Vehicle | 27 (27.0%) | 0 (0.0%) |
| 1 Vehicle | 0 (0.0%) | 15 (22.1%) |
| 2 Vehicles | 0 (0.0%) | 0 (0.0%) |
| 3 Vehicles | 0 (0.0%) | 0 (0.0%) |
| 4 Vehicles | 73 (73.0%) | 53 (77.9%) |
| 5 or more Vehicles | 0 (0.0%) | 0 (0.0%) |
| Total | 100 (100.0%) | 68 (100.0%) |
Commute Time in Green Valley Farms
The most frequently occuring commute durations in Green Valley Farms are 10 to 14 minutes (73 commuters, 43.4%), 20 to 24 minutes (64 commuters, 38.1%), and 25 to 29 minutes (16 commuters, 9.5%).
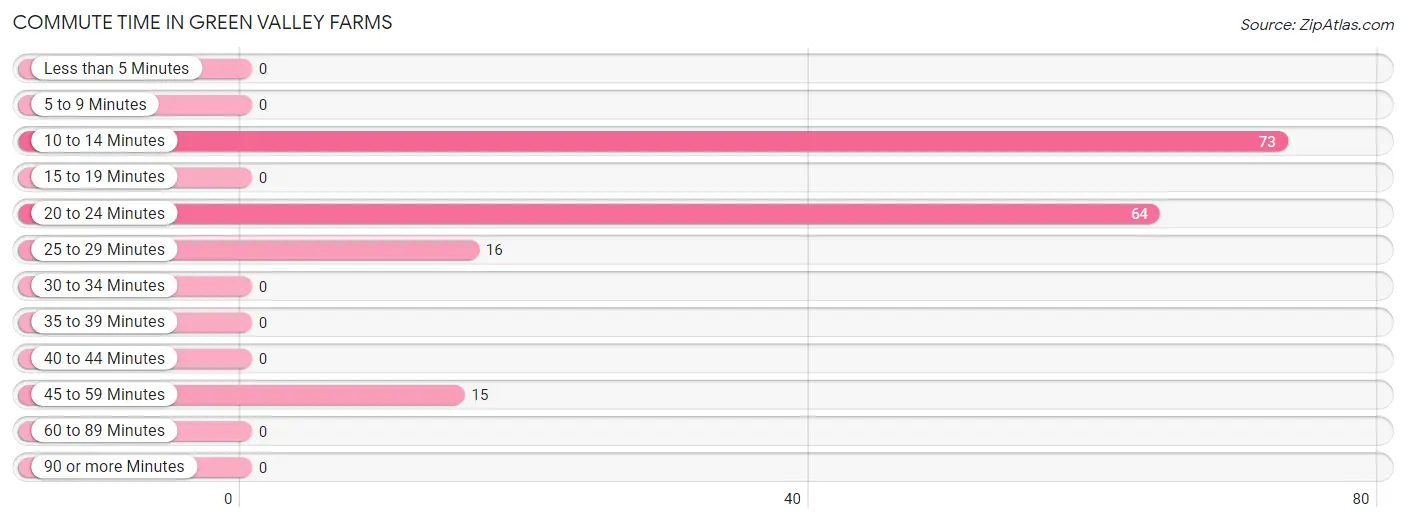
| Commute Time | # Commuters | % Commuters |
| Less than 5 Minutes | 0 | 0.0% |
| 5 to 9 Minutes | 0 | 0.0% |
| 10 to 14 Minutes | 73 | 43.4% |
| 15 to 19 Minutes | 0 | 0.0% |
| 20 to 24 Minutes | 64 | 38.1% |
| 25 to 29 Minutes | 16 | 9.5% |
| 30 to 34 Minutes | 0 | 0.0% |
| 35 to 39 Minutes | 0 | 0.0% |
| 40 to 44 Minutes | 0 | 0.0% |
| 45 to 59 Minutes | 15 | 8.9% |
| 60 to 89 Minutes | 0 | 0.0% |
| 90 or more Minutes | 0 | 0.0% |
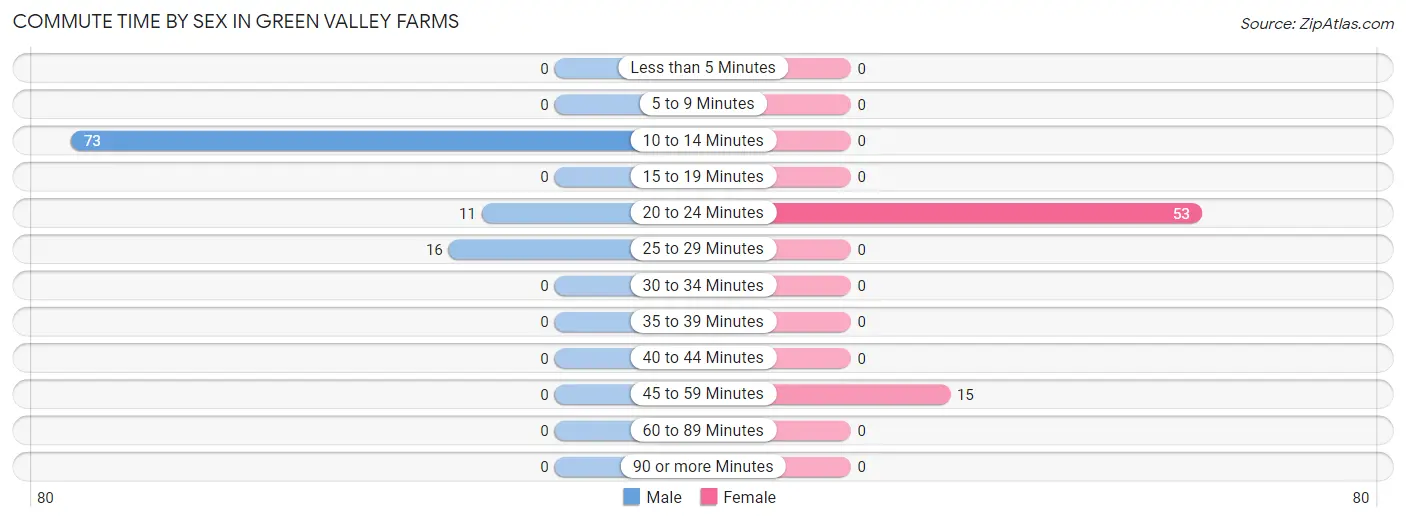
Commute Time by Sex in Green Valley Farms
The most common commute times in Green Valley Farms are 10 to 14 minutes (73 commuters, 73.0%) for males and 20 to 24 minutes (53 commuters, 77.9%) for females.
| Commute Time | Male | Female |
| Less than 5 Minutes | 0 (0.0%) | 0 (0.0%) |
| 5 to 9 Minutes | 0 (0.0%) | 0 (0.0%) |
| 10 to 14 Minutes | 73 (73.0%) | 0 (0.0%) |
| 15 to 19 Minutes | 0 (0.0%) | 0 (0.0%) |
| 20 to 24 Minutes | 11 (11.0%) | 53 (77.9%) |
| 25 to 29 Minutes | 16 (16.0%) | 0 (0.0%) |
| 30 to 34 Minutes | 0 (0.0%) | 0 (0.0%) |
| 35 to 39 Minutes | 0 (0.0%) | 0 (0.0%) |
| 40 to 44 Minutes | 0 (0.0%) | 0 (0.0%) |
| 45 to 59 Minutes | 0 (0.0%) | 15 (22.1%) |
| 60 to 89 Minutes | 0 (0.0%) | 0 (0.0%) |
| 90 or more Minutes | 0 (0.0%) | 0 (0.0%) |
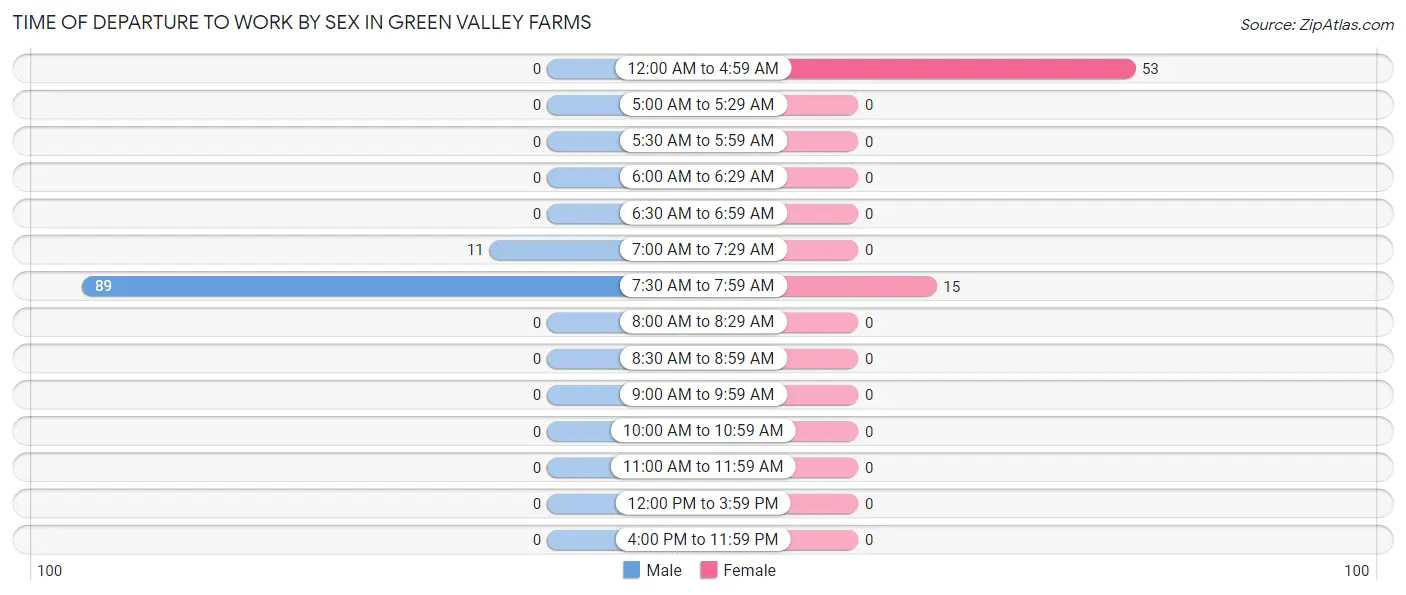
Time of Departure to Work by Sex in Green Valley Farms
The most frequent times of departure to work in Green Valley Farms are 7:30 AM to 7:59 AM (89, 89.0%) for males and 12:00 AM to 4:59 AM (53, 77.9%) for females.
| Time of Departure | Male | Female |
| 12:00 AM to 4:59 AM | 0 (0.0%) | 53 (77.9%) |
| 5:00 AM to 5:29 AM | 0 (0.0%) | 0 (0.0%) |
| 5:30 AM to 5:59 AM | 0 (0.0%) | 0 (0.0%) |
| 6:00 AM to 6:29 AM | 0 (0.0%) | 0 (0.0%) |
| 6:30 AM to 6:59 AM | 0 (0.0%) | 0 (0.0%) |
| 7:00 AM to 7:29 AM | 11 (11.0%) | 0 (0.0%) |
| 7:30 AM to 7:59 AM | 89 (89.0%) | 15 (22.1%) |
| 8:00 AM to 8:29 AM | 0 (0.0%) | 0 (0.0%) |
| 8:30 AM to 8:59 AM | 0 (0.0%) | 0 (0.0%) |
| 9:00 AM to 9:59 AM | 0 (0.0%) | 0 (0.0%) |
| 10:00 AM to 10:59 AM | 0 (0.0%) | 0 (0.0%) |
| 11:00 AM to 11:59 AM | 0 (0.0%) | 0 (0.0%) |
| 12:00 PM to 3:59 PM | 0 (0.0%) | 0 (0.0%) |
| 4:00 PM to 11:59 PM | 0 (0.0%) | 0 (0.0%) |
| Total | 100 (100.0%) | 68 (100.0%) |
Housing Occupancy in Green Valley Farms
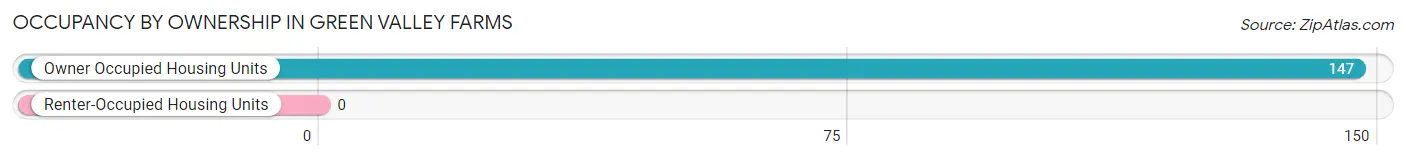
Occupancy by Ownership in Green Valley Farms
Of the total 147 dwellings in Green Valley Farms, owner-occupied units account for 147 (100.0%), while renter-occupied units make up 0 (0.0%).
| Occupancy | # Housing Units | % Housing Units |
| Owner Occupied Housing Units | 147 | 100.0% |
| Renter-Occupied Housing Units | 0 | 0.0% |
| Total Occupied Housing Units | 147 | 100.0% |
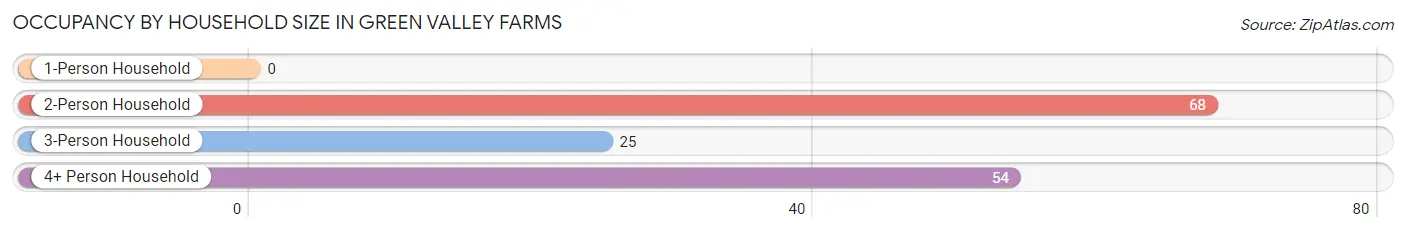
Occupancy by Household Size in Green Valley Farms
| Household Size | # Housing Units | % Housing Units |
| 1-Person Household | 0 | 0.0% |
| 2-Person Household | 68 | 46.3% |
| 3-Person Household | 25 | 17.0% |
| 4+ Person Household | 54 | 36.7% |
| Total Housing Units | 147 | 100.0% |
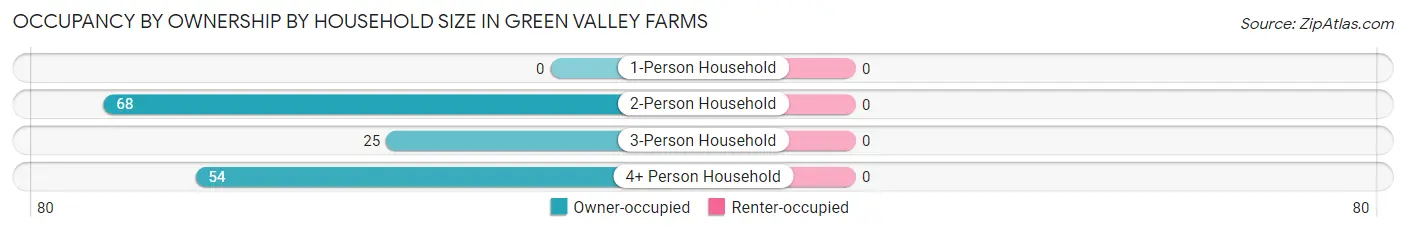
Occupancy by Ownership by Household Size in Green Valley Farms
| Household Size | Owner-occupied | Renter-occupied |
| 1-Person Household | 0 (0.0%) | 0 (0.0%) |
| 2-Person Household | 68 (100.0%) | 0 (0.0%) |
| 3-Person Household | 25 (100.0%) | 0 (0.0%) |
| 4+ Person Household | 54 (100.0%) | 0 (0.0%) |
| Total Housing Units | 147 (100.0%) | 0 (0.0%) |
Occupancy by Educational Attainment in Green Valley Farms
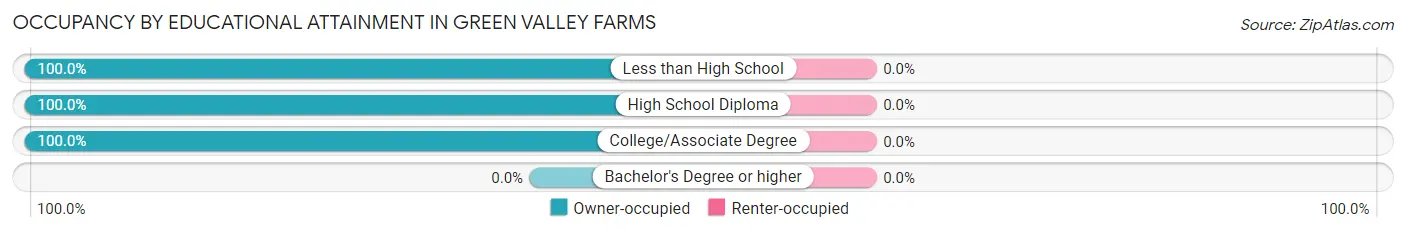
| Household Size | Owner-occupied | Renter-occupied |
| Less than High School | 46 (100.0%) | 0 (0.0%) |
| High School Diploma | 86 (100.0%) | 0 (0.0%) |
| College/Associate Degree | 15 (100.0%) | 0 (0.0%) |
| Bachelor's Degree or higher | 0 (0.0%) | 0 (0.0%) |
Occupancy by Age of Householder in Green Valley Farms
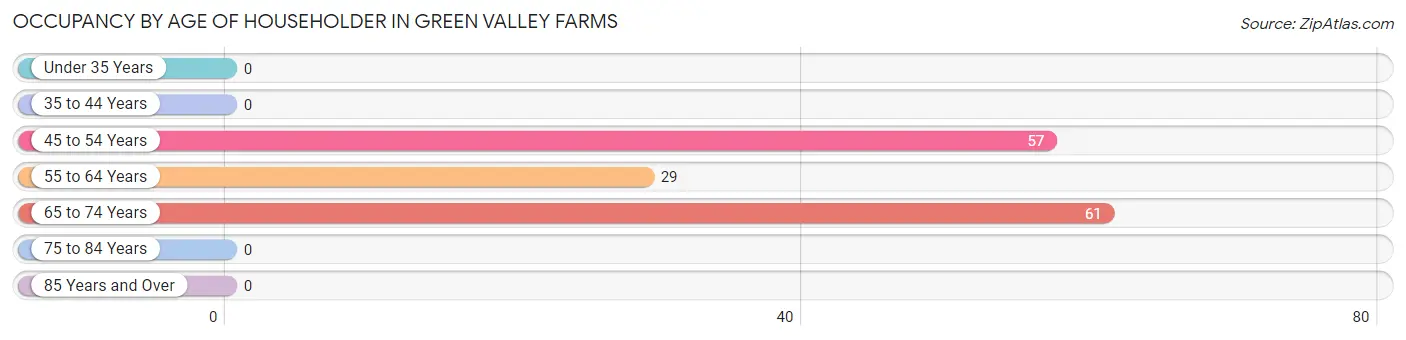
| Age Bracket | # Households | % Households |
| Under 35 Years | 0 | 0.0% |
| 35 to 44 Years | 0 | 0.0% |
| 45 to 54 Years | 57 | 38.8% |
| 55 to 64 Years | 29 | 19.7% |
| 65 to 74 Years | 61 | 41.5% |
| 75 to 84 Years | 0 | 0.0% |
| 85 Years and Over | 0 | 0.0% |
| Total | 147 | 100.0% |
Housing Finances in Green Valley Farms
Median Income by Occupancy in Green Valley Farms
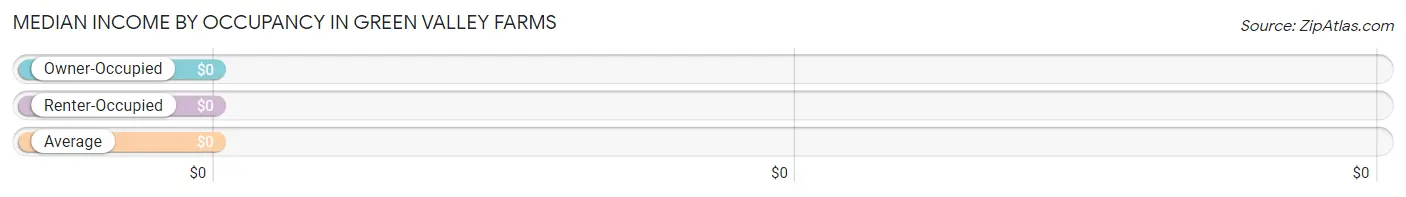
| Occupancy Type | # Households | Median Income |
| Owner-Occupied | 147 (100.0%) | $0 |
| Renter-Occupied | 0 (0.0%) | $0 |
| Average | 147 (100.0%) | $0 |
Occupancy by Householder Income Bracket in Green Valley Farms
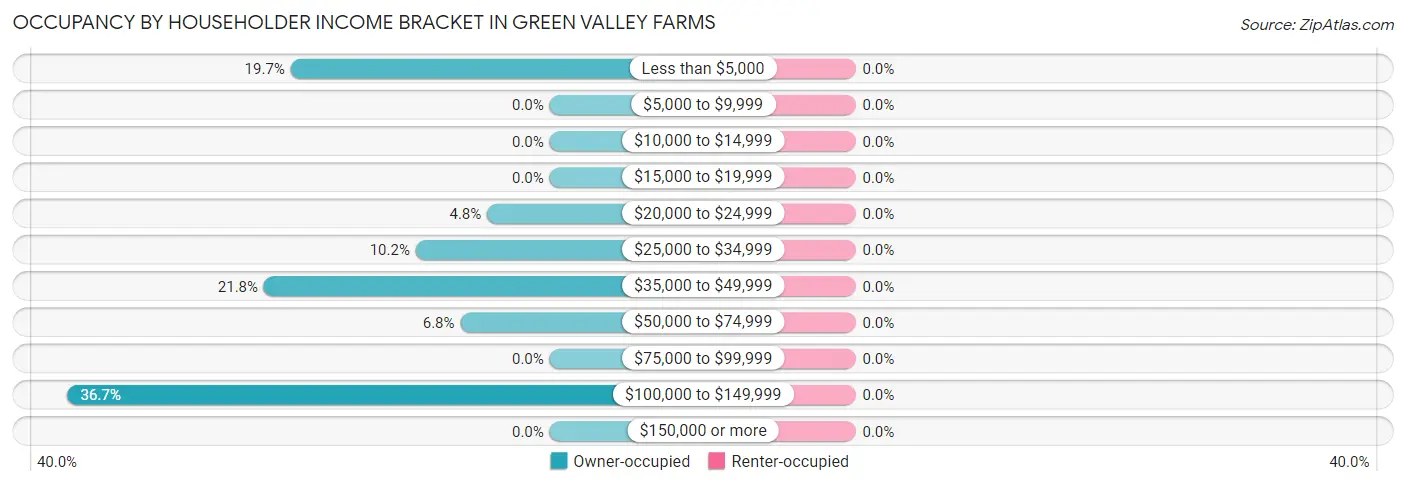
| Income Bracket | Owner-occupied | Renter-occupied |
| Less than $5,000 | 29 (19.7%) | 0 (0.0%) |
| $5,000 to $9,999 | 0 (0.0%) | 0 (0.0%) |
| $10,000 to $14,999 | 0 (0.0%) | 0 (0.0%) |
| $15,000 to $19,999 | 0 (0.0%) | 0 (0.0%) |
| $20,000 to $24,999 | 7 (4.8%) | 0 (0.0%) |
| $25,000 to $34,999 | 15 (10.2%) | 0 (0.0%) |
| $35,000 to $49,999 | 32 (21.8%) | 0 (0.0%) |
| $50,000 to $74,999 | 10 (6.8%) | 0 (0.0%) |
| $75,000 to $99,999 | 0 (0.0%) | 0 (0.0%) |
| $100,000 to $149,999 | 54 (36.7%) | 0 (0.0%) |
| $150,000 or more | 0 (0.0%) | 0 (0.0%) |
| Total | 147 (100.0%) | 0 (0.0%) |
Monthly Housing Cost Tiers in Green Valley Farms
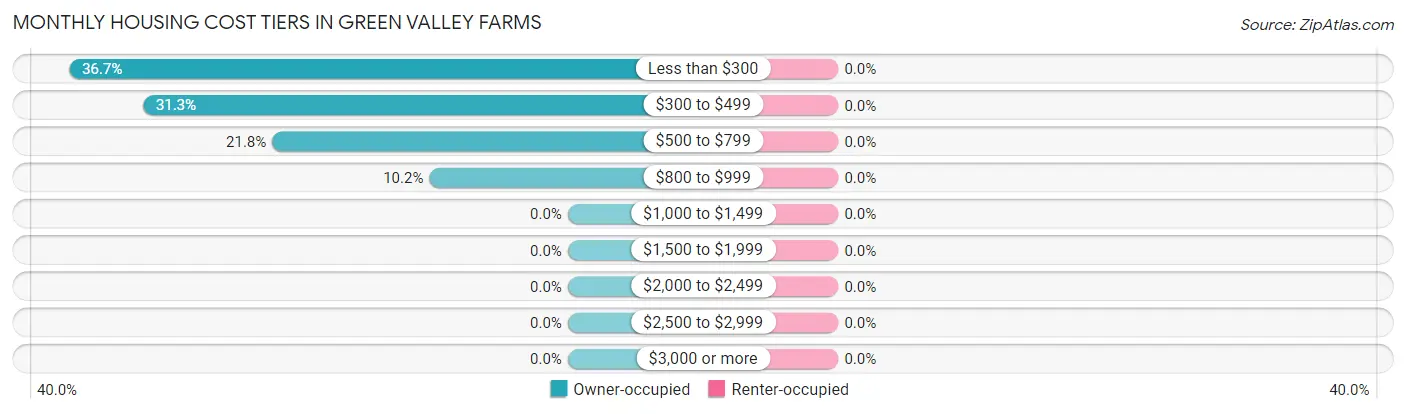
| Monthly Cost | Owner-occupied | Renter-occupied |
| Less than $300 | 54 (36.7%) | 0 (0.0%) |
| $300 to $499 | 46 (31.3%) | 0 (0.0%) |
| $500 to $799 | 32 (21.8%) | 0 (0.0%) |
| $800 to $999 | 15 (10.2%) | 0 (0.0%) |
| $1,000 to $1,499 | 0 (0.0%) | 0 (0.0%) |
| $1,500 to $1,999 | 0 (0.0%) | 0 (0.0%) |
| $2,000 to $2,499 | 0 (0.0%) | 0 (0.0%) |
| $2,500 to $2,999 | 0 (0.0%) | 0 (0.0%) |
| $3,000 or more | 0 (0.0%) | 0 (0.0%) |
| Total | 147 (100.0%) | 0 (0.0%) |
Physical Housing Characteristics in Green Valley Farms
Housing Structures in Green Valley Farms
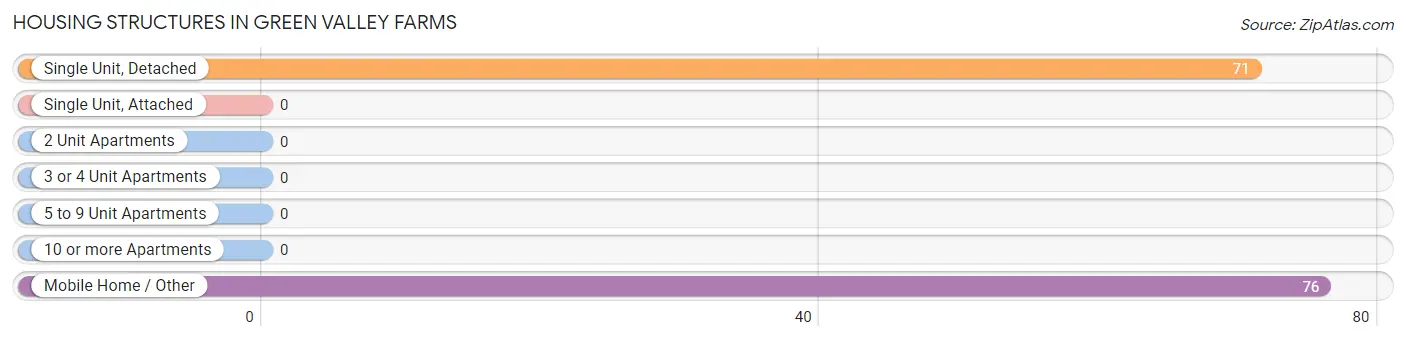
| Structure Type | # Housing Units | % Housing Units |
| Single Unit, Detached | 71 | 48.3% |
| Single Unit, Attached | 0 | 0.0% |
| 2 Unit Apartments | 0 | 0.0% |
| 3 or 4 Unit Apartments | 0 | 0.0% |
| 5 to 9 Unit Apartments | 0 | 0.0% |
| 10 or more Apartments | 0 | 0.0% |
| Mobile Home / Other | 76 | 51.7% |
| Total | 147 | 100.0% |
Housing Structures by Occupancy in Green Valley Farms
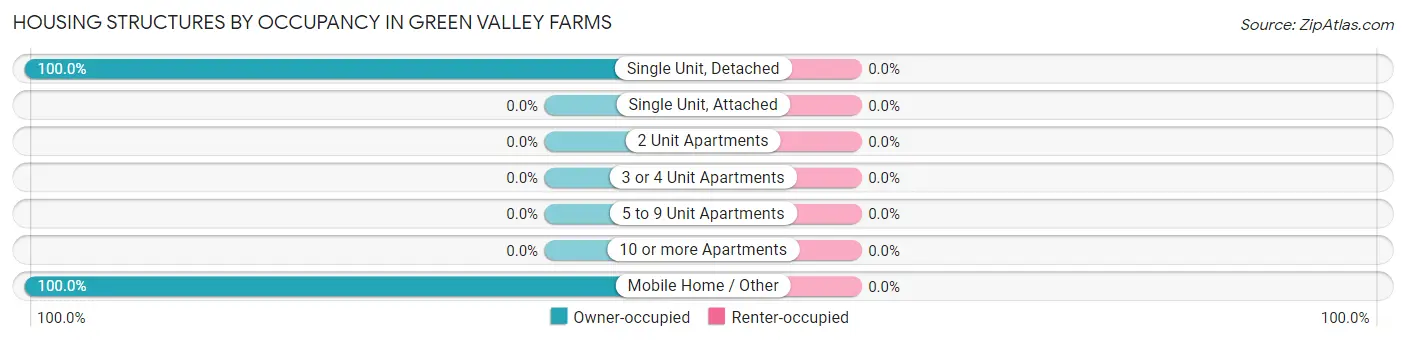
| Structure Type | Owner-occupied | Renter-occupied |
| Single Unit, Detached | 71 (100.0%) | 0 (0.0%) |
| Single Unit, Attached | 0 (0.0%) | 0 (0.0%) |
| 2 Unit Apartments | 0 (0.0%) | 0 (0.0%) |
| 3 or 4 Unit Apartments | 0 (0.0%) | 0 (0.0%) |
| 5 to 9 Unit Apartments | 0 (0.0%) | 0 (0.0%) |
| 10 or more Apartments | 0 (0.0%) | 0 (0.0%) |
| Mobile Home / Other | 76 (100.0%) | 0 (0.0%) |
| Total | 147 (100.0%) | 0 (0.0%) |
Housing Structures by Number of Rooms in Green Valley Farms
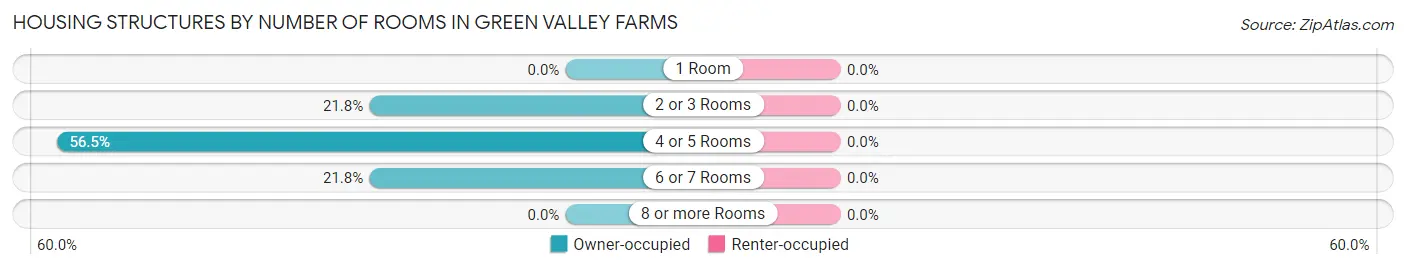
| Number of Rooms | Owner-occupied | Renter-occupied |
| 1 Room | 0 (0.0%) | 0 (0.0%) |
| 2 or 3 Rooms | 32 (21.8%) | 0 (0.0%) |
| 4 or 5 Rooms | 83 (56.5%) | 0 (0.0%) |
| 6 or 7 Rooms | 32 (21.8%) | 0 (0.0%) |
| 8 or more Rooms | 0 (0.0%) | 0 (0.0%) |
| Total | 147 (100.0%) | 0 (0.0%) |
Housing Structure by Heating Type in Green Valley Farms
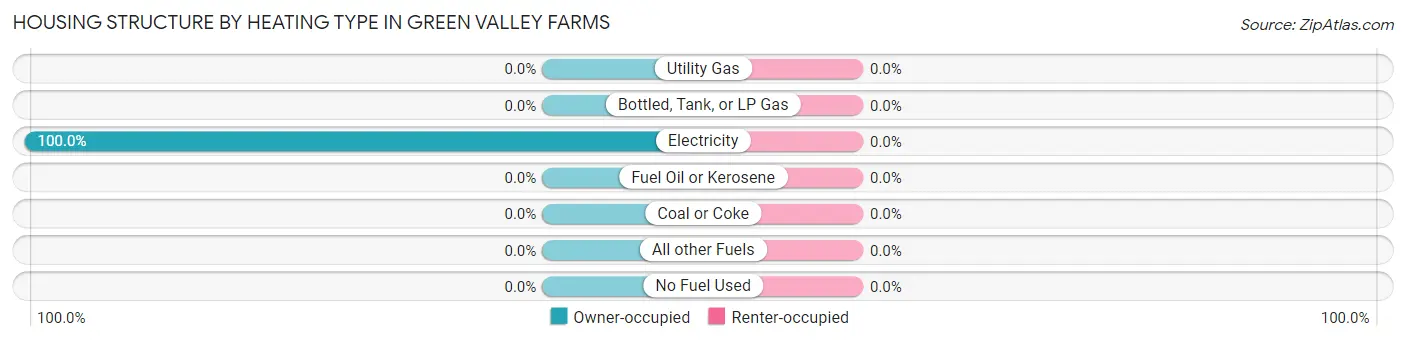
| Heating Type | Owner-occupied | Renter-occupied |
| Utility Gas | 0 (0.0%) | 0 (0.0%) |
| Bottled, Tank, or LP Gas | 0 (0.0%) | 0 (0.0%) |
| Electricity | 147 (100.0%) | 0 (0.0%) |
| Fuel Oil or Kerosene | 0 (0.0%) | 0 (0.0%) |
| Coal or Coke | 0 (0.0%) | 0 (0.0%) |
| All other Fuels | 0 (0.0%) | 0 (0.0%) |
| No Fuel Used | 0 (0.0%) | 0 (0.0%) |
| Total | 147 (100.0%) | 0 (0.0%) |
Household Vehicle Usage in Green Valley Farms
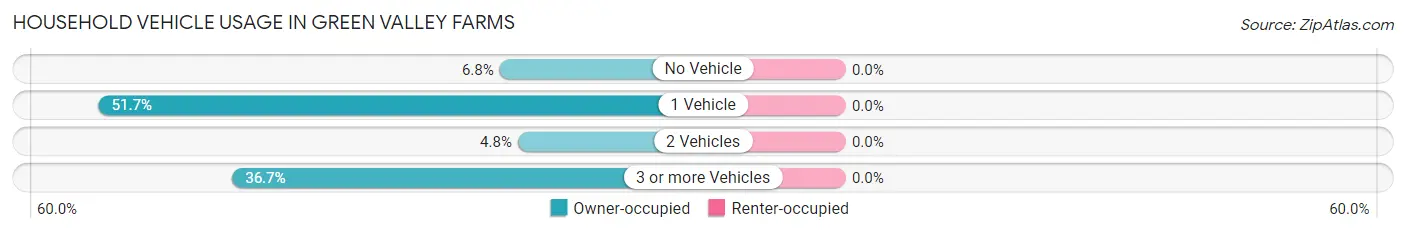
| Vehicles per Household | Owner-occupied | Renter-occupied |
| No Vehicle | 10 (6.8%) | 0 (0.0%) |
| 1 Vehicle | 76 (51.7%) | 0 (0.0%) |
| 2 Vehicles | 7 (4.8%) | 0 (0.0%) |
| 3 or more Vehicles | 54 (36.7%) | 0 (0.0%) |
| Total | 147 (100.0%) | 0 (0.0%) |
Real Estate & Mortgages in Green Valley Farms
Real Estate and Mortgage Overview in Green Valley Farms
| Characteristic | Without Mortgage | With Mortgage |
| Housing Units | 100 | 47 |
| Median Property Value | $49,300 | $0 |
| Median Household Income | - | - |
| Monthly Housing Costs | $246 | $0 |
| Real Estate Taxes | $382 | $0 |
Property Value by Mortgage Status in Green Valley Farms
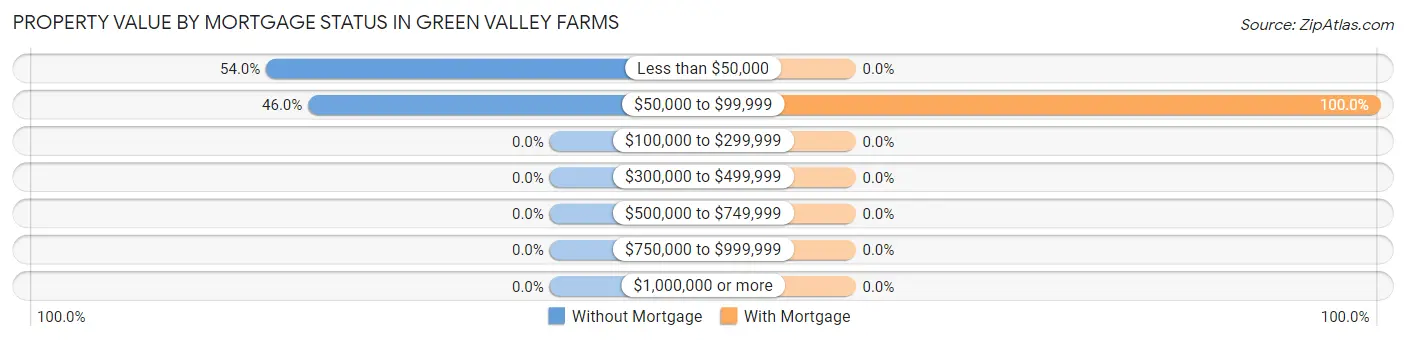
| Property Value | Without Mortgage | With Mortgage |
| Less than $50,000 | 54 (54.0%) | 0 (0.0%) |
| $50,000 to $99,999 | 46 (46.0%) | 47 (100.0%) |
| $100,000 to $299,999 | 0 (0.0%) | 0 (0.0%) |
| $300,000 to $499,999 | 0 (0.0%) | 0 (0.0%) |
| $500,000 to $749,999 | 0 (0.0%) | 0 (0.0%) |
| $750,000 to $999,999 | 0 (0.0%) | 0 (0.0%) |
| $1,000,000 or more | 0 (0.0%) | 0 (0.0%) |
| Total | 100 (100.0%) | 47 (100.0%) |
Household Income by Mortgage Status in Green Valley Farms
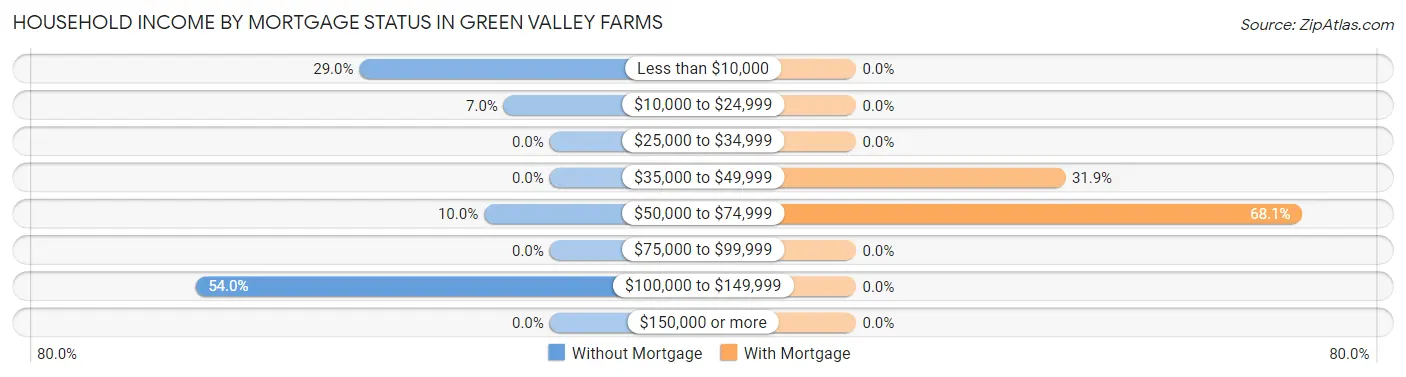
| Household Income | Without Mortgage | With Mortgage |
| Less than $10,000 | 29 (29.0%) | 0 (0.0%) |
| $10,000 to $24,999 | 7 (7.0%) | 0 (0.0%) |
| $25,000 to $34,999 | 0 (0.0%) | 0 (0.0%) |
| $35,000 to $49,999 | 0 (0.0%) | 15 (31.9%) |
| $50,000 to $74,999 | 10 (10.0%) | 32 (68.1%) |
| $75,000 to $99,999 | 0 (0.0%) | 0 (0.0%) |
| $100,000 to $149,999 | 54 (54.0%) | 0 (0.0%) |
| $150,000 or more | 0 (0.0%) | 0 (0.0%) |
| Total | 100 (100.0%) | 47 (100.0%) |
Property Value to Household Income Ratio in Green Valley Farms
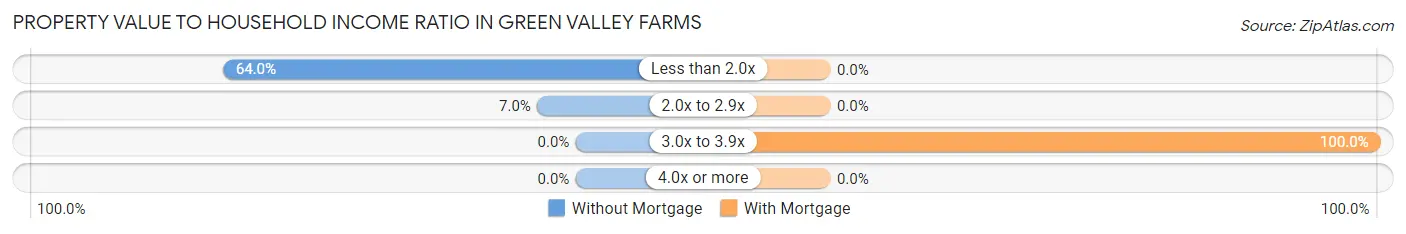
| Value-to-Income Ratio | Without Mortgage | With Mortgage |
| Less than 2.0x | 64 (64.0%) | 0 (0.0%) |
| 2.0x to 2.9x | 7 (7.0%) | 0 (0.0%) |
| 3.0x to 3.9x | 0 (0.0%) | 47 (100.0%) |
| 4.0x or more | 0 (0.0%) | 0 (0.0%) |
| Total | 100 (100.0%) | 47 (100.0%) |
Real Estate Taxes by Mortgage Status in Green Valley Farms
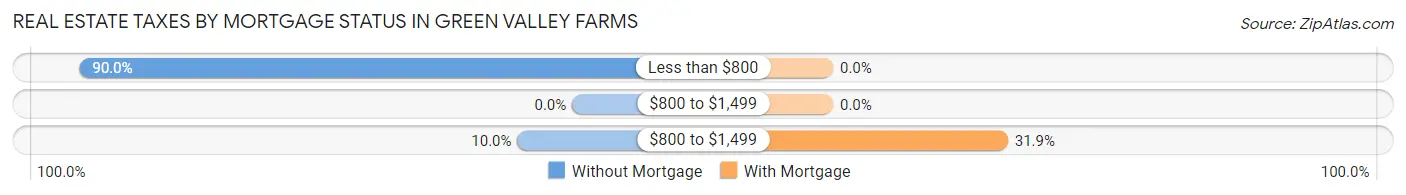
| Property Taxes | Without Mortgage | With Mortgage |
| Less than $800 | 90 (90.0%) | 0 (0.0%) |
| $800 to $1,499 | 0 (0.0%) | 0 (0.0%) |
| $800 to $1,499 | 10 (10.0%) | 15 (31.9%) |
| Total | 100 (100.0%) | 47 (100.0%) |
Health & Disability in Green Valley Farms
Health Insurance Coverage by Age in Green Valley Farms
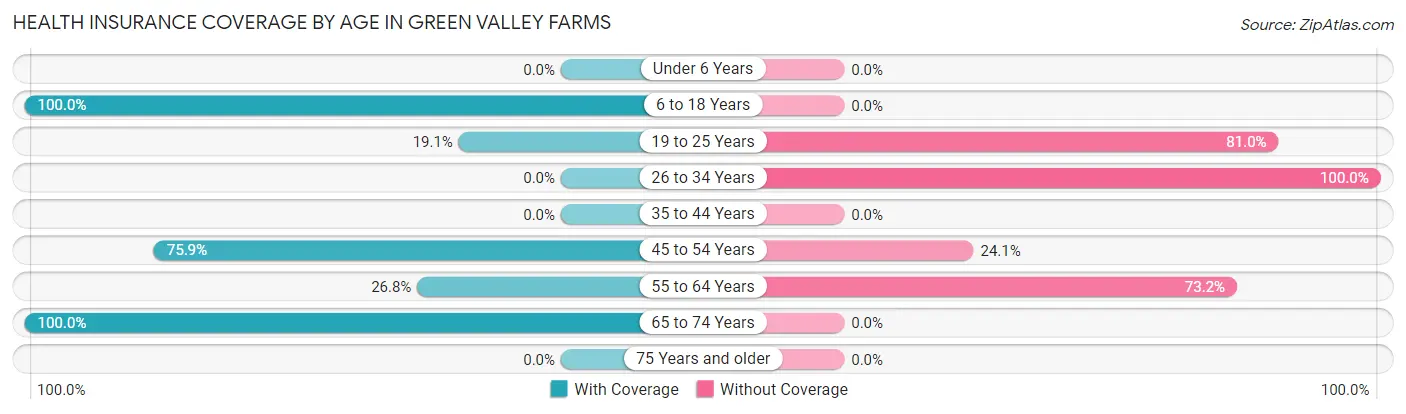
| Age Bracket | With Coverage | Without Coverage |
| Under 6 Years | 0 (0.0%) | 0 (0.0%) |
| 6 to 18 Years | 19 (100.0%) | 0 (0.0%) |
| 19 to 25 Years | 16 (19.1%) | 68 (80.9%) |
| 26 to 34 Years | 0 (0.0%) | 73 (100.0%) |
| 35 to 44 Years | 0 (0.0%) | 0 (0.0%) |
| 45 to 54 Years | 85 (75.9%) | 27 (24.1%) |
| 55 to 64 Years | 30 (26.8%) | 82 (73.2%) |
| 65 to 74 Years | 68 (100.0%) | 0 (0.0%) |
| 75 Years and older | 0 (0.0%) | 0 (0.0%) |
| Total | 218 (46.6%) | 250 (53.4%) |
Health Insurance Coverage by Citizenship Status in Green Valley Farms
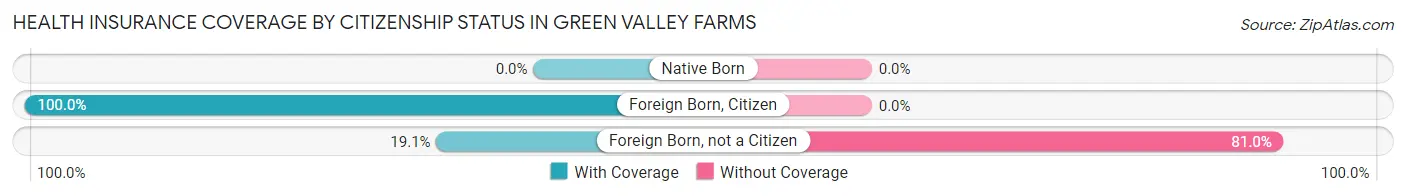
| Citizenship Status | With Coverage | Without Coverage |
| Native Born | 0 (0.0%) | 0 (0.0%) |
| Foreign Born, Citizen | 19 (100.0%) | 0 (0.0%) |
| Foreign Born, not a Citizen | 16 (19.1%) | 68 (80.9%) |
Health Insurance Coverage by Household Income in Green Valley Farms
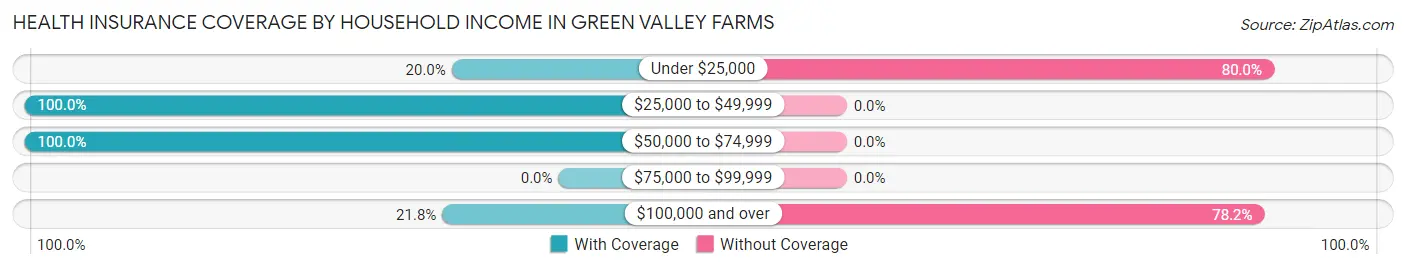
| Household Income | With Coverage | Without Coverage |
| Under $25,000 | 14 (20.0%) | 56 (80.0%) |
| $25,000 to $49,999 | 113 (100.0%) | 0 (0.0%) |
| $50,000 to $74,999 | 37 (100.0%) | 0 (0.0%) |
| $75,000 to $99,999 | 0 (0.0%) | 0 (0.0%) |
| $100,000 and over | 54 (21.8%) | 194 (78.2%) |
Public vs Private Health Insurance Coverage by Age in Green Valley Farms
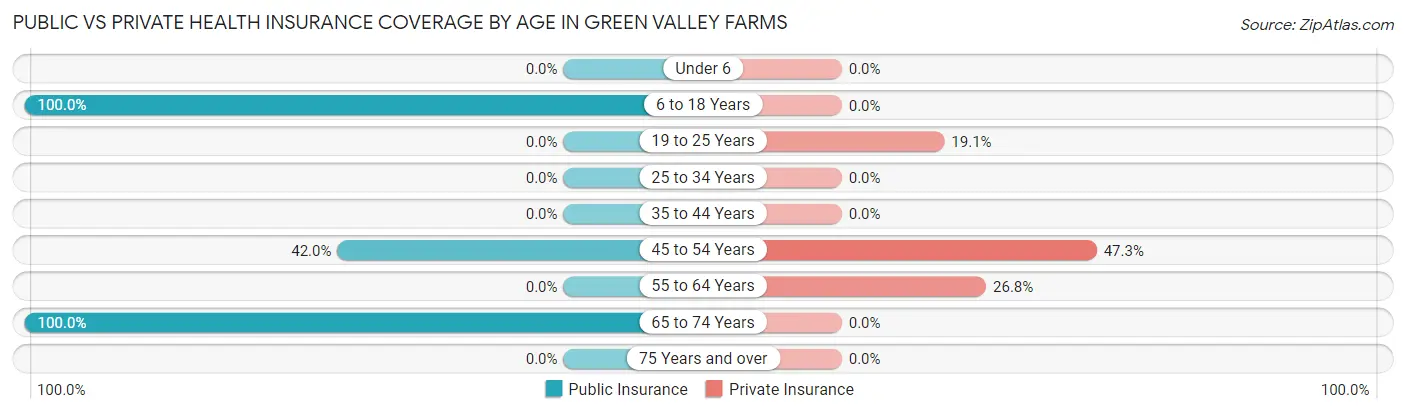
| Age Bracket | Public Insurance | Private Insurance |
| Under 6 | 0 (0.0%) | 0 (0.0%) |
| 6 to 18 Years | 19 (100.0%) | 0 (0.0%) |
| 19 to 25 Years | 0 (0.0%) | 16 (19.1%) |
| 25 to 34 Years | 0 (0.0%) | 0 (0.0%) |
| 35 to 44 Years | 0 (0.0%) | 0 (0.0%) |
| 45 to 54 Years | 47 (42.0%) | 53 (47.3%) |
| 55 to 64 Years | 0 (0.0%) | 30 (26.8%) |
| 65 to 74 Years | 68 (100.0%) | 0 (0.0%) |
| 75 Years and over | 0 (0.0%) | 0 (0.0%) |
| Total | 134 (28.6%) | 99 (21.1%) |
Disability Status by Sex by Age in Green Valley Farms
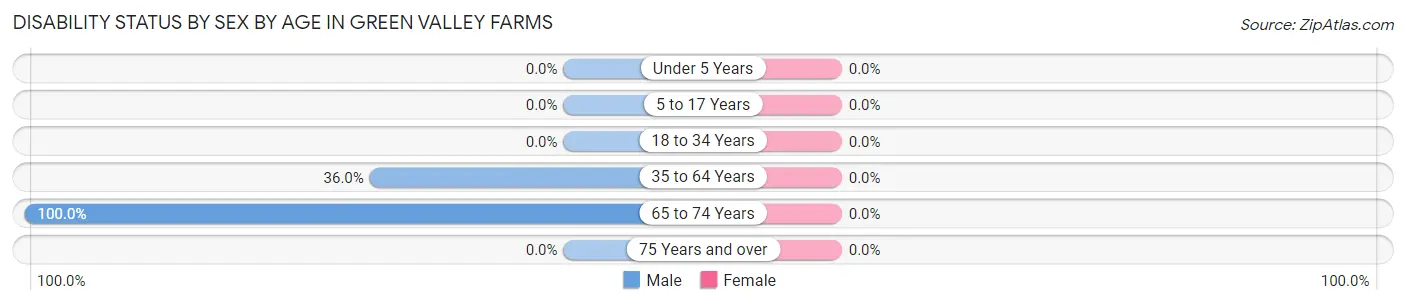
| Age Bracket | Male | Female |
| Under 5 Years | 0 (0.0%) | 0 (0.0%) |
| 5 to 17 Years | 0 (0.0%) | 0 (0.0%) |
| 18 to 34 Years | 0 (0.0%) | 0 (0.0%) |
| 35 to 64 Years | 32 (36.0%) | 0 (0.0%) |
| 65 to 74 Years | 61 (100.0%) | 0 (0.0%) |
| 75 Years and over | 0 (0.0%) | 0 (0.0%) |
Disability Class by Sex by Age in Green Valley Farms
Disability Class: Hearing Difficulty
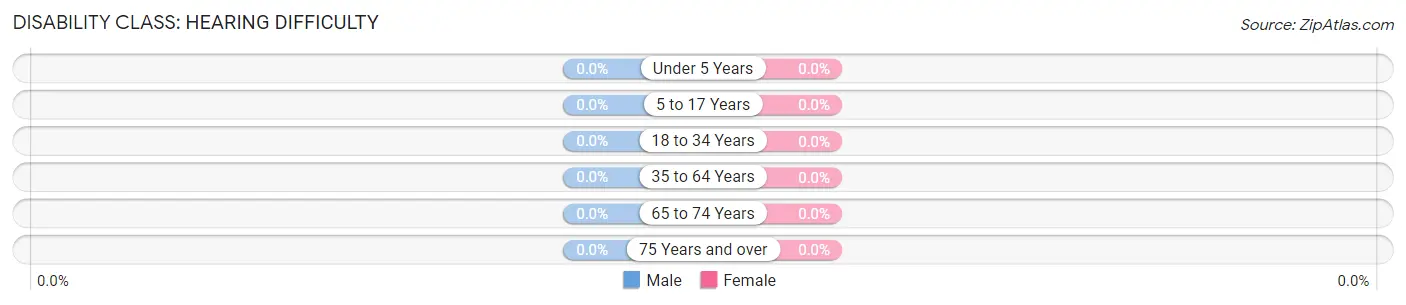
| Age Bracket | Male | Female |
| Under 5 Years | 0 (0.0%) | 0 (0.0%) |
| 5 to 17 Years | 0 (0.0%) | 0 (0.0%) |
| 18 to 34 Years | 0 (0.0%) | 0 (0.0%) |
| 35 to 64 Years | 0 (0.0%) | 0 (0.0%) |
| 65 to 74 Years | 0 (0.0%) | 0 (0.0%) |
| 75 Years and over | 0 (0.0%) | 0 (0.0%) |
Disability Class: Vision Difficulty
| Age Bracket | Male | Female |
| Under 5 Years | 0 (0.0%) | 0 (0.0%) |
| 5 to 17 Years | 0 (0.0%) | 0 (0.0%) |
| 18 to 34 Years | 0 (0.0%) | 0 (0.0%) |
| 35 to 64 Years | 0 (0.0%) | 0 (0.0%) |
| 65 to 74 Years | 0 (0.0%) | 0 (0.0%) |
| 75 Years and over | 0 (0.0%) | 0 (0.0%) |
Disability Class: Cognitive Difficulty
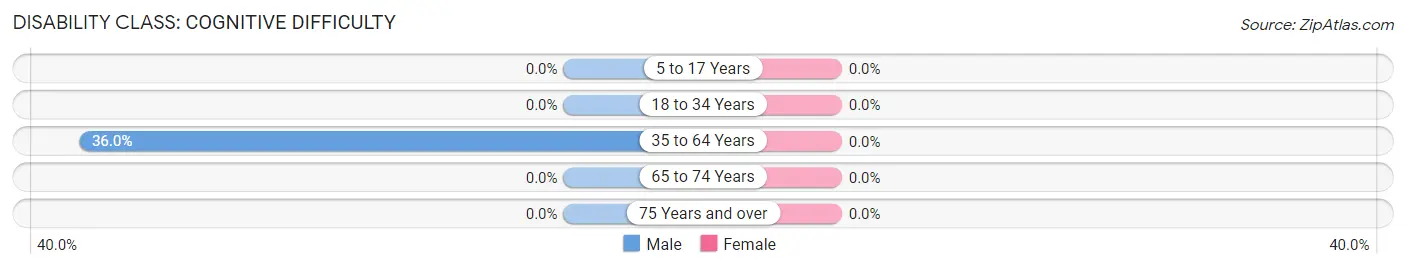
| Age Bracket | Male | Female |
| 5 to 17 Years | 0 (0.0%) | 0 (0.0%) |
| 18 to 34 Years | 0 (0.0%) | 0 (0.0%) |
| 35 to 64 Years | 32 (36.0%) | 0 (0.0%) |
| 65 to 74 Years | 0 (0.0%) | 0 (0.0%) |
| 75 Years and over | 0 (0.0%) | 0 (0.0%) |
Disability Class: Ambulatory Difficulty
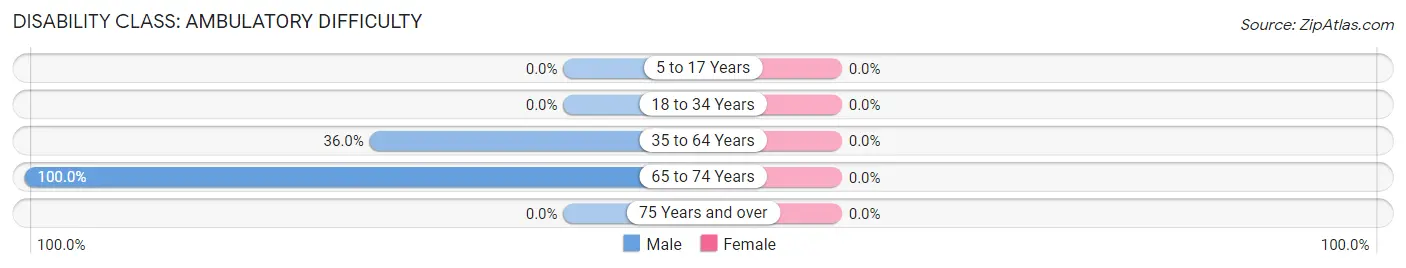
| Age Bracket | Male | Female |
| 5 to 17 Years | 0 (0.0%) | 0 (0.0%) |
| 18 to 34 Years | 0 (0.0%) | 0 (0.0%) |
| 35 to 64 Years | 32 (36.0%) | 0 (0.0%) |
| 65 to 74 Years | 61 (100.0%) | 0 (0.0%) |
| 75 Years and over | 0 (0.0%) | 0 (0.0%) |
Disability Class: Self-Care Difficulty
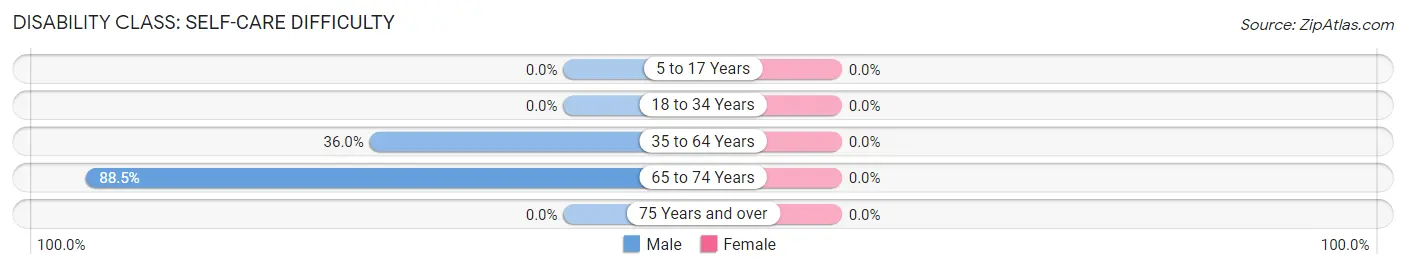
| Age Bracket | Male | Female |
| 5 to 17 Years | 0 (0.0%) | 0 (0.0%) |
| 18 to 34 Years | 0 (0.0%) | 0 (0.0%) |
| 35 to 64 Years | 32 (36.0%) | 0 (0.0%) |
| 65 to 74 Years | 54 (88.5%) | 0 (0.0%) |
| 75 Years and over | 0 (0.0%) | 0 (0.0%) |
Technology Access in Green Valley Farms
Computing Device Access in Green Valley Farms
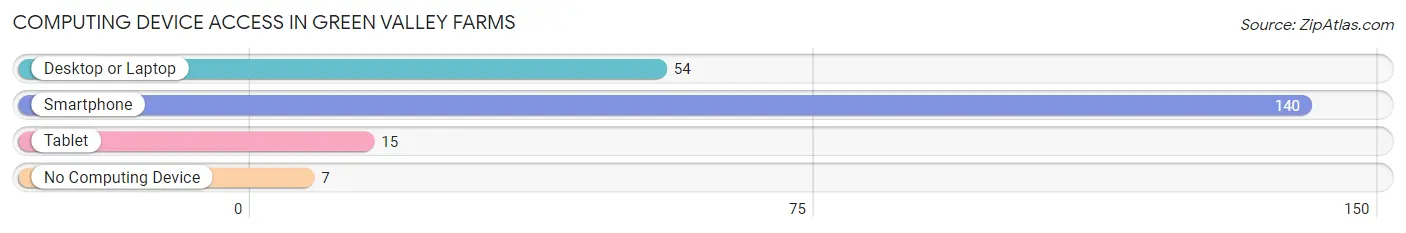
| Device Type | # Households | % Households |
| Desktop or Laptop | 54 | 36.7% |
| Smartphone | 140 | 95.2% |
| Tablet | 15 | 10.2% |
| No Computing Device | 7 | 4.8% |
| Total | 147 | 100.0% |
Internet Access in Green Valley Farms
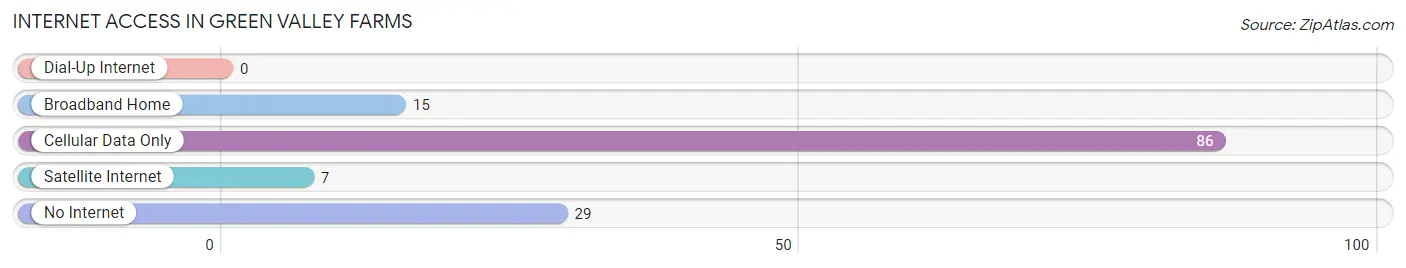
| Internet Type | # Households | % Households |
| Dial-Up Internet | 0 | 0.0% |
| Broadband Home | 15 | 10.2% |
| Cellular Data Only | 86 | 58.5% |
| Satellite Internet | 7 | 4.8% |
| No Internet | 29 | 19.7% |
| Total | 147 | 100.0% |
Green Valley Farms Summary
History
Located in the heart of the Texas Hill Country, Green Valley Farms is a small rural community in Gillespie County, Texas. The area was first settled in the late 1800s by German immigrants who were attracted to the area’s fertile soil and mild climate. The community was originally known as “Green Valley” and was home to a number of small farms and ranches. In the early 1900s, the area was renamed “Green Valley Farms” to reflect the agricultural nature of the community.
The area was largely agricultural until the 1950s, when the local economy began to diversify. The construction of a nearby dam in the 1950s provided the community with a reliable source of water, which allowed for the development of a number of small businesses. In the 1960s, the area began to attract retirees from other parts of the country, who were drawn to the area’s mild climate and scenic beauty.
Today, Green Valley Farms is a small, rural community with a population of approximately 1,000 people. The area is still largely agricultural, with a number of small farms and ranches in the area. The local economy is largely based on agriculture, with a number of small businesses providing services to the local community.
Geography
Green Valley Farms is located in the heart of the Texas Hill Country, approximately 70 miles northwest of Austin. The area is characterized by rolling hills, lush vegetation, and a mild climate. The area is home to a number of small farms and ranches, as well as a number of small businesses.
The area is located in the Edwards Plateau, which is characterized by limestone hills and canyons. The area is home to a number of species of wildlife, including deer, wild turkeys, and a variety of birds. The area is also home to a number of small lakes and rivers, which provide a number of recreational opportunities.
Economy
The economy of Green Valley Farms is largely based on agriculture. The area is home to a number of small farms and ranches, which produce a variety of crops, including corn, wheat, hay, and cotton. The area is also home to a number of small businesses, which provide services to the local community.
The area is also home to a number of tourist attractions, including a number of wineries, a golf course, and a number of outdoor recreational activities. The area is also home to a number of small manufacturing businesses, which produce a variety of products, including furniture, clothing, and food products.
Demographics
As of the 2010 census, the population of Green Valley Farms was 1,000 people. The population is largely white (90%), with a small Hispanic population (7%) and a small African American population (3%). The median household income in the area is $45,000, and the median home value is $150,000. The area is largely rural, with a number of small farms and ranches in the area. The area is also home to a number of small businesses, which provide services to the local community.
Common Questions
What is Per Capita Income in Green Valley Farms?
Per Capita income in Green Valley Farms is $19,771.
What is Inequality or Gini Index in Green Valley Farms?
Inequality or Gini Index in Green Valley Farms is 0.41.
What is the Total Population of Green Valley Farms?
Total Population of Green Valley Farms is 468.
What is the Total Male Population of Green Valley Farms?
Total Male Population of Green Valley Farms is 239.
What is the Total Female Population of Green Valley Farms?
Total Female Population of Green Valley Farms is 229.
What is the Ratio of Males per 100 Females in Green Valley Farms?
There are 104.37 Males per 100 Females in Green Valley Farms.
What is the Ratio of Females per 100 Males in Green Valley Farms?
There are 95.82 Females per 100 Males in Green Valley Farms.
What is the Median Population Age in Green Valley Farms?
Median Population Age in Green Valley Farms is 49.2 Years.
What is the Average Family Size in Green Valley Farms
Average Family Size in Green Valley Farms is 3.5 People.
What is the Average Household Size in Green Valley Farms
Average Household Size in Green Valley Farms is 3.2 People.
How Large is the Labor Force in Green Valley Farms?
There are 185 People in the Labor Forcein in Green Valley Farms.
What is the Percentage of People in the Labor Force in Green Valley Farms?
41.2% of People are in the Labor Force in Green Valley Farms.
What is the Unemployment Rate in Green Valley Farms?
Unemployment Rate in Green Valley Farms is 9.2%.