Old Hundred, NC Map & Demographics
Old Hundred Map
Old Hundred Overview
$5,266
PER CAPITA INCOME
$25,772
AVG FAMILY INCOME
$25,441
AVG HOUSEHOLD INCOME
$11,408
FAMILY INCOME DEFICIT
0.37
INEQUALITY / GINI INDEX
316
TOTAL POPULATION
141
MALE POPULATION
175
FEMALE POPULATION
80.57
MALES / 100 FEMALES
124.11
FEMALES / 100 MALES
29.7
MEDIAN AGE
3.9
AVG FAMILY SIZE
4.0
AVG HOUSEHOLD SIZE
113
LABOR FORCE [ PEOPLE ]
47.9%
PERCENT IN LABOR FORCE
80.5%
UNEMPLOYMENT RATE
Income in Old Hundred
Income Overview in Old Hundred
Per Capita Income in Old Hundred is $5,266, while median incomes of families and households are $25,772 and $25,441 respectively.
| Characteristic | Number | Measure |
| Per Capita Income | 316 | $5,266 |
| Median Family Income | 69 | $25,772 |
| Mean Family Income | 69 | $21,277 |
| Median Household Income | 78 | $25,441 |
| Mean Household Income | 78 | $20,483 |
| Income Deficit | 69 | $11,408 |
| Wage / Income Gap (%) | 316 | 0.00% |
| Wage / Income Gap ($) | 316 | 100.00¢ per $1 |
| Gini / Inequality Index | 316 | 0.37 |
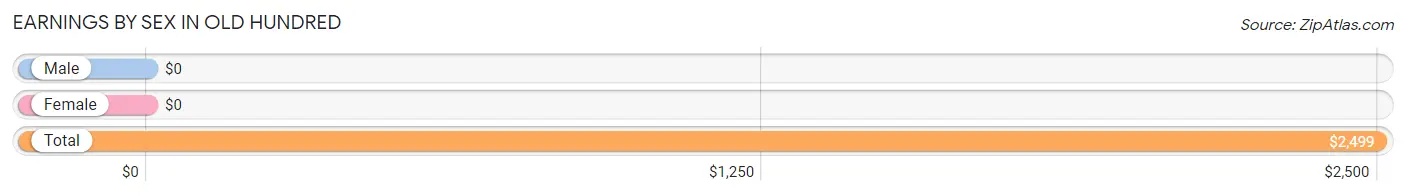
Earnings by Sex in Old Hundred
| Sex | Number | Average Earnings |
| Male | 23 (51.1%) | $0 |
| Female | 22 (48.9%) | $0 |
| Total | 45 (100.0%) | $2,499 |
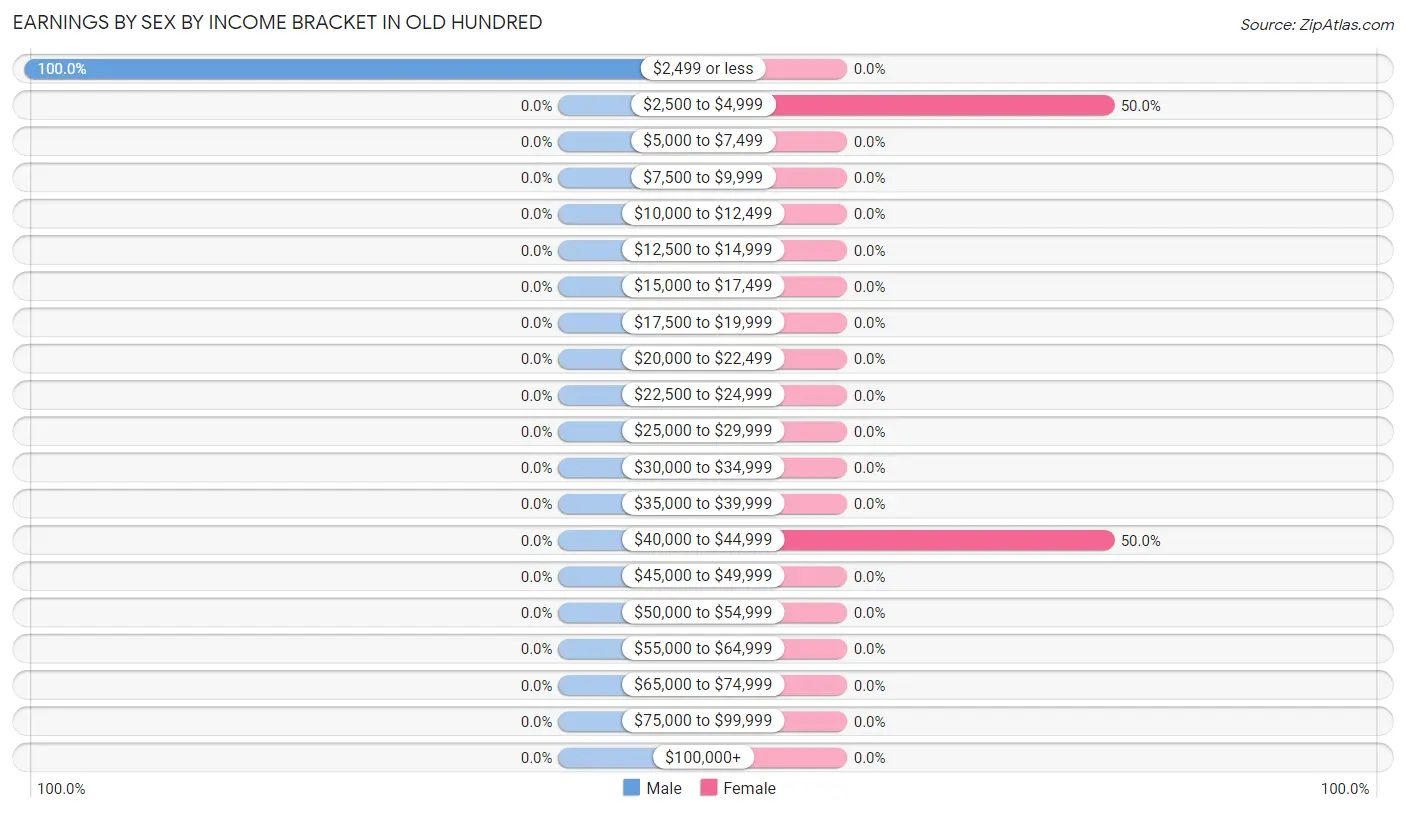
Earnings by Sex by Income Bracket in Old Hundred
The most common earnings brackets in Old Hundred are $2,499 or less for men (23 | 100.0%) and $2,500 to $4,999 for women (11 | 50.0%).
| Income | Male | Female |
| $2,499 or less | 23 (100.0%) | 0 (0.0%) |
| $2,500 to $4,999 | 0 (0.0%) | 11 (50.0%) |
| $5,000 to $7,499 | 0 (0.0%) | 0 (0.0%) |
| $7,500 to $9,999 | 0 (0.0%) | 0 (0.0%) |
| $10,000 to $12,499 | 0 (0.0%) | 0 (0.0%) |
| $12,500 to $14,999 | 0 (0.0%) | 0 (0.0%) |
| $15,000 to $17,499 | 0 (0.0%) | 0 (0.0%) |
| $17,500 to $19,999 | 0 (0.0%) | 0 (0.0%) |
| $20,000 to $22,499 | 0 (0.0%) | 0 (0.0%) |
| $22,500 to $24,999 | 0 (0.0%) | 0 (0.0%) |
| $25,000 to $29,999 | 0 (0.0%) | 0 (0.0%) |
| $30,000 to $34,999 | 0 (0.0%) | 0 (0.0%) |
| $35,000 to $39,999 | 0 (0.0%) | 0 (0.0%) |
| $40,000 to $44,999 | 0 (0.0%) | 11 (50.0%) |
| $45,000 to $49,999 | 0 (0.0%) | 0 (0.0%) |
| $50,000 to $54,999 | 0 (0.0%) | 0 (0.0%) |
| $55,000 to $64,999 | 0 (0.0%) | 0 (0.0%) |
| $65,000 to $74,999 | 0 (0.0%) | 0 (0.0%) |
| $75,000 to $99,999 | 0 (0.0%) | 0 (0.0%) |
| $100,000+ | 0 (0.0%) | 0 (0.0%) |
| Total | 23 (100.0%) | 22 (100.0%) |
Earnings by Sex by Educational Attainment in Old Hundred
| Educational Attainment | Male Income | Female Income |
| Less than High School | - | - |
| High School Diploma | - | - |
| College or Associate's Degree | - | - |
| Bachelor's Degree | - | - |
| Graduate Degree | - | - |
| Total | - | - |
Family Income in Old Hundred
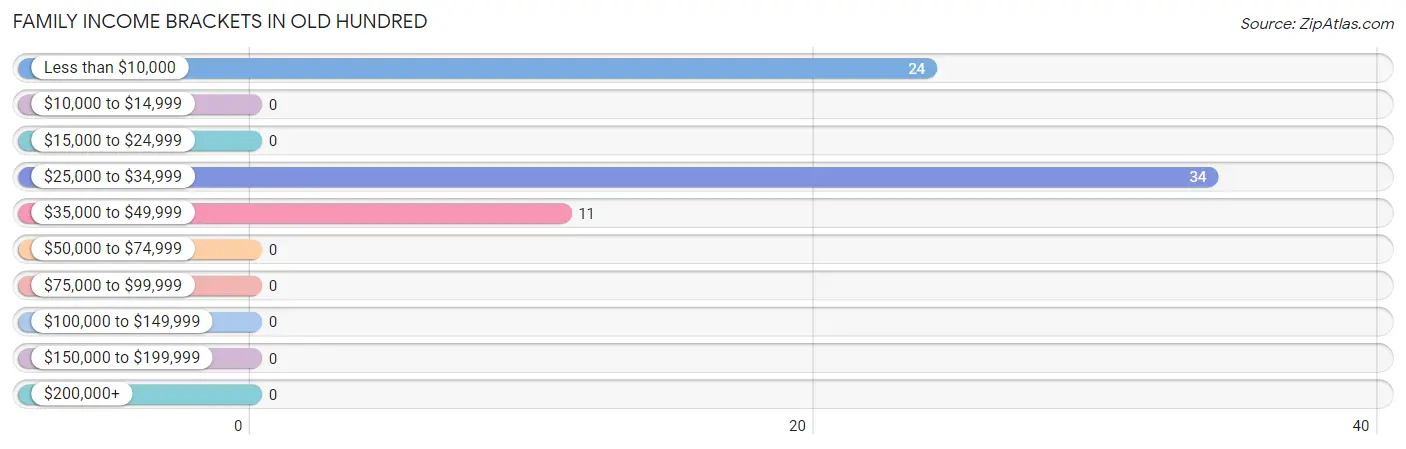
Family Income Brackets in Old Hundred
According to the Old Hundred family income data, there are 34 families falling into the $25,000 to $34,999 income range, which is the most common income bracket and makes up 49.3% of all families.
| Income Bracket | # Families | % Families |
| Less than $10,000 | 24 | 34.8% |
| $10,000 to $14,999 | 0 | 0.0% |
| $15,000 to $24,999 | 0 | 0.0% |
| $25,000 to $34,999 | 34 | 49.3% |
| $35,000 to $49,999 | 11 | 15.9% |
| $50,000 to $74,999 | 0 | 0.0% |
| $75,000 to $99,999 | 0 | 0.0% |
| $100,000 to $149,999 | 0 | 0.0% |
| $150,000 to $199,999 | 0 | 0.0% |
| $200,000+ | 0 | 0.0% |
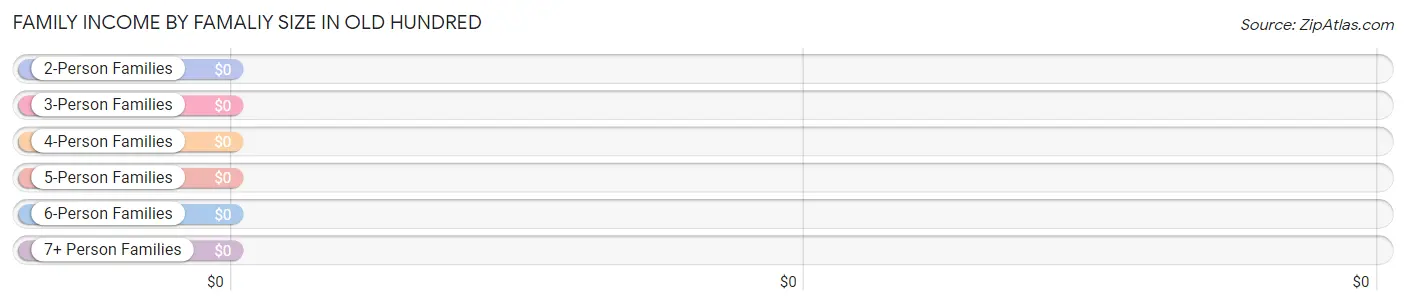
Family Income by Famaliy Size in Old Hundred
| Income Bracket | # Families | Median Income |
| 2-Person Families | 11 (15.9%) | $0 |
| 3-Person Families | 42 (60.9%) | $0 |
| 4-Person Families | 16 (23.2%) | $0 |
| 5-Person Families | 0 (0.0%) | $0 |
| 6-Person Families | 0 (0.0%) | $0 |
| 7+ Person Families | 0 (0.0%) | $0 |
| Total | 69 (100.0%) | $25,772 |
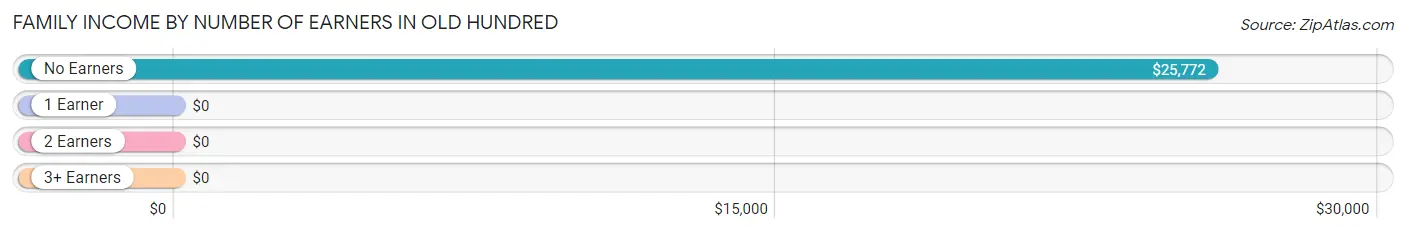
Family Income by Number of Earners in Old Hundred
| Number of Earners | # Families | Median Income |
| No Earners | 47 (68.1%) | $25,772 |
| 1 Earner | 22 (31.9%) | $0 |
| 2 Earners | 0 (0.0%) | $0 |
| 3+ Earners | 0 (0.0%) | $0 |
| Total | 69 (100.0%) | $25,772 |
Household Income in Old Hundred
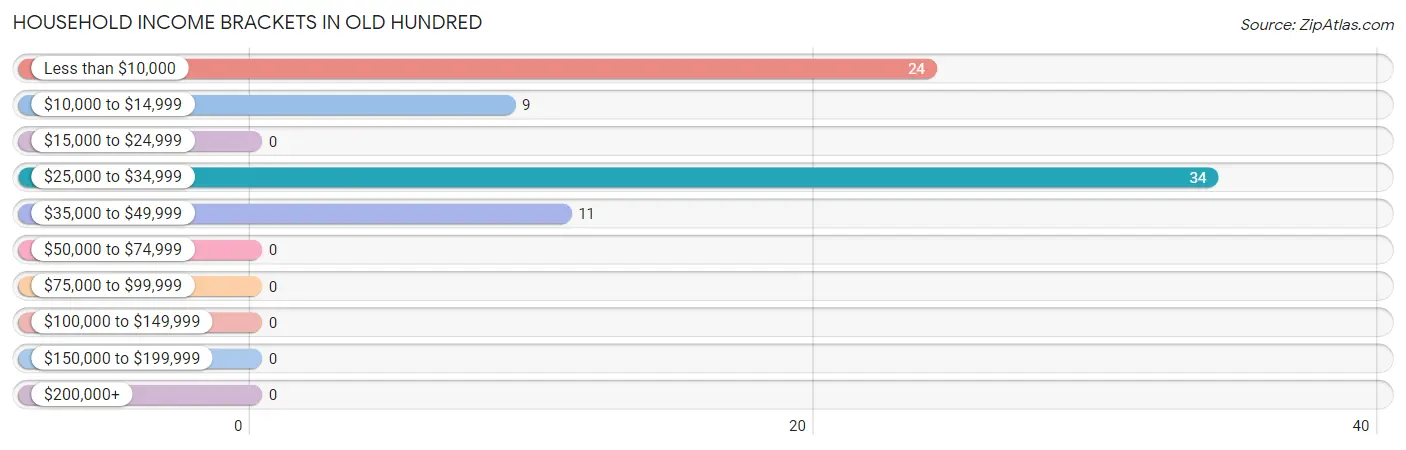
Household Income Brackets in Old Hundred
With 34 households falling in the category, the $25,000 to $34,999 income range is the most frequent in Old Hundred, accounting for 43.6% of all households.
| Income Bracket | # Households | % Households |
| Less than $10,000 | 24 | 30.8% |
| $10,000 to $14,999 | 9 | 11.5% |
| $15,000 to $24,999 | 0 | 0.0% |
| $25,000 to $34,999 | 34 | 43.6% |
| $35,000 to $49,999 | 11 | 14.1% |
| $50,000 to $74,999 | 0 | 0.0% |
| $75,000 to $99,999 | 0 | 0.0% |
| $100,000 to $149,999 | 0 | 0.0% |
| $150,000 to $199,999 | 0 | 0.0% |
| $200,000+ | 0 | 0.0% |
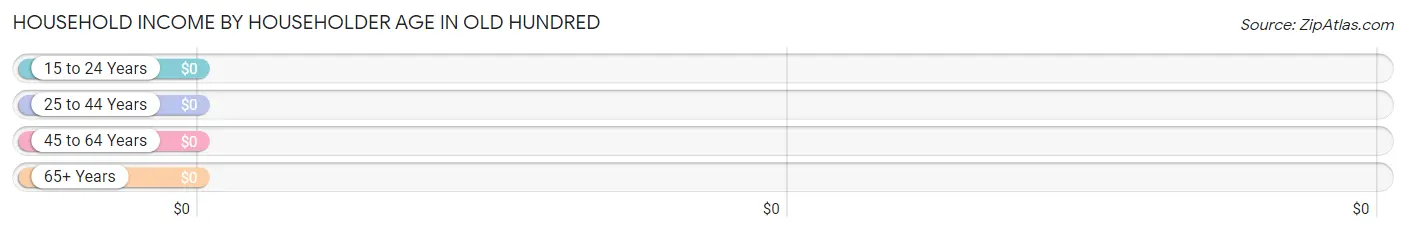
Household Income by Householder Age in Old Hundred
| Income Bracket | # Households | Median Income |
| 15 to 24 Years | 0 (0.0%) | $0 |
| 25 to 44 Years | 35 (44.9%) | $0 |
| 45 to 64 Years | 16 (20.5%) | $0 |
| 65+ Years | 27 (34.6%) | $0 |
| Total | 78 (100.0%) | $25,441 |
Poverty in Old Hundred
Income Below Poverty by Sex and Age in Old Hundred
With 77.3% poverty level for males and 62.3% for females among the residents of Old Hundred, 15 year old males and 16 and 17 year old females are the most vulnerable to poverty, with 11 males (100.0%) and 18 females (100.0%) in their respective age groups living below the poverty level.
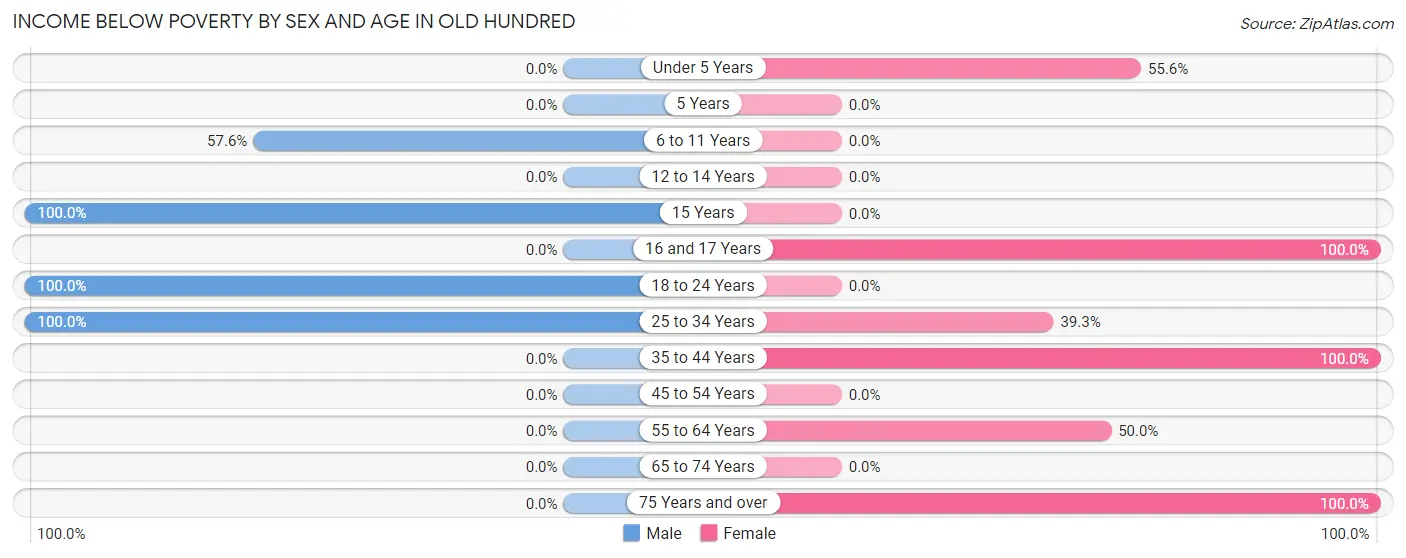
| Age Bracket | Male | Female |
| Under 5 Years | 0 (0.0%) | 20 (55.6%) |
| 5 Years | 0 (0.0%) | 0 (0.0%) |
| 6 to 11 Years | 19 (57.6%) | 0 (0.0%) |
| 12 to 14 Years | 0 (0.0%) | 0 (0.0%) |
| 15 Years | 11 (100.0%) | 0 (0.0%) |
| 16 and 17 Years | 0 (0.0%) | 18 (100.0%) |
| 18 to 24 Years | 23 (100.0%) | 0 (0.0%) |
| 25 to 34 Years | 56 (100.0%) | 22 (39.3%) |
| 35 to 44 Years | 0 (0.0%) | 24 (100.0%) |
| 45 to 54 Years | 0 (0.0%) | 0 (0.0%) |
| 55 to 64 Years | 0 (0.0%) | 16 (50.0%) |
| 65 to 74 Years | 0 (0.0%) | 0 (0.0%) |
| 75 Years and over | 0 (0.0%) | 9 (100.0%) |
| Total | 109 (77.3%) | 109 (62.3%) |
Income Above Poverty by Sex and Age in Old Hundred
According to the poverty statistics in Old Hundred, males aged 65 to 74 years and females aged 25 to 34 years are the age groups that are most secure financially, with 100.0% of males and 60.7% of females in these age groups living above the poverty line.
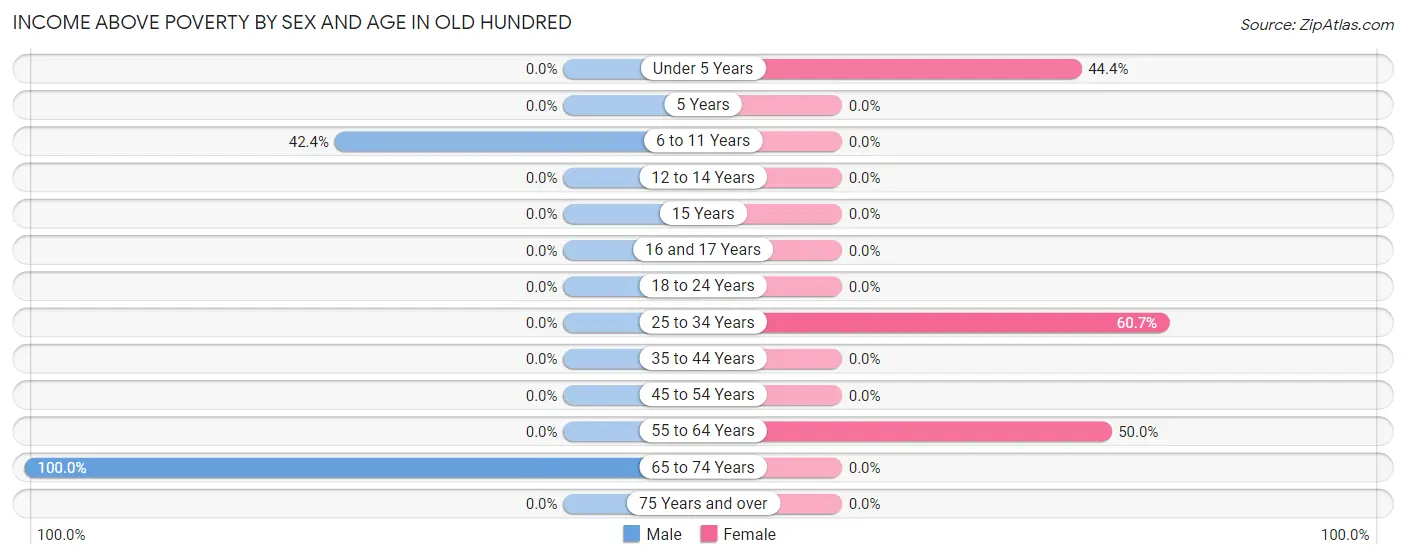
| Age Bracket | Male | Female |
| Under 5 Years | 0 (0.0%) | 16 (44.4%) |
| 5 Years | 0 (0.0%) | 0 (0.0%) |
| 6 to 11 Years | 14 (42.4%) | 0 (0.0%) |
| 12 to 14 Years | 0 (0.0%) | 0 (0.0%) |
| 15 Years | 0 (0.0%) | 0 (0.0%) |
| 16 and 17 Years | 0 (0.0%) | 0 (0.0%) |
| 18 to 24 Years | 0 (0.0%) | 0 (0.0%) |
| 25 to 34 Years | 0 (0.0%) | 34 (60.7%) |
| 35 to 44 Years | 0 (0.0%) | 0 (0.0%) |
| 45 to 54 Years | 0 (0.0%) | 0 (0.0%) |
| 55 to 64 Years | 0 (0.0%) | 16 (50.0%) |
| 65 to 74 Years | 18 (100.0%) | 0 (0.0%) |
| 75 Years and over | 0 (0.0%) | 0 (0.0%) |
| Total | 32 (22.7%) | 66 (37.7%) |
Income Below Poverty Among Married-Couple Families in Old Hundred
| Children | Above Poverty | Below Poverty |
| No Children | 18 (100.0%) | 0 (0.0%) |
| 1 or 2 Children | 0 (0.0%) | 0 (0.0%) |
| 3 or 4 Children | 0 (0.0%) | 0 (0.0%) |
| 5 or more Children | 0 (0.0%) | 0 (0.0%) |
| Total | 18 (100.0%) | 0 (0.0%) |
Income Below Poverty Among Single-Parent Households in Old Hundred
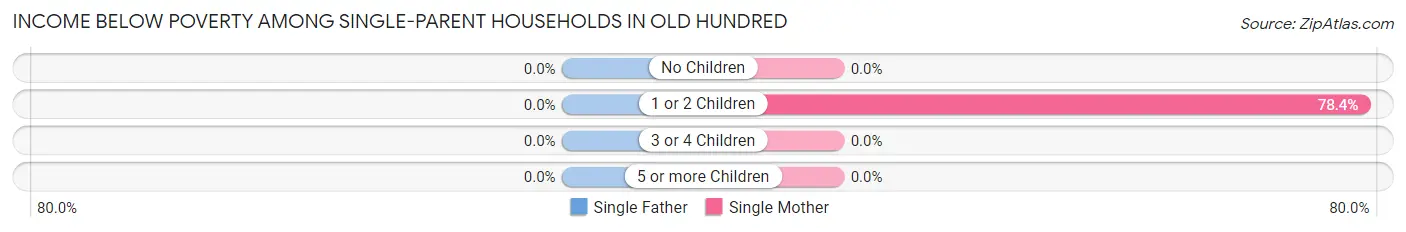
| Children | Single Father | Single Mother |
| No Children | 0 (0.0%) | 0 (0.0%) |
| 1 or 2 Children | 0 (0.0%) | 40 (78.4%) |
| 3 or 4 Children | 0 (0.0%) | 0 (0.0%) |
| 5 or more Children | 0 (0.0%) | 0 (0.0%) |
| Total | 0 (0.0%) | 40 (78.4%) |
Income Below Poverty Among Married-Couple vs Single-Parent Households in Old Hundred
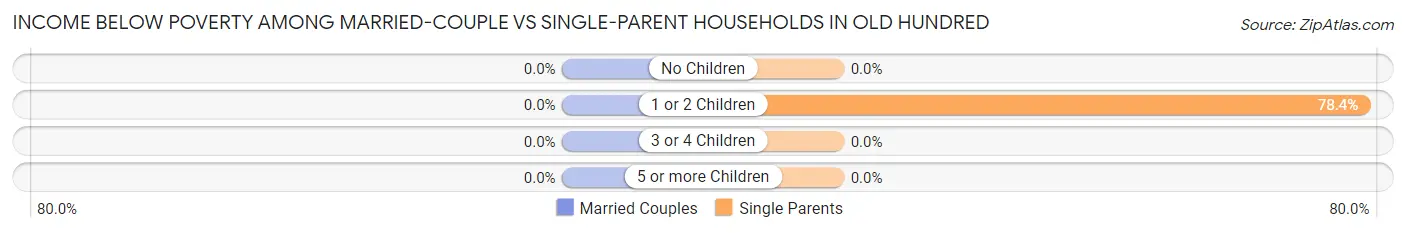
| Children | Married-Couple Families | Single-Parent Households |
| No Children | 0 (0.0%) | 0 (0.0%) |
| 1 or 2 Children | 0 (0.0%) | 40 (78.4%) |
| 3 or 4 Children | 0 (0.0%) | 0 (0.0%) |
| 5 or more Children | 0 (0.0%) | 0 (0.0%) |
| Total | 0 (0.0%) | 40 (78.4%) |
Race in Old Hundred
The most populous races in Old Hundred are White / Caucasian (251 | 79.4%), Two or more Races (52 | 16.5%), and Native / Alaskan (13 | 4.1%).
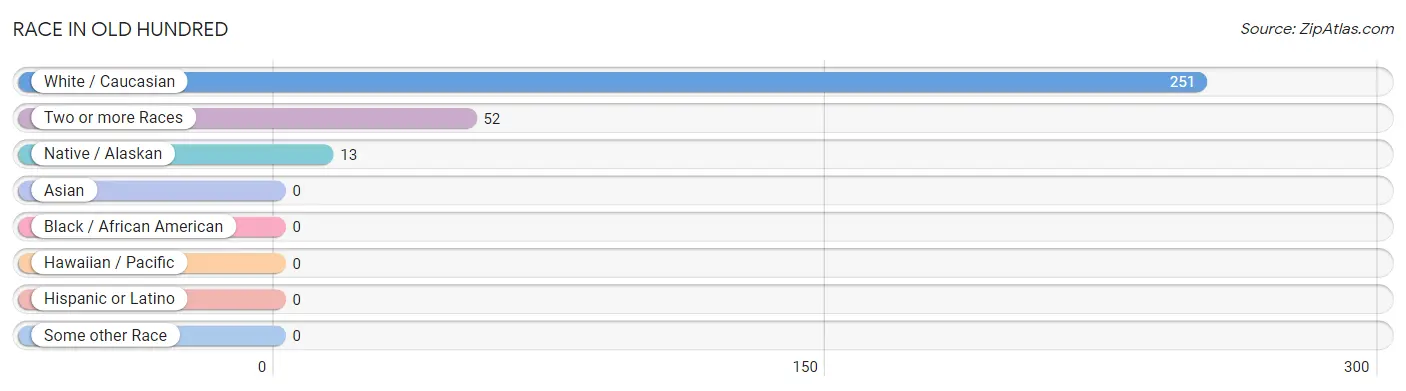
| Race | # Population | % Population |
| Asian | 0 | 0.0% |
| Black / African American | 0 | 0.0% |
| Hawaiian / Pacific | 0 | 0.0% |
| Hispanic or Latino | 0 | 0.0% |
| Native / Alaskan | 13 | 4.1% |
| White / Caucasian | 251 | 79.4% |
| Two or more Races | 52 | 16.5% |
| Some other Race | 0 | 0.0% |
| Total | 316 | 100.0% |
Ancestry in Old Hundred
The most populous ancestries reported in Old Hundred are Lumbee (65 | 20.6%), and English (57 | 18.0%), together accounting for 38.6% of all Old Hundred residents.
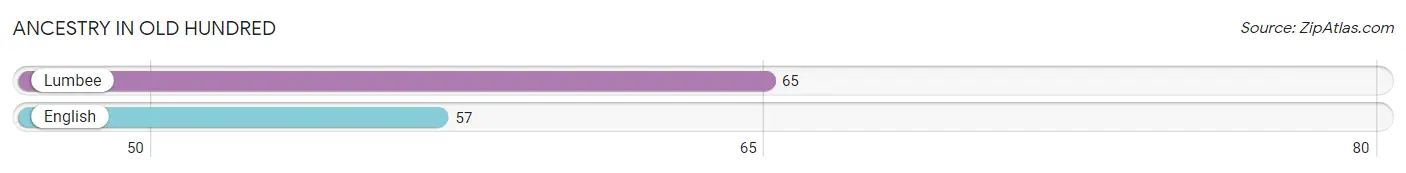
| Ancestry | # Population | % Population |
| English | 57 | 18.0% |
| Lumbee | 65 | 20.6% | View All 2 Rows |
Immigrants in Old Hundred

| Immigration Origin | # Population | % Population | View All 0 Rows |
Sex and Age in Old Hundred
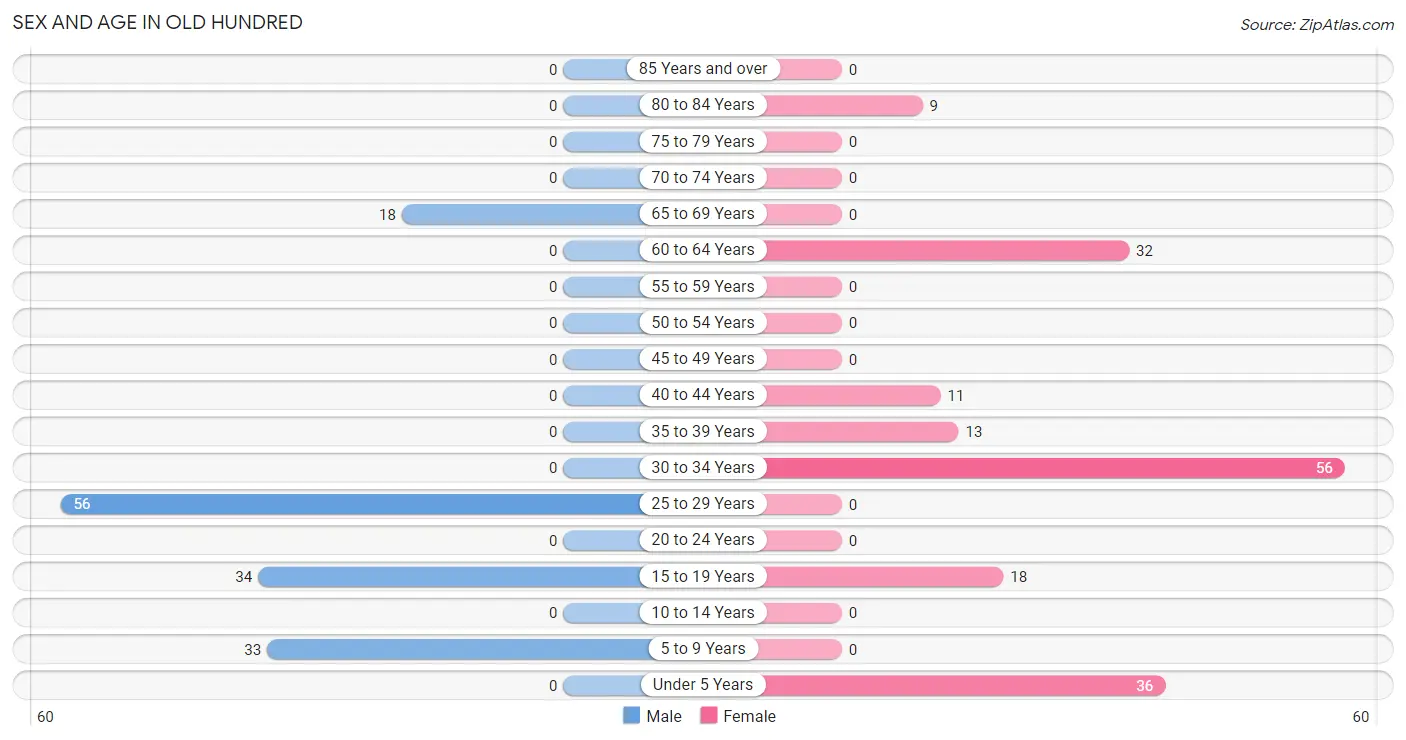
Sex and Age in Old Hundred
The most populous age groups in Old Hundred are 25 to 29 Years (56 | 39.7%) for men and 30 to 34 Years (56 | 32.0%) for women.
| Age Bracket | Male | Female |
| Under 5 Years | 0 (0.0%) | 36 (20.6%) |
| 5 to 9 Years | 33 (23.4%) | 0 (0.0%) |
| 10 to 14 Years | 0 (0.0%) | 0 (0.0%) |
| 15 to 19 Years | 34 (24.1%) | 18 (10.3%) |
| 20 to 24 Years | 0 (0.0%) | 0 (0.0%) |
| 25 to 29 Years | 56 (39.7%) | 0 (0.0%) |
| 30 to 34 Years | 0 (0.0%) | 56 (32.0%) |
| 35 to 39 Years | 0 (0.0%) | 13 (7.4%) |
| 40 to 44 Years | 0 (0.0%) | 11 (6.3%) |
| 45 to 49 Years | 0 (0.0%) | 0 (0.0%) |
| 50 to 54 Years | 0 (0.0%) | 0 (0.0%) |
| 55 to 59 Years | 0 (0.0%) | 0 (0.0%) |
| 60 to 64 Years | 0 (0.0%) | 32 (18.3%) |
| 65 to 69 Years | 18 (12.8%) | 0 (0.0%) |
| 70 to 74 Years | 0 (0.0%) | 0 (0.0%) |
| 75 to 79 Years | 0 (0.0%) | 0 (0.0%) |
| 80 to 84 Years | 0 (0.0%) | 9 (5.1%) |
| 85 Years and over | 0 (0.0%) | 0 (0.0%) |
| Total | 141 (100.0%) | 175 (100.0%) |
Families and Households in Old Hundred
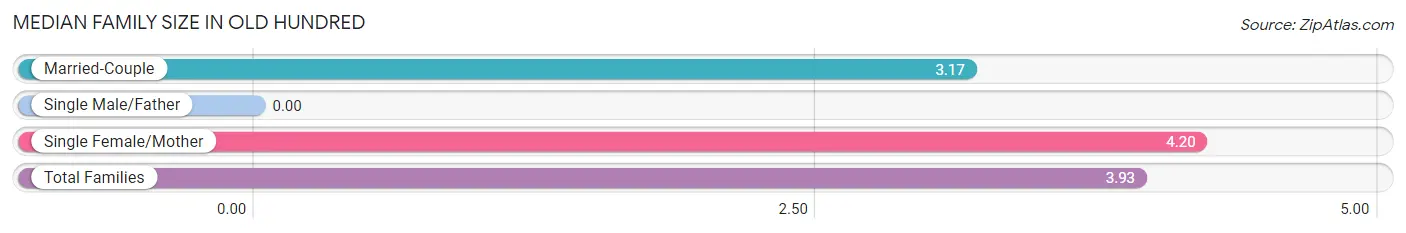
Median Family Size in Old Hundred
| Family Type | # Families | Family Size |
| Married-Couple | 18 (26.1%) | 3.17 |
| Single Male/Father | 0 (0.0%) | - |
| Single Female/Mother | 51 (73.9%) | 4.20 |
| Total Families | 69 (100.0%) | 3.93 |
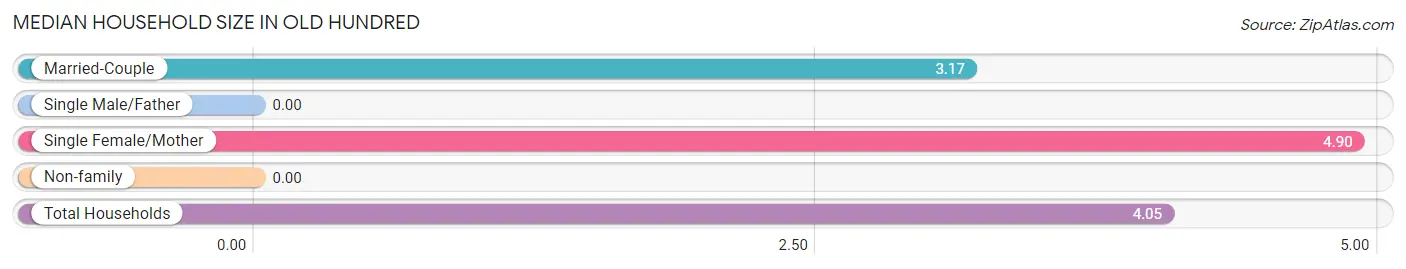
Median Household Size in Old Hundred
| Household Type | # Households | Household Size |
| Married-Couple | 18 (23.1%) | 3.17 |
| Single Male/Father | 0 (0.0%) | - |
| Single Female/Mother | 51 (65.4%) | 4.90 |
| Non-family | 9 (11.5%) | - |
| Total Households | 78 (100.0%) | 4.05 |
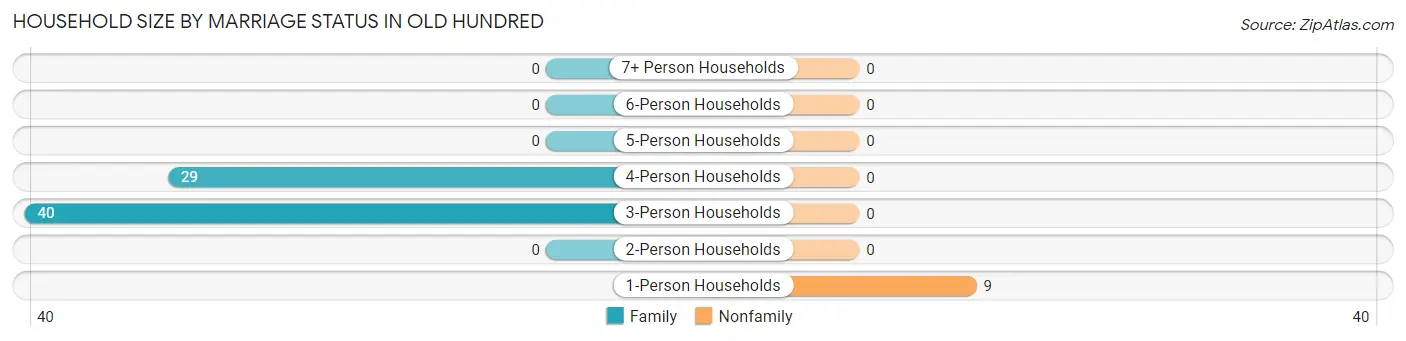
Household Size by Marriage Status in Old Hundred
Out of a total of 78 households in Old Hundred, 69 (88.5%) are family households, while 9 (11.5%) are nonfamily households. The most numerous type of family households are 3-person households, comprising 40, and the most common type of nonfamily households are 1-person households, comprising 9.
| Household Size | Family Households | Nonfamily Households |
| 1-Person Households | - | 9 (11.5%) |
| 2-Person Households | 0 (0.0%) | 0 (0.0%) |
| 3-Person Households | 40 (51.3%) | 0 (0.0%) |
| 4-Person Households | 29 (37.2%) | 0 (0.0%) |
| 5-Person Households | 0 (0.0%) | 0 (0.0%) |
| 6-Person Households | 0 (0.0%) | 0 (0.0%) |
| 7+ Person Households | 0 (0.0%) | 0 (0.0%) |
| Total | 69 (88.5%) | 9 (11.5%) |
Female Fertility in Old Hundred
Fertility by Age in Old Hundred
| Age Bracket | Women with Births | Births / 1,000 Women |
| 15 to 19 years | 0 (0.0%) | 0.0 |
| 20 to 34 years | 0 (0.0%) | 0.0 |
| 35 to 50 years | 0 (0.0%) | 0.0 |
| Total | 0 (0.0%) | 0.0 |
Fertility by Age by Marriage Status in Old Hundred
| Age Bracket | Married | Unmarried |
| 15 to 19 years | 0 (0.0%) | 0 (0.0%) |
| 20 to 34 years | 0 (0.0%) | 0 (0.0%) |
| 35 to 50 years | 0 (0.0%) | 0 (0.0%) |
| Total | 0 (0.0%) | 0 (0.0%) |
Fertility by Education in Old Hundred
| Educational Attainment | Women with Births | Births / 1,000 Women |
| Less than High School | 0 (0.0%) | 0.0 |
| High School Diploma | 0 (0.0%) | 0.0 |
| College or Associate's Degree | 0 (0.0%) | 0.0 |
| Bachelor's Degree | 0 (0.0%) | 0.0 |
| Graduate Degree | 0 (0.0%) | 0.0 |
| Total | 0 (0.0%) | 0.0 |
Fertility by Education by Marriage Status in Old Hundred
| Educational Attainment | Married | Unmarried |
| Less than High School | 0 (0.0%) | 0 (0.0%) |
| High School Diploma | 0 (0.0%) | 0 (0.0%) |
| College or Associate's Degree | 0 (0.0%) | 0 (0.0%) |
| Bachelor's Degree | 0 (0.0%) | 0 (0.0%) |
| Graduate Degree | 0 (0.0%) | 0 (0.0%) |
| Total | 0 (0.0%) | 0 (0.0%) |
Employment Characteristics in Old Hundred
Employment by Class of Employer in Old Hundred
Among the 22 employed individuals in Old Hundred, , and private company employees (22 | 100.0%) make up the most common classes of employment.
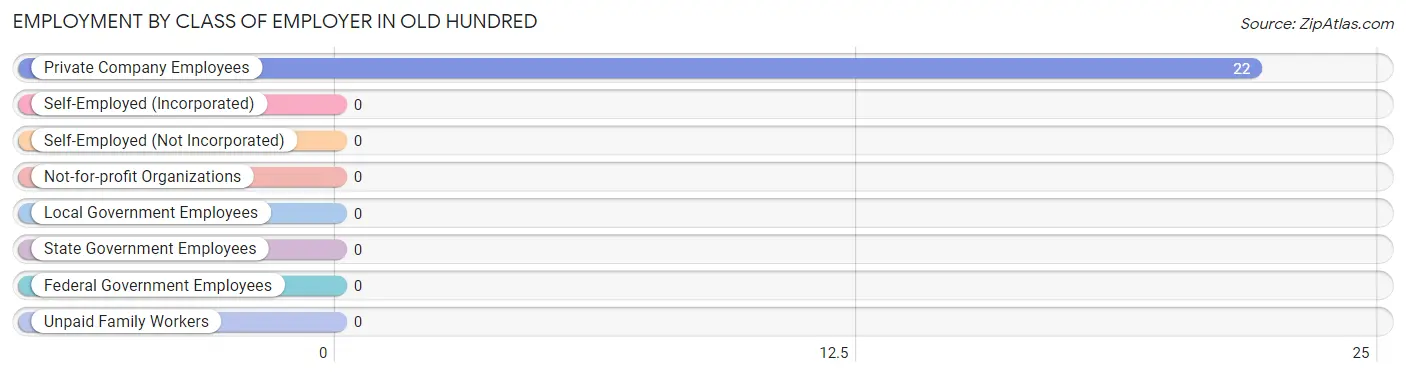
| Employer Class | # Employees | % Employees |
| Private Company Employees | 22 | 100.0% |
| Self-Employed (Incorporated) | 0 | 0.0% |
| Self-Employed (Not Incorporated) | 0 | 0.0% |
| Not-for-profit Organizations | 0 | 0.0% |
| Local Government Employees | 0 | 0.0% |
| State Government Employees | 0 | 0.0% |
| Federal Government Employees | 0 | 0.0% |
| Unpaid Family Workers | 0 | 0.0% |
| Total | 22 | 100.0% |
Employment Status by Age in Old Hundred
According to the labor force statistics for Old Hundred, out of the total population over 16 years of age (236), 47.9% or 113 individuals are in the labor force, with 80.5% or 91 of them unemployed. The age group with the highest labor force participation rate is 25 to 29 years, with 100.0% or 56 individuals in the labor force. Within the labor force, the 25 to 29 years age range has the highest percentage of unemployed individuals, with 100.0% or 56 of them being unemployed.
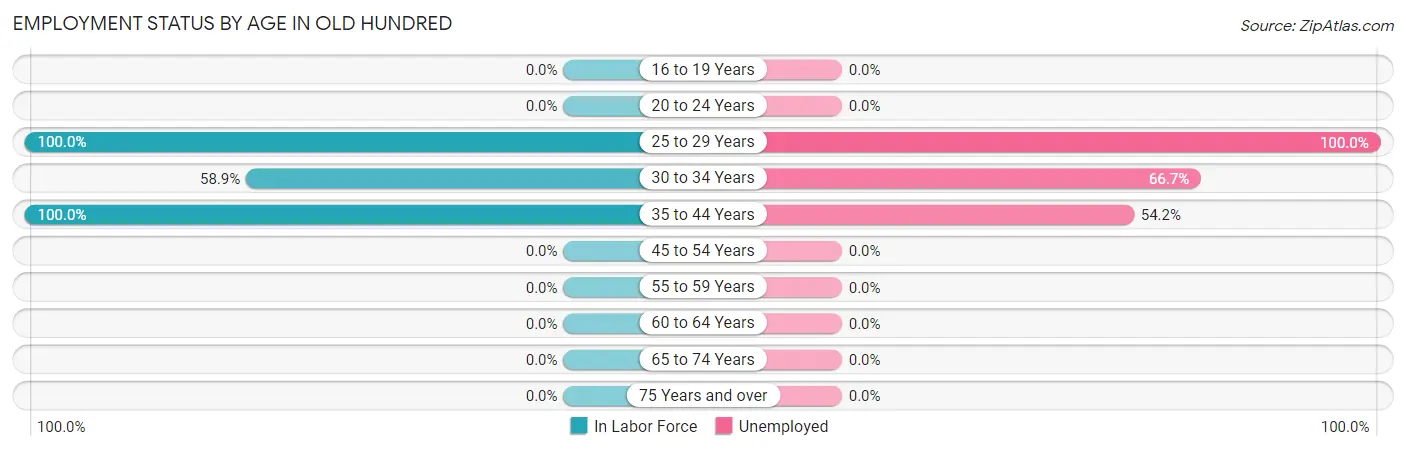
| Age Bracket | In Labor Force | Unemployed |
| 16 to 19 Years | 0 (0.0%) | 0 (0.0%) |
| 20 to 24 Years | 0 (0.0%) | 0 (0.0%) |
| 25 to 29 Years | 56 (100.0%) | 56 (100.0%) |
| 30 to 34 Years | 33 (58.9%) | 22 (66.7%) |
| 35 to 44 Years | 24 (100.0%) | 13 (54.2%) |
| 45 to 54 Years | 0 (0.0%) | 0 (0.0%) |
| 55 to 59 Years | 0 (0.0%) | 0 (0.0%) |
| 60 to 64 Years | 0 (0.0%) | 0 (0.0%) |
| 65 to 74 Years | 0 (0.0%) | 0 (0.0%) |
| 75 Years and over | 0 (0.0%) | 0 (0.0%) |
| Total | 113 (47.9%) | 91 (80.5%) |
Employment Status by Educational Attainment in Old Hundred
According to labor force statistics for Old Hundred, 67.3% of individuals (113) out of the total population between 25 and 64 years of age (168) are in the labor force, with 80.5% or 91 of them being unemployed. The group with the highest labor force participation rate are those with the educational attainment of high school diploma, with 100.0% or 24 individuals in the labor force. Within the labor force, individuals with less than high school education have the highest percentage of unemployment, with 100.0% or 43 of them being unemployed.
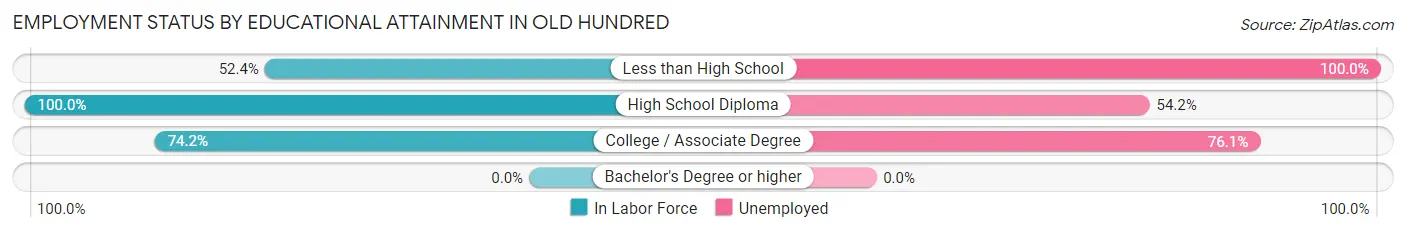
| Educational Attainment | In Labor Force | Unemployed |
| Less than High School | 43 (52.4%) | 82 (100.0%) |
| High School Diploma | 24 (100.0%) | 13 (54.2%) |
| College / Associate Degree | 46 (74.2%) | 47 (76.1%) |
| Bachelor's Degree or higher | 0 (0.0%) | 0 (0.0%) |
| Total | 113 (67.3%) | 135 (80.5%) |
Employment Occupations by Sex in Old Hundred
Management, Business, Science and Arts Occupations
The most common Management, Business, Science and Arts occupations in Old Hundred are , and Management (11 | 50.0%).
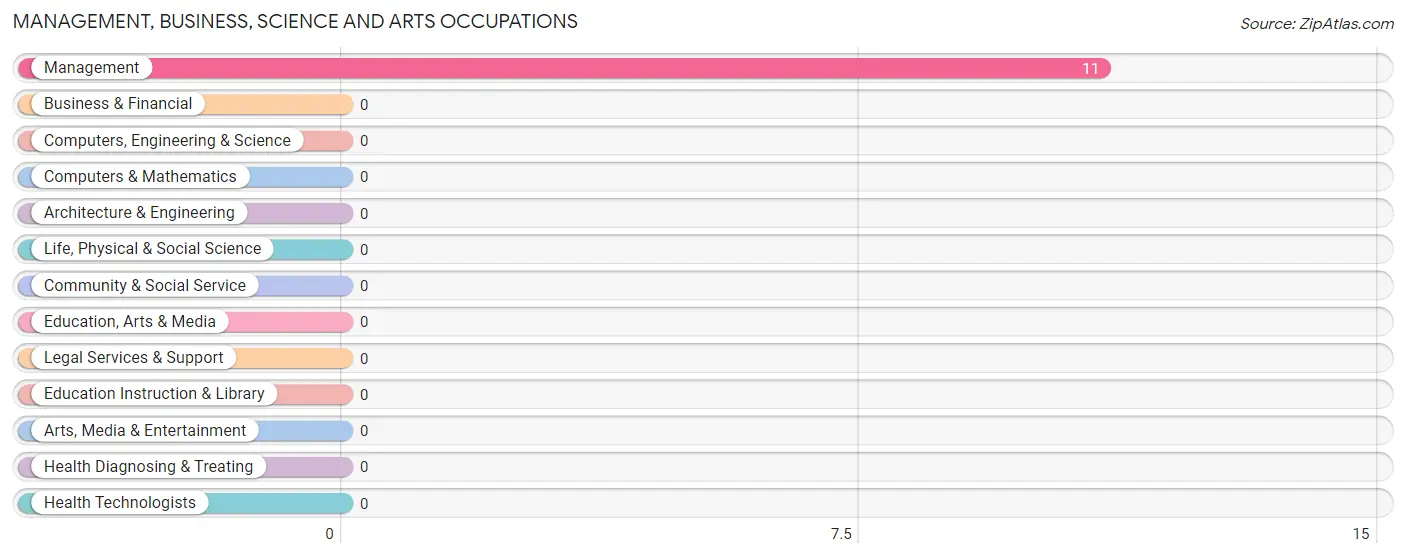
Management, Business, Science and Arts Occupations by Sex
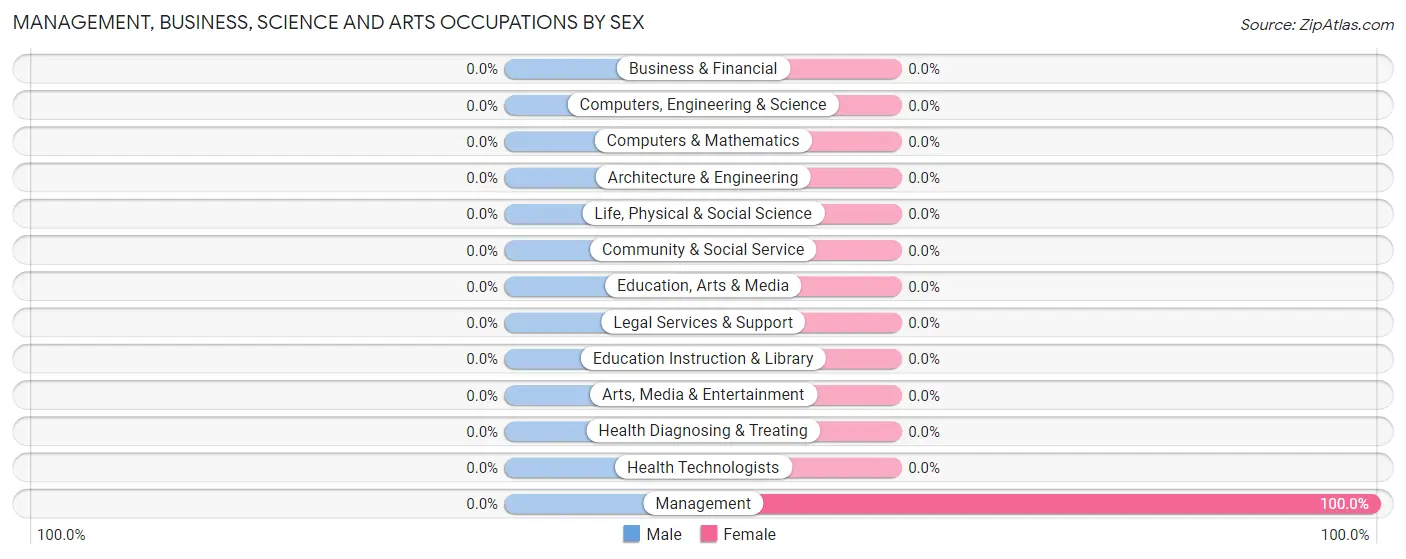
| Occupation | Male | Female |
| Management | 0 (0.0%) | 11 (100.0%) |
| Business & Financial | 0 (0.0%) | 0 (0.0%) |
| Computers, Engineering & Science | 0 (0.0%) | 0 (0.0%) |
| Computers & Mathematics | 0 (0.0%) | 0 (0.0%) |
| Architecture & Engineering | 0 (0.0%) | 0 (0.0%) |
| Life, Physical & Social Science | 0 (0.0%) | 0 (0.0%) |
| Community & Social Service | 0 (0.0%) | 0 (0.0%) |
| Education, Arts & Media | 0 (0.0%) | 0 (0.0%) |
| Legal Services & Support | 0 (0.0%) | 0 (0.0%) |
| Education Instruction & Library | 0 (0.0%) | 0 (0.0%) |
| Arts, Media & Entertainment | 0 (0.0%) | 0 (0.0%) |
| Health Diagnosing & Treating | 0 (0.0%) | 0 (0.0%) |
| Health Technologists | 0 (0.0%) | 0 (0.0%) |
| Total (Category) | 0 (0.0%) | 11 (100.0%) |
| Total (Overall) | 0 (0.0%) | 22 (100.0%) |
Services Occupations
Services Occupations by Sex
| Occupation | Male | Female |
| Healthcare Support | 0 (0.0%) | 0 (0.0%) |
| Security & Protection | 0 (0.0%) | 0 (0.0%) |
| Firefighting & Prevention | 0 (0.0%) | 0 (0.0%) |
| Law Enforcement | 0 (0.0%) | 0 (0.0%) |
| Food Preparation & Serving | 0 (0.0%) | 0 (0.0%) |
| Cleaning & Maintenance | 0 (0.0%) | 0 (0.0%) |
| Personal Care & Service | 0 (0.0%) | 0 (0.0%) |
| Total (Category) | 0 (0.0%) | 0 (0.0%) |
| Total (Overall) | 0 (0.0%) | 22 (100.0%) |
Sales and Office Occupations
Sales and Office Occupations by Sex
| Occupation | Male | Female |
| Sales & Related | 0 (0.0%) | 0 (0.0%) |
| Office & Administration | 0 (0.0%) | 0 (0.0%) |
| Total (Category) | 0 (0.0%) | 0 (0.0%) |
| Total (Overall) | 0 (0.0%) | 22 (100.0%) |
Natural Resources, Construction and Maintenance Occupations
Natural Resources, Construction and Maintenance Occupations by Sex
| Occupation | Male | Female |
| Farming, Fishing & Forestry | 0 (0.0%) | 0 (0.0%) |
| Construction & Extraction | 0 (0.0%) | 0 (0.0%) |
| Installation, Maintenance & Repair | 0 (0.0%) | 0 (0.0%) |
| Total (Category) | 0 (0.0%) | 0 (0.0%) |
| Total (Overall) | 0 (0.0%) | 22 (100.0%) |
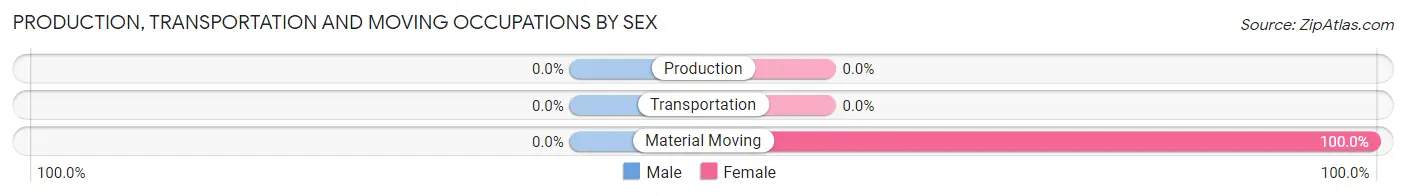
Production, Transportation and Moving Occupations
The most common Production, Transportation and Moving occupations in Old Hundred are , and Material Moving (11 | 50.0%).
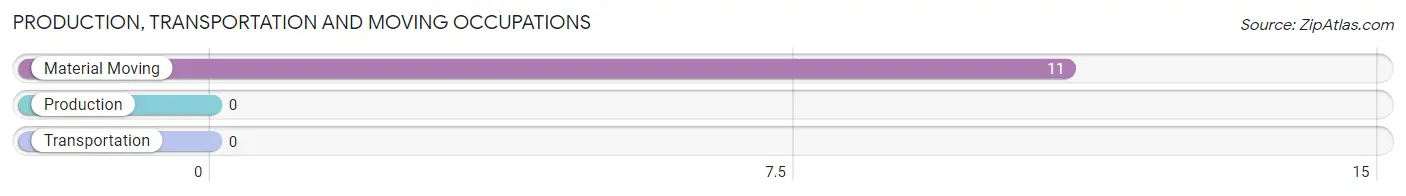
Production, Transportation and Moving Occupations by Sex
| Occupation | Male | Female |
| Production | 0 (0.0%) | 0 (0.0%) |
| Transportation | 0 (0.0%) | 0 (0.0%) |
| Material Moving | 0 (0.0%) | 11 (100.0%) |
| Total (Category) | 0 (0.0%) | 11 (100.0%) |
| Total (Overall) | 0 (0.0%) | 22 (100.0%) |
Employment Industries by Sex in Old Hundred
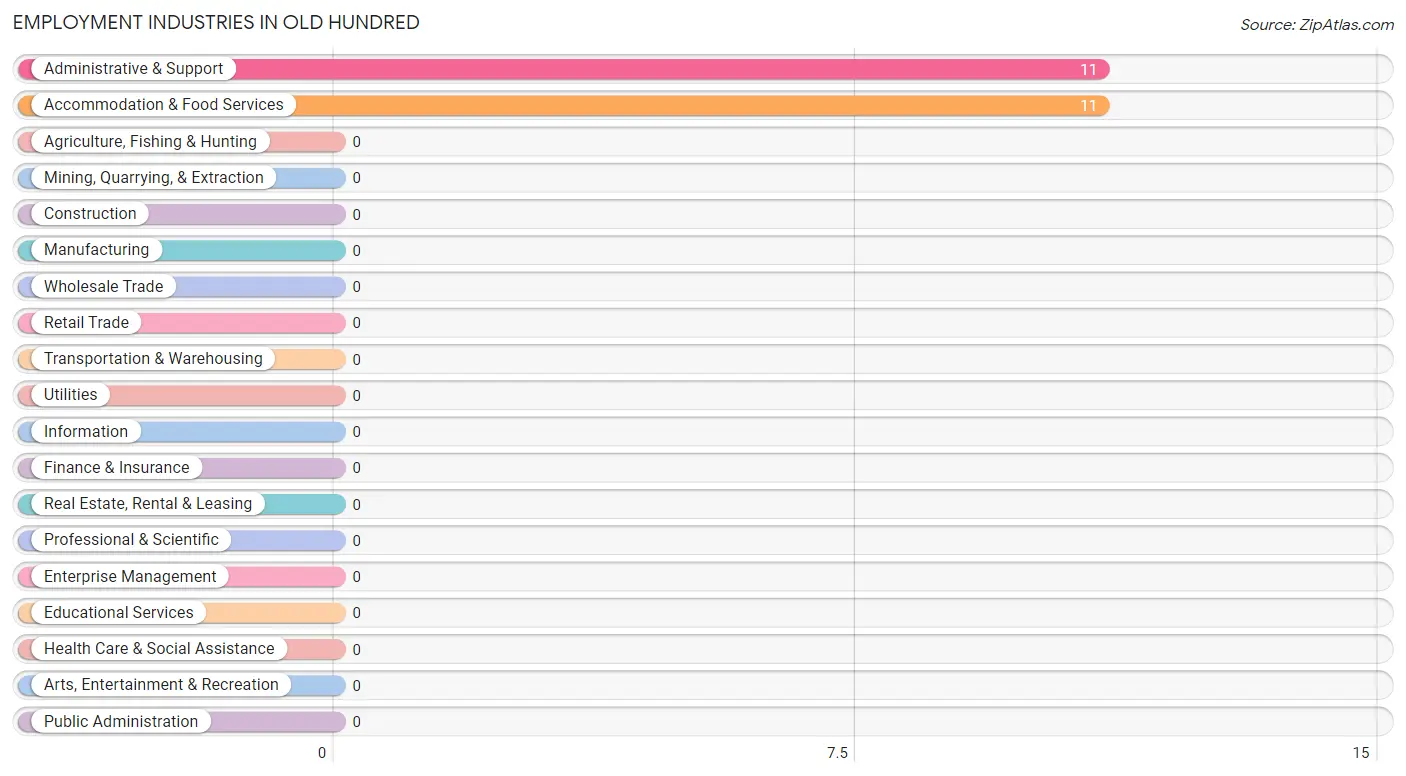
Employment Industries in Old Hundred
The major employment industries in Old Hundred include Administrative & Support (11 | 50.0%), and Accommodation & Food Services (11 | 50.0%).
Employment Industries by Sex in Old Hundred
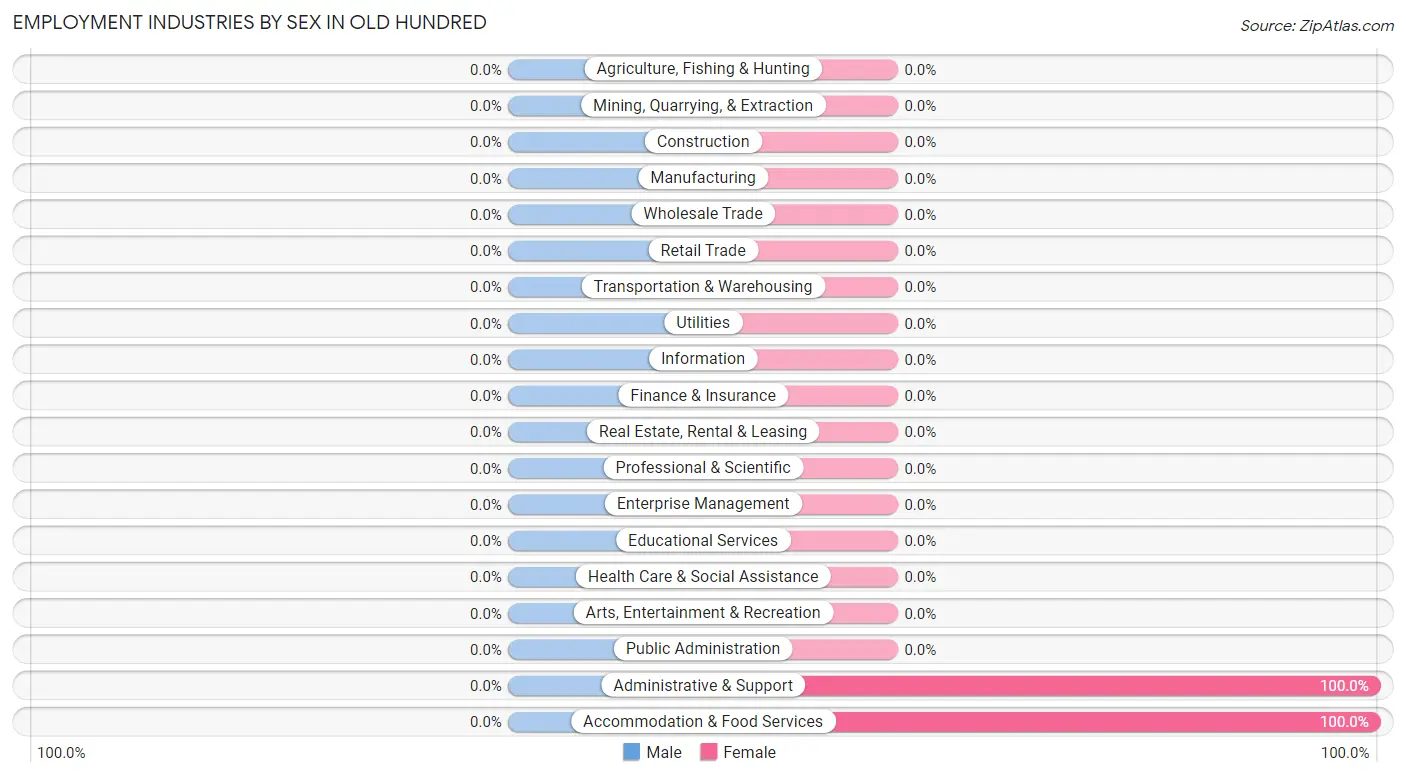
| Industry | Male | Female |
| Agriculture, Fishing & Hunting | 0 (0.0%) | 0 (0.0%) |
| Mining, Quarrying, & Extraction | 0 (0.0%) | 0 (0.0%) |
| Construction | 0 (0.0%) | 0 (0.0%) |
| Manufacturing | 0 (0.0%) | 0 (0.0%) |
| Wholesale Trade | 0 (0.0%) | 0 (0.0%) |
| Retail Trade | 0 (0.0%) | 0 (0.0%) |
| Transportation & Warehousing | 0 (0.0%) | 0 (0.0%) |
| Utilities | 0 (0.0%) | 0 (0.0%) |
| Information | 0 (0.0%) | 0 (0.0%) |
| Finance & Insurance | 0 (0.0%) | 0 (0.0%) |
| Real Estate, Rental & Leasing | 0 (0.0%) | 0 (0.0%) |
| Professional & Scientific | 0 (0.0%) | 0 (0.0%) |
| Enterprise Management | 0 (0.0%) | 0 (0.0%) |
| Administrative & Support | 0 (0.0%) | 11 (100.0%) |
| Educational Services | 0 (0.0%) | 0 (0.0%) |
| Health Care & Social Assistance | 0 (0.0%) | 0 (0.0%) |
| Arts, Entertainment & Recreation | 0 (0.0%) | 0 (0.0%) |
| Accommodation & Food Services | 0 (0.0%) | 11 (100.0%) |
| Public Administration | 0 (0.0%) | 0 (0.0%) |
| Total | 0 (0.0%) | 22 (100.0%) |
Education in Old Hundred
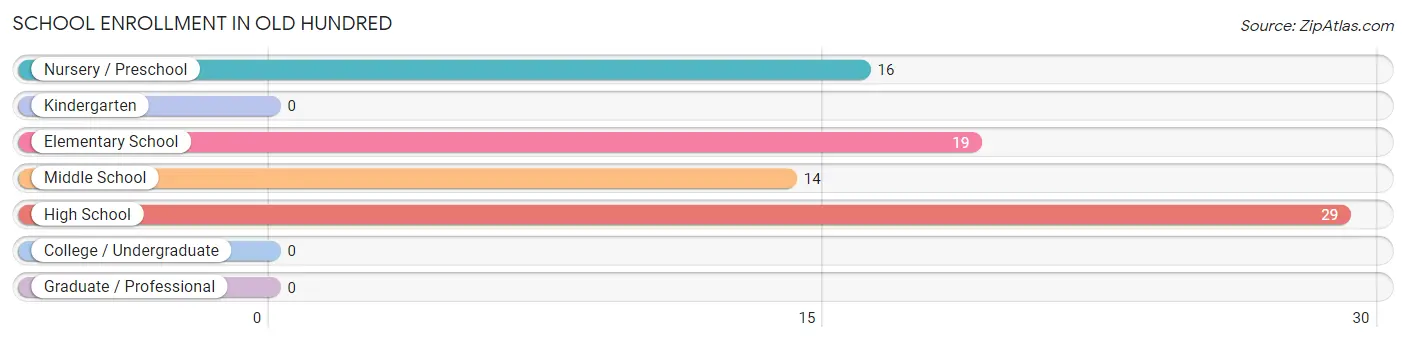
School Enrollment in Old Hundred
The most common levels of schooling among the 78 students in Old Hundred are high school (29 | 37.2%), elementary school (19 | 24.4%), and nursery / preschool (16 | 20.5%).
| School Level | # Students | % Students |
| Nursery / Preschool | 16 | 20.5% |
| Kindergarten | 0 | 0.0% |
| Elementary School | 19 | 24.4% |
| Middle School | 14 | 17.9% |
| High School | 29 | 37.2% |
| College / Undergraduate | 0 | 0.0% |
| Graduate / Professional | 0 | 0.0% |
| Total | 78 | 100.0% |
School Enrollment by Age by Funding Source in Old Hundred
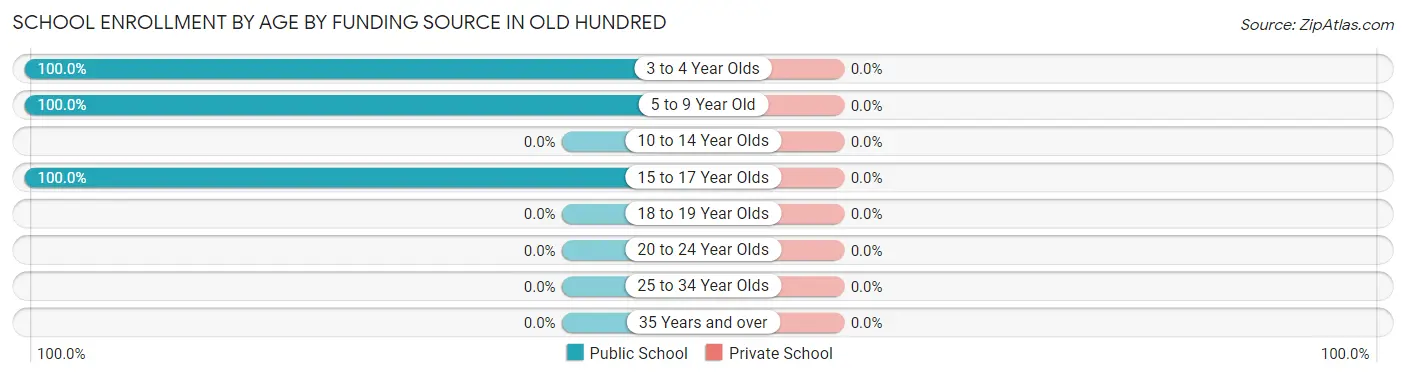
| Age Bracket | Public School | Private School |
| 3 to 4 Year Olds | 16 (100.0%) | 0 (0.0%) |
| 5 to 9 Year Old | 33 (100.0%) | 0 (0.0%) |
| 10 to 14 Year Olds | 0 (0.0%) | 0 (0.0%) |
| 15 to 17 Year Olds | 29 (100.0%) | 0 (0.0%) |
| 18 to 19 Year Olds | 0 (0.0%) | 0 (0.0%) |
| 20 to 24 Year Olds | 0 (0.0%) | 0 (0.0%) |
| 25 to 34 Year Olds | 0 (0.0%) | 0 (0.0%) |
| 35 Years and over | 0 (0.0%) | 0 (0.0%) |
| Total | 78 (100.0%) | 0 (0.0%) |
Educational Attainment by Field of Study in Old Hundred
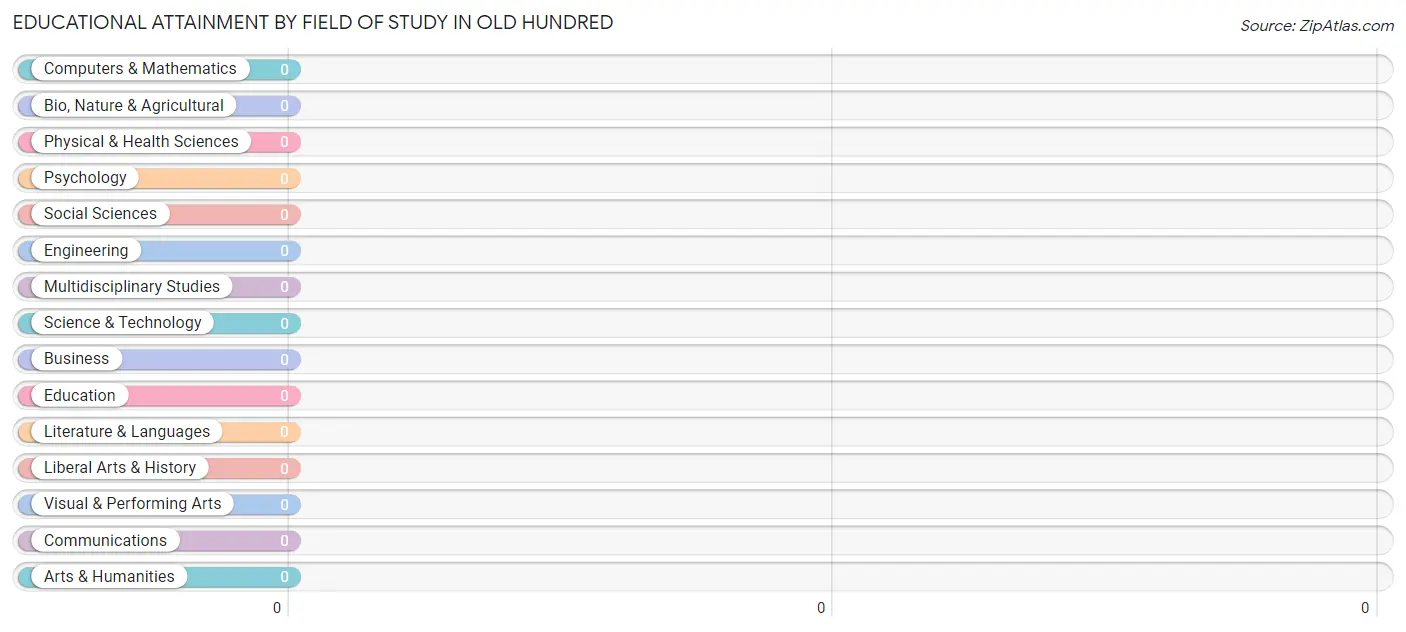
| Field of Study | # Graduates | % Graduates |
| Computers & Mathematics | 0 | 0.0% |
| Bio, Nature & Agricultural | 0 | 0.0% |
| Physical & Health Sciences | 0 | 0.0% |
| Psychology | 0 | 0.0% |
| Social Sciences | 0 | 0.0% |
| Engineering | 0 | 0.0% |
| Multidisciplinary Studies | 0 | 0.0% |
| Science & Technology | 0 | 0.0% |
| Business | 0 | 0.0% |
| Education | 0 | 0.0% |
| Literature & Languages | 0 | 0.0% |
| Liberal Arts & History | 0 | 0.0% |
| Visual & Performing Arts | 0 | 0.0% |
| Communications | 0 | 0.0% |
| Arts & Humanities | 0 | 0.0% |
| Total | 0 | 0.0% |
Transportation & Commute in Old Hundred
Vehicle Availability by Sex in Old Hundred
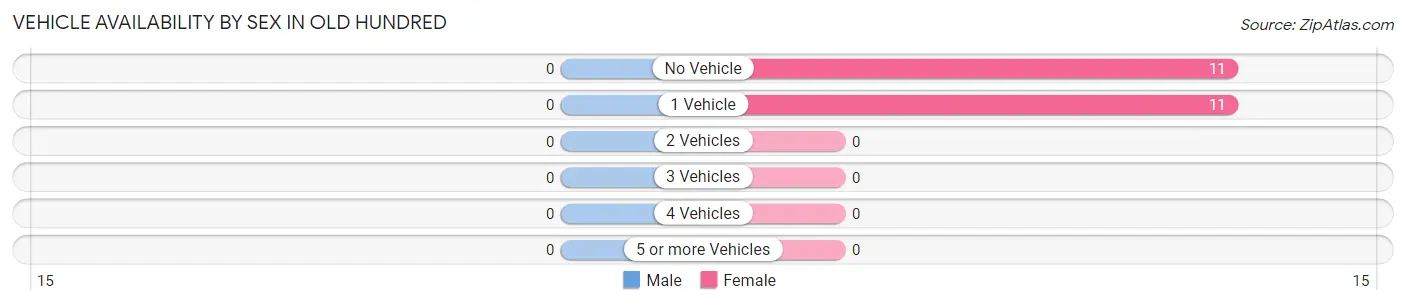
| Vehicles Available | Male | Female |
| No Vehicle | 0 (0.0%) | 11 (50.0%) |
| 1 Vehicle | 0 (0.0%) | 11 (50.0%) |
| 2 Vehicles | 0 (0.0%) | 0 (0.0%) |
| 3 Vehicles | 0 (0.0%) | 0 (0.0%) |
| 4 Vehicles | 0 (0.0%) | 0 (0.0%) |
| 5 or more Vehicles | 0 (0.0%) | 0 (0.0%) |
| Total | 0 (0.0%) | 22 (100.0%) |
Commute Time in Old Hundred
The most frequently occuring commute durations in Old Hundred are 35 to 39 minutes (11 commuters, 50.0%), 90 or more minutes (11 commuters, 50.0%), and less than 5 minutes (0 commuters, 0.0%).
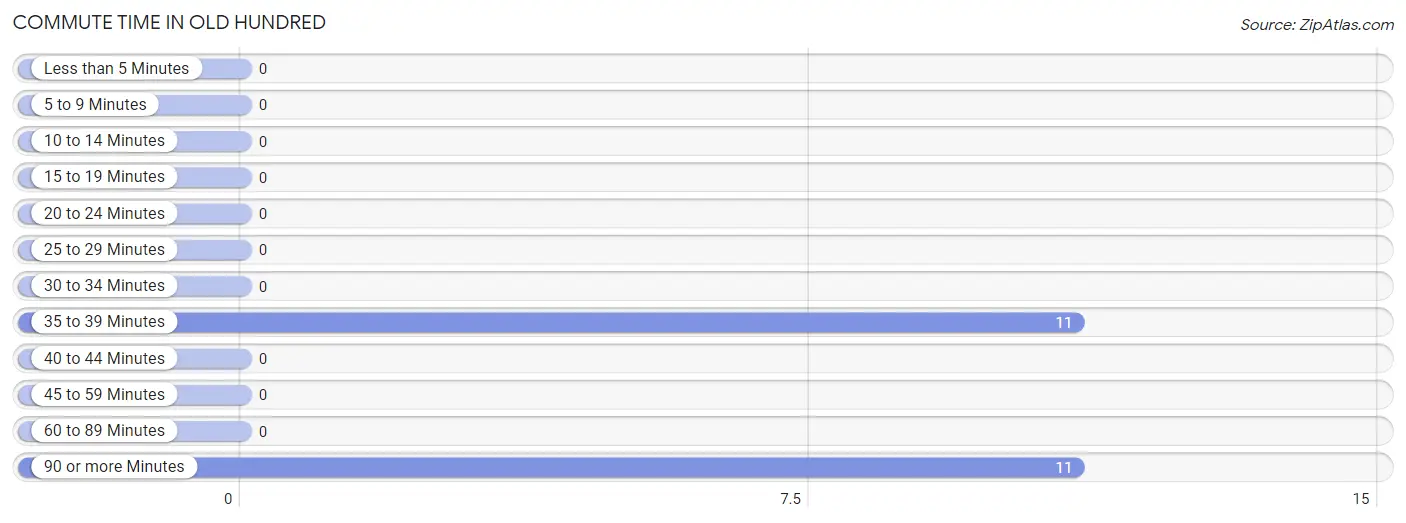
| Commute Time | # Commuters | % Commuters |
| Less than 5 Minutes | 0 | 0.0% |
| 5 to 9 Minutes | 0 | 0.0% |
| 10 to 14 Minutes | 0 | 0.0% |
| 15 to 19 Minutes | 0 | 0.0% |
| 20 to 24 Minutes | 0 | 0.0% |
| 25 to 29 Minutes | 0 | 0.0% |
| 30 to 34 Minutes | 0 | 0.0% |
| 35 to 39 Minutes | 11 | 50.0% |
| 40 to 44 Minutes | 0 | 0.0% |
| 45 to 59 Minutes | 0 | 0.0% |
| 60 to 89 Minutes | 0 | 0.0% |
| 90 or more Minutes | 11 | 50.0% |
Commute Time by Sex in Old Hundred
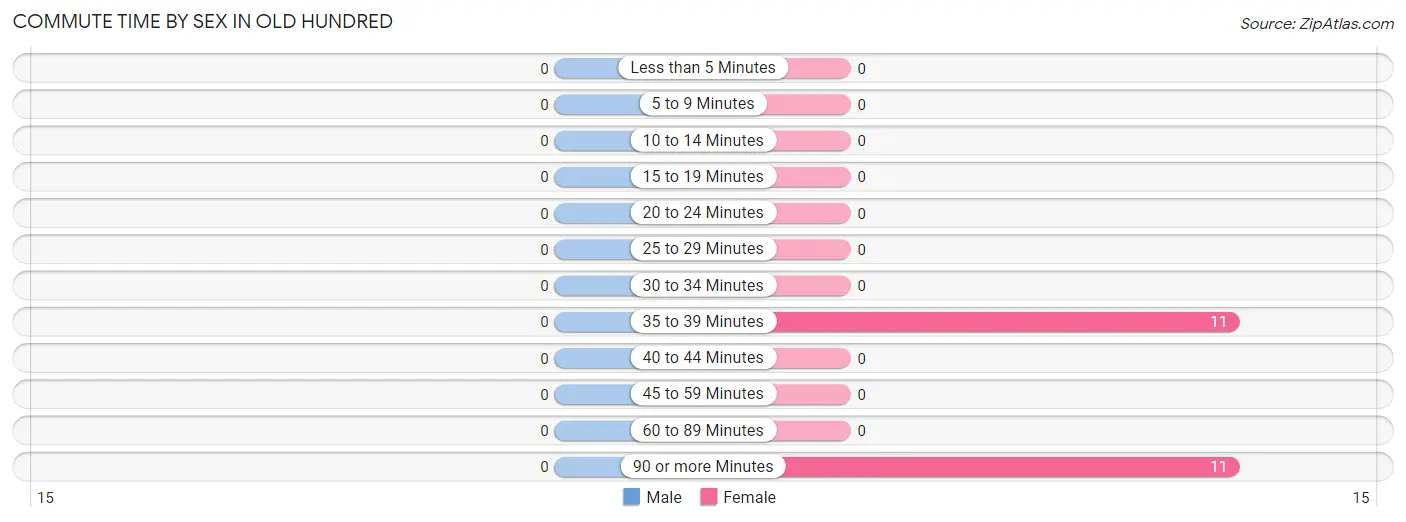
| Commute Time | Male | Female |
| Less than 5 Minutes | 0 (0.0%) | 0 (0.0%) |
| 5 to 9 Minutes | 0 (0.0%) | 0 (0.0%) |
| 10 to 14 Minutes | 0 (0.0%) | 0 (0.0%) |
| 15 to 19 Minutes | 0 (0.0%) | 0 (0.0%) |
| 20 to 24 Minutes | 0 (0.0%) | 0 (0.0%) |
| 25 to 29 Minutes | 0 (0.0%) | 0 (0.0%) |
| 30 to 34 Minutes | 0 (0.0%) | 0 (0.0%) |
| 35 to 39 Minutes | 0 (0.0%) | 11 (50.0%) |
| 40 to 44 Minutes | 0 (0.0%) | 0 (0.0%) |
| 45 to 59 Minutes | 0 (0.0%) | 0 (0.0%) |
| 60 to 89 Minutes | 0 (0.0%) | 0 (0.0%) |
| 90 or more Minutes | 0 (0.0%) | 11 (50.0%) |
Time of Departure to Work by Sex in Old Hundred
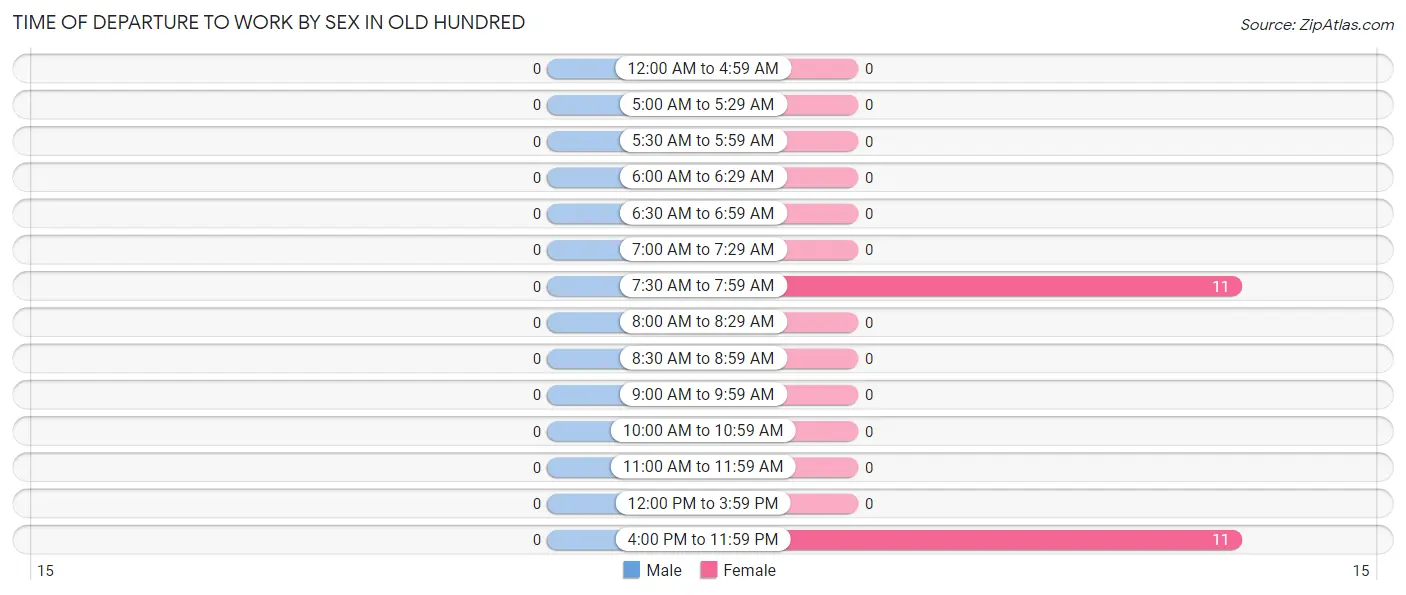
| Time of Departure | Male | Female |
| 12:00 AM to 4:59 AM | 0 (0.0%) | 0 (0.0%) |
| 5:00 AM to 5:29 AM | 0 (0.0%) | 0 (0.0%) |
| 5:30 AM to 5:59 AM | 0 (0.0%) | 0 (0.0%) |
| 6:00 AM to 6:29 AM | 0 (0.0%) | 0 (0.0%) |
| 6:30 AM to 6:59 AM | 0 (0.0%) | 0 (0.0%) |
| 7:00 AM to 7:29 AM | 0 (0.0%) | 0 (0.0%) |
| 7:30 AM to 7:59 AM | 0 (0.0%) | 11 (50.0%) |
| 8:00 AM to 8:29 AM | 0 (0.0%) | 0 (0.0%) |
| 8:30 AM to 8:59 AM | 0 (0.0%) | 0 (0.0%) |
| 9:00 AM to 9:59 AM | 0 (0.0%) | 0 (0.0%) |
| 10:00 AM to 10:59 AM | 0 (0.0%) | 0 (0.0%) |
| 11:00 AM to 11:59 AM | 0 (0.0%) | 0 (0.0%) |
| 12:00 PM to 3:59 PM | 0 (0.0%) | 0 (0.0%) |
| 4:00 PM to 11:59 PM | 0 (0.0%) | 11 (50.0%) |
| Total | 0 (0.0%) | 22 (100.0%) |
Housing Occupancy in Old Hundred
Occupancy by Ownership in Old Hundred
Of the total 78 dwellings in Old Hundred, owner-occupied units account for 34 (43.6%), while renter-occupied units make up 44 (56.4%).
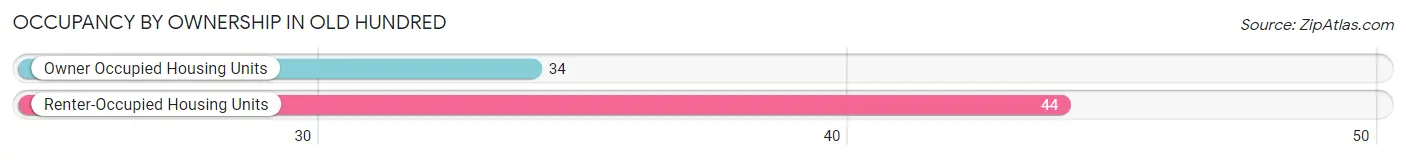
| Occupancy | # Housing Units | % Housing Units |
| Owner Occupied Housing Units | 34 | 43.6% |
| Renter-Occupied Housing Units | 44 | 56.4% |
| Total Occupied Housing Units | 78 | 100.0% |
Occupancy by Household Size in Old Hundred
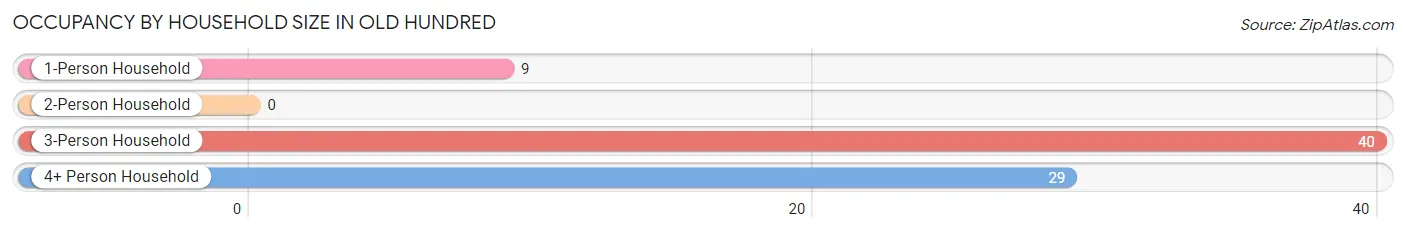
| Household Size | # Housing Units | % Housing Units |
| 1-Person Household | 9 | 11.5% |
| 2-Person Household | 0 | 0.0% |
| 3-Person Household | 40 | 51.3% |
| 4+ Person Household | 29 | 37.2% |
| Total Housing Units | 78 | 100.0% |
Occupancy by Ownership by Household Size in Old Hundred
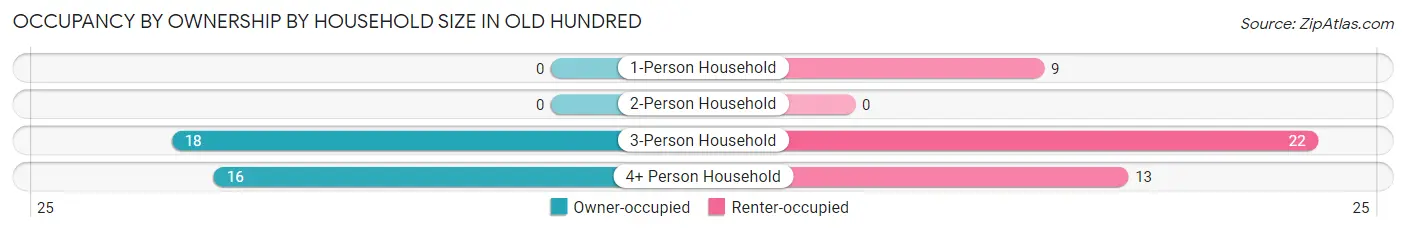
| Household Size | Owner-occupied | Renter-occupied |
| 1-Person Household | 0 (0.0%) | 9 (100.0%) |
| 2-Person Household | 0 (0.0%) | 0 (0.0%) |
| 3-Person Household | 18 (45.0%) | 22 (55.0%) |
| 4+ Person Household | 16 (55.2%) | 13 (44.8%) |
| Total Housing Units | 34 (43.6%) | 44 (56.4%) |
Occupancy by Educational Attainment in Old Hundred
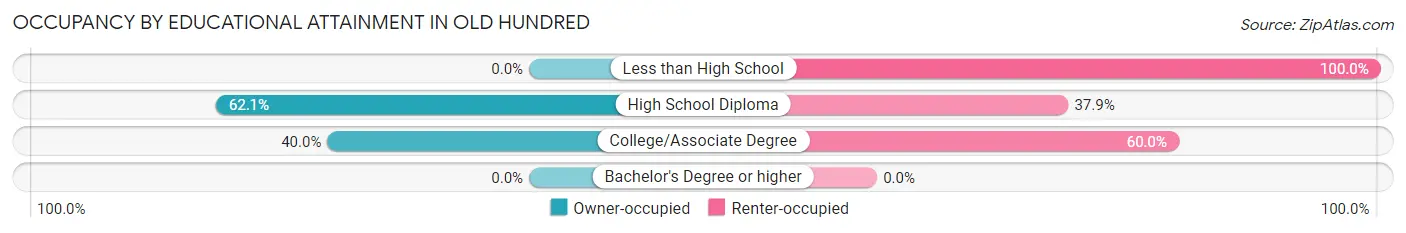
| Household Size | Owner-occupied | Renter-occupied |
| Less than High School | 0 (0.0%) | 9 (100.0%) |
| High School Diploma | 18 (62.1%) | 11 (37.9%) |
| College/Associate Degree | 16 (40.0%) | 24 (60.0%) |
| Bachelor's Degree or higher | 0 (0.0%) | 0 (0.0%) |
Occupancy by Age of Householder in Old Hundred
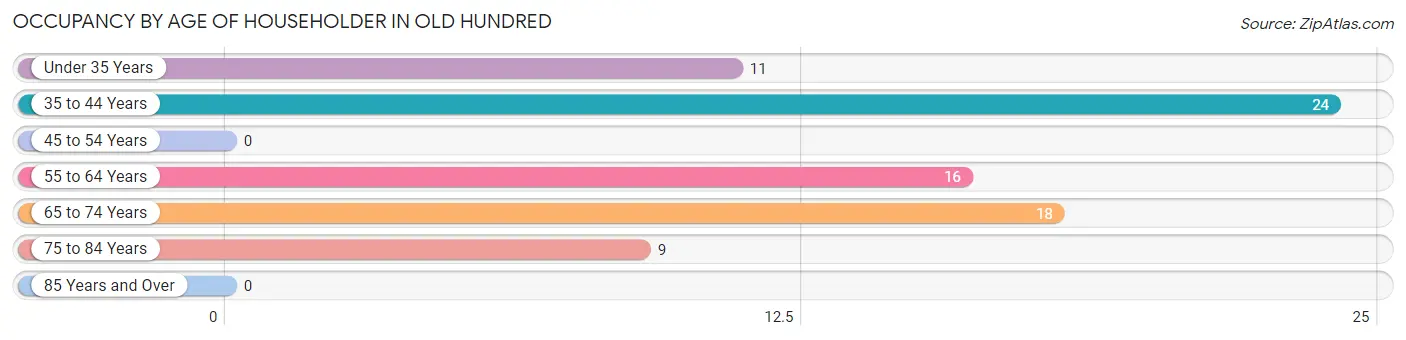
| Age Bracket | # Households | % Households |
| Under 35 Years | 11 | 14.1% |
| 35 to 44 Years | 24 | 30.8% |
| 45 to 54 Years | 0 | 0.0% |
| 55 to 64 Years | 16 | 20.5% |
| 65 to 74 Years | 18 | 23.1% |
| 75 to 84 Years | 9 | 11.5% |
| 85 Years and Over | 0 | 0.0% |
| Total | 78 | 100.0% |
Housing Finances in Old Hundred
Median Income by Occupancy in Old Hundred
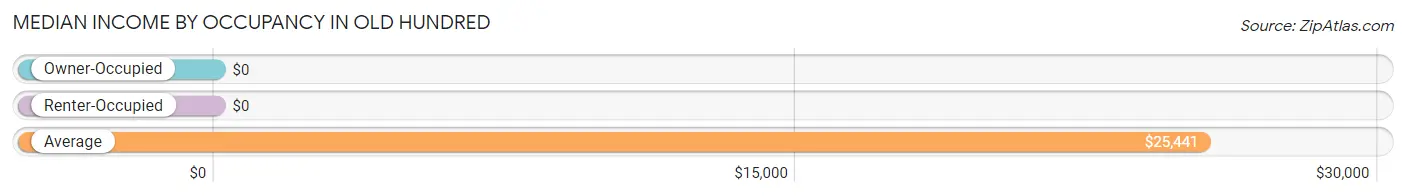
| Occupancy Type | # Households | Median Income |
| Owner-Occupied | 34 (43.6%) | $0 |
| Renter-Occupied | 44 (56.4%) | $0 |
| Average | 78 (100.0%) | $25,441 |
Occupancy by Householder Income Bracket in Old Hundred

| Income Bracket | Owner-occupied | Renter-occupied |
| Less than $5,000 | 0 (0.0%) | 13 (29.5%) |
| $5,000 to $9,999 | 0 (0.0%) | 11 (25.0%) |
| $10,000 to $14,999 | 0 (0.0%) | 9 (20.4%) |
| $15,000 to $19,999 | 0 (0.0%) | 0 (0.0%) |
| $20,000 to $24,999 | 0 (0.0%) | 0 (0.0%) |
| $25,000 to $34,999 | 34 (100.0%) | 0 (0.0%) |
| $35,000 to $49,999 | 0 (0.0%) | 11 (25.0%) |
| $50,000 to $74,999 | 0 (0.0%) | 0 (0.0%) |
| $75,000 to $99,999 | 0 (0.0%) | 0 (0.0%) |
| $100,000 to $149,999 | 0 (0.0%) | 0 (0.0%) |
| $150,000 or more | 0 (0.0%) | 0 (0.0%) |
| Total | 34 (100.0%) | 44 (100.0%) |
Monthly Housing Cost Tiers in Old Hundred
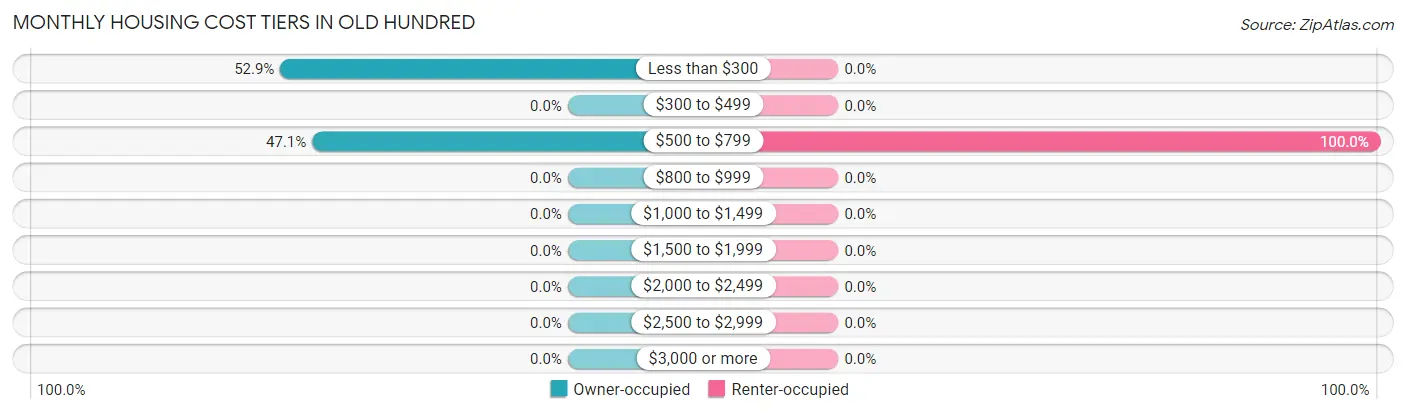
| Monthly Cost | Owner-occupied | Renter-occupied |
| Less than $300 | 18 (52.9%) | 0 (0.0%) |
| $300 to $499 | 0 (0.0%) | 0 (0.0%) |
| $500 to $799 | 16 (47.1%) | 44 (100.0%) |
| $800 to $999 | 0 (0.0%) | 0 (0.0%) |
| $1,000 to $1,499 | 0 (0.0%) | 0 (0.0%) |
| $1,500 to $1,999 | 0 (0.0%) | 0 (0.0%) |
| $2,000 to $2,499 | 0 (0.0%) | 0 (0.0%) |
| $2,500 to $2,999 | 0 (0.0%) | 0 (0.0%) |
| $3,000 or more | 0 (0.0%) | 0 (0.0%) |
| Total | 34 (100.0%) | 44 (100.0%) |
Physical Housing Characteristics in Old Hundred
Housing Structures in Old Hundred
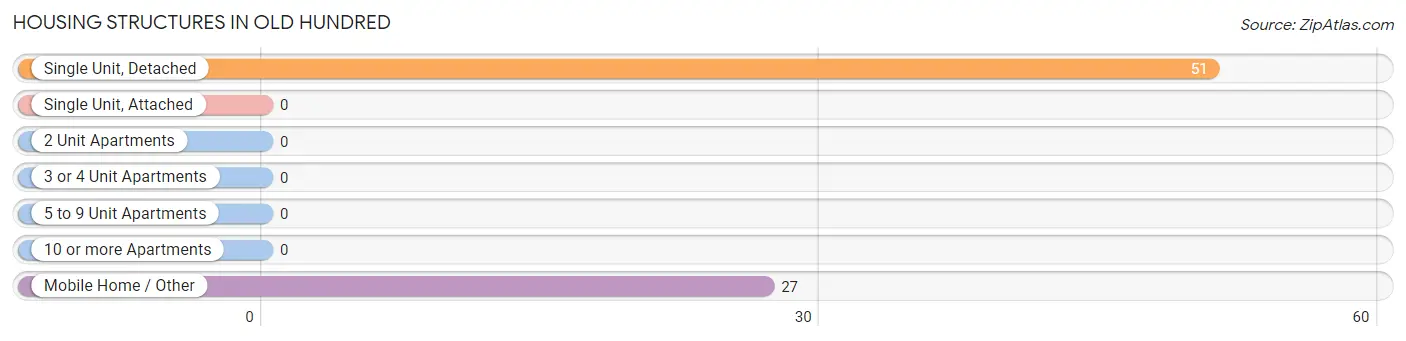
| Structure Type | # Housing Units | % Housing Units |
| Single Unit, Detached | 51 | 65.4% |
| Single Unit, Attached | 0 | 0.0% |
| 2 Unit Apartments | 0 | 0.0% |
| 3 or 4 Unit Apartments | 0 | 0.0% |
| 5 to 9 Unit Apartments | 0 | 0.0% |
| 10 or more Apartments | 0 | 0.0% |
| Mobile Home / Other | 27 | 34.6% |
| Total | 78 | 100.0% |
Housing Structures by Occupancy in Old Hundred
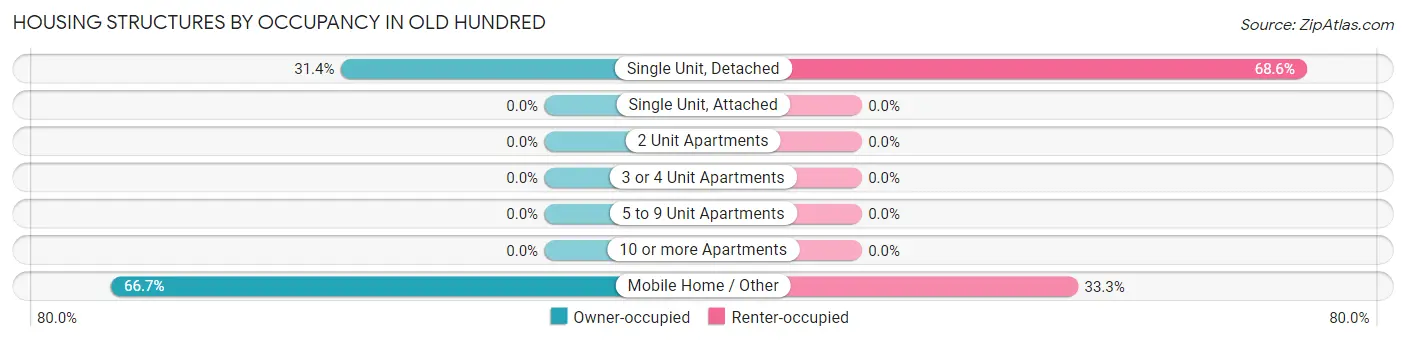
| Structure Type | Owner-occupied | Renter-occupied |
| Single Unit, Detached | 16 (31.4%) | 35 (68.6%) |
| Single Unit, Attached | 0 (0.0%) | 0 (0.0%) |
| 2 Unit Apartments | 0 (0.0%) | 0 (0.0%) |
| 3 or 4 Unit Apartments | 0 (0.0%) | 0 (0.0%) |
| 5 to 9 Unit Apartments | 0 (0.0%) | 0 (0.0%) |
| 10 or more Apartments | 0 (0.0%) | 0 (0.0%) |
| Mobile Home / Other | 18 (66.7%) | 9 (33.3%) |
| Total | 34 (43.6%) | 44 (56.4%) |
Housing Structures by Number of Rooms in Old Hundred
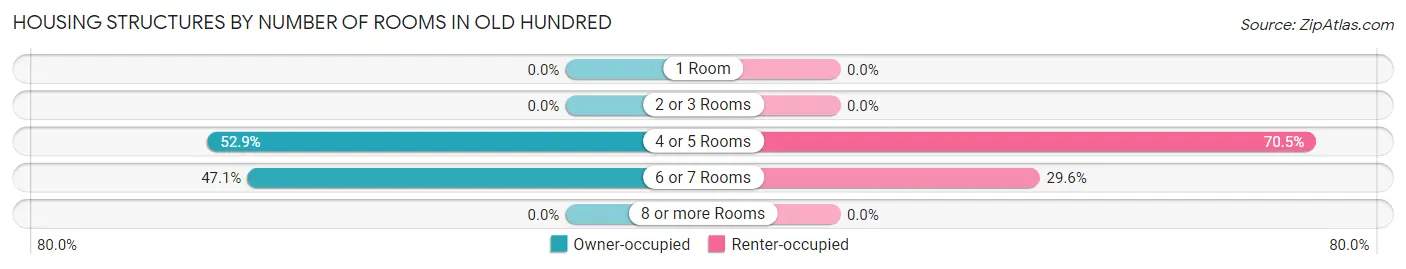
| Number of Rooms | Owner-occupied | Renter-occupied |
| 1 Room | 0 (0.0%) | 0 (0.0%) |
| 2 or 3 Rooms | 0 (0.0%) | 0 (0.0%) |
| 4 or 5 Rooms | 18 (52.9%) | 31 (70.5%) |
| 6 or 7 Rooms | 16 (47.1%) | 13 (29.5%) |
| 8 or more Rooms | 0 (0.0%) | 0 (0.0%) |
| Total | 34 (100.0%) | 44 (100.0%) |
Housing Structure by Heating Type in Old Hundred
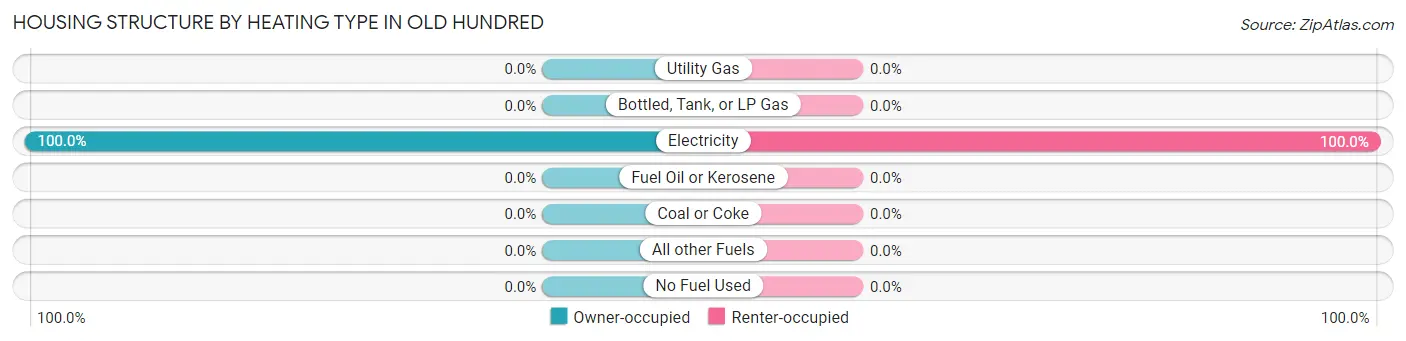
| Heating Type | Owner-occupied | Renter-occupied |
| Utility Gas | 0 (0.0%) | 0 (0.0%) |
| Bottled, Tank, or LP Gas | 0 (0.0%) | 0 (0.0%) |
| Electricity | 34 (100.0%) | 44 (100.0%) |
| Fuel Oil or Kerosene | 0 (0.0%) | 0 (0.0%) |
| Coal or Coke | 0 (0.0%) | 0 (0.0%) |
| All other Fuels | 0 (0.0%) | 0 (0.0%) |
| No Fuel Used | 0 (0.0%) | 0 (0.0%) |
| Total | 34 (100.0%) | 44 (100.0%) |
Household Vehicle Usage in Old Hundred
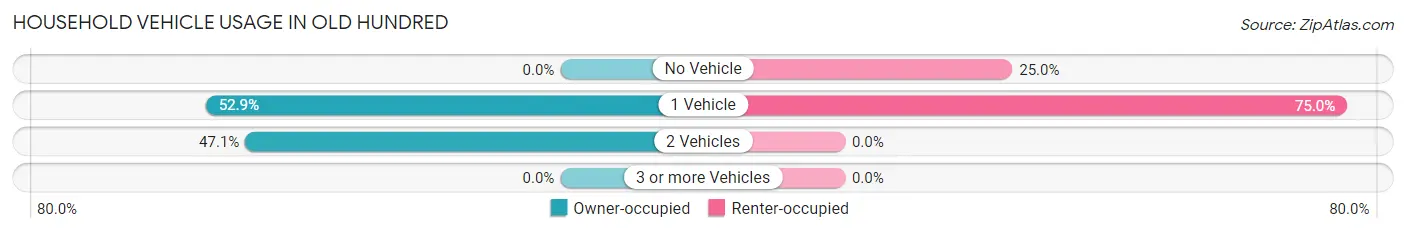
| Vehicles per Household | Owner-occupied | Renter-occupied |
| No Vehicle | 0 (0.0%) | 11 (25.0%) |
| 1 Vehicle | 18 (52.9%) | 33 (75.0%) |
| 2 Vehicles | 16 (47.1%) | 0 (0.0%) |
| 3 or more Vehicles | 0 (0.0%) | 0 (0.0%) |
| Total | 34 (100.0%) | 44 (100.0%) |
Real Estate & Mortgages in Old Hundred
Real Estate and Mortgage Overview in Old Hundred
| Characteristic | Without Mortgage | With Mortgage |
| Housing Units | 34 | 0 |
| Median Property Value | - | - |
| Median Household Income | - | - |
| Monthly Housing Costs | - | - |
| Real Estate Taxes | - | - |
Property Value by Mortgage Status in Old Hundred
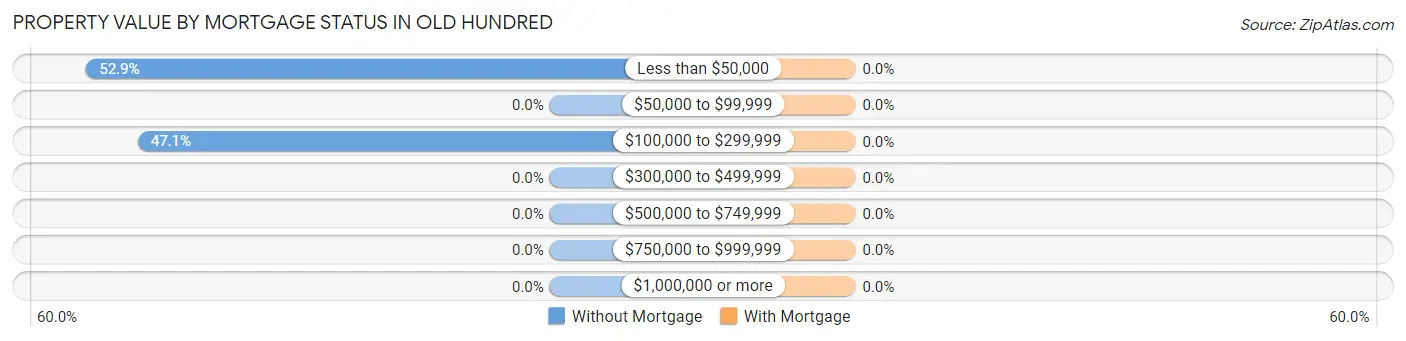
| Property Value | Without Mortgage | With Mortgage |
| Less than $50,000 | 18 (52.9%) | 0 (0.0%) |
| $50,000 to $99,999 | 0 (0.0%) | 0 (0.0%) |
| $100,000 to $299,999 | 16 (47.1%) | 0 (0.0%) |
| $300,000 to $499,999 | 0 (0.0%) | 0 (0.0%) |
| $500,000 to $749,999 | 0 (0.0%) | 0 (0.0%) |
| $750,000 to $999,999 | 0 (0.0%) | 0 (0.0%) |
| $1,000,000 or more | 0 (0.0%) | 0 (0.0%) |
| Total | 34 (100.0%) | 0 (0.0%) |
Household Income by Mortgage Status in Old Hundred
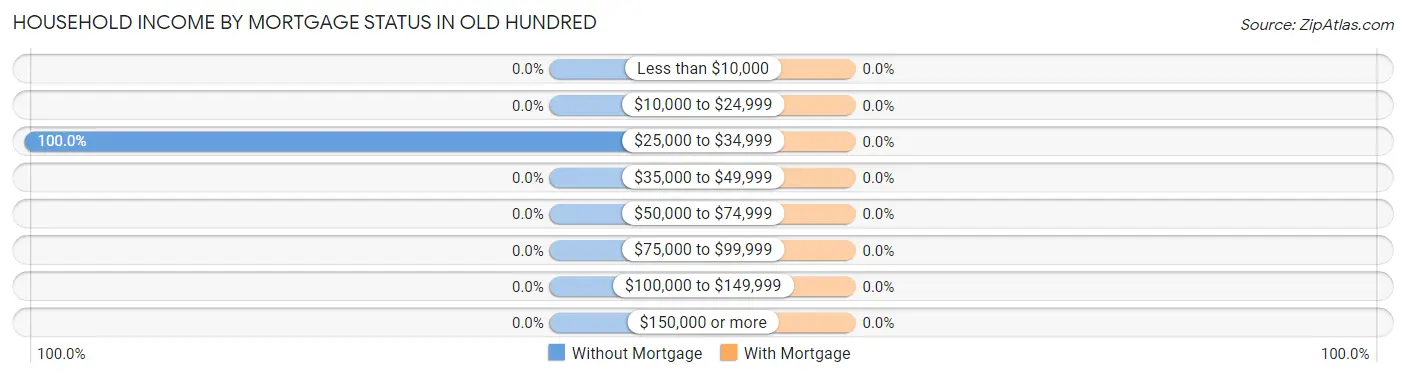
| Household Income | Without Mortgage | With Mortgage |
| Less than $10,000 | 0 (0.0%) | 0 (0.0%) |
| $10,000 to $24,999 | 0 (0.0%) | 0 (0.0%) |
| $25,000 to $34,999 | 34 (100.0%) | 0 (0.0%) |
| $35,000 to $49,999 | 0 (0.0%) | 0 (0.0%) |
| $50,000 to $74,999 | 0 (0.0%) | 0 (0.0%) |
| $75,000 to $99,999 | 0 (0.0%) | 0 (0.0%) |
| $100,000 to $149,999 | 0 (0.0%) | 0 (0.0%) |
| $150,000 or more | 0 (0.0%) | 0 (0.0%) |
| Total | 34 (100.0%) | 0 (0.0%) |
Property Value to Household Income Ratio in Old Hundred
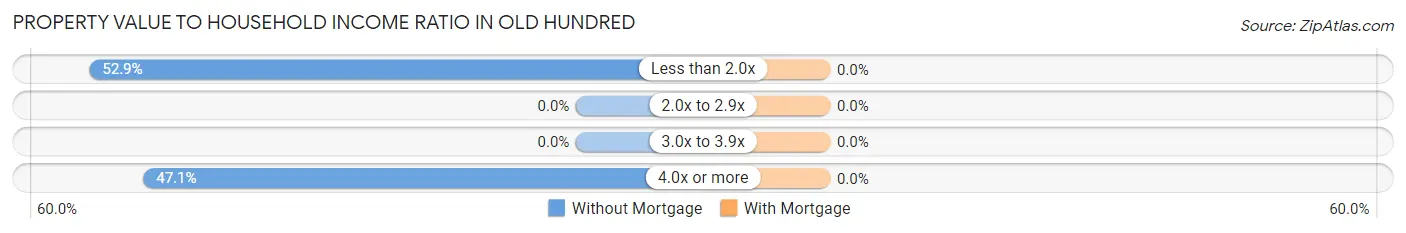
| Value-to-Income Ratio | Without Mortgage | With Mortgage |
| Less than 2.0x | 18 (52.9%) | 0 (0.0%) |
| 2.0x to 2.9x | 0 (0.0%) | 0 (0.0%) |
| 3.0x to 3.9x | 0 (0.0%) | 0 (0.0%) |
| 4.0x or more | 16 (47.1%) | 0 (0.0%) |
| Total | 34 (100.0%) | 0 (0.0%) |
Real Estate Taxes by Mortgage Status in Old Hundred
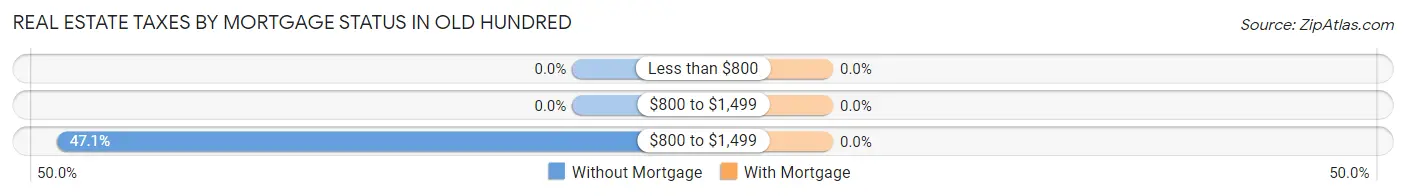
| Property Taxes | Without Mortgage | With Mortgage |
| Less than $800 | 0 (0.0%) | 0 (0.0%) |
| $800 to $1,499 | 0 (0.0%) | 0 (0.0%) |
| $800 to $1,499 | 16 (47.1%) | 0 (0.0%) |
| Total | 34 (100.0%) | 0 (0.0%) |
Health & Disability in Old Hundred
Health Insurance Coverage by Age in Old Hundred
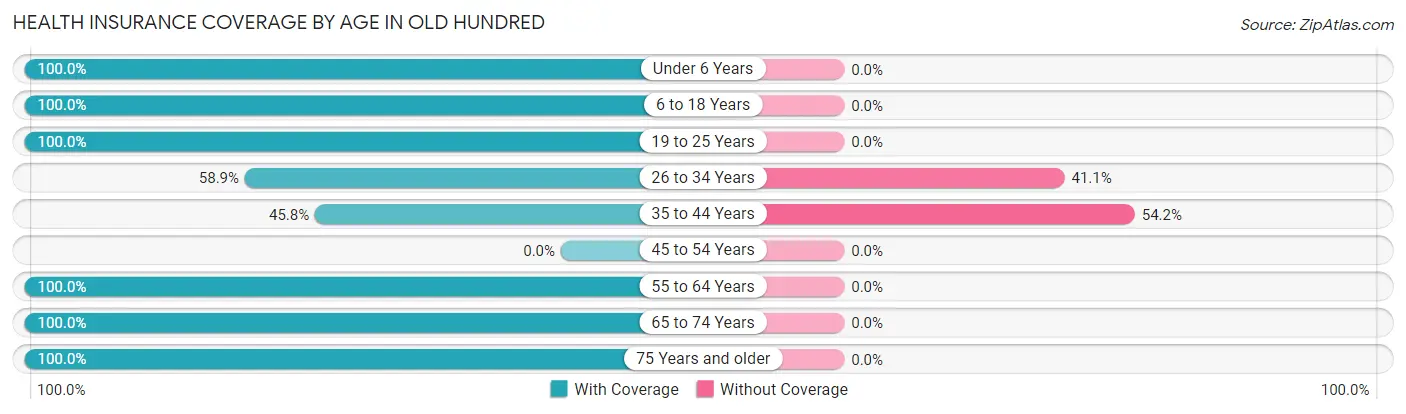
| Age Bracket | With Coverage | Without Coverage |
| Under 6 Years | 36 (100.0%) | 0 (0.0%) |
| 6 to 18 Years | 62 (100.0%) | 0 (0.0%) |
| 19 to 25 Years | 23 (100.0%) | 0 (0.0%) |
| 26 to 34 Years | 66 (58.9%) | 46 (41.1%) |
| 35 to 44 Years | 11 (45.8%) | 13 (54.2%) |
| 45 to 54 Years | 0 (0.0%) | 0 (0.0%) |
| 55 to 64 Years | 32 (100.0%) | 0 (0.0%) |
| 65 to 74 Years | 18 (100.0%) | 0 (0.0%) |
| 75 Years and older | 9 (100.0%) | 0 (0.0%) |
| Total | 257 (81.3%) | 59 (18.7%) |
Health Insurance Coverage by Citizenship Status in Old Hundred
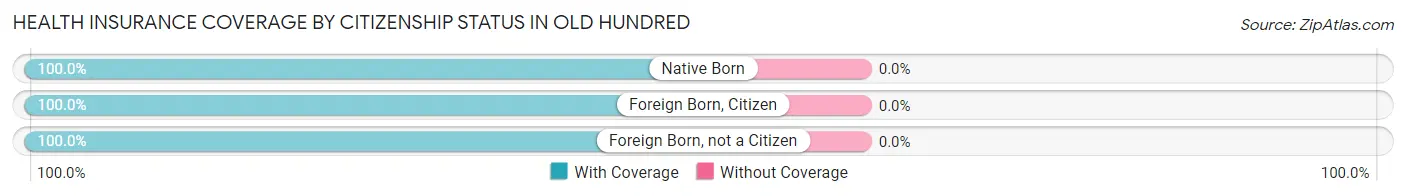
| Citizenship Status | With Coverage | Without Coverage |
| Native Born | 36 (100.0%) | 0 (0.0%) |
| Foreign Born, Citizen | 62 (100.0%) | 0 (0.0%) |
| Foreign Born, not a Citizen | 23 (100.0%) | 0 (0.0%) |
Health Insurance Coverage by Household Income in Old Hundred
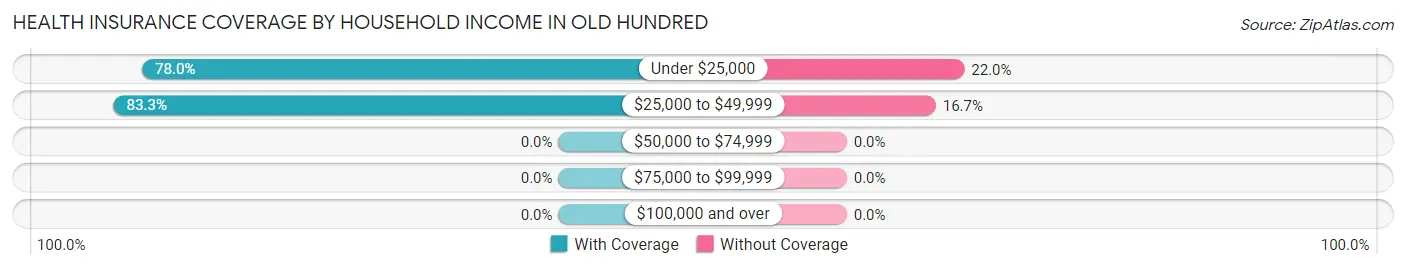
| Household Income | With Coverage | Without Coverage |
| Under $25,000 | 92 (78.0%) | 26 (22.0%) |
| $25,000 to $49,999 | 165 (83.3%) | 33 (16.7%) |
| $50,000 to $74,999 | 0 (0.0%) | 0 (0.0%) |
| $75,000 to $99,999 | 0 (0.0%) | 0 (0.0%) |
| $100,000 and over | 0 (0.0%) | 0 (0.0%) |
Public vs Private Health Insurance Coverage by Age in Old Hundred
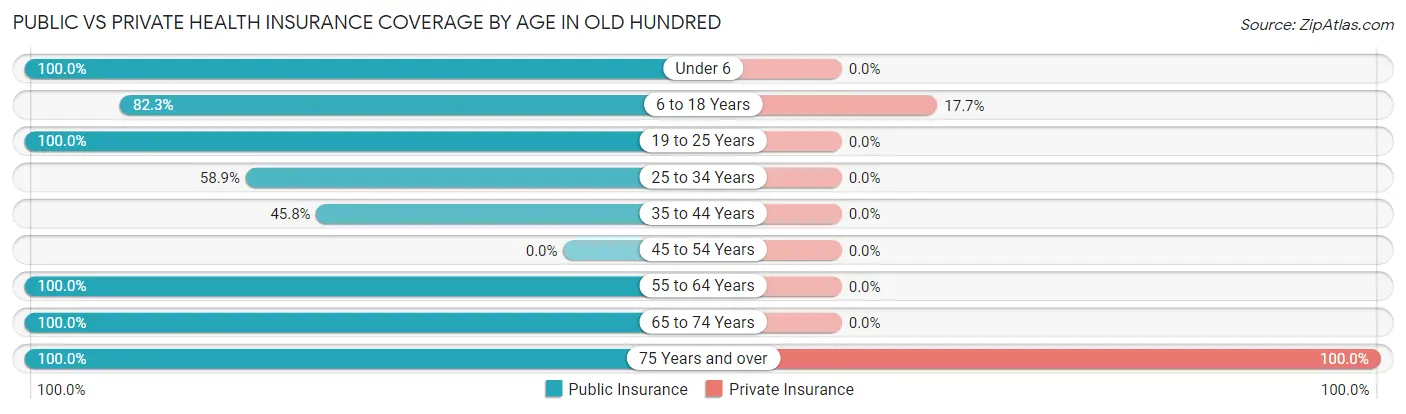
| Age Bracket | Public Insurance | Private Insurance |
| Under 6 | 36 (100.0%) | 0 (0.0%) |
| 6 to 18 Years | 51 (82.3%) | 11 (17.7%) |
| 19 to 25 Years | 23 (100.0%) | 0 (0.0%) |
| 25 to 34 Years | 66 (58.9%) | 0 (0.0%) |
| 35 to 44 Years | 11 (45.8%) | 0 (0.0%) |
| 45 to 54 Years | 0 (0.0%) | 0 (0.0%) |
| 55 to 64 Years | 32 (100.0%) | 0 (0.0%) |
| 65 to 74 Years | 18 (100.0%) | 0 (0.0%) |
| 75 Years and over | 9 (100.0%) | 9 (100.0%) |
| Total | 246 (77.8%) | 20 (6.3%) |
Disability Status by Sex by Age in Old Hundred
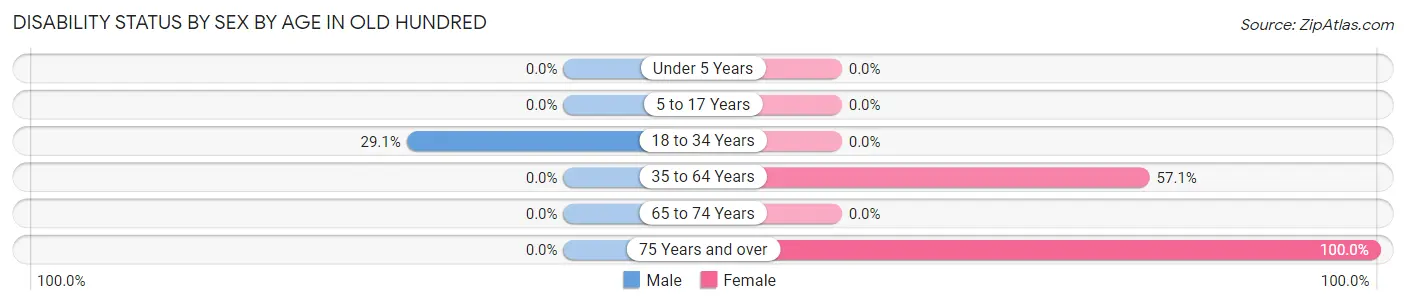
| Age Bracket | Male | Female |
| Under 5 Years | 0 (0.0%) | 0 (0.0%) |
| 5 to 17 Years | 0 (0.0%) | 0 (0.0%) |
| 18 to 34 Years | 23 (29.1%) | 0 (0.0%) |
| 35 to 64 Years | 0 (0.0%) | 32 (57.1%) |
| 65 to 74 Years | 0 (0.0%) | 0 (0.0%) |
| 75 Years and over | 0 (0.0%) | 9 (100.0%) |
Disability Class by Sex by Age in Old Hundred
Disability Class: Hearing Difficulty

| Age Bracket | Male | Female |
| Under 5 Years | 0 (0.0%) | 0 (0.0%) |
| 5 to 17 Years | 0 (0.0%) | 0 (0.0%) |
| 18 to 34 Years | 0 (0.0%) | 0 (0.0%) |
| 35 to 64 Years | 0 (0.0%) | 16 (28.6%) |
| 65 to 74 Years | 0 (0.0%) | 0 (0.0%) |
| 75 Years and over | 0 (0.0%) | 0 (0.0%) |
Disability Class: Vision Difficulty
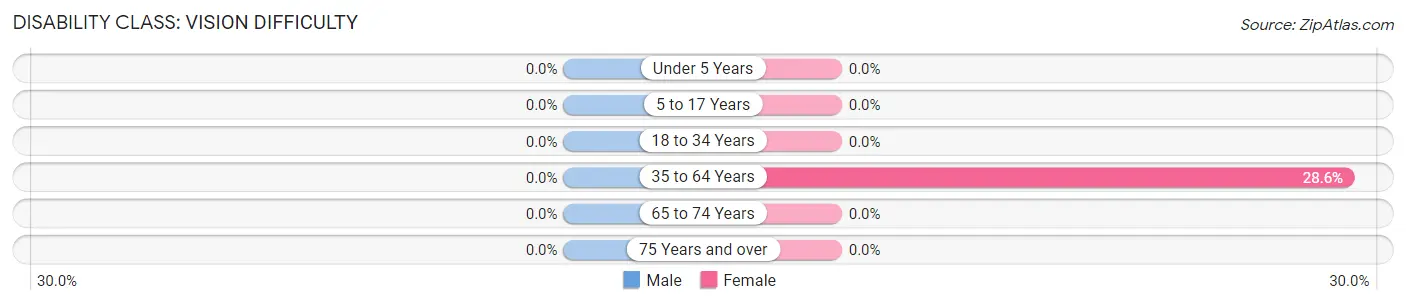
| Age Bracket | Male | Female |
| Under 5 Years | 0 (0.0%) | 0 (0.0%) |
| 5 to 17 Years | 0 (0.0%) | 0 (0.0%) |
| 18 to 34 Years | 0 (0.0%) | 0 (0.0%) |
| 35 to 64 Years | 0 (0.0%) | 16 (28.6%) |
| 65 to 74 Years | 0 (0.0%) | 0 (0.0%) |
| 75 Years and over | 0 (0.0%) | 0 (0.0%) |
Disability Class: Cognitive Difficulty
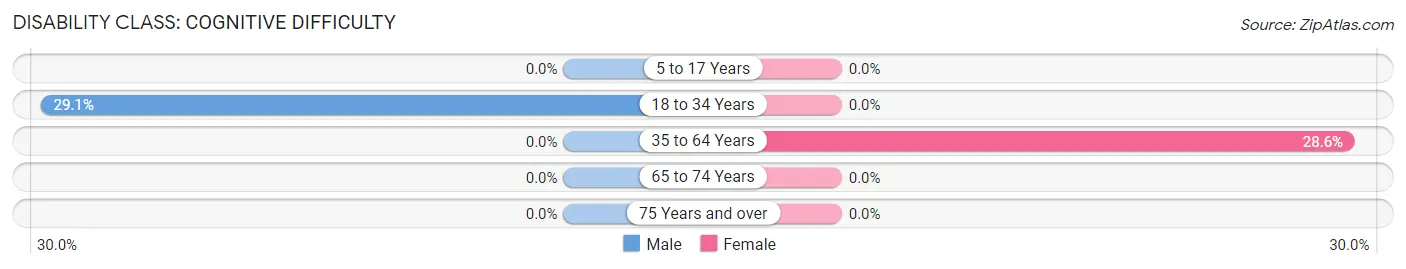
| Age Bracket | Male | Female |
| 5 to 17 Years | 0 (0.0%) | 0 (0.0%) |
| 18 to 34 Years | 23 (29.1%) | 0 (0.0%) |
| 35 to 64 Years | 0 (0.0%) | 16 (28.6%) |
| 65 to 74 Years | 0 (0.0%) | 0 (0.0%) |
| 75 Years and over | 0 (0.0%) | 0 (0.0%) |
Disability Class: Ambulatory Difficulty
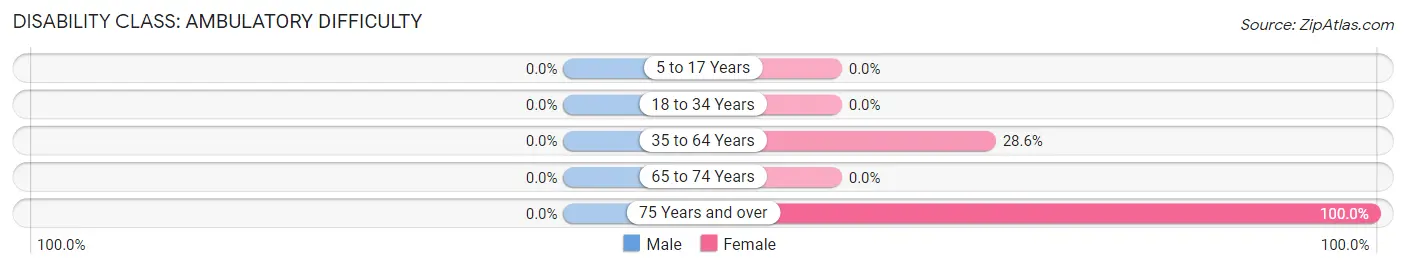
| Age Bracket | Male | Female |
| 5 to 17 Years | 0 (0.0%) | 0 (0.0%) |
| 18 to 34 Years | 0 (0.0%) | 0 (0.0%) |
| 35 to 64 Years | 0 (0.0%) | 16 (28.6%) |
| 65 to 74 Years | 0 (0.0%) | 0 (0.0%) |
| 75 Years and over | 0 (0.0%) | 9 (100.0%) |
Disability Class: Self-Care Difficulty
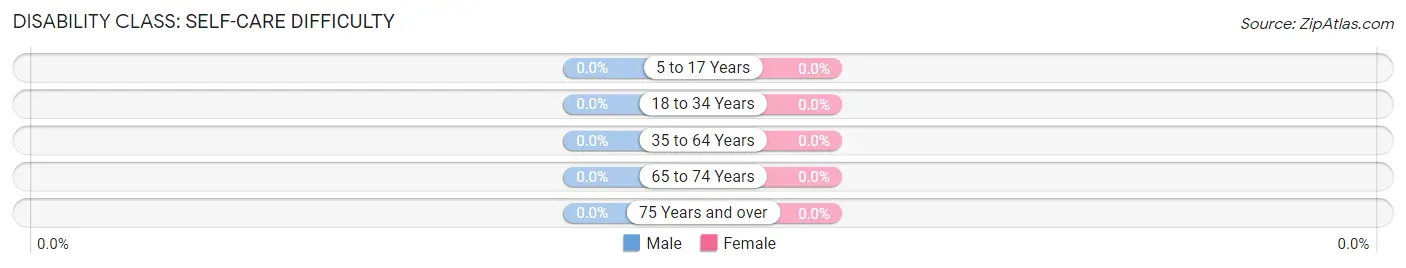
| Age Bracket | Male | Female |
| 5 to 17 Years | 0 (0.0%) | 0 (0.0%) |
| 18 to 34 Years | 0 (0.0%) | 0 (0.0%) |
| 35 to 64 Years | 0 (0.0%) | 0 (0.0%) |
| 65 to 74 Years | 0 (0.0%) | 0 (0.0%) |
| 75 Years and over | 0 (0.0%) | 0 (0.0%) |
Technology Access in Old Hundred
Computing Device Access in Old Hundred
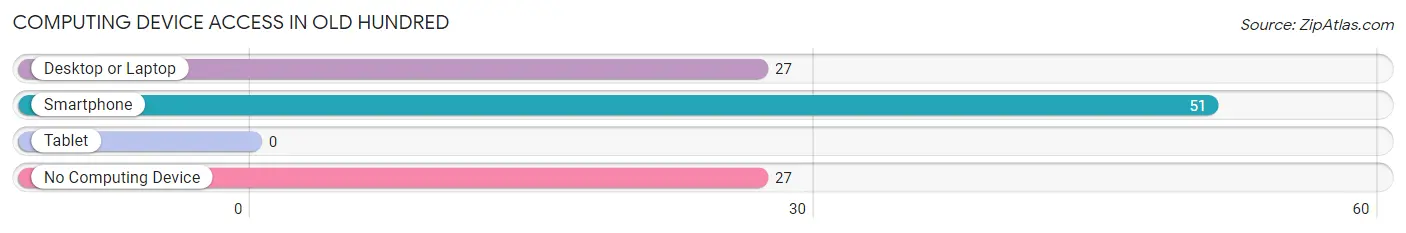
| Device Type | # Households | % Households |
| Desktop or Laptop | 27 | 34.6% |
| Smartphone | 51 | 65.4% |
| Tablet | 0 | 0.0% |
| No Computing Device | 27 | 34.6% |
| Total | 78 | 100.0% |
Internet Access in Old Hundred
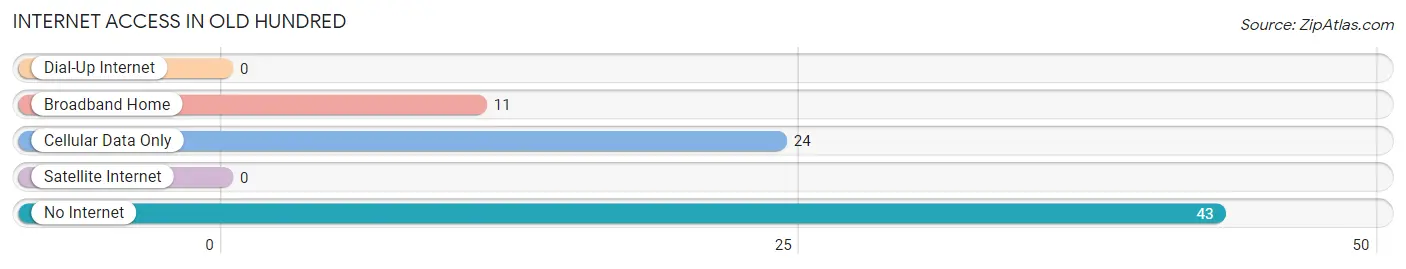
| Internet Type | # Households | % Households |
| Dial-Up Internet | 0 | 0.0% |
| Broadband Home | 11 | 14.1% |
| Cellular Data Only | 24 | 30.8% |
| Satellite Internet | 0 | 0.0% |
| No Internet | 43 | 55.1% |
| Total | 78 | 100.0% |
Old Hundred Summary
Old Hundred is a small unincorporated community located in the western part of North Carolina, in the foothills of the Blue Ridge Mountains. It is situated in the county of Macon, and is part of the Asheville metropolitan area. The population of Old Hundred was estimated to be around 200 people in 2020.
History
Old Hundred was first settled in the late 1700s by a group of settlers from the nearby town of Franklin. The settlers were looking for a place to call home and found the area to be ideal for farming and raising livestock. The town was originally known as “Old Hundred” due to the fact that the settlers had to travel one hundred miles to reach the area. The name was later changed to “Old Hundred” in honor of the original settlers.
The town was officially incorporated in 1887 and was home to a variety of businesses, including a general store, a post office, a blacksmith shop, and a sawmill. The town also had a school, a church, and a cemetery.
In the early 1900s, the town began to decline due to the decline of the local economy. The sawmill closed in the 1920s and the post office closed in the 1940s. The town was eventually abandoned in the 1950s.
Geography
Old Hundred is located in the western part of North Carolina, in the foothills of the Blue Ridge Mountains. The town is situated in the county of Macon, and is part of the Asheville metropolitan area. The town is located at an elevation of 1,400 feet above sea level.
The town is surrounded by a variety of natural features, including the Nantahala National Forest, the Great Smoky Mountains National Park, and the Pisgah National Forest. The town is also located near a number of rivers, including the French Broad River, the Little Tennessee River, and the Tuckasegee River.
Economy
The economy of Old Hundred is largely based on tourism. The town is home to a variety of attractions, including the Great Smoky Mountains National Park, the Nantahala National Forest, and the Pisgah National Forest. The town is also home to a number of outdoor recreation activities, such as hiking, camping, fishing, and hunting.
The town is also home to a number of small businesses, including restaurants, cafes, and shops. The town is also home to a number of bed and breakfasts, as well as a variety of lodging options.
Demographics
The population of Old Hundred was estimated to be around 200 people in 2020. The town is predominantly white, with a small percentage of African Americans and Native Americans. The median household income in the town is around $30,000, and the median home value is around $150,000. The town has a low unemployment rate, and the majority of the population is employed in the tourism industry.
Common Questions
What is Per Capita Income in Old Hundred?
Per Capita income in Old Hundred is $5,266.
What is the Median Family Income in Old Hundred?
Median Family Income in Old Hundred is $25,772.
What is the Median Household income in Old Hundred?
Median Household Income in Old Hundred is $25,441.
What is Family Income Deficit in Old Hundred?
Family Income Deficit in Old Hundred is $11,408.
Families that are below poverty line in Old Hundred earn $11,408 less on average than the poverty threshold level.
What is Inequality or Gini Index in Old Hundred?
Inequality or Gini Index in Old Hundred is 0.37.
What is the Total Population of Old Hundred?
Total Population of Old Hundred is 316.
What is the Total Male Population of Old Hundred?
Total Male Population of Old Hundred is 141.
What is the Total Female Population of Old Hundred?
Total Female Population of Old Hundred is 175.
What is the Ratio of Males per 100 Females in Old Hundred?
There are 80.57 Males per 100 Females in Old Hundred.
What is the Ratio of Females per 100 Males in Old Hundred?
There are 124.11 Females per 100 Males in Old Hundred.
What is the Median Population Age in Old Hundred?
Median Population Age in Old Hundred is 29.7 Years.
What is the Average Family Size in Old Hundred
Average Family Size in Old Hundred is 3.9 People.
What is the Average Household Size in Old Hundred
Average Household Size in Old Hundred is 4.0 People.
How Large is the Labor Force in Old Hundred?
There are 113 People in the Labor Forcein in Old Hundred.
What is the Percentage of People in the Labor Force in Old Hundred?
47.9% of People are in the Labor Force in Old Hundred.
What is the Unemployment Rate in Old Hundred?
Unemployment Rate in Old Hundred is 80.5%.