Surfside, FL Map & Demographics
Surfside Map
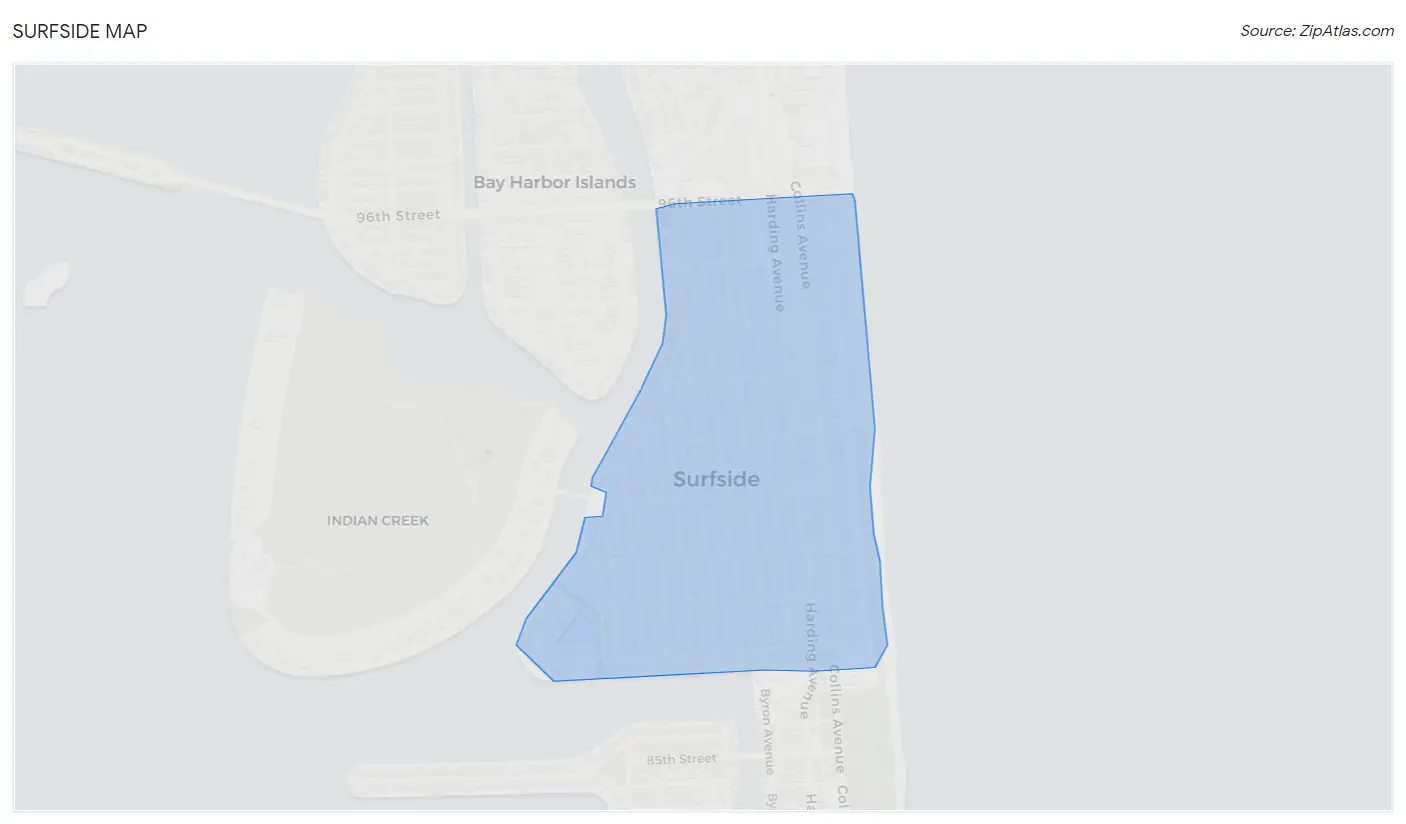
Surfside Overview
$47,713
PER CAPITA INCOME
$89,177
AVG FAMILY INCOME
$73,160
AVG HOUSEHOLD INCOME
34.2%
WAGE / INCOME GAP [ % ]
65.8¢/ $1
WAGE / INCOME GAP [ $ ]
0.57
INEQUALITY / GINI INDEX
5,625
TOTAL POPULATION
2,511
MALE POPULATION
3,114
FEMALE POPULATION
80.64
MALES / 100 FEMALES
124.01
FEMALES / 100 MALES
41.6
MEDIAN AGE
3.5
AVG FAMILY SIZE
2.7
AVG HOUSEHOLD SIZE
2,423
LABOR FORCE [ PEOPLE ]
61.2%
PERCENT IN LABOR FORCE
3.6%
UNEMPLOYMENT RATE
Income in Surfside
Income Overview in Surfside
Per Capita Income in Surfside is $47,713, while median incomes of families and households are $89,177 and $73,160 respectively.
| Characteristic | Number | Measure |
| Per Capita Income | 5,625 | $47,713 |
| Median Family Income | 1,289 | $89,177 |
| Mean Family Income | 1,289 | $139,073 |
| Median Household Income | 2,105 | $73,160 |
| Mean Household Income | 2,105 | $125,679 |
| Income Deficit | 1,289 | $0 |
| Wage / Income Gap (%) | 5,625 | 34.18% |
| Wage / Income Gap ($) | 5,625 | 65.82¢ per $1 |
| Gini / Inequality Index | 5,625 | 0.57 |
Earnings by Sex in Surfside
Average Earnings in Surfside are $46,317, $58,818 for men and $38,716 for women, a difference of 34.2%.
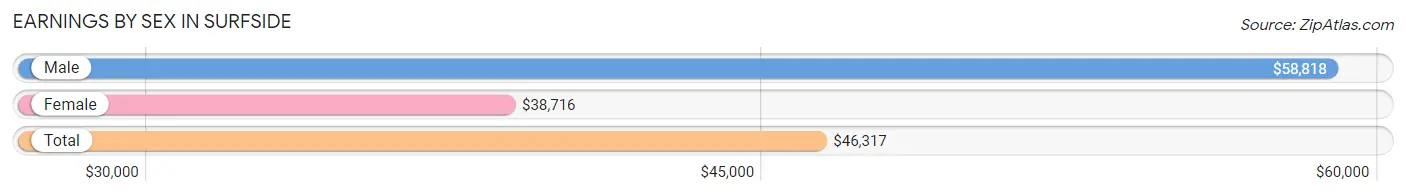
| Sex | Number | Average Earnings |
| Male | 1,142 (44.8%) | $58,818 |
| Female | 1,405 (55.2%) | $38,716 |
| Total | 2,547 (100.0%) | $46,317 |
Earnings by Sex by Income Bracket in Surfside
The most common earnings brackets in Surfside are $100,000+ for men (292 | 25.6%) and $45,000 to $49,999 for women (186 | 13.2%).
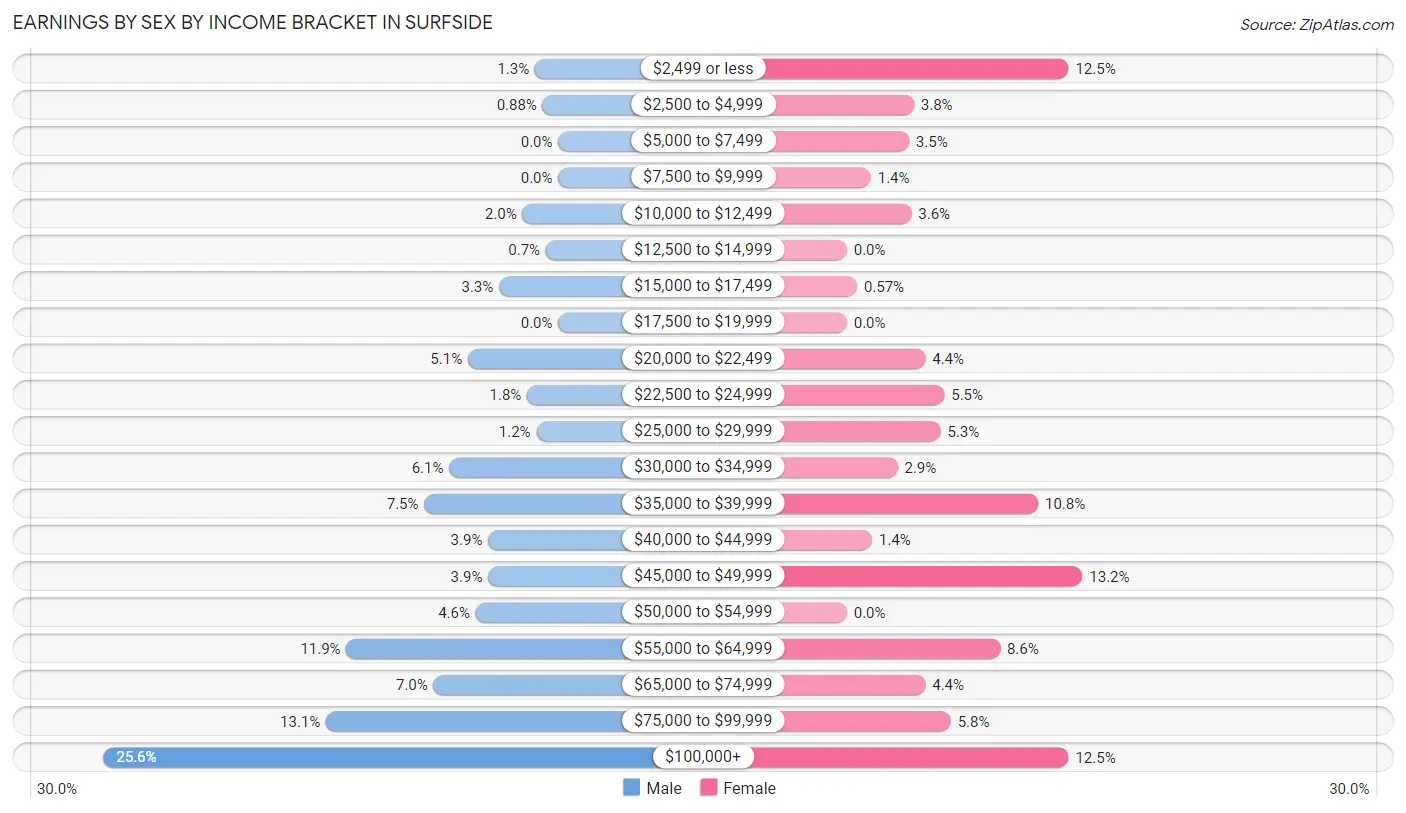
| Income | Male | Female |
| $2,499 or less | 15 (1.3%) | 175 (12.5%) |
| $2,500 to $4,999 | 10 (0.9%) | 53 (3.8%) |
| $5,000 to $7,499 | 0 (0.0%) | 49 (3.5%) |
| $7,500 to $9,999 | 0 (0.0%) | 19 (1.3%) |
| $10,000 to $12,499 | 23 (2.0%) | 51 (3.6%) |
| $12,500 to $14,999 | 8 (0.7%) | 0 (0.0%) |
| $15,000 to $17,499 | 38 (3.3%) | 8 (0.6%) |
| $17,500 to $19,999 | 0 (0.0%) | 0 (0.0%) |
| $20,000 to $22,499 | 58 (5.1%) | 62 (4.4%) |
| $22,500 to $24,999 | 20 (1.8%) | 77 (5.5%) |
| $25,000 to $29,999 | 14 (1.2%) | 74 (5.3%) |
| $30,000 to $34,999 | 70 (6.1%) | 40 (2.9%) |
| $35,000 to $39,999 | 86 (7.5%) | 151 (10.7%) |
| $40,000 to $44,999 | 45 (3.9%) | 20 (1.4%) |
| $45,000 to $49,999 | 45 (3.9%) | 186 (13.2%) |
| $50,000 to $54,999 | 53 (4.6%) | 0 (0.0%) |
| $55,000 to $64,999 | 136 (11.9%) | 121 (8.6%) |
| $65,000 to $74,999 | 80 (7.0%) | 62 (4.4%) |
| $75,000 to $99,999 | 149 (13.1%) | 82 (5.8%) |
| $100,000+ | 292 (25.6%) | 175 (12.5%) |
| Total | 1,142 (100.0%) | 1,405 (100.0%) |
Earnings by Sex by Educational Attainment in Surfside
Average earnings in Surfside are $59,493 for men and $39,338 for women, a difference of 33.9%. Men with an educational attainment of graduate degree enjoy the highest average annual earnings of $110,417, while those with high school diploma education earn the least with $55,186. Women with an educational attainment of graduate degree earn the most with the average annual earnings of $69,294, while those with college or associate's degree education have the smallest earnings of $25,679.
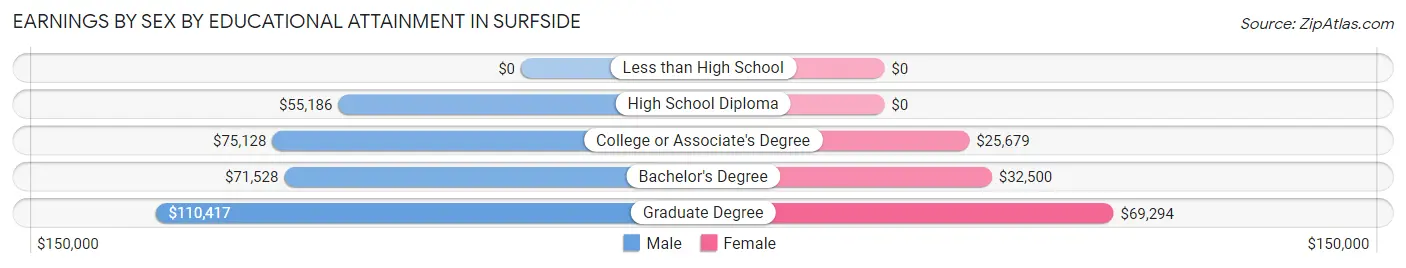
| Educational Attainment | Male Income | Female Income |
| Less than High School | - | - |
| High School Diploma | $55,186 | $0 |
| College or Associate's Degree | $75,128 | $25,679 |
| Bachelor's Degree | $71,528 | $32,500 |
| Graduate Degree | $110,417 | $69,294 |
| Total | $59,493 | $39,338 |
Family Income in Surfside
Family Income Brackets in Surfside
According to the Surfside family income data, there are 227 families falling into the $100,000 to $149,999 income range, which is the most common income bracket and makes up 17.6% of all families.
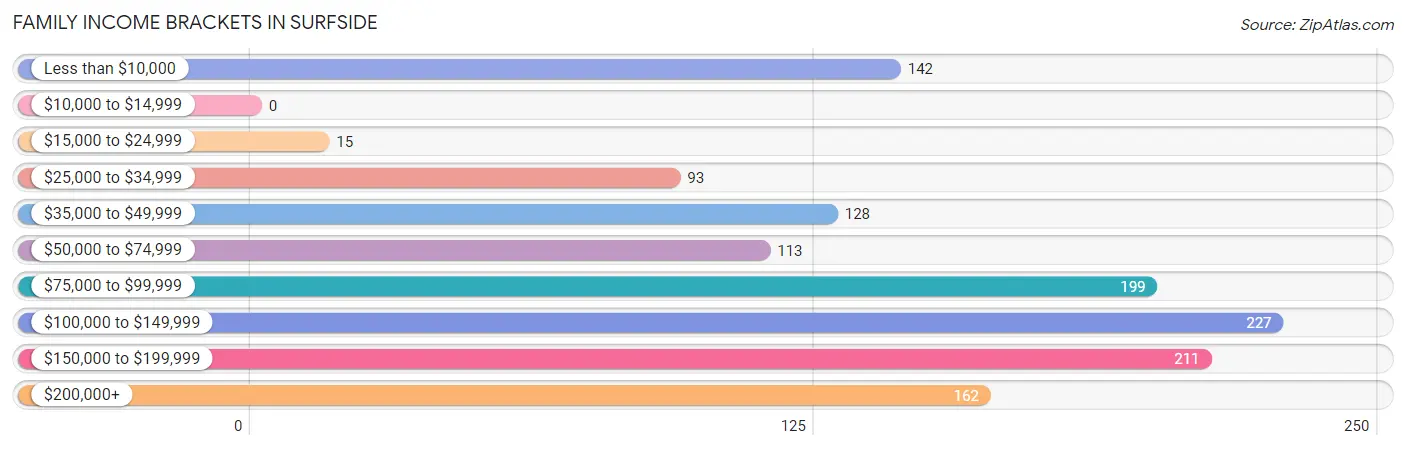
| Income Bracket | # Families | % Families |
| Less than $10,000 | 142 | 11.0% |
| $10,000 to $14,999 | 0 | 0.0% |
| $15,000 to $24,999 | 15 | 1.2% |
| $25,000 to $34,999 | 93 | 7.2% |
| $35,000 to $49,999 | 128 | 9.9% |
| $50,000 to $74,999 | 113 | 8.8% |
| $75,000 to $99,999 | 199 | 15.4% |
| $100,000 to $149,999 | 227 | 17.6% |
| $150,000 to $199,999 | 211 | 16.4% |
| $200,000+ | 162 | 12.6% |
Family Income by Famaliy Size in Surfside
5-person families (90 | 7.0%) account for the highest median family income in Surfside with $167,833 per family, while 2-person families (646 | 50.1%) have the highest median income of $48,992 per family member.
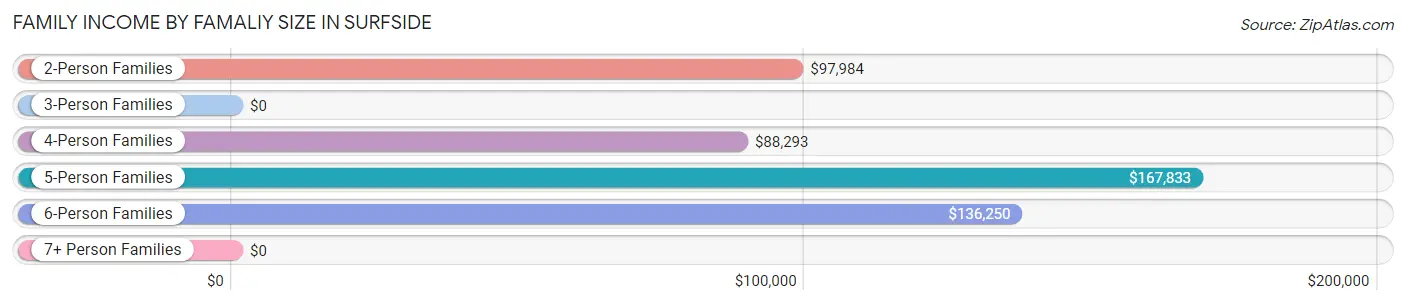
| Income Bracket | # Families | Median Income |
| 2-Person Families | 646 (50.1%) | $97,984 |
| 3-Person Families | 185 (14.3%) | $0 |
| 4-Person Families | 278 (21.6%) | $88,293 |
| 5-Person Families | 90 (7.0%) | $167,833 |
| 6-Person Families | 90 (7.0%) | $136,250 |
| 7+ Person Families | 0 (0.0%) | $0 |
| Total | 1,289 (100.0%) | $89,177 |
Family Income by Number of Earners in Surfside
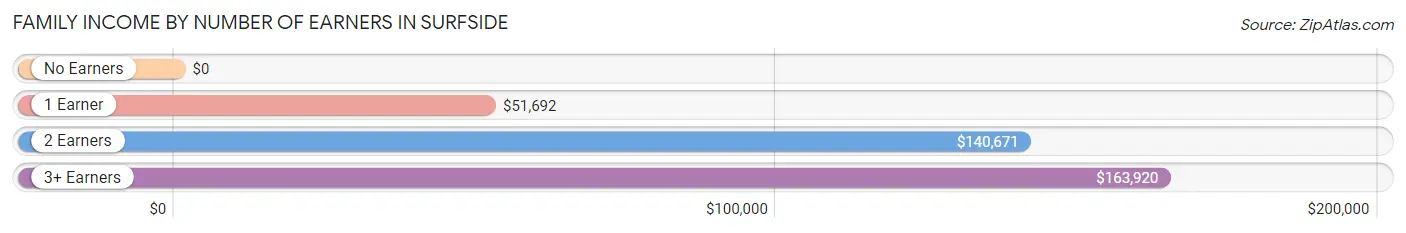
| Number of Earners | # Families | Median Income |
| No Earners | 298 (23.1%) | $0 |
| 1 Earner | 388 (30.1%) | $51,692 |
| 2 Earners | 560 (43.4%) | $140,671 |
| 3+ Earners | 43 (3.3%) | $163,920 |
| Total | 1,289 (100.0%) | $89,177 |
Household Income in Surfside
Household Income Brackets in Surfside
With 330 households falling in the category, the $200,000+ income range is the most frequent in Surfside, accounting for 15.7% of all households. In contrast, only 80 households (3.8%) fall into the $10,000 to $14,999 income bracket, making it the least populous group.
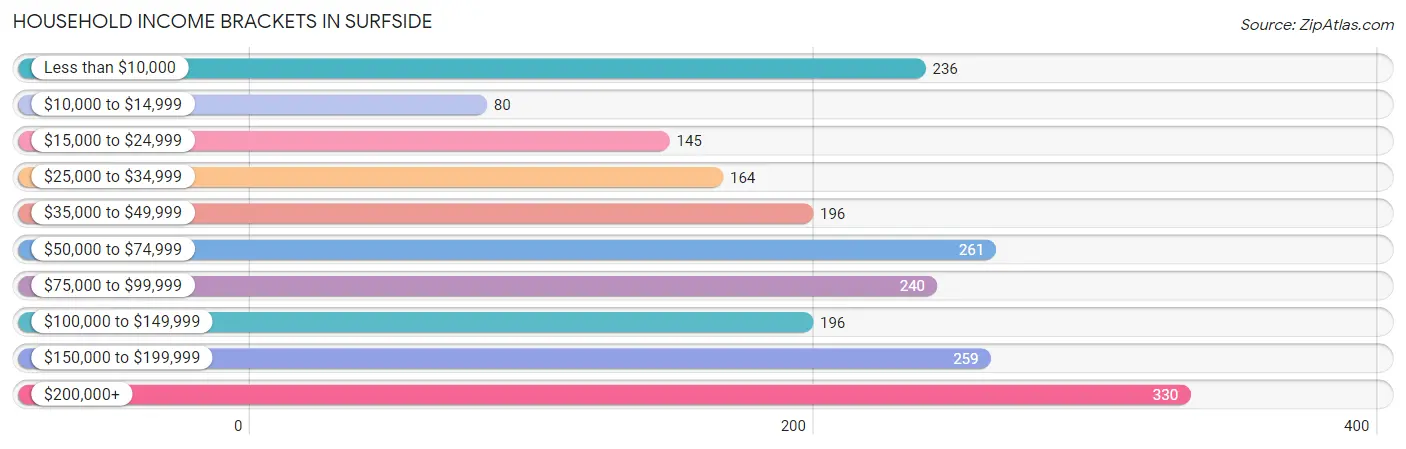
| Income Bracket | # Households | % Households |
| Less than $10,000 | 236 | 11.2% |
| $10,000 to $14,999 | 80 | 3.8% |
| $15,000 to $24,999 | 145 | 6.9% |
| $25,000 to $34,999 | 164 | 7.8% |
| $35,000 to $49,999 | 196 | 9.3% |
| $50,000 to $74,999 | 261 | 12.4% |
| $75,000 to $99,999 | 240 | 11.4% |
| $100,000 to $149,999 | 196 | 9.3% |
| $150,000 to $199,999 | 259 | 12.3% |
| $200,000+ | 330 | 15.7% |
Household Income by Householder Age in Surfside
The median household income in Surfside is $73,160, with the highest median household income of $80,565 found in the 45 to 64 years age bracket for the primary householder. A total of 812 households (38.6%) fall into this category.
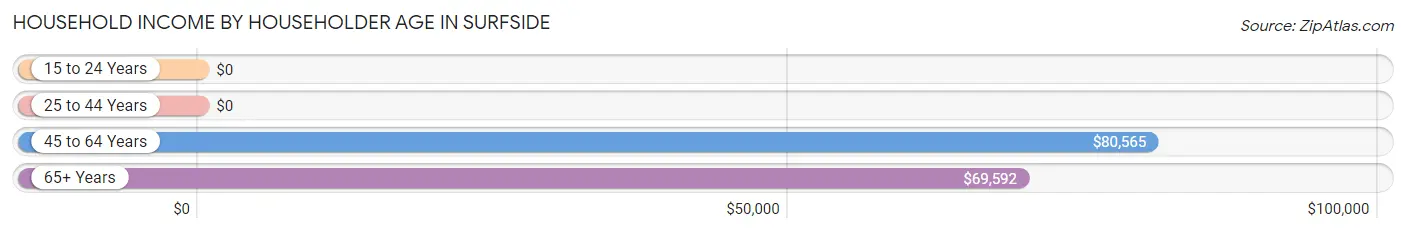
| Income Bracket | # Households | Median Income |
| 15 to 24 Years | 0 (0.0%) | $0 |
| 25 to 44 Years | 559 (26.6%) | $0 |
| 45 to 64 Years | 812 (38.6%) | $80,565 |
| 65+ Years | 734 (34.9%) | $69,592 |
| Total | 2,105 (100.0%) | $73,160 |
Poverty in Surfside
Income Below Poverty by Sex and Age in Surfside
With 10.0% poverty level for males and 17.2% for females among the residents of Surfside, 12 to 14 year old males and 25 to 34 year old females are the most vulnerable to poverty, with 70 males (47.6%) and 77 females (52.0%) in their respective age groups living below the poverty level.
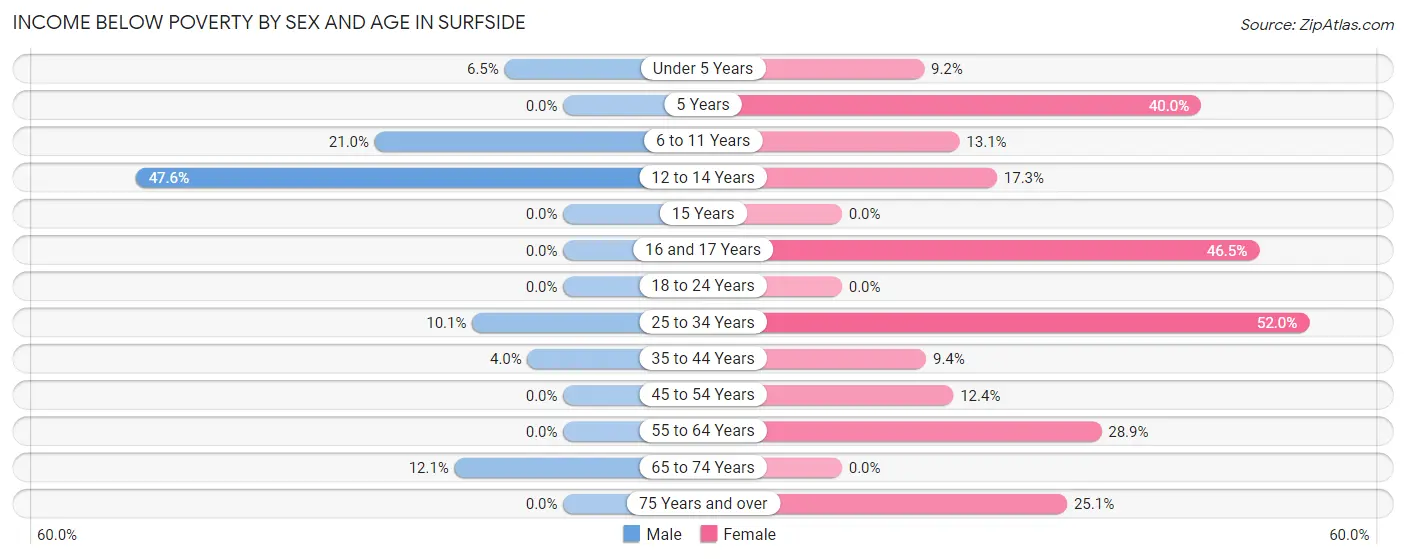
| Age Bracket | Male | Female |
| Under 5 Years | 24 (6.5%) | 24 (9.2%) |
| 5 Years | 0 (0.0%) | 20 (40.0%) |
| 6 to 11 Years | 72 (21.0%) | 41 (13.1%) |
| 12 to 14 Years | 70 (47.6%) | 19 (17.3%) |
| 15 Years | 0 (0.0%) | 0 (0.0%) |
| 16 and 17 Years | 0 (0.0%) | 46 (46.5%) |
| 18 to 24 Years | 0 (0.0%) | 0 (0.0%) |
| 25 to 34 Years | 15 (10.1%) | 77 (52.0%) |
| 35 to 44 Years | 15 (4.0%) | 41 (9.4%) |
| 45 to 54 Years | 0 (0.0%) | 52 (12.4%) |
| 55 to 64 Years | 0 (0.0%) | 137 (28.9%) |
| 65 to 74 Years | 56 (12.1%) | 0 (0.0%) |
| 75 Years and over | 0 (0.0%) | 79 (25.1%) |
| Total | 252 (10.0%) | 536 (17.2%) |
Income Above Poverty by Sex and Age in Surfside
According to the poverty statistics in Surfside, males aged 18 to 24 years and females aged 15 years are the age groups that are most secure financially, with 100.0% of males and 100.0% of females in these age groups living above the poverty line.
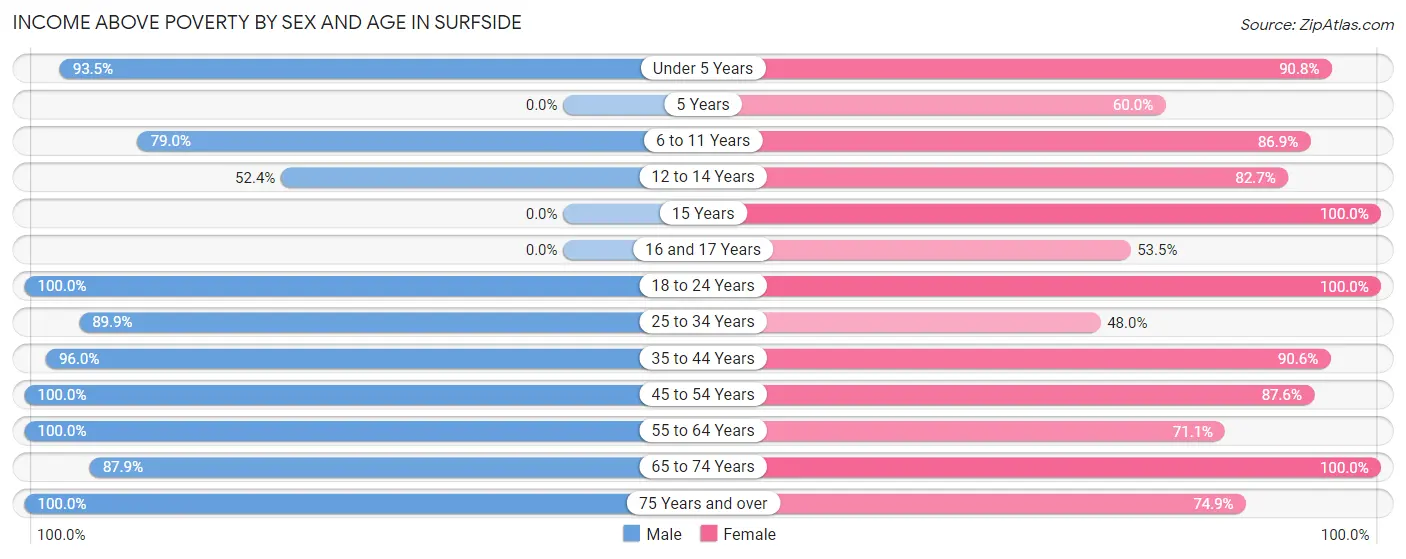
| Age Bracket | Male | Female |
| Under 5 Years | 343 (93.5%) | 238 (90.8%) |
| 5 Years | 0 (0.0%) | 30 (60.0%) |
| 6 to 11 Years | 271 (79.0%) | 272 (86.9%) |
| 12 to 14 Years | 77 (52.4%) | 91 (82.7%) |
| 15 Years | 0 (0.0%) | 74 (100.0%) |
| 16 and 17 Years | 0 (0.0%) | 53 (53.5%) |
| 18 to 24 Years | 40 (100.0%) | 157 (100.0%) |
| 25 to 34 Years | 133 (89.9%) | 71 (48.0%) |
| 35 to 44 Years | 362 (96.0%) | 396 (90.6%) |
| 45 to 54 Years | 295 (100.0%) | 367 (87.6%) |
| 55 to 64 Years | 105 (100.0%) | 337 (71.1%) |
| 65 to 74 Years | 407 (87.9%) | 256 (100.0%) |
| 75 Years and over | 226 (100.0%) | 236 (74.9%) |
| Total | 2,259 (90.0%) | 2,578 (82.8%) |
Income Below Poverty Among Married-Couple Families in Surfside
The poverty statistics for married-couple families in Surfside show that 9.2% or 86 of the total 937 families live below the poverty line. Families with no children have the highest poverty rate of 10.1%, comprising of 56 families. On the other hand, families with 1 or 2 children have the lowest poverty rate of 7.5%, which includes 15 families.
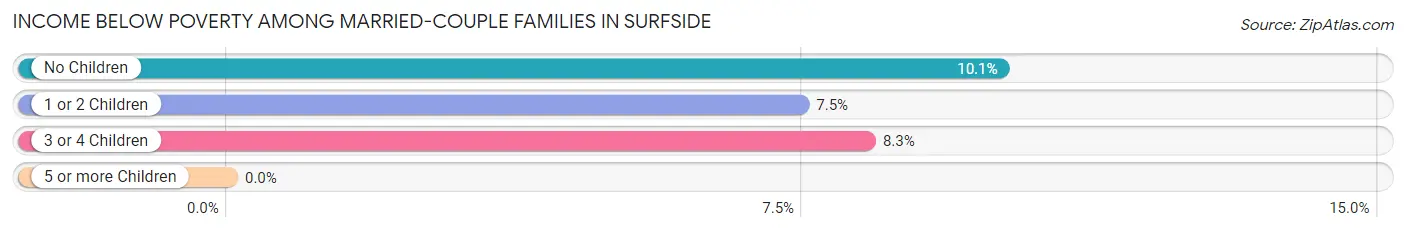
| Children | Above Poverty | Below Poverty |
| No Children | 500 (89.9%) | 56 (10.1%) |
| 1 or 2 Children | 186 (92.5%) | 15 (7.5%) |
| 3 or 4 Children | 165 (91.7%) | 15 (8.3%) |
| 5 or more Children | 0 (0.0%) | 0 (0.0%) |
| Total | 851 (90.8%) | 86 (9.2%) |
Income Below Poverty Among Single-Parent Households in Surfside
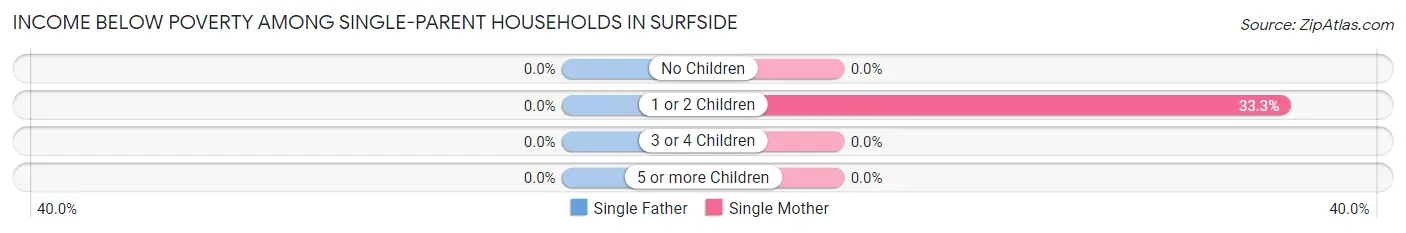
| Children | Single Father | Single Mother |
| No Children | 0 (0.0%) | 0 (0.0%) |
| 1 or 2 Children | 0 (0.0%) | 71 (33.3%) |
| 3 or 4 Children | 0 (0.0%) | 0 (0.0%) |
| 5 or more Children | 0 (0.0%) | 0 (0.0%) |
| Total | 0 (0.0%) | 71 (22.3%) |
Income Below Poverty Among Married-Couple vs Single-Parent Households in Surfside
The poverty data for Surfside shows that 86 of the married-couple family households (9.2%) and 71 of the single-parent households (20.2%) are living below the poverty level. Within the married-couple family households, those with no children have the highest poverty rate, with 56 households (10.1%) falling below the poverty line. Among the single-parent households, those with 1 or 2 children have the highest poverty rate, with 71 household (33.3%) living below poverty.
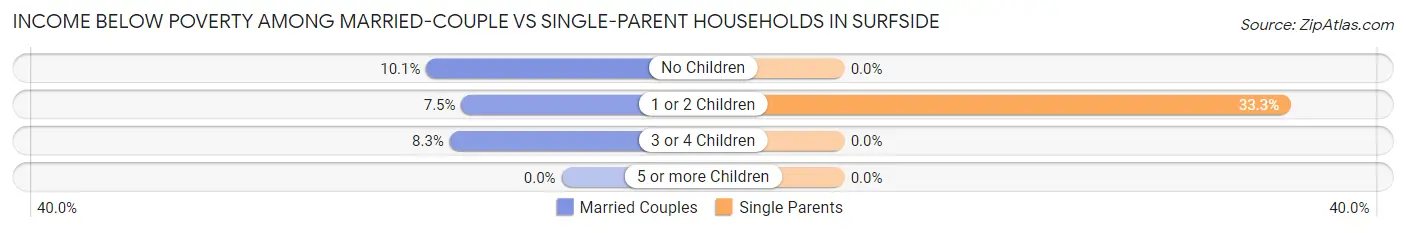
| Children | Married-Couple Families | Single-Parent Households |
| No Children | 56 (10.1%) | 0 (0.0%) |
| 1 or 2 Children | 15 (7.5%) | 71 (33.3%) |
| 3 or 4 Children | 15 (8.3%) | 0 (0.0%) |
| 5 or more Children | 0 (0.0%) | 0 (0.0%) |
| Total | 86 (9.2%) | 71 (20.2%) |
Race in Surfside
The most populous races in Surfside are White / Caucasian (4,369 | 77.7%), Hispanic or Latino (2,078 | 36.9%), and Two or more Races (691 | 12.3%).
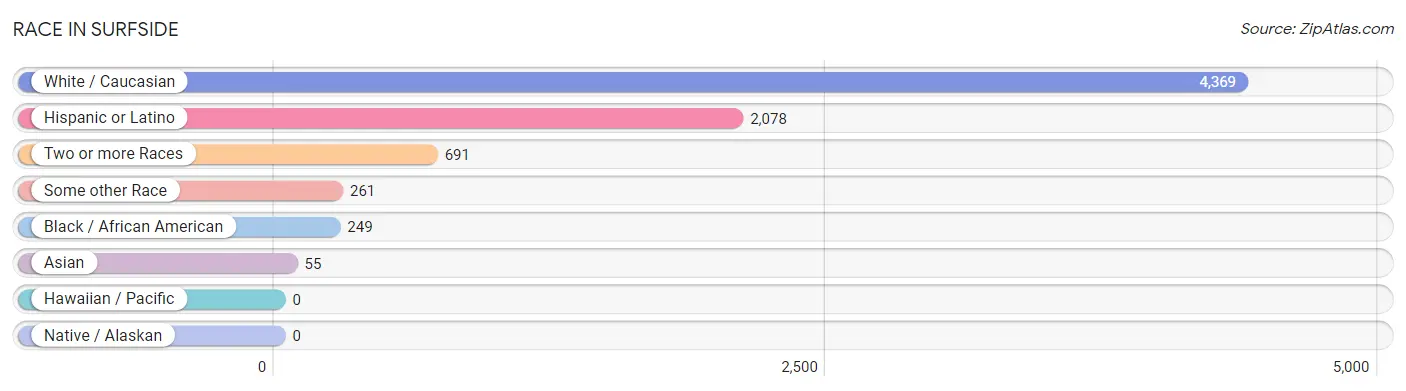
| Race | # Population | % Population |
| Asian | 55 | 1.0% |
| Black / African American | 249 | 4.4% |
| Hawaiian / Pacific | 0 | 0.0% |
| Hispanic or Latino | 2,078 | 36.9% |
| Native / Alaskan | 0 | 0.0% |
| White / Caucasian | 4,369 | 77.7% |
| Two or more Races | 691 | 12.3% |
| Some other Race | 261 | 4.6% |
| Total | 5,625 | 100.0% |
Ancestry in Surfside
The most populous ancestries reported in Surfside are Cuban (1,039 | 18.5%), American (976 | 17.3%), South American (601 | 10.7%), Polish (422 | 7.5%), and Italian (275 | 4.9%), together accounting for 58.9% of all Surfside residents.
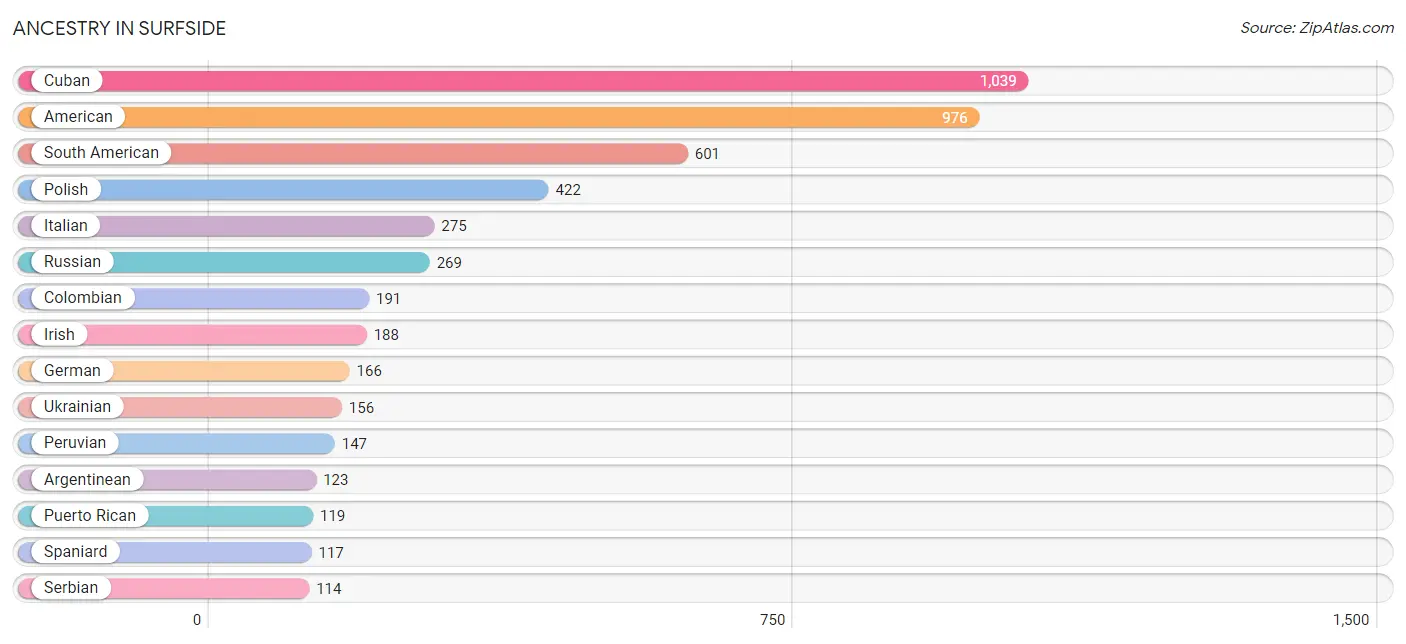
| Ancestry | # Population | % Population |
| American | 976 | 17.3% |
| Arab | 77 | 1.4% |
| Argentinean | 123 | 2.2% |
| Austrian | 13 | 0.2% |
| Belgian | 15 | 0.3% |
| British | 54 | 1.0% |
| Central American | 18 | 0.3% |
| Central American Indian | 3 | 0.1% |
| Chilean | 99 | 1.8% |
| Colombian | 191 | 3.4% |
| Croatian | 36 | 0.6% |
| Cuban | 1,039 | 18.5% |
| Czech | 13 | 0.2% |
| Dutch | 28 | 0.5% |
| Eastern European | 48 | 0.9% |
| English | 97 | 1.7% |
| Estonian | 23 | 0.4% |
| European | 26 | 0.5% |
| French | 100 | 1.8% |
| German | 166 | 2.9% |
| Greek | 17 | 0.3% |
| Hungarian | 29 | 0.5% |
| Iranian | 18 | 0.3% |
| Irish | 188 | 3.3% |
| Israeli | 80 | 1.4% |
| Italian | 275 | 4.9% |
| Laotian | 78 | 1.4% |
| Mexican | 29 | 0.5% |
| Moroccan | 21 | 0.4% |
| Norwegian | 38 | 0.7% |
| Panamanian | 18 | 0.3% |
| Peruvian | 147 | 2.6% |
| Polish | 422 | 7.5% |
| Puerto Rican | 119 | 2.1% |
| Romanian | 35 | 0.6% |
| Russian | 269 | 4.8% |
| Scotch-Irish | 15 | 0.3% |
| Scottish | 28 | 0.5% |
| Serbian | 114 | 2.0% |
| Slovak | 15 | 0.3% |
| South American | 601 | 10.7% |
| Spaniard | 117 | 2.1% |
| Swedish | 12 | 0.2% |
| Thai | 75 | 1.3% |
| Ukrainian | 156 | 2.8% |
| Uruguayan | 26 | 0.5% |
| Venezuelan | 15 | 0.3% | View All 47 Rows |
Immigrants in Surfside
The most numerous immigrant groups reported in Surfside came from Latin America (1,545 | 27.5%), South America (805 | 14.3%), Caribbean (676 | 12.0%), Cuba (676 | 12.0%), and Europe (586 | 10.4%), together accounting for 76.2% of all Surfside residents.
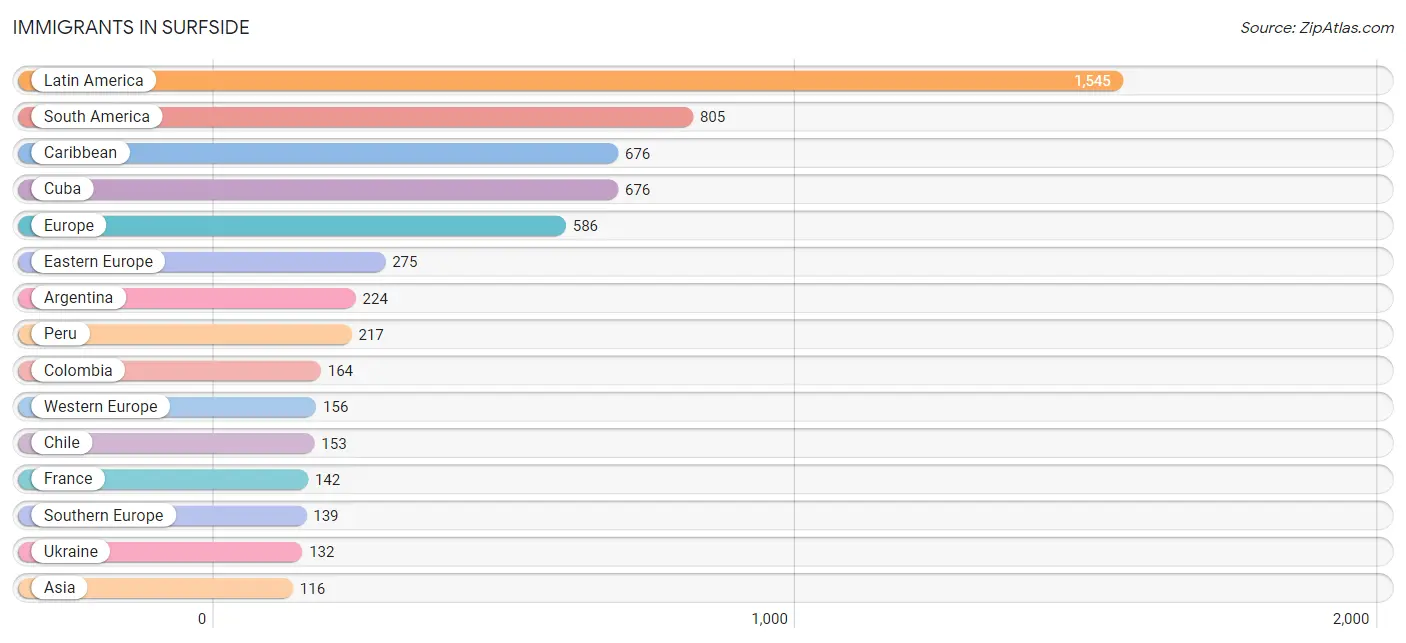
| Immigration Origin | # Population | % Population |
| Africa | 95 | 1.7% |
| Argentina | 224 | 4.0% |
| Asia | 116 | 2.1% |
| Australia | 14 | 0.3% |
| Brazil | 14 | 0.3% |
| Canada | 25 | 0.4% |
| Caribbean | 676 | 12.0% |
| Central America | 64 | 1.1% |
| Chile | 153 | 2.7% |
| Colombia | 164 | 2.9% |
| Cuba | 676 | 12.0% |
| Czechoslovakia | 15 | 0.3% |
| Eastern Europe | 275 | 4.9% |
| Egypt | 56 | 1.0% |
| Europe | 586 | 10.4% |
| France | 142 | 2.5% |
| Germany | 14 | 0.3% |
| Hungary | 7 | 0.1% |
| India | 59 | 1.1% |
| Israel | 57 | 1.0% |
| Italy | 110 | 2.0% |
| Latin America | 1,545 | 27.5% |
| Mexico | 46 | 0.8% |
| Morocco | 39 | 0.7% |
| Northern Africa | 95 | 1.7% |
| Northern Europe | 16 | 0.3% |
| Oceania | 14 | 0.3% |
| Panama | 18 | 0.3% |
| Peru | 217 | 3.9% |
| Romania | 35 | 0.6% |
| Russia | 30 | 0.5% |
| Serbia | 33 | 0.6% |
| South America | 805 | 14.3% |
| South Central Asia | 59 | 1.1% |
| Southern Europe | 139 | 2.5% |
| Spain | 29 | 0.5% |
| Ukraine | 132 | 2.4% |
| Uruguay | 18 | 0.3% |
| Venezuela | 15 | 0.3% |
| Western Asia | 57 | 1.0% |
| Western Europe | 156 | 2.8% | View All 41 Rows |
Sex and Age in Surfside
Sex and Age in Surfside
The most populous age groups in Surfside are Under 5 Years (367 | 14.6%) for men and Under 5 Years (262 | 8.4%) for women.
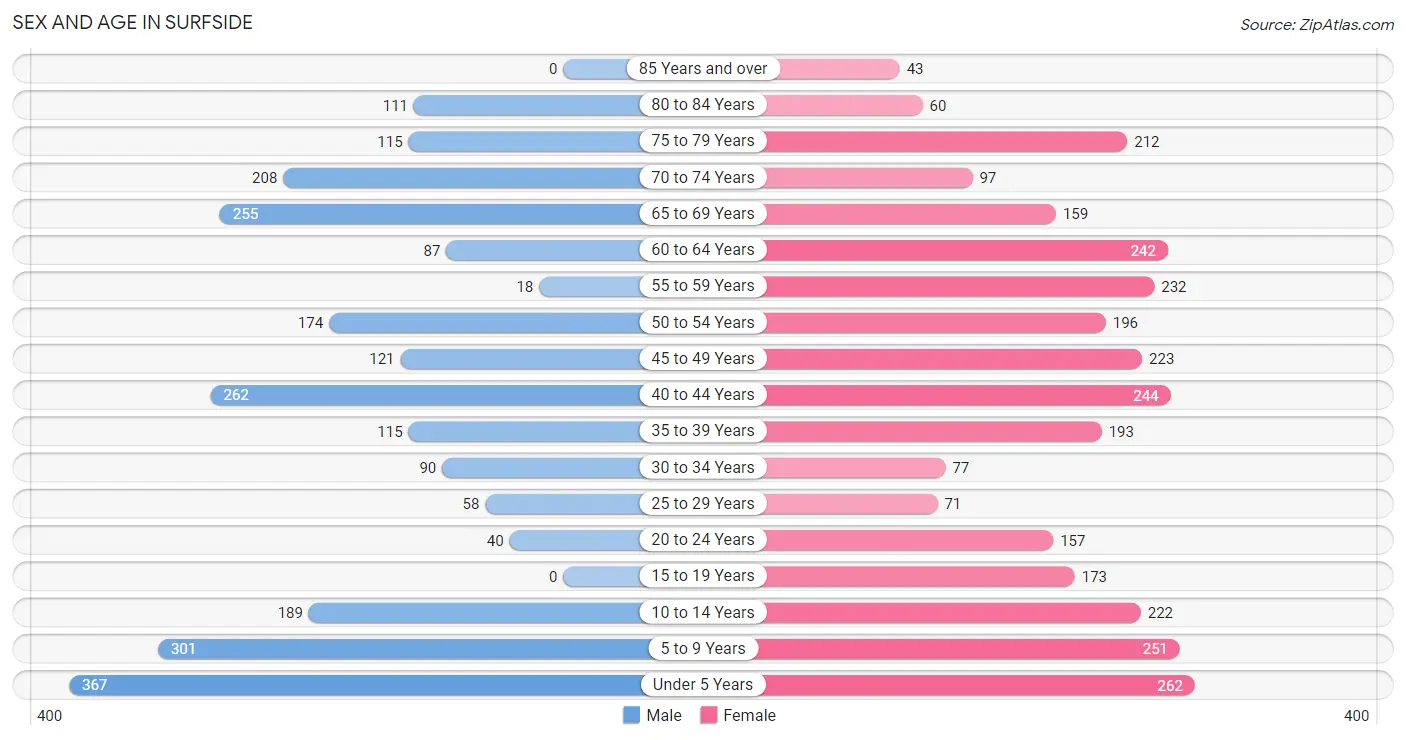
| Age Bracket | Male | Female |
| Under 5 Years | 367 (14.6%) | 262 (8.4%) |
| 5 to 9 Years | 301 (12.0%) | 251 (8.1%) |
| 10 to 14 Years | 189 (7.5%) | 222 (7.1%) |
| 15 to 19 Years | 0 (0.0%) | 173 (5.6%) |
| 20 to 24 Years | 40 (1.6%) | 157 (5.0%) |
| 25 to 29 Years | 58 (2.3%) | 71 (2.3%) |
| 30 to 34 Years | 90 (3.6%) | 77 (2.5%) |
| 35 to 39 Years | 115 (4.6%) | 193 (6.2%) |
| 40 to 44 Years | 262 (10.4%) | 244 (7.8%) |
| 45 to 49 Years | 121 (4.8%) | 223 (7.2%) |
| 50 to 54 Years | 174 (6.9%) | 196 (6.3%) |
| 55 to 59 Years | 18 (0.7%) | 232 (7.4%) |
| 60 to 64 Years | 87 (3.5%) | 242 (7.8%) |
| 65 to 69 Years | 255 (10.2%) | 159 (5.1%) |
| 70 to 74 Years | 208 (8.3%) | 97 (3.1%) |
| 75 to 79 Years | 115 (4.6%) | 212 (6.8%) |
| 80 to 84 Years | 111 (4.4%) | 60 (1.9%) |
| 85 Years and over | 0 (0.0%) | 43 (1.4%) |
| Total | 2,511 (100.0%) | 3,114 (100.0%) |
Families and Households in Surfside
Median Family Size in Surfside
The median family size in Surfside is 3.48 persons per family, with married-couple families (937 | 72.7%) accounting for the largest median family size of 3.59 persons per family. On the other hand, single male/father families (33 | 2.6%) represent the smallest median family size with 2.06 persons per family.
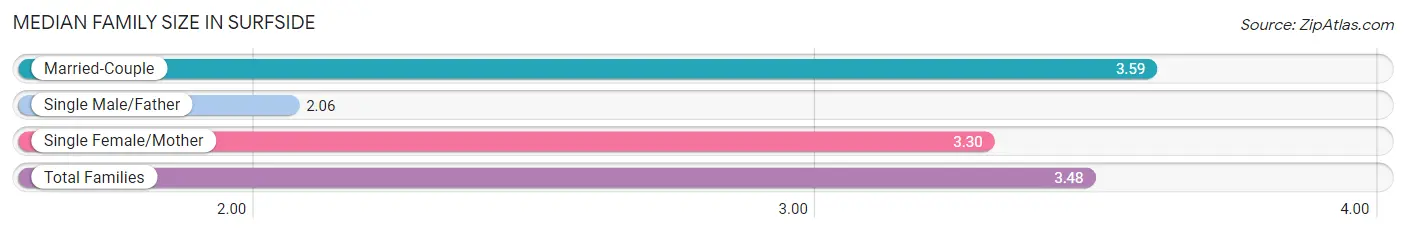
| Family Type | # Families | Family Size |
| Married-Couple | 937 (72.7%) | 3.59 |
| Single Male/Father | 33 (2.6%) | 2.06 |
| Single Female/Mother | 319 (24.7%) | 3.30 |
| Total Families | 1,289 (100.0%) | 3.48 |
Median Household Size in Surfside
The median household size in Surfside is 2.67 persons per household, with married-couple households (937 | 44.5%) accounting for the largest median household size of 3.65 persons per household. non-family households (816 | 38.8%) represent the smallest median household size with 1.32 persons per household.
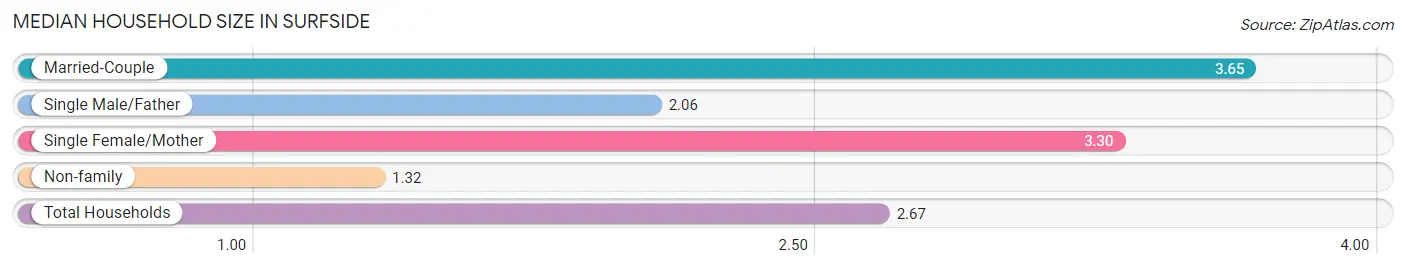
| Household Type | # Households | Household Size |
| Married-Couple | 937 (44.5%) | 3.65 |
| Single Male/Father | 33 (1.6%) | 2.06 |
| Single Female/Mother | 319 (15.1%) | 3.30 |
| Non-family | 816 (38.8%) | 1.32 |
| Total Households | 2,105 (100.0%) | 2.67 |
Household Size by Marriage Status in Surfside
Out of a total of 2,105 households in Surfside, 1,289 (61.2%) are family households, while 816 (38.8%) are nonfamily households. The most numerous type of family households are 2-person households, comprising 646, and the most common type of nonfamily households are 1-person households, comprising 599.
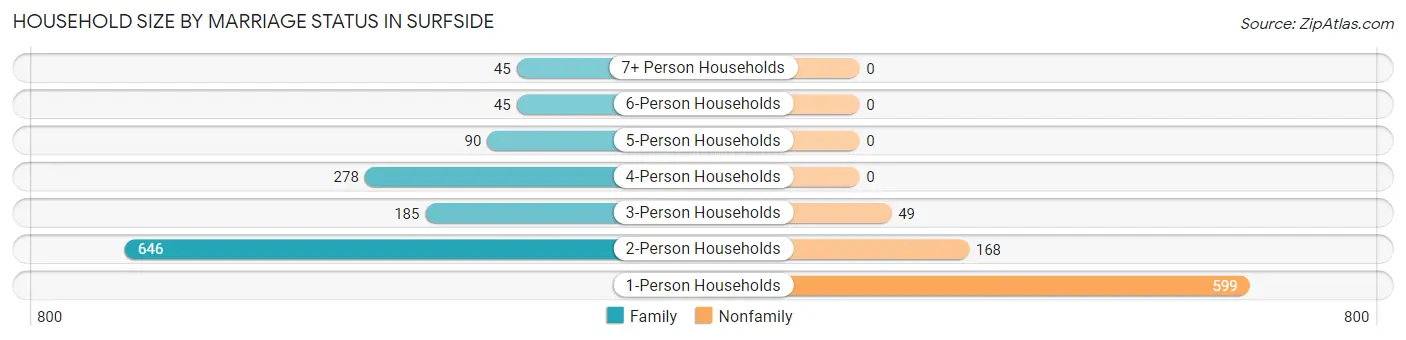
| Household Size | Family Households | Nonfamily Households |
| 1-Person Households | - | 599 (28.5%) |
| 2-Person Households | 646 (30.7%) | 168 (8.0%) |
| 3-Person Households | 185 (8.8%) | 49 (2.3%) |
| 4-Person Households | 278 (13.2%) | 0 (0.0%) |
| 5-Person Households | 90 (4.3%) | 0 (0.0%) |
| 6-Person Households | 45 (2.1%) | 0 (0.0%) |
| 7+ Person Households | 45 (2.1%) | 0 (0.0%) |
| Total | 1,289 (61.2%) | 816 (38.8%) |
Female Fertility in Surfside
Fertility by Age in Surfside
Average fertility rate in Surfside is 36.0 births per 1,000 women. Women in the age bracket of 35 to 50 years have the highest fertility rate with 61.0 births per 1,000 women. Women in the age bracket of 35 to 50 years acount for 100.0% of all women with births.
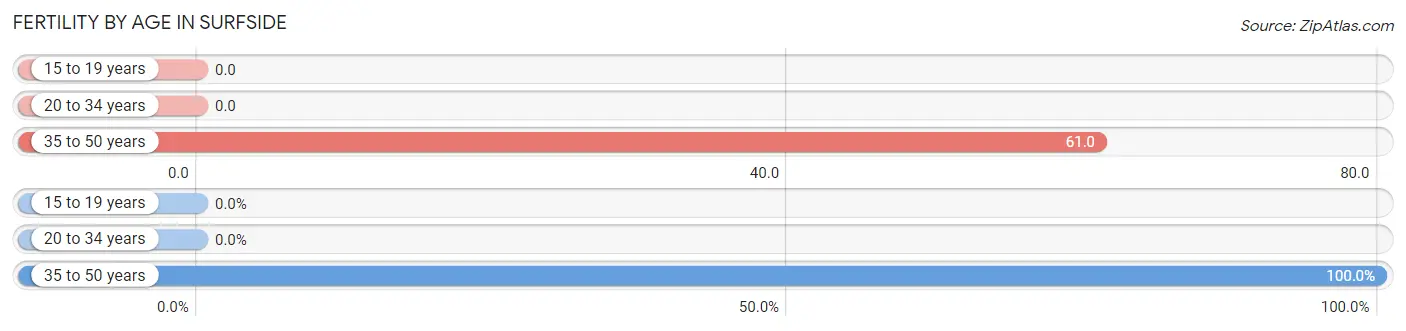
| Age Bracket | Women with Births | Births / 1,000 Women |
| 15 to 19 years | 0 (0.0%) | 0.0 |
| 20 to 34 years | 0 (0.0%) | 0.0 |
| 35 to 50 years | 41 (100.0%) | 61.0 |
| Total | 41 (100.0%) | 36.0 |
Fertility by Age by Marriage Status in Surfside
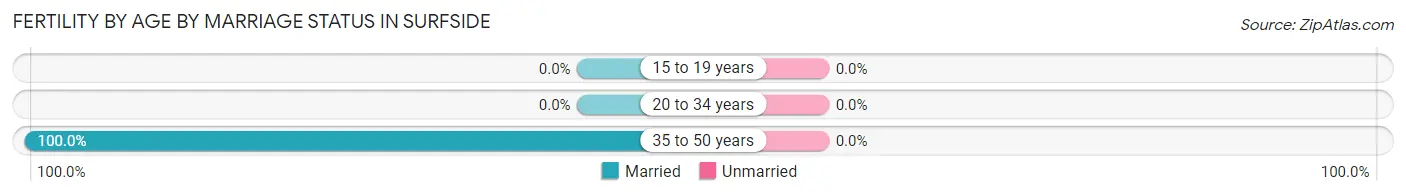
| Age Bracket | Married | Unmarried |
| 15 to 19 years | 0 (0.0%) | 0 (0.0%) |
| 20 to 34 years | 0 (0.0%) | 0 (0.0%) |
| 35 to 50 years | 41 (100.0%) | 0 (0.0%) |
| Total | 41 (100.0%) | 0 (0.0%) |
Fertility by Education in Surfside
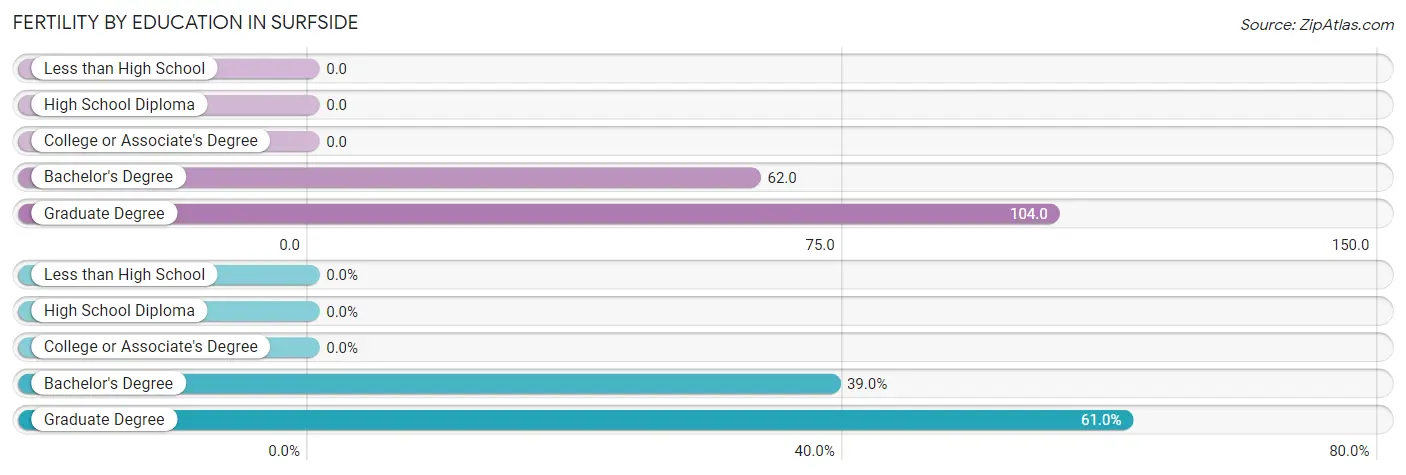
| Educational Attainment | Women with Births | Births / 1,000 Women |
| Less than High School | 0 (0.0%) | 0.0 |
| High School Diploma | 0 (0.0%) | 0.0 |
| College or Associate's Degree | 0 (0.0%) | 0.0 |
| Bachelor's Degree | 16 (39.0%) | 62.0 |
| Graduate Degree | 25 (61.0%) | 104.0 |
| Total | 41 (100.0%) | 36.0 |
Fertility by Education by Marriage Status in Surfside
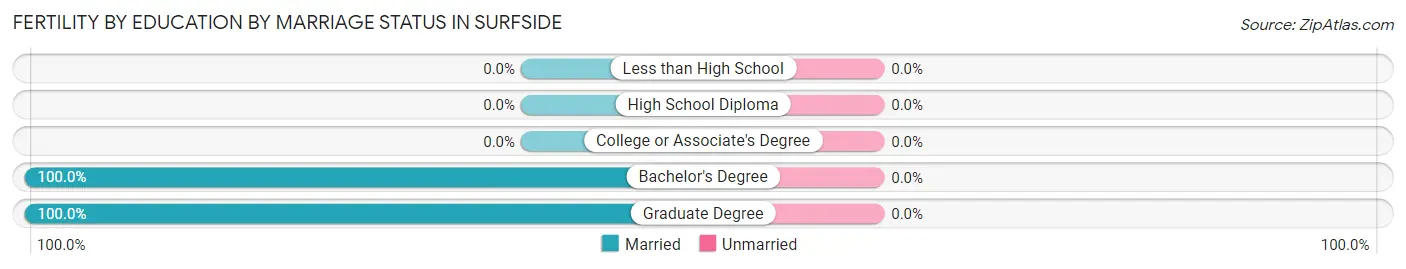
| Educational Attainment | Married | Unmarried |
| Less than High School | 0 (0.0%) | 0 (0.0%) |
| High School Diploma | 0 (0.0%) | 0 (0.0%) |
| College or Associate's Degree | 0 (0.0%) | 0 (0.0%) |
| Bachelor's Degree | 16 (100.0%) | 0 (0.0%) |
| Graduate Degree | 25 (100.0%) | 0 (0.0%) |
| Total | 41 (100.0%) | 0 (0.0%) |
Employment Characteristics in Surfside
Employment by Class of Employer in Surfside
Among the 2,317 employed individuals in Surfside, private company employees (1,396 | 60.3%), self-employed (incorporated) (323 | 13.9%), and self-employed (not incorporated) (274 | 11.8%) make up the most common classes of employment.
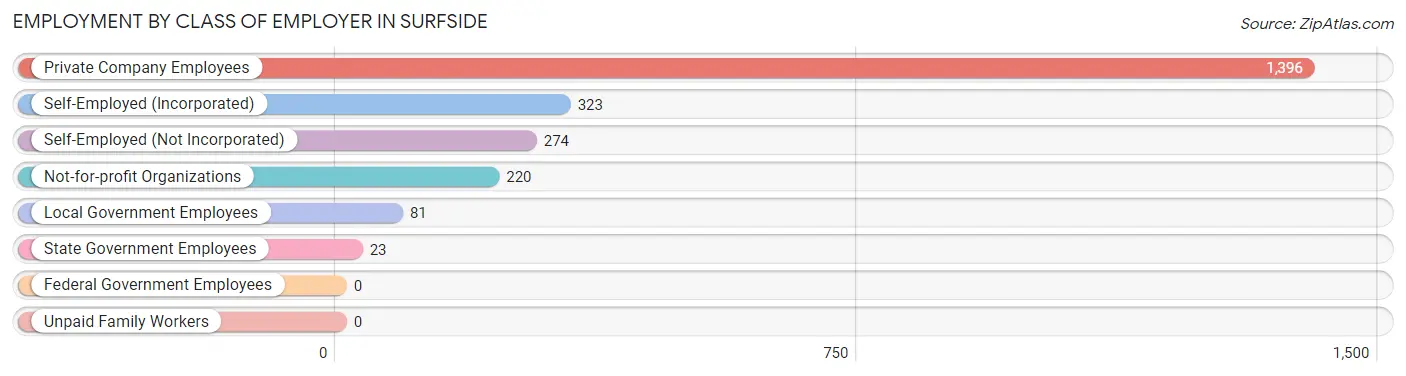
| Employer Class | # Employees | % Employees |
| Private Company Employees | 1,396 | 60.3% |
| Self-Employed (Incorporated) | 323 | 13.9% |
| Self-Employed (Not Incorporated) | 274 | 11.8% |
| Not-for-profit Organizations | 220 | 9.5% |
| Local Government Employees | 81 | 3.5% |
| State Government Employees | 23 | 1.0% |
| Federal Government Employees | 0 | 0.0% |
| Unpaid Family Workers | 0 | 0.0% |
| Total | 2,317 | 100.0% |
Employment Status by Age in Surfside
According to the labor force statistics for Surfside, out of the total population over 16 years of age (3,959), 61.2% or 2,423 individuals are in the labor force, with 3.6% or 87 of them unemployed. The age group with the highest labor force participation rate is 25 to 29 years, with 100.0% or 129 individuals in the labor force. Within the labor force, the 25 to 29 years age range has the highest percentage of unemployed individuals, with 16.3% or 21 of them being unemployed.
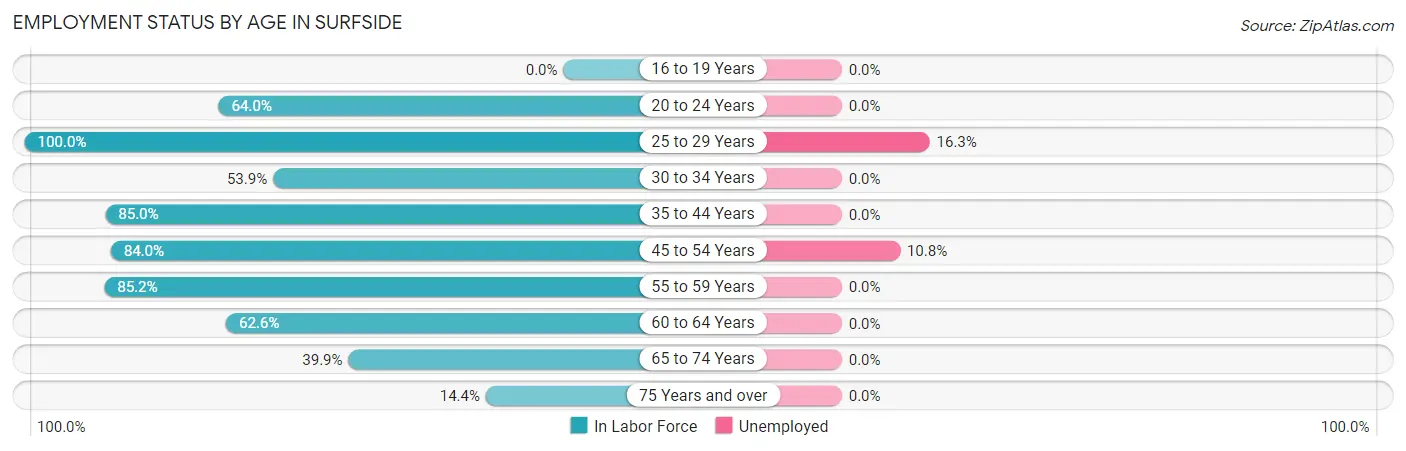
| Age Bracket | In Labor Force | Unemployed |
| 16 to 19 Years | 0 (0.0%) | 0 (0.0%) |
| 20 to 24 Years | 126 (64.0%) | 0 (0.0%) |
| 25 to 29 Years | 129 (100.0%) | 21 (16.3%) |
| 30 to 34 Years | 90 (53.9%) | 0 (0.0%) |
| 35 to 44 Years | 692 (85.0%) | 0 (0.0%) |
| 45 to 54 Years | 600 (84.0%) | 65 (10.8%) |
| 55 to 59 Years | 213 (85.2%) | 0 (0.0%) |
| 60 to 64 Years | 206 (62.6%) | 0 (0.0%) |
| 65 to 74 Years | 287 (39.9%) | 0 (0.0%) |
| 75 Years and over | 78 (14.4%) | 0 (0.0%) |
| Total | 2,423 (61.2%) | 87 (3.6%) |
Employment Status by Educational Attainment in Surfside
According to labor force statistics for Surfside, 80.3% of individuals (1,930) out of the total population between 25 and 64 years of age (2,403) are in the labor force, with 4.5% or 87 of them being unemployed. The group with the highest labor force participation rate are those with the educational attainment of less than high school, with 100.0% or 8 individuals in the labor force. Within the labor force, individuals with college / associate degree education have the highest percentage of unemployment, with 19.9% or 65 of them being unemployed.
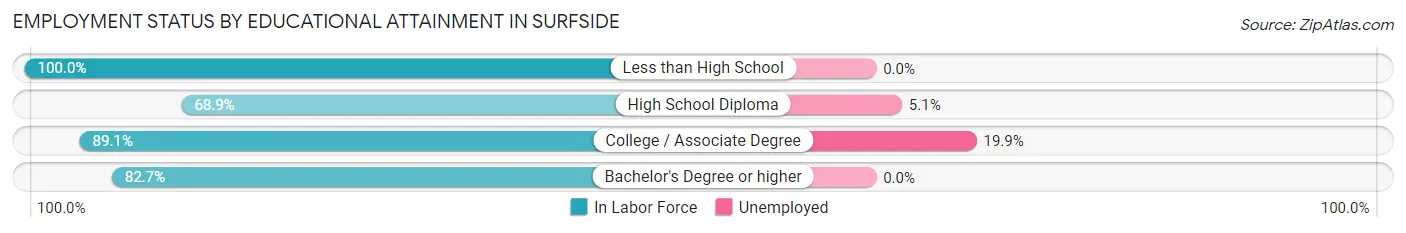
| Educational Attainment | In Labor Force | Unemployed |
| Less than High School | 8 (100.0%) | 0 (0.0%) |
| High School Diploma | 415 (68.9%) | 31 (5.1%) |
| College / Associate Degree | 327 (89.1%) | 73 (19.9%) |
| Bachelor's Degree or higher | 1,179 (82.7%) | 0 (0.0%) |
| Total | 1,930 (80.3%) | 108 (4.5%) |
Employment Occupations by Sex in Surfside
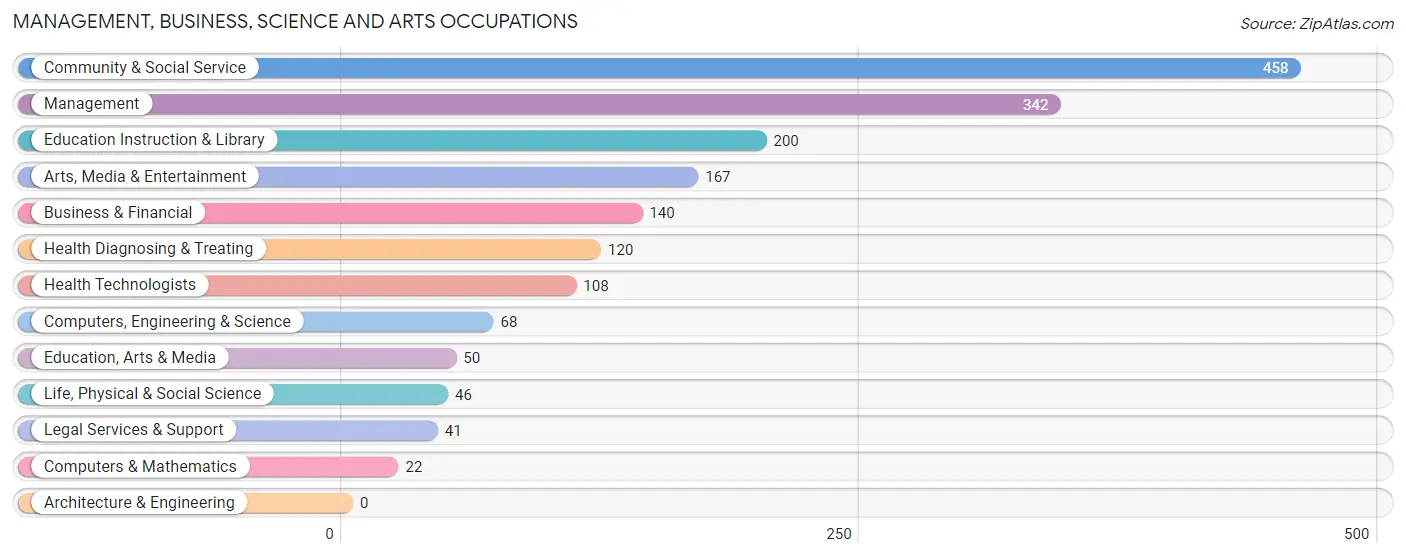
Management, Business, Science and Arts Occupations
The most common Management, Business, Science and Arts occupations in Surfside are Community & Social Service (458 | 19.6%), Management (342 | 14.6%), Education Instruction & Library (200 | 8.6%), Arts, Media & Entertainment (167 | 7.1%), and Business & Financial (140 | 6.0%).
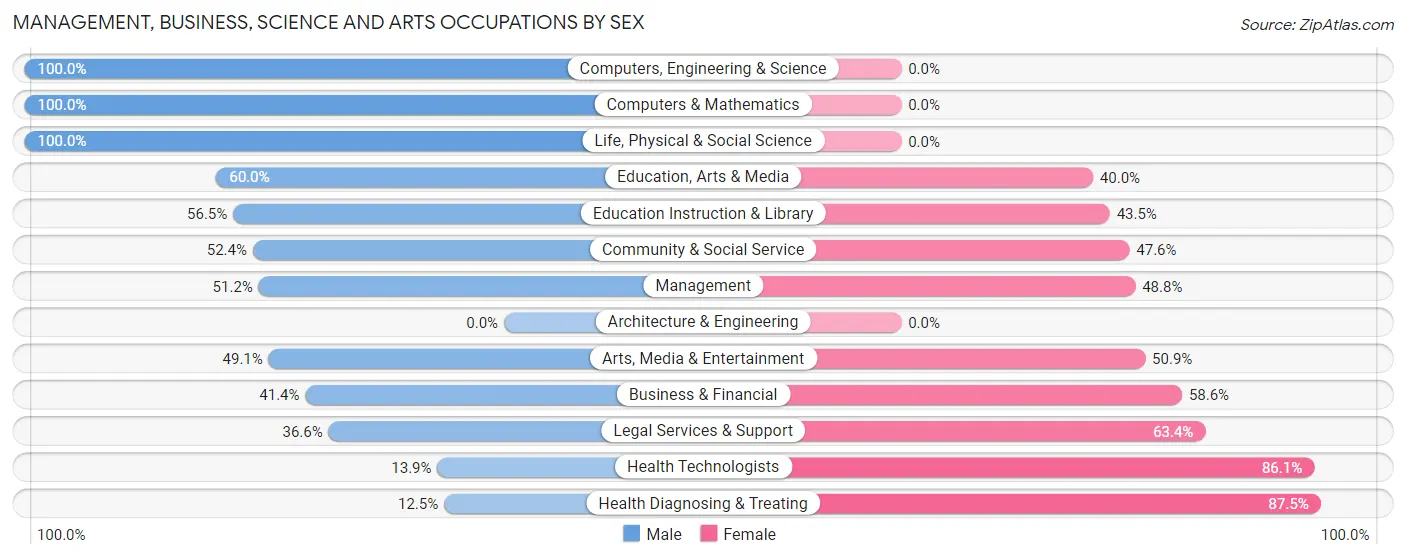
Management, Business, Science and Arts Occupations by Sex
Within the Management, Business, Science and Arts occupations in Surfside, the most male-oriented occupations are Computers, Engineering & Science (100.0%), Computers & Mathematics (100.0%), and Life, Physical & Social Science (100.0%), while the most female-oriented occupations are Health Diagnosing & Treating (87.5%), Health Technologists (86.1%), and Legal Services & Support (63.4%).
| Occupation | Male | Female |
| Management | 175 (51.2%) | 167 (48.8%) |
| Business & Financial | 58 (41.4%) | 82 (58.6%) |
| Computers, Engineering & Science | 68 (100.0%) | 0 (0.0%) |
| Computers & Mathematics | 22 (100.0%) | 0 (0.0%) |
| Architecture & Engineering | 0 (0.0%) | 0 (0.0%) |
| Life, Physical & Social Science | 46 (100.0%) | 0 (0.0%) |
| Community & Social Service | 240 (52.4%) | 218 (47.6%) |
| Education, Arts & Media | 30 (60.0%) | 20 (40.0%) |
| Legal Services & Support | 15 (36.6%) | 26 (63.4%) |
| Education Instruction & Library | 113 (56.5%) | 87 (43.5%) |
| Arts, Media & Entertainment | 82 (49.1%) | 85 (50.9%) |
| Health Diagnosing & Treating | 15 (12.5%) | 105 (87.5%) |
| Health Technologists | 15 (13.9%) | 93 (86.1%) |
| Total (Category) | 556 (49.3%) | 572 (50.7%) |
| Total (Overall) | 1,087 (46.6%) | 1,248 (53.4%) |
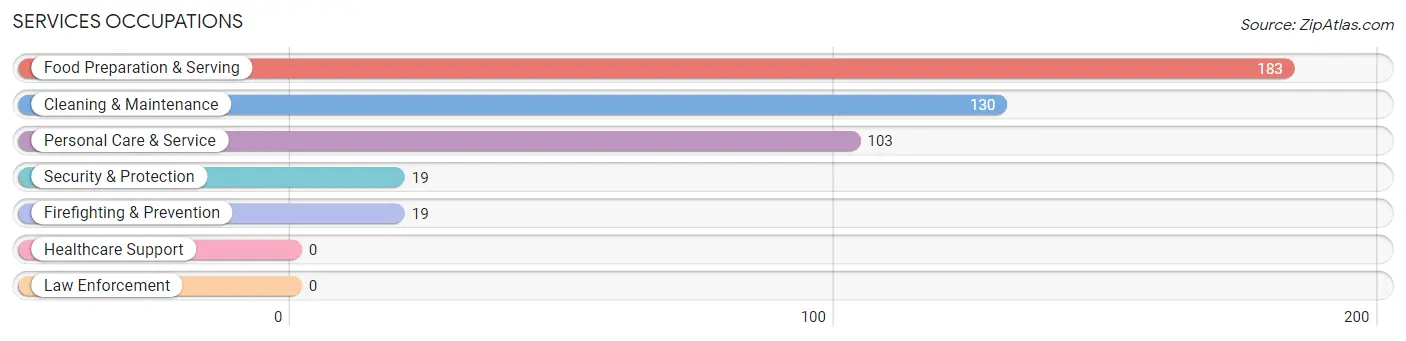
Services Occupations
The most common Services occupations in Surfside are Food Preparation & Serving (183 | 7.8%), Cleaning & Maintenance (130 | 5.6%), Personal Care & Service (103 | 4.4%), Security & Protection (19 | 0.8%), and Firefighting & Prevention (19 | 0.8%).
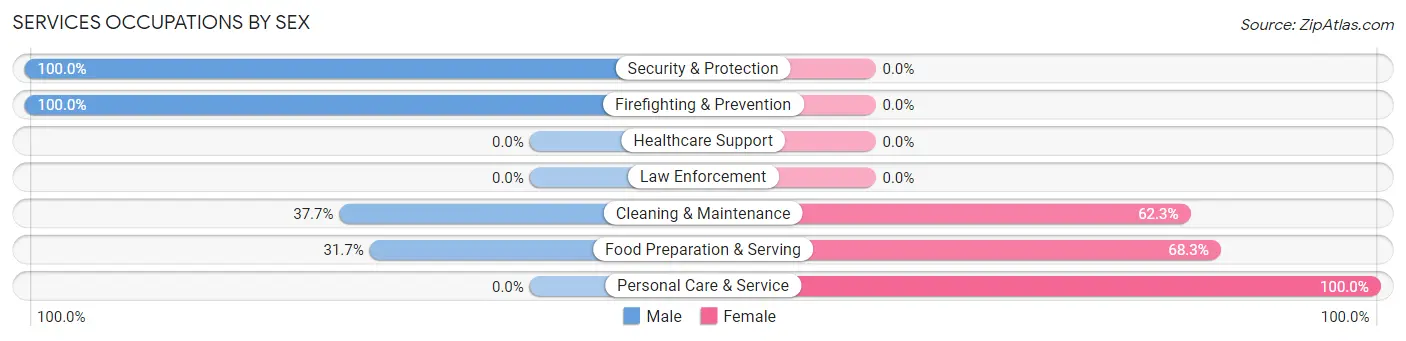
Services Occupations by Sex
Within the Services occupations in Surfside, the most male-oriented occupations are Security & Protection (100.0%), Firefighting & Prevention (100.0%), and Cleaning & Maintenance (37.7%), while the most female-oriented occupations are Personal Care & Service (100.0%), Food Preparation & Serving (68.3%), and Cleaning & Maintenance (62.3%).
| Occupation | Male | Female |
| Healthcare Support | 0 (0.0%) | 0 (0.0%) |
| Security & Protection | 19 (100.0%) | 0 (0.0%) |
| Firefighting & Prevention | 19 (100.0%) | 0 (0.0%) |
| Law Enforcement | 0 (0.0%) | 0 (0.0%) |
| Food Preparation & Serving | 58 (31.7%) | 125 (68.3%) |
| Cleaning & Maintenance | 49 (37.7%) | 81 (62.3%) |
| Personal Care & Service | 0 (0.0%) | 103 (100.0%) |
| Total (Category) | 126 (29.0%) | 309 (71.0%) |
| Total (Overall) | 1,087 (46.6%) | 1,248 (53.4%) |
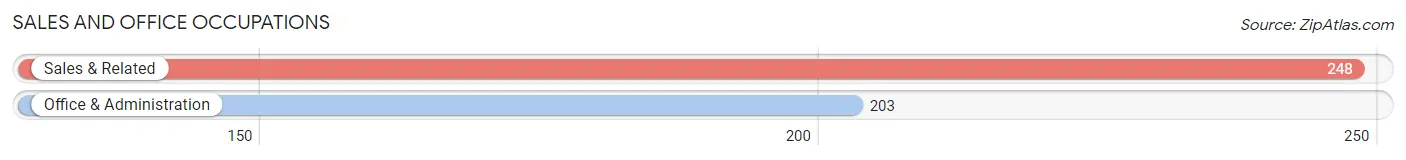
Sales and Office Occupations
The most common Sales and Office occupations in Surfside are Sales & Related (248 | 10.6%), and Office & Administration (203 | 8.7%).
Sales and Office Occupations by Sex
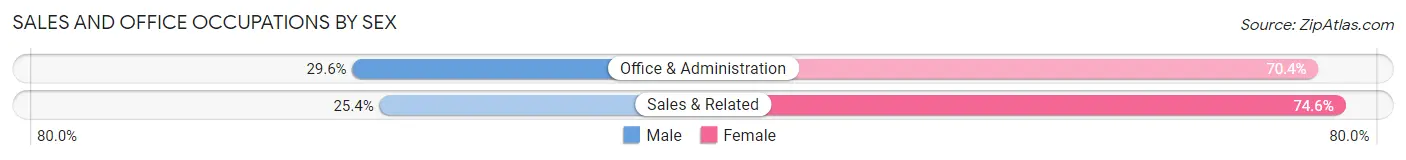
| Occupation | Male | Female |
| Sales & Related | 63 (25.4%) | 185 (74.6%) |
| Office & Administration | 60 (29.6%) | 143 (70.4%) |
| Total (Category) | 123 (27.3%) | 328 (72.7%) |
| Total (Overall) | 1,087 (46.6%) | 1,248 (53.4%) |
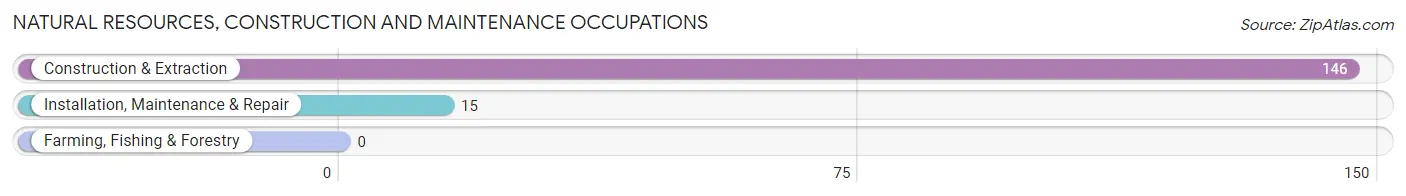
Natural Resources, Construction and Maintenance Occupations
The most common Natural Resources, Construction and Maintenance occupations in Surfside are Construction & Extraction (146 | 6.2%), and Installation, Maintenance & Repair (15 | 0.6%).
Natural Resources, Construction and Maintenance Occupations by Sex
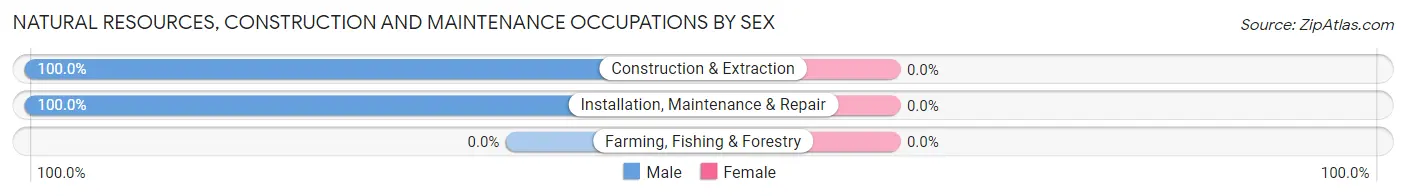
| Occupation | Male | Female |
| Farming, Fishing & Forestry | 0 (0.0%) | 0 (0.0%) |
| Construction & Extraction | 146 (100.0%) | 0 (0.0%) |
| Installation, Maintenance & Repair | 15 (100.0%) | 0 (0.0%) |
| Total (Category) | 161 (100.0%) | 0 (0.0%) |
| Total (Overall) | 1,087 (46.6%) | 1,248 (53.4%) |
Production, Transportation and Moving Occupations
The most common Production, Transportation and Moving occupations in Surfside are Transportation (100 | 4.3%), and Production (60 | 2.6%).
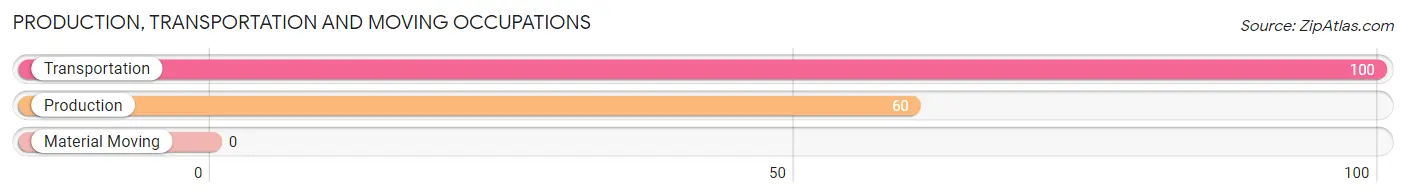
Production, Transportation and Moving Occupations by Sex
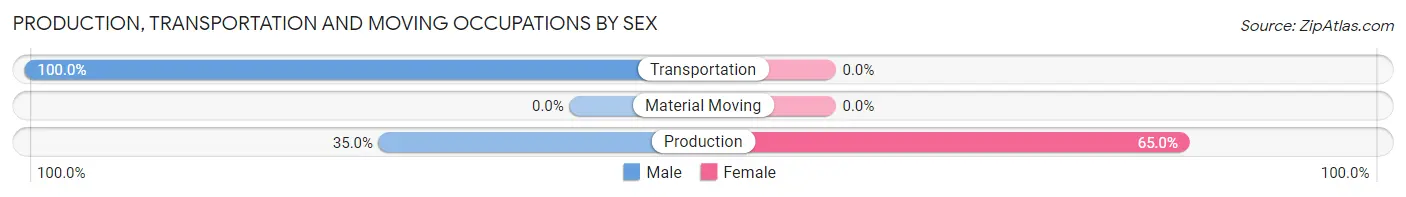
| Occupation | Male | Female |
| Production | 21 (35.0%) | 39 (65.0%) |
| Transportation | 100 (100.0%) | 0 (0.0%) |
| Material Moving | 0 (0.0%) | 0 (0.0%) |
| Total (Category) | 121 (75.6%) | 39 (24.4%) |
| Total (Overall) | 1,087 (46.6%) | 1,248 (53.4%) |
Employment Industries by Sex in Surfside
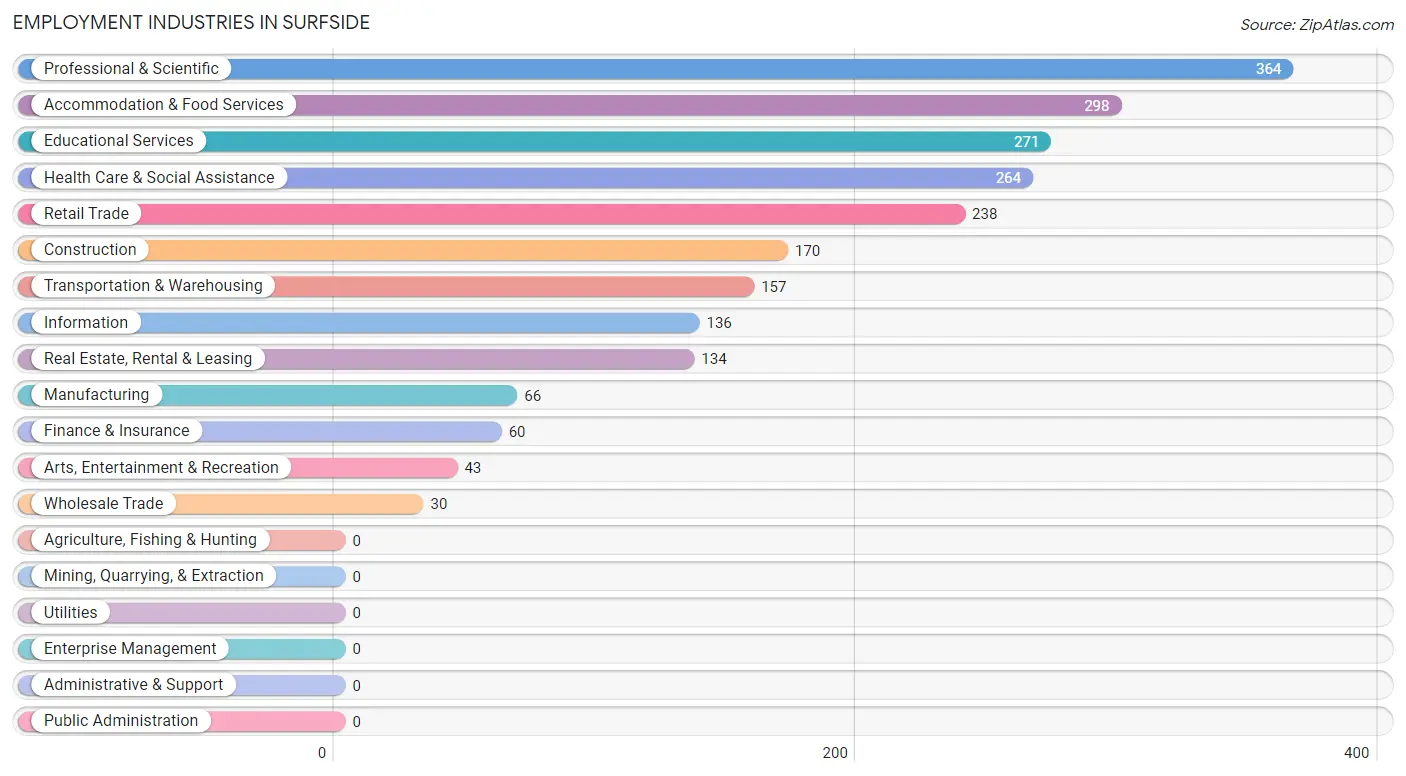
Employment Industries in Surfside
The major employment industries in Surfside include Professional & Scientific (364 | 15.6%), Accommodation & Food Services (298 | 12.8%), Educational Services (271 | 11.6%), Health Care & Social Assistance (264 | 11.3%), and Retail Trade (238 | 10.2%).
Employment Industries by Sex in Surfside
The Surfside industries that see more men than women are Construction (100.0%), Wholesale Trade (100.0%), and Manufacturing (74.2%), whereas the industries that tend to have a higher number of women are Finance & Insurance (100.0%), Health Care & Social Assistance (71.6%), and Retail Trade (69.8%).
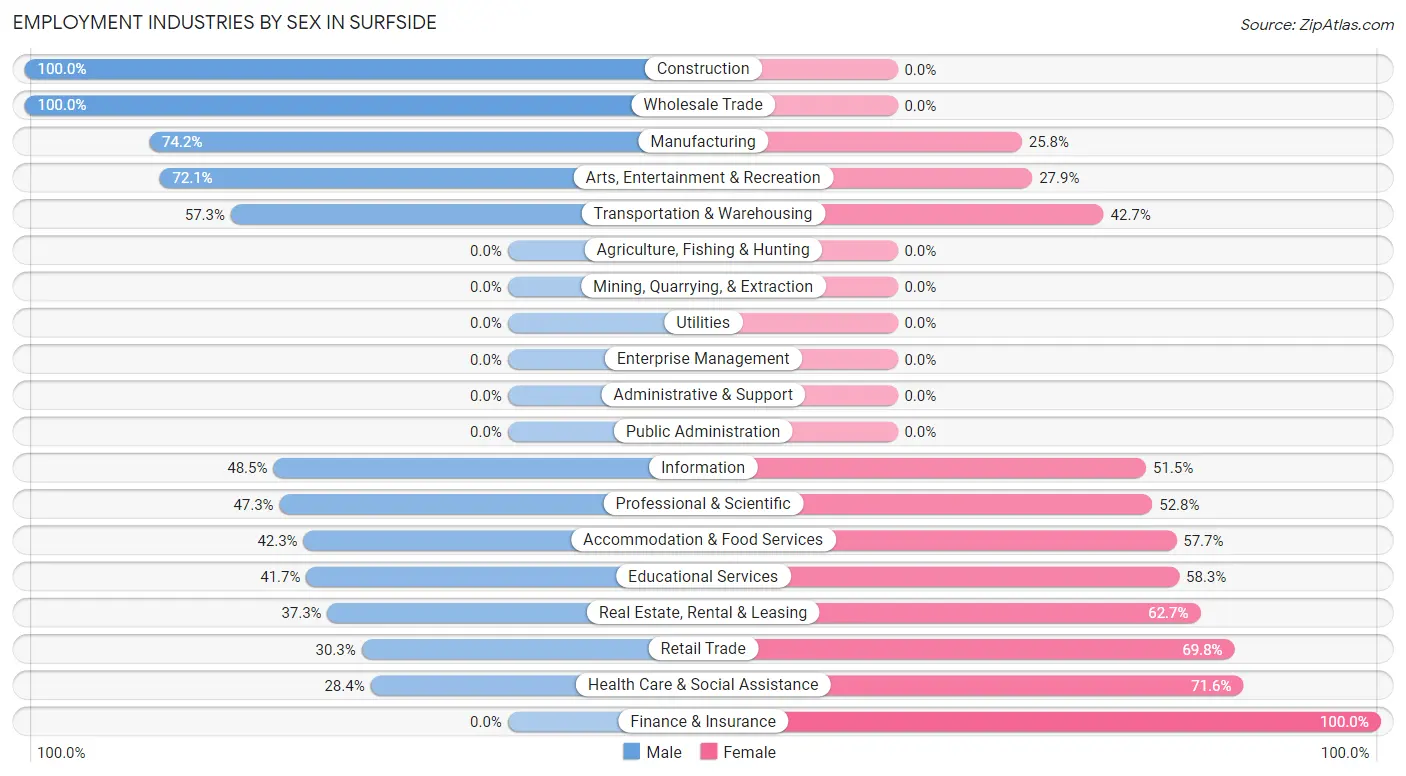
| Industry | Male | Female |
| Agriculture, Fishing & Hunting | 0 (0.0%) | 0 (0.0%) |
| Mining, Quarrying, & Extraction | 0 (0.0%) | 0 (0.0%) |
| Construction | 170 (100.0%) | 0 (0.0%) |
| Manufacturing | 49 (74.2%) | 17 (25.8%) |
| Wholesale Trade | 30 (100.0%) | 0 (0.0%) |
| Retail Trade | 72 (30.2%) | 166 (69.8%) |
| Transportation & Warehousing | 90 (57.3%) | 67 (42.7%) |
| Utilities | 0 (0.0%) | 0 (0.0%) |
| Information | 66 (48.5%) | 70 (51.5%) |
| Finance & Insurance | 0 (0.0%) | 60 (100.0%) |
| Real Estate, Rental & Leasing | 50 (37.3%) | 84 (62.7%) |
| Professional & Scientific | 172 (47.2%) | 192 (52.7%) |
| Enterprise Management | 0 (0.0%) | 0 (0.0%) |
| Administrative & Support | 0 (0.0%) | 0 (0.0%) |
| Educational Services | 113 (41.7%) | 158 (58.3%) |
| Health Care & Social Assistance | 75 (28.4%) | 189 (71.6%) |
| Arts, Entertainment & Recreation | 31 (72.1%) | 12 (27.9%) |
| Accommodation & Food Services | 126 (42.3%) | 172 (57.7%) |
| Public Administration | 0 (0.0%) | 0 (0.0%) |
| Total | 1,087 (46.6%) | 1,248 (53.4%) |
Education in Surfside
School Enrollment in Surfside
The most common levels of schooling among the 1,338 students in Surfside are elementary school (428 | 32.0%), middle school (411 | 30.7%), and college / undergraduate (167 | 12.5%).
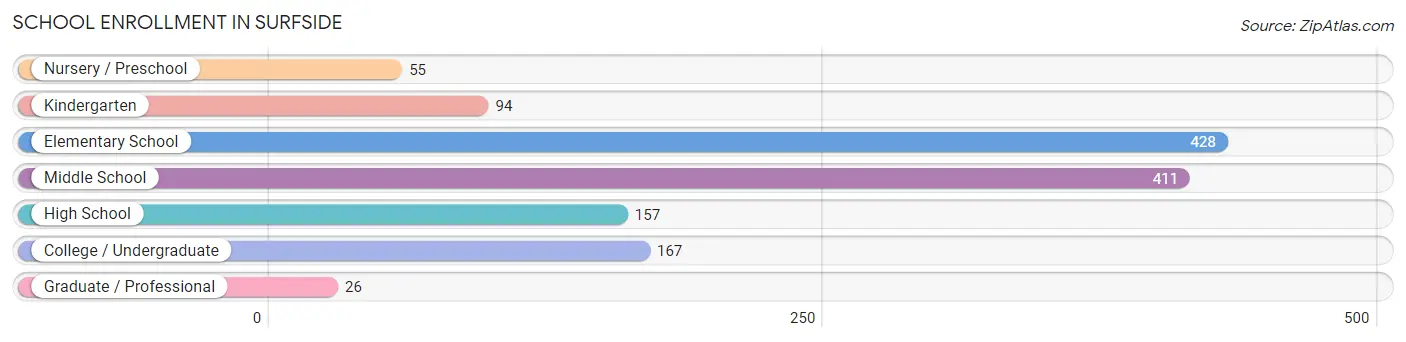
| School Level | # Students | % Students |
| Nursery / Preschool | 55 | 4.1% |
| Kindergarten | 94 | 7.0% |
| Elementary School | 428 | 32.0% |
| Middle School | 411 | 30.7% |
| High School | 157 | 11.7% |
| College / Undergraduate | 167 | 12.5% |
| Graduate / Professional | 26 | 1.9% |
| Total | 1,338 | 100.0% |
School Enrollment by Age by Funding Source in Surfside
Out of a total of 1,338 students who are enrolled in schools in Surfside, 611 (45.7%) attend a private institution, while the remaining 727 (54.3%) are enrolled in public schools. The age group of 3 to 4 year olds has the highest likelihood of being enrolled in private schools, with 25 (100.0% in the age bracket) enrolled. Conversely, the age group of 15 to 17 year olds has the lowest likelihood of being enrolled in a private school, with 157 (100.0% in the age bracket) attending a public institution.
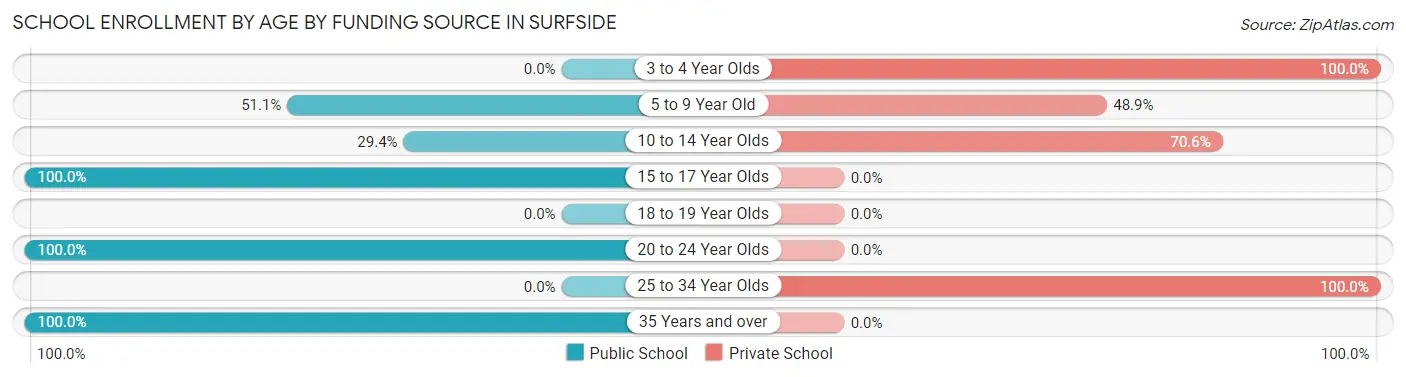
| Age Bracket | Public School | Private School |
| 3 to 4 Year Olds | 0 (0.0%) | 25 (100.0%) |
| 5 to 9 Year Old | 282 (51.1%) | 270 (48.9%) |
| 10 to 14 Year Olds | 121 (29.4%) | 290 (70.6%) |
| 15 to 17 Year Olds | 157 (100.0%) | 0 (0.0%) |
| 18 to 19 Year Olds | 0 (0.0%) | 0 (0.0%) |
| 20 to 24 Year Olds | 121 (100.0%) | 0 (0.0%) |
| 25 to 34 Year Olds | 0 (0.0%) | 26 (100.0%) |
| 35 Years and over | 46 (100.0%) | 0 (0.0%) |
| Total | 727 (54.3%) | 611 (45.7%) |
Educational Attainment by Field of Study in Surfside
Business (479 | 21.4%), social sciences (286 | 12.8%), engineering (248 | 11.1%), education (195 | 8.7%), and communications (184 | 8.2%) are the most common fields of study among 2,239 individuals in Surfside who have obtained a bachelor's degree or higher.
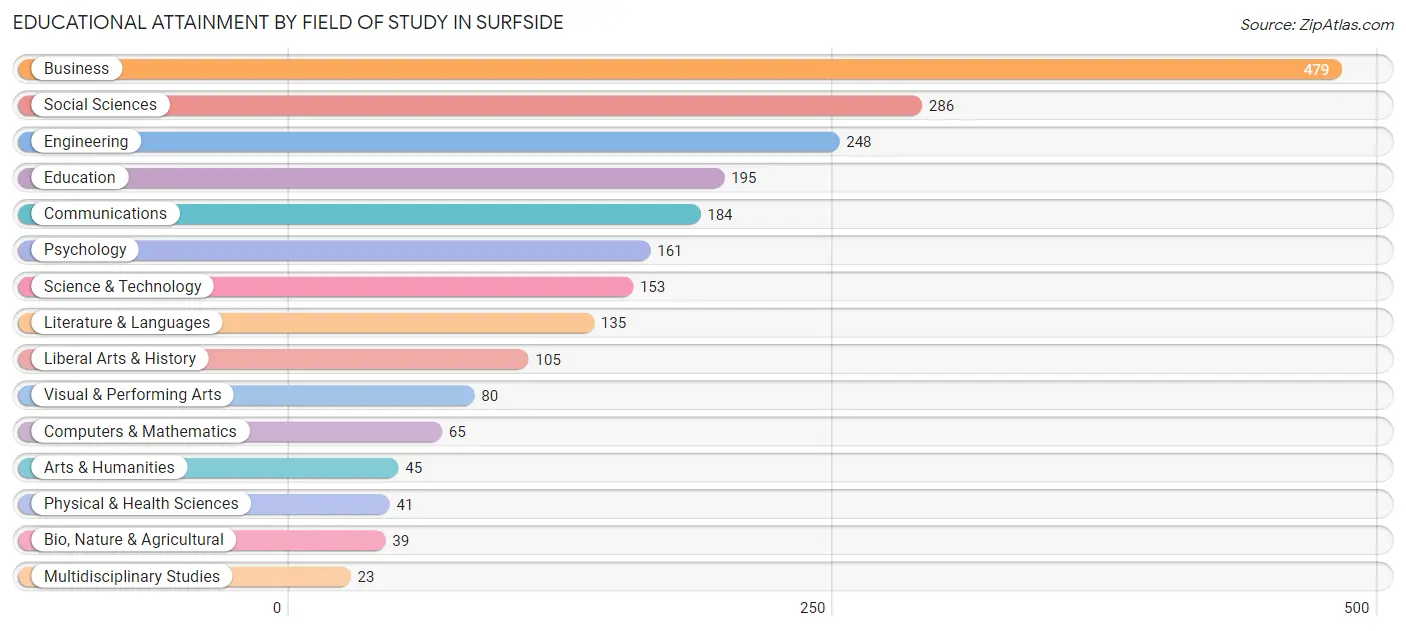
| Field of Study | # Graduates | % Graduates |
| Computers & Mathematics | 65 | 2.9% |
| Bio, Nature & Agricultural | 39 | 1.7% |
| Physical & Health Sciences | 41 | 1.8% |
| Psychology | 161 | 7.2% |
| Social Sciences | 286 | 12.8% |
| Engineering | 248 | 11.1% |
| Multidisciplinary Studies | 23 | 1.0% |
| Science & Technology | 153 | 6.8% |
| Business | 479 | 21.4% |
| Education | 195 | 8.7% |
| Literature & Languages | 135 | 6.0% |
| Liberal Arts & History | 105 | 4.7% |
| Visual & Performing Arts | 80 | 3.6% |
| Communications | 184 | 8.2% |
| Arts & Humanities | 45 | 2.0% |
| Total | 2,239 | 100.0% |
Transportation & Commute in Surfside
Vehicle Availability by Sex in Surfside
The most prevalent vehicle ownership categories in Surfside are males with 2 vehicles (586, accounting for 53.9%) and females with 2 vehicles (549, making up 47.6%).
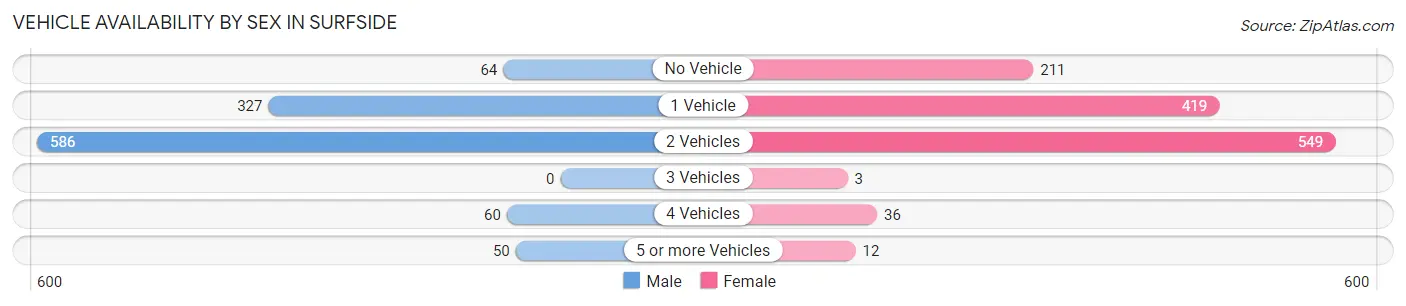
| Vehicles Available | Male | Female |
| No Vehicle | 64 (5.9%) | 211 (17.2%) |
| 1 Vehicle | 327 (30.1%) | 419 (34.1%) |
| 2 Vehicles | 586 (53.9%) | 549 (44.6%) |
| 3 Vehicles | 0 (0.0%) | 3 (0.2%) |
| 4 Vehicles | 60 (5.5%) | 36 (2.9%) |
| 5 or more Vehicles | 50 (4.6%) | 12 (1.0%) |
| Total | 1,087 (100.0%) | 1,230 (100.0%) |
Commute Time in Surfside
The most frequently occuring commute durations in Surfside are 30 to 34 minutes (480 commuters, 26.9%), 10 to 14 minutes (239 commuters, 13.4%), and 60 to 89 minutes (229 commuters, 12.8%).
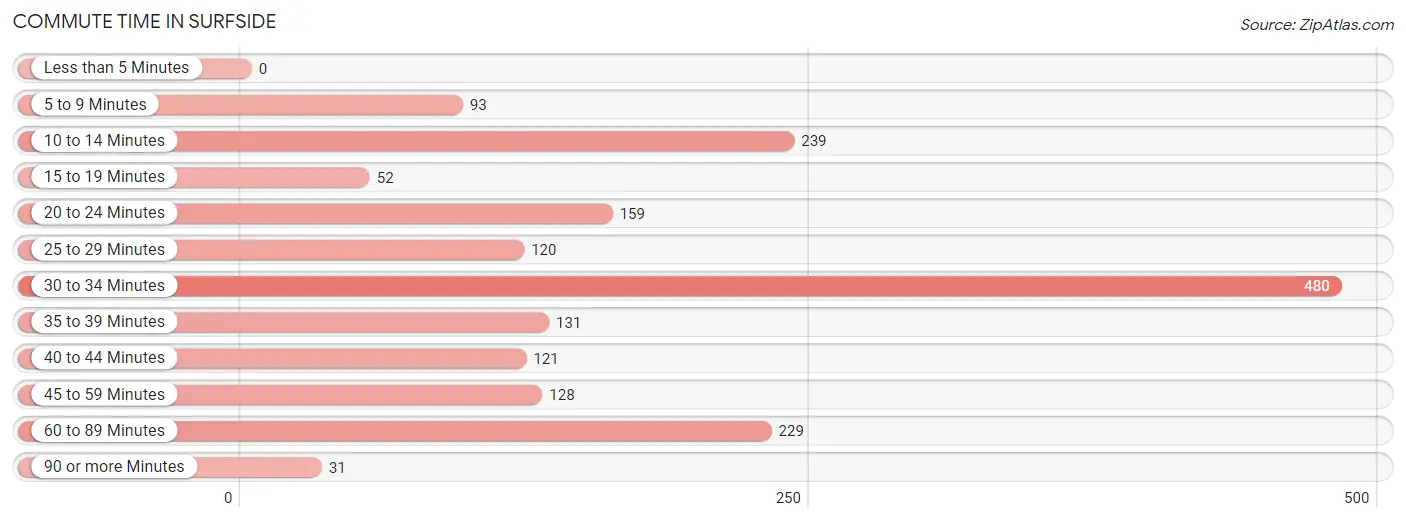
| Commute Time | # Commuters | % Commuters |
| Less than 5 Minutes | 0 | 0.0% |
| 5 to 9 Minutes | 93 | 5.2% |
| 10 to 14 Minutes | 239 | 13.4% |
| 15 to 19 Minutes | 52 | 2.9% |
| 20 to 24 Minutes | 159 | 8.9% |
| 25 to 29 Minutes | 120 | 6.7% |
| 30 to 34 Minutes | 480 | 26.9% |
| 35 to 39 Minutes | 131 | 7.3% |
| 40 to 44 Minutes | 121 | 6.8% |
| 45 to 59 Minutes | 128 | 7.2% |
| 60 to 89 Minutes | 229 | 12.8% |
| 90 or more Minutes | 31 | 1.7% |
Commute Time by Sex in Surfside
The most common commute times in Surfside are 30 to 34 minutes (274 commuters, 29.8%) for males and 30 to 34 minutes (206 commuters, 23.8%) for females.
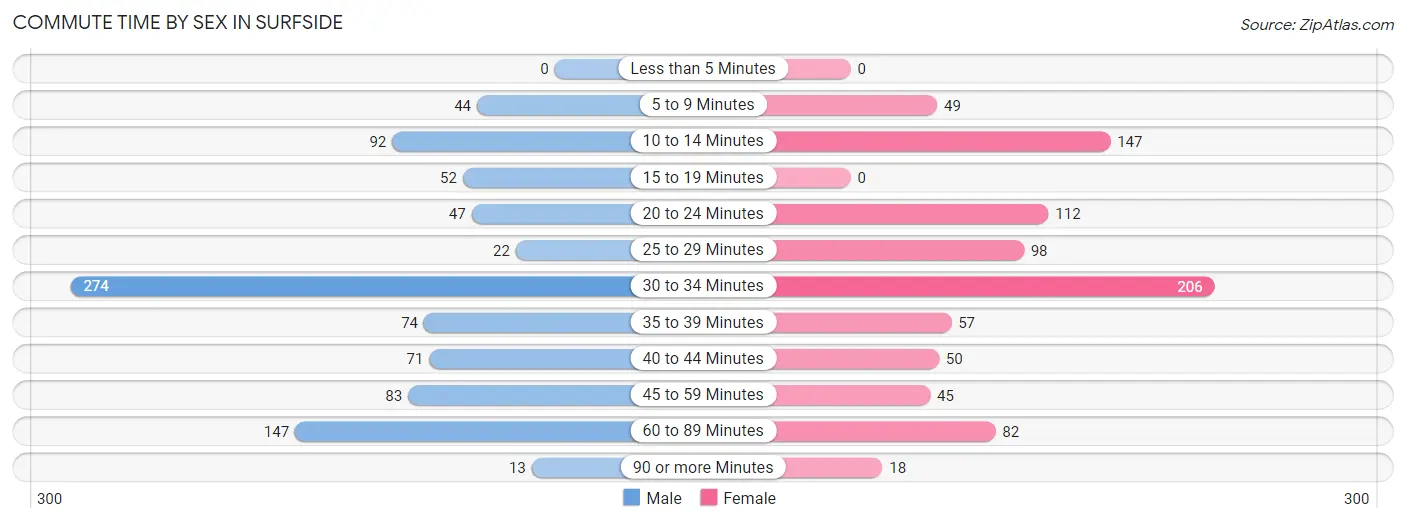
| Commute Time | Male | Female |
| Less than 5 Minutes | 0 (0.0%) | 0 (0.0%) |
| 5 to 9 Minutes | 44 (4.8%) | 49 (5.7%) |
| 10 to 14 Minutes | 92 (10.0%) | 147 (17.0%) |
| 15 to 19 Minutes | 52 (5.7%) | 0 (0.0%) |
| 20 to 24 Minutes | 47 (5.1%) | 112 (13.0%) |
| 25 to 29 Minutes | 22 (2.4%) | 98 (11.3%) |
| 30 to 34 Minutes | 274 (29.8%) | 206 (23.8%) |
| 35 to 39 Minutes | 74 (8.1%) | 57 (6.6%) |
| 40 to 44 Minutes | 71 (7.7%) | 50 (5.8%) |
| 45 to 59 Minutes | 83 (9.0%) | 45 (5.2%) |
| 60 to 89 Minutes | 147 (16.0%) | 82 (9.5%) |
| 90 or more Minutes | 13 (1.4%) | 18 (2.1%) |
Time of Departure to Work by Sex in Surfside
The most frequent times of departure to work in Surfside are 7:30 AM to 7:59 AM (156, 17.0%) for males and 8:00 AM to 8:29 AM (202, 23.4%) for females.
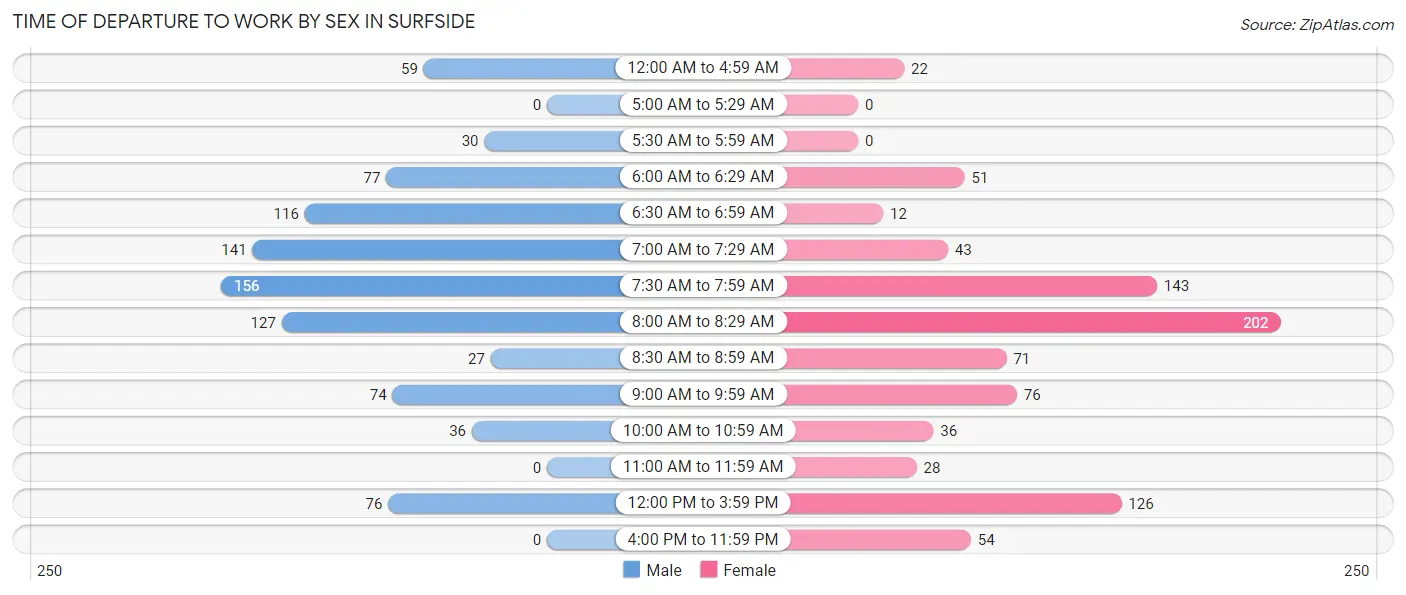
| Time of Departure | Male | Female |
| 12:00 AM to 4:59 AM | 59 (6.4%) | 22 (2.5%) |
| 5:00 AM to 5:29 AM | 0 (0.0%) | 0 (0.0%) |
| 5:30 AM to 5:59 AM | 30 (3.3%) | 0 (0.0%) |
| 6:00 AM to 6:29 AM | 77 (8.4%) | 51 (5.9%) |
| 6:30 AM to 6:59 AM | 116 (12.6%) | 12 (1.4%) |
| 7:00 AM to 7:29 AM | 141 (15.3%) | 43 (5.0%) |
| 7:30 AM to 7:59 AM | 156 (17.0%) | 143 (16.6%) |
| 8:00 AM to 8:29 AM | 127 (13.8%) | 202 (23.4%) |
| 8:30 AM to 8:59 AM | 27 (2.9%) | 71 (8.2%) |
| 9:00 AM to 9:59 AM | 74 (8.1%) | 76 (8.8%) |
| 10:00 AM to 10:59 AM | 36 (3.9%) | 36 (4.2%) |
| 11:00 AM to 11:59 AM | 0 (0.0%) | 28 (3.2%) |
| 12:00 PM to 3:59 PM | 76 (8.3%) | 126 (14.6%) |
| 4:00 PM to 11:59 PM | 0 (0.0%) | 54 (6.2%) |
| Total | 919 (100.0%) | 864 (100.0%) |
Housing Occupancy in Surfside
Occupancy by Ownership in Surfside
Of the total 2,105 dwellings in Surfside, owner-occupied units account for 1,347 (64.0%), while renter-occupied units make up 758 (36.0%).
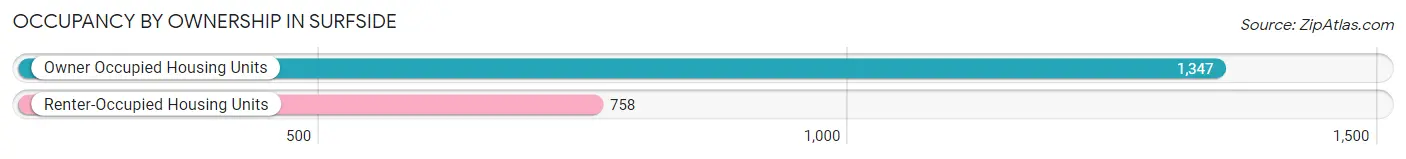
| Occupancy | # Housing Units | % Housing Units |
| Owner Occupied Housing Units | 1,347 | 64.0% |
| Renter-Occupied Housing Units | 758 | 36.0% |
| Total Occupied Housing Units | 2,105 | 100.0% |
Occupancy by Household Size in Surfside
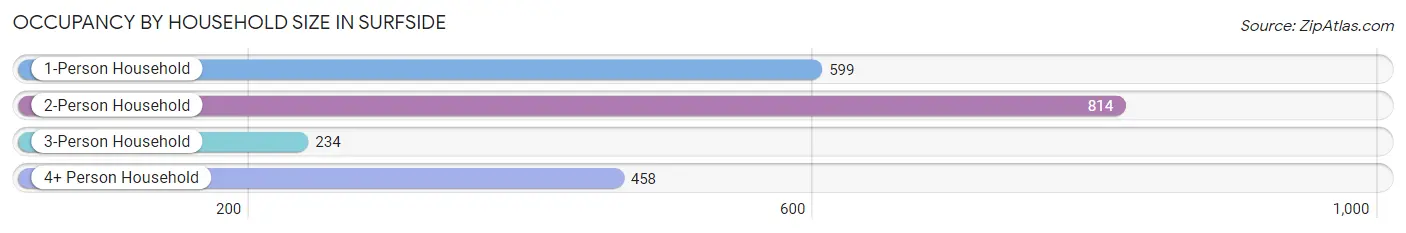
| Household Size | # Housing Units | % Housing Units |
| 1-Person Household | 599 | 28.5% |
| 2-Person Household | 814 | 38.7% |
| 3-Person Household | 234 | 11.1% |
| 4+ Person Household | 458 | 21.8% |
| Total Housing Units | 2,105 | 100.0% |
Occupancy by Ownership by Household Size in Surfside
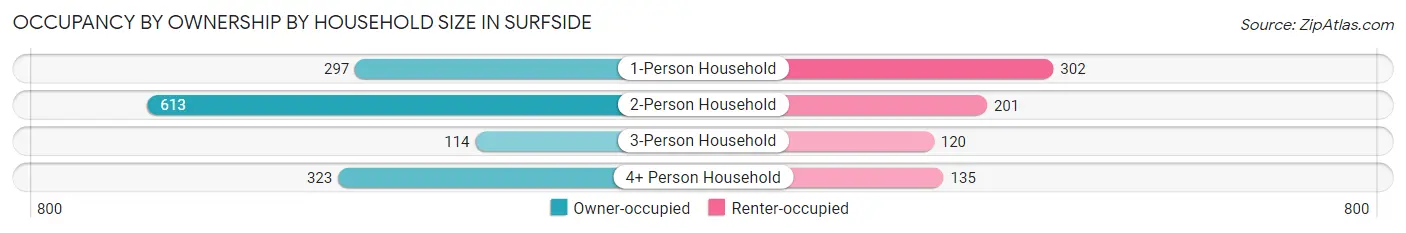
| Household Size | Owner-occupied | Renter-occupied |
| 1-Person Household | 297 (49.6%) | 302 (50.4%) |
| 2-Person Household | 613 (75.3%) | 201 (24.7%) |
| 3-Person Household | 114 (48.7%) | 120 (51.3%) |
| 4+ Person Household | 323 (70.5%) | 135 (29.5%) |
| Total Housing Units | 1,347 (64.0%) | 758 (36.0%) |
Occupancy by Educational Attainment in Surfside
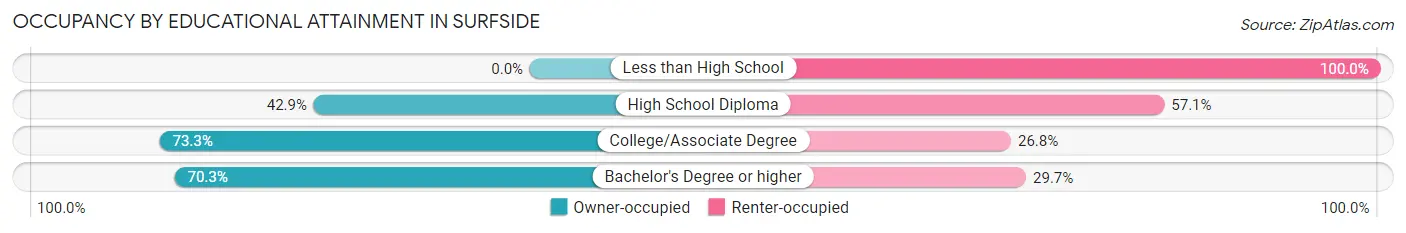
| Household Size | Owner-occupied | Renter-occupied |
| Less than High School | 0 (0.0%) | 14 (100.0%) |
| High School Diploma | 210 (42.9%) | 280 (57.1%) |
| College/Associate Degree | 293 (73.3%) | 107 (26.8%) |
| Bachelor's Degree or higher | 844 (70.3%) | 357 (29.7%) |
Occupancy by Age of Householder in Surfside
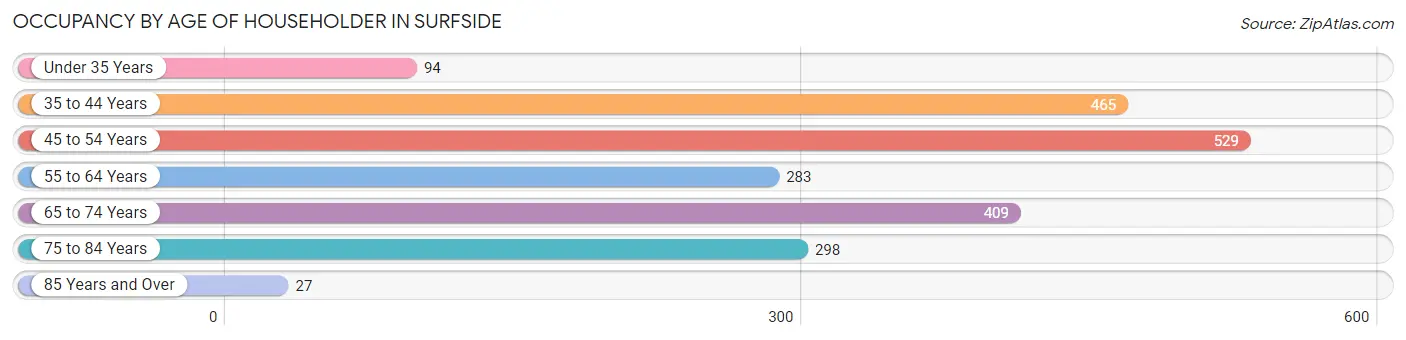
| Age Bracket | # Households | % Households |
| Under 35 Years | 94 | 4.5% |
| 35 to 44 Years | 465 | 22.1% |
| 45 to 54 Years | 529 | 25.1% |
| 55 to 64 Years | 283 | 13.4% |
| 65 to 74 Years | 409 | 19.4% |
| 75 to 84 Years | 298 | 14.2% |
| 85 Years and Over | 27 | 1.3% |
| Total | 2,105 | 100.0% |
Housing Finances in Surfside
Median Income by Occupancy in Surfside
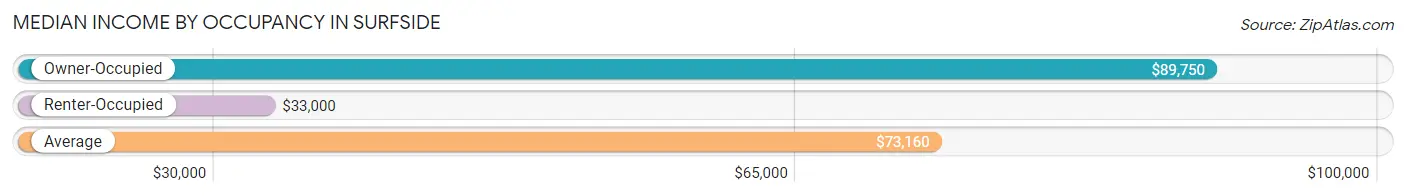
| Occupancy Type | # Households | Median Income |
| Owner-Occupied | 1,347 (64.0%) | $89,750 |
| Renter-Occupied | 758 (36.0%) | $33,000 |
| Average | 2,105 (100.0%) | $73,160 |
Occupancy by Householder Income Bracket in Surfside
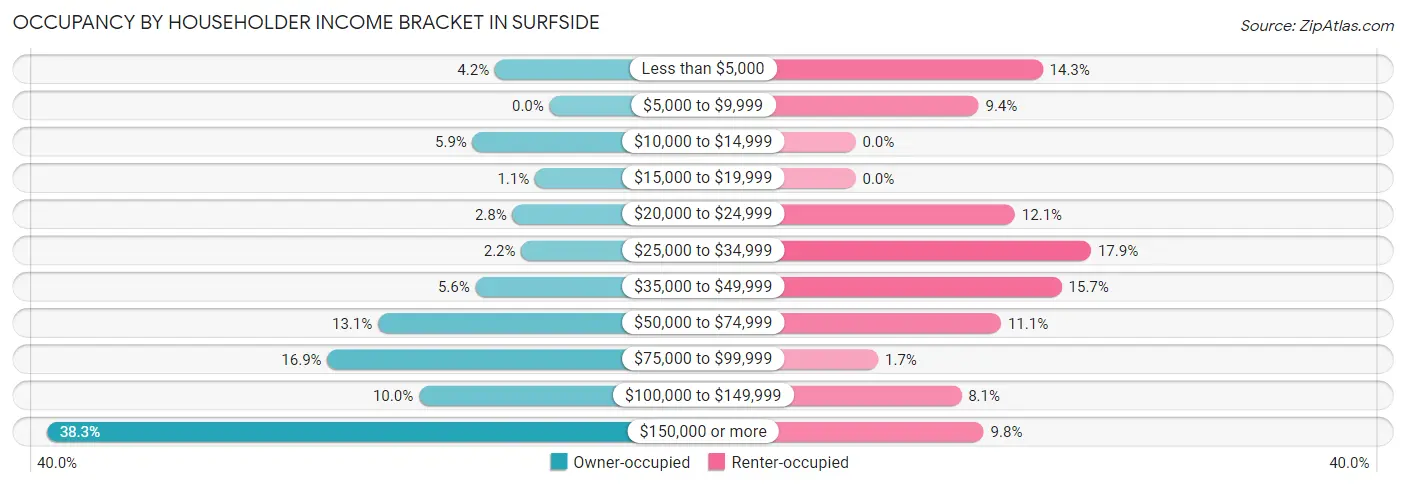
| Income Bracket | Owner-occupied | Renter-occupied |
| Less than $5,000 | 56 (4.2%) | 108 (14.2%) |
| $5,000 to $9,999 | 0 (0.0%) | 71 (9.4%) |
| $10,000 to $14,999 | 79 (5.9%) | 0 (0.0%) |
| $15,000 to $19,999 | 15 (1.1%) | 0 (0.0%) |
| $20,000 to $24,999 | 38 (2.8%) | 92 (12.1%) |
| $25,000 to $34,999 | 29 (2.1%) | 136 (17.9%) |
| $35,000 to $49,999 | 76 (5.6%) | 119 (15.7%) |
| $50,000 to $74,999 | 176 (13.1%) | 84 (11.1%) |
| $75,000 to $99,999 | 228 (16.9%) | 13 (1.7%) |
| $100,000 to $149,999 | 134 (10.0%) | 61 (8.1%) |
| $150,000 or more | 516 (38.3%) | 74 (9.8%) |
| Total | 1,347 (100.0%) | 758 (100.0%) |
Monthly Housing Cost Tiers in Surfside
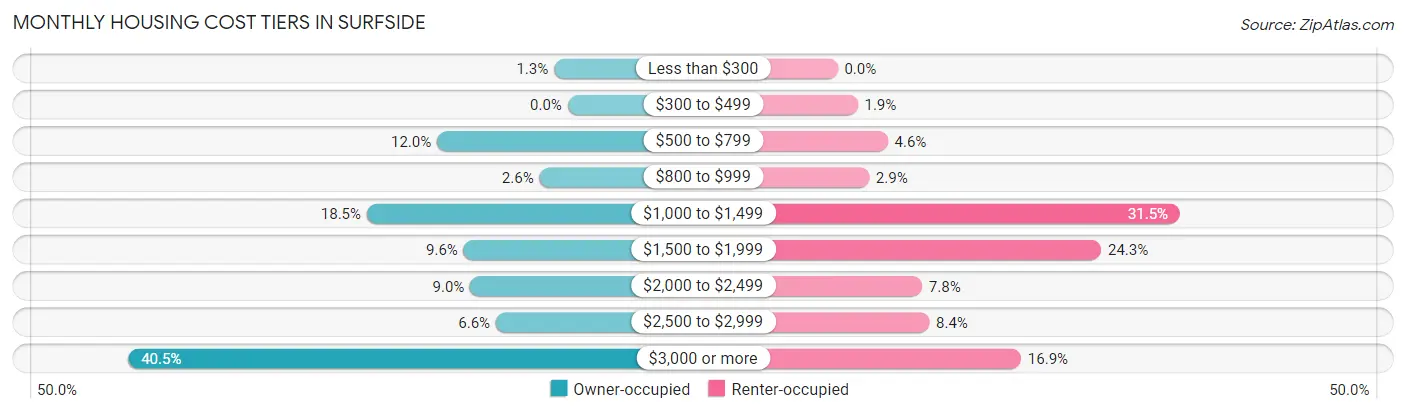
| Monthly Cost | Owner-occupied | Renter-occupied |
| Less than $300 | 17 (1.3%) | 0 (0.0%) |
| $300 to $499 | 0 (0.0%) | 14 (1.8%) |
| $500 to $799 | 162 (12.0%) | 35 (4.6%) |
| $800 to $999 | 35 (2.6%) | 22 (2.9%) |
| $1,000 to $1,499 | 249 (18.5%) | 239 (31.5%) |
| $1,500 to $1,999 | 129 (9.6%) | 184 (24.3%) |
| $2,000 to $2,499 | 121 (9.0%) | 59 (7.8%) |
| $2,500 to $2,999 | 89 (6.6%) | 64 (8.4%) |
| $3,000 or more | 545 (40.5%) | 128 (16.9%) |
| Total | 1,347 (100.0%) | 758 (100.0%) |
Physical Housing Characteristics in Surfside
Housing Structures in Surfside
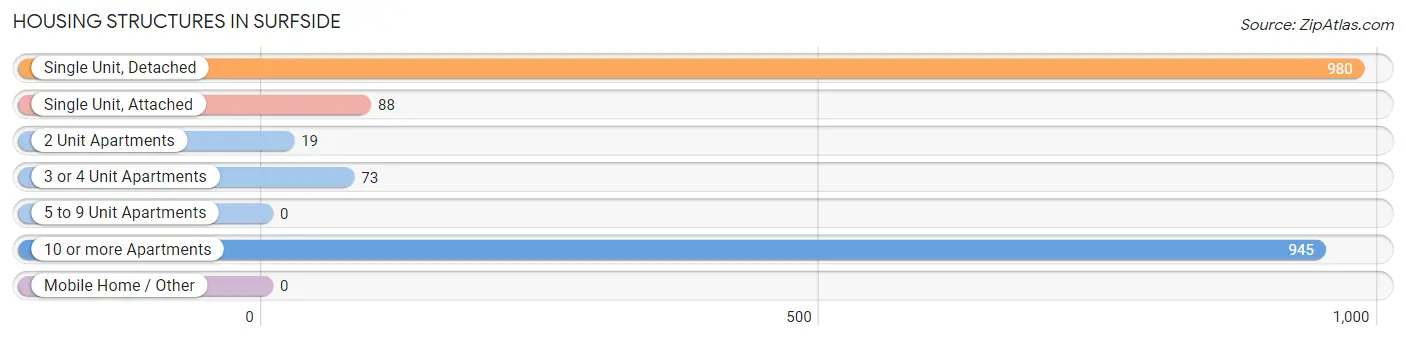
| Structure Type | # Housing Units | % Housing Units |
| Single Unit, Detached | 980 | 46.6% |
| Single Unit, Attached | 88 | 4.2% |
| 2 Unit Apartments | 19 | 0.9% |
| 3 or 4 Unit Apartments | 73 | 3.5% |
| 5 to 9 Unit Apartments | 0 | 0.0% |
| 10 or more Apartments | 945 | 44.9% |
| Mobile Home / Other | 0 | 0.0% |
| Total | 2,105 | 100.0% |
Housing Structures by Occupancy in Surfside
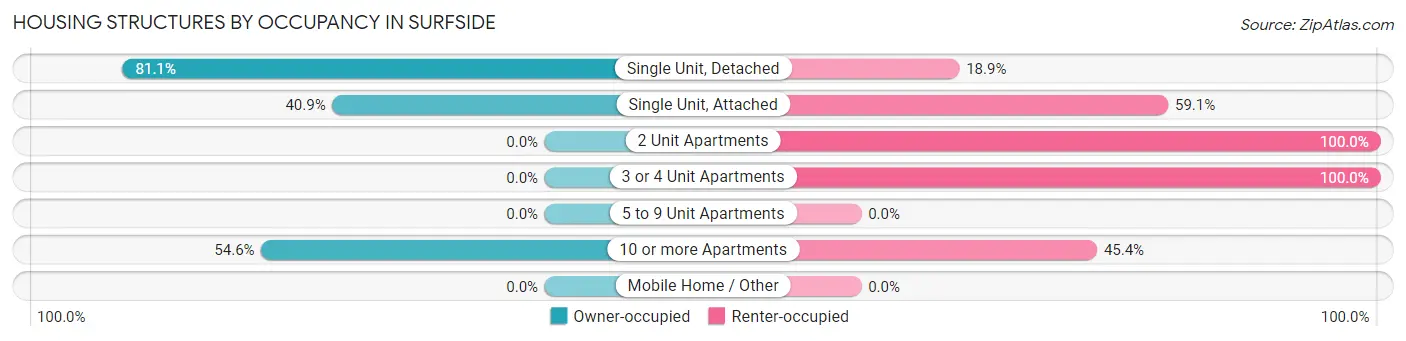
| Structure Type | Owner-occupied | Renter-occupied |
| Single Unit, Detached | 795 (81.1%) | 185 (18.9%) |
| Single Unit, Attached | 36 (40.9%) | 52 (59.1%) |
| 2 Unit Apartments | 0 (0.0%) | 19 (100.0%) |
| 3 or 4 Unit Apartments | 0 (0.0%) | 73 (100.0%) |
| 5 to 9 Unit Apartments | 0 (0.0%) | 0 (0.0%) |
| 10 or more Apartments | 516 (54.6%) | 429 (45.4%) |
| Mobile Home / Other | 0 (0.0%) | 0 (0.0%) |
| Total | 1,347 (64.0%) | 758 (36.0%) |
Housing Structures by Number of Rooms in Surfside
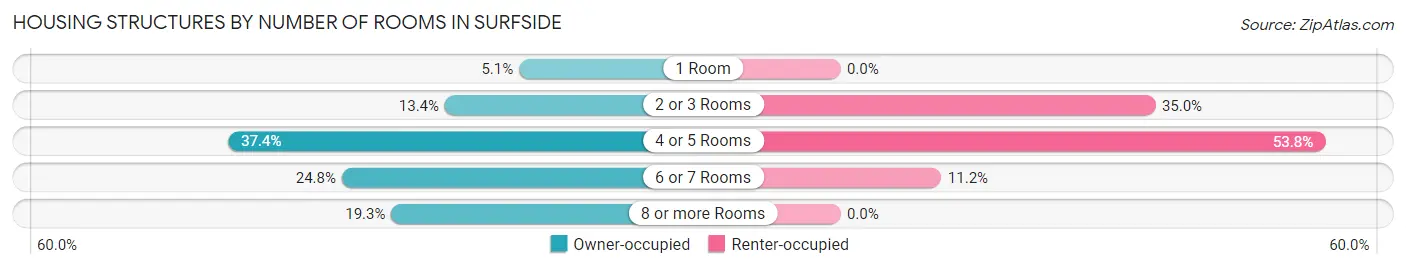
| Number of Rooms | Owner-occupied | Renter-occupied |
| 1 Room | 69 (5.1%) | 0 (0.0%) |
| 2 or 3 Rooms | 180 (13.4%) | 265 (35.0%) |
| 4 or 5 Rooms | 504 (37.4%) | 408 (53.8%) |
| 6 or 7 Rooms | 334 (24.8%) | 85 (11.2%) |
| 8 or more Rooms | 260 (19.3%) | 0 (0.0%) |
| Total | 1,347 (100.0%) | 758 (100.0%) |
Housing Structure by Heating Type in Surfside
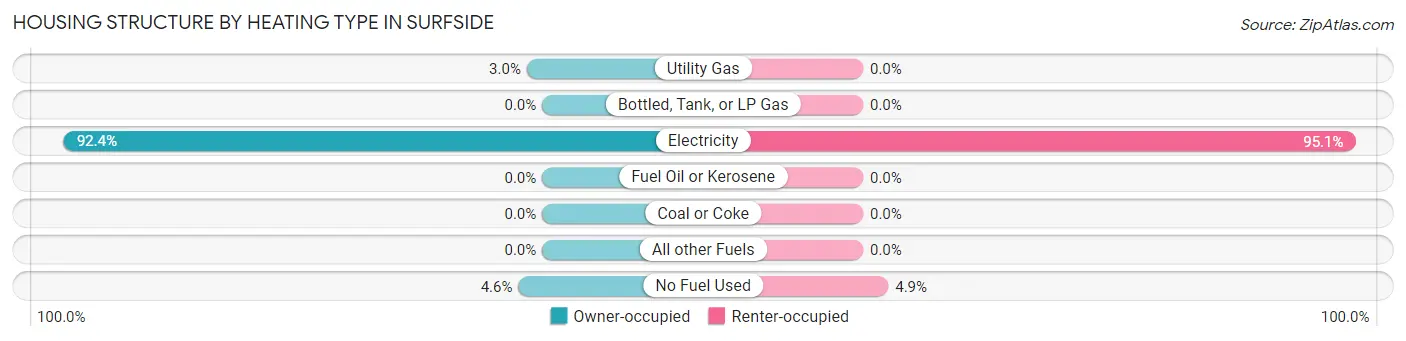
| Heating Type | Owner-occupied | Renter-occupied |
| Utility Gas | 40 (3.0%) | 0 (0.0%) |
| Bottled, Tank, or LP Gas | 0 (0.0%) | 0 (0.0%) |
| Electricity | 1,245 (92.4%) | 721 (95.1%) |
| Fuel Oil or Kerosene | 0 (0.0%) | 0 (0.0%) |
| Coal or Coke | 0 (0.0%) | 0 (0.0%) |
| All other Fuels | 0 (0.0%) | 0 (0.0%) |
| No Fuel Used | 62 (4.6%) | 37 (4.9%) |
| Total | 1,347 (100.0%) | 758 (100.0%) |
Household Vehicle Usage in Surfside
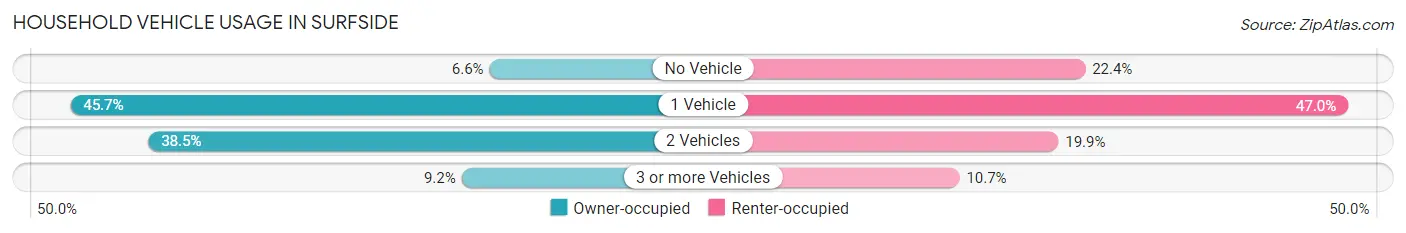
| Vehicles per Household | Owner-occupied | Renter-occupied |
| No Vehicle | 89 (6.6%) | 170 (22.4%) |
| 1 Vehicle | 616 (45.7%) | 356 (47.0%) |
| 2 Vehicles | 518 (38.5%) | 151 (19.9%) |
| 3 or more Vehicles | 124 (9.2%) | 81 (10.7%) |
| Total | 1,347 (100.0%) | 758 (100.0%) |
Real Estate & Mortgages in Surfside
Real Estate and Mortgage Overview in Surfside
| Characteristic | Without Mortgage | With Mortgage |
| Housing Units | 609 | 738 |
| Median Property Value | $609,500 | $766,700 |
| Median Household Income | $79,612 | $284 |
| Monthly Housing Costs | $1,173 | $488 |
| Real Estate Taxes | $6,611 | $0 |
Property Value by Mortgage Status in Surfside
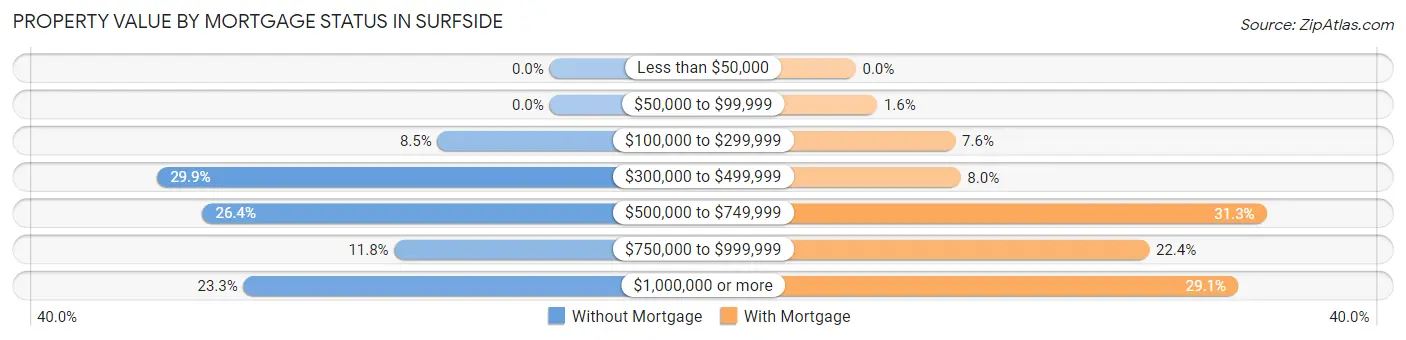
| Property Value | Without Mortgage | With Mortgage |
| Less than $50,000 | 0 (0.0%) | 0 (0.0%) |
| $50,000 to $99,999 | 0 (0.0%) | 12 (1.6%) |
| $100,000 to $299,999 | 52 (8.5%) | 56 (7.6%) |
| $300,000 to $499,999 | 182 (29.9%) | 59 (8.0%) |
| $500,000 to $749,999 | 161 (26.4%) | 231 (31.3%) |
| $750,000 to $999,999 | 72 (11.8%) | 165 (22.4%) |
| $1,000,000 or more | 142 (23.3%) | 215 (29.1%) |
| Total | 609 (100.0%) | 738 (100.0%) |
Household Income by Mortgage Status in Surfside
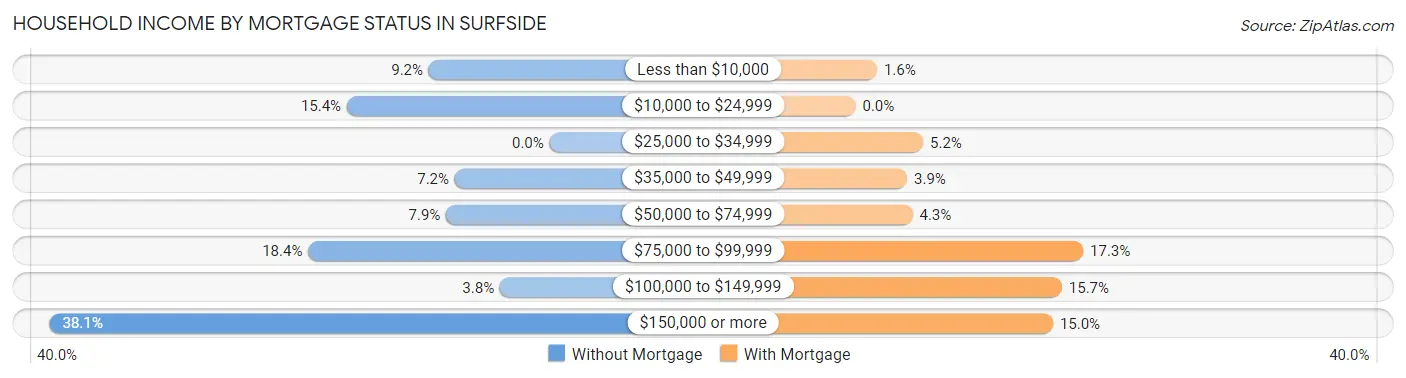
| Household Income | Without Mortgage | With Mortgage |
| Less than $10,000 | 56 (9.2%) | 12 (1.6%) |
| $10,000 to $24,999 | 94 (15.4%) | 0 (0.0%) |
| $25,000 to $34,999 | 0 (0.0%) | 38 (5.1%) |
| $35,000 to $49,999 | 44 (7.2%) | 29 (3.9%) |
| $50,000 to $74,999 | 48 (7.9%) | 32 (4.3%) |
| $75,000 to $99,999 | 112 (18.4%) | 128 (17.3%) |
| $100,000 to $149,999 | 23 (3.8%) | 116 (15.7%) |
| $150,000 or more | 232 (38.1%) | 111 (15.0%) |
| Total | 609 (100.0%) | 738 (100.0%) |
Property Value to Household Income Ratio in Surfside
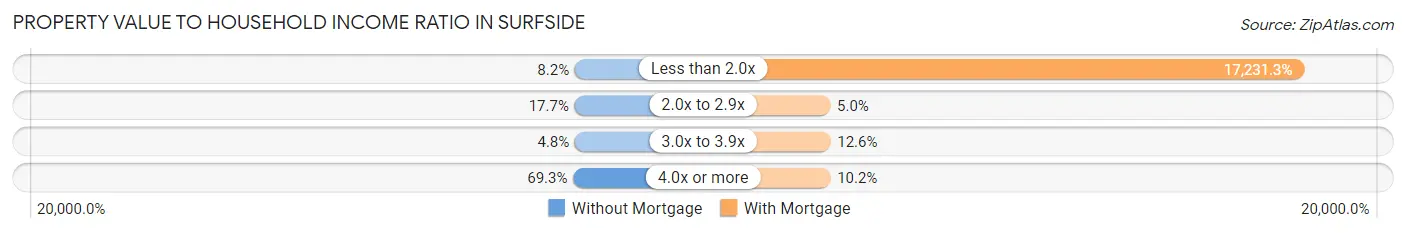
| Value-to-Income Ratio | Without Mortgage | With Mortgage |
| Less than 2.0x | 50 (8.2%) | 127,167 (17,231.3%) |
| 2.0x to 2.9x | 108 (17.7%) | 37 (5.0%) |
| 3.0x to 3.9x | 29 (4.8%) | 93 (12.6%) |
| 4.0x or more | 422 (69.3%) | 75 (10.2%) |
| Total | 609 (100.0%) | 738 (100.0%) |
Real Estate Taxes by Mortgage Status in Surfside
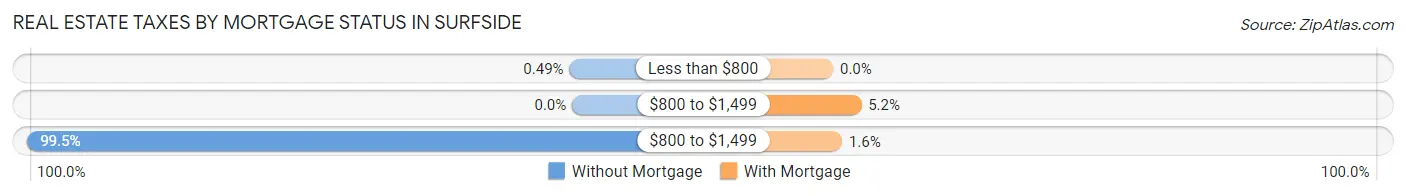
| Property Taxes | Without Mortgage | With Mortgage |
| Less than $800 | 3 (0.5%) | 0 (0.0%) |
| $800 to $1,499 | 0 (0.0%) | 38 (5.1%) |
| $800 to $1,499 | 606 (99.5%) | 12 (1.6%) |
| Total | 609 (100.0%) | 738 (100.0%) |
Health & Disability in Surfside
Health Insurance Coverage by Age in Surfside
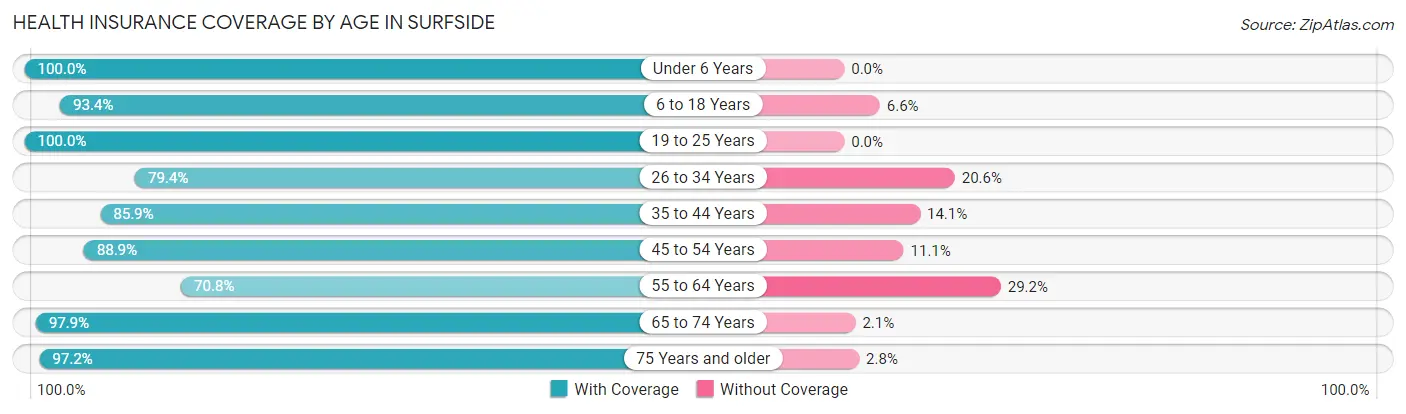
| Age Bracket | With Coverage | Without Coverage |
| Under 6 Years | 679 (100.0%) | 0 (0.0%) |
| 6 to 18 Years | 1,014 (93.4%) | 72 (6.6%) |
| 19 to 25 Years | 197 (100.0%) | 0 (0.0%) |
| 26 to 34 Years | 235 (79.4%) | 61 (20.6%) |
| 35 to 44 Years | 699 (85.9%) | 115 (14.1%) |
| 45 to 54 Years | 635 (88.9%) | 79 (11.1%) |
| 55 to 64 Years | 410 (70.8%) | 169 (29.2%) |
| 65 to 74 Years | 704 (97.9%) | 15 (2.1%) |
| 75 Years and older | 526 (97.2%) | 15 (2.8%) |
| Total | 5,099 (90.6%) | 526 (9.3%) |
Health Insurance Coverage by Citizenship Status in Surfside
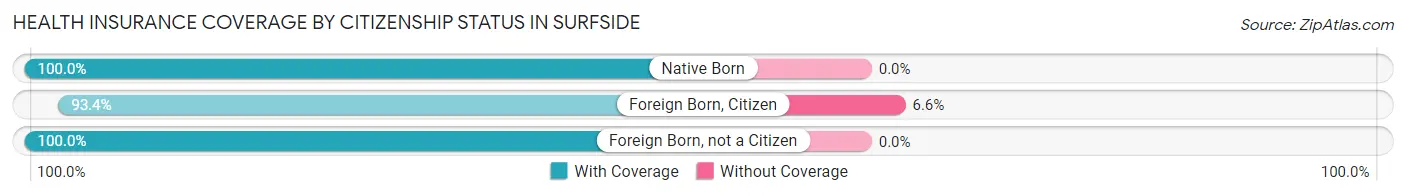
| Citizenship Status | With Coverage | Without Coverage |
| Native Born | 679 (100.0%) | 0 (0.0%) |
| Foreign Born, Citizen | 1,014 (93.4%) | 72 (6.6%) |
| Foreign Born, not a Citizen | 197 (100.0%) | 0 (0.0%) |
Health Insurance Coverage by Household Income in Surfside
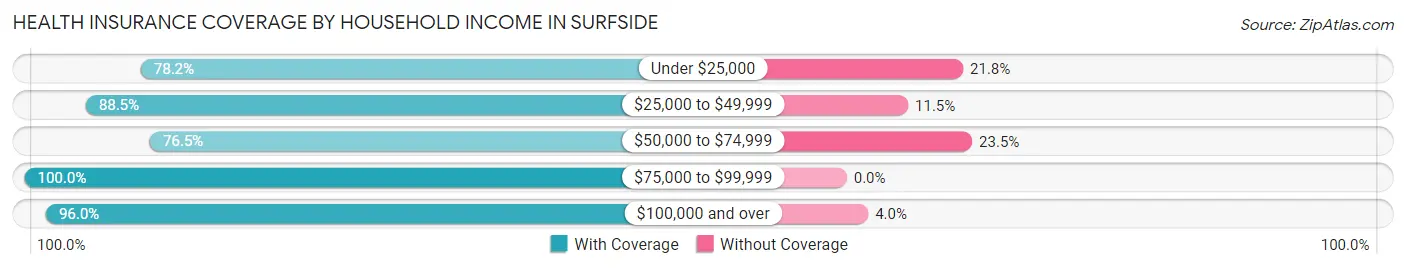
| Household Income | With Coverage | Without Coverage |
| Under $25,000 | 610 (78.2%) | 170 (21.8%) |
| $25,000 to $49,999 | 778 (88.5%) | 101 (11.5%) |
| $50,000 to $74,999 | 482 (76.5%) | 148 (23.5%) |
| $75,000 to $99,999 | 665 (100.0%) | 0 (0.0%) |
| $100,000 and over | 2,564 (96.0%) | 107 (4.0%) |
Public vs Private Health Insurance Coverage by Age in Surfside
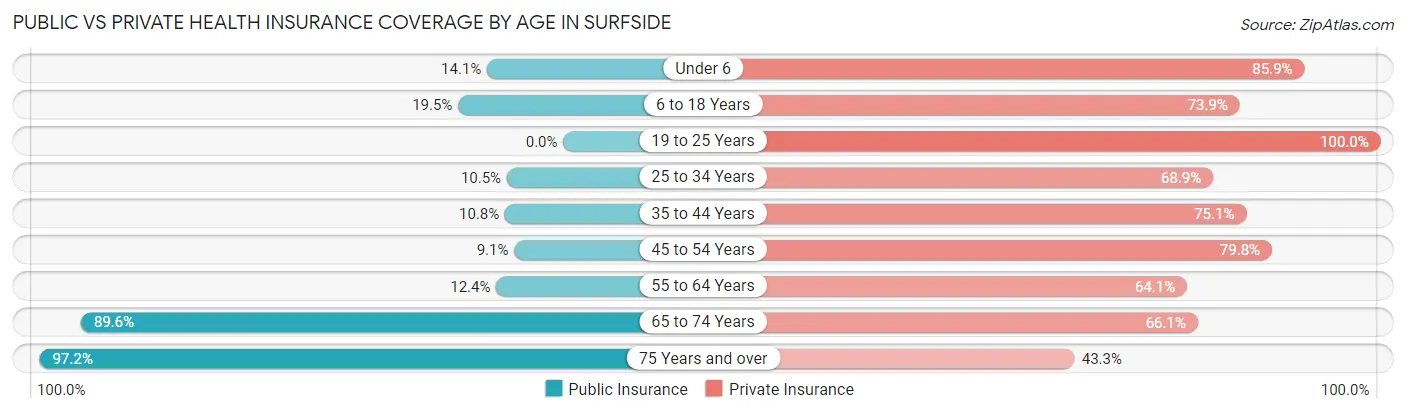
| Age Bracket | Public Insurance | Private Insurance |
| Under 6 | 96 (14.1%) | 583 (85.9%) |
| 6 to 18 Years | 212 (19.5%) | 802 (73.9%) |
| 19 to 25 Years | 0 (0.0%) | 197 (100.0%) |
| 25 to 34 Years | 31 (10.5%) | 204 (68.9%) |
| 35 to 44 Years | 88 (10.8%) | 611 (75.1%) |
| 45 to 54 Years | 65 (9.1%) | 570 (79.8%) |
| 55 to 64 Years | 72 (12.4%) | 371 (64.1%) |
| 65 to 74 Years | 644 (89.6%) | 475 (66.1%) |
| 75 Years and over | 526 (97.2%) | 234 (43.2%) |
| Total | 1,734 (30.8%) | 4,047 (72.0%) |
Disability Status by Sex by Age in Surfside
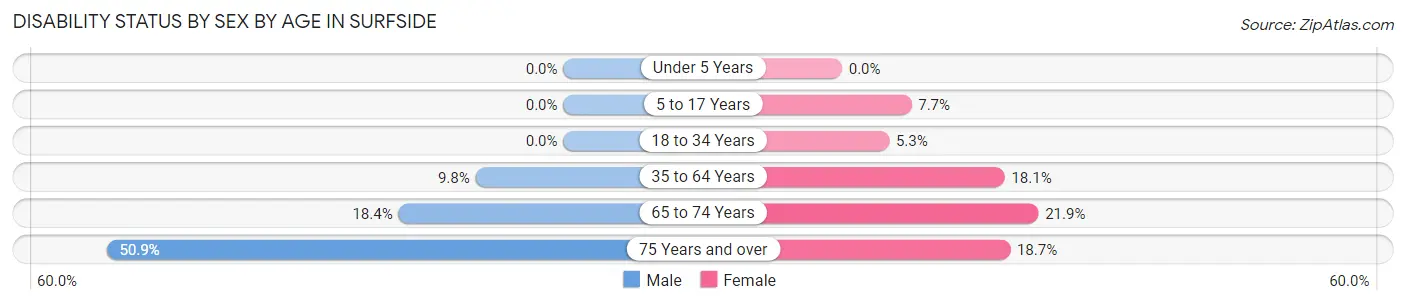
| Age Bracket | Male | Female |
| Under 5 Years | 0 (0.0%) | 0 (0.0%) |
| 5 to 17 Years | 0 (0.0%) | 50 (7.7%) |
| 18 to 34 Years | 0 (0.0%) | 16 (5.2%) |
| 35 to 64 Years | 76 (9.8%) | 241 (18.1%) |
| 65 to 74 Years | 85 (18.4%) | 56 (21.9%) |
| 75 Years and over | 115 (50.9%) | 59 (18.7%) |
Disability Class by Sex by Age in Surfside
Disability Class: Hearing Difficulty
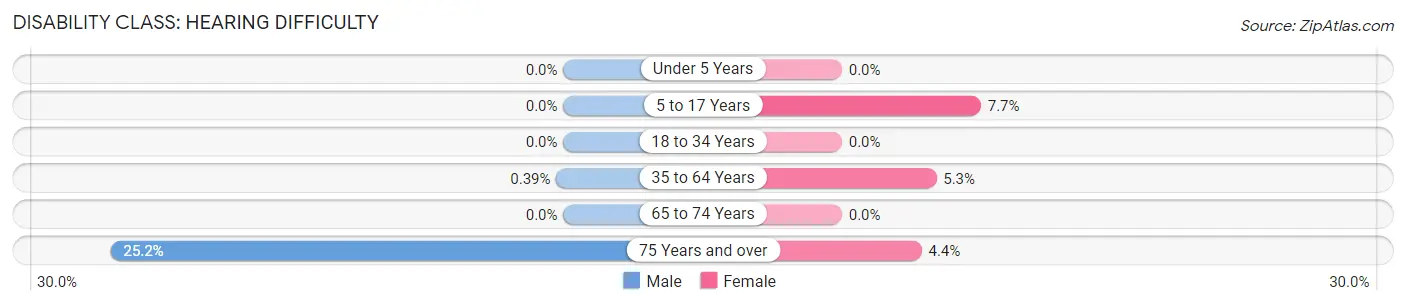
| Age Bracket | Male | Female |
| Under 5 Years | 0 (0.0%) | 0 (0.0%) |
| 5 to 17 Years | 0 (0.0%) | 50 (7.7%) |
| 18 to 34 Years | 0 (0.0%) | 0 (0.0%) |
| 35 to 64 Years | 3 (0.4%) | 70 (5.3%) |
| 65 to 74 Years | 0 (0.0%) | 0 (0.0%) |
| 75 Years and over | 57 (25.2%) | 14 (4.4%) |
Disability Class: Vision Difficulty
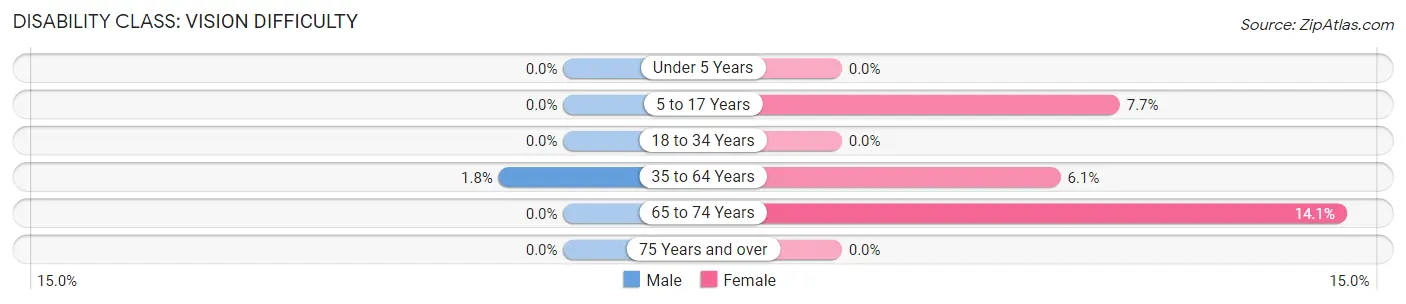
| Age Bracket | Male | Female |
| Under 5 Years | 0 (0.0%) | 0 (0.0%) |
| 5 to 17 Years | 0 (0.0%) | 50 (7.7%) |
| 18 to 34 Years | 0 (0.0%) | 0 (0.0%) |
| 35 to 64 Years | 14 (1.8%) | 81 (6.1%) |
| 65 to 74 Years | 0 (0.0%) | 36 (14.1%) |
| 75 Years and over | 0 (0.0%) | 0 (0.0%) |
Disability Class: Cognitive Difficulty
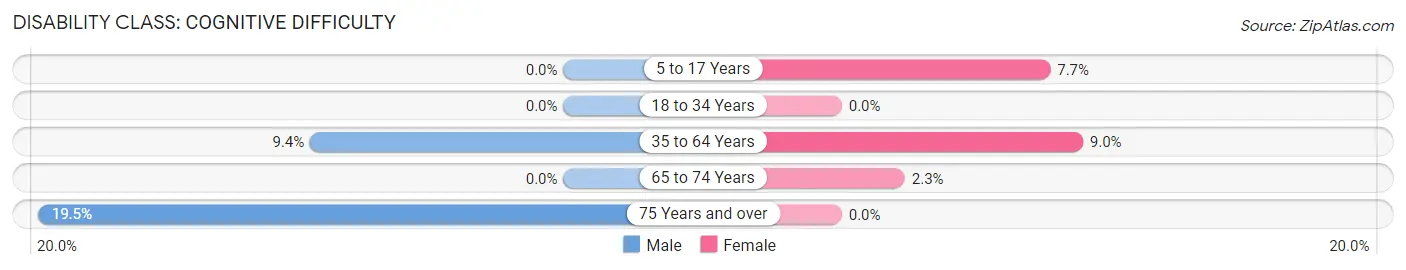
| Age Bracket | Male | Female |
| 5 to 17 Years | 0 (0.0%) | 50 (7.7%) |
| 18 to 34 Years | 0 (0.0%) | 0 (0.0%) |
| 35 to 64 Years | 73 (9.4%) | 119 (8.9%) |
| 65 to 74 Years | 0 (0.0%) | 6 (2.3%) |
| 75 Years and over | 44 (19.5%) | 0 (0.0%) |
Disability Class: Ambulatory Difficulty
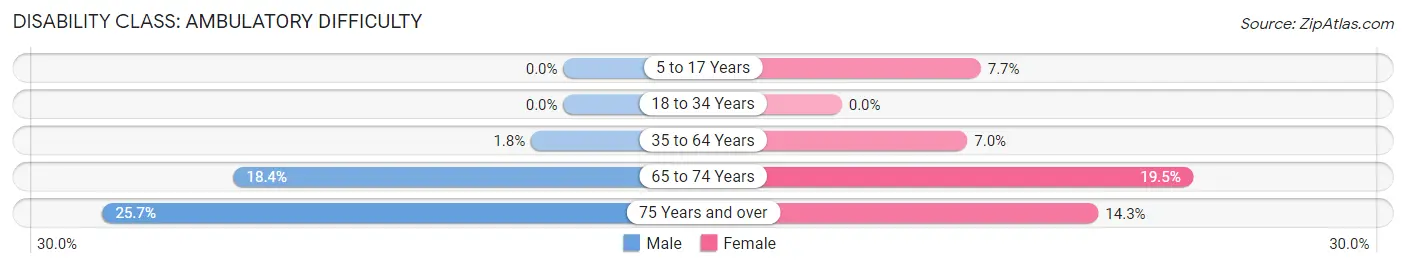
| Age Bracket | Male | Female |
| 5 to 17 Years | 0 (0.0%) | 50 (7.7%) |
| 18 to 34 Years | 0 (0.0%) | 0 (0.0%) |
| 35 to 64 Years | 14 (1.8%) | 93 (7.0%) |
| 65 to 74 Years | 85 (18.4%) | 50 (19.5%) |
| 75 Years and over | 58 (25.7%) | 45 (14.3%) |
Disability Class: Self-Care Difficulty
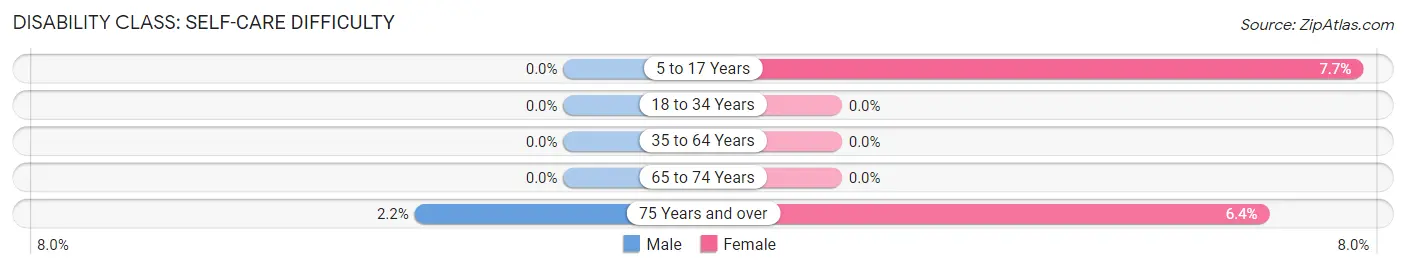
| Age Bracket | Male | Female |
| 5 to 17 Years | 0 (0.0%) | 50 (7.7%) |
| 18 to 34 Years | 0 (0.0%) | 0 (0.0%) |
| 35 to 64 Years | 0 (0.0%) | 0 (0.0%) |
| 65 to 74 Years | 0 (0.0%) | 0 (0.0%) |
| 75 Years and over | 5 (2.2%) | 20 (6.4%) |
Technology Access in Surfside
Computing Device Access in Surfside
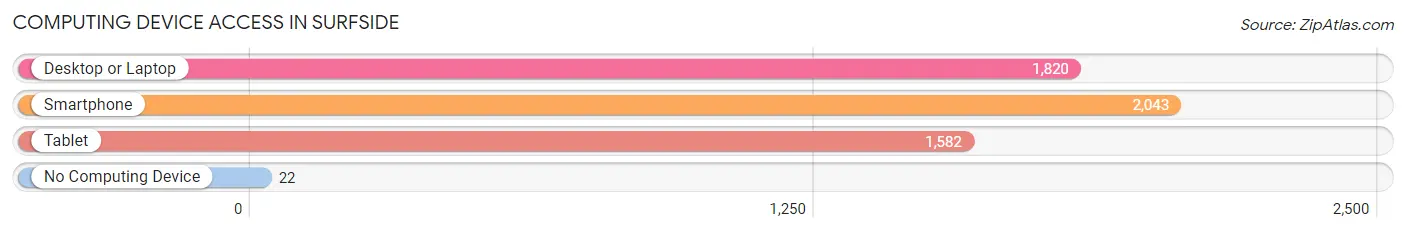
| Device Type | # Households | % Households |
| Desktop or Laptop | 1,820 | 86.5% |
| Smartphone | 2,043 | 97.1% |
| Tablet | 1,582 | 75.1% |
| No Computing Device | 22 | 1.1% |
| Total | 2,105 | 100.0% |
Internet Access in Surfside
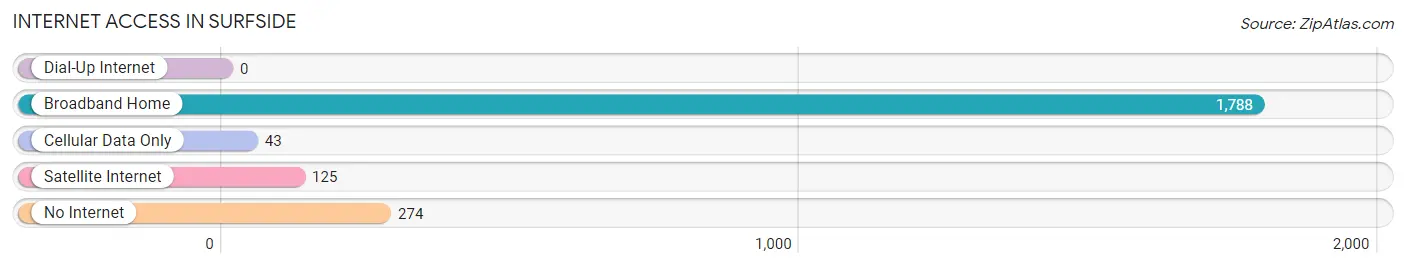
| Internet Type | # Households | % Households |
| Dial-Up Internet | 0 | 0.0% |
| Broadband Home | 1,788 | 84.9% |
| Cellular Data Only | 43 | 2.0% |
| Satellite Internet | 125 | 5.9% |
| No Internet | 274 | 13.0% |
| Total | 2,105 | 100.0% |
Surfside Summary
Surfside, Florida is a small town located in Miami-Dade County, Florida. It is situated between the Atlantic Ocean and Biscayne Bay, and is bordered by the cities of Bal Harbour and Bay Harbor Islands. The town is known for its beautiful beaches, and is a popular destination for tourists and locals alike.
Geography
Surfside is located on the eastern coast of Florida, between the Atlantic Ocean and Biscayne Bay. The town is approximately 2.5 square miles in size, and is bordered by the cities of Bal Harbour and Bay Harbor Islands. The town is situated on a barrier island, and is connected to the mainland by the Broad Causeway. The town is home to several parks, including Surfside Park, which is located on the beach, and the Surfside Community Center, which offers a variety of recreational activities.
Economy
Surfside is a popular tourist destination, and the town’s economy is largely driven by tourism. The town is home to several hotels, restaurants, and shops, which cater to both tourists and locals. The town is also home to several corporate offices, including the headquarters of the Miami Herald.
Demographics
As of the 2010 census, the population of Surfside was 5,744. The population is predominantly white (77.2%), with a small percentage of African Americans (7.3%), Hispanics (7.2%), and Asians (3.2%). The median household income in Surfside is $50,945, and the median home value is $541,400.
History
Surfside was first settled in the early 1900s, when a group of settlers from the Bahamas arrived in the area. The town was incorporated in 1935, and was named after the nearby beach. In the 1950s, the town began to experience a period of growth, as more people moved to the area. The town was also home to several celebrities, including Jackie Gleason and Frank Sinatra.
In the late 1970s, the town began to experience a period of decline, as many of the businesses and residents moved away. In the 1980s, the town began to experience a resurgence, as new businesses and residents moved to the area. Today, Surfside is a popular tourist destination, and is home to several hotels, restaurants, and shops.
Common Questions
What is Per Capita Income in Surfside?
Per Capita income in Surfside is $47,713.
What is the Median Family Income in Surfside?
Median Family Income in Surfside is $89,177.
What is the Median Household income in Surfside?
Median Household Income in Surfside is $73,160.
What is Income or Wage Gap in Surfside?
Income or Wage Gap in Surfside is 34.2%.
Women in Surfside earn 65.8 cents for every dollar earned by a man.
What is Inequality or Gini Index in Surfside?
Inequality or Gini Index in Surfside is 0.57.
What is the Total Population of Surfside?
Total Population of Surfside is 5,625.
What is the Total Male Population of Surfside?
Total Male Population of Surfside is 2,511.
What is the Total Female Population of Surfside?
Total Female Population of Surfside is 3,114.
What is the Ratio of Males per 100 Females in Surfside?
There are 80.64 Males per 100 Females in Surfside.
What is the Ratio of Females per 100 Males in Surfside?
There are 124.01 Females per 100 Males in Surfside.
What is the Median Population Age in Surfside?
Median Population Age in Surfside is 41.6 Years.
What is the Average Family Size in Surfside
Average Family Size in Surfside is 3.5 People.
What is the Average Household Size in Surfside
Average Household Size in Surfside is 2.7 People.
How Large is the Labor Force in Surfside?
There are 2,423 People in the Labor Forcein in Surfside.
What is the Percentage of People in the Labor Force in Surfside?
61.2% of People are in the Labor Force in Surfside.
What is the Unemployment Rate in Surfside?
Unemployment Rate in Surfside is 3.6%.