Black Hammock, FL Map & Demographics
Black Hammock Map
Black Hammock Overview
$45,734
PER CAPITA INCOME
41.7%
WAGE / INCOME GAP [ % ]
58.3¢/ $1
WAGE / INCOME GAP [ $ ]
0.51
INEQUALITY / GINI INDEX
1,140
TOTAL POPULATION
695
MALE POPULATION
445
FEMALE POPULATION
156.18
MALES / 100 FEMALES
64.03
FEMALES / 100 MALES
59.2
MEDIAN AGE
2.8
AVG FAMILY SIZE
1.9
AVG HOUSEHOLD SIZE
739
LABOR FORCE [ PEOPLE ]
71.3%
PERCENT IN LABOR FORCE
5.4%
UNEMPLOYMENT RATE
Income in Black Hammock
Income Overview in Black Hammock
| Characteristic | Number | Measure |
| Per Capita Income | 1,140 | $45,734 |
| Median Family Income | 283 | $0 |
| Mean Family Income | 283 | $145,752 |
| Median Household Income | 570 | $0 |
| Mean Household Income | 570 | $91,094 |
| Income Deficit | 283 | $0 |
| Wage / Income Gap (%) | 1,140 | 41.68% |
| Wage / Income Gap ($) | 1,140 | 58.32¢ per $1 |
| Gini / Inequality Index | 1,140 | 0.51 |
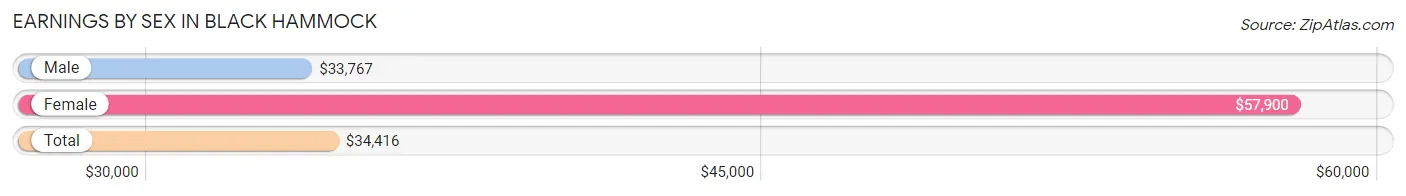
Earnings by Sex in Black Hammock
Average Earnings in Black Hammock are $34,416, $33,767 for men and $57,900 for women, a difference of 41.7%.
| Sex | Number | Average Earnings |
| Male | 515 (72.2%) | $33,767 |
| Female | 198 (27.8%) | $57,900 |
| Total | 713 (100.0%) | $34,416 |
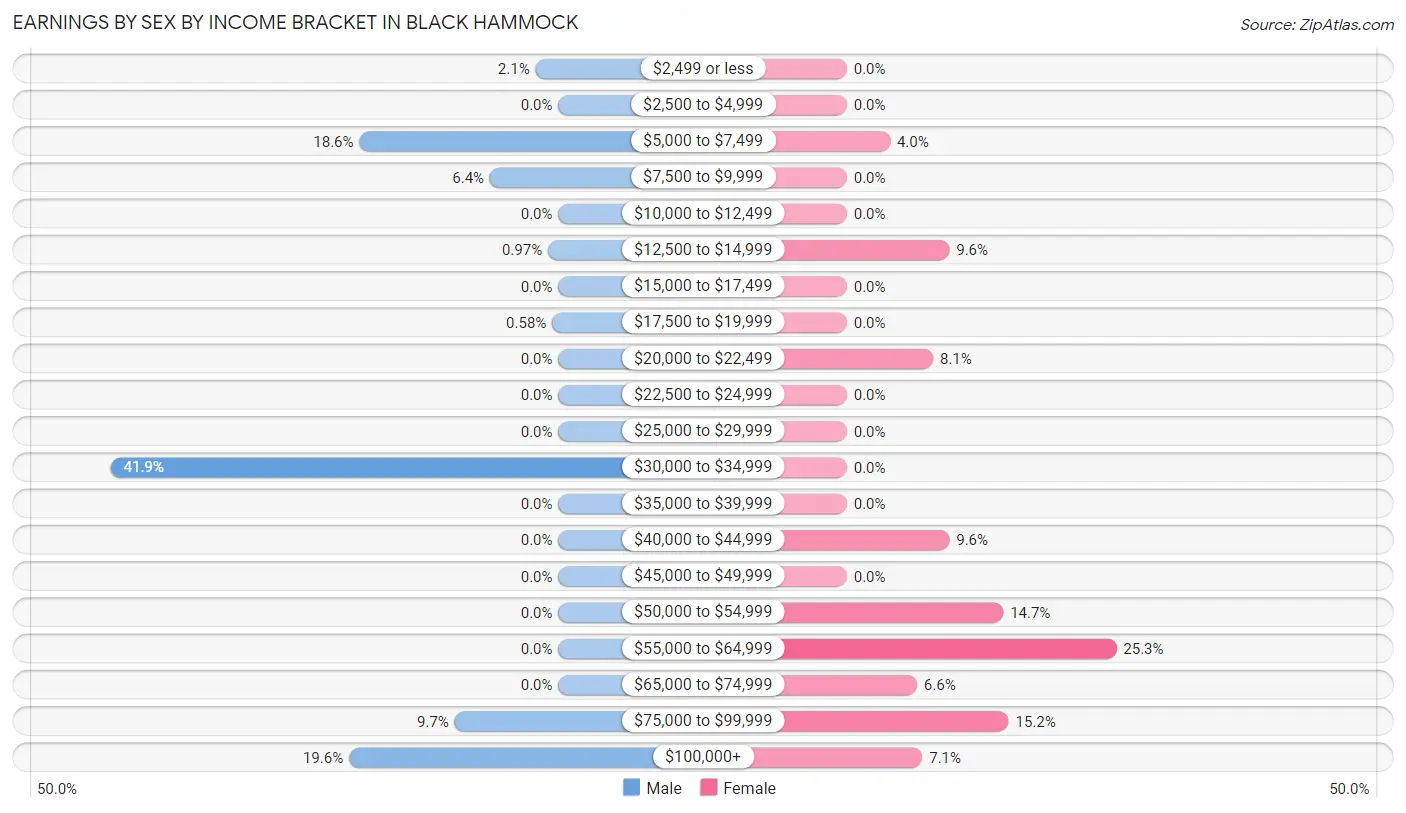
Earnings by Sex by Income Bracket in Black Hammock
The most common earnings brackets in Black Hammock are $30,000 to $34,999 for men (216 | 41.9%) and $55,000 to $64,999 for women (50 | 25.3%).
| Income | Male | Female |
| $2,499 or less | 11 (2.1%) | 0 (0.0%) |
| $2,500 to $4,999 | 0 (0.0%) | 0 (0.0%) |
| $5,000 to $7,499 | 96 (18.6%) | 8 (4.0%) |
| $7,500 to $9,999 | 33 (6.4%) | 0 (0.0%) |
| $10,000 to $12,499 | 0 (0.0%) | 0 (0.0%) |
| $12,500 to $14,999 | 5 (1.0%) | 19 (9.6%) |
| $15,000 to $17,499 | 0 (0.0%) | 0 (0.0%) |
| $17,500 to $19,999 | 3 (0.6%) | 0 (0.0%) |
| $20,000 to $22,499 | 0 (0.0%) | 16 (8.1%) |
| $22,500 to $24,999 | 0 (0.0%) | 0 (0.0%) |
| $25,000 to $29,999 | 0 (0.0%) | 0 (0.0%) |
| $30,000 to $34,999 | 216 (41.9%) | 0 (0.0%) |
| $35,000 to $39,999 | 0 (0.0%) | 0 (0.0%) |
| $40,000 to $44,999 | 0 (0.0%) | 19 (9.6%) |
| $45,000 to $49,999 | 0 (0.0%) | 0 (0.0%) |
| $50,000 to $54,999 | 0 (0.0%) | 29 (14.6%) |
| $55,000 to $64,999 | 0 (0.0%) | 50 (25.3%) |
| $65,000 to $74,999 | 0 (0.0%) | 13 (6.6%) |
| $75,000 to $99,999 | 50 (9.7%) | 30 (15.1%) |
| $100,000+ | 101 (19.6%) | 14 (7.1%) |
| Total | 515 (100.0%) | 198 (100.0%) |
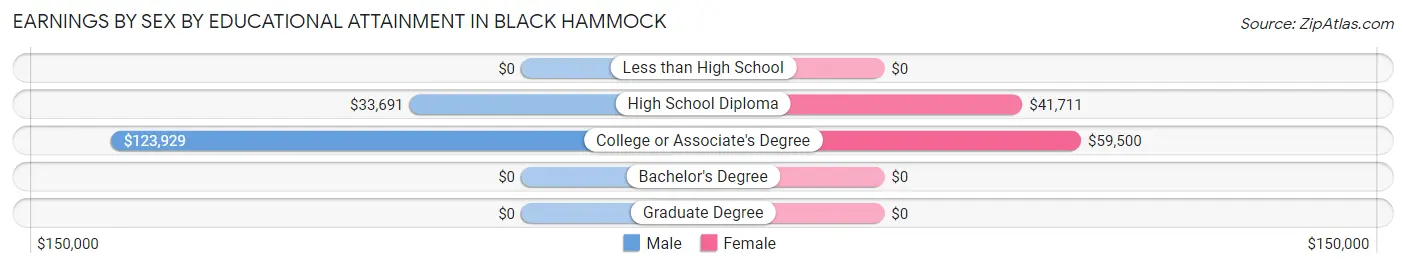
Earnings by Sex by Educational Attainment in Black Hammock
| Educational Attainment | Male Income | Female Income |
| Less than High School | - | - |
| High School Diploma | $33,691 | $41,711 |
| College or Associate's Degree | $123,929 | $59,500 |
| Bachelor's Degree | - | - |
| Graduate Degree | - | - |
| Total | - | - |
Family Income in Black Hammock
Family Income Brackets in Black Hammock
According to the Black Hammock family income data, there are 102 families falling into the $75,000 to $99,999 income range, which is the most common income bracket and makes up 36.0% of all families.
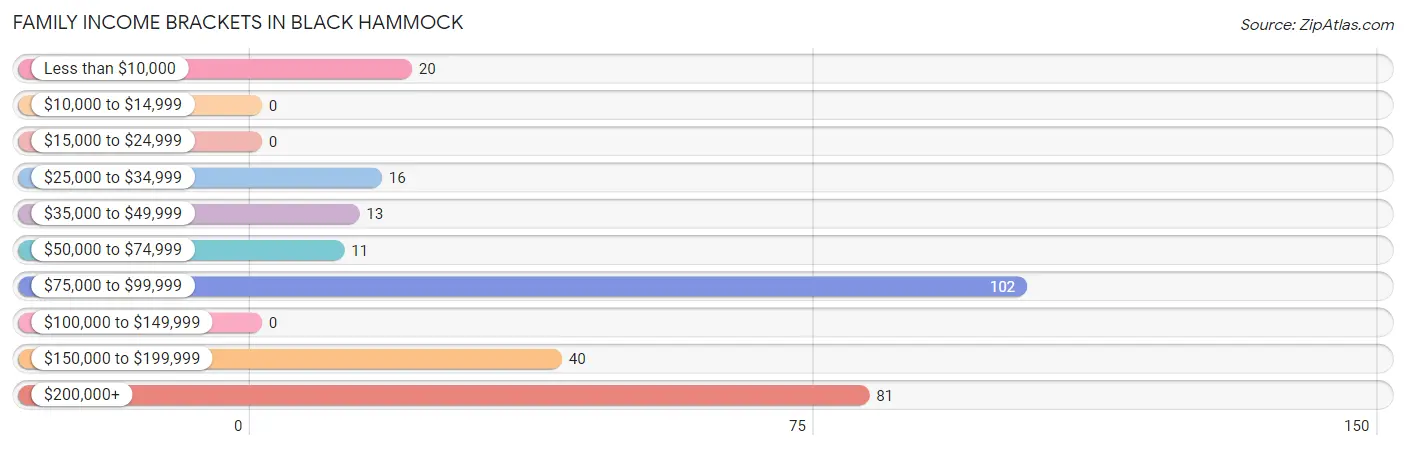
| Income Bracket | # Families | % Families |
| Less than $10,000 | 20 | 7.1% |
| $10,000 to $14,999 | 0 | 0.0% |
| $15,000 to $24,999 | 0 | 0.0% |
| $25,000 to $34,999 | 16 | 5.7% |
| $35,000 to $49,999 | 13 | 4.6% |
| $50,000 to $74,999 | 11 | 3.9% |
| $75,000 to $99,999 | 102 | 36.0% |
| $100,000 to $149,999 | 0 | 0.0% |
| $150,000 to $199,999 | 40 | 14.1% |
| $200,000+ | 81 | 28.6% |
Family Income by Famaliy Size in Black Hammock
3-person families (36 | 12.7%) account for the highest median family income in Black Hammock with $250,001 per family, while 3-person families (36 | 12.7%) have the highest median income of $83,334 per family member.
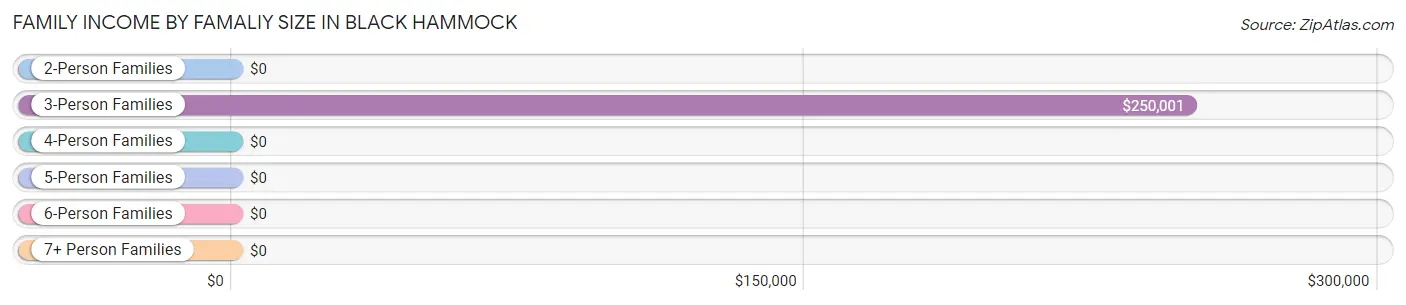
| Income Bracket | # Families | Median Income |
| 2-Person Families | 164 (58.0%) | $0 |
| 3-Person Families | 36 (12.7%) | $250,001 |
| 4-Person Families | 70 (24.7%) | $0 |
| 5-Person Families | 13 (4.6%) | $0 |
| 6-Person Families | 0 (0.0%) | $0 |
| 7+ Person Families | 0 (0.0%) | $0 |
| Total | 283 (100.0%) | $0 |
Family Income by Number of Earners in Black Hammock
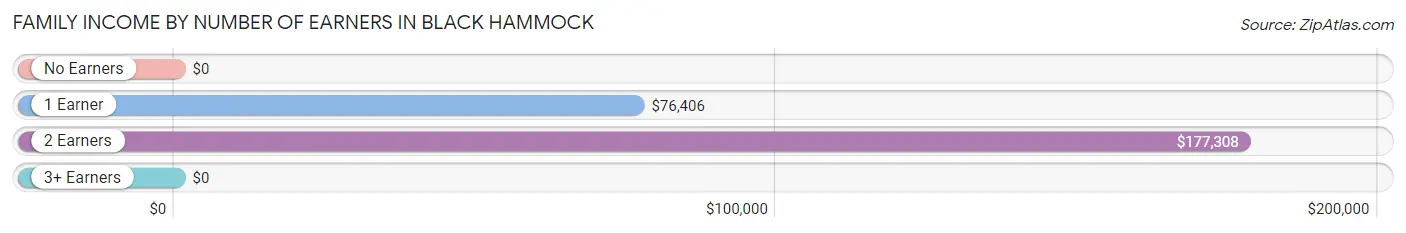
| Number of Earners | # Families | Median Income |
| No Earners | 39 (13.8%) | $0 |
| 1 Earner | 58 (20.5%) | $76,406 |
| 2 Earners | 136 (48.1%) | $177,308 |
| 3+ Earners | 50 (17.7%) | $0 |
| Total | 283 (100.0%) | $0 |
Household Income in Black Hammock
Household Income Brackets in Black Hammock
With 239 households falling in the category, the $25,000 to $34,999 income range is the most frequent in Black Hammock, accounting for 41.9% of all households.
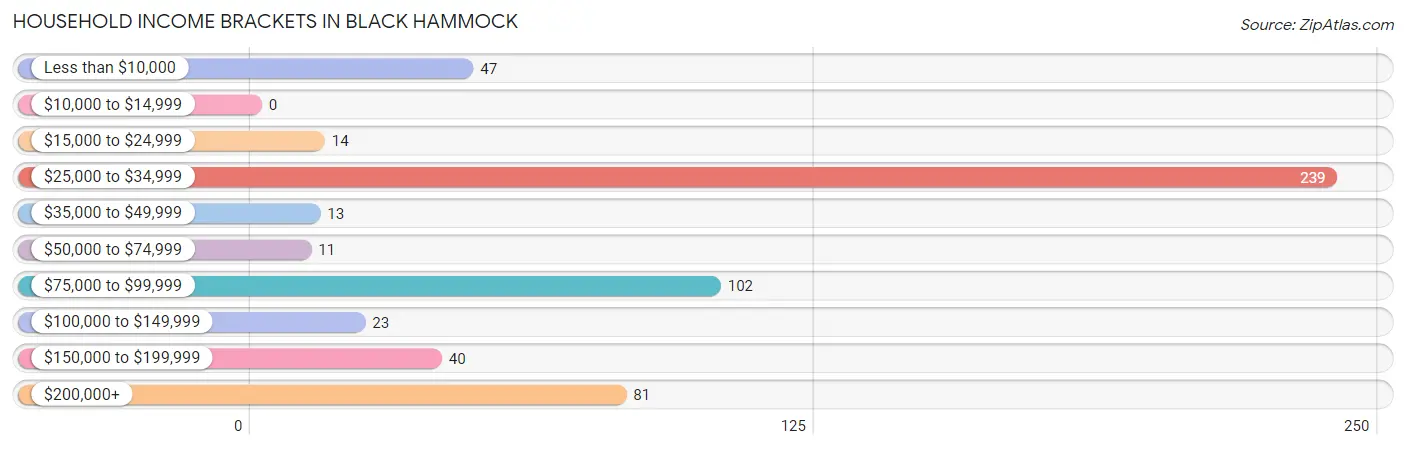
| Income Bracket | # Households | % Households |
| Less than $10,000 | 47 | 8.2% |
| $10,000 to $14,999 | 0 | 0.0% |
| $15,000 to $24,999 | 14 | 2.5% |
| $25,000 to $34,999 | 239 | 41.9% |
| $35,000 to $49,999 | 13 | 2.3% |
| $50,000 to $74,999 | 11 | 1.9% |
| $75,000 to $99,999 | 102 | 17.9% |
| $100,000 to $149,999 | 23 | 4.0% |
| $150,000 to $199,999 | 40 | 7.0% |
| $200,000+ | 81 | 14.2% |
Household Income by Householder Age in Black Hammock
The median household income in Black Hammock is $0, with the highest median household income of $250,001 found in the 25 to 44 years age bracket for the primary householder. A total of 43 households (7.5%) fall into this category.
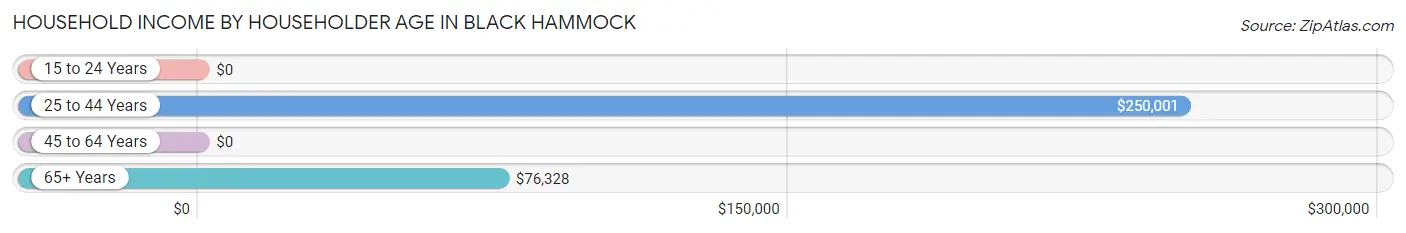
| Income Bracket | # Households | Median Income |
| 15 to 24 Years | 0 (0.0%) | $0 |
| 25 to 44 Years | 43 (7.5%) | $250,001 |
| 45 to 64 Years | 410 (71.9%) | $0 |
| 65+ Years | 117 (20.5%) | $76,328 |
| Total | 570 (100.0%) | $0 |
Poverty in Black Hammock
Income Below Poverty by Sex and Age in Black Hammock
With 13.8% poverty level for males and 10.2% for females among the residents of Black Hammock, 18 to 24 year old males and 55 to 64 year old females are the most vulnerable to poverty, with 39 males (45.9%) and 43 females (26.1%) in their respective age groups living below the poverty level.
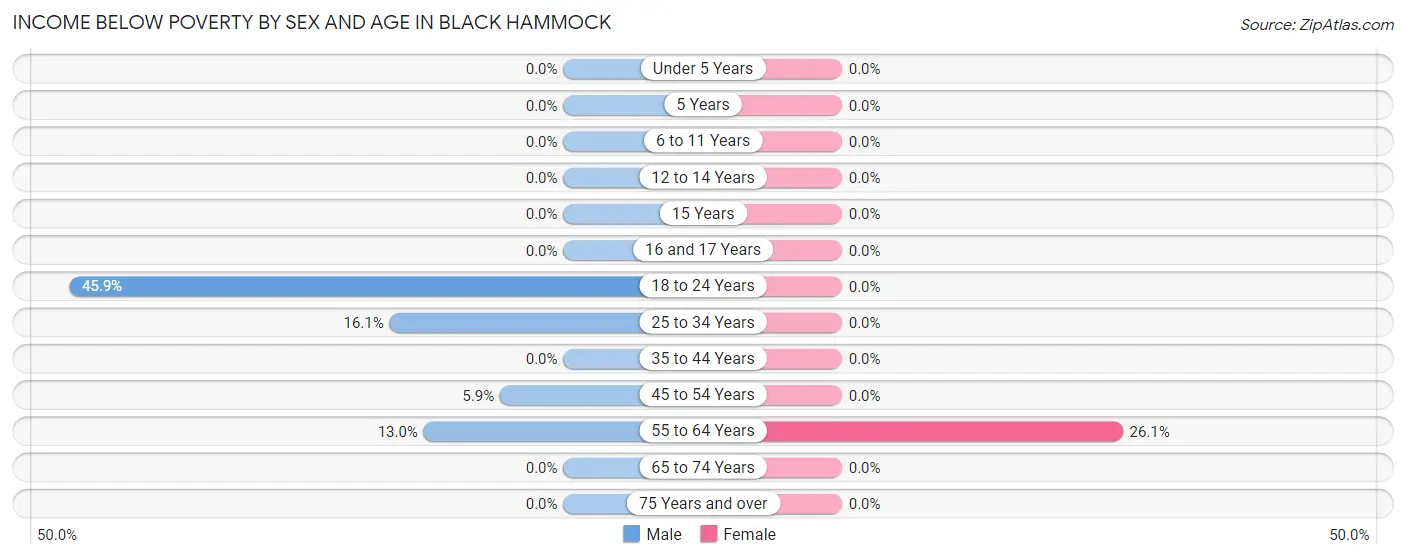
| Age Bracket | Male | Female |
| Under 5 Years | 0 (0.0%) | 0 (0.0%) |
| 5 Years | 0 (0.0%) | 0 (0.0%) |
| 6 to 11 Years | 0 (0.0%) | 0 (0.0%) |
| 12 to 14 Years | 0 (0.0%) | 0 (0.0%) |
| 15 Years | 0 (0.0%) | 0 (0.0%) |
| 16 and 17 Years | 0 (0.0%) | 0 (0.0%) |
| 18 to 24 Years | 39 (45.9%) | 0 (0.0%) |
| 25 to 34 Years | 5 (16.1%) | 0 (0.0%) |
| 35 to 44 Years | 0 (0.0%) | 0 (0.0%) |
| 45 to 54 Years | 1 (5.9%) | 0 (0.0%) |
| 55 to 64 Years | 49 (13.0%) | 43 (26.1%) |
| 65 to 74 Years | 0 (0.0%) | 0 (0.0%) |
| 75 Years and over | 0 (0.0%) | 0 (0.0%) |
| Total | 94 (13.8%) | 43 (10.2%) |
Income Above Poverty by Sex and Age in Black Hammock
According to the poverty statistics in Black Hammock, males aged under 5 years and females aged under 5 years are the age groups that are most secure financially, with 100.0% of males and 100.0% of females in these age groups living above the poverty line.
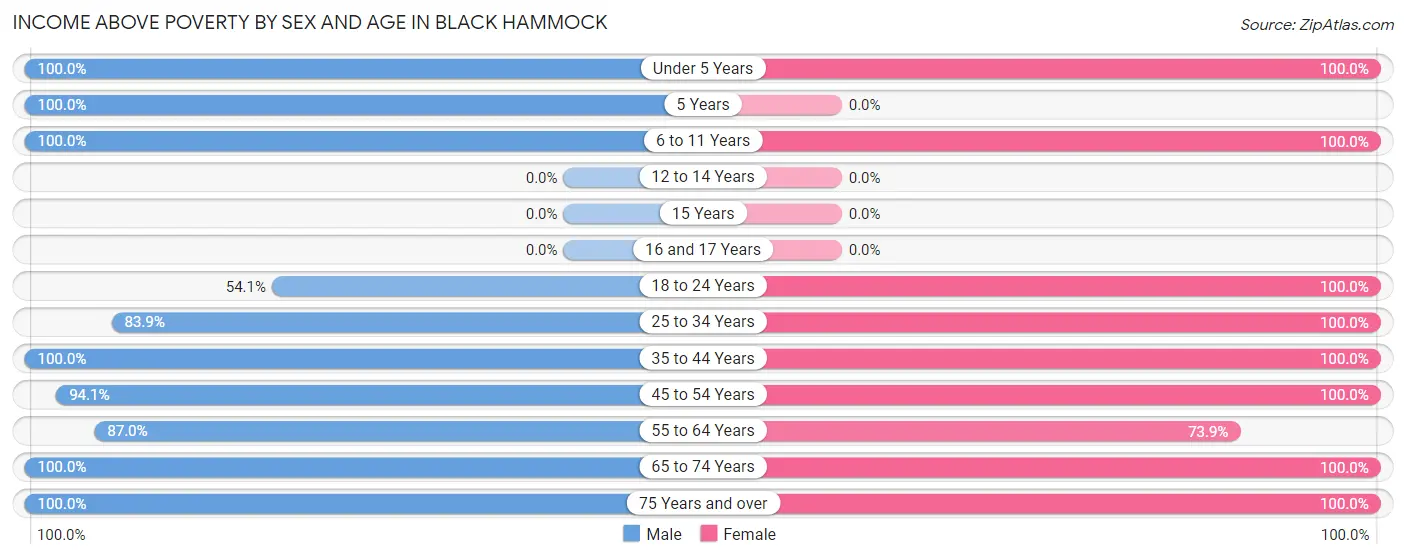
| Age Bracket | Male | Female |
| Under 5 Years | 7 (100.0%) | 13 (100.0%) |
| 5 Years | 21 (100.0%) | 0 (0.0%) |
| 6 to 11 Years | 13 (100.0%) | 13 (100.0%) |
| 12 to 14 Years | 0 (0.0%) | 0 (0.0%) |
| 15 Years | 0 (0.0%) | 0 (0.0%) |
| 16 and 17 Years | 0 (0.0%) | 0 (0.0%) |
| 18 to 24 Years | 46 (54.1%) | 61 (100.0%) |
| 25 to 34 Years | 26 (83.9%) | 29 (100.0%) |
| 35 to 44 Years | 27 (100.0%) | 12 (100.0%) |
| 45 to 54 Years | 16 (94.1%) | 40 (100.0%) |
| 55 to 64 Years | 329 (87.0%) | 122 (73.9%) |
| 65 to 74 Years | 91 (100.0%) | 62 (100.0%) |
| 75 Years and over | 13 (100.0%) | 26 (100.0%) |
| Total | 589 (86.2%) | 378 (89.8%) |
Income Below Poverty Among Married-Couple Families in Black Hammock
The poverty statistics for married-couple families in Black Hammock show that 7.1% or 20 of the total 283 families live below the poverty line. Families with no children have the highest poverty rate of 8.1%, comprising of 20 families. On the other hand, families with 1 or 2 children have the lowest poverty rate of 0.0%, which includes 0 families.
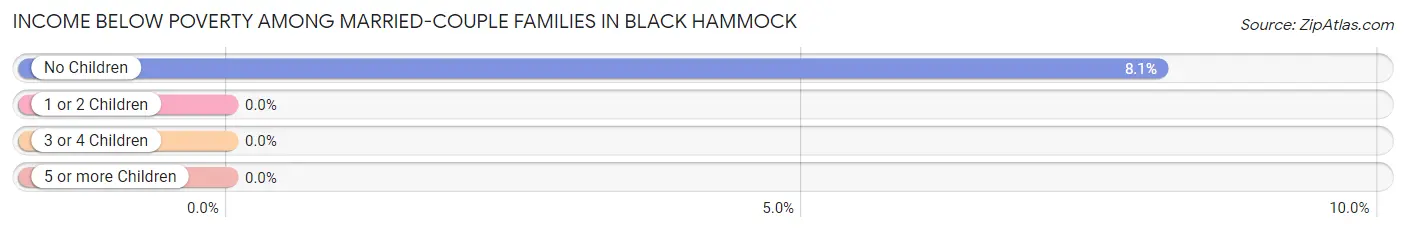
| Children | Above Poverty | Below Poverty |
| No Children | 227 (91.9%) | 20 (8.1%) |
| 1 or 2 Children | 23 (100.0%) | 0 (0.0%) |
| 3 or 4 Children | 13 (100.0%) | 0 (0.0%) |
| 5 or more Children | 0 (0.0%) | 0 (0.0%) |
| Total | 263 (92.9%) | 20 (7.1%) |
Income Below Poverty Among Single-Parent Households in Black Hammock
| Children | Single Father | Single Mother |
| No Children | 0 (0.0%) | 0 (0.0%) |
| 1 or 2 Children | 0 (0.0%) | 0 (0.0%) |
| 3 or 4 Children | 0 (0.0%) | 0 (0.0%) |
| 5 or more Children | 0 (0.0%) | 0 (0.0%) |
| Total | 0 (0.0%) | 0 (0.0%) |
Income Below Poverty Among Married-Couple vs Single-Parent Households in Black Hammock
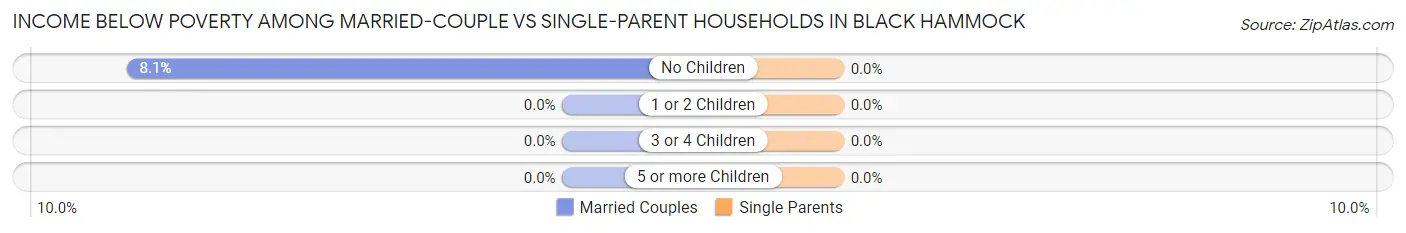
| Children | Married-Couple Families | Single-Parent Households |
| No Children | 20 (8.1%) | 0 (0.0%) |
| 1 or 2 Children | 0 (0.0%) | 0 (0.0%) |
| 3 or 4 Children | 0 (0.0%) | 0 (0.0%) |
| 5 or more Children | 0 (0.0%) | 0 (0.0%) |
| Total | 20 (7.1%) | 0 (0.0%) |
Race in Black Hammock
The most populous races in Black Hammock are White / Caucasian (831 | 72.9%), Hispanic or Latino (265 | 23.3%), and Some other Race (216 | 19.0%).
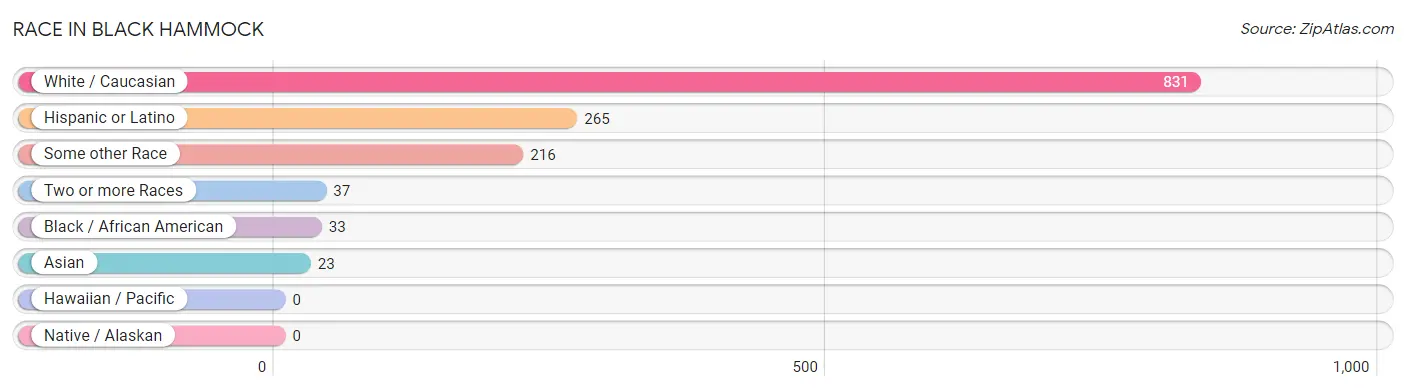
| Race | # Population | % Population |
| Asian | 23 | 2.0% |
| Black / African American | 33 | 2.9% |
| Hawaiian / Pacific | 0 | 0.0% |
| Hispanic or Latino | 265 | 23.3% |
| Native / Alaskan | 0 | 0.0% |
| White / Caucasian | 831 | 72.9% |
| Two or more Races | 37 | 3.3% |
| Some other Race | 216 | 19.0% |
| Total | 1,140 | 100.0% |
Ancestry in Black Hammock
The most populous ancestries reported in Black Hammock are English (225 | 19.7%), German (196 | 17.2%), Italian (127 | 11.1%), Irish (102 | 8.9%), and Polish (55 | 4.8%), together accounting for 61.8% of all Black Hammock residents.
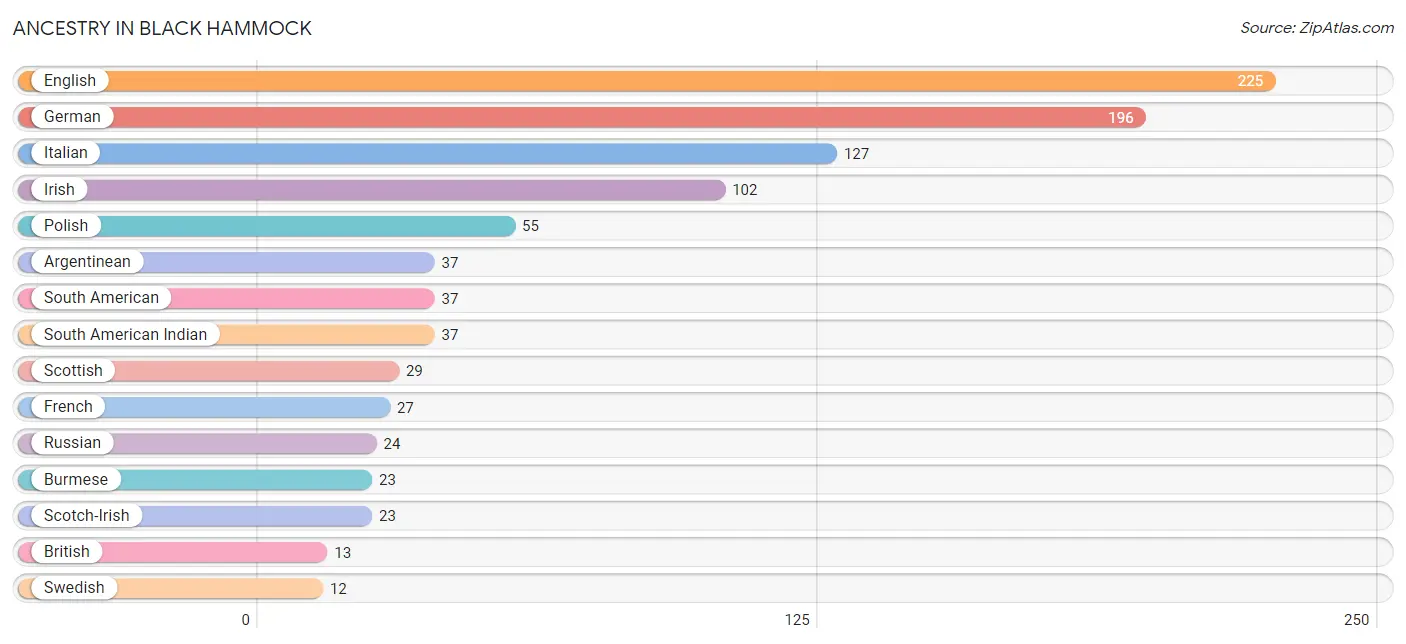
| Ancestry | # Population | % Population |
| American | 6 | 0.5% |
| Argentinean | 37 | 3.3% |
| British | 13 | 1.1% |
| Burmese | 23 | 2.0% |
| Czech | 7 | 0.6% |
| English | 225 | 19.7% |
| French | 27 | 2.4% |
| German | 196 | 17.2% |
| Irish | 102 | 8.9% |
| Israeli | 1 | 0.1% |
| Italian | 127 | 11.1% |
| Mexican | 6 | 0.5% |
| Polish | 55 | 4.8% |
| Puerto Rican | 3 | 0.3% |
| Russian | 24 | 2.1% |
| Scandinavian | 10 | 0.9% |
| Scotch-Irish | 23 | 2.0% |
| Scottish | 29 | 2.5% |
| South American | 37 | 3.3% |
| South American Indian | 37 | 3.3% |
| Swedish | 12 | 1.1% | View All 21 Rows |
Immigrants in Black Hammock
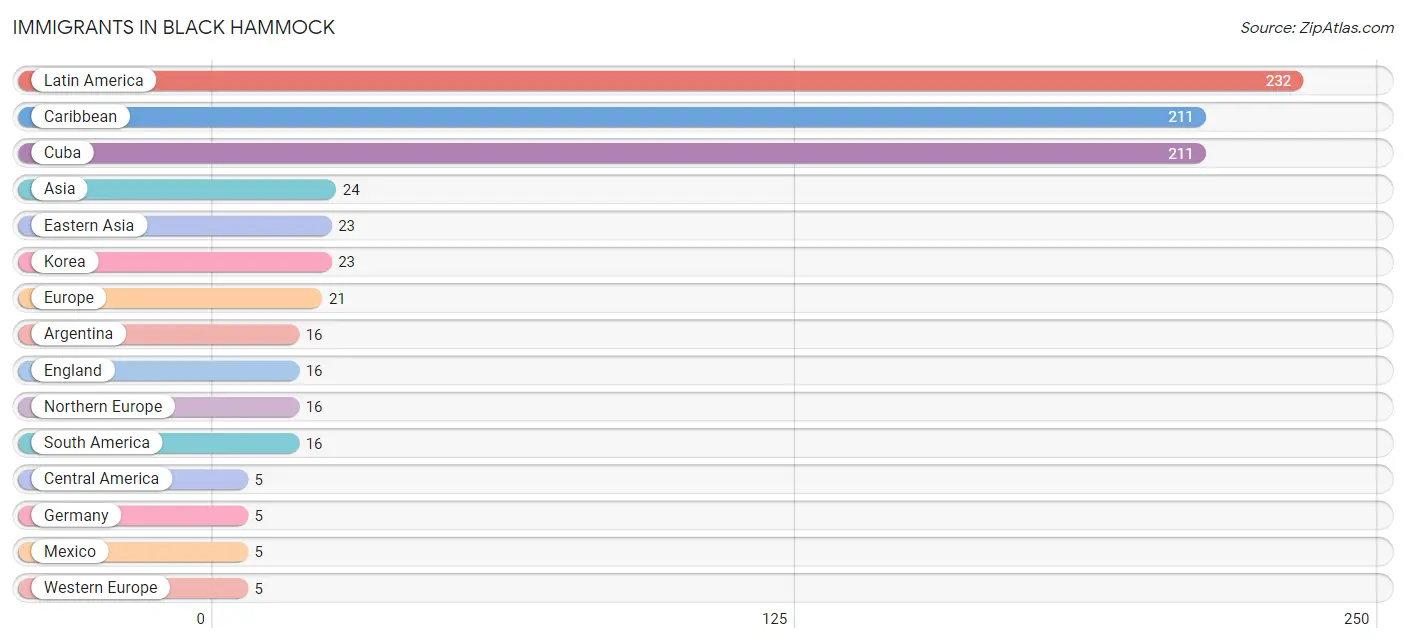
The most numerous immigrant groups reported in Black Hammock came from Latin America (232 | 20.3%), Caribbean (211 | 18.5%), Cuba (211 | 18.5%), Asia (24 | 2.1%), and Eastern Asia (23 | 2.0%), together accounting for 61.5% of all Black Hammock residents.
| Immigration Origin | # Population | % Population |
| Argentina | 16 | 1.4% |
| Asia | 24 | 2.1% |
| Caribbean | 211 | 18.5% |
| Central America | 5 | 0.4% |
| Cuba | 211 | 18.5% |
| Eastern Asia | 23 | 2.0% |
| England | 16 | 1.4% |
| Europe | 21 | 1.8% |
| Germany | 5 | 0.4% |
| Israel | 1 | 0.1% |
| Korea | 23 | 2.0% |
| Latin America | 232 | 20.3% |
| Mexico | 5 | 0.4% |
| Northern Europe | 16 | 1.4% |
| South America | 16 | 1.4% |
| Western Asia | 1 | 0.1% |
| Western Europe | 5 | 0.4% | View All 17 Rows |
Sex and Age in Black Hammock
Sex and Age in Black Hammock
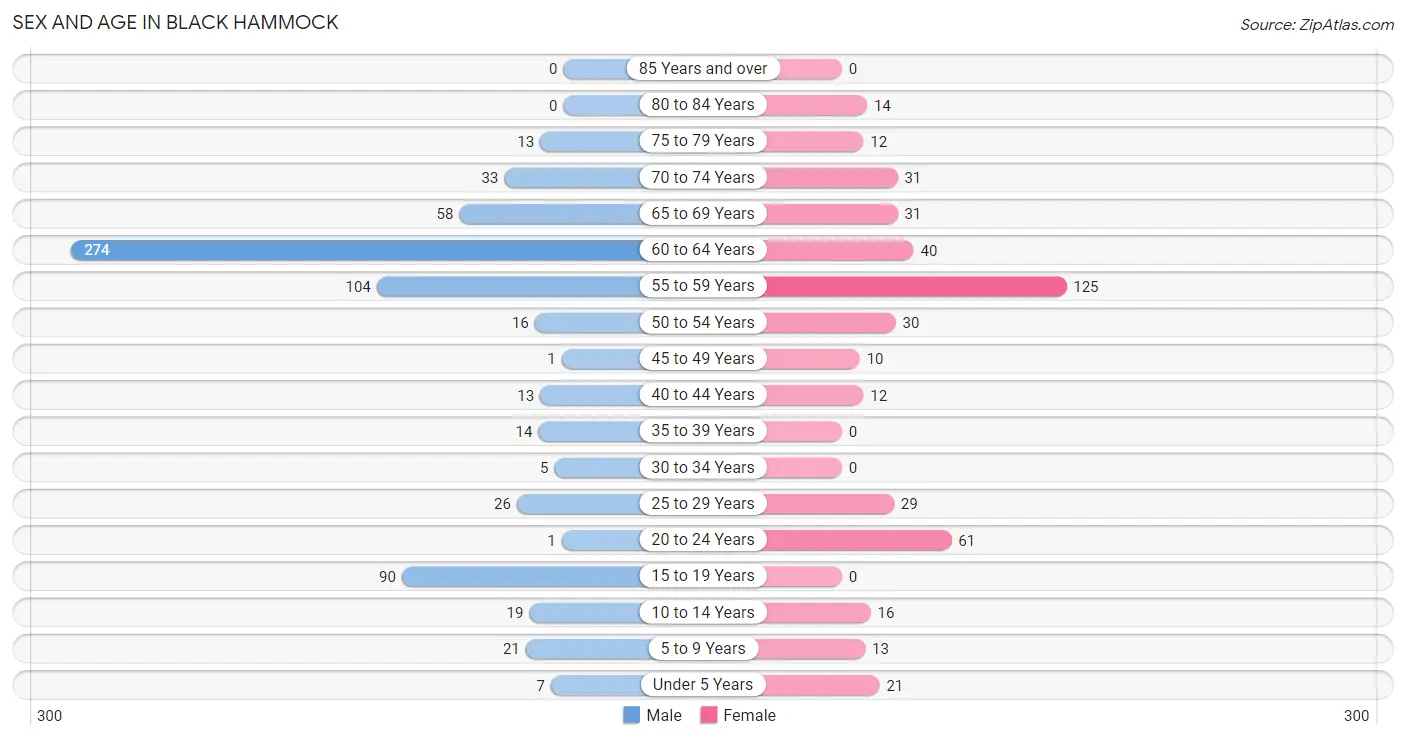
The most populous age groups in Black Hammock are 60 to 64 Years (274 | 39.4%) for men and 55 to 59 Years (125 | 28.1%) for women.
| Age Bracket | Male | Female |
| Under 5 Years | 7 (1.0%) | 21 (4.7%) |
| 5 to 9 Years | 21 (3.0%) | 13 (2.9%) |
| 10 to 14 Years | 19 (2.7%) | 16 (3.6%) |
| 15 to 19 Years | 90 (13.0%) | 0 (0.0%) |
| 20 to 24 Years | 1 (0.1%) | 61 (13.7%) |
| 25 to 29 Years | 26 (3.7%) | 29 (6.5%) |
| 30 to 34 Years | 5 (0.7%) | 0 (0.0%) |
| 35 to 39 Years | 14 (2.0%) | 0 (0.0%) |
| 40 to 44 Years | 13 (1.9%) | 12 (2.7%) |
| 45 to 49 Years | 1 (0.1%) | 10 (2.2%) |
| 50 to 54 Years | 16 (2.3%) | 30 (6.7%) |
| 55 to 59 Years | 104 (15.0%) | 125 (28.1%) |
| 60 to 64 Years | 274 (39.4%) | 40 (9.0%) |
| 65 to 69 Years | 58 (8.4%) | 31 (7.0%) |
| 70 to 74 Years | 33 (4.8%) | 31 (7.0%) |
| 75 to 79 Years | 13 (1.9%) | 12 (2.7%) |
| 80 to 84 Years | 0 (0.0%) | 14 (3.2%) |
| 85 Years and over | 0 (0.0%) | 0 (0.0%) |
| Total | 695 (100.0%) | 445 (100.0%) |
Families and Households in Black Hammock
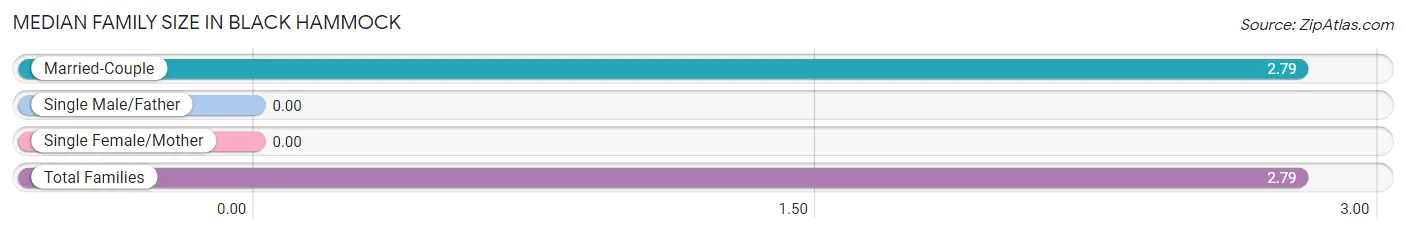
Median Family Size in Black Hammock
| Family Type | # Families | Family Size |
| Married-Couple | 283 (100.0%) | 2.79 |
| Single Male/Father | 0 (0.0%) | - |
| Single Female/Mother | 0 (0.0%) | - |
| Total Families | 283 (100.0%) | 2.79 |
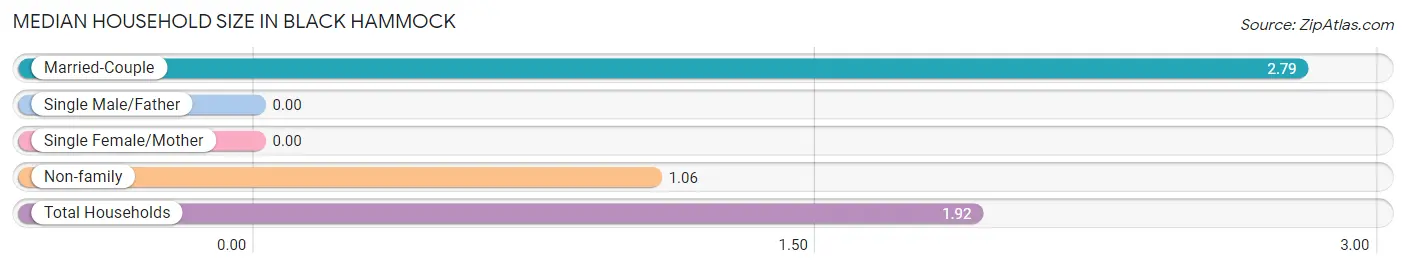
Median Household Size in Black Hammock
| Household Type | # Households | Household Size |
| Married-Couple | 283 (49.6%) | 2.79 |
| Single Male/Father | 0 (0.0%) | - |
| Single Female/Mother | 0 (0.0%) | - |
| Non-family | 287 (50.3%) | 1.06 |
| Total Households | 570 (100.0%) | 1.92 |
Household Size by Marriage Status in Black Hammock
Out of a total of 570 households in Black Hammock, 283 (49.6%) are family households, while 287 (50.3%) are nonfamily households. The most numerous type of family households are 2-person households, comprising 164, and the most common type of nonfamily households are 1-person households, comprising 264.
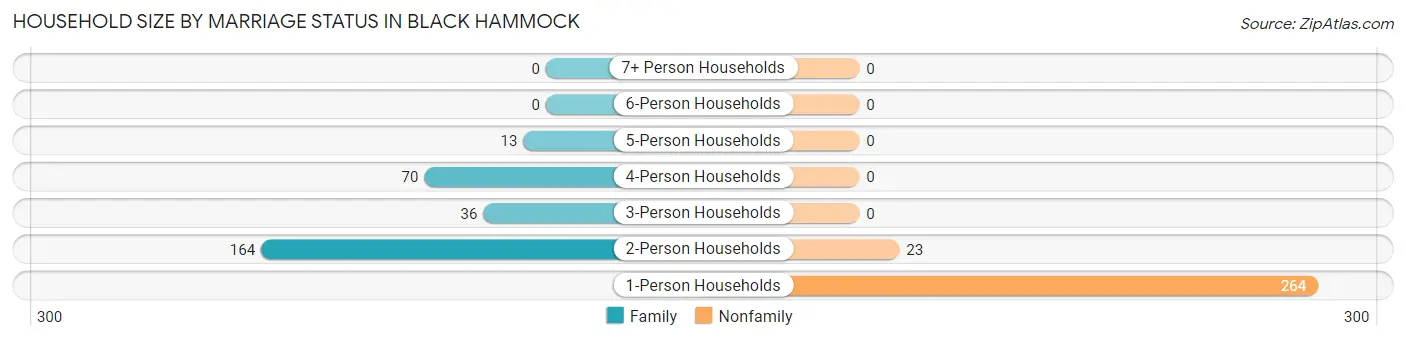
| Household Size | Family Households | Nonfamily Households |
| 1-Person Households | - | 264 (46.3%) |
| 2-Person Households | 164 (28.8%) | 23 (4.0%) |
| 3-Person Households | 36 (6.3%) | 0 (0.0%) |
| 4-Person Households | 70 (12.3%) | 0 (0.0%) |
| 5-Person Households | 13 (2.3%) | 0 (0.0%) |
| 6-Person Households | 0 (0.0%) | 0 (0.0%) |
| 7+ Person Households | 0 (0.0%) | 0 (0.0%) |
| Total | 283 (49.6%) | 287 (50.3%) |
Female Fertility in Black Hammock
Fertility by Age in Black Hammock
| Age Bracket | Women with Births | Births / 1,000 Women |
| 15 to 19 years | 0 (0.0%) | 0.0 |
| 20 to 34 years | 0 (0.0%) | 0.0 |
| 35 to 50 years | 0 (0.0%) | 0.0 |
| Total | 0 (0.0%) | 0.0 |
Fertility by Age by Marriage Status in Black Hammock
| Age Bracket | Married | Unmarried |
| 15 to 19 years | 0 (0.0%) | 0 (0.0%) |
| 20 to 34 years | 0 (0.0%) | 0 (0.0%) |
| 35 to 50 years | 0 (0.0%) | 0 (0.0%) |
| Total | 0 (0.0%) | 0 (0.0%) |
Fertility by Education in Black Hammock
| Educational Attainment | Women with Births | Births / 1,000 Women |
| Less than High School | 0 (0.0%) | 0.0 |
| High School Diploma | 0 (0.0%) | 0.0 |
| College or Associate's Degree | 0 (0.0%) | 0.0 |
| Bachelor's Degree | 0 (0.0%) | 0.0 |
| Graduate Degree | 0 (0.0%) | 0.0 |
| Total | 0 (0.0%) | 0.0 |
Fertility by Education by Marriage Status in Black Hammock
| Educational Attainment | Married | Unmarried |
| Less than High School | 0 (0.0%) | 0 (0.0%) |
| High School Diploma | 0 (0.0%) | 0 (0.0%) |
| College or Associate's Degree | 0 (0.0%) | 0 (0.0%) |
| Bachelor's Degree | 0 (0.0%) | 0 (0.0%) |
| Graduate Degree | 0 (0.0%) | 0 (0.0%) |
| Total | 0 (0.0%) | 0 (0.0%) |
Employment Characteristics in Black Hammock
Employment by Class of Employer in Black Hammock
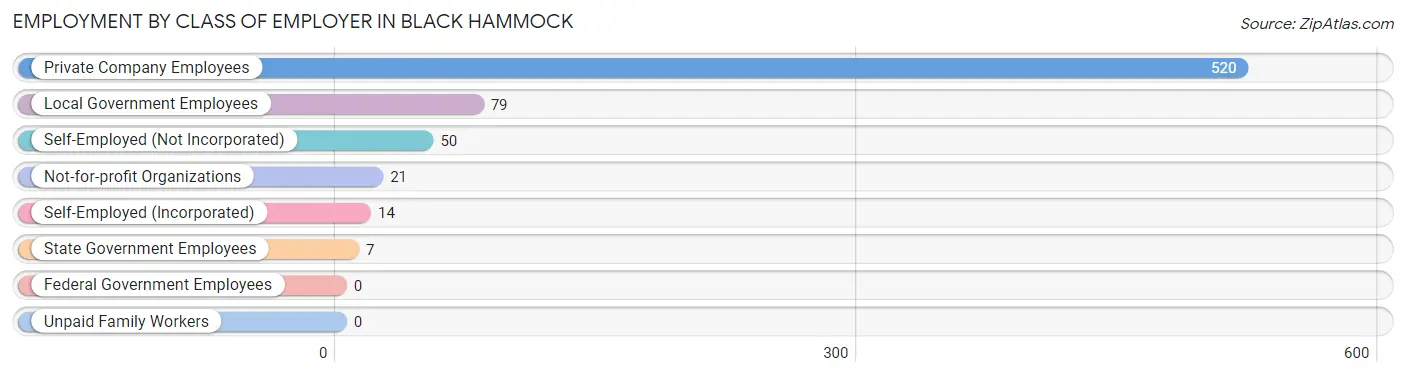
Among the 691 employed individuals in Black Hammock, private company employees (520 | 75.2%), local government employees (79 | 11.4%), and self-employed (not incorporated) (50 | 7.2%) make up the most common classes of employment.
| Employer Class | # Employees | % Employees |
| Private Company Employees | 520 | 75.2% |
| Self-Employed (Incorporated) | 14 | 2.0% |
| Self-Employed (Not Incorporated) | 50 | 7.2% |
| Not-for-profit Organizations | 21 | 3.0% |
| Local Government Employees | 79 | 11.4% |
| State Government Employees | 7 | 1.0% |
| Federal Government Employees | 0 | 0.0% |
| Unpaid Family Workers | 0 | 0.0% |
| Total | 691 | 100.0% |
Employment Status by Age in Black Hammock
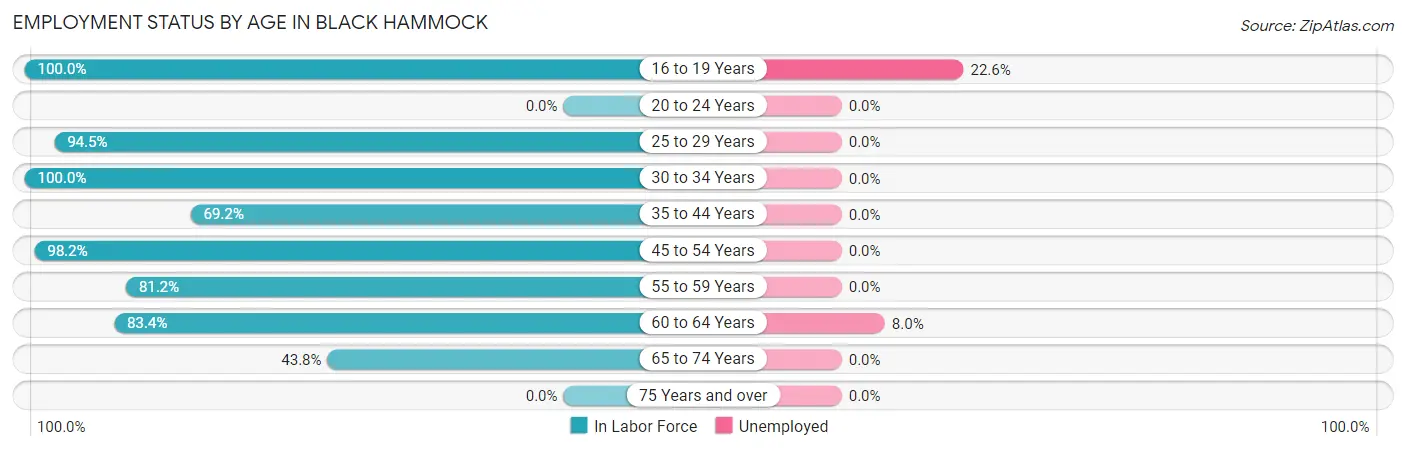
According to the labor force statistics for Black Hammock, out of the total population over 16 years of age (1,037), 71.3% or 739 individuals are in the labor force, with 5.4% or 40 of them unemployed. The age group with the highest labor force participation rate is 16 to 19 years, with 100.0% or 84 individuals in the labor force. Within the labor force, the 16 to 19 years age range has the highest percentage of unemployed individuals, with 22.6% or 19 of them being unemployed.
| Age Bracket | In Labor Force | Unemployed |
| 16 to 19 Years | 84 (100.0%) | 19 (22.6%) |
| 20 to 24 Years | 0 (0.0%) | 0 (0.0%) |
| 25 to 29 Years | 52 (94.5%) | 0 (0.0%) |
| 30 to 34 Years | 5 (100.0%) | 0 (0.0%) |
| 35 to 44 Years | 27 (69.2%) | 0 (0.0%) |
| 45 to 54 Years | 56 (98.2%) | 0 (0.0%) |
| 55 to 59 Years | 186 (81.2%) | 0 (0.0%) |
| 60 to 64 Years | 262 (83.4%) | 21 (8.0%) |
| 65 to 74 Years | 67 (43.8%) | 0 (0.0%) |
| 75 Years and over | 0 (0.0%) | 0 (0.0%) |
| Total | 739 (71.3%) | 40 (5.4%) |
Employment Status by Educational Attainment in Black Hammock
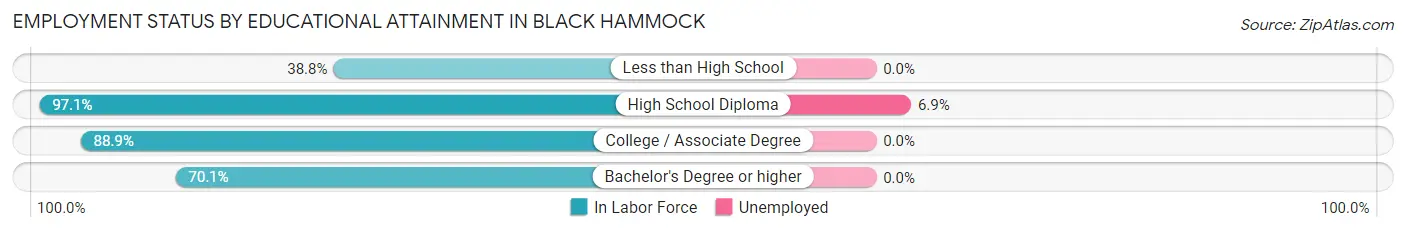
According to labor force statistics for Black Hammock, 84.1% of individuals (588) out of the total population between 25 and 64 years of age (699) are in the labor force, with 3.6% or 21 of them being unemployed. The group with the highest labor force participation rate are those with the educational attainment of high school diploma, with 97.1% or 304 individuals in the labor force. Within the labor force, individuals with high school diploma education have the highest percentage of unemployment, with 6.9% or 21 of them being unemployed.
| Educational Attainment | In Labor Force | Unemployed |
| Less than High School | 19 (38.8%) | 0 (0.0%) |
| High School Diploma | 304 (97.1%) | 22 (6.9%) |
| College / Associate Degree | 136 (88.9%) | 0 (0.0%) |
| Bachelor's Degree or higher | 129 (70.1%) | 0 (0.0%) |
| Total | 588 (84.1%) | 25 (3.6%) |
Employment Occupations by Sex in Black Hammock
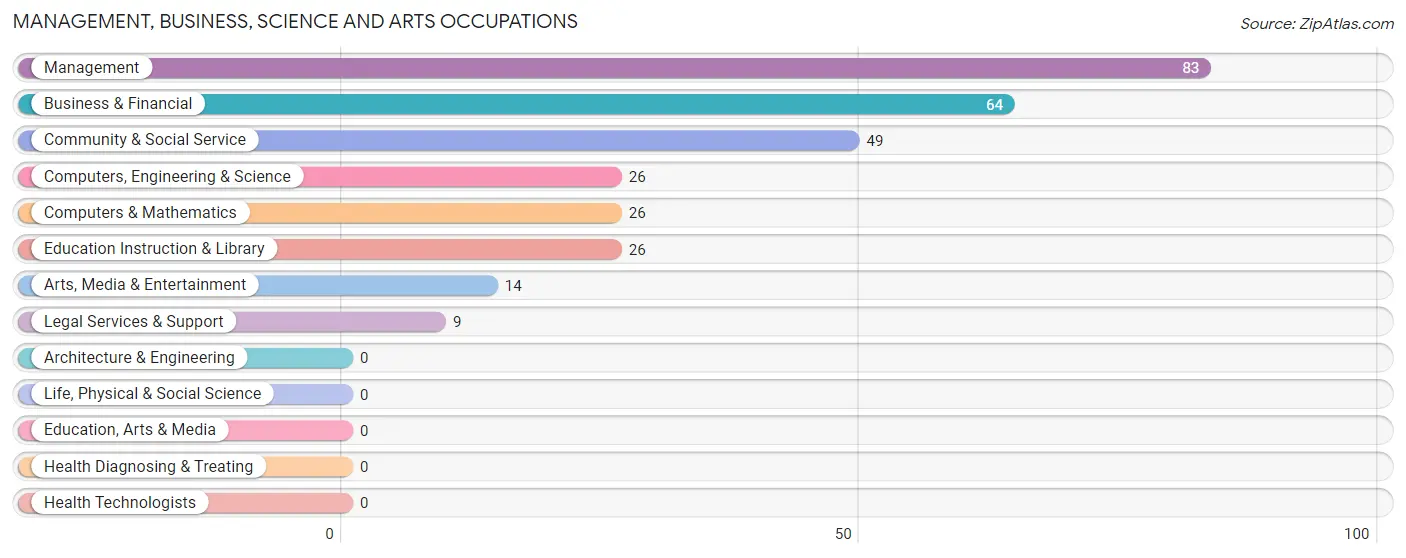
Management, Business, Science and Arts Occupations
The most common Management, Business, Science and Arts occupations in Black Hammock are Management (83 | 11.9%), Business & Financial (64 | 9.2%), Community & Social Service (49 | 7.0%), Computers, Engineering & Science (26 | 3.7%), and Computers & Mathematics (26 | 3.7%).
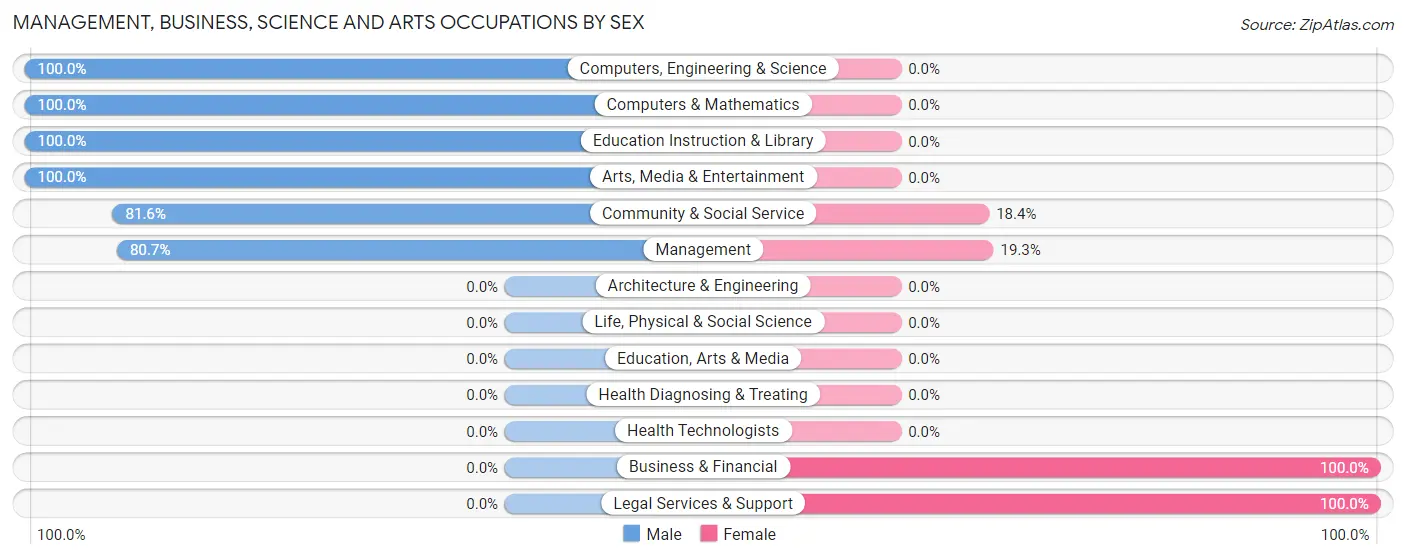
Management, Business, Science and Arts Occupations by Sex
Within the Management, Business, Science and Arts occupations in Black Hammock, the most male-oriented occupations are Computers, Engineering & Science (100.0%), Computers & Mathematics (100.0%), and Education Instruction & Library (100.0%), while the most female-oriented occupations are Business & Financial (100.0%), Legal Services & Support (100.0%), and Management (19.3%).
| Occupation | Male | Female |
| Management | 67 (80.7%) | 16 (19.3%) |
| Business & Financial | 0 (0.0%) | 64 (100.0%) |
| Computers, Engineering & Science | 26 (100.0%) | 0 (0.0%) |
| Computers & Mathematics | 26 (100.0%) | 0 (0.0%) |
| Architecture & Engineering | 0 (0.0%) | 0 (0.0%) |
| Life, Physical & Social Science | 0 (0.0%) | 0 (0.0%) |
| Community & Social Service | 40 (81.6%) | 9 (18.4%) |
| Education, Arts & Media | 0 (0.0%) | 0 (0.0%) |
| Legal Services & Support | 0 (0.0%) | 9 (100.0%) |
| Education Instruction & Library | 26 (100.0%) | 0 (0.0%) |
| Arts, Media & Entertainment | 14 (100.0%) | 0 (0.0%) |
| Health Diagnosing & Treating | 0 (0.0%) | 0 (0.0%) |
| Health Technologists | 0 (0.0%) | 0 (0.0%) |
| Total (Category) | 133 (59.9%) | 89 (40.1%) |
| Total (Overall) | 501 (71.7%) | 198 (28.3%) |
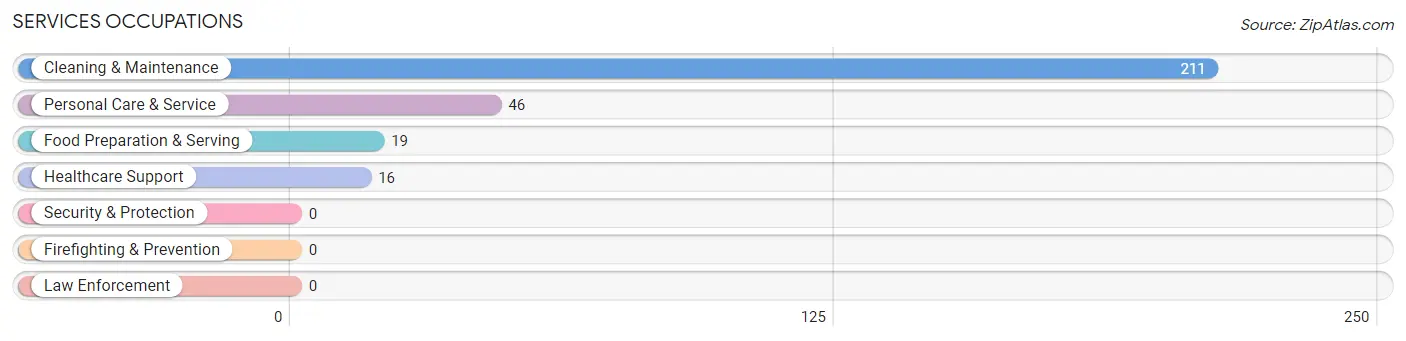
Services Occupations
The most common Services occupations in Black Hammock are Cleaning & Maintenance (211 | 30.2%), Personal Care & Service (46 | 6.6%), Food Preparation & Serving (19 | 2.7%), and Healthcare Support (16 | 2.3%).
Services Occupations by Sex
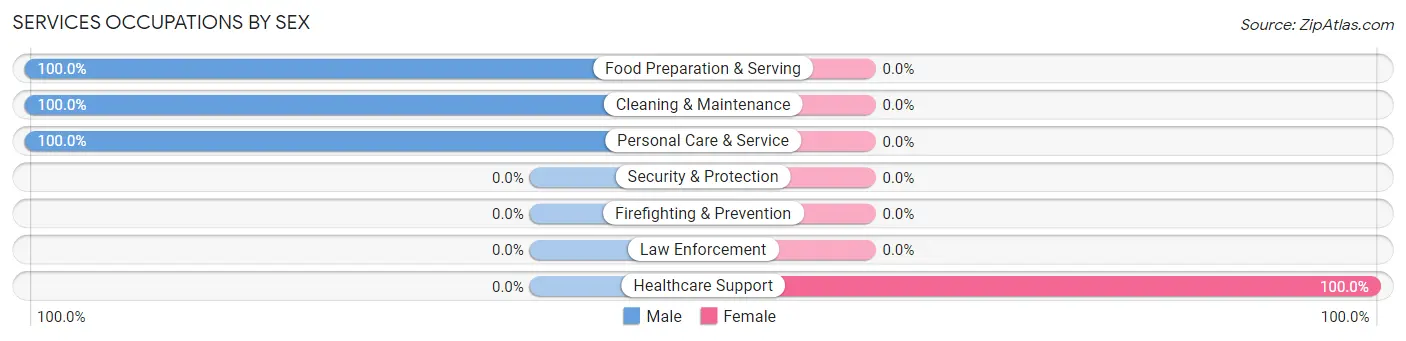
| Occupation | Male | Female |
| Healthcare Support | 0 (0.0%) | 16 (100.0%) |
| Security & Protection | 0 (0.0%) | 0 (0.0%) |
| Firefighting & Prevention | 0 (0.0%) | 0 (0.0%) |
| Law Enforcement | 0 (0.0%) | 0 (0.0%) |
| Food Preparation & Serving | 19 (100.0%) | 0 (0.0%) |
| Cleaning & Maintenance | 211 (100.0%) | 0 (0.0%) |
| Personal Care & Service | 46 (100.0%) | 0 (0.0%) |
| Total (Category) | 276 (94.5%) | 16 (5.5%) |
| Total (Overall) | 501 (71.7%) | 198 (28.3%) |
Sales and Office Occupations
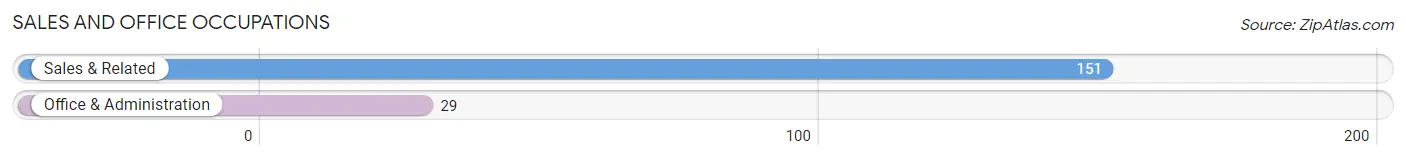
The most common Sales and Office occupations in Black Hammock are Sales & Related (151 | 21.6%), and Office & Administration (29 | 4.2%).
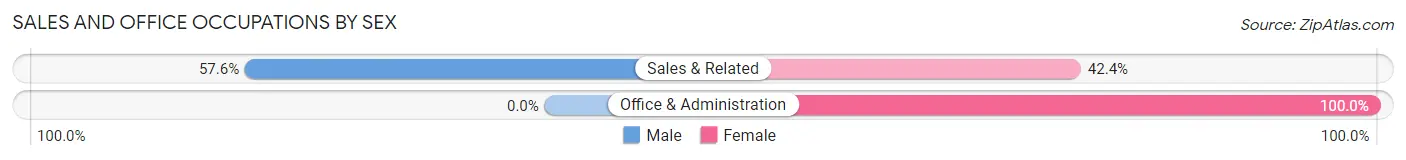
Sales and Office Occupations by Sex
| Occupation | Male | Female |
| Sales & Related | 87 (57.6%) | 64 (42.4%) |
| Office & Administration | 0 (0.0%) | 29 (100.0%) |
| Total (Category) | 87 (48.3%) | 93 (51.7%) |
| Total (Overall) | 501 (71.7%) | 198 (28.3%) |
Natural Resources, Construction and Maintenance Occupations
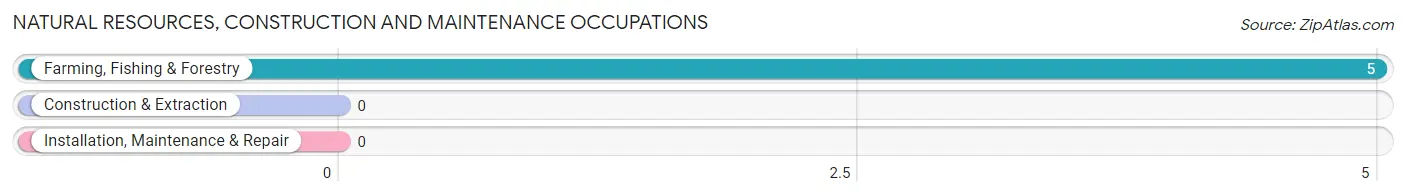
The most common Natural Resources, Construction and Maintenance occupations in Black Hammock are , and Farming, Fishing & Forestry (5 | 0.7%).
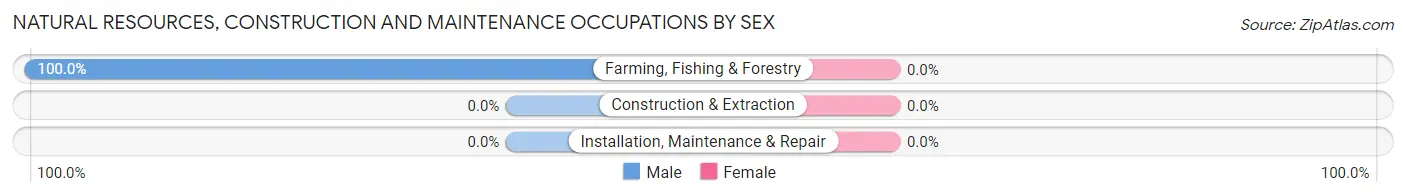
Natural Resources, Construction and Maintenance Occupations by Sex
| Occupation | Male | Female |
| Farming, Fishing & Forestry | 5 (100.0%) | 0 (0.0%) |
| Construction & Extraction | 0 (0.0%) | 0 (0.0%) |
| Installation, Maintenance & Repair | 0 (0.0%) | 0 (0.0%) |
| Total (Category) | 5 (100.0%) | 0 (0.0%) |
| Total (Overall) | 501 (71.7%) | 198 (28.3%) |
Production, Transportation and Moving Occupations
Production, Transportation and Moving Occupations by Sex
| Occupation | Male | Female |
| Production | 0 (0.0%) | 0 (0.0%) |
| Transportation | 0 (0.0%) | 0 (0.0%) |
| Material Moving | 0 (0.0%) | 0 (0.0%) |
| Total (Category) | 0 (0.0%) | 0 (0.0%) |
| Total (Overall) | 501 (71.7%) | 198 (28.3%) |
Employment Industries by Sex in Black Hammock
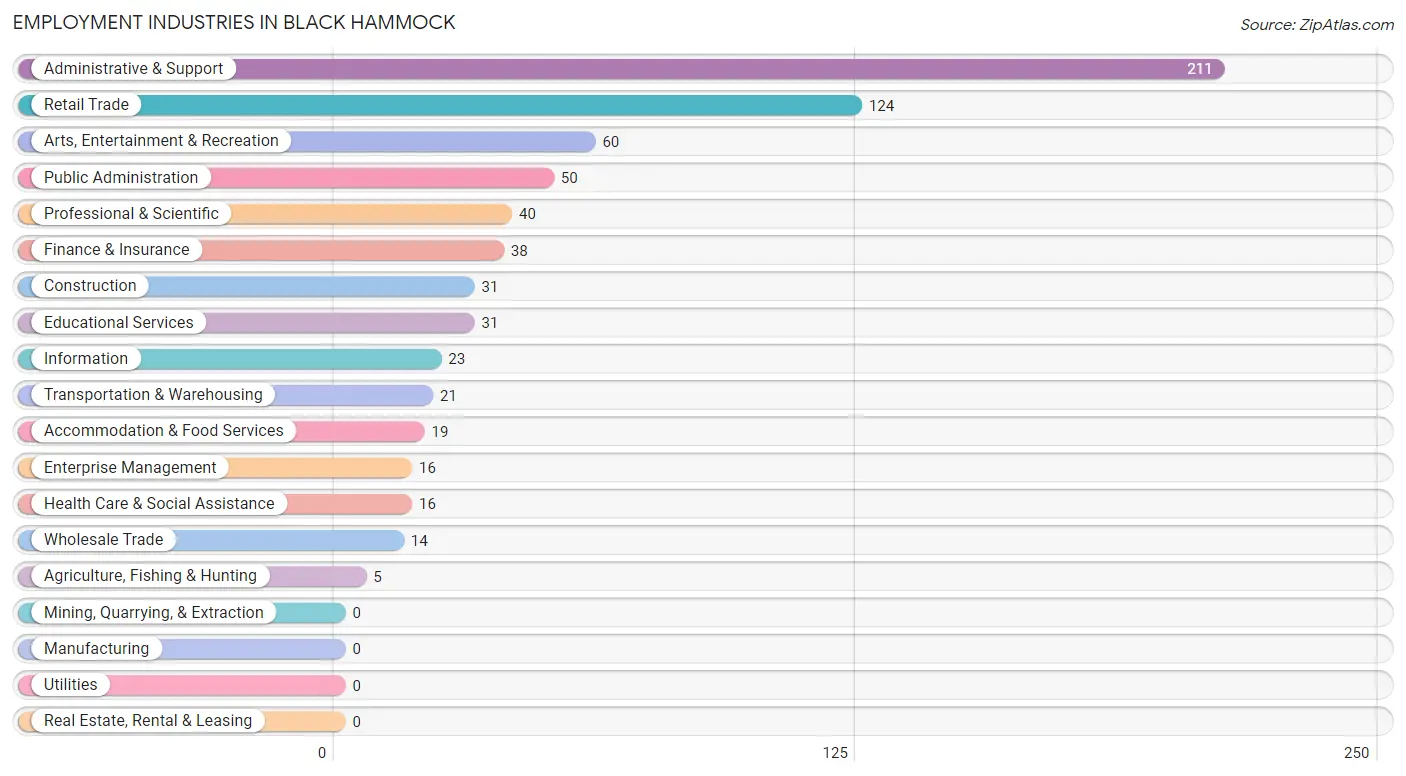
Employment Industries in Black Hammock
The major employment industries in Black Hammock include Administrative & Support (211 | 30.2%), Retail Trade (124 | 17.7%), Arts, Entertainment & Recreation (60 | 8.6%), Public Administration (50 | 7.1%), and Professional & Scientific (40 | 5.7%).
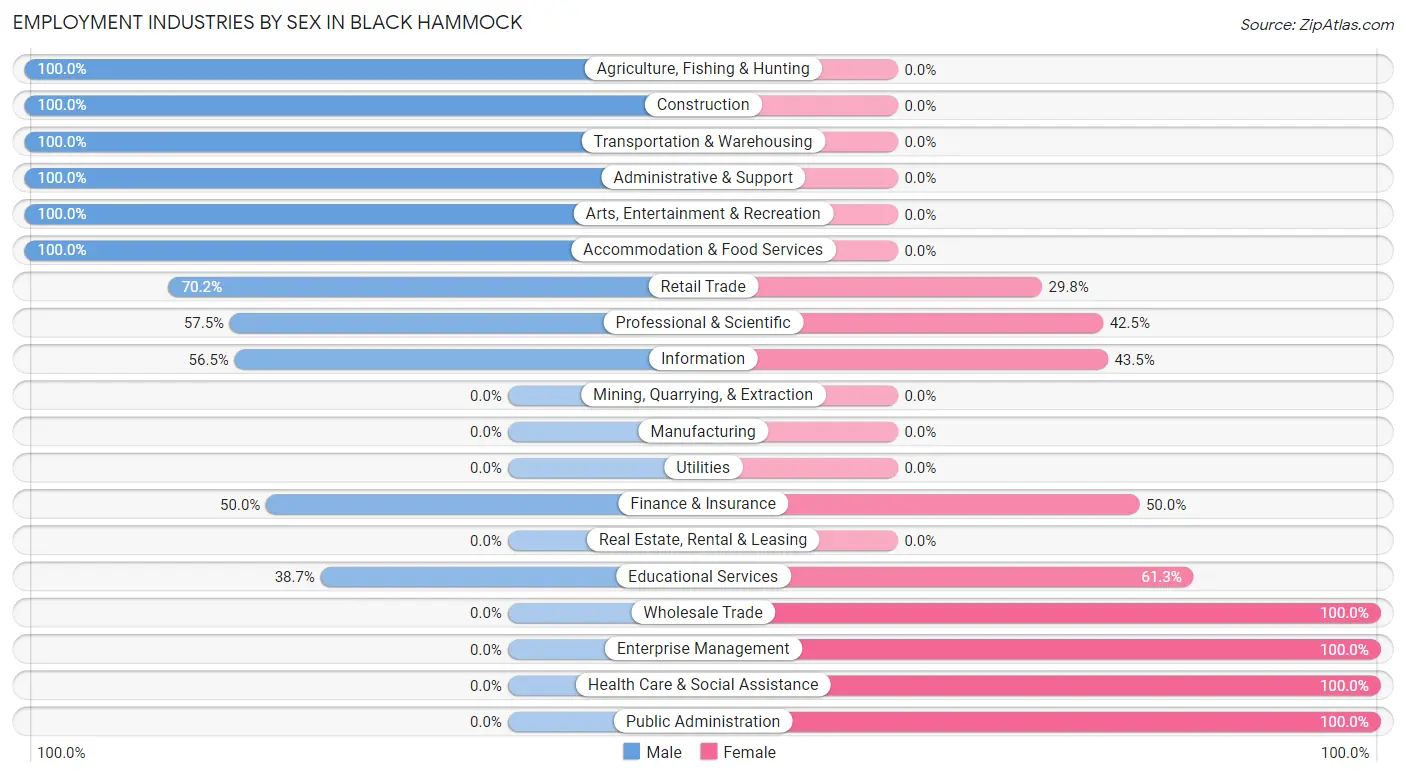
Employment Industries by Sex in Black Hammock
The Black Hammock industries that see more men than women are Agriculture, Fishing & Hunting (100.0%), Construction (100.0%), and Transportation & Warehousing (100.0%), whereas the industries that tend to have a higher number of women are Wholesale Trade (100.0%), Enterprise Management (100.0%), and Health Care & Social Assistance (100.0%).
| Industry | Male | Female |
| Agriculture, Fishing & Hunting | 5 (100.0%) | 0 (0.0%) |
| Mining, Quarrying, & Extraction | 0 (0.0%) | 0 (0.0%) |
| Construction | 31 (100.0%) | 0 (0.0%) |
| Manufacturing | 0 (0.0%) | 0 (0.0%) |
| Wholesale Trade | 0 (0.0%) | 14 (100.0%) |
| Retail Trade | 87 (70.2%) | 37 (29.8%) |
| Transportation & Warehousing | 21 (100.0%) | 0 (0.0%) |
| Utilities | 0 (0.0%) | 0 (0.0%) |
| Information | 13 (56.5%) | 10 (43.5%) |
| Finance & Insurance | 19 (50.0%) | 19 (50.0%) |
| Real Estate, Rental & Leasing | 0 (0.0%) | 0 (0.0%) |
| Professional & Scientific | 23 (57.5%) | 17 (42.5%) |
| Enterprise Management | 0 (0.0%) | 16 (100.0%) |
| Administrative & Support | 211 (100.0%) | 0 (0.0%) |
| Educational Services | 12 (38.7%) | 19 (61.3%) |
| Health Care & Social Assistance | 0 (0.0%) | 16 (100.0%) |
| Arts, Entertainment & Recreation | 60 (100.0%) | 0 (0.0%) |
| Accommodation & Food Services | 19 (100.0%) | 0 (0.0%) |
| Public Administration | 0 (0.0%) | 50 (100.0%) |
| Total | 501 (71.7%) | 198 (28.3%) |
Education in Black Hammock
School Enrollment in Black Hammock
The most common levels of schooling among the 160 students in Black Hammock are high school (71 | 44.4%), elementary school (26 | 16.3%), and middle school (22 | 13.8%).
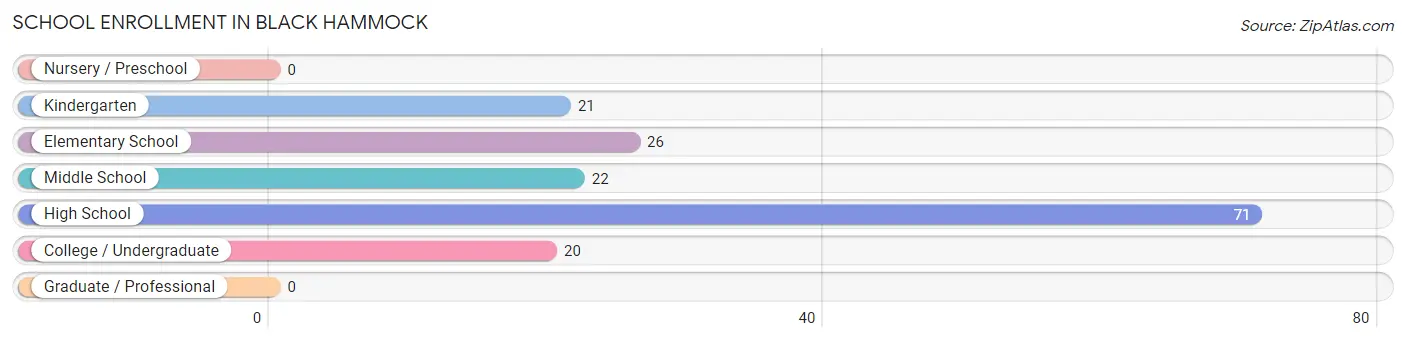
| School Level | # Students | % Students |
| Nursery / Preschool | 0 | 0.0% |
| Kindergarten | 21 | 13.1% |
| Elementary School | 26 | 16.3% |
| Middle School | 22 | 13.8% |
| High School | 71 | 44.4% |
| College / Undergraduate | 20 | 12.5% |
| Graduate / Professional | 0 | 0.0% |
| Total | 160 | 100.0% |
School Enrollment by Age by Funding Source in Black Hammock
Out of a total of 160 students who are enrolled in schools in Black Hammock, 68 (42.5%) attend a private institution, while the remaining 92 (57.5%) are enrolled in public schools. The age group of 20 to 24 year olds has the highest likelihood of being enrolled in private schools, with 1 (100.0% in the age bracket) enrolled. Conversely, the age group of 10 to 14 year olds has the lowest likelihood of being enrolled in a private school, with 35 (100.0% in the age bracket) attending a public institution.

| Age Bracket | Public School | Private School |
| 3 to 4 Year Olds | 0 (0.0%) | 0 (0.0%) |
| 5 to 9 Year Old | 13 (38.2%) | 21 (61.8%) |
| 10 to 14 Year Olds | 35 (100.0%) | 0 (0.0%) |
| 15 to 17 Year Olds | 6 (100.0%) | 0 (0.0%) |
| 18 to 19 Year Olds | 38 (45.2%) | 46 (54.8%) |
| 20 to 24 Year Olds | 0 (0.0%) | 1 (100.0%) |
| 25 to 34 Year Olds | 0 (0.0%) | 0 (0.0%) |
| 35 Years and over | 0 (0.0%) | 0 (0.0%) |
| Total | 92 (57.5%) | 68 (42.5%) |
Educational Attainment by Field of Study in Black Hammock
Communications (63 | 17.9%), business (61 | 17.4%), engineering (50 | 14.2%), social sciences (35 | 10.0%), and physical & health sciences (30 | 8.6%) are the most common fields of study among 351 individuals in Black Hammock who have obtained a bachelor's degree or higher.
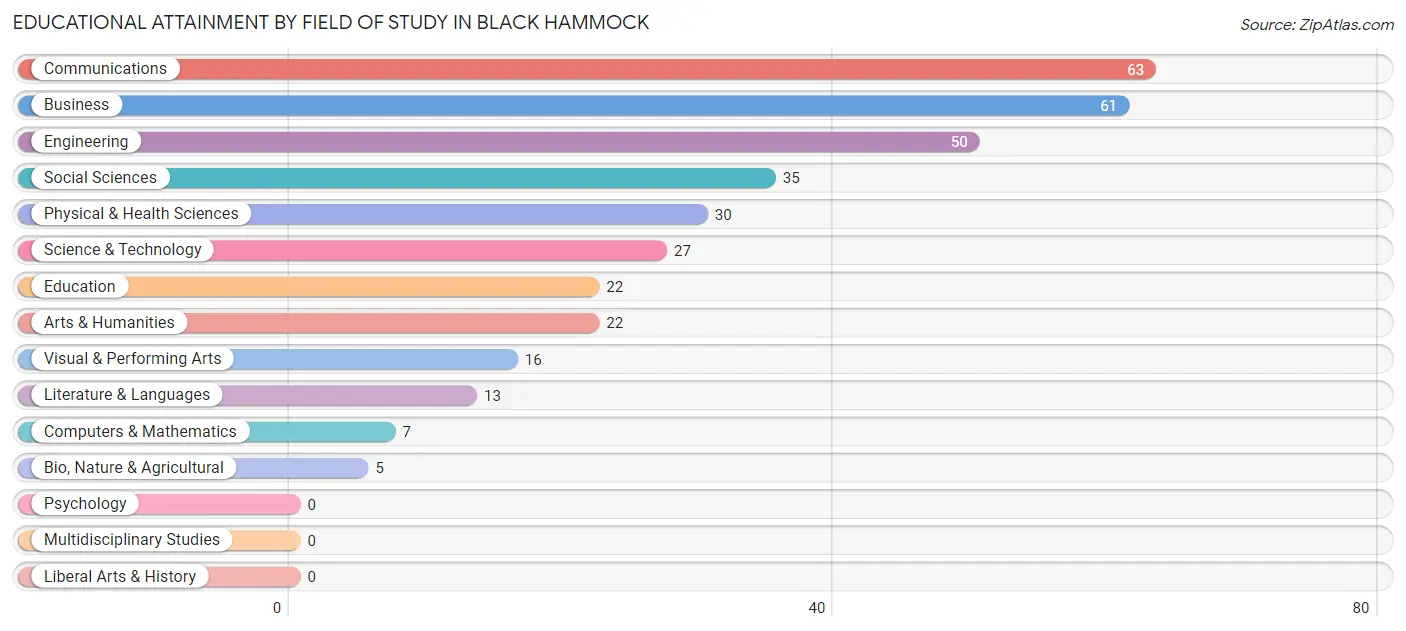
| Field of Study | # Graduates | % Graduates |
| Computers & Mathematics | 7 | 2.0% |
| Bio, Nature & Agricultural | 5 | 1.4% |
| Physical & Health Sciences | 30 | 8.6% |
| Psychology | 0 | 0.0% |
| Social Sciences | 35 | 10.0% |
| Engineering | 50 | 14.2% |
| Multidisciplinary Studies | 0 | 0.0% |
| Science & Technology | 27 | 7.7% |
| Business | 61 | 17.4% |
| Education | 22 | 6.3% |
| Literature & Languages | 13 | 3.7% |
| Liberal Arts & History | 0 | 0.0% |
| Visual & Performing Arts | 16 | 4.6% |
| Communications | 63 | 17.9% |
| Arts & Humanities | 22 | 6.3% |
| Total | 351 | 100.0% |
Transportation & Commute in Black Hammock
Vehicle Availability by Sex in Black Hammock
The most prevalent vehicle ownership categories in Black Hammock are males with 1 vehicle (211, accounting for 42.5%) and females with 1 vehicle (0, making up 111.1%).
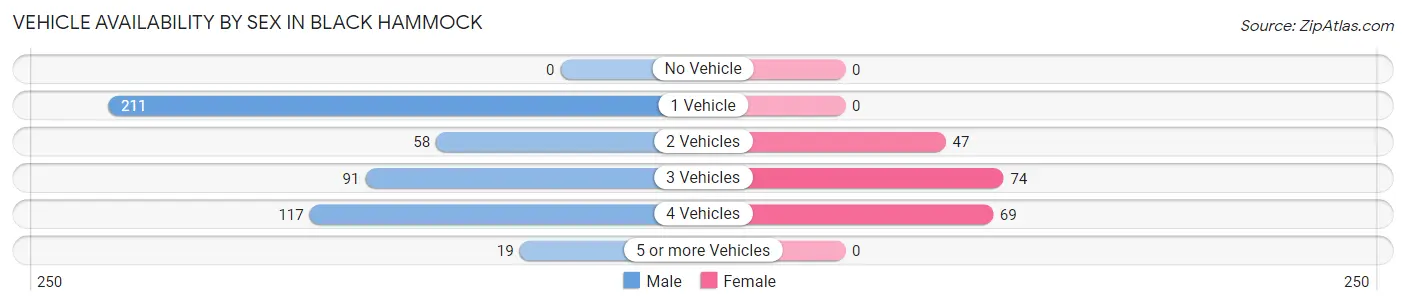
| Vehicles Available | Male | Female |
| No Vehicle | 0 (0.0%) | 0 (0.0%) |
| 1 Vehicle | 211 (42.5%) | 0 (0.0%) |
| 2 Vehicles | 58 (11.7%) | 47 (24.7%) |
| 3 Vehicles | 91 (18.3%) | 74 (39.0%) |
| 4 Vehicles | 117 (23.6%) | 69 (36.3%) |
| 5 or more Vehicles | 19 (3.8%) | 0 (0.0%) |
| Total | 496 (100.0%) | 190 (100.0%) |
Commute Time in Black Hammock
The most frequently occuring commute durations in Black Hammock are 20 to 24 minutes (244 commuters, 39.6%), 30 to 34 minutes (135 commuters, 21.9%), and 10 to 14 minutes (65 commuters, 10.5%).
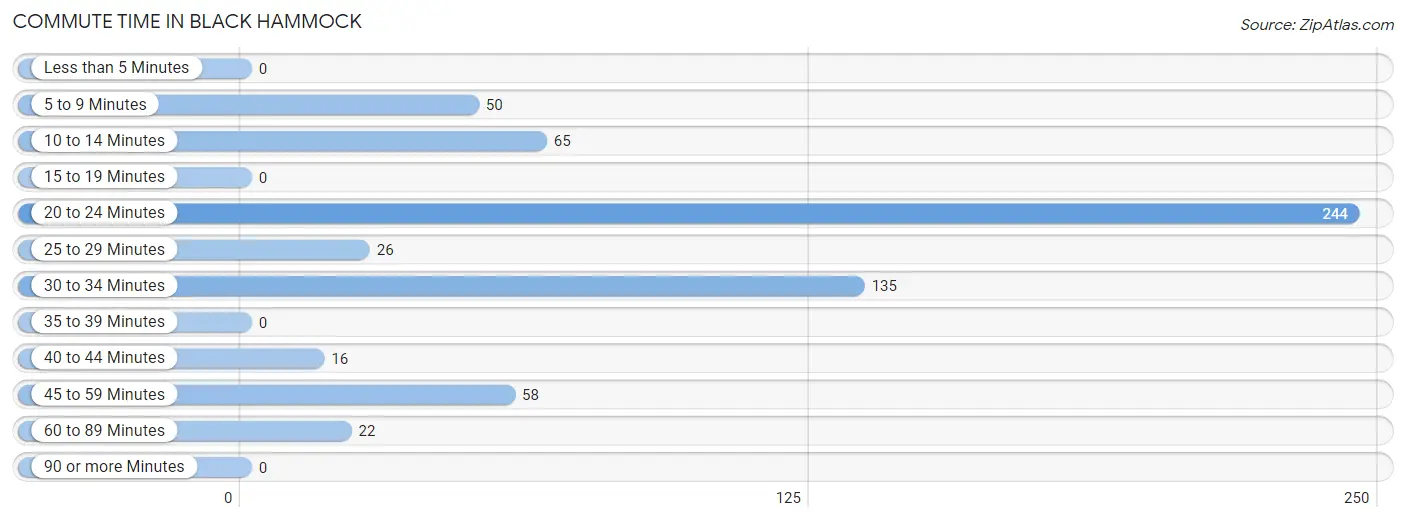
| Commute Time | # Commuters | % Commuters |
| Less than 5 Minutes | 0 | 0.0% |
| 5 to 9 Minutes | 50 | 8.1% |
| 10 to 14 Minutes | 65 | 10.5% |
| 15 to 19 Minutes | 0 | 0.0% |
| 20 to 24 Minutes | 244 | 39.6% |
| 25 to 29 Minutes | 26 | 4.2% |
| 30 to 34 Minutes | 135 | 21.9% |
| 35 to 39 Minutes | 0 | 0.0% |
| 40 to 44 Minutes | 16 | 2.6% |
| 45 to 59 Minutes | 58 | 9.4% |
| 60 to 89 Minutes | 22 | 3.6% |
| 90 or more Minutes | 0 | 0.0% |
Commute Time by Sex in Black Hammock
The most common commute times in Black Hammock are 20 to 24 minutes (225 commuters, 50.1%) for males and 5 to 9 minutes (50 commuters, 29.9%) for females.
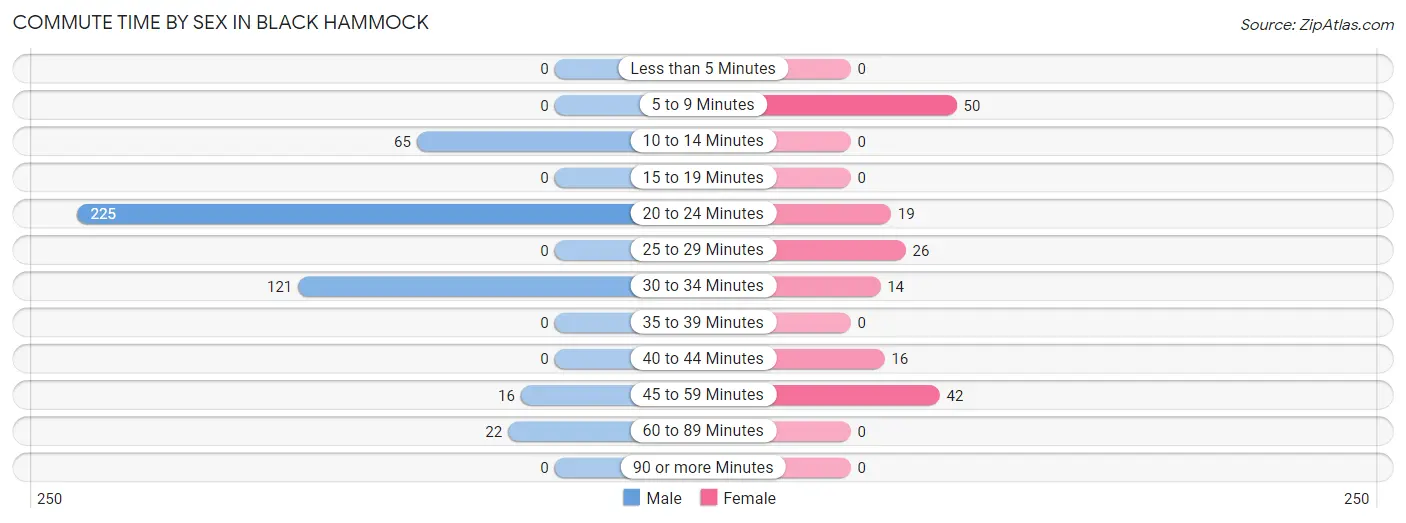
| Commute Time | Male | Female |
| Less than 5 Minutes | 0 (0.0%) | 0 (0.0%) |
| 5 to 9 Minutes | 0 (0.0%) | 50 (29.9%) |
| 10 to 14 Minutes | 65 (14.5%) | 0 (0.0%) |
| 15 to 19 Minutes | 0 (0.0%) | 0 (0.0%) |
| 20 to 24 Minutes | 225 (50.1%) | 19 (11.4%) |
| 25 to 29 Minutes | 0 (0.0%) | 26 (15.6%) |
| 30 to 34 Minutes | 121 (27.0%) | 14 (8.4%) |
| 35 to 39 Minutes | 0 (0.0%) | 0 (0.0%) |
| 40 to 44 Minutes | 0 (0.0%) | 16 (9.6%) |
| 45 to 59 Minutes | 16 (3.6%) | 42 (25.2%) |
| 60 to 89 Minutes | 22 (4.9%) | 0 (0.0%) |
| 90 or more Minutes | 0 (0.0%) | 0 (0.0%) |
Time of Departure to Work by Sex in Black Hammock
The most frequent times of departure to work in Black Hammock are 5:00 AM to 5:29 AM (211, 47.0%) for males and 7:00 AM to 7:29 AM (83, 49.7%) for females.
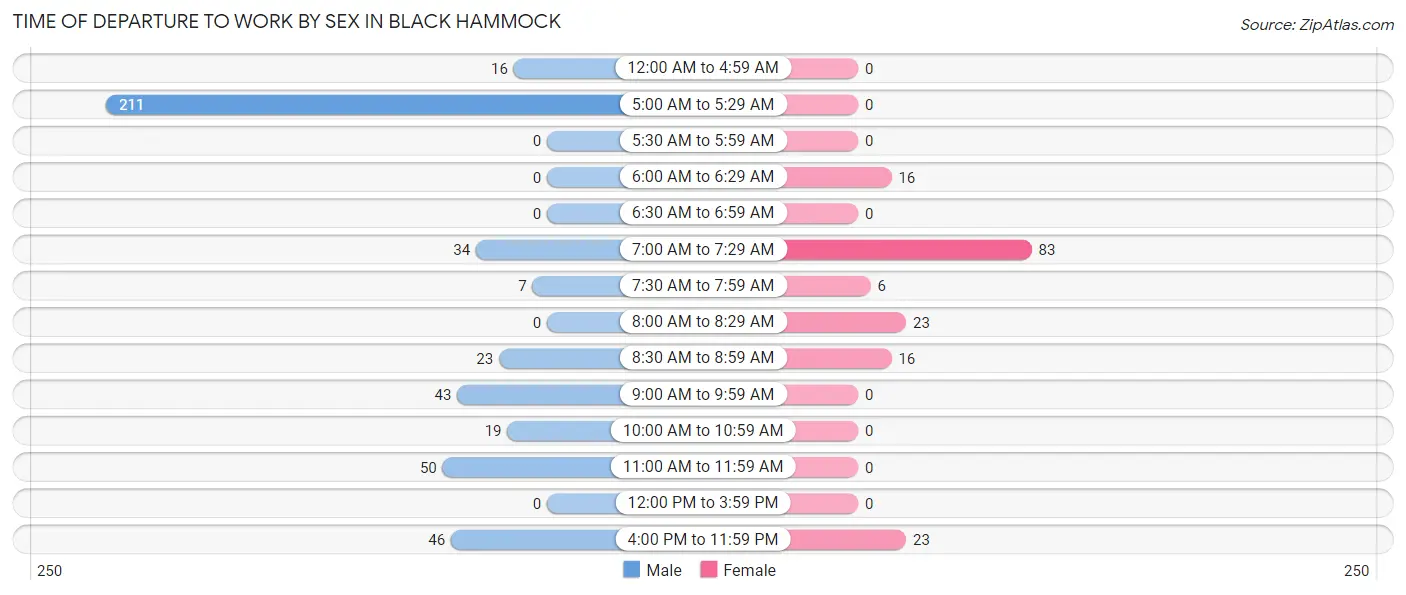
| Time of Departure | Male | Female |
| 12:00 AM to 4:59 AM | 16 (3.6%) | 0 (0.0%) |
| 5:00 AM to 5:29 AM | 211 (47.0%) | 0 (0.0%) |
| 5:30 AM to 5:59 AM | 0 (0.0%) | 0 (0.0%) |
| 6:00 AM to 6:29 AM | 0 (0.0%) | 16 (9.6%) |
| 6:30 AM to 6:59 AM | 0 (0.0%) | 0 (0.0%) |
| 7:00 AM to 7:29 AM | 34 (7.6%) | 83 (49.7%) |
| 7:30 AM to 7:59 AM | 7 (1.6%) | 6 (3.6%) |
| 8:00 AM to 8:29 AM | 0 (0.0%) | 23 (13.8%) |
| 8:30 AM to 8:59 AM | 23 (5.1%) | 16 (9.6%) |
| 9:00 AM to 9:59 AM | 43 (9.6%) | 0 (0.0%) |
| 10:00 AM to 10:59 AM | 19 (4.2%) | 0 (0.0%) |
| 11:00 AM to 11:59 AM | 50 (11.1%) | 0 (0.0%) |
| 12:00 PM to 3:59 PM | 0 (0.0%) | 0 (0.0%) |
| 4:00 PM to 11:59 PM | 46 (10.2%) | 23 (13.8%) |
| Total | 449 (100.0%) | 167 (100.0%) |
Housing Occupancy in Black Hammock
Occupancy by Ownership in Black Hammock
Of the total 570 dwellings in Black Hammock, owner-occupied units account for 555 (97.4%), while renter-occupied units make up 15 (2.6%).
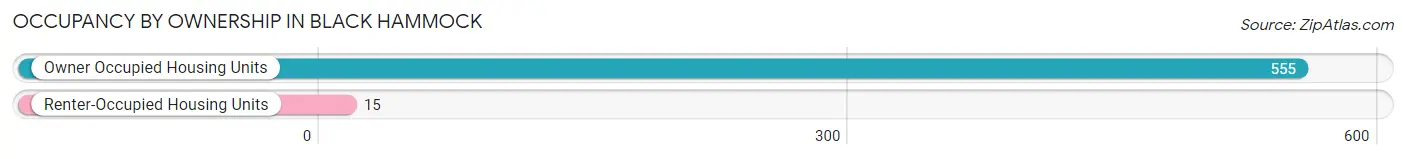
| Occupancy | # Housing Units | % Housing Units |
| Owner Occupied Housing Units | 555 | 97.4% |
| Renter-Occupied Housing Units | 15 | 2.6% |
| Total Occupied Housing Units | 570 | 100.0% |
Occupancy by Household Size in Black Hammock
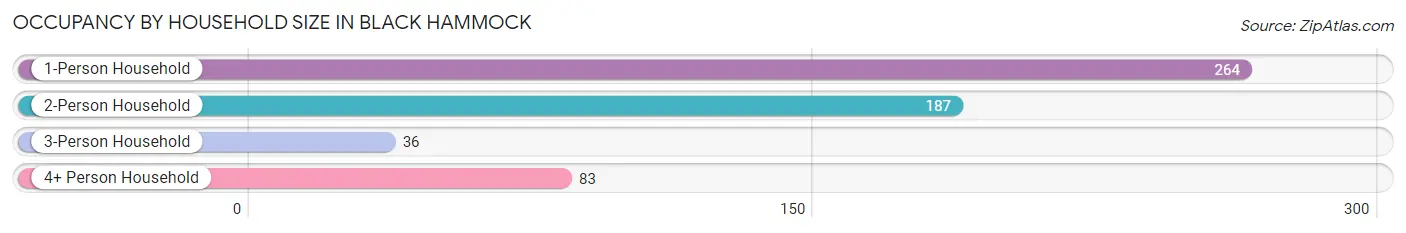
| Household Size | # Housing Units | % Housing Units |
| 1-Person Household | 264 | 46.3% |
| 2-Person Household | 187 | 32.8% |
| 3-Person Household | 36 | 6.3% |
| 4+ Person Household | 83 | 14.6% |
| Total Housing Units | 570 | 100.0% |
Occupancy by Ownership by Household Size in Black Hammock
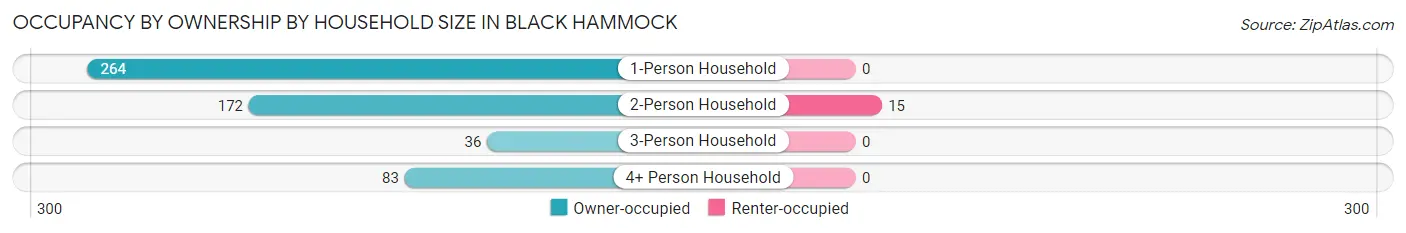
| Household Size | Owner-occupied | Renter-occupied |
| 1-Person Household | 264 (100.0%) | 0 (0.0%) |
| 2-Person Household | 172 (92.0%) | 15 (8.0%) |
| 3-Person Household | 36 (100.0%) | 0 (0.0%) |
| 4+ Person Household | 83 (100.0%) | 0 (0.0%) |
| Total Housing Units | 555 (97.4%) | 15 (2.6%) |
Occupancy by Educational Attainment in Black Hammock
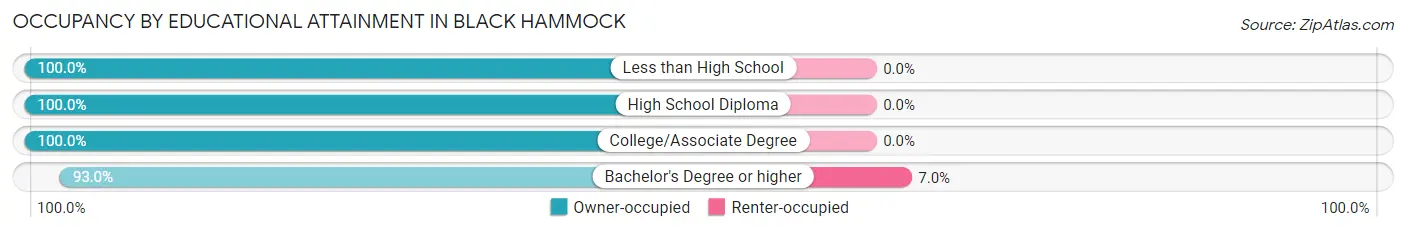
| Household Size | Owner-occupied | Renter-occupied |
| Less than High School | 40 (100.0%) | 0 (0.0%) |
| High School Diploma | 274 (100.0%) | 0 (0.0%) |
| College/Associate Degree | 41 (100.0%) | 0 (0.0%) |
| Bachelor's Degree or higher | 200 (93.0%) | 15 (7.0%) |
Occupancy by Age of Householder in Black Hammock
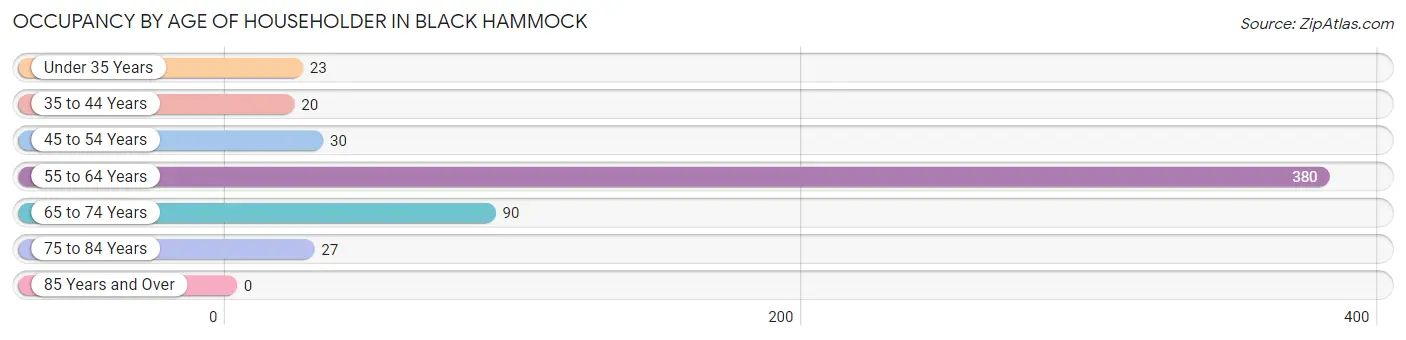
| Age Bracket | # Households | % Households |
| Under 35 Years | 23 | 4.0% |
| 35 to 44 Years | 20 | 3.5% |
| 45 to 54 Years | 30 | 5.3% |
| 55 to 64 Years | 380 | 66.7% |
| 65 to 74 Years | 90 | 15.8% |
| 75 to 84 Years | 27 | 4.7% |
| 85 Years and Over | 0 | 0.0% |
| Total | 570 | 100.0% |
Housing Finances in Black Hammock
Median Income by Occupancy in Black Hammock
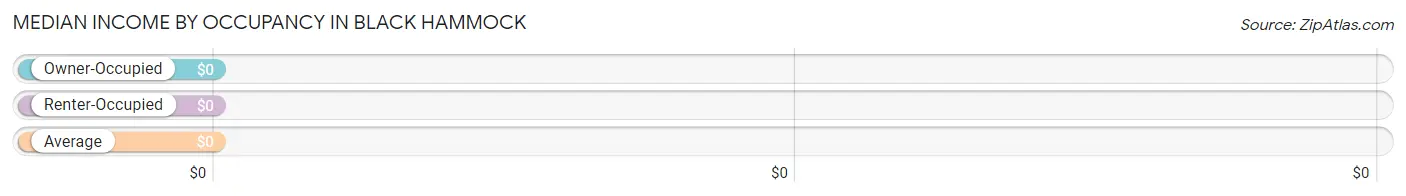
| Occupancy Type | # Households | Median Income |
| Owner-Occupied | 555 (97.4%) | $0 |
| Renter-Occupied | 15 (2.6%) | $0 |
| Average | 570 (100.0%) | $0 |
Occupancy by Householder Income Bracket in Black Hammock
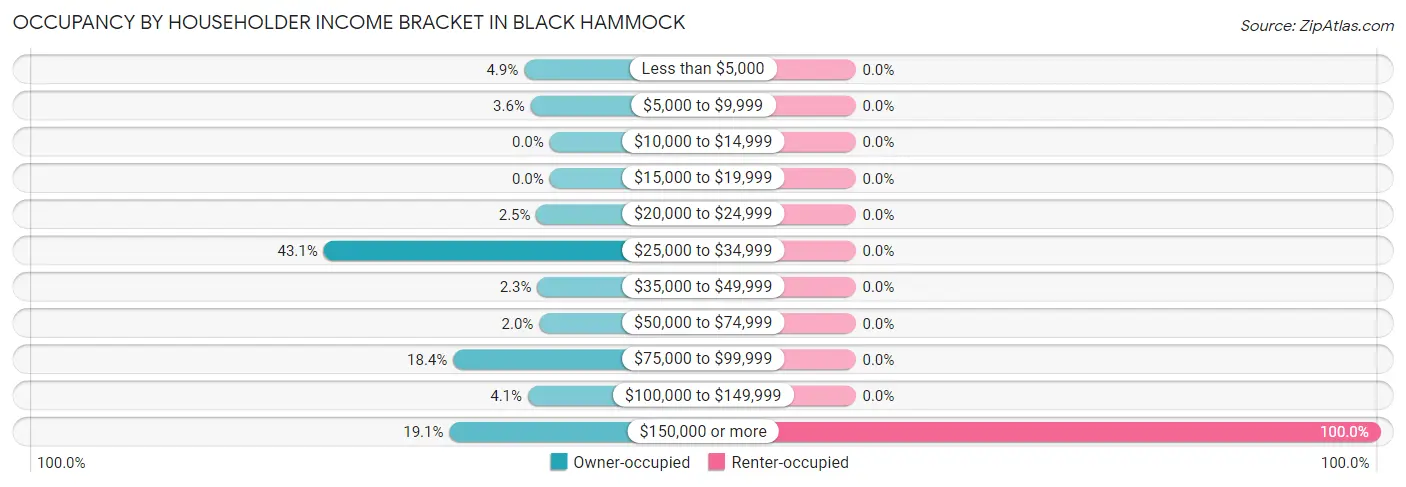
| Income Bracket | Owner-occupied | Renter-occupied |
| Less than $5,000 | 27 (4.9%) | 0 (0.0%) |
| $5,000 to $9,999 | 20 (3.6%) | 0 (0.0%) |
| $10,000 to $14,999 | 0 (0.0%) | 0 (0.0%) |
| $15,000 to $19,999 | 0 (0.0%) | 0 (0.0%) |
| $20,000 to $24,999 | 14 (2.5%) | 0 (0.0%) |
| $25,000 to $34,999 | 239 (43.1%) | 0 (0.0%) |
| $35,000 to $49,999 | 13 (2.3%) | 0 (0.0%) |
| $50,000 to $74,999 | 11 (2.0%) | 0 (0.0%) |
| $75,000 to $99,999 | 102 (18.4%) | 0 (0.0%) |
| $100,000 to $149,999 | 23 (4.1%) | 0 (0.0%) |
| $150,000 or more | 106 (19.1%) | 15 (100.0%) |
| Total | 555 (100.0%) | 15 (100.0%) |
Monthly Housing Cost Tiers in Black Hammock
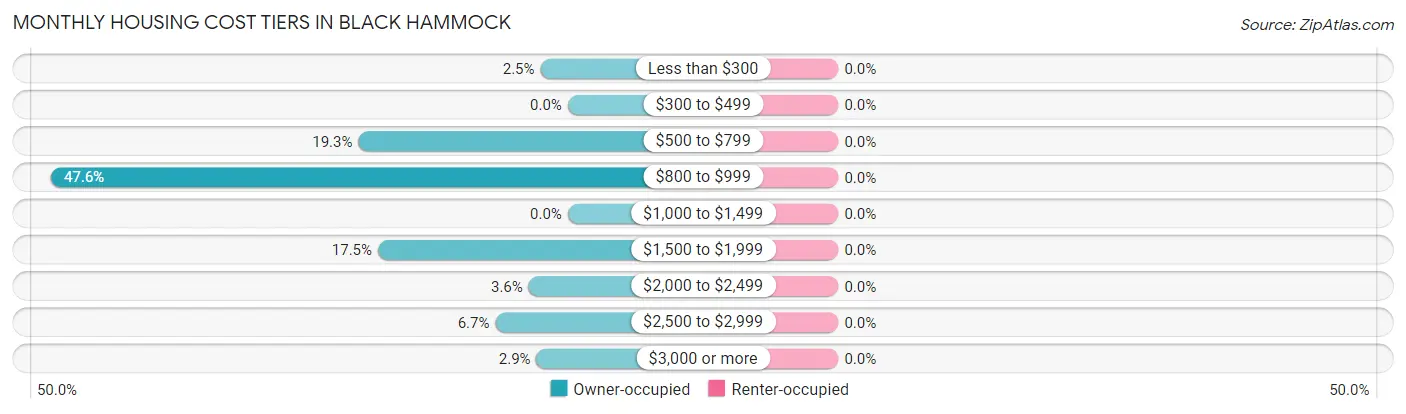
| Monthly Cost | Owner-occupied | Renter-occupied |
| Less than $300 | 14 (2.5%) | 0 (0.0%) |
| $300 to $499 | 0 (0.0%) | 0 (0.0%) |
| $500 to $799 | 107 (19.3%) | 0 (0.0%) |
| $800 to $999 | 264 (47.6%) | 0 (0.0%) |
| $1,000 to $1,499 | 0 (0.0%) | 0 (0.0%) |
| $1,500 to $1,999 | 97 (17.5%) | 0 (0.0%) |
| $2,000 to $2,499 | 20 (3.6%) | 0 (0.0%) |
| $2,500 to $2,999 | 37 (6.7%) | 0 (0.0%) |
| $3,000 or more | 16 (2.9%) | 0 (0.0%) |
| Total | 555 (100.0%) | 15 (100.0%) |
Physical Housing Characteristics in Black Hammock
Housing Structures in Black Hammock
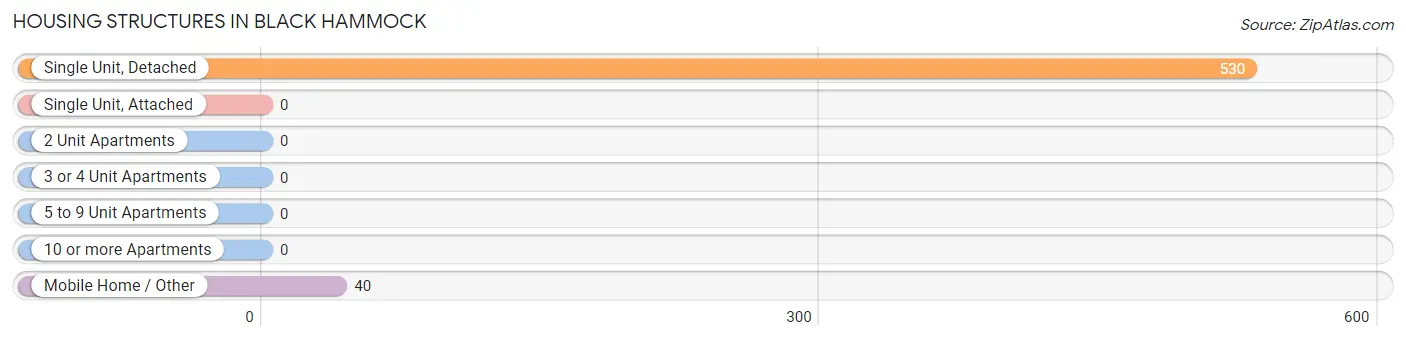
| Structure Type | # Housing Units | % Housing Units |
| Single Unit, Detached | 530 | 93.0% |
| Single Unit, Attached | 0 | 0.0% |
| 2 Unit Apartments | 0 | 0.0% |
| 3 or 4 Unit Apartments | 0 | 0.0% |
| 5 to 9 Unit Apartments | 0 | 0.0% |
| 10 or more Apartments | 0 | 0.0% |
| Mobile Home / Other | 40 | 7.0% |
| Total | 570 | 100.0% |
Housing Structures by Occupancy in Black Hammock
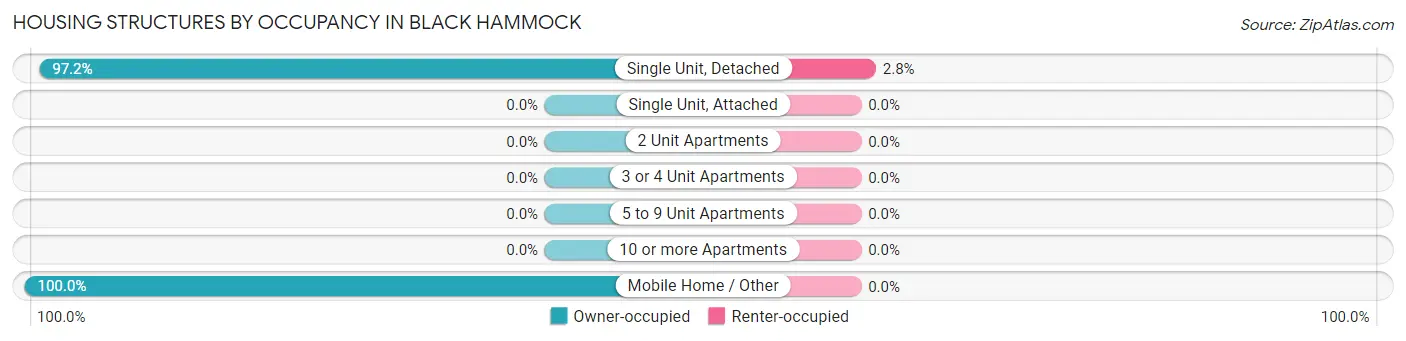
| Structure Type | Owner-occupied | Renter-occupied |
| Single Unit, Detached | 515 (97.2%) | 15 (2.8%) |
| Single Unit, Attached | 0 (0.0%) | 0 (0.0%) |
| 2 Unit Apartments | 0 (0.0%) | 0 (0.0%) |
| 3 or 4 Unit Apartments | 0 (0.0%) | 0 (0.0%) |
| 5 to 9 Unit Apartments | 0 (0.0%) | 0 (0.0%) |
| 10 or more Apartments | 0 (0.0%) | 0 (0.0%) |
| Mobile Home / Other | 40 (100.0%) | 0 (0.0%) |
| Total | 555 (97.4%) | 15 (2.6%) |
Housing Structures by Number of Rooms in Black Hammock
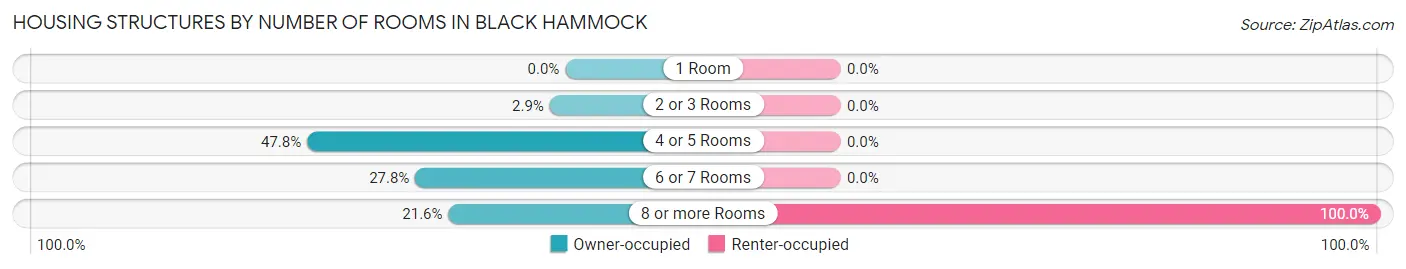
| Number of Rooms | Owner-occupied | Renter-occupied |
| 1 Room | 0 (0.0%) | 0 (0.0%) |
| 2 or 3 Rooms | 16 (2.9%) | 0 (0.0%) |
| 4 or 5 Rooms | 265 (47.7%) | 0 (0.0%) |
| 6 or 7 Rooms | 154 (27.8%) | 0 (0.0%) |
| 8 or more Rooms | 120 (21.6%) | 15 (100.0%) |
| Total | 555 (100.0%) | 15 (100.0%) |
Housing Structure by Heating Type in Black Hammock
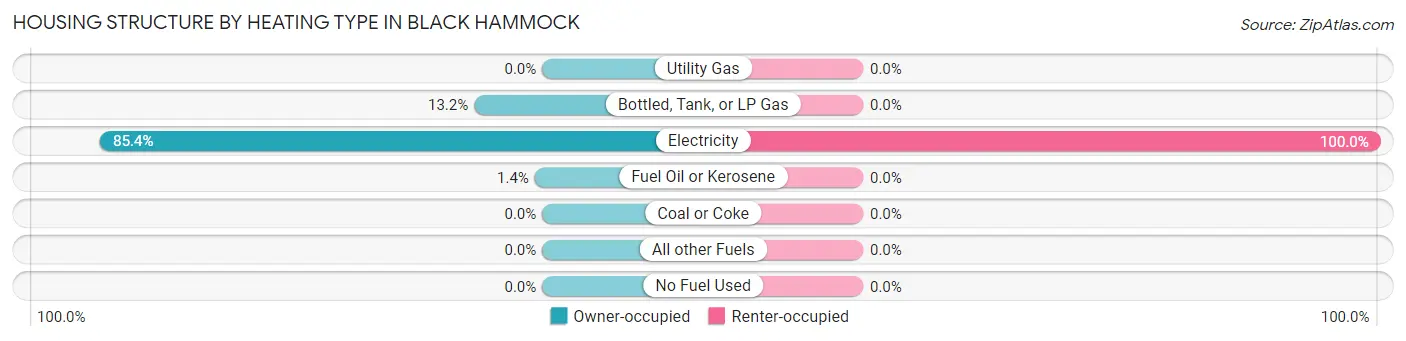
| Heating Type | Owner-occupied | Renter-occupied |
| Utility Gas | 0 (0.0%) | 0 (0.0%) |
| Bottled, Tank, or LP Gas | 73 (13.2%) | 0 (0.0%) |
| Electricity | 474 (85.4%) | 15 (100.0%) |
| Fuel Oil or Kerosene | 8 (1.4%) | 0 (0.0%) |
| Coal or Coke | 0 (0.0%) | 0 (0.0%) |
| All other Fuels | 0 (0.0%) | 0 (0.0%) |
| No Fuel Used | 0 (0.0%) | 0 (0.0%) |
| Total | 555 (100.0%) | 15 (100.0%) |
Household Vehicle Usage in Black Hammock
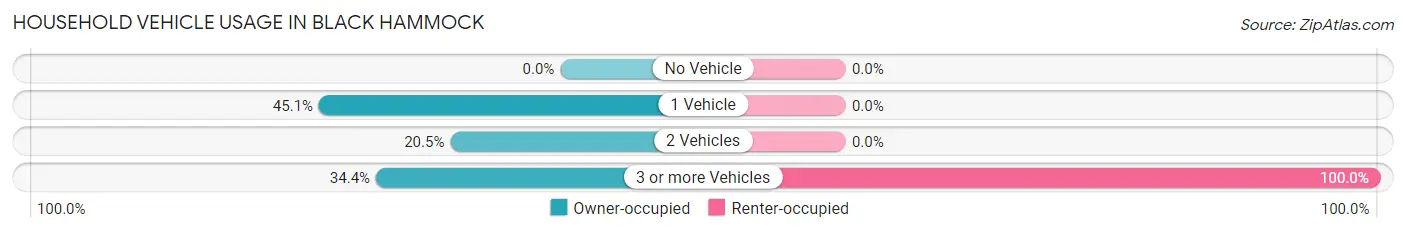
| Vehicles per Household | Owner-occupied | Renter-occupied |
| No Vehicle | 0 (0.0%) | 0 (0.0%) |
| 1 Vehicle | 250 (45.1%) | 0 (0.0%) |
| 2 Vehicles | 114 (20.5%) | 0 (0.0%) |
| 3 or more Vehicles | 191 (34.4%) | 15 (100.0%) |
| Total | 555 (100.0%) | 15 (100.0%) |
Real Estate & Mortgages in Black Hammock
Real Estate and Mortgage Overview in Black Hammock
| Characteristic | Without Mortgage | With Mortgage |
| Housing Units | 181 | 374 |
| Median Property Value | $578,400 | $0 |
| Median Household Income | $76,004 | $87 |
| Monthly Housing Costs | $832 | $16 |
| Real Estate Taxes | - | - |
Property Value by Mortgage Status in Black Hammock
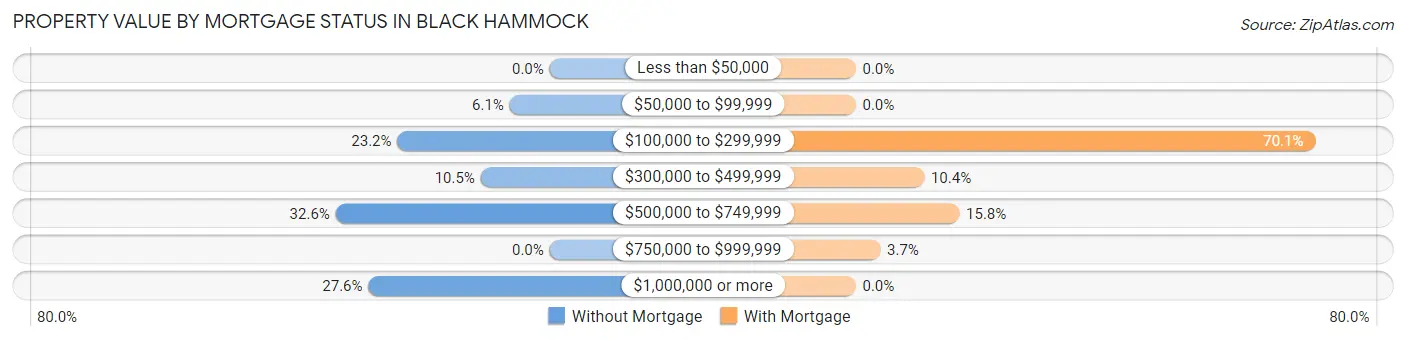
| Property Value | Without Mortgage | With Mortgage |
| Less than $50,000 | 0 (0.0%) | 0 (0.0%) |
| $50,000 to $99,999 | 11 (6.1%) | 0 (0.0%) |
| $100,000 to $299,999 | 42 (23.2%) | 262 (70.1%) |
| $300,000 to $499,999 | 19 (10.5%) | 39 (10.4%) |
| $500,000 to $749,999 | 59 (32.6%) | 59 (15.8%) |
| $750,000 to $999,999 | 0 (0.0%) | 14 (3.7%) |
| $1,000,000 or more | 50 (27.6%) | 0 (0.0%) |
| Total | 181 (100.0%) | 374 (100.0%) |
Household Income by Mortgage Status in Black Hammock
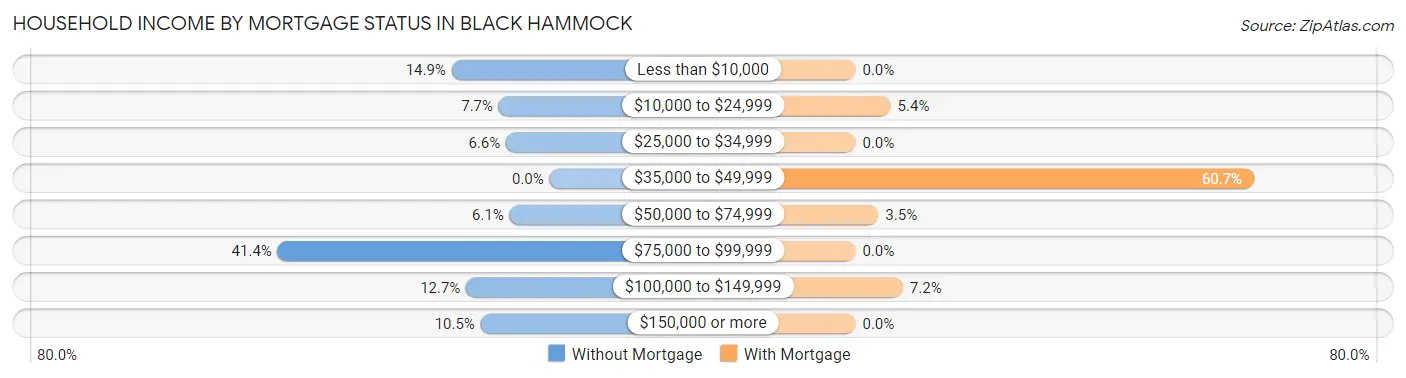
| Household Income | Without Mortgage | With Mortgage |
| Less than $10,000 | 27 (14.9%) | 0 (0.0%) |
| $10,000 to $24,999 | 14 (7.7%) | 20 (5.3%) |
| $25,000 to $34,999 | 12 (6.6%) | 0 (0.0%) |
| $35,000 to $49,999 | 0 (0.0%) | 227 (60.7%) |
| $50,000 to $74,999 | 11 (6.1%) | 13 (3.5%) |
| $75,000 to $99,999 | 75 (41.4%) | 0 (0.0%) |
| $100,000 to $149,999 | 23 (12.7%) | 27 (7.2%) |
| $150,000 or more | 19 (10.5%) | 0 (0.0%) |
| Total | 181 (100.0%) | 374 (100.0%) |
Property Value to Household Income Ratio in Black Hammock
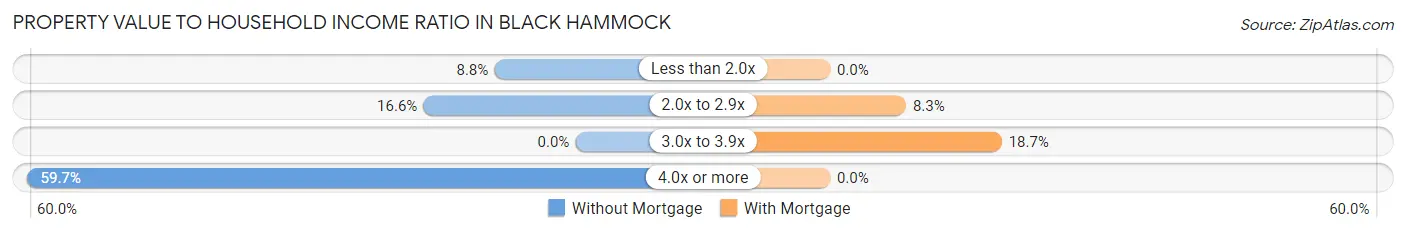
| Value-to-Income Ratio | Without Mortgage | With Mortgage |
| Less than 2.0x | 16 (8.8%) | 0 (0.0%) |
| 2.0x to 2.9x | 30 (16.6%) | 31 (8.3%) |
| 3.0x to 3.9x | 0 (0.0%) | 70 (18.7%) |
| 4.0x or more | 108 (59.7%) | 0 (0.0%) |
| Total | 181 (100.0%) | 374 (100.0%) |
Real Estate Taxes by Mortgage Status in Black Hammock
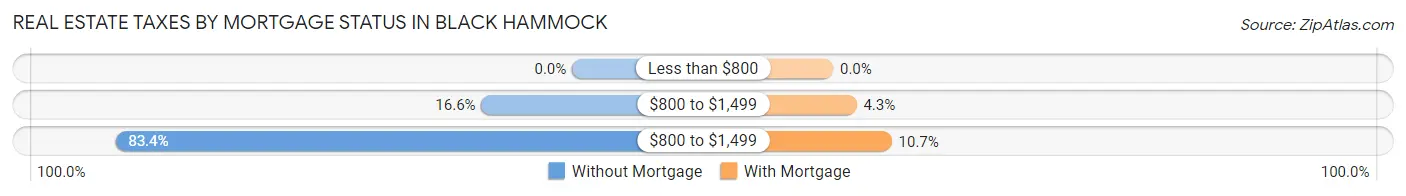
| Property Taxes | Without Mortgage | With Mortgage |
| Less than $800 | 0 (0.0%) | 0 (0.0%) |
| $800 to $1,499 | 30 (16.6%) | 16 (4.3%) |
| $800 to $1,499 | 151 (83.4%) | 40 (10.7%) |
| Total | 181 (100.0%) | 374 (100.0%) |
Health & Disability in Black Hammock
Health Insurance Coverage by Age in Black Hammock
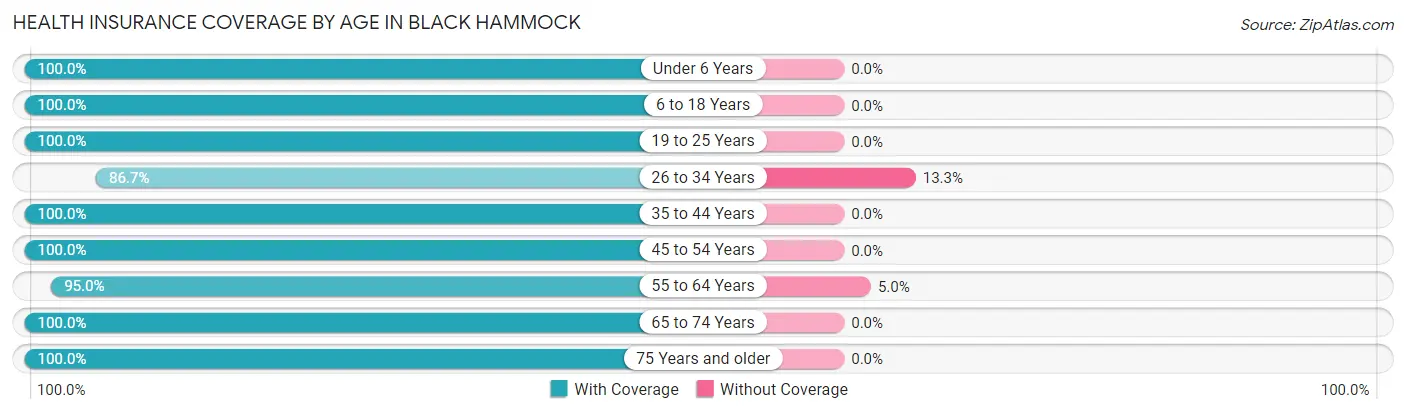
| Age Bracket | With Coverage | Without Coverage |
| Under 6 Years | 41 (100.0%) | 0 (0.0%) |
| 6 to 18 Years | 91 (100.0%) | 0 (0.0%) |
| 19 to 25 Years | 81 (100.0%) | 0 (0.0%) |
| 26 to 34 Years | 52 (86.7%) | 8 (13.3%) |
| 35 to 44 Years | 39 (100.0%) | 0 (0.0%) |
| 45 to 54 Years | 57 (100.0%) | 0 (0.0%) |
| 55 to 64 Years | 516 (95.0%) | 27 (5.0%) |
| 65 to 74 Years | 153 (100.0%) | 0 (0.0%) |
| 75 Years and older | 39 (100.0%) | 0 (0.0%) |
| Total | 1,069 (96.8%) | 35 (3.2%) |
Health Insurance Coverage by Citizenship Status in Black Hammock
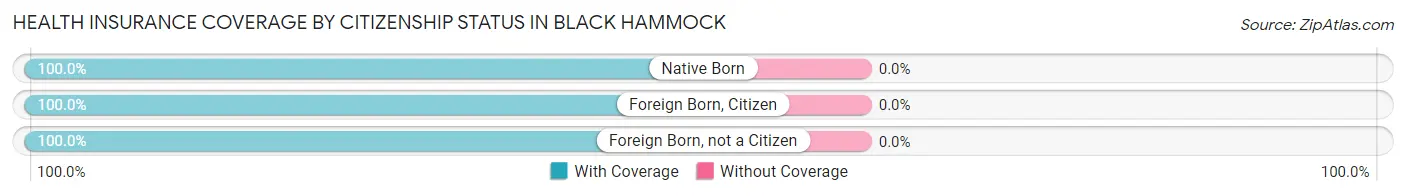
| Citizenship Status | With Coverage | Without Coverage |
| Native Born | 41 (100.0%) | 0 (0.0%) |
| Foreign Born, Citizen | 91 (100.0%) | 0 (0.0%) |
| Foreign Born, not a Citizen | 81 (100.0%) | 0 (0.0%) |
Health Insurance Coverage by Household Income in Black Hammock
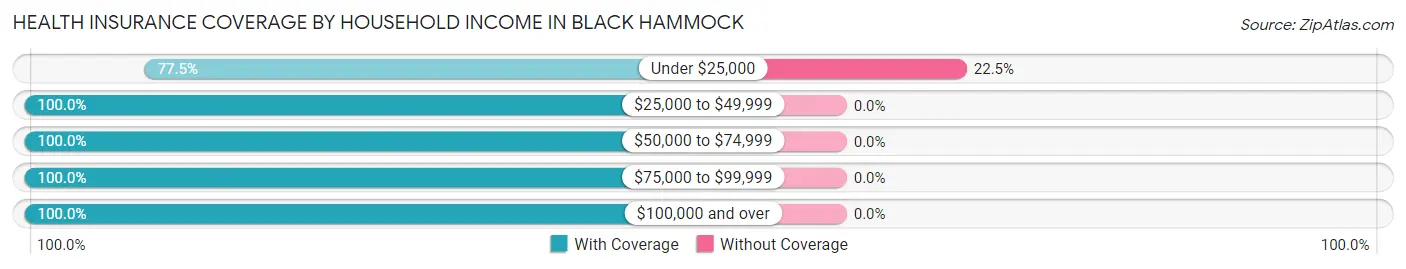
| Household Income | With Coverage | Without Coverage |
| Under $25,000 | 93 (77.5%) | 27 (22.5%) |
| $25,000 to $49,999 | 275 (100.0%) | 0 (0.0%) |
| $50,000 to $74,999 | 19 (100.0%) | 0 (0.0%) |
| $75,000 to $99,999 | 349 (100.0%) | 0 (0.0%) |
| $100,000 and over | 330 (100.0%) | 0 (0.0%) |
Public vs Private Health Insurance Coverage by Age in Black Hammock
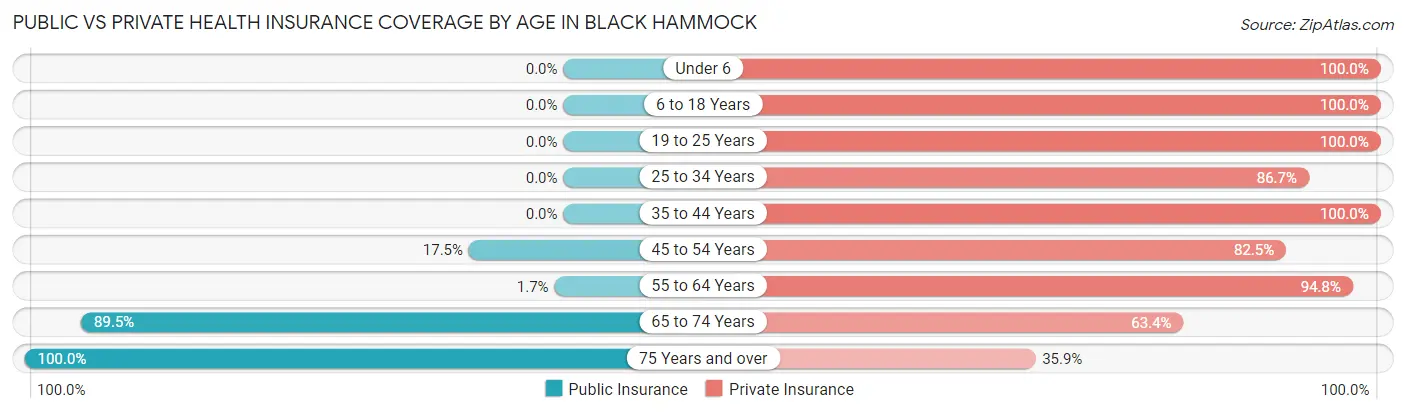
| Age Bracket | Public Insurance | Private Insurance |
| Under 6 | 0 (0.0%) | 41 (100.0%) |
| 6 to 18 Years | 0 (0.0%) | 91 (100.0%) |
| 19 to 25 Years | 0 (0.0%) | 81 (100.0%) |
| 25 to 34 Years | 0 (0.0%) | 52 (86.7%) |
| 35 to 44 Years | 0 (0.0%) | 39 (100.0%) |
| 45 to 54 Years | 10 (17.5%) | 47 (82.5%) |
| 55 to 64 Years | 9 (1.7%) | 515 (94.8%) |
| 65 to 74 Years | 137 (89.5%) | 97 (63.4%) |
| 75 Years and over | 39 (100.0%) | 14 (35.9%) |
| Total | 195 (17.7%) | 977 (88.5%) |
Disability Status by Sex by Age in Black Hammock
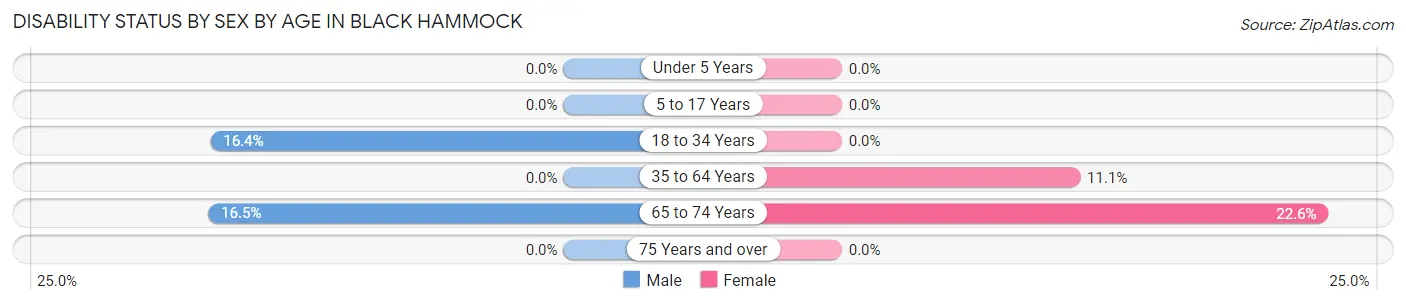
| Age Bracket | Male | Female |
| Under 5 Years | 0 (0.0%) | 0 (0.0%) |
| 5 to 17 Years | 0 (0.0%) | 0 (0.0%) |
| 18 to 34 Years | 19 (16.4%) | 0 (0.0%) |
| 35 to 64 Years | 0 (0.0%) | 24 (11.1%) |
| 65 to 74 Years | 15 (16.5%) | 14 (22.6%) |
| 75 Years and over | 0 (0.0%) | 0 (0.0%) |
Disability Class by Sex by Age in Black Hammock
Disability Class: Hearing Difficulty
| Age Bracket | Male | Female |
| Under 5 Years | 0 (0.0%) | 0 (0.0%) |
| 5 to 17 Years | 0 (0.0%) | 0 (0.0%) |
| 18 to 34 Years | 0 (0.0%) | 0 (0.0%) |
| 35 to 64 Years | 0 (0.0%) | 0 (0.0%) |
| 65 to 74 Years | 0 (0.0%) | 0 (0.0%) |
| 75 Years and over | 0 (0.0%) | 0 (0.0%) |
Disability Class: Vision Difficulty
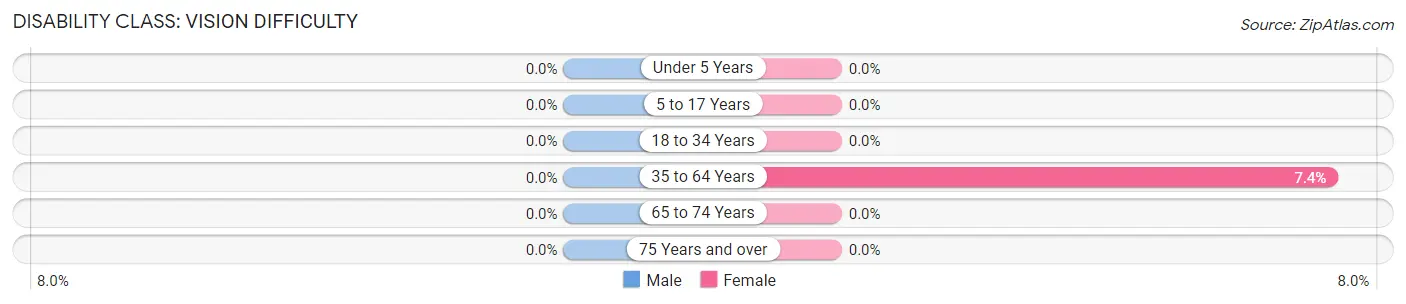
| Age Bracket | Male | Female |
| Under 5 Years | 0 (0.0%) | 0 (0.0%) |
| 5 to 17 Years | 0 (0.0%) | 0 (0.0%) |
| 18 to 34 Years | 0 (0.0%) | 0 (0.0%) |
| 35 to 64 Years | 0 (0.0%) | 16 (7.4%) |
| 65 to 74 Years | 0 (0.0%) | 0 (0.0%) |
| 75 Years and over | 0 (0.0%) | 0 (0.0%) |
Disability Class: Cognitive Difficulty
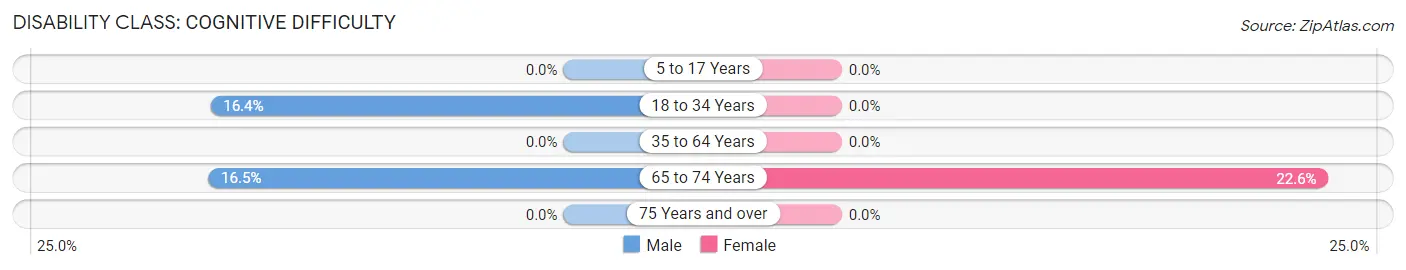
| Age Bracket | Male | Female |
| 5 to 17 Years | 0 (0.0%) | 0 (0.0%) |
| 18 to 34 Years | 19 (16.4%) | 0 (0.0%) |
| 35 to 64 Years | 0 (0.0%) | 0 (0.0%) |
| 65 to 74 Years | 15 (16.5%) | 14 (22.6%) |
| 75 Years and over | 0 (0.0%) | 0 (0.0%) |
Disability Class: Ambulatory Difficulty
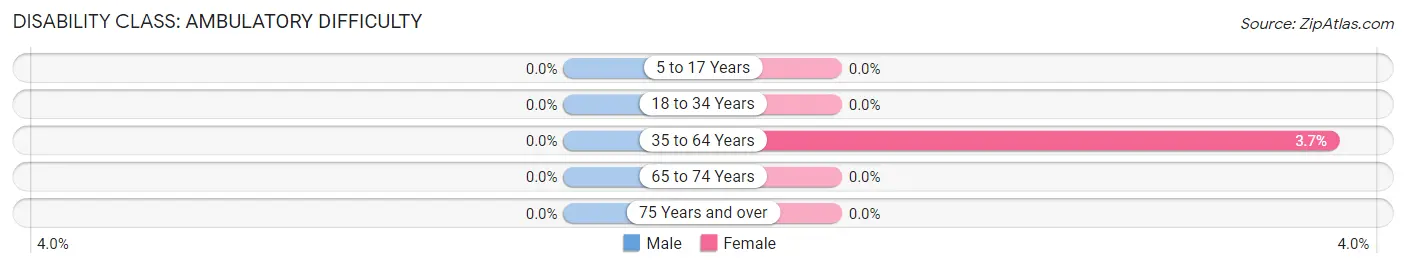
| Age Bracket | Male | Female |
| 5 to 17 Years | 0 (0.0%) | 0 (0.0%) |
| 18 to 34 Years | 0 (0.0%) | 0 (0.0%) |
| 35 to 64 Years | 0 (0.0%) | 8 (3.7%) |
| 65 to 74 Years | 0 (0.0%) | 0 (0.0%) |
| 75 Years and over | 0 (0.0%) | 0 (0.0%) |
Disability Class: Self-Care Difficulty
| Age Bracket | Male | Female |
| 5 to 17 Years | 0 (0.0%) | 0 (0.0%) |
| 18 to 34 Years | 0 (0.0%) | 0 (0.0%) |
| 35 to 64 Years | 0 (0.0%) | 0 (0.0%) |
| 65 to 74 Years | 0 (0.0%) | 0 (0.0%) |
| 75 Years and over | 0 (0.0%) | 0 (0.0%) |
Technology Access in Black Hammock
Computing Device Access in Black Hammock
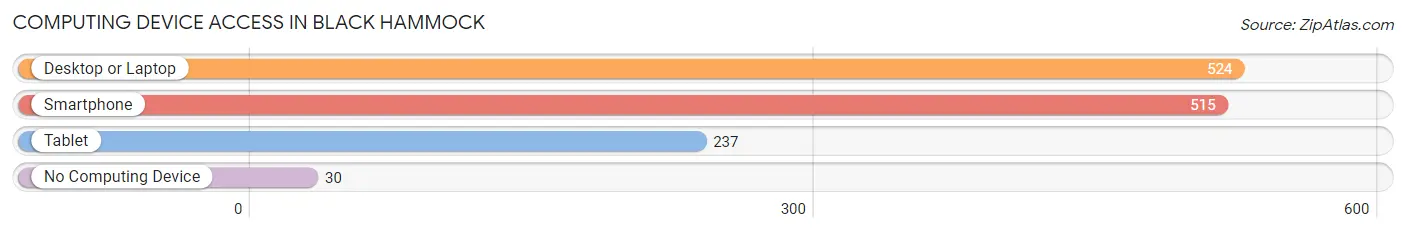
| Device Type | # Households | % Households |
| Desktop or Laptop | 524 | 91.9% |
| Smartphone | 515 | 90.3% |
| Tablet | 237 | 41.6% |
| No Computing Device | 30 | 5.3% |
| Total | 570 | 100.0% |
Internet Access in Black Hammock
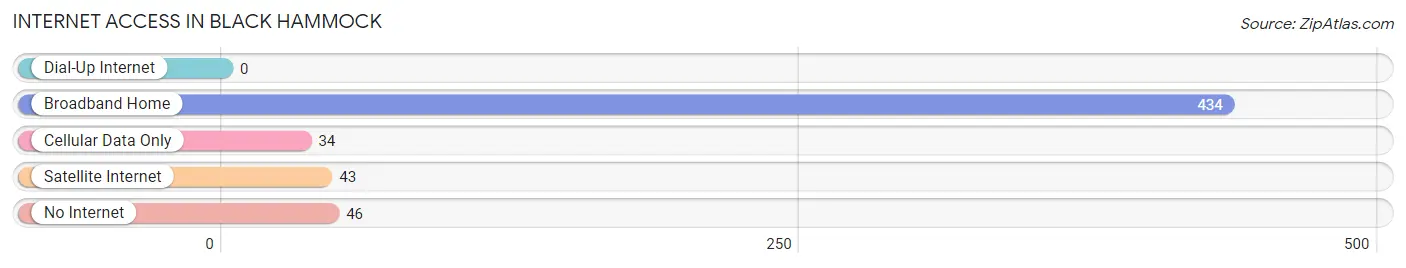
| Internet Type | # Households | % Households |
| Dial-Up Internet | 0 | 0.0% |
| Broadband Home | 434 | 76.1% |
| Cellular Data Only | 34 | 6.0% |
| Satellite Internet | 43 | 7.5% |
| No Internet | 46 | 8.1% |
| Total | 570 | 100.0% |
Black Hammock Summary
Hammock, Florida is a small unincorporated community located in the northeastern part of Volusia County, Florida. It is situated on the banks of the St. Johns River, just south of the city of Deland. The community is named after the black hammock trees that are found in the area.
History
The area that is now known as Hammock, Florida was originally inhabited by the Timucua Indians. The Timucua were a Native American tribe that lived in the area for thousands of years before the arrival of Europeans. The first Europeans to settle in the area were Spanish explorers in the late 1500s. The area was then part of the Spanish colony of Florida.
In the early 1800s, the area was settled by American settlers. The first settlers were mostly farmers and ranchers who were attracted to the area by its fertile soil and abundant wildlife. The area was also known for its large population of black hammock trees, which gave the area its name.
In the late 1800s, the area was home to a number of small towns, including Deland, which was the county seat of Volusia County. The area was also home to a number of citrus groves and other agricultural operations.
In the early 1900s, the area began to experience a period of growth and development. The area was home to a number of businesses, including a sawmill, a turpentine still, and a number of stores. The area also became a popular tourist destination, with a number of resorts and hotels being built in the area.
In the mid-1900s, the area experienced a period of decline. The area was hit hard by the Great Depression and the citrus industry was hit particularly hard. Many of the businesses in the area closed and the population began to decline.
In the late 1900s, the area began to experience a period of revitalization. The area was home to a number of new businesses, including a number of restaurants and retail stores. The area also became a popular destination for tourists, with a number of resorts and hotels being built in the area.
Geography
Hammock, Florida is located in the northeastern part of Volusia County, Florida. It is situated on the banks of the St. Johns River, just south of the city of Deland. The area is mostly flat, with some rolling hills in the area. The area is home to a number of lakes, including Lake Monroe and Lake George.
The climate in the area is subtropical, with hot, humid summers and mild winters. The average temperature in the area is around 70 degrees Fahrenheit. The area receives an average of 50 inches of rain per year.
Economy
The economy of Hammock, Florida is largely based on tourism and agriculture. The area is home to a number of resorts and hotels, as well as a number of restaurants and retail stores. The area is also home to a number of citrus groves and other agricultural operations.
The area is also home to a number of manufacturing and industrial operations, including a number of aerospace and defense companies. The area is also home to a number of government and military installations, including the Naval Air Station Jacksonville and the Naval Air Station Mayport.
Demographics
As of the 2010 census, the population of Hammock, Florida was 1,845. The racial makeup of the area was 79.3% White, 15.2% African American, 0.3% Native American, 0.7% Asian, 0.1% Pacific Islander, and 4.4% from other races. The median household income in the area was $41,944. The per capita income in the area was $20,945.
Common Questions
What is Per Capita Income in Black Hammock?
Per Capita income in Black Hammock is $45,734.
What is Income or Wage Gap in Black Hammock?
Income or Wage Gap in Black Hammock is 41.7%.
Women in Black Hammock earn 58.3 cents for every dollar earned by a man.
What is Inequality or Gini Index in Black Hammock?
Inequality or Gini Index in Black Hammock is 0.51.
What is the Total Population of Black Hammock?
Total Population of Black Hammock is 1,140.
What is the Total Male Population of Black Hammock?
Total Male Population of Black Hammock is 695.
What is the Total Female Population of Black Hammock?
Total Female Population of Black Hammock is 445.
What is the Ratio of Males per 100 Females in Black Hammock?
There are 156.18 Males per 100 Females in Black Hammock.
What is the Ratio of Females per 100 Males in Black Hammock?
There are 64.03 Females per 100 Males in Black Hammock.
What is the Median Population Age in Black Hammock?
Median Population Age in Black Hammock is 59.2 Years.
What is the Average Family Size in Black Hammock
Average Family Size in Black Hammock is 2.8 People.
What is the Average Household Size in Black Hammock
Average Household Size in Black Hammock is 1.9 People.
How Large is the Labor Force in Black Hammock?
There are 739 People in the Labor Forcein in Black Hammock.
What is the Percentage of People in the Labor Force in Black Hammock?
71.3% of People are in the Labor Force in Black Hammock.
What is the Unemployment Rate in Black Hammock?
Unemployment Rate in Black Hammock is 5.4%.