Miami Shores, FL Map & Demographics
Miami Shores Map
Miami Shores Overview
$54,518
PER CAPITA INCOME
$144,375
AVG FAMILY INCOME
$120,833
AVG HOUSEHOLD INCOME
37.1%
WAGE / INCOME GAP [ % ]
62.9¢/ $1
WAGE / INCOME GAP [ $ ]
0.44
INEQUALITY / GINI INDEX
11,638
TOTAL POPULATION
5,217
MALE POPULATION
6,421
FEMALE POPULATION
81.25
MALES / 100 FEMALES
123.08
FEMALES / 100 MALES
38.0
MEDIAN AGE
3.3
AVG FAMILY SIZE
2.7
AVG HOUSEHOLD SIZE
5,957
LABOR FORCE [ PEOPLE ]
62.9%
PERCENT IN LABOR FORCE
7.0%
UNEMPLOYMENT RATE
Income in Miami Shores
Income Overview in Miami Shores
Per Capita Income in Miami Shores is $54,518, while median incomes of families and households are $144,375 and $120,833 respectively.
| Characteristic | Number | Measure |
| Per Capita Income | 11,638 | $54,518 |
| Median Family Income | 2,555 | $144,375 |
| Mean Family Income | 2,555 | $183,785 |
| Median Household Income | 3,756 | $120,833 |
| Mean Household Income | 3,756 | $164,958 |
| Income Deficit | 2,555 | $0 |
| Wage / Income Gap (%) | 11,638 | 37.13% |
| Wage / Income Gap ($) | 11,638 | 62.87¢ per $1 |
| Gini / Inequality Index | 11,638 | 0.44 |
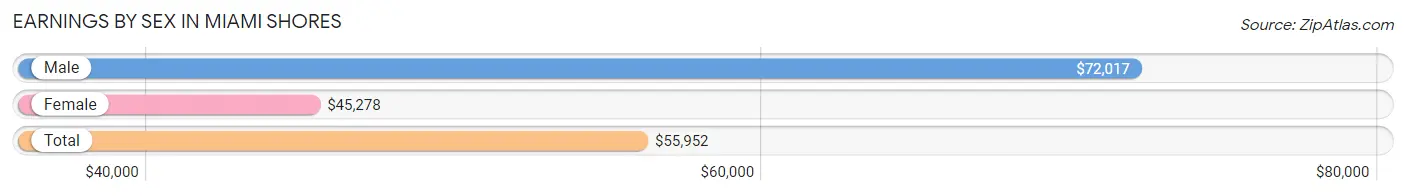
Earnings by Sex in Miami Shores
Average Earnings in Miami Shores are $55,952, $72,017 for men and $45,278 for women, a difference of 37.1%.
| Sex | Number | Average Earnings |
| Male | 3,131 (51.1%) | $72,017 |
| Female | 2,992 (48.9%) | $45,278 |
| Total | 6,123 (100.0%) | $55,952 |
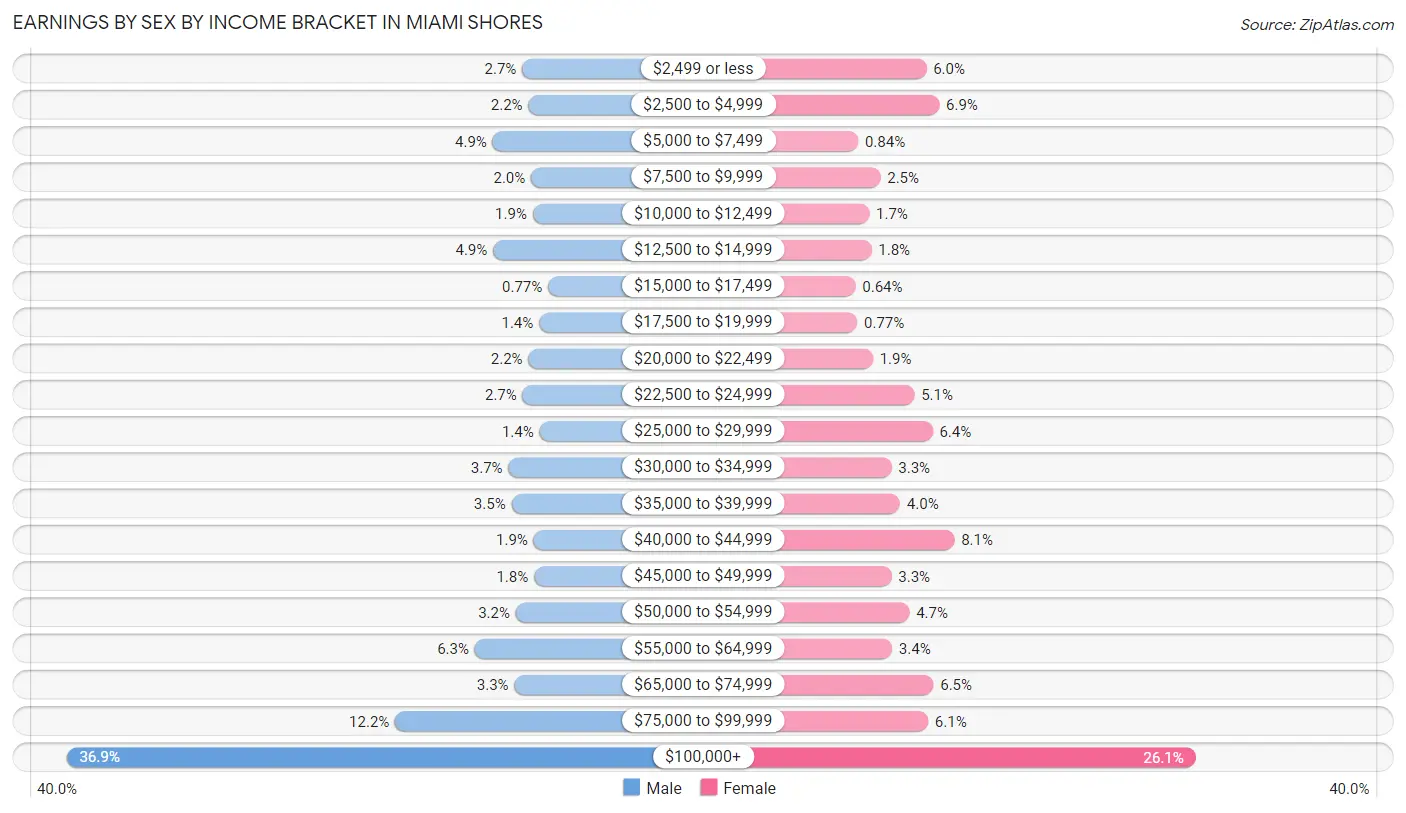
Earnings by Sex by Income Bracket in Miami Shores
The most common earnings brackets in Miami Shores are $100,000+ for men (1,154 | 36.9%) and $100,000+ for women (782 | 26.1%).
| Income | Male | Female |
| $2,499 or less | 85 (2.7%) | 178 (5.9%) |
| $2,500 to $4,999 | 70 (2.2%) | 207 (6.9%) |
| $5,000 to $7,499 | 154 (4.9%) | 25 (0.8%) |
| $7,500 to $9,999 | 64 (2.0%) | 75 (2.5%) |
| $10,000 to $12,499 | 60 (1.9%) | 50 (1.7%) |
| $12,500 to $14,999 | 153 (4.9%) | 55 (1.8%) |
| $15,000 to $17,499 | 24 (0.8%) | 19 (0.6%) |
| $17,500 to $19,999 | 45 (1.4%) | 23 (0.8%) |
| $20,000 to $22,499 | 70 (2.2%) | 58 (1.9%) |
| $22,500 to $24,999 | 84 (2.7%) | 151 (5.1%) |
| $25,000 to $29,999 | 44 (1.4%) | 192 (6.4%) |
| $30,000 to $34,999 | 117 (3.7%) | 100 (3.3%) |
| $35,000 to $39,999 | 110 (3.5%) | 119 (4.0%) |
| $40,000 to $44,999 | 58 (1.8%) | 241 (8.1%) |
| $45,000 to $49,999 | 57 (1.8%) | 100 (3.3%) |
| $50,000 to $54,999 | 100 (3.2%) | 140 (4.7%) |
| $55,000 to $64,999 | 196 (6.3%) | 101 (3.4%) |
| $65,000 to $74,999 | 103 (3.3%) | 194 (6.5%) |
| $75,000 to $99,999 | 383 (12.2%) | 182 (6.1%) |
| $100,000+ | 1,154 (36.9%) | 782 (26.1%) |
| Total | 3,131 (100.0%) | 2,992 (100.0%) |
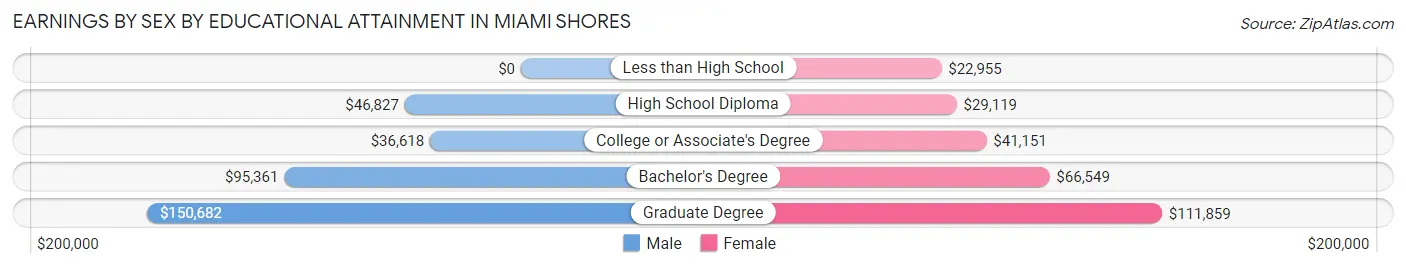
Earnings by Sex by Educational Attainment in Miami Shores
Average earnings in Miami Shores are $81,696 for men and $57,361 for women, a difference of 29.8%. Men with an educational attainment of graduate degree enjoy the highest average annual earnings of $150,682, while those with college or associate's degree education earn the least with $36,618. Women with an educational attainment of graduate degree earn the most with the average annual earnings of $111,859, while those with less than high school education have the smallest earnings of $22,955.
| Educational Attainment | Male Income | Female Income |
| Less than High School | - | - |
| High School Diploma | $46,827 | $29,119 |
| College or Associate's Degree | $36,618 | $41,151 |
| Bachelor's Degree | $95,361 | $66,549 |
| Graduate Degree | $150,682 | $111,859 |
| Total | $81,696 | $57,361 |
Family Income in Miami Shores
Family Income Brackets in Miami Shores
According to the Miami Shores family income data, there are 892 families falling into the $200,000+ income range, which is the most common income bracket and makes up 34.9% of all families. Conversely, the less than $10,000 income bracket is the least frequent group with only 20 families (0.8%) belonging to this category.
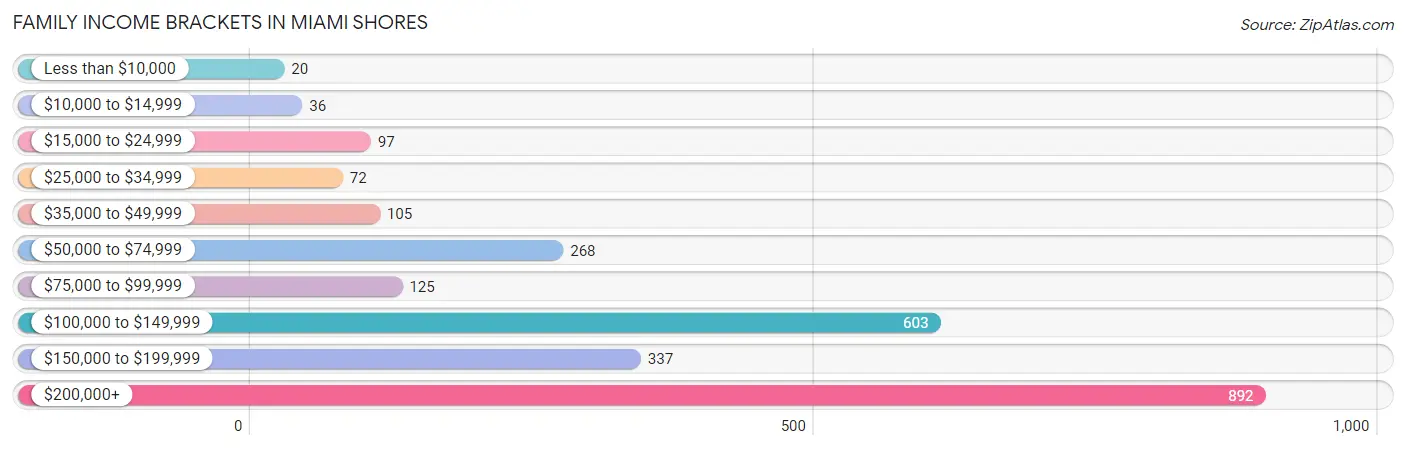
| Income Bracket | # Families | % Families |
| Less than $10,000 | 20 | 0.8% |
| $10,000 to $14,999 | 36 | 1.4% |
| $15,000 to $24,999 | 97 | 3.8% |
| $25,000 to $34,999 | 72 | 2.8% |
| $35,000 to $49,999 | 105 | 4.1% |
| $50,000 to $74,999 | 268 | 10.5% |
| $75,000 to $99,999 | 125 | 4.9% |
| $100,000 to $149,999 | 603 | 23.6% |
| $150,000 to $199,999 | 337 | 13.2% |
| $200,000+ | 892 | 34.9% |
Family Income by Famaliy Size in Miami Shores
5-person families (209 | 8.2%) account for the highest median family income in Miami Shores with $250,001 per family, while 2-person families (1,122 | 43.9%) have the highest median income of $61,700 per family member.
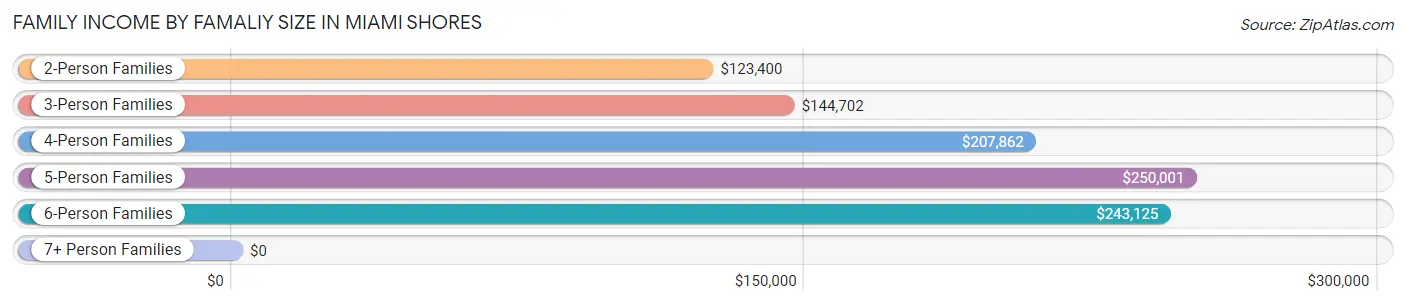
| Income Bracket | # Families | Median Income |
| 2-Person Families | 1,122 (43.9%) | $123,400 |
| 3-Person Families | 597 (23.4%) | $144,702 |
| 4-Person Families | 517 (20.2%) | $207,862 |
| 5-Person Families | 209 (8.2%) | $250,001 |
| 6-Person Families | 95 (3.7%) | $243,125 |
| 7+ Person Families | 15 (0.6%) | $0 |
| Total | 2,555 (100.0%) | $144,375 |
Family Income by Number of Earners in Miami Shores
The median family income in Miami Shores is $144,375, with families comprising 2 earners (1,409) having the highest median family income of $169,904, while families with no earners (256) have the lowest median family income of $67,105, accounting for 55.1% and 10.0% of families, respectively.
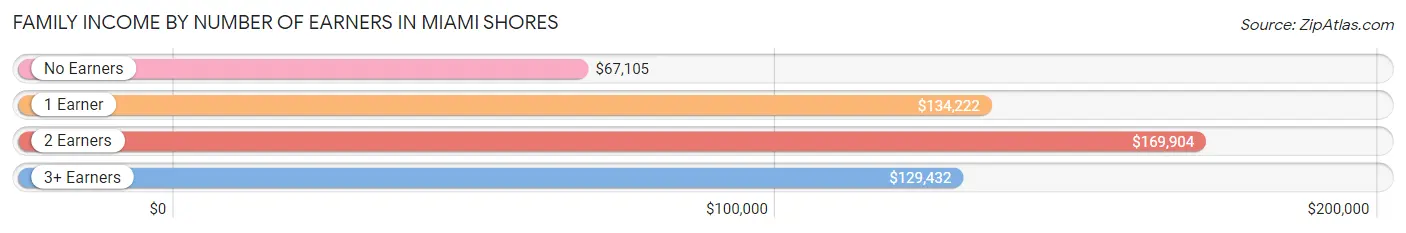
| Number of Earners | # Families | Median Income |
| No Earners | 256 (10.0%) | $67,105 |
| 1 Earner | 677 (26.5%) | $134,222 |
| 2 Earners | 1,409 (55.1%) | $169,904 |
| 3+ Earners | 213 (8.3%) | $129,432 |
| Total | 2,555 (100.0%) | $144,375 |
Household Income in Miami Shores
Household Income Brackets in Miami Shores
With 1,108 households falling in the category, the $200,000+ income range is the most frequent in Miami Shores, accounting for 29.5% of all households. In contrast, only 34 households (0.9%) fall into the less than $10,000 income bracket, making it the least populous group.
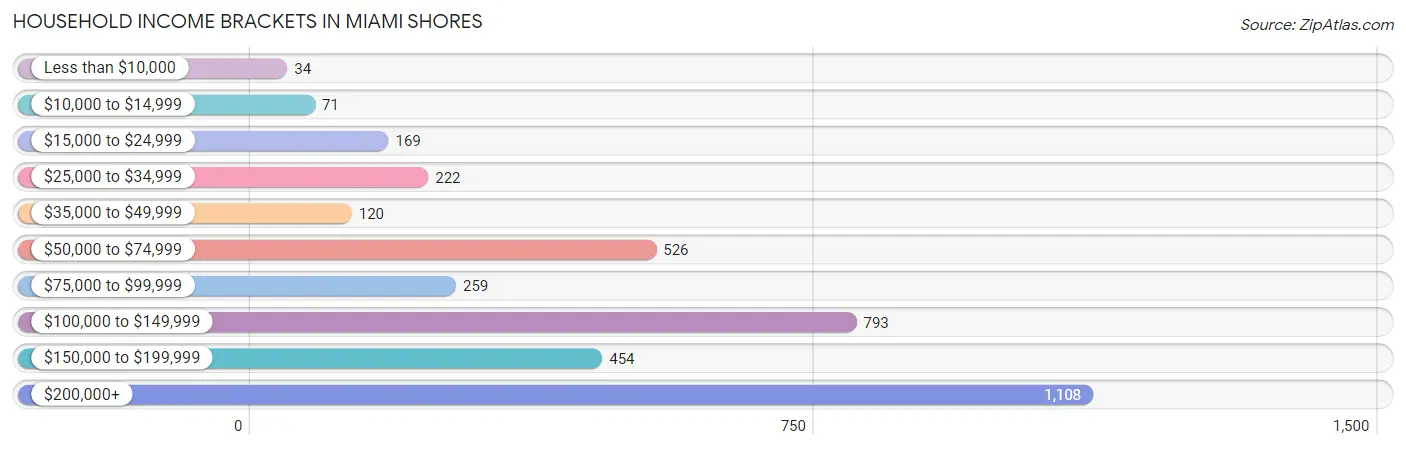
| Income Bracket | # Households | % Households |
| Less than $10,000 | 34 | 0.9% |
| $10,000 to $14,999 | 71 | 1.9% |
| $15,000 to $24,999 | 169 | 4.5% |
| $25,000 to $34,999 | 222 | 5.9% |
| $35,000 to $49,999 | 120 | 3.2% |
| $50,000 to $74,999 | 526 | 14.0% |
| $75,000 to $99,999 | 259 | 6.9% |
| $100,000 to $149,999 | 793 | 21.1% |
| $150,000 to $199,999 | 454 | 12.1% |
| $200,000+ | 1,108 | 29.5% |
Household Income by Householder Age in Miami Shores
The median household income in Miami Shores is $120,833, with the highest median household income of $165,536 found in the 25 to 44 years age bracket for the primary householder. A total of 883 households (23.5%) fall into this category. Meanwhile, the 15 to 24 years age bracket for the primary householder has the lowest median household income of $0, with 23 households (0.6%) in this group.
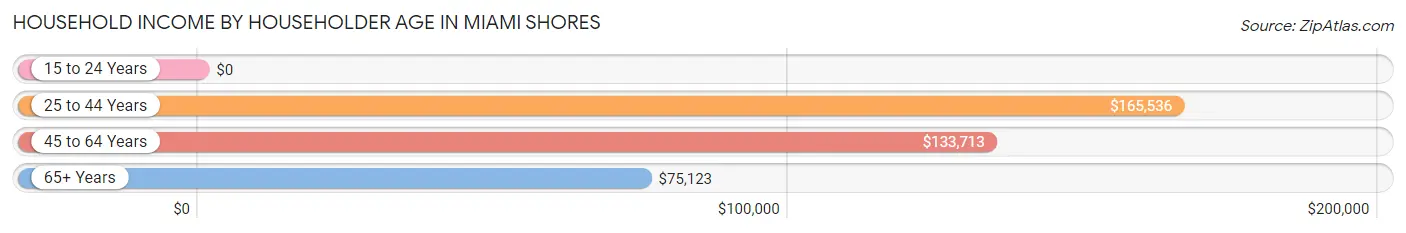
| Income Bracket | # Households | Median Income |
| 15 to 24 Years | 23 (0.6%) | $0 |
| 25 to 44 Years | 883 (23.5%) | $165,536 |
| 45 to 64 Years | 2,045 (54.4%) | $133,713 |
| 65+ Years | 805 (21.4%) | $75,123 |
| Total | 3,756 (100.0%) | $120,833 |
Poverty in Miami Shores
Income Below Poverty by Sex and Age in Miami Shores
With 5.4% poverty level for males and 9.3% for females among the residents of Miami Shores, 75 year old and over males and 75 year old and over females are the most vulnerable to poverty, with 64 males (27.8%) and 72 females (22.9%) in their respective age groups living below the poverty level.
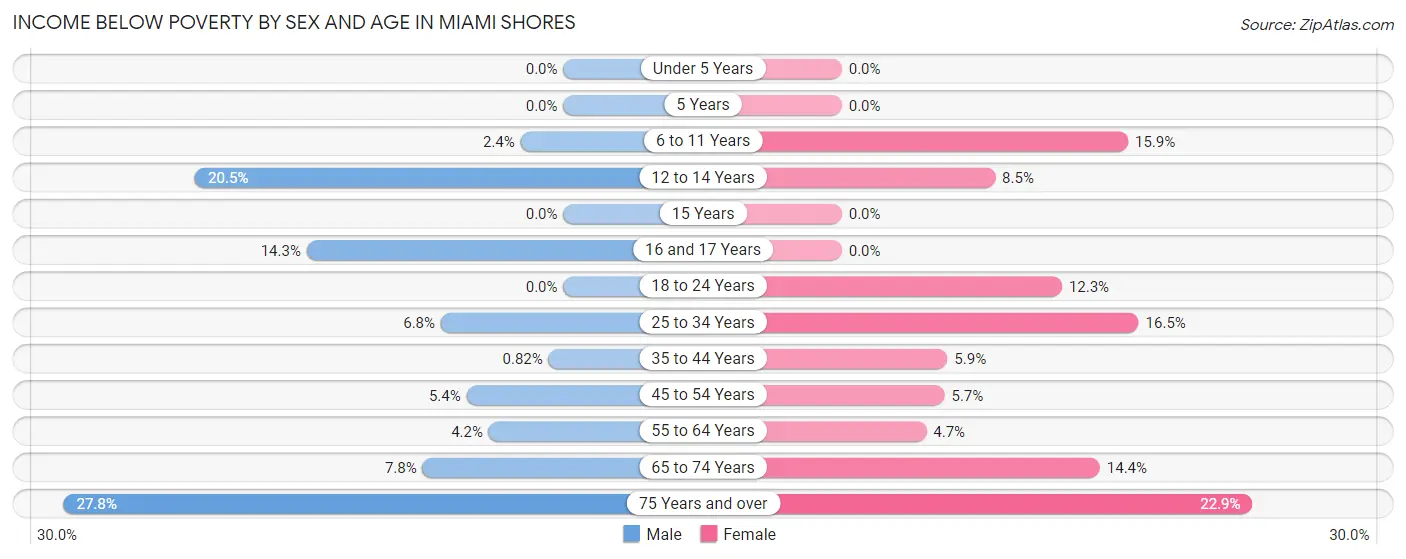
| Age Bracket | Male | Female |
| Under 5 Years | 0 (0.0%) | 0 (0.0%) |
| 5 Years | 0 (0.0%) | 0 (0.0%) |
| 6 to 11 Years | 5 (2.4%) | 84 (15.9%) |
| 12 to 14 Years | 33 (20.5%) | 7 (8.5%) |
| 15 Years | 0 (0.0%) | 0 (0.0%) |
| 16 and 17 Years | 7 (14.3%) | 0 (0.0%) |
| 18 to 24 Years | 0 (0.0%) | 44 (12.3%) |
| 25 to 34 Years | 30 (6.8%) | 100 (16.5%) |
| 35 to 44 Years | 6 (0.8%) | 38 (5.9%) |
| 45 to 54 Years | 39 (5.4%) | 43 (5.7%) |
| 55 to 64 Years | 41 (4.2%) | 38 (4.7%) |
| 65 to 74 Years | 36 (7.8%) | 73 (14.4%) |
| 75 Years and over | 64 (27.8%) | 72 (22.9%) |
| Total | 261 (5.4%) | 499 (9.3%) |
Income Above Poverty by Sex and Age in Miami Shores
According to the poverty statistics in Miami Shores, males aged under 5 years and females aged under 5 years are the age groups that are most secure financially, with 100.0% of males and 100.0% of females in these age groups living above the poverty line.
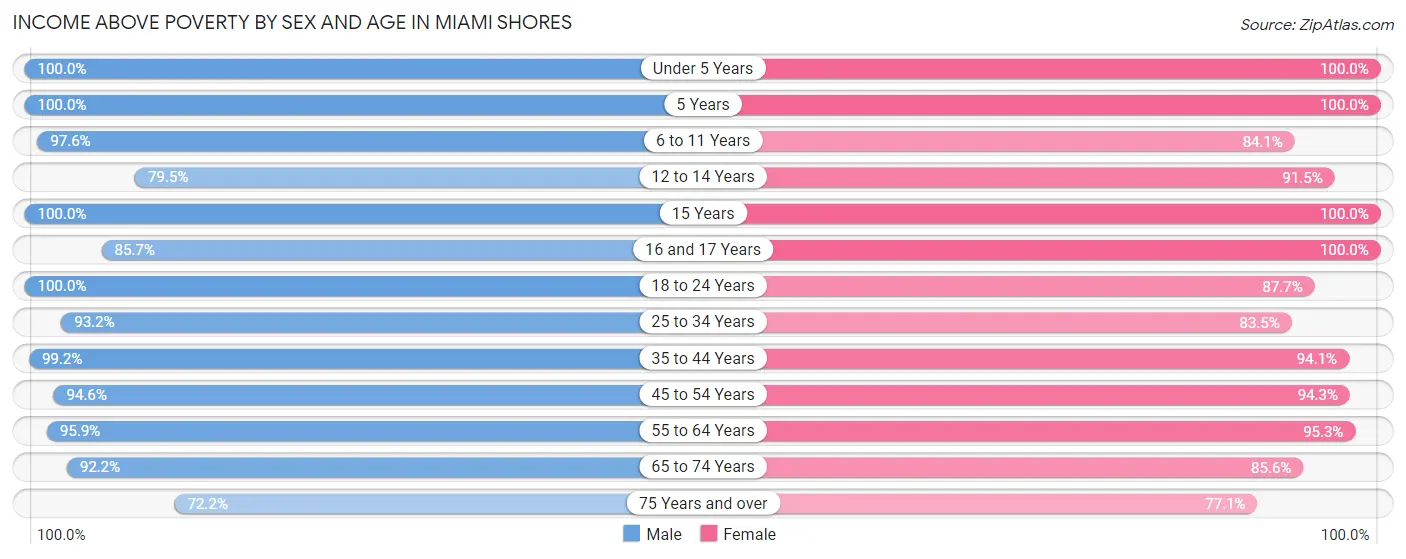
| Age Bracket | Male | Female |
| Under 5 Years | 470 (100.0%) | 483 (100.0%) |
| 5 Years | 91 (100.0%) | 25 (100.0%) |
| 6 to 11 Years | 205 (97.6%) | 443 (84.1%) |
| 12 to 14 Years | 128 (79.5%) | 75 (91.5%) |
| 15 Years | 28 (100.0%) | 90 (100.0%) |
| 16 and 17 Years | 42 (85.7%) | 150 (100.0%) |
| 18 to 24 Years | 274 (100.0%) | 315 (87.7%) |
| 25 to 34 Years | 410 (93.2%) | 505 (83.5%) |
| 35 to 44 Years | 726 (99.2%) | 608 (94.1%) |
| 45 to 54 Years | 685 (94.6%) | 709 (94.3%) |
| 55 to 64 Years | 948 (95.9%) | 769 (95.3%) |
| 65 to 74 Years | 423 (92.2%) | 435 (85.6%) |
| 75 Years and over | 166 (72.2%) | 243 (77.1%) |
| Total | 4,596 (94.6%) | 4,850 (90.7%) |
Income Below Poverty Among Married-Couple Families in Miami Shores
The poverty statistics for married-couple families in Miami Shores show that 2.1% or 43 of the total 1,997 families live below the poverty line. Families with 1 or 2 children have the highest poverty rate of 6.7%, comprising of 38 families. On the other hand, families with no children have the lowest poverty rate of 0.0%, which includes 0 families.
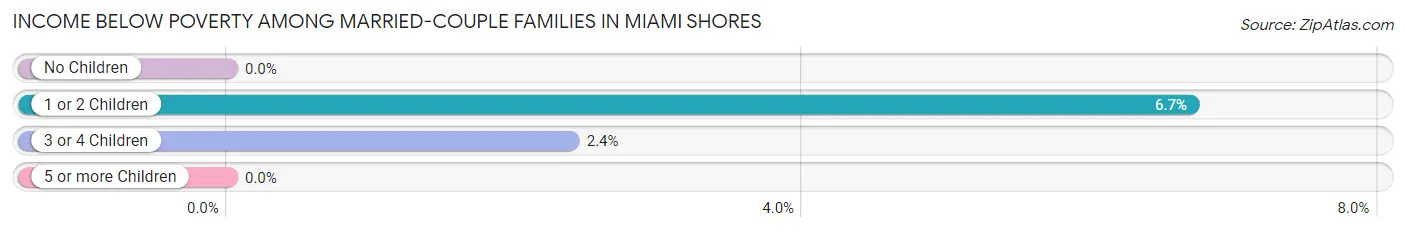
| Children | Above Poverty | Below Poverty |
| No Children | 1,218 (100.0%) | 0 (0.0%) |
| 1 or 2 Children | 530 (93.3%) | 38 (6.7%) |
| 3 or 4 Children | 205 (97.6%) | 5 (2.4%) |
| 5 or more Children | 1 (100.0%) | 0 (0.0%) |
| Total | 1,954 (97.9%) | 43 (2.1%) |
Income Below Poverty Among Single-Parent Households in Miami Shores
According to the poverty data in Miami Shores, 12.9% or 30 single-father households and 17.5% or 57 single-mother households are living below the poverty line. Among single-father households, those with 1 or 2 children have the highest poverty rate, with 30 households (42.2%) experiencing poverty. Likewise, among single-mother households, those with no children have the highest poverty rate, with 57 households (26.2%) falling below the poverty line.
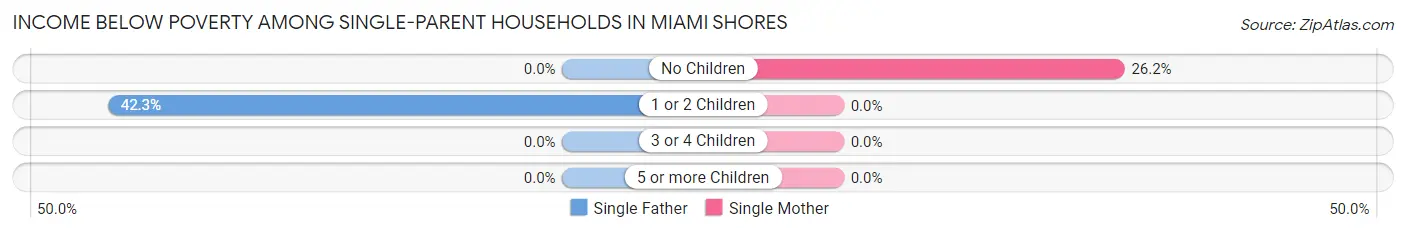
| Children | Single Father | Single Mother |
| No Children | 0 (0.0%) | 57 (26.2%) |
| 1 or 2 Children | 30 (42.2%) | 0 (0.0%) |
| 3 or 4 Children | 0 (0.0%) | 0 (0.0%) |
| 5 or more Children | 0 (0.0%) | 0 (0.0%) |
| Total | 30 (12.9%) | 57 (17.5%) |
Income Below Poverty Among Married-Couple vs Single-Parent Households in Miami Shores
The poverty data for Miami Shores shows that 43 of the married-couple family households (2.1%) and 87 of the single-parent households (15.6%) are living below the poverty level. Within the married-couple family households, those with 1 or 2 children have the highest poverty rate, with 38 households (6.7%) falling below the poverty line. Among the single-parent households, those with 1 or 2 children have the highest poverty rate, with 30 household (16.9%) living below poverty.
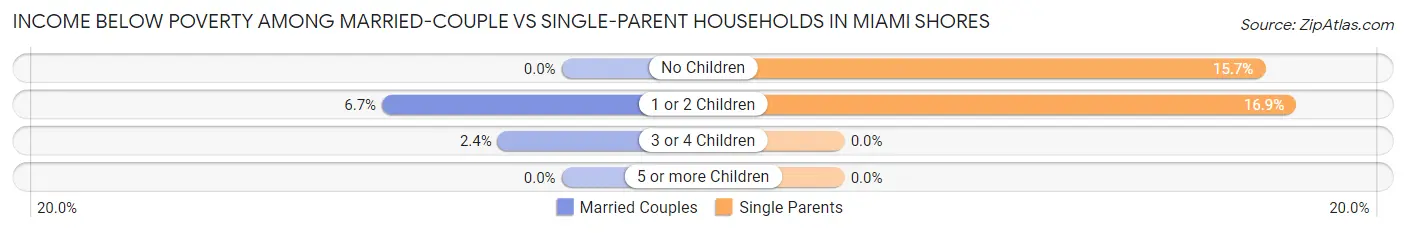
| Children | Married-Couple Families | Single-Parent Households |
| No Children | 0 (0.0%) | 57 (15.7%) |
| 1 or 2 Children | 38 (6.7%) | 30 (16.9%) |
| 3 or 4 Children | 5 (2.4%) | 0 (0.0%) |
| 5 or more Children | 0 (0.0%) | 0 (0.0%) |
| Total | 43 (2.1%) | 87 (15.6%) |
Race in Miami Shores
The most populous races in Miami Shores are White / Caucasian (6,670 | 57.3%), Hispanic or Latino (3,965 | 34.1%), and Black / African American (1,917 | 16.5%).
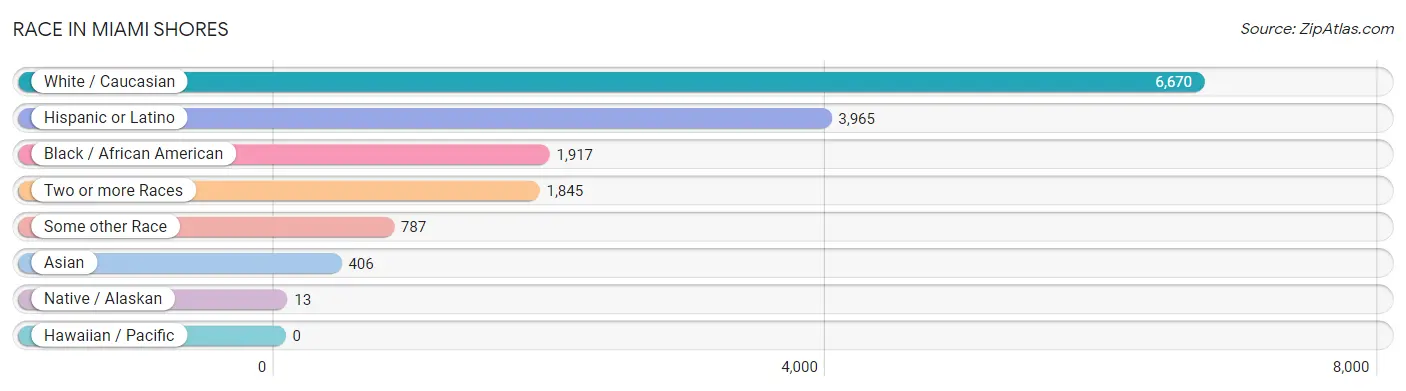
| Race | # Population | % Population |
| Asian | 406 | 3.5% |
| Black / African American | 1,917 | 16.5% |
| Hawaiian / Pacific | 0 | 0.0% |
| Hispanic or Latino | 3,965 | 34.1% |
| Native / Alaskan | 13 | 0.1% |
| White / Caucasian | 6,670 | 57.3% |
| Two or more Races | 1,845 | 15.9% |
| Some other Race | 787 | 6.8% |
| Total | 11,638 | 100.0% |
Ancestry in Miami Shores
The most populous ancestries reported in Miami Shores are South American (1,453 | 12.5%), Irish (1,217 | 10.5%), Cuban (1,003 | 8.6%), English (944 | 8.1%), and Haitian (911 | 7.8%), together accounting for 47.5% of all Miami Shores residents.
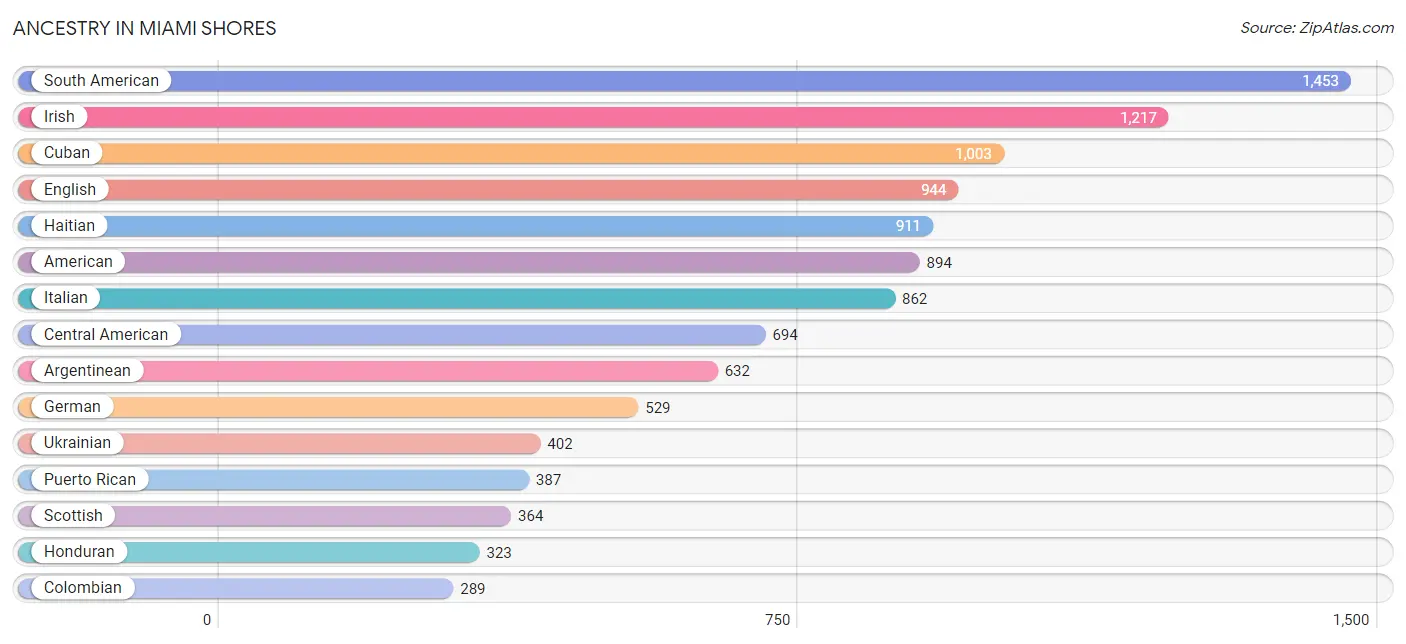
| Ancestry | # Population | % Population |
| African | 10 | 0.1% |
| Albanian | 8 | 0.1% |
| American | 894 | 7.7% |
| Arab | 94 | 0.8% |
| Argentinean | 632 | 5.4% |
| Assyrian / Chaldean / Syriac | 8 | 0.1% |
| Austrian | 72 | 0.6% |
| Bahamian | 17 | 0.2% |
| Bhutanese | 21 | 0.2% |
| Blackfeet | 13 | 0.1% |
| Brazilian | 86 | 0.7% |
| British | 50 | 0.4% |
| Burmese | 5 | 0.0% |
| Canadian | 20 | 0.2% |
| Central American | 694 | 6.0% |
| Chilean | 38 | 0.3% |
| Colombian | 289 | 2.5% |
| Costa Rican | 14 | 0.1% |
| Croatian | 4 | 0.0% |
| Cuban | 1,003 | 8.6% |
| Czech | 17 | 0.2% |
| Czechoslovakian | 1 | 0.0% |
| Danish | 50 | 0.4% |
| Dominican | 57 | 0.5% |
| Dutch | 29 | 0.3% |
| Eastern European | 76 | 0.6% |
| Ecuadorian | 97 | 0.8% |
| English | 944 | 8.1% |
| European | 142 | 1.2% |
| French | 162 | 1.4% |
| French Canadian | 20 | 0.2% |
| German | 529 | 4.5% |
| Greek | 32 | 0.3% |
| Guatemalan | 56 | 0.5% |
| Haitian | 911 | 7.8% |
| Honduran | 323 | 2.8% |
| Hungarian | 49 | 0.4% |
| Indian (Asian) | 44 | 0.4% |
| Irish | 1,217 | 10.5% |
| Israeli | 71 | 0.6% |
| Italian | 862 | 7.4% |
| Jamaican | 124 | 1.1% |
| Korean | 153 | 1.3% |
| Lebanese | 37 | 0.3% |
| Lithuanian | 53 | 0.5% |
| Mexican | 152 | 1.3% |
| New Zealander | 7 | 0.1% |
| Nicaraguan | 221 | 1.9% |
| Nigerian | 19 | 0.2% |
| Northern European | 19 | 0.2% |
| Norwegian | 43 | 0.4% |
| Palestinian | 5 | 0.0% |
| Paraguayan | 6 | 0.1% |
| Peruvian | 164 | 1.4% |
| Polish | 169 | 1.5% |
| Portuguese | 33 | 0.3% |
| Puerto Rican | 387 | 3.3% |
| Russian | 145 | 1.3% |
| Salvadoran | 80 | 0.7% |
| Scandinavian | 19 | 0.2% |
| Scotch-Irish | 28 | 0.2% |
| Scottish | 364 | 3.1% |
| Serbian | 16 | 0.1% |
| Slovak | 14 | 0.1% |
| South African | 10 | 0.1% |
| South American | 1,453 | 12.5% |
| Spaniard | 74 | 0.6% |
| Sri Lankan | 256 | 2.2% |
| Subsaharan African | 39 | 0.3% |
| Swedish | 71 | 0.6% |
| Swiss | 16 | 0.1% |
| Syrian | 11 | 0.1% |
| Thai | 178 | 1.5% |
| Trinidadian and Tobagonian | 82 | 0.7% |
| Ukrainian | 402 | 3.5% |
| Uruguayan | 81 | 0.7% |
| Venezuelan | 146 | 1.3% |
| Welsh | 30 | 0.3% |
| West Indian | 4 | 0.0% | View All 79 Rows |
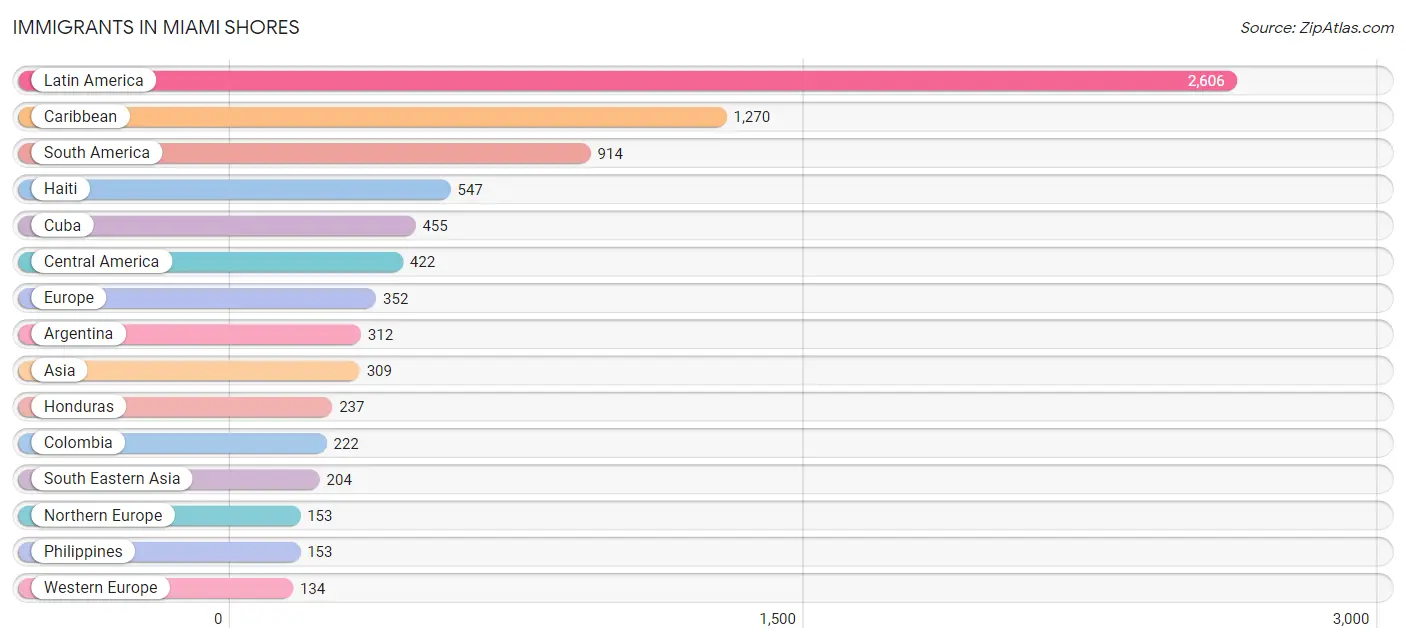
Immigrants in Miami Shores
The most numerous immigrant groups reported in Miami Shores came from Latin America (2,606 | 22.4%), Caribbean (1,270 | 10.9%), South America (914 | 7.9%), Haiti (547 | 4.7%), and Cuba (455 | 3.9%), together accounting for 49.8% of all Miami Shores residents.
| Immigration Origin | # Population | % Population |
| Africa | 19 | 0.2% |
| Argentina | 312 | 2.7% |
| Asia | 309 | 2.7% |
| Australia | 7 | 0.1% |
| Austria | 6 | 0.1% |
| Bahamas | 30 | 0.3% |
| Brazil | 77 | 0.7% |
| Canada | 35 | 0.3% |
| Caribbean | 1,270 | 10.9% |
| Central America | 422 | 3.6% |
| China | 19 | 0.2% |
| Colombia | 222 | 1.9% |
| Costa Rica | 14 | 0.1% |
| Cuba | 455 | 3.9% |
| Dominican Republic | 67 | 0.6% |
| Eastern Asia | 45 | 0.4% |
| Eastern Europe | 7 | 0.1% |
| Ecuador | 20 | 0.2% |
| El Salvador | 21 | 0.2% |
| England | 43 | 0.4% |
| Europe | 352 | 3.0% |
| France | 36 | 0.3% |
| Germany | 92 | 0.8% |
| Guatemala | 21 | 0.2% |
| Haiti | 547 | 4.7% |
| Honduras | 237 | 2.0% |
| Hungary | 3 | 0.0% |
| India | 60 | 0.5% |
| Ireland | 2 | 0.0% |
| Italy | 14 | 0.1% |
| Jamaica | 89 | 0.8% |
| Japan | 21 | 0.2% |
| Korea | 5 | 0.0% |
| Latin America | 2,606 | 22.4% |
| Mexico | 24 | 0.2% |
| Nicaragua | 82 | 0.7% |
| Nigeria | 1 | 0.0% |
| Northern Europe | 153 | 1.3% |
| Norway | 6 | 0.1% |
| Oceania | 14 | 0.1% |
| Panama | 23 | 0.2% |
| Peru | 116 | 1.0% |
| Philippines | 153 | 1.3% |
| South America | 914 | 7.9% |
| South Central Asia | 60 | 0.5% |
| South Eastern Asia | 204 | 1.8% |
| Southern Europe | 58 | 0.5% |
| Spain | 44 | 0.4% |
| Trinidad and Tobago | 82 | 0.7% |
| Ukraine | 4 | 0.0% |
| Uruguay | 32 | 0.3% |
| Venezuela | 129 | 1.1% |
| Vietnam | 51 | 0.4% |
| Western Africa | 19 | 0.2% |
| Western Europe | 134 | 1.1% | View All 55 Rows |
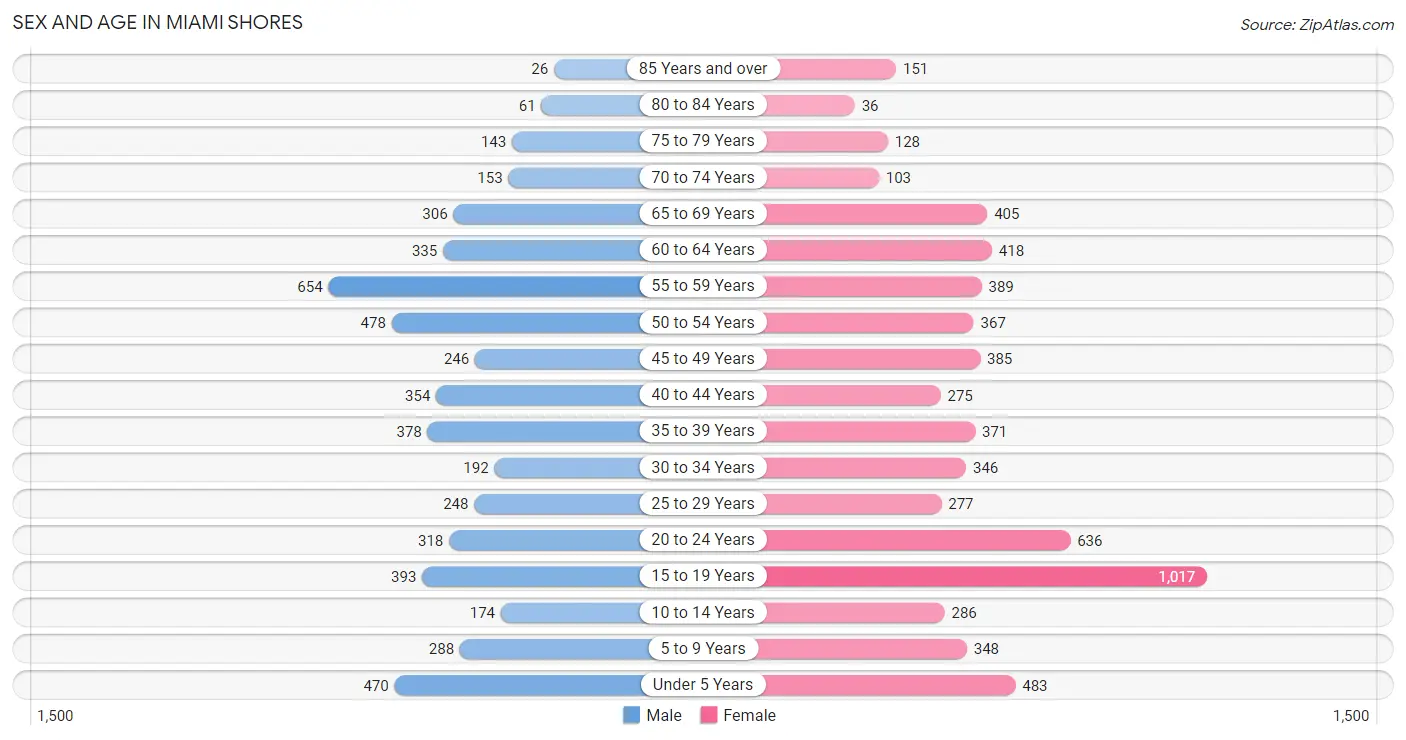
Sex and Age in Miami Shores
Sex and Age in Miami Shores
The most populous age groups in Miami Shores are 55 to 59 Years (654 | 12.5%) for men and 15 to 19 Years (1,017 | 15.8%) for women.
| Age Bracket | Male | Female |
| Under 5 Years | 470 (9.0%) | 483 (7.5%) |
| 5 to 9 Years | 288 (5.5%) | 348 (5.4%) |
| 10 to 14 Years | 174 (3.3%) | 286 (4.4%) |
| 15 to 19 Years | 393 (7.5%) | 1,017 (15.8%) |
| 20 to 24 Years | 318 (6.1%) | 636 (9.9%) |
| 25 to 29 Years | 248 (4.8%) | 277 (4.3%) |
| 30 to 34 Years | 192 (3.7%) | 346 (5.4%) |
| 35 to 39 Years | 378 (7.2%) | 371 (5.8%) |
| 40 to 44 Years | 354 (6.8%) | 275 (4.3%) |
| 45 to 49 Years | 246 (4.7%) | 385 (6.0%) |
| 50 to 54 Years | 478 (9.2%) | 367 (5.7%) |
| 55 to 59 Years | 654 (12.5%) | 389 (6.1%) |
| 60 to 64 Years | 335 (6.4%) | 418 (6.5%) |
| 65 to 69 Years | 306 (5.9%) | 405 (6.3%) |
| 70 to 74 Years | 153 (2.9%) | 103 (1.6%) |
| 75 to 79 Years | 143 (2.7%) | 128 (2.0%) |
| 80 to 84 Years | 61 (1.2%) | 36 (0.6%) |
| 85 Years and over | 26 (0.5%) | 151 (2.4%) |
| Total | 5,217 (100.0%) | 6,421 (100.0%) |
Families and Households in Miami Shores
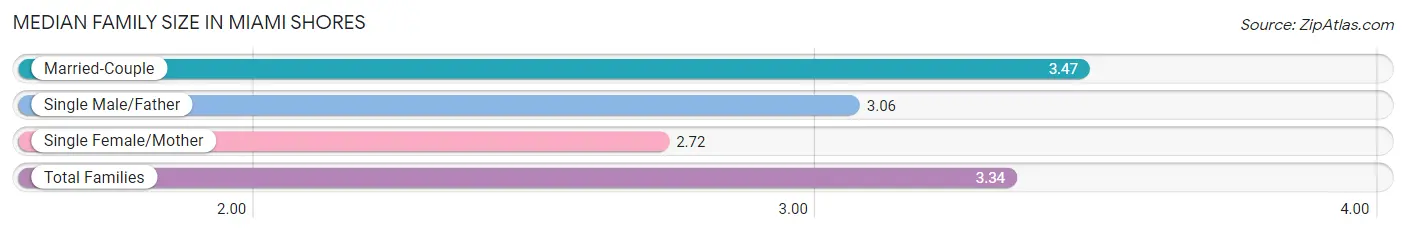
Median Family Size in Miami Shores
The median family size in Miami Shores is 3.34 persons per family, with married-couple families (1,997 | 78.2%) accounting for the largest median family size of 3.47 persons per family. On the other hand, single female/mother families (325 | 12.7%) represent the smallest median family size with 2.72 persons per family.
| Family Type | # Families | Family Size |
| Married-Couple | 1,997 (78.2%) | 3.47 |
| Single Male/Father | 233 (9.1%) | 3.06 |
| Single Female/Mother | 325 (12.7%) | 2.72 |
| Total Families | 2,555 (100.0%) | 3.34 |
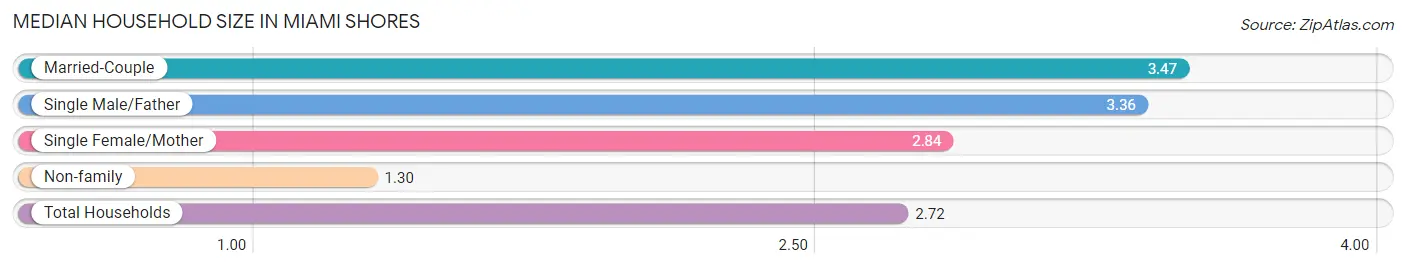
Median Household Size in Miami Shores
The median household size in Miami Shores is 2.72 persons per household, with married-couple households (1,997 | 53.2%) accounting for the largest median household size of 3.47 persons per household. non-family households (1,201 | 32.0%) represent the smallest median household size with 1.30 persons per household.
| Household Type | # Households | Household Size |
| Married-Couple | 1,997 (53.2%) | 3.47 |
| Single Male/Father | 233 (6.2%) | 3.36 |
| Single Female/Mother | 325 (8.6%) | 2.84 |
| Non-family | 1,201 (32.0%) | 1.30 |
| Total Households | 3,756 (100.0%) | 2.72 |
Household Size by Marriage Status in Miami Shores
Out of a total of 3,756 households in Miami Shores, 2,555 (68.0%) are family households, while 1,201 (32.0%) are nonfamily households. The most numerous type of family households are 2-person households, comprising 1,079, and the most common type of nonfamily households are 1-person households, comprising 916.
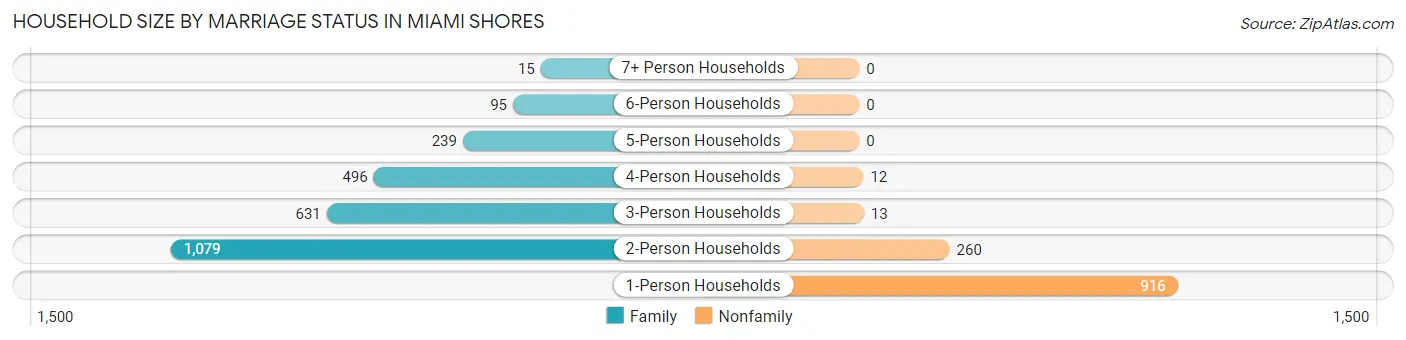
| Household Size | Family Households | Nonfamily Households |
| 1-Person Households | - | 916 (24.4%) |
| 2-Person Households | 1,079 (28.7%) | 260 (6.9%) |
| 3-Person Households | 631 (16.8%) | 13 (0.4%) |
| 4-Person Households | 496 (13.2%) | 12 (0.3%) |
| 5-Person Households | 239 (6.4%) | 0 (0.0%) |
| 6-Person Households | 95 (2.5%) | 0 (0.0%) |
| 7+ Person Households | 15 (0.4%) | 0 (0.0%) |
| Total | 2,555 (68.0%) | 1,201 (32.0%) |
Female Fertility in Miami Shores
Fertility by Age in Miami Shores
Average fertility rate in Miami Shores is 45.0 births per 1,000 women. Women in the age bracket of 35 to 50 years have the highest fertility rate with 110.0 births per 1,000 women. Women in the age bracket of 35 to 50 years acount for 80.8% of all women with births.
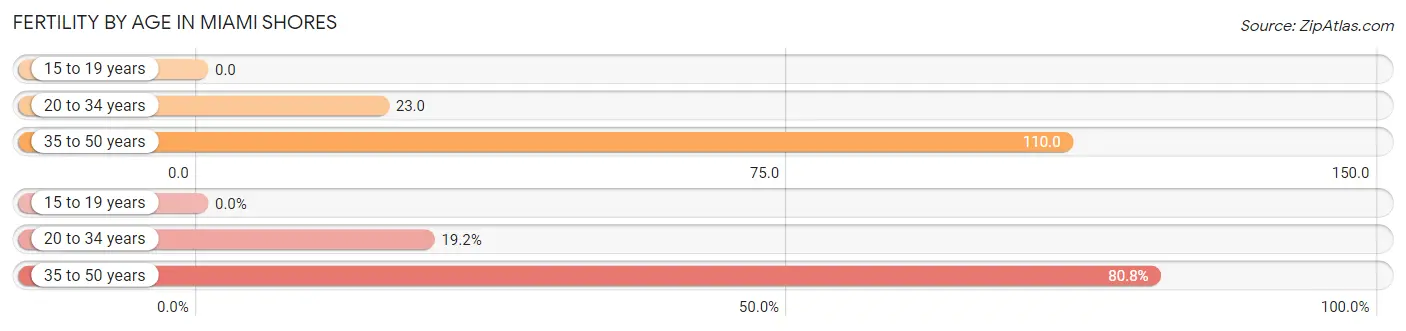
| Age Bracket | Women with Births | Births / 1,000 Women |
| 15 to 19 years | 0 (0.0%) | 0.0 |
| 20 to 34 years | 29 (19.2%) | 23.0 |
| 35 to 50 years | 122 (80.8%) | 110.0 |
| Total | 151 (100.0%) | 45.0 |
Fertility by Age by Marriage Status in Miami Shores
96.0% of women with births (151) in Miami Shores are married. The highest percentage of unmarried women with births falls into 20 to 34 years age bracket with 20.7% of them unmarried at the time of birth, while the lowest percentage of unmarried women with births belong to 35 to 50 years age bracket with 0.0% of them unmarried.
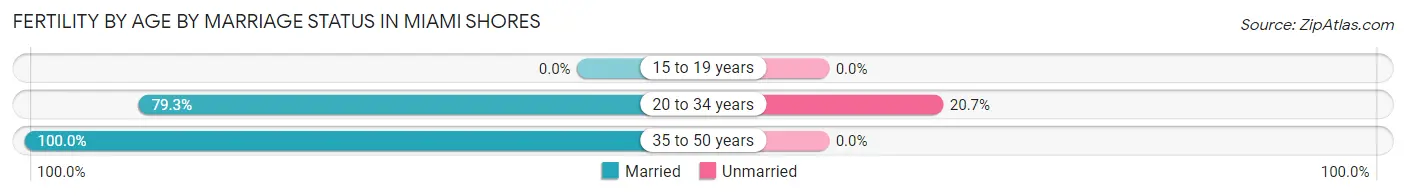
| Age Bracket | Married | Unmarried |
| 15 to 19 years | 0 (0.0%) | 0 (0.0%) |
| 20 to 34 years | 23 (79.3%) | 6 (20.7%) |
| 35 to 50 years | 122 (100.0%) | 0 (0.0%) |
| Total | 145 (96.0%) | 6 (4.0%) |
Fertility by Education in Miami Shores
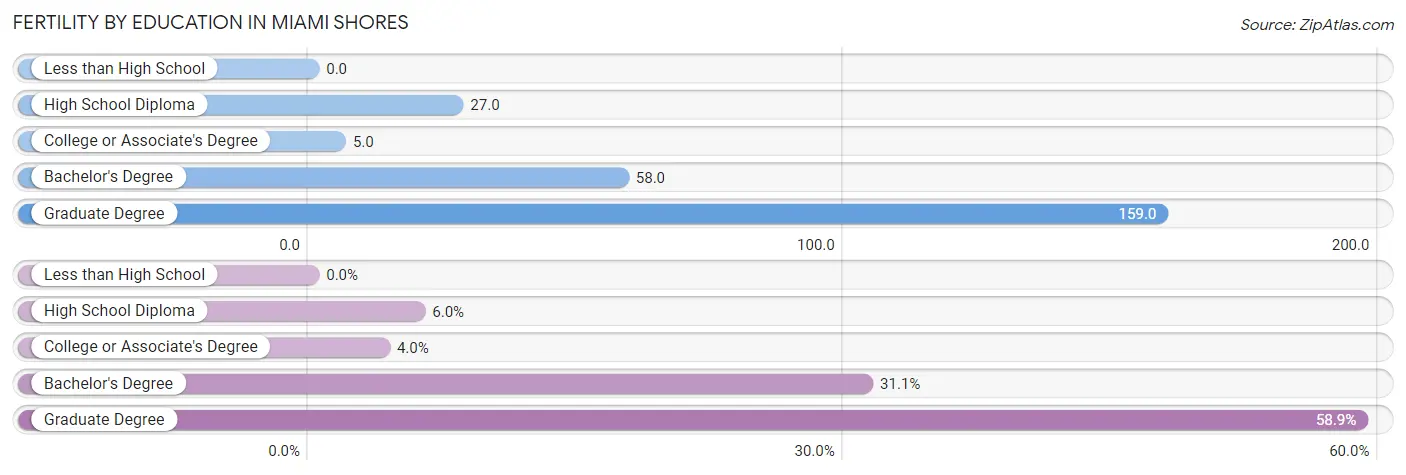
| Educational Attainment | Women with Births | Births / 1,000 Women |
| Less than High School | 0 (0.0%) | 0.0 |
| High School Diploma | 9 (6.0%) | 27.0 |
| College or Associate's Degree | 6 (4.0%) | 5.0 |
| Bachelor's Degree | 47 (31.1%) | 58.0 |
| Graduate Degree | 89 (58.9%) | 159.0 |
| Total | 151 (100.0%) | 45.0 |
Fertility by Education by Marriage Status in Miami Shores
4.0% of women with births in Miami Shores are unmarried. Women with the educational attainment of high school diploma are most likely to be married with 100.0% of them married at childbirth, while women with the educational attainment of college or associate's degree are least likely to be married with 100.0% of them unmarried at childbirth.
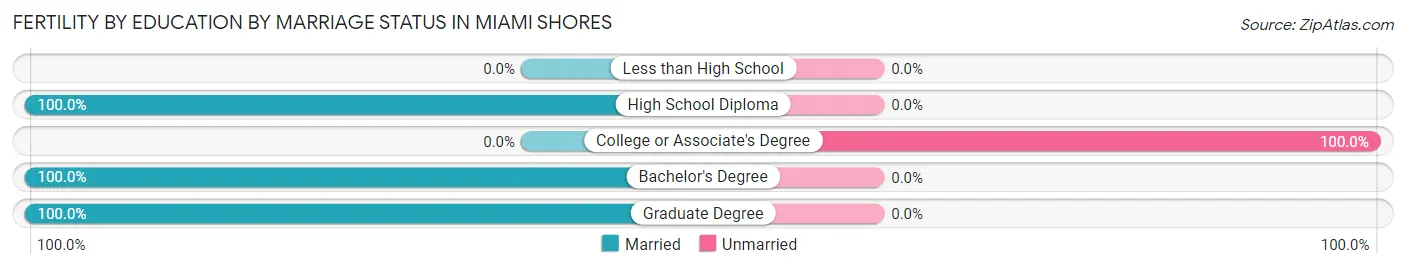
| Educational Attainment | Married | Unmarried |
| Less than High School | 0 (0.0%) | 0 (0.0%) |
| High School Diploma | 9 (100.0%) | 0 (0.0%) |
| College or Associate's Degree | 0 (0.0%) | 6 (100.0%) |
| Bachelor's Degree | 47 (100.0%) | 0 (0.0%) |
| Graduate Degree | 89 (100.0%) | 0 (0.0%) |
| Total | 145 (96.0%) | 6 (4.0%) |
Employment Characteristics in Miami Shores
Employment by Class of Employer in Miami Shores
Among the 5,418 employed individuals in Miami Shores, private company employees (3,260 | 60.2%), self-employed (incorporated) (784 | 14.5%), and self-employed (not incorporated) (408 | 7.5%) make up the most common classes of employment.
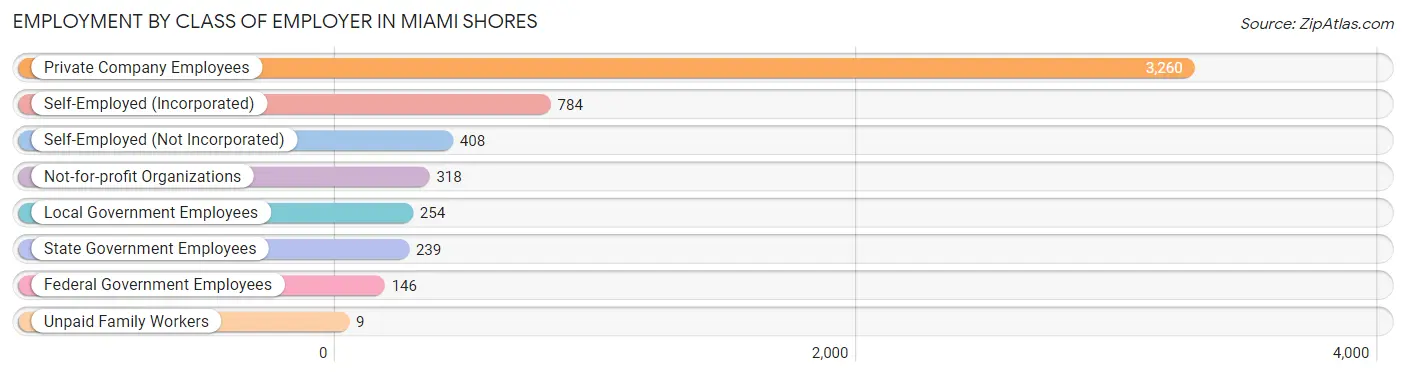
| Employer Class | # Employees | % Employees |
| Private Company Employees | 3,260 | 60.2% |
| Self-Employed (Incorporated) | 784 | 14.5% |
| Self-Employed (Not Incorporated) | 408 | 7.5% |
| Not-for-profit Organizations | 318 | 5.9% |
| Local Government Employees | 254 | 4.7% |
| State Government Employees | 239 | 4.4% |
| Federal Government Employees | 146 | 2.7% |
| Unpaid Family Workers | 9 | 0.2% |
| Total | 5,418 | 100.0% |
Employment Status by Age in Miami Shores
According to the labor force statistics for Miami Shores, out of the total population over 16 years of age (9,471), 62.9% or 5,957 individuals are in the labor force, with 7.0% or 417 of them unemployed. The age group with the highest labor force participation rate is 45 to 54 years, with 89.7% or 1,324 individuals in the labor force. Within the labor force, the 16 to 19 years age range has the highest percentage of unemployed individuals, with 46.0% or 157 of them being unemployed.
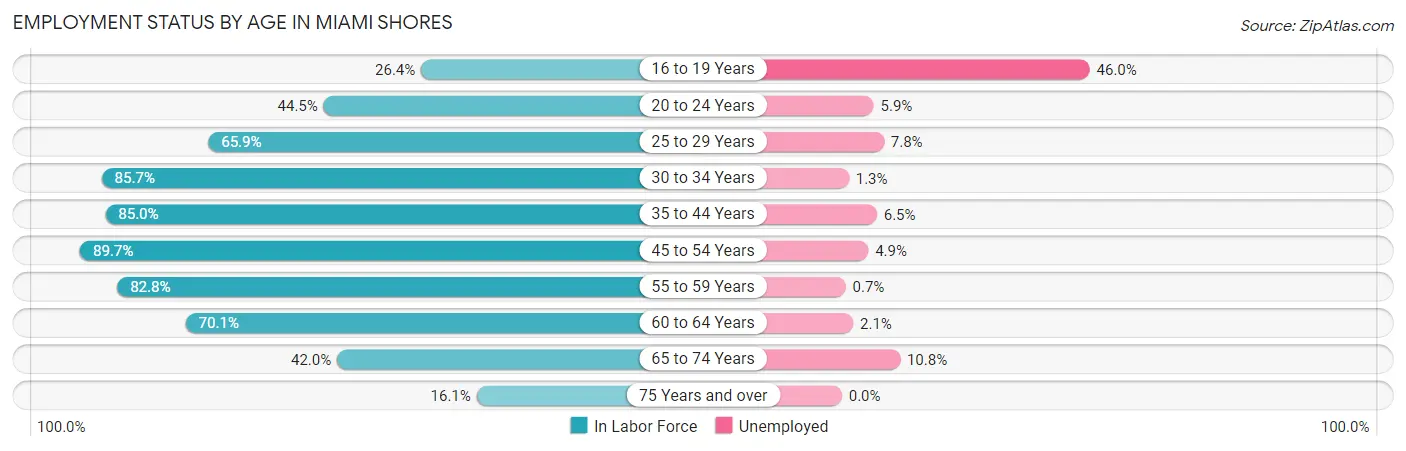
| Age Bracket | In Labor Force | Unemployed |
| 16 to 19 Years | 341 (26.4%) | 157 (46.0%) |
| 20 to 24 Years | 425 (44.5%) | 25 (5.9%) |
| 25 to 29 Years | 346 (65.9%) | 27 (7.8%) |
| 30 to 34 Years | 461 (85.7%) | 6 (1.3%) |
| 35 to 44 Years | 1,171 (85.0%) | 76 (6.5%) |
| 45 to 54 Years | 1,324 (89.7%) | 65 (4.9%) |
| 55 to 59 Years | 864 (82.8%) | 6 (0.7%) |
| 60 to 64 Years | 528 (70.1%) | 11 (2.1%) |
| 65 to 74 Years | 406 (42.0%) | 44 (10.8%) |
| 75 Years and over | 88 (16.1%) | 0 (0.0%) |
| Total | 5,957 (62.9%) | 417 (7.0%) |
Employment Status by Educational Attainment in Miami Shores
According to labor force statistics for Miami Shores, 82.2% of individuals (4,696) out of the total population between 25 and 64 years of age (5,713) are in the labor force, with 4.1% or 193 of them being unemployed. The group with the highest labor force participation rate are those with the educational attainment of bachelor's degree or higher, with 84.9% or 3,142 individuals in the labor force. Within the labor force, individuals with college / associate degree education have the highest percentage of unemployment, with 8.3% or 79 of them being unemployed.
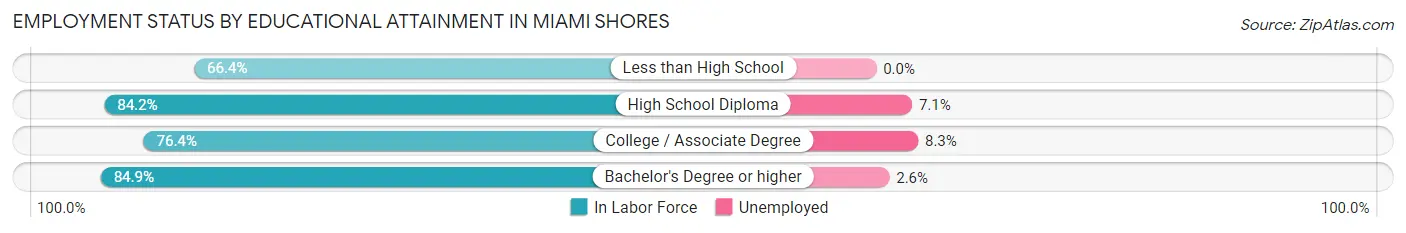
| Educational Attainment | In Labor Force | Unemployed |
| Less than High School | 164 (66.4%) | 0 (0.0%) |
| High School Diploma | 438 (84.2%) | 37 (7.1%) |
| College / Associate Degree | 951 (76.4%) | 103 (8.3%) |
| Bachelor's Degree or higher | 3,142 (84.9%) | 96 (2.6%) |
| Total | 4,696 (82.2%) | 234 (4.1%) |
Employment Occupations by Sex in Miami Shores
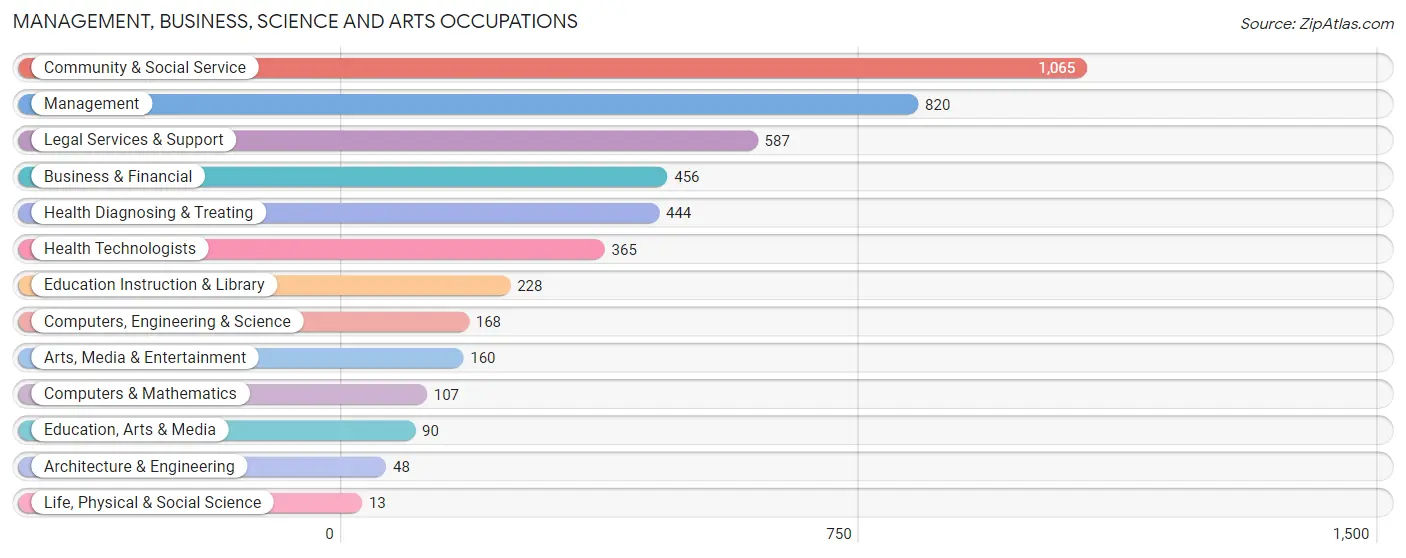
Management, Business, Science and Arts Occupations
The most common Management, Business, Science and Arts occupations in Miami Shores are Community & Social Service (1,065 | 19.2%), Management (820 | 14.8%), Legal Services & Support (587 | 10.6%), Business & Financial (456 | 8.2%), and Health Diagnosing & Treating (444 | 8.0%).
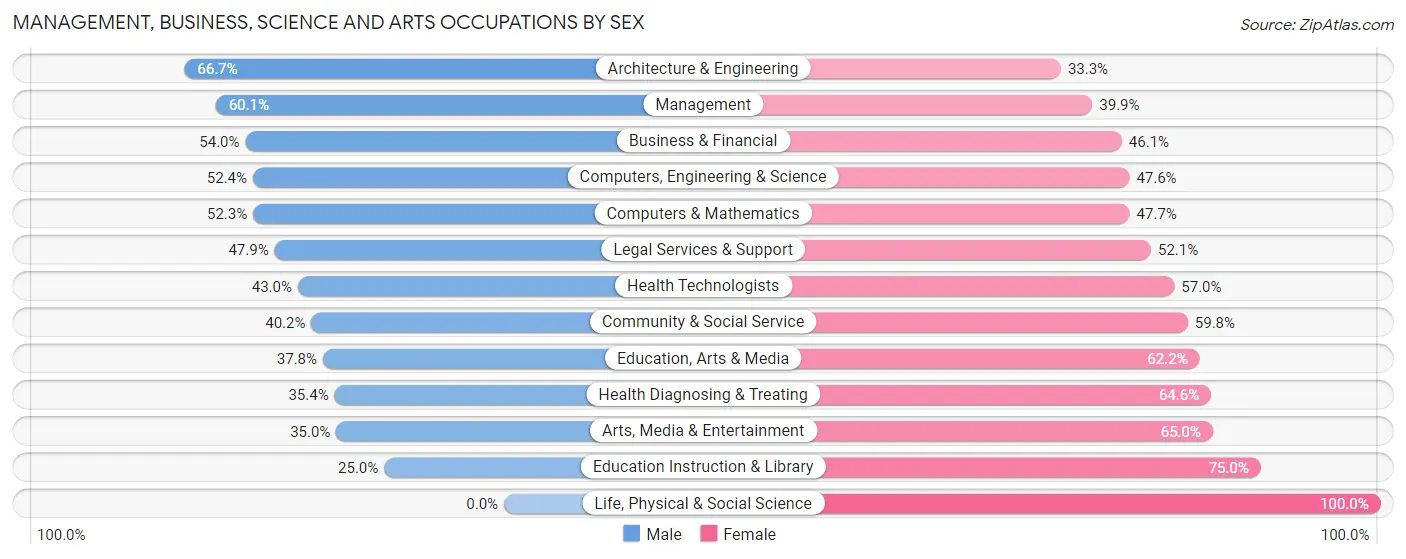
Management, Business, Science and Arts Occupations by Sex
Within the Management, Business, Science and Arts occupations in Miami Shores, the most male-oriented occupations are Architecture & Engineering (66.7%), Management (60.1%), and Business & Financial (53.9%), while the most female-oriented occupations are Life, Physical & Social Science (100.0%), Education Instruction & Library (75.0%), and Arts, Media & Entertainment (65.0%).
| Occupation | Male | Female |
| Management | 493 (60.1%) | 327 (39.9%) |
| Business & Financial | 246 (53.9%) | 210 (46.1%) |
| Computers, Engineering & Science | 88 (52.4%) | 80 (47.6%) |
| Computers & Mathematics | 56 (52.3%) | 51 (47.7%) |
| Architecture & Engineering | 32 (66.7%) | 16 (33.3%) |
| Life, Physical & Social Science | 0 (0.0%) | 13 (100.0%) |
| Community & Social Service | 428 (40.2%) | 637 (59.8%) |
| Education, Arts & Media | 34 (37.8%) | 56 (62.2%) |
| Legal Services & Support | 281 (47.9%) | 306 (52.1%) |
| Education Instruction & Library | 57 (25.0%) | 171 (75.0%) |
| Arts, Media & Entertainment | 56 (35.0%) | 104 (65.0%) |
| Health Diagnosing & Treating | 157 (35.4%) | 287 (64.6%) |
| Health Technologists | 157 (43.0%) | 208 (57.0%) |
| Total (Category) | 1,412 (47.8%) | 1,541 (52.2%) |
| Total (Overall) | 2,905 (52.5%) | 2,632 (47.5%) |
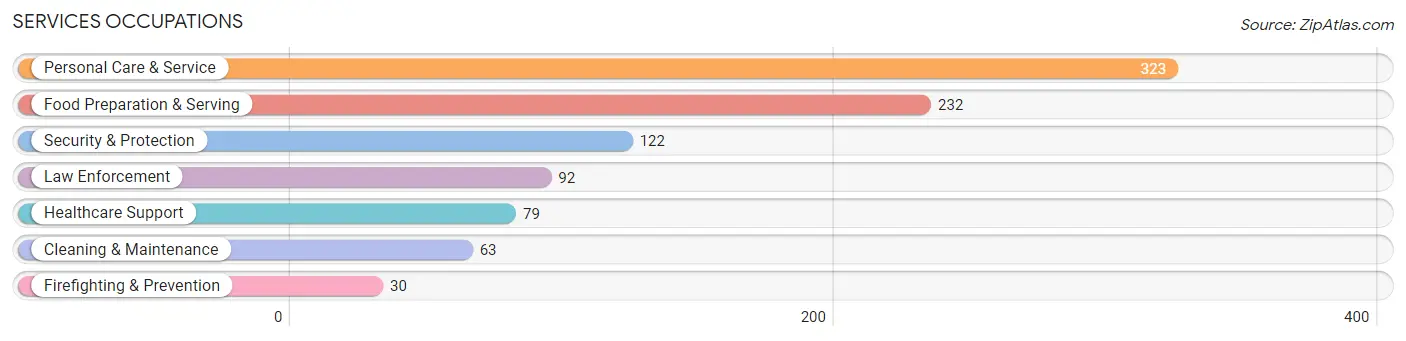
Services Occupations
The most common Services occupations in Miami Shores are Personal Care & Service (323 | 5.8%), Food Preparation & Serving (232 | 4.2%), Security & Protection (122 | 2.2%), Law Enforcement (92 | 1.7%), and Healthcare Support (79 | 1.4%).
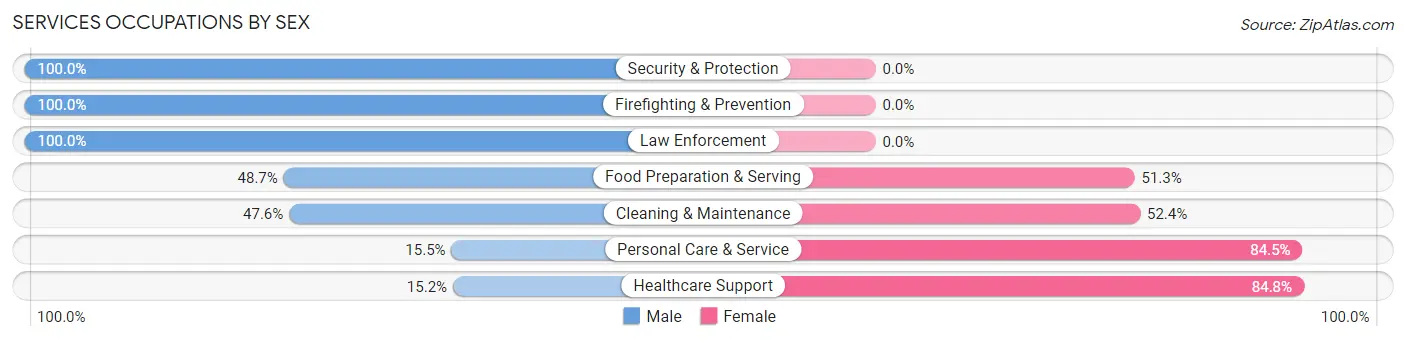
Services Occupations by Sex
Within the Services occupations in Miami Shores, the most male-oriented occupations are Security & Protection (100.0%), Firefighting & Prevention (100.0%), and Law Enforcement (100.0%), while the most female-oriented occupations are Healthcare Support (84.8%), Personal Care & Service (84.5%), and Cleaning & Maintenance (52.4%).
| Occupation | Male | Female |
| Healthcare Support | 12 (15.2%) | 67 (84.8%) |
| Security & Protection | 122 (100.0%) | 0 (0.0%) |
| Firefighting & Prevention | 30 (100.0%) | 0 (0.0%) |
| Law Enforcement | 92 (100.0%) | 0 (0.0%) |
| Food Preparation & Serving | 113 (48.7%) | 119 (51.3%) |
| Cleaning & Maintenance | 30 (47.6%) | 33 (52.4%) |
| Personal Care & Service | 50 (15.5%) | 273 (84.5%) |
| Total (Category) | 327 (39.9%) | 492 (60.1%) |
| Total (Overall) | 2,905 (52.5%) | 2,632 (47.5%) |
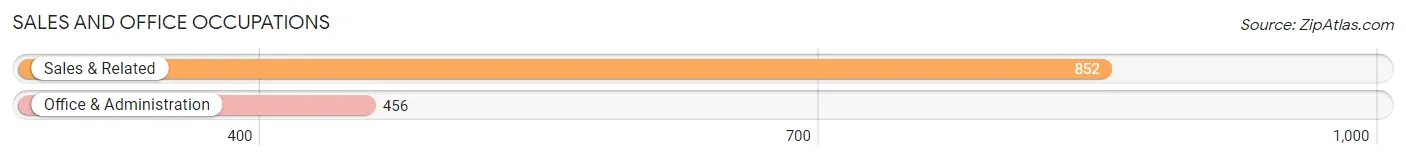
Sales and Office Occupations
The most common Sales and Office occupations in Miami Shores are Sales & Related (852 | 15.4%), and Office & Administration (456 | 8.2%).
Sales and Office Occupations by Sex
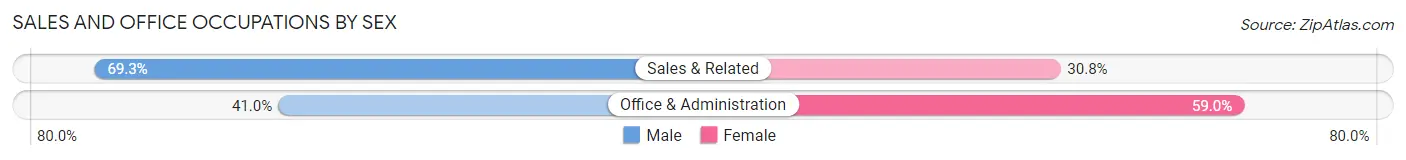
| Occupation | Male | Female |
| Sales & Related | 590 (69.3%) | 262 (30.7%) |
| Office & Administration | 187 (41.0%) | 269 (59.0%) |
| Total (Category) | 777 (59.4%) | 531 (40.6%) |
| Total (Overall) | 2,905 (52.5%) | 2,632 (47.5%) |
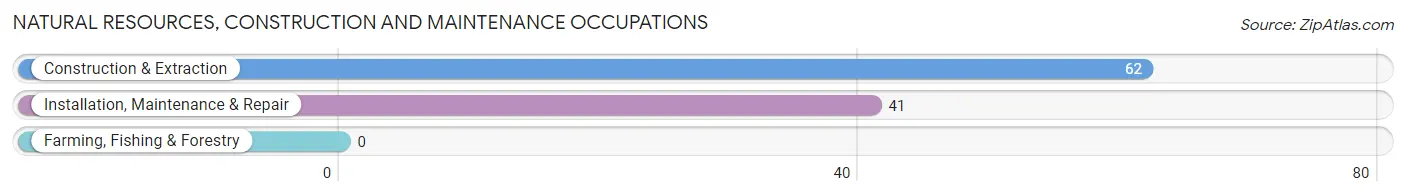
Natural Resources, Construction and Maintenance Occupations
The most common Natural Resources, Construction and Maintenance occupations in Miami Shores are Construction & Extraction (62 | 1.1%), and Installation, Maintenance & Repair (41 | 0.7%).
Natural Resources, Construction and Maintenance Occupations by Sex
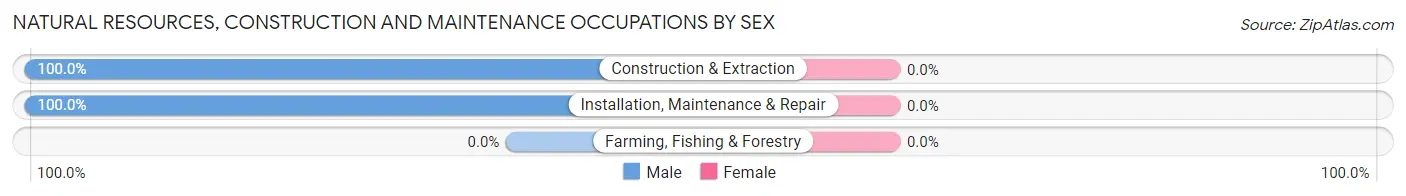
| Occupation | Male | Female |
| Farming, Fishing & Forestry | 0 (0.0%) | 0 (0.0%) |
| Construction & Extraction | 62 (100.0%) | 0 (0.0%) |
| Installation, Maintenance & Repair | 41 (100.0%) | 0 (0.0%) |
| Total (Category) | 103 (100.0%) | 0 (0.0%) |
| Total (Overall) | 2,905 (52.5%) | 2,632 (47.5%) |
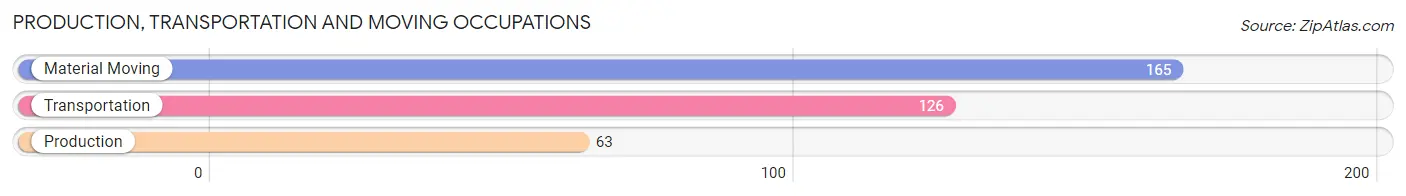
Production, Transportation and Moving Occupations
The most common Production, Transportation and Moving occupations in Miami Shores are Material Moving (165 | 3.0%), Transportation (126 | 2.3%), and Production (63 | 1.1%).
Production, Transportation and Moving Occupations by Sex
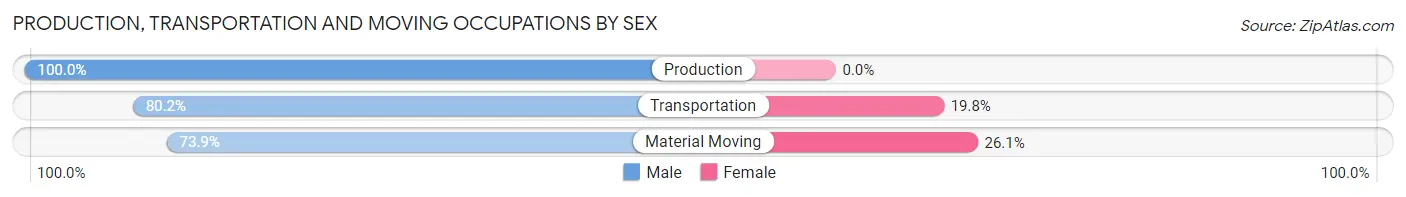
| Occupation | Male | Female |
| Production | 63 (100.0%) | 0 (0.0%) |
| Transportation | 101 (80.2%) | 25 (19.8%) |
| Material Moving | 122 (73.9%) | 43 (26.1%) |
| Total (Category) | 286 (80.8%) | 68 (19.2%) |
| Total (Overall) | 2,905 (52.5%) | 2,632 (47.5%) |
Employment Industries by Sex in Miami Shores
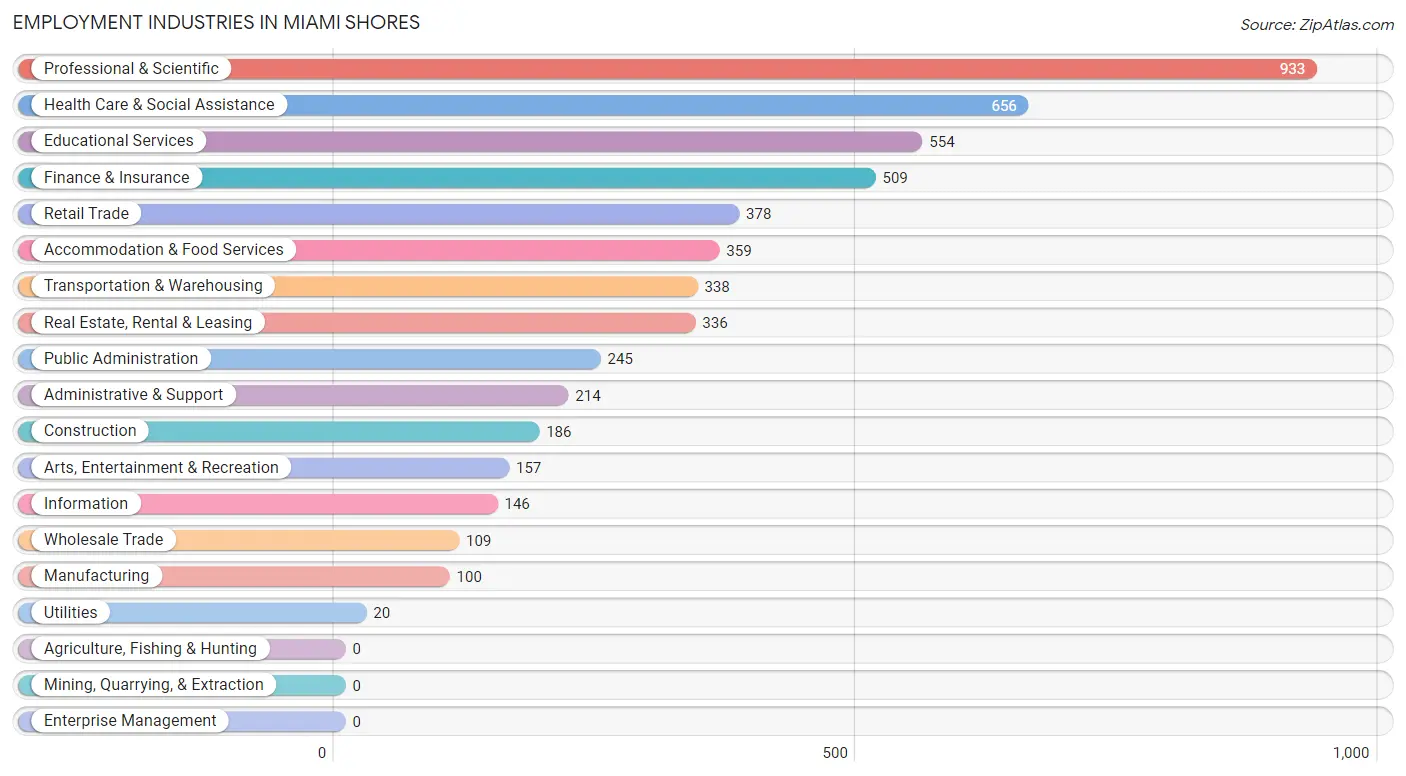
Employment Industries in Miami Shores
The major employment industries in Miami Shores include Professional & Scientific (933 | 16.9%), Health Care & Social Assistance (656 | 11.8%), Educational Services (554 | 10.0%), Finance & Insurance (509 | 9.2%), and Retail Trade (378 | 6.8%).
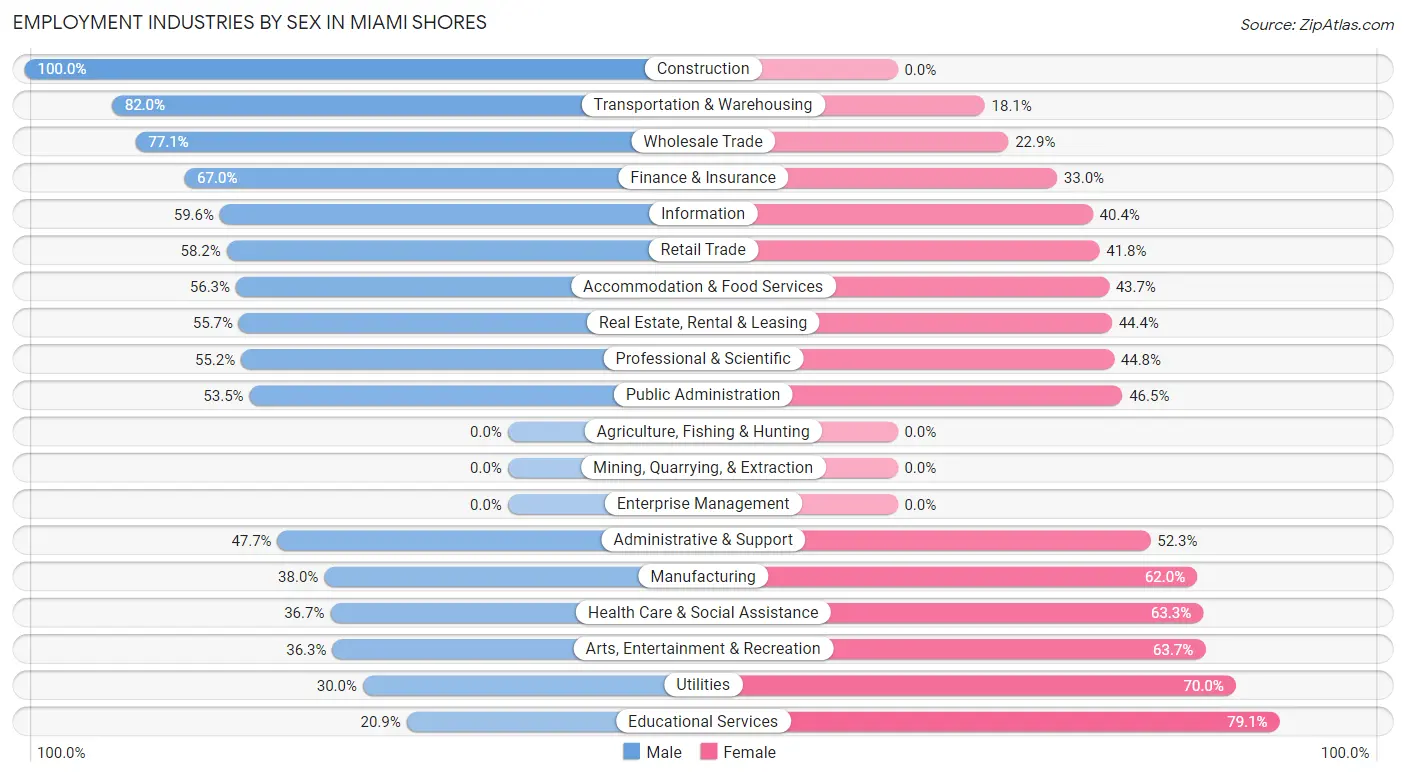
Employment Industries by Sex in Miami Shores
The Miami Shores industries that see more men than women are Construction (100.0%), Transportation & Warehousing (82.0%), and Wholesale Trade (77.1%), whereas the industries that tend to have a higher number of women are Educational Services (79.1%), Utilities (70.0%), and Arts, Entertainment & Recreation (63.7%).
| Industry | Male | Female |
| Agriculture, Fishing & Hunting | 0 (0.0%) | 0 (0.0%) |
| Mining, Quarrying, & Extraction | 0 (0.0%) | 0 (0.0%) |
| Construction | 186 (100.0%) | 0 (0.0%) |
| Manufacturing | 38 (38.0%) | 62 (62.0%) |
| Wholesale Trade | 84 (77.1%) | 25 (22.9%) |
| Retail Trade | 220 (58.2%) | 158 (41.8%) |
| Transportation & Warehousing | 277 (82.0%) | 61 (18.0%) |
| Utilities | 6 (30.0%) | 14 (70.0%) |
| Information | 87 (59.6%) | 59 (40.4%) |
| Finance & Insurance | 341 (67.0%) | 168 (33.0%) |
| Real Estate, Rental & Leasing | 187 (55.6%) | 149 (44.4%) |
| Professional & Scientific | 515 (55.2%) | 418 (44.8%) |
| Enterprise Management | 0 (0.0%) | 0 (0.0%) |
| Administrative & Support | 102 (47.7%) | 112 (52.3%) |
| Educational Services | 116 (20.9%) | 438 (79.1%) |
| Health Care & Social Assistance | 241 (36.7%) | 415 (63.3%) |
| Arts, Entertainment & Recreation | 57 (36.3%) | 100 (63.7%) |
| Accommodation & Food Services | 202 (56.3%) | 157 (43.7%) |
| Public Administration | 131 (53.5%) | 114 (46.5%) |
| Total | 2,905 (52.5%) | 2,632 (47.5%) |
Education in Miami Shores
School Enrollment in Miami Shores
The most common levels of schooling among the 3,977 students in Miami Shores are college / undergraduate (1,769 | 44.5%), elementary school (540 | 13.6%), and nursery / preschool (536 | 13.5%).
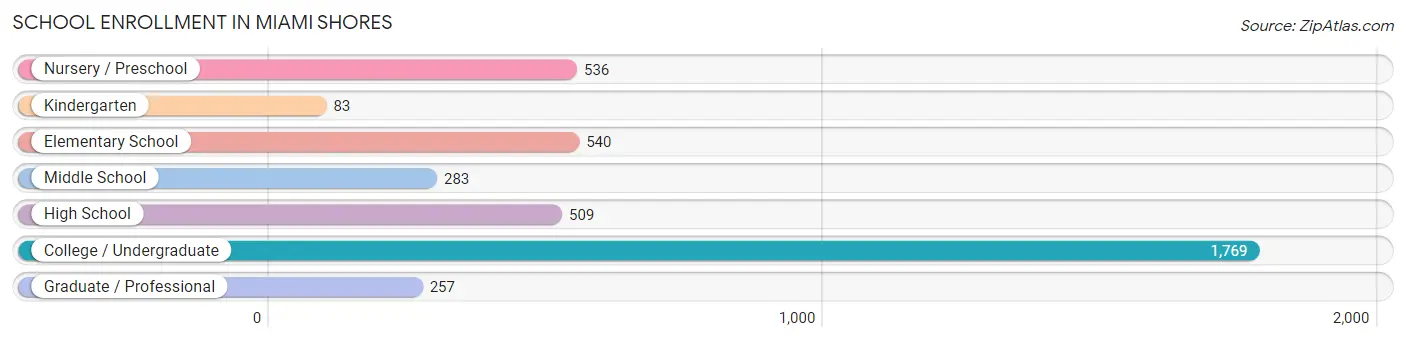
| School Level | # Students | % Students |
| Nursery / Preschool | 536 | 13.5% |
| Kindergarten | 83 | 2.1% |
| Elementary School | 540 | 13.6% |
| Middle School | 283 | 7.1% |
| High School | 509 | 12.8% |
| College / Undergraduate | 1,769 | 44.5% |
| Graduate / Professional | 257 | 6.5% |
| Total | 3,977 | 100.0% |
School Enrollment by Age by Funding Source in Miami Shores
Out of a total of 3,977 students who are enrolled in schools in Miami Shores, 2,569 (64.6%) attend a private institution, while the remaining 1,408 (35.4%) are enrolled in public schools. The age group of 3 to 4 year olds has the highest likelihood of being enrolled in private schools, with 399 (87.1% in the age bracket) enrolled. Conversely, the age group of 10 to 14 year olds has the lowest likelihood of being enrolled in a private school, with 287 (65.1% in the age bracket) attending a public institution.
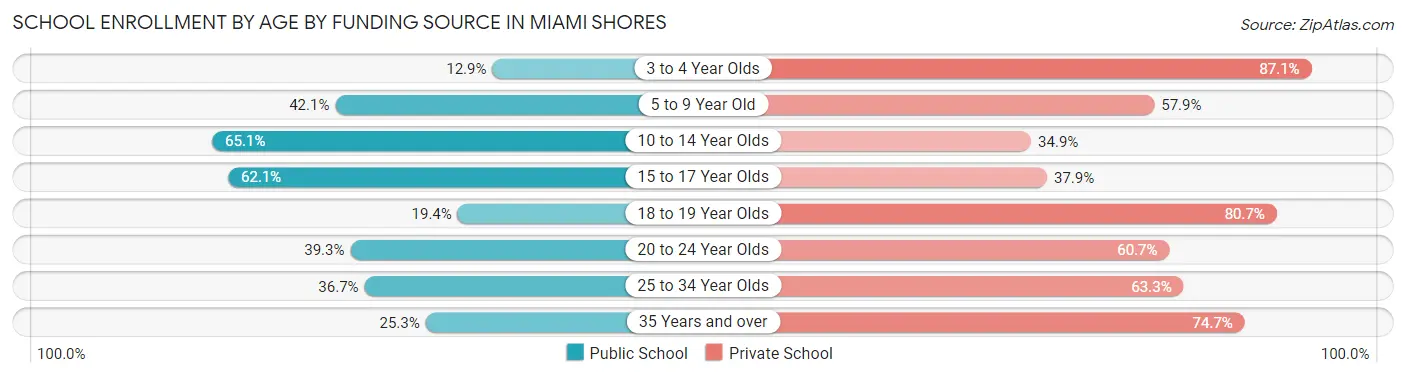
| Age Bracket | Public School | Private School |
| 3 to 4 Year Olds | 59 (12.9%) | 399 (87.1%) |
| 5 to 9 Year Old | 268 (42.1%) | 368 (57.9%) |
| 10 to 14 Year Olds | 287 (65.1%) | 154 (34.9%) |
| 15 to 17 Year Olds | 205 (62.1%) | 125 (37.9%) |
| 18 to 19 Year Olds | 209 (19.4%) | 871 (80.6%) |
| 20 to 24 Year Olds | 264 (39.3%) | 407 (60.7%) |
| 25 to 34 Year Olds | 76 (36.7%) | 131 (63.3%) |
| 35 Years and over | 39 (25.3%) | 115 (74.7%) |
| Total | 1,408 (35.4%) | 2,569 (64.6%) |
Educational Attainment by Field of Study in Miami Shores
Business (1,115 | 24.1%), social sciences (525 | 11.3%), science & technology (467 | 10.1%), literature & languages (405 | 8.7%), and visual & performing arts (369 | 8.0%) are the most common fields of study among 4,629 individuals in Miami Shores who have obtained a bachelor's degree or higher.
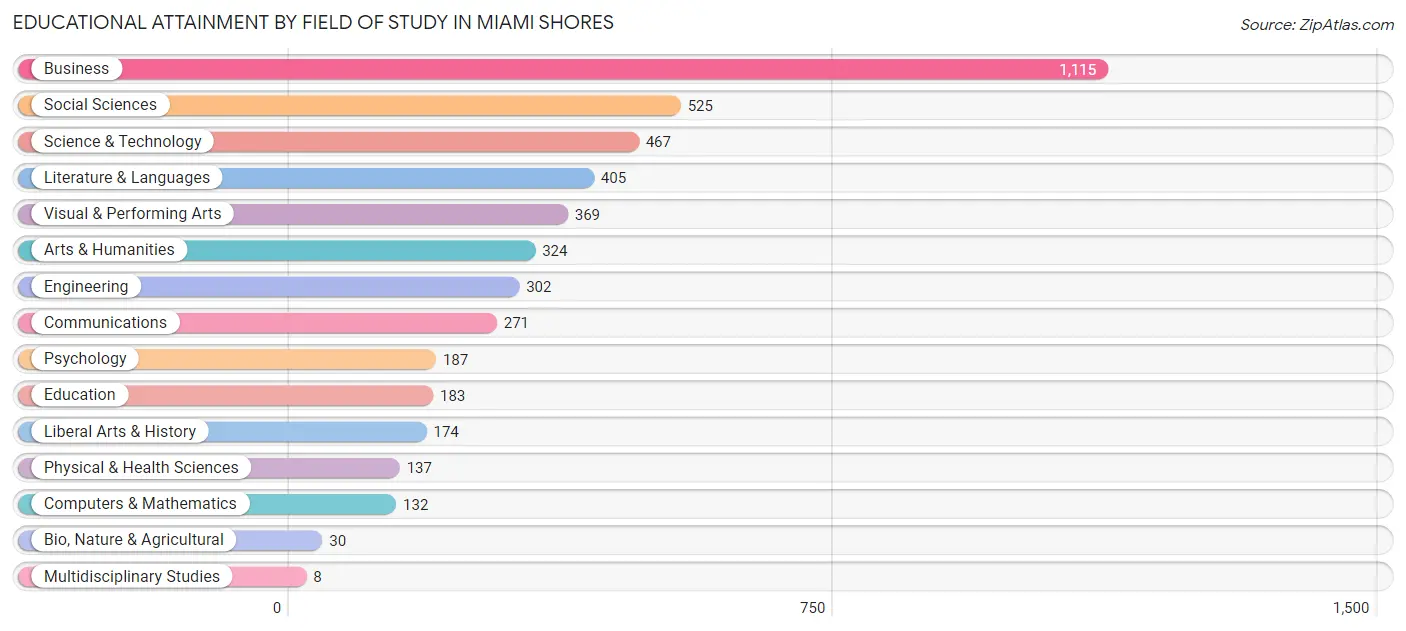
| Field of Study | # Graduates | % Graduates |
| Computers & Mathematics | 132 | 2.9% |
| Bio, Nature & Agricultural | 30 | 0.6% |
| Physical & Health Sciences | 137 | 3.0% |
| Psychology | 187 | 4.0% |
| Social Sciences | 525 | 11.3% |
| Engineering | 302 | 6.5% |
| Multidisciplinary Studies | 8 | 0.2% |
| Science & Technology | 467 | 10.1% |
| Business | 1,115 | 24.1% |
| Education | 183 | 4.0% |
| Literature & Languages | 405 | 8.7% |
| Liberal Arts & History | 174 | 3.8% |
| Visual & Performing Arts | 369 | 8.0% |
| Communications | 271 | 5.9% |
| Arts & Humanities | 324 | 7.0% |
| Total | 4,629 | 100.0% |
Transportation & Commute in Miami Shores
Vehicle Availability by Sex in Miami Shores
The most prevalent vehicle ownership categories in Miami Shores are males with 2 vehicles (1,313, accounting for 46.4%) and females with 2 vehicles (935, making up 57.7%).
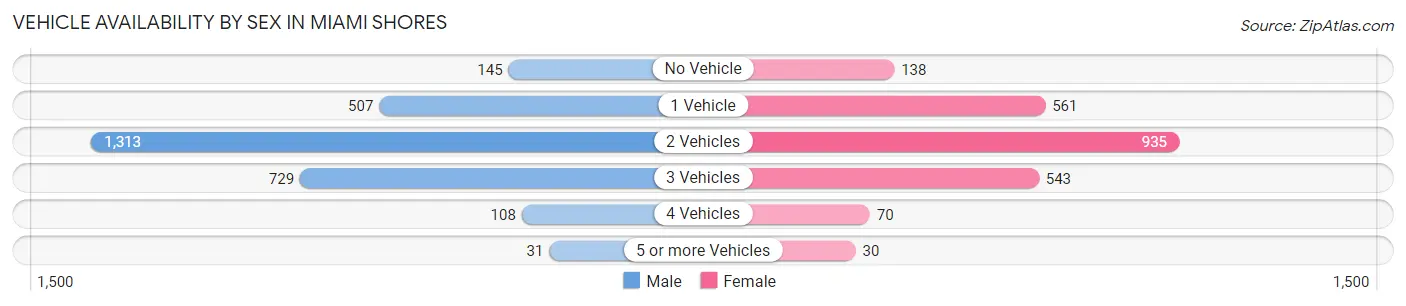
| Vehicles Available | Male | Female |
| No Vehicle | 145 (5.1%) | 138 (6.1%) |
| 1 Vehicle | 507 (17.9%) | 561 (24.6%) |
| 2 Vehicles | 1,313 (46.4%) | 935 (41.1%) |
| 3 Vehicles | 729 (25.7%) | 543 (23.8%) |
| 4 Vehicles | 108 (3.8%) | 70 (3.1%) |
| 5 or more Vehicles | 31 (1.1%) | 30 (1.3%) |
| Total | 2,833 (100.0%) | 2,277 (100.0%) |
Commute Time in Miami Shores
The most frequently occuring commute durations in Miami Shores are 30 to 34 minutes (816 commuters, 18.6%), 45 to 59 minutes (670 commuters, 15.2%), and 10 to 14 minutes (606 commuters, 13.8%).
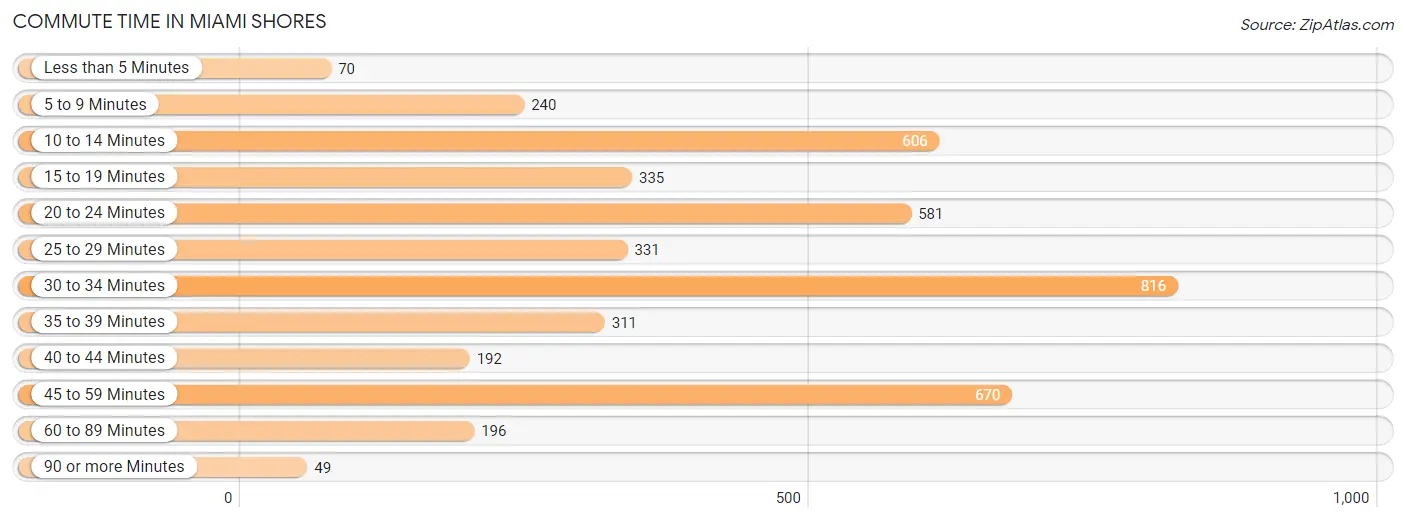
| Commute Time | # Commuters | % Commuters |
| Less than 5 Minutes | 70 | 1.6% |
| 5 to 9 Minutes | 240 | 5.5% |
| 10 to 14 Minutes | 606 | 13.8% |
| 15 to 19 Minutes | 335 | 7.6% |
| 20 to 24 Minutes | 581 | 13.2% |
| 25 to 29 Minutes | 331 | 7.5% |
| 30 to 34 Minutes | 816 | 18.6% |
| 35 to 39 Minutes | 311 | 7.1% |
| 40 to 44 Minutes | 192 | 4.4% |
| 45 to 59 Minutes | 670 | 15.2% |
| 60 to 89 Minutes | 196 | 4.5% |
| 90 or more Minutes | 49 | 1.1% |
Commute Time by Sex in Miami Shores
The most common commute times in Miami Shores are 30 to 34 minutes (527 commuters, 22.3%) for males and 45 to 59 minutes (464 commuters, 22.9%) for females.
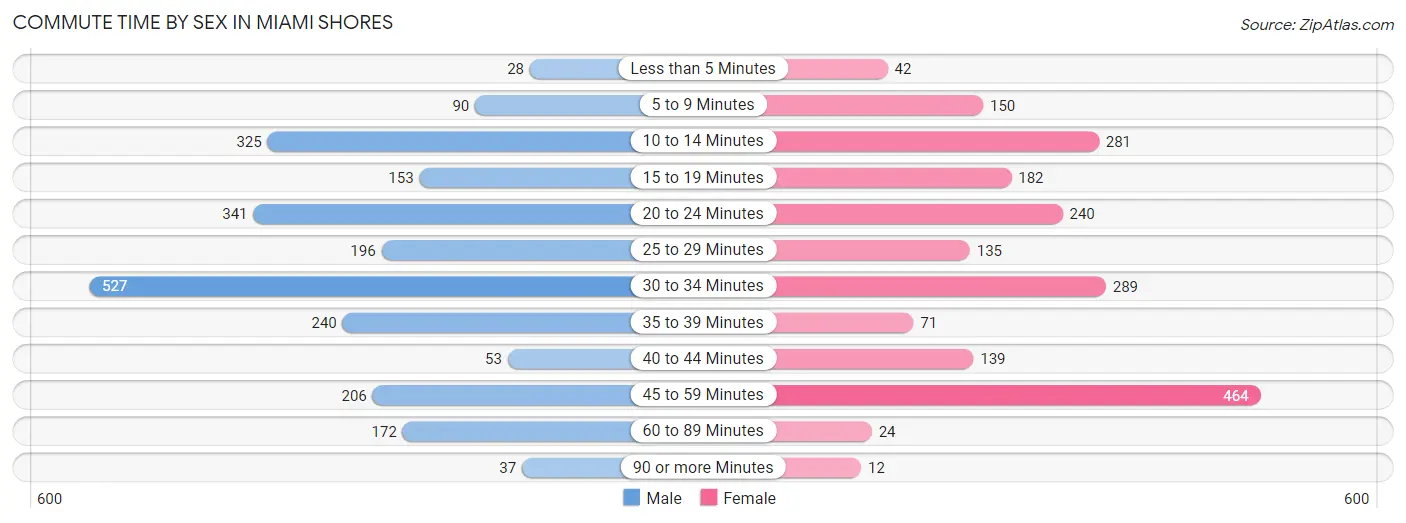
| Commute Time | Male | Female |
| Less than 5 Minutes | 28 (1.2%) | 42 (2.1%) |
| 5 to 9 Minutes | 90 (3.8%) | 150 (7.4%) |
| 10 to 14 Minutes | 325 (13.7%) | 281 (13.9%) |
| 15 to 19 Minutes | 153 (6.5%) | 182 (9.0%) |
| 20 to 24 Minutes | 341 (14.4%) | 240 (11.8%) |
| 25 to 29 Minutes | 196 (8.3%) | 135 (6.7%) |
| 30 to 34 Minutes | 527 (22.3%) | 289 (14.2%) |
| 35 to 39 Minutes | 240 (10.1%) | 71 (3.5%) |
| 40 to 44 Minutes | 53 (2.2%) | 139 (6.9%) |
| 45 to 59 Minutes | 206 (8.7%) | 464 (22.9%) |
| 60 to 89 Minutes | 172 (7.3%) | 24 (1.2%) |
| 90 or more Minutes | 37 (1.6%) | 12 (0.6%) |
Time of Departure to Work by Sex in Miami Shores
The most frequent times of departure to work in Miami Shores are 9:00 AM to 9:59 AM (506, 21.4%) for males and 7:00 AM to 7:29 AM (299, 14.7%) for females.
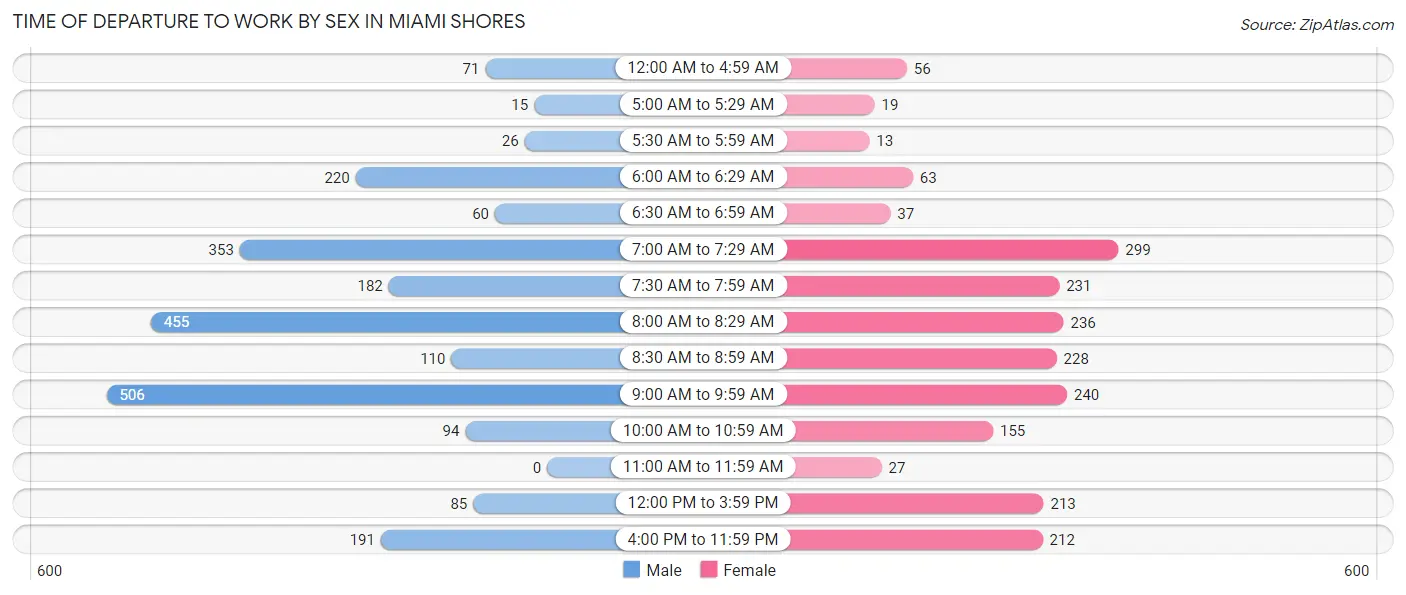
| Time of Departure | Male | Female |
| 12:00 AM to 4:59 AM | 71 (3.0%) | 56 (2.8%) |
| 5:00 AM to 5:29 AM | 15 (0.6%) | 19 (0.9%) |
| 5:30 AM to 5:59 AM | 26 (1.1%) | 13 (0.6%) |
| 6:00 AM to 6:29 AM | 220 (9.3%) | 63 (3.1%) |
| 6:30 AM to 6:59 AM | 60 (2.5%) | 37 (1.8%) |
| 7:00 AM to 7:29 AM | 353 (14.9%) | 299 (14.7%) |
| 7:30 AM to 7:59 AM | 182 (7.7%) | 231 (11.4%) |
| 8:00 AM to 8:29 AM | 455 (19.2%) | 236 (11.6%) |
| 8:30 AM to 8:59 AM | 110 (4.6%) | 228 (11.2%) |
| 9:00 AM to 9:59 AM | 506 (21.4%) | 240 (11.8%) |
| 10:00 AM to 10:59 AM | 94 (4.0%) | 155 (7.6%) |
| 11:00 AM to 11:59 AM | 0 (0.0%) | 27 (1.3%) |
| 12:00 PM to 3:59 PM | 85 (3.6%) | 213 (10.5%) |
| 4:00 PM to 11:59 PM | 191 (8.1%) | 212 (10.4%) |
| Total | 2,368 (100.0%) | 2,029 (100.0%) |
Housing Occupancy in Miami Shores
Occupancy by Ownership in Miami Shores
Of the total 3,756 dwellings in Miami Shores, owner-occupied units account for 3,171 (84.4%), while renter-occupied units make up 585 (15.6%).
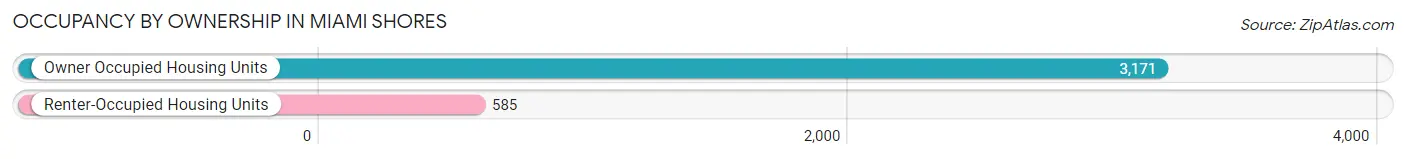
| Occupancy | # Housing Units | % Housing Units |
| Owner Occupied Housing Units | 3,171 | 84.4% |
| Renter-Occupied Housing Units | 585 | 15.6% |
| Total Occupied Housing Units | 3,756 | 100.0% |
Occupancy by Household Size in Miami Shores
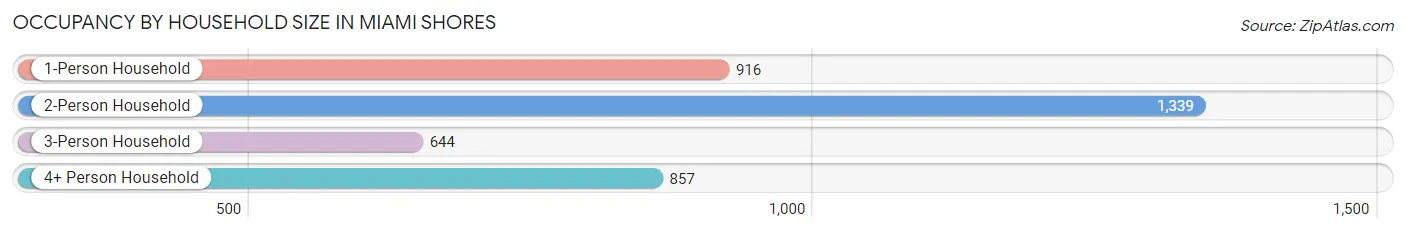
| Household Size | # Housing Units | % Housing Units |
| 1-Person Household | 916 | 24.4% |
| 2-Person Household | 1,339 | 35.6% |
| 3-Person Household | 644 | 17.2% |
| 4+ Person Household | 857 | 22.8% |
| Total Housing Units | 3,756 | 100.0% |
Occupancy by Ownership by Household Size in Miami Shores
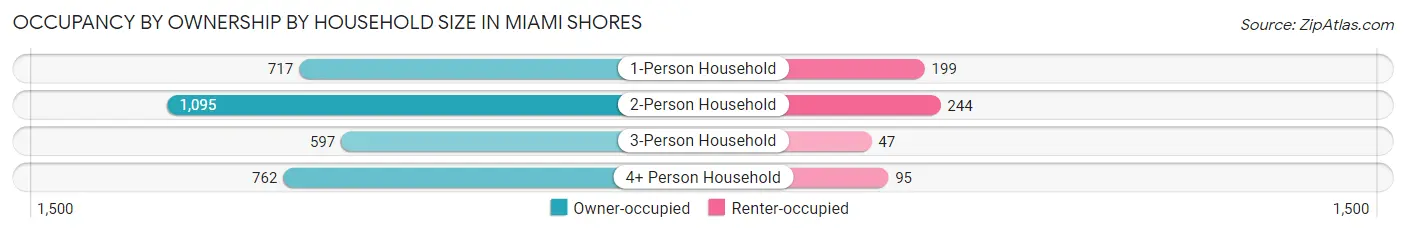
| Household Size | Owner-occupied | Renter-occupied |
| 1-Person Household | 717 (78.3%) | 199 (21.7%) |
| 2-Person Household | 1,095 (81.8%) | 244 (18.2%) |
| 3-Person Household | 597 (92.7%) | 47 (7.3%) |
| 4+ Person Household | 762 (88.9%) | 95 (11.1%) |
| Total Housing Units | 3,171 (84.4%) | 585 (15.6%) |
Occupancy by Educational Attainment in Miami Shores
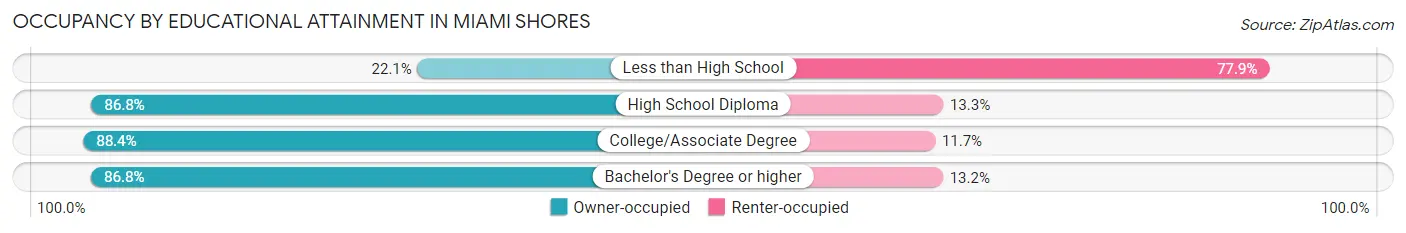
| Household Size | Owner-occupied | Renter-occupied |
| Less than High School | 34 (22.1%) | 120 (77.9%) |
| High School Diploma | 406 (86.8%) | 62 (13.3%) |
| College/Associate Degree | 614 (88.3%) | 81 (11.7%) |
| Bachelor's Degree or higher | 2,117 (86.8%) | 322 (13.2%) |
Occupancy by Age of Householder in Miami Shores
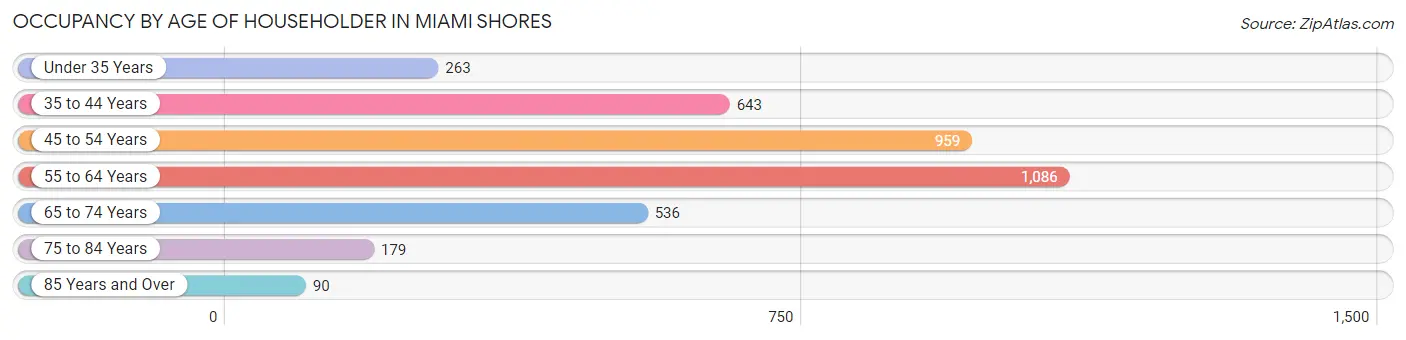
| Age Bracket | # Households | % Households |
| Under 35 Years | 263 | 7.0% |
| 35 to 44 Years | 643 | 17.1% |
| 45 to 54 Years | 959 | 25.5% |
| 55 to 64 Years | 1,086 | 28.9% |
| 65 to 74 Years | 536 | 14.3% |
| 75 to 84 Years | 179 | 4.8% |
| 85 Years and Over | 90 | 2.4% |
| Total | 3,756 | 100.0% |
Housing Finances in Miami Shores
Median Income by Occupancy in Miami Shores
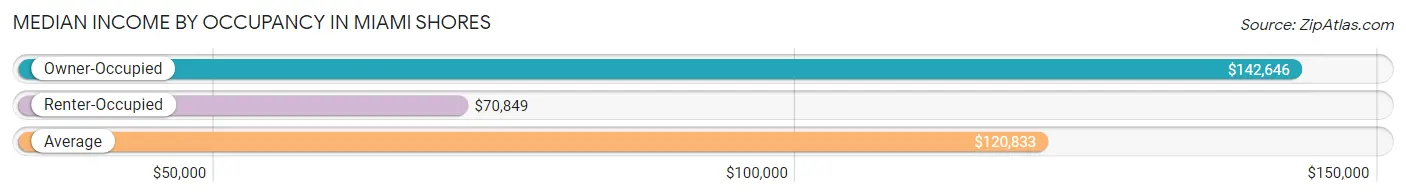
| Occupancy Type | # Households | Median Income |
| Owner-Occupied | 3,171 (84.4%) | $142,646 |
| Renter-Occupied | 585 (15.6%) | $70,849 |
| Average | 3,756 (100.0%) | $120,833 |
Occupancy by Householder Income Bracket in Miami Shores
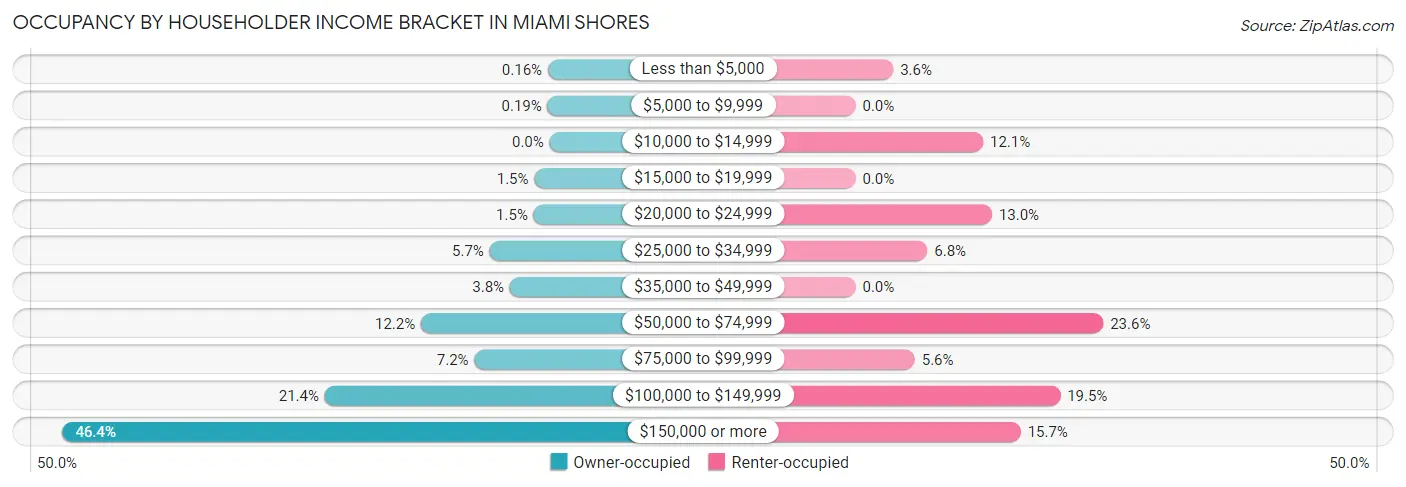
| Income Bracket | Owner-occupied | Renter-occupied |
| Less than $5,000 | 5 (0.2%) | 21 (3.6%) |
| $5,000 to $9,999 | 6 (0.2%) | 0 (0.0%) |
| $10,000 to $14,999 | 0 (0.0%) | 71 (12.1%) |
| $15,000 to $19,999 | 46 (1.5%) | 0 (0.0%) |
| $20,000 to $24,999 | 48 (1.5%) | 76 (13.0%) |
| $25,000 to $34,999 | 181 (5.7%) | 40 (6.8%) |
| $35,000 to $49,999 | 120 (3.8%) | 0 (0.0%) |
| $50,000 to $74,999 | 388 (12.2%) | 138 (23.6%) |
| $75,000 to $99,999 | 227 (7.2%) | 33 (5.6%) |
| $100,000 to $149,999 | 679 (21.4%) | 114 (19.5%) |
| $150,000 or more | 1,471 (46.4%) | 92 (15.7%) |
| Total | 3,171 (100.0%) | 585 (100.0%) |
Monthly Housing Cost Tiers in Miami Shores
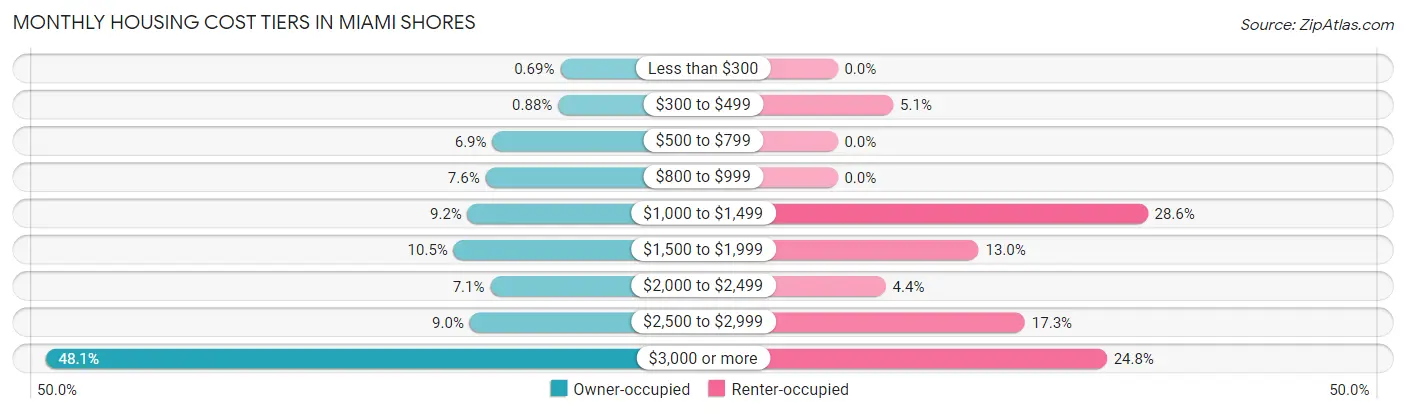
| Monthly Cost | Owner-occupied | Renter-occupied |
| Less than $300 | 22 (0.7%) | 0 (0.0%) |
| $300 to $499 | 28 (0.9%) | 30 (5.1%) |
| $500 to $799 | 220 (6.9%) | 0 (0.0%) |
| $800 to $999 | 240 (7.6%) | 0 (0.0%) |
| $1,000 to $1,499 | 292 (9.2%) | 167 (28.5%) |
| $1,500 to $1,999 | 333 (10.5%) | 76 (13.0%) |
| $2,000 to $2,499 | 226 (7.1%) | 26 (4.4%) |
| $2,500 to $2,999 | 286 (9.0%) | 101 (17.3%) |
| $3,000 or more | 1,524 (48.1%) | 145 (24.8%) |
| Total | 3,171 (100.0%) | 585 (100.0%) |
Physical Housing Characteristics in Miami Shores
Housing Structures in Miami Shores
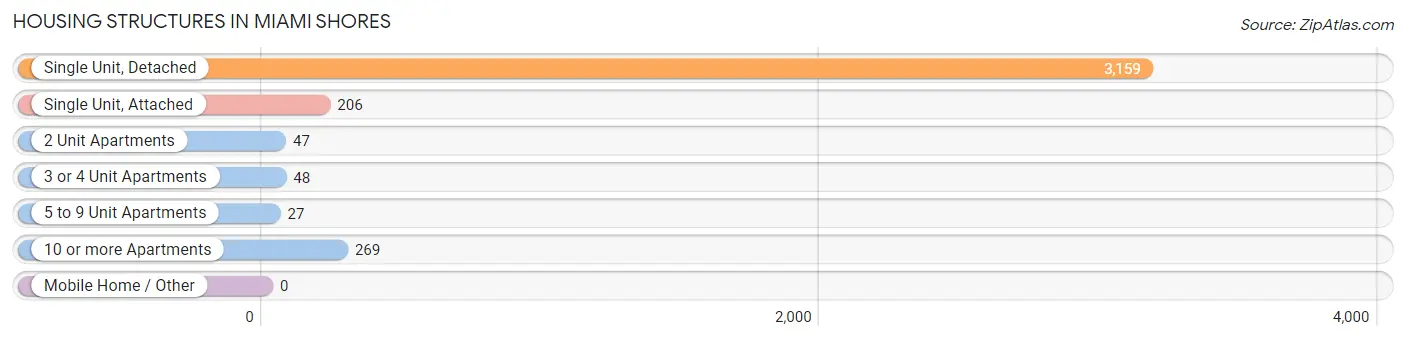
| Structure Type | # Housing Units | % Housing Units |
| Single Unit, Detached | 3,159 | 84.1% |
| Single Unit, Attached | 206 | 5.5% |
| 2 Unit Apartments | 47 | 1.3% |
| 3 or 4 Unit Apartments | 48 | 1.3% |
| 5 to 9 Unit Apartments | 27 | 0.7% |
| 10 or more Apartments | 269 | 7.2% |
| Mobile Home / Other | 0 | 0.0% |
| Total | 3,756 | 100.0% |
Housing Structures by Occupancy in Miami Shores
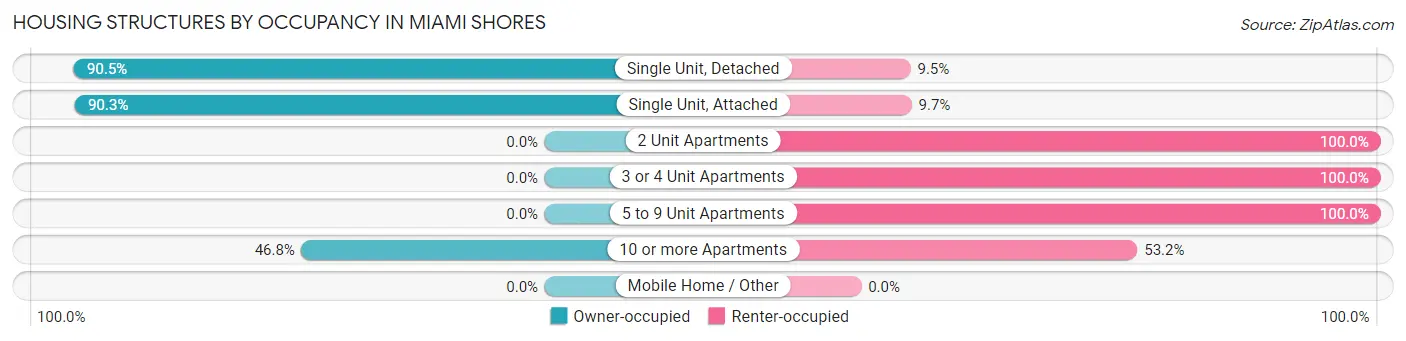
| Structure Type | Owner-occupied | Renter-occupied |
| Single Unit, Detached | 2,859 (90.5%) | 300 (9.5%) |
| Single Unit, Attached | 186 (90.3%) | 20 (9.7%) |
| 2 Unit Apartments | 0 (0.0%) | 47 (100.0%) |
| 3 or 4 Unit Apartments | 0 (0.0%) | 48 (100.0%) |
| 5 to 9 Unit Apartments | 0 (0.0%) | 27 (100.0%) |
| 10 or more Apartments | 126 (46.8%) | 143 (53.2%) |
| Mobile Home / Other | 0 (0.0%) | 0 (0.0%) |
| Total | 3,171 (84.4%) | 585 (15.6%) |
Housing Structures by Number of Rooms in Miami Shores
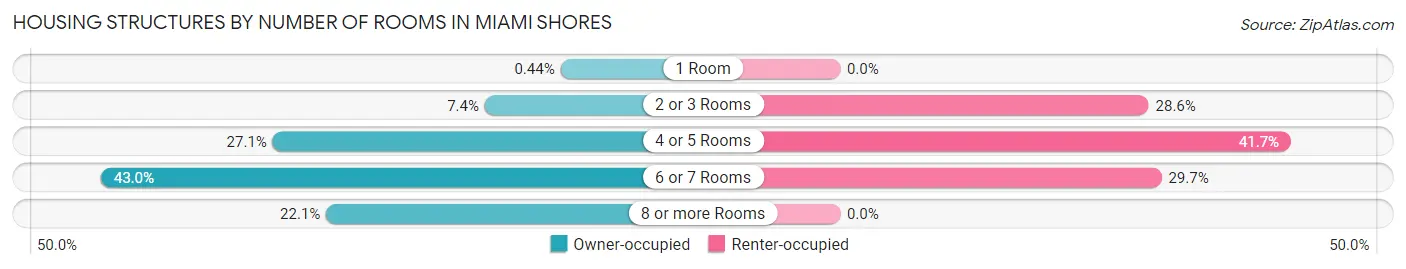
| Number of Rooms | Owner-occupied | Renter-occupied |
| 1 Room | 14 (0.4%) | 0 (0.0%) |
| 2 or 3 Rooms | 236 (7.4%) | 167 (28.5%) |
| 4 or 5 Rooms | 858 (27.1%) | 244 (41.7%) |
| 6 or 7 Rooms | 1,362 (42.9%) | 174 (29.7%) |
| 8 or more Rooms | 701 (22.1%) | 0 (0.0%) |
| Total | 3,171 (100.0%) | 585 (100.0%) |
Housing Structure by Heating Type in Miami Shores
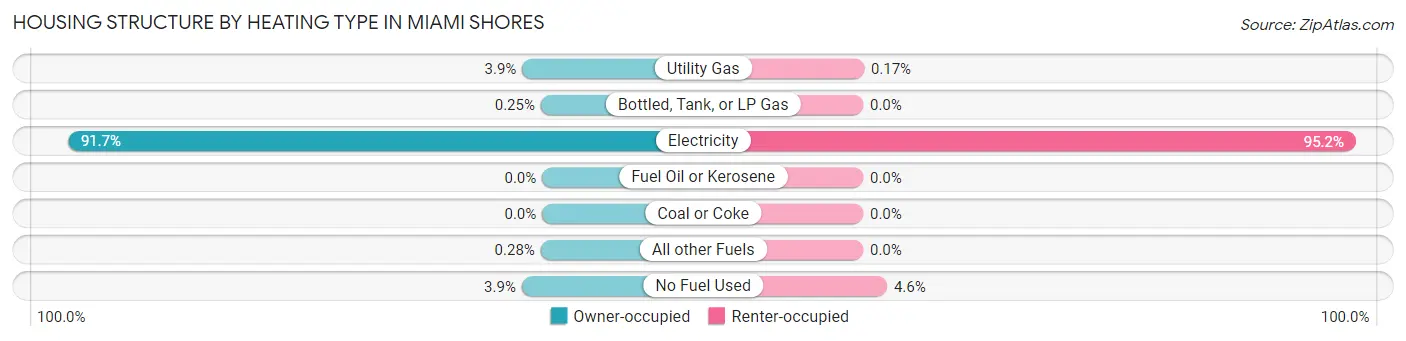
| Heating Type | Owner-occupied | Renter-occupied |
| Utility Gas | 122 (3.8%) | 1 (0.2%) |
| Bottled, Tank, or LP Gas | 8 (0.3%) | 0 (0.0%) |
| Electricity | 2,907 (91.7%) | 557 (95.2%) |
| Fuel Oil or Kerosene | 0 (0.0%) | 0 (0.0%) |
| Coal or Coke | 0 (0.0%) | 0 (0.0%) |
| All other Fuels | 9 (0.3%) | 0 (0.0%) |
| No Fuel Used | 125 (3.9%) | 27 (4.6%) |
| Total | 3,171 (100.0%) | 585 (100.0%) |
Household Vehicle Usage in Miami Shores
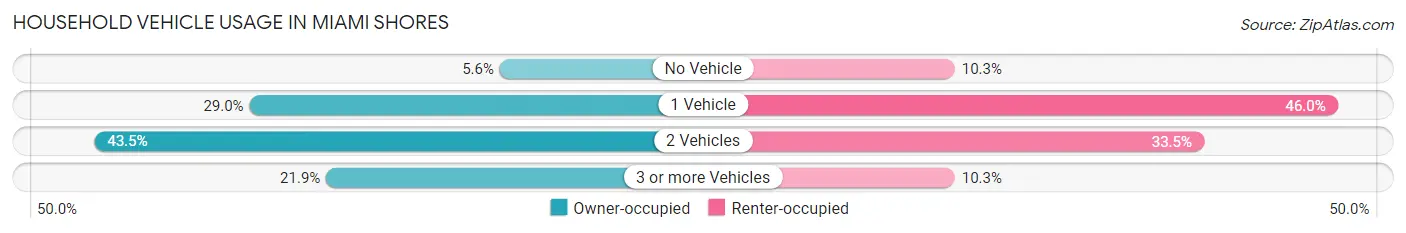
| Vehicles per Household | Owner-occupied | Renter-occupied |
| No Vehicle | 179 (5.6%) | 60 (10.3%) |
| 1 Vehicle | 920 (29.0%) | 269 (46.0%) |
| 2 Vehicles | 1,379 (43.5%) | 196 (33.5%) |
| 3 or more Vehicles | 693 (21.8%) | 60 (10.3%) |
| Total | 3,171 (100.0%) | 585 (100.0%) |
Real Estate & Mortgages in Miami Shores
Real Estate and Mortgage Overview in Miami Shores
| Characteristic | Without Mortgage | With Mortgage |
| Housing Units | 897 | 2,274 |
| Median Property Value | $653,500 | $691,600 |
| Median Household Income | $101,031 | $1,126 |
| Monthly Housing Costs | $996 | $1,506 |
| Real Estate Taxes | $5,755 | $0 |
Property Value by Mortgage Status in Miami Shores
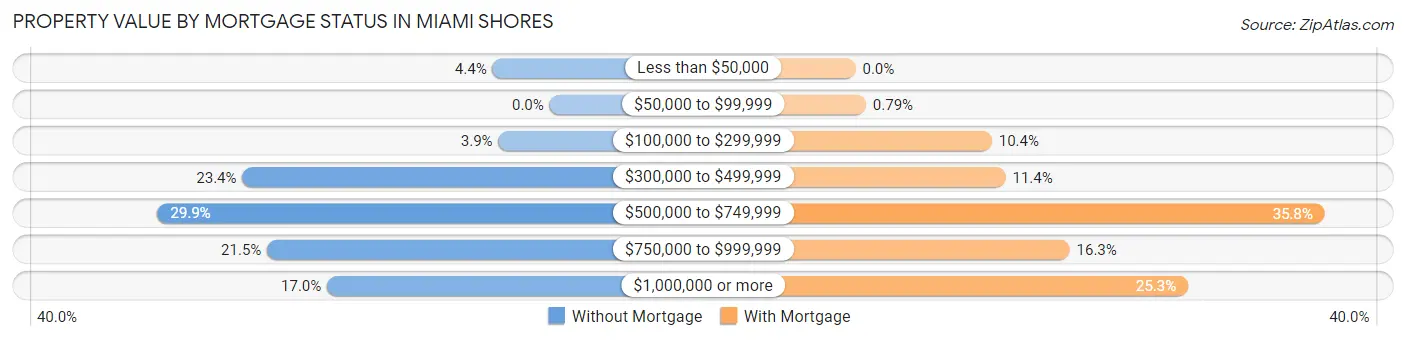
| Property Value | Without Mortgage | With Mortgage |
| Less than $50,000 | 39 (4.3%) | 0 (0.0%) |
| $50,000 to $99,999 | 0 (0.0%) | 18 (0.8%) |
| $100,000 to $299,999 | 35 (3.9%) | 236 (10.4%) |
| $300,000 to $499,999 | 210 (23.4%) | 260 (11.4%) |
| $500,000 to $749,999 | 268 (29.9%) | 813 (35.7%) |
| $750,000 to $999,999 | 193 (21.5%) | 371 (16.3%) |
| $1,000,000 or more | 152 (17.0%) | 576 (25.3%) |
| Total | 897 (100.0%) | 2,274 (100.0%) |
Household Income by Mortgage Status in Miami Shores
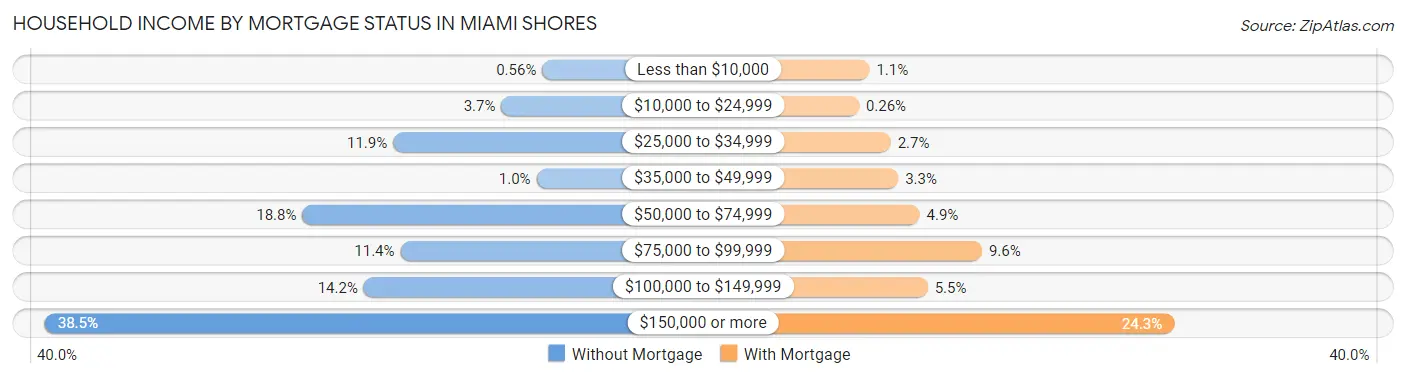
| Household Income | Without Mortgage | With Mortgage |
| Less than $10,000 | 5 (0.6%) | 24 (1.1%) |
| $10,000 to $24,999 | 33 (3.7%) | 6 (0.3%) |
| $25,000 to $34,999 | 107 (11.9%) | 61 (2.7%) |
| $35,000 to $49,999 | 9 (1.0%) | 74 (3.3%) |
| $50,000 to $74,999 | 169 (18.8%) | 111 (4.9%) |
| $75,000 to $99,999 | 102 (11.4%) | 219 (9.6%) |
| $100,000 to $149,999 | 127 (14.2%) | 125 (5.5%) |
| $150,000 or more | 345 (38.5%) | 552 (24.3%) |
| Total | 897 (100.0%) | 2,274 (100.0%) |
Property Value to Household Income Ratio in Miami Shores
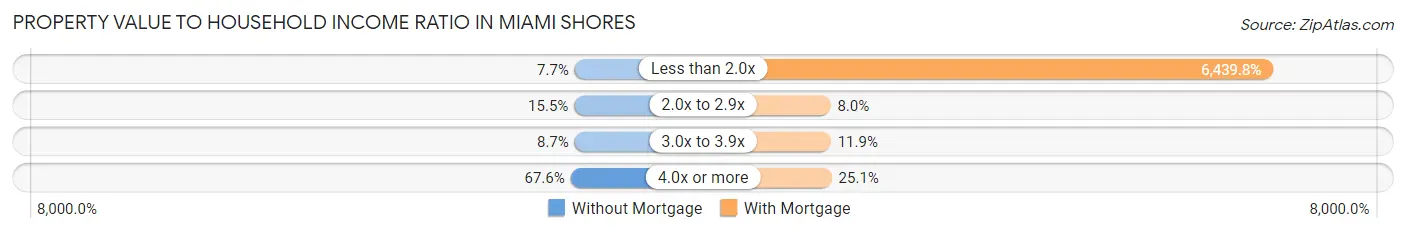
| Value-to-Income Ratio | Without Mortgage | With Mortgage |
| Less than 2.0x | 69 (7.7%) | 146,442 (6,439.8%) |
| 2.0x to 2.9x | 139 (15.5%) | 182 (8.0%) |
| 3.0x to 3.9x | 78 (8.7%) | 271 (11.9%) |
| 4.0x or more | 606 (67.6%) | 570 (25.1%) |
| Total | 897 (100.0%) | 2,274 (100.0%) |
Real Estate Taxes by Mortgage Status in Miami Shores
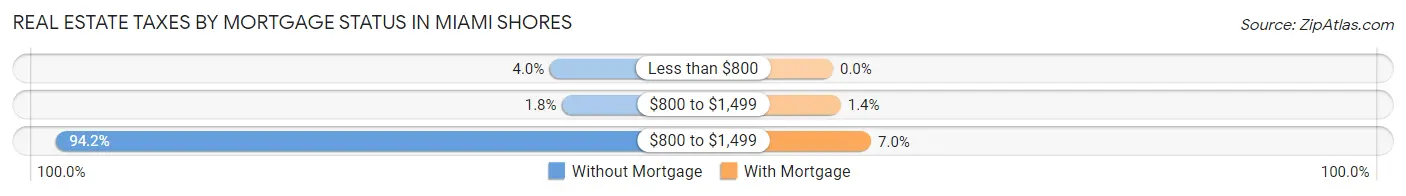
| Property Taxes | Without Mortgage | With Mortgage |
| Less than $800 | 36 (4.0%) | 0 (0.0%) |
| $800 to $1,499 | 16 (1.8%) | 32 (1.4%) |
| $800 to $1,499 | 845 (94.2%) | 158 (7.0%) |
| Total | 897 (100.0%) | 2,274 (100.0%) |
Health & Disability in Miami Shores
Health Insurance Coverage by Age in Miami Shores
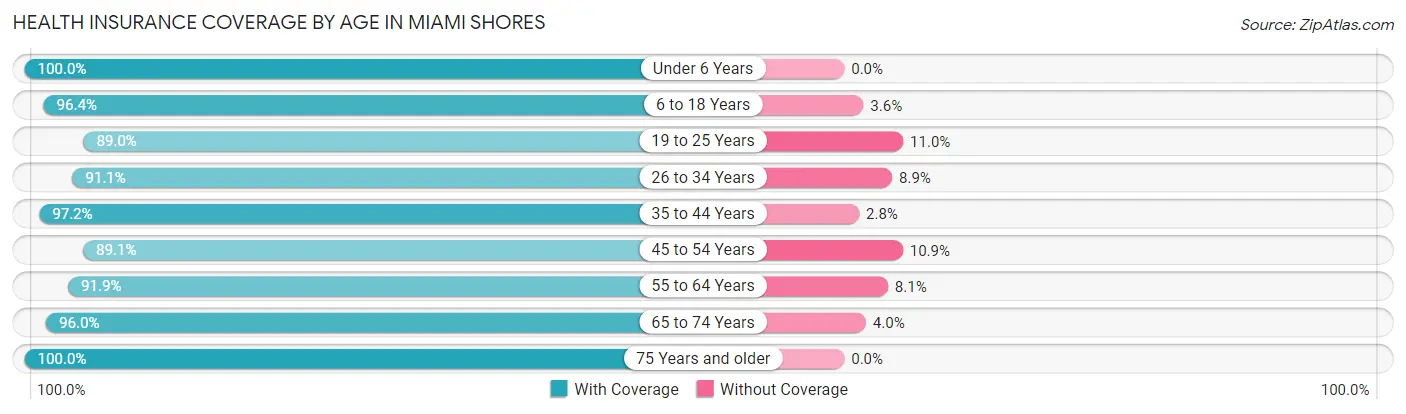
| Age Bracket | With Coverage | Without Coverage |
| Under 6 Years | 1,069 (100.0%) | 0 (0.0%) |
| 6 to 18 Years | 1,898 (96.4%) | 70 (3.6%) |
| 19 to 25 Years | 1,322 (89.0%) | 163 (11.0%) |
| 26 to 34 Years | 869 (91.1%) | 85 (8.9%) |
| 35 to 44 Years | 1,340 (97.2%) | 38 (2.8%) |
| 45 to 54 Years | 1,315 (89.1%) | 161 (10.9%) |
| 55 to 64 Years | 1,650 (91.9%) | 146 (8.1%) |
| 65 to 74 Years | 928 (96.0%) | 39 (4.0%) |
| 75 Years and older | 545 (100.0%) | 0 (0.0%) |
| Total | 10,936 (94.0%) | 702 (6.0%) |
Health Insurance Coverage by Citizenship Status in Miami Shores
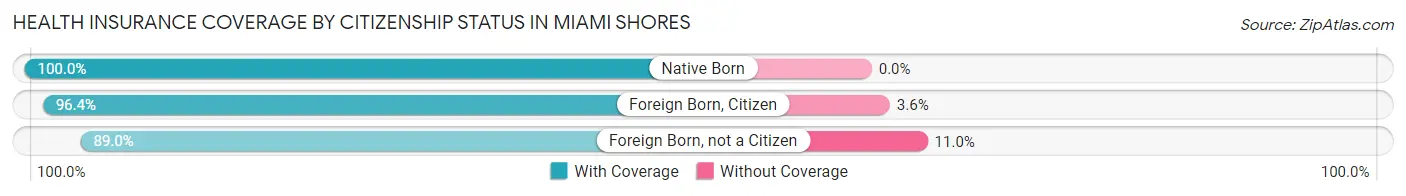
| Citizenship Status | With Coverage | Without Coverage |
| Native Born | 1,069 (100.0%) | 0 (0.0%) |
| Foreign Born, Citizen | 1,898 (96.4%) | 70 (3.6%) |
| Foreign Born, not a Citizen | 1,322 (89.0%) | 163 (11.0%) |
Health Insurance Coverage by Household Income in Miami Shores
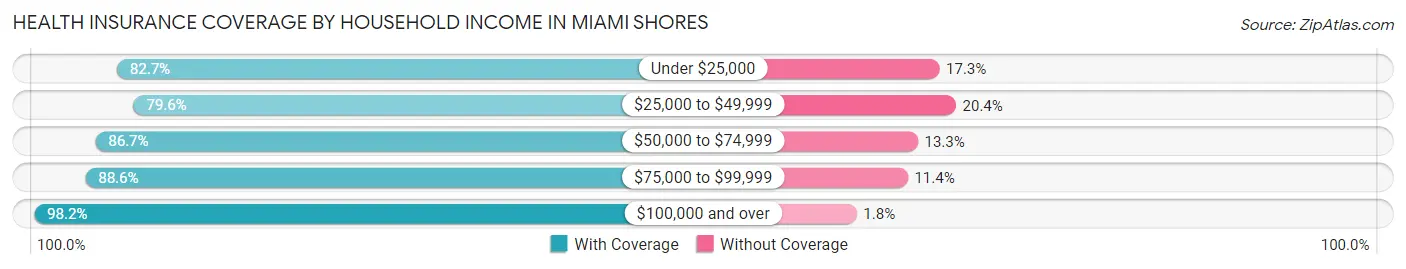
| Household Income | With Coverage | Without Coverage |
| Under $25,000 | 526 (82.7%) | 110 (17.3%) |
| $25,000 to $49,999 | 531 (79.6%) | 136 (20.4%) |
| $50,000 to $74,999 | 981 (86.7%) | 150 (13.3%) |
| $75,000 to $99,999 | 530 (88.6%) | 68 (11.4%) |
| $100,000 and over | 7,040 (98.2%) | 129 (1.8%) |
Public vs Private Health Insurance Coverage by Age in Miami Shores
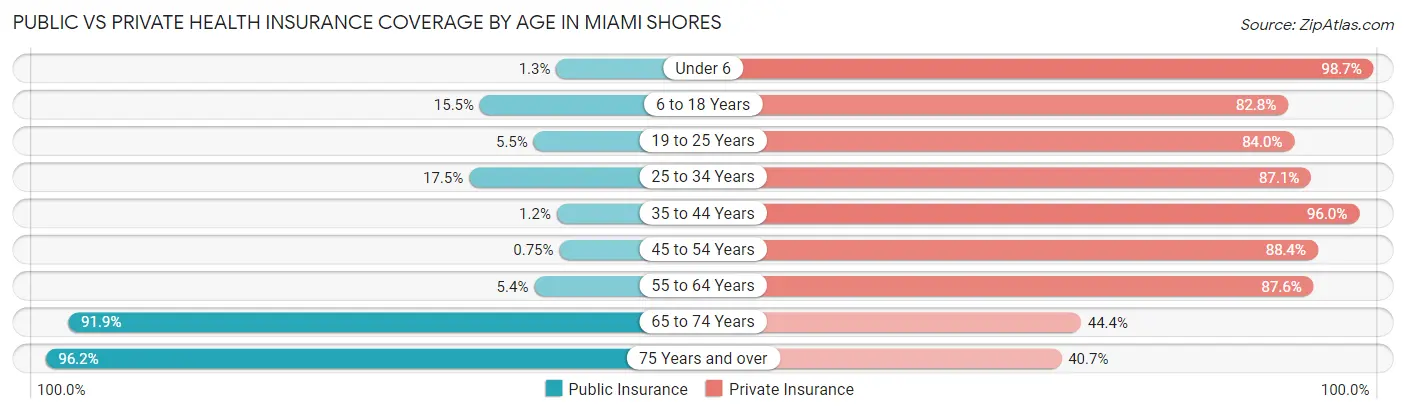
| Age Bracket | Public Insurance | Private Insurance |
| Under 6 | 14 (1.3%) | 1,055 (98.7%) |
| 6 to 18 Years | 305 (15.5%) | 1,630 (82.8%) |
| 19 to 25 Years | 82 (5.5%) | 1,247 (84.0%) |
| 25 to 34 Years | 167 (17.5%) | 831 (87.1%) |
| 35 to 44 Years | 17 (1.2%) | 1,323 (96.0%) |
| 45 to 54 Years | 11 (0.7%) | 1,304 (88.3%) |
| 55 to 64 Years | 97 (5.4%) | 1,573 (87.6%) |
| 65 to 74 Years | 889 (91.9%) | 429 (44.4%) |
| 75 Years and over | 524 (96.2%) | 222 (40.7%) |
| Total | 2,106 (18.1%) | 9,614 (82.6%) |
Disability Status by Sex by Age in Miami Shores
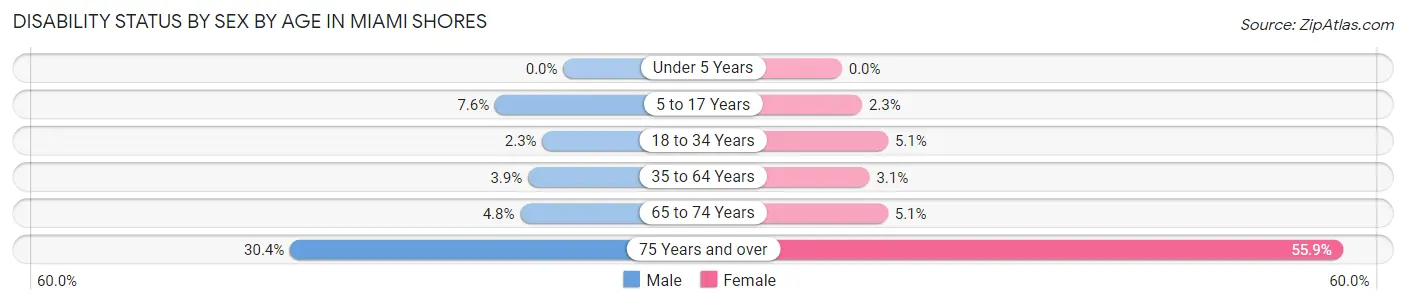
| Age Bracket | Male | Female |
| Under 5 Years | 0 (0.0%) | 0 (0.0%) |
| 5 to 17 Years | 41 (7.6%) | 20 (2.2%) |
| 18 to 34 Years | 25 (2.3%) | 104 (5.1%) |
| 35 to 64 Years | 96 (3.9%) | 68 (3.1%) |
| 65 to 74 Years | 22 (4.8%) | 26 (5.1%) |
| 75 Years and over | 70 (30.4%) | 176 (55.9%) |
Disability Class by Sex by Age in Miami Shores
Disability Class: Hearing Difficulty
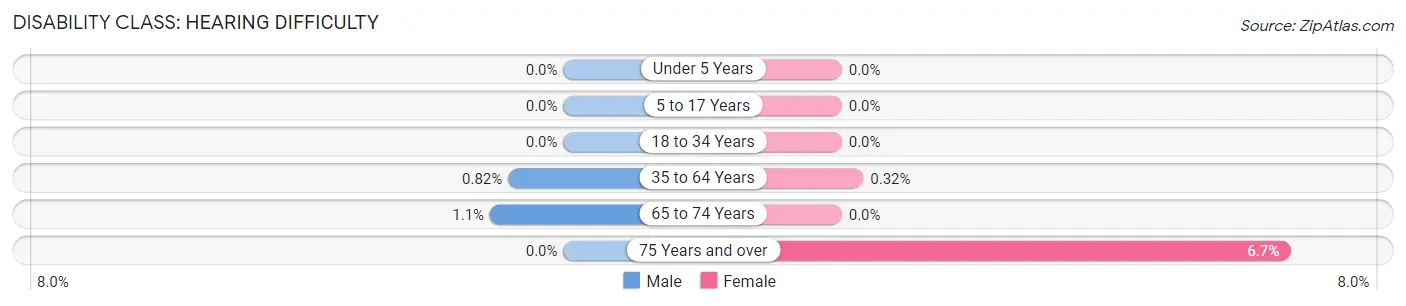
| Age Bracket | Male | Female |
| Under 5 Years | 0 (0.0%) | 0 (0.0%) |
| 5 to 17 Years | 0 (0.0%) | 0 (0.0%) |
| 18 to 34 Years | 0 (0.0%) | 0 (0.0%) |
| 35 to 64 Years | 20 (0.8%) | 7 (0.3%) |
| 65 to 74 Years | 5 (1.1%) | 0 (0.0%) |
| 75 Years and over | 0 (0.0%) | 21 (6.7%) |
Disability Class: Vision Difficulty
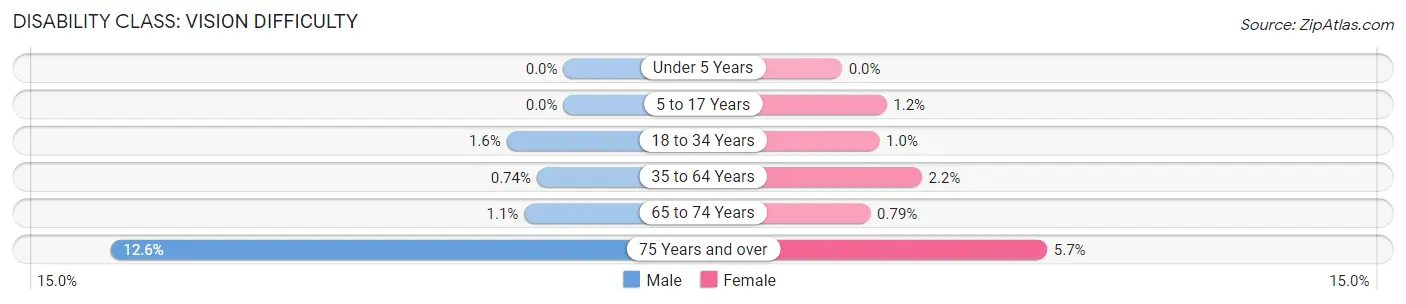
| Age Bracket | Male | Female |
| Under 5 Years | 0 (0.0%) | 0 (0.0%) |
| 5 to 17 Years | 0 (0.0%) | 11 (1.2%) |
| 18 to 34 Years | 17 (1.6%) | 21 (1.0%) |
| 35 to 64 Years | 18 (0.7%) | 49 (2.2%) |
| 65 to 74 Years | 5 (1.1%) | 4 (0.8%) |
| 75 Years and over | 29 (12.6%) | 18 (5.7%) |
Disability Class: Cognitive Difficulty
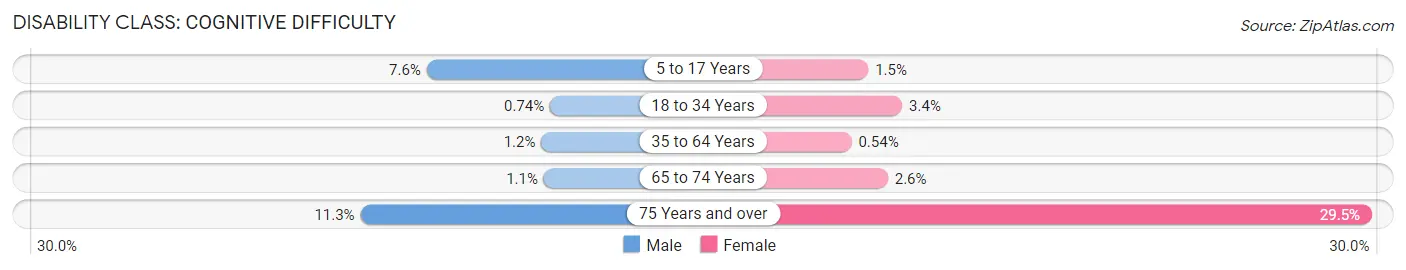
| Age Bracket | Male | Female |
| 5 to 17 Years | 41 (7.6%) | 13 (1.5%) |
| 18 to 34 Years | 8 (0.7%) | 68 (3.4%) |
| 35 to 64 Years | 30 (1.2%) | 12 (0.5%) |
| 65 to 74 Years | 5 (1.1%) | 13 (2.6%) |
| 75 Years and over | 26 (11.3%) | 93 (29.5%) |
Disability Class: Ambulatory Difficulty
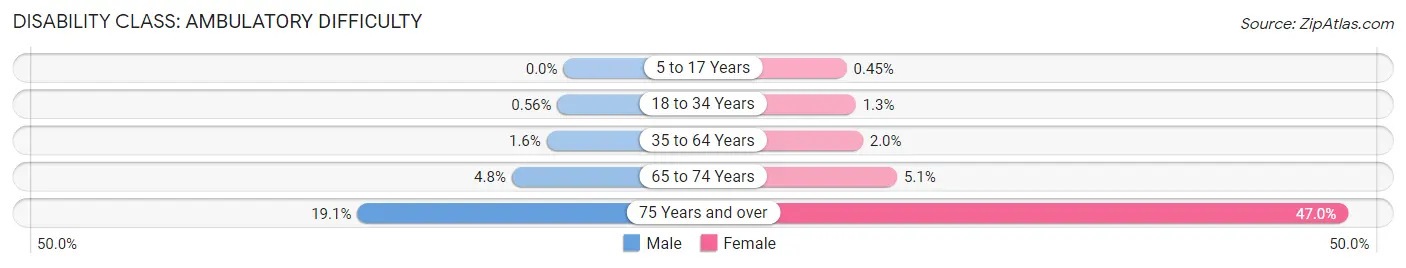
| Age Bracket | Male | Female |
| 5 to 17 Years | 0 (0.0%) | 4 (0.4%) |
| 18 to 34 Years | 6 (0.6%) | 26 (1.3%) |
| 35 to 64 Years | 38 (1.5%) | 43 (1.9%) |
| 65 to 74 Years | 22 (4.8%) | 26 (5.1%) |
| 75 Years and over | 44 (19.1%) | 148 (47.0%) |
Disability Class: Self-Care Difficulty
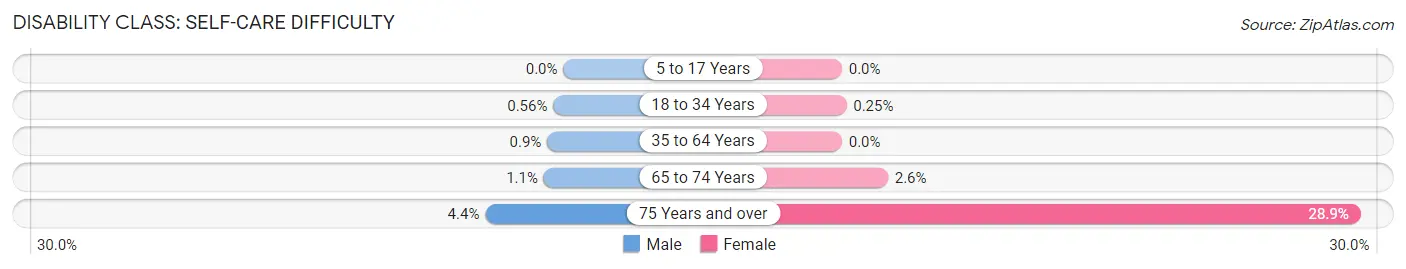
| Age Bracket | Male | Female |
| 5 to 17 Years | 0 (0.0%) | 0 (0.0%) |
| 18 to 34 Years | 6 (0.6%) | 5 (0.3%) |
| 35 to 64 Years | 22 (0.9%) | 0 (0.0%) |
| 65 to 74 Years | 5 (1.1%) | 13 (2.6%) |
| 75 Years and over | 10 (4.3%) | 91 (28.9%) |
Technology Access in Miami Shores
Computing Device Access in Miami Shores
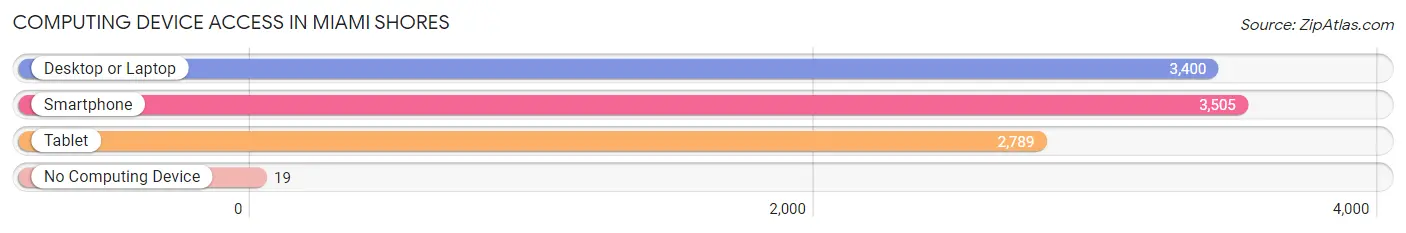
| Device Type | # Households | % Households |
| Desktop or Laptop | 3,400 | 90.5% |
| Smartphone | 3,505 | 93.3% |
| Tablet | 2,789 | 74.3% |
| No Computing Device | 19 | 0.5% |
| Total | 3,756 | 100.0% |
Internet Access in Miami Shores
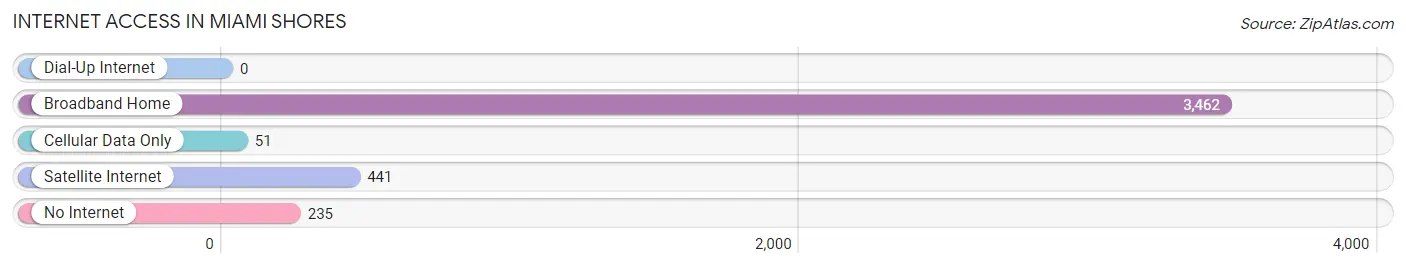
| Internet Type | # Households | % Households |
| Dial-Up Internet | 0 | 0.0% |
| Broadband Home | 3,462 | 92.2% |
| Cellular Data Only | 51 | 1.4% |
| Satellite Internet | 441 | 11.7% |
| No Internet | 235 | 6.3% |
| Total | 3,756 | 100.0% |
Miami Shores Summary
Miami Shores is a village located in Miami-Dade County, Florida, United States. It is located on the northern side of the Miami metropolitan area, just north of the city of Miami. The village is bordered by the cities of North Miami, El Portal, and Biscayne Park. As of the 2010 census, the population of Miami Shores was 10,380.
History
The area that is now Miami Shores was originally inhabited by the Tequesta Indians, who were the original inhabitants of the Miami area. The Tequesta Indians were a peaceful tribe that lived off the land, fishing and hunting. The area was first settled by Europeans in the late 19th century, when a group of settlers from the Bahamas arrived in the area. The settlers established a small fishing village, which they named “Miami Shores”.
In 1925, the village was incorporated as a municipality. The village was originally intended to be a residential community, and the village was designed to be a “model village”, with wide streets, large lots, and a variety of housing styles. The village was also designed to be a “garden city”, with lush landscaping and parks.
In the 1950s, the village began to experience rapid growth, as the population of Miami-Dade County began to increase. The village was annexed by the city of Miami in 1954, and the population of the village continued to grow. In the 1960s, the village began to experience a period of suburbanization, as many of the residents of the village began to move to the suburbs.
Geography
Miami Shores is located in Miami-Dade County, Florida, United States. It is located on the northern side of the Miami metropolitan area, just north of the city of Miami. The village is bordered by the cities of North Miami, El Portal, and Biscayne Park. The village is located on the Atlantic coast, and is situated on the Miami River. The village is located at an elevation of 6 feet (1.8 m) above sea level.
The village covers an area of 2.3 square miles (6.0 km2), of which 0.2 square miles (0.5 km2) is water. The village is located in a tropical climate, with hot and humid summers and mild winters. The average temperature in the village is 78°F (26°C).
Economy
The economy of Miami Shores is largely based on tourism and service industries. The village is home to a variety of restaurants, bars, and shops, as well as a number of hotels and resorts. The village is also home to a number of corporate offices, including those of Burger King, Carnival Cruise Lines, and Ryder Systems.
The village is also home to a number of educational institutions, including Barry University, Florida International University, and Miami Dade College. The village is also home to a number of medical facilities, including the Miami Shores Medical Center and the Miami Shores Surgical Center.
Demographics
As of the 2010 census, the population of Miami Shores was 10,380. The population is composed of a diverse mix of ethnicities, including White (63.2%), Hispanic or Latino (20.2%), African American (10.3%), and Asian (3.2%). The median household income in the village is $50,945, and the median age is 41.7 years. The village has a high rate of homeownership, with 73.3% of the population owning their own homes.
Common Questions
What is Per Capita Income in Miami Shores?
Per Capita income in Miami Shores is $54,518.
What is the Median Family Income in Miami Shores?
Median Family Income in Miami Shores is $144,375.
What is the Median Household income in Miami Shores?
Median Household Income in Miami Shores is $120,833.
What is Income or Wage Gap in Miami Shores?
Income or Wage Gap in Miami Shores is 37.1%.
Women in Miami Shores earn 62.9 cents for every dollar earned by a man.
What is Inequality or Gini Index in Miami Shores?
Inequality or Gini Index in Miami Shores is 0.44.
What is the Total Population of Miami Shores?
Total Population of Miami Shores is 11,638.
What is the Total Male Population of Miami Shores?
Total Male Population of Miami Shores is 5,217.
What is the Total Female Population of Miami Shores?
Total Female Population of Miami Shores is 6,421.
What is the Ratio of Males per 100 Females in Miami Shores?
There are 81.25 Males per 100 Females in Miami Shores.
What is the Ratio of Females per 100 Males in Miami Shores?
There are 123.08 Females per 100 Males in Miami Shores.
What is the Median Population Age in Miami Shores?
Median Population Age in Miami Shores is 38.0 Years.
What is the Average Family Size in Miami Shores
Average Family Size in Miami Shores is 3.3 People.
What is the Average Household Size in Miami Shores
Average Household Size in Miami Shores is 2.7 People.
How Large is the Labor Force in Miami Shores?
There are 5,957 People in the Labor Forcein in Miami Shores.
What is the Percentage of People in the Labor Force in Miami Shores?
62.9% of People are in the Labor Force in Miami Shores.
What is the Unemployment Rate in Miami Shores?
Unemployment Rate in Miami Shores is 7.0%.