Lake Clarke Shores, FL Map & Demographics
Lake Clarke Shores Map
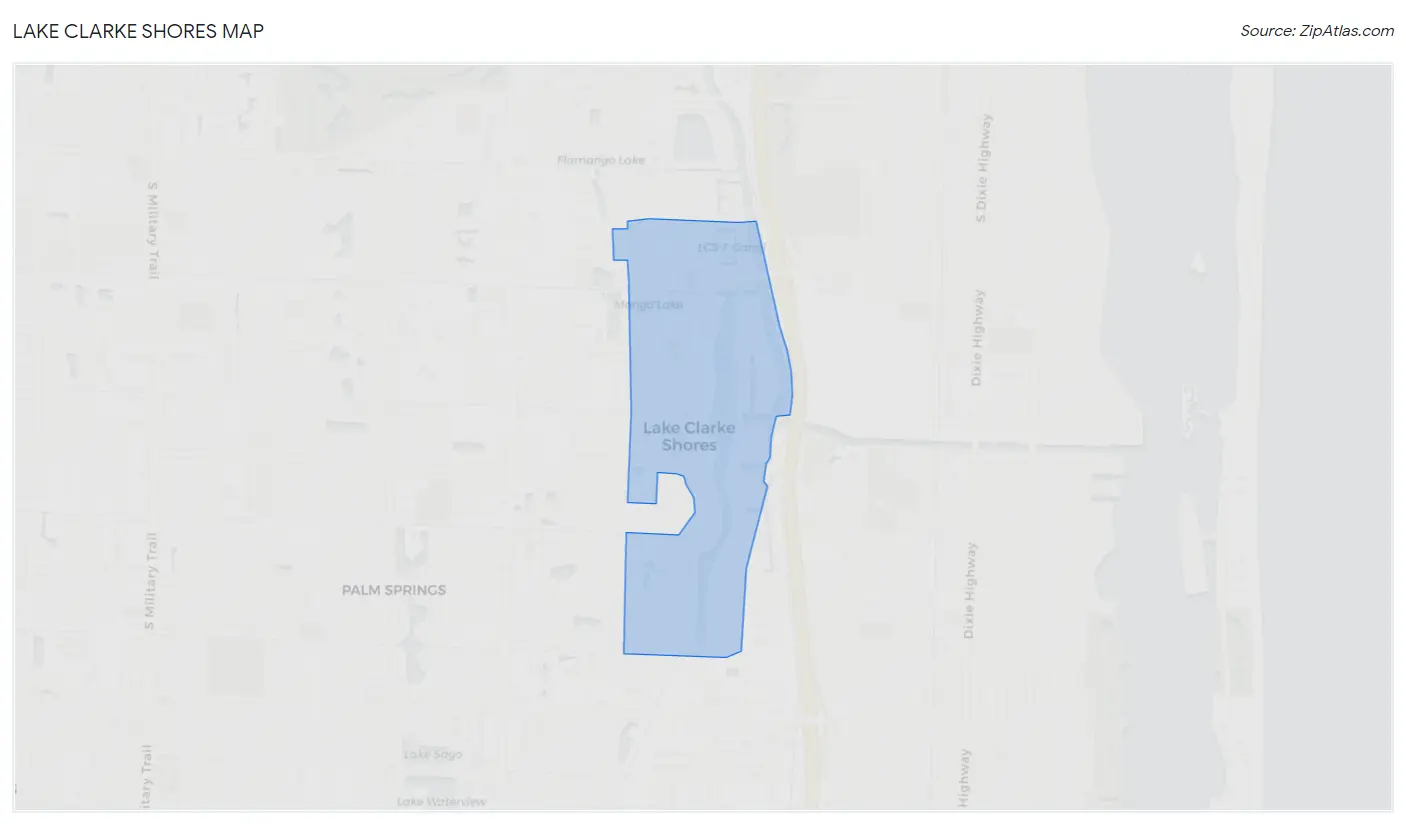
Lake Clarke Shores Overview
$55,108
PER CAPITA INCOME
$151,161
AVG FAMILY INCOME
$133,333
AVG HOUSEHOLD INCOME
11.1%
WAGE / INCOME GAP [ % ]
88.9¢/ $1
WAGE / INCOME GAP [ $ ]
0.44
INEQUALITY / GINI INDEX
3,553
TOTAL POPULATION
1,702
MALE POPULATION
1,851
FEMALE POPULATION
91.95
MALES / 100 FEMALES
108.75
FEMALES / 100 MALES
42.9
MEDIAN AGE
3.5
AVG FAMILY SIZE
3.3
AVG HOUSEHOLD SIZE
2,055
LABOR FORCE [ PEOPLE ]
68.4%
PERCENT IN LABOR FORCE
7.4%
UNEMPLOYMENT RATE
Lake Clarke Shores Area Codes
Income in Lake Clarke Shores
Income Overview in Lake Clarke Shores
Per Capita Income in Lake Clarke Shores is $55,108, while median incomes of families and households are $151,161 and $133,333 respectively.
| Characteristic | Number | Measure |
| Per Capita Income | 3,553 | $55,108 |
| Median Family Income | 929 | $151,161 |
| Mean Family Income | 929 | $189,449 |
| Median Household Income | 1,076 | $133,333 |
| Mean Household Income | 1,076 | $177,957 |
| Income Deficit | 929 | $0 |
| Wage / Income Gap (%) | 3,553 | 11.13% |
| Wage / Income Gap ($) | 3,553 | 88.87¢ per $1 |
| Gini / Inequality Index | 3,553 | 0.44 |
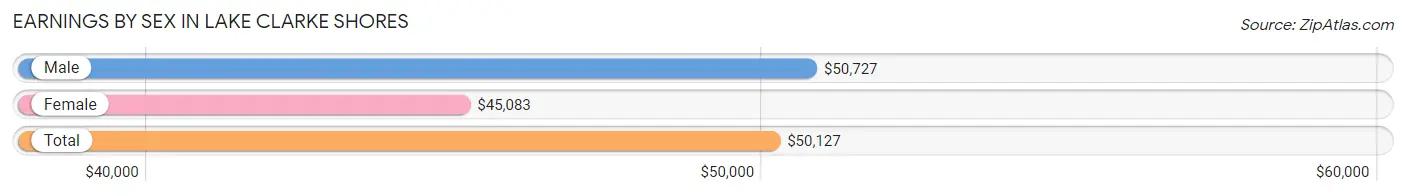
Earnings by Sex in Lake Clarke Shores
Average Earnings in Lake Clarke Shores are $50,127, $50,727 for men and $45,083 for women, a difference of 11.1%.
| Sex | Number | Average Earnings |
| Male | 1,121 (56.0%) | $50,727 |
| Female | 881 (44.0%) | $45,083 |
| Total | 2,002 (100.0%) | $50,127 |
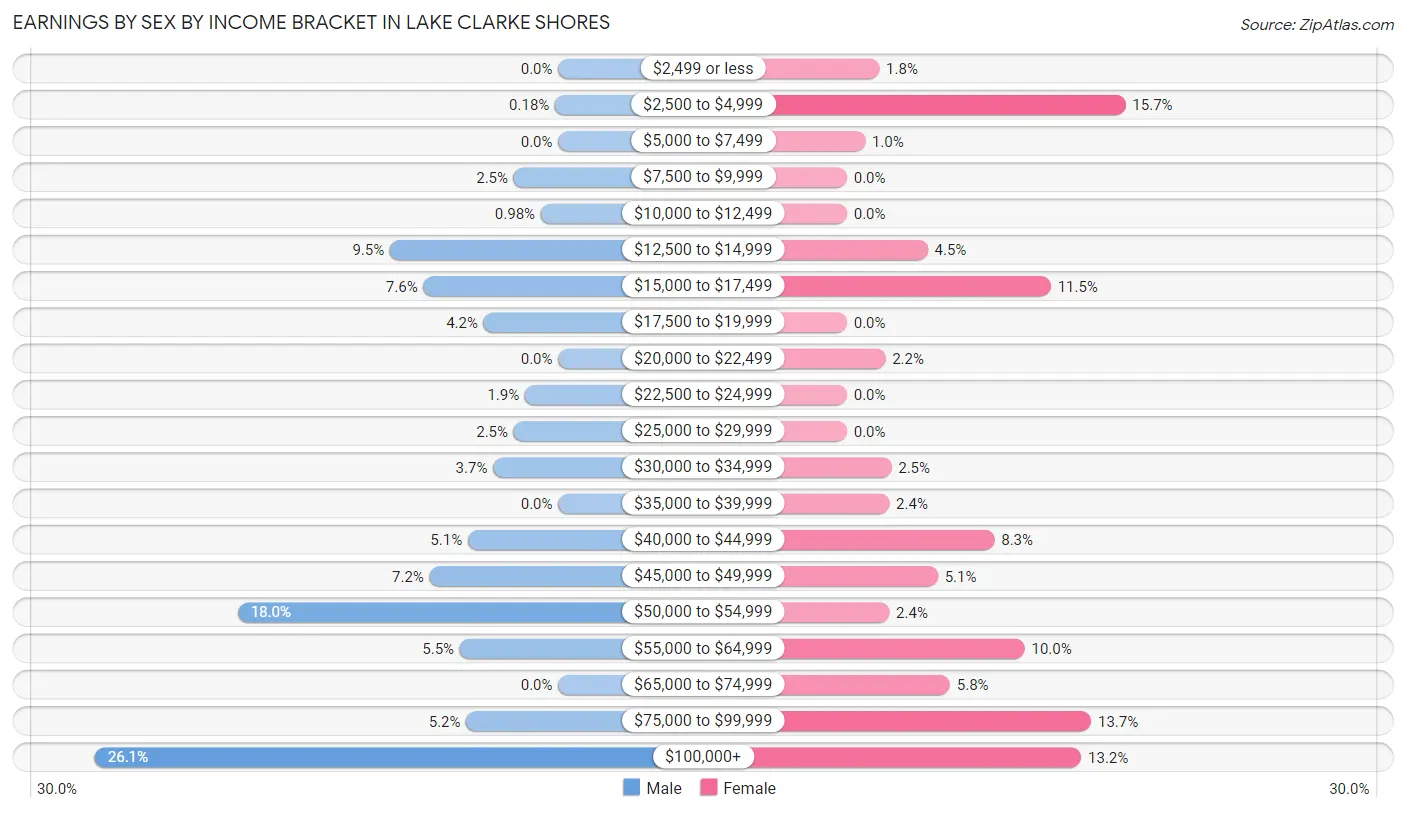
Earnings by Sex by Income Bracket in Lake Clarke Shores
The most common earnings brackets in Lake Clarke Shores are $100,000+ for men (292 | 26.1%) and $2,500 to $4,999 for women (138 | 15.7%).
| Income | Male | Female |
| $2,499 or less | 0 (0.0%) | 16 (1.8%) |
| $2,500 to $4,999 | 2 (0.2%) | 138 (15.7%) |
| $5,000 to $7,499 | 0 (0.0%) | 9 (1.0%) |
| $7,500 to $9,999 | 28 (2.5%) | 0 (0.0%) |
| $10,000 to $12,499 | 11 (1.0%) | 0 (0.0%) |
| $12,500 to $14,999 | 106 (9.5%) | 40 (4.5%) |
| $15,000 to $17,499 | 85 (7.6%) | 101 (11.5%) |
| $17,500 to $19,999 | 47 (4.2%) | 0 (0.0%) |
| $20,000 to $22,499 | 0 (0.0%) | 19 (2.2%) |
| $22,500 to $24,999 | 21 (1.9%) | 0 (0.0%) |
| $25,000 to $29,999 | 28 (2.5%) | 0 (0.0%) |
| $30,000 to $34,999 | 41 (3.7%) | 22 (2.5%) |
| $35,000 to $39,999 | 0 (0.0%) | 21 (2.4%) |
| $40,000 to $44,999 | 57 (5.1%) | 73 (8.3%) |
| $45,000 to $49,999 | 81 (7.2%) | 45 (5.1%) |
| $50,000 to $54,999 | 202 (18.0%) | 21 (2.4%) |
| $55,000 to $64,999 | 62 (5.5%) | 88 (10.0%) |
| $65,000 to $74,999 | 0 (0.0%) | 51 (5.8%) |
| $75,000 to $99,999 | 58 (5.2%) | 121 (13.7%) |
| $100,000+ | 292 (26.1%) | 116 (13.2%) |
| Total | 1,121 (100.0%) | 881 (100.0%) |
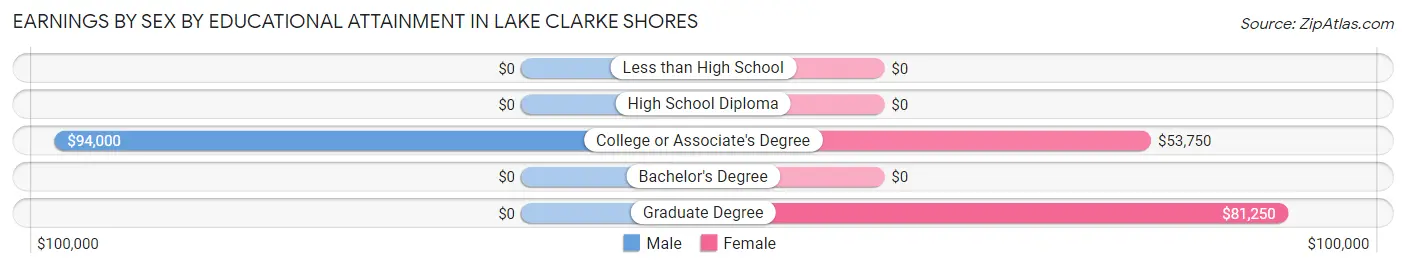
Earnings by Sex by Educational Attainment in Lake Clarke Shores
| Educational Attainment | Male Income | Female Income |
| Less than High School | - | - |
| High School Diploma | - | - |
| College or Associate's Degree | $94,000 | $53,750 |
| Bachelor's Degree | - | - |
| Graduate Degree | - | - |
| Total | - | - |
Family Income in Lake Clarke Shores
Family Income Brackets in Lake Clarke Shores
According to the Lake Clarke Shores family income data, there are 320 families falling into the $200,000+ income range, which is the most common income bracket and makes up 34.4% of all families.
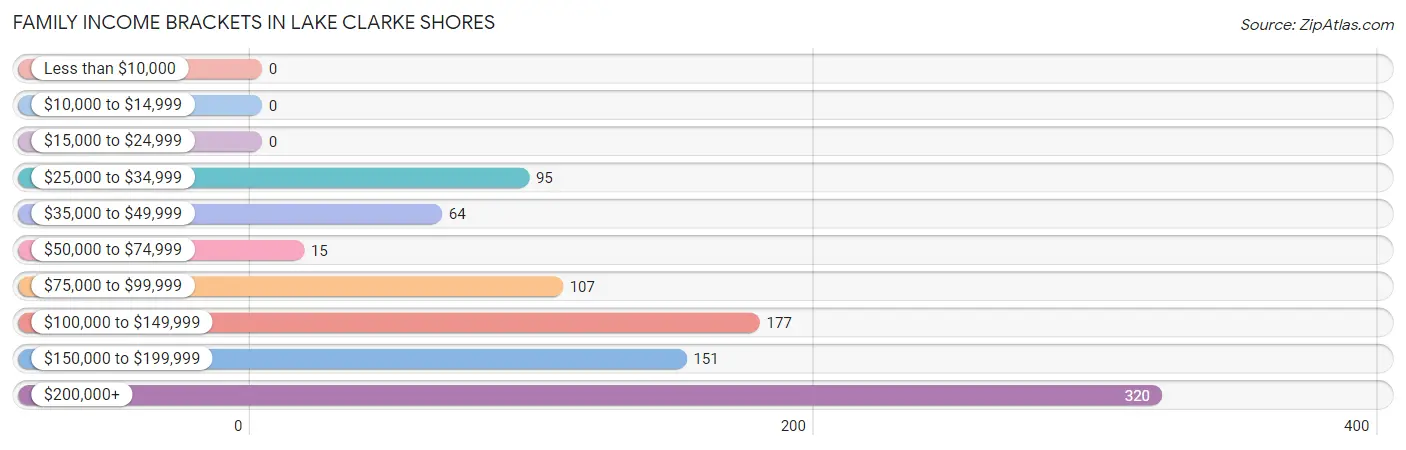
| Income Bracket | # Families | % Families |
| Less than $10,000 | 0 | 0.0% |
| $10,000 to $14,999 | 0 | 0.0% |
| $15,000 to $24,999 | 0 | 0.0% |
| $25,000 to $34,999 | 95 | 10.2% |
| $35,000 to $49,999 | 64 | 6.9% |
| $50,000 to $74,999 | 15 | 1.6% |
| $75,000 to $99,999 | 107 | 11.5% |
| $100,000 to $149,999 | 177 | 19.1% |
| $150,000 to $199,999 | 151 | 16.3% |
| $200,000+ | 320 | 34.4% |
Family Income by Famaliy Size in Lake Clarke Shores
4-person families (222 | 23.9%) account for the highest median family income in Lake Clarke Shores with $146,136 per family, while 2-person families (330 | 35.5%) have the highest median income of $56,691 per family member.
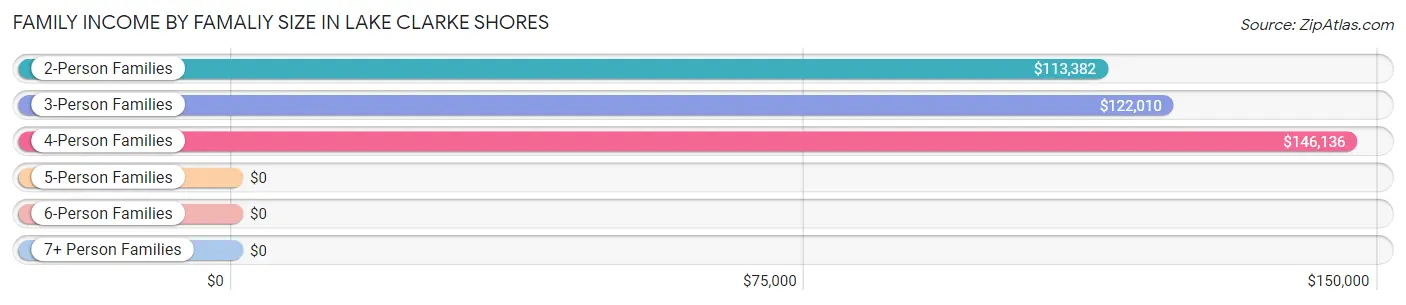
| Income Bracket | # Families | Median Income |
| 2-Person Families | 330 (35.5%) | $113,382 |
| 3-Person Families | 208 (22.4%) | $122,010 |
| 4-Person Families | 222 (23.9%) | $146,136 |
| 5-Person Families | 32 (3.4%) | $0 |
| 6-Person Families | 137 (14.7%) | $0 |
| 7+ Person Families | 0 (0.0%) | $0 |
| Total | 929 (100.0%) | $151,161 |
Family Income by Number of Earners in Lake Clarke Shores
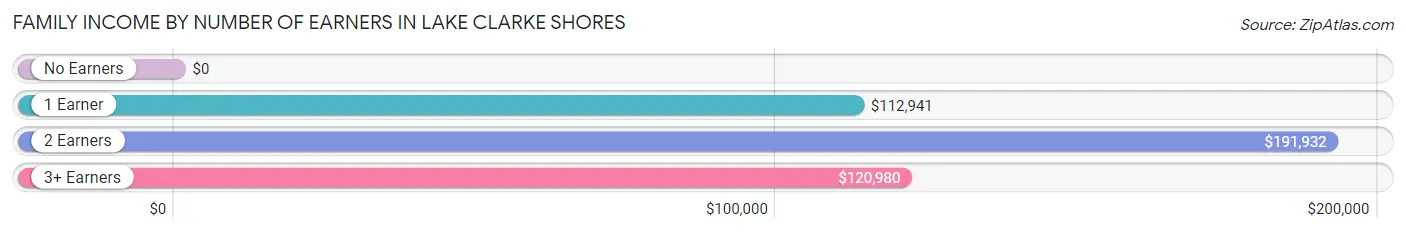
| Number of Earners | # Families | Median Income |
| No Earners | 81 (8.7%) | $0 |
| 1 Earner | 196 (21.1%) | $112,941 |
| 2 Earners | 442 (47.6%) | $191,932 |
| 3+ Earners | 210 (22.6%) | $120,980 |
| Total | 929 (100.0%) | $151,161 |
Household Income in Lake Clarke Shores
Household Income Brackets in Lake Clarke Shores
With 358 households falling in the category, the $200,000+ income range is the most frequent in Lake Clarke Shores, accounting for 33.3% of all households. In contrast, only 11 households (1.0%) fall into the $10,000 to $14,999 income bracket, making it the least populous group.
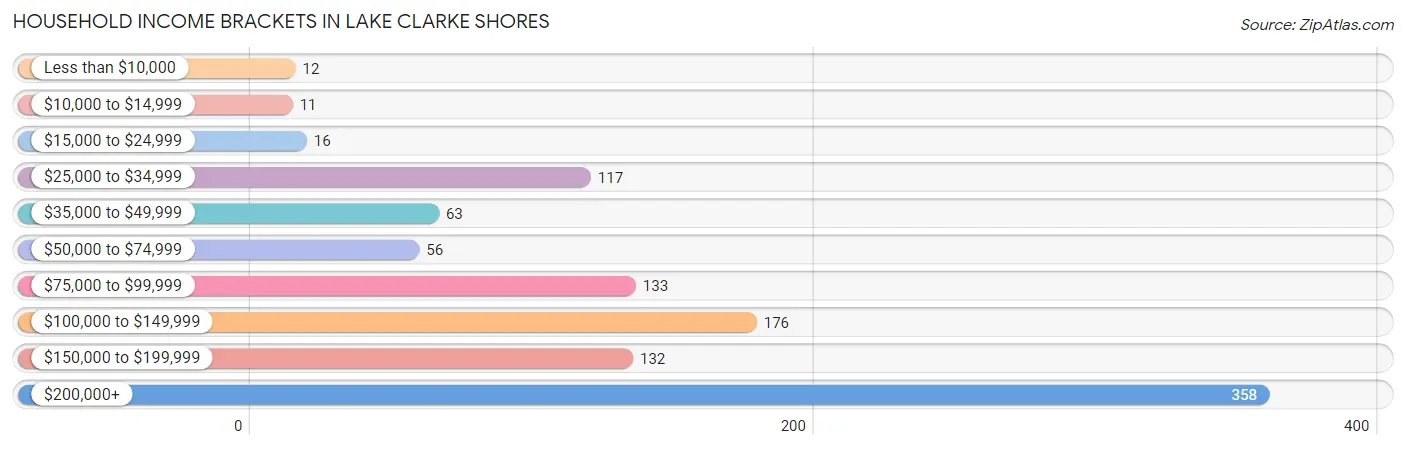
| Income Bracket | # Households | % Households |
| Less than $10,000 | 12 | 1.1% |
| $10,000 to $14,999 | 11 | 1.0% |
| $15,000 to $24,999 | 16 | 1.5% |
| $25,000 to $34,999 | 117 | 10.9% |
| $35,000 to $49,999 | 63 | 5.9% |
| $50,000 to $74,999 | 56 | 5.2% |
| $75,000 to $99,999 | 133 | 12.4% |
| $100,000 to $149,999 | 176 | 16.4% |
| $150,000 to $199,999 | 132 | 12.3% |
| $200,000+ | 358 | 33.3% |
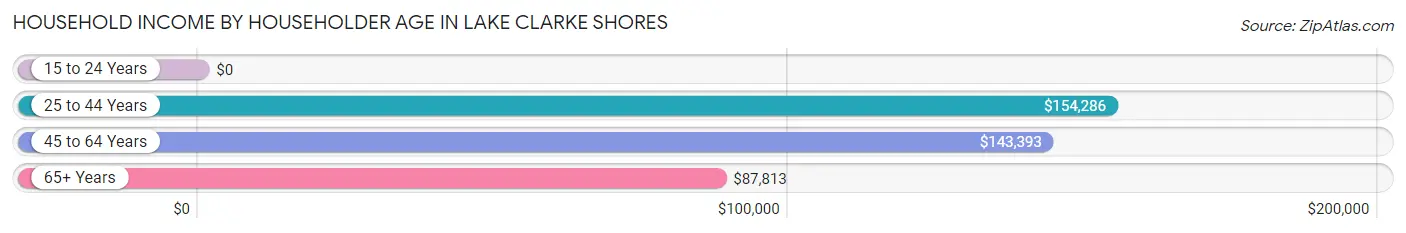
Household Income by Householder Age in Lake Clarke Shores
The median household income in Lake Clarke Shores is $133,333, with the highest median household income of $154,286 found in the 25 to 44 years age bracket for the primary householder. A total of 110 households (10.2%) fall into this category.
| Income Bracket | # Households | Median Income |
| 15 to 24 Years | 0 (0.0%) | $0 |
| 25 to 44 Years | 110 (10.2%) | $154,286 |
| 45 to 64 Years | 694 (64.5%) | $143,393 |
| 65+ Years | 272 (25.3%) | $87,813 |
| Total | 1,076 (100.0%) | $133,333 |
Poverty in Lake Clarke Shores
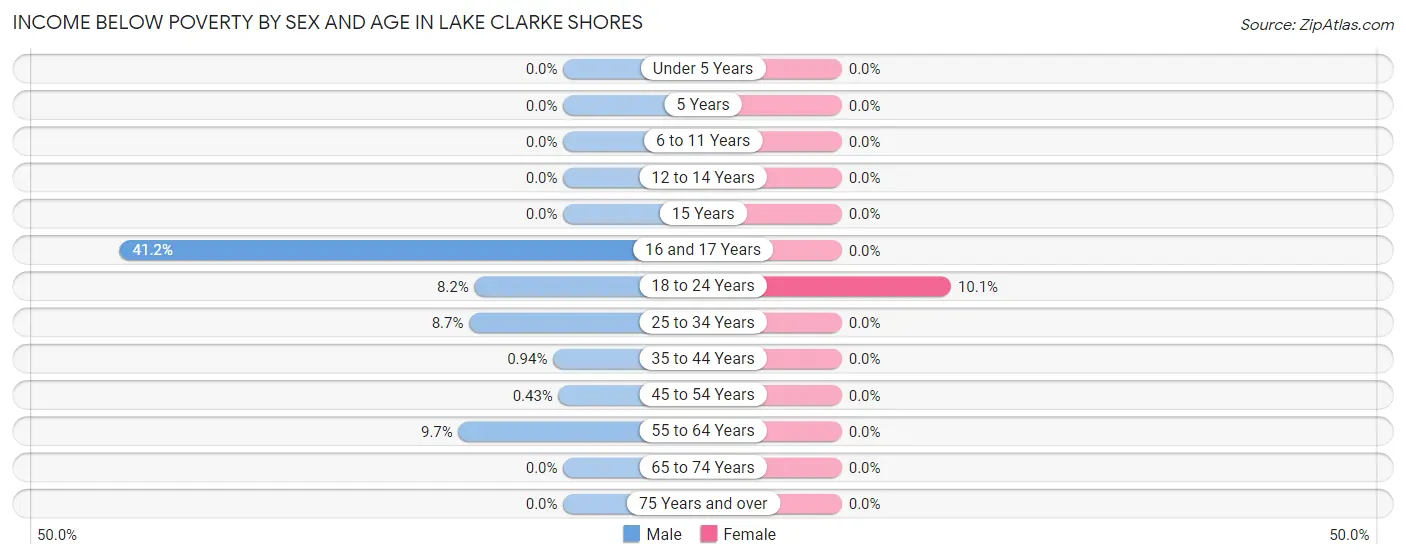
Income Below Poverty by Sex and Age in Lake Clarke Shores
With 4.6% poverty level for males and 1.2% for females among the residents of Lake Clarke Shores, 16 and 17 year old males and 18 to 24 year old females are the most vulnerable to poverty, with 21 males (41.2%) and 23 females (10.1%) in their respective age groups living below the poverty level.
| Age Bracket | Male | Female |
| Under 5 Years | 0 (0.0%) | 0 (0.0%) |
| 5 Years | 0 (0.0%) | 0 (0.0%) |
| 6 to 11 Years | 0 (0.0%) | 0 (0.0%) |
| 12 to 14 Years | 0 (0.0%) | 0 (0.0%) |
| 15 Years | 0 (0.0%) | 0 (0.0%) |
| 16 and 17 Years | 21 (41.2%) | 0 (0.0%) |
| 18 to 24 Years | 28 (8.2%) | 23 (10.1%) |
| 25 to 34 Years | 11 (8.7%) | 0 (0.0%) |
| 35 to 44 Years | 1 (0.9%) | 0 (0.0%) |
| 45 to 54 Years | 2 (0.4%) | 0 (0.0%) |
| 55 to 64 Years | 14 (9.7%) | 0 (0.0%) |
| 65 to 74 Years | 0 (0.0%) | 0 (0.0%) |
| 75 Years and over | 0 (0.0%) | 0 (0.0%) |
| Total | 77 (4.6%) | 23 (1.2%) |
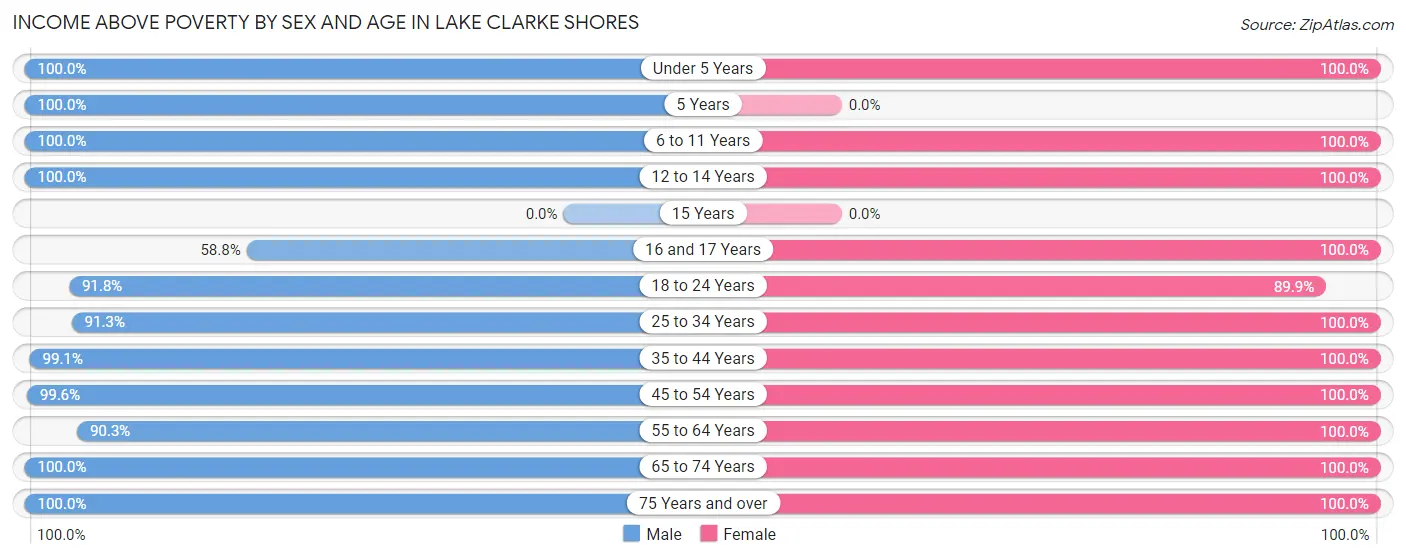
Income Above Poverty by Sex and Age in Lake Clarke Shores
According to the poverty statistics in Lake Clarke Shores, males aged under 5 years and females aged under 5 years are the age groups that are most secure financially, with 100.0% of males and 100.0% of females in these age groups living above the poverty line.
| Age Bracket | Male | Female |
| Under 5 Years | 42 (100.0%) | 67 (100.0%) |
| 5 Years | 22 (100.0%) | 0 (0.0%) |
| 6 to 11 Years | 198 (100.0%) | 31 (100.0%) |
| 12 to 14 Years | 15 (100.0%) | 149 (100.0%) |
| 15 Years | 0 (0.0%) | 0 (0.0%) |
| 16 and 17 Years | 30 (58.8%) | 170 (100.0%) |
| 18 to 24 Years | 312 (91.8%) | 204 (89.9%) |
| 25 to 34 Years | 115 (91.3%) | 107 (100.0%) |
| 35 to 44 Years | 105 (99.1%) | 146 (100.0%) |
| 45 to 54 Years | 462 (99.6%) | 514 (100.0%) |
| 55 to 64 Years | 130 (90.3%) | 172 (100.0%) |
| 65 to 74 Years | 102 (100.0%) | 184 (100.0%) |
| 75 Years and over | 68 (100.0%) | 84 (100.0%) |
| Total | 1,601 (95.4%) | 1,828 (98.8%) |
Income Below Poverty Among Married-Couple Families in Lake Clarke Shores
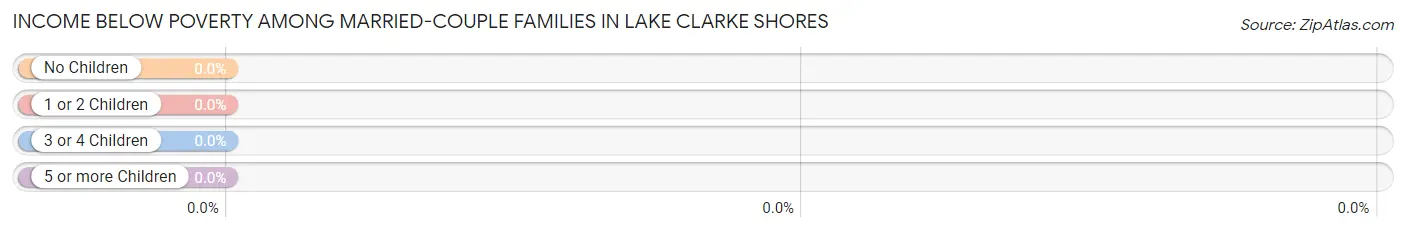
| Children | Above Poverty | Below Poverty |
| No Children | 402 (100.0%) | 0 (0.0%) |
| 1 or 2 Children | 350 (100.0%) | 0 (0.0%) |
| 3 or 4 Children | 32 (100.0%) | 0 (0.0%) |
| 5 or more Children | 0 (0.0%) | 0 (0.0%) |
| Total | 784 (100.0%) | 0 (0.0%) |
Income Below Poverty Among Single-Parent Households in Lake Clarke Shores
| Children | Single Father | Single Mother |
| No Children | 0 (0.0%) | 0 (0.0%) |
| 1 or 2 Children | 0 (0.0%) | 0 (0.0%) |
| 3 or 4 Children | 0 (0.0%) | 0 (0.0%) |
| 5 or more Children | 0 (0.0%) | 0 (0.0%) |
| Total | 0 (0.0%) | 0 (0.0%) |
Income Below Poverty Among Married-Couple vs Single-Parent Households in Lake Clarke Shores
| Children | Married-Couple Families | Single-Parent Households |
| No Children | 0 (0.0%) | 0 (0.0%) |
| 1 or 2 Children | 0 (0.0%) | 0 (0.0%) |
| 3 or 4 Children | 0 (0.0%) | 0 (0.0%) |
| 5 or more Children | 0 (0.0%) | 0 (0.0%) |
| Total | 0 (0.0%) | 0 (0.0%) |
Race in Lake Clarke Shores
The most populous races in Lake Clarke Shores are White / Caucasian (3,098 | 87.2%), Hispanic or Latino (991 | 27.9%), and Two or more Races (275 | 7.7%).
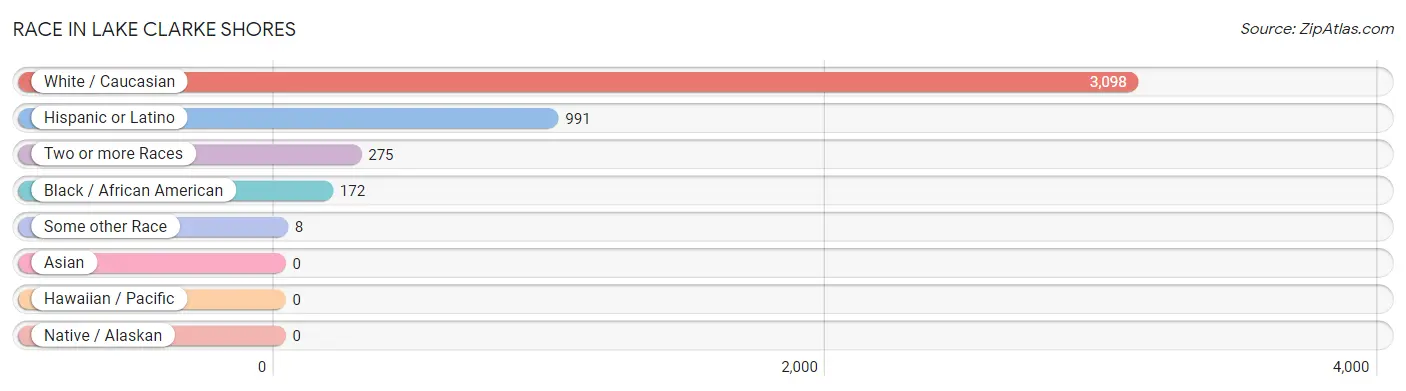
| Race | # Population | % Population |
| Asian | 0 | 0.0% |
| Black / African American | 172 | 4.8% |
| Hawaiian / Pacific | 0 | 0.0% |
| Hispanic or Latino | 991 | 27.9% |
| Native / Alaskan | 0 | 0.0% |
| White / Caucasian | 3,098 | 87.2% |
| Two or more Races | 275 | 7.7% |
| Some other Race | 8 | 0.2% |
| Total | 3,553 | 100.0% |
Ancestry in Lake Clarke Shores
The most populous ancestries reported in Lake Clarke Shores are German (1,233 | 34.7%), Irish (1,034 | 29.1%), Spanish (388 | 10.9%), Cuban (273 | 7.7%), and Brazilian (263 | 7.4%), together accounting for 89.8% of all Lake Clarke Shores residents.
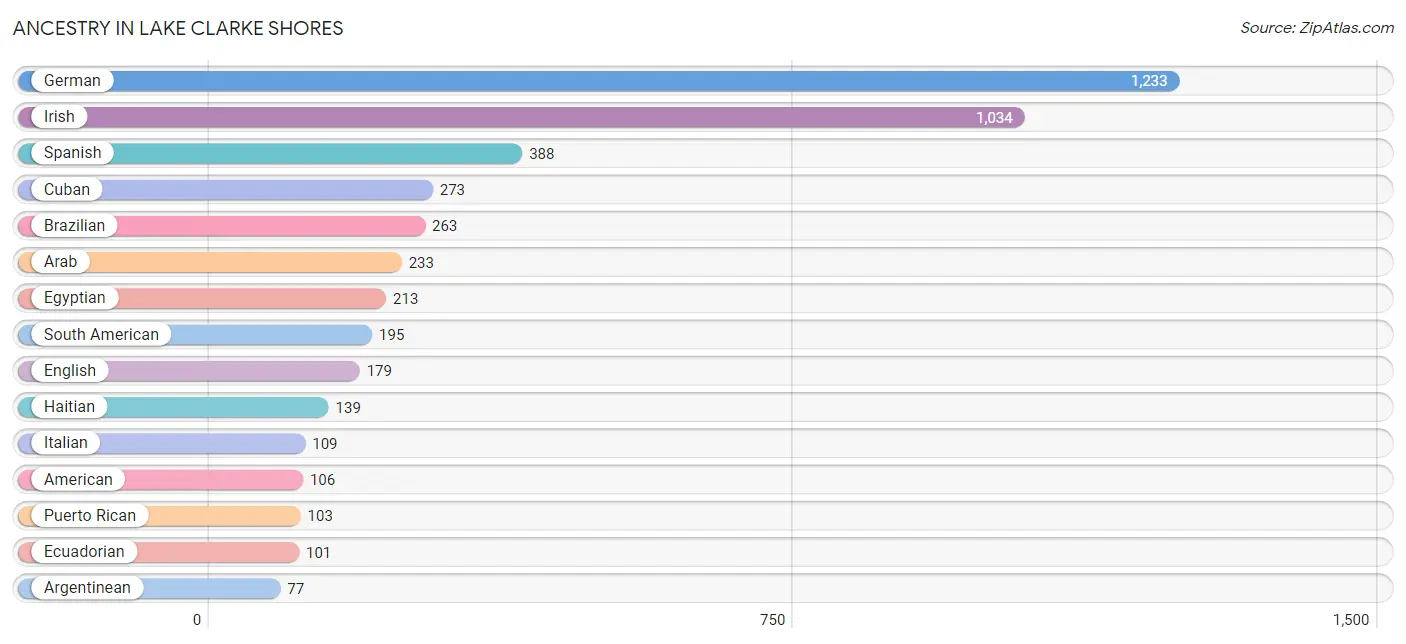
| Ancestry | # Population | % Population |
| American | 106 | 3.0% |
| Arab | 233 | 6.6% |
| Argentinean | 77 | 2.2% |
| Brazilian | 263 | 7.4% |
| British | 15 | 0.4% |
| Central American | 13 | 0.4% |
| Colombian | 10 | 0.3% |
| Cuban | 273 | 7.7% |
| Eastern European | 36 | 1.0% |
| Ecuadorian | 101 | 2.8% |
| Egyptian | 213 | 6.0% |
| English | 179 | 5.0% |
| European | 11 | 0.3% |
| Finnish | 16 | 0.4% |
| French | 13 | 0.4% |
| French Canadian | 32 | 0.9% |
| German | 1,233 | 34.7% |
| Haitian | 139 | 3.9% |
| Honduran | 13 | 0.4% |
| Irish | 1,034 | 29.1% |
| Italian | 109 | 3.1% |
| Jamaican | 55 | 1.5% |
| Korean | 16 | 0.4% |
| Mexican | 1 | 0.0% |
| Norwegian | 8 | 0.2% |
| Polish | 62 | 1.8% |
| Puerto Rican | 103 | 2.9% |
| Russian | 29 | 0.8% |
| Scottish | 44 | 1.2% |
| Slovene | 18 | 0.5% |
| South American | 195 | 5.5% |
| Spanish | 388 | 10.9% |
| Swedish | 14 | 0.4% |
| Swiss | 22 | 0.6% |
| Syrian | 20 | 0.6% |
| Uruguayan | 7 | 0.2% | View All 36 Rows |
Immigrants in Lake Clarke Shores
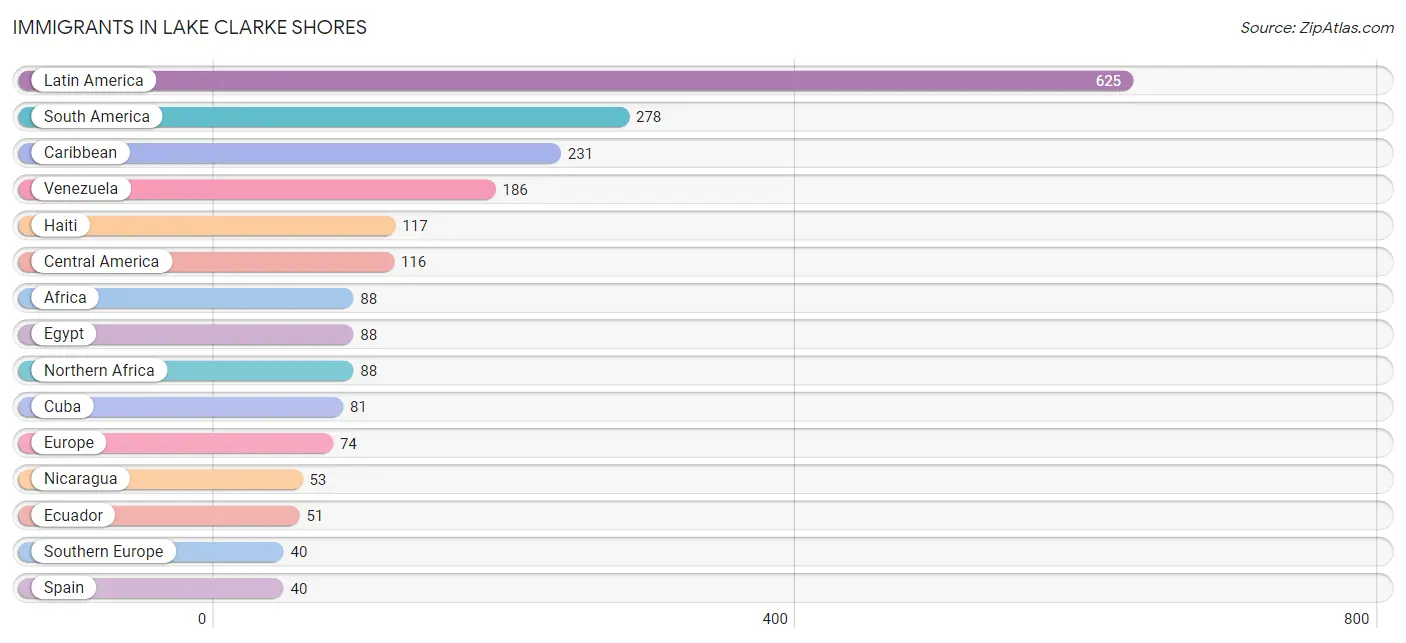
The most numerous immigrant groups reported in Lake Clarke Shores came from Latin America (625 | 17.6%), South America (278 | 7.8%), Caribbean (231 | 6.5%), Venezuela (186 | 5.2%), and Haiti (117 | 3.3%), together accounting for 40.4% of all Lake Clarke Shores residents.
| Immigration Origin | # Population | % Population |
| Africa | 88 | 2.5% |
| Argentina | 24 | 0.7% |
| Canada | 20 | 0.6% |
| Caribbean | 231 | 6.5% |
| Central America | 116 | 3.3% |
| Colombia | 10 | 0.3% |
| Cuba | 81 | 2.3% |
| Ecuador | 51 | 1.4% |
| Egypt | 88 | 2.5% |
| England | 32 | 0.9% |
| Europe | 74 | 2.1% |
| Haiti | 117 | 3.3% |
| Honduras | 35 | 1.0% |
| Jamaica | 33 | 0.9% |
| Latin America | 625 | 17.6% |
| Mexico | 28 | 0.8% |
| Nicaragua | 53 | 1.5% |
| Northern Africa | 88 | 2.5% |
| Northern Europe | 32 | 0.9% |
| South America | 278 | 7.8% |
| Southern Europe | 40 | 1.1% |
| Spain | 40 | 1.1% |
| Switzerland | 2 | 0.1% |
| Uruguay | 7 | 0.2% |
| Venezuela | 186 | 5.2% |
| Western Europe | 2 | 0.1% | View All 26 Rows |
Sex and Age in Lake Clarke Shores
Sex and Age in Lake Clarke Shores
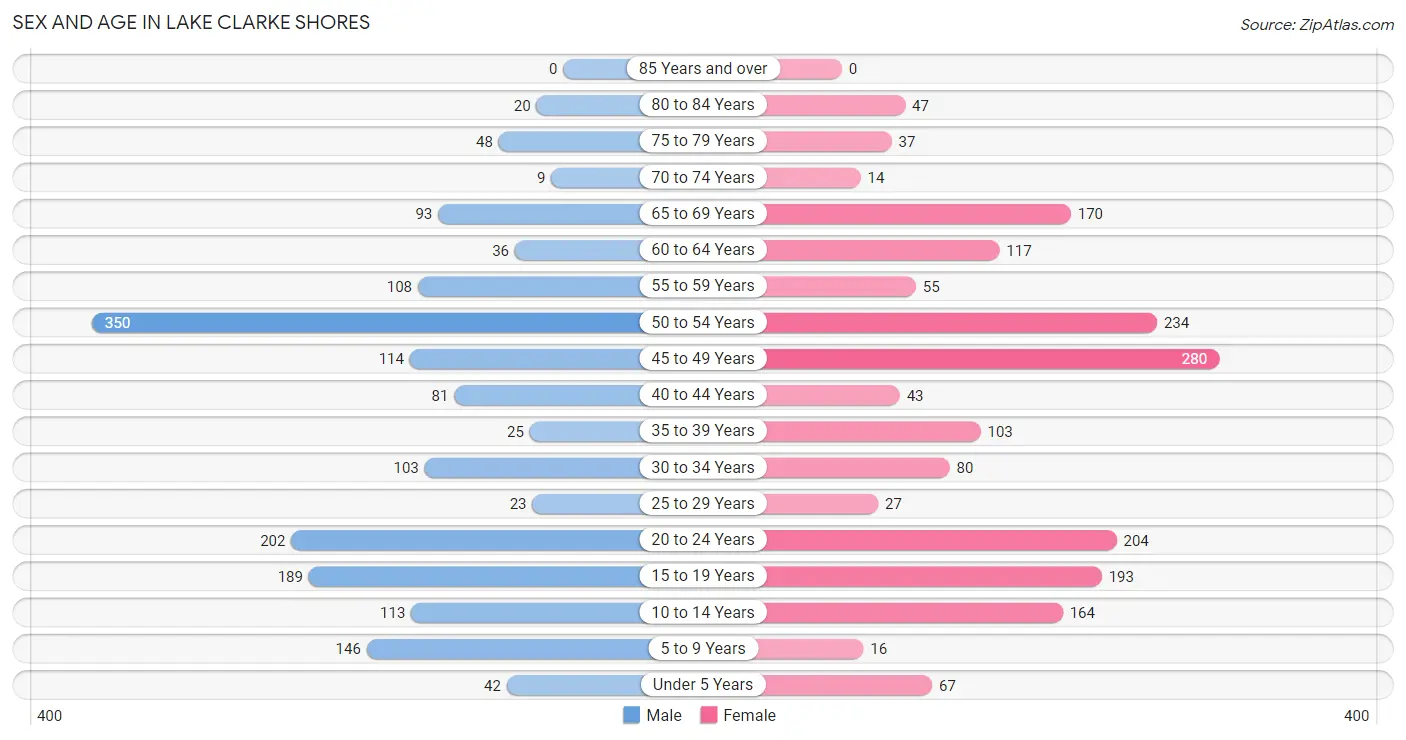
The most populous age groups in Lake Clarke Shores are 50 to 54 Years (350 | 20.6%) for men and 45 to 49 Years (280 | 15.1%) for women.
| Age Bracket | Male | Female |
| Under 5 Years | 42 (2.5%) | 67 (3.6%) |
| 5 to 9 Years | 146 (8.6%) | 16 (0.9%) |
| 10 to 14 Years | 113 (6.6%) | 164 (8.9%) |
| 15 to 19 Years | 189 (11.1%) | 193 (10.4%) |
| 20 to 24 Years | 202 (11.9%) | 204 (11.0%) |
| 25 to 29 Years | 23 (1.3%) | 27 (1.5%) |
| 30 to 34 Years | 103 (6.0%) | 80 (4.3%) |
| 35 to 39 Years | 25 (1.5%) | 103 (5.6%) |
| 40 to 44 Years | 81 (4.8%) | 43 (2.3%) |
| 45 to 49 Years | 114 (6.7%) | 280 (15.1%) |
| 50 to 54 Years | 350 (20.6%) | 234 (12.6%) |
| 55 to 59 Years | 108 (6.4%) | 55 (3.0%) |
| 60 to 64 Years | 36 (2.1%) | 117 (6.3%) |
| 65 to 69 Years | 93 (5.5%) | 170 (9.2%) |
| 70 to 74 Years | 9 (0.5%) | 14 (0.8%) |
| 75 to 79 Years | 48 (2.8%) | 37 (2.0%) |
| 80 to 84 Years | 20 (1.2%) | 47 (2.5%) |
| 85 Years and over | 0 (0.0%) | 0 (0.0%) |
| Total | 1,702 (100.0%) | 1,851 (100.0%) |
Families and Households in Lake Clarke Shores
Median Family Size in Lake Clarke Shores
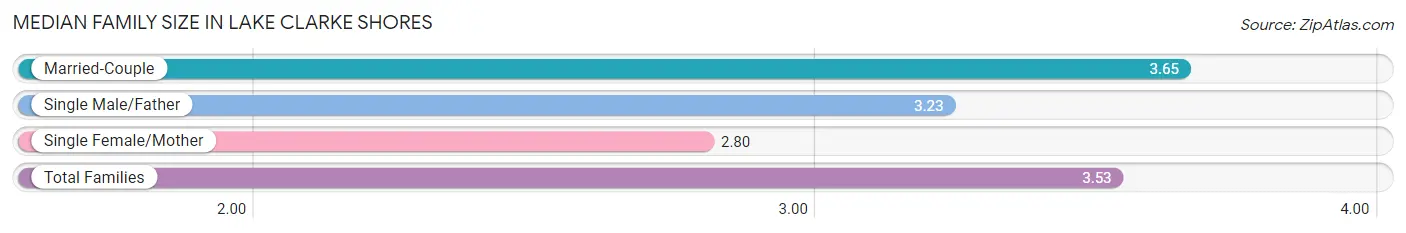
The median family size in Lake Clarke Shores is 3.53 persons per family, with married-couple families (784 | 84.4%) accounting for the largest median family size of 3.65 persons per family. On the other hand, single female/mother families (132 | 14.2%) represent the smallest median family size with 2.80 persons per family.
| Family Type | # Families | Family Size |
| Married-Couple | 784 (84.4%) | 3.65 |
| Single Male/Father | 13 (1.4%) | 3.23 |
| Single Female/Mother | 132 (14.2%) | 2.80 |
| Total Families | 929 (100.0%) | 3.53 |
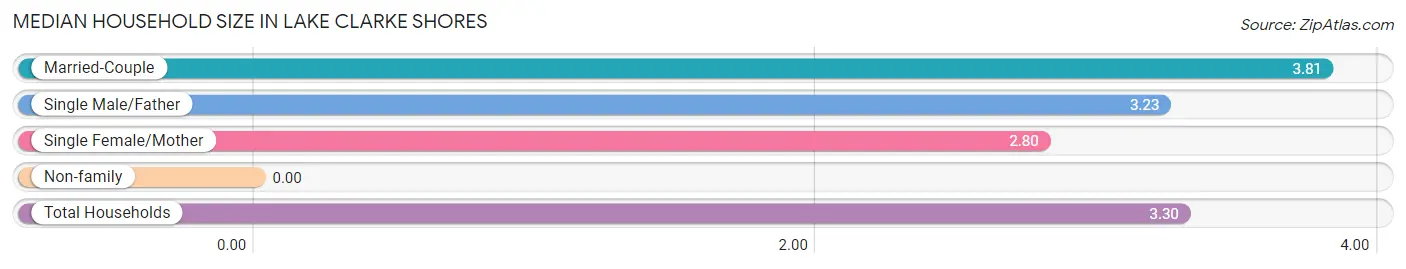
Median Household Size in Lake Clarke Shores
| Household Type | # Households | Household Size |
| Married-Couple | 784 (72.9%) | 3.81 |
| Single Male/Father | 13 (1.2%) | 3.23 |
| Single Female/Mother | 132 (12.3%) | 2.80 |
| Non-family | 147 (13.7%) | - |
| Total Households | 1,076 (100.0%) | 3.30 |
Household Size by Marriage Status in Lake Clarke Shores
Out of a total of 1,076 households in Lake Clarke Shores, 929 (86.3%) are family households, while 147 (13.7%) are nonfamily households. The most numerous type of family households are 2-person households, comprising 308, and the most common type of nonfamily households are 1-person households, comprising 147.
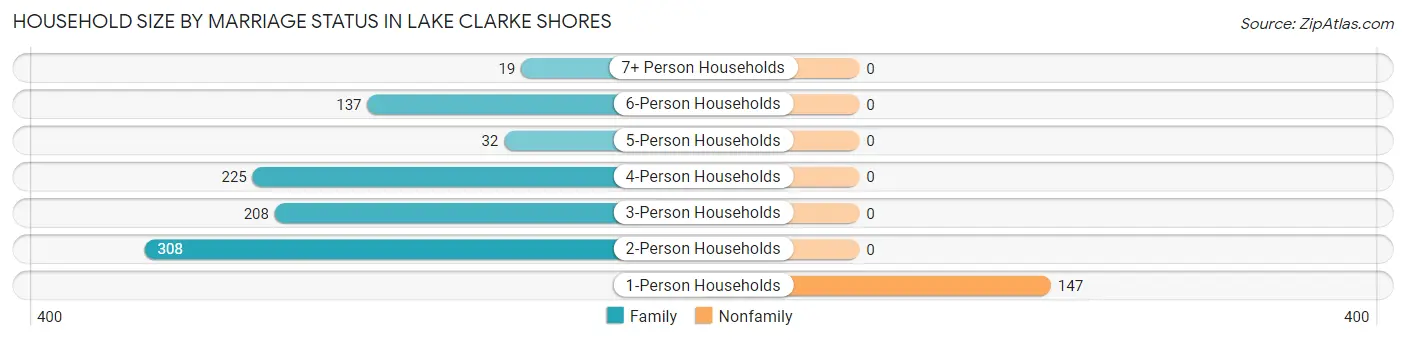
| Household Size | Family Households | Nonfamily Households |
| 1-Person Households | - | 147 (13.7%) |
| 2-Person Households | 308 (28.6%) | 0 (0.0%) |
| 3-Person Households | 208 (19.3%) | 0 (0.0%) |
| 4-Person Households | 225 (20.9%) | 0 (0.0%) |
| 5-Person Households | 32 (3.0%) | 0 (0.0%) |
| 6-Person Households | 137 (12.7%) | 0 (0.0%) |
| 7+ Person Households | 19 (1.8%) | 0 (0.0%) |
| Total | 929 (86.3%) | 147 (13.7%) |
Female Fertility in Lake Clarke Shores
Fertility by Age in Lake Clarke Shores
Average fertility rate in Lake Clarke Shores is 29.0 births per 1,000 women. Women in the age bracket of 35 to 50 years have the highest fertility rate with 60.0 births per 1,000 women. Women in the age bracket of 35 to 50 years acount for 100.0% of all women with births.
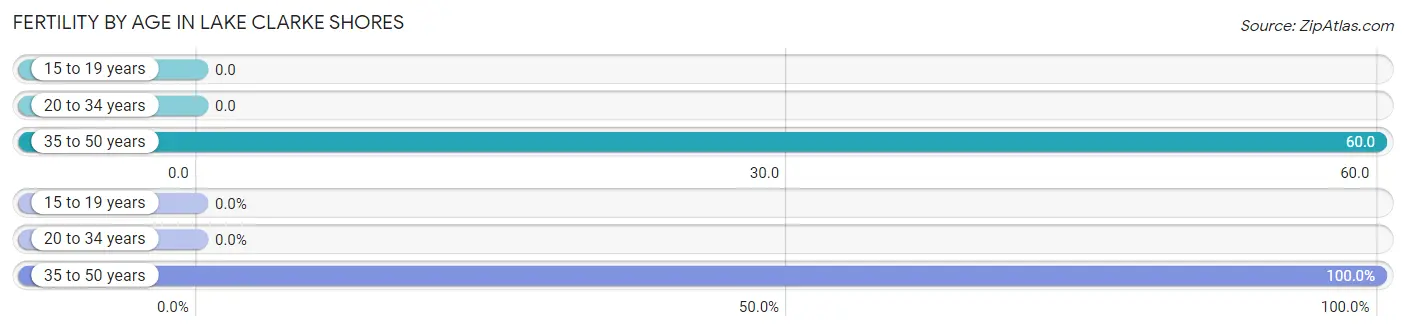
| Age Bracket | Women with Births | Births / 1,000 Women |
| 15 to 19 years | 0 (0.0%) | 0.0 |
| 20 to 34 years | 0 (0.0%) | 0.0 |
| 35 to 50 years | 29 (100.0%) | 60.0 |
| Total | 29 (100.0%) | 29.0 |
Fertility by Age by Marriage Status in Lake Clarke Shores
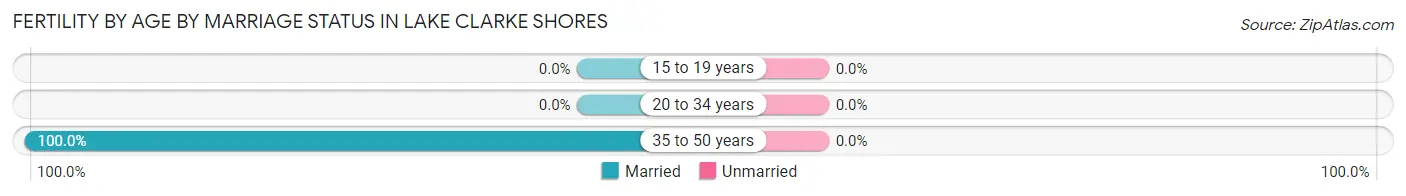
| Age Bracket | Married | Unmarried |
| 15 to 19 years | 0 (0.0%) | 0 (0.0%) |
| 20 to 34 years | 0 (0.0%) | 0 (0.0%) |
| 35 to 50 years | 29 (100.0%) | 0 (0.0%) |
| Total | 29 (100.0%) | 0 (0.0%) |
Fertility by Education in Lake Clarke Shores
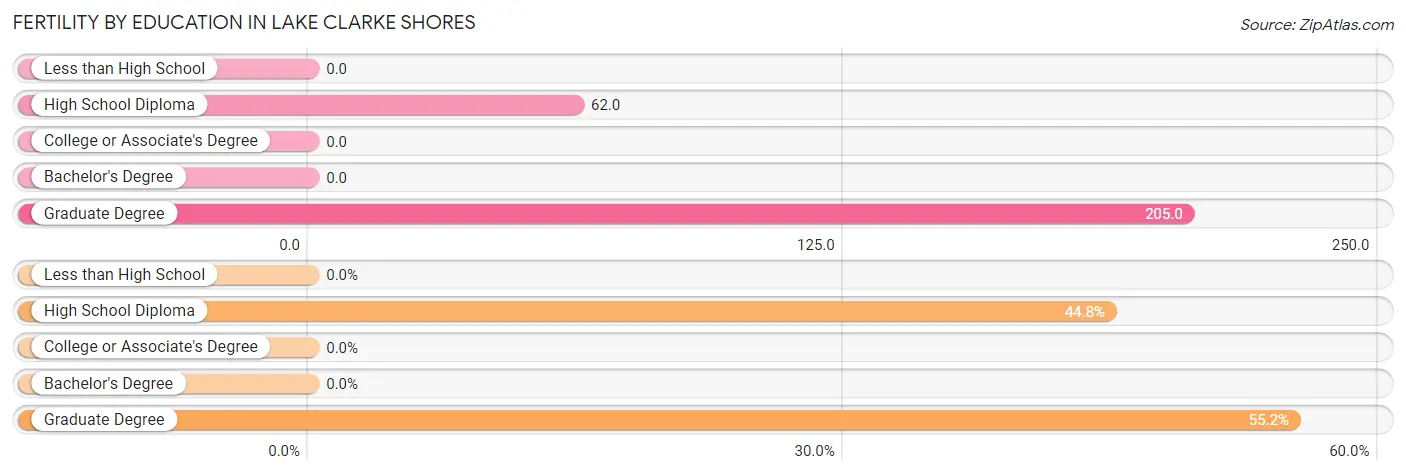
| Educational Attainment | Women with Births | Births / 1,000 Women |
| Less than High School | 0 (0.0%) | 0.0 |
| High School Diploma | 13 (44.8%) | 62.0 |
| College or Associate's Degree | 0 (0.0%) | 0.0 |
| Bachelor's Degree | 0 (0.0%) | 0.0 |
| Graduate Degree | 16 (55.2%) | 205.0 |
| Total | 29 (100.0%) | 29.0 |
Fertility by Education by Marriage Status in Lake Clarke Shores
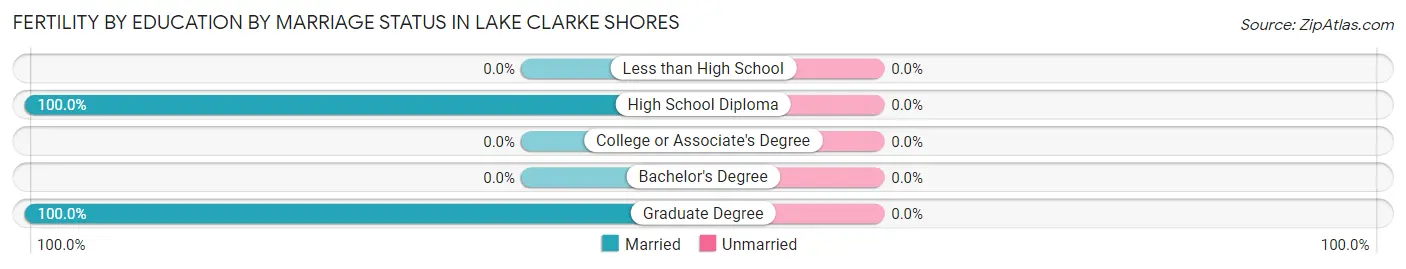
| Educational Attainment | Married | Unmarried |
| Less than High School | 0 (0.0%) | 0 (0.0%) |
| High School Diploma | 13 (100.0%) | 0 (0.0%) |
| College or Associate's Degree | 0 (0.0%) | 0 (0.0%) |
| Bachelor's Degree | 0 (0.0%) | 0 (0.0%) |
| Graduate Degree | 16 (100.0%) | 0 (0.0%) |
| Total | 29 (100.0%) | 0 (0.0%) |
Employment Characteristics in Lake Clarke Shores
Employment by Class of Employer in Lake Clarke Shores
Among the 1,903 employed individuals in Lake Clarke Shores, private company employees (850 | 44.7%), self-employed (incorporated) (388 | 20.4%), and not-for-profit organizations (282 | 14.8%) make up the most common classes of employment.
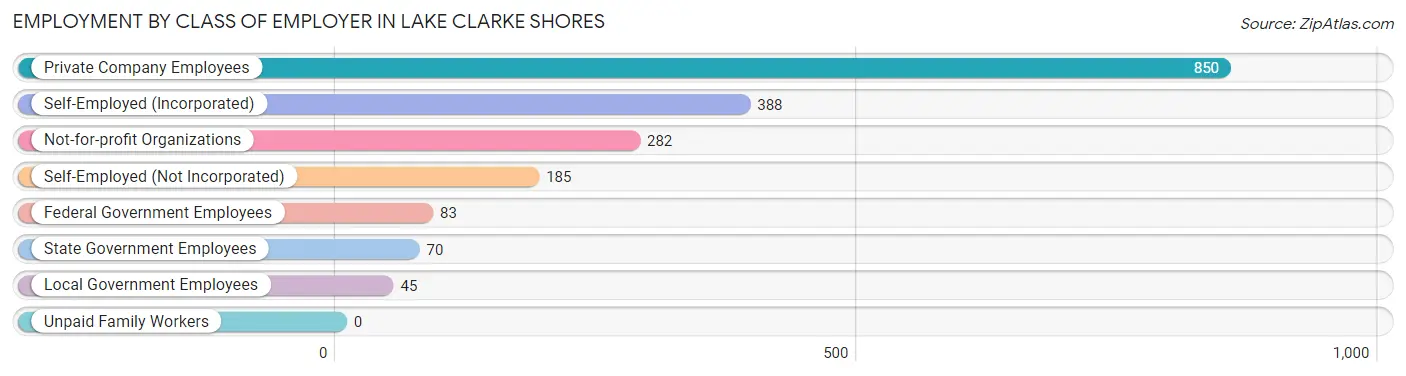
| Employer Class | # Employees | % Employees |
| Private Company Employees | 850 | 44.7% |
| Self-Employed (Incorporated) | 388 | 20.4% |
| Self-Employed (Not Incorporated) | 185 | 9.7% |
| Not-for-profit Organizations | 282 | 14.8% |
| Local Government Employees | 45 | 2.4% |
| State Government Employees | 70 | 3.7% |
| Federal Government Employees | 83 | 4.4% |
| Unpaid Family Workers | 0 | 0.0% |
| Total | 1,903 | 100.0% |
Employment Status by Age in Lake Clarke Shores
According to the labor force statistics for Lake Clarke Shores, out of the total population over 16 years of age (3,005), 68.4% or 2,055 individuals are in the labor force, with 7.4% or 152 of them unemployed. The age group with the highest labor force participation rate is 25 to 29 years, with 100.0% or 50 individuals in the labor force. Within the labor force, the 20 to 24 years age range has the highest percentage of unemployed individuals, with 24.3% or 65 of them being unemployed.
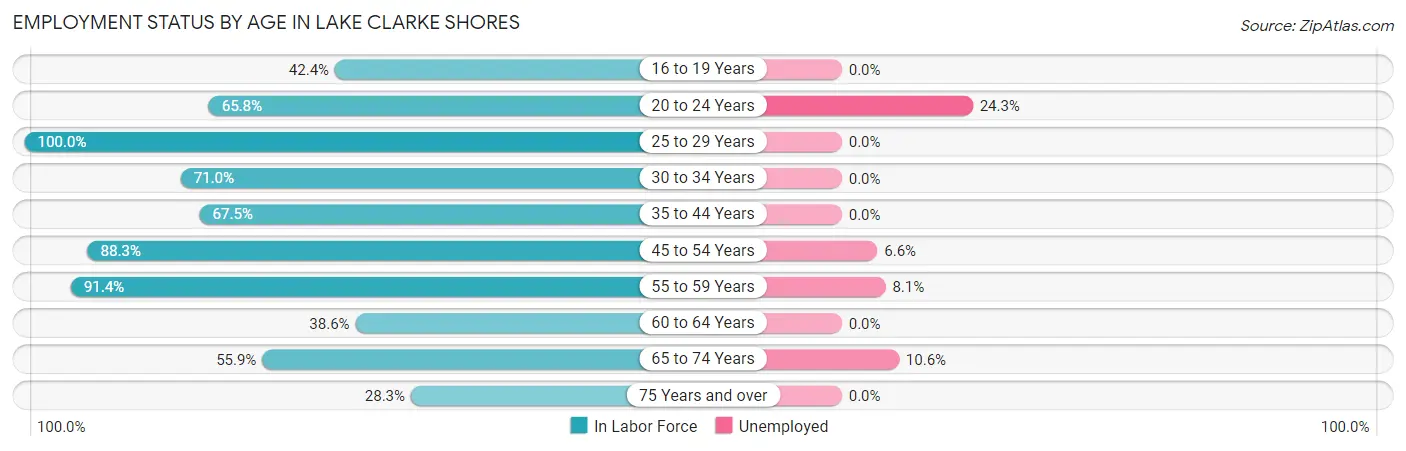
| Age Bracket | In Labor Force | Unemployed |
| 16 to 19 Years | 162 (42.4%) | 0 (0.0%) |
| 20 to 24 Years | 267 (65.8%) | 65 (24.3%) |
| 25 to 29 Years | 50 (100.0%) | 0 (0.0%) |
| 30 to 34 Years | 130 (71.0%) | 0 (0.0%) |
| 35 to 44 Years | 170 (67.5%) | 0 (0.0%) |
| 45 to 54 Years | 864 (88.3%) | 57 (6.6%) |
| 55 to 59 Years | 149 (91.4%) | 12 (8.1%) |
| 60 to 64 Years | 59 (38.6%) | 0 (0.0%) |
| 65 to 74 Years | 160 (55.9%) | 17 (10.6%) |
| 75 Years and over | 43 (28.3%) | 0 (0.0%) |
| Total | 2,055 (68.4%) | 152 (7.4%) |
Employment Status by Educational Attainment in Lake Clarke Shores
According to labor force statistics for Lake Clarke Shores, 79.9% of individuals (1,421) out of the total population between 25 and 64 years of age (1,779) are in the labor force, with 4.9% or 70 of them being unemployed. The group with the highest labor force participation rate are those with the educational attainment of less than high school, with 84.3% or 70 individuals in the labor force. Within the labor force, individuals with high school diploma education have the highest percentage of unemployment, with 26.2% or 69 of them being unemployed.
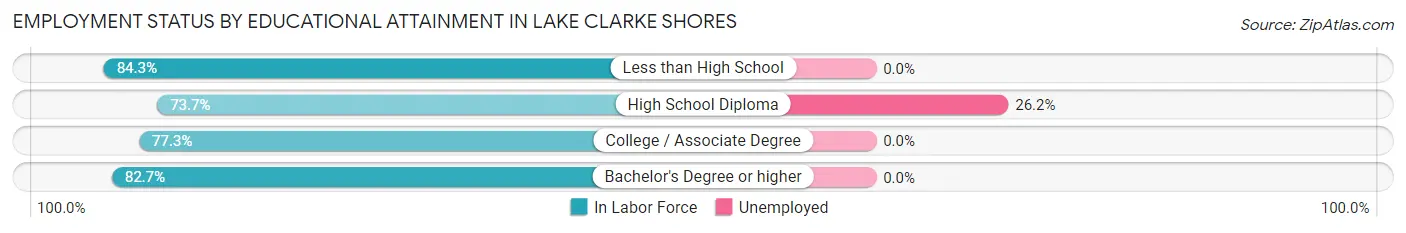
| Educational Attainment | In Labor Force | Unemployed |
| Less than High School | 70 (84.3%) | 0 (0.0%) |
| High School Diploma | 263 (73.7%) | 94 (26.2%) |
| College / Associate Degree | 262 (77.3%) | 0 (0.0%) |
| Bachelor's Degree or higher | 827 (82.7%) | 0 (0.0%) |
| Total | 1,421 (79.9%) | 87 (4.9%) |
Employment Occupations by Sex in Lake Clarke Shores
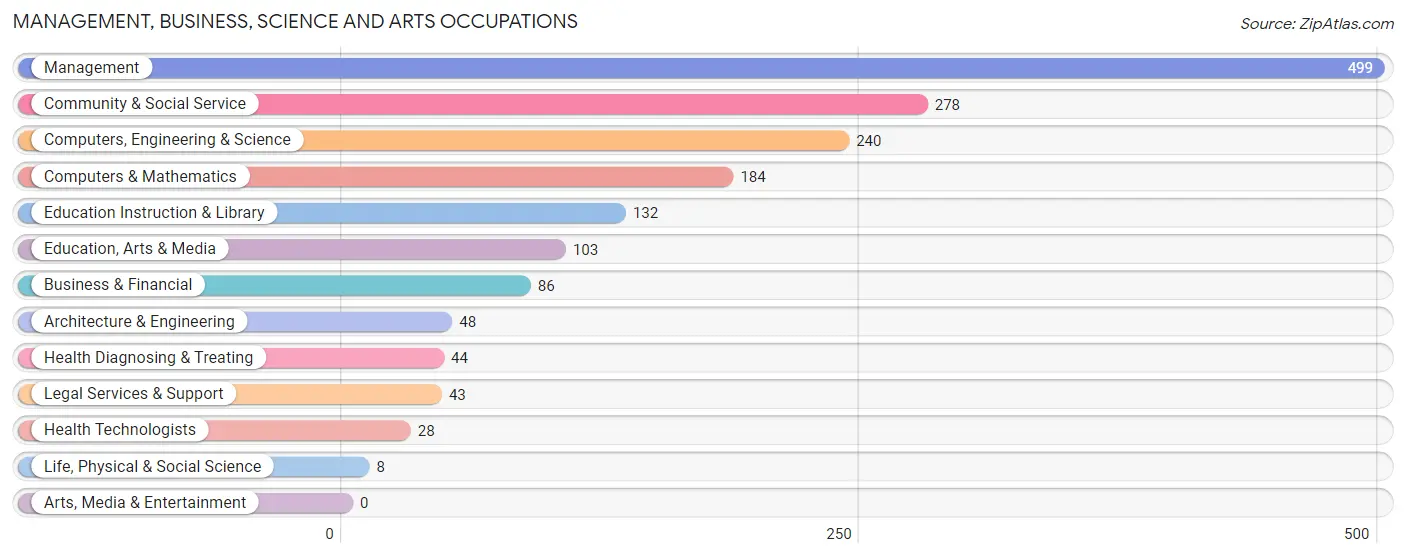
Management, Business, Science and Arts Occupations
The most common Management, Business, Science and Arts occupations in Lake Clarke Shores are Management (499 | 26.2%), Community & Social Service (278 | 14.6%), Computers, Engineering & Science (240 | 12.6%), Computers & Mathematics (184 | 9.7%), and Education Instruction & Library (132 | 6.9%).
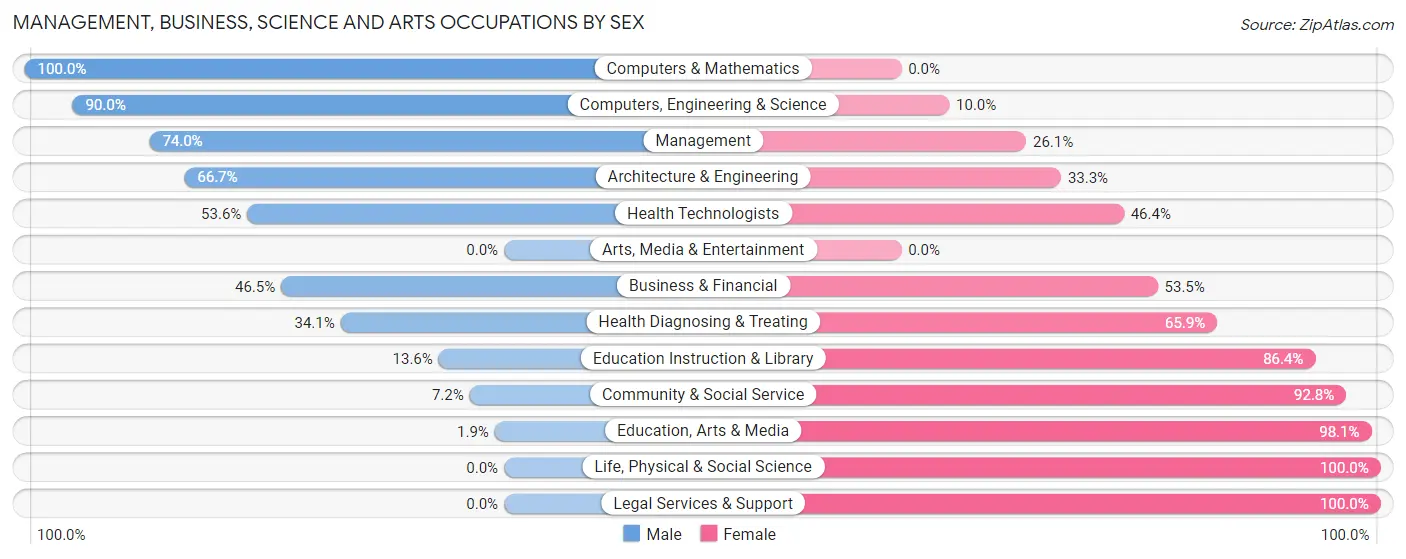
Management, Business, Science and Arts Occupations by Sex
Within the Management, Business, Science and Arts occupations in Lake Clarke Shores, the most male-oriented occupations are Computers & Mathematics (100.0%), Computers, Engineering & Science (90.0%), and Management (74.0%), while the most female-oriented occupations are Life, Physical & Social Science (100.0%), Legal Services & Support (100.0%), and Education, Arts & Media (98.1%).
| Occupation | Male | Female |
| Management | 369 (74.0%) | 130 (26.1%) |
| Business & Financial | 40 (46.5%) | 46 (53.5%) |
| Computers, Engineering & Science | 216 (90.0%) | 24 (10.0%) |
| Computers & Mathematics | 184 (100.0%) | 0 (0.0%) |
| Architecture & Engineering | 32 (66.7%) | 16 (33.3%) |
| Life, Physical & Social Science | 0 (0.0%) | 8 (100.0%) |
| Community & Social Service | 20 (7.2%) | 258 (92.8%) |
| Education, Arts & Media | 2 (1.9%) | 101 (98.1%) |
| Legal Services & Support | 0 (0.0%) | 43 (100.0%) |
| Education Instruction & Library | 18 (13.6%) | 114 (86.4%) |
| Arts, Media & Entertainment | 0 (0.0%) | 0 (0.0%) |
| Health Diagnosing & Treating | 15 (34.1%) | 29 (65.9%) |
| Health Technologists | 15 (53.6%) | 13 (46.4%) |
| Total (Category) | 660 (57.5%) | 487 (42.5%) |
| Total (Overall) | 1,099 (57.8%) | 804 (42.2%) |
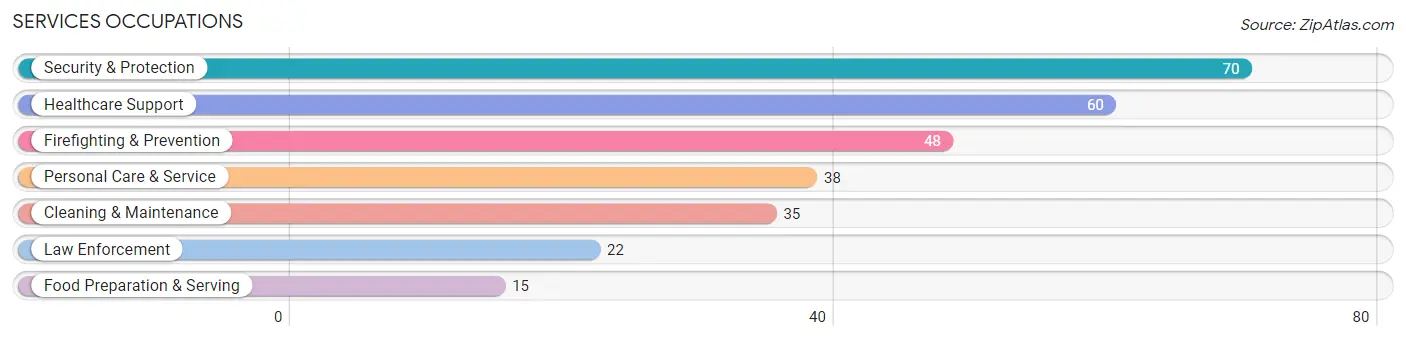
Services Occupations
The most common Services occupations in Lake Clarke Shores are Security & Protection (70 | 3.7%), Healthcare Support (60 | 3.2%), Firefighting & Prevention (48 | 2.5%), Personal Care & Service (38 | 2.0%), and Cleaning & Maintenance (35 | 1.8%).
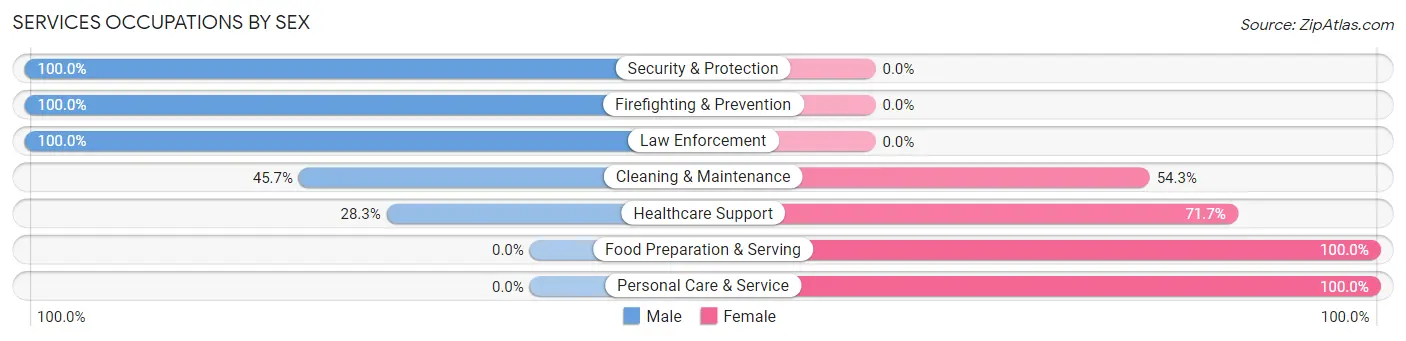
Services Occupations by Sex
Within the Services occupations in Lake Clarke Shores, the most male-oriented occupations are Security & Protection (100.0%), Firefighting & Prevention (100.0%), and Law Enforcement (100.0%), while the most female-oriented occupations are Food Preparation & Serving (100.0%), Personal Care & Service (100.0%), and Healthcare Support (71.7%).
| Occupation | Male | Female |
| Healthcare Support | 17 (28.3%) | 43 (71.7%) |
| Security & Protection | 70 (100.0%) | 0 (0.0%) |
| Firefighting & Prevention | 48 (100.0%) | 0 (0.0%) |
| Law Enforcement | 22 (100.0%) | 0 (0.0%) |
| Food Preparation & Serving | 0 (0.0%) | 15 (100.0%) |
| Cleaning & Maintenance | 16 (45.7%) | 19 (54.3%) |
| Personal Care & Service | 0 (0.0%) | 38 (100.0%) |
| Total (Category) | 103 (47.2%) | 115 (52.7%) |
| Total (Overall) | 1,099 (57.8%) | 804 (42.2%) |
Sales and Office Occupations
The most common Sales and Office occupations in Lake Clarke Shores are Office & Administration (325 | 17.1%), and Sales & Related (44 | 2.3%).
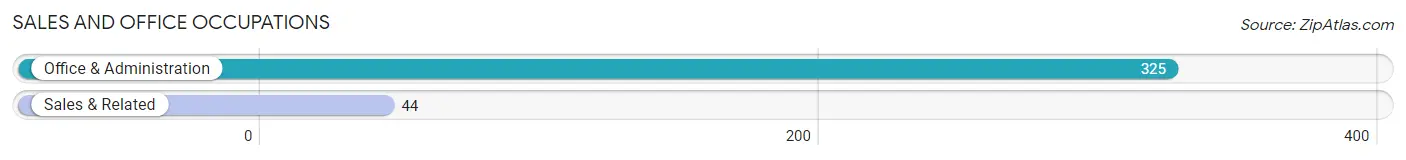
Sales and Office Occupations by Sex
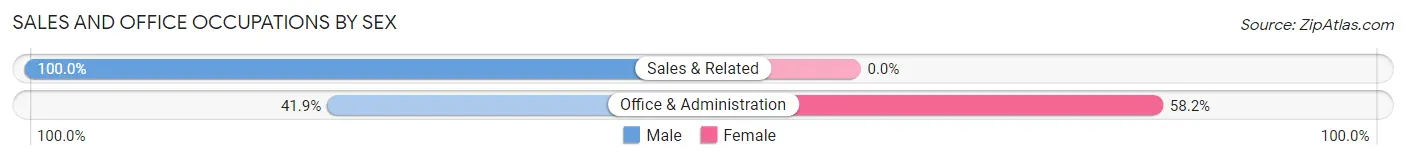
| Occupation | Male | Female |
| Sales & Related | 44 (100.0%) | 0 (0.0%) |
| Office & Administration | 136 (41.8%) | 189 (58.2%) |
| Total (Category) | 180 (48.8%) | 189 (51.2%) |
| Total (Overall) | 1,099 (57.8%) | 804 (42.2%) |
Natural Resources, Construction and Maintenance Occupations
The most common Natural Resources, Construction and Maintenance occupations in Lake Clarke Shores are Construction & Extraction (46 | 2.4%), Installation, Maintenance & Repair (18 | 0.9%), and Farming, Fishing & Forestry (1 | 0.1%).
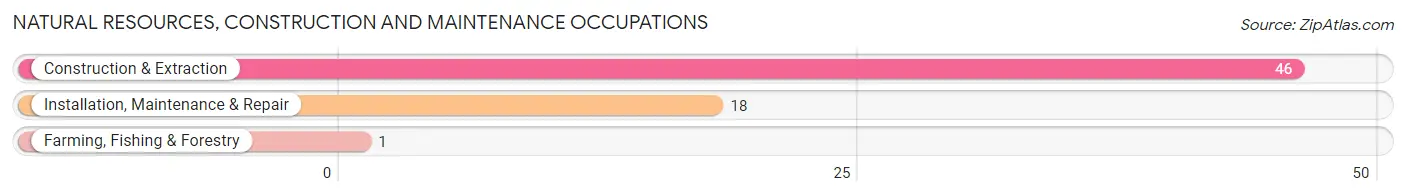
Natural Resources, Construction and Maintenance Occupations by Sex
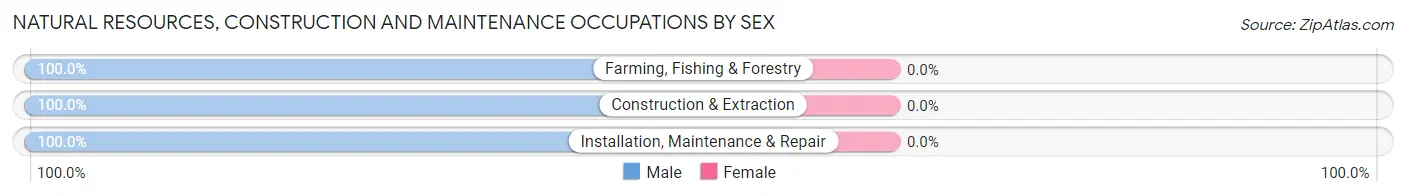
| Occupation | Male | Female |
| Farming, Fishing & Forestry | 1 (100.0%) | 0 (0.0%) |
| Construction & Extraction | 46 (100.0%) | 0 (0.0%) |
| Installation, Maintenance & Repair | 18 (100.0%) | 0 (0.0%) |
| Total (Category) | 65 (100.0%) | 0 (0.0%) |
| Total (Overall) | 1,099 (57.8%) | 804 (42.2%) |
Production, Transportation and Moving Occupations
The most common Production, Transportation and Moving occupations in Lake Clarke Shores are Transportation (103 | 5.4%), and Production (1 | 0.1%).
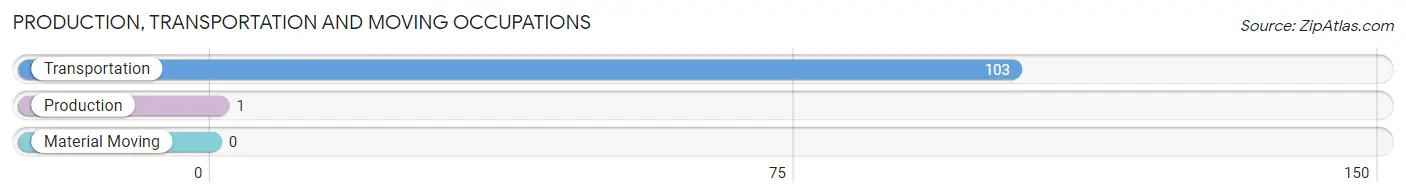
Production, Transportation and Moving Occupations by Sex
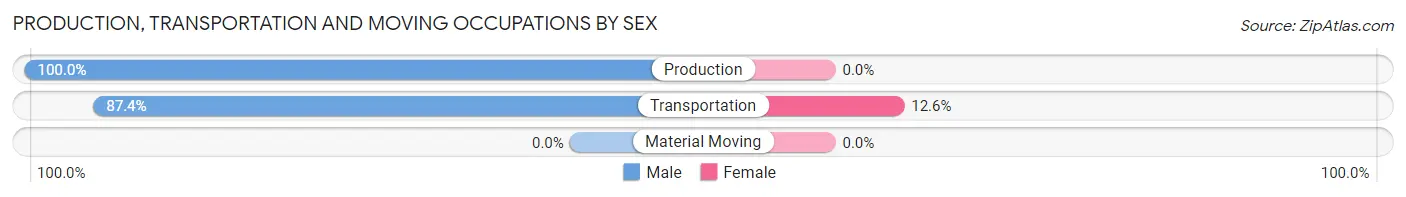
| Occupation | Male | Female |
| Production | 1 (100.0%) | 0 (0.0%) |
| Transportation | 90 (87.4%) | 13 (12.6%) |
| Material Moving | 0 (0.0%) | 0 (0.0%) |
| Total (Category) | 91 (87.5%) | 13 (12.5%) |
| Total (Overall) | 1,099 (57.8%) | 804 (42.2%) |
Employment Industries by Sex in Lake Clarke Shores
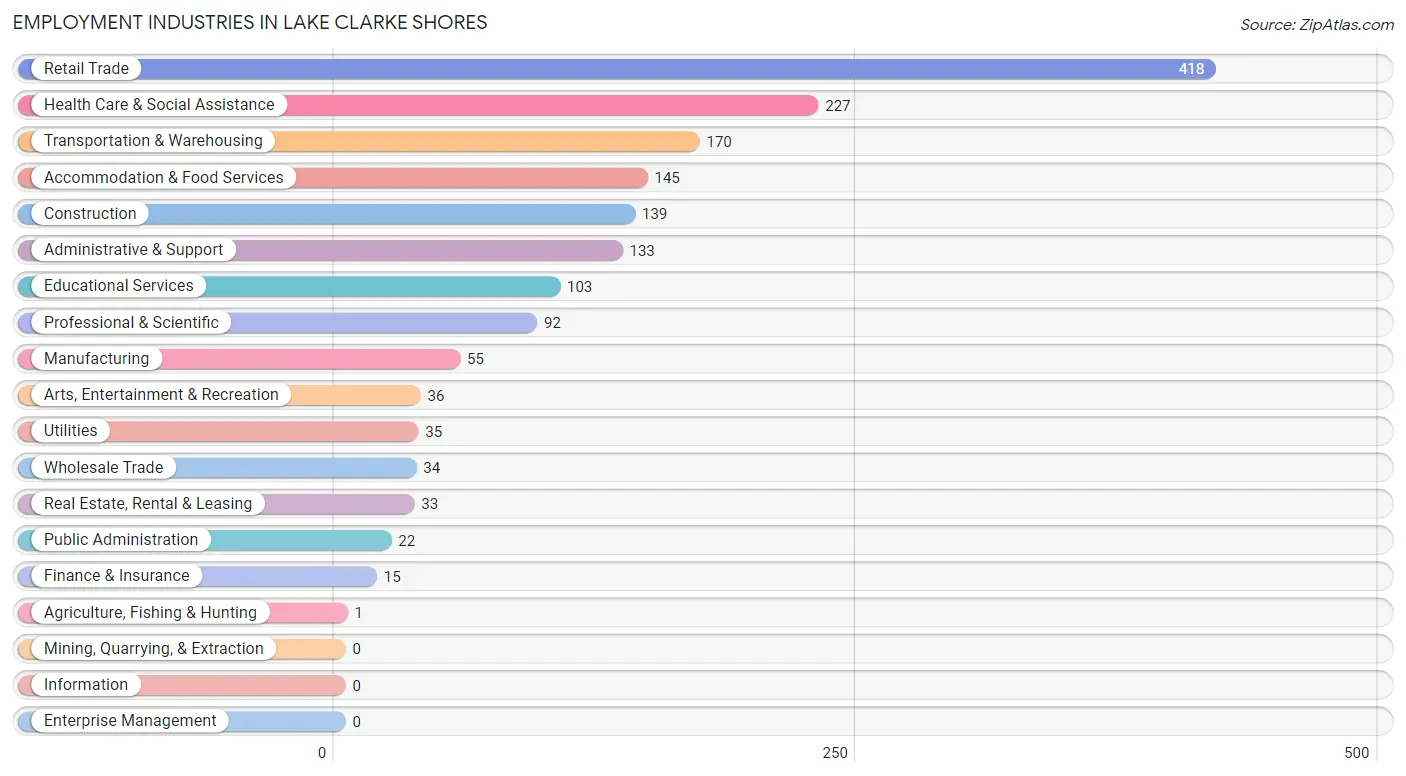
Employment Industries in Lake Clarke Shores
The major employment industries in Lake Clarke Shores include Retail Trade (418 | 22.0%), Health Care & Social Assistance (227 | 11.9%), Transportation & Warehousing (170 | 8.9%), Accommodation & Food Services (145 | 7.6%), and Construction (139 | 7.3%).
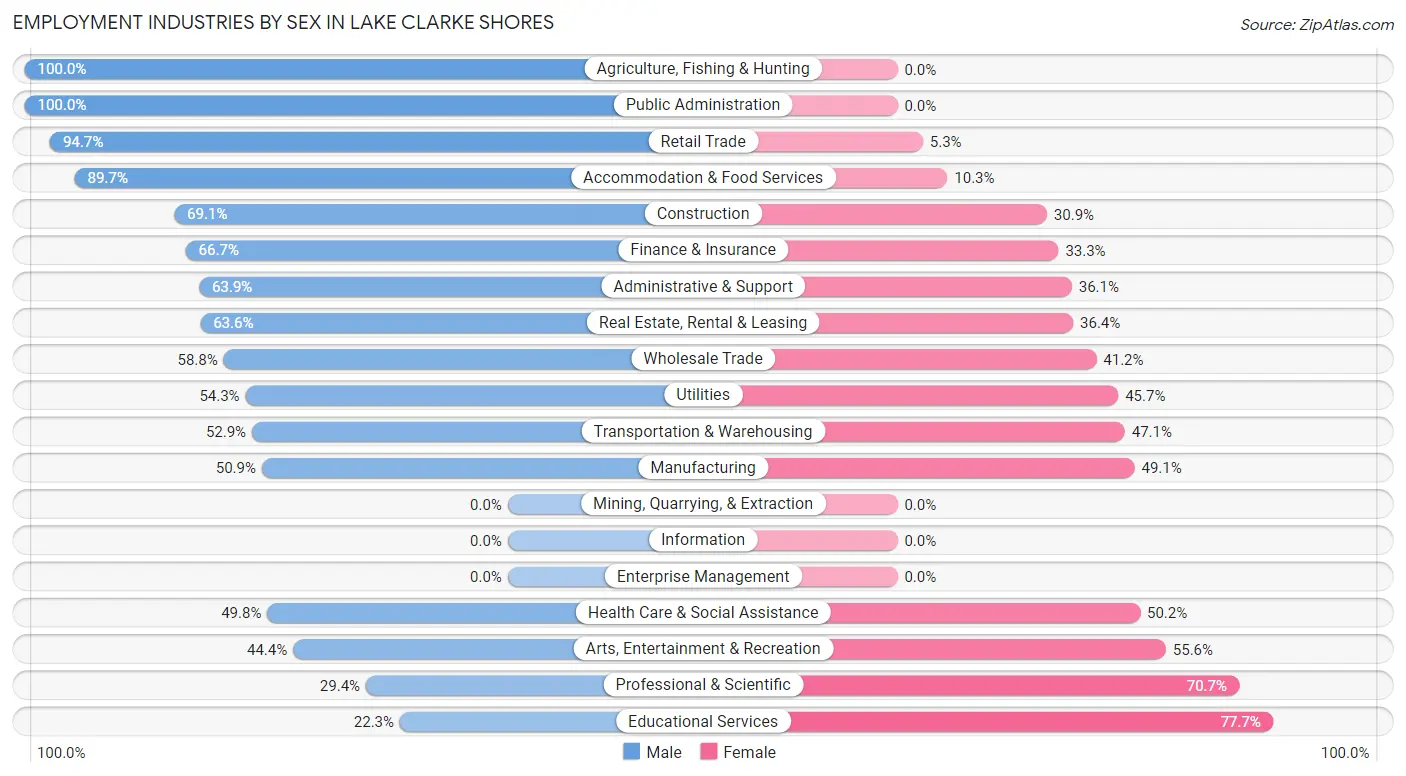
Employment Industries by Sex in Lake Clarke Shores
The Lake Clarke Shores industries that see more men than women are Agriculture, Fishing & Hunting (100.0%), Public Administration (100.0%), and Retail Trade (94.7%), whereas the industries that tend to have a higher number of women are Educational Services (77.7%), Professional & Scientific (70.7%), and Arts, Entertainment & Recreation (55.6%).
| Industry | Male | Female |
| Agriculture, Fishing & Hunting | 1 (100.0%) | 0 (0.0%) |
| Mining, Quarrying, & Extraction | 0 (0.0%) | 0 (0.0%) |
| Construction | 96 (69.1%) | 43 (30.9%) |
| Manufacturing | 28 (50.9%) | 27 (49.1%) |
| Wholesale Trade | 20 (58.8%) | 14 (41.2%) |
| Retail Trade | 396 (94.7%) | 22 (5.3%) |
| Transportation & Warehousing | 90 (52.9%) | 80 (47.1%) |
| Utilities | 19 (54.3%) | 16 (45.7%) |
| Information | 0 (0.0%) | 0 (0.0%) |
| Finance & Insurance | 10 (66.7%) | 5 (33.3%) |
| Real Estate, Rental & Leasing | 21 (63.6%) | 12 (36.4%) |
| Professional & Scientific | 27 (29.3%) | 65 (70.7%) |
| Enterprise Management | 0 (0.0%) | 0 (0.0%) |
| Administrative & Support | 85 (63.9%) | 48 (36.1%) |
| Educational Services | 23 (22.3%) | 80 (77.7%) |
| Health Care & Social Assistance | 113 (49.8%) | 114 (50.2%) |
| Arts, Entertainment & Recreation | 16 (44.4%) | 20 (55.6%) |
| Accommodation & Food Services | 130 (89.7%) | 15 (10.3%) |
| Public Administration | 22 (100.0%) | 0 (0.0%) |
| Total | 1,099 (57.8%) | 804 (42.2%) |
Education in Lake Clarke Shores
School Enrollment in Lake Clarke Shores
The most common levels of schooling among the 1,026 students in Lake Clarke Shores are college / undergraduate (284 | 27.7%), high school (281 | 27.4%), and middle school (220 | 21.4%).
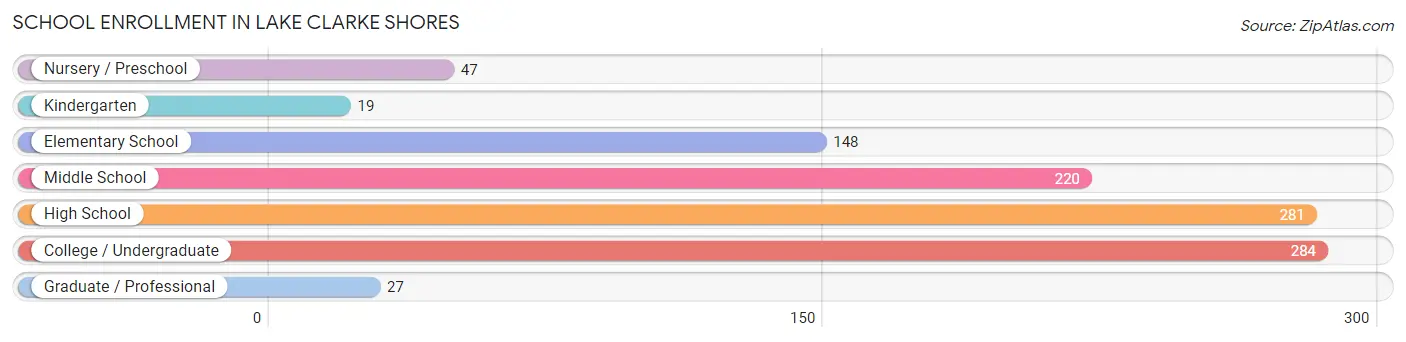
| School Level | # Students | % Students |
| Nursery / Preschool | 47 | 4.6% |
| Kindergarten | 19 | 1.8% |
| Elementary School | 148 | 14.4% |
| Middle School | 220 | 21.4% |
| High School | 281 | 27.4% |
| College / Undergraduate | 284 | 27.7% |
| Graduate / Professional | 27 | 2.6% |
| Total | 1,026 | 100.0% |
School Enrollment by Age by Funding Source in Lake Clarke Shores
Out of a total of 1,026 students who are enrolled in schools in Lake Clarke Shores, 422 (41.1%) attend a private institution, while the remaining 604 (58.9%) are enrolled in public schools. The age group of 10 to 14 year olds has the highest likelihood of being enrolled in private schools, with 200 (81.0% in the age bracket) enrolled. Conversely, the age group of 20 to 24 year olds has the lowest likelihood of being enrolled in a private school, with 204 (100.0% in the age bracket) attending a public institution.
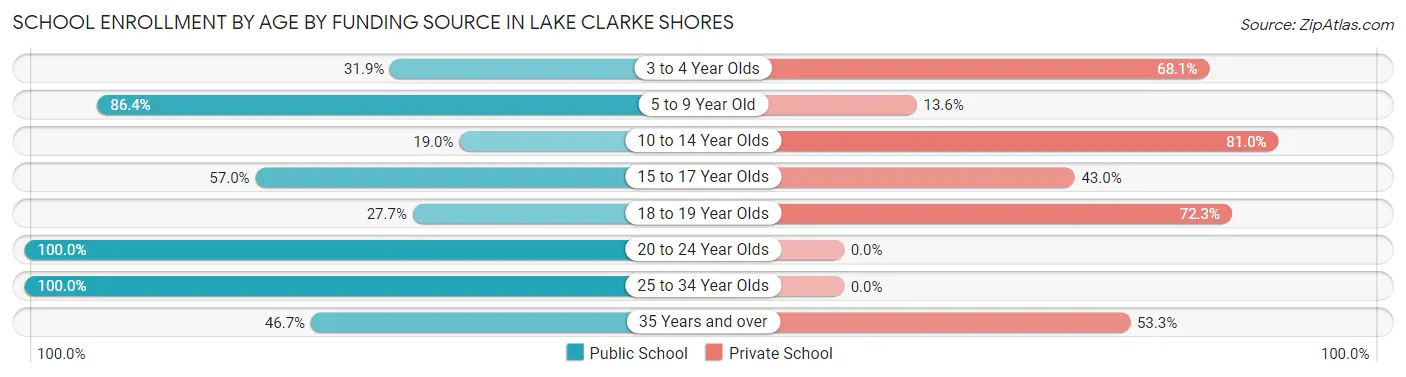
| Age Bracket | Public School | Private School |
| 3 to 4 Year Olds | 15 (31.9%) | 32 (68.1%) |
| 5 to 9 Year Old | 121 (86.4%) | 19 (13.6%) |
| 10 to 14 Year Olds | 47 (19.0%) | 200 (81.0%) |
| 15 to 17 Year Olds | 126 (57.0%) | 95 (43.0%) |
| 18 to 19 Year Olds | 23 (27.7%) | 60 (72.3%) |
| 20 to 24 Year Olds | 204 (100.0%) | 0 (0.0%) |
| 25 to 34 Year Olds | 54 (100.0%) | 0 (0.0%) |
| 35 Years and over | 14 (46.7%) | 16 (53.3%) |
| Total | 604 (58.9%) | 422 (41.1%) |
Educational Attainment by Field of Study in Lake Clarke Shores
Business (400 | 32.4%), engineering (175 | 14.2%), bio, nature & agricultural (152 | 12.3%), education (144 | 11.7%), and science & technology (84 | 6.8%) are the most common fields of study among 1,235 individuals in Lake Clarke Shores who have obtained a bachelor's degree or higher.
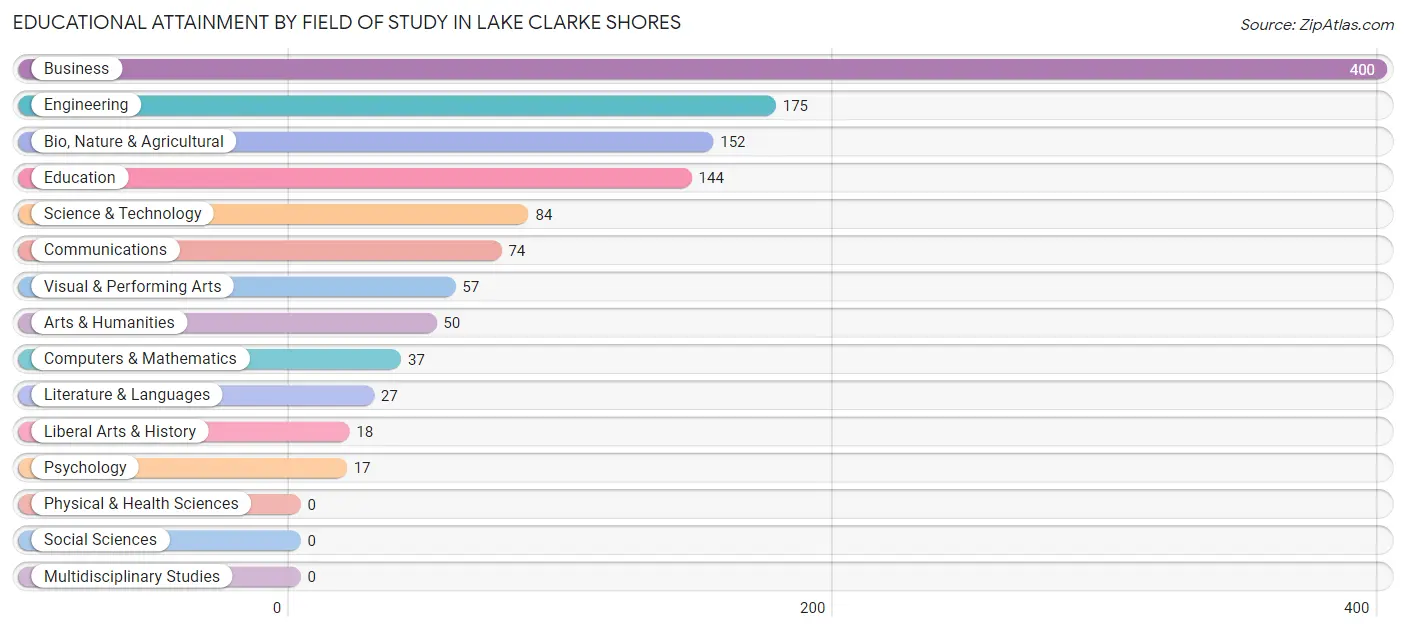
| Field of Study | # Graduates | % Graduates |
| Computers & Mathematics | 37 | 3.0% |
| Bio, Nature & Agricultural | 152 | 12.3% |
| Physical & Health Sciences | 0 | 0.0% |
| Psychology | 17 | 1.4% |
| Social Sciences | 0 | 0.0% |
| Engineering | 175 | 14.2% |
| Multidisciplinary Studies | 0 | 0.0% |
| Science & Technology | 84 | 6.8% |
| Business | 400 | 32.4% |
| Education | 144 | 11.7% |
| Literature & Languages | 27 | 2.2% |
| Liberal Arts & History | 18 | 1.5% |
| Visual & Performing Arts | 57 | 4.6% |
| Communications | 74 | 6.0% |
| Arts & Humanities | 50 | 4.1% |
| Total | 1,235 | 100.0% |
Transportation & Commute in Lake Clarke Shores
Vehicle Availability by Sex in Lake Clarke Shores
The most prevalent vehicle ownership categories in Lake Clarke Shores are males with 5 or more vehicles (401, accounting for 36.6%) and females with 5 or more vehicles (82, making up 49.9%).
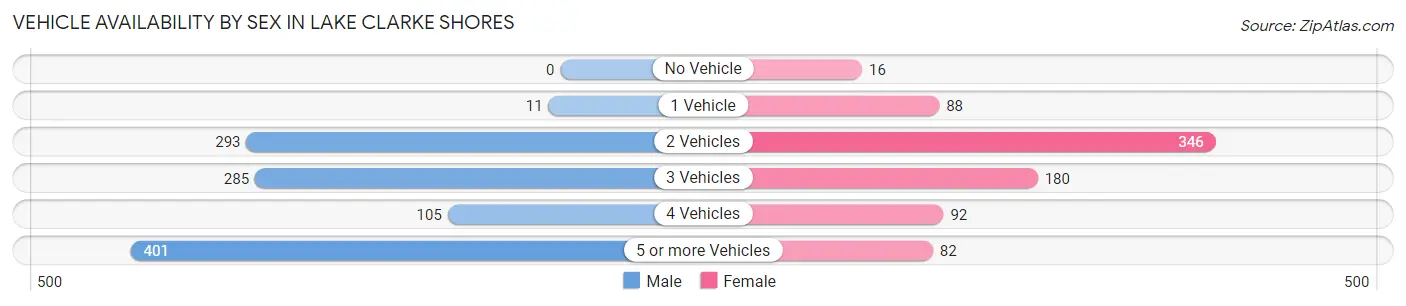
| Vehicles Available | Male | Female |
| No Vehicle | 0 (0.0%) | 16 (2.0%) |
| 1 Vehicle | 11 (1.0%) | 88 (11.0%) |
| 2 Vehicles | 293 (26.8%) | 346 (43.0%) |
| 3 Vehicles | 285 (26.0%) | 180 (22.4%) |
| 4 Vehicles | 105 (9.6%) | 92 (11.4%) |
| 5 or more Vehicles | 401 (36.6%) | 82 (10.2%) |
| Total | 1,095 (100.0%) | 804 (100.0%) |
Commute Time in Lake Clarke Shores
The most frequently occuring commute durations in Lake Clarke Shores are 10 to 14 minutes (461 commuters, 34.6%), 25 to 29 minutes (263 commuters, 19.7%), and 20 to 24 minutes (190 commuters, 14.2%).

| Commute Time | # Commuters | % Commuters |
| Less than 5 Minutes | 0 | 0.0% |
| 5 to 9 Minutes | 80 | 6.0% |
| 10 to 14 Minutes | 461 | 34.6% |
| 15 to 19 Minutes | 110 | 8.3% |
| 20 to 24 Minutes | 190 | 14.2% |
| 25 to 29 Minutes | 263 | 19.7% |
| 30 to 34 Minutes | 123 | 9.2% |
| 35 to 39 Minutes | 22 | 1.7% |
| 40 to 44 Minutes | 18 | 1.3% |
| 45 to 59 Minutes | 27 | 2.0% |
| 60 to 89 Minutes | 27 | 2.0% |
| 90 or more Minutes | 13 | 1.0% |
Commute Time by Sex in Lake Clarke Shores
The most common commute times in Lake Clarke Shores are 25 to 29 minutes (182 commuters, 26.5%) for males and 10 to 14 minutes (302 commuters, 46.8%) for females.
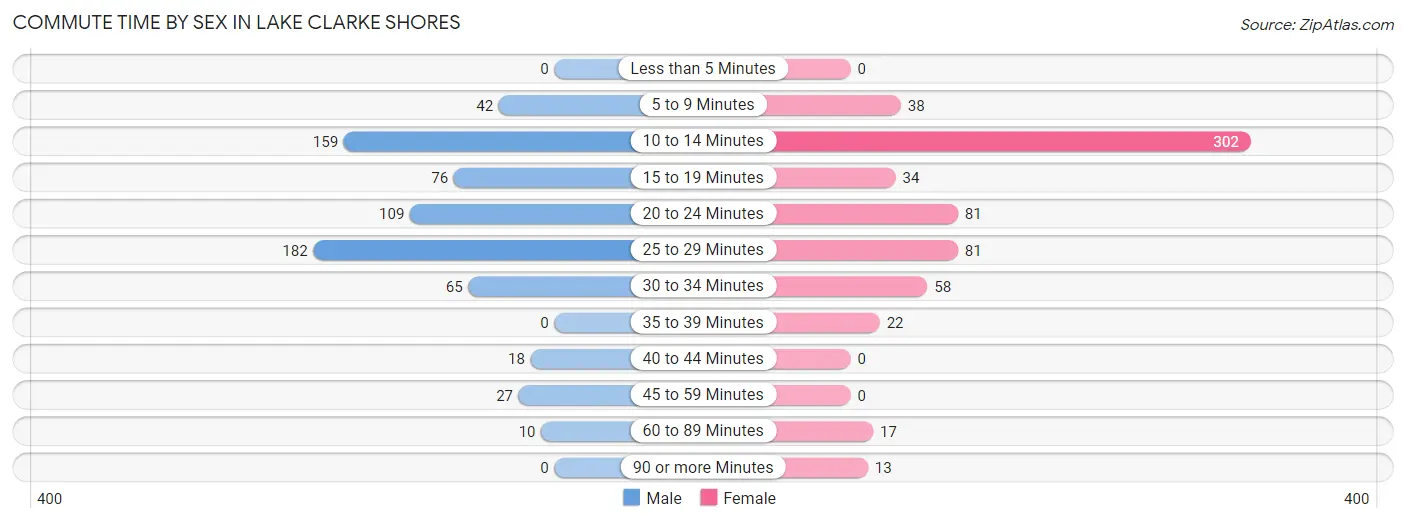
| Commute Time | Male | Female |
| Less than 5 Minutes | 0 (0.0%) | 0 (0.0%) |
| 5 to 9 Minutes | 42 (6.1%) | 38 (5.9%) |
| 10 to 14 Minutes | 159 (23.1%) | 302 (46.8%) |
| 15 to 19 Minutes | 76 (11.1%) | 34 (5.3%) |
| 20 to 24 Minutes | 109 (15.8%) | 81 (12.5%) |
| 25 to 29 Minutes | 182 (26.5%) | 81 (12.5%) |
| 30 to 34 Minutes | 65 (9.5%) | 58 (9.0%) |
| 35 to 39 Minutes | 0 (0.0%) | 22 (3.4%) |
| 40 to 44 Minutes | 18 (2.6%) | 0 (0.0%) |
| 45 to 59 Minutes | 27 (3.9%) | 0 (0.0%) |
| 60 to 89 Minutes | 10 (1.5%) | 17 (2.6%) |
| 90 or more Minutes | 0 (0.0%) | 13 (2.0%) |
Time of Departure to Work by Sex in Lake Clarke Shores
The most frequent times of departure to work in Lake Clarke Shores are 5:30 AM to 5:59 AM (138, 20.1%) for males and 8:30 AM to 8:59 AM (254, 39.3%) for females.
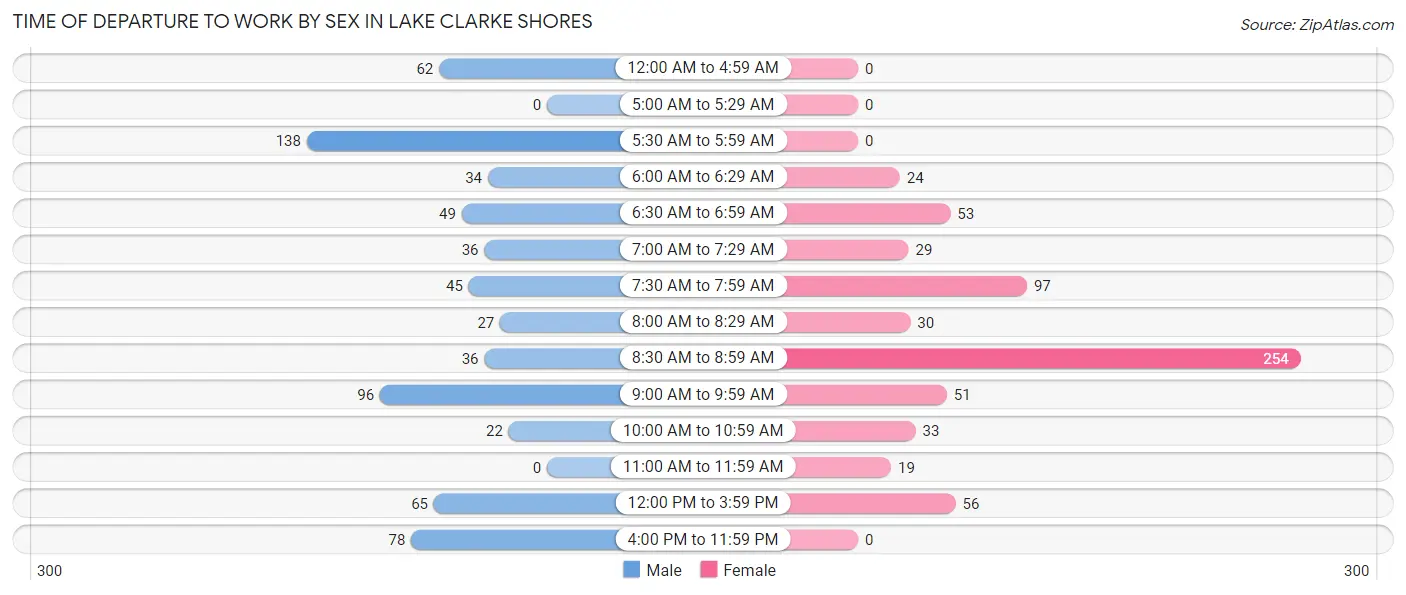
| Time of Departure | Male | Female |
| 12:00 AM to 4:59 AM | 62 (9.0%) | 0 (0.0%) |
| 5:00 AM to 5:29 AM | 0 (0.0%) | 0 (0.0%) |
| 5:30 AM to 5:59 AM | 138 (20.1%) | 0 (0.0%) |
| 6:00 AM to 6:29 AM | 34 (4.9%) | 24 (3.7%) |
| 6:30 AM to 6:59 AM | 49 (7.1%) | 53 (8.2%) |
| 7:00 AM to 7:29 AM | 36 (5.2%) | 29 (4.5%) |
| 7:30 AM to 7:59 AM | 45 (6.5%) | 97 (15.0%) |
| 8:00 AM to 8:29 AM | 27 (3.9%) | 30 (4.6%) |
| 8:30 AM to 8:59 AM | 36 (5.2%) | 254 (39.3%) |
| 9:00 AM to 9:59 AM | 96 (14.0%) | 51 (7.9%) |
| 10:00 AM to 10:59 AM | 22 (3.2%) | 33 (5.1%) |
| 11:00 AM to 11:59 AM | 0 (0.0%) | 19 (2.9%) |
| 12:00 PM to 3:59 PM | 65 (9.5%) | 56 (8.7%) |
| 4:00 PM to 11:59 PM | 78 (11.3%) | 0 (0.0%) |
| Total | 688 (100.0%) | 646 (100.0%) |
Housing Occupancy in Lake Clarke Shores
Occupancy by Ownership in Lake Clarke Shores
Of the total 1,076 dwellings in Lake Clarke Shores, owner-occupied units account for 1,068 (99.3%), while renter-occupied units make up 8 (0.7%).
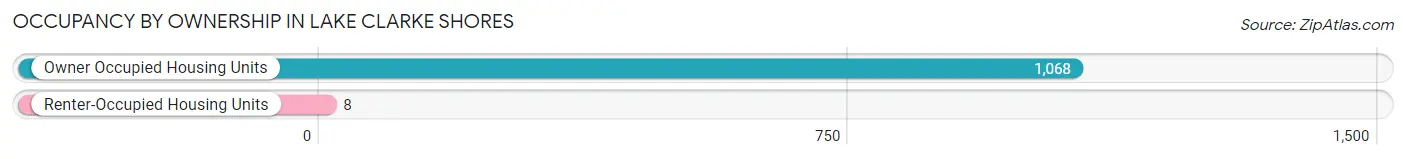
| Occupancy | # Housing Units | % Housing Units |
| Owner Occupied Housing Units | 1,068 | 99.3% |
| Renter-Occupied Housing Units | 8 | 0.7% |
| Total Occupied Housing Units | 1,076 | 100.0% |
Occupancy by Household Size in Lake Clarke Shores
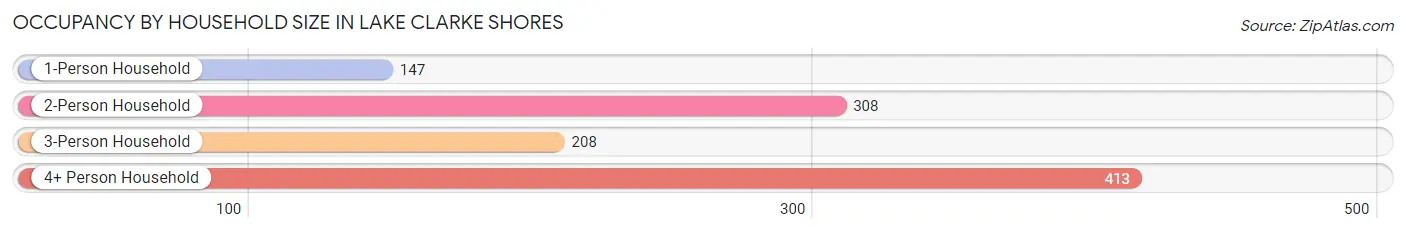
| Household Size | # Housing Units | % Housing Units |
| 1-Person Household | 147 | 13.7% |
| 2-Person Household | 308 | 28.6% |
| 3-Person Household | 208 | 19.3% |
| 4+ Person Household | 413 | 38.4% |
| Total Housing Units | 1,076 | 100.0% |
Occupancy by Ownership by Household Size in Lake Clarke Shores
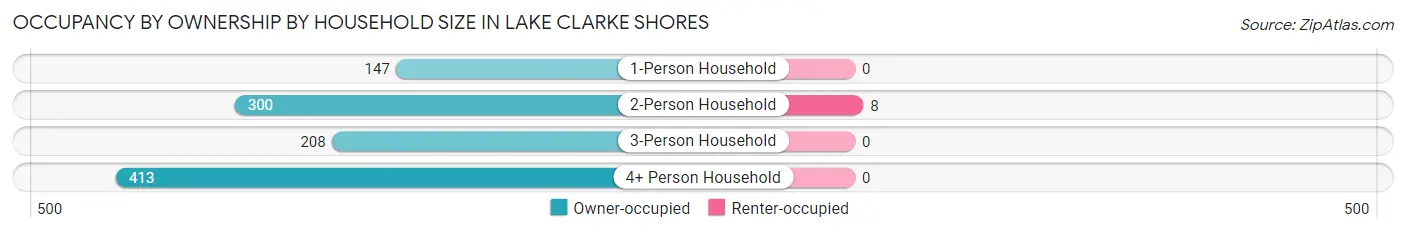
| Household Size | Owner-occupied | Renter-occupied |
| 1-Person Household | 147 (100.0%) | 0 (0.0%) |
| 2-Person Household | 300 (97.4%) | 8 (2.6%) |
| 3-Person Household | 208 (100.0%) | 0 (0.0%) |
| 4+ Person Household | 413 (100.0%) | 0 (0.0%) |
| Total Housing Units | 1,068 (99.3%) | 8 (0.7%) |
Occupancy by Educational Attainment in Lake Clarke Shores
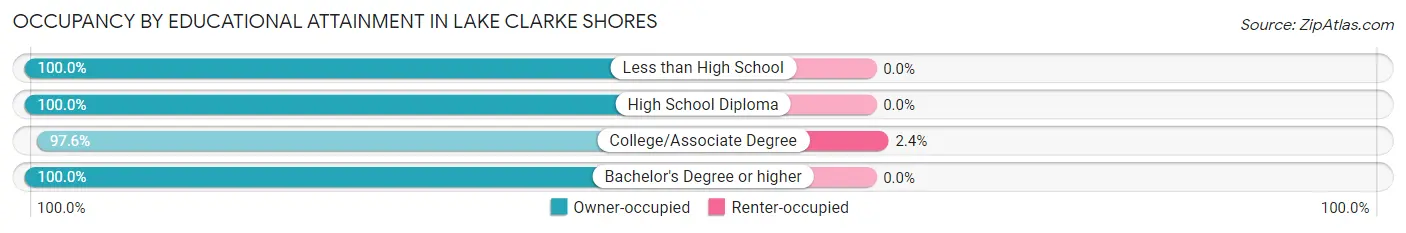
| Household Size | Owner-occupied | Renter-occupied |
| Less than High School | 34 (100.0%) | 0 (0.0%) |
| High School Diploma | 121 (100.0%) | 0 (0.0%) |
| College/Associate Degree | 320 (97.6%) | 8 (2.4%) |
| Bachelor's Degree or higher | 593 (100.0%) | 0 (0.0%) |
Occupancy by Age of Householder in Lake Clarke Shores
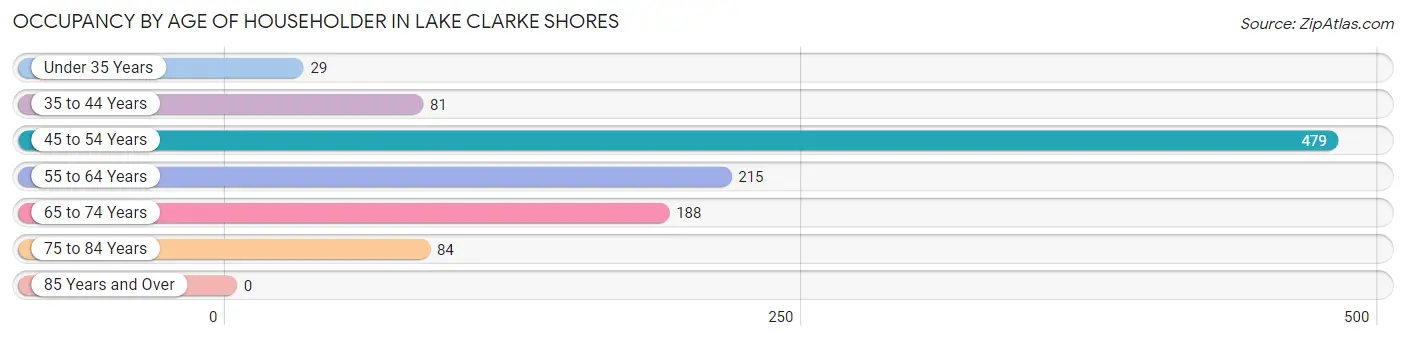
| Age Bracket | # Households | % Households |
| Under 35 Years | 29 | 2.7% |
| 35 to 44 Years | 81 | 7.5% |
| 45 to 54 Years | 479 | 44.5% |
| 55 to 64 Years | 215 | 20.0% |
| 65 to 74 Years | 188 | 17.5% |
| 75 to 84 Years | 84 | 7.8% |
| 85 Years and Over | 0 | 0.0% |
| Total | 1,076 | 100.0% |
Housing Finances in Lake Clarke Shores
Median Income by Occupancy in Lake Clarke Shores
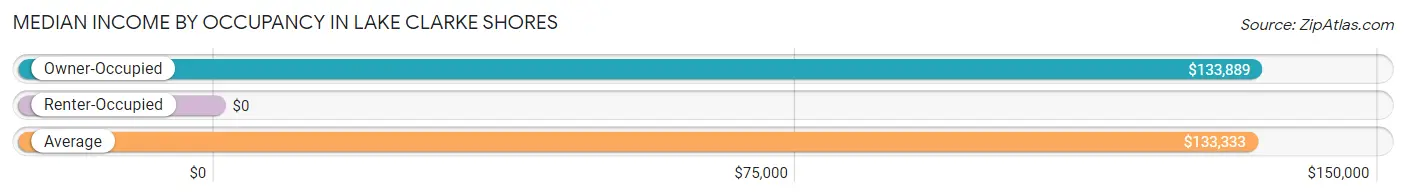
| Occupancy Type | # Households | Median Income |
| Owner-Occupied | 1,068 (99.3%) | $133,889 |
| Renter-Occupied | 8 (0.7%) | $0 |
| Average | 1,076 (100.0%) | $133,333 |
Occupancy by Householder Income Bracket in Lake Clarke Shores
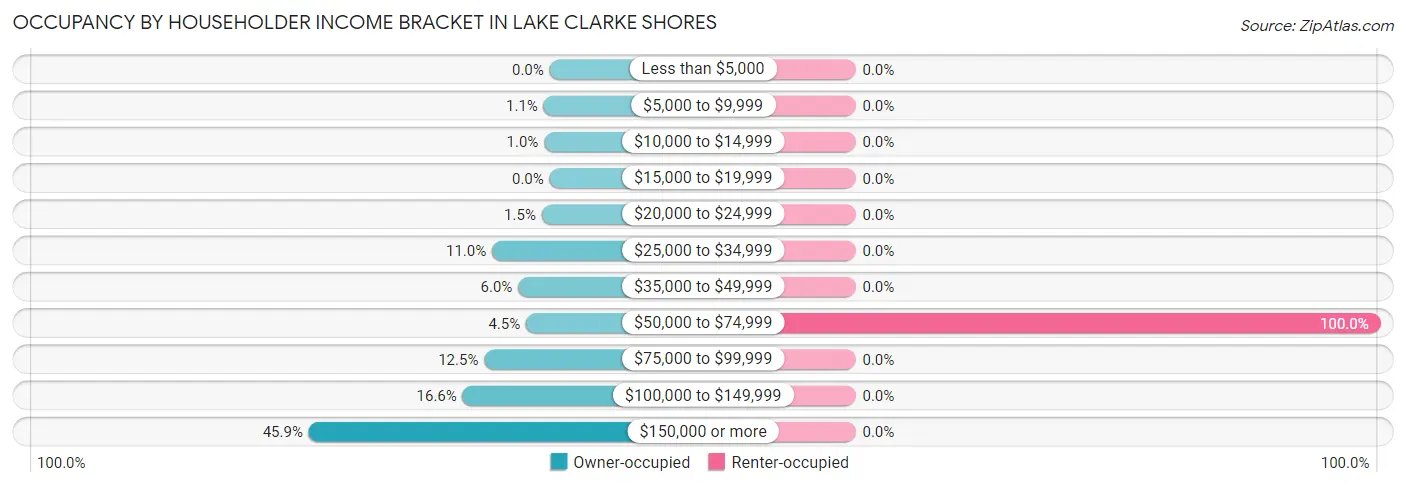
| Income Bracket | Owner-occupied | Renter-occupied |
| Less than $5,000 | 0 (0.0%) | 0 (0.0%) |
| $5,000 to $9,999 | 12 (1.1%) | 0 (0.0%) |
| $10,000 to $14,999 | 11 (1.0%) | 0 (0.0%) |
| $15,000 to $19,999 | 0 (0.0%) | 0 (0.0%) |
| $20,000 to $24,999 | 16 (1.5%) | 0 (0.0%) |
| $25,000 to $34,999 | 117 (11.0%) | 0 (0.0%) |
| $35,000 to $49,999 | 64 (6.0%) | 0 (0.0%) |
| $50,000 to $74,999 | 48 (4.5%) | 8 (100.0%) |
| $75,000 to $99,999 | 133 (12.4%) | 0 (0.0%) |
| $100,000 to $149,999 | 177 (16.6%) | 0 (0.0%) |
| $150,000 or more | 490 (45.9%) | 0 (0.0%) |
| Total | 1,068 (100.0%) | 8 (100.0%) |
Monthly Housing Cost Tiers in Lake Clarke Shores
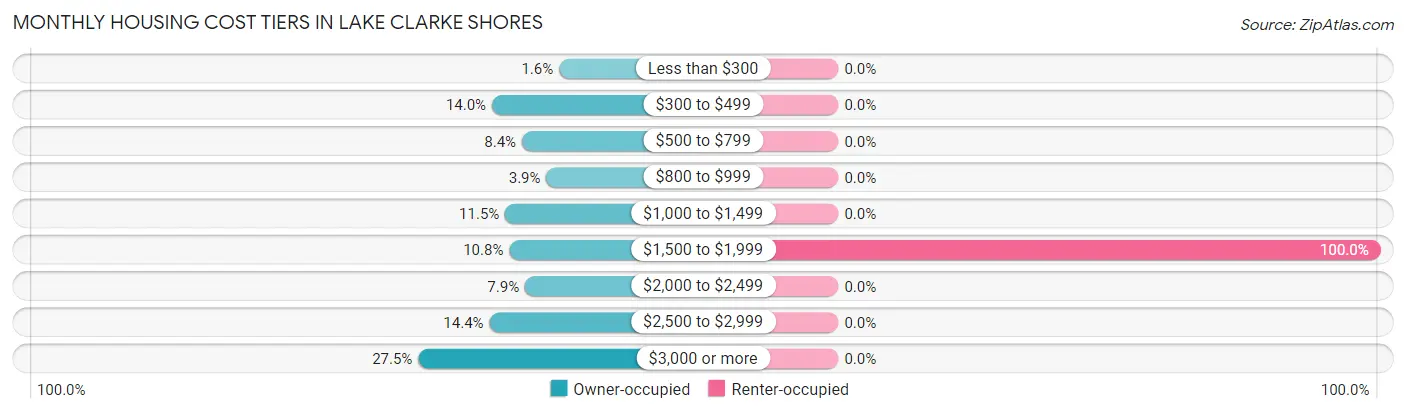
| Monthly Cost | Owner-occupied | Renter-occupied |
| Less than $300 | 17 (1.6%) | 0 (0.0%) |
| $300 to $499 | 149 (14.0%) | 0 (0.0%) |
| $500 to $799 | 90 (8.4%) | 0 (0.0%) |
| $800 to $999 | 42 (3.9%) | 0 (0.0%) |
| $1,000 to $1,499 | 123 (11.5%) | 0 (0.0%) |
| $1,500 to $1,999 | 115 (10.8%) | 8 (100.0%) |
| $2,000 to $2,499 | 84 (7.9%) | 0 (0.0%) |
| $2,500 to $2,999 | 154 (14.4%) | 0 (0.0%) |
| $3,000 or more | 294 (27.5%) | 0 (0.0%) |
| Total | 1,068 (100.0%) | 8 (100.0%) |
Physical Housing Characteristics in Lake Clarke Shores
Housing Structures in Lake Clarke Shores
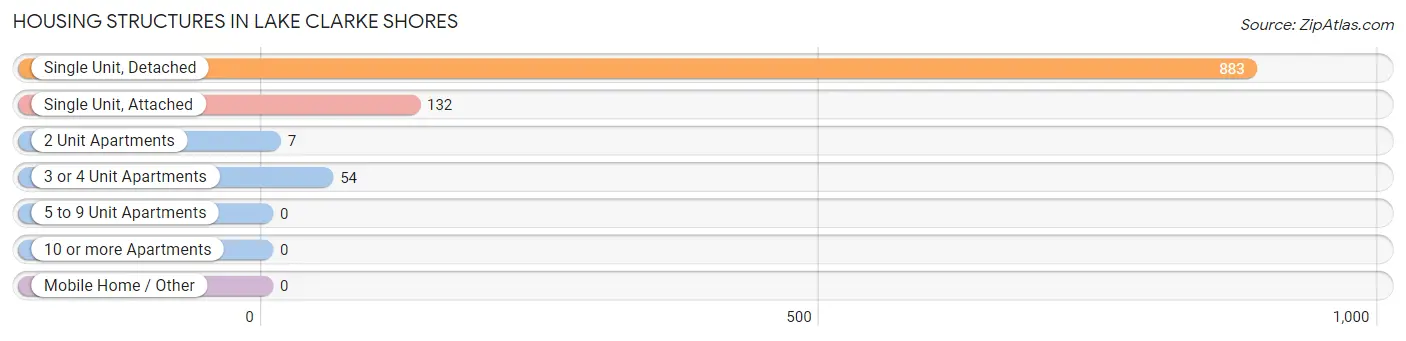
| Structure Type | # Housing Units | % Housing Units |
| Single Unit, Detached | 883 | 82.1% |
| Single Unit, Attached | 132 | 12.3% |
| 2 Unit Apartments | 7 | 0.6% |
| 3 or 4 Unit Apartments | 54 | 5.0% |
| 5 to 9 Unit Apartments | 0 | 0.0% |
| 10 or more Apartments | 0 | 0.0% |
| Mobile Home / Other | 0 | 0.0% |
| Total | 1,076 | 100.0% |
Housing Structures by Occupancy in Lake Clarke Shores
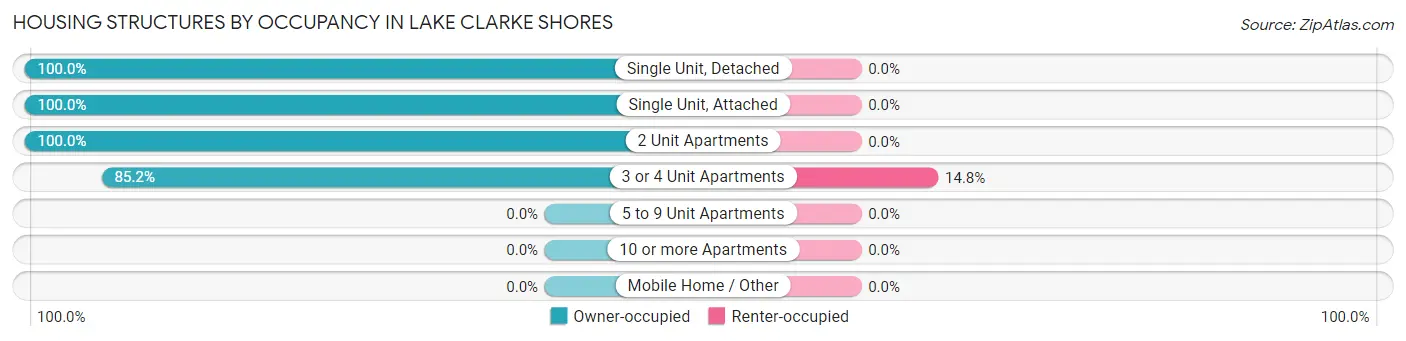
| Structure Type | Owner-occupied | Renter-occupied |
| Single Unit, Detached | 883 (100.0%) | 0 (0.0%) |
| Single Unit, Attached | 132 (100.0%) | 0 (0.0%) |
| 2 Unit Apartments | 7 (100.0%) | 0 (0.0%) |
| 3 or 4 Unit Apartments | 46 (85.2%) | 8 (14.8%) |
| 5 to 9 Unit Apartments | 0 (0.0%) | 0 (0.0%) |
| 10 or more Apartments | 0 (0.0%) | 0 (0.0%) |
| Mobile Home / Other | 0 (0.0%) | 0 (0.0%) |
| Total | 1,068 (99.3%) | 8 (0.7%) |
Housing Structures by Number of Rooms in Lake Clarke Shores
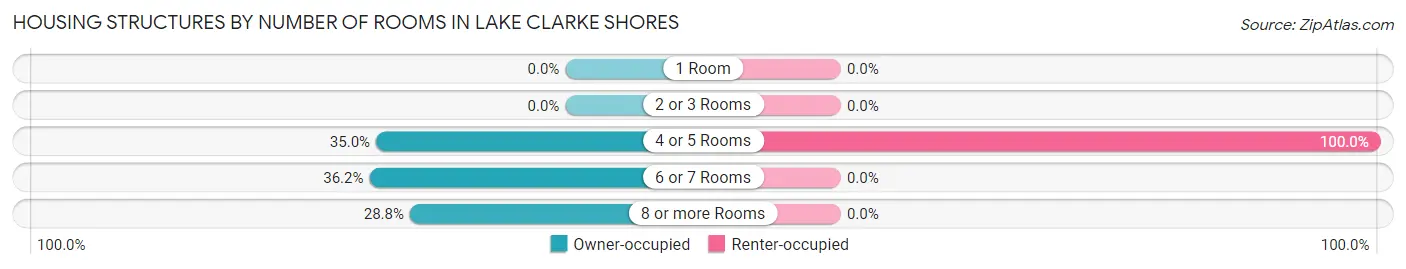
| Number of Rooms | Owner-occupied | Renter-occupied |
| 1 Room | 0 (0.0%) | 0 (0.0%) |
| 2 or 3 Rooms | 0 (0.0%) | 0 (0.0%) |
| 4 or 5 Rooms | 374 (35.0%) | 8 (100.0%) |
| 6 or 7 Rooms | 387 (36.2%) | 0 (0.0%) |
| 8 or more Rooms | 307 (28.7%) | 0 (0.0%) |
| Total | 1,068 (100.0%) | 8 (100.0%) |
Housing Structure by Heating Type in Lake Clarke Shores
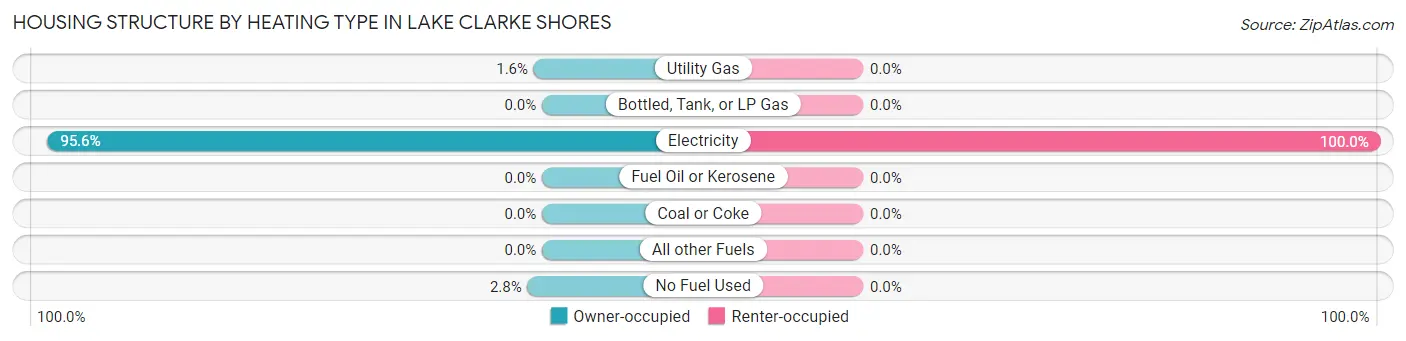
| Heating Type | Owner-occupied | Renter-occupied |
| Utility Gas | 17 (1.6%) | 0 (0.0%) |
| Bottled, Tank, or LP Gas | 0 (0.0%) | 0 (0.0%) |
| Electricity | 1,021 (95.6%) | 8 (100.0%) |
| Fuel Oil or Kerosene | 0 (0.0%) | 0 (0.0%) |
| Coal or Coke | 0 (0.0%) | 0 (0.0%) |
| All other Fuels | 0 (0.0%) | 0 (0.0%) |
| No Fuel Used | 30 (2.8%) | 0 (0.0%) |
| Total | 1,068 (100.0%) | 8 (100.0%) |
Household Vehicle Usage in Lake Clarke Shores
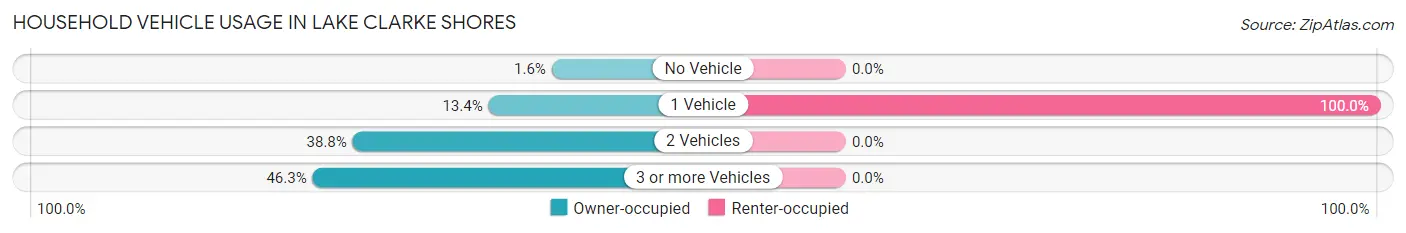
| Vehicles per Household | Owner-occupied | Renter-occupied |
| No Vehicle | 17 (1.6%) | 0 (0.0%) |
| 1 Vehicle | 143 (13.4%) | 8 (100.0%) |
| 2 Vehicles | 414 (38.8%) | 0 (0.0%) |
| 3 or more Vehicles | 494 (46.3%) | 0 (0.0%) |
| Total | 1,068 (100.0%) | 8 (100.0%) |
Real Estate & Mortgages in Lake Clarke Shores
Real Estate and Mortgage Overview in Lake Clarke Shores
| Characteristic | Without Mortgage | With Mortgage |
| Housing Units | 483 | 585 |
| Median Property Value | $488,900 | $461,700 |
| Median Household Income | $156,754 | $205 |
| Monthly Housing Costs | $902 | $157 |
| Real Estate Taxes | $5,609 | $0 |
Property Value by Mortgage Status in Lake Clarke Shores
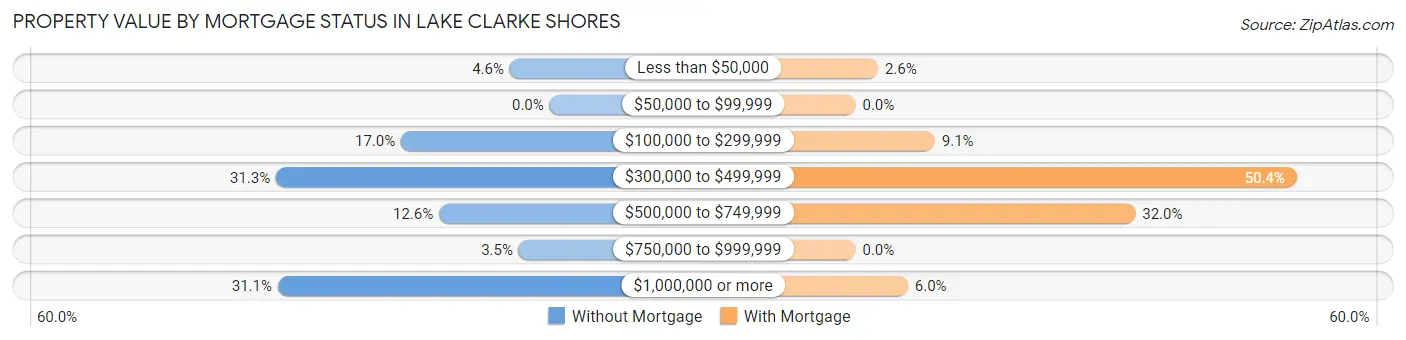
| Property Value | Without Mortgage | With Mortgage |
| Less than $50,000 | 22 (4.5%) | 15 (2.6%) |
| $50,000 to $99,999 | 0 (0.0%) | 0 (0.0%) |
| $100,000 to $299,999 | 82 (17.0%) | 53 (9.1%) |
| $300,000 to $499,999 | 151 (31.3%) | 295 (50.4%) |
| $500,000 to $749,999 | 61 (12.6%) | 187 (32.0%) |
| $750,000 to $999,999 | 17 (3.5%) | 0 (0.0%) |
| $1,000,000 or more | 150 (31.1%) | 35 (6.0%) |
| Total | 483 (100.0%) | 585 (100.0%) |
Household Income by Mortgage Status in Lake Clarke Shores
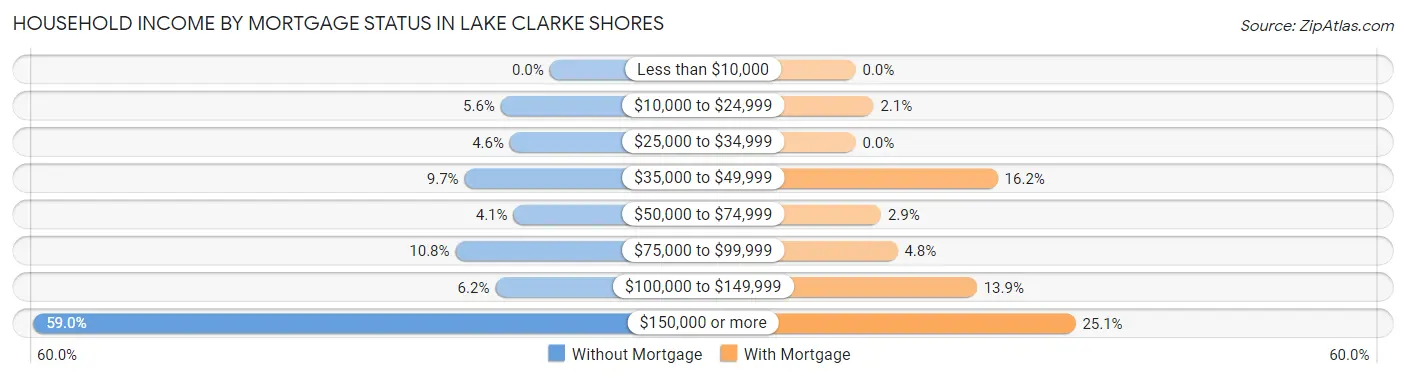
| Household Income | Without Mortgage | With Mortgage |
| Less than $10,000 | 0 (0.0%) | 0 (0.0%) |
| $10,000 to $24,999 | 27 (5.6%) | 12 (2.1%) |
| $25,000 to $34,999 | 22 (4.5%) | 0 (0.0%) |
| $35,000 to $49,999 | 47 (9.7%) | 95 (16.2%) |
| $50,000 to $74,999 | 20 (4.1%) | 17 (2.9%) |
| $75,000 to $99,999 | 52 (10.8%) | 28 (4.8%) |
| $100,000 to $149,999 | 30 (6.2%) | 81 (13.9%) |
| $150,000 or more | 285 (59.0%) | 147 (25.1%) |
| Total | 483 (100.0%) | 585 (100.0%) |
Property Value to Household Income Ratio in Lake Clarke Shores
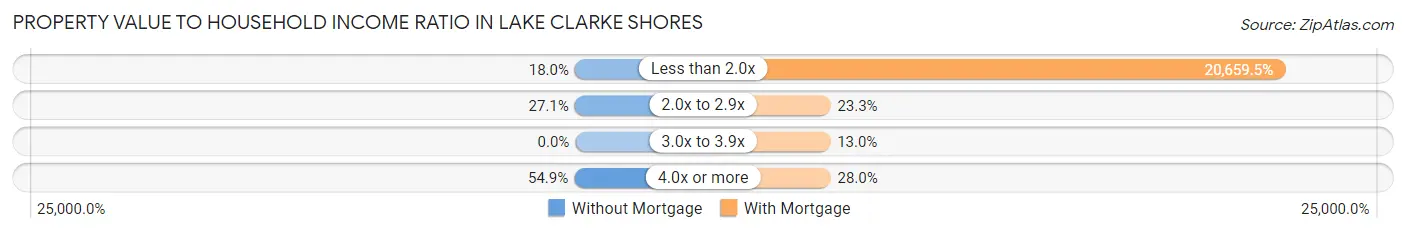
| Value-to-Income Ratio | Without Mortgage | With Mortgage |
| Less than 2.0x | 87 (18.0%) | 120,858 (20,659.5%) |
| 2.0x to 2.9x | 131 (27.1%) | 136 (23.3%) |
| 3.0x to 3.9x | 0 (0.0%) | 76 (13.0%) |
| 4.0x or more | 265 (54.9%) | 164 (28.0%) |
| Total | 483 (100.0%) | 585 (100.0%) |
Real Estate Taxes by Mortgage Status in Lake Clarke Shores
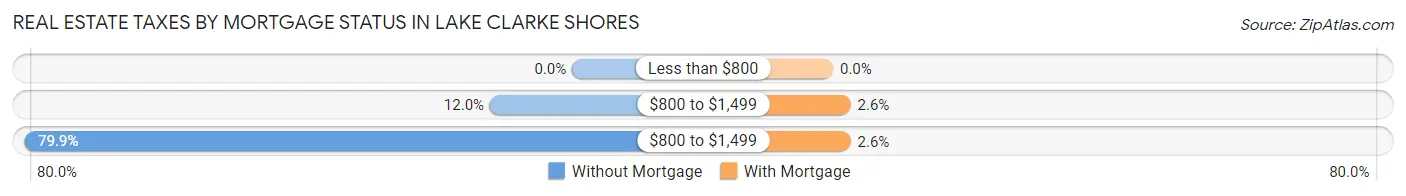
| Property Taxes | Without Mortgage | With Mortgage |
| Less than $800 | 0 (0.0%) | 0 (0.0%) |
| $800 to $1,499 | 58 (12.0%) | 15 (2.6%) |
| $800 to $1,499 | 386 (79.9%) | 15 (2.6%) |
| Total | 483 (100.0%) | 585 (100.0%) |
Health & Disability in Lake Clarke Shores
Health Insurance Coverage by Age in Lake Clarke Shores
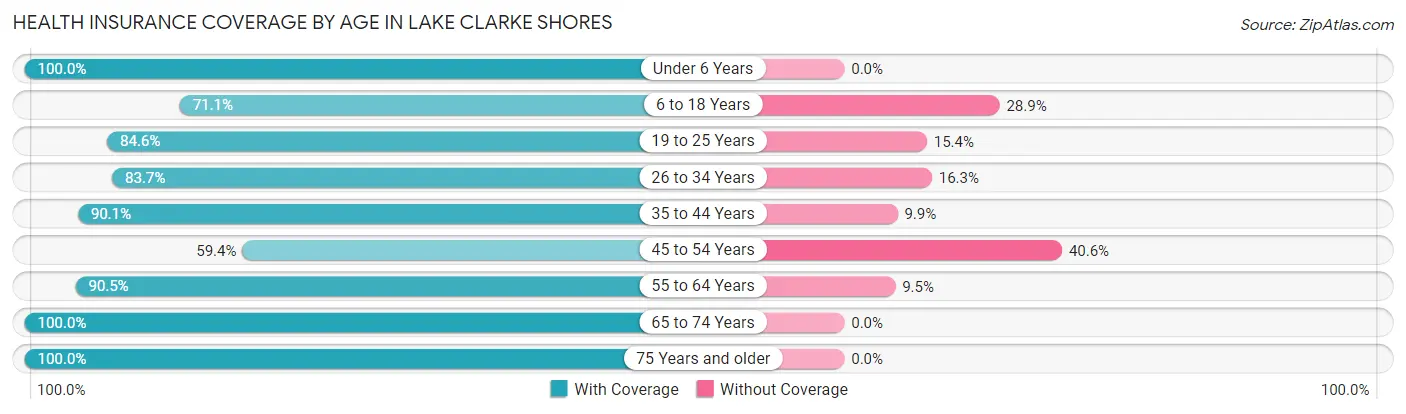
| Age Bracket | With Coverage | Without Coverage |
| Under 6 Years | 131 (100.0%) | 0 (0.0%) |
| 6 to 18 Years | 496 (71.1%) | 202 (28.9%) |
| 19 to 25 Years | 429 (84.6%) | 78 (15.4%) |
| 26 to 34 Years | 195 (83.7%) | 38 (16.3%) |
| 35 to 44 Years | 227 (90.1%) | 25 (9.9%) |
| 45 to 54 Years | 581 (59.4%) | 397 (40.6%) |
| 55 to 64 Years | 286 (90.5%) | 30 (9.5%) |
| 65 to 74 Years | 286 (100.0%) | 0 (0.0%) |
| 75 Years and older | 152 (100.0%) | 0 (0.0%) |
| Total | 2,783 (78.3%) | 770 (21.7%) |
Health Insurance Coverage by Citizenship Status in Lake Clarke Shores
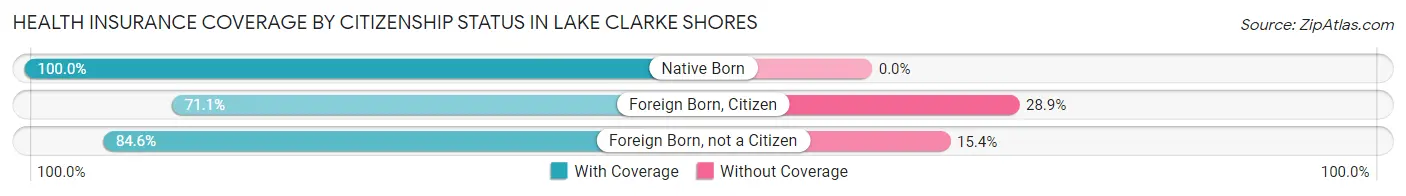
| Citizenship Status | With Coverage | Without Coverage |
| Native Born | 131 (100.0%) | 0 (0.0%) |
| Foreign Born, Citizen | 496 (71.1%) | 202 (28.9%) |
| Foreign Born, not a Citizen | 429 (84.6%) | 78 (15.4%) |
Health Insurance Coverage by Household Income in Lake Clarke Shores
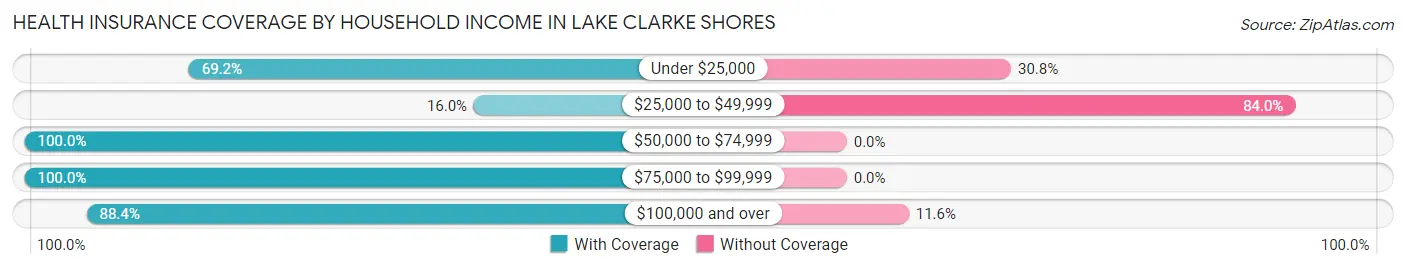
| Household Income | With Coverage | Without Coverage |
| Under $25,000 | 27 (69.2%) | 12 (30.8%) |
| $25,000 to $49,999 | 88 (16.0%) | 462 (84.0%) |
| $50,000 to $74,999 | 80 (100.0%) | 0 (0.0%) |
| $75,000 to $99,999 | 354 (100.0%) | 0 (0.0%) |
| $100,000 and over | 2,231 (88.4%) | 293 (11.6%) |
Public vs Private Health Insurance Coverage by Age in Lake Clarke Shores
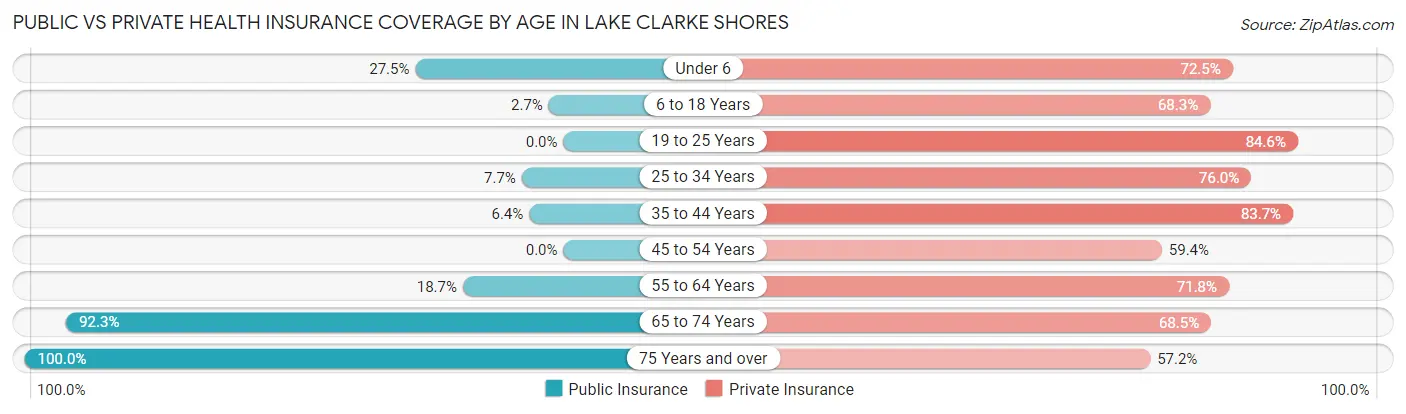
| Age Bracket | Public Insurance | Private Insurance |
| Under 6 | 36 (27.5%) | 95 (72.5%) |
| 6 to 18 Years | 19 (2.7%) | 477 (68.3%) |
| 19 to 25 Years | 0 (0.0%) | 429 (84.6%) |
| 25 to 34 Years | 18 (7.7%) | 177 (76.0%) |
| 35 to 44 Years | 16 (6.4%) | 211 (83.7%) |
| 45 to 54 Years | 0 (0.0%) | 581 (59.4%) |
| 55 to 64 Years | 59 (18.7%) | 227 (71.8%) |
| 65 to 74 Years | 264 (92.3%) | 196 (68.5%) |
| 75 Years and over | 152 (100.0%) | 87 (57.2%) |
| Total | 564 (15.9%) | 2,480 (69.8%) |
Disability Status by Sex by Age in Lake Clarke Shores
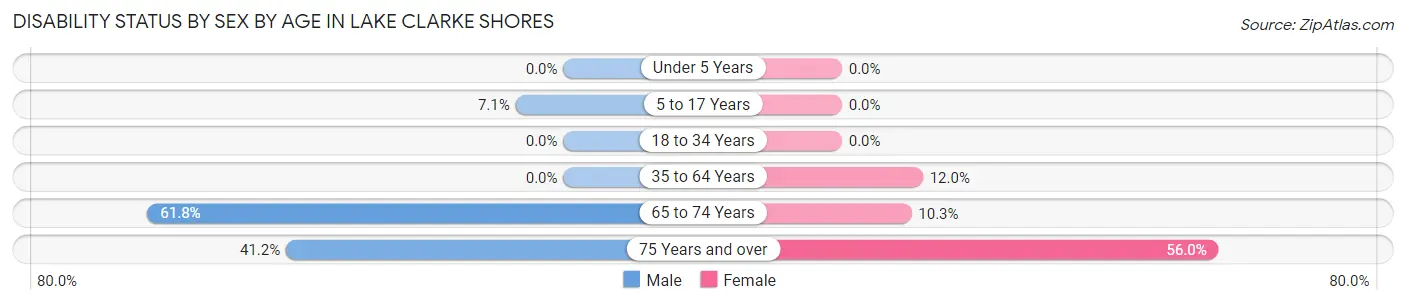
| Age Bracket | Male | Female |
| Under 5 Years | 0 (0.0%) | 0 (0.0%) |
| 5 to 17 Years | 22 (7.1%) | 0 (0.0%) |
| 18 to 34 Years | 0 (0.0%) | 0 (0.0%) |
| 35 to 64 Years | 0 (0.0%) | 100 (12.0%) |
| 65 to 74 Years | 63 (61.8%) | 19 (10.3%) |
| 75 Years and over | 28 (41.2%) | 47 (55.9%) |
Disability Class by Sex by Age in Lake Clarke Shores
Disability Class: Hearing Difficulty
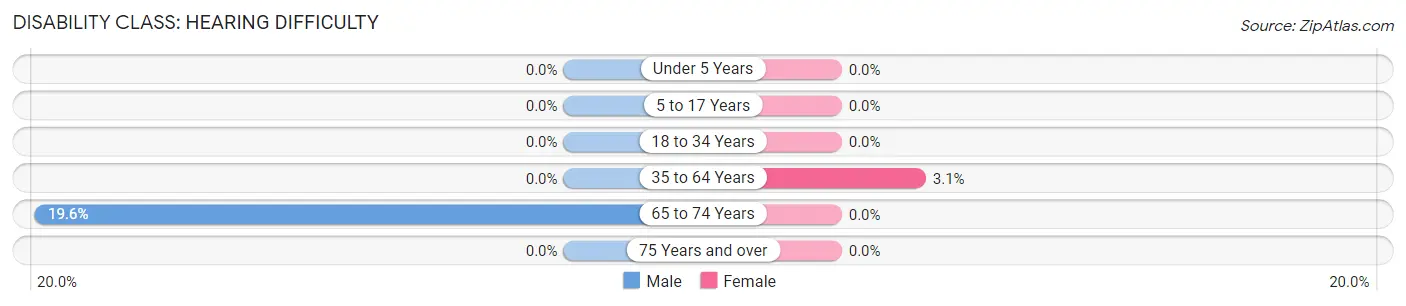
| Age Bracket | Male | Female |
| Under 5 Years | 0 (0.0%) | 0 (0.0%) |
| 5 to 17 Years | 0 (0.0%) | 0 (0.0%) |
| 18 to 34 Years | 0 (0.0%) | 0 (0.0%) |
| 35 to 64 Years | 0 (0.0%) | 26 (3.1%) |
| 65 to 74 Years | 20 (19.6%) | 0 (0.0%) |
| 75 Years and over | 0 (0.0%) | 0 (0.0%) |
Disability Class: Vision Difficulty
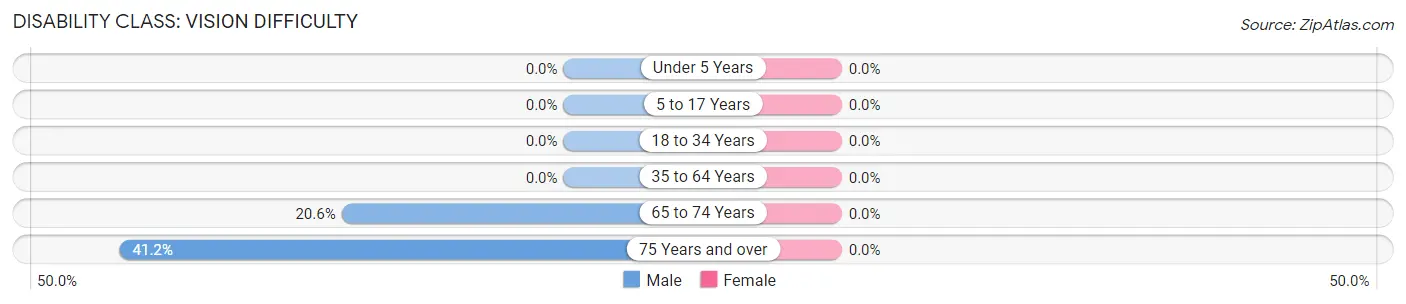
| Age Bracket | Male | Female |
| Under 5 Years | 0 (0.0%) | 0 (0.0%) |
| 5 to 17 Years | 0 (0.0%) | 0 (0.0%) |
| 18 to 34 Years | 0 (0.0%) | 0 (0.0%) |
| 35 to 64 Years | 0 (0.0%) | 0 (0.0%) |
| 65 to 74 Years | 21 (20.6%) | 0 (0.0%) |
| 75 Years and over | 28 (41.2%) | 0 (0.0%) |
Disability Class: Cognitive Difficulty
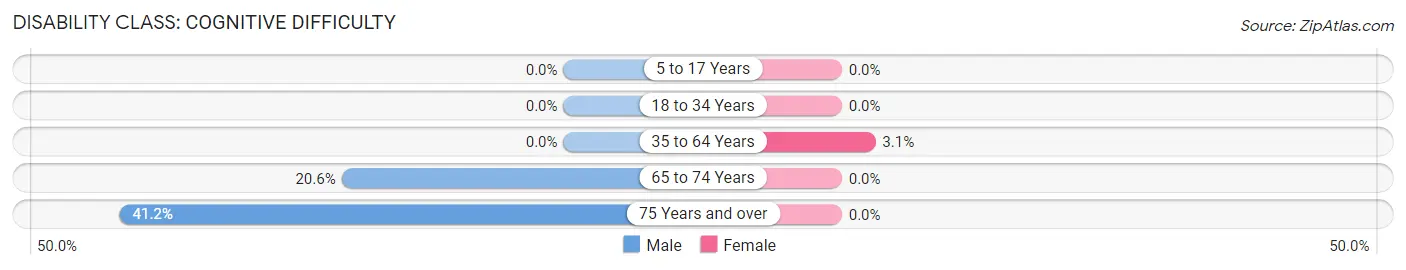
| Age Bracket | Male | Female |
| 5 to 17 Years | 0 (0.0%) | 0 (0.0%) |
| 18 to 34 Years | 0 (0.0%) | 0 (0.0%) |
| 35 to 64 Years | 0 (0.0%) | 26 (3.1%) |
| 65 to 74 Years | 21 (20.6%) | 0 (0.0%) |
| 75 Years and over | 28 (41.2%) | 0 (0.0%) |
Disability Class: Ambulatory Difficulty
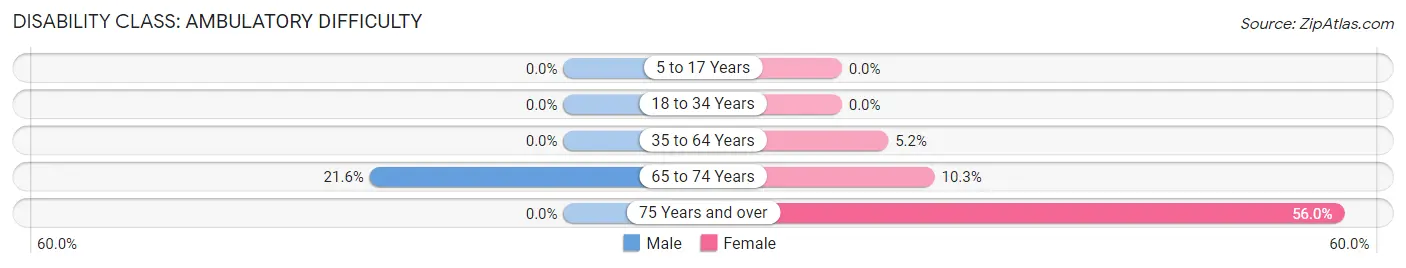
| Age Bracket | Male | Female |
| 5 to 17 Years | 0 (0.0%) | 0 (0.0%) |
| 18 to 34 Years | 0 (0.0%) | 0 (0.0%) |
| 35 to 64 Years | 0 (0.0%) | 43 (5.2%) |
| 65 to 74 Years | 22 (21.6%) | 19 (10.3%) |
| 75 Years and over | 0 (0.0%) | 47 (55.9%) |
Disability Class: Self-Care Difficulty
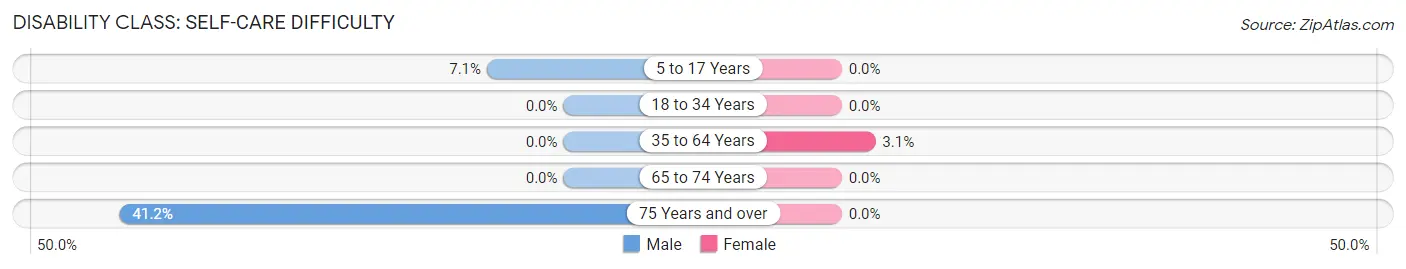
| Age Bracket | Male | Female |
| 5 to 17 Years | 22 (7.1%) | 0 (0.0%) |
| 18 to 34 Years | 0 (0.0%) | 0 (0.0%) |
| 35 to 64 Years | 0 (0.0%) | 26 (3.1%) |
| 65 to 74 Years | 0 (0.0%) | 0 (0.0%) |
| 75 Years and over | 28 (41.2%) | 0 (0.0%) |
Technology Access in Lake Clarke Shores
Computing Device Access in Lake Clarke Shores
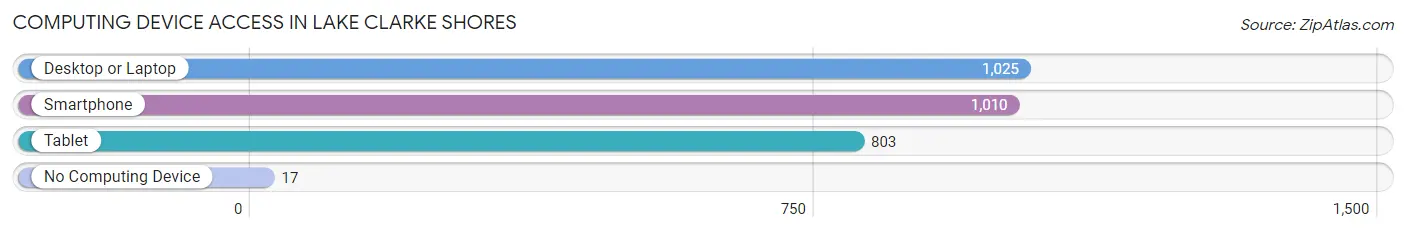
| Device Type | # Households | % Households |
| Desktop or Laptop | 1,025 | 95.3% |
| Smartphone | 1,010 | 93.9% |
| Tablet | 803 | 74.6% |
| No Computing Device | 17 | 1.6% |
| Total | 1,076 | 100.0% |
Internet Access in Lake Clarke Shores
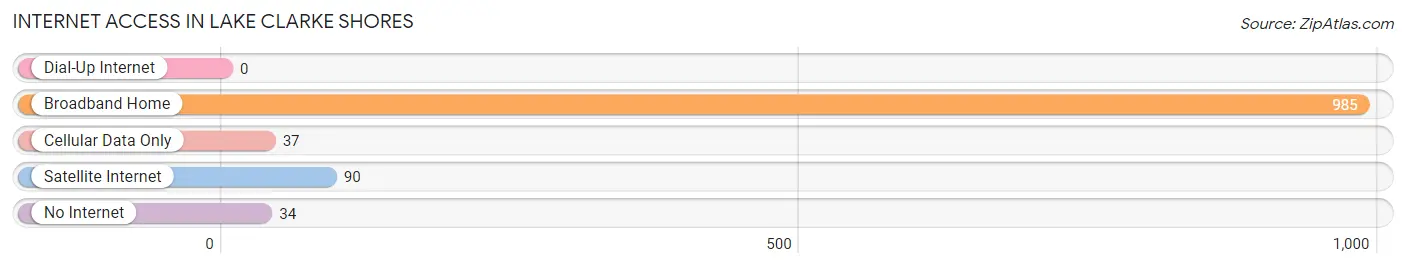
| Internet Type | # Households | % Households |
| Dial-Up Internet | 0 | 0.0% |
| Broadband Home | 985 | 91.5% |
| Cellular Data Only | 37 | 3.4% |
| Satellite Internet | 90 | 8.4% |
| No Internet | 34 | 3.2% |
| Total | 1,076 | 100.0% |
Lake Clarke Shores Summary
History
Lake Clarke Shores is a small town located in Palm Beach County, Florida. It is situated on the western shore of Lake Clarke, a large freshwater lake. The town was incorporated in 1957 and has a population of approximately 4,000 people.
The area was originally inhabited by the Tequesta Indians, who were the first known inhabitants of the area. The Tequesta Indians were a peaceful tribe that lived in the area for centuries before the arrival of Europeans. The first Europeans to settle in the area were Spanish explorers in the late 1500s. They named the lake after the Tequesta chief, Chief Clarke.
In the early 1900s, the area began to be developed as a residential community. The first homes were built in the 1920s and 1930s. The town was officially incorporated in 1957 and has since grown to become a popular residential community.
Geography
Lake Clarke Shores is located in Palm Beach County, Florida. It is situated on the western shore of Lake Clarke, a large freshwater lake. The town is bordered by the cities of West Palm Beach, Lake Worth, and Greenacres.
The town has a total area of 1.3 square miles, all of which is land. The town is located at an elevation of 10 feet above sea level. The climate in the area is classified as humid subtropical, with hot, humid summers and mild winters.
Economy
The economy of Lake Clarke Shores is largely based on tourism and real estate. The town is home to several resorts and hotels, as well as a number of restaurants and shops. The town also has a number of marinas and boat docks, which attract visitors from all over the world.
The town is also home to a number of businesses, including a number of professional services, such as law firms, accounting firms, and financial services. The town also has a number of retail stores, including clothing stores, grocery stores, and home improvement stores.
Demographics
As of the 2010 census, the population of Lake Clarke Shores was 4,068. The population is made up of a diverse mix of people, with the majority being white (78.3%), followed by African American (14.2%), Hispanic (4.2%), and Asian (2.3%).
The median household income in the town is $50,945, and the median home value is $212,000. The town has a high rate of homeownership, with over 80% of the population owning their own homes.
The town is served by the Palm Beach County School District, which includes two elementary schools, one middle school, and one high school. The town also has a number of private schools, including a Catholic school and a Montessori school.
Common Questions
What is Per Capita Income in Lake Clarke Shores?
Per Capita income in Lake Clarke Shores is $55,108.
What is the Median Family Income in Lake Clarke Shores?
Median Family Income in Lake Clarke Shores is $151,161.
What is the Median Household income in Lake Clarke Shores?
Median Household Income in Lake Clarke Shores is $133,333.
What is Income or Wage Gap in Lake Clarke Shores?
Income or Wage Gap in Lake Clarke Shores is 11.1%.
Women in Lake Clarke Shores earn 88.9 cents for every dollar earned by a man.
What is Inequality or Gini Index in Lake Clarke Shores?
Inequality or Gini Index in Lake Clarke Shores is 0.44.
What is the Total Population of Lake Clarke Shores?
Total Population of Lake Clarke Shores is 3,553.
What is the Total Male Population of Lake Clarke Shores?
Total Male Population of Lake Clarke Shores is 1,702.
What is the Total Female Population of Lake Clarke Shores?
Total Female Population of Lake Clarke Shores is 1,851.
What is the Ratio of Males per 100 Females in Lake Clarke Shores?
There are 91.95 Males per 100 Females in Lake Clarke Shores.
What is the Ratio of Females per 100 Males in Lake Clarke Shores?
There are 108.75 Females per 100 Males in Lake Clarke Shores.
What is the Median Population Age in Lake Clarke Shores?
Median Population Age in Lake Clarke Shores is 42.9 Years.
What is the Average Family Size in Lake Clarke Shores
Average Family Size in Lake Clarke Shores is 3.5 People.
What is the Average Household Size in Lake Clarke Shores
Average Household Size in Lake Clarke Shores is 3.3 People.
How Large is the Labor Force in Lake Clarke Shores?
There are 2,055 People in the Labor Forcein in Lake Clarke Shores.
What is the Percentage of People in the Labor Force in Lake Clarke Shores?
68.4% of People are in the Labor Force in Lake Clarke Shores.
What is the Unemployment Rate in Lake Clarke Shores?
Unemployment Rate in Lake Clarke Shores is 7.4%.