Dahlonega, GA Map & Demographics
Dahlonega Map
Dahlonega Overview
$24,752
PER CAPITA INCOME
$110,800
AVG FAMILY INCOME
$57,941
AVG HOUSEHOLD INCOME
0.48
INEQUALITY / GINI INDEX
7,083
TOTAL POPULATION
3,174
MALE POPULATION
3,909
FEMALE POPULATION
81.20
MALES / 100 FEMALES
123.16
FEMALES / 100 MALES
21.8
MEDIAN AGE
2.7
AVG FAMILY SIZE
2.5
AVG HOUSEHOLD SIZE
2,965
LABOR FORCE [ PEOPLE ]
45.1%
PERCENT IN LABOR FORCE
4.4%
UNEMPLOYMENT RATE
Dahlonega Area Codes
Income in Dahlonega
Income Overview in Dahlonega
Per Capita Income in Dahlonega is $24,752, while median incomes of families and households are $110,800 and $57,941 respectively.
| Characteristic | Number | Measure |
| Per Capita Income | 7,083 | $24,752 |
| Median Family Income | 1,160 | $110,800 |
| Mean Family Income | 1,160 | $115,153 |
| Median Household Income | 2,102 | $57,941 |
| Mean Household Income | 2,102 | $81,360 |
| Income Deficit | 1,160 | $0 |
| Wage / Income Gap (%) | 7,083 | 0.00% |
| Wage / Income Gap ($) | 7,083 | 100.00¢ per $1 |
| Gini / Inequality Index | 7,083 | 0.48 |
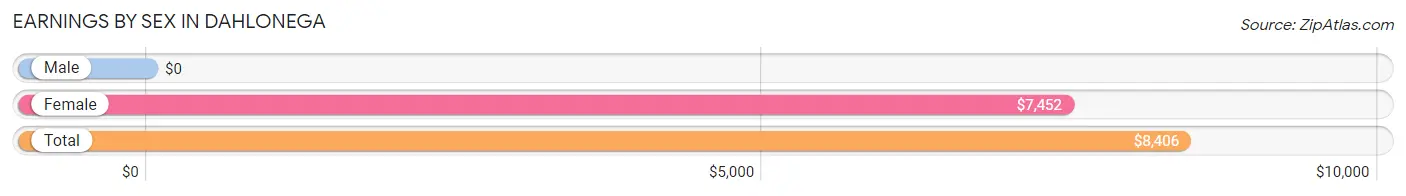
Earnings by Sex in Dahlonega
| Sex | Number | Average Earnings |
| Male | 1,934 (48.4%) | $0 |
| Female | 2,061 (51.6%) | $7,452 |
| Total | 3,995 (100.0%) | $8,406 |
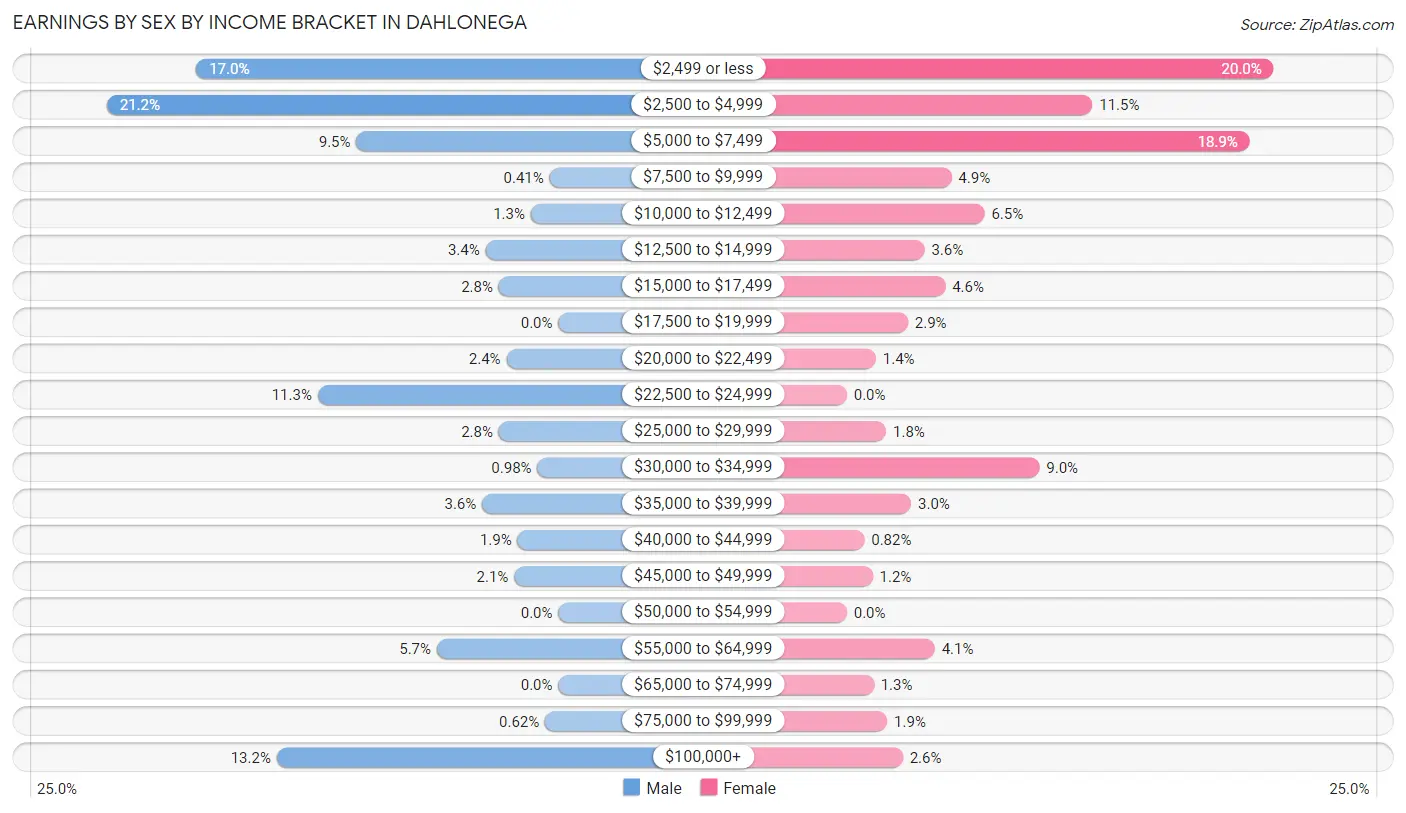
Earnings by Sex by Income Bracket in Dahlonega
The most common earnings brackets in Dahlonega are $2,500 to $4,999 for men (409 | 21.1%) and $2,499 or less for women (412 | 20.0%).
| Income | Male | Female |
| $2,499 or less | 328 (17.0%) | 412 (20.0%) |
| $2,500 to $4,999 | 409 (21.1%) | 237 (11.5%) |
| $5,000 to $7,499 | 183 (9.5%) | 389 (18.9%) |
| $7,500 to $9,999 | 8 (0.4%) | 101 (4.9%) |
| $10,000 to $12,499 | 25 (1.3%) | 133 (6.5%) |
| $12,500 to $14,999 | 66 (3.4%) | 75 (3.6%) |
| $15,000 to $17,499 | 54 (2.8%) | 95 (4.6%) |
| $17,500 to $19,999 | 0 (0.0%) | 59 (2.9%) |
| $20,000 to $22,499 | 47 (2.4%) | 28 (1.4%) |
| $22,500 to $24,999 | 218 (11.3%) | 0 (0.0%) |
| $25,000 to $29,999 | 54 (2.8%) | 38 (1.8%) |
| $30,000 to $34,999 | 19 (1.0%) | 186 (9.0%) |
| $35,000 to $39,999 | 69 (3.6%) | 62 (3.0%) |
| $40,000 to $44,999 | 37 (1.9%) | 17 (0.8%) |
| $45,000 to $49,999 | 40 (2.1%) | 25 (1.2%) |
| $50,000 to $54,999 | 0 (0.0%) | 0 (0.0%) |
| $55,000 to $64,999 | 110 (5.7%) | 85 (4.1%) |
| $65,000 to $74,999 | 0 (0.0%) | 26 (1.3%) |
| $75,000 to $99,999 | 12 (0.6%) | 39 (1.9%) |
| $100,000+ | 255 (13.2%) | 54 (2.6%) |
| Total | 1,934 (100.0%) | 2,061 (100.0%) |
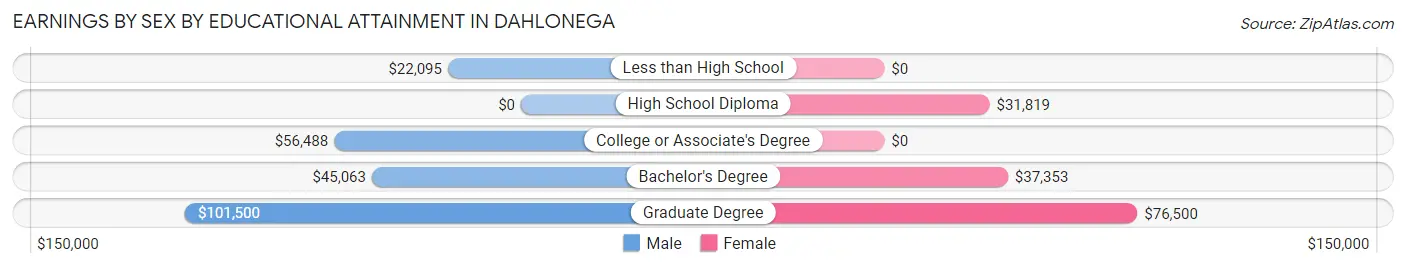
Earnings by Sex by Educational Attainment in Dahlonega
Average earnings in Dahlonega are $45,844 for men and $32,490 for women, a difference of 29.1%. Men with an educational attainment of graduate degree enjoy the highest average annual earnings of $101,500, while those with less than high school education earn the least with $22,095. Women with an educational attainment of graduate degree earn the most with the average annual earnings of $76,500, while those with high school diploma education have the smallest earnings of $31,819.
| Educational Attainment | Male Income | Female Income |
| Less than High School | $22,095 | $0 |
| High School Diploma | - | - |
| College or Associate's Degree | $56,488 | $0 |
| Bachelor's Degree | $45,063 | $37,353 |
| Graduate Degree | $101,500 | $76,500 |
| Total | $45,844 | $32,490 |
Family Income in Dahlonega
Family Income Brackets in Dahlonega
According to the Dahlonega family income data, there are 268 families falling into the $50,000 to $74,999 income range, which is the most common income bracket and makes up 23.1% of all families.
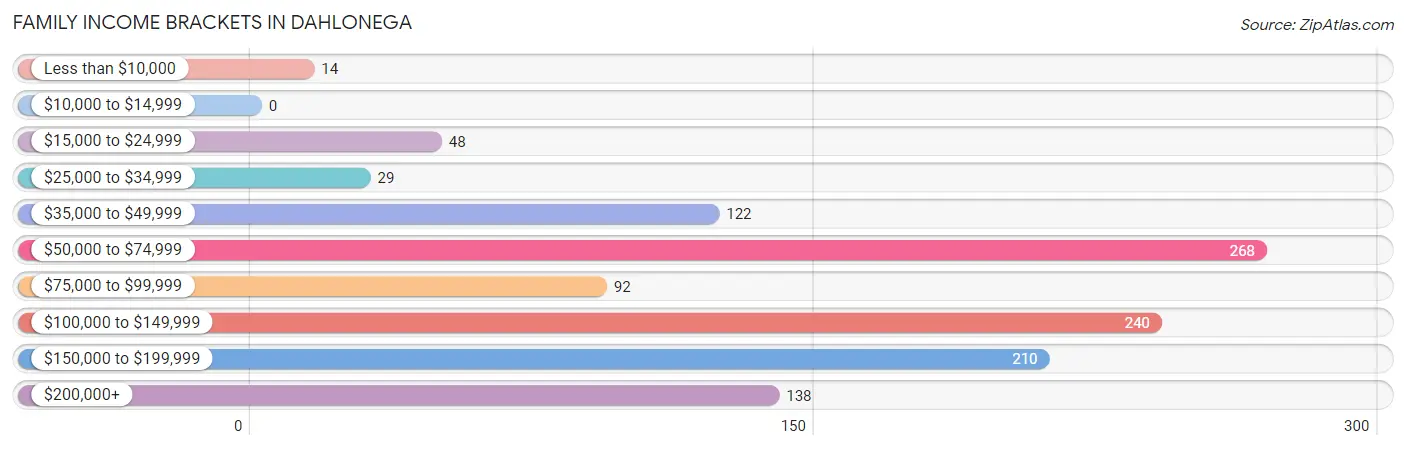
| Income Bracket | # Families | % Families |
| Less than $10,000 | 14 | 1.2% |
| $10,000 to $14,999 | 0 | 0.0% |
| $15,000 to $24,999 | 48 | 4.1% |
| $25,000 to $34,999 | 29 | 2.5% |
| $35,000 to $49,999 | 122 | 10.5% |
| $50,000 to $74,999 | 268 | 23.1% |
| $75,000 to $99,999 | 92 | 7.9% |
| $100,000 to $149,999 | 240 | 20.7% |
| $150,000 to $199,999 | 210 | 18.1% |
| $200,000+ | 138 | 11.9% |
Family Income by Famaliy Size in Dahlonega
4-person families (137 | 11.8%) account for the highest median family income in Dahlonega with $134,835 per family, while 2-person families (826 | 71.2%) have the highest median income of $37,946 per family member.
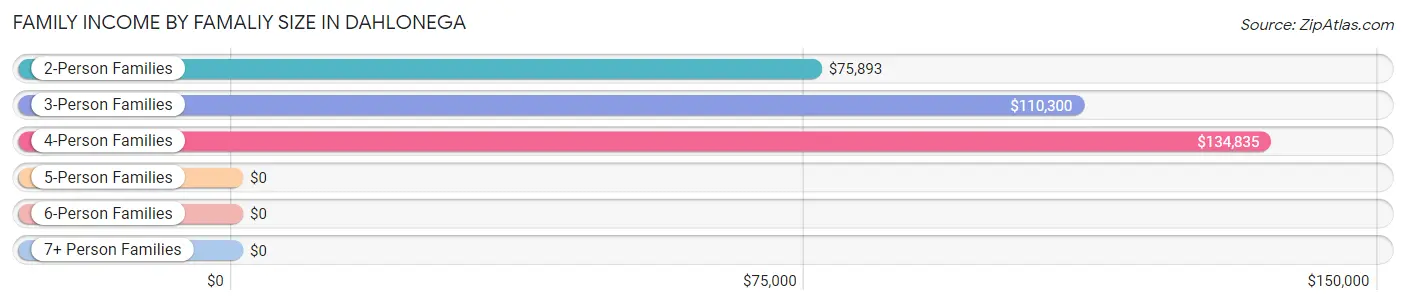
| Income Bracket | # Families | Median Income |
| 2-Person Families | 826 (71.2%) | $75,893 |
| 3-Person Families | 150 (12.9%) | $110,300 |
| 4-Person Families | 137 (11.8%) | $134,835 |
| 5-Person Families | 47 (4.1%) | $0 |
| 6-Person Families | 0 (0.0%) | $0 |
| 7+ Person Families | 0 (0.0%) | $0 |
| Total | 1,160 (100.0%) | $110,800 |
Family Income by Number of Earners in Dahlonega
The median family income in Dahlonega is $110,800, with families comprising no earners (478) having the highest median family income of $167,620, while families with 1 earner (185) have the lowest median family income of $56,208, accounting for 41.2% and 16.0% of families, respectively.
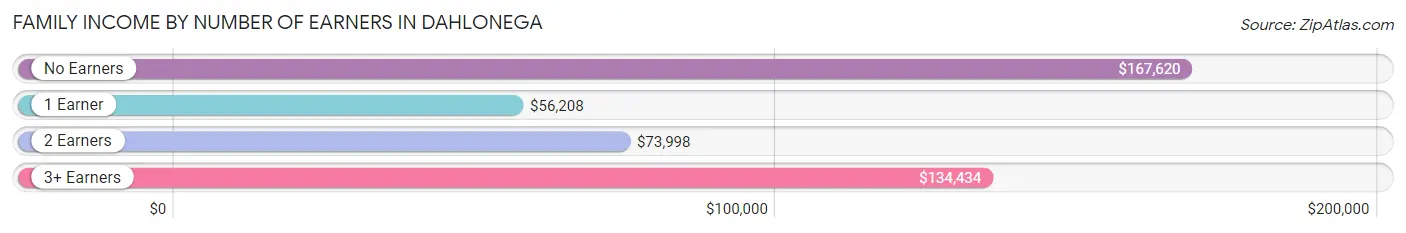
| Number of Earners | # Families | Median Income |
| No Earners | 478 (41.2%) | $167,620 |
| 1 Earner | 185 (16.0%) | $56,208 |
| 2 Earners | 391 (33.7%) | $73,998 |
| 3+ Earners | 106 (9.1%) | $134,434 |
| Total | 1,160 (100.0%) | $110,800 |
Household Income in Dahlonega
Household Income Brackets in Dahlonega
With 328 households falling in the category, the $15,000 to $24,999 income range is the most frequent in Dahlonega, accounting for 15.6% of all households. In contrast, only 99 households (4.7%) fall into the $75,000 to $99,999 income bracket, making it the least populous group.
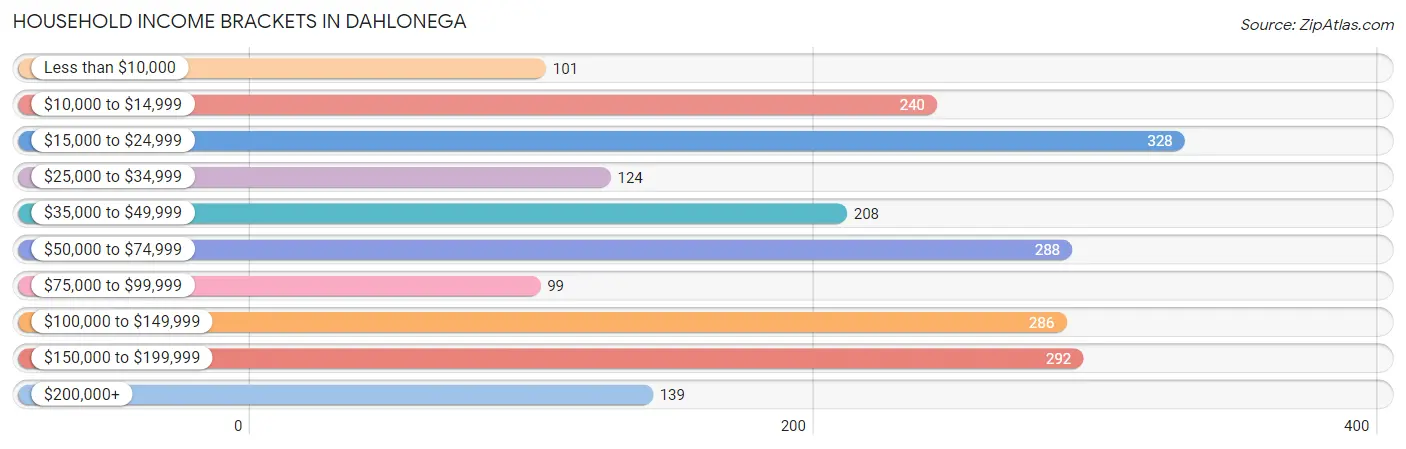
| Income Bracket | # Households | % Households |
| Less than $10,000 | 101 | 4.8% |
| $10,000 to $14,999 | 240 | 11.4% |
| $15,000 to $24,999 | 328 | 15.6% |
| $25,000 to $34,999 | 124 | 5.9% |
| $35,000 to $49,999 | 208 | 9.9% |
| $50,000 to $74,999 | 288 | 13.7% |
| $75,000 to $99,999 | 99 | 4.7% |
| $100,000 to $149,999 | 286 | 13.6% |
| $150,000 to $199,999 | 292 | 13.9% |
| $200,000+ | 139 | 6.6% |
Household Income by Householder Age in Dahlonega
The median household income in Dahlonega is $57,941, with the highest median household income of $129,338 found in the 45 to 64 years age bracket for the primary householder. A total of 375 households (17.8%) fall into this category. Meanwhile, the 65+ years age bracket for the primary householder has the lowest median household income of $0, with 789 households (37.5%) in this group.
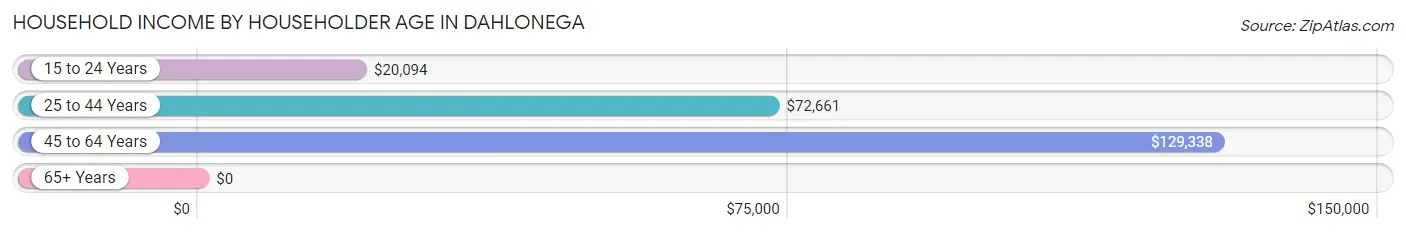
| Income Bracket | # Households | Median Income |
| 15 to 24 Years | 525 (25.0%) | $20,094 |
| 25 to 44 Years | 413 (19.7%) | $72,661 |
| 45 to 64 Years | 375 (17.8%) | $129,338 |
| 65+ Years | 789 (37.5%) | $0 |
| Total | 2,102 (100.0%) | $57,941 |
Poverty in Dahlonega
Income Below Poverty by Sex and Age in Dahlonega
With 28.1% poverty level for males and 30.5% for females among the residents of Dahlonega, 18 to 24 year old males and 18 to 24 year old females are the most vulnerable to poverty, with 465 males (64.7%) and 740 females (67.8%) in their respective age groups living below the poverty level.
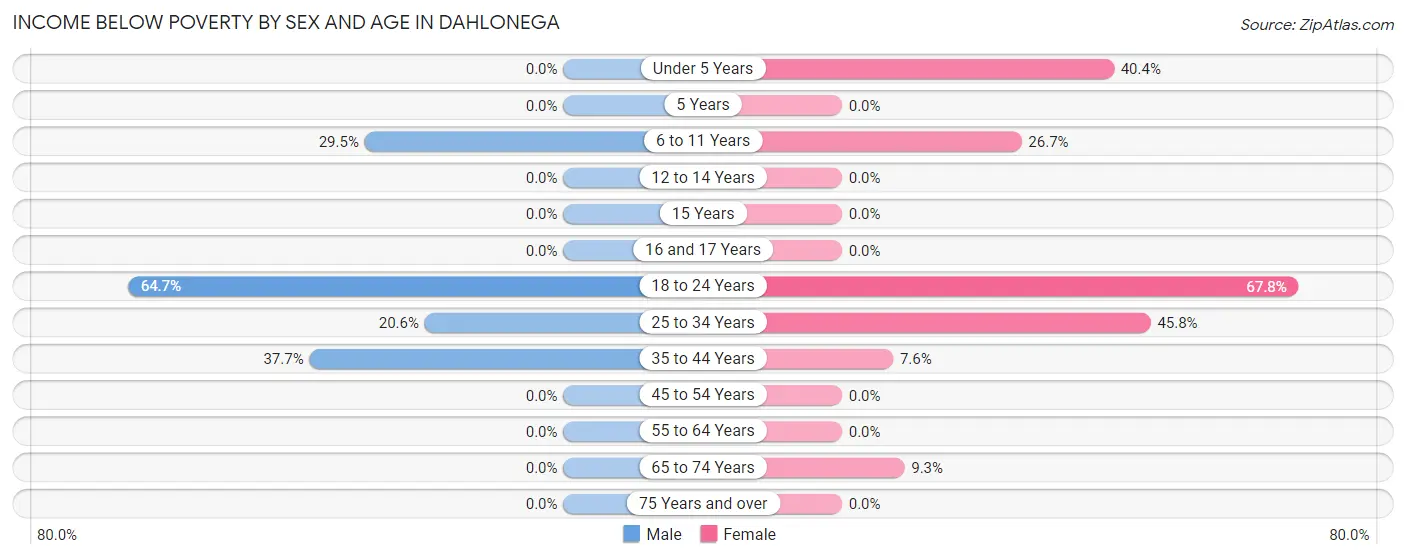
| Age Bracket | Male | Female |
| Under 5 Years | 0 (0.0%) | 21 (40.4%) |
| 5 Years | 0 (0.0%) | 0 (0.0%) |
| 6 to 11 Years | 23 (29.5%) | 20 (26.7%) |
| 12 to 14 Years | 0 (0.0%) | 0 (0.0%) |
| 15 Years | 0 (0.0%) | 0 (0.0%) |
| 16 and 17 Years | 0 (0.0%) | 0 (0.0%) |
| 18 to 24 Years | 465 (64.7%) | 740 (67.8%) |
| 25 to 34 Years | 29 (20.6%) | 77 (45.8%) |
| 35 to 44 Years | 72 (37.7%) | 20 (7.6%) |
| 45 to 54 Years | 0 (0.0%) | 0 (0.0%) |
| 55 to 64 Years | 0 (0.0%) | 0 (0.0%) |
| 65 to 74 Years | 0 (0.0%) | 36 (9.3%) |
| 75 Years and over | 0 (0.0%) | 0 (0.0%) |
| Total | 589 (28.1%) | 914 (30.5%) |
Income Above Poverty by Sex and Age in Dahlonega
According to the poverty statistics in Dahlonega, males aged under 5 years and females aged 5 years are the age groups that are most secure financially, with 100.0% of males and 100.0% of females in these age groups living above the poverty line.
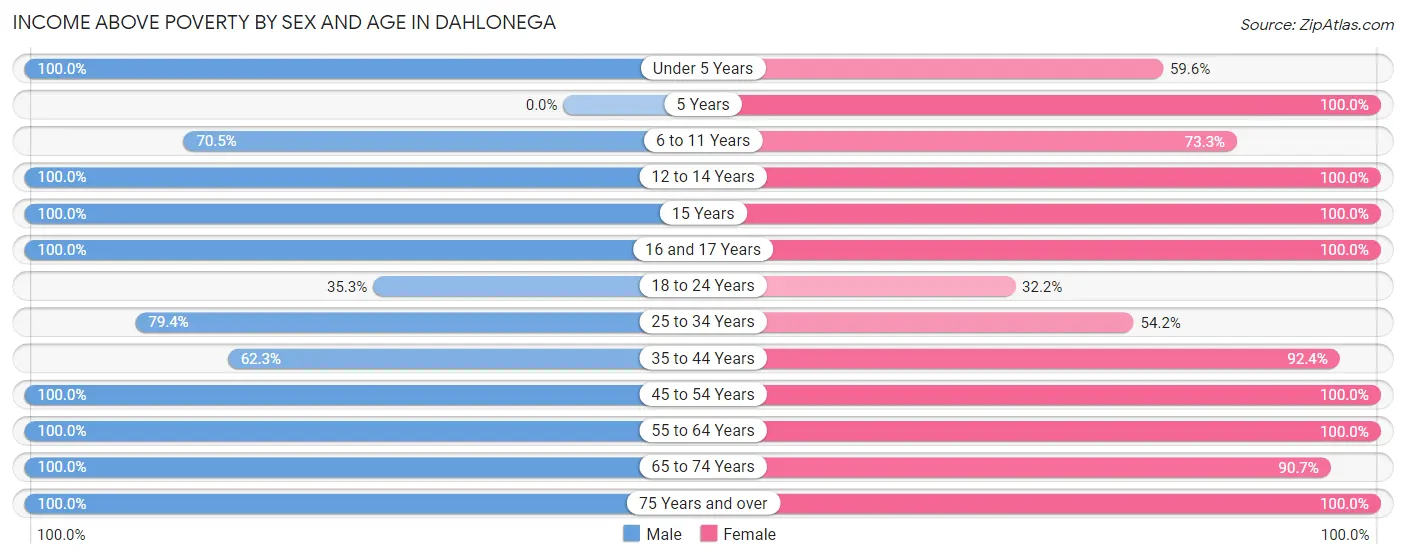
| Age Bracket | Male | Female |
| Under 5 Years | 20 (100.0%) | 31 (59.6%) |
| 5 Years | 0 (0.0%) | 36 (100.0%) |
| 6 to 11 Years | 55 (70.5%) | 55 (73.3%) |
| 12 to 14 Years | 65 (100.0%) | 81 (100.0%) |
| 15 Years | 19 (100.0%) | 30 (100.0%) |
| 16 and 17 Years | 13 (100.0%) | 72 (100.0%) |
| 18 to 24 Years | 254 (35.3%) | 351 (32.2%) |
| 25 to 34 Years | 112 (79.4%) | 91 (54.2%) |
| 35 to 44 Years | 119 (62.3%) | 243 (92.4%) |
| 45 to 54 Years | 249 (100.0%) | 193 (100.0%) |
| 55 to 64 Years | 121 (100.0%) | 139 (100.0%) |
| 65 to 74 Years | 282 (100.0%) | 352 (90.7%) |
| 75 Years and over | 202 (100.0%) | 404 (100.0%) |
| Total | 1,511 (72.0%) | 2,078 (69.5%) |
Income Below Poverty Among Married-Couple Families in Dahlonega
The poverty statistics for married-couple families in Dahlonega show that 2.8% or 29 of the total 1,034 families live below the poverty line. Families with 1 or 2 children have the highest poverty rate of 11.8%, comprising of 29 families. On the other hand, families with no children have the lowest poverty rate of 0.0%, which includes 0 families.
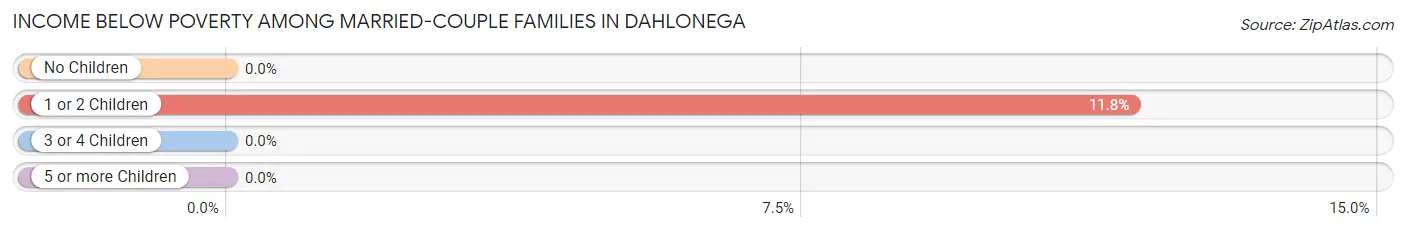
| Children | Above Poverty | Below Poverty |
| No Children | 753 (100.0%) | 0 (0.0%) |
| 1 or 2 Children | 217 (88.2%) | 29 (11.8%) |
| 3 or 4 Children | 35 (100.0%) | 0 (0.0%) |
| 5 or more Children | 0 (0.0%) | 0 (0.0%) |
| Total | 1,005 (97.2%) | 29 (2.8%) |
Income Below Poverty Among Single-Parent Households in Dahlonega
According to the poverty data in Dahlonega, 100.0% or 14 single-father households and 16.1% or 18 single-mother households are living below the poverty line. Among single-father households, those with no children have the highest poverty rate, with 14 households (100.0%) experiencing poverty. Likewise, among single-mother households, those with 1 or 2 children have the highest poverty rate, with 18 households (100.0%) falling below the poverty line.
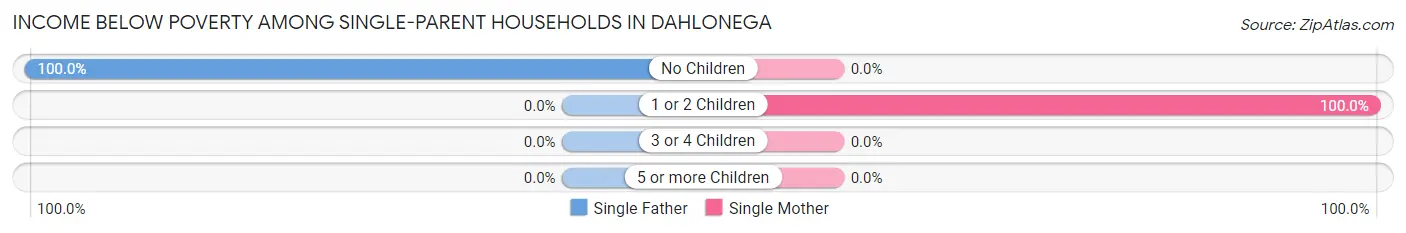
| Children | Single Father | Single Mother |
| No Children | 14 (100.0%) | 0 (0.0%) |
| 1 or 2 Children | 0 (0.0%) | 18 (100.0%) |
| 3 or 4 Children | 0 (0.0%) | 0 (0.0%) |
| 5 or more Children | 0 (0.0%) | 0 (0.0%) |
| Total | 14 (100.0%) | 18 (16.1%) |
Income Below Poverty Among Married-Couple vs Single-Parent Households in Dahlonega
The poverty data for Dahlonega shows that 29 of the married-couple family households (2.8%) and 32 of the single-parent households (25.4%) are living below the poverty level. Within the married-couple family households, those with 1 or 2 children have the highest poverty rate, with 29 households (11.8%) falling below the poverty line. Among the single-parent households, those with 1 or 2 children have the highest poverty rate, with 18 household (100.0%) living below poverty.
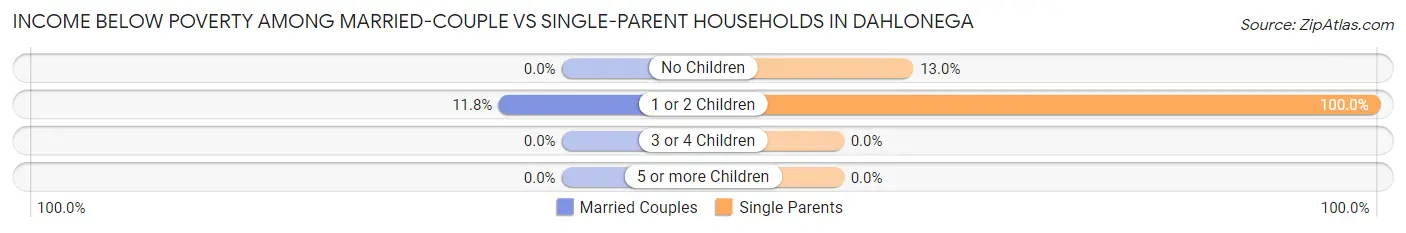
| Children | Married-Couple Families | Single-Parent Households |
| No Children | 0 (0.0%) | 14 (13.0%) |
| 1 or 2 Children | 29 (11.8%) | 18 (100.0%) |
| 3 or 4 Children | 0 (0.0%) | 0 (0.0%) |
| 5 or more Children | 0 (0.0%) | 0 (0.0%) |
| Total | 29 (2.8%) | 32 (25.4%) |
Race in Dahlonega
The most populous races in Dahlonega are White / Caucasian (6,388 | 90.2%), Hispanic or Latino (448 | 6.3%), and Black / African American (336 | 4.7%).
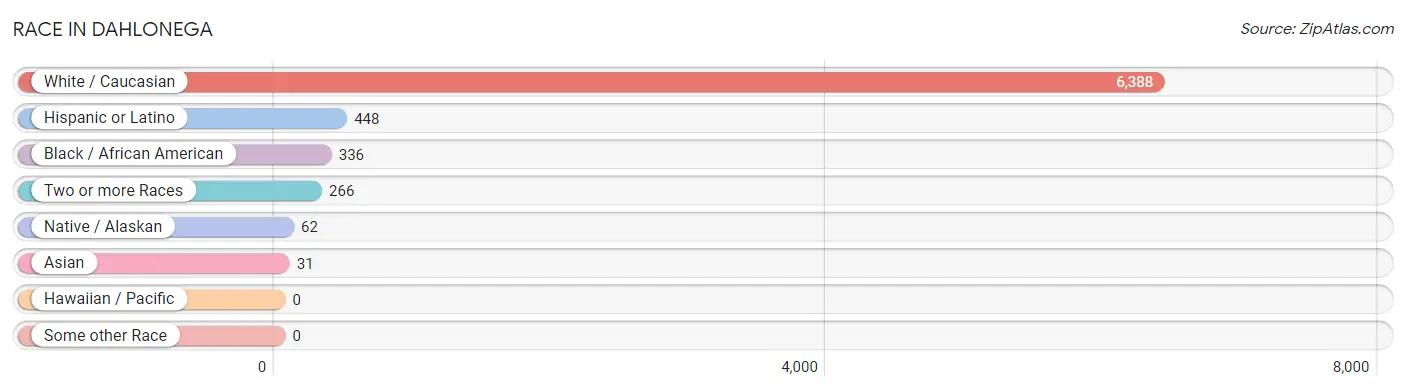
| Race | # Population | % Population |
| Asian | 31 | 0.4% |
| Black / African American | 336 | 4.7% |
| Hawaiian / Pacific | 0 | 0.0% |
| Hispanic or Latino | 448 | 6.3% |
| Native / Alaskan | 62 | 0.9% |
| White / Caucasian | 6,388 | 90.2% |
| Two or more Races | 266 | 3.8% |
| Some other Race | 0 | 0.0% |
| Total | 7,083 | 100.0% |
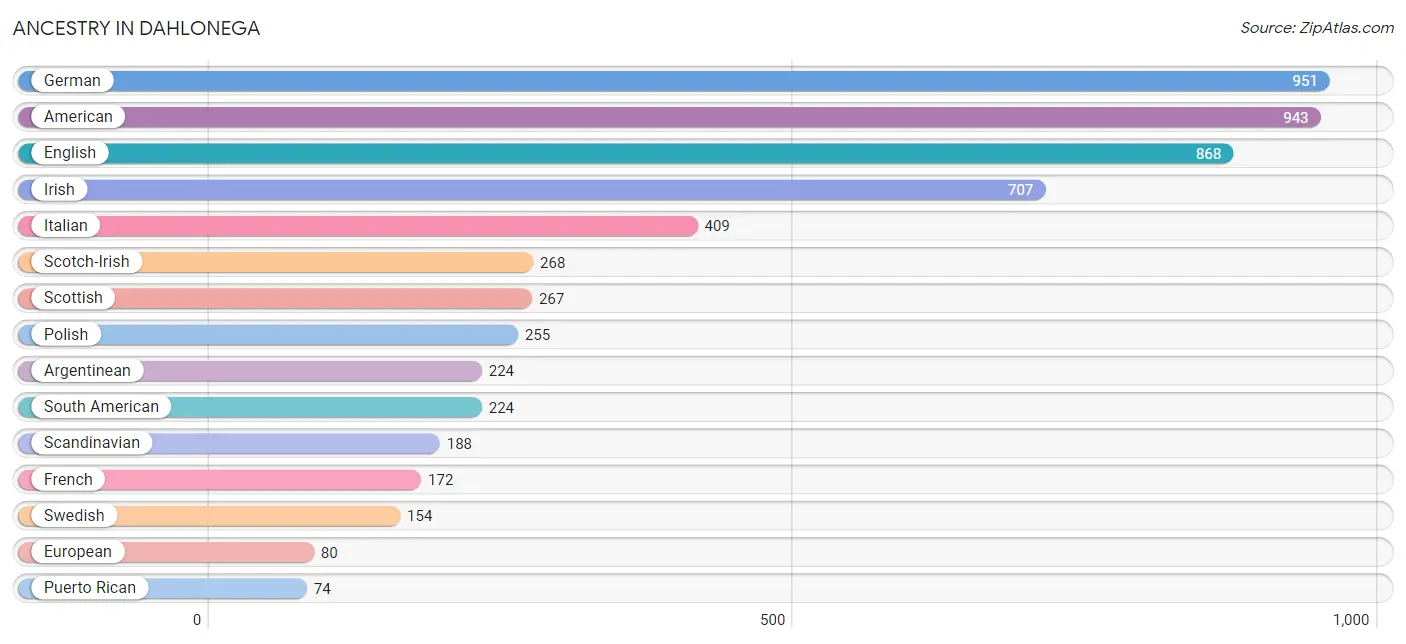
Ancestry in Dahlonega
The most populous ancestries reported in Dahlonega are German (951 | 13.4%), American (943 | 13.3%), English (868 | 12.2%), Irish (707 | 10.0%), and Italian (409 | 5.8%), together accounting for 54.7% of all Dahlonega residents.
| Ancestry | # Population | % Population |
| American | 943 | 13.3% |
| Arab | 12 | 0.2% |
| Argentinean | 224 | 3.2% |
| Austrian | 45 | 0.6% |
| Bhutanese | 16 | 0.2% |
| Blackfeet | 4 | 0.1% |
| British | 59 | 0.8% |
| Central American | 26 | 0.4% |
| Central American Indian | 26 | 0.4% |
| Cherokee | 52 | 0.7% |
| Danish | 59 | 0.8% |
| Dominican | 3 | 0.0% |
| Eastern European | 4 | 0.1% |
| English | 868 | 12.2% |
| European | 80 | 1.1% |
| French | 172 | 2.4% |
| French Canadian | 4 | 0.1% |
| German | 951 | 13.4% |
| Guatemalan | 26 | 0.4% |
| Indian (Asian) | 28 | 0.4% |
| Irish | 707 | 10.0% |
| Italian | 409 | 5.8% |
| Lebanese | 12 | 0.2% |
| Mexican | 36 | 0.5% |
| Native Hawaiian | 47 | 0.7% |
| Polish | 255 | 3.6% |
| Puerto Rican | 74 | 1.0% |
| Scandinavian | 188 | 2.6% |
| Scotch-Irish | 268 | 3.8% |
| Scottish | 267 | 3.8% |
| Seminole | 4 | 0.1% |
| South American | 224 | 3.2% |
| Sri Lankan | 12 | 0.2% |
| Swedish | 154 | 2.2% |
| Swiss | 74 | 1.0% |
| Thai | 4 | 0.1% |
| Ukrainian | 50 | 0.7% |
| Welsh | 48 | 0.7% | View All 38 Rows |
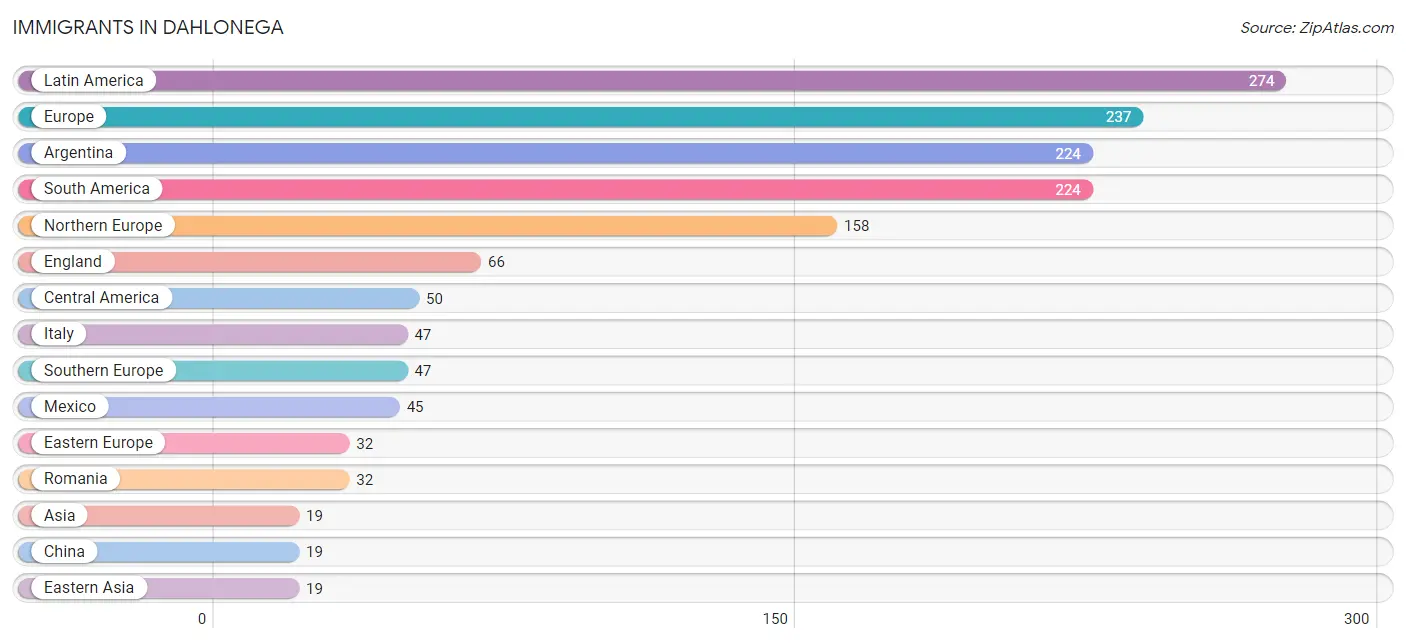
Immigrants in Dahlonega
The most numerous immigrant groups reported in Dahlonega came from Latin America (274 | 3.9%), Europe (237 | 3.4%), Argentina (224 | 3.2%), South America (224 | 3.2%), and Northern Europe (158 | 2.2%), together accounting for 15.8% of all Dahlonega residents.
| Immigration Origin | # Population | % Population |
| Argentina | 224 | 3.2% |
| Asia | 19 | 0.3% |
| Central America | 50 | 0.7% |
| China | 19 | 0.3% |
| Eastern Asia | 19 | 0.3% |
| Eastern Europe | 32 | 0.4% |
| El Salvador | 5 | 0.1% |
| England | 66 | 0.9% |
| Europe | 237 | 3.4% |
| Hong Kong | 14 | 0.2% |
| Italy | 47 | 0.7% |
| Latin America | 274 | 3.9% |
| Mexico | 45 | 0.6% |
| Northern Europe | 158 | 2.2% |
| Romania | 32 | 0.4% |
| South America | 224 | 3.2% |
| Southern Europe | 47 | 0.7% | View All 17 Rows |
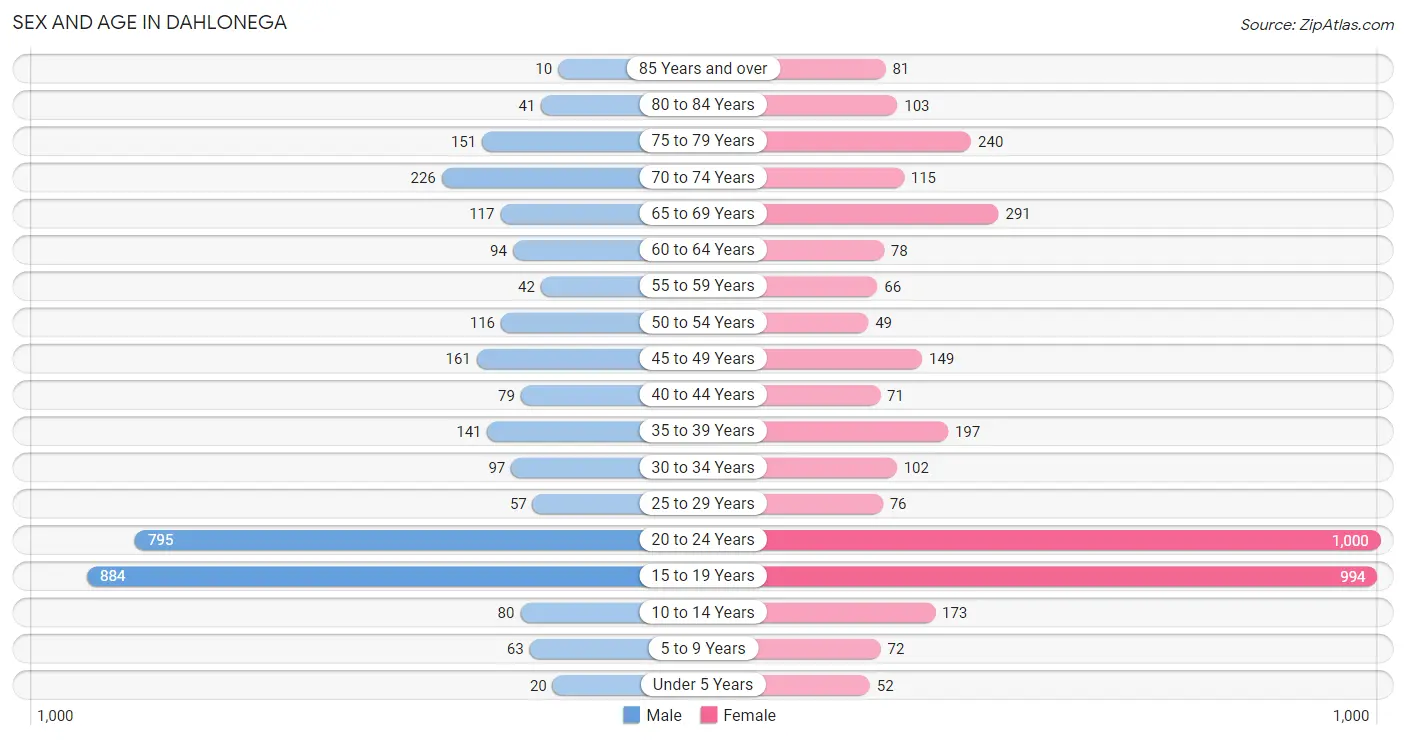
Sex and Age in Dahlonega
Sex and Age in Dahlonega
The most populous age groups in Dahlonega are 15 to 19 Years (884 | 27.9%) for men and 20 to 24 Years (1,000 | 25.6%) for women.
| Age Bracket | Male | Female |
| Under 5 Years | 20 (0.6%) | 52 (1.3%) |
| 5 to 9 Years | 63 (2.0%) | 72 (1.8%) |
| 10 to 14 Years | 80 (2.5%) | 173 (4.4%) |
| 15 to 19 Years | 884 (27.9%) | 994 (25.4%) |
| 20 to 24 Years | 795 (25.1%) | 1,000 (25.6%) |
| 25 to 29 Years | 57 (1.8%) | 76 (1.9%) |
| 30 to 34 Years | 97 (3.1%) | 102 (2.6%) |
| 35 to 39 Years | 141 (4.4%) | 197 (5.0%) |
| 40 to 44 Years | 79 (2.5%) | 71 (1.8%) |
| 45 to 49 Years | 161 (5.1%) | 149 (3.8%) |
| 50 to 54 Years | 116 (3.6%) | 49 (1.3%) |
| 55 to 59 Years | 42 (1.3%) | 66 (1.7%) |
| 60 to 64 Years | 94 (3.0%) | 78 (2.0%) |
| 65 to 69 Years | 117 (3.7%) | 291 (7.4%) |
| 70 to 74 Years | 226 (7.1%) | 115 (2.9%) |
| 75 to 79 Years | 151 (4.8%) | 240 (6.1%) |
| 80 to 84 Years | 41 (1.3%) | 103 (2.6%) |
| 85 Years and over | 10 (0.3%) | 81 (2.1%) |
| Total | 3,174 (100.0%) | 3,909 (100.0%) |
Families and Households in Dahlonega
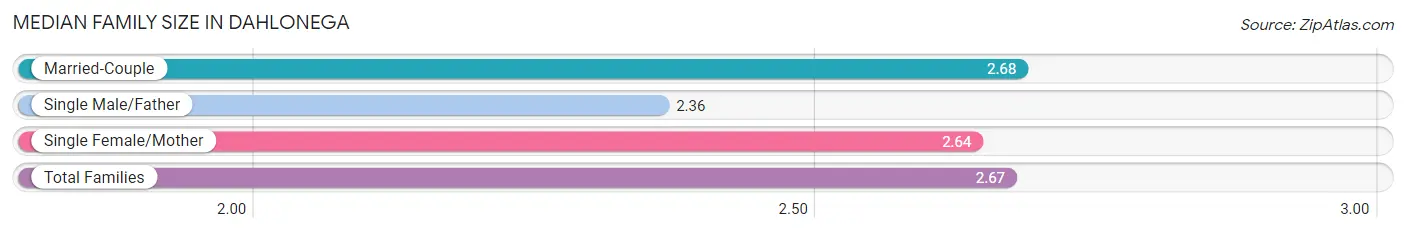
Median Family Size in Dahlonega
The median family size in Dahlonega is 2.67 persons per family, with married-couple families (1,034 | 89.1%) accounting for the largest median family size of 2.68 persons per family. On the other hand, single male/father families (14 | 1.2%) represent the smallest median family size with 2.36 persons per family.
| Family Type | # Families | Family Size |
| Married-Couple | 1,034 (89.1%) | 2.68 |
| Single Male/Father | 14 (1.2%) | 2.36 |
| Single Female/Mother | 112 (9.7%) | 2.64 |
| Total Families | 1,160 (100.0%) | 2.67 |
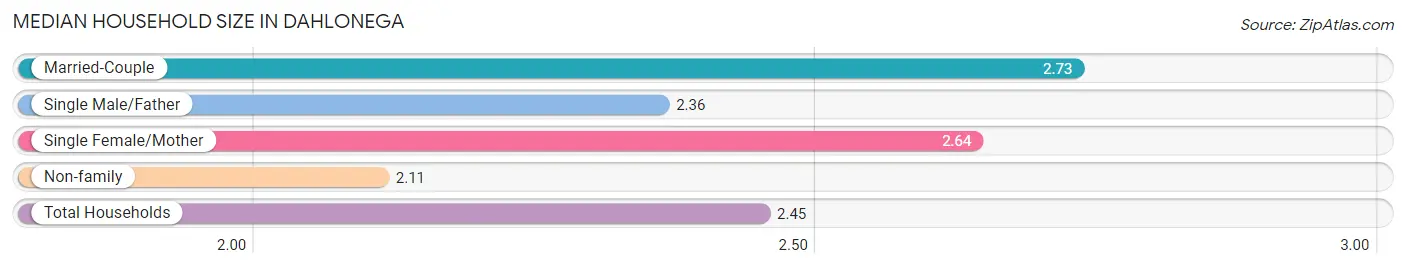
Median Household Size in Dahlonega
The median household size in Dahlonega is 2.45 persons per household, with married-couple households (1,034 | 49.2%) accounting for the largest median household size of 2.73 persons per household. non-family households (942 | 44.8%) represent the smallest median household size with 2.11 persons per household.
| Household Type | # Households | Household Size |
| Married-Couple | 1,034 (49.2%) | 2.73 |
| Single Male/Father | 14 (0.7%) | 2.36 |
| Single Female/Mother | 112 (5.3%) | 2.64 |
| Non-family | 942 (44.8%) | 2.11 |
| Total Households | 2,102 (100.0%) | 2.45 |
Household Size by Marriage Status in Dahlonega
Out of a total of 2,102 households in Dahlonega, 1,160 (55.2%) are family households, while 942 (44.8%) are nonfamily households. The most numerous type of family households are 2-person households, comprising 796, and the most common type of nonfamily households are 1-person households, comprising 584.
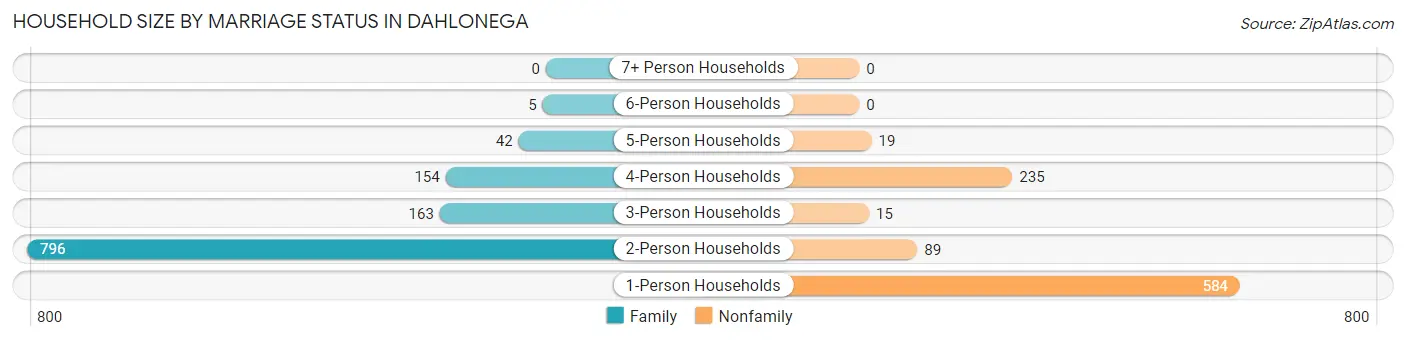
| Household Size | Family Households | Nonfamily Households |
| 1-Person Households | - | 584 (27.8%) |
| 2-Person Households | 796 (37.9%) | 89 (4.2%) |
| 3-Person Households | 163 (7.7%) | 15 (0.7%) |
| 4-Person Households | 154 (7.3%) | 235 (11.2%) |
| 5-Person Households | 42 (2.0%) | 19 (0.9%) |
| 6-Person Households | 5 (0.2%) | 0 (0.0%) |
| 7+ Person Households | 0 (0.0%) | 0 (0.0%) |
| Total | 1,160 (55.2%) | 942 (44.8%) |
Female Fertility in Dahlonega
Fertility by Age in Dahlonega
Average fertility rate in Dahlonega is 16.0 births per 1,000 women. Women in the age bracket of 20 to 34 years have the highest fertility rate with 36.0 births per 1,000 women. Women in the age bracket of 20 to 34 years acount for 100.0% of all women with births.
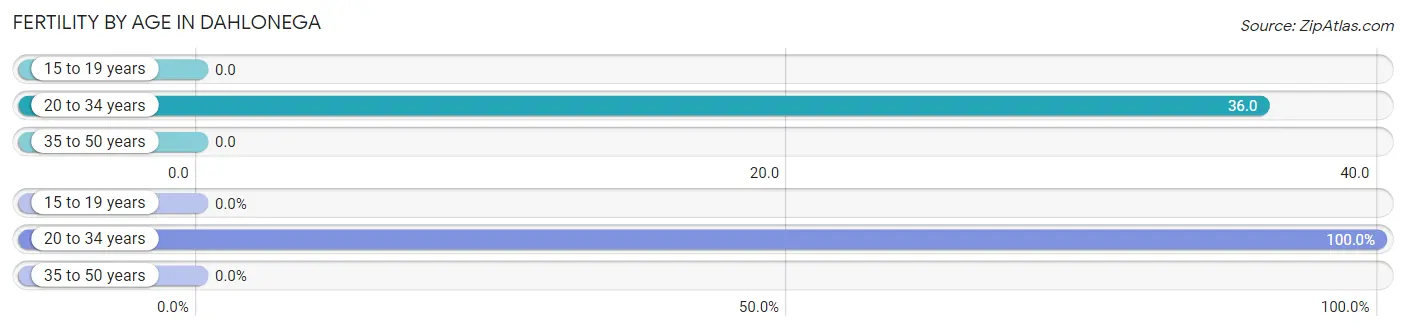
| Age Bracket | Women with Births | Births / 1,000 Women |
| 15 to 19 years | 0 (0.0%) | 0.0 |
| 20 to 34 years | 42 (100.0%) | 36.0 |
| 35 to 50 years | 0 (0.0%) | 0.0 |
| Total | 42 (100.0%) | 16.0 |
Fertility by Age by Marriage Status in Dahlonega
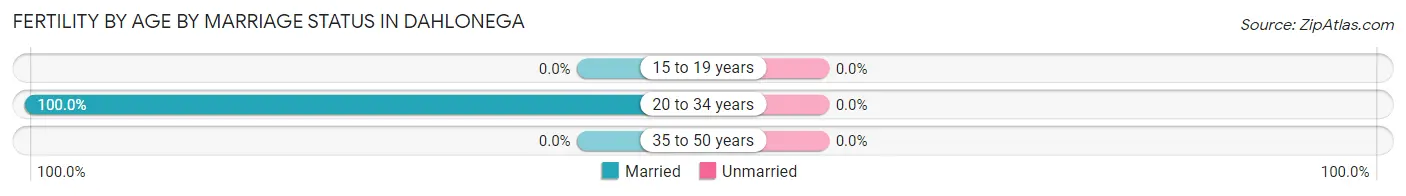
| Age Bracket | Married | Unmarried |
| 15 to 19 years | 0 (0.0%) | 0 (0.0%) |
| 20 to 34 years | 42 (100.0%) | 0 (0.0%) |
| 35 to 50 years | 0 (0.0%) | 0 (0.0%) |
| Total | 42 (100.0%) | 0 (0.0%) |
Fertility by Education in Dahlonega
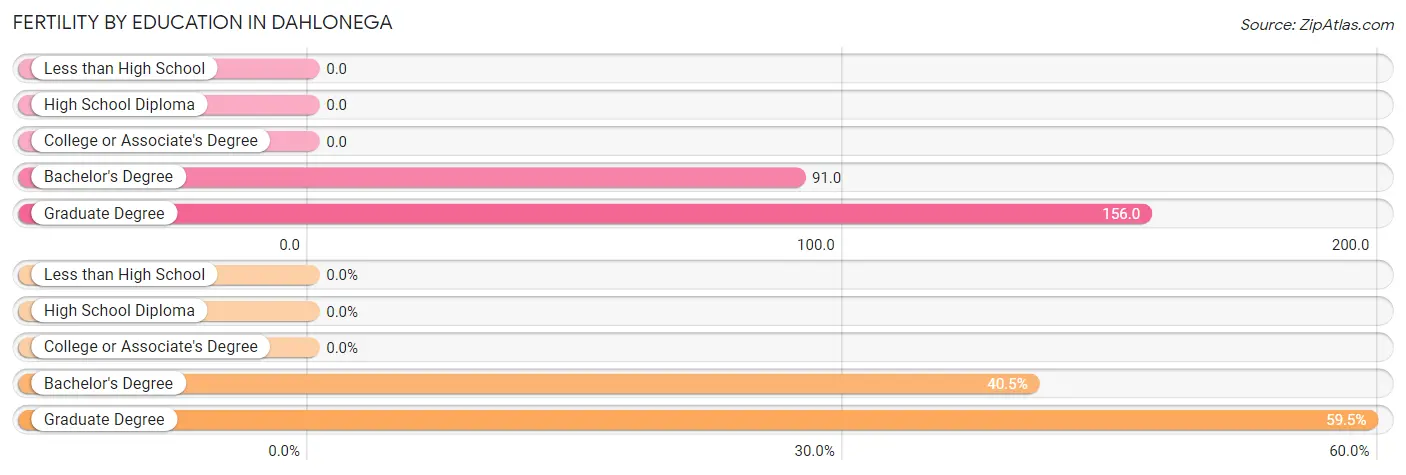
| Educational Attainment | Women with Births | Births / 1,000 Women |
| Less than High School | 0 (0.0%) | 0.0 |
| High School Diploma | 0 (0.0%) | 0.0 |
| College or Associate's Degree | 0 (0.0%) | 0.0 |
| Bachelor's Degree | 17 (40.5%) | 91.0 |
| Graduate Degree | 25 (59.5%) | 156.0 |
| Total | 42 (100.0%) | 16.0 |
Fertility by Education by Marriage Status in Dahlonega
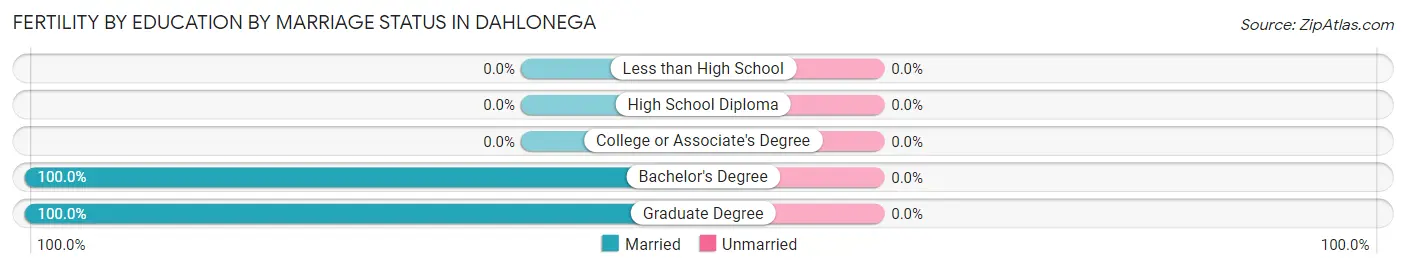
| Educational Attainment | Married | Unmarried |
| Less than High School | 0 (0.0%) | 0 (0.0%) |
| High School Diploma | 0 (0.0%) | 0 (0.0%) |
| College or Associate's Degree | 0 (0.0%) | 0 (0.0%) |
| Bachelor's Degree | 17 (100.0%) | 0 (0.0%) |
| Graduate Degree | 25 (100.0%) | 0 (0.0%) |
| Total | 42 (100.0%) | 0 (0.0%) |
Employment Characteristics in Dahlonega
Employment by Class of Employer in Dahlonega
Among the 2,797 employed individuals in Dahlonega, private company employees (1,639 | 58.6%), not-for-profit organizations (332 | 11.9%), and state government employees (320 | 11.4%) make up the most common classes of employment.
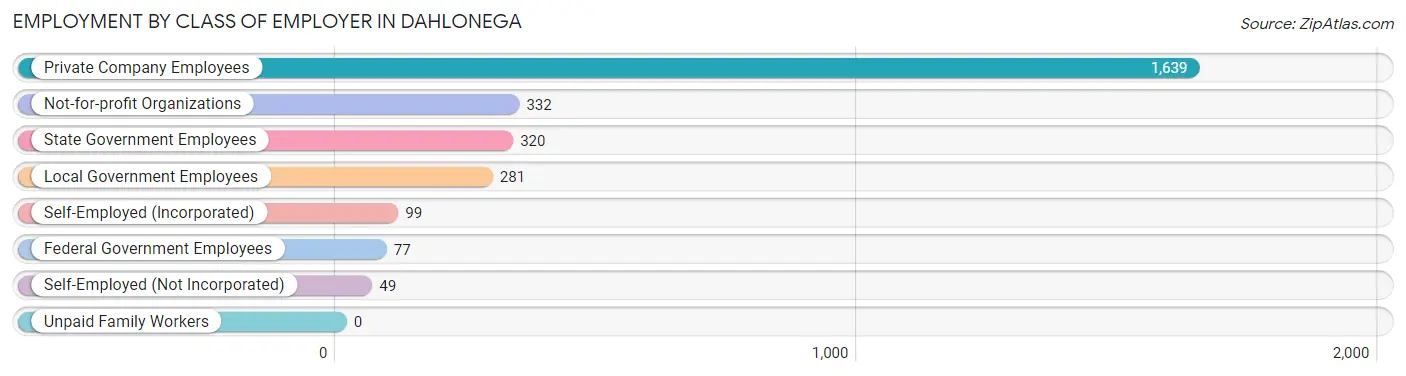
| Employer Class | # Employees | % Employees |
| Private Company Employees | 1,639 | 58.6% |
| Self-Employed (Incorporated) | 99 | 3.5% |
| Self-Employed (Not Incorporated) | 49 | 1.8% |
| Not-for-profit Organizations | 332 | 11.9% |
| Local Government Employees | 281 | 10.1% |
| State Government Employees | 320 | 11.4% |
| Federal Government Employees | 77 | 2.8% |
| Unpaid Family Workers | 0 | 0.0% |
| Total | 2,797 | 100.0% |
Employment Status by Age in Dahlonega
According to the labor force statistics for Dahlonega, out of the total population over 16 years of age (6,574), 45.1% or 2,965 individuals are in the labor force, with 4.4% or 130 of them unemployed. The age group with the highest labor force participation rate is 45 to 54 years, with 90.7% or 431 individuals in the labor force. Within the labor force, the 75 years and over age range has the highest percentage of unemployed individuals, with 43.9% or 18 of them being unemployed.
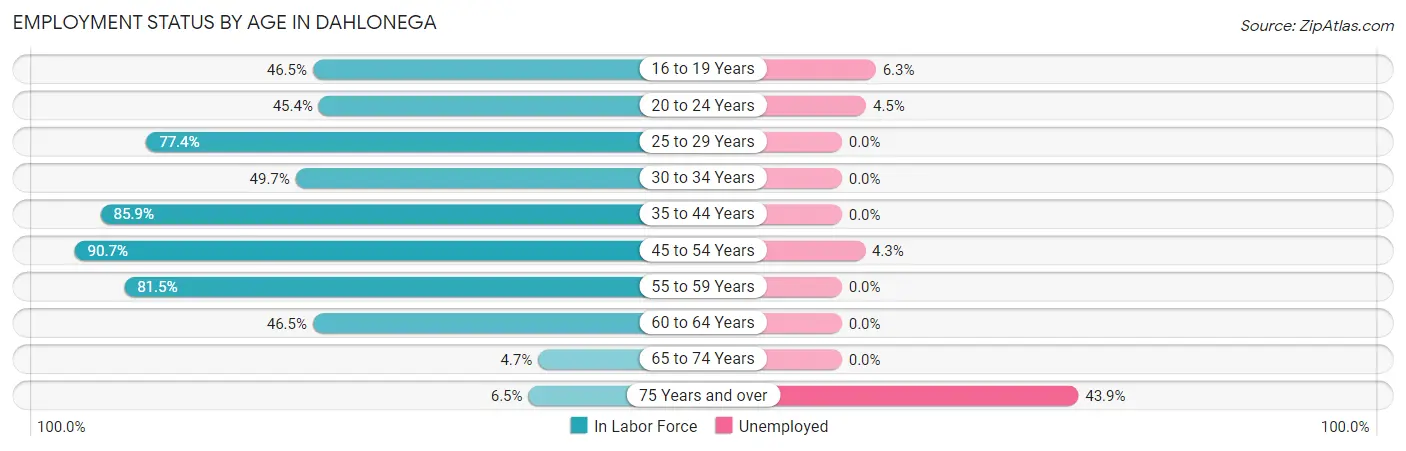
| Age Bracket | In Labor Force | Unemployed |
| 16 to 19 Years | 850 (46.5%) | 54 (6.3%) |
| 20 to 24 Years | 815 (45.4%) | 37 (4.5%) |
| 25 to 29 Years | 103 (77.4%) | 0 (0.0%) |
| 30 to 34 Years | 99 (49.7%) | 0 (0.0%) |
| 35 to 44 Years | 419 (85.9%) | 0 (0.0%) |
| 45 to 54 Years | 431 (90.7%) | 19 (4.3%) |
| 55 to 59 Years | 88 (81.5%) | 0 (0.0%) |
| 60 to 64 Years | 80 (46.5%) | 0 (0.0%) |
| 65 to 74 Years | 35 (4.7%) | 0 (0.0%) |
| 75 Years and over | 41 (6.5%) | 18 (43.9%) |
| Total | 2,965 (45.1%) | 130 (4.4%) |
Employment Status by Educational Attainment in Dahlonega
According to labor force statistics for Dahlonega, 77.5% of individuals (1,221) out of the total population between 25 and 64 years of age (1,575) are in the labor force, with 1.6% or 20 of them being unemployed. The group with the highest labor force participation rate are those with the educational attainment of bachelor's degree or higher, with 89.6% or 736 individuals in the labor force. Within the labor force, individuals with bachelor's degree or higher education have the highest percentage of unemployment, with 2.6% or 19 of them being unemployed.
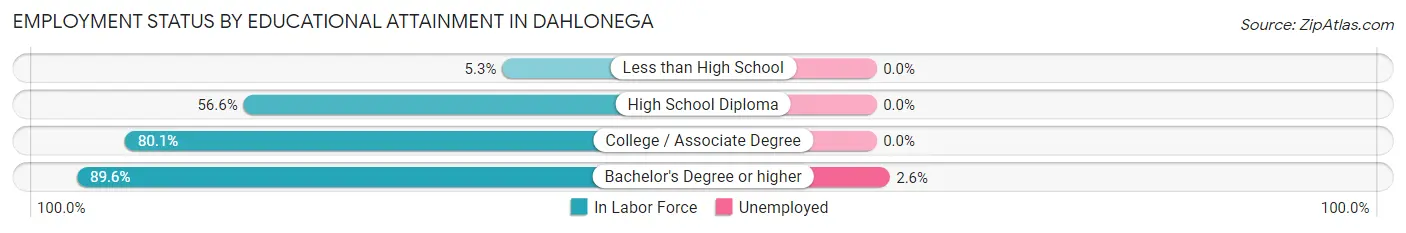
| Educational Attainment | In Labor Force | Unemployed |
| Less than High School | 2 (5.3%) | 0 (0.0%) |
| High School Diploma | 220 (56.6%) | 0 (0.0%) |
| College / Associate Degree | 262 (80.1%) | 0 (0.0%) |
| Bachelor's Degree or higher | 736 (89.6%) | 21 (2.6%) |
| Total | 1,221 (77.5%) | 25 (1.6%) |
Employment Occupations by Sex in Dahlonega
Management, Business, Science and Arts Occupations
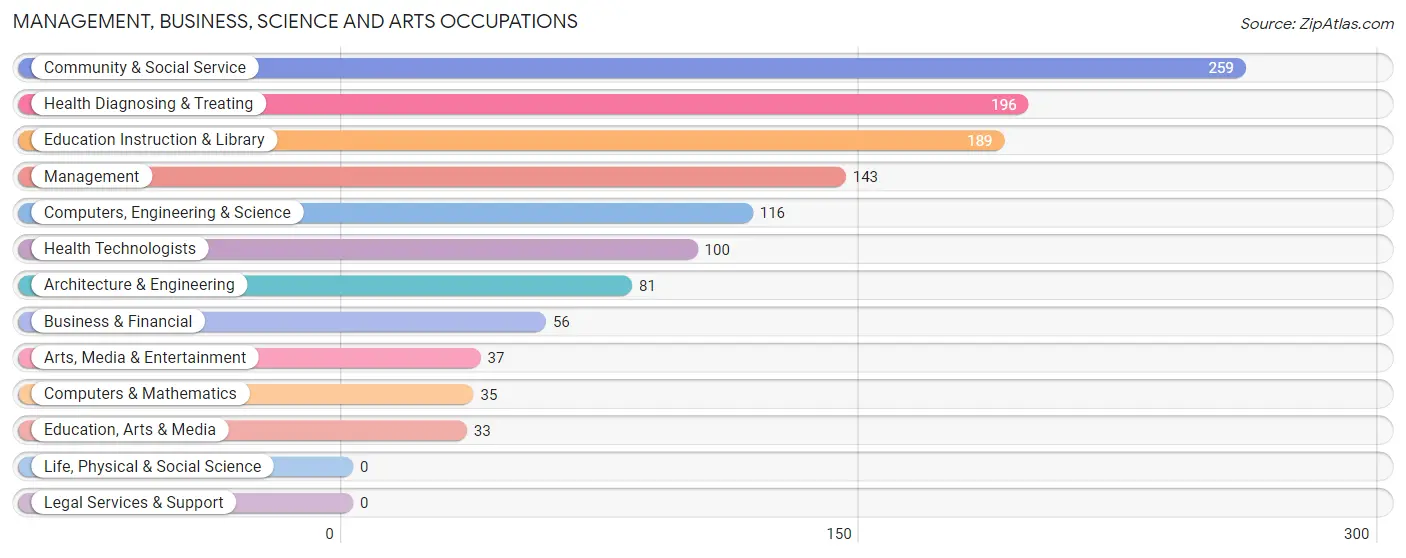
The most common Management, Business, Science and Arts occupations in Dahlonega are Community & Social Service (259 | 9.4%), Health Diagnosing & Treating (196 | 7.1%), Education Instruction & Library (189 | 6.8%), Management (143 | 5.2%), and Computers, Engineering & Science (116 | 4.2%).
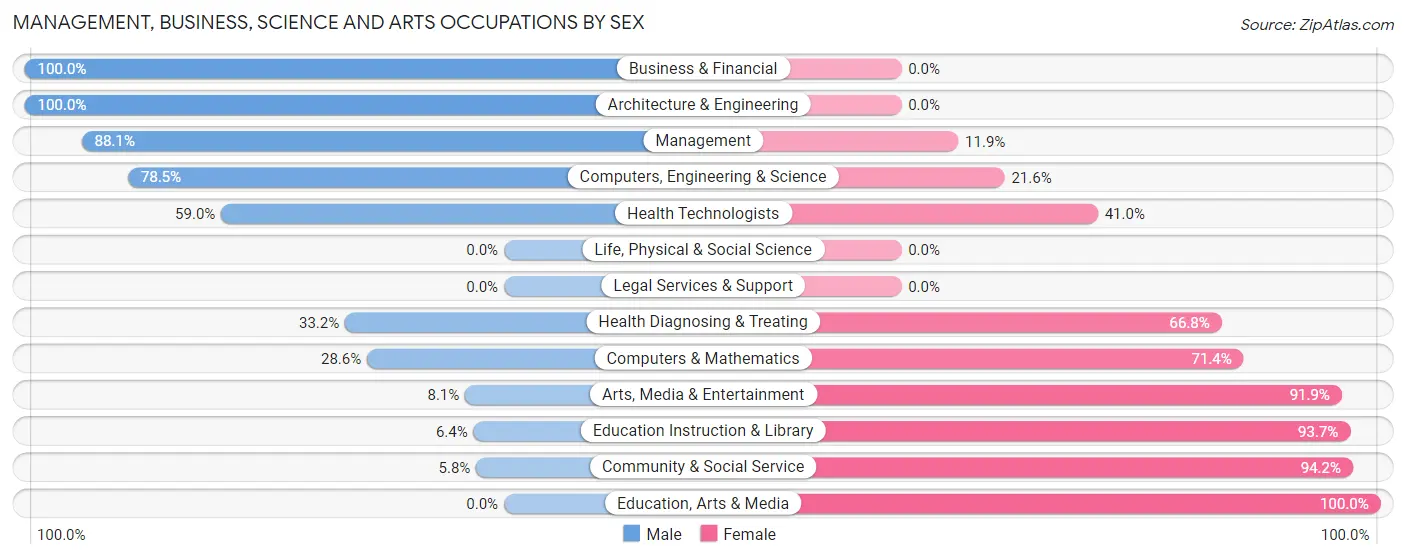
Management, Business, Science and Arts Occupations by Sex
Within the Management, Business, Science and Arts occupations in Dahlonega, the most male-oriented occupations are Business & Financial (100.0%), Architecture & Engineering (100.0%), and Management (88.1%), while the most female-oriented occupations are Education, Arts & Media (100.0%), Community & Social Service (94.2%), and Education Instruction & Library (93.6%).
| Occupation | Male | Female |
| Management | 126 (88.1%) | 17 (11.9%) |
| Business & Financial | 56 (100.0%) | 0 (0.0%) |
| Computers, Engineering & Science | 91 (78.4%) | 25 (21.5%) |
| Computers & Mathematics | 10 (28.6%) | 25 (71.4%) |
| Architecture & Engineering | 81 (100.0%) | 0 (0.0%) |
| Life, Physical & Social Science | 0 (0.0%) | 0 (0.0%) |
| Community & Social Service | 15 (5.8%) | 244 (94.2%) |
| Education, Arts & Media | 0 (0.0%) | 33 (100.0%) |
| Legal Services & Support | 0 (0.0%) | 0 (0.0%) |
| Education Instruction & Library | 12 (6.4%) | 177 (93.6%) |
| Arts, Media & Entertainment | 3 (8.1%) | 34 (91.9%) |
| Health Diagnosing & Treating | 65 (33.2%) | 131 (66.8%) |
| Health Technologists | 59 (59.0%) | 41 (41.0%) |
| Total (Category) | 353 (45.8%) | 417 (54.2%) |
| Total (Overall) | 1,233 (44.6%) | 1,530 (55.4%) |
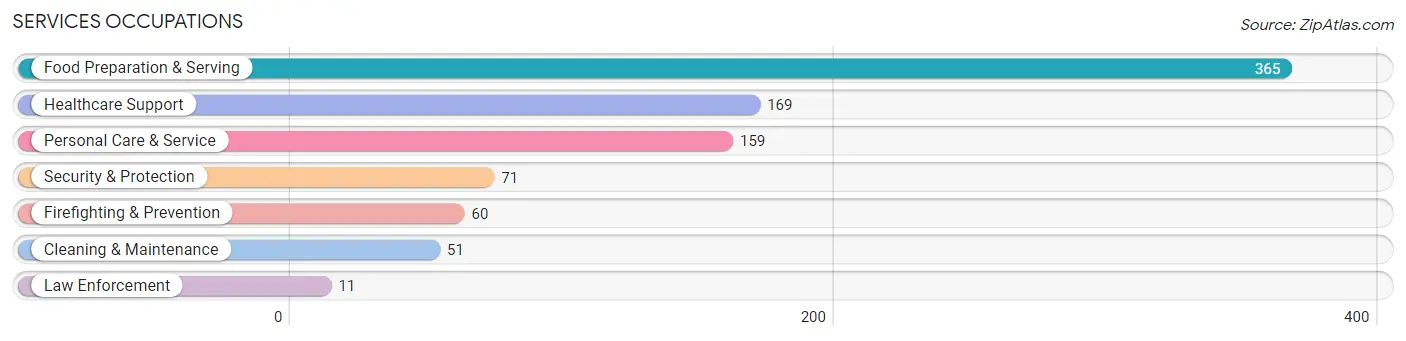
Services Occupations
The most common Services occupations in Dahlonega are Food Preparation & Serving (365 | 13.2%), Healthcare Support (169 | 6.1%), Personal Care & Service (159 | 5.8%), Security & Protection (71 | 2.6%), and Firefighting & Prevention (60 | 2.2%).
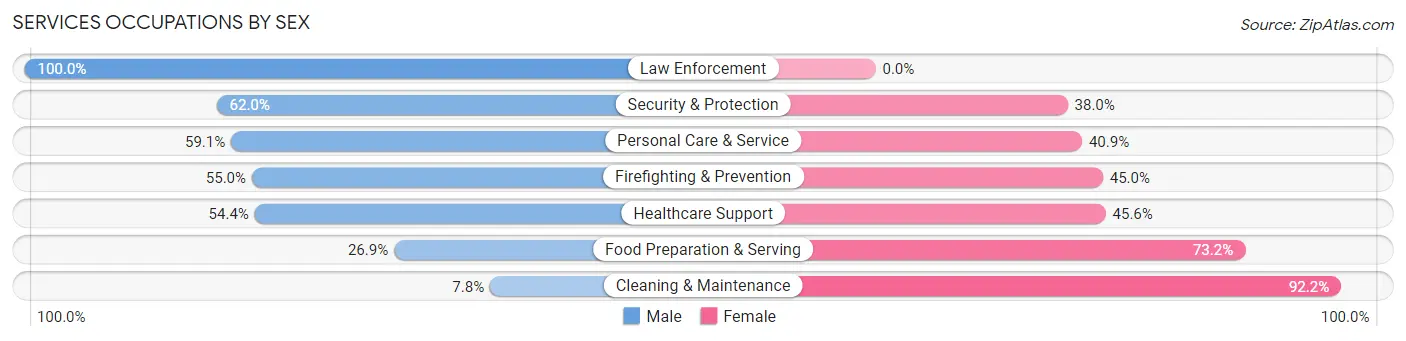
Services Occupations by Sex
Within the Services occupations in Dahlonega, the most male-oriented occupations are Law Enforcement (100.0%), Security & Protection (62.0%), and Personal Care & Service (59.1%), while the most female-oriented occupations are Cleaning & Maintenance (92.2%), Food Preparation & Serving (73.2%), and Healthcare Support (45.6%).
| Occupation | Male | Female |
| Healthcare Support | 92 (54.4%) | 77 (45.6%) |
| Security & Protection | 44 (62.0%) | 27 (38.0%) |
| Firefighting & Prevention | 33 (55.0%) | 27 (45.0%) |
| Law Enforcement | 11 (100.0%) | 0 (0.0%) |
| Food Preparation & Serving | 98 (26.9%) | 267 (73.2%) |
| Cleaning & Maintenance | 4 (7.8%) | 47 (92.2%) |
| Personal Care & Service | 94 (59.1%) | 65 (40.9%) |
| Total (Category) | 332 (40.7%) | 483 (59.3%) |
| Total (Overall) | 1,233 (44.6%) | 1,530 (55.4%) |
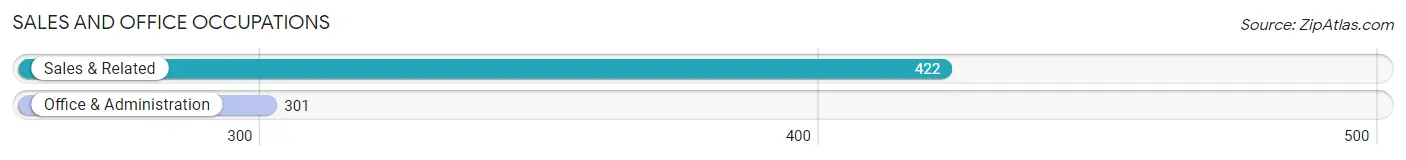
Sales and Office Occupations
The most common Sales and Office occupations in Dahlonega are Sales & Related (422 | 15.3%), and Office & Administration (301 | 10.9%).
Sales and Office Occupations by Sex
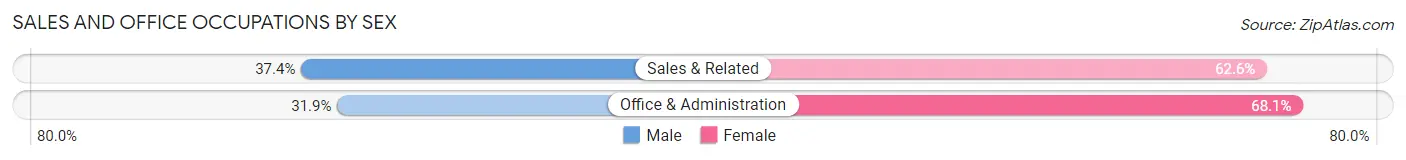
| Occupation | Male | Female |
| Sales & Related | 158 (37.4%) | 264 (62.6%) |
| Office & Administration | 96 (31.9%) | 205 (68.1%) |
| Total (Category) | 254 (35.1%) | 469 (64.9%) |
| Total (Overall) | 1,233 (44.6%) | 1,530 (55.4%) |
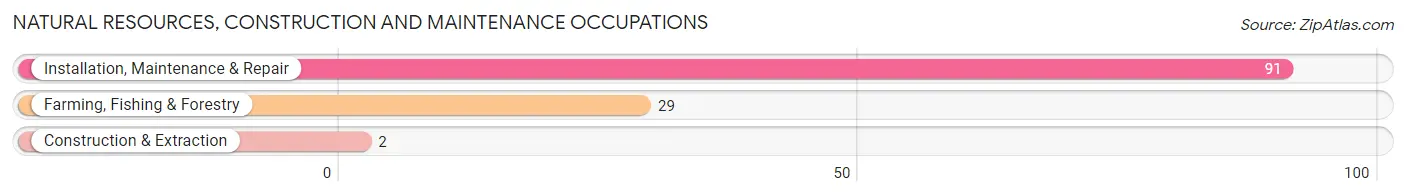
Natural Resources, Construction and Maintenance Occupations
The most common Natural Resources, Construction and Maintenance occupations in Dahlonega are Installation, Maintenance & Repair (91 | 3.3%), Farming, Fishing & Forestry (29 | 1.1%), and Construction & Extraction (2 | 0.1%).
Natural Resources, Construction and Maintenance Occupations by Sex
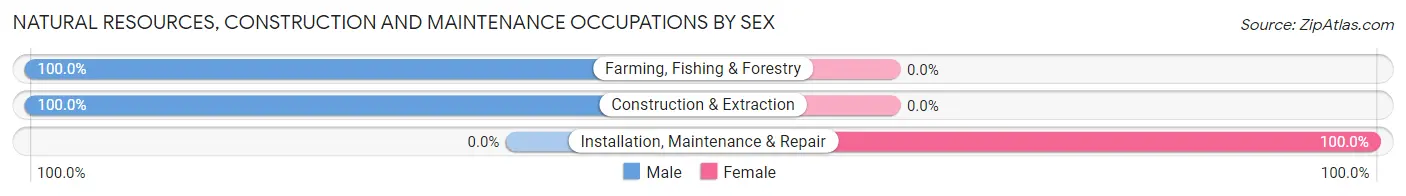
| Occupation | Male | Female |
| Farming, Fishing & Forestry | 29 (100.0%) | 0 (0.0%) |
| Construction & Extraction | 2 (100.0%) | 0 (0.0%) |
| Installation, Maintenance & Repair | 0 (0.0%) | 91 (100.0%) |
| Total (Category) | 31 (25.4%) | 91 (74.6%) |
| Total (Overall) | 1,233 (44.6%) | 1,530 (55.4%) |
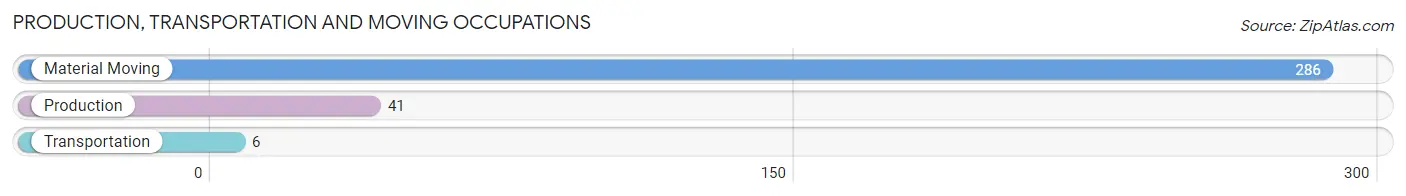
Production, Transportation and Moving Occupations
The most common Production, Transportation and Moving occupations in Dahlonega are Material Moving (286 | 10.3%), Production (41 | 1.5%), and Transportation (6 | 0.2%).
Production, Transportation and Moving Occupations by Sex
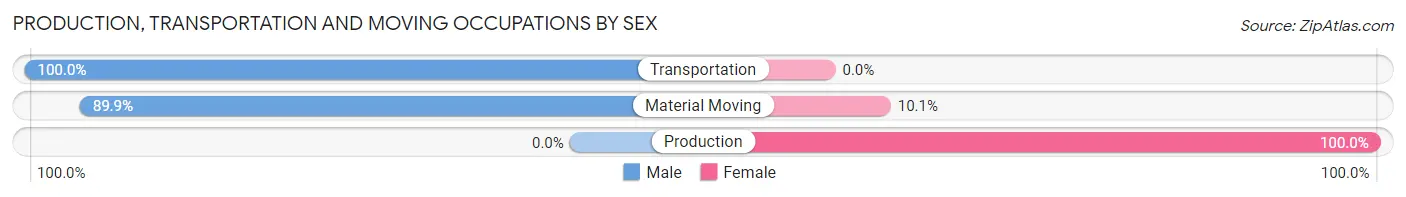
| Occupation | Male | Female |
| Production | 0 (0.0%) | 41 (100.0%) |
| Transportation | 6 (100.0%) | 0 (0.0%) |
| Material Moving | 257 (89.9%) | 29 (10.1%) |
| Total (Category) | 263 (79.0%) | 70 (21.0%) |
| Total (Overall) | 1,233 (44.6%) | 1,530 (55.4%) |
Employment Industries by Sex in Dahlonega
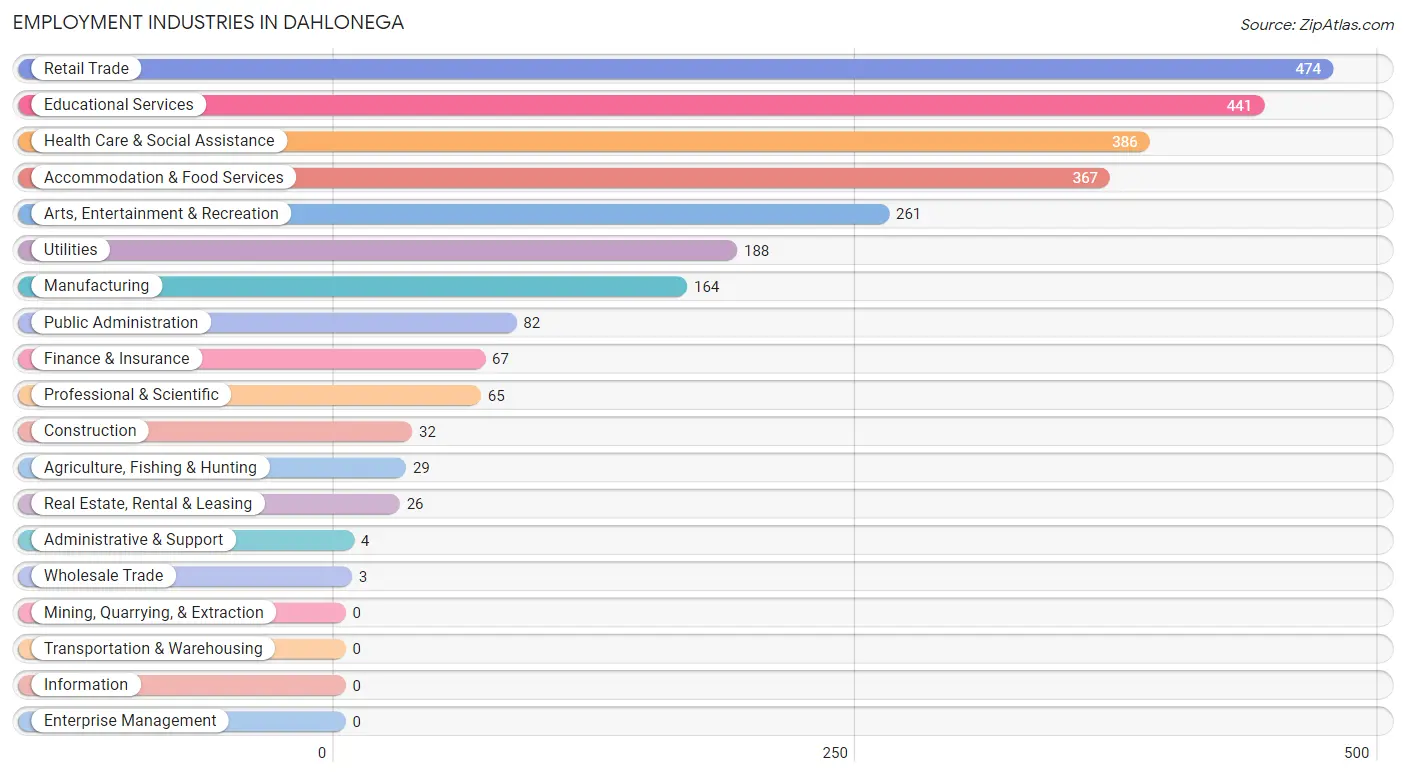
Employment Industries in Dahlonega
The major employment industries in Dahlonega include Retail Trade (474 | 17.2%), Educational Services (441 | 16.0%), Health Care & Social Assistance (386 | 14.0%), Accommodation & Food Services (367 | 13.3%), and Arts, Entertainment & Recreation (261 | 9.5%).
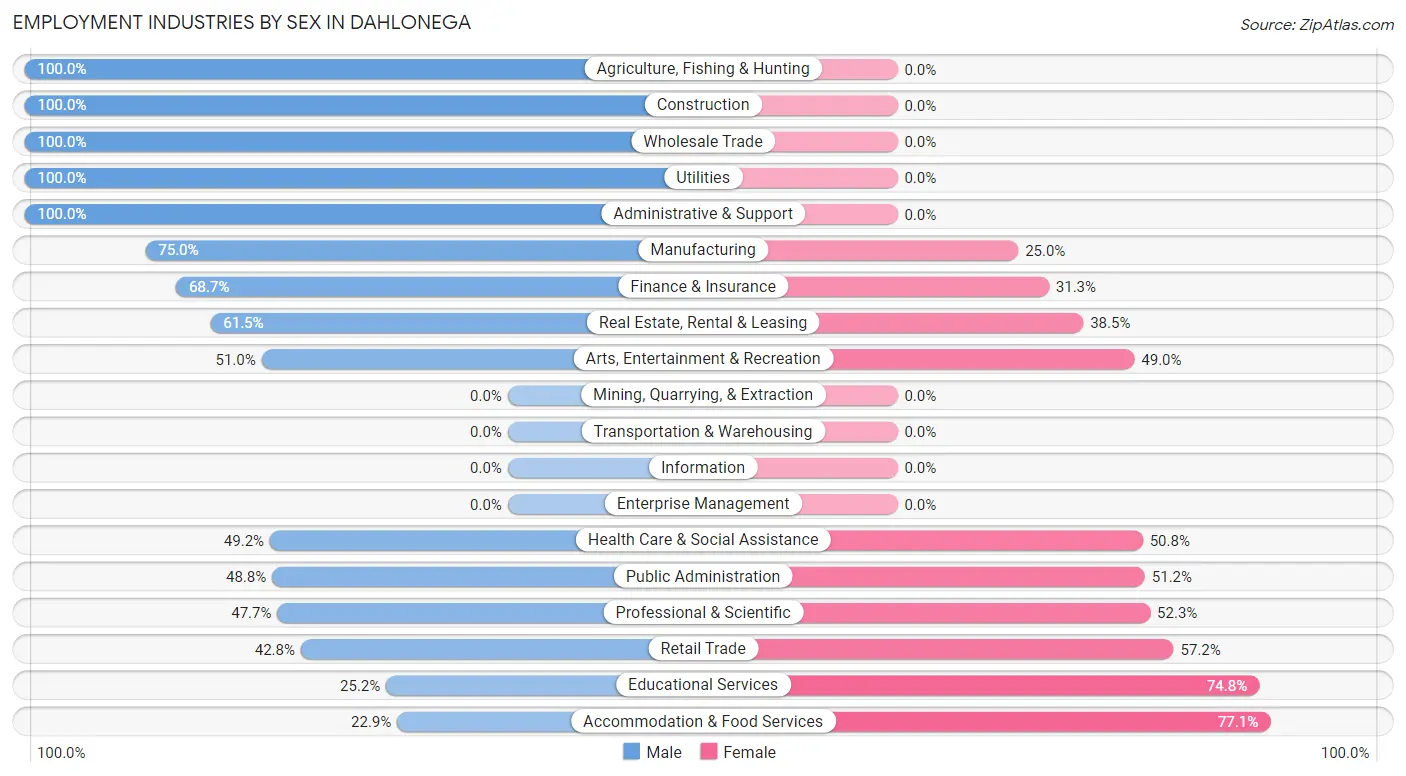
Employment Industries by Sex in Dahlonega
The Dahlonega industries that see more men than women are Agriculture, Fishing & Hunting (100.0%), Construction (100.0%), and Wholesale Trade (100.0%), whereas the industries that tend to have a higher number of women are Accommodation & Food Services (77.1%), Educational Services (74.8%), and Retail Trade (57.2%).
| Industry | Male | Female |
| Agriculture, Fishing & Hunting | 29 (100.0%) | 0 (0.0%) |
| Mining, Quarrying, & Extraction | 0 (0.0%) | 0 (0.0%) |
| Construction | 32 (100.0%) | 0 (0.0%) |
| Manufacturing | 123 (75.0%) | 41 (25.0%) |
| Wholesale Trade | 3 (100.0%) | 0 (0.0%) |
| Retail Trade | 203 (42.8%) | 271 (57.2%) |
| Transportation & Warehousing | 0 (0.0%) | 0 (0.0%) |
| Utilities | 188 (100.0%) | 0 (0.0%) |
| Information | 0 (0.0%) | 0 (0.0%) |
| Finance & Insurance | 46 (68.7%) | 21 (31.3%) |
| Real Estate, Rental & Leasing | 16 (61.5%) | 10 (38.5%) |
| Professional & Scientific | 31 (47.7%) | 34 (52.3%) |
| Enterprise Management | 0 (0.0%) | 0 (0.0%) |
| Administrative & Support | 4 (100.0%) | 0 (0.0%) |
| Educational Services | 111 (25.2%) | 330 (74.8%) |
| Health Care & Social Assistance | 190 (49.2%) | 196 (50.8%) |
| Arts, Entertainment & Recreation | 133 (51.0%) | 128 (49.0%) |
| Accommodation & Food Services | 84 (22.9%) | 283 (77.1%) |
| Public Administration | 40 (48.8%) | 42 (51.2%) |
| Total | 1,233 (44.6%) | 1,530 (55.4%) |
Education in Dahlonega
School Enrollment in Dahlonega
The most common levels of schooling among the 3,951 students in Dahlonega are college / undergraduate (3,209 | 81.2%), middle school (213 | 5.4%), and graduate / professional (213 | 5.4%).
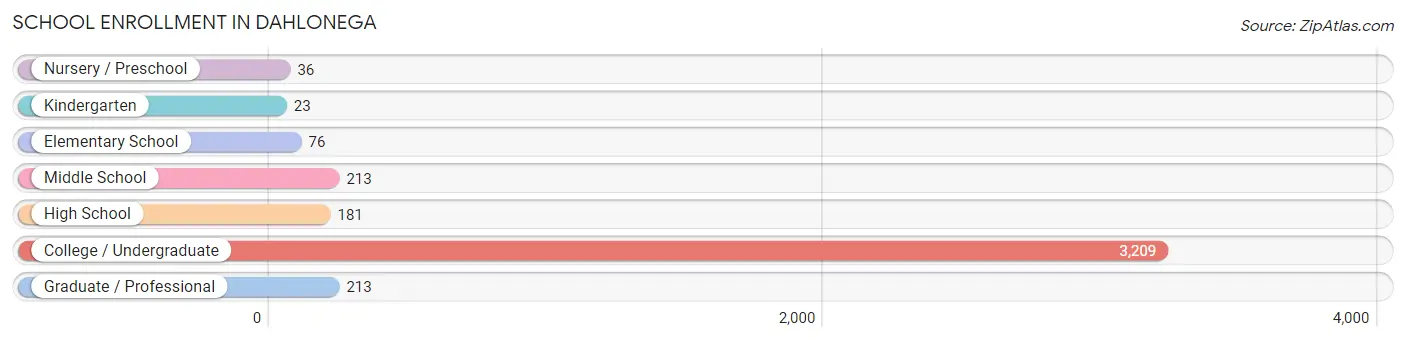
| School Level | # Students | % Students |
| Nursery / Preschool | 36 | 0.9% |
| Kindergarten | 23 | 0.6% |
| Elementary School | 76 | 1.9% |
| Middle School | 213 | 5.4% |
| High School | 181 | 4.6% |
| College / Undergraduate | 3,209 | 81.2% |
| Graduate / Professional | 213 | 5.4% |
| Total | 3,951 | 100.0% |
School Enrollment by Age by Funding Source in Dahlonega
Out of a total of 3,951 students who are enrolled in schools in Dahlonega, 115 (2.9%) attend a private institution, while the remaining 3,836 (97.1%) are enrolled in public schools. The age group of 15 to 17 year olds has the highest likelihood of being enrolled in private schools, with 23 (16.0% in the age bracket) enrolled. Conversely, the age group of 5 to 9 year old has the lowest likelihood of being enrolled in a private school, with 135 (100.0% in the age bracket) attending a public institution.
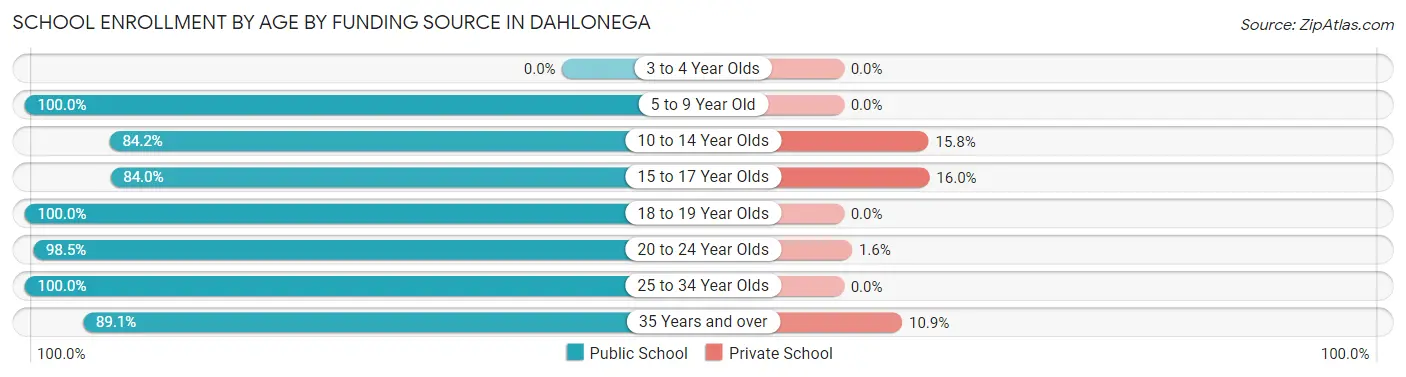
| Age Bracket | Public School | Private School |
| 3 to 4 Year Olds | 0 (0.0%) | 0 (0.0%) |
| 5 to 9 Year Old | 135 (100.0%) | 0 (0.0%) |
| 10 to 14 Year Olds | 213 (84.2%) | 40 (15.8%) |
| 15 to 17 Year Olds | 121 (84.0%) | 23 (16.0%) |
| 18 to 19 Year Olds | 1,546 (100.0%) | 0 (0.0%) |
| 20 to 24 Year Olds | 1,586 (98.5%) | 25 (1.5%) |
| 25 to 34 Year Olds | 32 (100.0%) | 0 (0.0%) |
| 35 Years and over | 205 (89.1%) | 25 (10.9%) |
| Total | 3,836 (97.1%) | 115 (2.9%) |
Educational Attainment by Field of Study in Dahlonega
Science & technology (401 | 24.6%), arts & humanities (232 | 14.2%), business (228 | 14.0%), social sciences (158 | 9.7%), and education (143 | 8.8%) are the most common fields of study among 1,628 individuals in Dahlonega who have obtained a bachelor's degree or higher.
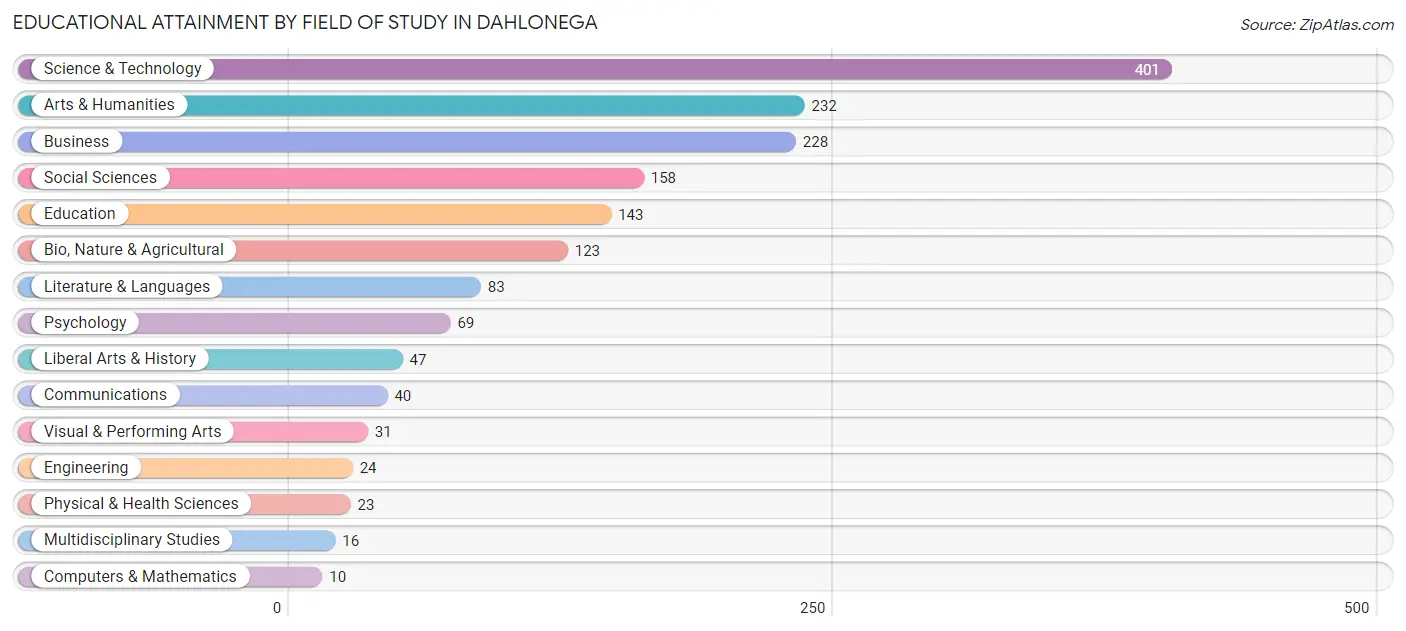
| Field of Study | # Graduates | % Graduates |
| Computers & Mathematics | 10 | 0.6% |
| Bio, Nature & Agricultural | 123 | 7.6% |
| Physical & Health Sciences | 23 | 1.4% |
| Psychology | 69 | 4.2% |
| Social Sciences | 158 | 9.7% |
| Engineering | 24 | 1.5% |
| Multidisciplinary Studies | 16 | 1.0% |
| Science & Technology | 401 | 24.6% |
| Business | 228 | 14.0% |
| Education | 143 | 8.8% |
| Literature & Languages | 83 | 5.1% |
| Liberal Arts & History | 47 | 2.9% |
| Visual & Performing Arts | 31 | 1.9% |
| Communications | 40 | 2.5% |
| Arts & Humanities | 232 | 14.2% |
| Total | 1,628 | 100.0% |
Transportation & Commute in Dahlonega
Vehicle Availability by Sex in Dahlonega
The most prevalent vehicle ownership categories in Dahlonega are males with 3 vehicles (419, accounting for 42.3%) and females with 3 vehicles (295, making up 37.2%).
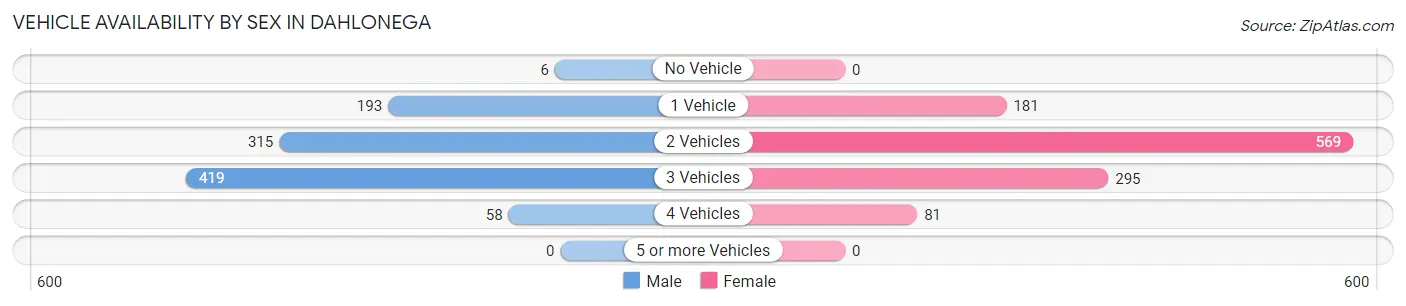
| Vehicles Available | Male | Female |
| No Vehicle | 6 (0.6%) | 0 (0.0%) |
| 1 Vehicle | 193 (19.5%) | 181 (16.1%) |
| 2 Vehicles | 315 (31.8%) | 569 (50.5%) |
| 3 Vehicles | 419 (42.3%) | 295 (26.2%) |
| 4 Vehicles | 58 (5.9%) | 81 (7.2%) |
| 5 or more Vehicles | 0 (0.0%) | 0 (0.0%) |
| Total | 991 (100.0%) | 1,126 (100.0%) |
Commute Time in Dahlonega
The most frequently occuring commute durations in Dahlonega are 5 to 9 minutes (619 commuters, 23.7%), 45 to 59 minutes (398 commuters, 15.2%), and 10 to 14 minutes (340 commuters, 13.0%).
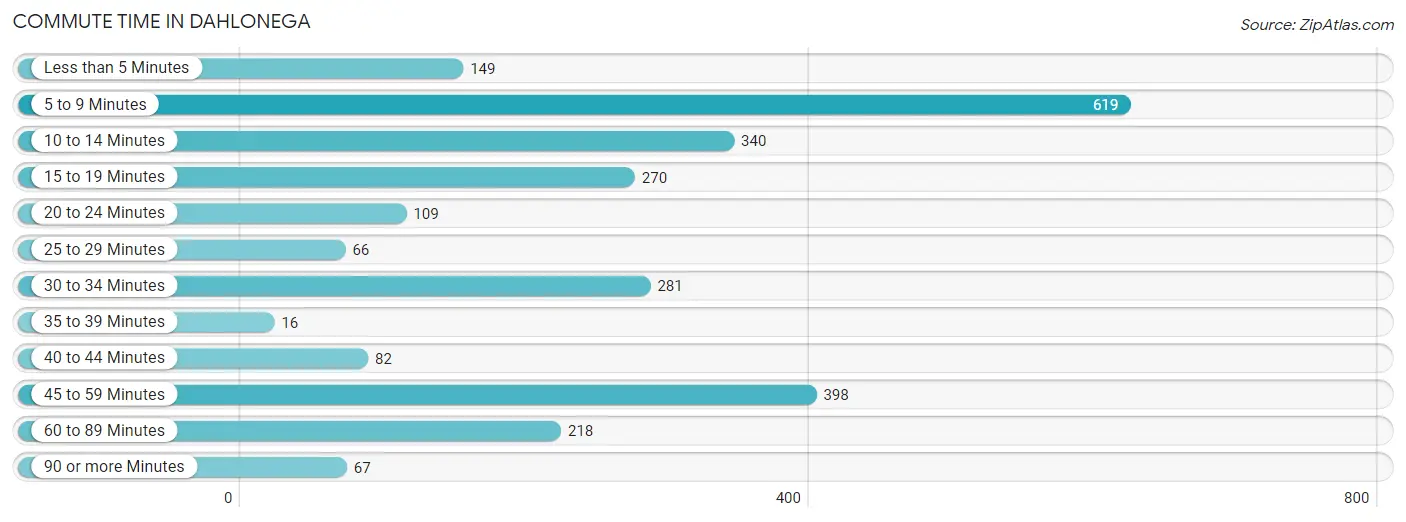
| Commute Time | # Commuters | % Commuters |
| Less than 5 Minutes | 149 | 5.7% |
| 5 to 9 Minutes | 619 | 23.7% |
| 10 to 14 Minutes | 340 | 13.0% |
| 15 to 19 Minutes | 270 | 10.3% |
| 20 to 24 Minutes | 109 | 4.2% |
| 25 to 29 Minutes | 66 | 2.5% |
| 30 to 34 Minutes | 281 | 10.7% |
| 35 to 39 Minutes | 16 | 0.6% |
| 40 to 44 Minutes | 82 | 3.1% |
| 45 to 59 Minutes | 398 | 15.2% |
| 60 to 89 Minutes | 218 | 8.3% |
| 90 or more Minutes | 67 | 2.6% |
Commute Time by Sex in Dahlonega
The most common commute times in Dahlonega are 5 to 9 minutes (227 commuters, 19.4%) for males and 5 to 9 minutes (392 commuters, 27.2%) for females.
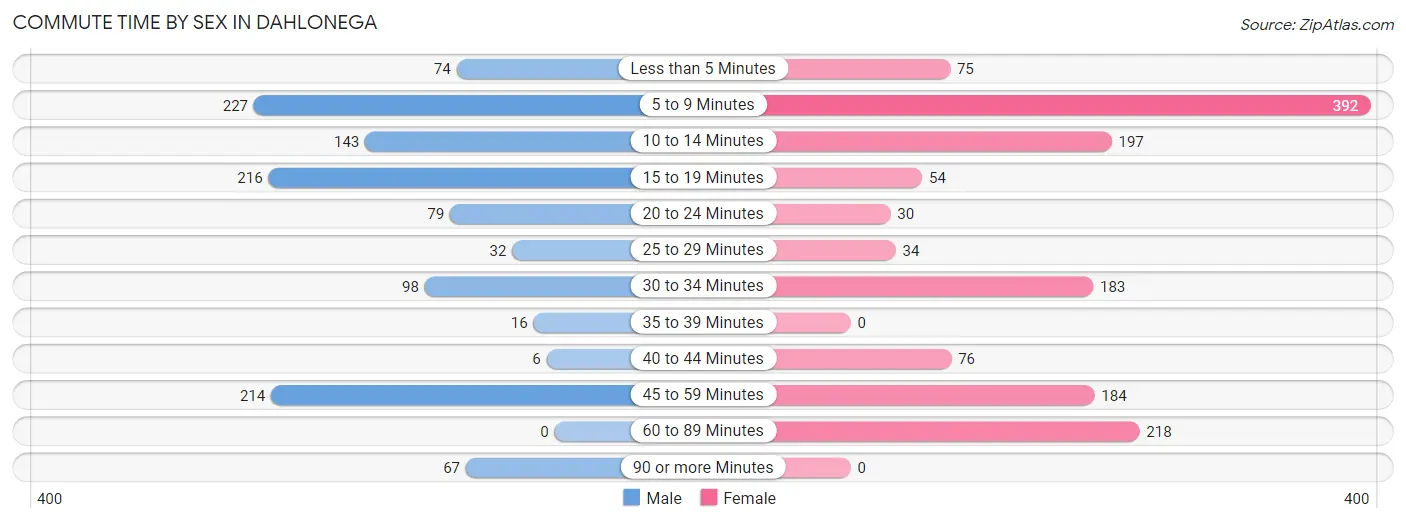
| Commute Time | Male | Female |
| Less than 5 Minutes | 74 (6.3%) | 75 (5.2%) |
| 5 to 9 Minutes | 227 (19.4%) | 392 (27.2%) |
| 10 to 14 Minutes | 143 (12.2%) | 197 (13.7%) |
| 15 to 19 Minutes | 216 (18.4%) | 54 (3.7%) |
| 20 to 24 Minutes | 79 (6.7%) | 30 (2.1%) |
| 25 to 29 Minutes | 32 (2.7%) | 34 (2.4%) |
| 30 to 34 Minutes | 98 (8.4%) | 183 (12.7%) |
| 35 to 39 Minutes | 16 (1.4%) | 0 (0.0%) |
| 40 to 44 Minutes | 6 (0.5%) | 76 (5.3%) |
| 45 to 59 Minutes | 214 (18.3%) | 184 (12.8%) |
| 60 to 89 Minutes | 0 (0.0%) | 218 (15.1%) |
| 90 or more Minutes | 67 (5.7%) | 0 (0.0%) |
Time of Departure to Work by Sex in Dahlonega
The most frequent times of departure to work in Dahlonega are 6:00 AM to 6:29 AM (191, 16.3%) for males and 9:00 AM to 9:59 AM (296, 20.5%) for females.
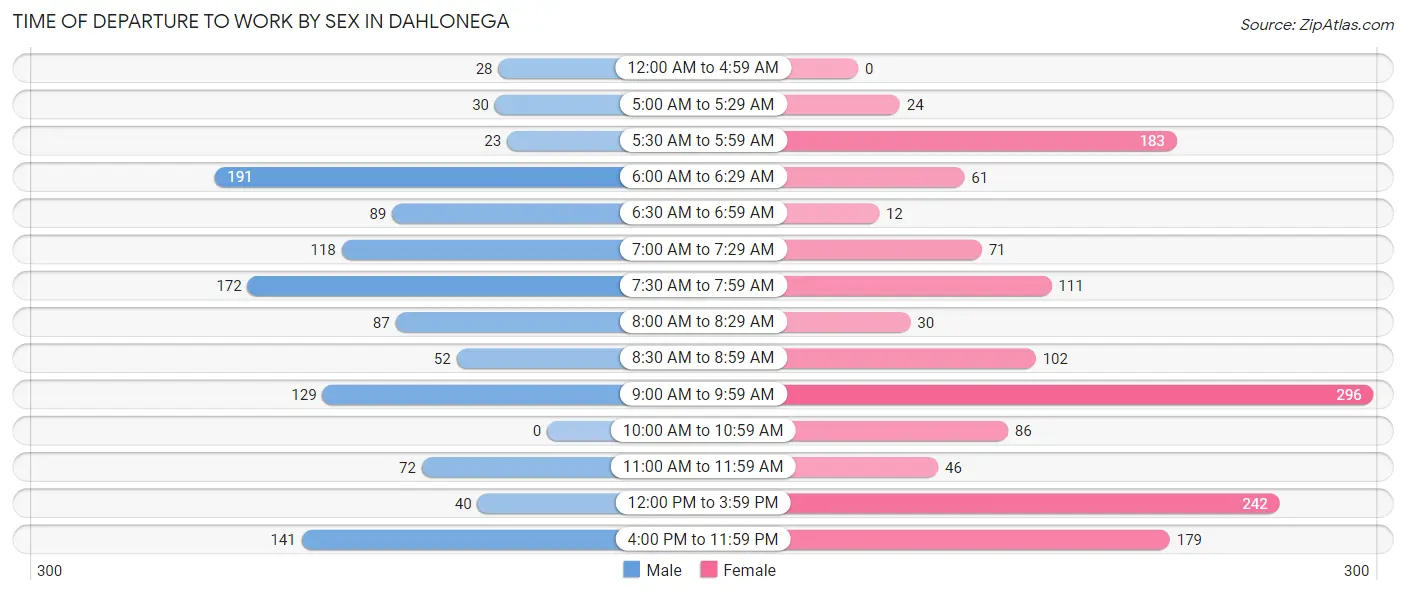
| Time of Departure | Male | Female |
| 12:00 AM to 4:59 AM | 28 (2.4%) | 0 (0.0%) |
| 5:00 AM to 5:29 AM | 30 (2.6%) | 24 (1.7%) |
| 5:30 AM to 5:59 AM | 23 (2.0%) | 183 (12.7%) |
| 6:00 AM to 6:29 AM | 191 (16.3%) | 61 (4.2%) |
| 6:30 AM to 6:59 AM | 89 (7.6%) | 12 (0.8%) |
| 7:00 AM to 7:29 AM | 118 (10.1%) | 71 (4.9%) |
| 7:30 AM to 7:59 AM | 172 (14.7%) | 111 (7.7%) |
| 8:00 AM to 8:29 AM | 87 (7.4%) | 30 (2.1%) |
| 8:30 AM to 8:59 AM | 52 (4.4%) | 102 (7.1%) |
| 9:00 AM to 9:59 AM | 129 (11.0%) | 296 (20.5%) |
| 10:00 AM to 10:59 AM | 0 (0.0%) | 86 (6.0%) |
| 11:00 AM to 11:59 AM | 72 (6.1%) | 46 (3.2%) |
| 12:00 PM to 3:59 PM | 40 (3.4%) | 242 (16.8%) |
| 4:00 PM to 11:59 PM | 141 (12.0%) | 179 (12.4%) |
| Total | 1,172 (100.0%) | 1,443 (100.0%) |
Housing Occupancy in Dahlonega
Occupancy by Ownership in Dahlonega
Of the total 2,102 dwellings in Dahlonega, owner-occupied units account for 1,150 (54.7%), while renter-occupied units make up 952 (45.3%).
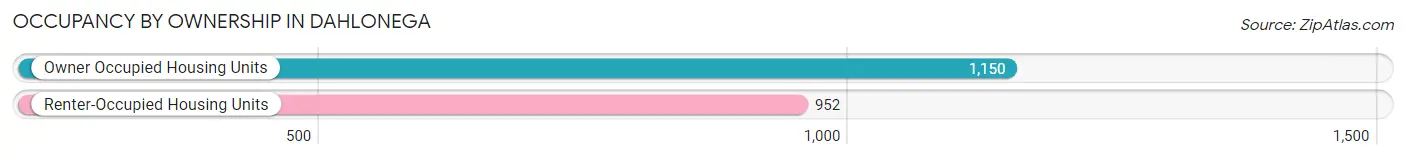
| Occupancy | # Housing Units | % Housing Units |
| Owner Occupied Housing Units | 1,150 | 54.7% |
| Renter-Occupied Housing Units | 952 | 45.3% |
| Total Occupied Housing Units | 2,102 | 100.0% |
Occupancy by Household Size in Dahlonega
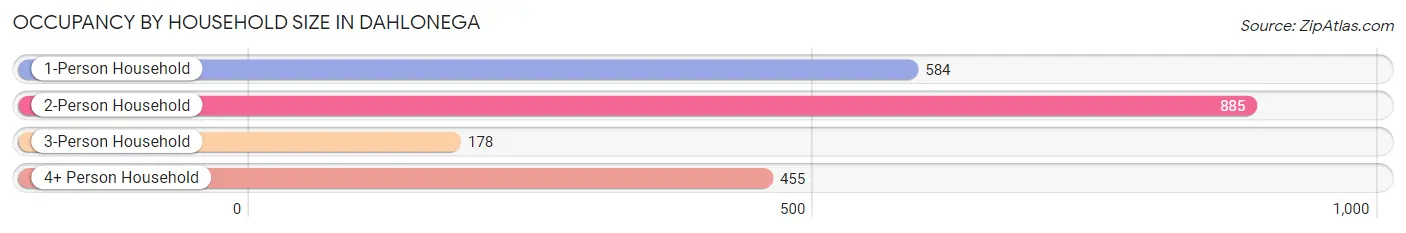
| Household Size | # Housing Units | % Housing Units |
| 1-Person Household | 584 | 27.8% |
| 2-Person Household | 885 | 42.1% |
| 3-Person Household | 178 | 8.5% |
| 4+ Person Household | 455 | 21.6% |
| Total Housing Units | 2,102 | 100.0% |
Occupancy by Ownership by Household Size in Dahlonega
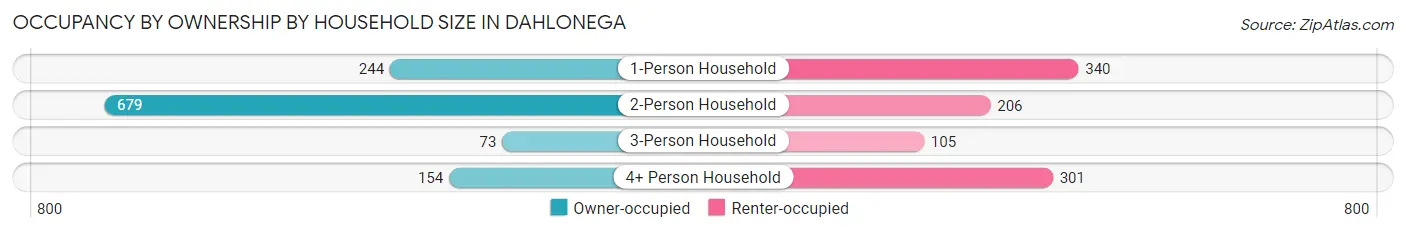
| Household Size | Owner-occupied | Renter-occupied |
| 1-Person Household | 244 (41.8%) | 340 (58.2%) |
| 2-Person Household | 679 (76.7%) | 206 (23.3%) |
| 3-Person Household | 73 (41.0%) | 105 (59.0%) |
| 4+ Person Household | 154 (33.9%) | 301 (66.1%) |
| Total Housing Units | 1,150 (54.7%) | 952 (45.3%) |
Occupancy by Educational Attainment in Dahlonega
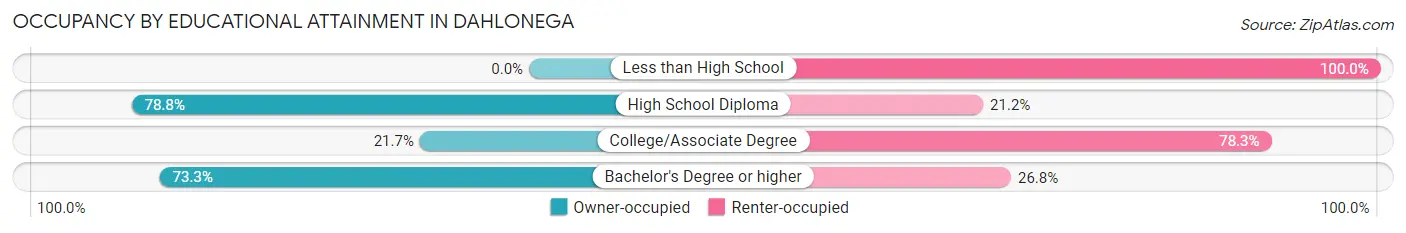
| Household Size | Owner-occupied | Renter-occupied |
| Less than High School | 0 (0.0%) | 40 (100.0%) |
| High School Diploma | 260 (78.8%) | 70 (21.2%) |
| College/Associate Degree | 159 (21.7%) | 575 (78.3%) |
| Bachelor's Degree or higher | 731 (73.3%) | 267 (26.8%) |
Occupancy by Age of Householder in Dahlonega
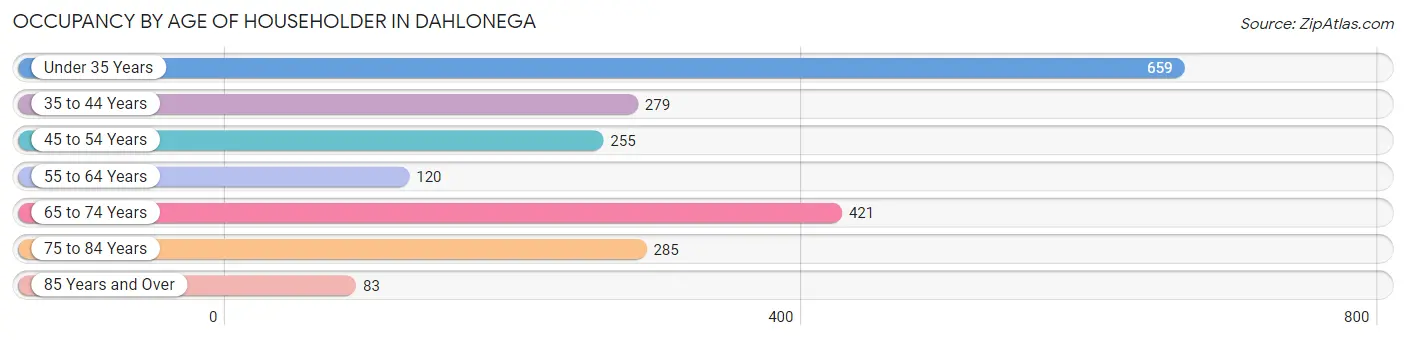
| Age Bracket | # Households | % Households |
| Under 35 Years | 659 | 31.4% |
| 35 to 44 Years | 279 | 13.3% |
| 45 to 54 Years | 255 | 12.1% |
| 55 to 64 Years | 120 | 5.7% |
| 65 to 74 Years | 421 | 20.0% |
| 75 to 84 Years | 285 | 13.6% |
| 85 Years and Over | 83 | 4.0% |
| Total | 2,102 | 100.0% |
Housing Finances in Dahlonega
Median Income by Occupancy in Dahlonega
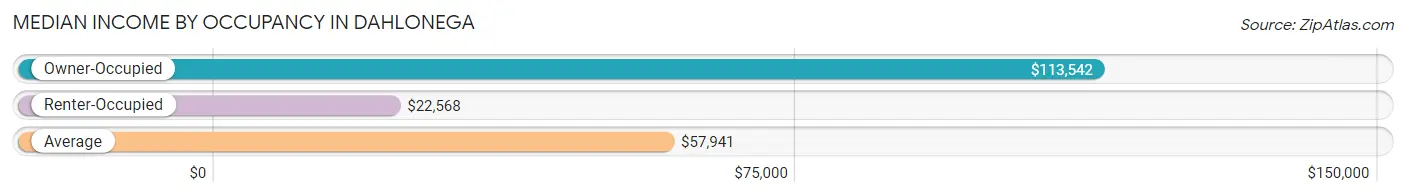
| Occupancy Type | # Households | Median Income |
| Owner-Occupied | 1,150 (54.7%) | $113,542 |
| Renter-Occupied | 952 (45.3%) | $22,568 |
| Average | 2,102 (100.0%) | $57,941 |
Occupancy by Householder Income Bracket in Dahlonega
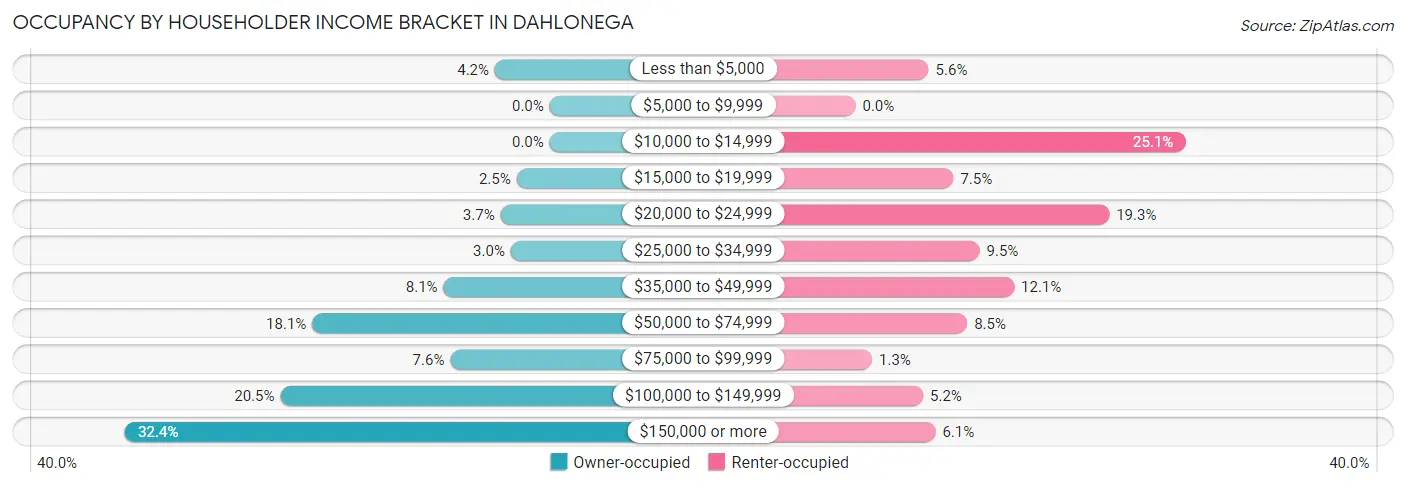
| Income Bracket | Owner-occupied | Renter-occupied |
| Less than $5,000 | 48 (4.2%) | 53 (5.6%) |
| $5,000 to $9,999 | 0 (0.0%) | 0 (0.0%) |
| $10,000 to $14,999 | 0 (0.0%) | 239 (25.1%) |
| $15,000 to $19,999 | 29 (2.5%) | 71 (7.5%) |
| $20,000 to $24,999 | 43 (3.7%) | 184 (19.3%) |
| $25,000 to $34,999 | 34 (3.0%) | 90 (9.5%) |
| $35,000 to $49,999 | 93 (8.1%) | 115 (12.1%) |
| $50,000 to $74,999 | 208 (18.1%) | 81 (8.5%) |
| $75,000 to $99,999 | 87 (7.6%) | 12 (1.3%) |
| $100,000 to $149,999 | 236 (20.5%) | 49 (5.1%) |
| $150,000 or more | 372 (32.4%) | 58 (6.1%) |
| Total | 1,150 (100.0%) | 952 (100.0%) |
Monthly Housing Cost Tiers in Dahlonega
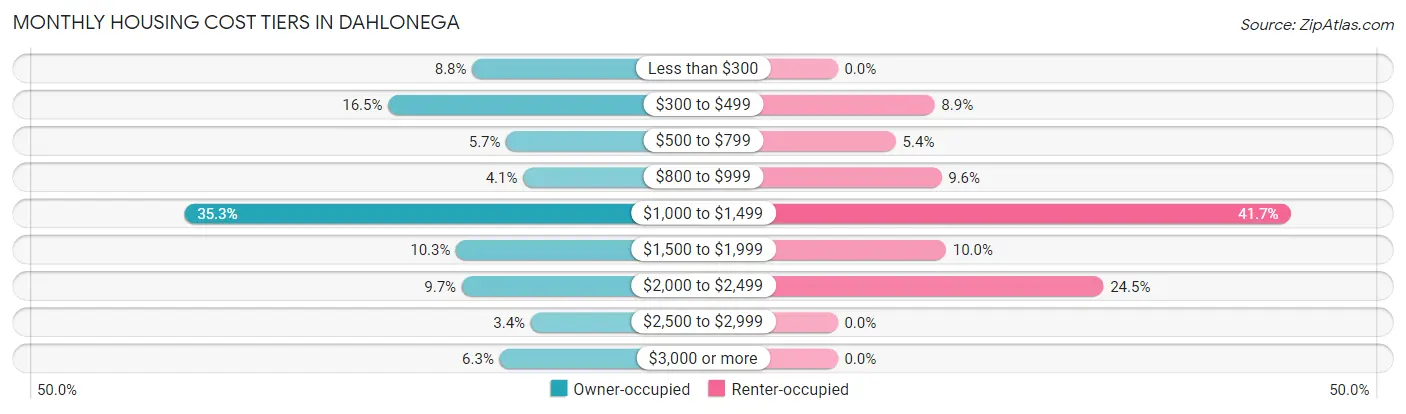
| Monthly Cost | Owner-occupied | Renter-occupied |
| Less than $300 | 101 (8.8%) | 0 (0.0%) |
| $300 to $499 | 190 (16.5%) | 85 (8.9%) |
| $500 to $799 | 65 (5.7%) | 51 (5.4%) |
| $800 to $999 | 47 (4.1%) | 91 (9.6%) |
| $1,000 to $1,499 | 406 (35.3%) | 397 (41.7%) |
| $1,500 to $1,999 | 118 (10.3%) | 95 (10.0%) |
| $2,000 to $2,499 | 112 (9.7%) | 233 (24.5%) |
| $2,500 to $2,999 | 39 (3.4%) | 0 (0.0%) |
| $3,000 or more | 72 (6.3%) | 0 (0.0%) |
| Total | 1,150 (100.0%) | 952 (100.0%) |
Physical Housing Characteristics in Dahlonega
Housing Structures in Dahlonega
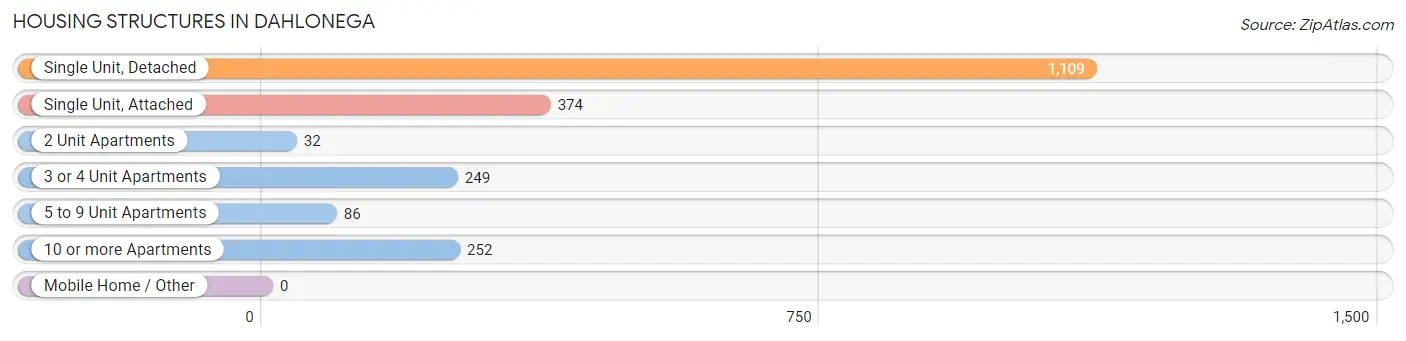
| Structure Type | # Housing Units | % Housing Units |
| Single Unit, Detached | 1,109 | 52.8% |
| Single Unit, Attached | 374 | 17.8% |
| 2 Unit Apartments | 32 | 1.5% |
| 3 or 4 Unit Apartments | 249 | 11.8% |
| 5 to 9 Unit Apartments | 86 | 4.1% |
| 10 or more Apartments | 252 | 12.0% |
| Mobile Home / Other | 0 | 0.0% |
| Total | 2,102 | 100.0% |
Housing Structures by Occupancy in Dahlonega
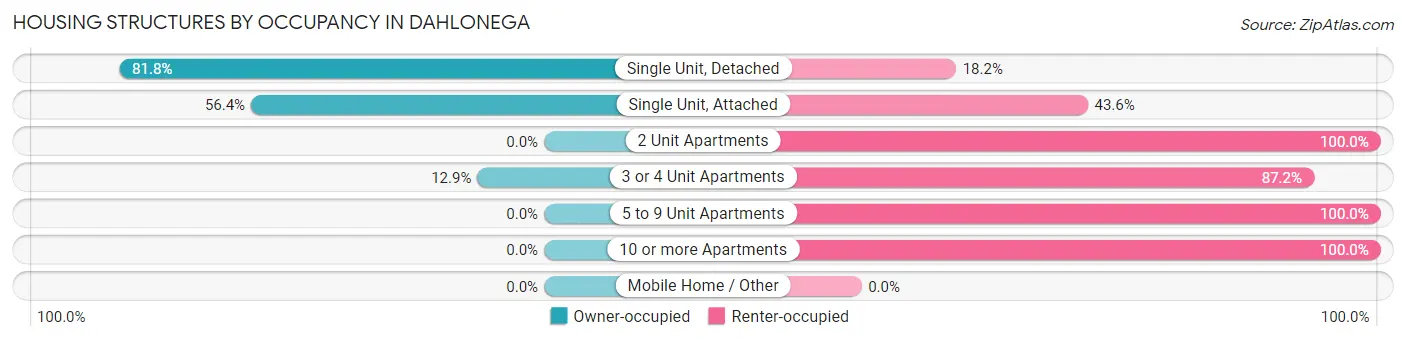
| Structure Type | Owner-occupied | Renter-occupied |
| Single Unit, Detached | 907 (81.8%) | 202 (18.2%) |
| Single Unit, Attached | 211 (56.4%) | 163 (43.6%) |
| 2 Unit Apartments | 0 (0.0%) | 32 (100.0%) |
| 3 or 4 Unit Apartments | 32 (12.9%) | 217 (87.2%) |
| 5 to 9 Unit Apartments | 0 (0.0%) | 86 (100.0%) |
| 10 or more Apartments | 0 (0.0%) | 252 (100.0%) |
| Mobile Home / Other | 0 (0.0%) | 0 (0.0%) |
| Total | 1,150 (54.7%) | 952 (45.3%) |
Housing Structures by Number of Rooms in Dahlonega
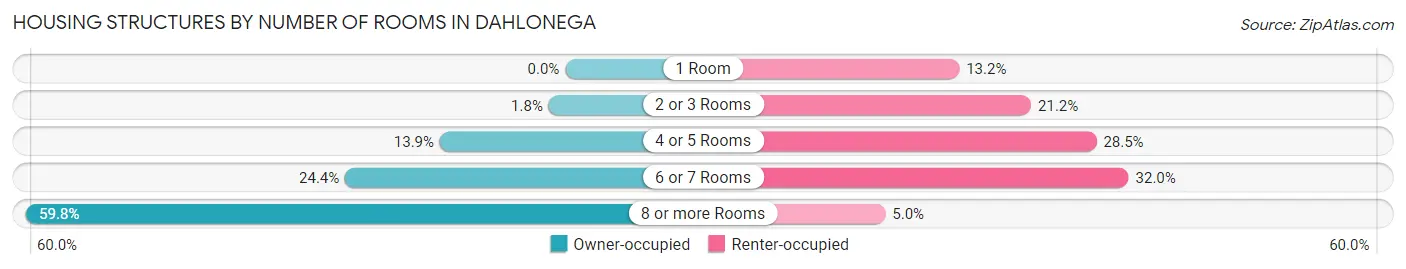
| Number of Rooms | Owner-occupied | Renter-occupied |
| 1 Room | 0 (0.0%) | 126 (13.2%) |
| 2 or 3 Rooms | 21 (1.8%) | 202 (21.2%) |
| 4 or 5 Rooms | 160 (13.9%) | 271 (28.5%) |
| 6 or 7 Rooms | 281 (24.4%) | 305 (32.0%) |
| 8 or more Rooms | 688 (59.8%) | 48 (5.0%) |
| Total | 1,150 (100.0%) | 952 (100.0%) |
Housing Structure by Heating Type in Dahlonega
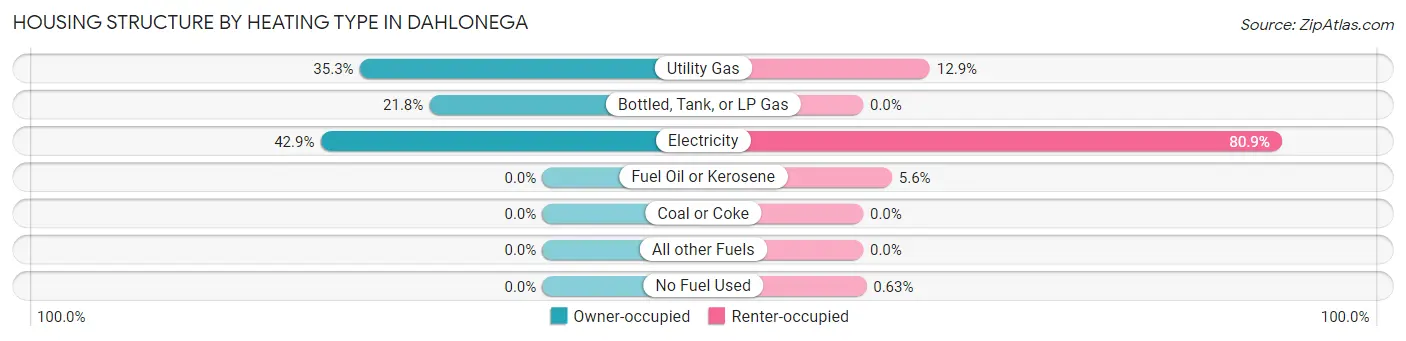
| Heating Type | Owner-occupied | Renter-occupied |
| Utility Gas | 406 (35.3%) | 123 (12.9%) |
| Bottled, Tank, or LP Gas | 251 (21.8%) | 0 (0.0%) |
| Electricity | 493 (42.9%) | 770 (80.9%) |
| Fuel Oil or Kerosene | 0 (0.0%) | 53 (5.6%) |
| Coal or Coke | 0 (0.0%) | 0 (0.0%) |
| All other Fuels | 0 (0.0%) | 0 (0.0%) |
| No Fuel Used | 0 (0.0%) | 6 (0.6%) |
| Total | 1,150 (100.0%) | 952 (100.0%) |
Household Vehicle Usage in Dahlonega
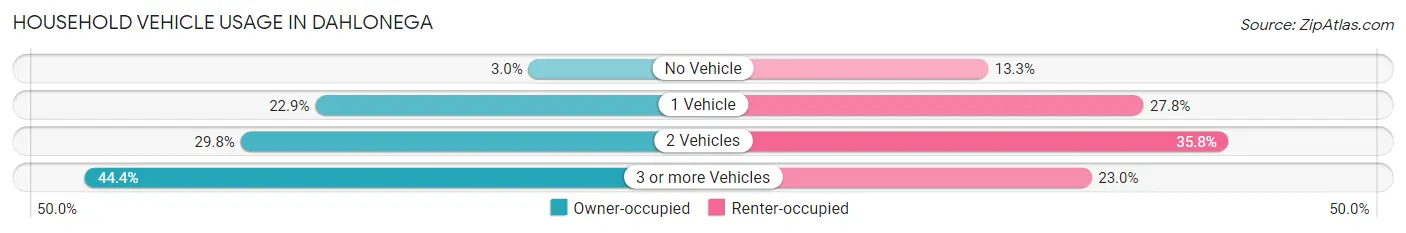
| Vehicles per Household | Owner-occupied | Renter-occupied |
| No Vehicle | 34 (3.0%) | 127 (13.3%) |
| 1 Vehicle | 263 (22.9%) | 265 (27.8%) |
| 2 Vehicles | 343 (29.8%) | 341 (35.8%) |
| 3 or more Vehicles | 510 (44.4%) | 219 (23.0%) |
| Total | 1,150 (100.0%) | 952 (100.0%) |
Real Estate & Mortgages in Dahlonega
Real Estate and Mortgage Overview in Dahlonega
| Characteristic | Without Mortgage | With Mortgage |
| Housing Units | 669 | 481 |
| Median Property Value | $452,400 | $337,000 |
| Median Household Income | $133,137 | $100 |
| Monthly Housing Costs | $778 | $72 |
| Real Estate Taxes | $3,154 | $19 |
Property Value by Mortgage Status in Dahlonega
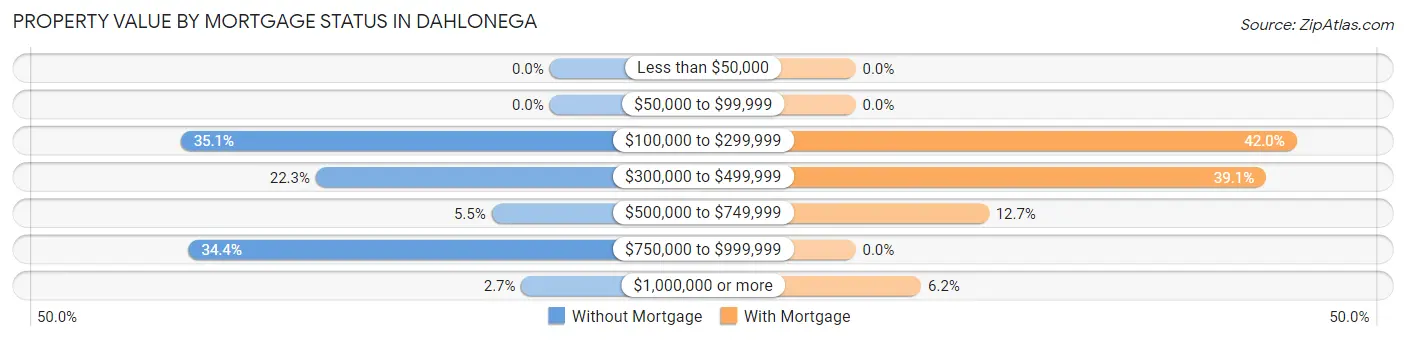
| Property Value | Without Mortgage | With Mortgage |
| Less than $50,000 | 0 (0.0%) | 0 (0.0%) |
| $50,000 to $99,999 | 0 (0.0%) | 0 (0.0%) |
| $100,000 to $299,999 | 235 (35.1%) | 202 (42.0%) |
| $300,000 to $499,999 | 149 (22.3%) | 188 (39.1%) |
| $500,000 to $749,999 | 37 (5.5%) | 61 (12.7%) |
| $750,000 to $999,999 | 230 (34.4%) | 0 (0.0%) |
| $1,000,000 or more | 18 (2.7%) | 30 (6.2%) |
| Total | 669 (100.0%) | 481 (100.0%) |
Household Income by Mortgage Status in Dahlonega
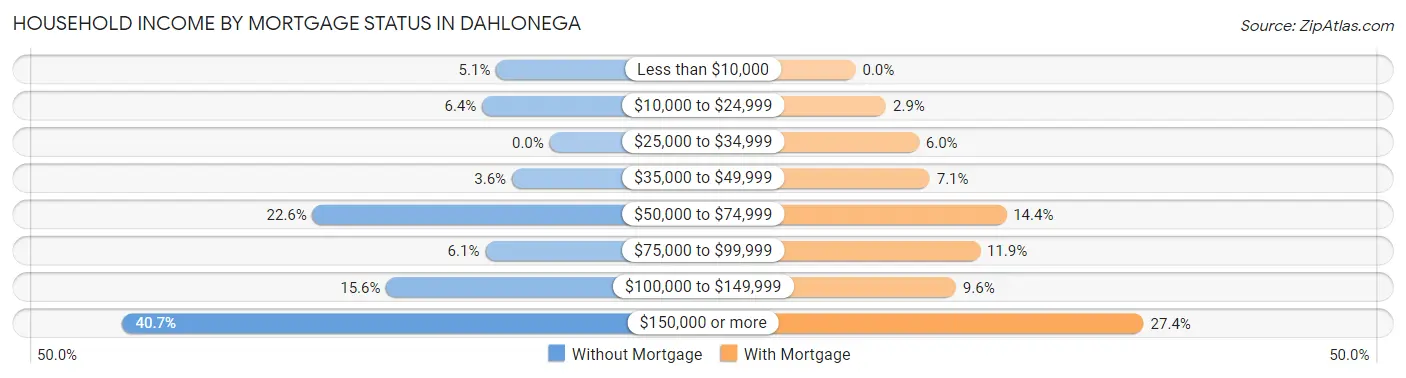
| Household Income | Without Mortgage | With Mortgage |
| Less than $10,000 | 34 (5.1%) | 0 (0.0%) |
| $10,000 to $24,999 | 43 (6.4%) | 14 (2.9%) |
| $25,000 to $34,999 | 0 (0.0%) | 29 (6.0%) |
| $35,000 to $49,999 | 24 (3.6%) | 34 (7.1%) |
| $50,000 to $74,999 | 151 (22.6%) | 69 (14.3%) |
| $75,000 to $99,999 | 41 (6.1%) | 57 (11.8%) |
| $100,000 to $149,999 | 104 (15.5%) | 46 (9.6%) |
| $150,000 or more | 272 (40.7%) | 132 (27.4%) |
| Total | 669 (100.0%) | 481 (100.0%) |
Property Value to Household Income Ratio in Dahlonega
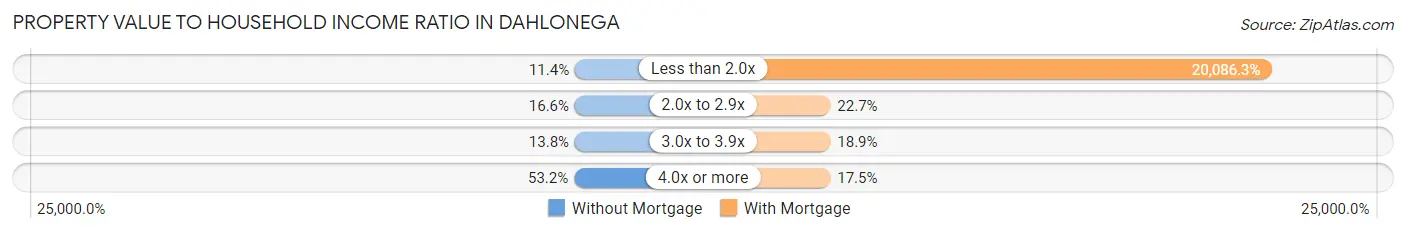
| Value-to-Income Ratio | Without Mortgage | With Mortgage |
| Less than 2.0x | 76 (11.4%) | 96,615 (20,086.3%) |
| 2.0x to 2.9x | 111 (16.6%) | 109 (22.7%) |
| 3.0x to 3.9x | 92 (13.8%) | 91 (18.9%) |
| 4.0x or more | 356 (53.2%) | 84 (17.5%) |
| Total | 669 (100.0%) | 481 (100.0%) |
Real Estate Taxes by Mortgage Status in Dahlonega
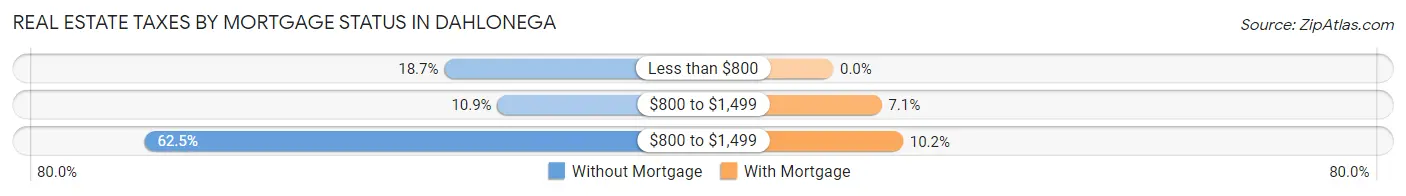
| Property Taxes | Without Mortgage | With Mortgage |
| Less than $800 | 125 (18.7%) | 0 (0.0%) |
| $800 to $1,499 | 73 (10.9%) | 34 (7.1%) |
| $800 to $1,499 | 418 (62.5%) | 49 (10.2%) |
| Total | 669 (100.0%) | 481 (100.0%) |
Health & Disability in Dahlonega
Health Insurance Coverage by Age in Dahlonega
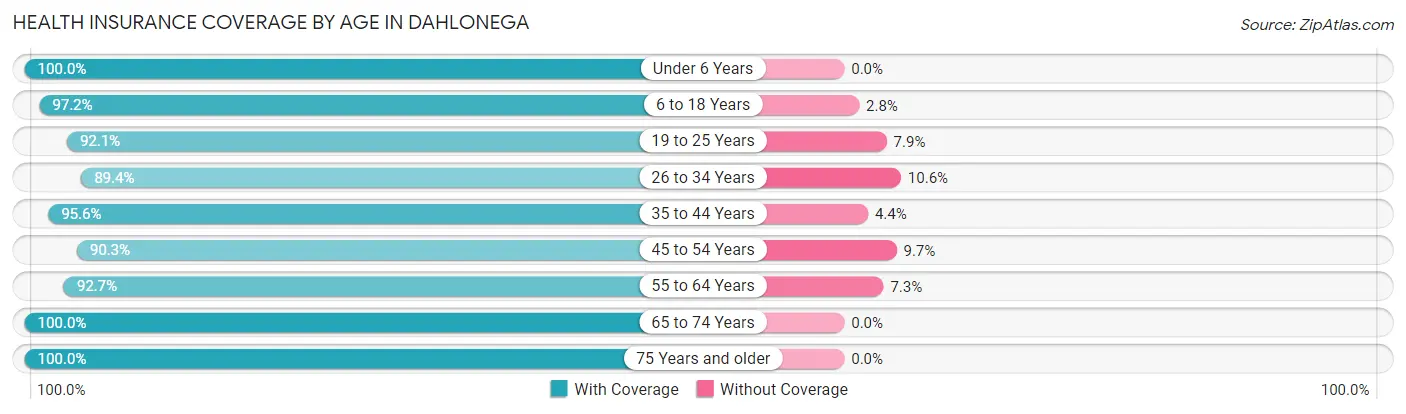
| Age Bracket | With Coverage | Without Coverage |
| Under 6 Years | 108 (100.0%) | 0 (0.0%) |
| 6 to 18 Years | 1,091 (97.2%) | 31 (2.8%) |
| 19 to 25 Years | 2,728 (92.1%) | 234 (7.9%) |
| 26 to 34 Years | 161 (89.4%) | 19 (10.6%) |
| 35 to 44 Years | 434 (95.6%) | 20 (4.4%) |
| 45 to 54 Years | 389 (90.3%) | 42 (9.7%) |
| 55 to 64 Years | 241 (92.7%) | 19 (7.3%) |
| 65 to 74 Years | 670 (100.0%) | 0 (0.0%) |
| 75 Years and older | 606 (100.0%) | 0 (0.0%) |
| Total | 6,428 (94.6%) | 365 (5.4%) |
Health Insurance Coverage by Citizenship Status in Dahlonega
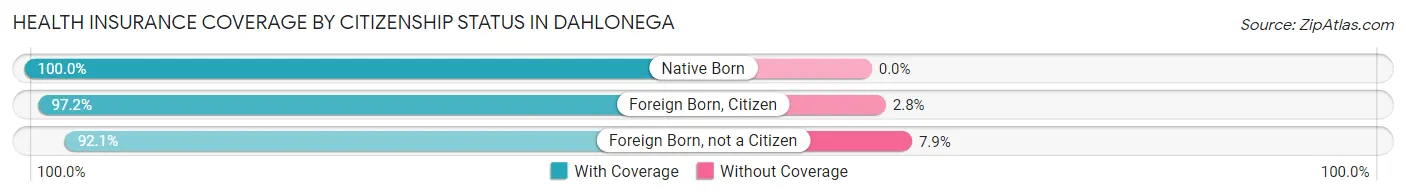
| Citizenship Status | With Coverage | Without Coverage |
| Native Born | 108 (100.0%) | 0 (0.0%) |
| Foreign Born, Citizen | 1,091 (97.2%) | 31 (2.8%) |
| Foreign Born, not a Citizen | 2,728 (92.1%) | 234 (7.9%) |
Health Insurance Coverage by Household Income in Dahlonega
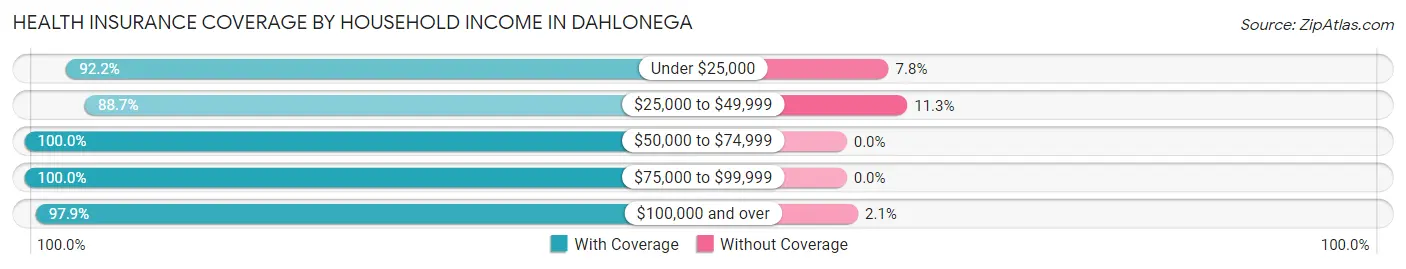
| Household Income | With Coverage | Without Coverage |
| Under $25,000 | 1,470 (92.2%) | 125 (7.8%) |
| $25,000 to $49,999 | 673 (88.7%) | 86 (11.3%) |
| $50,000 to $74,999 | 651 (100.0%) | 0 (0.0%) |
| $75,000 to $99,999 | 186 (100.0%) | 0 (0.0%) |
| $100,000 and over | 1,845 (97.9%) | 40 (2.1%) |
Public vs Private Health Insurance Coverage by Age in Dahlonega
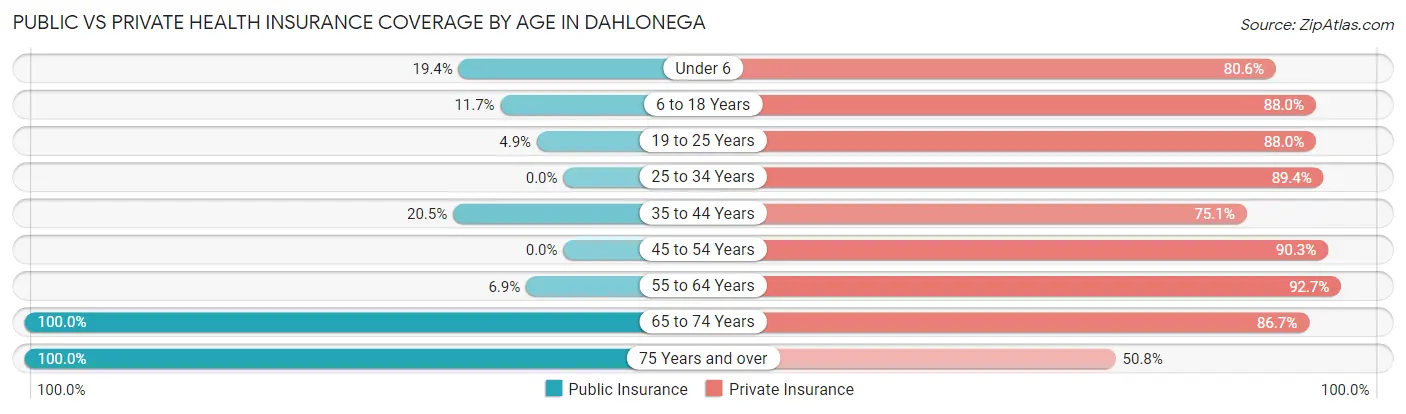
| Age Bracket | Public Insurance | Private Insurance |
| Under 6 | 21 (19.4%) | 87 (80.6%) |
| 6 to 18 Years | 131 (11.7%) | 987 (88.0%) |
| 19 to 25 Years | 145 (4.9%) | 2,607 (88.0%) |
| 25 to 34 Years | 0 (0.0%) | 161 (89.4%) |
| 35 to 44 Years | 93 (20.5%) | 341 (75.1%) |
| 45 to 54 Years | 0 (0.0%) | 389 (90.3%) |
| 55 to 64 Years | 18 (6.9%) | 241 (92.7%) |
| 65 to 74 Years | 670 (100.0%) | 581 (86.7%) |
| 75 Years and over | 606 (100.0%) | 308 (50.8%) |
| Total | 1,684 (24.8%) | 5,702 (83.9%) |
Disability Status by Sex by Age in Dahlonega
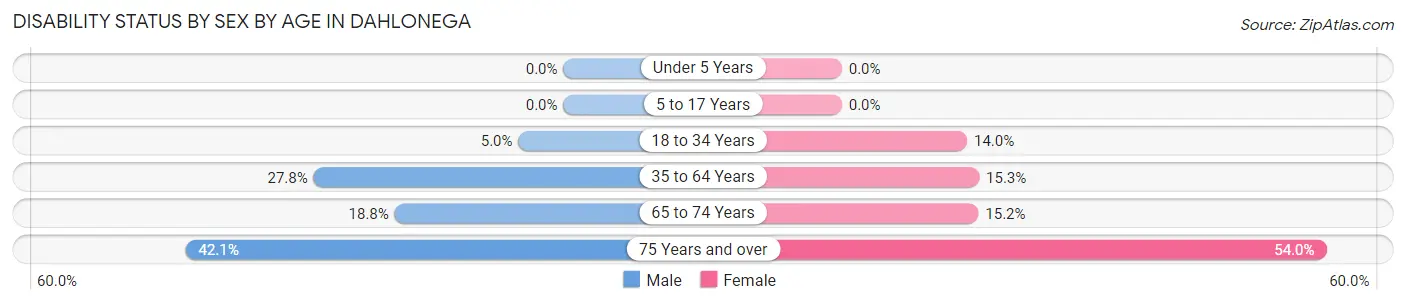
| Age Bracket | Male | Female |
| Under 5 Years | 0 (0.0%) | 0 (0.0%) |
| 5 to 17 Years | 0 (0.0%) | 0 (0.0%) |
| 18 to 34 Years | 86 (5.0%) | 286 (14.0%) |
| 35 to 64 Years | 153 (27.8%) | 91 (15.3%) |
| 65 to 74 Years | 53 (18.8%) | 59 (15.2%) |
| 75 Years and over | 85 (42.1%) | 218 (54.0%) |
Disability Class by Sex by Age in Dahlonega
Disability Class: Hearing Difficulty
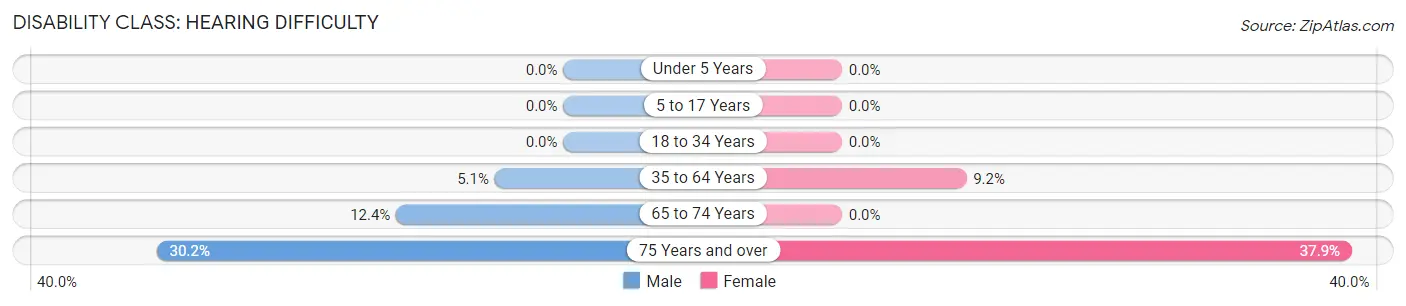
| Age Bracket | Male | Female |
| Under 5 Years | 0 (0.0%) | 0 (0.0%) |
| 5 to 17 Years | 0 (0.0%) | 0 (0.0%) |
| 18 to 34 Years | 0 (0.0%) | 0 (0.0%) |
| 35 to 64 Years | 28 (5.1%) | 55 (9.2%) |
| 65 to 74 Years | 35 (12.4%) | 0 (0.0%) |
| 75 Years and over | 61 (30.2%) | 153 (37.9%) |
Disability Class: Vision Difficulty
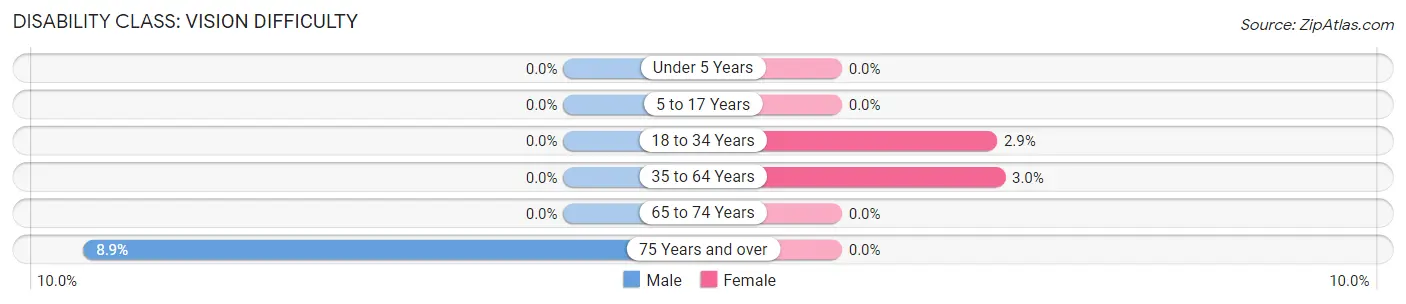
| Age Bracket | Male | Female |
| Under 5 Years | 0 (0.0%) | 0 (0.0%) |
| 5 to 17 Years | 0 (0.0%) | 0 (0.0%) |
| 18 to 34 Years | 0 (0.0%) | 59 (2.9%) |
| 35 to 64 Years | 0 (0.0%) | 18 (3.0%) |
| 65 to 74 Years | 0 (0.0%) | 0 (0.0%) |
| 75 Years and over | 18 (8.9%) | 0 (0.0%) |
Disability Class: Cognitive Difficulty
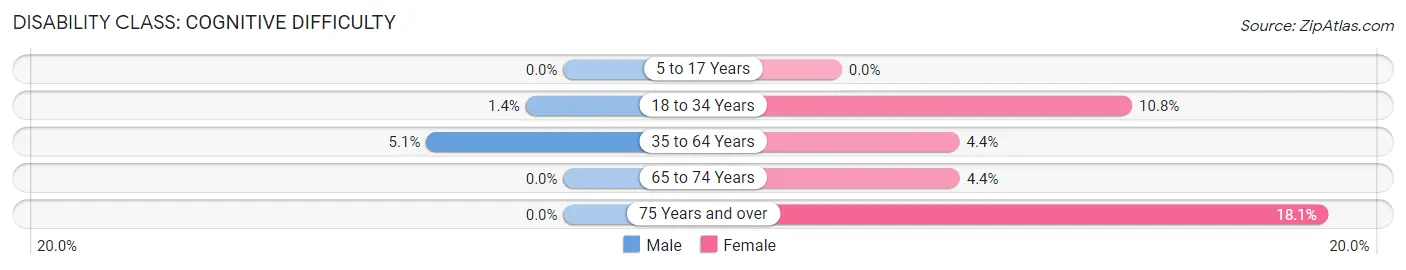
| Age Bracket | Male | Female |
| 5 to 17 Years | 0 (0.0%) | 0 (0.0%) |
| 18 to 34 Years | 24 (1.4%) | 221 (10.8%) |
| 35 to 64 Years | 28 (5.1%) | 26 (4.4%) |
| 65 to 74 Years | 0 (0.0%) | 17 (4.4%) |
| 75 Years and over | 0 (0.0%) | 73 (18.1%) |
Disability Class: Ambulatory Difficulty
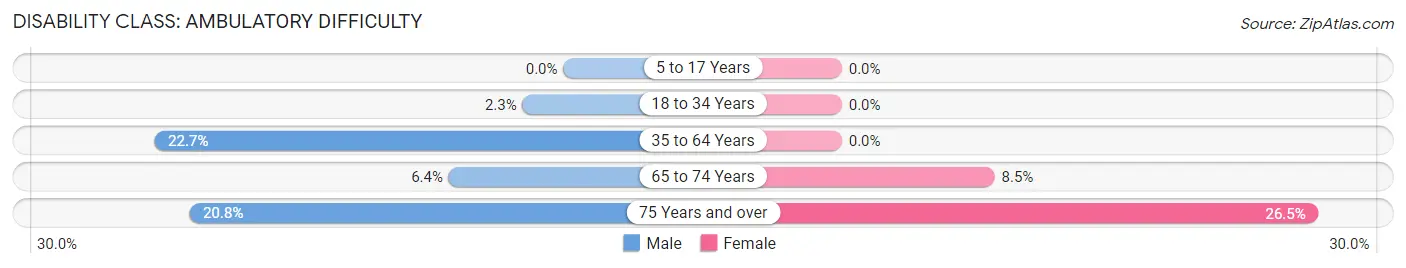
| Age Bracket | Male | Female |
| 5 to 17 Years | 0 (0.0%) | 0 (0.0%) |
| 18 to 34 Years | 39 (2.3%) | 0 (0.0%) |
| 35 to 64 Years | 125 (22.7%) | 0 (0.0%) |
| 65 to 74 Years | 18 (6.4%) | 33 (8.5%) |
| 75 Years and over | 42 (20.8%) | 107 (26.5%) |
Disability Class: Self-Care Difficulty
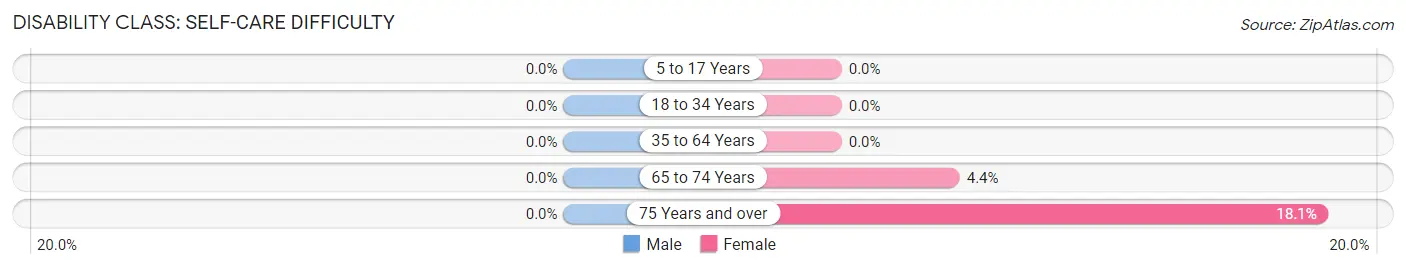
| Age Bracket | Male | Female |
| 5 to 17 Years | 0 (0.0%) | 0 (0.0%) |
| 18 to 34 Years | 0 (0.0%) | 0 (0.0%) |
| 35 to 64 Years | 0 (0.0%) | 0 (0.0%) |
| 65 to 74 Years | 0 (0.0%) | 17 (4.4%) |
| 75 Years and over | 0 (0.0%) | 73 (18.1%) |
Technology Access in Dahlonega
Computing Device Access in Dahlonega
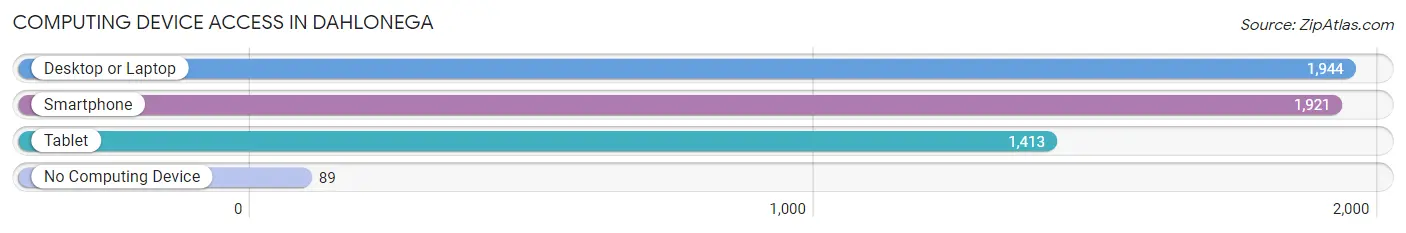
| Device Type | # Households | % Households |
| Desktop or Laptop | 1,944 | 92.5% |
| Smartphone | 1,921 | 91.4% |
| Tablet | 1,413 | 67.2% |
| No Computing Device | 89 | 4.2% |
| Total | 2,102 | 100.0% |
Internet Access in Dahlonega
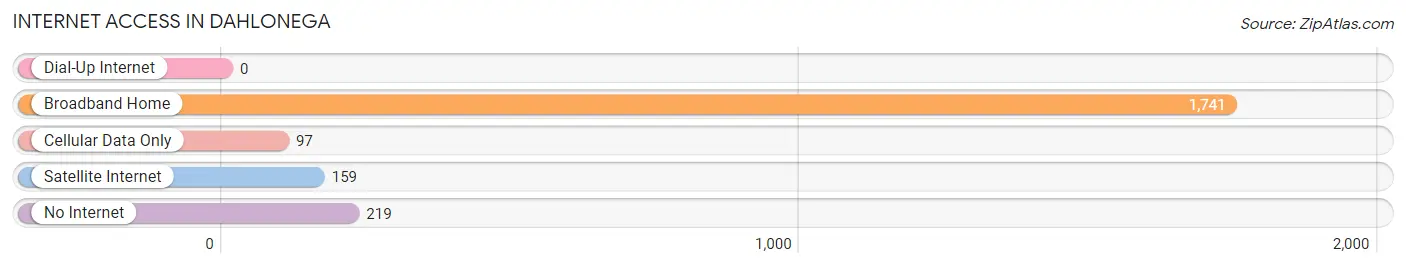
| Internet Type | # Households | % Households |
| Dial-Up Internet | 0 | 0.0% |
| Broadband Home | 1,741 | 82.8% |
| Cellular Data Only | 97 | 4.6% |
| Satellite Internet | 159 | 7.6% |
| No Internet | 219 | 10.4% |
| Total | 2,102 | 100.0% |
Dahlonega Summary
Dahlonega is a city located in the foothills of the Blue Ridge Mountains in Lumpkin County, Georgia. It is the county seat of Lumpkin County and is located about an hour and a half north of Atlanta. The city is known for its gold rush history, its picturesque downtown, and its proximity to the Appalachian Trail.
History
Dahlonega was founded in 1833 as the seat of Lumpkin County. The city was named after the Cherokee word “Dahlonaga” which means “yellow” or “gold”. This is fitting as Dahlonega is known as the site of the first major gold rush in the United States. The gold rush began in 1828 when a man named Benjamin Parks discovered gold in the area. This discovery sparked a gold rush that lasted until the late 1840s. During this time, Dahlonega was a bustling town with a population of over 5,000 people.
The gold rush eventually ended and the population of Dahlonega declined. The city was able to survive the decline due to its location on the Western and Atlantic Railroad. This allowed the city to become a center for trade and commerce. The city also became a center for education with the founding of North Georgia College in 1873. The college is now known as the University of North Georgia.
Geography
Dahlonega is located in the foothills of the Blue Ridge Mountains in Lumpkin County, Georgia. The city is situated at the base of the Appalachian Trail and is surrounded by the Chattahoochee National Forest. The city is located about an hour and a half north of Atlanta and is accessible by US Highway 19 and State Route 60.
The city has a total area of 8.2 square miles, of which 8.1 square miles is land and 0.1 square miles is water. The city is located at an elevation of 1,068 feet above sea level.
Economy
Dahlonega’s economy is largely driven by tourism. The city is a popular destination for outdoor enthusiasts due to its proximity to the Appalachian Trail and the Chattahoochee National Forest. The city is also home to the University of North Georgia, which is a major employer in the area.
The city is also home to several wineries and vineyards, as well as a number of antique stores and art galleries. The city is also home to a number of festivals and events throughout the year, including the Gold Rush Festival and the Dahlonega Arts and Wine Festival.
Demographics
As of the 2010 census, the population of Dahlonega was 5,242. The racial makeup of the city was 87.3% White, 8.2% African American, 0.4% Native American, 1.2% Asian, 0.1% Pacific Islander, 1.2% from other races, and 1.6% from two or more races. Hispanic or Latino of any race were 3.3% of the population.
The median household income in Dahlonega was $37,917 and the median family income was $45,938. The per capita income for the city was $20,945. About 11.3% of families and 15.7% of the population were below the poverty line, including 22.2% of those under age 18 and 8.2% of those age 65 or over.
Common Questions
What is Per Capita Income in Dahlonega?
Per Capita income in Dahlonega is $24,752.
What is the Median Family Income in Dahlonega?
Median Family Income in Dahlonega is $110,800.
What is the Median Household income in Dahlonega?
Median Household Income in Dahlonega is $57,941.
What is Inequality or Gini Index in Dahlonega?
Inequality or Gini Index in Dahlonega is 0.48.
What is the Total Population of Dahlonega?
Total Population of Dahlonega is 7,083.
What is the Total Male Population of Dahlonega?
Total Male Population of Dahlonega is 3,174.
What is the Total Female Population of Dahlonega?
Total Female Population of Dahlonega is 3,909.
What is the Ratio of Males per 100 Females in Dahlonega?
There are 81.20 Males per 100 Females in Dahlonega.
What is the Ratio of Females per 100 Males in Dahlonega?
There are 123.16 Females per 100 Males in Dahlonega.
What is the Median Population Age in Dahlonega?
Median Population Age in Dahlonega is 21.8 Years.
What is the Average Family Size in Dahlonega
Average Family Size in Dahlonega is 2.7 People.
What is the Average Household Size in Dahlonega
Average Household Size in Dahlonega is 2.5 People.
How Large is the Labor Force in Dahlonega?
There are 2,965 People in the Labor Forcein in Dahlonega.
What is the Percentage of People in the Labor Force in Dahlonega?
45.1% of People are in the Labor Force in Dahlonega.
What is the Unemployment Rate in Dahlonega?
Unemployment Rate in Dahlonega is 4.4%.