South Palm Beach, FL Map & Demographics
South Palm Beach Map
South Palm Beach Overview
$102,269
PER CAPITA INCOME
$166,563
AVG FAMILY INCOME
$82,917
AVG HOUSEHOLD INCOME
0.56
INEQUALITY / GINI INDEX
1,648
TOTAL POPULATION
680
MALE POPULATION
968
FEMALE POPULATION
70.25
MALES / 100 FEMALES
142.35
FEMALES / 100 MALES
66.9
MEDIAN AGE
2.3
AVG FAMILY SIZE
1.7
AVG HOUSEHOLD SIZE
750
LABOR FORCE [ PEOPLE ]
46.8%
PERCENT IN LABOR FORCE
1.3%
UNEMPLOYMENT RATE
South Palm Beach Area Codes
Income in South Palm Beach
Income Overview in South Palm Beach
Per Capita Income in South Palm Beach is $102,269, while median incomes of families and households are $166,563 and $82,917 respectively.
| Characteristic | Number | Measure |
| Per Capita Income | 1,648 | $102,269 |
| Median Family Income | 367 | $166,563 |
| Mean Family Income | 367 | $241,160 |
| Median Household Income | 994 | $82,917 |
| Mean Household Income | 994 | $159,859 |
| Income Deficit | 367 | $0 |
| Wage / Income Gap (%) | 1,648 | 0.00% |
| Wage / Income Gap ($) | 1,648 | 100.00¢ per $1 |
| Gini / Inequality Index | 1,648 | 0.56 |
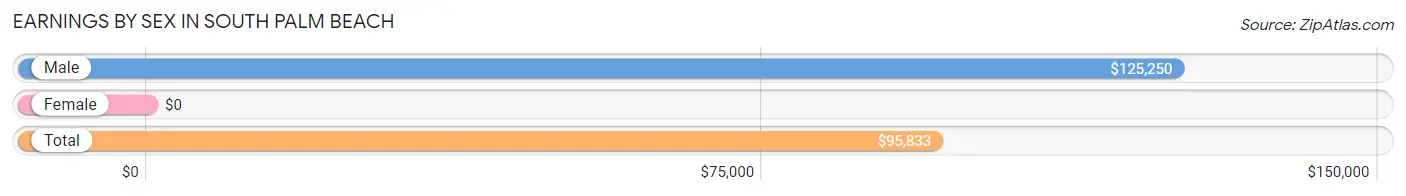
Earnings by Sex in South Palm Beach
| Sex | Number | Average Earnings |
| Male | 362 (45.4%) | $125,250 |
| Female | 436 (54.6%) | $0 |
| Total | 798 (100.0%) | $95,833 |
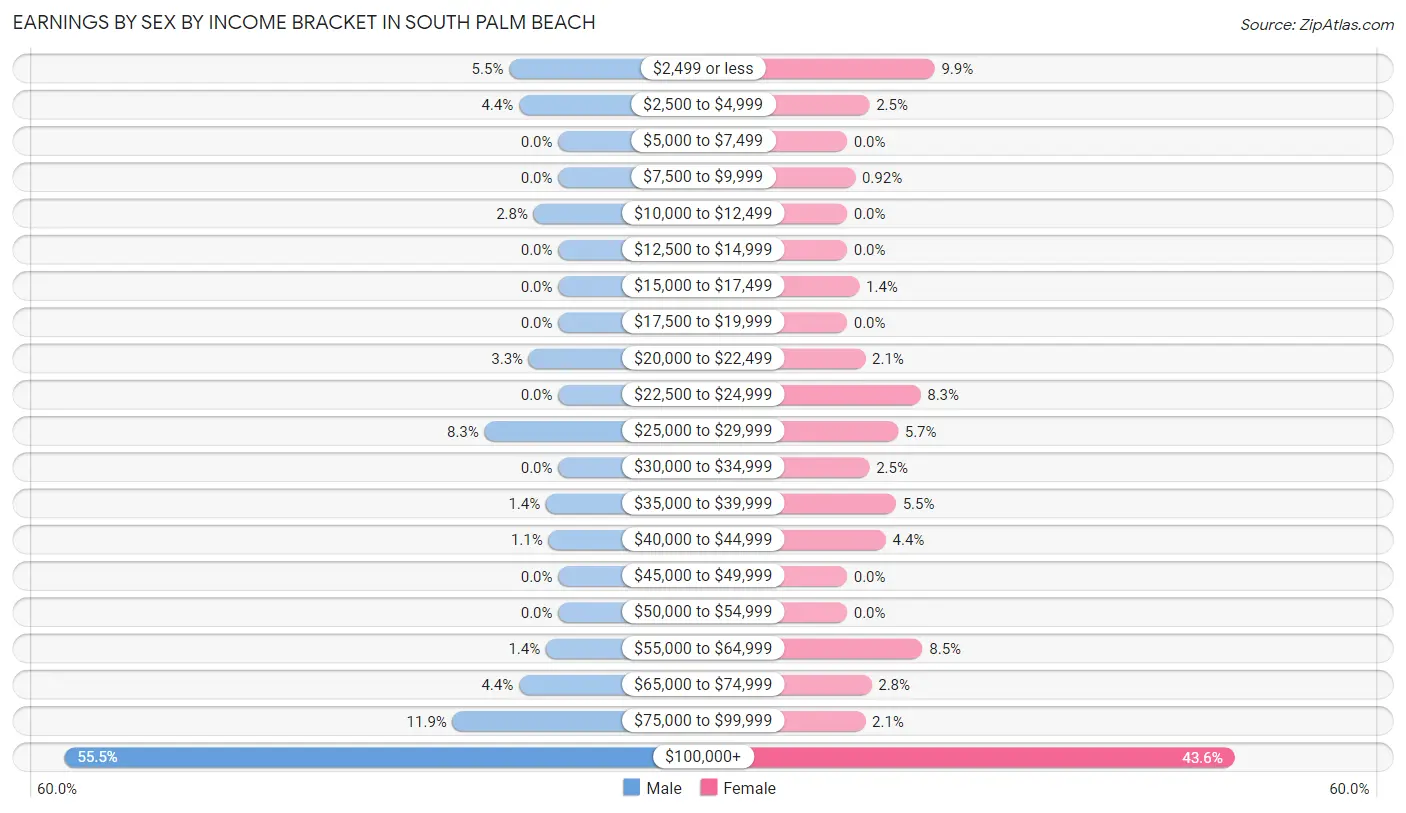
Earnings by Sex by Income Bracket in South Palm Beach
The most common earnings brackets in South Palm Beach are $100,000+ for men (201 | 55.5%) and $100,000+ for women (190 | 43.6%).
| Income | Male | Female |
| $2,499 or less | 20 (5.5%) | 43 (9.9%) |
| $2,500 to $4,999 | 16 (4.4%) | 11 (2.5%) |
| $5,000 to $7,499 | 0 (0.0%) | 0 (0.0%) |
| $7,500 to $9,999 | 0 (0.0%) | 4 (0.9%) |
| $10,000 to $12,499 | 10 (2.8%) | 0 (0.0%) |
| $12,500 to $14,999 | 0 (0.0%) | 0 (0.0%) |
| $15,000 to $17,499 | 0 (0.0%) | 6 (1.4%) |
| $17,500 to $19,999 | 0 (0.0%) | 0 (0.0%) |
| $20,000 to $22,499 | 12 (3.3%) | 9 (2.1%) |
| $22,500 to $24,999 | 0 (0.0%) | 36 (8.3%) |
| $25,000 to $29,999 | 30 (8.3%) | 25 (5.7%) |
| $30,000 to $34,999 | 0 (0.0%) | 11 (2.5%) |
| $35,000 to $39,999 | 5 (1.4%) | 24 (5.5%) |
| $40,000 to $44,999 | 4 (1.1%) | 19 (4.4%) |
| $45,000 to $49,999 | 0 (0.0%) | 0 (0.0%) |
| $50,000 to $54,999 | 0 (0.0%) | 0 (0.0%) |
| $55,000 to $64,999 | 5 (1.4%) | 37 (8.5%) |
| $65,000 to $74,999 | 16 (4.4%) | 12 (2.8%) |
| $75,000 to $99,999 | 43 (11.9%) | 9 (2.1%) |
| $100,000+ | 201 (55.5%) | 190 (43.6%) |
| Total | 362 (100.0%) | 436 (100.0%) |
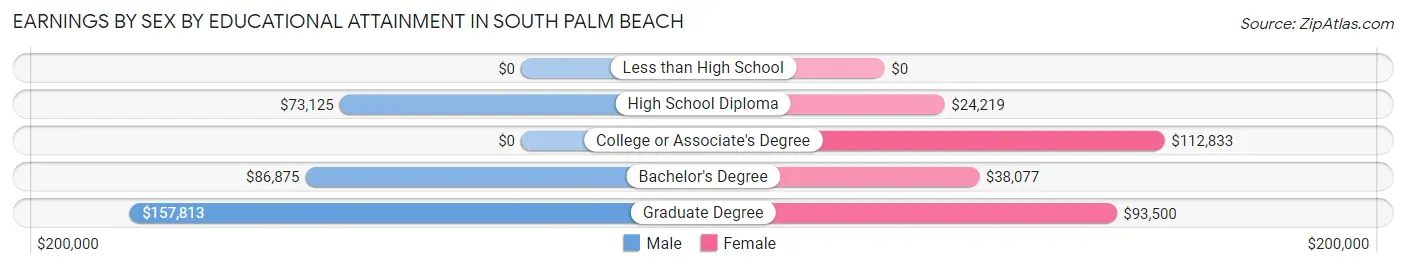
Earnings by Sex by Educational Attainment in South Palm Beach
| Educational Attainment | Male Income | Female Income |
| Less than High School | - | - |
| High School Diploma | $73,125 | $24,219 |
| College or Associate's Degree | - | - |
| Bachelor's Degree | $86,875 | $38,077 |
| Graduate Degree | $157,813 | $93,500 |
| Total | $125,250 | $0 |
Family Income in South Palm Beach
Family Income Brackets in South Palm Beach
According to the South Palm Beach family income data, there are 155 families falling into the $200,000+ income range, which is the most common income bracket and makes up 42.2% of all families.
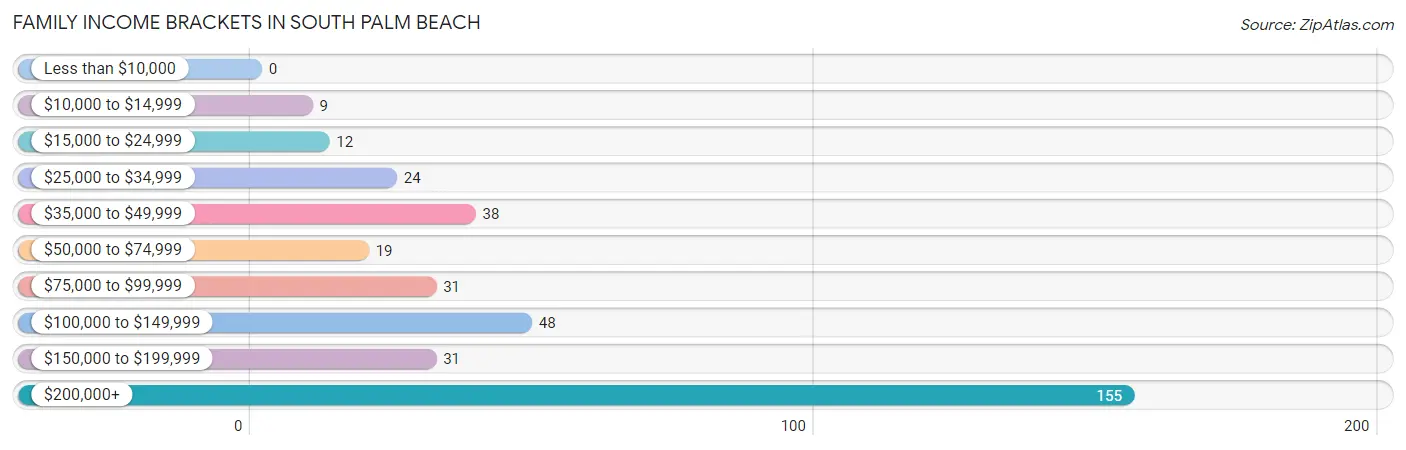
| Income Bracket | # Families | % Families |
| Less than $10,000 | 0 | 0.0% |
| $10,000 to $14,999 | 9 | 2.5% |
| $15,000 to $24,999 | 12 | 3.3% |
| $25,000 to $34,999 | 24 | 6.5% |
| $35,000 to $49,999 | 38 | 10.4% |
| $50,000 to $74,999 | 19 | 5.2% |
| $75,000 to $99,999 | 31 | 8.4% |
| $100,000 to $149,999 | 48 | 13.1% |
| $150,000 to $199,999 | 31 | 8.4% |
| $200,000+ | 155 | 42.2% |
Family Income by Famaliy Size in South Palm Beach
3-person families (58 | 15.8%) account for the highest median family income in South Palm Beach with $225,833 per family, while 3-person families (58 | 15.8%) have the highest median income of $75,278 per family member.
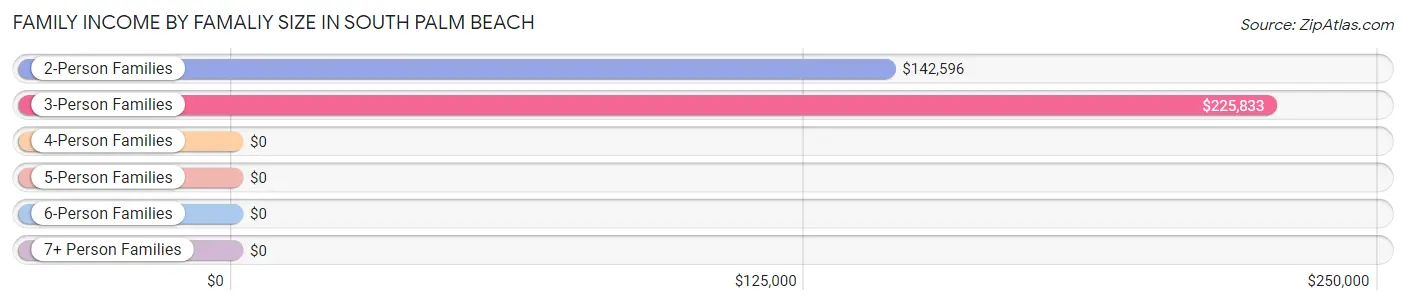
| Income Bracket | # Families | Median Income |
| 2-Person Families | 303 (82.6%) | $142,596 |
| 3-Person Families | 58 (15.8%) | $225,833 |
| 4-Person Families | 6 (1.6%) | $0 |
| 5-Person Families | 0 (0.0%) | $0 |
| 6-Person Families | 0 (0.0%) | $0 |
| 7+ Person Families | 0 (0.0%) | $0 |
| Total | 367 (100.0%) | $166,563 |
Family Income by Number of Earners in South Palm Beach
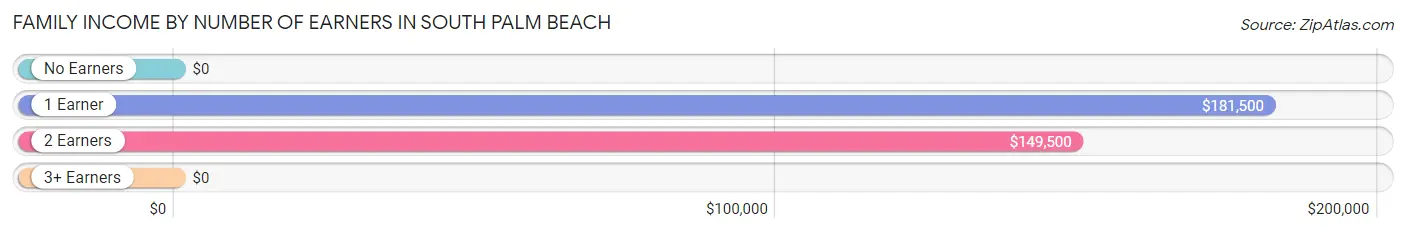
| Number of Earners | # Families | Median Income |
| No Earners | 159 (43.3%) | $0 |
| 1 Earner | 122 (33.2%) | $181,500 |
| 2 Earners | 86 (23.4%) | $149,500 |
| 3+ Earners | 0 (0.0%) | $0 |
| Total | 367 (100.0%) | $166,563 |
Household Income in South Palm Beach
Household Income Brackets in South Palm Beach
With 316 households falling in the category, the $200,000+ income range is the most frequent in South Palm Beach, accounting for 31.8% of all households. In contrast, only 30 households (3.0%) fall into the less than $10,000 income bracket, making it the least populous group.
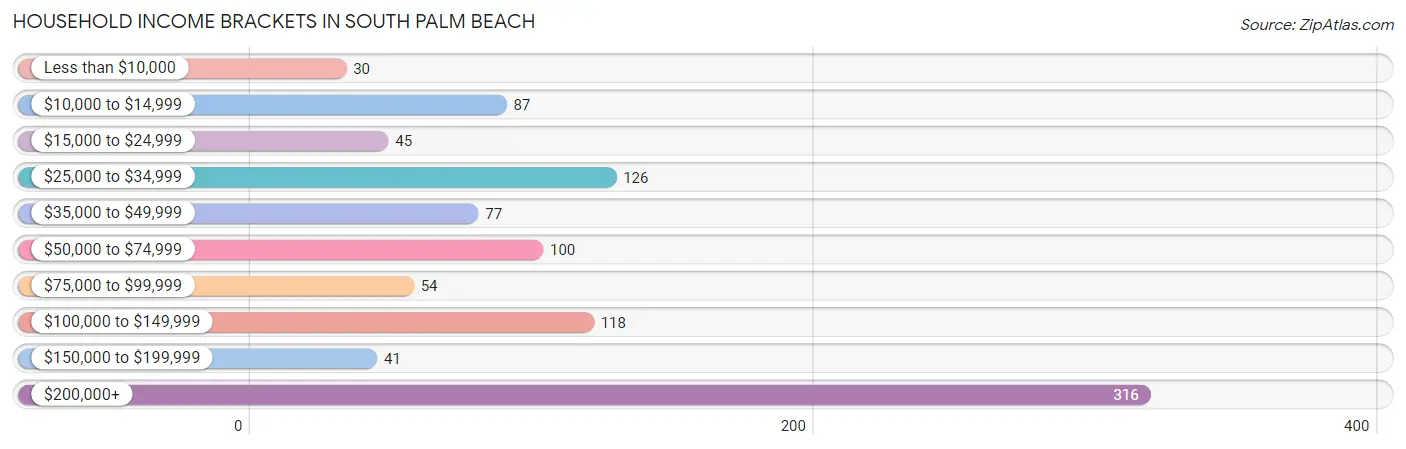
| Income Bracket | # Households | % Households |
| Less than $10,000 | 30 | 3.0% |
| $10,000 to $14,999 | 87 | 8.8% |
| $15,000 to $24,999 | 45 | 4.5% |
| $25,000 to $34,999 | 126 | 12.7% |
| $35,000 to $49,999 | 77 | 7.7% |
| $50,000 to $74,999 | 100 | 10.1% |
| $75,000 to $99,999 | 54 | 5.4% |
| $100,000 to $149,999 | 118 | 11.9% |
| $150,000 to $199,999 | 41 | 4.1% |
| $200,000+ | 316 | 31.8% |
Household Income by Householder Age in South Palm Beach
The median household income in South Palm Beach is $82,917, with the highest median household income of $149,250 found in the 45 to 64 years age bracket for the primary householder. A total of 357 households (35.9%) fall into this category.
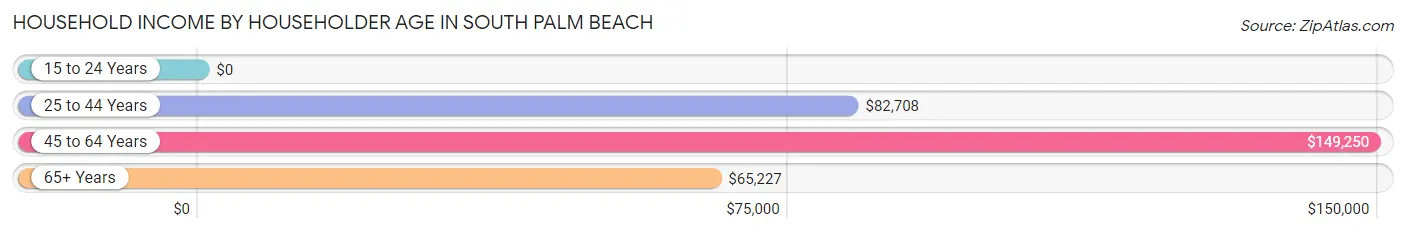
| Income Bracket | # Households | Median Income |
| 15 to 24 Years | 0 (0.0%) | $0 |
| 25 to 44 Years | 79 (8.0%) | $82,708 |
| 45 to 64 Years | 357 (35.9%) | $149,250 |
| 65+ Years | 558 (56.1%) | $65,227 |
| Total | 994 (100.0%) | $82,917 |
Poverty in South Palm Beach
Income Below Poverty by Sex and Age in South Palm Beach
With 5.3% poverty level for males and 14.3% for females among the residents of South Palm Beach, 6 to 11 year old males and 75 year old and over females are the most vulnerable to poverty, with 6 males (31.6%) and 85 females (28.9%) in their respective age groups living below the poverty level.
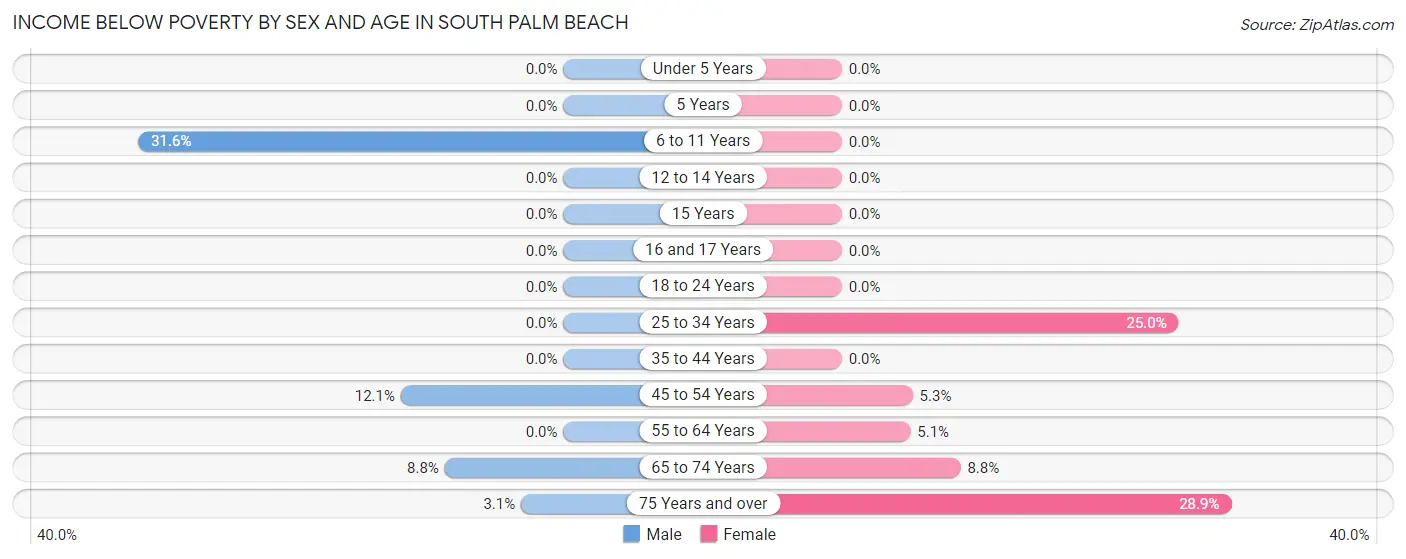
| Age Bracket | Male | Female |
| Under 5 Years | 0 (0.0%) | 0 (0.0%) |
| 5 Years | 0 (0.0%) | 0 (0.0%) |
| 6 to 11 Years | 6 (31.6%) | 0 (0.0%) |
| 12 to 14 Years | 0 (0.0%) | 0 (0.0%) |
| 15 Years | 0 (0.0%) | 0 (0.0%) |
| 16 and 17 Years | 0 (0.0%) | 0 (0.0%) |
| 18 to 24 Years | 0 (0.0%) | 0 (0.0%) |
| 25 to 34 Years | 0 (0.0%) | 12 (25.0%) |
| 35 to 44 Years | 0 (0.0%) | 0 (0.0%) |
| 45 to 54 Years | 7 (12.1%) | 4 (5.3%) |
| 55 to 64 Years | 0 (0.0%) | 11 (5.1%) |
| 65 to 74 Years | 17 (8.8%) | 26 (8.8%) |
| 75 Years and over | 6 (3.1%) | 85 (28.9%) |
| Total | 36 (5.3%) | 138 (14.3%) |
Income Above Poverty by Sex and Age in South Palm Beach
According to the poverty statistics in South Palm Beach, males aged 25 to 34 years and females aged under 5 years are the age groups that are most secure financially, with 100.0% of males and 100.0% of females in these age groups living above the poverty line.
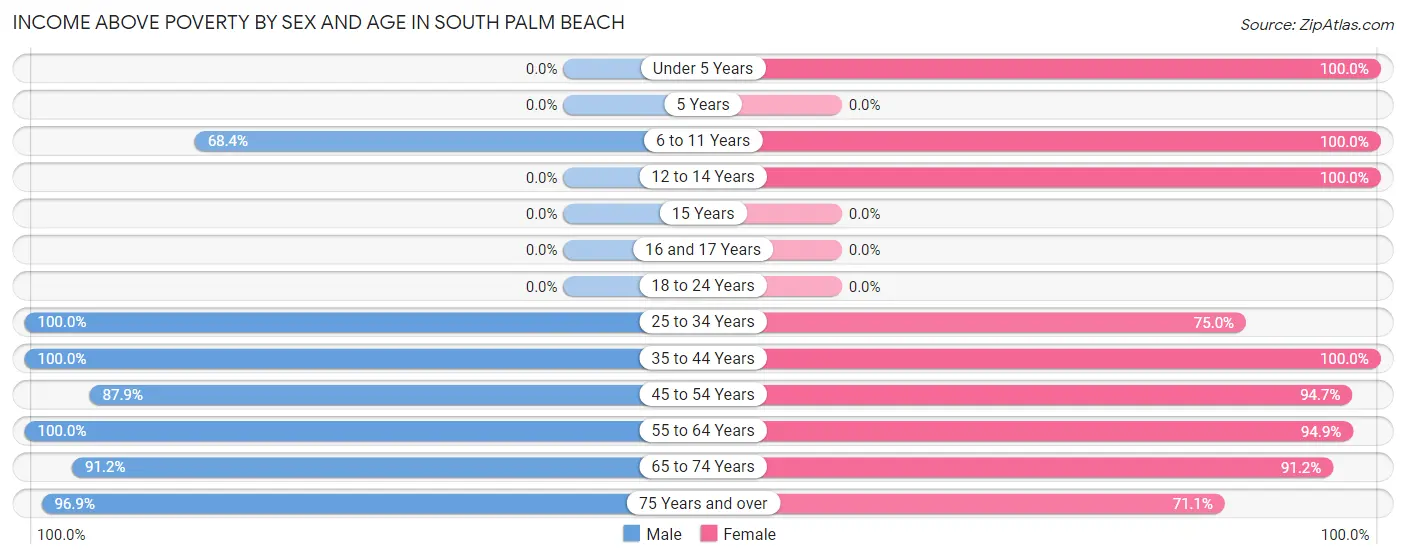
| Age Bracket | Male | Female |
| Under 5 Years | 0 (0.0%) | 8 (100.0%) |
| 5 Years | 0 (0.0%) | 0 (0.0%) |
| 6 to 11 Years | 13 (68.4%) | 6 (100.0%) |
| 12 to 14 Years | 0 (0.0%) | 12 (100.0%) |
| 15 Years | 0 (0.0%) | 0 (0.0%) |
| 16 and 17 Years | 0 (0.0%) | 0 (0.0%) |
| 18 to 24 Years | 0 (0.0%) | 0 (0.0%) |
| 25 to 34 Years | 30 (100.0%) | 36 (75.0%) |
| 35 to 44 Years | 15 (100.0%) | 13 (100.0%) |
| 45 to 54 Years | 51 (87.9%) | 72 (94.7%) |
| 55 to 64 Years | 174 (100.0%) | 205 (94.9%) |
| 65 to 74 Years | 176 (91.2%) | 269 (91.2%) |
| 75 Years and over | 185 (96.9%) | 209 (71.1%) |
| Total | 644 (94.7%) | 830 (85.7%) |
Income Below Poverty Among Married-Couple Families in South Palm Beach
The poverty statistics for married-couple families in South Palm Beach show that 3.8% or 12 of the total 313 families live below the poverty line. Families with no children have the highest poverty rate of 4.1%, comprising of 12 families. On the other hand, families with 1 or 2 children have the lowest poverty rate of 0.0%, which includes 0 families.
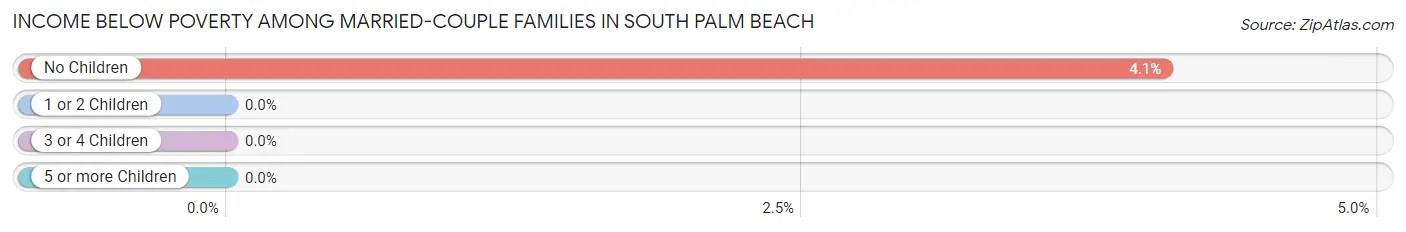
| Children | Above Poverty | Below Poverty |
| No Children | 283 (95.9%) | 12 (4.1%) |
| 1 or 2 Children | 18 (100.0%) | 0 (0.0%) |
| 3 or 4 Children | 0 (0.0%) | 0 (0.0%) |
| 5 or more Children | 0 (0.0%) | 0 (0.0%) |
| Total | 301 (96.2%) | 12 (3.8%) |
Income Below Poverty Among Single-Parent Households in South Palm Beach
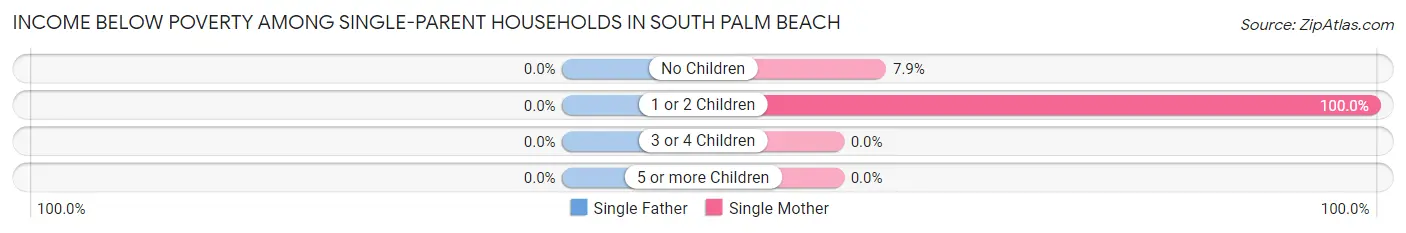
| Children | Single Father | Single Mother |
| No Children | 0 (0.0%) | 3 (7.9%) |
| 1 or 2 Children | 0 (0.0%) | 6 (100.0%) |
| 3 or 4 Children | 0 (0.0%) | 0 (0.0%) |
| 5 or more Children | 0 (0.0%) | 0 (0.0%) |
| Total | 0 (0.0%) | 9 (20.4%) |
Income Below Poverty Among Married-Couple vs Single-Parent Households in South Palm Beach
The poverty data for South Palm Beach shows that 12 of the married-couple family households (3.8%) and 9 of the single-parent households (16.7%) are living below the poverty level. Within the married-couple family households, those with no children have the highest poverty rate, with 12 households (4.1%) falling below the poverty line. Among the single-parent households, those with 1 or 2 children have the highest poverty rate, with 6 household (50.0%) living below poverty.
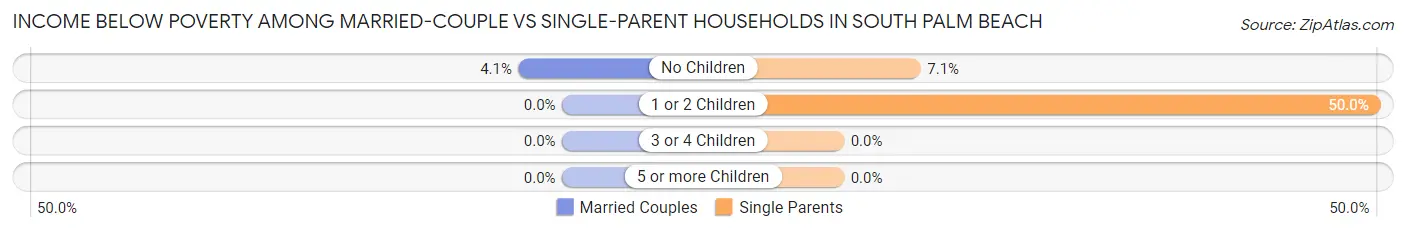
| Children | Married-Couple Families | Single-Parent Households |
| No Children | 12 (4.1%) | 3 (7.1%) |
| 1 or 2 Children | 0 (0.0%) | 6 (50.0%) |
| 3 or 4 Children | 0 (0.0%) | 0 (0.0%) |
| 5 or more Children | 0 (0.0%) | 0 (0.0%) |
| Total | 12 (3.8%) | 9 (16.7%) |
Race in South Palm Beach
The most populous races in South Palm Beach are White / Caucasian (1,511 | 91.7%), Hispanic or Latino (152 | 9.2%), and Asian (63 | 3.8%).
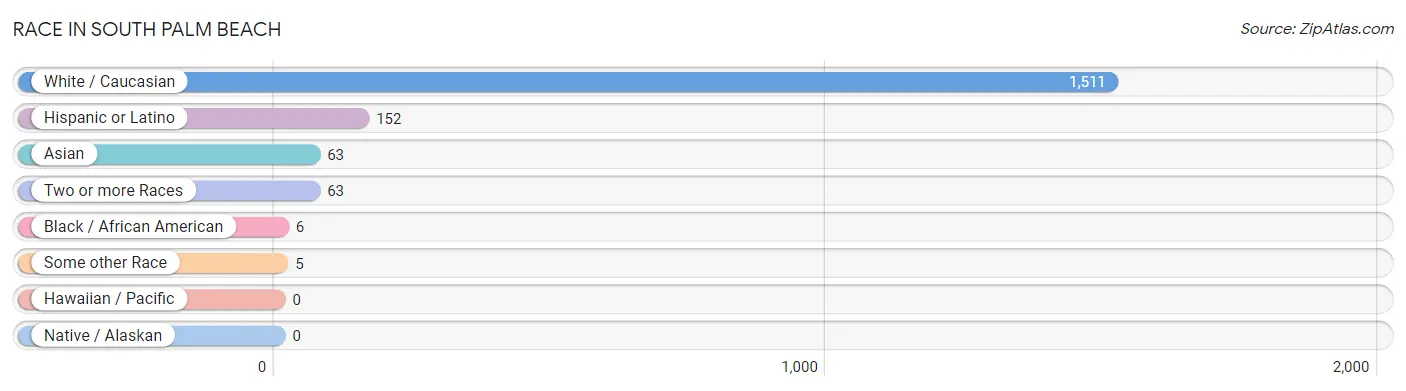
| Race | # Population | % Population |
| Asian | 63 | 3.8% |
| Black / African American | 6 | 0.4% |
| Hawaiian / Pacific | 0 | 0.0% |
| Hispanic or Latino | 152 | 9.2% |
| Native / Alaskan | 0 | 0.0% |
| White / Caucasian | 1,511 | 91.7% |
| Two or more Races | 63 | 3.8% |
| Some other Race | 5 | 0.3% |
| Total | 1,648 | 100.0% |
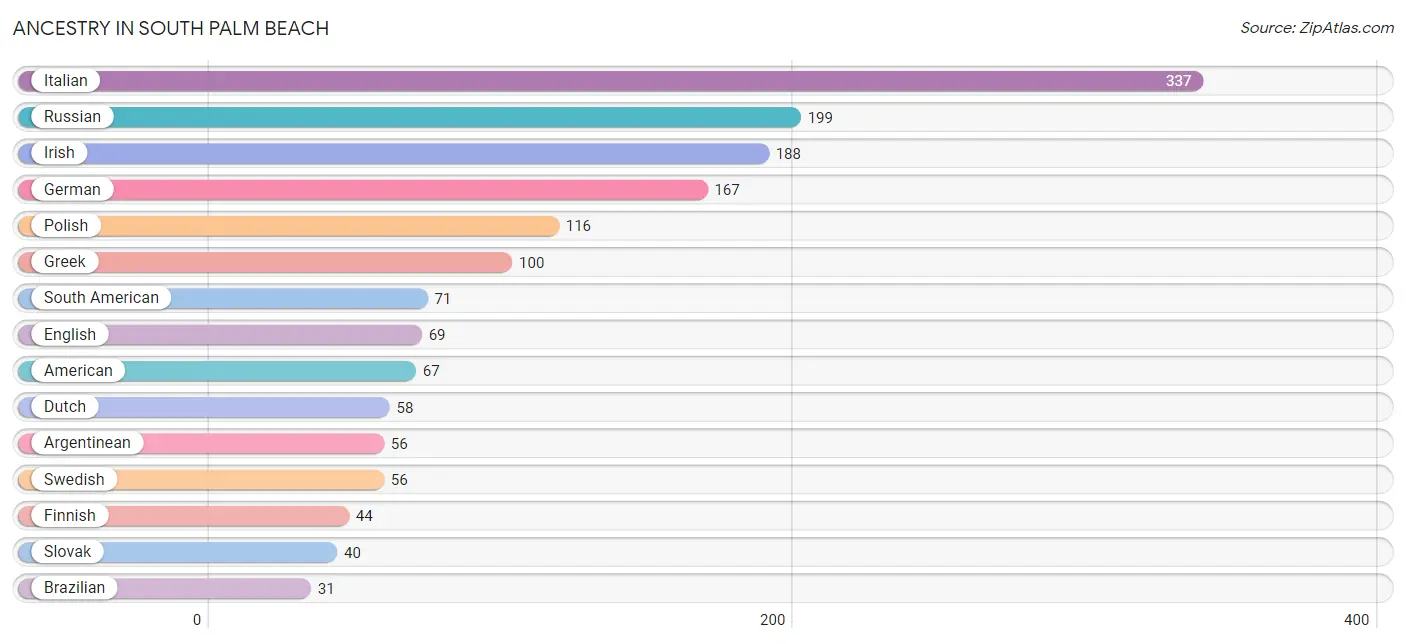
Ancestry in South Palm Beach
The most populous ancestries reported in South Palm Beach are Italian (337 | 20.4%), Russian (199 | 12.1%), Irish (188 | 11.4%), German (167 | 10.1%), and Polish (116 | 7.0%), together accounting for 61.1% of all South Palm Beach residents.
| Ancestry | # Population | % Population |
| American | 67 | 4.1% |
| Arab | 5 | 0.3% |
| Argentinean | 56 | 3.4% |
| Armenian | 6 | 0.4% |
| Australian | 6 | 0.4% |
| Austrian | 11 | 0.7% |
| Brazilian | 31 | 1.9% |
| Canadian | 6 | 0.4% |
| Central American | 6 | 0.4% |
| Chilean | 10 | 0.6% |
| Colombian | 5 | 0.3% |
| Costa Rican | 6 | 0.4% |
| Cuban | 28 | 1.7% |
| Danish | 4 | 0.2% |
| Dutch | 58 | 3.5% |
| Eastern European | 24 | 1.5% |
| English | 69 | 4.2% |
| European | 30 | 1.8% |
| Filipino | 20 | 1.2% |
| Finnish | 44 | 2.7% |
| French | 27 | 1.6% |
| French Canadian | 13 | 0.8% |
| German | 167 | 10.1% |
| Greek | 100 | 6.1% |
| Haitian | 6 | 0.4% |
| Hungarian | 10 | 0.6% |
| Indian (Asian) | 16 | 1.0% |
| Irish | 188 | 11.4% |
| Italian | 337 | 20.4% |
| Korean | 27 | 1.6% |
| Lithuanian | 27 | 1.6% |
| Mexican | 12 | 0.7% |
| Norwegian | 16 | 1.0% |
| Polish | 116 | 7.0% |
| Portuguese | 12 | 0.7% |
| Puerto Rican | 23 | 1.4% |
| Romanian | 17 | 1.0% |
| Russian | 199 | 12.1% |
| Scandinavian | 6 | 0.4% |
| Scotch-Irish | 19 | 1.1% |
| Scottish | 15 | 0.9% |
| Slovak | 40 | 2.4% |
| South American | 71 | 4.3% |
| Spaniard | 5 | 0.3% |
| Swedish | 56 | 3.4% |
| Swiss | 5 | 0.3% |
| Syrian | 5 | 0.3% |
| Welsh | 16 | 1.0% | View All 48 Rows |
Immigrants in South Palm Beach
The most numerous immigrant groups reported in South Palm Beach came from Europe (215 | 13.1%), Asia (158 | 9.6%), Latin America (120 | 7.3%), South America (95 | 5.8%), and Western Asia (95 | 5.8%), together accounting for 41.4% of all South Palm Beach residents.
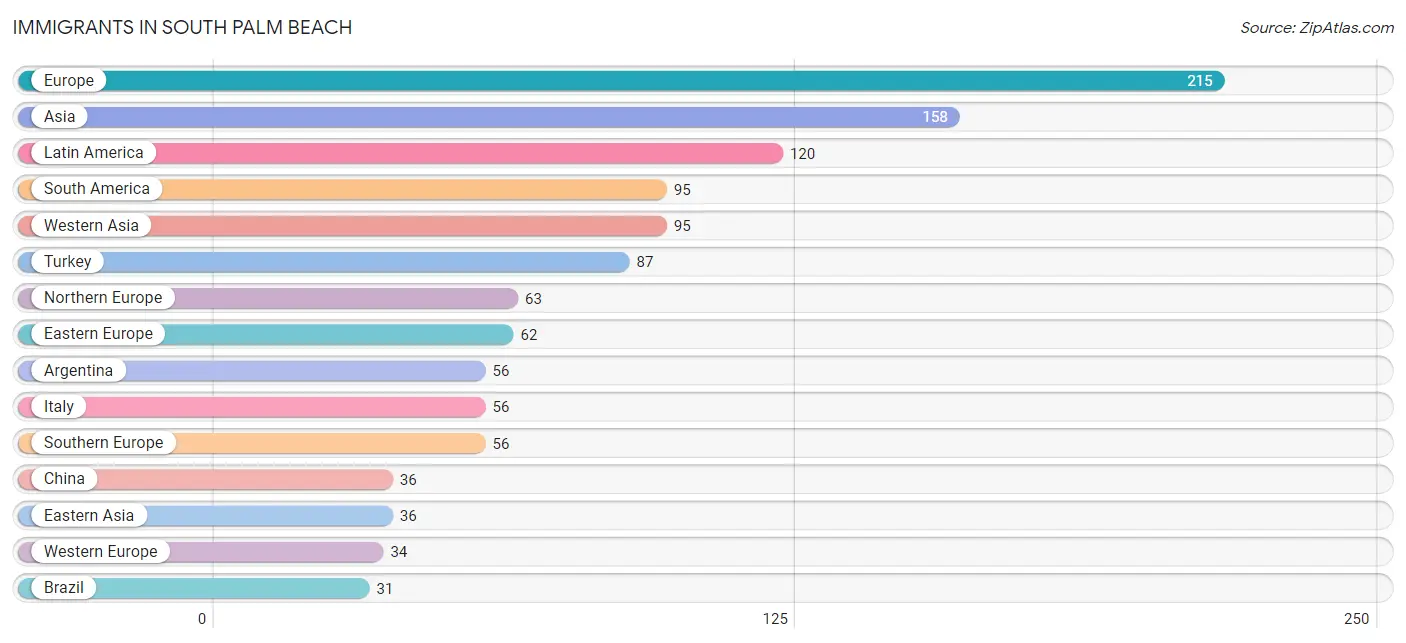
| Immigration Origin | # Population | % Population |
| Argentina | 56 | 3.4% |
| Asia | 158 | 9.6% |
| Australia | 6 | 0.4% |
| Brazil | 31 | 1.9% |
| Canada | 24 | 1.5% |
| Caribbean | 25 | 1.5% |
| Chile | 3 | 0.2% |
| China | 36 | 2.2% |
| Colombia | 5 | 0.3% |
| Cuba | 14 | 0.9% |
| Dominican Republic | 5 | 0.3% |
| Eastern Asia | 36 | 2.2% |
| Eastern Europe | 62 | 3.8% |
| England | 14 | 0.9% |
| Europe | 215 | 13.1% |
| France | 11 | 0.7% |
| Germany | 23 | 1.4% |
| Haiti | 6 | 0.4% |
| Ireland | 5 | 0.3% |
| Italy | 56 | 3.4% |
| Latin America | 120 | 7.3% |
| Lithuania | 5 | 0.3% |
| Northern Europe | 63 | 3.8% |
| Norway | 4 | 0.2% |
| Oceania | 6 | 0.4% |
| Philippines | 27 | 1.6% |
| Poland | 18 | 1.1% |
| Romania | 12 | 0.7% |
| Russia | 10 | 0.6% |
| South America | 95 | 5.8% |
| South Eastern Asia | 27 | 1.6% |
| Southern Europe | 56 | 3.4% |
| Syria | 5 | 0.3% |
| Taiwan | 20 | 1.2% |
| Turkey | 87 | 5.3% |
| Ukraine | 17 | 1.0% |
| Western Asia | 95 | 5.8% |
| Western Europe | 34 | 2.1% | View All 38 Rows |
Sex and Age in South Palm Beach
Sex and Age in South Palm Beach
The most populous age groups in South Palm Beach are 55 to 59 Years (135 | 19.9%) for men and 65 to 69 Years (205 | 21.2%) for women.
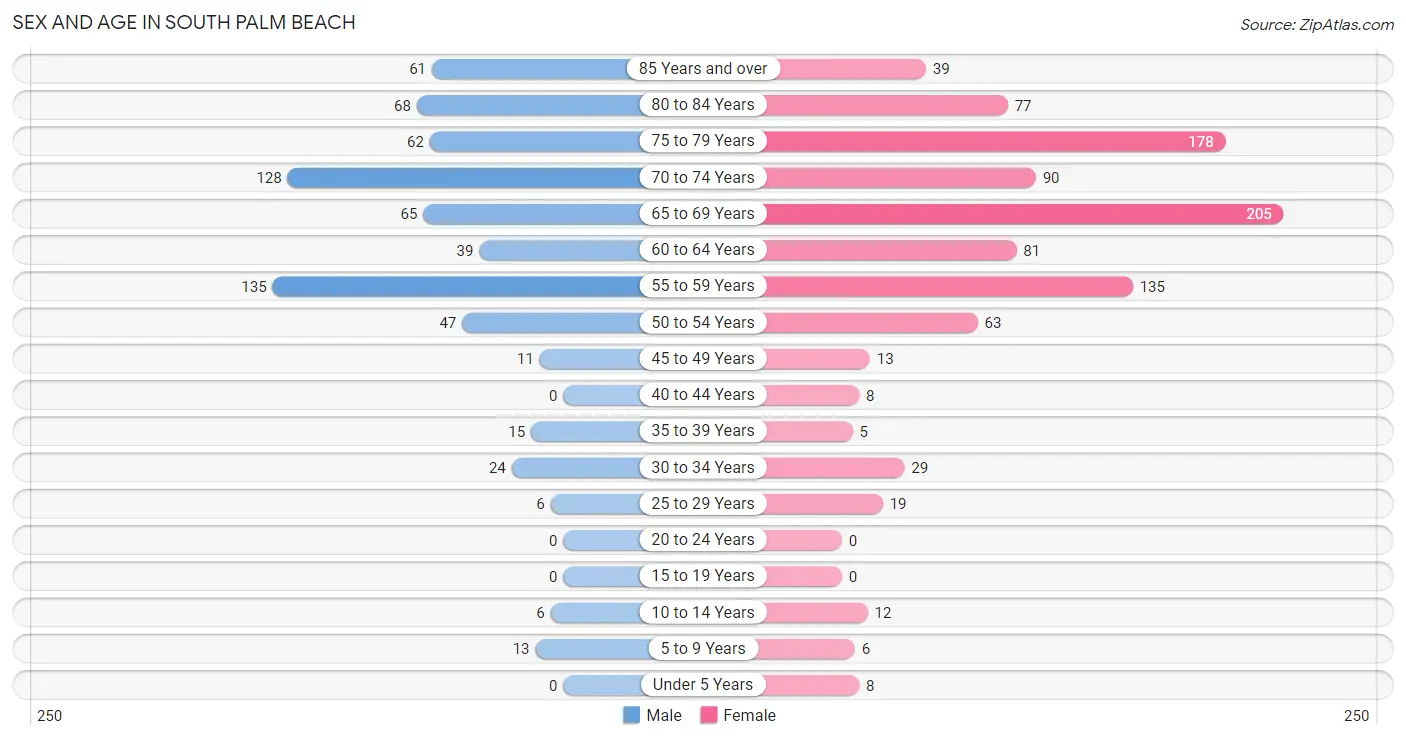
| Age Bracket | Male | Female |
| Under 5 Years | 0 (0.0%) | 8 (0.8%) |
| 5 to 9 Years | 13 (1.9%) | 6 (0.6%) |
| 10 to 14 Years | 6 (0.9%) | 12 (1.2%) |
| 15 to 19 Years | 0 (0.0%) | 0 (0.0%) |
| 20 to 24 Years | 0 (0.0%) | 0 (0.0%) |
| 25 to 29 Years | 6 (0.9%) | 19 (2.0%) |
| 30 to 34 Years | 24 (3.5%) | 29 (3.0%) |
| 35 to 39 Years | 15 (2.2%) | 5 (0.5%) |
| 40 to 44 Years | 0 (0.0%) | 8 (0.8%) |
| 45 to 49 Years | 11 (1.6%) | 13 (1.3%) |
| 50 to 54 Years | 47 (6.9%) | 63 (6.5%) |
| 55 to 59 Years | 135 (19.9%) | 135 (14.0%) |
| 60 to 64 Years | 39 (5.7%) | 81 (8.4%) |
| 65 to 69 Years | 65 (9.6%) | 205 (21.2%) |
| 70 to 74 Years | 128 (18.8%) | 90 (9.3%) |
| 75 to 79 Years | 62 (9.1%) | 178 (18.4%) |
| 80 to 84 Years | 68 (10.0%) | 77 (8.0%) |
| 85 Years and over | 61 (9.0%) | 39 (4.0%) |
| Total | 680 (100.0%) | 968 (100.0%) |
Families and Households in South Palm Beach
Median Family Size in South Palm Beach
The median family size in South Palm Beach is 2.32 persons per family, with single male/father families (10 | 2.7%) accounting for the largest median family size of 3.7 persons per family. On the other hand, married-couple families (313 | 85.3%) represent the smallest median family size with 2.16 persons per family.
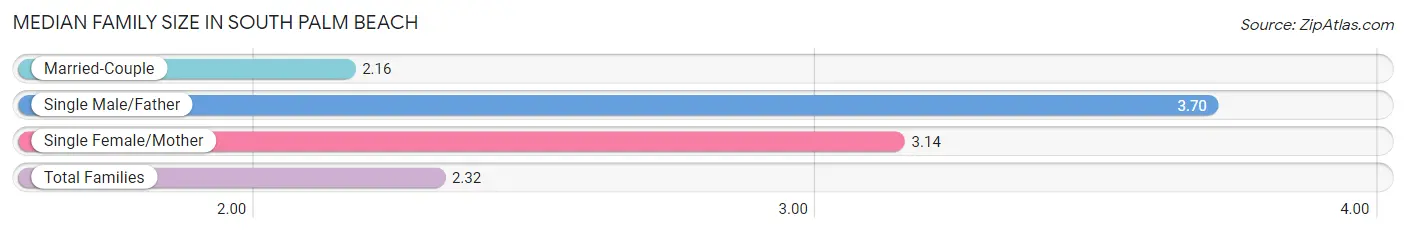
| Family Type | # Families | Family Size |
| Married-Couple | 313 (85.3%) | 2.16 |
| Single Male/Father | 10 (2.7%) | 3.70 |
| Single Female/Mother | 44 (12.0%) | 3.14 |
| Total Families | 367 (100.0%) | 2.32 |
Median Household Size in South Palm Beach
The median household size in South Palm Beach is 1.66 persons per household, with single male/father households (10 | 1.0%) accounting for the largest median household size of 3.7 persons per household. non-family households (627 | 63.1%) represent the smallest median household size with 1.27 persons per household.
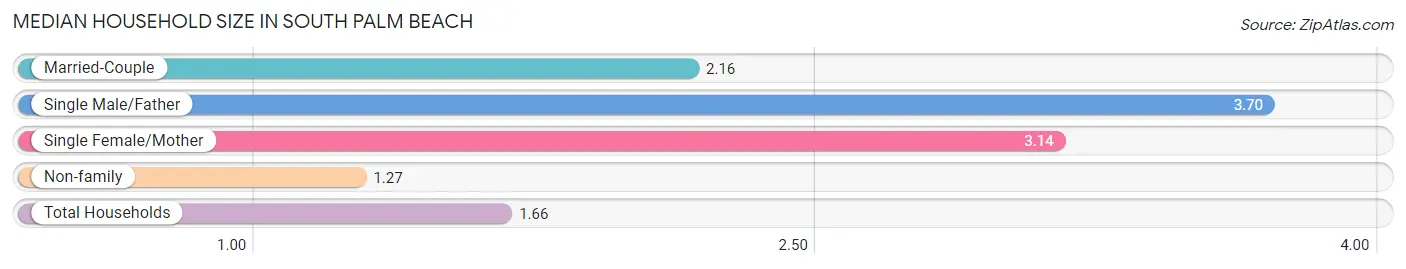
| Household Type | # Households | Household Size |
| Married-Couple | 313 (31.5%) | 2.16 |
| Single Male/Father | 10 (1.0%) | 3.70 |
| Single Female/Mother | 44 (4.4%) | 3.14 |
| Non-family | 627 (63.1%) | 1.27 |
| Total Households | 994 (100.0%) | 1.66 |
Household Size by Marriage Status in South Palm Beach
Out of a total of 994 households in South Palm Beach, 367 (36.9%) are family households, while 627 (63.1%) are nonfamily households. The most numerous type of family households are 2-person households, comprising 303, and the most common type of nonfamily households are 1-person households, comprising 503.
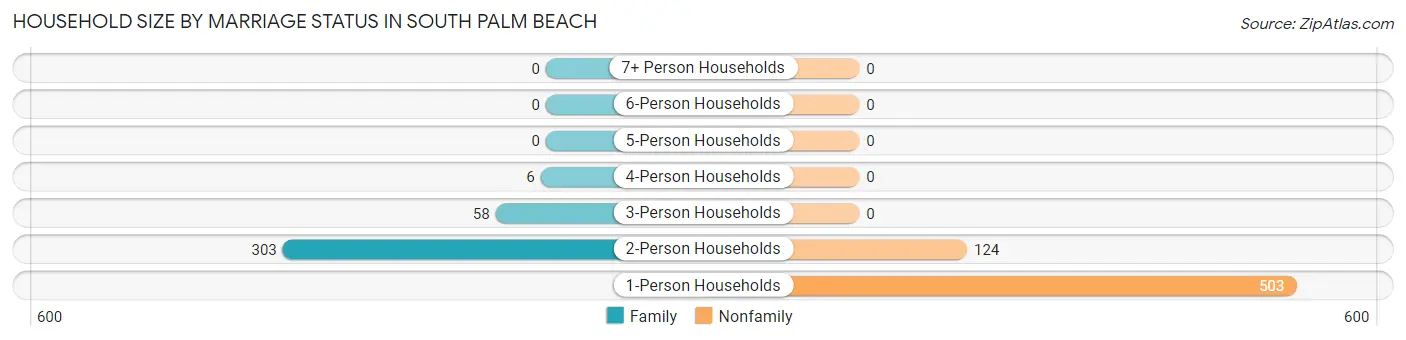
| Household Size | Family Households | Nonfamily Households |
| 1-Person Households | - | 503 (50.6%) |
| 2-Person Households | 303 (30.5%) | 124 (12.5%) |
| 3-Person Households | 58 (5.8%) | 0 (0.0%) |
| 4-Person Households | 6 (0.6%) | 0 (0.0%) |
| 5-Person Households | 0 (0.0%) | 0 (0.0%) |
| 6-Person Households | 0 (0.0%) | 0 (0.0%) |
| 7+ Person Households | 0 (0.0%) | 0 (0.0%) |
| Total | 367 (36.9%) | 627 (63.1%) |
Female Fertility in South Palm Beach
Fertility by Age in South Palm Beach
| Age Bracket | Women with Births | Births / 1,000 Women |
| 15 to 19 years | 0 (0.0%) | 0.0 |
| 20 to 34 years | 0 (0.0%) | 0.0 |
| 35 to 50 years | 0 (0.0%) | 0.0 |
| Total | 0 (0.0%) | 0.0 |
Fertility by Age by Marriage Status in South Palm Beach
| Age Bracket | Married | Unmarried |
| 15 to 19 years | 0 (0.0%) | 0 (0.0%) |
| 20 to 34 years | 0 (0.0%) | 0 (0.0%) |
| 35 to 50 years | 0 (0.0%) | 0 (0.0%) |
| Total | 0 (0.0%) | 0 (0.0%) |
Fertility by Education in South Palm Beach
| Educational Attainment | Women with Births | Births / 1,000 Women |
| Less than High School | 0 (0.0%) | 0.0 |
| High School Diploma | 0 (0.0%) | 0.0 |
| College or Associate's Degree | 0 (0.0%) | 0.0 |
| Bachelor's Degree | 0 (0.0%) | 0.0 |
| Graduate Degree | 0 (0.0%) | 0.0 |
| Total | 0 (0.0%) | 0.0 |
Fertility by Education by Marriage Status in South Palm Beach
| Educational Attainment | Married | Unmarried |
| Less than High School | 0 (0.0%) | 0 (0.0%) |
| High School Diploma | 0 (0.0%) | 0 (0.0%) |
| College or Associate's Degree | 0 (0.0%) | 0 (0.0%) |
| Bachelor's Degree | 0 (0.0%) | 0 (0.0%) |
| Graduate Degree | 0 (0.0%) | 0 (0.0%) |
| Total | 0 (0.0%) | 0 (0.0%) |
Employment Characteristics in South Palm Beach
Employment by Class of Employer in South Palm Beach
Among the 732 employed individuals in South Palm Beach, private company employees (527 | 72.0%), self-employed (not incorporated) (98 | 13.4%), and self-employed (incorporated) (48 | 6.6%) make up the most common classes of employment.
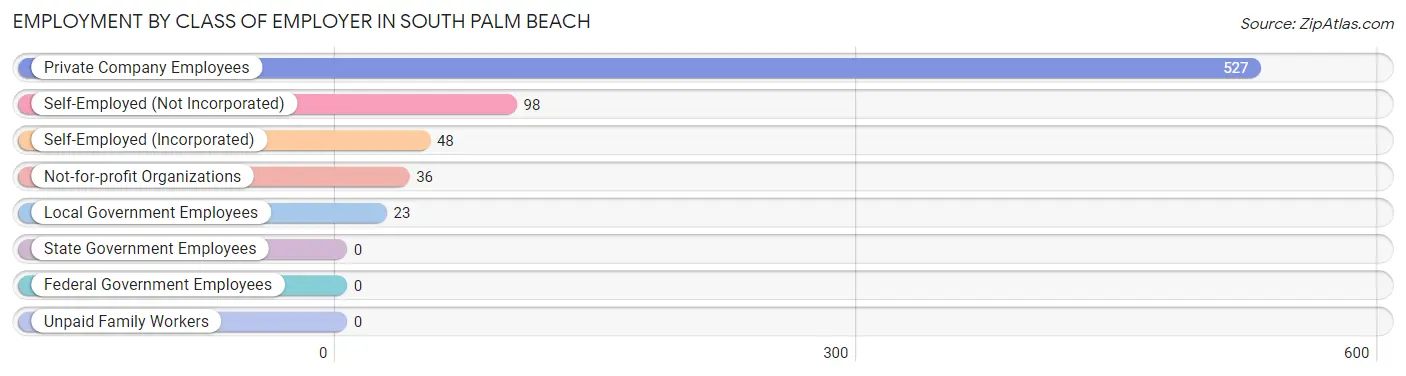
| Employer Class | # Employees | % Employees |
| Private Company Employees | 527 | 72.0% |
| Self-Employed (Incorporated) | 48 | 6.6% |
| Self-Employed (Not Incorporated) | 98 | 13.4% |
| Not-for-profit Organizations | 36 | 4.9% |
| Local Government Employees | 23 | 3.1% |
| State Government Employees | 0 | 0.0% |
| Federal Government Employees | 0 | 0.0% |
| Unpaid Family Workers | 0 | 0.0% |
| Total | 732 | 100.0% |
Employment Status by Age in South Palm Beach
According to the labor force statistics for South Palm Beach, out of the total population over 16 years of age (1,603), 46.8% or 750 individuals are in the labor force, with 1.3% or 10 of them unemployed. The age group with the highest labor force participation rate is 30 to 34 years, with 88.7% or 47 individuals in the labor force. Within the labor force, the 65 to 74 years age range has the highest percentage of unemployed individuals, with 4.1% or 10 of them being unemployed.
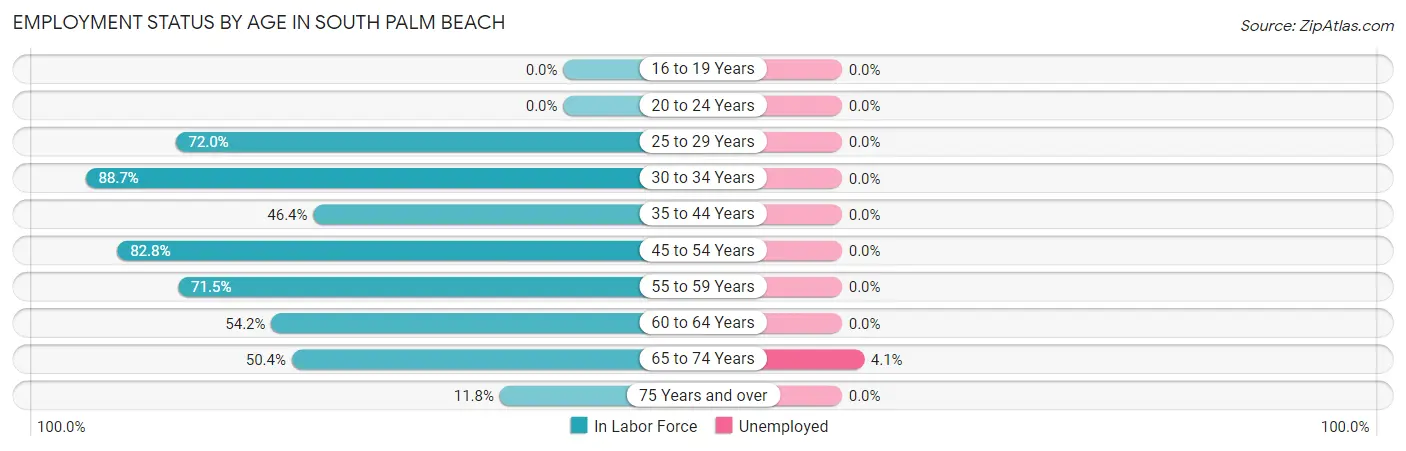
| Age Bracket | In Labor Force | Unemployed |
| 16 to 19 Years | 0 (0.0%) | 0 (0.0%) |
| 20 to 24 Years | 0 (0.0%) | 0 (0.0%) |
| 25 to 29 Years | 18 (72.0%) | 0 (0.0%) |
| 30 to 34 Years | 47 (88.7%) | 0 (0.0%) |
| 35 to 44 Years | 13 (46.4%) | 0 (0.0%) |
| 45 to 54 Years | 111 (82.8%) | 0 (0.0%) |
| 55 to 59 Years | 193 (71.5%) | 0 (0.0%) |
| 60 to 64 Years | 65 (54.2%) | 0 (0.0%) |
| 65 to 74 Years | 246 (50.4%) | 10 (4.1%) |
| 75 Years and over | 57 (11.8%) | 0 (0.0%) |
| Total | 750 (46.8%) | 10 (1.3%) |
Employment Status by Educational Attainment in South Palm Beach
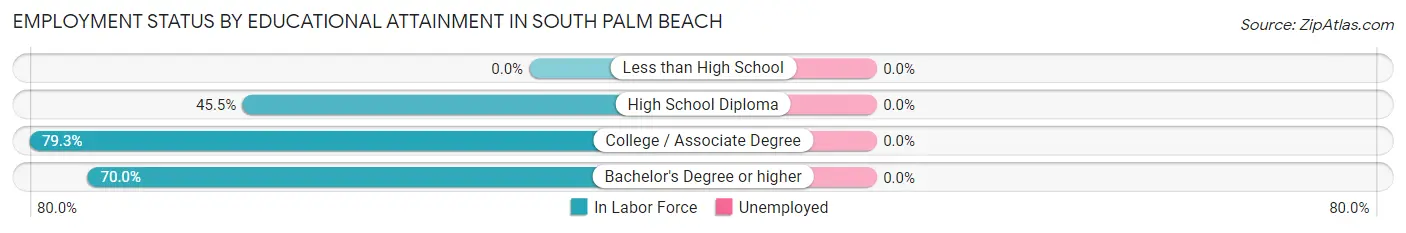
| Educational Attainment | In Labor Force | Unemployed |
| Less than High School | 0 (0.0%) | 0 (0.0%) |
| High School Diploma | 25 (45.5%) | 0 (0.0%) |
| College / Associate Degree | 203 (79.3%) | 0 (0.0%) |
| Bachelor's Degree or higher | 219 (70.0%) | 0 (0.0%) |
| Total | 447 (71.0%) | 0 (0.0%) |
Employment Occupations by Sex in South Palm Beach
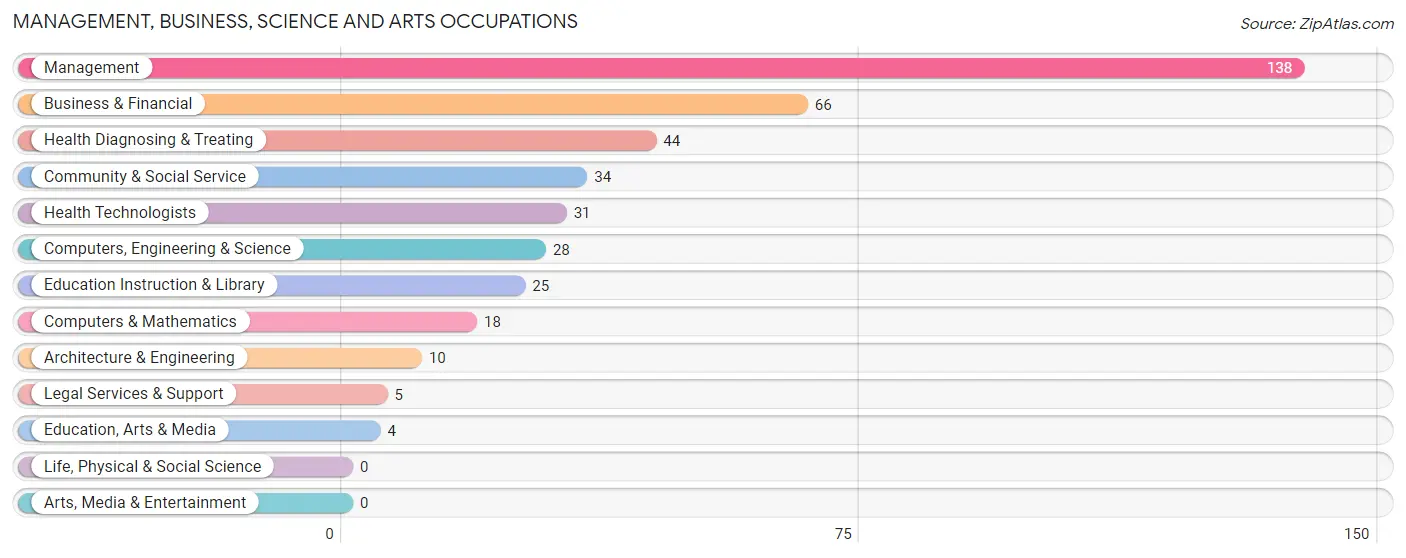
Management, Business, Science and Arts Occupations
The most common Management, Business, Science and Arts occupations in South Palm Beach are Management (138 | 18.6%), Business & Financial (66 | 8.9%), Health Diagnosing & Treating (44 | 5.9%), Community & Social Service (34 | 4.6%), and Health Technologists (31 | 4.2%).
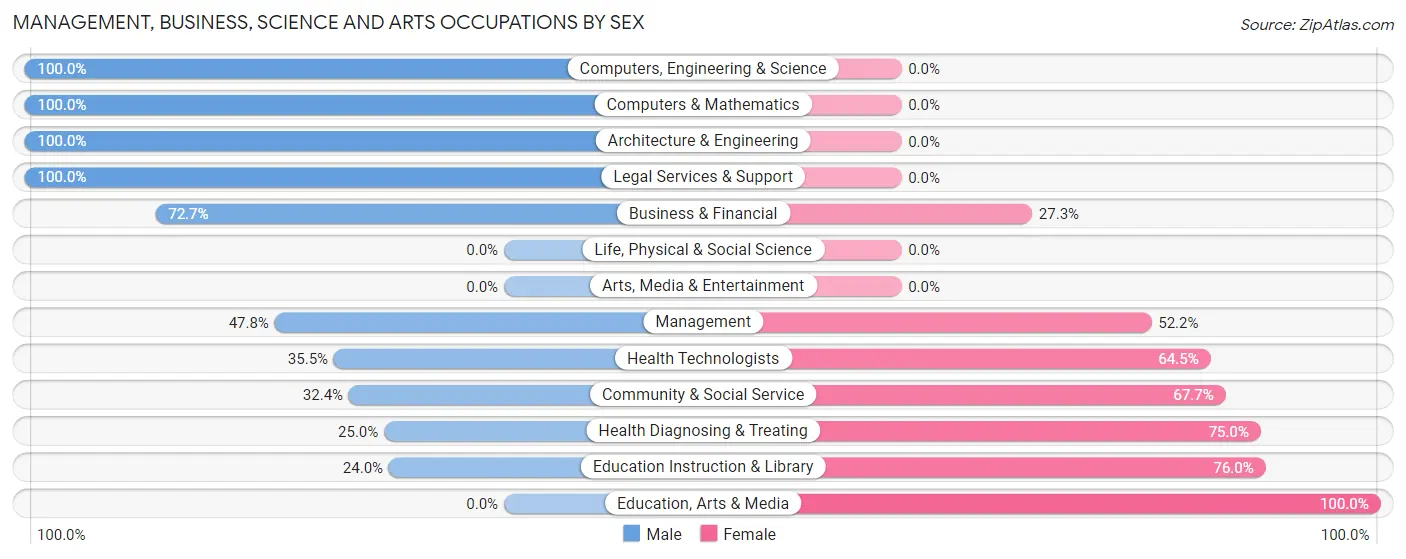
Management, Business, Science and Arts Occupations by Sex
Within the Management, Business, Science and Arts occupations in South Palm Beach, the most male-oriented occupations are Computers, Engineering & Science (100.0%), Computers & Mathematics (100.0%), and Architecture & Engineering (100.0%), while the most female-oriented occupations are Education, Arts & Media (100.0%), Education Instruction & Library (76.0%), and Health Diagnosing & Treating (75.0%).
| Occupation | Male | Female |
| Management | 66 (47.8%) | 72 (52.2%) |
| Business & Financial | 48 (72.7%) | 18 (27.3%) |
| Computers, Engineering & Science | 28 (100.0%) | 0 (0.0%) |
| Computers & Mathematics | 18 (100.0%) | 0 (0.0%) |
| Architecture & Engineering | 10 (100.0%) | 0 (0.0%) |
| Life, Physical & Social Science | 0 (0.0%) | 0 (0.0%) |
| Community & Social Service | 11 (32.4%) | 23 (67.6%) |
| Education, Arts & Media | 0 (0.0%) | 4 (100.0%) |
| Legal Services & Support | 5 (100.0%) | 0 (0.0%) |
| Education Instruction & Library | 6 (24.0%) | 19 (76.0%) |
| Arts, Media & Entertainment | 0 (0.0%) | 0 (0.0%) |
| Health Diagnosing & Treating | 11 (25.0%) | 33 (75.0%) |
| Health Technologists | 11 (35.5%) | 20 (64.5%) |
| Total (Category) | 164 (52.9%) | 146 (47.1%) |
| Total (Overall) | 362 (48.9%) | 378 (51.1%) |
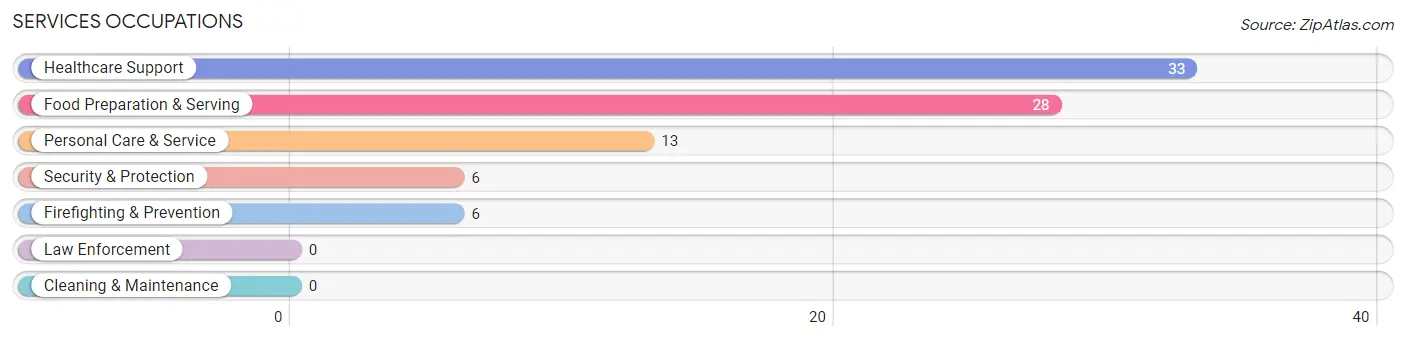
Services Occupations
The most common Services occupations in South Palm Beach are Healthcare Support (33 | 4.5%), Food Preparation & Serving (28 | 3.8%), Personal Care & Service (13 | 1.8%), Security & Protection (6 | 0.8%), and Firefighting & Prevention (6 | 0.8%).
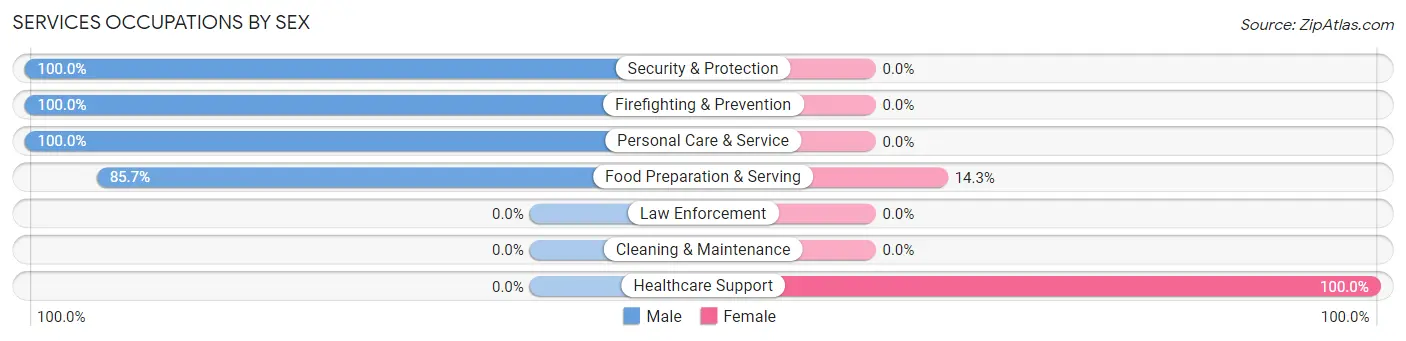
Services Occupations by Sex
Within the Services occupations in South Palm Beach, the most male-oriented occupations are Security & Protection (100.0%), Firefighting & Prevention (100.0%), and Personal Care & Service (100.0%), while the most female-oriented occupations are Healthcare Support (100.0%), and Food Preparation & Serving (14.3%).
| Occupation | Male | Female |
| Healthcare Support | 0 (0.0%) | 33 (100.0%) |
| Security & Protection | 6 (100.0%) | 0 (0.0%) |
| Firefighting & Prevention | 6 (100.0%) | 0 (0.0%) |
| Law Enforcement | 0 (0.0%) | 0 (0.0%) |
| Food Preparation & Serving | 24 (85.7%) | 4 (14.3%) |
| Cleaning & Maintenance | 0 (0.0%) | 0 (0.0%) |
| Personal Care & Service | 13 (100.0%) | 0 (0.0%) |
| Total (Category) | 43 (53.7%) | 37 (46.3%) |
| Total (Overall) | 362 (48.9%) | 378 (51.1%) |
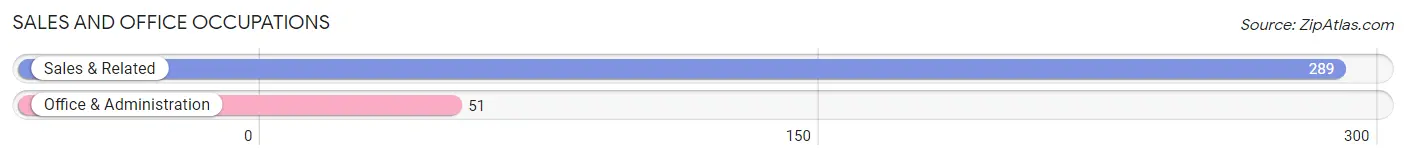
Sales and Office Occupations
The most common Sales and Office occupations in South Palm Beach are Sales & Related (289 | 39.1%), and Office & Administration (51 | 6.9%).
Sales and Office Occupations by Sex
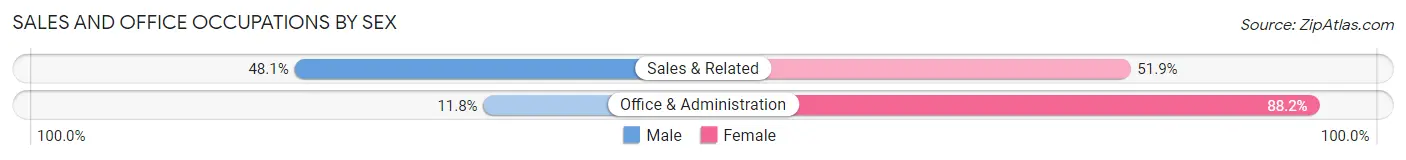
| Occupation | Male | Female |
| Sales & Related | 139 (48.1%) | 150 (51.9%) |
| Office & Administration | 6 (11.8%) | 45 (88.2%) |
| Total (Category) | 145 (42.6%) | 195 (57.4%) |
| Total (Overall) | 362 (48.9%) | 378 (51.1%) |
Natural Resources, Construction and Maintenance Occupations
Natural Resources, Construction and Maintenance Occupations by Sex
| Occupation | Male | Female |
| Farming, Fishing & Forestry | 0 (0.0%) | 0 (0.0%) |
| Construction & Extraction | 0 (0.0%) | 0 (0.0%) |
| Installation, Maintenance & Repair | 0 (0.0%) | 0 (0.0%) |
| Total (Category) | 0 (0.0%) | 0 (0.0%) |
| Total (Overall) | 362 (48.9%) | 378 (51.1%) |
Production, Transportation and Moving Occupations
The most common Production, Transportation and Moving occupations in South Palm Beach are Production (5 | 0.7%), and Transportation (5 | 0.7%).
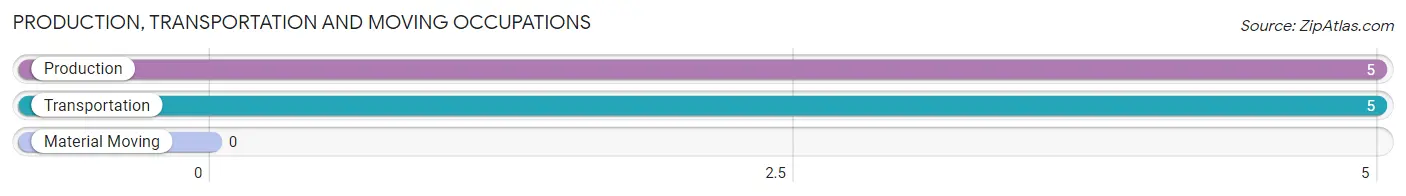
Production, Transportation and Moving Occupations by Sex
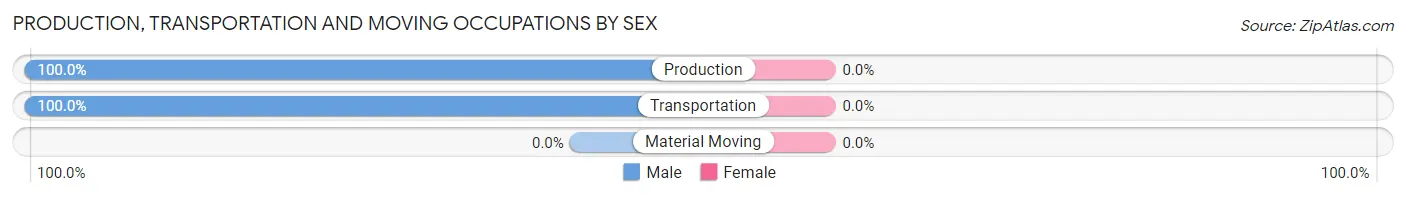
| Occupation | Male | Female |
| Production | 5 (100.0%) | 0 (0.0%) |
| Transportation | 5 (100.0%) | 0 (0.0%) |
| Material Moving | 0 (0.0%) | 0 (0.0%) |
| Total (Category) | 10 (100.0%) | 0 (0.0%) |
| Total (Overall) | 362 (48.9%) | 378 (51.1%) |
Employment Industries by Sex in South Palm Beach
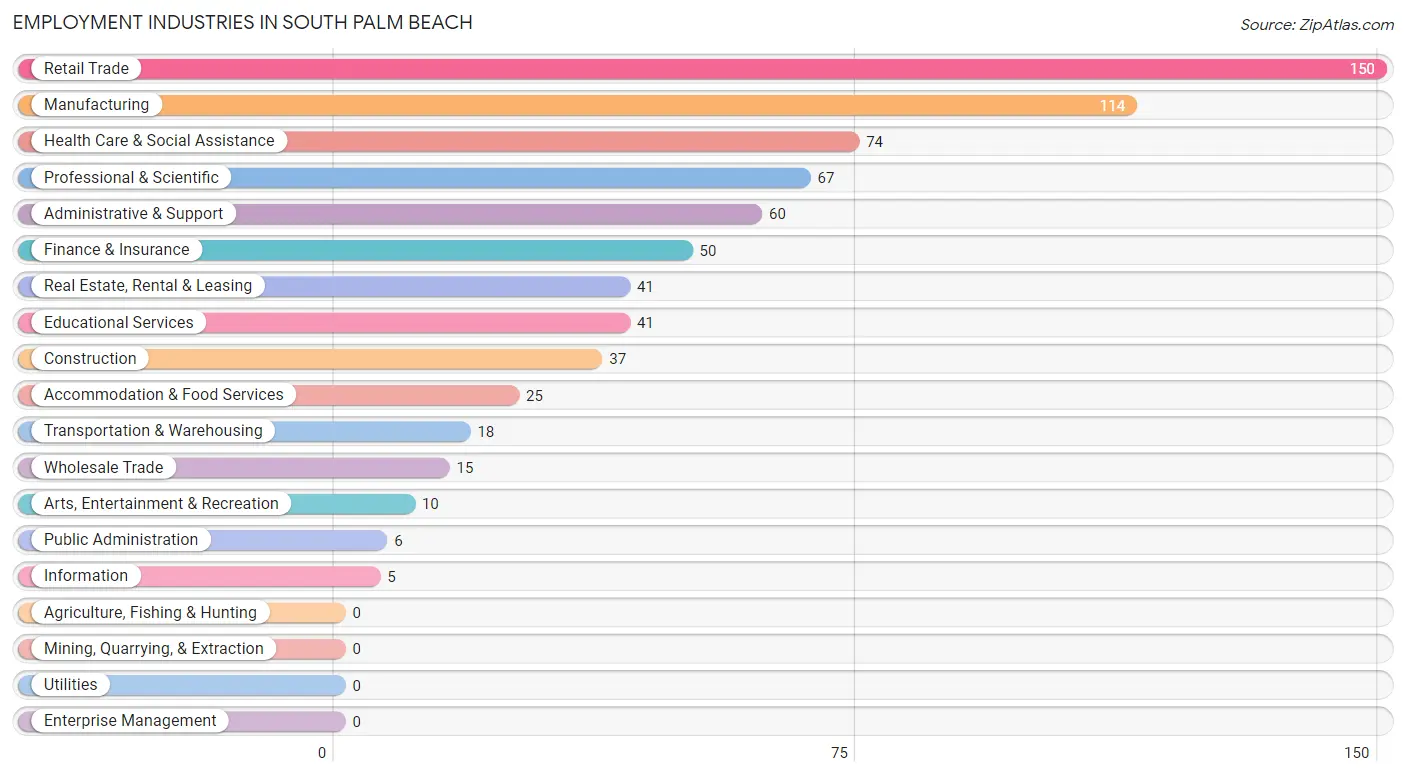
Employment Industries in South Palm Beach
The major employment industries in South Palm Beach include Retail Trade (150 | 20.3%), Manufacturing (114 | 15.4%), Health Care & Social Assistance (74 | 10.0%), Professional & Scientific (67 | 9.0%), and Administrative & Support (60 | 8.1%).
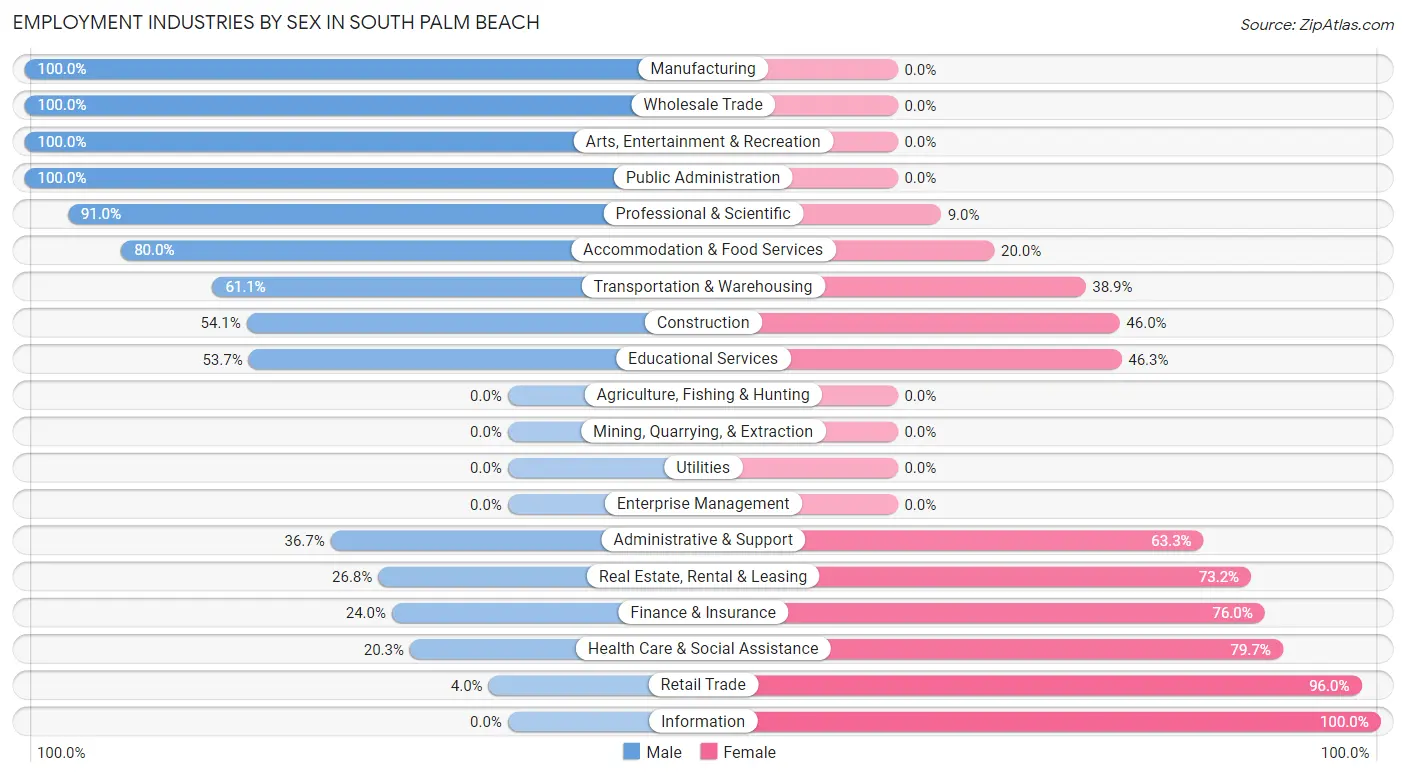
Employment Industries by Sex in South Palm Beach
The South Palm Beach industries that see more men than women are Manufacturing (100.0%), Wholesale Trade (100.0%), and Arts, Entertainment & Recreation (100.0%), whereas the industries that tend to have a higher number of women are Information (100.0%), Retail Trade (96.0%), and Health Care & Social Assistance (79.7%).
| Industry | Male | Female |
| Agriculture, Fishing & Hunting | 0 (0.0%) | 0 (0.0%) |
| Mining, Quarrying, & Extraction | 0 (0.0%) | 0 (0.0%) |
| Construction | 20 (54.0%) | 17 (46.0%) |
| Manufacturing | 114 (100.0%) | 0 (0.0%) |
| Wholesale Trade | 15 (100.0%) | 0 (0.0%) |
| Retail Trade | 6 (4.0%) | 144 (96.0%) |
| Transportation & Warehousing | 11 (61.1%) | 7 (38.9%) |
| Utilities | 0 (0.0%) | 0 (0.0%) |
| Information | 0 (0.0%) | 5 (100.0%) |
| Finance & Insurance | 12 (24.0%) | 38 (76.0%) |
| Real Estate, Rental & Leasing | 11 (26.8%) | 30 (73.2%) |
| Professional & Scientific | 61 (91.0%) | 6 (9.0%) |
| Enterprise Management | 0 (0.0%) | 0 (0.0%) |
| Administrative & Support | 22 (36.7%) | 38 (63.3%) |
| Educational Services | 22 (53.7%) | 19 (46.3%) |
| Health Care & Social Assistance | 15 (20.3%) | 59 (79.7%) |
| Arts, Entertainment & Recreation | 10 (100.0%) | 0 (0.0%) |
| Accommodation & Food Services | 20 (80.0%) | 5 (20.0%) |
| Public Administration | 6 (100.0%) | 0 (0.0%) |
| Total | 362 (48.9%) | 378 (51.1%) |
Education in South Palm Beach
School Enrollment in South Palm Beach
The most common levels of schooling among the 73 students in South Palm Beach are middle school (18 | 24.7%), college / undergraduate (15 | 20.5%), and elementary school (13 | 17.8%).
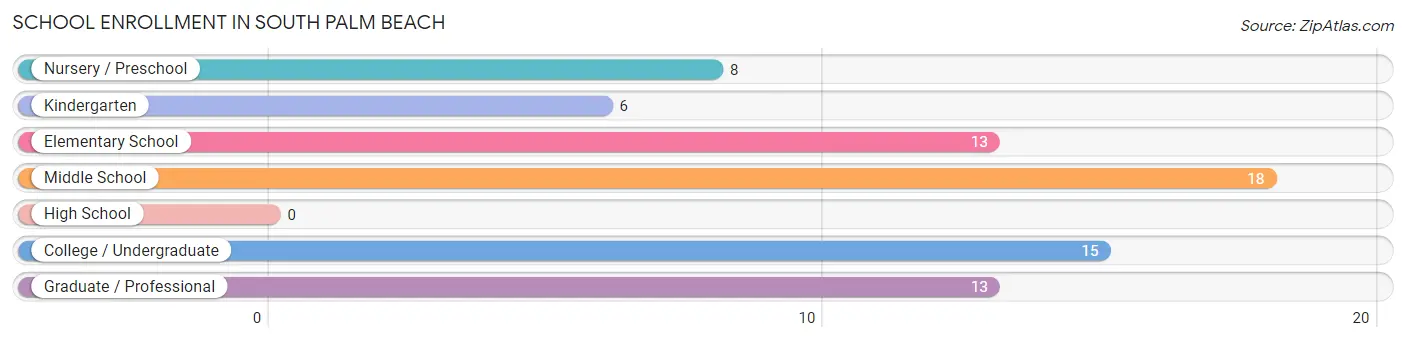
| School Level | # Students | % Students |
| Nursery / Preschool | 8 | 11.0% |
| Kindergarten | 6 | 8.2% |
| Elementary School | 13 | 17.8% |
| Middle School | 18 | 24.7% |
| High School | 0 | 0.0% |
| College / Undergraduate | 15 | 20.5% |
| Graduate / Professional | 13 | 17.8% |
| Total | 73 | 100.0% |
School Enrollment by Age by Funding Source in South Palm Beach
Out of a total of 73 students who are enrolled in schools in South Palm Beach, 12 (16.4%) attend a private institution, while the remaining 61 (83.6%) are enrolled in public schools. The age group of 25 to 34 year olds has the highest likelihood of being enrolled in private schools, with 6 (46.2% in the age bracket) enrolled. Conversely, the age group of 3 to 4 year olds has the lowest likelihood of being enrolled in a private school, with 8 (100.0% in the age bracket) attending a public institution.
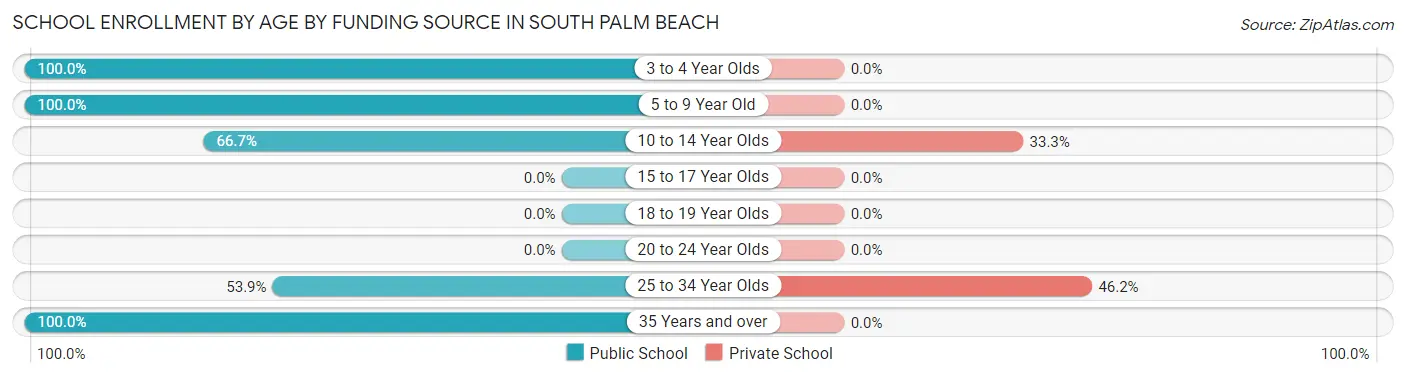
| Age Bracket | Public School | Private School |
| 3 to 4 Year Olds | 8 (100.0%) | 0 (0.0%) |
| 5 to 9 Year Old | 19 (100.0%) | 0 (0.0%) |
| 10 to 14 Year Olds | 12 (66.7%) | 6 (33.3%) |
| 15 to 17 Year Olds | 0 (0.0%) | 0 (0.0%) |
| 18 to 19 Year Olds | 0 (0.0%) | 0 (0.0%) |
| 20 to 24 Year Olds | 0 (0.0%) | 0 (0.0%) |
| 25 to 34 Year Olds | 7 (53.8%) | 6 (46.2%) |
| 35 Years and over | 15 (100.0%) | 0 (0.0%) |
| Total | 61 (83.6%) | 12 (16.4%) |
Educational Attainment by Field of Study in South Palm Beach
Business (126 | 16.6%), education (123 | 16.2%), science & technology (105 | 13.8%), engineering (99 | 13.0%), and literature & languages (56 | 7.4%) are the most common fields of study among 761 individuals in South Palm Beach who have obtained a bachelor's degree or higher.
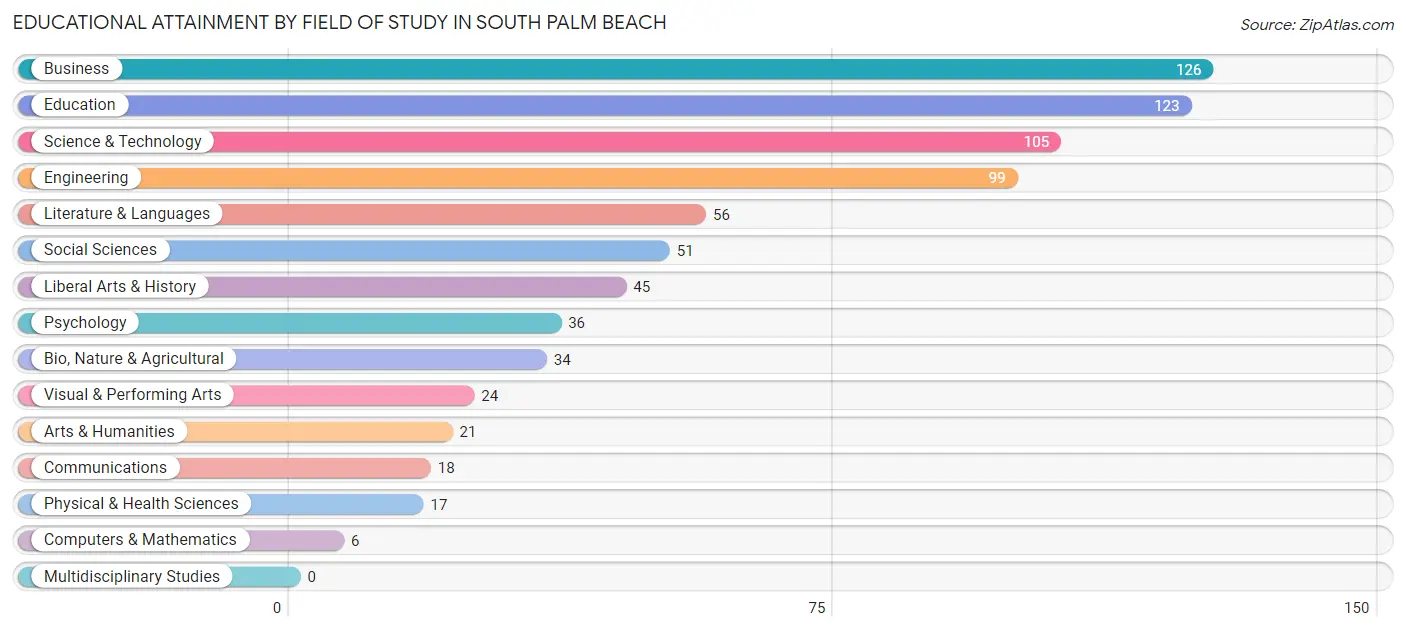
| Field of Study | # Graduates | % Graduates |
| Computers & Mathematics | 6 | 0.8% |
| Bio, Nature & Agricultural | 34 | 4.5% |
| Physical & Health Sciences | 17 | 2.2% |
| Psychology | 36 | 4.7% |
| Social Sciences | 51 | 6.7% |
| Engineering | 99 | 13.0% |
| Multidisciplinary Studies | 0 | 0.0% |
| Science & Technology | 105 | 13.8% |
| Business | 126 | 16.6% |
| Education | 123 | 16.2% |
| Literature & Languages | 56 | 7.4% |
| Liberal Arts & History | 45 | 5.9% |
| Visual & Performing Arts | 24 | 3.2% |
| Communications | 18 | 2.4% |
| Arts & Humanities | 21 | 2.8% |
| Total | 761 | 100.0% |
Transportation & Commute in South Palm Beach
Vehicle Availability by Sex in South Palm Beach
The most prevalent vehicle ownership categories in South Palm Beach are males with 2 vehicles (220, accounting for 60.8%) and females with 2 vehicles (222, making up 59.5%).
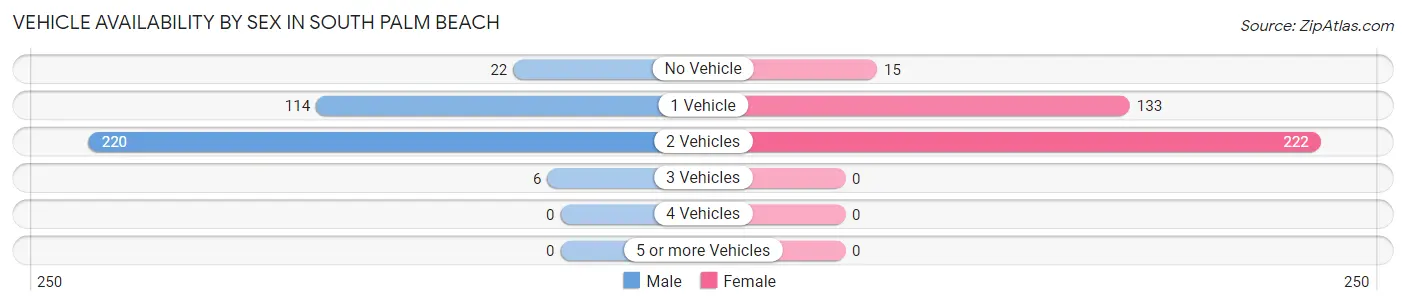
| Vehicles Available | Male | Female |
| No Vehicle | 22 (6.1%) | 15 (4.1%) |
| 1 Vehicle | 114 (31.5%) | 133 (35.9%) |
| 2 Vehicles | 220 (60.8%) | 222 (60.0%) |
| 3 Vehicles | 6 (1.7%) | 0 (0.0%) |
| 4 Vehicles | 0 (0.0%) | 0 (0.0%) |
| 5 or more Vehicles | 0 (0.0%) | 0 (0.0%) |
| Total | 362 (100.0%) | 370 (100.0%) |
Commute Time in South Palm Beach
The most frequently occuring commute durations in South Palm Beach are 60 to 89 minutes (128 commuters, 23.9%), 15 to 19 minutes (74 commuters, 13.8%), and 30 to 34 minutes (66 commuters, 12.3%).
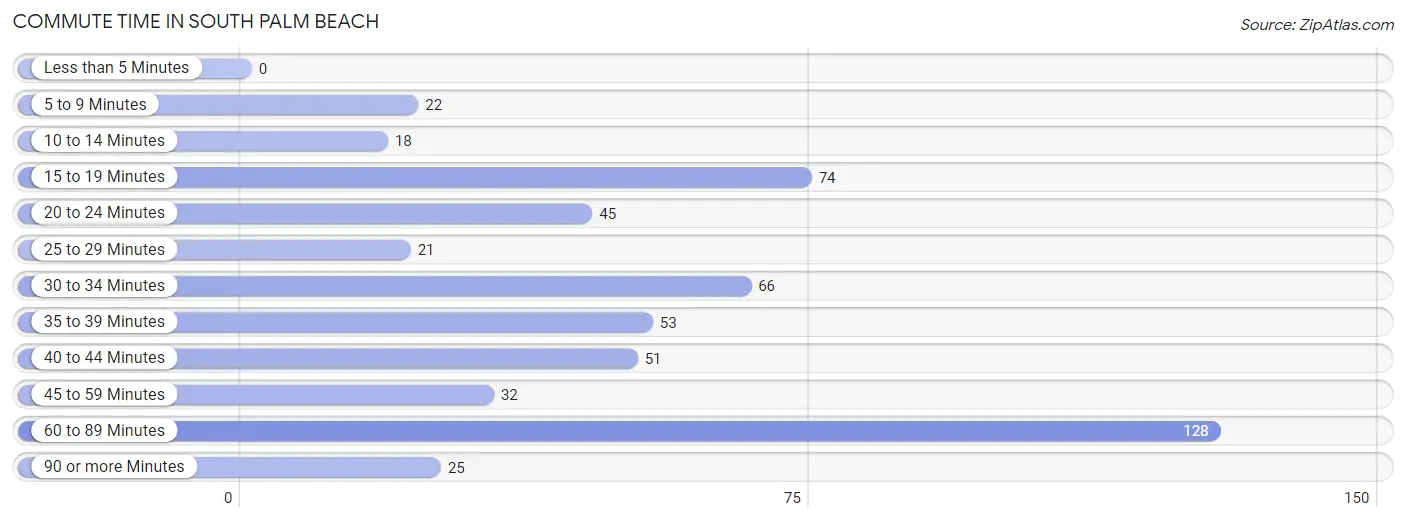
| Commute Time | # Commuters | % Commuters |
| Less than 5 Minutes | 0 | 0.0% |
| 5 to 9 Minutes | 22 | 4.1% |
| 10 to 14 Minutes | 18 | 3.4% |
| 15 to 19 Minutes | 74 | 13.8% |
| 20 to 24 Minutes | 45 | 8.4% |
| 25 to 29 Minutes | 21 | 3.9% |
| 30 to 34 Minutes | 66 | 12.3% |
| 35 to 39 Minutes | 53 | 9.9% |
| 40 to 44 Minutes | 51 | 9.5% |
| 45 to 59 Minutes | 32 | 6.0% |
| 60 to 89 Minutes | 128 | 23.9% |
| 90 or more Minutes | 25 | 4.7% |
Commute Time by Sex in South Palm Beach
The most common commute times in South Palm Beach are 40 to 44 minutes (47 commuters, 21.9%) for males and 60 to 89 minutes (128 commuters, 40.0%) for females.
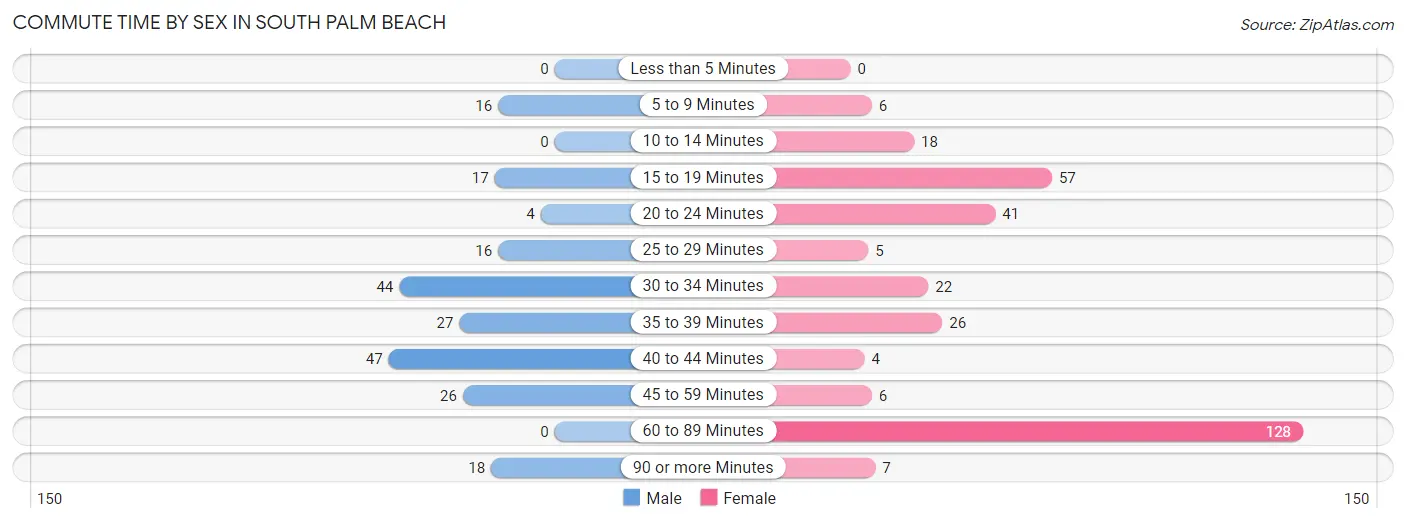
| Commute Time | Male | Female |
| Less than 5 Minutes | 0 (0.0%) | 0 (0.0%) |
| 5 to 9 Minutes | 16 (7.4%) | 6 (1.9%) |
| 10 to 14 Minutes | 0 (0.0%) | 18 (5.6%) |
| 15 to 19 Minutes | 17 (7.9%) | 57 (17.8%) |
| 20 to 24 Minutes | 4 (1.9%) | 41 (12.8%) |
| 25 to 29 Minutes | 16 (7.4%) | 5 (1.6%) |
| 30 to 34 Minutes | 44 (20.5%) | 22 (6.9%) |
| 35 to 39 Minutes | 27 (12.6%) | 26 (8.1%) |
| 40 to 44 Minutes | 47 (21.9%) | 4 (1.3%) |
| 45 to 59 Minutes | 26 (12.1%) | 6 (1.9%) |
| 60 to 89 Minutes | 0 (0.0%) | 128 (40.0%) |
| 90 or more Minutes | 18 (8.4%) | 7 (2.2%) |
Time of Departure to Work by Sex in South Palm Beach
The most frequent times of departure to work in South Palm Beach are 7:00 AM to 7:29 AM (37, 17.2%) for males and 8:00 AM to 8:29 AM (139, 43.4%) for females.
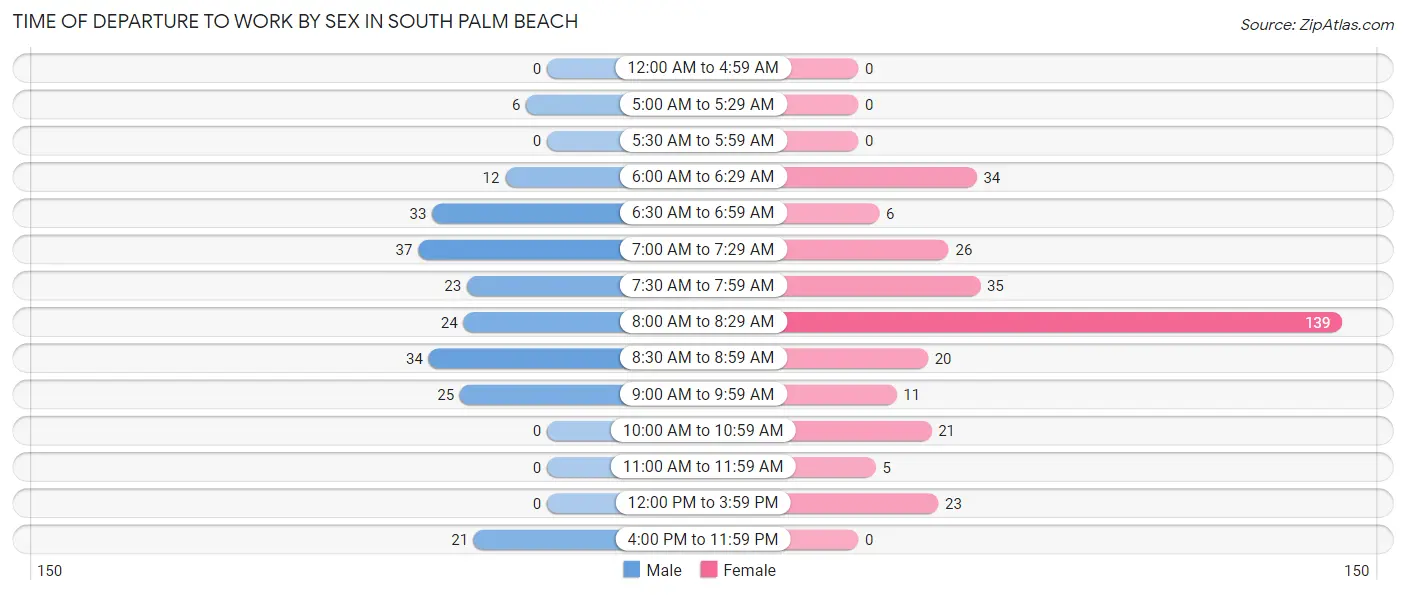
| Time of Departure | Male | Female |
| 12:00 AM to 4:59 AM | 0 (0.0%) | 0 (0.0%) |
| 5:00 AM to 5:29 AM | 6 (2.8%) | 0 (0.0%) |
| 5:30 AM to 5:59 AM | 0 (0.0%) | 0 (0.0%) |
| 6:00 AM to 6:29 AM | 12 (5.6%) | 34 (10.6%) |
| 6:30 AM to 6:59 AM | 33 (15.3%) | 6 (1.9%) |
| 7:00 AM to 7:29 AM | 37 (17.2%) | 26 (8.1%) |
| 7:30 AM to 7:59 AM | 23 (10.7%) | 35 (10.9%) |
| 8:00 AM to 8:29 AM | 24 (11.2%) | 139 (43.4%) |
| 8:30 AM to 8:59 AM | 34 (15.8%) | 20 (6.2%) |
| 9:00 AM to 9:59 AM | 25 (11.6%) | 11 (3.4%) |
| 10:00 AM to 10:59 AM | 0 (0.0%) | 21 (6.6%) |
| 11:00 AM to 11:59 AM | 0 (0.0%) | 5 (1.6%) |
| 12:00 PM to 3:59 PM | 0 (0.0%) | 23 (7.2%) |
| 4:00 PM to 11:59 PM | 21 (9.8%) | 0 (0.0%) |
| Total | 215 (100.0%) | 320 (100.0%) |
Housing Occupancy in South Palm Beach
Occupancy by Ownership in South Palm Beach
Of the total 994 dwellings in South Palm Beach, owner-occupied units account for 866 (87.1%), while renter-occupied units make up 128 (12.9%).
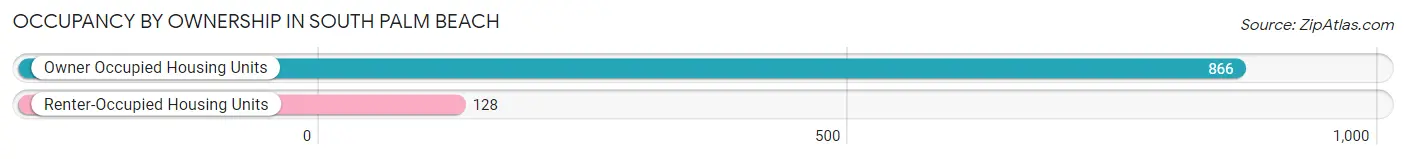
| Occupancy | # Housing Units | % Housing Units |
| Owner Occupied Housing Units | 866 | 87.1% |
| Renter-Occupied Housing Units | 128 | 12.9% |
| Total Occupied Housing Units | 994 | 100.0% |
Occupancy by Household Size in South Palm Beach
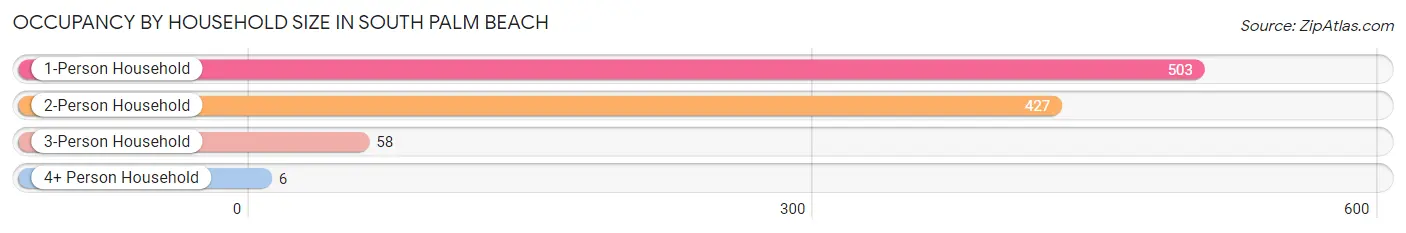
| Household Size | # Housing Units | % Housing Units |
| 1-Person Household | 503 | 50.6% |
| 2-Person Household | 427 | 43.0% |
| 3-Person Household | 58 | 5.8% |
| 4+ Person Household | 6 | 0.6% |
| Total Housing Units | 994 | 100.0% |
Occupancy by Ownership by Household Size in South Palm Beach
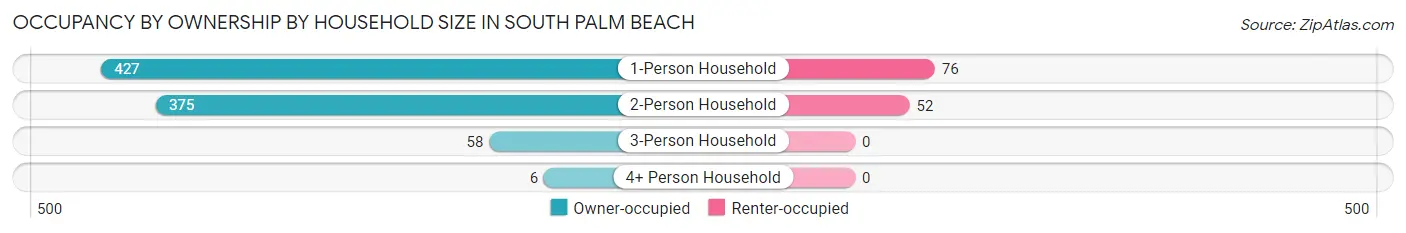
| Household Size | Owner-occupied | Renter-occupied |
| 1-Person Household | 427 (84.9%) | 76 (15.1%) |
| 2-Person Household | 375 (87.8%) | 52 (12.2%) |
| 3-Person Household | 58 (100.0%) | 0 (0.0%) |
| 4+ Person Household | 6 (100.0%) | 0 (0.0%) |
| Total Housing Units | 866 (87.1%) | 128 (12.9%) |
Occupancy by Educational Attainment in South Palm Beach
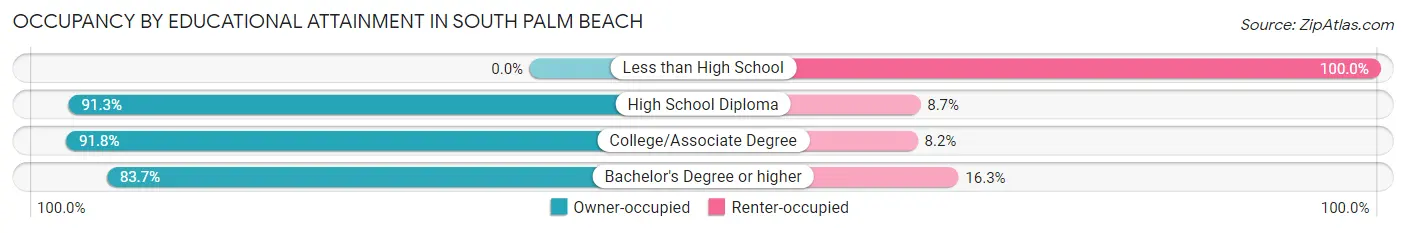
| Household Size | Owner-occupied | Renter-occupied |
| Less than High School | 0 (0.0%) | 5 (100.0%) |
| High School Diploma | 94 (91.3%) | 9 (8.7%) |
| College/Associate Degree | 346 (91.8%) | 31 (8.2%) |
| Bachelor's Degree or higher | 426 (83.7%) | 83 (16.3%) |
Occupancy by Age of Householder in South Palm Beach
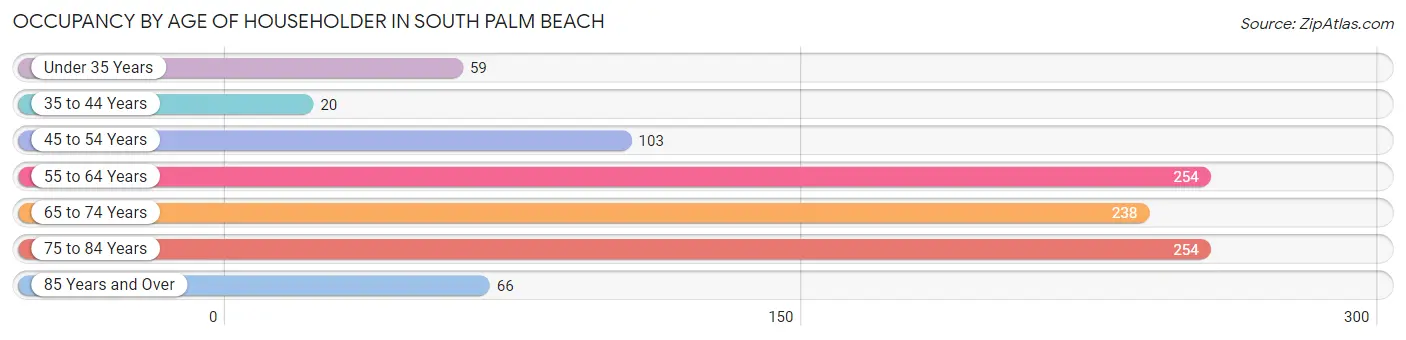
| Age Bracket | # Households | % Households |
| Under 35 Years | 59 | 5.9% |
| 35 to 44 Years | 20 | 2.0% |
| 45 to 54 Years | 103 | 10.4% |
| 55 to 64 Years | 254 | 25.6% |
| 65 to 74 Years | 238 | 23.9% |
| 75 to 84 Years | 254 | 25.6% |
| 85 Years and Over | 66 | 6.6% |
| Total | 994 | 100.0% |
Housing Finances in South Palm Beach
Median Income by Occupancy in South Palm Beach
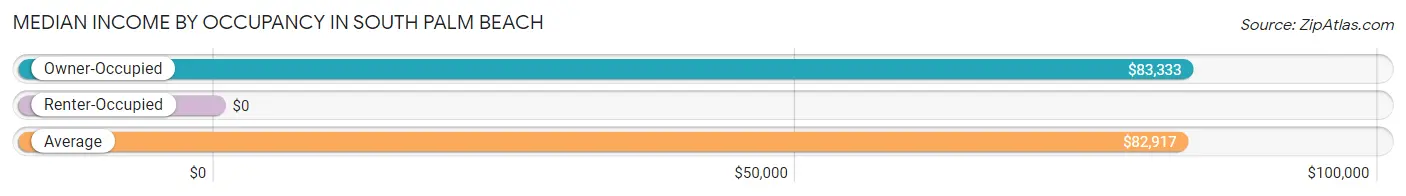
| Occupancy Type | # Households | Median Income |
| Owner-Occupied | 866 (87.1%) | $83,333 |
| Renter-Occupied | 128 (12.9%) | $0 |
| Average | 994 (100.0%) | $82,917 |
Occupancy by Householder Income Bracket in South Palm Beach
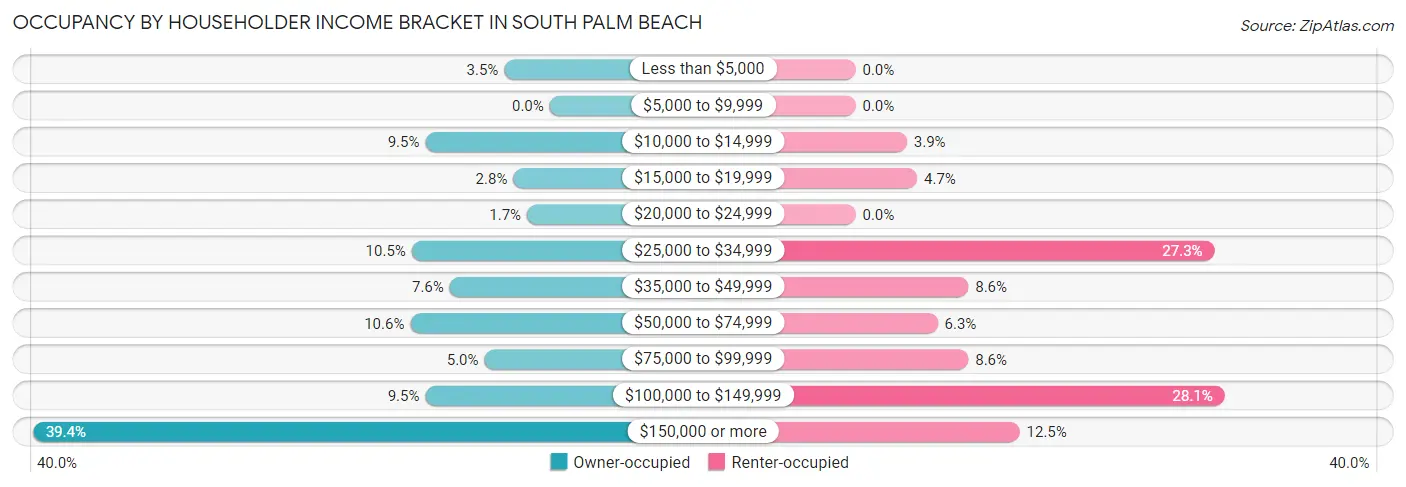
| Income Bracket | Owner-occupied | Renter-occupied |
| Less than $5,000 | 30 (3.5%) | 0 (0.0%) |
| $5,000 to $9,999 | 0 (0.0%) | 0 (0.0%) |
| $10,000 to $14,999 | 82 (9.5%) | 5 (3.9%) |
| $15,000 to $19,999 | 24 (2.8%) | 6 (4.7%) |
| $20,000 to $24,999 | 15 (1.7%) | 0 (0.0%) |
| $25,000 to $34,999 | 91 (10.5%) | 35 (27.3%) |
| $35,000 to $49,999 | 66 (7.6%) | 11 (8.6%) |
| $50,000 to $74,999 | 92 (10.6%) | 8 (6.2%) |
| $75,000 to $99,999 | 43 (5.0%) | 11 (8.6%) |
| $100,000 to $149,999 | 82 (9.5%) | 36 (28.1%) |
| $150,000 or more | 341 (39.4%) | 16 (12.5%) |
| Total | 866 (100.0%) | 128 (100.0%) |
Monthly Housing Cost Tiers in South Palm Beach
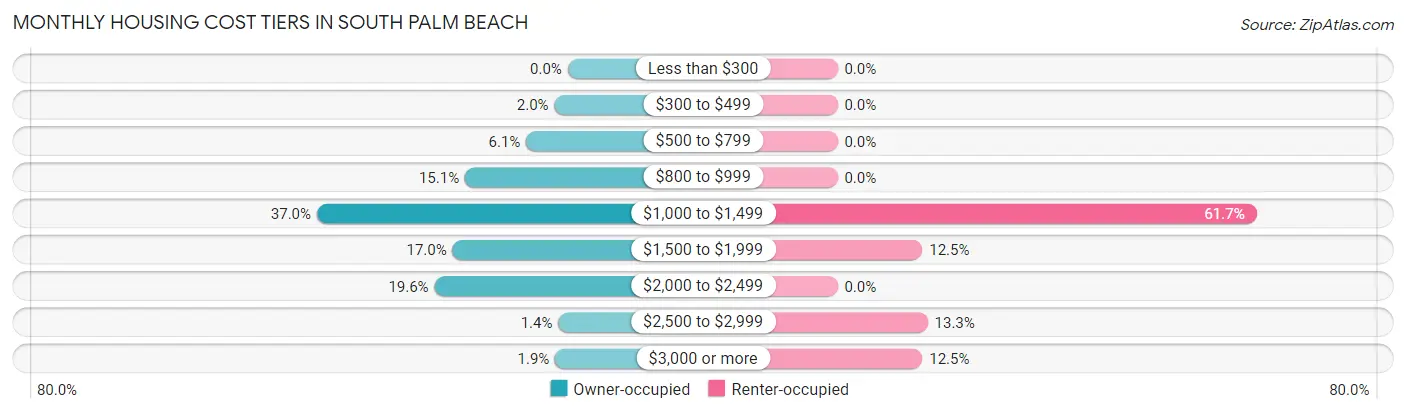
| Monthly Cost | Owner-occupied | Renter-occupied |
| Less than $300 | 0 (0.0%) | 0 (0.0%) |
| $300 to $499 | 17 (2.0%) | 0 (0.0%) |
| $500 to $799 | 53 (6.1%) | 0 (0.0%) |
| $800 to $999 | 131 (15.1%) | 0 (0.0%) |
| $1,000 to $1,499 | 320 (36.9%) | 79 (61.7%) |
| $1,500 to $1,999 | 147 (17.0%) | 16 (12.5%) |
| $2,000 to $2,499 | 170 (19.6%) | 0 (0.0%) |
| $2,500 to $2,999 | 12 (1.4%) | 17 (13.3%) |
| $3,000 or more | 16 (1.8%) | 16 (12.5%) |
| Total | 866 (100.0%) | 128 (100.0%) |
Physical Housing Characteristics in South Palm Beach
Housing Structures in South Palm Beach
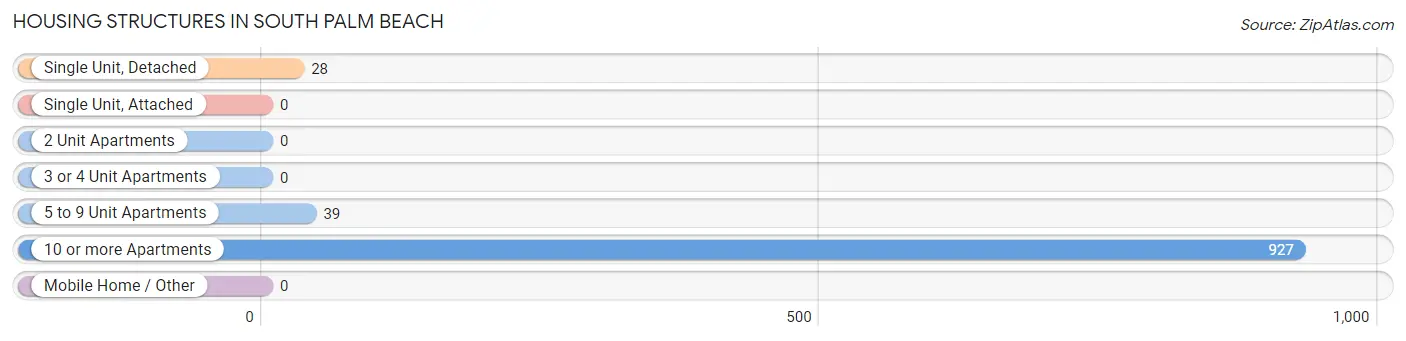
| Structure Type | # Housing Units | % Housing Units |
| Single Unit, Detached | 28 | 2.8% |
| Single Unit, Attached | 0 | 0.0% |
| 2 Unit Apartments | 0 | 0.0% |
| 3 or 4 Unit Apartments | 0 | 0.0% |
| 5 to 9 Unit Apartments | 39 | 3.9% |
| 10 or more Apartments | 927 | 93.3% |
| Mobile Home / Other | 0 | 0.0% |
| Total | 994 | 100.0% |
Housing Structures by Occupancy in South Palm Beach
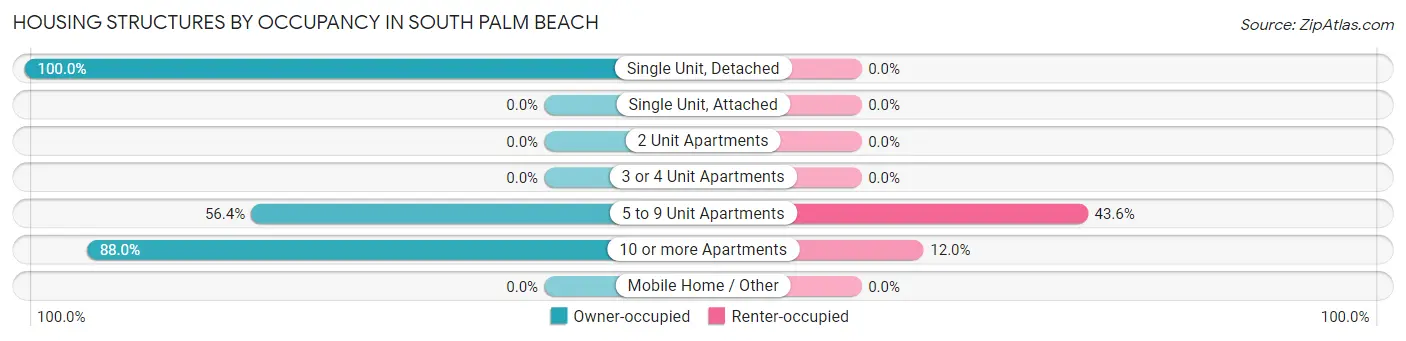
| Structure Type | Owner-occupied | Renter-occupied |
| Single Unit, Detached | 28 (100.0%) | 0 (0.0%) |
| Single Unit, Attached | 0 (0.0%) | 0 (0.0%) |
| 2 Unit Apartments | 0 (0.0%) | 0 (0.0%) |
| 3 or 4 Unit Apartments | 0 (0.0%) | 0 (0.0%) |
| 5 to 9 Unit Apartments | 22 (56.4%) | 17 (43.6%) |
| 10 or more Apartments | 816 (88.0%) | 111 (12.0%) |
| Mobile Home / Other | 0 (0.0%) | 0 (0.0%) |
| Total | 866 (87.1%) | 128 (12.9%) |
Housing Structures by Number of Rooms in South Palm Beach
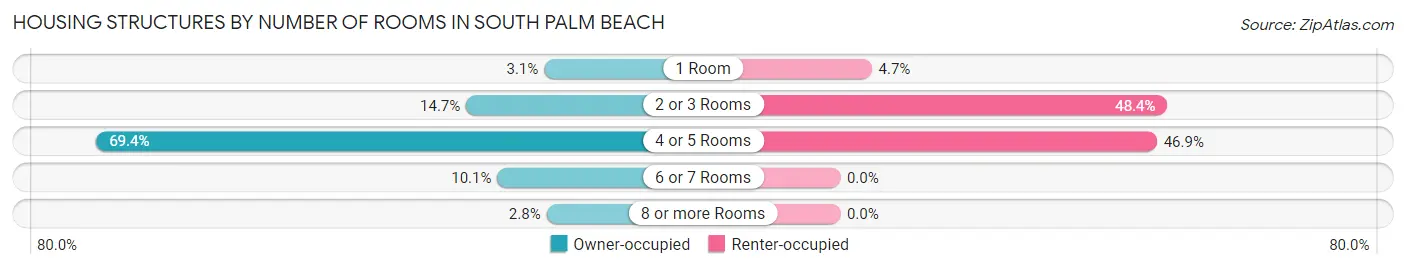
| Number of Rooms | Owner-occupied | Renter-occupied |
| 1 Room | 27 (3.1%) | 6 (4.7%) |
| 2 or 3 Rooms | 127 (14.7%) | 62 (48.4%) |
| 4 or 5 Rooms | 601 (69.4%) | 60 (46.9%) |
| 6 or 7 Rooms | 87 (10.1%) | 0 (0.0%) |
| 8 or more Rooms | 24 (2.8%) | 0 (0.0%) |
| Total | 866 (100.0%) | 128 (100.0%) |
Housing Structure by Heating Type in South Palm Beach
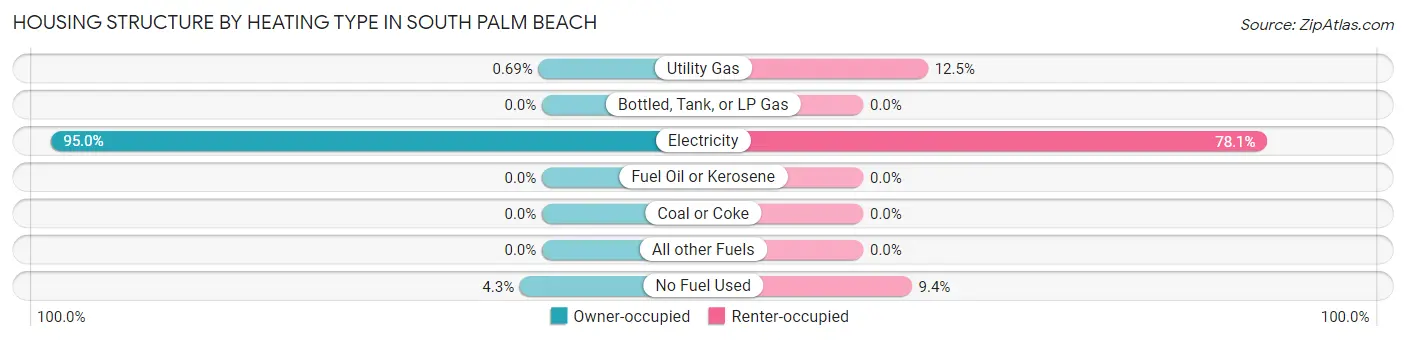
| Heating Type | Owner-occupied | Renter-occupied |
| Utility Gas | 6 (0.7%) | 16 (12.5%) |
| Bottled, Tank, or LP Gas | 0 (0.0%) | 0 (0.0%) |
| Electricity | 823 (95.0%) | 100 (78.1%) |
| Fuel Oil or Kerosene | 0 (0.0%) | 0 (0.0%) |
| Coal or Coke | 0 (0.0%) | 0 (0.0%) |
| All other Fuels | 0 (0.0%) | 0 (0.0%) |
| No Fuel Used | 37 (4.3%) | 12 (9.4%) |
| Total | 866 (100.0%) | 128 (100.0%) |
Household Vehicle Usage in South Palm Beach
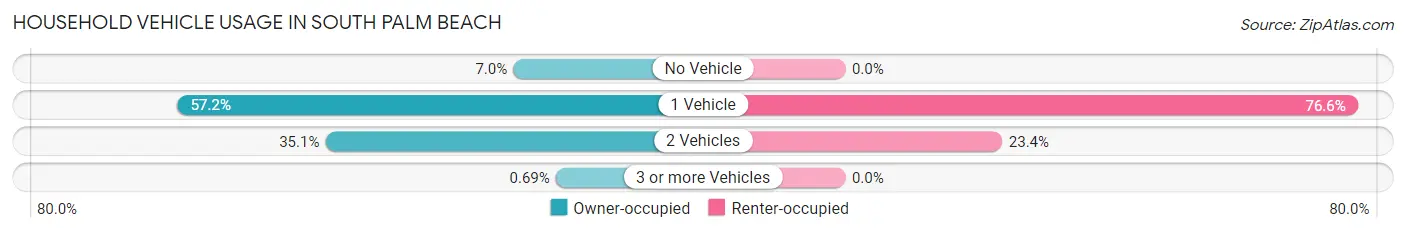
| Vehicles per Household | Owner-occupied | Renter-occupied |
| No Vehicle | 61 (7.0%) | 0 (0.0%) |
| 1 Vehicle | 495 (57.2%) | 98 (76.6%) |
| 2 Vehicles | 304 (35.1%) | 30 (23.4%) |
| 3 or more Vehicles | 6 (0.7%) | 0 (0.0%) |
| Total | 866 (100.0%) | 128 (100.0%) |
Real Estate & Mortgages in South Palm Beach
Real Estate and Mortgage Overview in South Palm Beach
| Characteristic | Without Mortgage | With Mortgage |
| Housing Units | 586 | 280 |
| Median Property Value | $311,600 | $318,500 |
| Median Household Income | $65,147 | $145 |
| Monthly Housing Costs | $1,236 | $16 |
| Real Estate Taxes | $2,899 | $0 |
Property Value by Mortgage Status in South Palm Beach
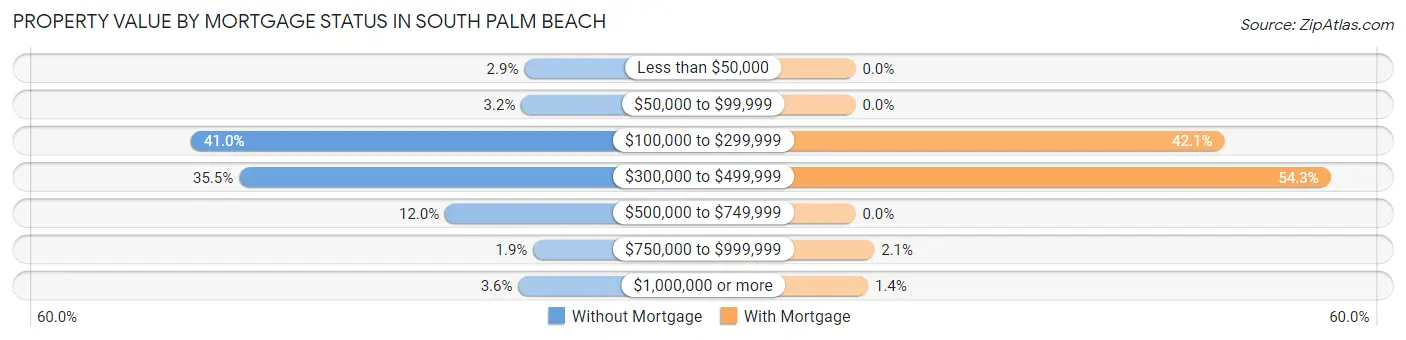
| Property Value | Without Mortgage | With Mortgage |
| Less than $50,000 | 17 (2.9%) | 0 (0.0%) |
| $50,000 to $99,999 | 19 (3.2%) | 0 (0.0%) |
| $100,000 to $299,999 | 240 (41.0%) | 118 (42.1%) |
| $300,000 to $499,999 | 208 (35.5%) | 152 (54.3%) |
| $500,000 to $749,999 | 70 (11.9%) | 0 (0.0%) |
| $750,000 to $999,999 | 11 (1.9%) | 6 (2.1%) |
| $1,000,000 or more | 21 (3.6%) | 4 (1.4%) |
| Total | 586 (100.0%) | 280 (100.0%) |
Household Income by Mortgage Status in South Palm Beach
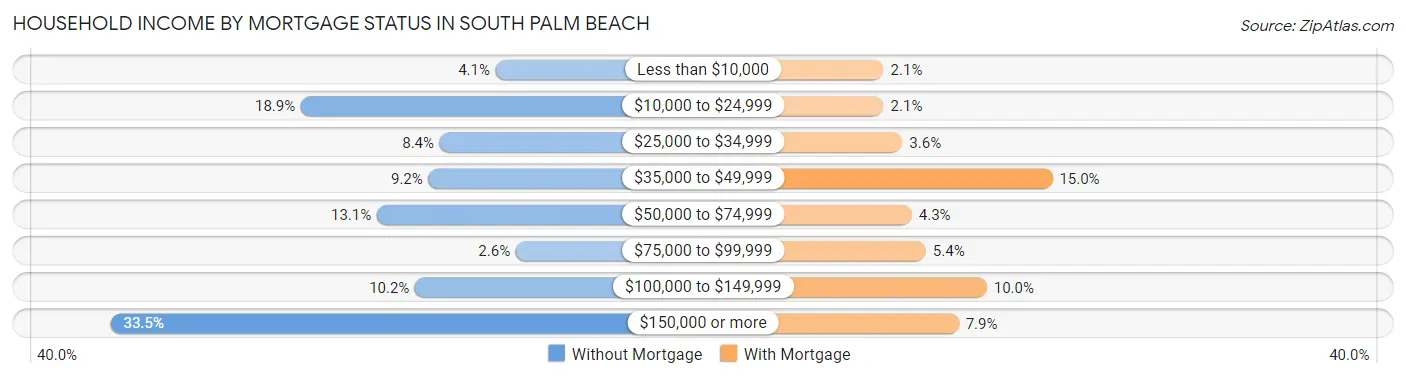
| Household Income | Without Mortgage | With Mortgage |
| Less than $10,000 | 24 (4.1%) | 6 (2.1%) |
| $10,000 to $24,999 | 111 (18.9%) | 6 (2.1%) |
| $25,000 to $34,999 | 49 (8.4%) | 10 (3.6%) |
| $35,000 to $49,999 | 54 (9.2%) | 42 (15.0%) |
| $50,000 to $74,999 | 77 (13.1%) | 12 (4.3%) |
| $75,000 to $99,999 | 15 (2.6%) | 15 (5.4%) |
| $100,000 to $149,999 | 60 (10.2%) | 28 (10.0%) |
| $150,000 or more | 196 (33.5%) | 22 (7.9%) |
| Total | 586 (100.0%) | 280 (100.0%) |
Property Value to Household Income Ratio in South Palm Beach
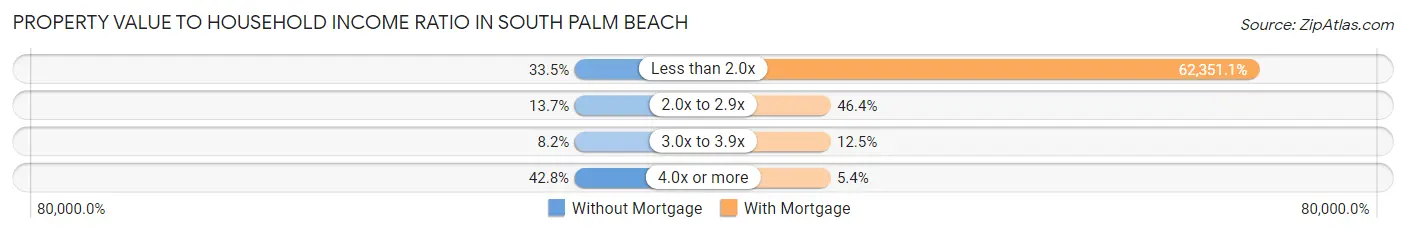
| Value-to-Income Ratio | Without Mortgage | With Mortgage |
| Less than 2.0x | 196 (33.5%) | 174,583 (62,351.1%) |
| 2.0x to 2.9x | 80 (13.7%) | 130 (46.4%) |
| 3.0x to 3.9x | 48 (8.2%) | 35 (12.5%) |
| 4.0x or more | 251 (42.8%) | 15 (5.4%) |
| Total | 586 (100.0%) | 280 (100.0%) |
Real Estate Taxes by Mortgage Status in South Palm Beach
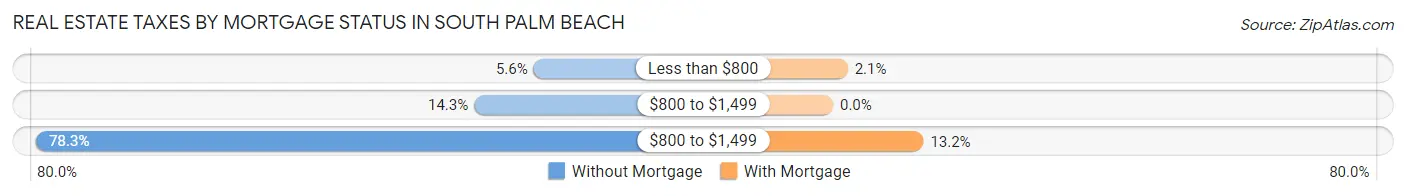
| Property Taxes | Without Mortgage | With Mortgage |
| Less than $800 | 33 (5.6%) | 6 (2.1%) |
| $800 to $1,499 | 84 (14.3%) | 0 (0.0%) |
| $800 to $1,499 | 459 (78.3%) | 37 (13.2%) |
| Total | 586 (100.0%) | 280 (100.0%) |
Health & Disability in South Palm Beach
Health Insurance Coverage by Age in South Palm Beach
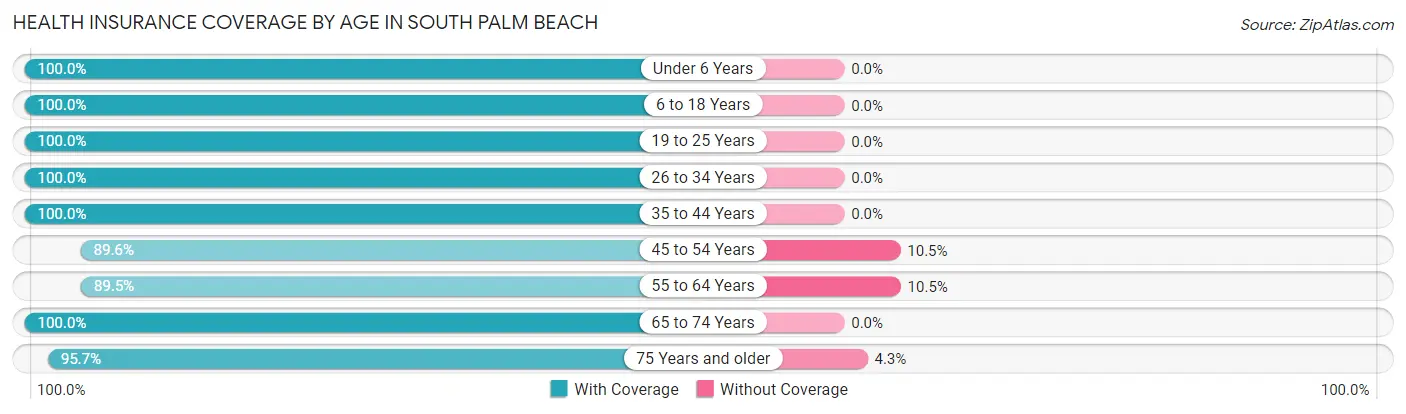
| Age Bracket | With Coverage | Without Coverage |
| Under 6 Years | 8 (100.0%) | 0 (0.0%) |
| 6 to 18 Years | 37 (100.0%) | 0 (0.0%) |
| 19 to 25 Years | 7 (100.0%) | 0 (0.0%) |
| 26 to 34 Years | 71 (100.0%) | 0 (0.0%) |
| 35 to 44 Years | 28 (100.0%) | 0 (0.0%) |
| 45 to 54 Years | 120 (89.5%) | 14 (10.4%) |
| 55 to 64 Years | 349 (89.5%) | 41 (10.5%) |
| 65 to 74 Years | 488 (100.0%) | 0 (0.0%) |
| 75 Years and older | 464 (95.7%) | 21 (4.3%) |
| Total | 1,572 (95.4%) | 76 (4.6%) |
Health Insurance Coverage by Citizenship Status in South Palm Beach
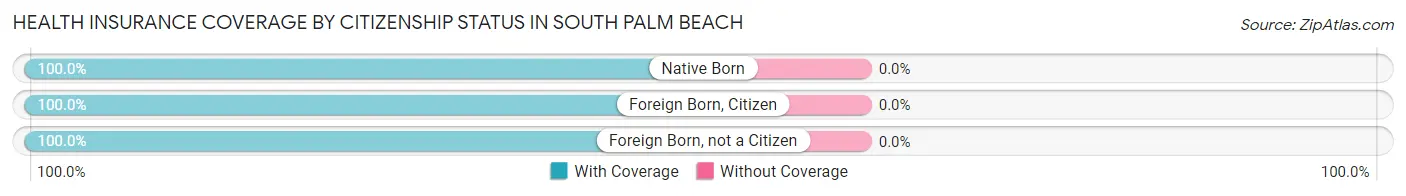
| Citizenship Status | With Coverage | Without Coverage |
| Native Born | 8 (100.0%) | 0 (0.0%) |
| Foreign Born, Citizen | 37 (100.0%) | 0 (0.0%) |
| Foreign Born, not a Citizen | 7 (100.0%) | 0 (0.0%) |
Health Insurance Coverage by Household Income in South Palm Beach
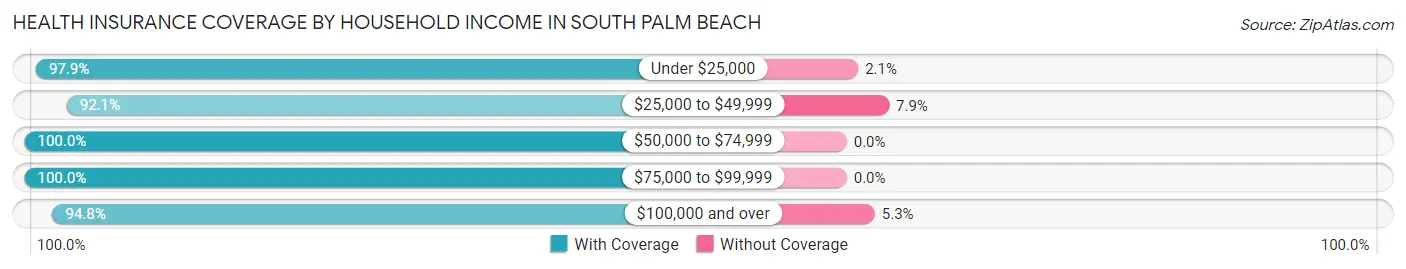
| Household Income | With Coverage | Without Coverage |
| Under $25,000 | 183 (97.9%) | 4 (2.1%) |
| $25,000 to $49,999 | 244 (92.1%) | 21 (7.9%) |
| $50,000 to $74,999 | 125 (100.0%) | 0 (0.0%) |
| $75,000 to $99,999 | 99 (100.0%) | 0 (0.0%) |
| $100,000 and over | 921 (94.8%) | 51 (5.2%) |
Public vs Private Health Insurance Coverage by Age in South Palm Beach
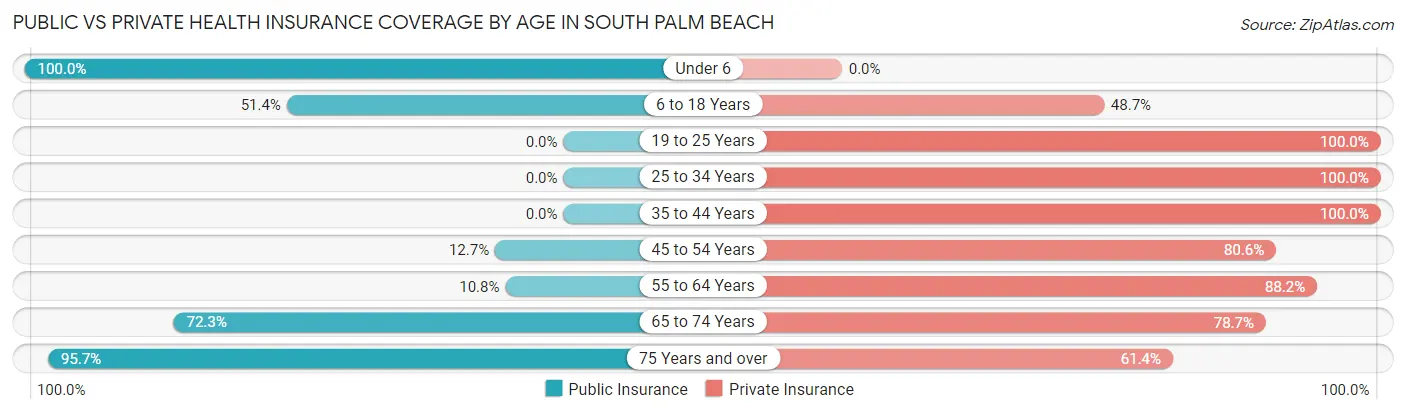
| Age Bracket | Public Insurance | Private Insurance |
| Under 6 | 8 (100.0%) | 0 (0.0%) |
| 6 to 18 Years | 19 (51.3%) | 18 (48.6%) |
| 19 to 25 Years | 0 (0.0%) | 7 (100.0%) |
| 25 to 34 Years | 0 (0.0%) | 71 (100.0%) |
| 35 to 44 Years | 0 (0.0%) | 28 (100.0%) |
| 45 to 54 Years | 17 (12.7%) | 108 (80.6%) |
| 55 to 64 Years | 42 (10.8%) | 344 (88.2%) |
| 65 to 74 Years | 353 (72.3%) | 384 (78.7%) |
| 75 Years and over | 464 (95.7%) | 298 (61.4%) |
| Total | 903 (54.8%) | 1,258 (76.3%) |
Disability Status by Sex by Age in South Palm Beach
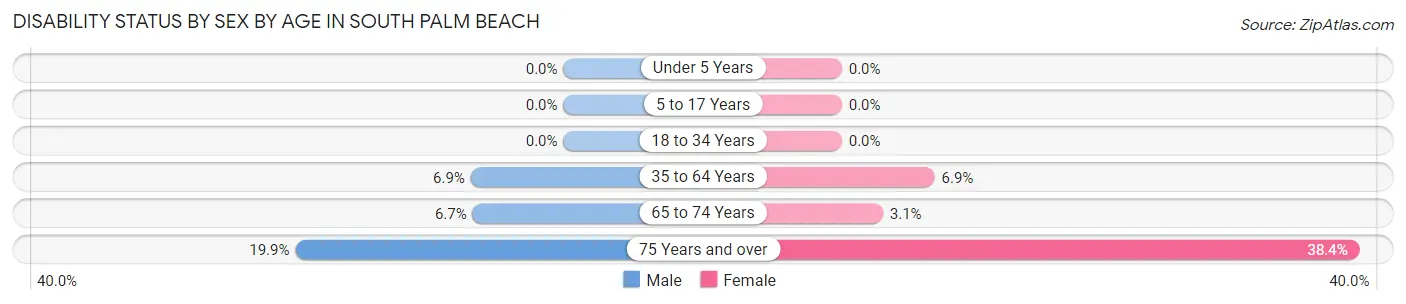
| Age Bracket | Male | Female |
| Under 5 Years | 0 (0.0%) | 0 (0.0%) |
| 5 to 17 Years | 0 (0.0%) | 0 (0.0%) |
| 18 to 34 Years | 0 (0.0%) | 0 (0.0%) |
| 35 to 64 Years | 17 (6.9%) | 21 (6.9%) |
| 65 to 74 Years | 13 (6.7%) | 9 (3.0%) |
| 75 Years and over | 38 (19.9%) | 113 (38.4%) |
Disability Class by Sex by Age in South Palm Beach
Disability Class: Hearing Difficulty
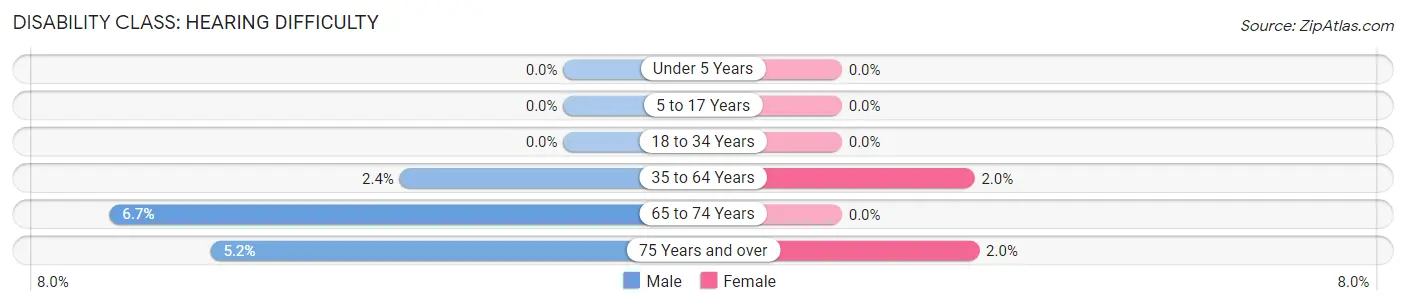
| Age Bracket | Male | Female |
| Under 5 Years | 0 (0.0%) | 0 (0.0%) |
| 5 to 17 Years | 0 (0.0%) | 0 (0.0%) |
| 18 to 34 Years | 0 (0.0%) | 0 (0.0%) |
| 35 to 64 Years | 6 (2.4%) | 6 (2.0%) |
| 65 to 74 Years | 13 (6.7%) | 0 (0.0%) |
| 75 Years and over | 10 (5.2%) | 6 (2.0%) |
Disability Class: Vision Difficulty
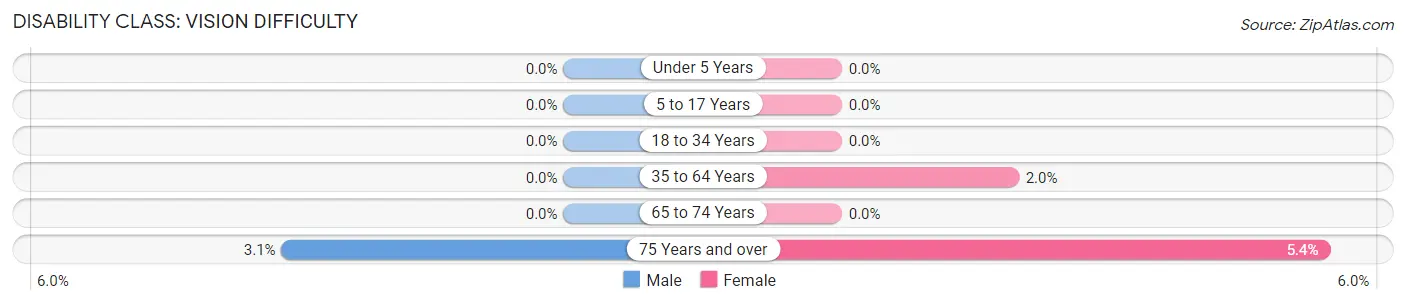
| Age Bracket | Male | Female |
| Under 5 Years | 0 (0.0%) | 0 (0.0%) |
| 5 to 17 Years | 0 (0.0%) | 0 (0.0%) |
| 18 to 34 Years | 0 (0.0%) | 0 (0.0%) |
| 35 to 64 Years | 0 (0.0%) | 6 (2.0%) |
| 65 to 74 Years | 0 (0.0%) | 0 (0.0%) |
| 75 Years and over | 6 (3.1%) | 16 (5.4%) |
Disability Class: Cognitive Difficulty
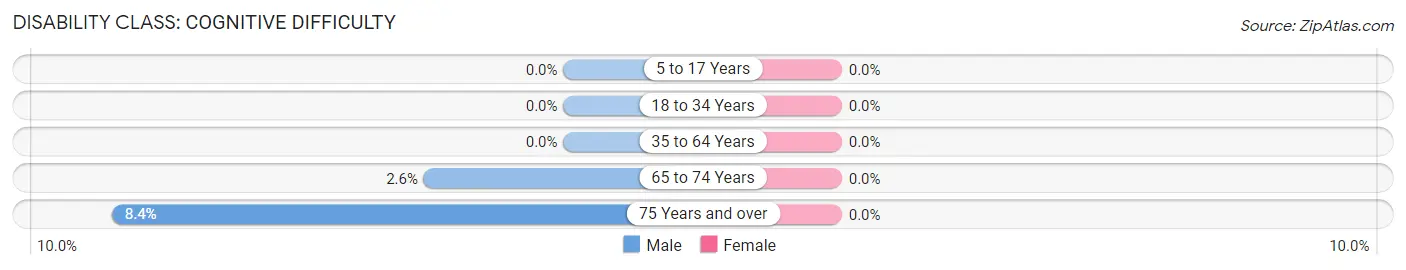
| Age Bracket | Male | Female |
| 5 to 17 Years | 0 (0.0%) | 0 (0.0%) |
| 18 to 34 Years | 0 (0.0%) | 0 (0.0%) |
| 35 to 64 Years | 0 (0.0%) | 0 (0.0%) |
| 65 to 74 Years | 5 (2.6%) | 0 (0.0%) |
| 75 Years and over | 16 (8.4%) | 0 (0.0%) |
Disability Class: Ambulatory Difficulty
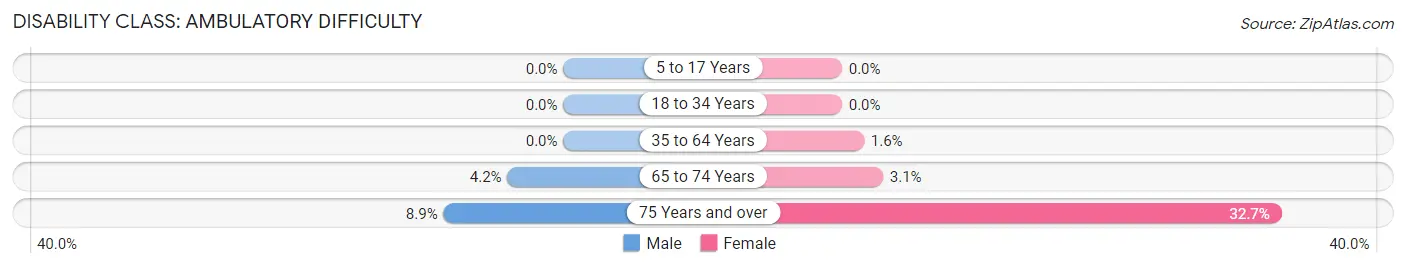
| Age Bracket | Male | Female |
| 5 to 17 Years | 0 (0.0%) | 0 (0.0%) |
| 18 to 34 Years | 0 (0.0%) | 0 (0.0%) |
| 35 to 64 Years | 0 (0.0%) | 5 (1.6%) |
| 65 to 74 Years | 8 (4.2%) | 9 (3.0%) |
| 75 Years and over | 17 (8.9%) | 96 (32.7%) |
Disability Class: Self-Care Difficulty
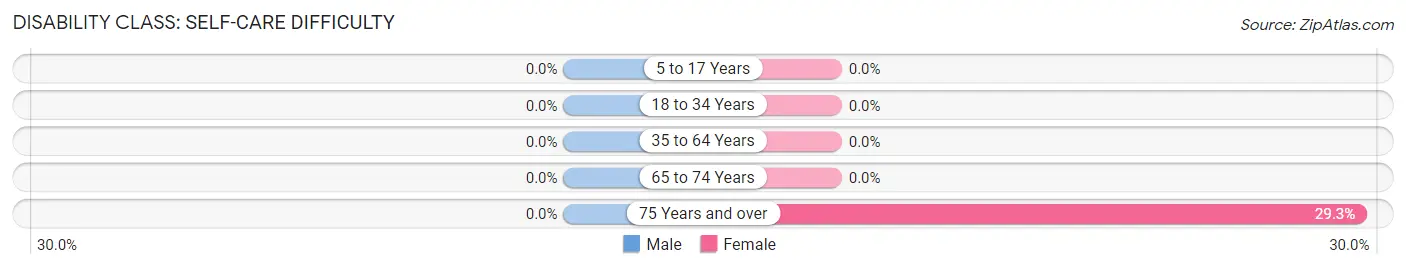
| Age Bracket | Male | Female |
| 5 to 17 Years | 0 (0.0%) | 0 (0.0%) |
| 18 to 34 Years | 0 (0.0%) | 0 (0.0%) |
| 35 to 64 Years | 0 (0.0%) | 0 (0.0%) |
| 65 to 74 Years | 0 (0.0%) | 0 (0.0%) |
| 75 Years and over | 0 (0.0%) | 86 (29.2%) |
Technology Access in South Palm Beach
Computing Device Access in South Palm Beach
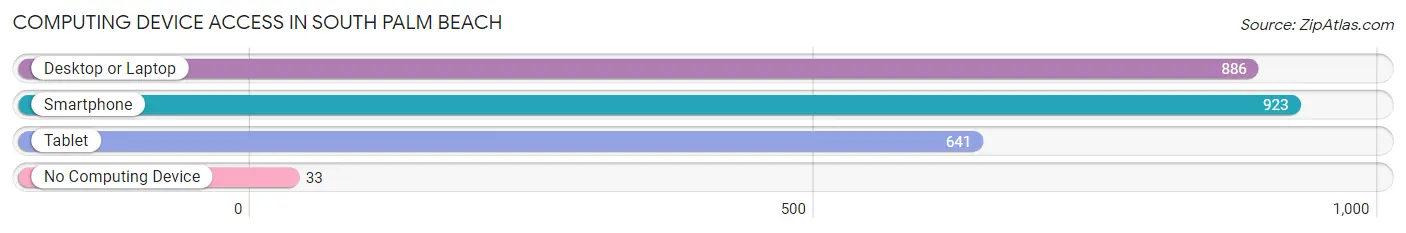
| Device Type | # Households | % Households |
| Desktop or Laptop | 886 | 89.1% |
| Smartphone | 923 | 92.9% |
| Tablet | 641 | 64.5% |
| No Computing Device | 33 | 3.3% |
| Total | 994 | 100.0% |
Internet Access in South Palm Beach
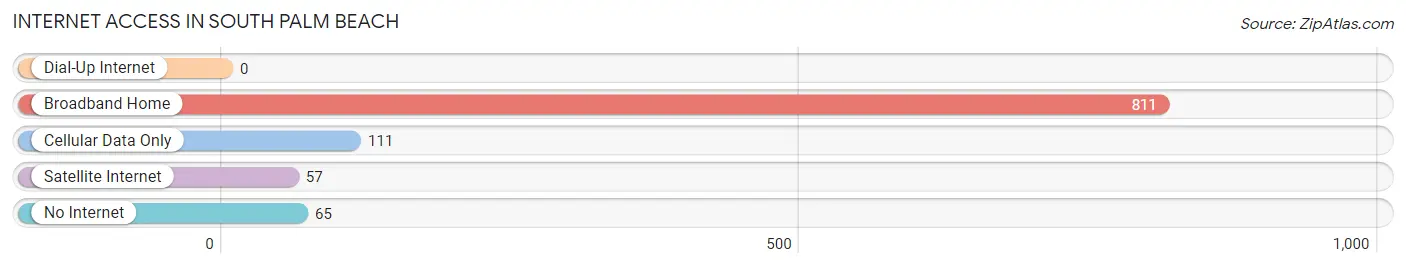
| Internet Type | # Households | % Households |
| Dial-Up Internet | 0 | 0.0% |
| Broadband Home | 811 | 81.6% |
| Cellular Data Only | 111 | 11.2% |
| Satellite Internet | 57 | 5.7% |
| No Internet | 65 | 6.5% |
| Total | 994 | 100.0% |
South Palm Beach Summary
Palm Beach County is located in the southeastern part of the state of Florida, and is home to the cities of South Palm Beach, Palm Beach, and West Palm Beach. The county is bordered by the Atlantic Ocean to the east, Martin County to the north, Broward County to the west, and Miami-Dade County to the south. The county has a population of over 1.4 million people, making it the third most populous county in the state.
History
The area that is now Palm Beach County was originally inhabited by the Tequesta Indians, who lived in the area for thousands of years before the arrival of Europeans. The first Europeans to explore the area were Spanish explorers, who arrived in the late 1500s. The area was later claimed by the British, and in 1821, it became part of the United States.
In the late 1800s, the area began to attract settlers from the north, and the population began to grow. In 1909, Palm Beach County was officially established, and the county seat was established in West Palm Beach.
Geography
Palm Beach County is located in the southeastern part of the state of Florida, and is bordered by the Atlantic Ocean to the east, Martin County to the north, Broward County to the west, and Miami-Dade County to the south. The county covers an area of 2,386 square miles, and is the third largest county in the state.
The county is divided into two distinct regions: the coastal region and the inland region. The coastal region is characterized by its sandy beaches, and is home to the cities of South Palm Beach, Palm Beach, and West Palm Beach. The inland region is characterized by its rolling hills and pine forests, and is home to the cities of Belle Glade, Pahokee, and South Bay.
Economy
The economy of Palm Beach County is largely driven by tourism, agriculture, and manufacturing. The county is home to several major tourist attractions, including the Palm Beach Zoo, the Flagler Museum, and the Kravis Center for the Performing Arts. The county is also home to several major agricultural operations, including sugarcane, citrus, and vegetable farms.
Manufacturing is also an important part of the county’s economy, with major employers including Pratt & Whitney, Sikorsky Aircraft, and Pratt & Whitney Canada. The county is also home to several major corporate headquarters, including Office Depot, NextEra Energy, and Florida Power & Light.
Demographics
As of the 2010 census, the population of Palm Beach County was 1,320,134, making it the third most populous county in the state. The population is composed of a diverse mix of ethnicities, with the largest groups being White (63.2%), Hispanic or Latino (20.2%), and African American (14.2%).
The median household income in the county is $54,890, and the median home value is $232,400. The unemployment rate in the county is 4.2%, which is lower than the national average. The poverty rate in the county is 11.2%, which is slightly higher than the national average.
Common Questions
What is Per Capita Income in South Palm Beach?
Per Capita income in South Palm Beach is $102,269.
What is the Median Family Income in South Palm Beach?
Median Family Income in South Palm Beach is $166,563.
What is the Median Household income in South Palm Beach?
Median Household Income in South Palm Beach is $82,917.
What is Inequality or Gini Index in South Palm Beach?
Inequality or Gini Index in South Palm Beach is 0.56.
What is the Total Population of South Palm Beach?
Total Population of South Palm Beach is 1,648.
What is the Total Male Population of South Palm Beach?
Total Male Population of South Palm Beach is 680.
What is the Total Female Population of South Palm Beach?
Total Female Population of South Palm Beach is 968.
What is the Ratio of Males per 100 Females in South Palm Beach?
There are 70.25 Males per 100 Females in South Palm Beach.
What is the Ratio of Females per 100 Males in South Palm Beach?
There are 142.35 Females per 100 Males in South Palm Beach.
What is the Median Population Age in South Palm Beach?
Median Population Age in South Palm Beach is 66.9 Years.
What is the Average Family Size in South Palm Beach
Average Family Size in South Palm Beach is 2.3 People.
What is the Average Household Size in South Palm Beach
Average Household Size in South Palm Beach is 1.7 People.
How Large is the Labor Force in South Palm Beach?
There are 750 People in the Labor Forcein in South Palm Beach.
What is the Percentage of People in the Labor Force in South Palm Beach?
46.8% of People are in the Labor Force in South Palm Beach.
What is the Unemployment Rate in South Palm Beach?
Unemployment Rate in South Palm Beach is 1.3%.