Sea Ranch Lakes, FL Map & Demographics
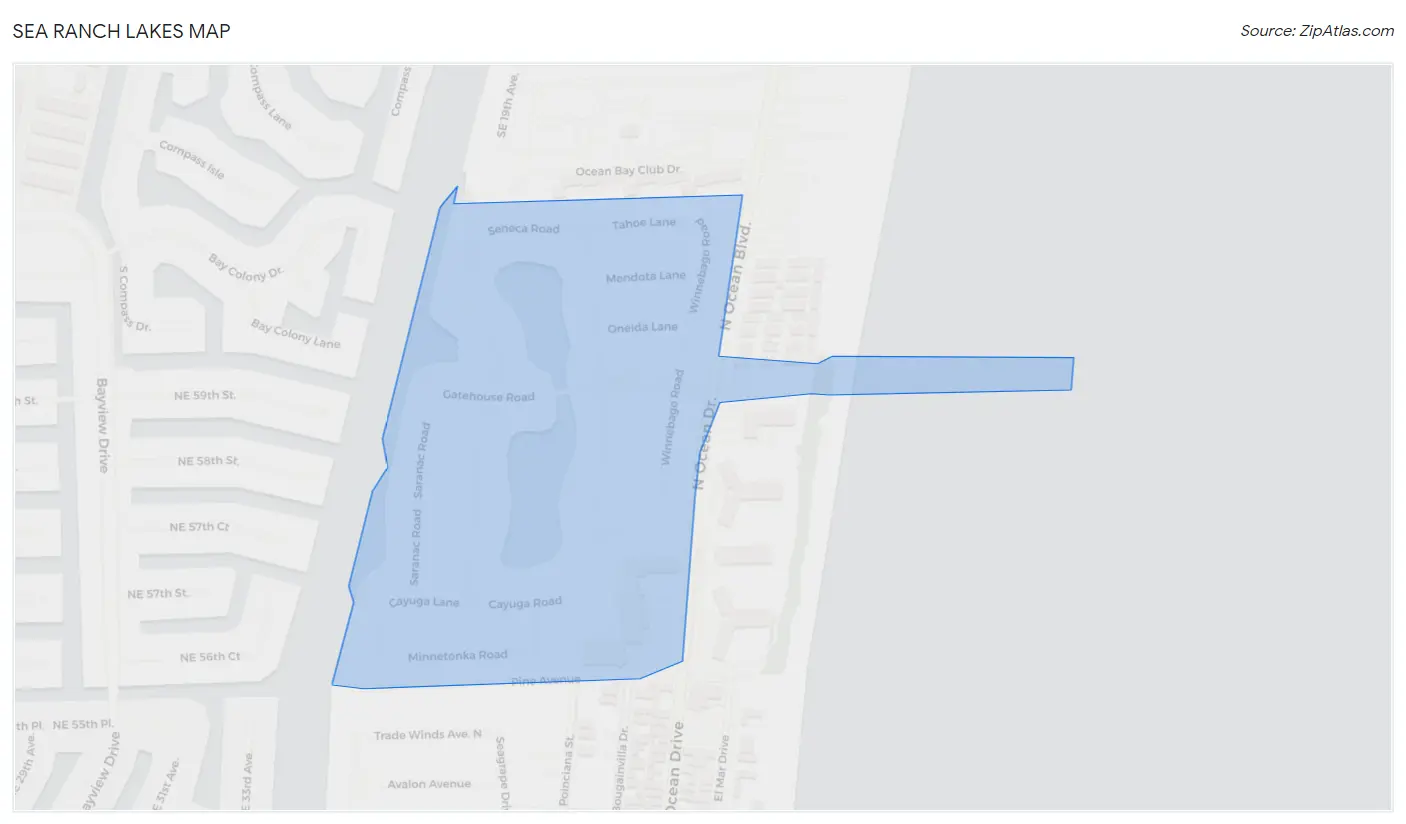
Sea Ranch Lakes Map
Sea Ranch Lakes Overview
$141,165
PER CAPITA INCOME
$250,001
AVG FAMILY INCOME
$238,750
AVG HOUSEHOLD INCOME
0.48
INEQUALITY / GINI INDEX
443
TOTAL POPULATION
225
MALE POPULATION
218
FEMALE POPULATION
103.21
MALES / 100 FEMALES
96.89
FEMALES / 100 MALES
48.2
MEDIAN AGE
3.0
AVG FAMILY SIZE
2.6
AVG HOUSEHOLD SIZE
201
LABOR FORCE [ PEOPLE ]
54.0%
PERCENT IN LABOR FORCE
1.0%
UNEMPLOYMENT RATE
Sea Ranch Lakes Area Codes
Income in Sea Ranch Lakes
Income Overview in Sea Ranch Lakes
Per Capita Income in Sea Ranch Lakes is $141,165, while median incomes of families and households are $250,001 and $238,750 respectively.
| Characteristic | Number | Measure |
| Per Capita Income | 443 | $141,165 |
| Median Family Income | 129 | $250,001 |
| Mean Family Income | 129 | $393,448 |
| Median Household Income | 172 | $238,750 |
| Mean Household Income | 172 | $351,376 |
| Income Deficit | 129 | $0 |
| Wage / Income Gap (%) | 443 | 0.00% |
| Wage / Income Gap ($) | 443 | 100.00¢ per $1 |
| Gini / Inequality Index | 443 | 0.48 |
Earnings by Sex in Sea Ranch Lakes
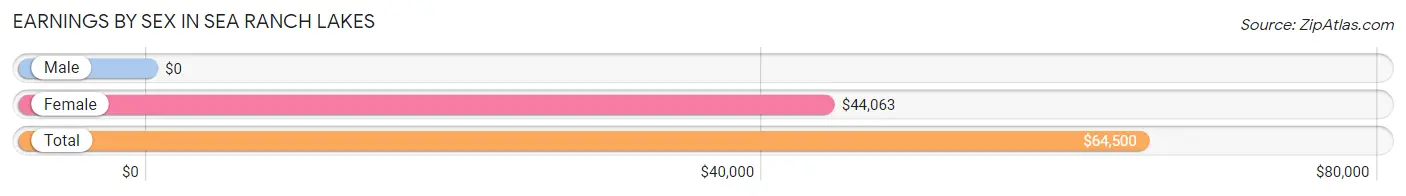
| Sex | Number | Average Earnings |
| Male | 133 (56.8%) | $0 |
| Female | 101 (43.2%) | $44,063 |
| Total | 234 (100.0%) | $64,500 |
Earnings by Sex by Income Bracket in Sea Ranch Lakes
The most common earnings brackets in Sea Ranch Lakes are $100,000+ for men (74 | 55.6%) and $100,000+ for women (16 | 15.8%).
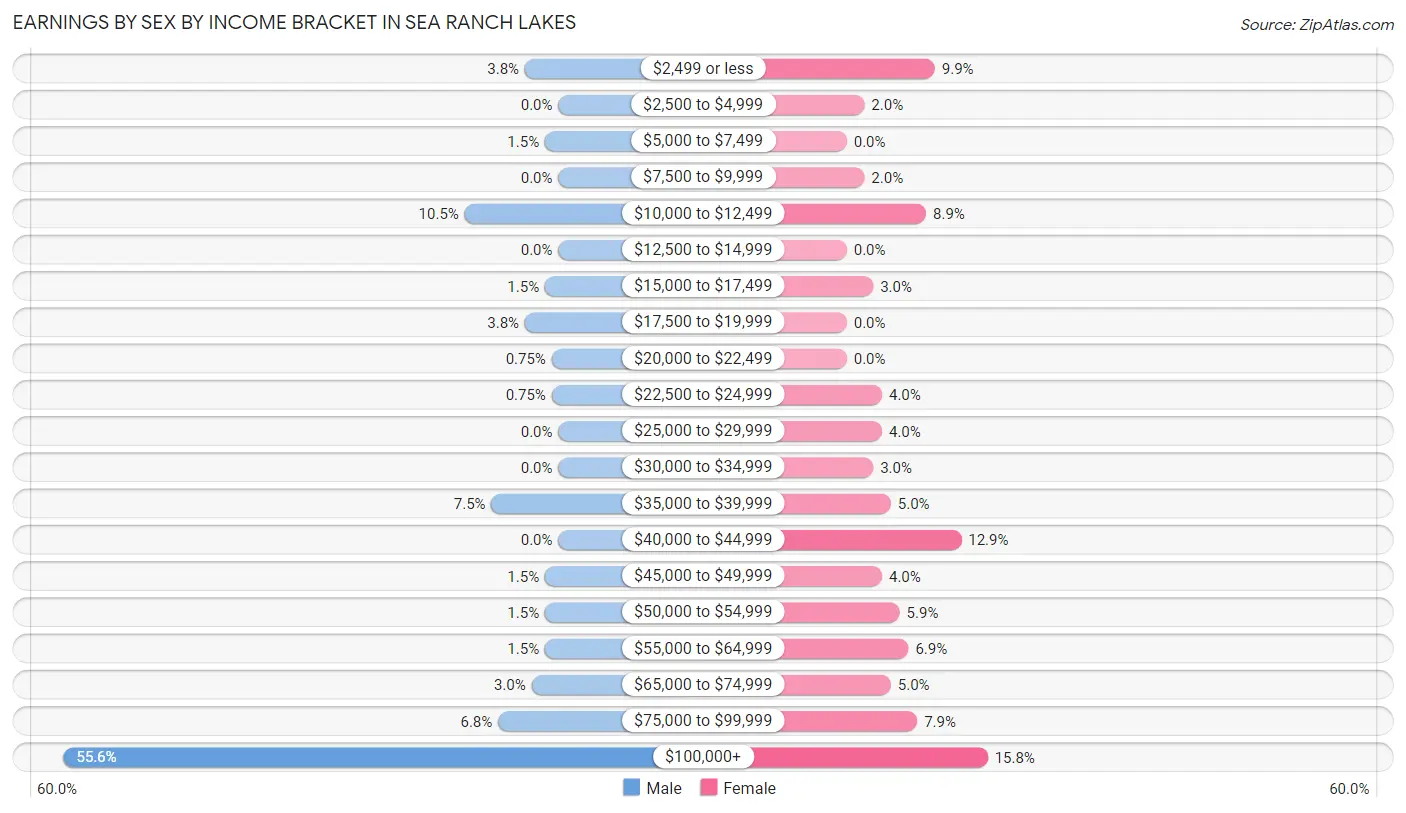
| Income | Male | Female |
| $2,499 or less | 5 (3.8%) | 10 (9.9%) |
| $2,500 to $4,999 | 0 (0.0%) | 2 (2.0%) |
| $5,000 to $7,499 | 2 (1.5%) | 0 (0.0%) |
| $7,500 to $9,999 | 0 (0.0%) | 2 (2.0%) |
| $10,000 to $12,499 | 14 (10.5%) | 9 (8.9%) |
| $12,500 to $14,999 | 0 (0.0%) | 0 (0.0%) |
| $15,000 to $17,499 | 2 (1.5%) | 3 (3.0%) |
| $17,500 to $19,999 | 5 (3.8%) | 0 (0.0%) |
| $20,000 to $22,499 | 1 (0.7%) | 0 (0.0%) |
| $22,500 to $24,999 | 1 (0.7%) | 4 (4.0%) |
| $25,000 to $29,999 | 0 (0.0%) | 4 (4.0%) |
| $30,000 to $34,999 | 0 (0.0%) | 3 (3.0%) |
| $35,000 to $39,999 | 10 (7.5%) | 5 (5.0%) |
| $40,000 to $44,999 | 0 (0.0%) | 13 (12.9%) |
| $45,000 to $49,999 | 2 (1.5%) | 4 (4.0%) |
| $50,000 to $54,999 | 2 (1.5%) | 6 (5.9%) |
| $55,000 to $64,999 | 2 (1.5%) | 7 (6.9%) |
| $65,000 to $74,999 | 4 (3.0%) | 5 (5.0%) |
| $75,000 to $99,999 | 9 (6.8%) | 8 (7.9%) |
| $100,000+ | 74 (55.6%) | 16 (15.8%) |
| Total | 133 (100.0%) | 101 (100.0%) |
Earnings by Sex by Educational Attainment in Sea Ranch Lakes
Average earnings in Sea Ranch Lakes are $187,778 for men and $45,625 for women, a difference of 75.7%. Men with an educational attainment of college or associate's degree enjoy the highest average annual earnings of $250,001, while those with graduate degree education earn the least with $118,750. Women with an educational attainment of college or associate's degree earn the most with the average annual earnings of $80,833, while those with bachelor's degree education have the smallest earnings of $45,938.
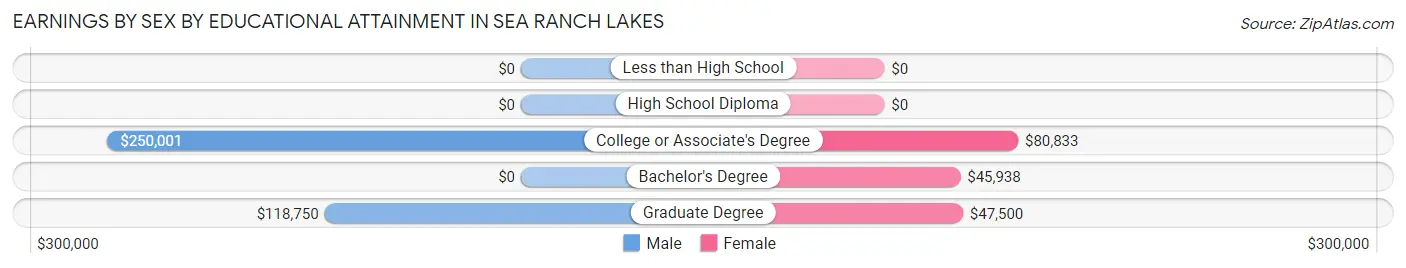
| Educational Attainment | Male Income | Female Income |
| Less than High School | - | - |
| High School Diploma | - | - |
| College or Associate's Degree | $250,001 | $80,833 |
| Bachelor's Degree | - | - |
| Graduate Degree | $118,750 | $47,500 |
| Total | $187,778 | $45,625 |
Family Income in Sea Ranch Lakes
Family Income Brackets in Sea Ranch Lakes
According to the Sea Ranch Lakes family income data, there are 77 families falling into the $200,000+ income range, which is the most common income bracket and makes up 59.7% of all families.
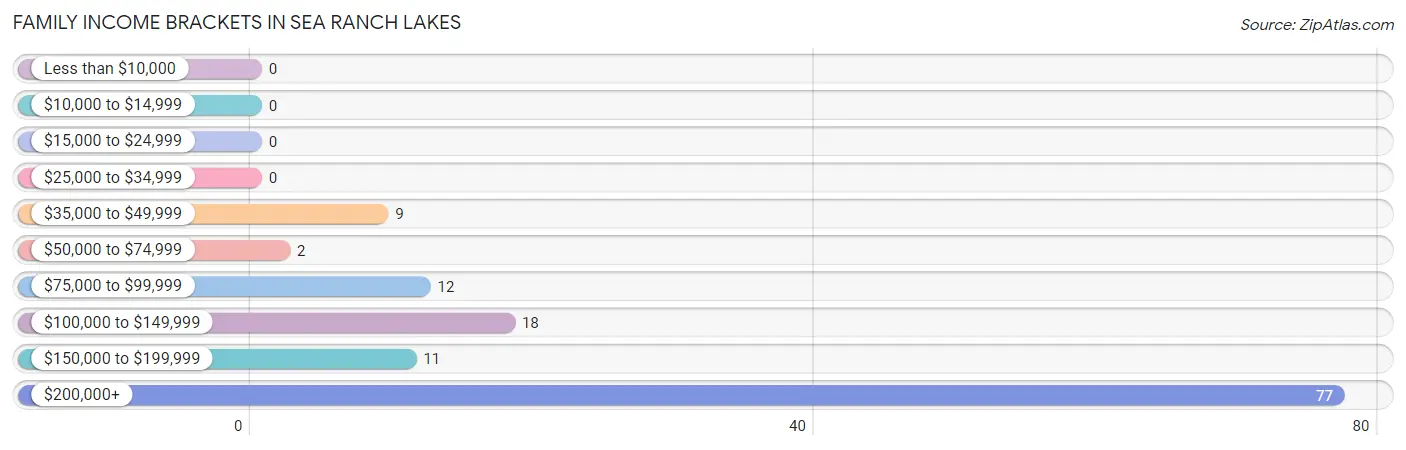
| Income Bracket | # Families | % Families |
| Less than $10,000 | 0 | 0.0% |
| $10,000 to $14,999 | 0 | 0.0% |
| $15,000 to $24,999 | 0 | 0.0% |
| $25,000 to $34,999 | 0 | 0.0% |
| $35,000 to $49,999 | 9 | 7.0% |
| $50,000 to $74,999 | 2 | 1.6% |
| $75,000 to $99,999 | 12 | 9.3% |
| $100,000 to $149,999 | 18 | 14.0% |
| $150,000 to $199,999 | 11 | 8.5% |
| $200,000+ | 77 | 59.7% |
Family Income by Famaliy Size in Sea Ranch Lakes
3-person families (23 | 17.8%) account for the highest median family income in Sea Ranch Lakes with $250,001 per family, while 2-person families (74 | 57.4%) have the highest median income of $108,750 per family member.
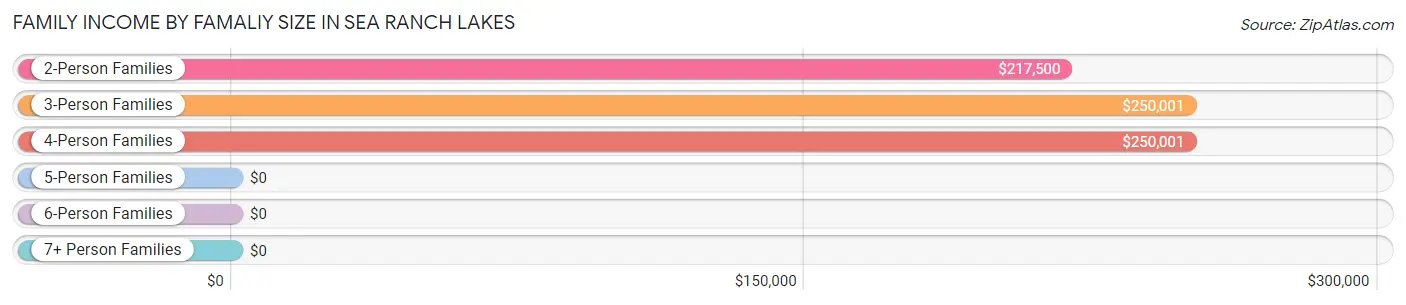
| Income Bracket | # Families | Median Income |
| 2-Person Families | 74 (57.4%) | $217,500 |
| 3-Person Families | 23 (17.8%) | $250,001 |
| 4-Person Families | 23 (17.8%) | $250,001 |
| 5-Person Families | 7 (5.4%) | $0 |
| 6-Person Families | 2 (1.5%) | $0 |
| 7+ Person Families | 0 (0.0%) | $0 |
| Total | 129 (100.0%) | $250,001 |
Family Income by Number of Earners in Sea Ranch Lakes
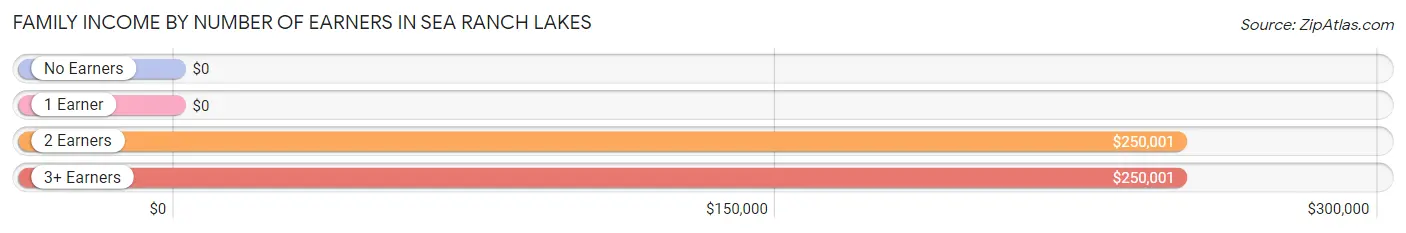
| Number of Earners | # Families | Median Income |
| No Earners | 8 (6.2%) | $0 |
| 1 Earner | 47 (36.4%) | $0 |
| 2 Earners | 66 (51.2%) | $250,001 |
| 3+ Earners | 8 (6.2%) | $250,001 |
| Total | 129 (100.0%) | $250,001 |
Household Income in Sea Ranch Lakes
Household Income Brackets in Sea Ranch Lakes
With 93 households falling in the category, the $200,000+ income range is the most frequent in Sea Ranch Lakes, accounting for 54.1% of all households.
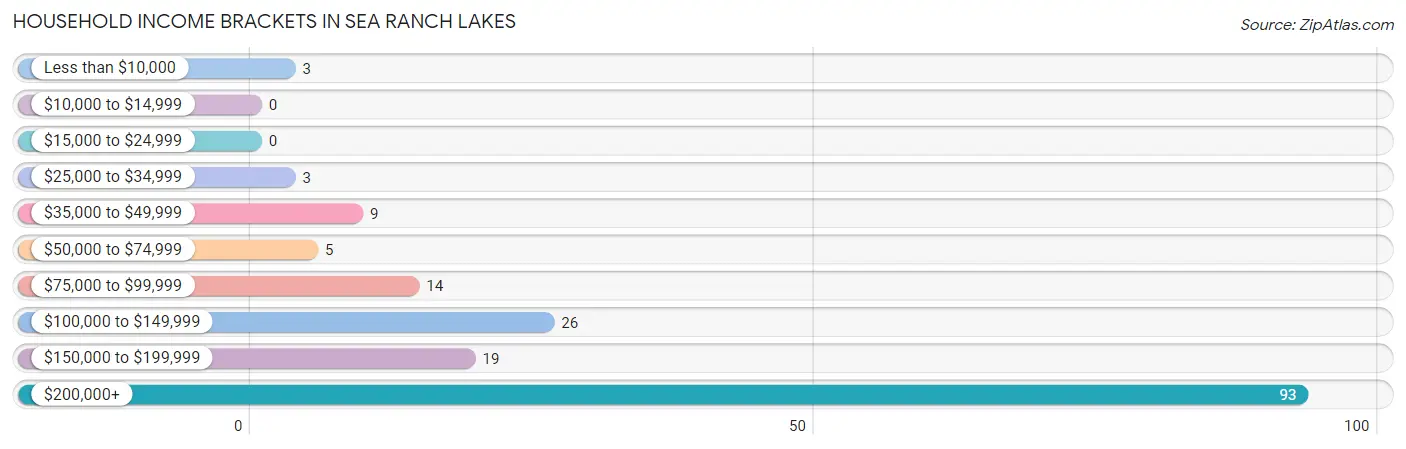
| Income Bracket | # Households | % Households |
| Less than $10,000 | 3 | 1.7% |
| $10,000 to $14,999 | 0 | 0.0% |
| $15,000 to $24,999 | 0 | 0.0% |
| $25,000 to $34,999 | 3 | 1.7% |
| $35,000 to $49,999 | 9 | 5.2% |
| $50,000 to $74,999 | 5 | 2.9% |
| $75,000 to $99,999 | 14 | 8.1% |
| $100,000 to $149,999 | 26 | 15.1% |
| $150,000 to $199,999 | 19 | 11.0% |
| $200,000+ | 93 | 54.1% |
Household Income by Householder Age in Sea Ranch Lakes
The median household income in Sea Ranch Lakes is $238,750, with the highest median household income of $250,001 found in the 25 to 44 years age bracket for the primary householder. A total of 23 households (13.4%) fall into this category.
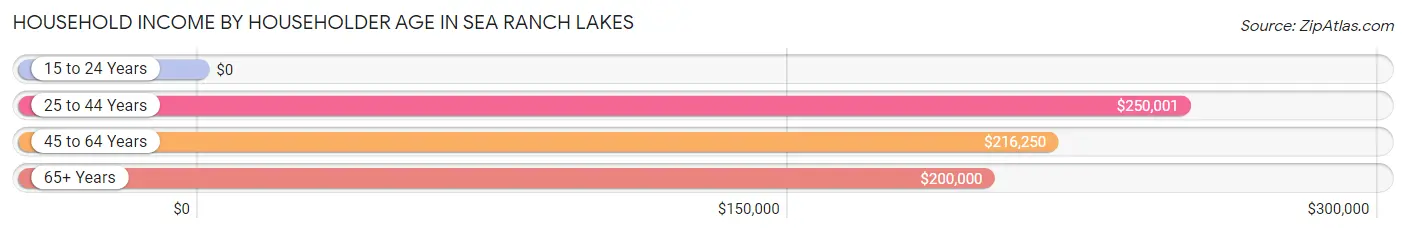
| Income Bracket | # Households | Median Income |
| 15 to 24 Years | 0 (0.0%) | $0 |
| 25 to 44 Years | 23 (13.4%) | $250,001 |
| 45 to 64 Years | 79 (45.9%) | $216,250 |
| 65+ Years | 70 (40.7%) | $200,000 |
| Total | 172 (100.0%) | $238,750 |
Poverty in Sea Ranch Lakes
Income Below Poverty by Sex and Age in Sea Ranch Lakes
With 0.4% poverty level for males and 1.8% for females among the residents of Sea Ranch Lakes, 75 year old and over males and 35 to 44 year old females are the most vulnerable to poverty, with 1 males (5.9%) and 2 females (10.0%) in their respective age groups living below the poverty level.
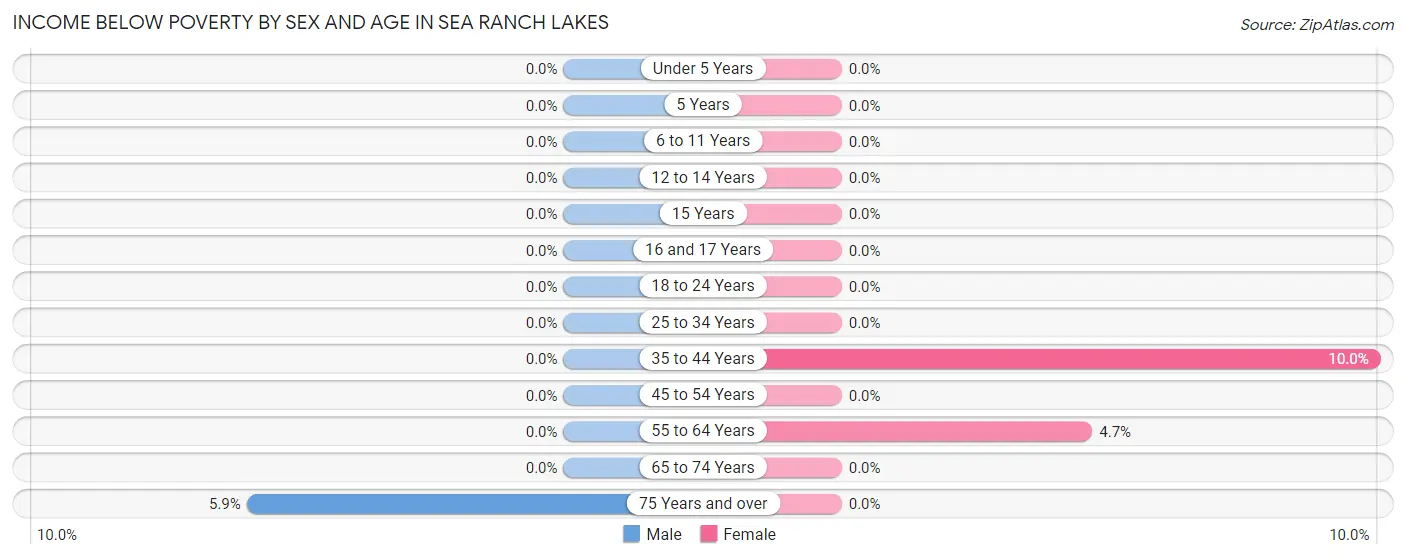
| Age Bracket | Male | Female |
| Under 5 Years | 0 (0.0%) | 0 (0.0%) |
| 5 Years | 0 (0.0%) | 0 (0.0%) |
| 6 to 11 Years | 0 (0.0%) | 0 (0.0%) |
| 12 to 14 Years | 0 (0.0%) | 0 (0.0%) |
| 15 Years | 0 (0.0%) | 0 (0.0%) |
| 16 and 17 Years | 0 (0.0%) | 0 (0.0%) |
| 18 to 24 Years | 0 (0.0%) | 0 (0.0%) |
| 25 to 34 Years | 0 (0.0%) | 0 (0.0%) |
| 35 to 44 Years | 0 (0.0%) | 2 (10.0%) |
| 45 to 54 Years | 0 (0.0%) | 0 (0.0%) |
| 55 to 64 Years | 0 (0.0%) | 2 (4.6%) |
| 65 to 74 Years | 0 (0.0%) | 0 (0.0%) |
| 75 Years and over | 1 (5.9%) | 0 (0.0%) |
| Total | 1 (0.4%) | 4 (1.8%) |
Income Above Poverty by Sex and Age in Sea Ranch Lakes
According to the poverty statistics in Sea Ranch Lakes, males aged under 5 years and females aged under 5 years are the age groups that are most secure financially, with 100.0% of males and 100.0% of females in these age groups living above the poverty line.
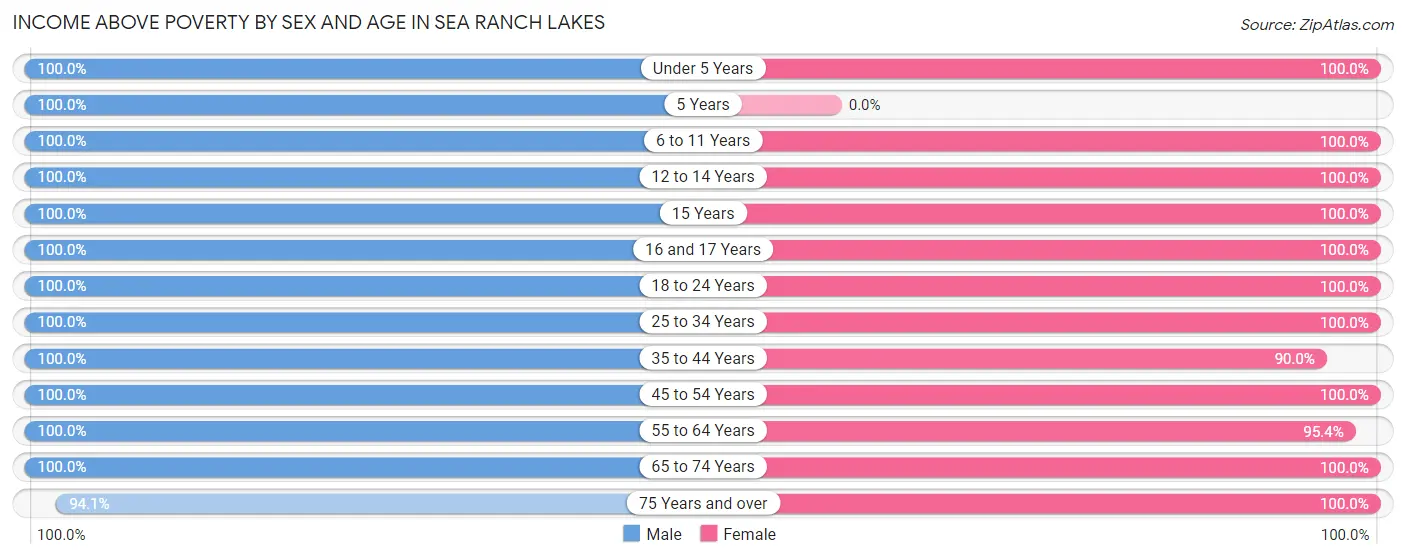
| Age Bracket | Male | Female |
| Under 5 Years | 9 (100.0%) | 10 (100.0%) |
| 5 Years | 2 (100.0%) | 0 (0.0%) |
| 6 to 11 Years | 13 (100.0%) | 17 (100.0%) |
| 12 to 14 Years | 7 (100.0%) | 4 (100.0%) |
| 15 Years | 3 (100.0%) | 6 (100.0%) |
| 16 and 17 Years | 16 (100.0%) | 16 (100.0%) |
| 18 to 24 Years | 21 (100.0%) | 9 (100.0%) |
| 25 to 34 Years | 9 (100.0%) | 3 (100.0%) |
| 35 to 44 Years | 21 (100.0%) | 18 (90.0%) |
| 45 to 54 Years | 36 (100.0%) | 42 (100.0%) |
| 55 to 64 Years | 32 (100.0%) | 41 (95.4%) |
| 65 to 74 Years | 39 (100.0%) | 26 (100.0%) |
| 75 Years and over | 16 (94.1%) | 22 (100.0%) |
| Total | 224 (99.6%) | 214 (98.2%) |
Income Below Poverty Among Married-Couple Families in Sea Ranch Lakes
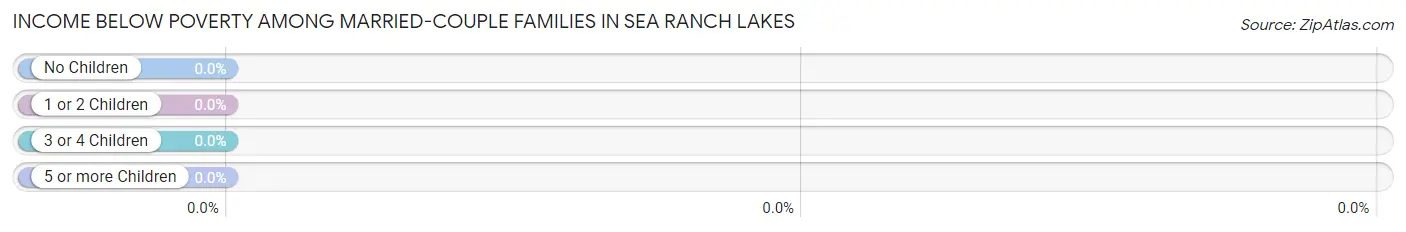
| Children | Above Poverty | Below Poverty |
| No Children | 70 (100.0%) | 0 (0.0%) |
| 1 or 2 Children | 32 (100.0%) | 0 (0.0%) |
| 3 or 4 Children | 5 (100.0%) | 0 (0.0%) |
| 5 or more Children | 0 (0.0%) | 0 (0.0%) |
| Total | 107 (100.0%) | 0 (0.0%) |
Income Below Poverty Among Single-Parent Households in Sea Ranch Lakes
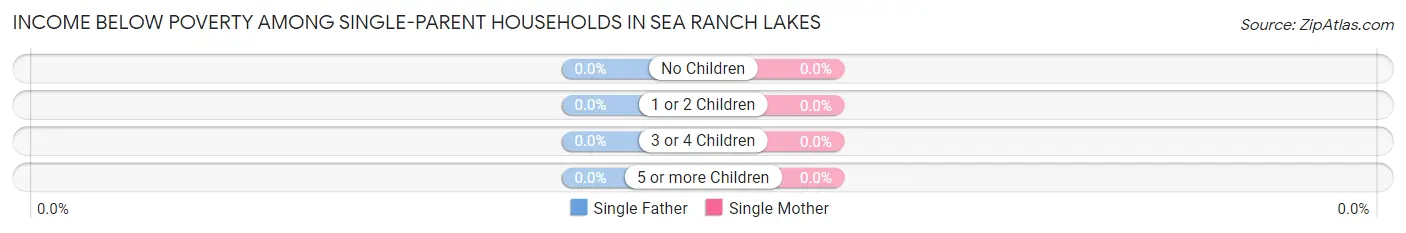
| Children | Single Father | Single Mother |
| No Children | 0 (0.0%) | 0 (0.0%) |
| 1 or 2 Children | 0 (0.0%) | 0 (0.0%) |
| 3 or 4 Children | 0 (0.0%) | 0 (0.0%) |
| 5 or more Children | 0 (0.0%) | 0 (0.0%) |
| Total | 0 (0.0%) | 0 (0.0%) |
Income Below Poverty Among Married-Couple vs Single-Parent Households in Sea Ranch Lakes
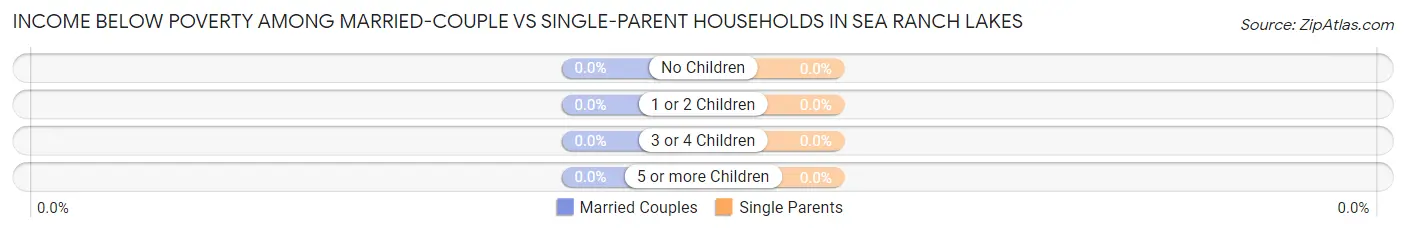
| Children | Married-Couple Families | Single-Parent Households |
| No Children | 0 (0.0%) | 0 (0.0%) |
| 1 or 2 Children | 0 (0.0%) | 0 (0.0%) |
| 3 or 4 Children | 0 (0.0%) | 0 (0.0%) |
| 5 or more Children | 0 (0.0%) | 0 (0.0%) |
| Total | 0 (0.0%) | 0 (0.0%) |
Race in Sea Ranch Lakes
The most populous races in Sea Ranch Lakes are White / Caucasian (364 | 82.2%), Hispanic or Latino (73 | 16.5%), and Two or more Races (61 | 13.8%).
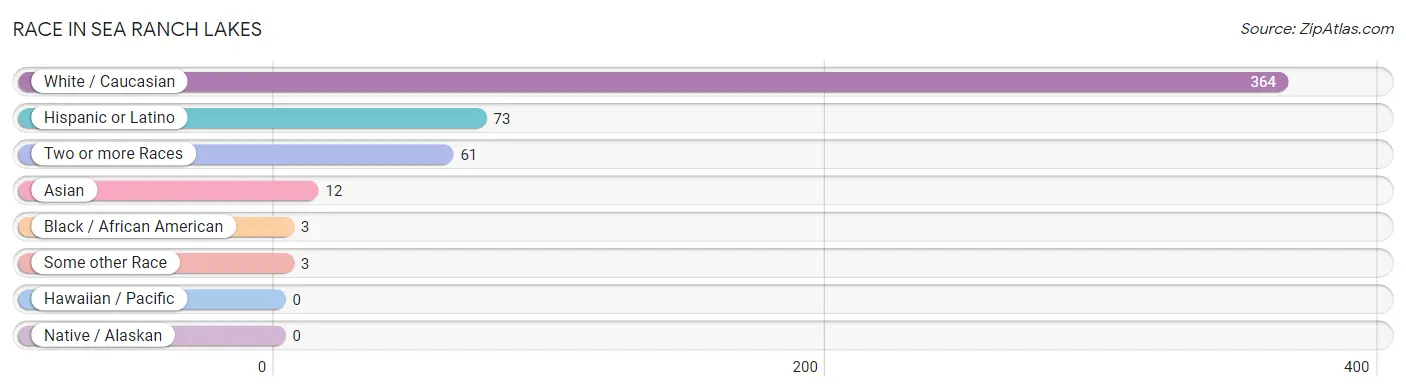
| Race | # Population | % Population |
| Asian | 12 | 2.7% |
| Black / African American | 3 | 0.7% |
| Hawaiian / Pacific | 0 | 0.0% |
| Hispanic or Latino | 73 | 16.5% |
| Native / Alaskan | 0 | 0.0% |
| White / Caucasian | 364 | 82.2% |
| Two or more Races | 61 | 13.8% |
| Some other Race | 3 | 0.7% |
| Total | 443 | 100.0% |
Ancestry in Sea Ranch Lakes
The most populous ancestries reported in Sea Ranch Lakes are German (61 | 13.8%), Italian (50 | 11.3%), Irish (38 | 8.6%), American (29 | 6.6%), and British (24 | 5.4%), together accounting for 45.6% of all Sea Ranch Lakes residents.
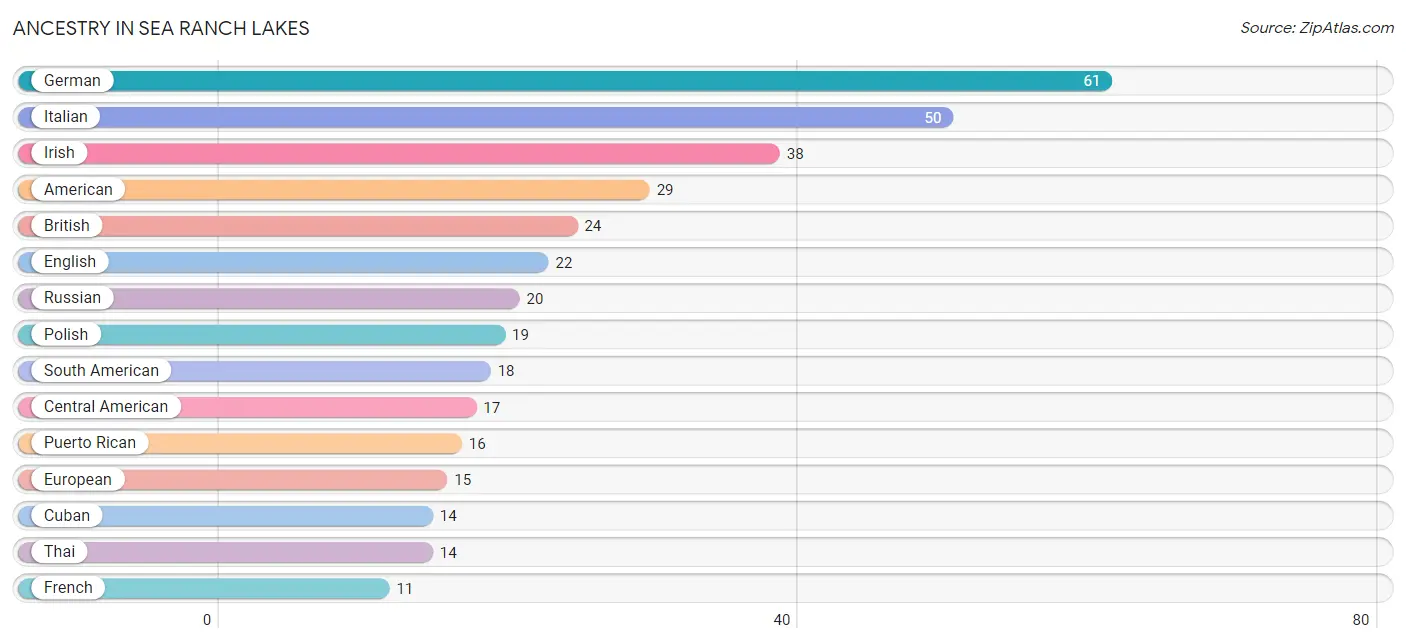
| Ancestry | # Population | % Population |
| American | 29 | 6.6% |
| Arab | 2 | 0.4% |
| Argentinean | 10 | 2.3% |
| Austrian | 2 | 0.4% |
| Brazilian | 4 | 0.9% |
| British | 24 | 5.4% |
| Central American | 17 | 3.8% |
| Colombian | 8 | 1.8% |
| Cuban | 14 | 3.2% |
| English | 22 | 5.0% |
| European | 15 | 3.4% |
| French | 11 | 2.5% |
| French Canadian | 1 | 0.2% |
| German | 61 | 13.8% |
| Greek | 7 | 1.6% |
| Guatemalan | 2 | 0.4% |
| Indian (Asian) | 3 | 0.7% |
| Indonesian | 2 | 0.4% |
| Iraqi | 1 | 0.2% |
| Irish | 38 | 8.6% |
| Italian | 50 | 11.3% |
| Lebanese | 1 | 0.2% |
| Lithuanian | 1 | 0.2% |
| Panamanian | 5 | 1.1% |
| Polish | 19 | 4.3% |
| Puerto Rican | 16 | 3.6% |
| Romanian | 2 | 0.4% |
| Russian | 20 | 4.5% |
| Salvadoran | 10 | 2.3% |
| Scotch-Irish | 5 | 1.1% |
| Scottish | 2 | 0.4% |
| South American | 18 | 4.1% |
| Swiss | 3 | 0.7% |
| Thai | 14 | 3.2% |
| Welsh | 2 | 0.4% |
| Yugoslavian | 2 | 0.4% | View All 36 Rows |
Immigrants in Sea Ranch Lakes
The most numerous immigrant groups reported in Sea Ranch Lakes came from Latin America (34 | 7.7%), Europe (32 | 7.2%), South America (24 | 5.4%), England (15 | 3.4%), and Northern Europe (15 | 3.4%), together accounting for 27.1% of all Sea Ranch Lakes residents.
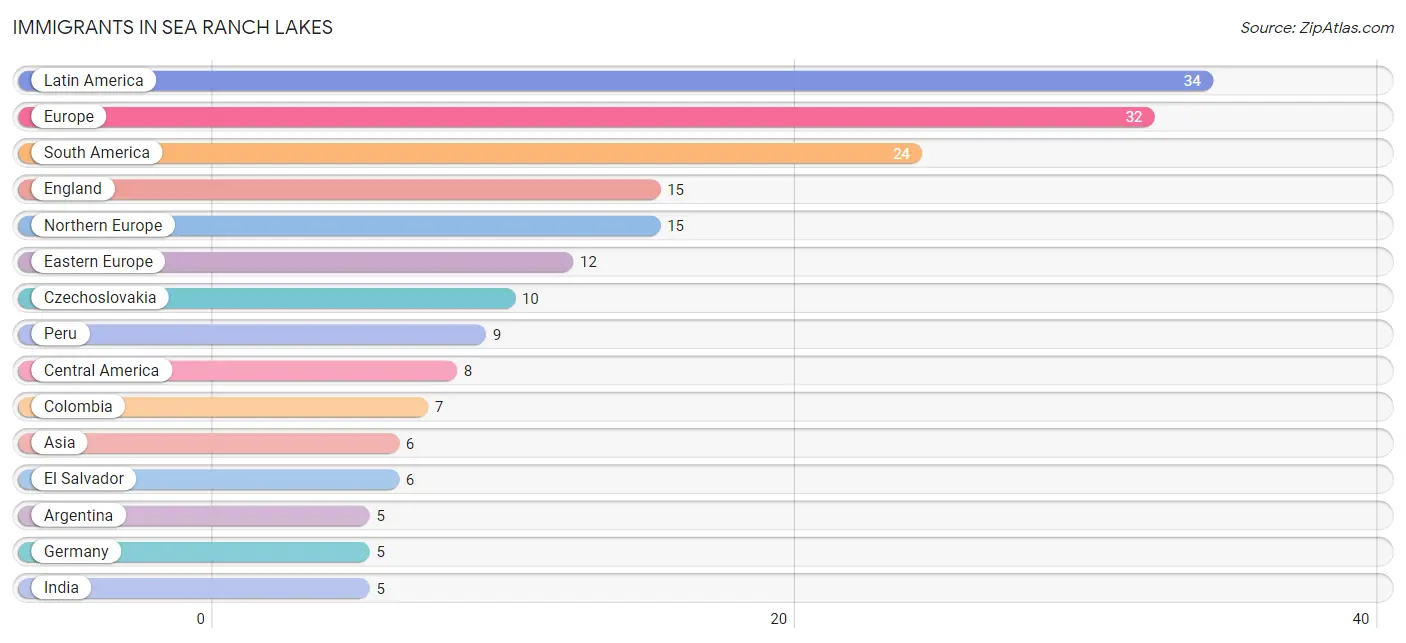
| Immigration Origin | # Population | % Population |
| Africa | 2 | 0.4% |
| Argentina | 5 | 1.1% |
| Asia | 6 | 1.3% |
| Bosnia and Herzegovina | 2 | 0.4% |
| Brazil | 3 | 0.7% |
| Canada | 1 | 0.2% |
| Caribbean | 2 | 0.4% |
| Central America | 8 | 1.8% |
| Colombia | 7 | 1.6% |
| Cuba | 2 | 0.4% |
| Czechoslovakia | 10 | 2.3% |
| Eastern Europe | 12 | 2.7% |
| El Salvador | 6 | 1.3% |
| England | 15 | 3.4% |
| Europe | 32 | 7.2% |
| Germany | 5 | 1.1% |
| Guatemala | 2 | 0.4% |
| India | 5 | 1.1% |
| Iraq | 1 | 0.2% |
| Latin America | 34 | 7.7% |
| Northern Europe | 15 | 3.4% |
| Peru | 9 | 2.0% |
| South Africa | 2 | 0.4% |
| South America | 24 | 5.4% |
| South Central Asia | 5 | 1.1% |
| Western Asia | 1 | 0.2% |
| Western Europe | 5 | 1.1% | View All 27 Rows |
Sex and Age in Sea Ranch Lakes
Sex and Age in Sea Ranch Lakes
The most populous age groups in Sea Ranch Lakes are 15 to 19 Years (35 | 15.6%) for men and 15 to 19 Years (31 | 14.2%) for women.
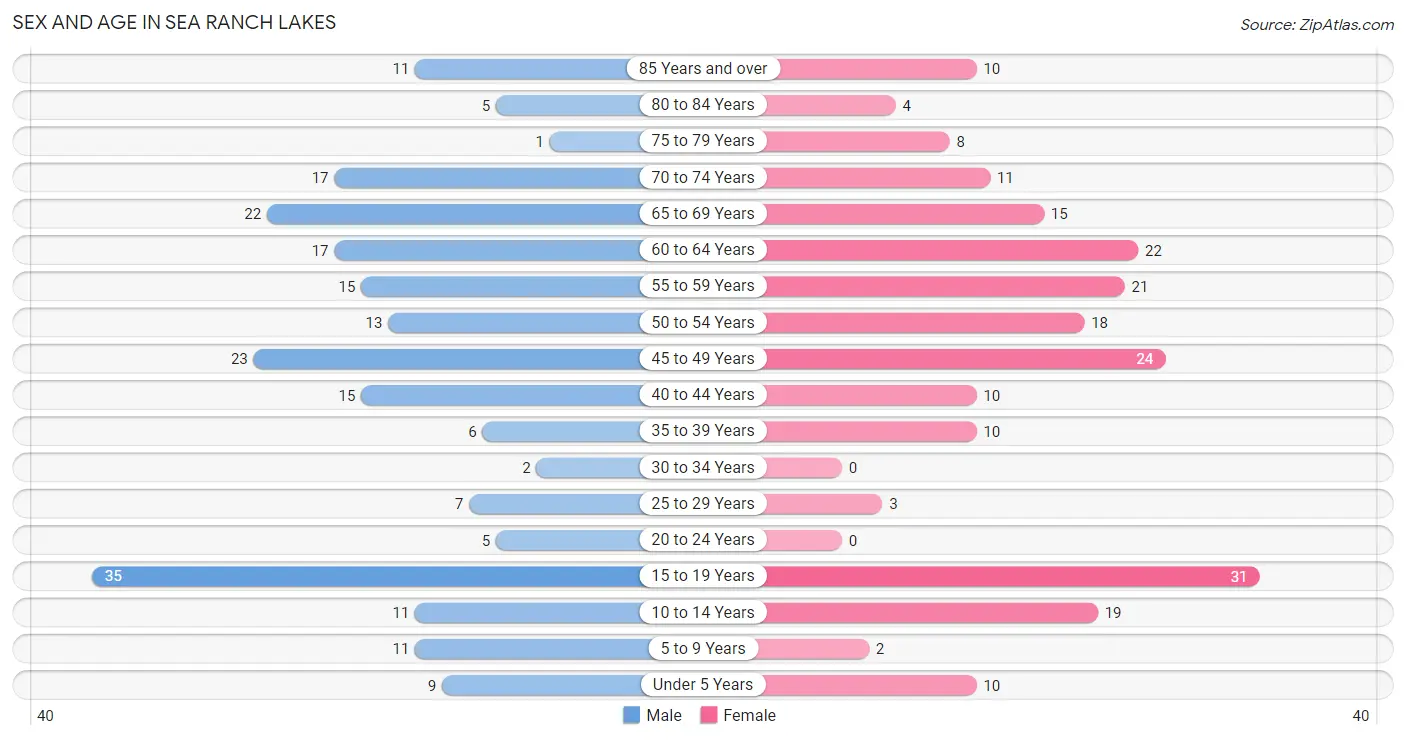
| Age Bracket | Male | Female |
| Under 5 Years | 9 (4.0%) | 10 (4.6%) |
| 5 to 9 Years | 11 (4.9%) | 2 (0.9%) |
| 10 to 14 Years | 11 (4.9%) | 19 (8.7%) |
| 15 to 19 Years | 35 (15.6%) | 31 (14.2%) |
| 20 to 24 Years | 5 (2.2%) | 0 (0.0%) |
| 25 to 29 Years | 7 (3.1%) | 3 (1.4%) |
| 30 to 34 Years | 2 (0.9%) | 0 (0.0%) |
| 35 to 39 Years | 6 (2.7%) | 10 (4.6%) |
| 40 to 44 Years | 15 (6.7%) | 10 (4.6%) |
| 45 to 49 Years | 23 (10.2%) | 24 (11.0%) |
| 50 to 54 Years | 13 (5.8%) | 18 (8.3%) |
| 55 to 59 Years | 15 (6.7%) | 21 (9.6%) |
| 60 to 64 Years | 17 (7.6%) | 22 (10.1%) |
| 65 to 69 Years | 22 (9.8%) | 15 (6.9%) |
| 70 to 74 Years | 17 (7.6%) | 11 (5.1%) |
| 75 to 79 Years | 1 (0.4%) | 8 (3.7%) |
| 80 to 84 Years | 5 (2.2%) | 4 (1.8%) |
| 85 Years and over | 11 (4.9%) | 10 (4.6%) |
| Total | 225 (100.0%) | 218 (100.0%) |
Families and Households in Sea Ranch Lakes
Median Family Size in Sea Ranch Lakes
The median family size in Sea Ranch Lakes is 3.05 persons per family, with single male/father families (8 | 6.2%) accounting for the largest median family size of 4.25 persons per family. On the other hand, single female/mother families (14 | 10.8%) represent the smallest median family size with 2.29 persons per family.
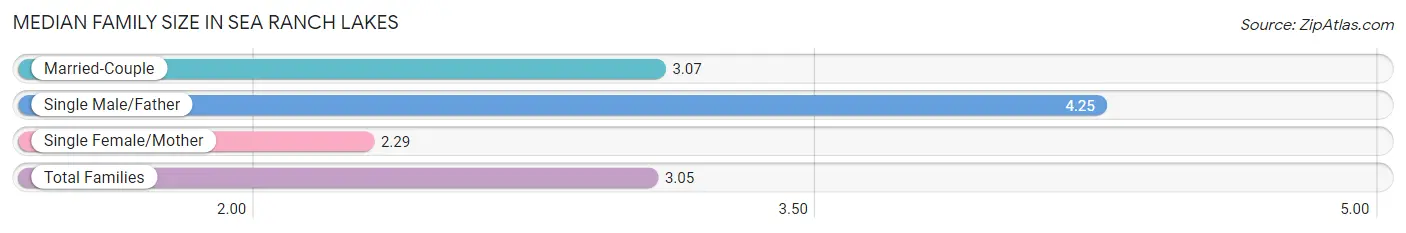
| Family Type | # Families | Family Size |
| Married-Couple | 107 (83.0%) | 3.07 |
| Single Male/Father | 8 (6.2%) | 4.25 |
| Single Female/Mother | 14 (10.8%) | 2.29 |
| Total Families | 129 (100.0%) | 3.05 |
Median Household Size in Sea Ranch Lakes
The median household size in Sea Ranch Lakes is 2.58 persons per household, with single male/father households (8 | 4.6%) accounting for the largest median household size of 4.5 persons per household. non-family households (43 | 25.0%) represent the smallest median household size with 1.09 persons per household.
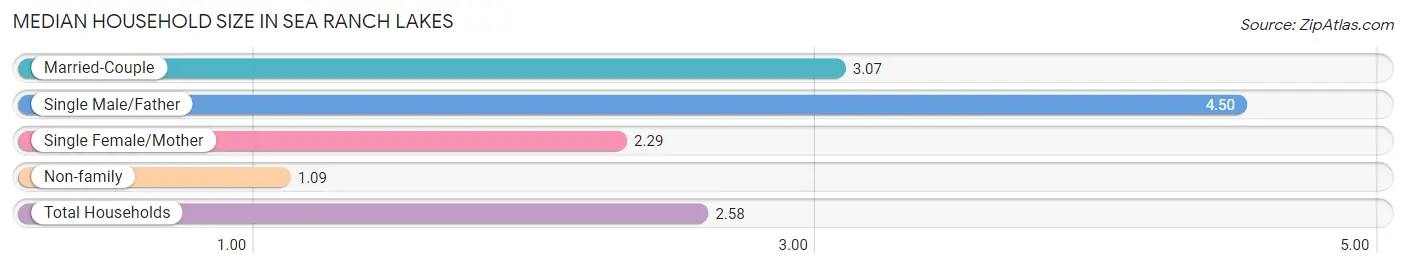
| Household Type | # Households | Household Size |
| Married-Couple | 107 (62.2%) | 3.07 |
| Single Male/Father | 8 (4.6%) | 4.50 |
| Single Female/Mother | 14 (8.1%) | 2.29 |
| Non-family | 43 (25.0%) | 1.09 |
| Total Households | 172 (100.0%) | 2.58 |
Household Size by Marriage Status in Sea Ranch Lakes
Out of a total of 172 households in Sea Ranch Lakes, 129 (75.0%) are family households, while 43 (25.0%) are nonfamily households. The most numerous type of family households are 2-person households, comprising 74, and the most common type of nonfamily households are 1-person households, comprising 39.
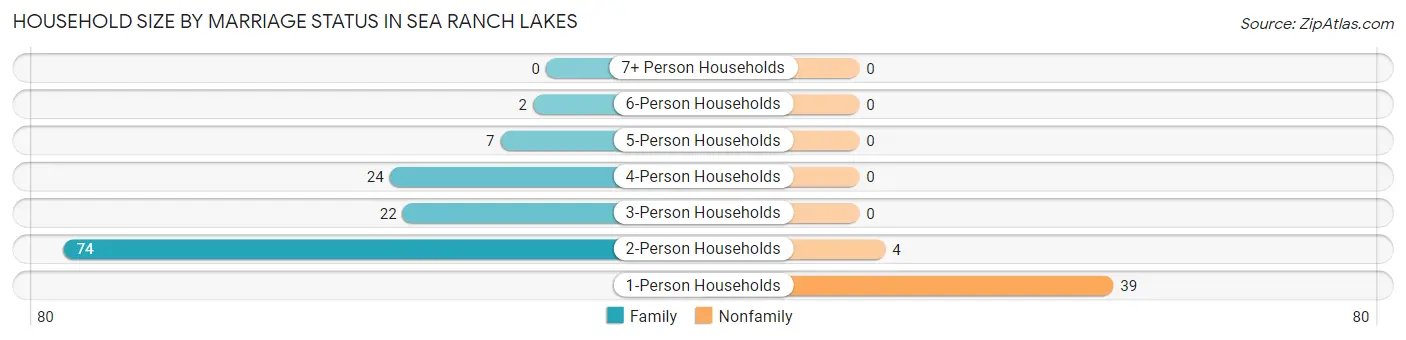
| Household Size | Family Households | Nonfamily Households |
| 1-Person Households | - | 39 (22.7%) |
| 2-Person Households | 74 (43.0%) | 4 (2.3%) |
| 3-Person Households | 22 (12.8%) | 0 (0.0%) |
| 4-Person Households | 24 (14.0%) | 0 (0.0%) |
| 5-Person Households | 7 (4.1%) | 0 (0.0%) |
| 6-Person Households | 2 (1.2%) | 0 (0.0%) |
| 7+ Person Households | 0 (0.0%) | 0 (0.0%) |
| Total | 129 (75.0%) | 43 (25.0%) |
Female Fertility in Sea Ranch Lakes
Fertility by Age in Sea Ranch Lakes
| Age Bracket | Women with Births | Births / 1,000 Women |
| 15 to 19 years | 0 (0.0%) | 0.0 |
| 20 to 34 years | 0 (0.0%) | 0.0 |
| 35 to 50 years | 0 (0.0%) | 0.0 |
| Total | 0 (0.0%) | 0.0 |
Fertility by Age by Marriage Status in Sea Ranch Lakes
| Age Bracket | Married | Unmarried |
| 15 to 19 years | 0 (0.0%) | 0 (0.0%) |
| 20 to 34 years | 0 (0.0%) | 0 (0.0%) |
| 35 to 50 years | 0 (0.0%) | 0 (0.0%) |
| Total | 0 (0.0%) | 0 (0.0%) |
Fertility by Education in Sea Ranch Lakes
| Educational Attainment | Women with Births | Births / 1,000 Women |
| Less than High School | 0 (0.0%) | 0.0 |
| High School Diploma | 0 (0.0%) | 0.0 |
| College or Associate's Degree | 0 (0.0%) | 0.0 |
| Bachelor's Degree | 0 (0.0%) | 0.0 |
| Graduate Degree | 0 (0.0%) | 0.0 |
| Total | 0 (0.0%) | 0.0 |
Fertility by Education by Marriage Status in Sea Ranch Lakes
| Educational Attainment | Married | Unmarried |
| Less than High School | 0 (0.0%) | 0 (0.0%) |
| High School Diploma | 0 (0.0%) | 0 (0.0%) |
| College or Associate's Degree | 0 (0.0%) | 0 (0.0%) |
| Bachelor's Degree | 0 (0.0%) | 0 (0.0%) |
| Graduate Degree | 0 (0.0%) | 0 (0.0%) |
| Total | 0 (0.0%) | 0 (0.0%) |
Employment Characteristics in Sea Ranch Lakes
Employment by Class of Employer in Sea Ranch Lakes
Among the 199 employed individuals in Sea Ranch Lakes, private company employees (115 | 57.8%), self-employed (incorporated) (53 | 26.6%), and self-employed (not incorporated) (15 | 7.5%) make up the most common classes of employment.
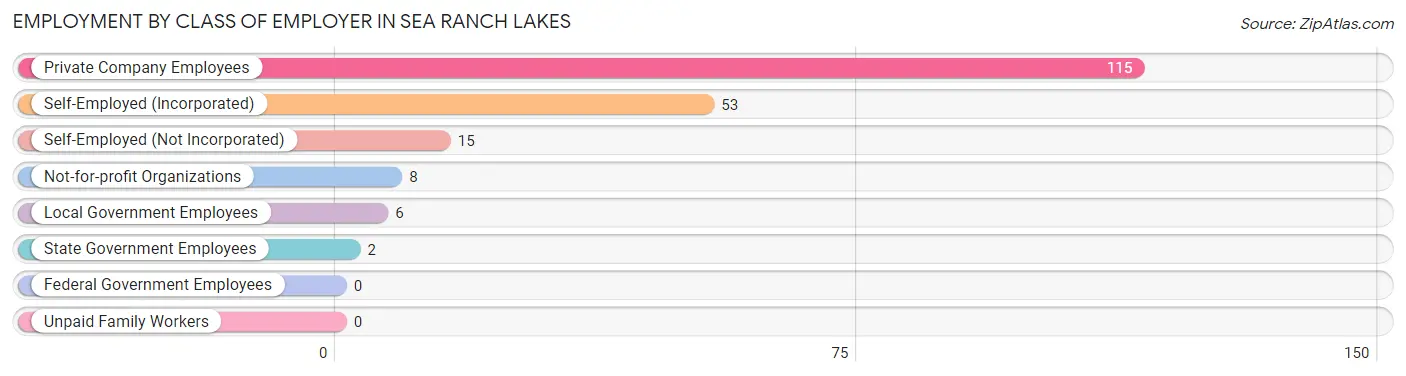
| Employer Class | # Employees | % Employees |
| Private Company Employees | 115 | 57.8% |
| Self-Employed (Incorporated) | 53 | 26.6% |
| Self-Employed (Not Incorporated) | 15 | 7.5% |
| Not-for-profit Organizations | 8 | 4.0% |
| Local Government Employees | 6 | 3.0% |
| State Government Employees | 2 | 1.0% |
| Federal Government Employees | 0 | 0.0% |
| Unpaid Family Workers | 0 | 0.0% |
| Total | 199 | 100.0% |
Employment Status by Age in Sea Ranch Lakes
According to the labor force statistics for Sea Ranch Lakes, out of the total population over 16 years of age (372), 54.0% or 201 individuals are in the labor force, with 1.0% or 2 of them unemployed. The age group with the highest labor force participation rate is 25 to 29 years, with 100.0% or 10 individuals in the labor force. Within the labor force, the 16 to 19 years age range has the highest percentage of unemployed individuals, with 100.0% or 2 of them being unemployed.
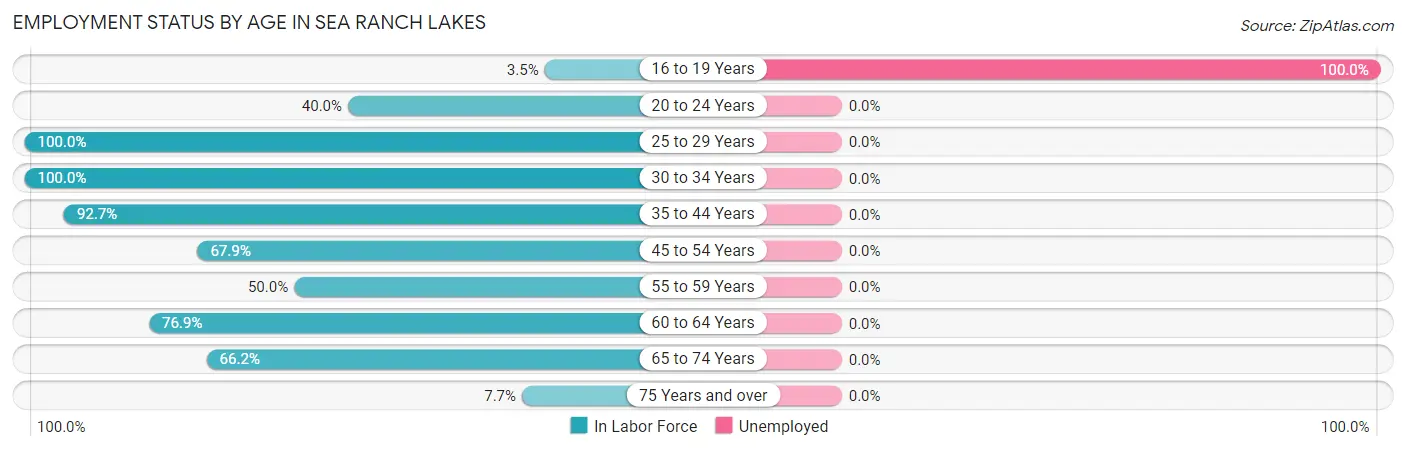
| Age Bracket | In Labor Force | Unemployed |
| 16 to 19 Years | 2 (3.5%) | 2 (100.0%) |
| 20 to 24 Years | 2 (40.0%) | 0 (0.0%) |
| 25 to 29 Years | 10 (100.0%) | 0 (0.0%) |
| 30 to 34 Years | 2 (100.0%) | 0 (0.0%) |
| 35 to 44 Years | 38 (92.7%) | 0 (0.0%) |
| 45 to 54 Years | 53 (67.9%) | 0 (0.0%) |
| 55 to 59 Years | 18 (50.0%) | 0 (0.0%) |
| 60 to 64 Years | 30 (76.9%) | 0 (0.0%) |
| 65 to 74 Years | 43 (66.2%) | 0 (0.0%) |
| 75 Years and over | 3 (7.7%) | 0 (0.0%) |
| Total | 201 (54.0%) | 2 (1.0%) |
Employment Status by Educational Attainment in Sea Ranch Lakes
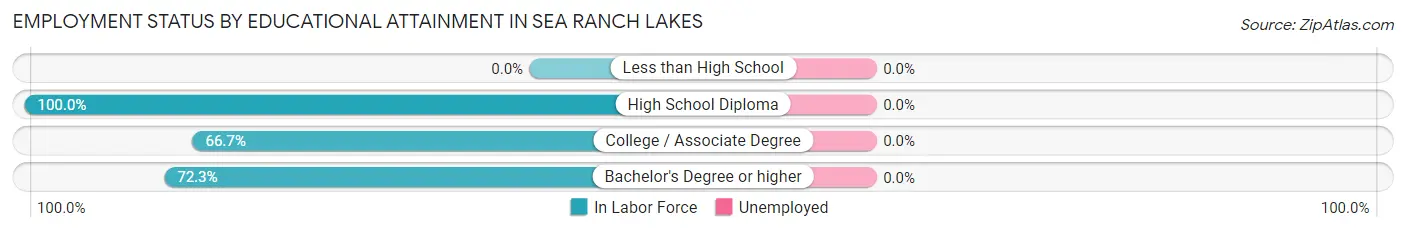
| Educational Attainment | In Labor Force | Unemployed |
| Less than High School | 0 (0.0%) | 0 (0.0%) |
| High School Diploma | 13 (100.0%) | 0 (0.0%) |
| College / Associate Degree | 18 (66.7%) | 0 (0.0%) |
| Bachelor's Degree or higher | 120 (72.3%) | 0 (0.0%) |
| Total | 151 (73.3%) | 0 (0.0%) |
Employment Occupations by Sex in Sea Ranch Lakes
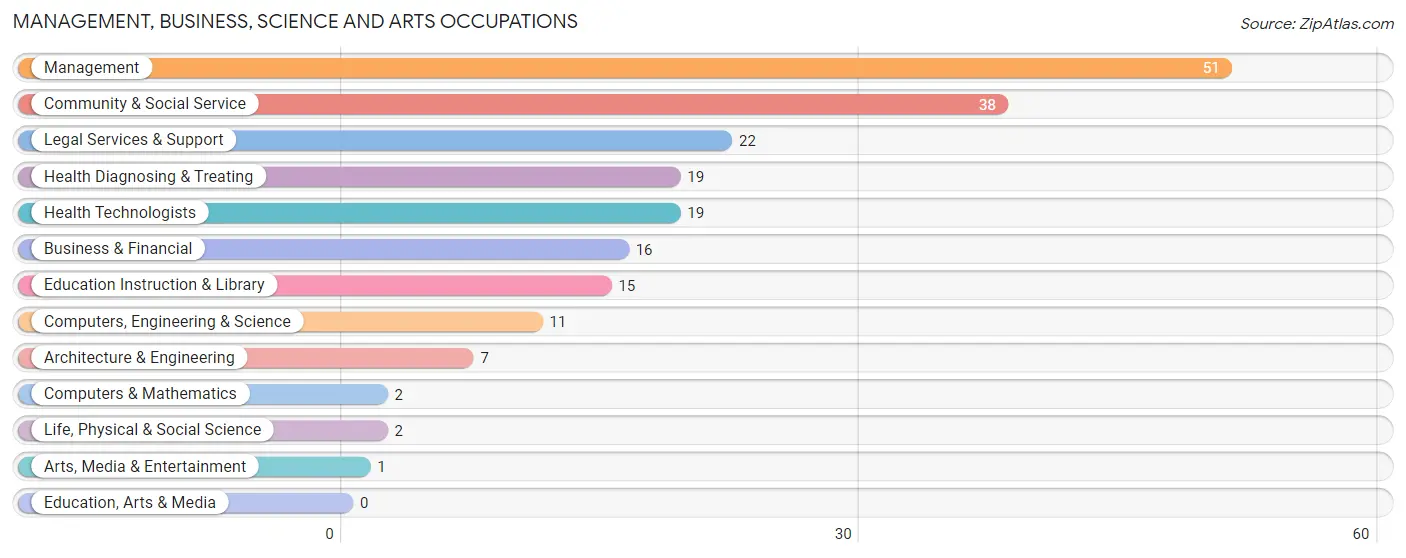
Management, Business, Science and Arts Occupations
The most common Management, Business, Science and Arts occupations in Sea Ranch Lakes are Management (51 | 25.6%), Community & Social Service (38 | 19.1%), Legal Services & Support (22 | 11.1%), Health Diagnosing & Treating (19 | 9.6%), and Health Technologists (19 | 9.6%).
Management, Business, Science and Arts Occupations by Sex
Within the Management, Business, Science and Arts occupations in Sea Ranch Lakes, the most male-oriented occupations are Computers, Engineering & Science (100.0%), Computers & Mathematics (100.0%), and Architecture & Engineering (100.0%), while the most female-oriented occupations are Arts, Media & Entertainment (100.0%), Education Instruction & Library (86.7%), and Community & Social Service (57.9%).
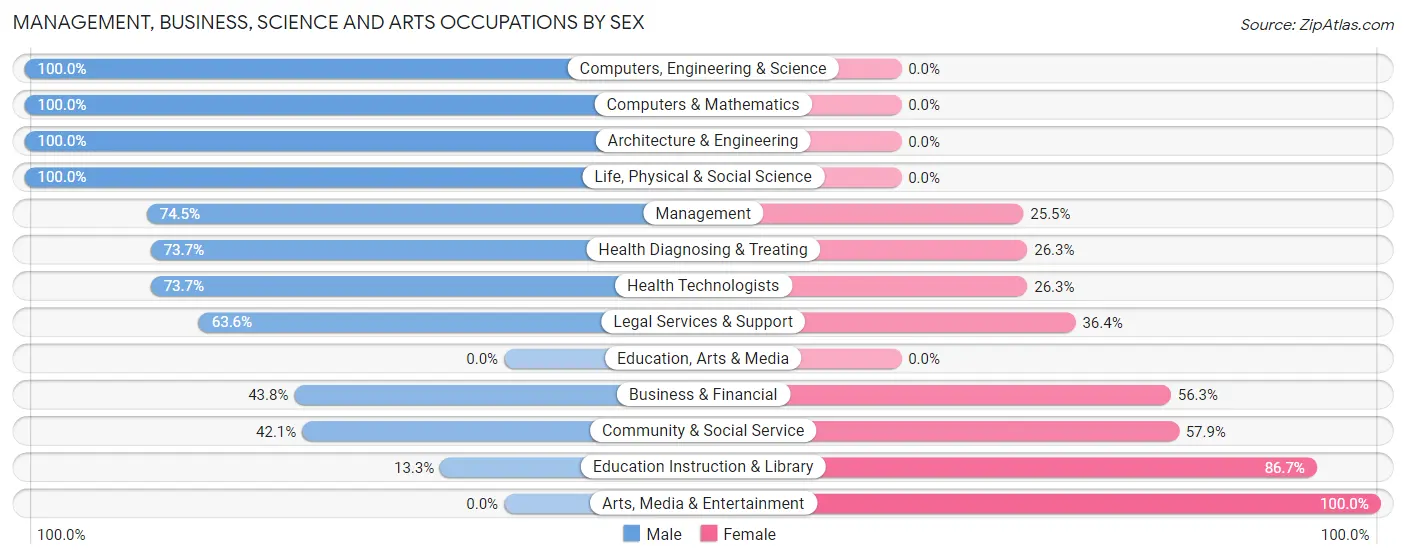
| Occupation | Male | Female |
| Management | 38 (74.5%) | 13 (25.5%) |
| Business & Financial | 7 (43.8%) | 9 (56.2%) |
| Computers, Engineering & Science | 11 (100.0%) | 0 (0.0%) |
| Computers & Mathematics | 2 (100.0%) | 0 (0.0%) |
| Architecture & Engineering | 7 (100.0%) | 0 (0.0%) |
| Life, Physical & Social Science | 2 (100.0%) | 0 (0.0%) |
| Community & Social Service | 16 (42.1%) | 22 (57.9%) |
| Education, Arts & Media | 0 (0.0%) | 0 (0.0%) |
| Legal Services & Support | 14 (63.6%) | 8 (36.4%) |
| Education Instruction & Library | 2 (13.3%) | 13 (86.7%) |
| Arts, Media & Entertainment | 0 (0.0%) | 1 (100.0%) |
| Health Diagnosing & Treating | 14 (73.7%) | 5 (26.3%) |
| Health Technologists | 14 (73.7%) | 5 (26.3%) |
| Total (Category) | 86 (63.7%) | 49 (36.3%) |
| Total (Overall) | 117 (58.8%) | 82 (41.2%) |
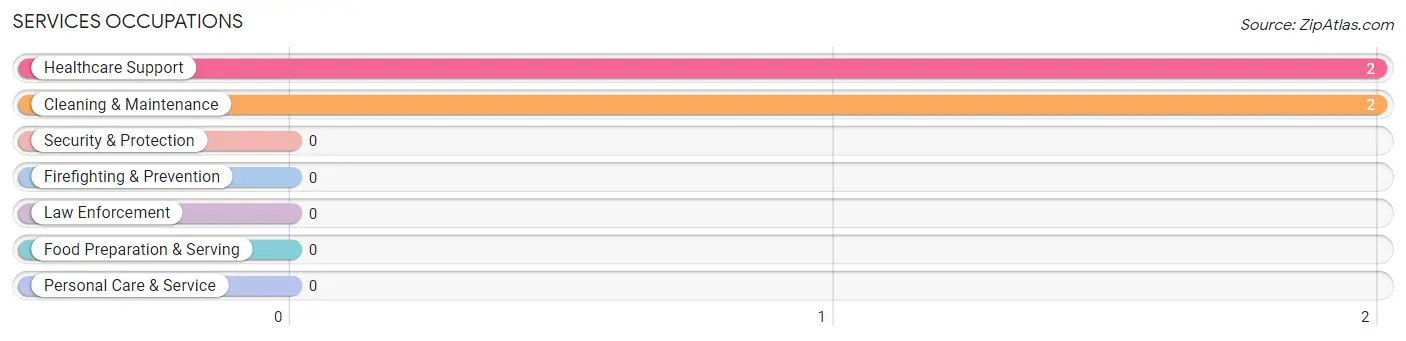
Services Occupations
The most common Services occupations in Sea Ranch Lakes are Healthcare Support (2 | 1.0%), and Cleaning & Maintenance (2 | 1.0%).
Services Occupations by Sex
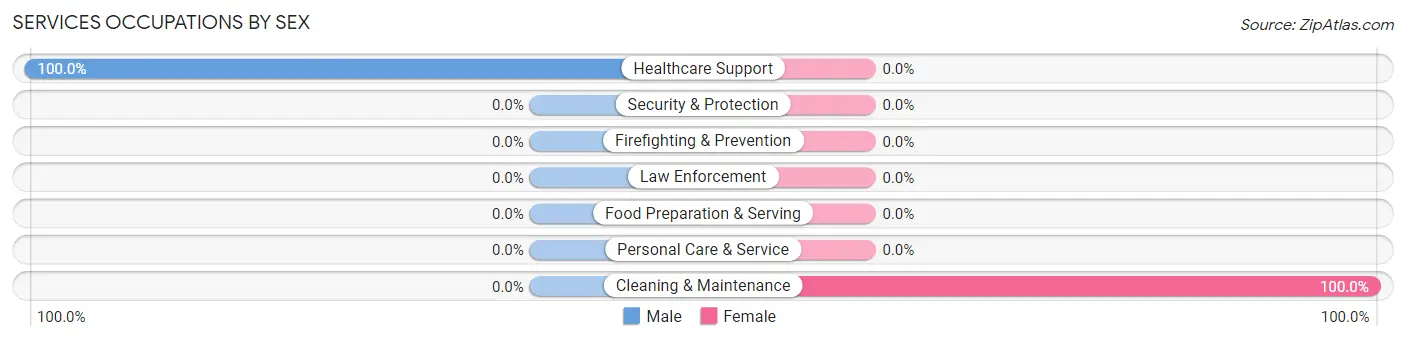
| Occupation | Male | Female |
| Healthcare Support | 2 (100.0%) | 0 (0.0%) |
| Security & Protection | 0 (0.0%) | 0 (0.0%) |
| Firefighting & Prevention | 0 (0.0%) | 0 (0.0%) |
| Law Enforcement | 0 (0.0%) | 0 (0.0%) |
| Food Preparation & Serving | 0 (0.0%) | 0 (0.0%) |
| Cleaning & Maintenance | 0 (0.0%) | 2 (100.0%) |
| Personal Care & Service | 0 (0.0%) | 0 (0.0%) |
| Total (Category) | 2 (50.0%) | 2 (50.0%) |
| Total (Overall) | 117 (58.8%) | 82 (41.2%) |
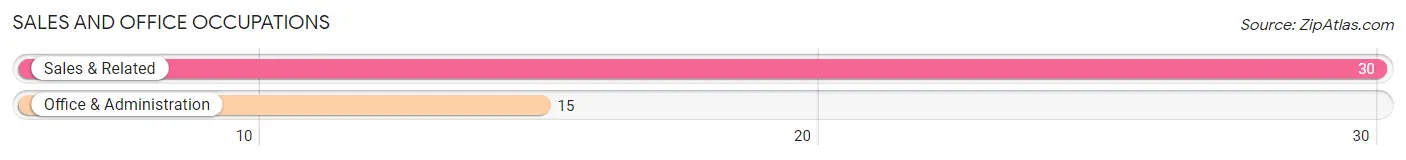
Sales and Office Occupations
The most common Sales and Office occupations in Sea Ranch Lakes are Sales & Related (30 | 15.1%), and Office & Administration (15 | 7.5%).
Sales and Office Occupations by Sex
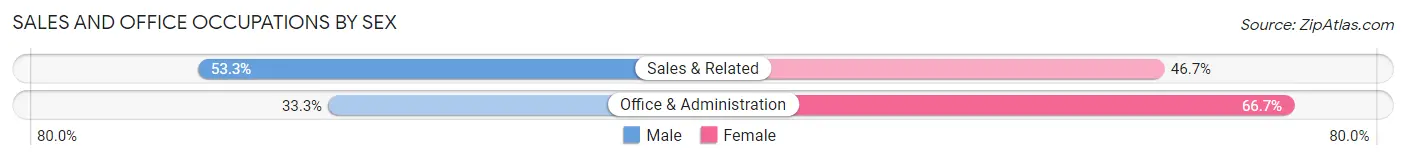
| Occupation | Male | Female |
| Sales & Related | 16 (53.3%) | 14 (46.7%) |
| Office & Administration | 5 (33.3%) | 10 (66.7%) |
| Total (Category) | 21 (46.7%) | 24 (53.3%) |
| Total (Overall) | 117 (58.8%) | 82 (41.2%) |
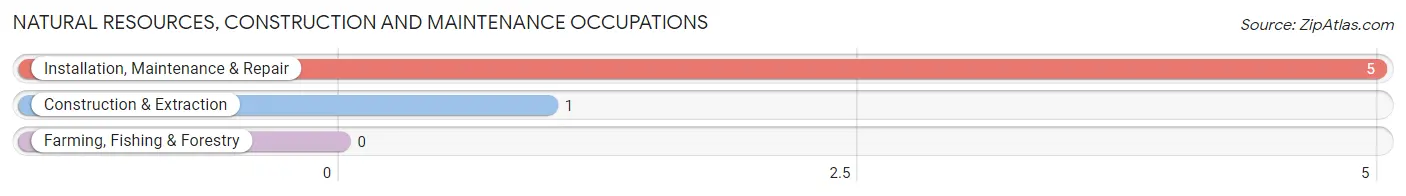
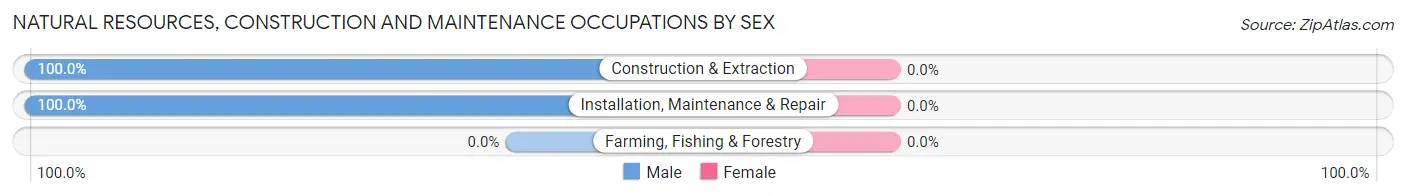
Natural Resources, Construction and Maintenance Occupations
The most common Natural Resources, Construction and Maintenance occupations in Sea Ranch Lakes are Installation, Maintenance & Repair (5 | 2.5%), and Construction & Extraction (1 | 0.5%).
Natural Resources, Construction and Maintenance Occupations by Sex
| Occupation | Male | Female |
| Farming, Fishing & Forestry | 0 (0.0%) | 0 (0.0%) |
| Construction & Extraction | 1 (100.0%) | 0 (0.0%) |
| Installation, Maintenance & Repair | 5 (100.0%) | 0 (0.0%) |
| Total (Category) | 6 (100.0%) | 0 (0.0%) |
| Total (Overall) | 117 (58.8%) | 82 (41.2%) |
Production, Transportation and Moving Occupations
The most common Production, Transportation and Moving occupations in Sea Ranch Lakes are , and Material Moving (9 | 4.5%).
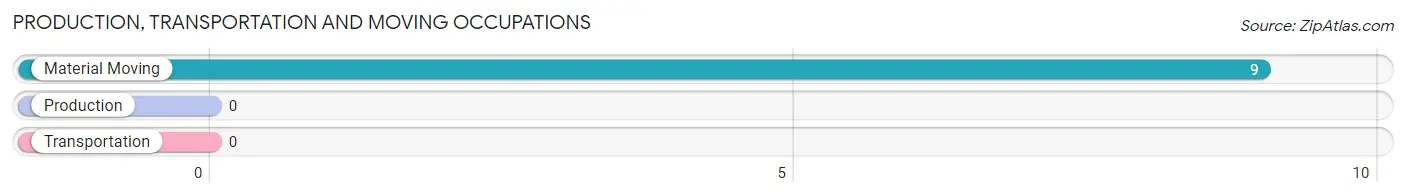
Production, Transportation and Moving Occupations by Sex
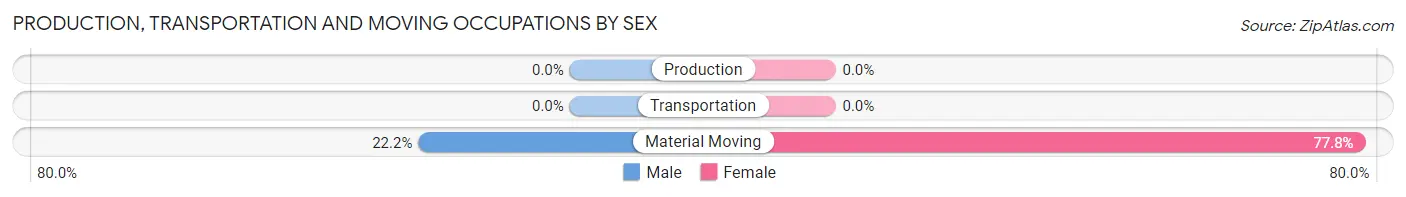
| Occupation | Male | Female |
| Production | 0 (0.0%) | 0 (0.0%) |
| Transportation | 0 (0.0%) | 0 (0.0%) |
| Material Moving | 2 (22.2%) | 7 (77.8%) |
| Total (Category) | 2 (22.2%) | 7 (77.8%) |
| Total (Overall) | 117 (58.8%) | 82 (41.2%) |
Employment Industries by Sex in Sea Ranch Lakes
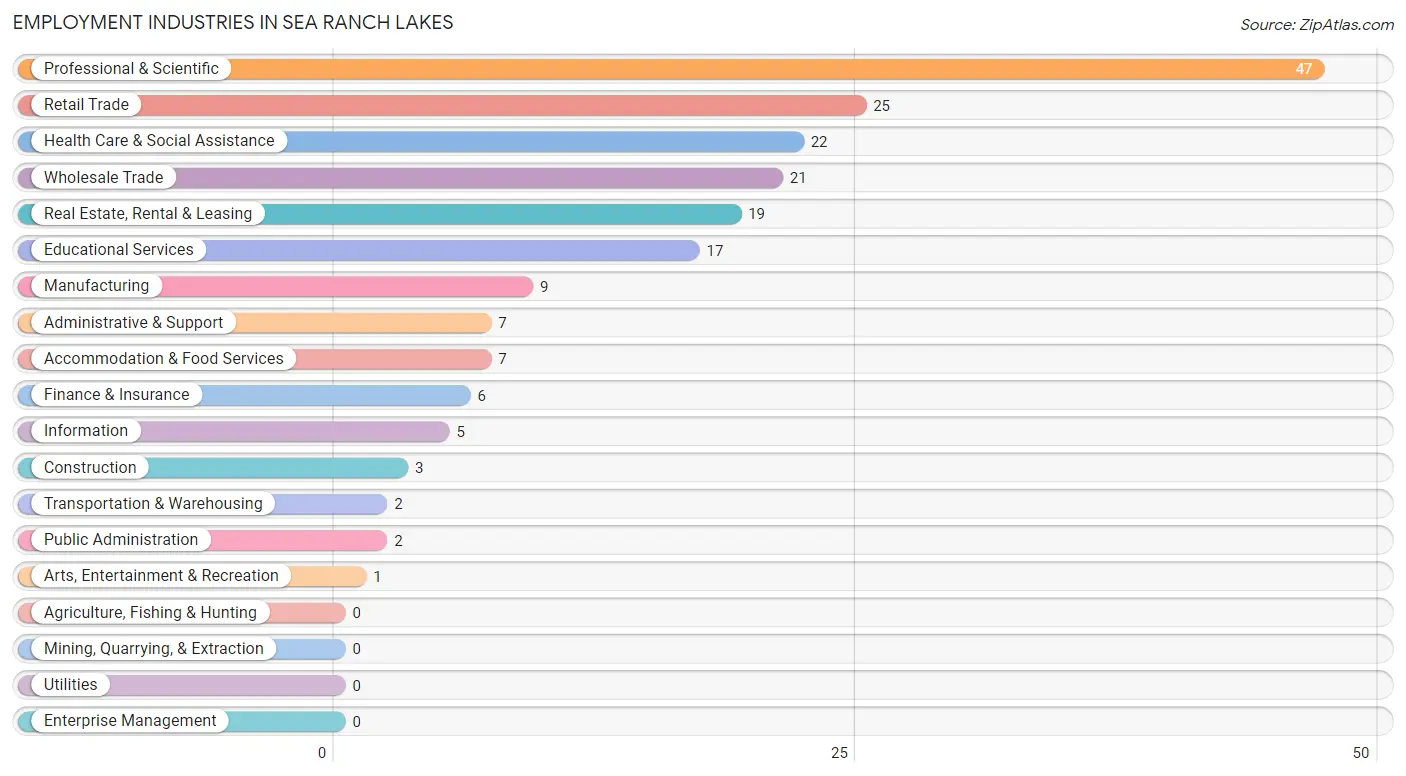
Employment Industries in Sea Ranch Lakes
The major employment industries in Sea Ranch Lakes include Professional & Scientific (47 | 23.6%), Retail Trade (25 | 12.6%), Health Care & Social Assistance (22 | 11.1%), Wholesale Trade (21 | 10.5%), and Real Estate, Rental & Leasing (19 | 9.6%).
Employment Industries by Sex in Sea Ranch Lakes
The Sea Ranch Lakes industries that see more men than women are Transportation & Warehousing (100.0%), Administrative & Support (100.0%), and Arts, Entertainment & Recreation (100.0%), whereas the industries that tend to have a higher number of women are Public Administration (100.0%), Educational Services (82.4%), and Construction (66.7%).
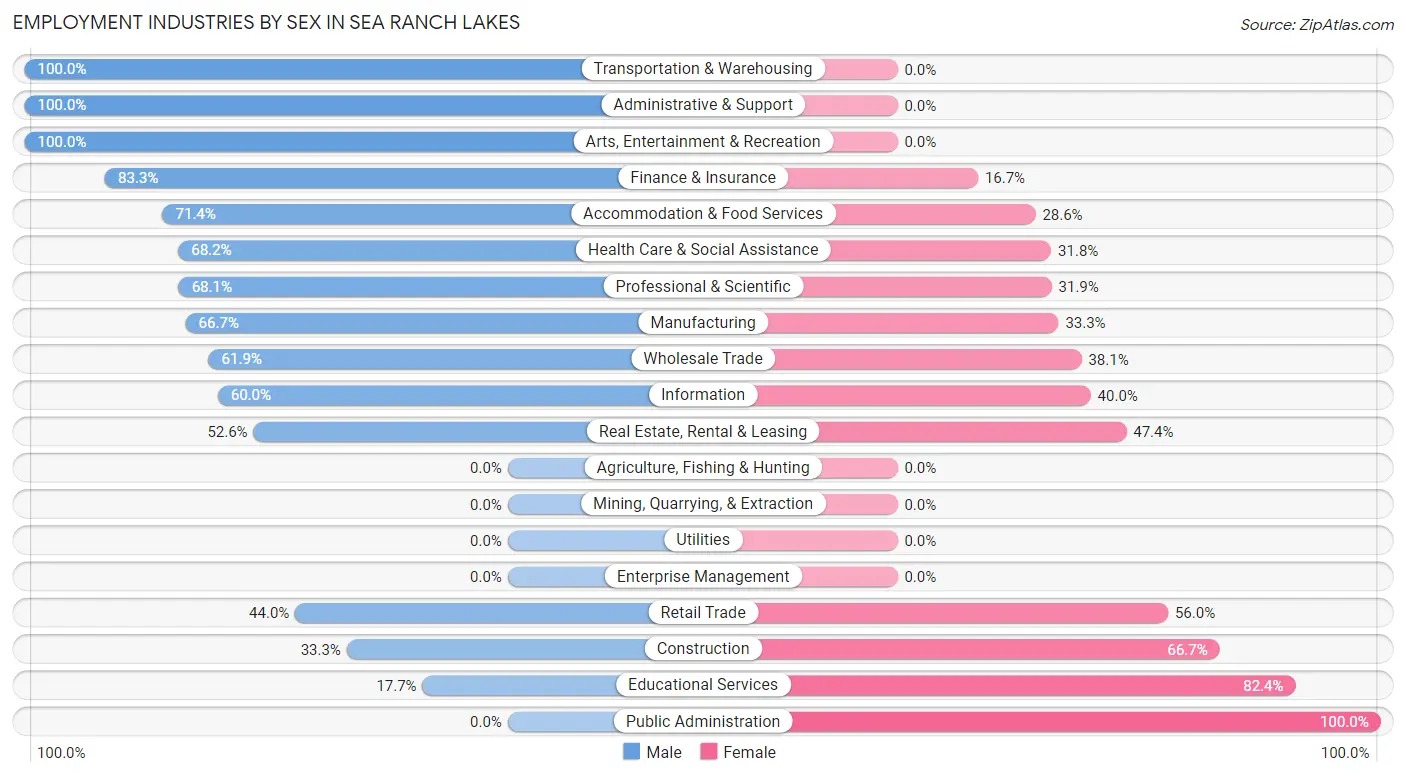
| Industry | Male | Female |
| Agriculture, Fishing & Hunting | 0 (0.0%) | 0 (0.0%) |
| Mining, Quarrying, & Extraction | 0 (0.0%) | 0 (0.0%) |
| Construction | 1 (33.3%) | 2 (66.7%) |
| Manufacturing | 6 (66.7%) | 3 (33.3%) |
| Wholesale Trade | 13 (61.9%) | 8 (38.1%) |
| Retail Trade | 11 (44.0%) | 14 (56.0%) |
| Transportation & Warehousing | 2 (100.0%) | 0 (0.0%) |
| Utilities | 0 (0.0%) | 0 (0.0%) |
| Information | 3 (60.0%) | 2 (40.0%) |
| Finance & Insurance | 5 (83.3%) | 1 (16.7%) |
| Real Estate, Rental & Leasing | 10 (52.6%) | 9 (47.4%) |
| Professional & Scientific | 32 (68.1%) | 15 (31.9%) |
| Enterprise Management | 0 (0.0%) | 0 (0.0%) |
| Administrative & Support | 7 (100.0%) | 0 (0.0%) |
| Educational Services | 3 (17.6%) | 14 (82.4%) |
| Health Care & Social Assistance | 15 (68.2%) | 7 (31.8%) |
| Arts, Entertainment & Recreation | 1 (100.0%) | 0 (0.0%) |
| Accommodation & Food Services | 5 (71.4%) | 2 (28.6%) |
| Public Administration | 0 (0.0%) | 2 (100.0%) |
| Total | 117 (58.8%) | 82 (41.2%) |
Education in Sea Ranch Lakes
School Enrollment in Sea Ranch Lakes
The most common levels of schooling among the 128 students in Sea Ranch Lakes are high school (52 | 40.6%), middle school (28 | 21.9%), and college / undergraduate (24 | 18.8%).
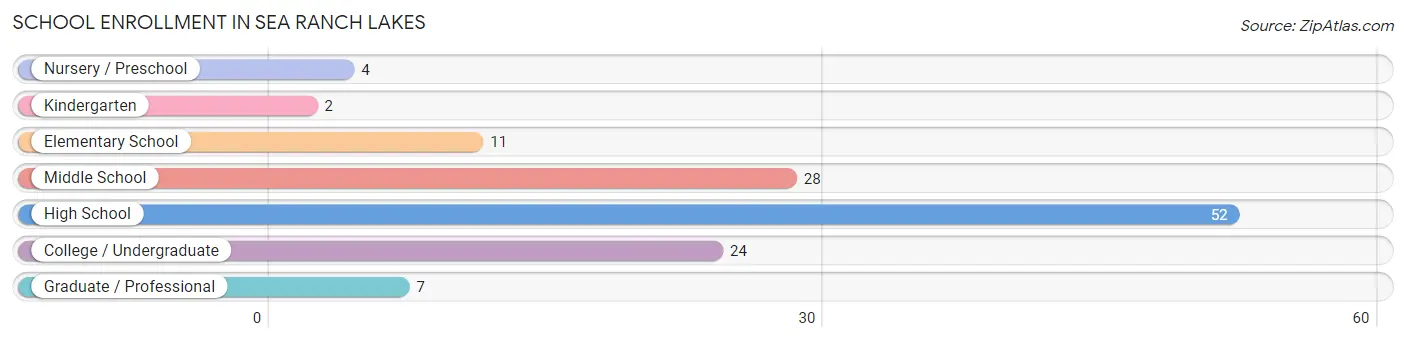
| School Level | # Students | % Students |
| Nursery / Preschool | 4 | 3.1% |
| Kindergarten | 2 | 1.6% |
| Elementary School | 11 | 8.6% |
| Middle School | 28 | 21.9% |
| High School | 52 | 40.6% |
| College / Undergraduate | 24 | 18.8% |
| Graduate / Professional | 7 | 5.5% |
| Total | 128 | 100.0% |
School Enrollment by Age by Funding Source in Sea Ranch Lakes
Out of a total of 128 students who are enrolled in schools in Sea Ranch Lakes, 101 (78.9%) attend a private institution, while the remaining 27 (21.1%) are enrolled in public schools. The age group of 20 to 24 year olds has the highest likelihood of being enrolled in private schools, with 5 (100.0% in the age bracket) enrolled. Conversely, the age group of 5 to 9 year old has the lowest likelihood of being enrolled in a private school, with 9 (81.8% in the age bracket) attending a public institution.
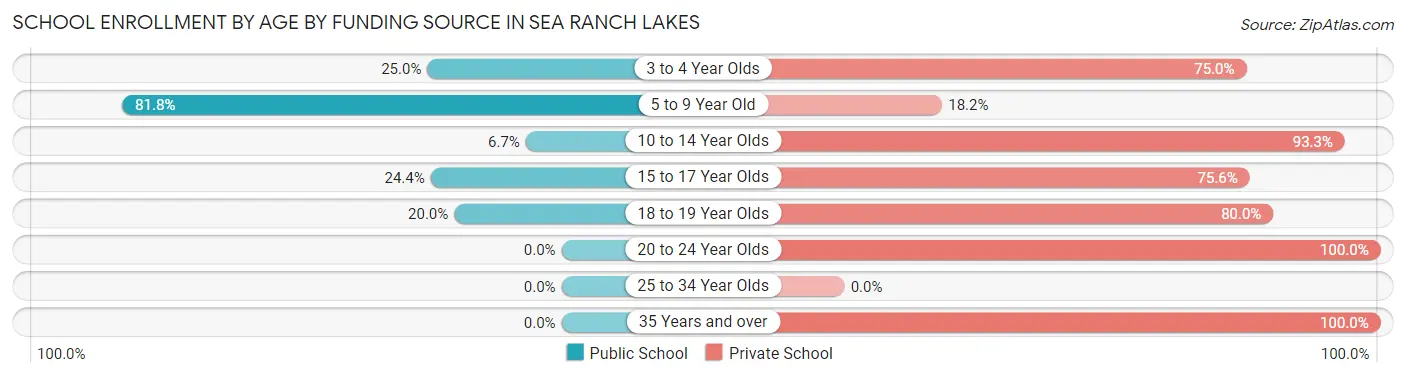
| Age Bracket | Public School | Private School |
| 3 to 4 Year Olds | 1 (25.0%) | 3 (75.0%) |
| 5 to 9 Year Old | 9 (81.8%) | 2 (18.2%) |
| 10 to 14 Year Olds | 2 (6.7%) | 28 (93.3%) |
| 15 to 17 Year Olds | 10 (24.4%) | 31 (75.6%) |
| 18 to 19 Year Olds | 5 (20.0%) | 20 (80.0%) |
| 20 to 24 Year Olds | 0 (0.0%) | 5 (100.0%) |
| 25 to 34 Year Olds | 0 (0.0%) | 0 (0.0%) |
| 35 Years and over | 0 (0.0%) | 12 (100.0%) |
| Total | 27 (21.1%) | 101 (78.9%) |
Educational Attainment by Field of Study in Sea Ranch Lakes
Business (71 | 28.9%), social sciences (38 | 15.4%), science & technology (20 | 8.1%), engineering (19 | 7.7%), and liberal arts & history (18 | 7.3%) are the most common fields of study among 246 individuals in Sea Ranch Lakes who have obtained a bachelor's degree or higher.
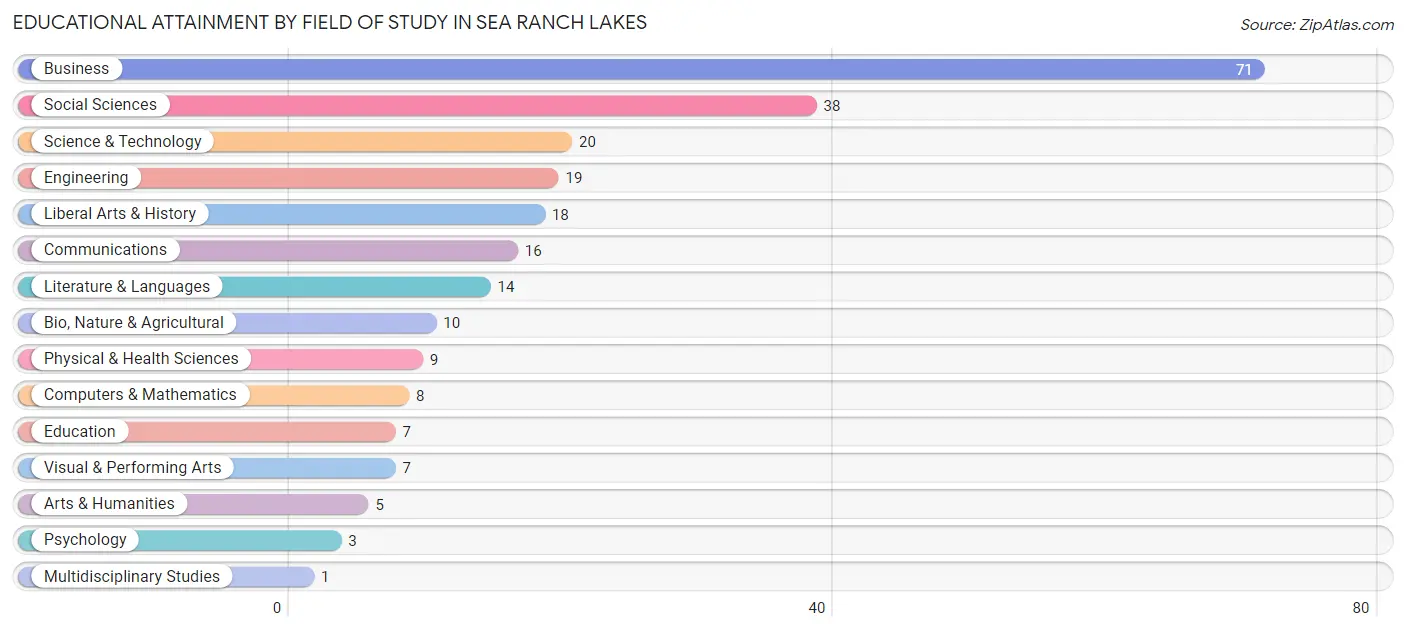
| Field of Study | # Graduates | % Graduates |
| Computers & Mathematics | 8 | 3.3% |
| Bio, Nature & Agricultural | 10 | 4.1% |
| Physical & Health Sciences | 9 | 3.7% |
| Psychology | 3 | 1.2% |
| Social Sciences | 38 | 15.4% |
| Engineering | 19 | 7.7% |
| Multidisciplinary Studies | 1 | 0.4% |
| Science & Technology | 20 | 8.1% |
| Business | 71 | 28.9% |
| Education | 7 | 2.9% |
| Literature & Languages | 14 | 5.7% |
| Liberal Arts & History | 18 | 7.3% |
| Visual & Performing Arts | 7 | 2.9% |
| Communications | 16 | 6.5% |
| Arts & Humanities | 5 | 2.0% |
| Total | 246 | 100.0% |
Transportation & Commute in Sea Ranch Lakes
Vehicle Availability by Sex in Sea Ranch Lakes
The most prevalent vehicle ownership categories in Sea Ranch Lakes are males with 2 vehicles (78, accounting for 66.7%) and females with 2 vehicles (37, making up 95.1%).
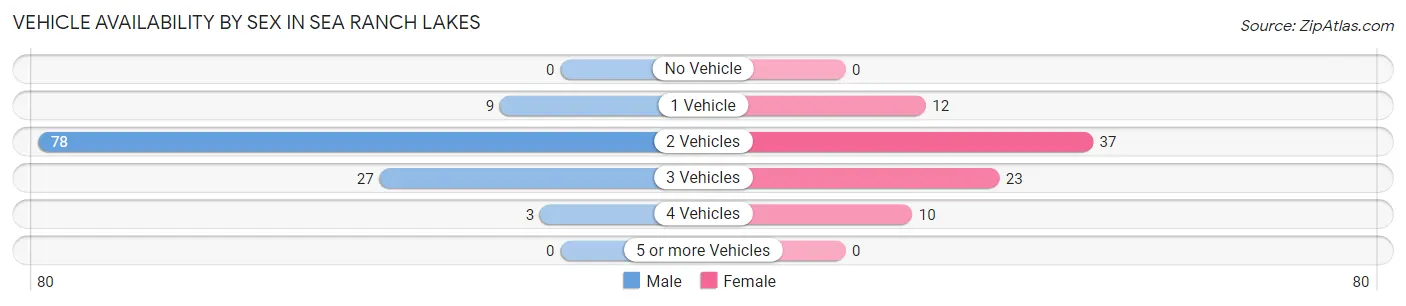
| Vehicles Available | Male | Female |
| No Vehicle | 0 (0.0%) | 0 (0.0%) |
| 1 Vehicle | 9 (7.7%) | 12 (14.6%) |
| 2 Vehicles | 78 (66.7%) | 37 (45.1%) |
| 3 Vehicles | 27 (23.1%) | 23 (28.1%) |
| 4 Vehicles | 3 (2.6%) | 10 (12.2%) |
| 5 or more Vehicles | 0 (0.0%) | 0 (0.0%) |
| Total | 117 (100.0%) | 82 (100.0%) |
Commute Time in Sea Ranch Lakes
The most frequently occuring commute durations in Sea Ranch Lakes are 20 to 24 minutes (44 commuters, 27.9%), 10 to 14 minutes (40 commuters, 25.3%), and 15 to 19 minutes (27 commuters, 17.1%).
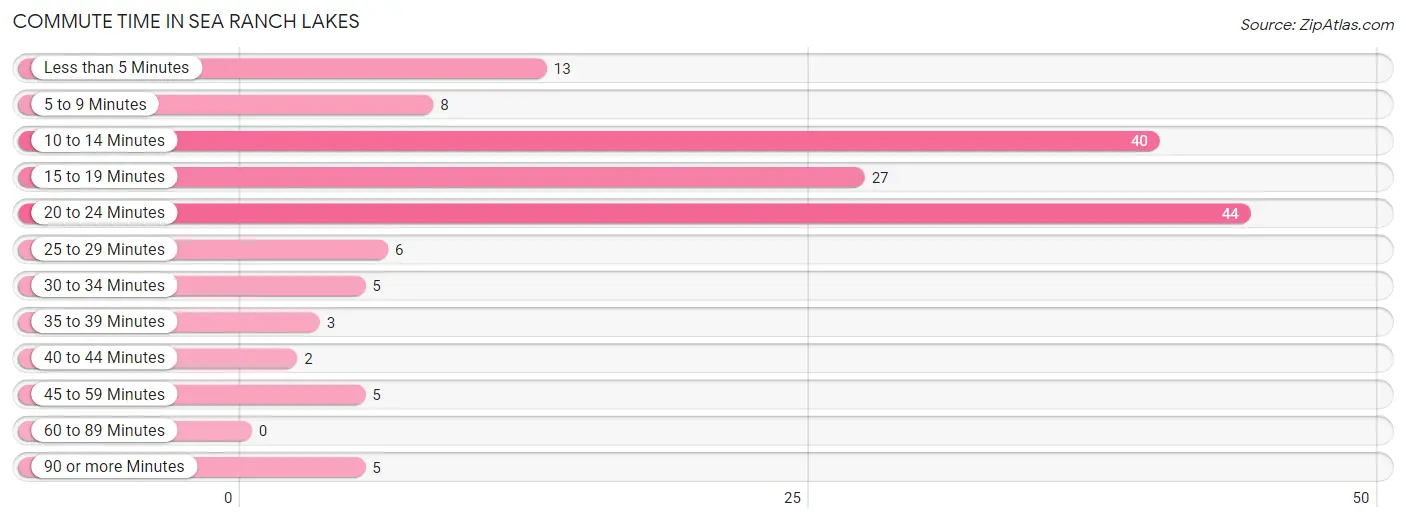
| Commute Time | # Commuters | % Commuters |
| Less than 5 Minutes | 13 | 8.2% |
| 5 to 9 Minutes | 8 | 5.1% |
| 10 to 14 Minutes | 40 | 25.3% |
| 15 to 19 Minutes | 27 | 17.1% |
| 20 to 24 Minutes | 44 | 27.9% |
| 25 to 29 Minutes | 6 | 3.8% |
| 30 to 34 Minutes | 5 | 3.2% |
| 35 to 39 Minutes | 3 | 1.9% |
| 40 to 44 Minutes | 2 | 1.3% |
| 45 to 59 Minutes | 5 | 3.2% |
| 60 to 89 Minutes | 0 | 0.0% |
| 90 or more Minutes | 5 | 3.2% |
Commute Time by Sex in Sea Ranch Lakes
The most common commute times in Sea Ranch Lakes are 20 to 24 minutes (36 commuters, 34.3%) for males and 10 to 14 minutes (13 commuters, 24.5%) for females.
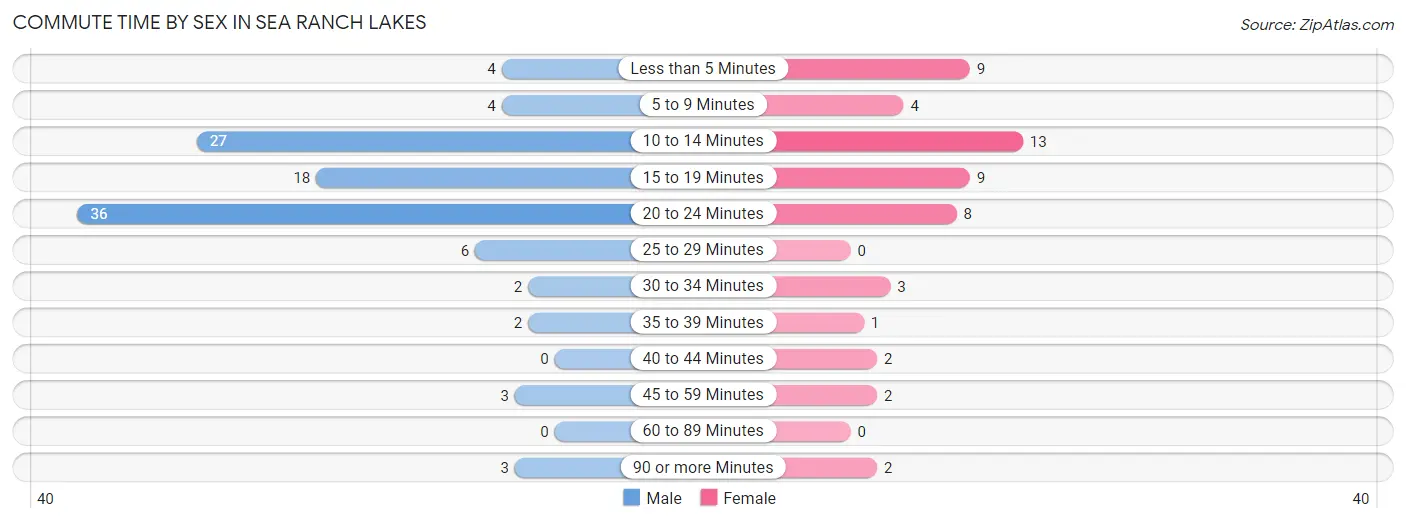
| Commute Time | Male | Female |
| Less than 5 Minutes | 4 (3.8%) | 9 (17.0%) |
| 5 to 9 Minutes | 4 (3.8%) | 4 (7.5%) |
| 10 to 14 Minutes | 27 (25.7%) | 13 (24.5%) |
| 15 to 19 Minutes | 18 (17.1%) | 9 (17.0%) |
| 20 to 24 Minutes | 36 (34.3%) | 8 (15.1%) |
| 25 to 29 Minutes | 6 (5.7%) | 0 (0.0%) |
| 30 to 34 Minutes | 2 (1.9%) | 3 (5.7%) |
| 35 to 39 Minutes | 2 (1.9%) | 1 (1.9%) |
| 40 to 44 Minutes | 0 (0.0%) | 2 (3.8%) |
| 45 to 59 Minutes | 3 (2.9%) | 2 (3.8%) |
| 60 to 89 Minutes | 0 (0.0%) | 0 (0.0%) |
| 90 or more Minutes | 3 (2.9%) | 2 (3.8%) |
Time of Departure to Work by Sex in Sea Ranch Lakes
The most frequent times of departure to work in Sea Ranch Lakes are 9:00 AM to 9:59 AM (32, 30.5%) for males and 8:30 AM to 8:59 AM (16, 30.2%) for females.
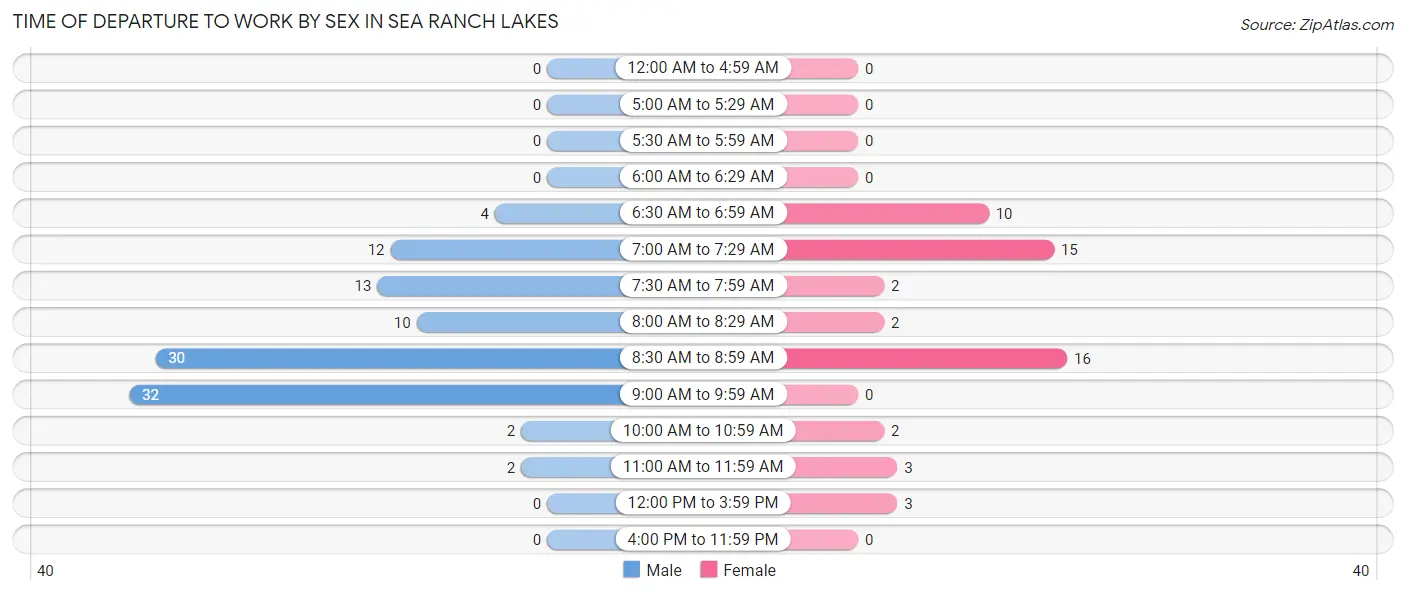
| Time of Departure | Male | Female |
| 12:00 AM to 4:59 AM | 0 (0.0%) | 0 (0.0%) |
| 5:00 AM to 5:29 AM | 0 (0.0%) | 0 (0.0%) |
| 5:30 AM to 5:59 AM | 0 (0.0%) | 0 (0.0%) |
| 6:00 AM to 6:29 AM | 0 (0.0%) | 0 (0.0%) |
| 6:30 AM to 6:59 AM | 4 (3.8%) | 10 (18.9%) |
| 7:00 AM to 7:29 AM | 12 (11.4%) | 15 (28.3%) |
| 7:30 AM to 7:59 AM | 13 (12.4%) | 2 (3.8%) |
| 8:00 AM to 8:29 AM | 10 (9.5%) | 2 (3.8%) |
| 8:30 AM to 8:59 AM | 30 (28.6%) | 16 (30.2%) |
| 9:00 AM to 9:59 AM | 32 (30.5%) | 0 (0.0%) |
| 10:00 AM to 10:59 AM | 2 (1.9%) | 2 (3.8%) |
| 11:00 AM to 11:59 AM | 2 (1.9%) | 3 (5.7%) |
| 12:00 PM to 3:59 PM | 0 (0.0%) | 3 (5.7%) |
| 4:00 PM to 11:59 PM | 0 (0.0%) | 0 (0.0%) |
| Total | 105 (100.0%) | 53 (100.0%) |
Housing Occupancy in Sea Ranch Lakes
Occupancy by Ownership in Sea Ranch Lakes
Of the total 172 dwellings in Sea Ranch Lakes, owner-occupied units account for 167 (97.1%), while renter-occupied units make up 5 (2.9%).
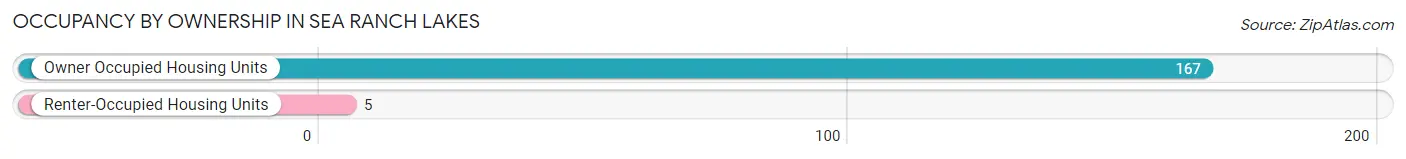
| Occupancy | # Housing Units | % Housing Units |
| Owner Occupied Housing Units | 167 | 97.1% |
| Renter-Occupied Housing Units | 5 | 2.9% |
| Total Occupied Housing Units | 172 | 100.0% |
Occupancy by Household Size in Sea Ranch Lakes
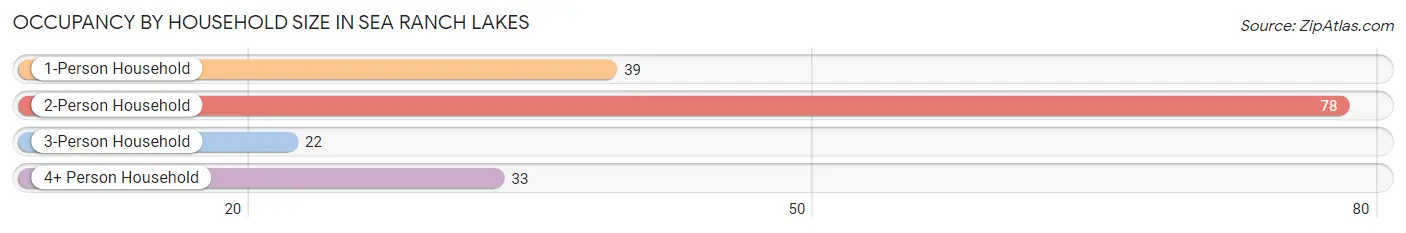
| Household Size | # Housing Units | % Housing Units |
| 1-Person Household | 39 | 22.7% |
| 2-Person Household | 78 | 45.4% |
| 3-Person Household | 22 | 12.8% |
| 4+ Person Household | 33 | 19.2% |
| Total Housing Units | 172 | 100.0% |
Occupancy by Ownership by Household Size in Sea Ranch Lakes
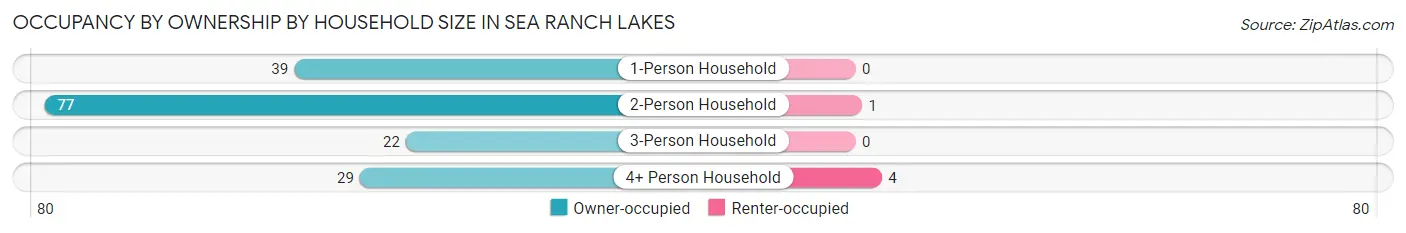
| Household Size | Owner-occupied | Renter-occupied |
| 1-Person Household | 39 (100.0%) | 0 (0.0%) |
| 2-Person Household | 77 (98.7%) | 1 (1.3%) |
| 3-Person Household | 22 (100.0%) | 0 (0.0%) |
| 4+ Person Household | 29 (87.9%) | 4 (12.1%) |
| Total Housing Units | 167 (97.1%) | 5 (2.9%) |
Occupancy by Educational Attainment in Sea Ranch Lakes
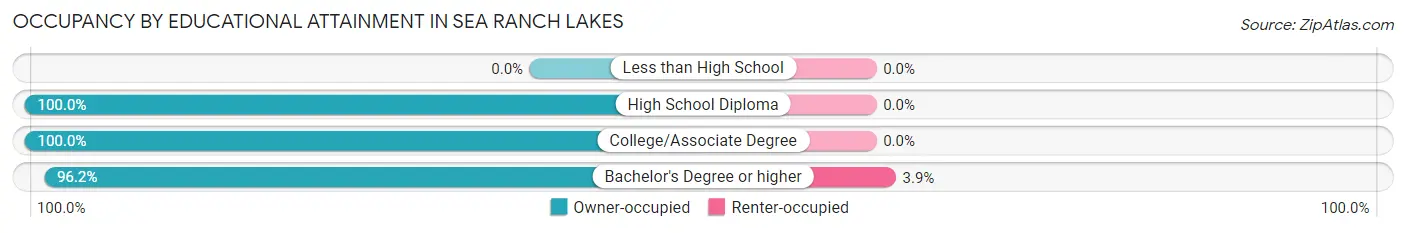
| Household Size | Owner-occupied | Renter-occupied |
| Less than High School | 0 (0.0%) | 0 (0.0%) |
| High School Diploma | 15 (100.0%) | 0 (0.0%) |
| College/Associate Degree | 27 (100.0%) | 0 (0.0%) |
| Bachelor's Degree or higher | 125 (96.2%) | 5 (3.8%) |
Occupancy by Age of Householder in Sea Ranch Lakes
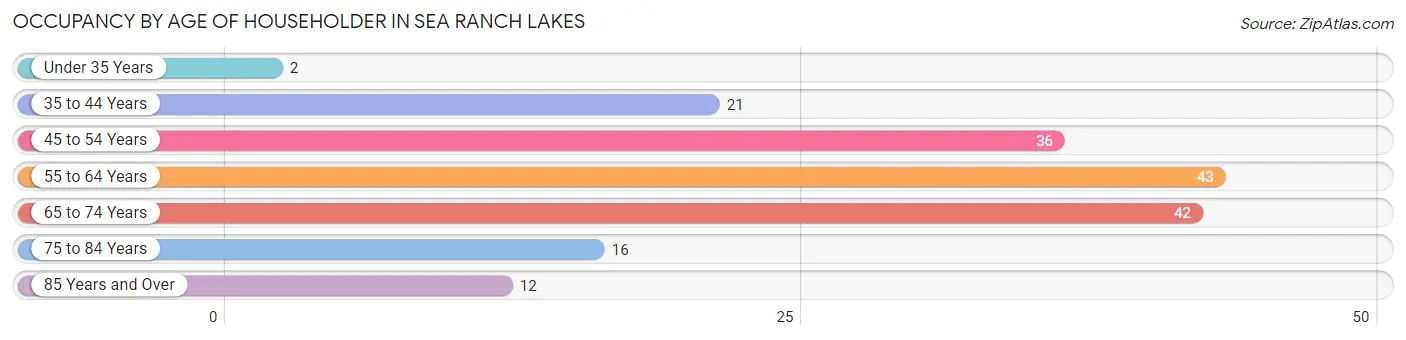
| Age Bracket | # Households | % Households |
| Under 35 Years | 2 | 1.2% |
| 35 to 44 Years | 21 | 12.2% |
| 45 to 54 Years | 36 | 20.9% |
| 55 to 64 Years | 43 | 25.0% |
| 65 to 74 Years | 42 | 24.4% |
| 75 to 84 Years | 16 | 9.3% |
| 85 Years and Over | 12 | 7.0% |
| Total | 172 | 100.0% |
Housing Finances in Sea Ranch Lakes
Median Income by Occupancy in Sea Ranch Lakes
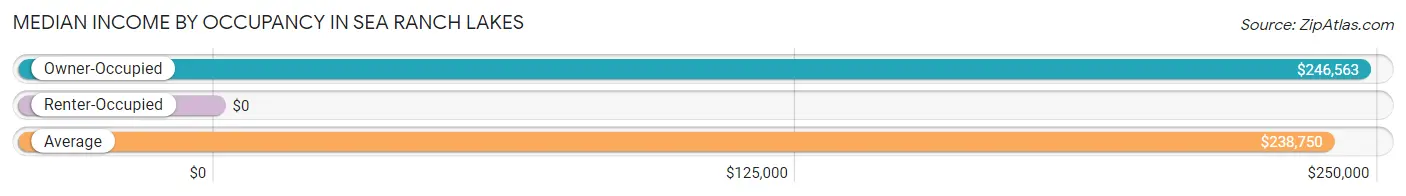
| Occupancy Type | # Households | Median Income |
| Owner-Occupied | 167 (97.1%) | $246,563 |
| Renter-Occupied | 5 (2.9%) | $0 |
| Average | 172 (100.0%) | $238,750 |
Occupancy by Householder Income Bracket in Sea Ranch Lakes
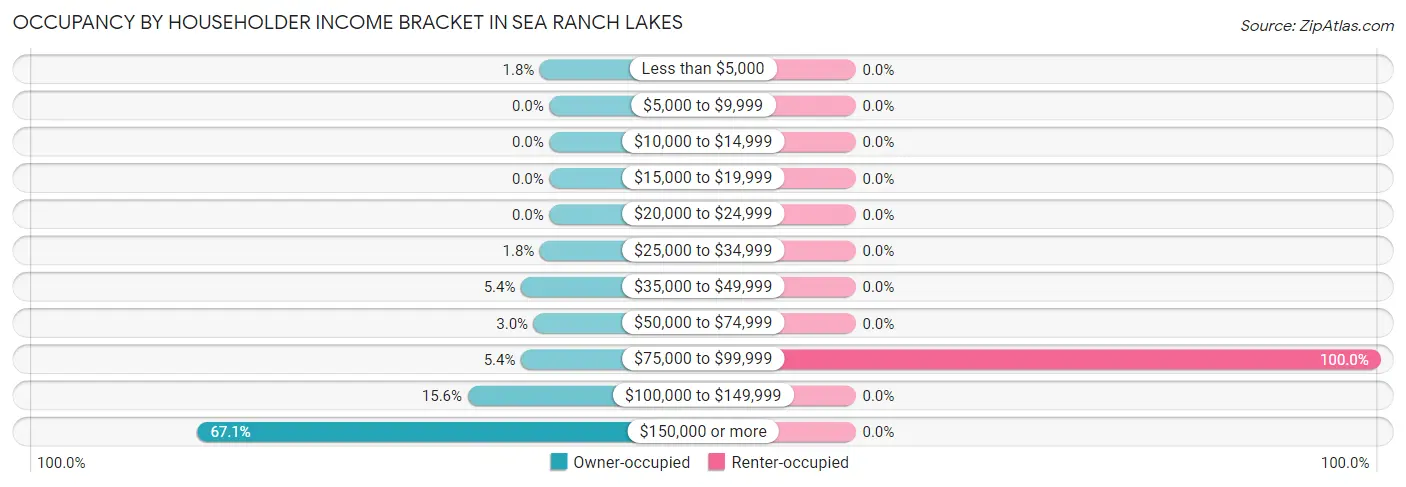
| Income Bracket | Owner-occupied | Renter-occupied |
| Less than $5,000 | 3 (1.8%) | 0 (0.0%) |
| $5,000 to $9,999 | 0 (0.0%) | 0 (0.0%) |
| $10,000 to $14,999 | 0 (0.0%) | 0 (0.0%) |
| $15,000 to $19,999 | 0 (0.0%) | 0 (0.0%) |
| $20,000 to $24,999 | 0 (0.0%) | 0 (0.0%) |
| $25,000 to $34,999 | 3 (1.8%) | 0 (0.0%) |
| $35,000 to $49,999 | 9 (5.4%) | 0 (0.0%) |
| $50,000 to $74,999 | 5 (3.0%) | 0 (0.0%) |
| $75,000 to $99,999 | 9 (5.4%) | 5 (100.0%) |
| $100,000 to $149,999 | 26 (15.6%) | 0 (0.0%) |
| $150,000 or more | 112 (67.1%) | 0 (0.0%) |
| Total | 167 (100.0%) | 5 (100.0%) |
Monthly Housing Cost Tiers in Sea Ranch Lakes
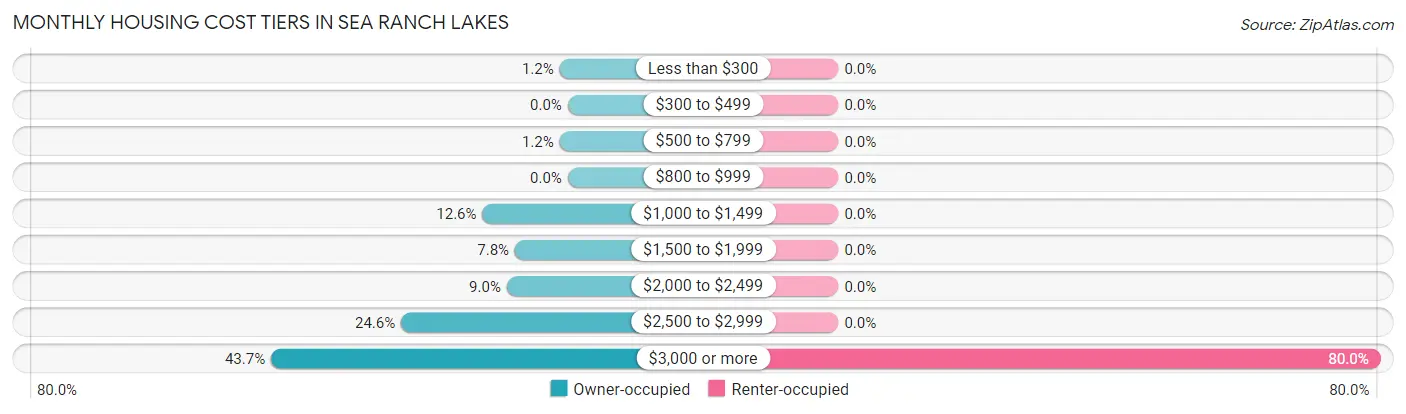
| Monthly Cost | Owner-occupied | Renter-occupied |
| Less than $300 | 2 (1.2%) | 0 (0.0%) |
| $300 to $499 | 0 (0.0%) | 0 (0.0%) |
| $500 to $799 | 2 (1.2%) | 0 (0.0%) |
| $800 to $999 | 0 (0.0%) | 0 (0.0%) |
| $1,000 to $1,499 | 21 (12.6%) | 0 (0.0%) |
| $1,500 to $1,999 | 13 (7.8%) | 0 (0.0%) |
| $2,000 to $2,499 | 15 (9.0%) | 0 (0.0%) |
| $2,500 to $2,999 | 41 (24.5%) | 0 (0.0%) |
| $3,000 or more | 73 (43.7%) | 4 (80.0%) |
| Total | 167 (100.0%) | 5 (100.0%) |
Physical Housing Characteristics in Sea Ranch Lakes
Housing Structures in Sea Ranch Lakes
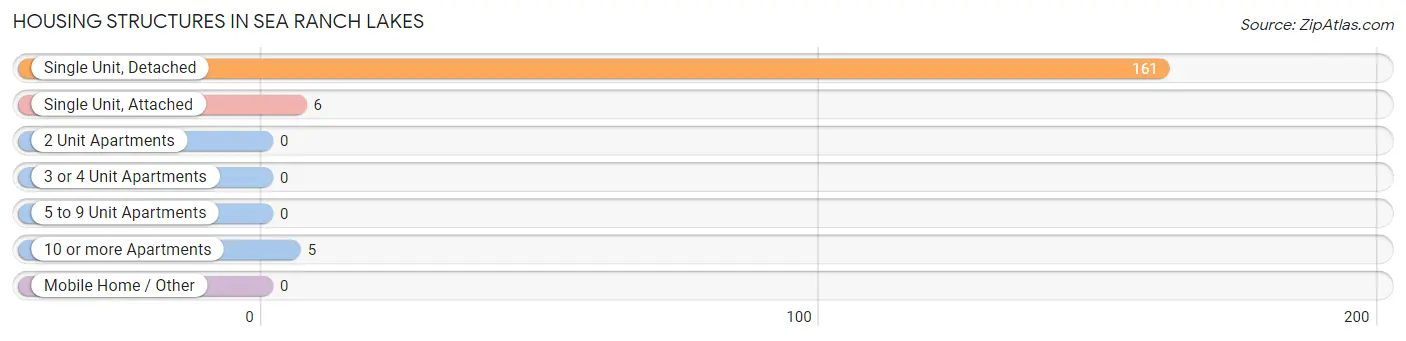
| Structure Type | # Housing Units | % Housing Units |
| Single Unit, Detached | 161 | 93.6% |
| Single Unit, Attached | 6 | 3.5% |
| 2 Unit Apartments | 0 | 0.0% |
| 3 or 4 Unit Apartments | 0 | 0.0% |
| 5 to 9 Unit Apartments | 0 | 0.0% |
| 10 or more Apartments | 5 | 2.9% |
| Mobile Home / Other | 0 | 0.0% |
| Total | 172 | 100.0% |
Housing Structures by Occupancy in Sea Ranch Lakes
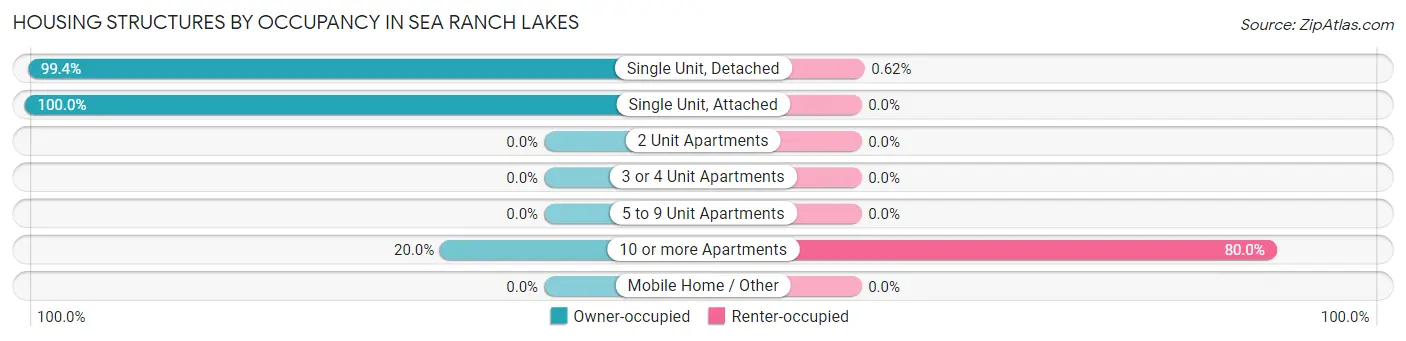
| Structure Type | Owner-occupied | Renter-occupied |
| Single Unit, Detached | 160 (99.4%) | 1 (0.6%) |
| Single Unit, Attached | 6 (100.0%) | 0 (0.0%) |
| 2 Unit Apartments | 0 (0.0%) | 0 (0.0%) |
| 3 or 4 Unit Apartments | 0 (0.0%) | 0 (0.0%) |
| 5 to 9 Unit Apartments | 0 (0.0%) | 0 (0.0%) |
| 10 or more Apartments | 1 (20.0%) | 4 (80.0%) |
| Mobile Home / Other | 0 (0.0%) | 0 (0.0%) |
| Total | 167 (97.1%) | 5 (2.9%) |
Housing Structures by Number of Rooms in Sea Ranch Lakes
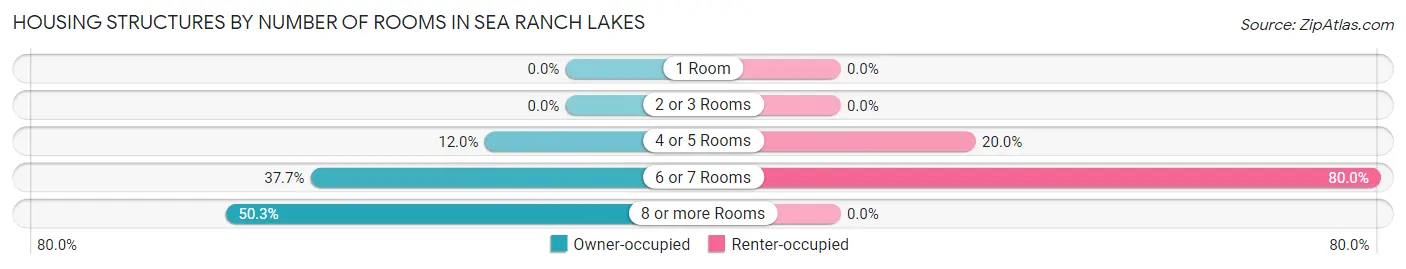
| Number of Rooms | Owner-occupied | Renter-occupied |
| 1 Room | 0 (0.0%) | 0 (0.0%) |
| 2 or 3 Rooms | 0 (0.0%) | 0 (0.0%) |
| 4 or 5 Rooms | 20 (12.0%) | 1 (20.0%) |
| 6 or 7 Rooms | 63 (37.7%) | 4 (80.0%) |
| 8 or more Rooms | 84 (50.3%) | 0 (0.0%) |
| Total | 167 (100.0%) | 5 (100.0%) |
Housing Structure by Heating Type in Sea Ranch Lakes
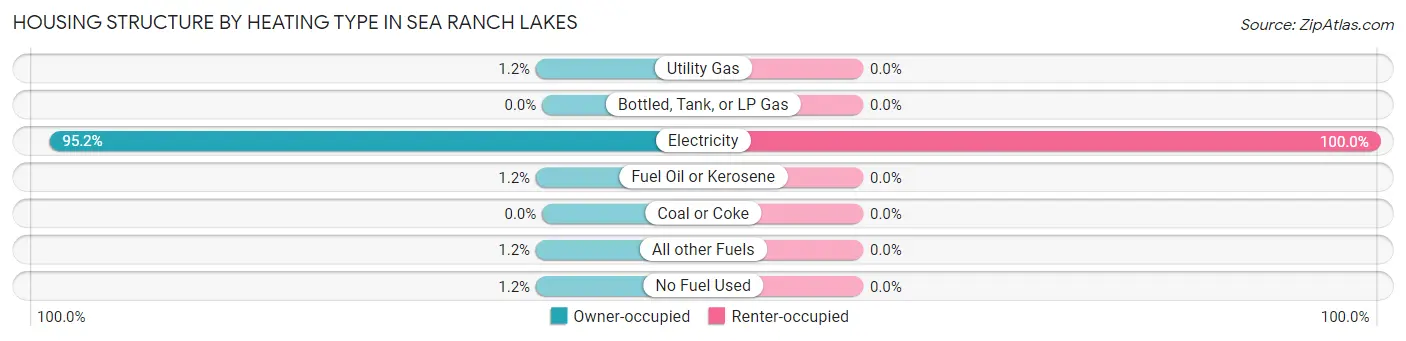
| Heating Type | Owner-occupied | Renter-occupied |
| Utility Gas | 2 (1.2%) | 0 (0.0%) |
| Bottled, Tank, or LP Gas | 0 (0.0%) | 0 (0.0%) |
| Electricity | 159 (95.2%) | 5 (100.0%) |
| Fuel Oil or Kerosene | 2 (1.2%) | 0 (0.0%) |
| Coal or Coke | 0 (0.0%) | 0 (0.0%) |
| All other Fuels | 2 (1.2%) | 0 (0.0%) |
| No Fuel Used | 2 (1.2%) | 0 (0.0%) |
| Total | 167 (100.0%) | 5 (100.0%) |
Household Vehicle Usage in Sea Ranch Lakes
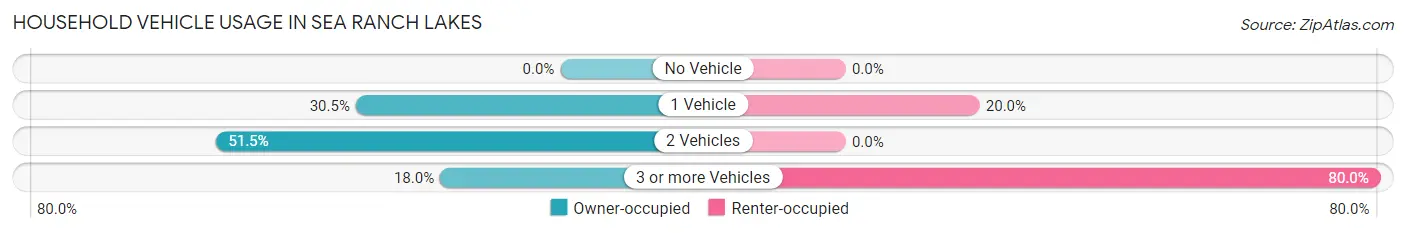
| Vehicles per Household | Owner-occupied | Renter-occupied |
| No Vehicle | 0 (0.0%) | 0 (0.0%) |
| 1 Vehicle | 51 (30.5%) | 1 (20.0%) |
| 2 Vehicles | 86 (51.5%) | 0 (0.0%) |
| 3 or more Vehicles | 30 (18.0%) | 4 (80.0%) |
| Total | 167 (100.0%) | 5 (100.0%) |
Real Estate & Mortgages in Sea Ranch Lakes
Real Estate and Mortgage Overview in Sea Ranch Lakes
| Characteristic | Without Mortgage | With Mortgage |
| Housing Units | 114 | 53 |
| Median Property Value | $1,652,800 | $1,375,000 |
| Median Household Income | $250,001 | $30 |
| Monthly Housing Costs | $1,501 | $37 |
| Real Estate Taxes | $10,001 | $0 |
Property Value by Mortgage Status in Sea Ranch Lakes
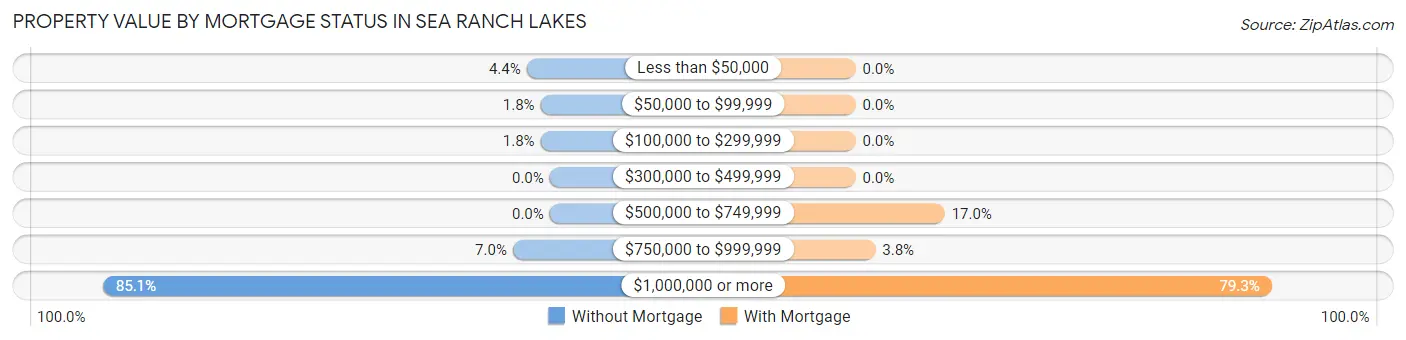
| Property Value | Without Mortgage | With Mortgage |
| Less than $50,000 | 5 (4.4%) | 0 (0.0%) |
| $50,000 to $99,999 | 2 (1.8%) | 0 (0.0%) |
| $100,000 to $299,999 | 2 (1.8%) | 0 (0.0%) |
| $300,000 to $499,999 | 0 (0.0%) | 0 (0.0%) |
| $500,000 to $749,999 | 0 (0.0%) | 9 (17.0%) |
| $750,000 to $999,999 | 8 (7.0%) | 2 (3.8%) |
| $1,000,000 or more | 97 (85.1%) | 42 (79.2%) |
| Total | 114 (100.0%) | 53 (100.0%) |
Household Income by Mortgage Status in Sea Ranch Lakes
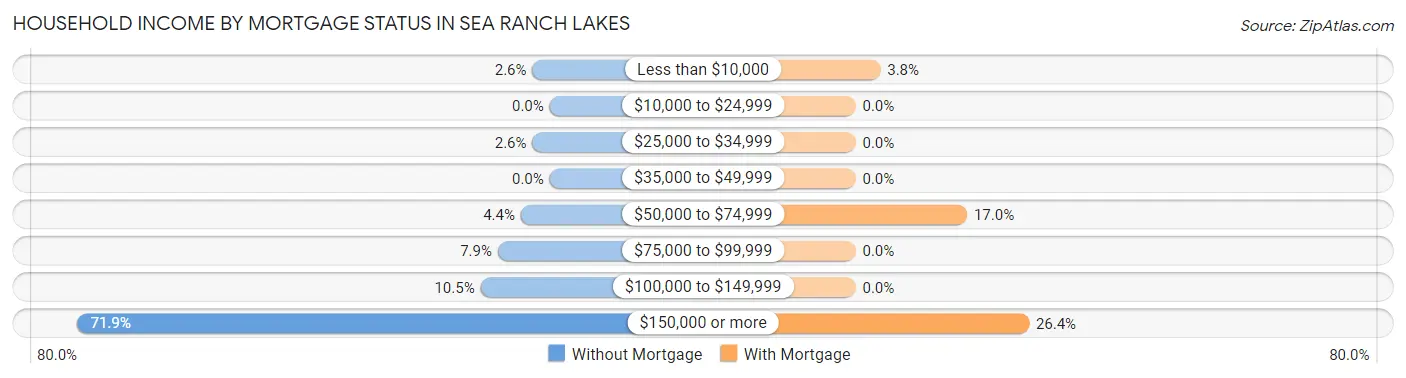
| Household Income | Without Mortgage | With Mortgage |
| Less than $10,000 | 3 (2.6%) | 2 (3.8%) |
| $10,000 to $24,999 | 0 (0.0%) | 0 (0.0%) |
| $25,000 to $34,999 | 3 (2.6%) | 0 (0.0%) |
| $35,000 to $49,999 | 0 (0.0%) | 0 (0.0%) |
| $50,000 to $74,999 | 5 (4.4%) | 9 (17.0%) |
| $75,000 to $99,999 | 9 (7.9%) | 0 (0.0%) |
| $100,000 to $149,999 | 12 (10.5%) | 0 (0.0%) |
| $150,000 or more | 82 (71.9%) | 14 (26.4%) |
| Total | 114 (100.0%) | 53 (100.0%) |
Property Value to Household Income Ratio in Sea Ranch Lakes
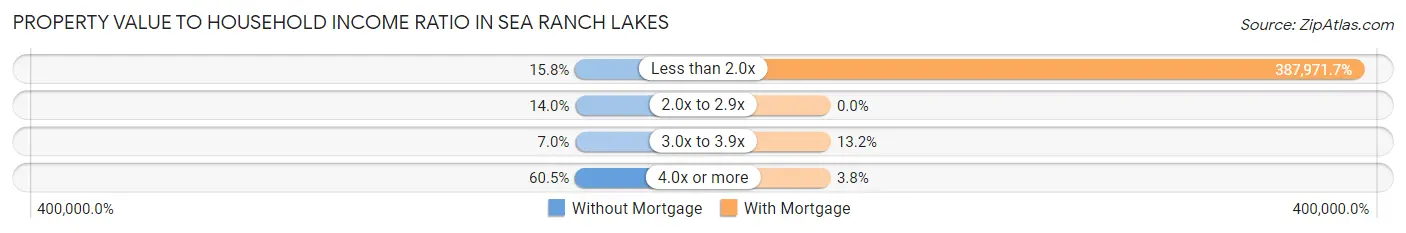
| Value-to-Income Ratio | Without Mortgage | With Mortgage |
| Less than 2.0x | 18 (15.8%) | 205,625 (387,971.7%) |
| 2.0x to 2.9x | 16 (14.0%) | 0 (0.0%) |
| 3.0x to 3.9x | 8 (7.0%) | 7 (13.2%) |
| 4.0x or more | 69 (60.5%) | 2 (3.8%) |
| Total | 114 (100.0%) | 53 (100.0%) |
Real Estate Taxes by Mortgage Status in Sea Ranch Lakes
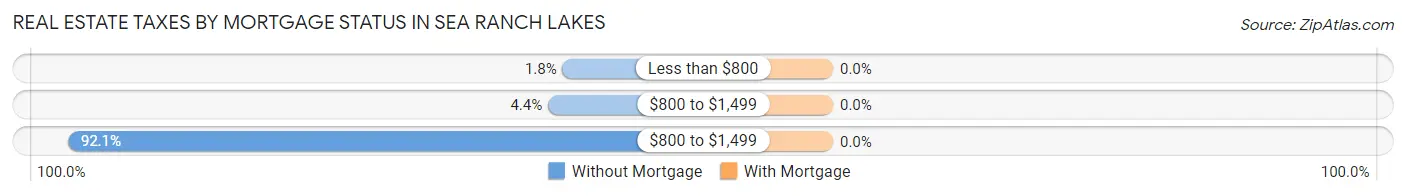
| Property Taxes | Without Mortgage | With Mortgage |
| Less than $800 | 2 (1.8%) | 0 (0.0%) |
| $800 to $1,499 | 5 (4.4%) | 0 (0.0%) |
| $800 to $1,499 | 105 (92.1%) | 0 (0.0%) |
| Total | 114 (100.0%) | 53 (100.0%) |
Health & Disability in Sea Ranch Lakes
Health Insurance Coverage by Age in Sea Ranch Lakes
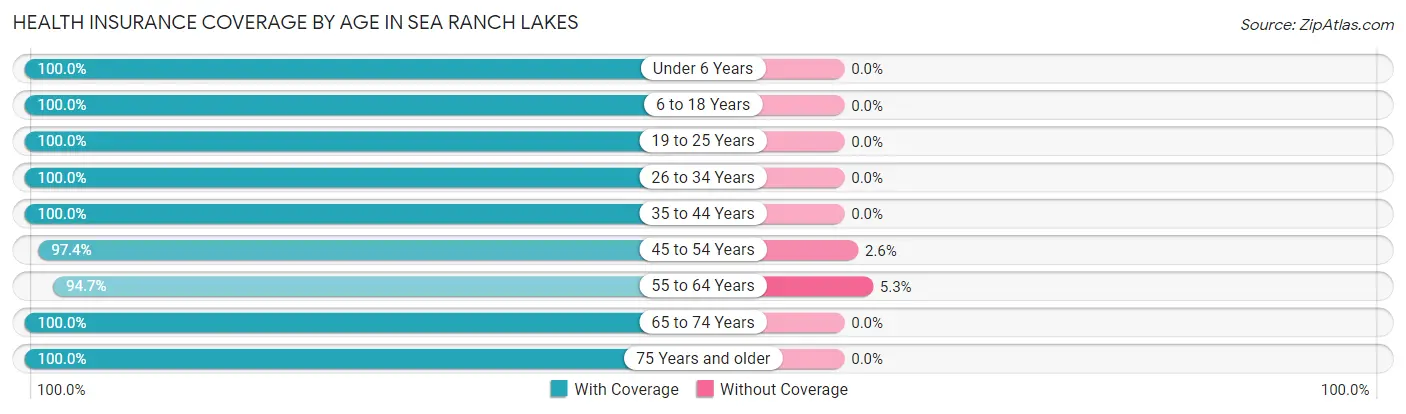
| Age Bracket | With Coverage | Without Coverage |
| Under 6 Years | 21 (100.0%) | 0 (0.0%) |
| 6 to 18 Years | 101 (100.0%) | 0 (0.0%) |
| 19 to 25 Years | 16 (100.0%) | 0 (0.0%) |
| 26 to 34 Years | 7 (100.0%) | 0 (0.0%) |
| 35 to 44 Years | 41 (100.0%) | 0 (0.0%) |
| 45 to 54 Years | 76 (97.4%) | 2 (2.6%) |
| 55 to 64 Years | 71 (94.7%) | 4 (5.3%) |
| 65 to 74 Years | 65 (100.0%) | 0 (0.0%) |
| 75 Years and older | 39 (100.0%) | 0 (0.0%) |
| Total | 437 (98.7%) | 6 (1.3%) |
Health Insurance Coverage by Citizenship Status in Sea Ranch Lakes
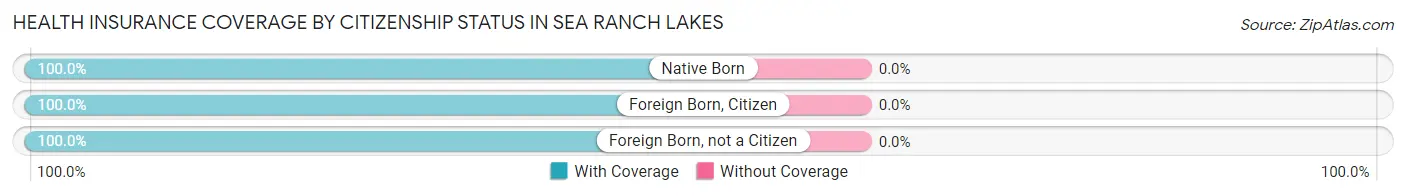
| Citizenship Status | With Coverage | Without Coverage |
| Native Born | 21 (100.0%) | 0 (0.0%) |
| Foreign Born, Citizen | 101 (100.0%) | 0 (0.0%) |
| Foreign Born, not a Citizen | 16 (100.0%) | 0 (0.0%) |
Health Insurance Coverage by Household Income in Sea Ranch Lakes
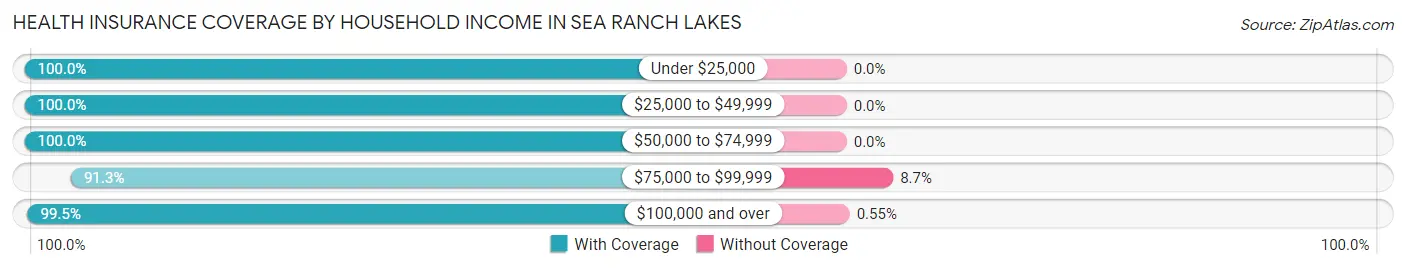
| Household Income | With Coverage | Without Coverage |
| Under $25,000 | 3 (100.0%) | 0 (0.0%) |
| $25,000 to $49,999 | 24 (100.0%) | 0 (0.0%) |
| $50,000 to $74,999 | 7 (100.0%) | 0 (0.0%) |
| $75,000 to $99,999 | 42 (91.3%) | 4 (8.7%) |
| $100,000 and over | 361 (99.5%) | 2 (0.5%) |
Public vs Private Health Insurance Coverage by Age in Sea Ranch Lakes
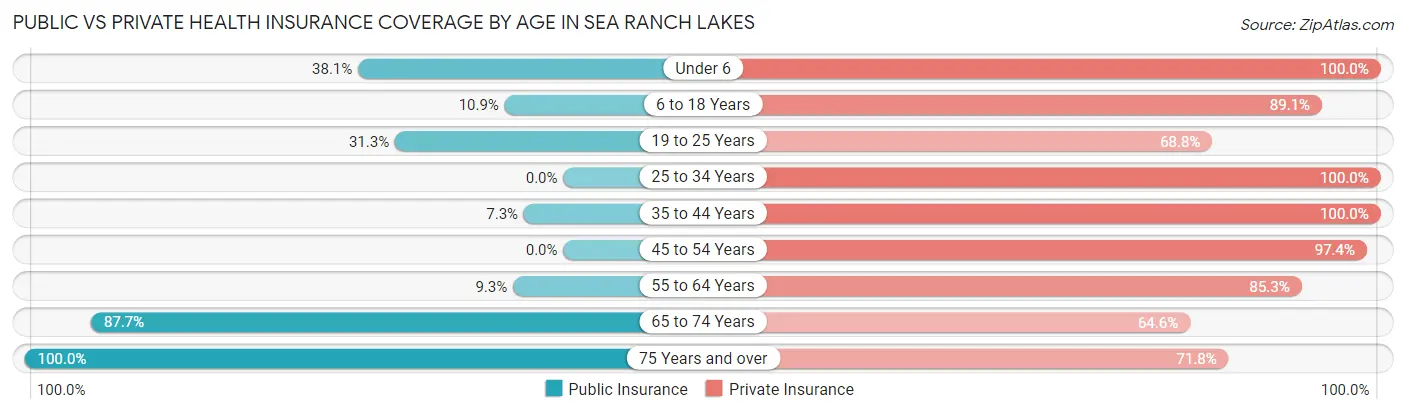
| Age Bracket | Public Insurance | Private Insurance |
| Under 6 | 8 (38.1%) | 21 (100.0%) |
| 6 to 18 Years | 11 (10.9%) | 90 (89.1%) |
| 19 to 25 Years | 5 (31.2%) | 11 (68.8%) |
| 25 to 34 Years | 0 (0.0%) | 7 (100.0%) |
| 35 to 44 Years | 3 (7.3%) | 41 (100.0%) |
| 45 to 54 Years | 0 (0.0%) | 76 (97.4%) |
| 55 to 64 Years | 7 (9.3%) | 64 (85.3%) |
| 65 to 74 Years | 57 (87.7%) | 42 (64.6%) |
| 75 Years and over | 39 (100.0%) | 28 (71.8%) |
| Total | 130 (29.3%) | 380 (85.8%) |
Disability Status by Sex by Age in Sea Ranch Lakes
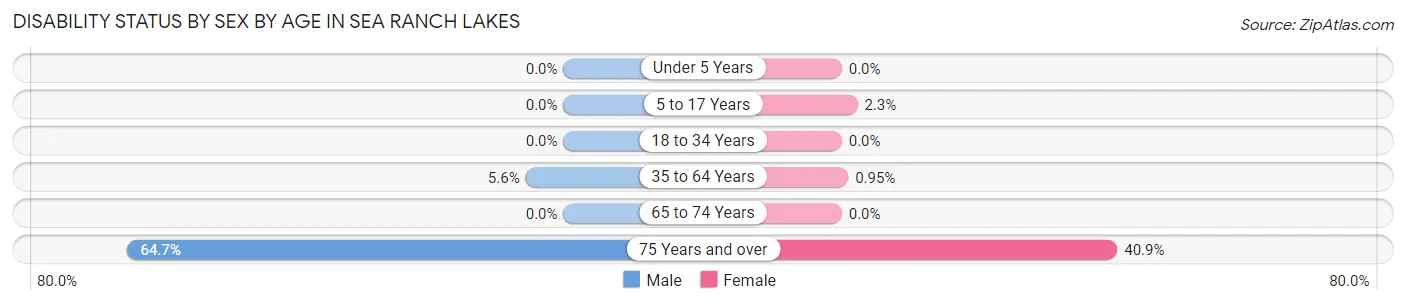
| Age Bracket | Male | Female |
| Under 5 Years | 0 (0.0%) | 0 (0.0%) |
| 5 to 17 Years | 0 (0.0%) | 1 (2.3%) |
| 18 to 34 Years | 0 (0.0%) | 0 (0.0%) |
| 35 to 64 Years | 5 (5.6%) | 1 (0.9%) |
| 65 to 74 Years | 0 (0.0%) | 0 (0.0%) |
| 75 Years and over | 11 (64.7%) | 9 (40.9%) |
Disability Class by Sex by Age in Sea Ranch Lakes
Disability Class: Hearing Difficulty
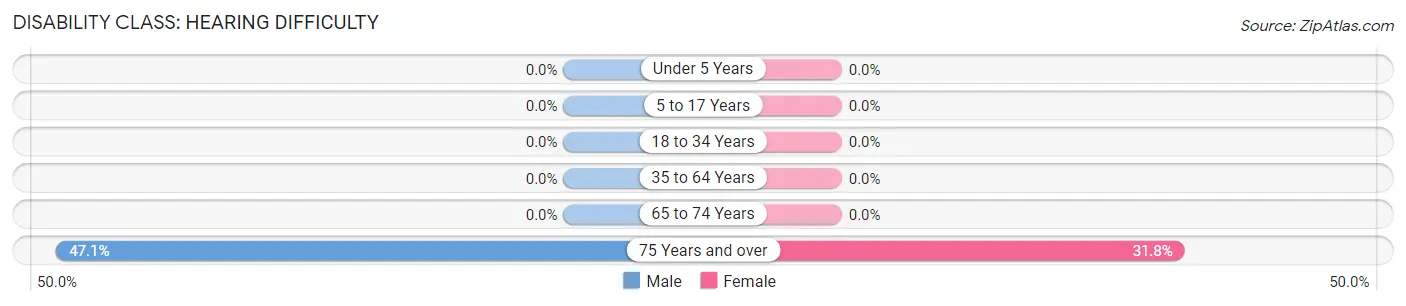
| Age Bracket | Male | Female |
| Under 5 Years | 0 (0.0%) | 0 (0.0%) |
| 5 to 17 Years | 0 (0.0%) | 0 (0.0%) |
| 18 to 34 Years | 0 (0.0%) | 0 (0.0%) |
| 35 to 64 Years | 0 (0.0%) | 0 (0.0%) |
| 65 to 74 Years | 0 (0.0%) | 0 (0.0%) |
| 75 Years and over | 8 (47.1%) | 7 (31.8%) |
Disability Class: Vision Difficulty
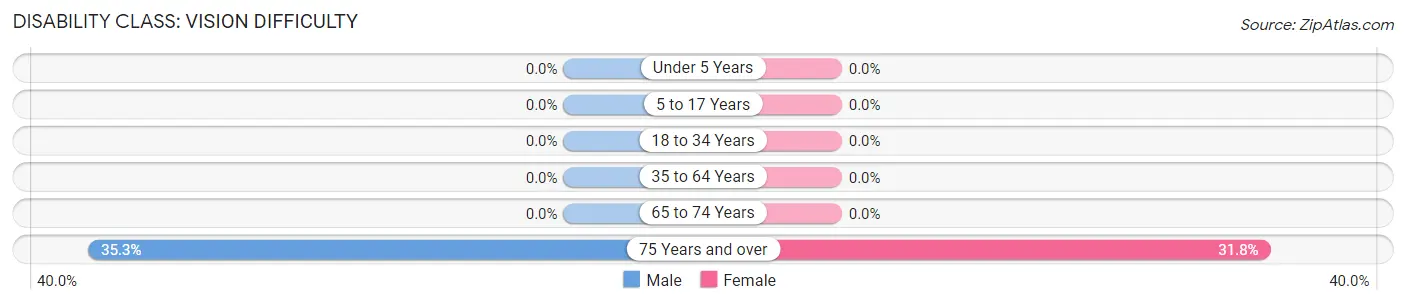
| Age Bracket | Male | Female |
| Under 5 Years | 0 (0.0%) | 0 (0.0%) |
| 5 to 17 Years | 0 (0.0%) | 0 (0.0%) |
| 18 to 34 Years | 0 (0.0%) | 0 (0.0%) |
| 35 to 64 Years | 0 (0.0%) | 0 (0.0%) |
| 65 to 74 Years | 0 (0.0%) | 0 (0.0%) |
| 75 Years and over | 6 (35.3%) | 7 (31.8%) |
Disability Class: Cognitive Difficulty
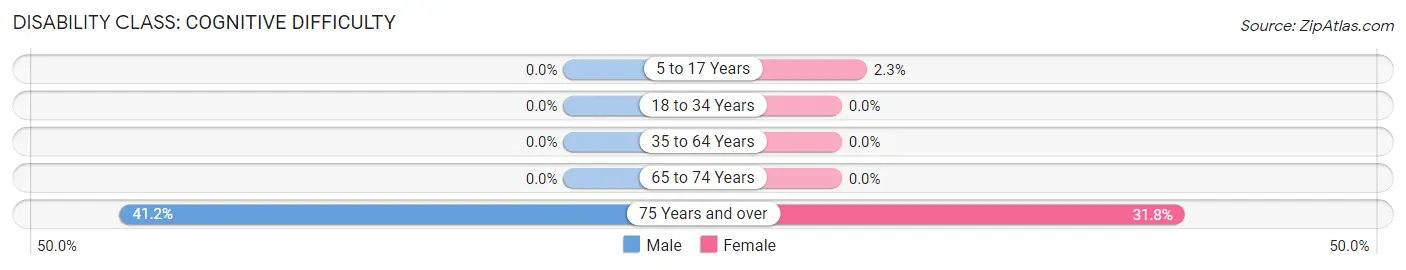
| Age Bracket | Male | Female |
| 5 to 17 Years | 0 (0.0%) | 1 (2.3%) |
| 18 to 34 Years | 0 (0.0%) | 0 (0.0%) |
| 35 to 64 Years | 0 (0.0%) | 0 (0.0%) |
| 65 to 74 Years | 0 (0.0%) | 0 (0.0%) |
| 75 Years and over | 7 (41.2%) | 7 (31.8%) |
Disability Class: Ambulatory Difficulty
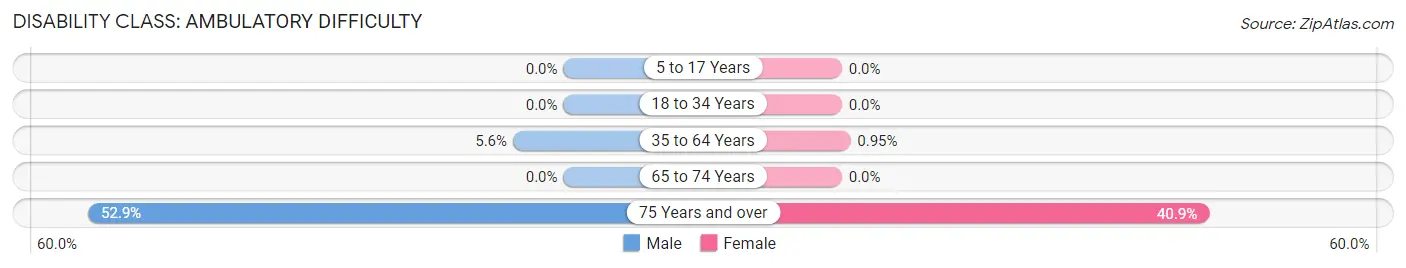
| Age Bracket | Male | Female |
| 5 to 17 Years | 0 (0.0%) | 0 (0.0%) |
| 18 to 34 Years | 0 (0.0%) | 0 (0.0%) |
| 35 to 64 Years | 5 (5.6%) | 1 (0.9%) |
| 65 to 74 Years | 0 (0.0%) | 0 (0.0%) |
| 75 Years and over | 9 (52.9%) | 9 (40.9%) |
Disability Class: Self-Care Difficulty
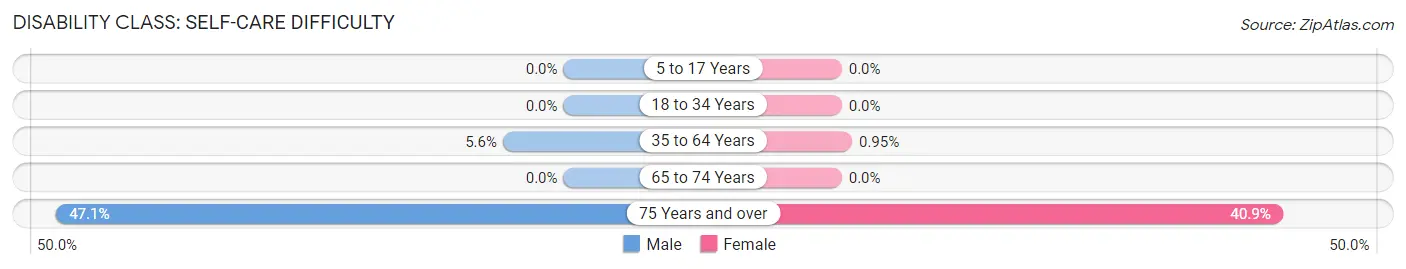
| Age Bracket | Male | Female |
| 5 to 17 Years | 0 (0.0%) | 0 (0.0%) |
| 18 to 34 Years | 0 (0.0%) | 0 (0.0%) |
| 35 to 64 Years | 5 (5.6%) | 1 (0.9%) |
| 65 to 74 Years | 0 (0.0%) | 0 (0.0%) |
| 75 Years and over | 8 (47.1%) | 9 (40.9%) |
Technology Access in Sea Ranch Lakes
Computing Device Access in Sea Ranch Lakes
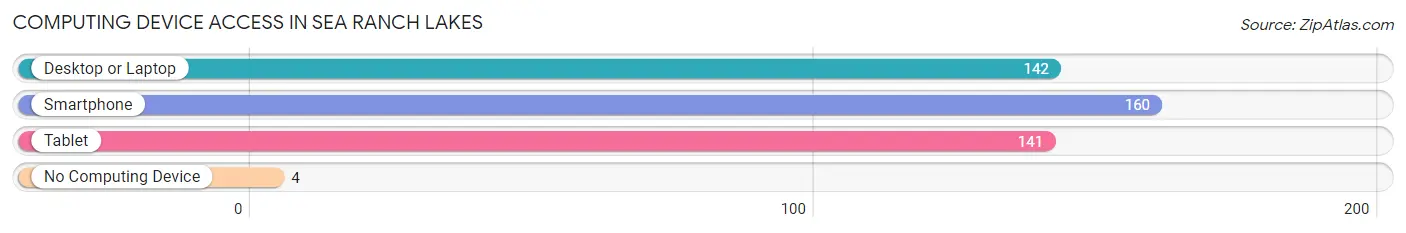
| Device Type | # Households | % Households |
| Desktop or Laptop | 142 | 82.6% |
| Smartphone | 160 | 93.0% |
| Tablet | 141 | 82.0% |
| No Computing Device | 4 | 2.3% |
| Total | 172 | 100.0% |
Internet Access in Sea Ranch Lakes
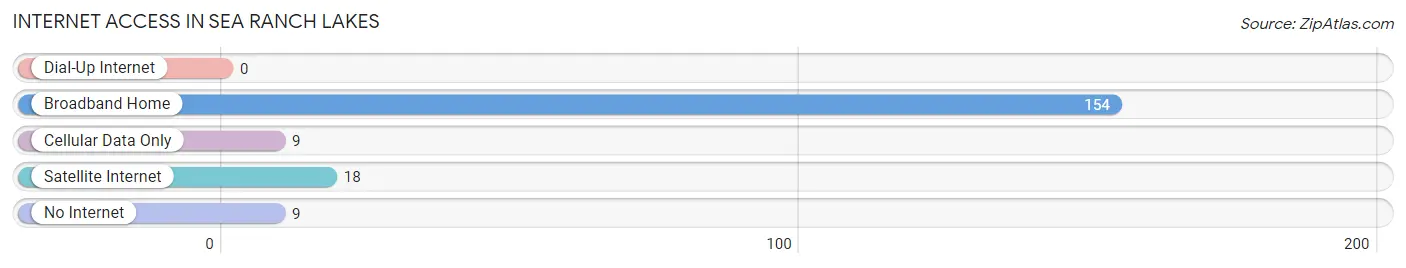
| Internet Type | # Households | % Households |
| Dial-Up Internet | 0 | 0.0% |
| Broadband Home | 154 | 89.5% |
| Cellular Data Only | 9 | 5.2% |
| Satellite Internet | 18 | 10.5% |
| No Internet | 9 | 5.2% |
| Total | 172 | 100.0% |
Sea Ranch Lakes Summary
The Village of Sea Ranch Lakes is a small, affluent municipality located in Broward County, Florida. It is situated between the cities of Lauderdale-by-the-Sea and Pompano Beach, and is bordered by the Atlantic Ocean to the east. The village was incorporated in 1959 and is home to approximately 500 residents.
Geography
Sea Ranch Lakes is located in southeastern Florida, approximately 25 miles north of Miami. It is situated between the cities of Lauderdale-by-the-Sea and Pompano Beach, and is bordered by the Atlantic Ocean to the east. The village is situated on a barrier island, and is surrounded by the Intracoastal Waterway to the west and the Atlantic Ocean to the east. The village covers an area of 0.2 square miles, and is home to approximately 500 residents.
History
The area that is now Sea Ranch Lakes was originally inhabited by the Tequesta Indians. In the late 19th century, the area was developed as a resort destination, and was known as the “Venice of America”. In 1959, the area was incorporated as the Village of Sea Ranch Lakes. The village was developed as a private, gated community, and was designed to be a luxurious and exclusive residential area.
Economy
The economy of Sea Ranch Lakes is largely based on tourism and real estate. The village is home to several luxury resorts and hotels, as well as a number of high-end restaurants and shops. The village is also home to a number of real estate developments, including single-family homes, condominiums, and townhomes.
Demographics
As of the 2010 census, the population of Sea Ranch Lakes was 498. The racial makeup of the village was 94.4% White, 2.2% African American, 0.2% Native American, 1.2% Asian, 0.2% Pacific Islander, 0.8% from other races, and 1.2% from two or more races. The median household income was $90,000, and the median family income was $100,000.
Conclusion
Sea Ranch Lakes is a small, affluent village located in Broward County, Florida. It is situated between the cities of Lauderdale-by-the-Sea and Pompano Beach, and is bordered by the Atlantic Ocean to the east. The village was incorporated in 1959 and is home to approximately 500 residents. The economy of Sea Ranch Lakes is largely based on tourism and real estate, and the village is home to several luxury resorts and hotels, as well as a number of high-end restaurants and shops. The population of Sea Ranch Lakes is largely white, with a median household income of $90,000 and a median family income of $100,000.
Common Questions
What is Per Capita Income in Sea Ranch Lakes?
Per Capita income in Sea Ranch Lakes is $141,165.
What is the Median Family Income in Sea Ranch Lakes?
Median Family Income in Sea Ranch Lakes is $250,001.
What is the Median Household income in Sea Ranch Lakes?
Median Household Income in Sea Ranch Lakes is $238,750.
What is Inequality or Gini Index in Sea Ranch Lakes?
Inequality or Gini Index in Sea Ranch Lakes is 0.48.
What is the Total Population of Sea Ranch Lakes?
Total Population of Sea Ranch Lakes is 443.
What is the Total Male Population of Sea Ranch Lakes?
Total Male Population of Sea Ranch Lakes is 225.
What is the Total Female Population of Sea Ranch Lakes?
Total Female Population of Sea Ranch Lakes is 218.
What is the Ratio of Males per 100 Females in Sea Ranch Lakes?
There are 103.21 Males per 100 Females in Sea Ranch Lakes.
What is the Ratio of Females per 100 Males in Sea Ranch Lakes?
There are 96.89 Females per 100 Males in Sea Ranch Lakes.
What is the Median Population Age in Sea Ranch Lakes?
Median Population Age in Sea Ranch Lakes is 48.2 Years.
What is the Average Family Size in Sea Ranch Lakes
Average Family Size in Sea Ranch Lakes is 3.0 People.
What is the Average Household Size in Sea Ranch Lakes
Average Household Size in Sea Ranch Lakes is 2.6 People.
How Large is the Labor Force in Sea Ranch Lakes?
There are 201 People in the Labor Forcein in Sea Ranch Lakes.
What is the Percentage of People in the Labor Force in Sea Ranch Lakes?
54.0% of People are in the Labor Force in Sea Ranch Lakes.
What is the Unemployment Rate in Sea Ranch Lakes?
Unemployment Rate in Sea Ranch Lakes is 1.0%.