Rogers, ND Map & Demographics
Rogers Map
Rogers Overview
$56,280
PER CAPITA INCOME
$149,375
AVG FAMILY INCOME
$71,625
AVG HOUSEHOLD INCOME
20.5%
WAGE / INCOME GAP [ % ]
79.5¢/ $1
WAGE / INCOME GAP [ $ ]
0.26
INEQUALITY / GINI INDEX
41
TOTAL POPULATION
21
MALE POPULATION
20
FEMALE POPULATION
105.00
MALES / 100 FEMALES
95.24
FEMALES / 100 MALES
41.9
MEDIAN AGE
2.1
AVG FAMILY SIZE
1.6
AVG HOUSEHOLD SIZE
35
LABOR FORCE [ PEOPLE ]
94.6%
PERCENT IN LABOR FORCE
5.7%
UNEMPLOYMENT RATE
Rogers Zip Codes
Rogers Area Codes
Income in Rogers
Income Overview in Rogers
Per Capita Income in Rogers is $56,280, while median incomes of families and households are $149,375 and $71,625 respectively.
| Characteristic | Number | Measure |
| Per Capita Income | 41 | $56,280 |
| Median Family Income | 11 | $149,375 |
| Mean Family Income | 11 | $141,218 |
| Median Household Income | 25 | $71,625 |
| Mean Household Income | 25 | $100,484 |
| Income Deficit | 11 | $0 |
| Wage / Income Gap (%) | 41 | 20.52% |
| Wage / Income Gap ($) | 41 | 79.48¢ per $1 |
| Gini / Inequality Index | 41 | 0.26 |
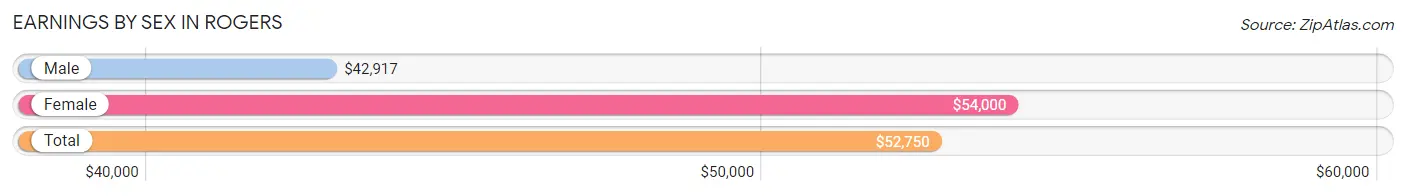
Earnings by Sex in Rogers
Average Earnings in Rogers are $52,750, $42,917 for men and $54,000 for women, a difference of 20.5%.
| Sex | Number | Average Earnings |
| Male | 21 (60.0%) | $42,917 |
| Female | 14 (40.0%) | $54,000 |
| Total | 35 (100.0%) | $52,750 |
Earnings by Sex by Income Bracket in Rogers
The most common earnings brackets in Rogers are $30,000 to $34,999 for men (7 | 33.3%) and $50,000 to $54,999 for women (5 | 35.7%).
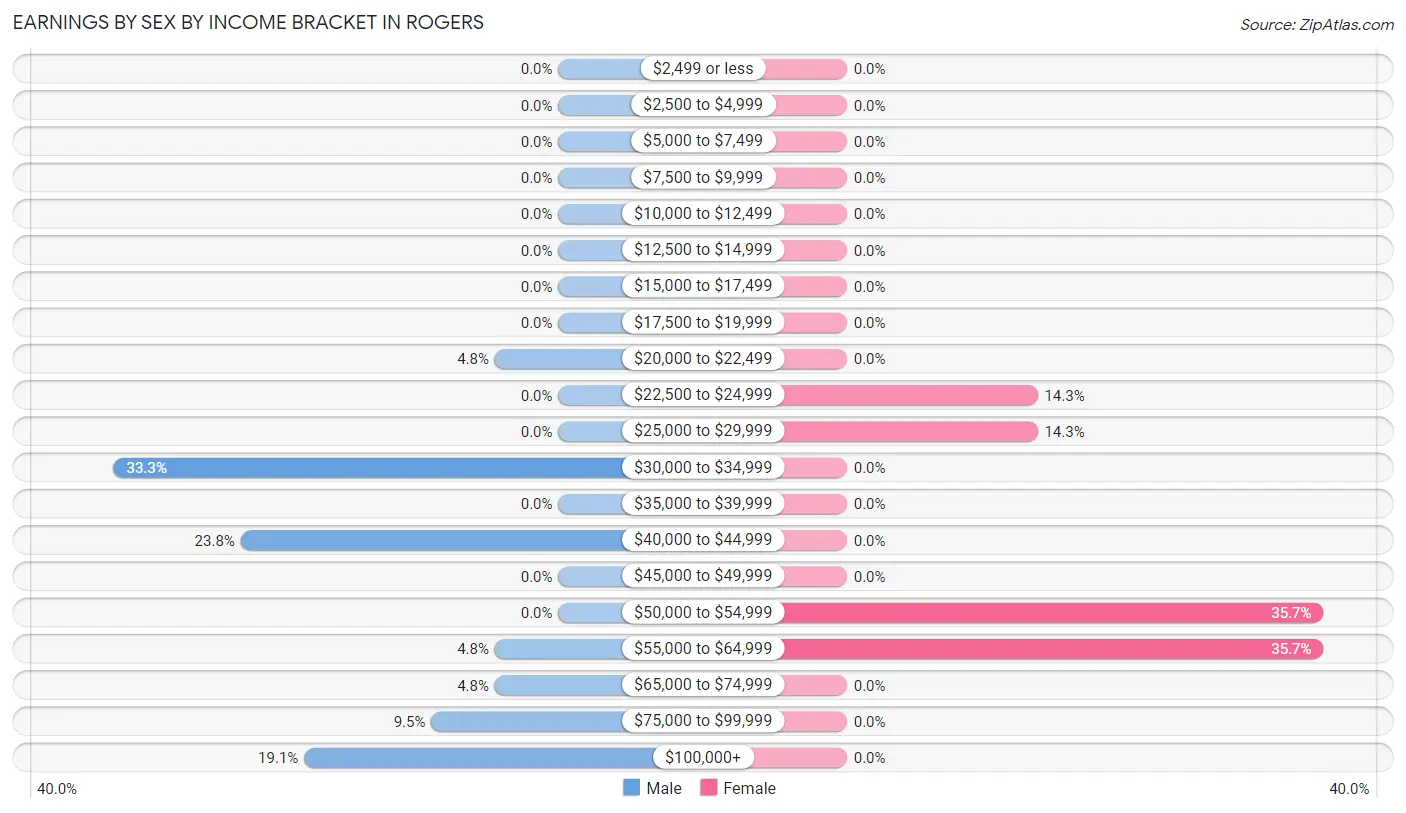
| Income | Male | Female |
| $2,499 or less | 0 (0.0%) | 0 (0.0%) |
| $2,500 to $4,999 | 0 (0.0%) | 0 (0.0%) |
| $5,000 to $7,499 | 0 (0.0%) | 0 (0.0%) |
| $7,500 to $9,999 | 0 (0.0%) | 0 (0.0%) |
| $10,000 to $12,499 | 0 (0.0%) | 0 (0.0%) |
| $12,500 to $14,999 | 0 (0.0%) | 0 (0.0%) |
| $15,000 to $17,499 | 0 (0.0%) | 0 (0.0%) |
| $17,500 to $19,999 | 0 (0.0%) | 0 (0.0%) |
| $20,000 to $22,499 | 1 (4.8%) | 0 (0.0%) |
| $22,500 to $24,999 | 0 (0.0%) | 2 (14.3%) |
| $25,000 to $29,999 | 0 (0.0%) | 2 (14.3%) |
| $30,000 to $34,999 | 7 (33.3%) | 0 (0.0%) |
| $35,000 to $39,999 | 0 (0.0%) | 0 (0.0%) |
| $40,000 to $44,999 | 5 (23.8%) | 0 (0.0%) |
| $45,000 to $49,999 | 0 (0.0%) | 0 (0.0%) |
| $50,000 to $54,999 | 0 (0.0%) | 5 (35.7%) |
| $55,000 to $64,999 | 1 (4.8%) | 5 (35.7%) |
| $65,000 to $74,999 | 1 (4.8%) | 0 (0.0%) |
| $75,000 to $99,999 | 2 (9.5%) | 0 (0.0%) |
| $100,000+ | 4 (19.1%) | 0 (0.0%) |
| Total | 21 (100.0%) | 14 (100.0%) |
Earnings by Sex by Educational Attainment in Rogers
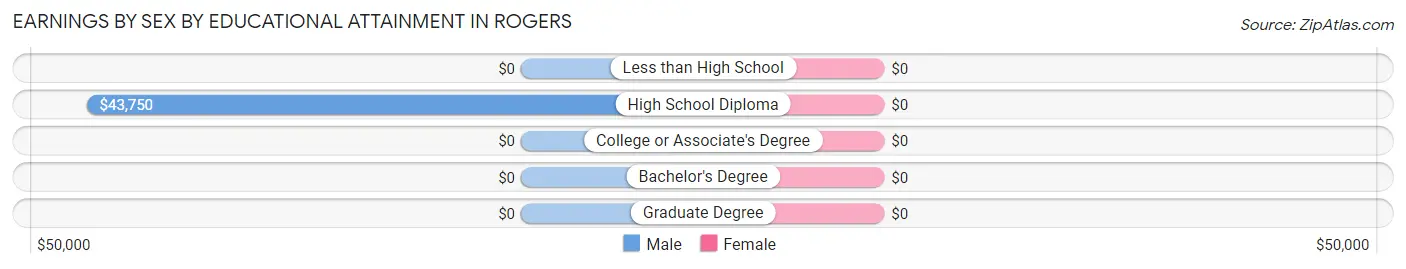
| Educational Attainment | Male Income | Female Income |
| Less than High School | - | - |
| High School Diploma | $43,750 | $0 |
| College or Associate's Degree | - | - |
| Bachelor's Degree | - | - |
| Graduate Degree | - | - |
| Total | $42,917 | $54,000 |
Family Income in Rogers
Family Income Brackets in Rogers
According to the Rogers family income data, there are 5 families falling into the $150,000 to $199,999 income range, which is the most common income bracket and makes up 45.5% of all families.
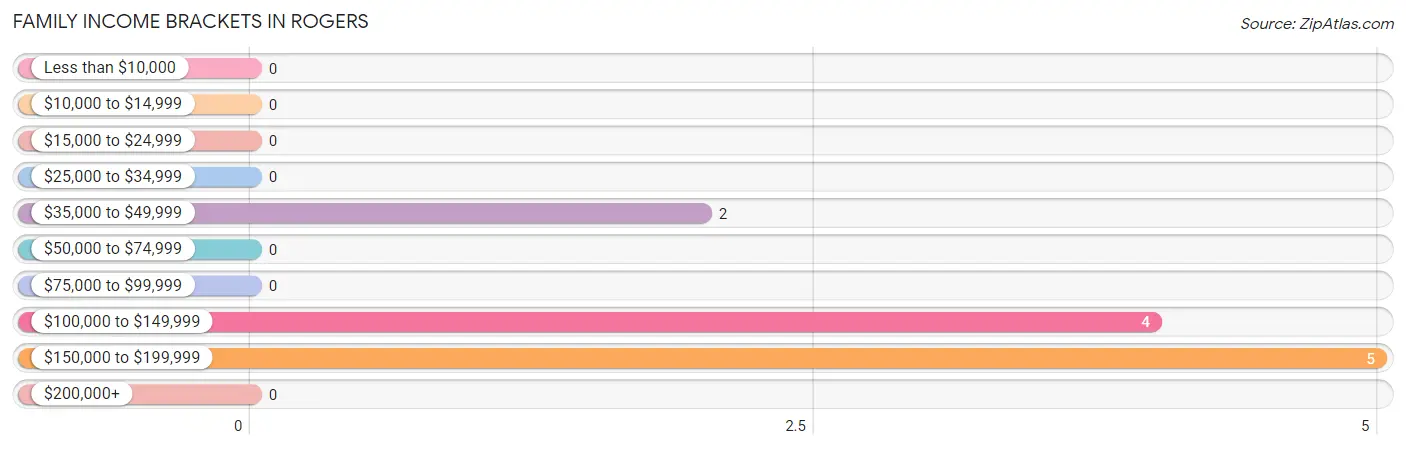
| Income Bracket | # Families | % Families |
| Less than $10,000 | 0 | 0.0% |
| $10,000 to $14,999 | 0 | 0.0% |
| $15,000 to $24,999 | 0 | 0.0% |
| $25,000 to $34,999 | 0 | 0.0% |
| $35,000 to $49,999 | 2 | 18.2% |
| $50,000 to $74,999 | 0 | 0.0% |
| $75,000 to $99,999 | 0 | 0.0% |
| $100,000 to $149,999 | 4 | 36.4% |
| $150,000 to $199,999 | 5 | 45.5% |
| $200,000+ | 0 | 0.0% |
Family Income by Famaliy Size in Rogers
3-person families (6 | 54.5%) account for the highest median family income in Rogers with $126,250 per family, while 3-person families (6 | 54.5%) have the highest median income of $42,083 per family member.
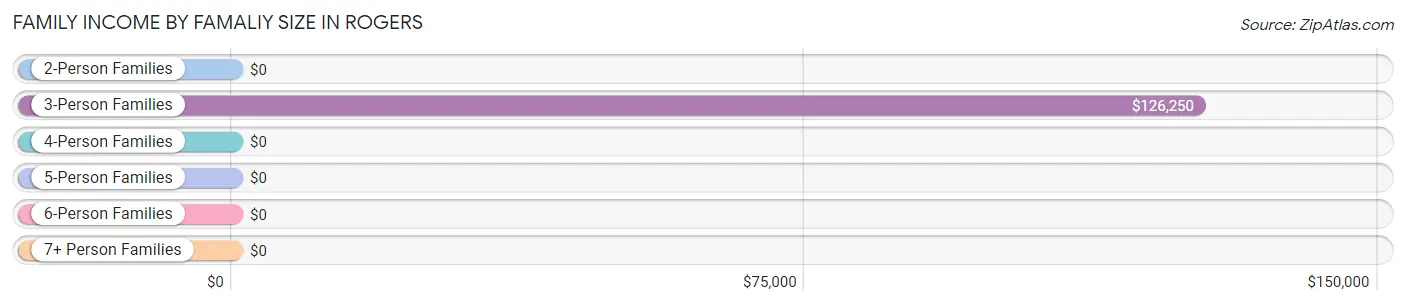
| Income Bracket | # Families | Median Income |
| 2-Person Families | 5 (45.5%) | $0 |
| 3-Person Families | 6 (54.5%) | $126,250 |
| 4-Person Families | 0 (0.0%) | $0 |
| 5-Person Families | 0 (0.0%) | $0 |
| 6-Person Families | 0 (0.0%) | $0 |
| 7+ Person Families | 0 (0.0%) | $0 |
| Total | 11 (100.0%) | $149,375 |
Family Income by Number of Earners in Rogers
| Number of Earners | # Families | Median Income |
| No Earners | 0 (0.0%) | $0 |
| 1 Earner | 2 (18.2%) | $0 |
| 2 Earners | 7 (63.6%) | $0 |
| 3+ Earners | 2 (18.2%) | $0 |
| Total | 11 (100.0%) | $149,375 |
Household Income in Rogers
Household Income Brackets in Rogers
With 14 households falling in the category, the $50,000 to $74,999 income range is the most frequent in Rogers, accounting for 56.0% of all households.
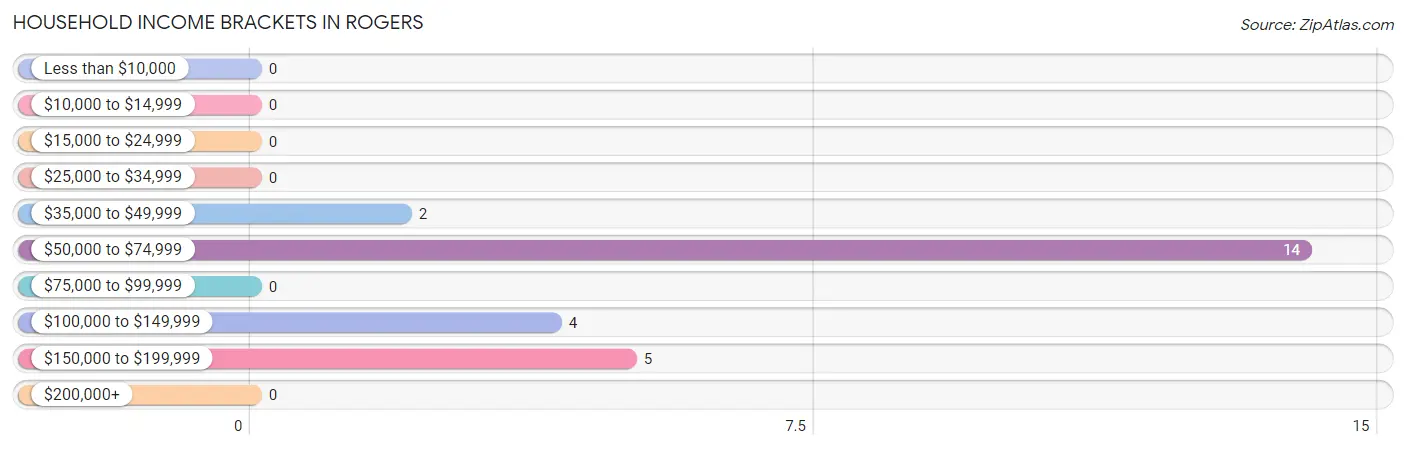
| Income Bracket | # Households | % Households |
| Less than $10,000 | 0 | 0.0% |
| $10,000 to $14,999 | 0 | 0.0% |
| $15,000 to $24,999 | 0 | 0.0% |
| $25,000 to $34,999 | 0 | 0.0% |
| $35,000 to $49,999 | 2 | 8.0% |
| $50,000 to $74,999 | 14 | 56.0% |
| $75,000 to $99,999 | 0 | 0.0% |
| $100,000 to $149,999 | 4 | 16.0% |
| $150,000 to $199,999 | 5 | 20.0% |
| $200,000+ | 0 | 0.0% |
Household Income by Householder Age in Rogers
The median household income in Rogers is $71,625, with the highest median household income of $155,000 found in the 25 to 44 years age bracket for the primary householder. A total of 10 households (40.0%) fall into this category.
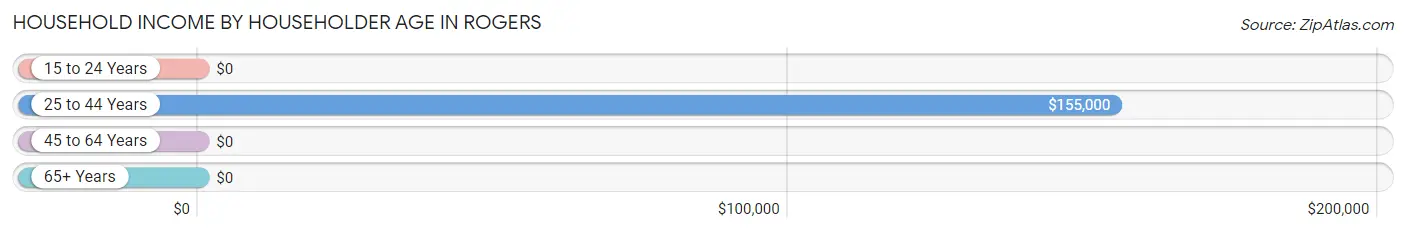
| Income Bracket | # Households | Median Income |
| 15 to 24 Years | 0 (0.0%) | $0 |
| 25 to 44 Years | 10 (40.0%) | $155,000 |
| 45 to 64 Years | 8 (32.0%) | $0 |
| 65+ Years | 7 (28.0%) | $0 |
| Total | 25 (100.0%) | $71,625 |
Poverty in Rogers
Income Below Poverty by Sex and Age in Rogers
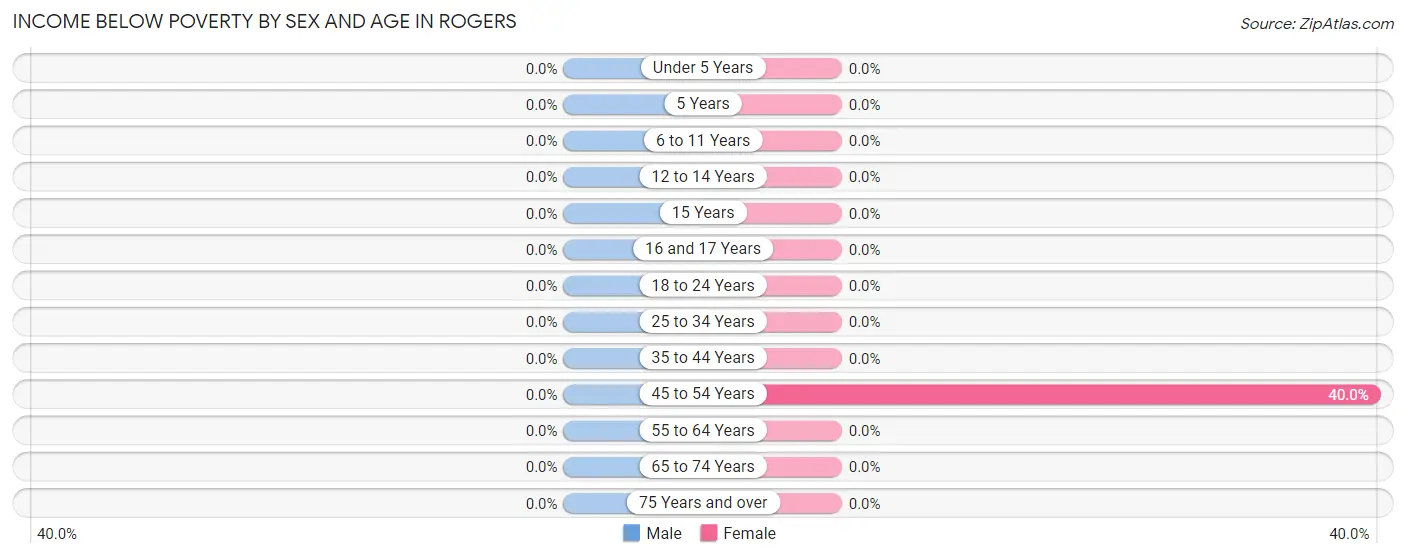
| Age Bracket | Male | Female |
| Under 5 Years | 0 (0.0%) | 0 (0.0%) |
| 5 Years | 0 (0.0%) | 0 (0.0%) |
| 6 to 11 Years | 0 (0.0%) | 0 (0.0%) |
| 12 to 14 Years | 0 (0.0%) | 0 (0.0%) |
| 15 Years | 0 (0.0%) | 0 (0.0%) |
| 16 and 17 Years | 0 (0.0%) | 0 (0.0%) |
| 18 to 24 Years | 0 (0.0%) | 0 (0.0%) |
| 25 to 34 Years | 0 (0.0%) | 0 (0.0%) |
| 35 to 44 Years | 0 (0.0%) | 0 (0.0%) |
| 45 to 54 Years | 0 (0.0%) | 2 (40.0%) |
| 55 to 64 Years | 0 (0.0%) | 0 (0.0%) |
| 65 to 74 Years | 0 (0.0%) | 0 (0.0%) |
| 75 Years and over | 0 (0.0%) | 0 (0.0%) |
| Total | 0 (0.0%) | 2 (10.0%) |
Income Above Poverty by Sex and Age in Rogers
According to the poverty statistics in Rogers, males aged 35 to 44 years and females aged under 5 years are the age groups that are most secure financially, with 100.0% of males and 100.0% of females in these age groups living above the poverty line.
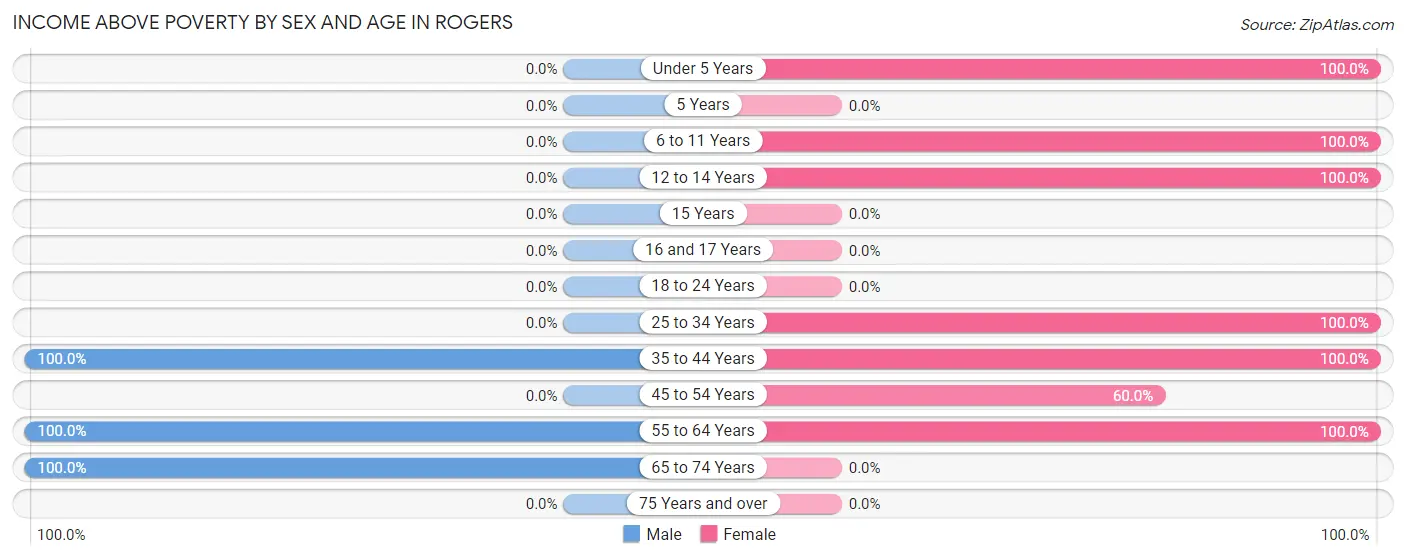
| Age Bracket | Male | Female |
| Under 5 Years | 0 (0.0%) | 1 (100.0%) |
| 5 Years | 0 (0.0%) | 0 (0.0%) |
| 6 to 11 Years | 0 (0.0%) | 2 (100.0%) |
| 12 to 14 Years | 0 (0.0%) | 1 (100.0%) |
| 15 Years | 0 (0.0%) | 0 (0.0%) |
| 16 and 17 Years | 0 (0.0%) | 0 (0.0%) |
| 18 to 24 Years | 0 (0.0%) | 0 (0.0%) |
| 25 to 34 Years | 0 (0.0%) | 4 (100.0%) |
| 35 to 44 Years | 9 (100.0%) | 5 (100.0%) |
| 45 to 54 Years | 0 (0.0%) | 3 (60.0%) |
| 55 to 64 Years | 5 (100.0%) | 2 (100.0%) |
| 65 to 74 Years | 7 (100.0%) | 0 (0.0%) |
| 75 Years and over | 0 (0.0%) | 0 (0.0%) |
| Total | 21 (100.0%) | 18 (90.0%) |
Income Below Poverty Among Married-Couple Families in Rogers
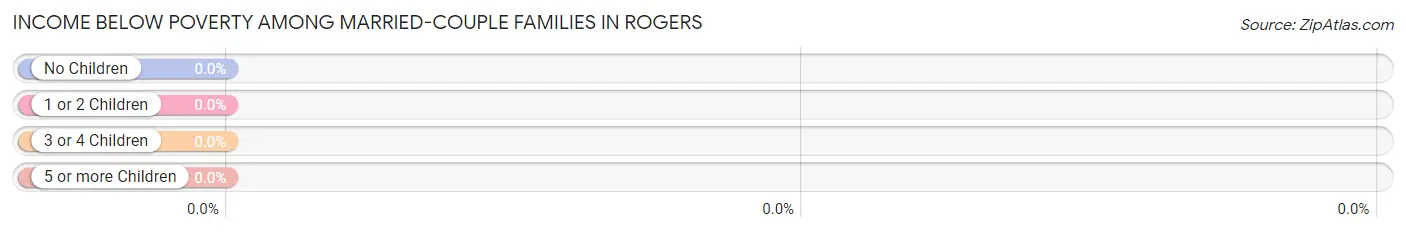
| Children | Above Poverty | Below Poverty |
| No Children | 7 (100.0%) | 0 (0.0%) |
| 1 or 2 Children | 2 (100.0%) | 0 (0.0%) |
| 3 or 4 Children | 0 (0.0%) | 0 (0.0%) |
| 5 or more Children | 0 (0.0%) | 0 (0.0%) |
| Total | 9 (100.0%) | 0 (0.0%) |
Income Below Poverty Among Single-Parent Households in Rogers
| Children | Single Father | Single Mother |
| No Children | 0 (0.0%) | 0 (0.0%) |
| 1 or 2 Children | 0 (0.0%) | 0 (0.0%) |
| 3 or 4 Children | 0 (0.0%) | 0 (0.0%) |
| 5 or more Children | 0 (0.0%) | 0 (0.0%) |
| Total | 0 (0.0%) | 0 (0.0%) |
Income Below Poverty Among Married-Couple vs Single-Parent Households in Rogers
| Children | Married-Couple Families | Single-Parent Households |
| No Children | 0 (0.0%) | 0 (0.0%) |
| 1 or 2 Children | 0 (0.0%) | 0 (0.0%) |
| 3 or 4 Children | 0 (0.0%) | 0 (0.0%) |
| 5 or more Children | 0 (0.0%) | 0 (0.0%) |
| Total | 0 (0.0%) | 0 (0.0%) |
Race in Rogers
The most populous races in Rogers are White / Caucasian (41 | 100.0%), and Hispanic or Latino (1 | 2.4%).
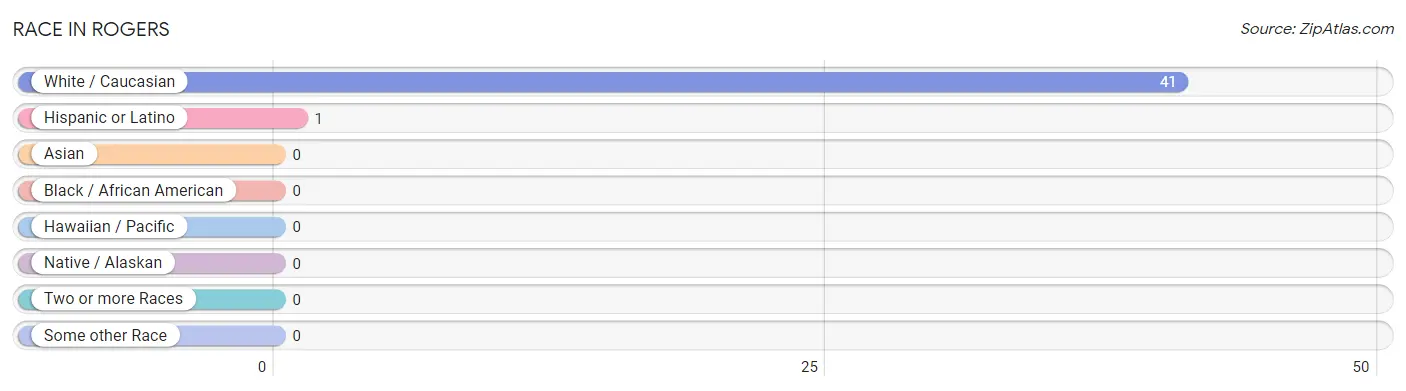
| Race | # Population | % Population |
| Asian | 0 | 0.0% |
| Black / African American | 0 | 0.0% |
| Hawaiian / Pacific | 0 | 0.0% |
| Hispanic or Latino | 1 | 2.4% |
| Native / Alaskan | 0 | 0.0% |
| White / Caucasian | 41 | 100.0% |
| Two or more Races | 0 | 0.0% |
| Some other Race | 0 | 0.0% |
| Total | 41 | 100.0% |
Ancestry in Rogers
The most populous ancestries reported in Rogers are Norwegian (20 | 48.8%), German (14 | 34.2%), Irish (6 | 14.6%), Swedish (5 | 12.2%), and French (2 | 4.9%), together accounting for 114.6% of all Rogers residents.
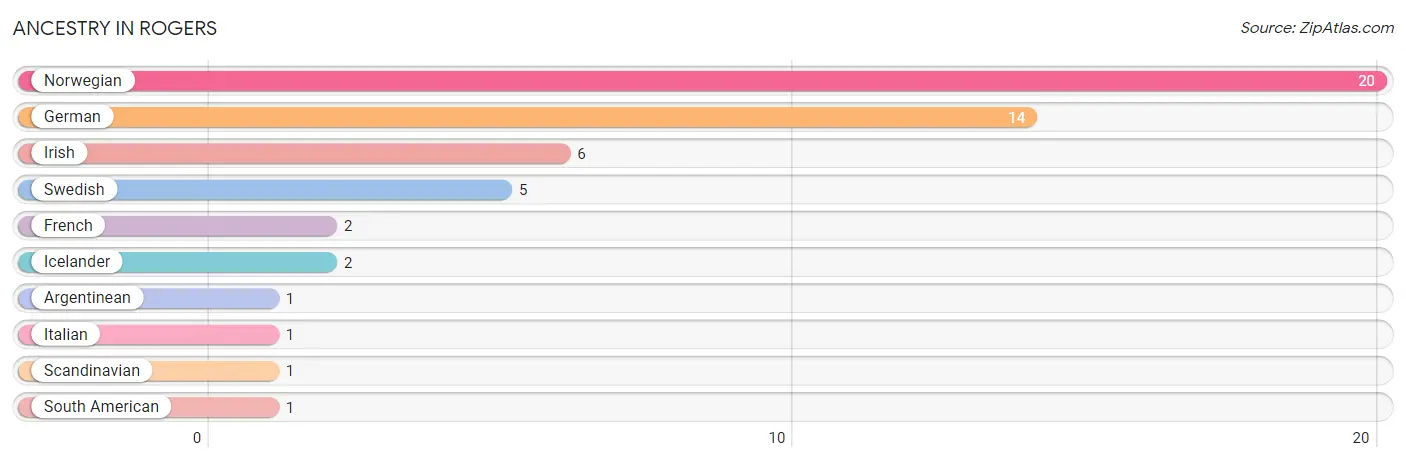
| Ancestry | # Population | % Population |
| Argentinean | 1 | 2.4% |
| French | 2 | 4.9% |
| German | 14 | 34.2% |
| Icelander | 2 | 4.9% |
| Irish | 6 | 14.6% |
| Italian | 1 | 2.4% |
| Norwegian | 20 | 48.8% |
| Scandinavian | 1 | 2.4% |
| South American | 1 | 2.4% |
| Swedish | 5 | 12.2% | View All 10 Rows |
Immigrants in Rogers

| Immigration Origin | # Population | % Population | View All 0 Rows |
Sex and Age in Rogers
Sex and Age in Rogers
The most populous age groups in Rogers are 65 to 69 Years (7 | 33.3%) for men and 40 to 44 Years (5 | 25.0%) for women.
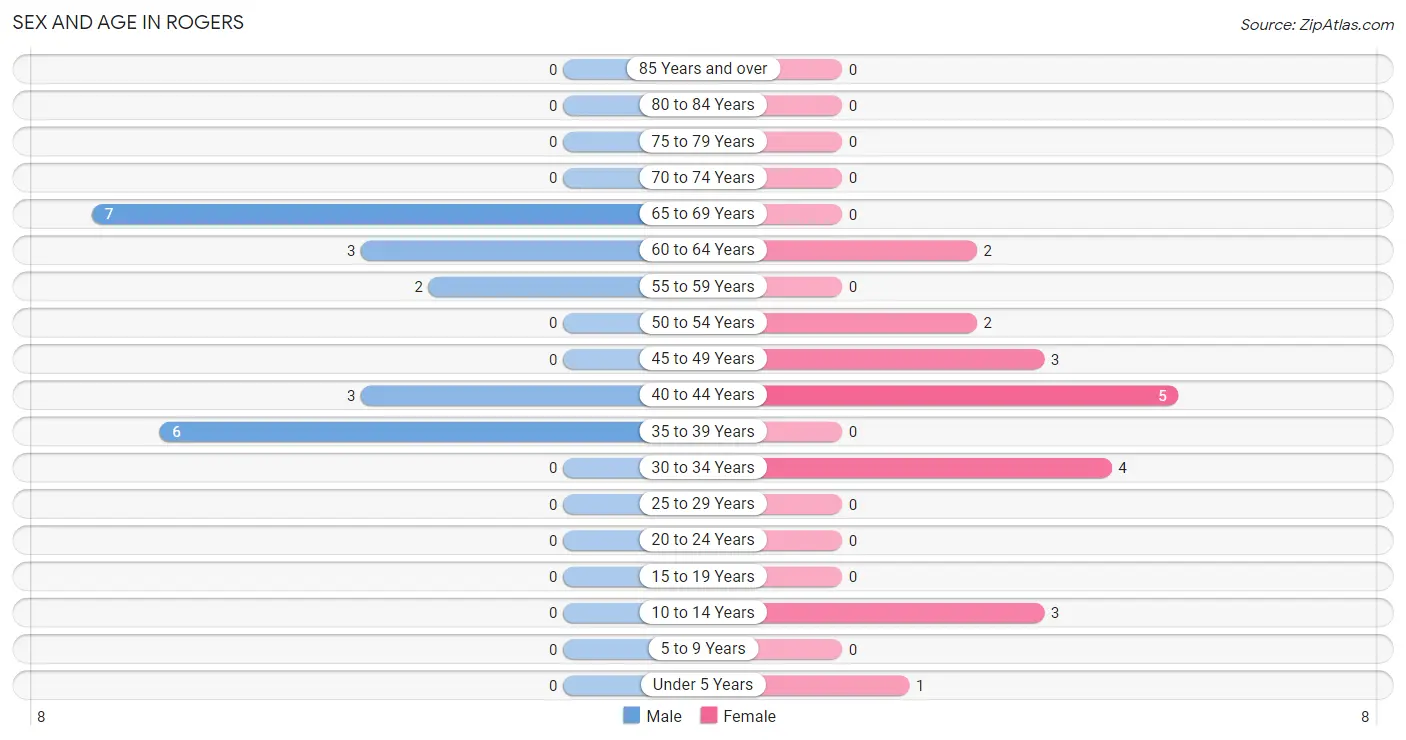
| Age Bracket | Male | Female |
| Under 5 Years | 0 (0.0%) | 1 (5.0%) |
| 5 to 9 Years | 0 (0.0%) | 0 (0.0%) |
| 10 to 14 Years | 0 (0.0%) | 3 (15.0%) |
| 15 to 19 Years | 0 (0.0%) | 0 (0.0%) |
| 20 to 24 Years | 0 (0.0%) | 0 (0.0%) |
| 25 to 29 Years | 0 (0.0%) | 0 (0.0%) |
| 30 to 34 Years | 0 (0.0%) | 4 (20.0%) |
| 35 to 39 Years | 6 (28.6%) | 0 (0.0%) |
| 40 to 44 Years | 3 (14.3%) | 5 (25.0%) |
| 45 to 49 Years | 0 (0.0%) | 3 (15.0%) |
| 50 to 54 Years | 0 (0.0%) | 2 (10.0%) |
| 55 to 59 Years | 2 (9.5%) | 0 (0.0%) |
| 60 to 64 Years | 3 (14.3%) | 2 (10.0%) |
| 65 to 69 Years | 7 (33.3%) | 0 (0.0%) |
| 70 to 74 Years | 0 (0.0%) | 0 (0.0%) |
| 75 to 79 Years | 0 (0.0%) | 0 (0.0%) |
| 80 to 84 Years | 0 (0.0%) | 0 (0.0%) |
| 85 Years and over | 0 (0.0%) | 0 (0.0%) |
| Total | 21 (100.0%) | 20 (100.0%) |
Families and Households in Rogers
Median Family Size in Rogers
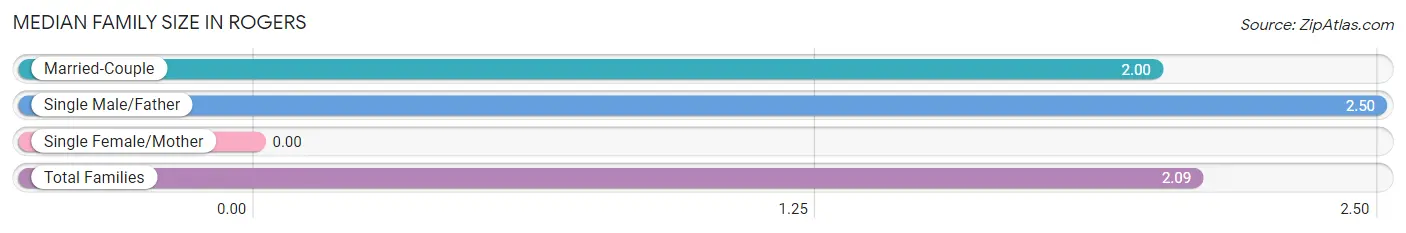
| Family Type | # Families | Family Size |
| Married-Couple | 9 (81.8%) | 2.00 |
| Single Male/Father | 2 (18.2%) | 2.50 |
| Single Female/Mother | 0 (0.0%) | - |
| Total Families | 11 (100.0%) | 2.09 |
Median Household Size in Rogers
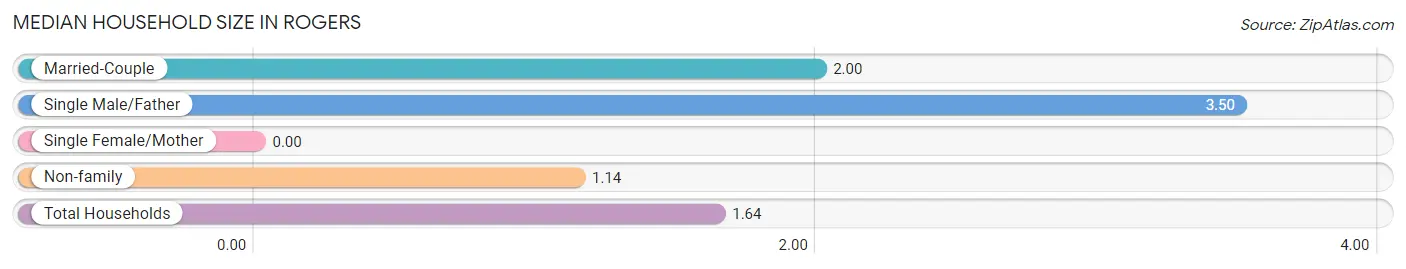
| Household Type | # Households | Household Size |
| Married-Couple | 9 (36.0%) | 2.00 |
| Single Male/Father | 2 (8.0%) | 3.50 |
| Single Female/Mother | 0 (0.0%) | - |
| Non-family | 14 (56.0%) | 1.14 |
| Total Households | 25 (100.0%) | 1.64 |
Household Size by Marriage Status in Rogers
Out of a total of 25 households in Rogers, 11 (44.0%) are family households, while 14 (56.0%) are nonfamily households. The most numerous type of family households are 2-person households, comprising 5, and the most common type of nonfamily households are 1-person households, comprising 13.
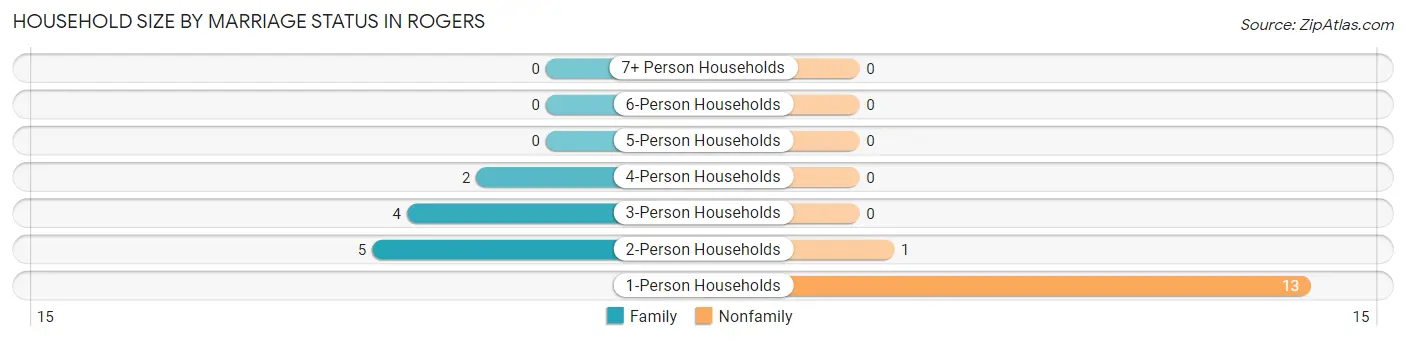
| Household Size | Family Households | Nonfamily Households |
| 1-Person Households | - | 13 (52.0%) |
| 2-Person Households | 5 (20.0%) | 1 (4.0%) |
| 3-Person Households | 4 (16.0%) | 0 (0.0%) |
| 4-Person Households | 2 (8.0%) | 0 (0.0%) |
| 5-Person Households | 0 (0.0%) | 0 (0.0%) |
| 6-Person Households | 0 (0.0%) | 0 (0.0%) |
| 7+ Person Households | 0 (0.0%) | 0 (0.0%) |
| Total | 11 (44.0%) | 14 (56.0%) |
Female Fertility in Rogers
Fertility by Age in Rogers
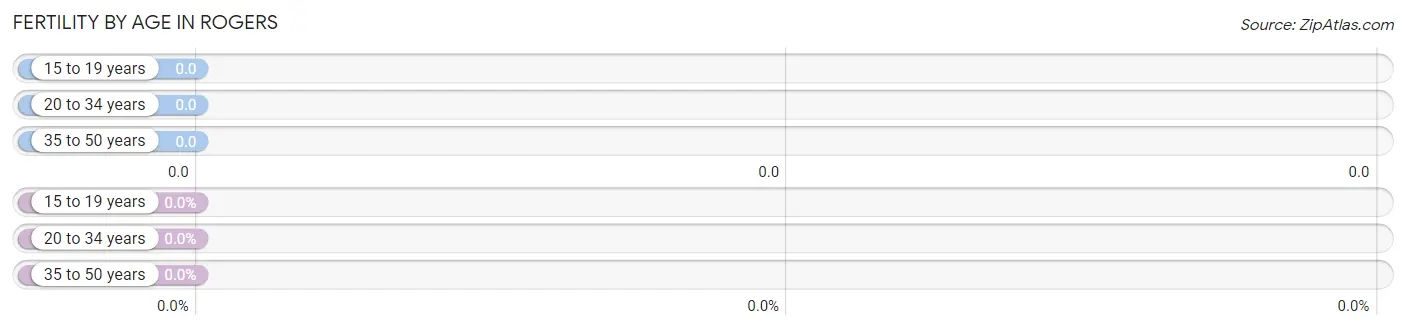
| Age Bracket | Women with Births | Births / 1,000 Women |
| 15 to 19 years | 0 (0.0%) | 0.0 |
| 20 to 34 years | 0 (0.0%) | 0.0 |
| 35 to 50 years | 0 (0.0%) | 0.0 |
| Total | 0 (0.0%) | 0.0 |
Fertility by Age by Marriage Status in Rogers
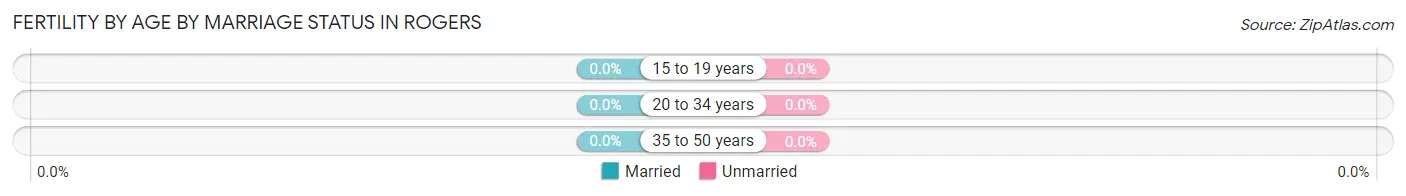
| Age Bracket | Married | Unmarried |
| 15 to 19 years | 0 (0.0%) | 0 (0.0%) |
| 20 to 34 years | 0 (0.0%) | 0 (0.0%) |
| 35 to 50 years | 0 (0.0%) | 0 (0.0%) |
| Total | 0 (0.0%) | 0 (0.0%) |
Fertility by Education in Rogers
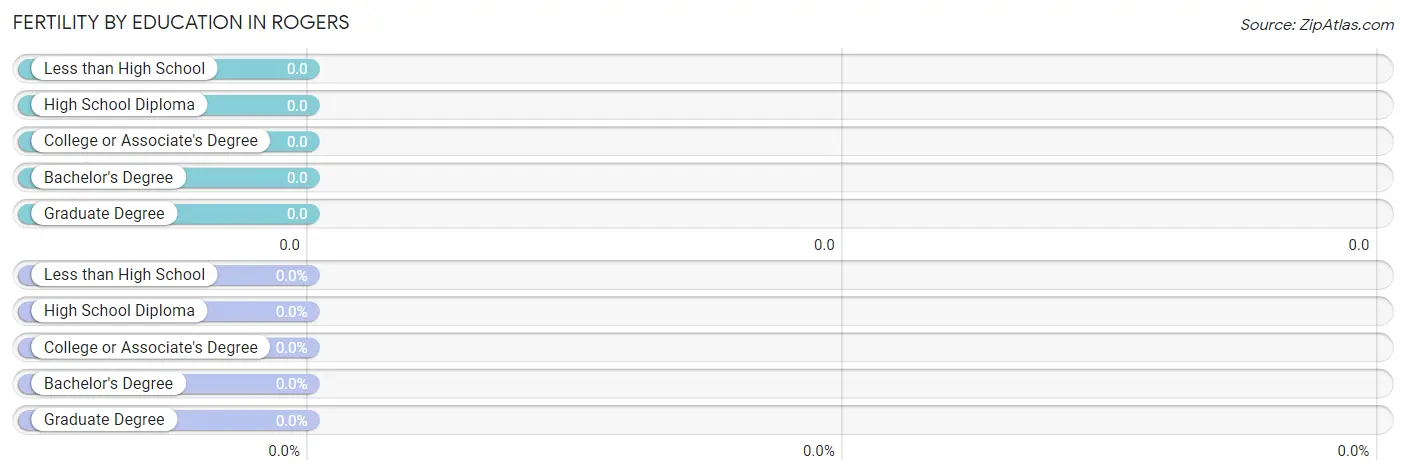
| Educational Attainment | Women with Births | Births / 1,000 Women |
| Less than High School | 0 (0.0%) | 0.0 |
| High School Diploma | 0 (0.0%) | 0.0 |
| College or Associate's Degree | 0 (0.0%) | 0.0 |
| Bachelor's Degree | 0 (0.0%) | 0.0 |
| Graduate Degree | 0 (0.0%) | 0.0 |
| Total | 0 (0.0%) | 0.0 |
Fertility by Education by Marriage Status in Rogers
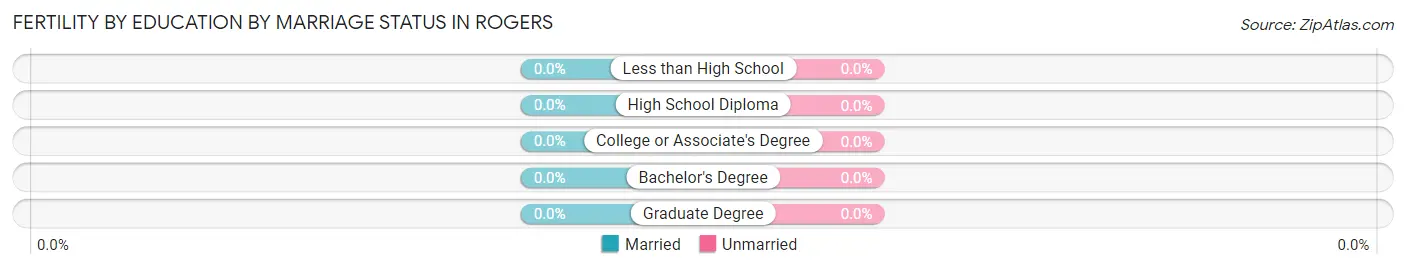
| Educational Attainment | Married | Unmarried |
| Less than High School | 0 (0.0%) | 0 (0.0%) |
| High School Diploma | 0 (0.0%) | 0 (0.0%) |
| College or Associate's Degree | 0 (0.0%) | 0 (0.0%) |
| Bachelor's Degree | 0 (0.0%) | 0 (0.0%) |
| Graduate Degree | 0 (0.0%) | 0 (0.0%) |
| Total | 0 (0.0%) | 0 (0.0%) |
Employment Characteristics in Rogers
Employment by Class of Employer in Rogers
Among the 33 employed individuals in Rogers, private company employees (11 | 33.3%), self-employed (not incorporated) (10 | 30.3%), and local government employees (7 | 21.2%) make up the most common classes of employment.
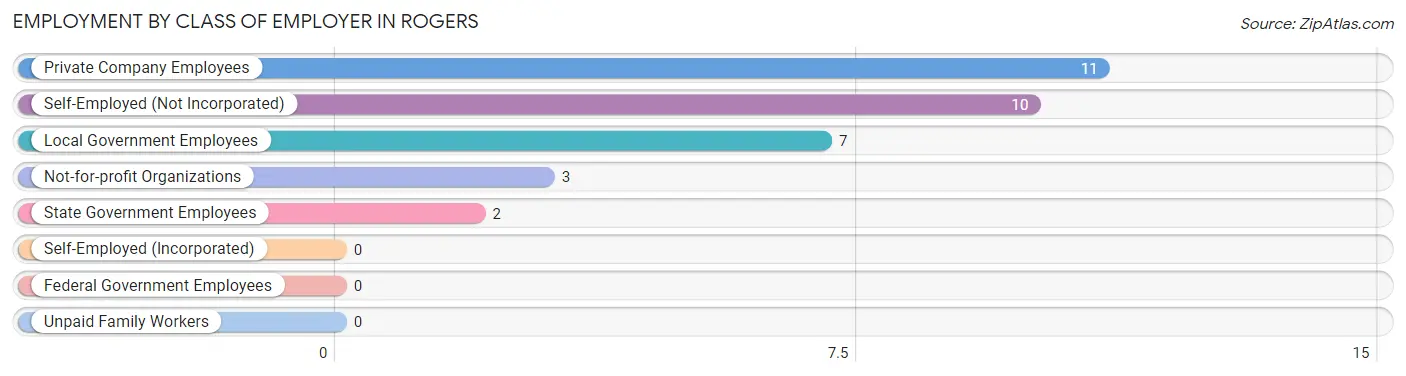
| Employer Class | # Employees | % Employees |
| Private Company Employees | 11 | 33.3% |
| Self-Employed (Incorporated) | 0 | 0.0% |
| Self-Employed (Not Incorporated) | 10 | 30.3% |
| Not-for-profit Organizations | 3 | 9.1% |
| Local Government Employees | 7 | 21.2% |
| State Government Employees | 2 | 6.1% |
| Federal Government Employees | 0 | 0.0% |
| Unpaid Family Workers | 0 | 0.0% |
| Total | 33 | 100.0% |
Employment Status by Age in Rogers
According to the labor force statistics for Rogers, out of the total population over 16 years of age (37), 94.6% or 35 individuals are in the labor force, with 5.7% or 2 of them unemployed. The age group with the highest labor force participation rate is 30 to 34 years, with 100.0% or 4 individuals in the labor force. Within the labor force, the 60 to 64 years age range has the highest percentage of unemployed individuals, with 40.0% or 2 of them being unemployed.
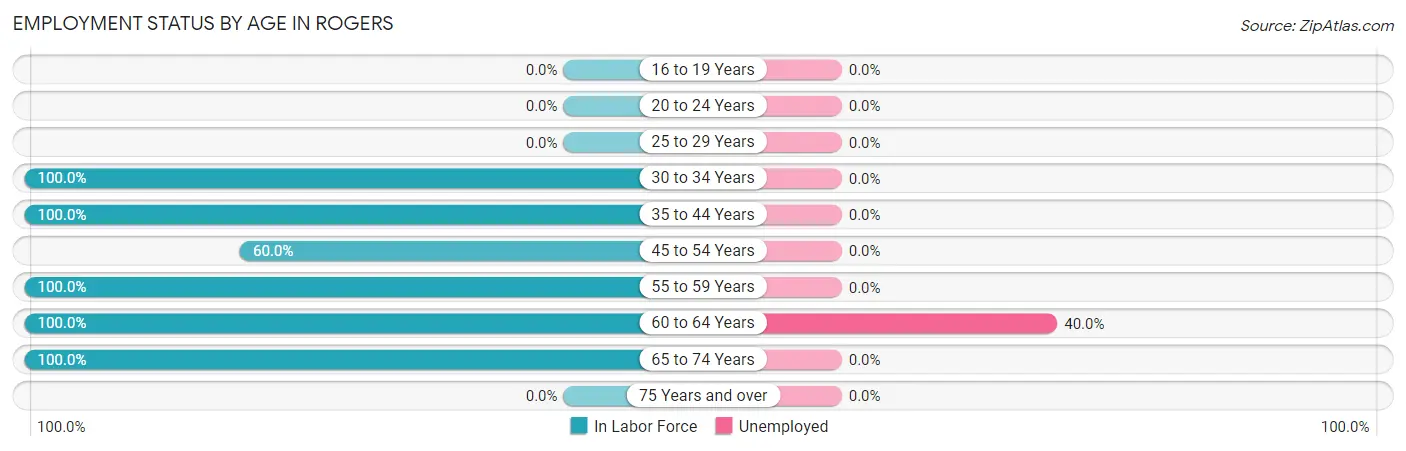
| Age Bracket | In Labor Force | Unemployed |
| 16 to 19 Years | 0 (0.0%) | 0 (0.0%) |
| 20 to 24 Years | 0 (0.0%) | 0 (0.0%) |
| 25 to 29 Years | 0 (0.0%) | 0 (0.0%) |
| 30 to 34 Years | 4 (100.0%) | 0 (0.0%) |
| 35 to 44 Years | 14 (100.0%) | 0 (0.0%) |
| 45 to 54 Years | 3 (60.0%) | 0 (0.0%) |
| 55 to 59 Years | 2 (100.0%) | 0 (0.0%) |
| 60 to 64 Years | 5 (100.0%) | 2 (40.0%) |
| 65 to 74 Years | 7 (100.0%) | 0 (0.0%) |
| 75 Years and over | 0 (0.0%) | 0 (0.0%) |
| Total | 35 (94.6%) | 2 (5.7%) |
Employment Status by Educational Attainment in Rogers
According to labor force statistics for Rogers, 93.3% of individuals (28) out of the total population between 25 and 64 years of age (30) are in the labor force, with 7.1% or 2 of them being unemployed. The group with the highest labor force participation rate are those with the educational attainment of high school diploma, with 100.0% or 12 individuals in the labor force. Within the labor force, individuals with high school diploma education have the highest percentage of unemployment, with 16.7% or 2 of them being unemployed.
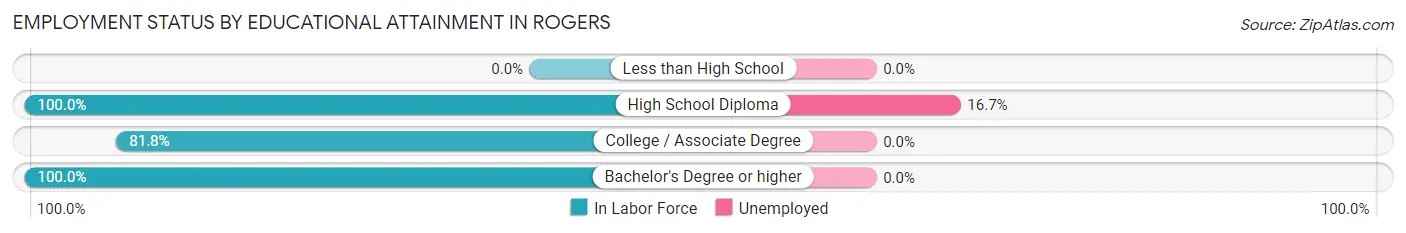
| Educational Attainment | In Labor Force | Unemployed |
| Less than High School | 0 (0.0%) | 0 (0.0%) |
| High School Diploma | 12 (100.0%) | 2 (16.7%) |
| College / Associate Degree | 9 (81.8%) | 0 (0.0%) |
| Bachelor's Degree or higher | 7 (100.0%) | 0 (0.0%) |
| Total | 28 (93.3%) | 2 (7.1%) |
Employment Occupations by Sex in Rogers
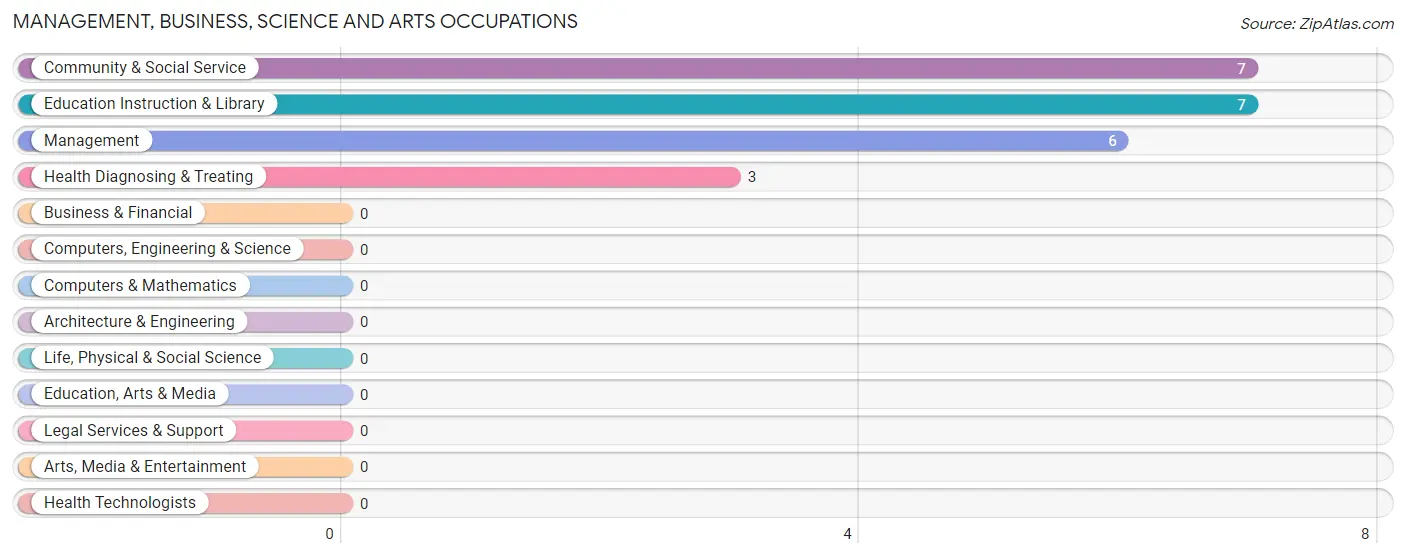
Management, Business, Science and Arts Occupations
The most common Management, Business, Science and Arts occupations in Rogers are Community & Social Service (7 | 21.2%), Education Instruction & Library (7 | 21.2%), Management (6 | 18.2%), and Health Diagnosing & Treating (3 | 9.1%).
Management, Business, Science and Arts Occupations by Sex
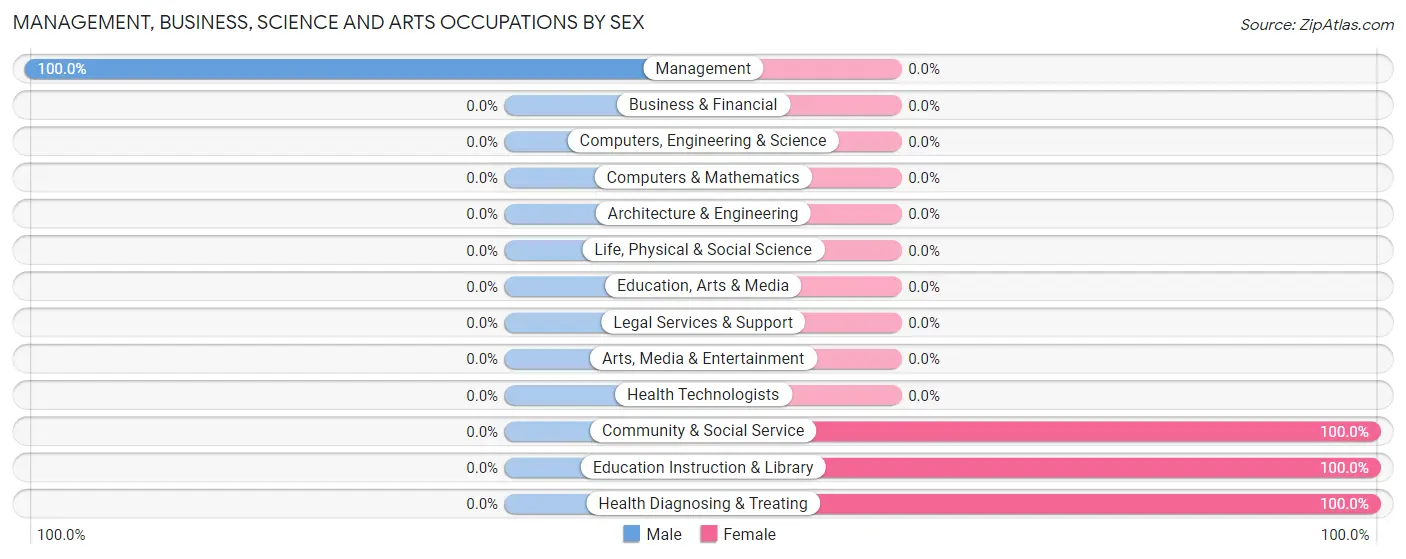
| Occupation | Male | Female |
| Management | 6 (100.0%) | 0 (0.0%) |
| Business & Financial | 0 (0.0%) | 0 (0.0%) |
| Computers, Engineering & Science | 0 (0.0%) | 0 (0.0%) |
| Computers & Mathematics | 0 (0.0%) | 0 (0.0%) |
| Architecture & Engineering | 0 (0.0%) | 0 (0.0%) |
| Life, Physical & Social Science | 0 (0.0%) | 0 (0.0%) |
| Community & Social Service | 0 (0.0%) | 7 (100.0%) |
| Education, Arts & Media | 0 (0.0%) | 0 (0.0%) |
| Legal Services & Support | 0 (0.0%) | 0 (0.0%) |
| Education Instruction & Library | 0 (0.0%) | 7 (100.0%) |
| Arts, Media & Entertainment | 0 (0.0%) | 0 (0.0%) |
| Health Diagnosing & Treating | 0 (0.0%) | 3 (100.0%) |
| Health Technologists | 0 (0.0%) | 0 (0.0%) |
| Total (Category) | 6 (37.5%) | 10 (62.5%) |
| Total (Overall) | 19 (57.6%) | 14 (42.4%) |
Services Occupations
The most common Services occupations in Rogers are , and Personal Care & Service (4 | 12.1%).
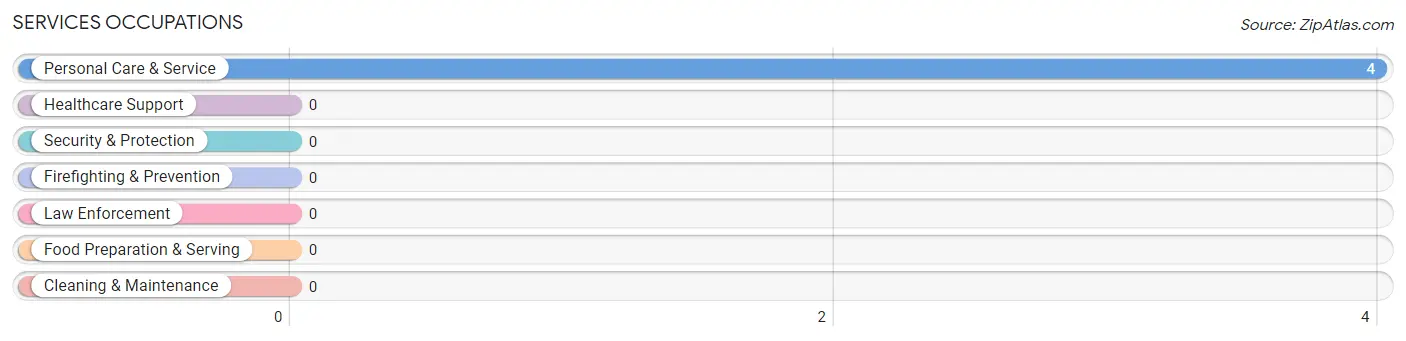
Services Occupations by Sex
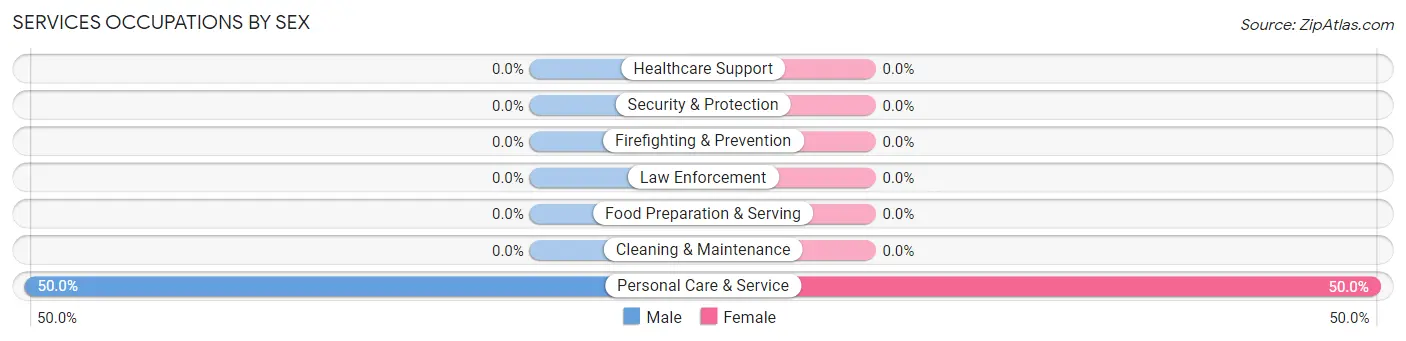
| Occupation | Male | Female |
| Healthcare Support | 0 (0.0%) | 0 (0.0%) |
| Security & Protection | 0 (0.0%) | 0 (0.0%) |
| Firefighting & Prevention | 0 (0.0%) | 0 (0.0%) |
| Law Enforcement | 0 (0.0%) | 0 (0.0%) |
| Food Preparation & Serving | 0 (0.0%) | 0 (0.0%) |
| Cleaning & Maintenance | 0 (0.0%) | 0 (0.0%) |
| Personal Care & Service | 2 (50.0%) | 2 (50.0%) |
| Total (Category) | 2 (50.0%) | 2 (50.0%) |
| Total (Overall) | 19 (57.6%) | 14 (42.4%) |
Sales and Office Occupations
The most common Sales and Office occupations in Rogers are , and Office & Administration (2 | 6.1%).
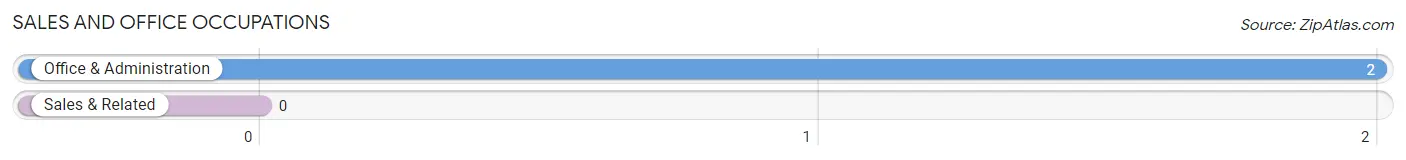
Sales and Office Occupations by Sex
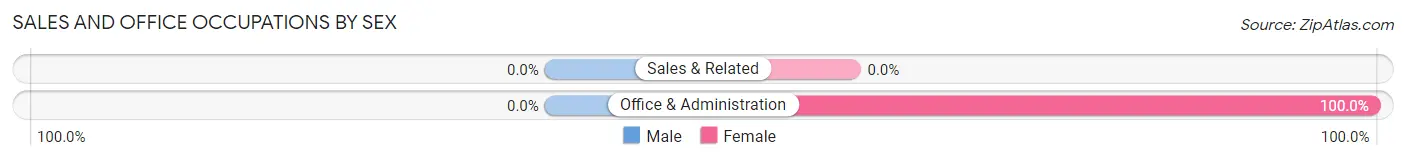
| Occupation | Male | Female |
| Sales & Related | 0 (0.0%) | 0 (0.0%) |
| Office & Administration | 0 (0.0%) | 2 (100.0%) |
| Total (Category) | 0 (0.0%) | 2 (100.0%) |
| Total (Overall) | 19 (57.6%) | 14 (42.4%) |
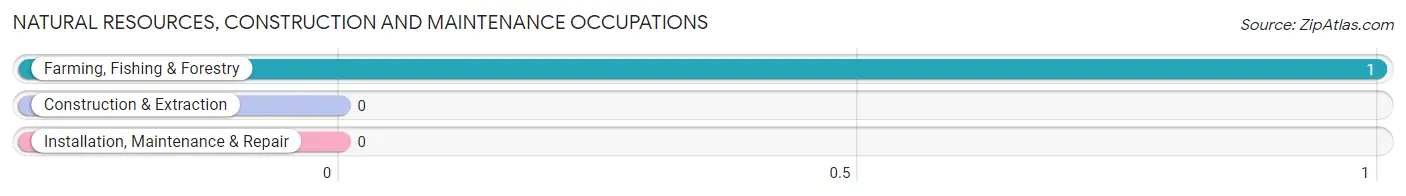
Natural Resources, Construction and Maintenance Occupations
The most common Natural Resources, Construction and Maintenance occupations in Rogers are , and Farming, Fishing & Forestry (1 | 3.0%).
Natural Resources, Construction and Maintenance Occupations by Sex
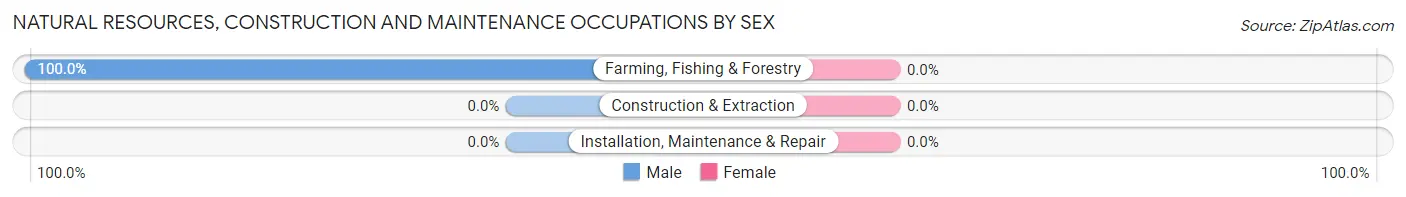
| Occupation | Male | Female |
| Farming, Fishing & Forestry | 1 (100.0%) | 0 (0.0%) |
| Construction & Extraction | 0 (0.0%) | 0 (0.0%) |
| Installation, Maintenance & Repair | 0 (0.0%) | 0 (0.0%) |
| Total (Category) | 1 (100.0%) | 0 (0.0%) |
| Total (Overall) | 19 (57.6%) | 14 (42.4%) |
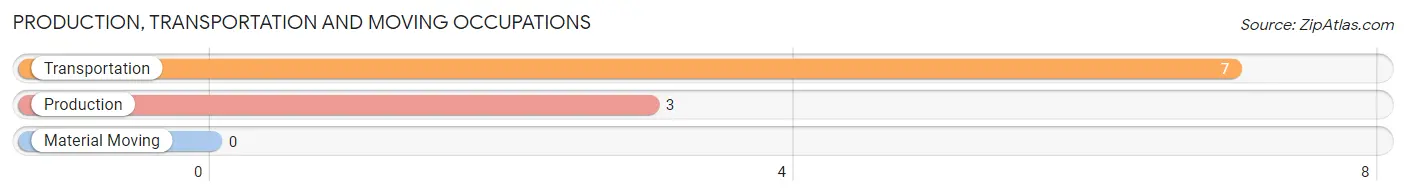
Production, Transportation and Moving Occupations
The most common Production, Transportation and Moving occupations in Rogers are Transportation (7 | 21.2%), and Production (3 | 9.1%).
Production, Transportation and Moving Occupations by Sex
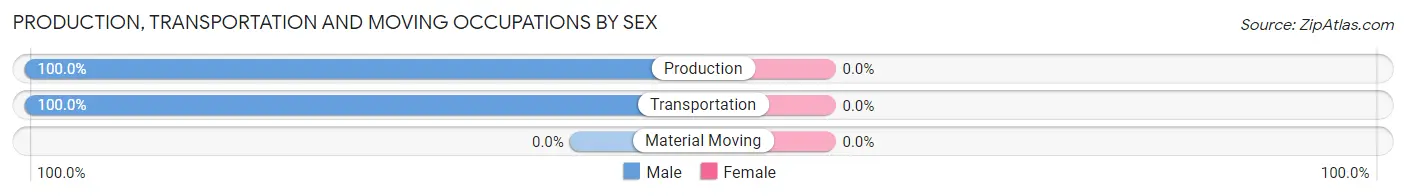
| Occupation | Male | Female |
| Production | 3 (100.0%) | 0 (0.0%) |
| Transportation | 7 (100.0%) | 0 (0.0%) |
| Material Moving | 0 (0.0%) | 0 (0.0%) |
| Total (Category) | 10 (100.0%) | 0 (0.0%) |
| Total (Overall) | 19 (57.6%) | 14 (42.4%) |
Employment Industries by Sex in Rogers
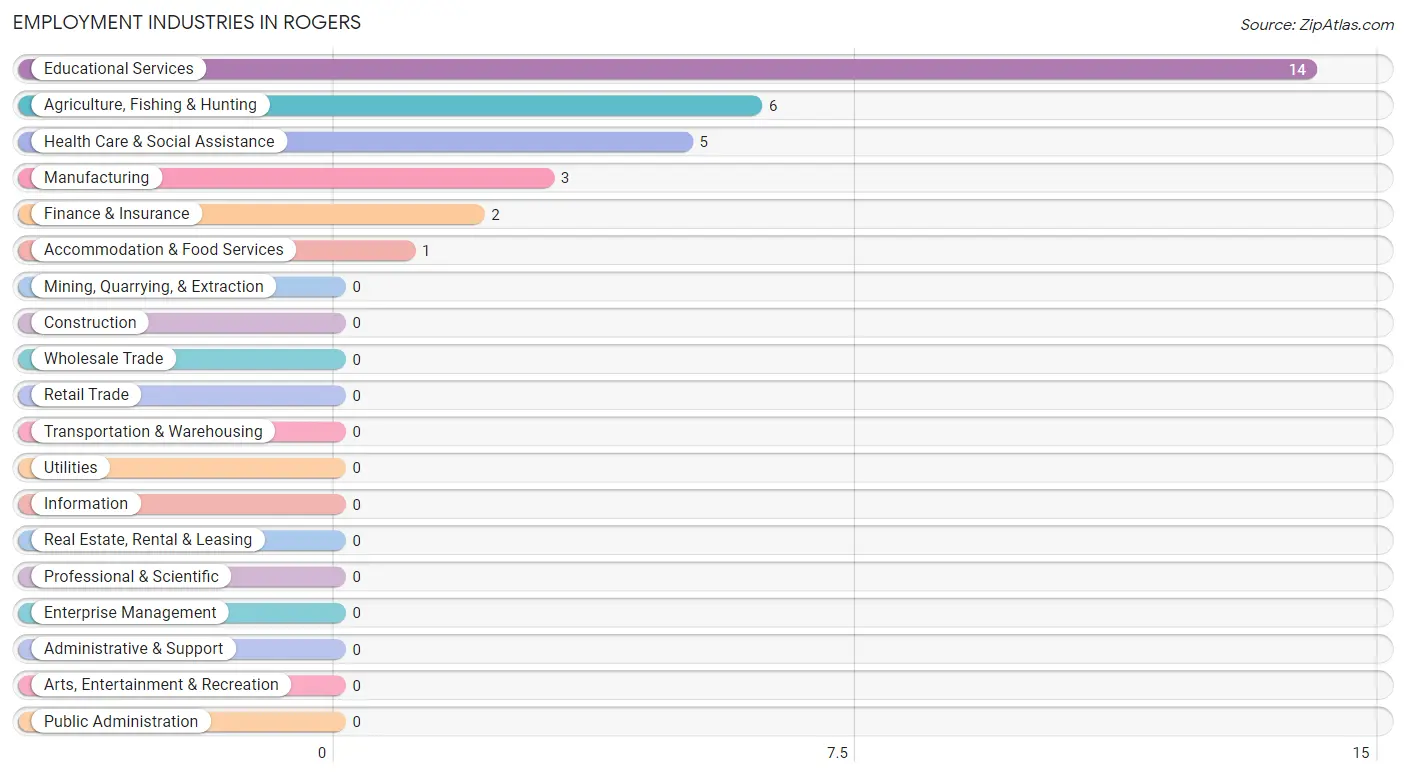
Employment Industries in Rogers
The major employment industries in Rogers include Educational Services (14 | 42.4%), Agriculture, Fishing & Hunting (6 | 18.2%), Health Care & Social Assistance (5 | 15.1%), Manufacturing (3 | 9.1%), and Finance & Insurance (2 | 6.1%).
Employment Industries by Sex in Rogers
The Rogers industries that see more men than women are Agriculture, Fishing & Hunting (100.0%), Manufacturing (100.0%), and Accommodation & Food Services (100.0%), whereas the industries that tend to have a higher number of women are Finance & Insurance (100.0%), Health Care & Social Assistance (100.0%), and Educational Services (50.0%).
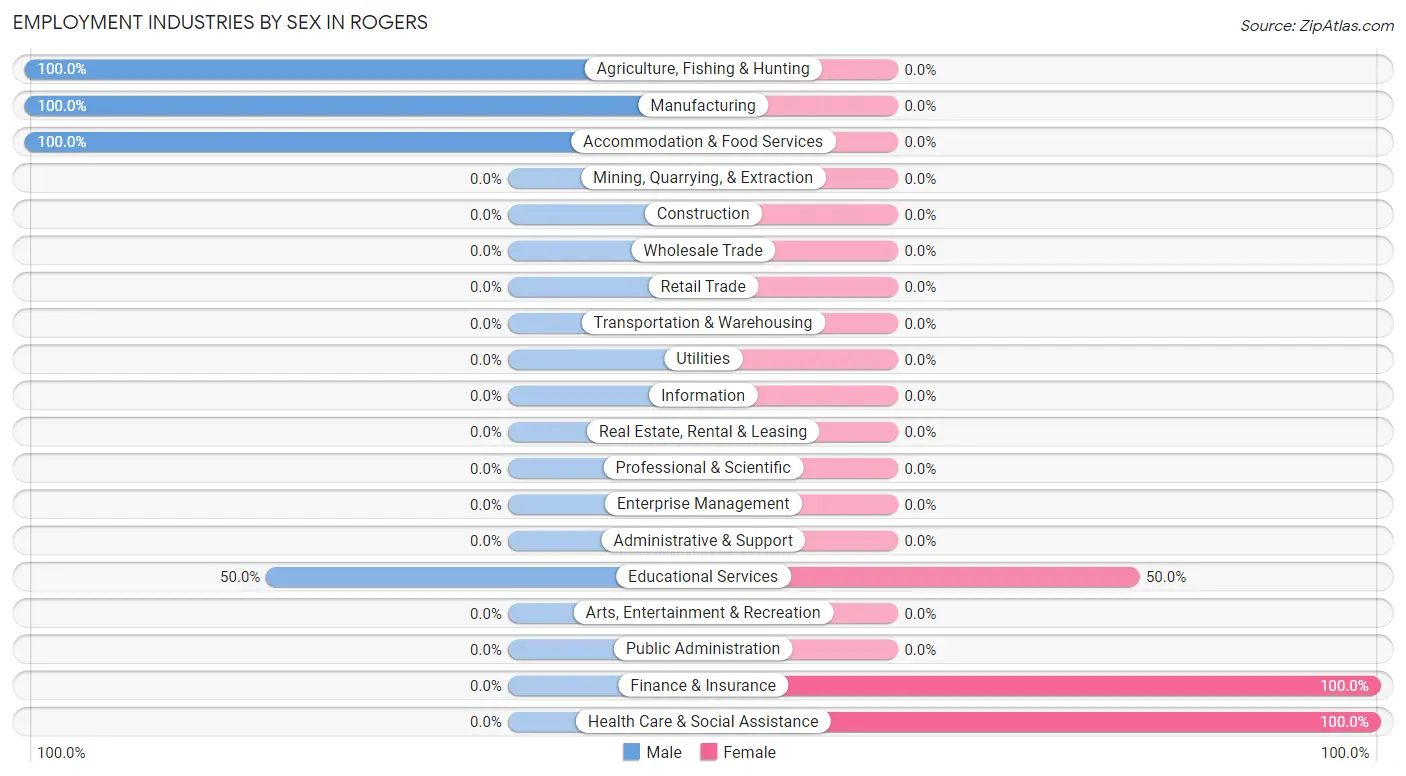
| Industry | Male | Female |
| Agriculture, Fishing & Hunting | 6 (100.0%) | 0 (0.0%) |
| Mining, Quarrying, & Extraction | 0 (0.0%) | 0 (0.0%) |
| Construction | 0 (0.0%) | 0 (0.0%) |
| Manufacturing | 3 (100.0%) | 0 (0.0%) |
| Wholesale Trade | 0 (0.0%) | 0 (0.0%) |
| Retail Trade | 0 (0.0%) | 0 (0.0%) |
| Transportation & Warehousing | 0 (0.0%) | 0 (0.0%) |
| Utilities | 0 (0.0%) | 0 (0.0%) |
| Information | 0 (0.0%) | 0 (0.0%) |
| Finance & Insurance | 0 (0.0%) | 2 (100.0%) |
| Real Estate, Rental & Leasing | 0 (0.0%) | 0 (0.0%) |
| Professional & Scientific | 0 (0.0%) | 0 (0.0%) |
| Enterprise Management | 0 (0.0%) | 0 (0.0%) |
| Administrative & Support | 0 (0.0%) | 0 (0.0%) |
| Educational Services | 7 (50.0%) | 7 (50.0%) |
| Health Care & Social Assistance | 0 (0.0%) | 5 (100.0%) |
| Arts, Entertainment & Recreation | 0 (0.0%) | 0 (0.0%) |
| Accommodation & Food Services | 1 (100.0%) | 0 (0.0%) |
| Public Administration | 0 (0.0%) | 0 (0.0%) |
| Total | 19 (57.6%) | 14 (42.4%) |
Education in Rogers
School Enrollment in Rogers
The most common levels of schooling among the 5 students in Rogers are middle school (3 | 60.0%), and graduate / professional (2 | 40.0%).
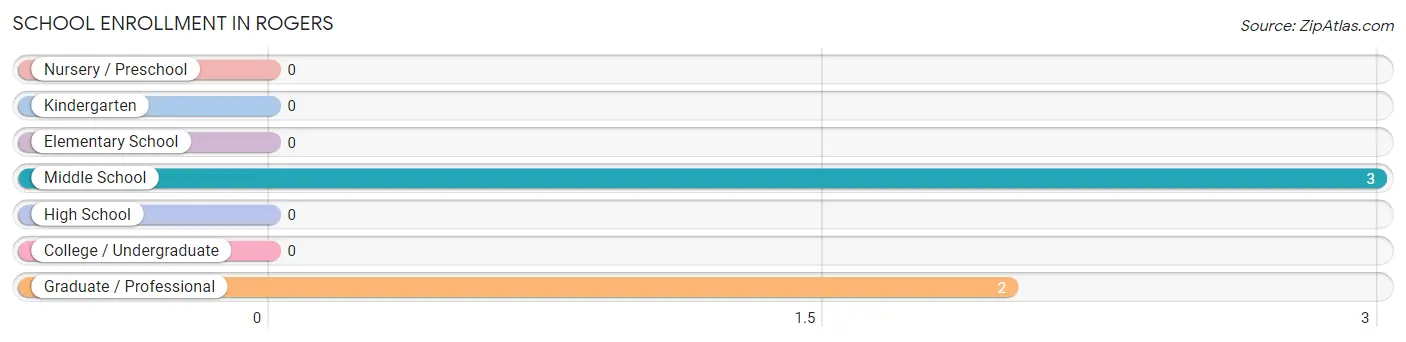
| School Level | # Students | % Students |
| Nursery / Preschool | 0 | 0.0% |
| Kindergarten | 0 | 0.0% |
| Elementary School | 0 | 0.0% |
| Middle School | 3 | 60.0% |
| High School | 0 | 0.0% |
| College / Undergraduate | 0 | 0.0% |
| Graduate / Professional | 2 | 40.0% |
| Total | 5 | 100.0% |
School Enrollment by Age by Funding Source in Rogers
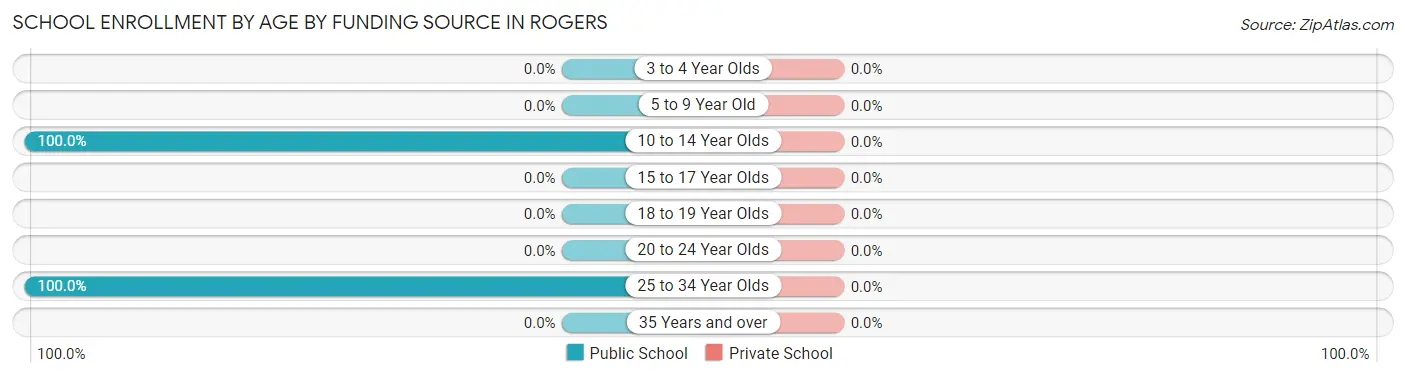
| Age Bracket | Public School | Private School |
| 3 to 4 Year Olds | 0 (0.0%) | 0 (0.0%) |
| 5 to 9 Year Old | 0 (0.0%) | 0 (0.0%) |
| 10 to 14 Year Olds | 3 (100.0%) | 0 (0.0%) |
| 15 to 17 Year Olds | 0 (0.0%) | 0 (0.0%) |
| 18 to 19 Year Olds | 0 (0.0%) | 0 (0.0%) |
| 20 to 24 Year Olds | 0 (0.0%) | 0 (0.0%) |
| 25 to 34 Year Olds | 2 (100.0%) | 0 (0.0%) |
| 35 Years and over | 0 (0.0%) | 0 (0.0%) |
| Total | 5 (100.0%) | 0 (0.0%) |
Educational Attainment by Field of Study in Rogers
Education (5 | 71.4%), and bio, nature & agricultural (2 | 28.6%) are the most common fields of study among 7 individuals in Rogers who have obtained a bachelor's degree or higher.
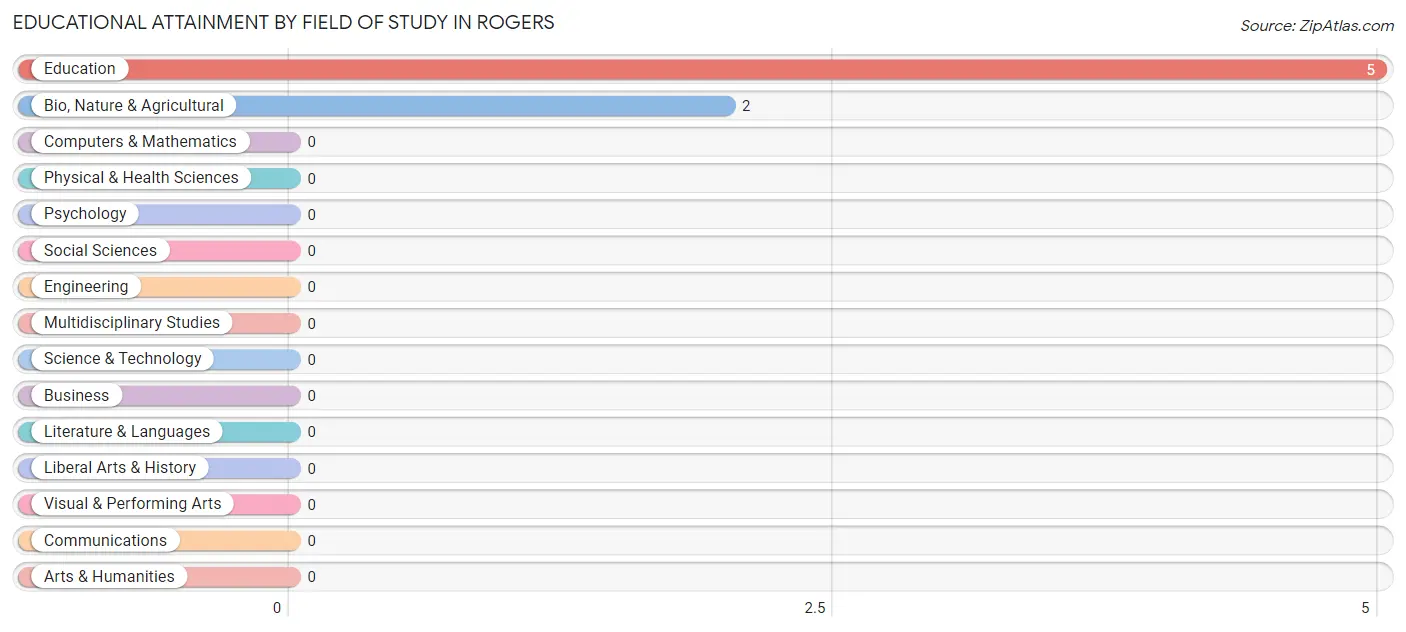
| Field of Study | # Graduates | % Graduates |
| Computers & Mathematics | 0 | 0.0% |
| Bio, Nature & Agricultural | 2 | 28.6% |
| Physical & Health Sciences | 0 | 0.0% |
| Psychology | 0 | 0.0% |
| Social Sciences | 0 | 0.0% |
| Engineering | 0 | 0.0% |
| Multidisciplinary Studies | 0 | 0.0% |
| Science & Technology | 0 | 0.0% |
| Business | 0 | 0.0% |
| Education | 5 | 71.4% |
| Literature & Languages | 0 | 0.0% |
| Liberal Arts & History | 0 | 0.0% |
| Visual & Performing Arts | 0 | 0.0% |
| Communications | 0 | 0.0% |
| Arts & Humanities | 0 | 0.0% |
| Total | 7 | 100.0% |
Transportation & Commute in Rogers
Vehicle Availability by Sex in Rogers
The most prevalent vehicle ownership categories in Rogers are males with 3 vehicles (10, accounting for 52.6%) and females with 3 vehicles (11, making up 71.4%).
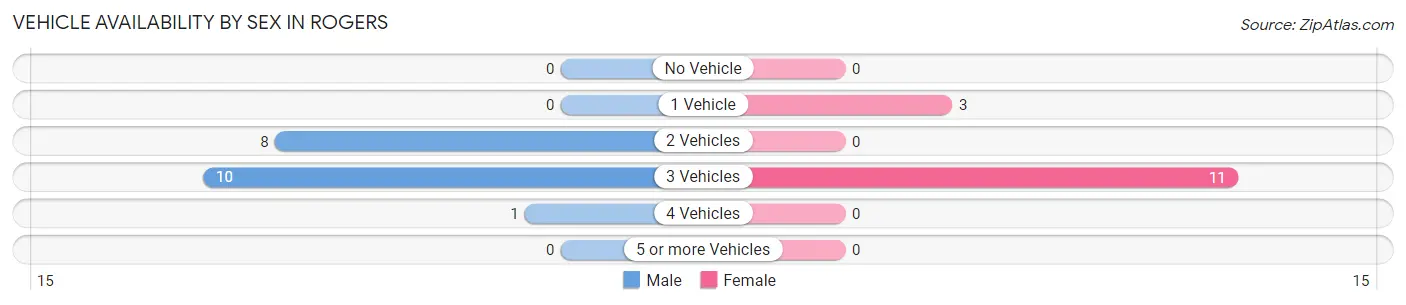
| Vehicles Available | Male | Female |
| No Vehicle | 0 (0.0%) | 0 (0.0%) |
| 1 Vehicle | 0 (0.0%) | 3 (21.4%) |
| 2 Vehicles | 8 (42.1%) | 0 (0.0%) |
| 3 Vehicles | 10 (52.6%) | 11 (78.6%) |
| 4 Vehicles | 1 (5.3%) | 0 (0.0%) |
| 5 or more Vehicles | 0 (0.0%) | 0 (0.0%) |
| Total | 19 (100.0%) | 14 (100.0%) |
Commute Time in Rogers
The most frequently occuring commute durations in Rogers are 10 to 14 minutes (9 commuters, 27.3%), 15 to 19 minutes (7 commuters, 21.2%), and 20 to 24 minutes (6 commuters, 18.2%).
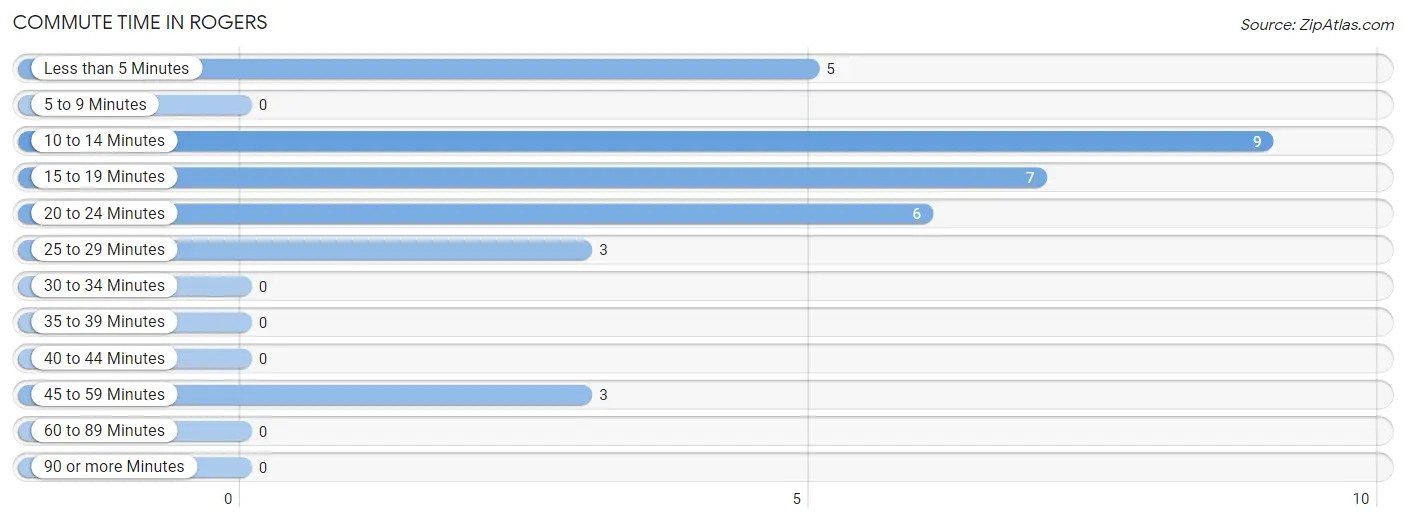
| Commute Time | # Commuters | % Commuters |
| Less than 5 Minutes | 5 | 15.1% |
| 5 to 9 Minutes | 0 | 0.0% |
| 10 to 14 Minutes | 9 | 27.3% |
| 15 to 19 Minutes | 7 | 21.2% |
| 20 to 24 Minutes | 6 | 18.2% |
| 25 to 29 Minutes | 3 | 9.1% |
| 30 to 34 Minutes | 0 | 0.0% |
| 35 to 39 Minutes | 0 | 0.0% |
| 40 to 44 Minutes | 0 | 0.0% |
| 45 to 59 Minutes | 3 | 9.1% |
| 60 to 89 Minutes | 0 | 0.0% |
| 90 or more Minutes | 0 | 0.0% |
Commute Time by Sex in Rogers
The most common commute times in Rogers are 15 to 19 minutes (7 commuters, 36.8%) for males and 10 to 14 minutes (5 commuters, 35.7%) for females.
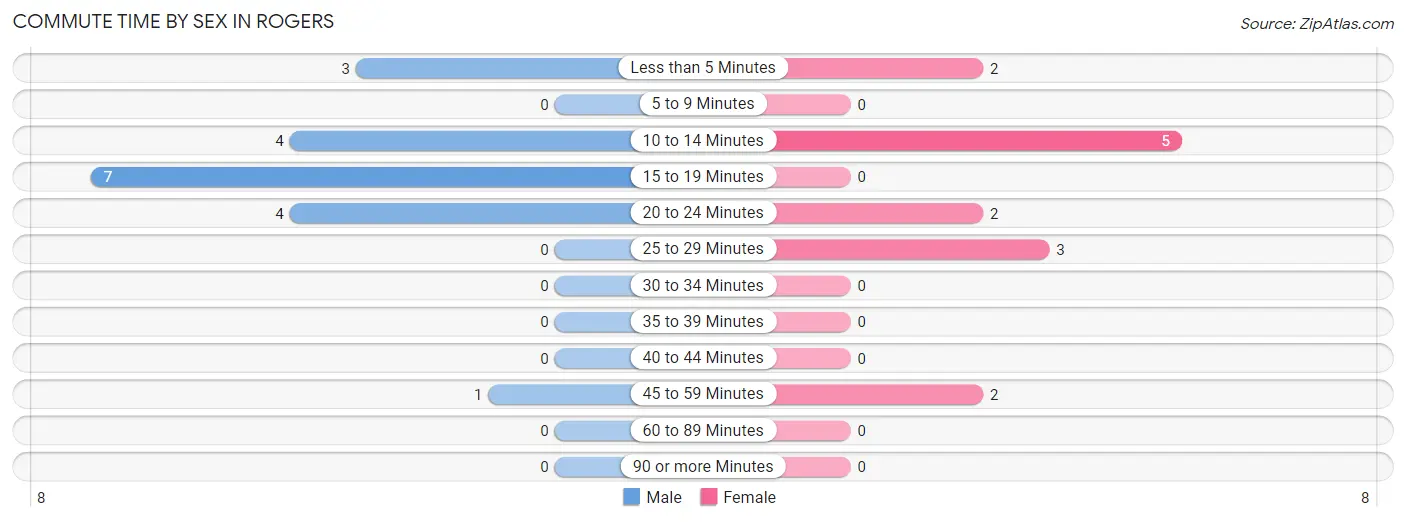
| Commute Time | Male | Female |
| Less than 5 Minutes | 3 (15.8%) | 2 (14.3%) |
| 5 to 9 Minutes | 0 (0.0%) | 0 (0.0%) |
| 10 to 14 Minutes | 4 (21.0%) | 5 (35.7%) |
| 15 to 19 Minutes | 7 (36.8%) | 0 (0.0%) |
| 20 to 24 Minutes | 4 (21.0%) | 2 (14.3%) |
| 25 to 29 Minutes | 0 (0.0%) | 3 (21.4%) |
| 30 to 34 Minutes | 0 (0.0%) | 0 (0.0%) |
| 35 to 39 Minutes | 0 (0.0%) | 0 (0.0%) |
| 40 to 44 Minutes | 0 (0.0%) | 0 (0.0%) |
| 45 to 59 Minutes | 1 (5.3%) | 2 (14.3%) |
| 60 to 89 Minutes | 0 (0.0%) | 0 (0.0%) |
| 90 or more Minutes | 0 (0.0%) | 0 (0.0%) |
Time of Departure to Work by Sex in Rogers
The most frequent times of departure to work in Rogers are 7:00 AM to 7:29 AM (13, 68.4%) for males and 7:00 AM to 7:29 AM (9, 64.3%) for females.
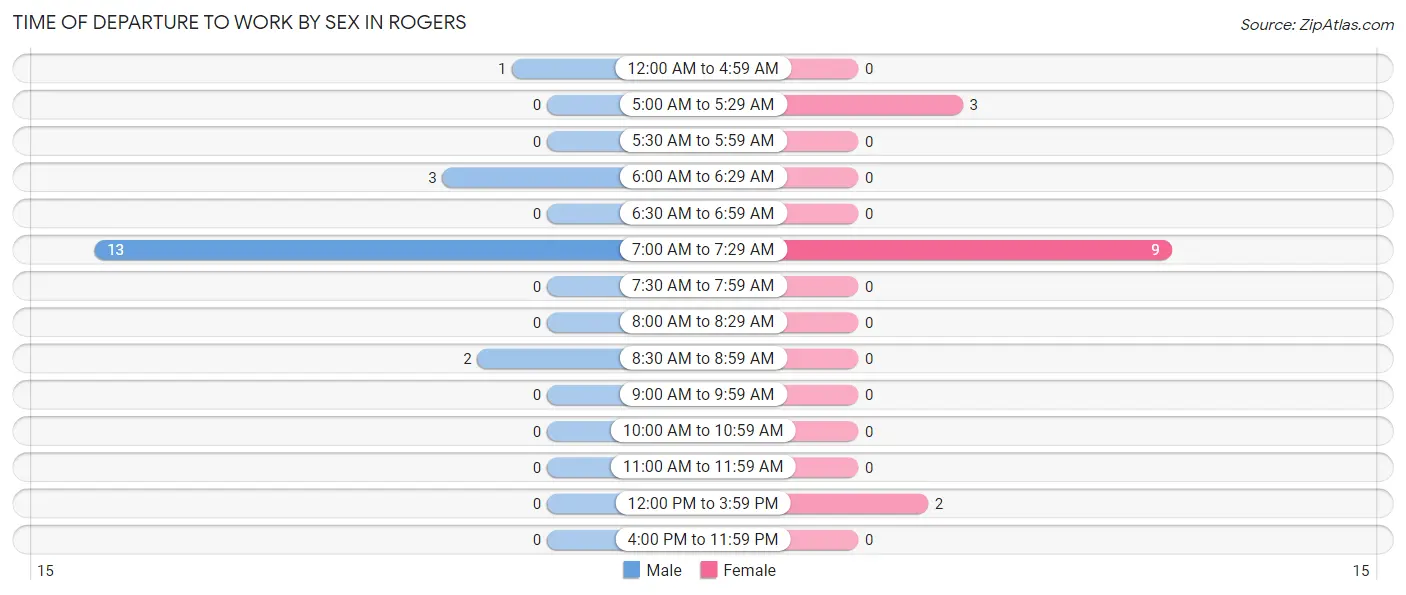
| Time of Departure | Male | Female |
| 12:00 AM to 4:59 AM | 1 (5.3%) | 0 (0.0%) |
| 5:00 AM to 5:29 AM | 0 (0.0%) | 3 (21.4%) |
| 5:30 AM to 5:59 AM | 0 (0.0%) | 0 (0.0%) |
| 6:00 AM to 6:29 AM | 3 (15.8%) | 0 (0.0%) |
| 6:30 AM to 6:59 AM | 0 (0.0%) | 0 (0.0%) |
| 7:00 AM to 7:29 AM | 13 (68.4%) | 9 (64.3%) |
| 7:30 AM to 7:59 AM | 0 (0.0%) | 0 (0.0%) |
| 8:00 AM to 8:29 AM | 0 (0.0%) | 0 (0.0%) |
| 8:30 AM to 8:59 AM | 2 (10.5%) | 0 (0.0%) |
| 9:00 AM to 9:59 AM | 0 (0.0%) | 0 (0.0%) |
| 10:00 AM to 10:59 AM | 0 (0.0%) | 0 (0.0%) |
| 11:00 AM to 11:59 AM | 0 (0.0%) | 0 (0.0%) |
| 12:00 PM to 3:59 PM | 0 (0.0%) | 2 (14.3%) |
| 4:00 PM to 11:59 PM | 0 (0.0%) | 0 (0.0%) |
| Total | 19 (100.0%) | 14 (100.0%) |
Housing Occupancy in Rogers
Occupancy by Ownership in Rogers
Of the total 25 dwellings in Rogers, owner-occupied units account for 25 (100.0%), while renter-occupied units make up 0 (0.0%).
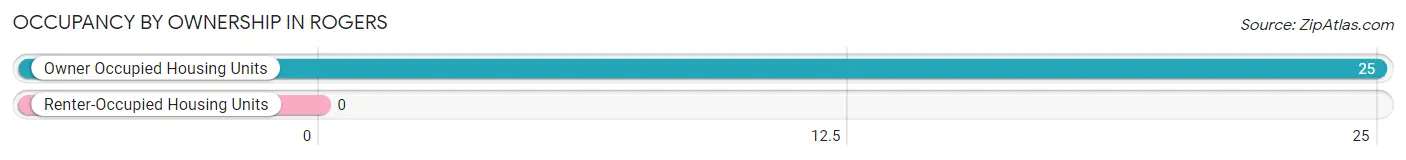
| Occupancy | # Housing Units | % Housing Units |
| Owner Occupied Housing Units | 25 | 100.0% |
| Renter-Occupied Housing Units | 0 | 0.0% |
| Total Occupied Housing Units | 25 | 100.0% |
Occupancy by Household Size in Rogers
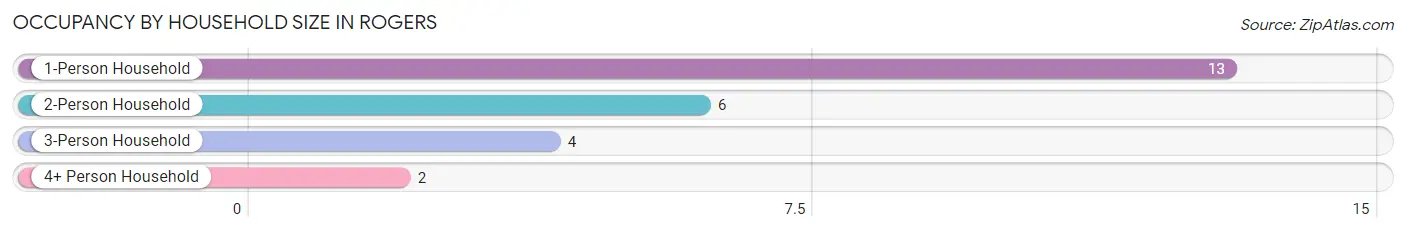
| Household Size | # Housing Units | % Housing Units |
| 1-Person Household | 13 | 52.0% |
| 2-Person Household | 6 | 24.0% |
| 3-Person Household | 4 | 16.0% |
| 4+ Person Household | 2 | 8.0% |
| Total Housing Units | 25 | 100.0% |
Occupancy by Ownership by Household Size in Rogers
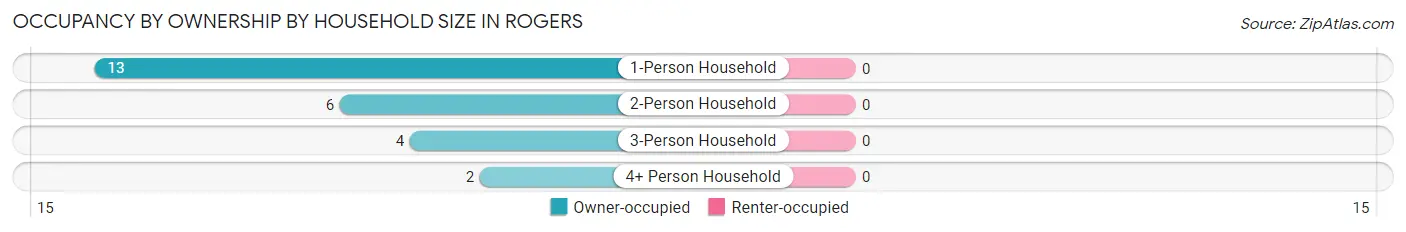
| Household Size | Owner-occupied | Renter-occupied |
| 1-Person Household | 13 (100.0%) | 0 (0.0%) |
| 2-Person Household | 6 (100.0%) | 0 (0.0%) |
| 3-Person Household | 4 (100.0%) | 0 (0.0%) |
| 4+ Person Household | 2 (100.0%) | 0 (0.0%) |
| Total Housing Units | 25 (100.0%) | 0 (0.0%) |
Occupancy by Educational Attainment in Rogers
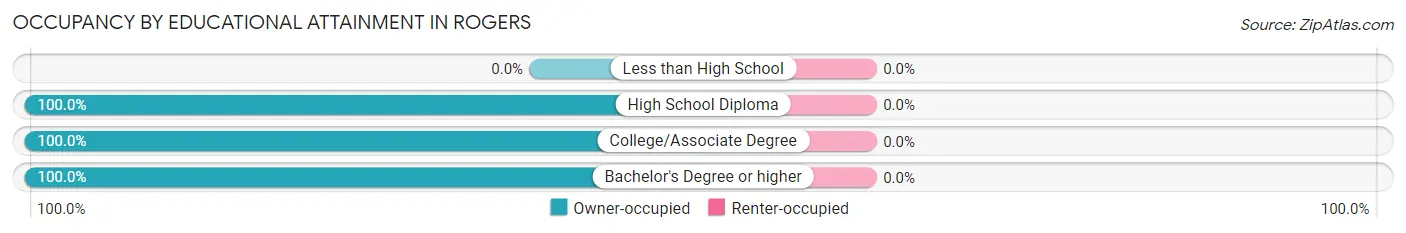
| Household Size | Owner-occupied | Renter-occupied |
| Less than High School | 0 (0.0%) | 0 (0.0%) |
| High School Diploma | 6 (100.0%) | 0 (0.0%) |
| College/Associate Degree | 12 (100.0%) | 0 (0.0%) |
| Bachelor's Degree or higher | 7 (100.0%) | 0 (0.0%) |
Occupancy by Age of Householder in Rogers
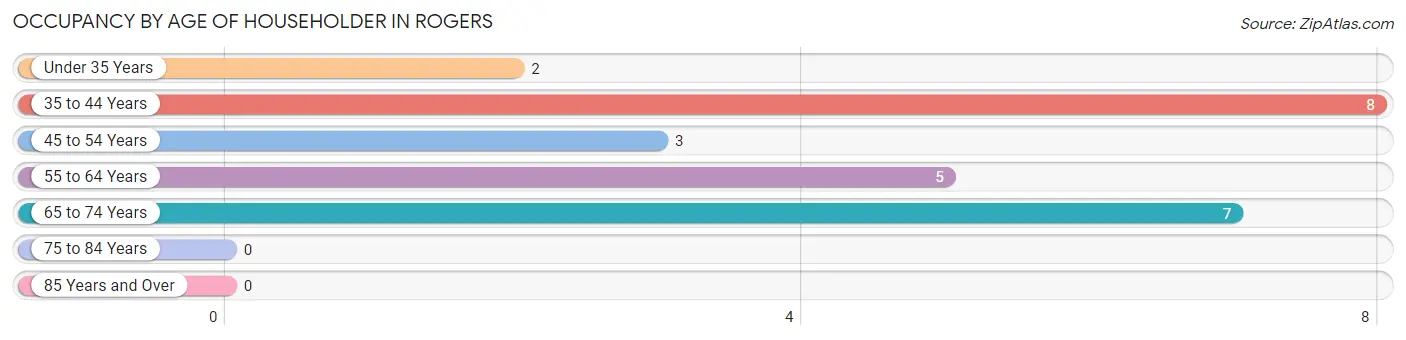
| Age Bracket | # Households | % Households |
| Under 35 Years | 2 | 8.0% |
| 35 to 44 Years | 8 | 32.0% |
| 45 to 54 Years | 3 | 12.0% |
| 55 to 64 Years | 5 | 20.0% |
| 65 to 74 Years | 7 | 28.0% |
| 75 to 84 Years | 0 | 0.0% |
| 85 Years and Over | 0 | 0.0% |
| Total | 25 | 100.0% |
Housing Finances in Rogers
Median Income by Occupancy in Rogers
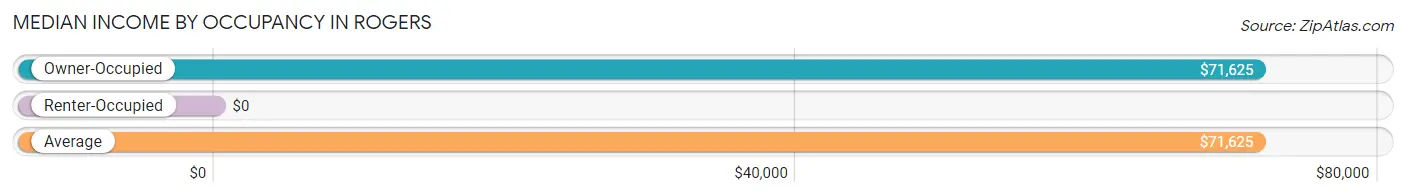
| Occupancy Type | # Households | Median Income |
| Owner-Occupied | 25 (100.0%) | $71,625 |
| Renter-Occupied | 0 (0.0%) | $0 |
| Average | 25 (100.0%) | $71,625 |
Occupancy by Householder Income Bracket in Rogers
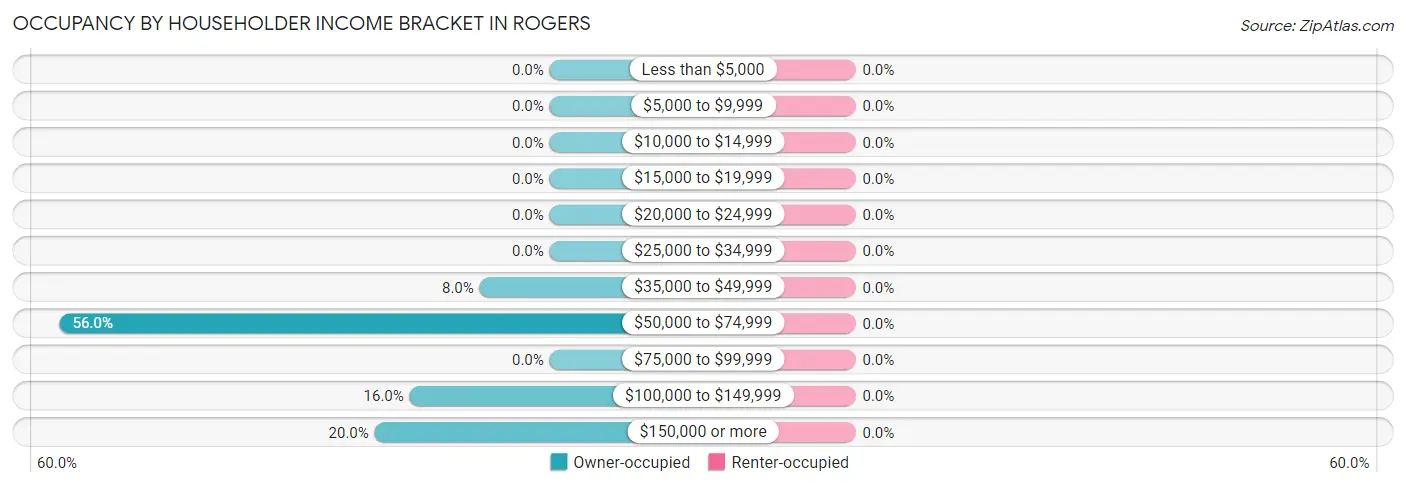
| Income Bracket | Owner-occupied | Renter-occupied |
| Less than $5,000 | 0 (0.0%) | 0 (0.0%) |
| $5,000 to $9,999 | 0 (0.0%) | 0 (0.0%) |
| $10,000 to $14,999 | 0 (0.0%) | 0 (0.0%) |
| $15,000 to $19,999 | 0 (0.0%) | 0 (0.0%) |
| $20,000 to $24,999 | 0 (0.0%) | 0 (0.0%) |
| $25,000 to $34,999 | 0 (0.0%) | 0 (0.0%) |
| $35,000 to $49,999 | 2 (8.0%) | 0 (0.0%) |
| $50,000 to $74,999 | 14 (56.0%) | 0 (0.0%) |
| $75,000 to $99,999 | 0 (0.0%) | 0 (0.0%) |
| $100,000 to $149,999 | 4 (16.0%) | 0 (0.0%) |
| $150,000 or more | 5 (20.0%) | 0 (0.0%) |
| Total | 25 (100.0%) | 0 (0.0%) |
Monthly Housing Cost Tiers in Rogers
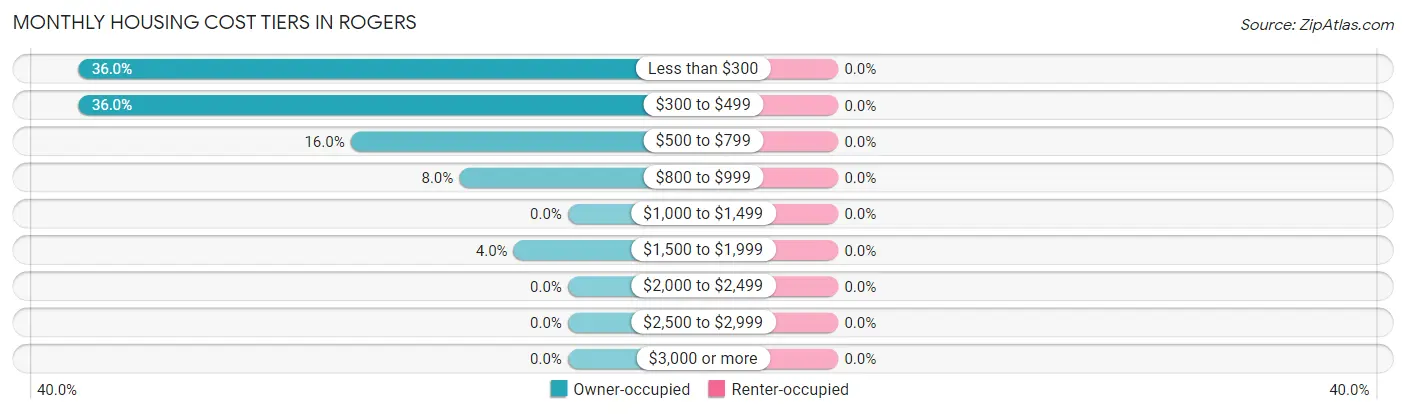
| Monthly Cost | Owner-occupied | Renter-occupied |
| Less than $300 | 9 (36.0%) | 0 (0.0%) |
| $300 to $499 | 9 (36.0%) | 0 (0.0%) |
| $500 to $799 | 4 (16.0%) | 0 (0.0%) |
| $800 to $999 | 2 (8.0%) | 0 (0.0%) |
| $1,000 to $1,499 | 0 (0.0%) | 0 (0.0%) |
| $1,500 to $1,999 | 1 (4.0%) | 0 (0.0%) |
| $2,000 to $2,499 | 0 (0.0%) | 0 (0.0%) |
| $2,500 to $2,999 | 0 (0.0%) | 0 (0.0%) |
| $3,000 or more | 0 (0.0%) | 0 (0.0%) |
| Total | 25 (100.0%) | 0 (0.0%) |
Physical Housing Characteristics in Rogers
Housing Structures in Rogers
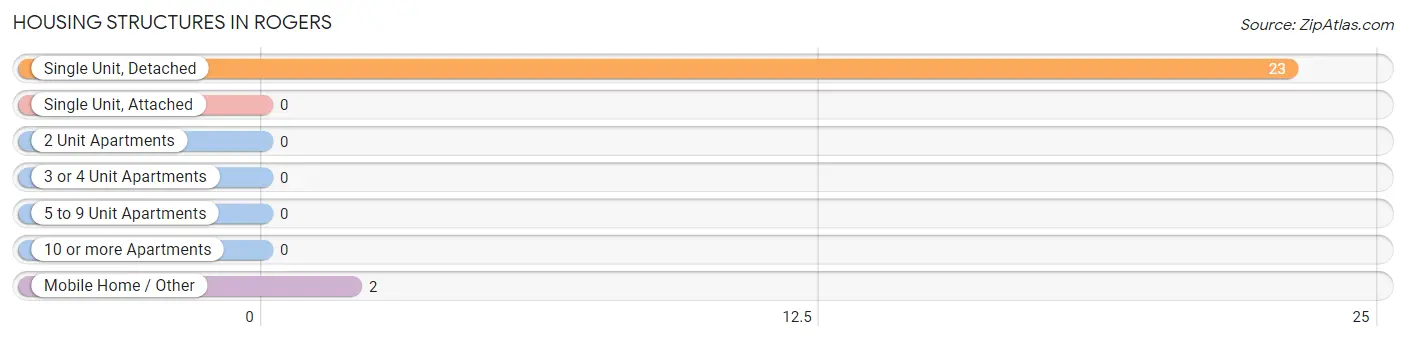
| Structure Type | # Housing Units | % Housing Units |
| Single Unit, Detached | 23 | 92.0% |
| Single Unit, Attached | 0 | 0.0% |
| 2 Unit Apartments | 0 | 0.0% |
| 3 or 4 Unit Apartments | 0 | 0.0% |
| 5 to 9 Unit Apartments | 0 | 0.0% |
| 10 or more Apartments | 0 | 0.0% |
| Mobile Home / Other | 2 | 8.0% |
| Total | 25 | 100.0% |
Housing Structures by Occupancy in Rogers
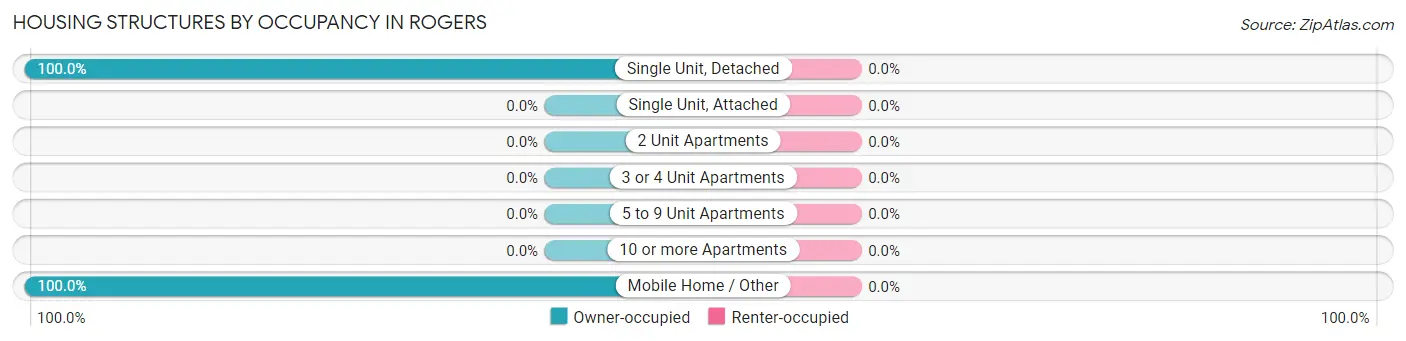
| Structure Type | Owner-occupied | Renter-occupied |
| Single Unit, Detached | 23 (100.0%) | 0 (0.0%) |
| Single Unit, Attached | 0 (0.0%) | 0 (0.0%) |
| 2 Unit Apartments | 0 (0.0%) | 0 (0.0%) |
| 3 or 4 Unit Apartments | 0 (0.0%) | 0 (0.0%) |
| 5 to 9 Unit Apartments | 0 (0.0%) | 0 (0.0%) |
| 10 or more Apartments | 0 (0.0%) | 0 (0.0%) |
| Mobile Home / Other | 2 (100.0%) | 0 (0.0%) |
| Total | 25 (100.0%) | 0 (0.0%) |
Housing Structures by Number of Rooms in Rogers
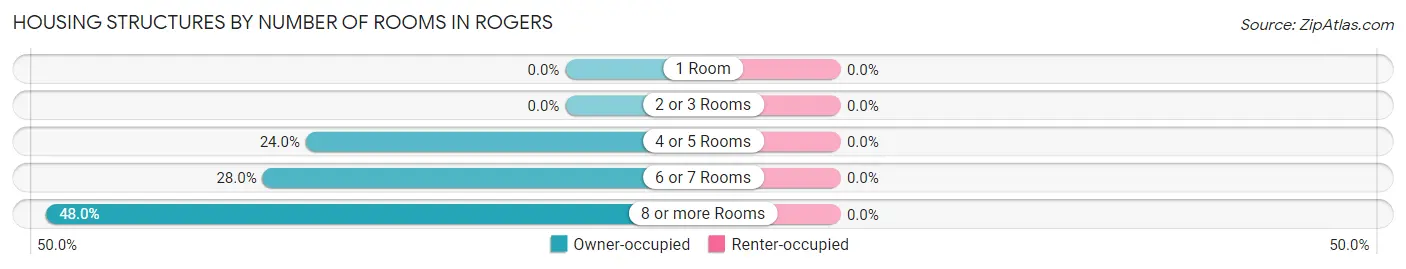
| Number of Rooms | Owner-occupied | Renter-occupied |
| 1 Room | 0 (0.0%) | 0 (0.0%) |
| 2 or 3 Rooms | 0 (0.0%) | 0 (0.0%) |
| 4 or 5 Rooms | 6 (24.0%) | 0 (0.0%) |
| 6 or 7 Rooms | 7 (28.0%) | 0 (0.0%) |
| 8 or more Rooms | 12 (48.0%) | 0 (0.0%) |
| Total | 25 (100.0%) | 0 (0.0%) |
Housing Structure by Heating Type in Rogers
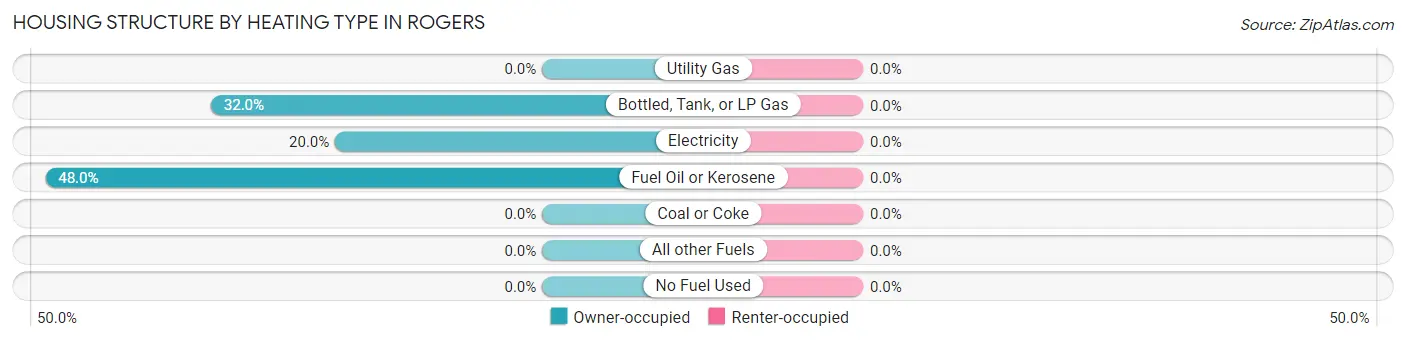
| Heating Type | Owner-occupied | Renter-occupied |
| Utility Gas | 0 (0.0%) | 0 (0.0%) |
| Bottled, Tank, or LP Gas | 8 (32.0%) | 0 (0.0%) |
| Electricity | 5 (20.0%) | 0 (0.0%) |
| Fuel Oil or Kerosene | 12 (48.0%) | 0 (0.0%) |
| Coal or Coke | 0 (0.0%) | 0 (0.0%) |
| All other Fuels | 0 (0.0%) | 0 (0.0%) |
| No Fuel Used | 0 (0.0%) | 0 (0.0%) |
| Total | 25 (100.0%) | 0 (0.0%) |
Household Vehicle Usage in Rogers
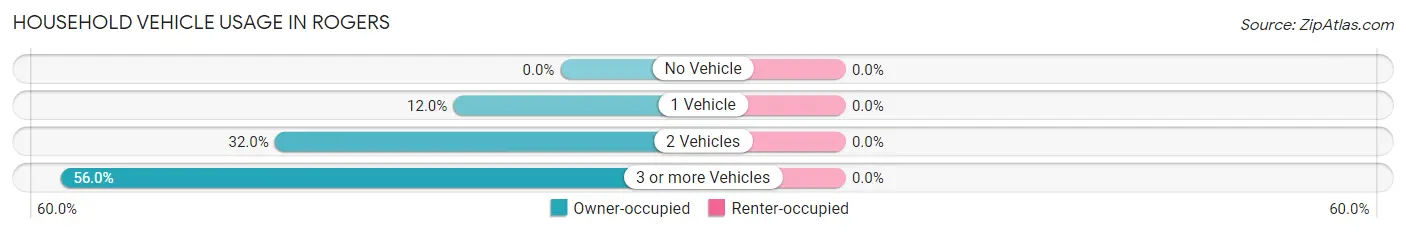
| Vehicles per Household | Owner-occupied | Renter-occupied |
| No Vehicle | 0 (0.0%) | 0 (0.0%) |
| 1 Vehicle | 3 (12.0%) | 0 (0.0%) |
| 2 Vehicles | 8 (32.0%) | 0 (0.0%) |
| 3 or more Vehicles | 14 (56.0%) | 0 (0.0%) |
| Total | 25 (100.0%) | 0 (0.0%) |
Real Estate & Mortgages in Rogers
Real Estate and Mortgage Overview in Rogers
| Characteristic | Without Mortgage | With Mortgage |
| Housing Units | 21 | 4 |
| Median Property Value | $38,100 | $112,500 |
| Median Household Income | $71,528 | $0 |
| Monthly Housing Costs | $375 | $0 |
| Real Estate Taxes | $361 | $0 |
Property Value by Mortgage Status in Rogers
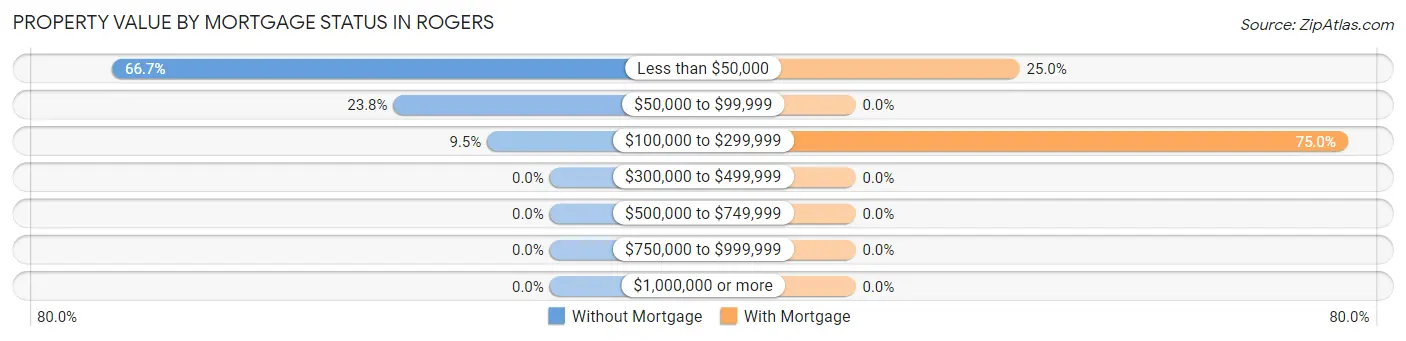
| Property Value | Without Mortgage | With Mortgage |
| Less than $50,000 | 14 (66.7%) | 1 (25.0%) |
| $50,000 to $99,999 | 5 (23.8%) | 0 (0.0%) |
| $100,000 to $299,999 | 2 (9.5%) | 3 (75.0%) |
| $300,000 to $499,999 | 0 (0.0%) | 0 (0.0%) |
| $500,000 to $749,999 | 0 (0.0%) | 0 (0.0%) |
| $750,000 to $999,999 | 0 (0.0%) | 0 (0.0%) |
| $1,000,000 or more | 0 (0.0%) | 0 (0.0%) |
| Total | 21 (100.0%) | 4 (100.0%) |
Household Income by Mortgage Status in Rogers
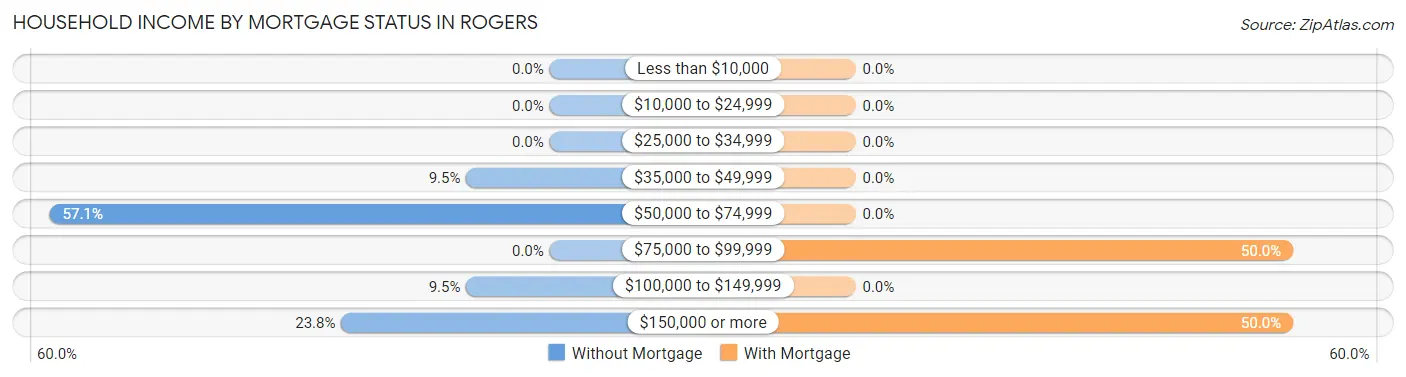
| Household Income | Without Mortgage | With Mortgage |
| Less than $10,000 | 0 (0.0%) | 0 (0.0%) |
| $10,000 to $24,999 | 0 (0.0%) | 0 (0.0%) |
| $25,000 to $34,999 | 0 (0.0%) | 0 (0.0%) |
| $35,000 to $49,999 | 2 (9.5%) | 0 (0.0%) |
| $50,000 to $74,999 | 12 (57.1%) | 0 (0.0%) |
| $75,000 to $99,999 | 0 (0.0%) | 2 (50.0%) |
| $100,000 to $149,999 | 2 (9.5%) | 0 (0.0%) |
| $150,000 or more | 5 (23.8%) | 2 (50.0%) |
| Total | 21 (100.0%) | 4 (100.0%) |
Property Value to Household Income Ratio in Rogers
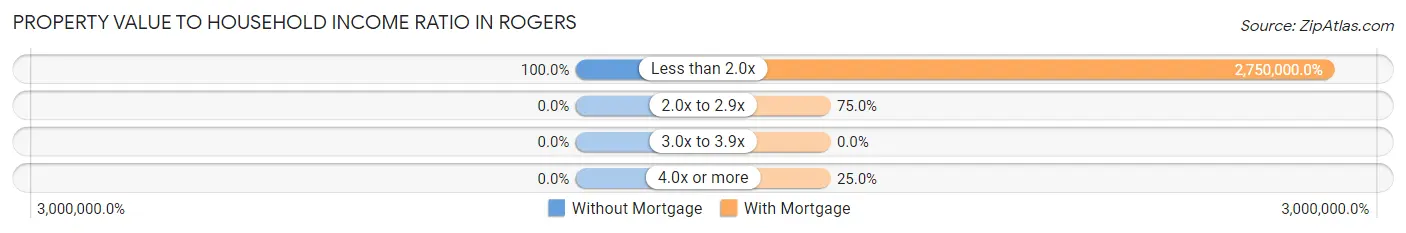
| Value-to-Income Ratio | Without Mortgage | With Mortgage |
| Less than 2.0x | 21 (100.0%) | 110,000 (2,750,000.0%) |
| 2.0x to 2.9x | 0 (0.0%) | 3 (75.0%) |
| 3.0x to 3.9x | 0 (0.0%) | 0 (0.0%) |
| 4.0x or more | 0 (0.0%) | 1 (25.0%) |
| Total | 21 (100.0%) | 4 (100.0%) |
Real Estate Taxes by Mortgage Status in Rogers
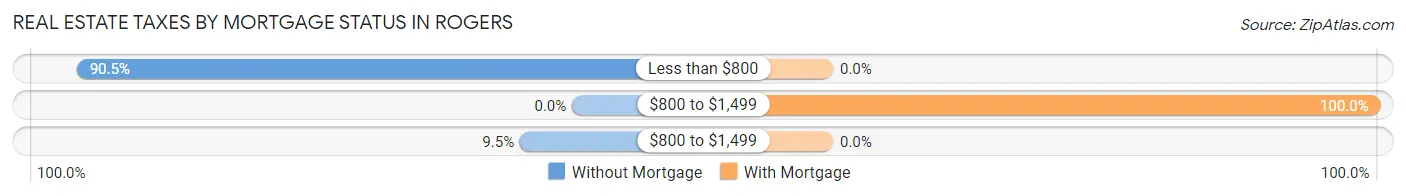
| Property Taxes | Without Mortgage | With Mortgage |
| Less than $800 | 19 (90.5%) | 0 (0.0%) |
| $800 to $1,499 | 0 (0.0%) | 4 (100.0%) |
| $800 to $1,499 | 2 (9.5%) | 0 (0.0%) |
| Total | 21 (100.0%) | 4 (100.0%) |
Health & Disability in Rogers
Health Insurance Coverage by Age in Rogers
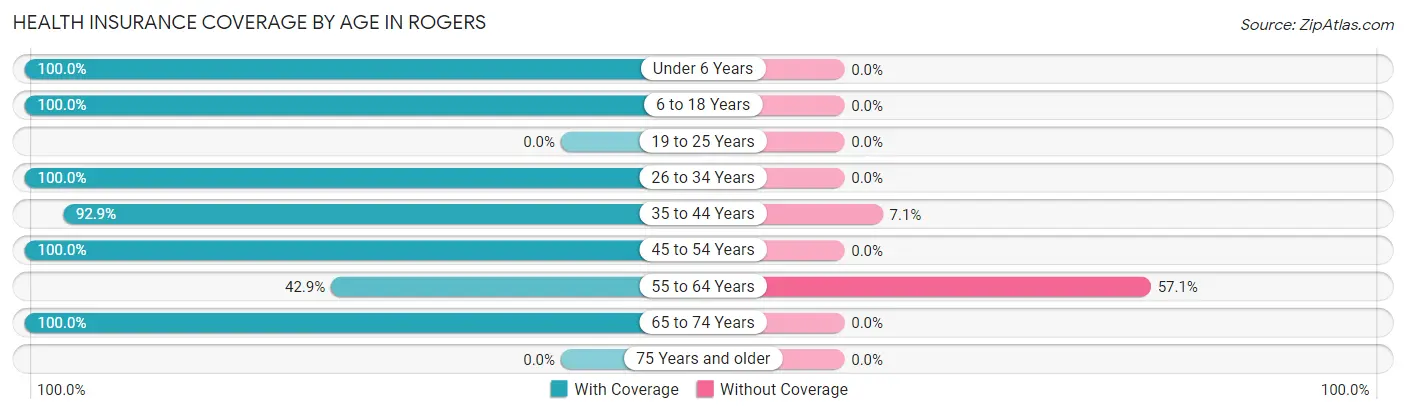
| Age Bracket | With Coverage | Without Coverage |
| Under 6 Years | 1 (100.0%) | 0 (0.0%) |
| 6 to 18 Years | 3 (100.0%) | 0 (0.0%) |
| 19 to 25 Years | 0 (0.0%) | 0 (0.0%) |
| 26 to 34 Years | 4 (100.0%) | 0 (0.0%) |
| 35 to 44 Years | 13 (92.9%) | 1 (7.1%) |
| 45 to 54 Years | 5 (100.0%) | 0 (0.0%) |
| 55 to 64 Years | 3 (42.9%) | 4 (57.1%) |
| 65 to 74 Years | 7 (100.0%) | 0 (0.0%) |
| 75 Years and older | 0 (0.0%) | 0 (0.0%) |
| Total | 36 (87.8%) | 5 (12.2%) |
Health Insurance Coverage by Citizenship Status in Rogers
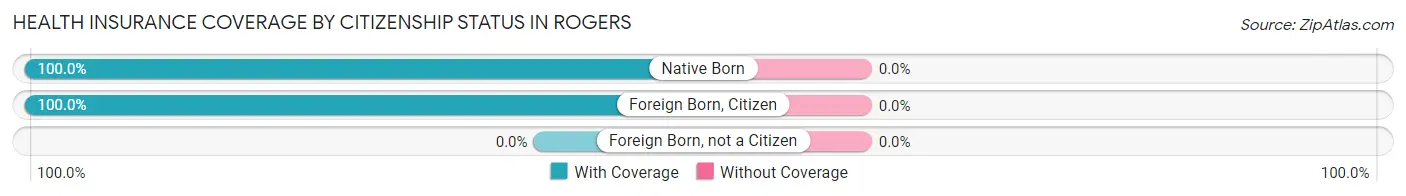
| Citizenship Status | With Coverage | Without Coverage |
| Native Born | 1 (100.0%) | 0 (0.0%) |
| Foreign Born, Citizen | 3 (100.0%) | 0 (0.0%) |
| Foreign Born, not a Citizen | 0 (0.0%) | 0 (0.0%) |
Health Insurance Coverage by Household Income in Rogers
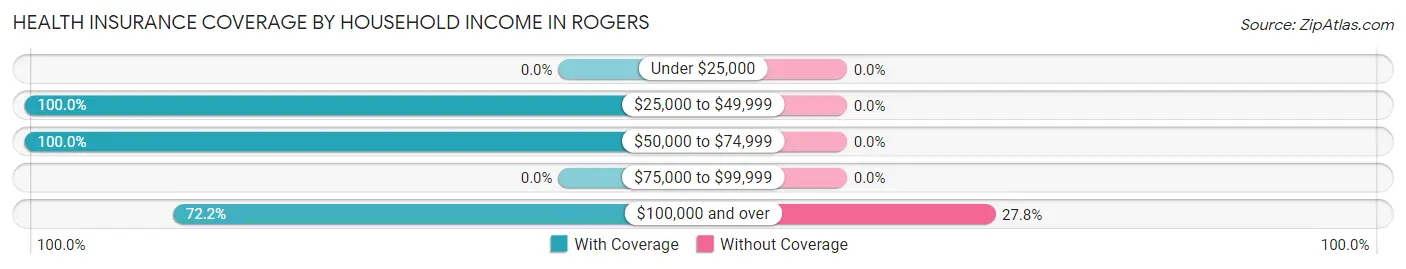
| Household Income | With Coverage | Without Coverage |
| Under $25,000 | 0 (0.0%) | 0 (0.0%) |
| $25,000 to $49,999 | 2 (100.0%) | 0 (0.0%) |
| $50,000 to $74,999 | 21 (100.0%) | 0 (0.0%) |
| $75,000 to $99,999 | 0 (0.0%) | 0 (0.0%) |
| $100,000 and over | 13 (72.2%) | 5 (27.8%) |
Public vs Private Health Insurance Coverage by Age in Rogers
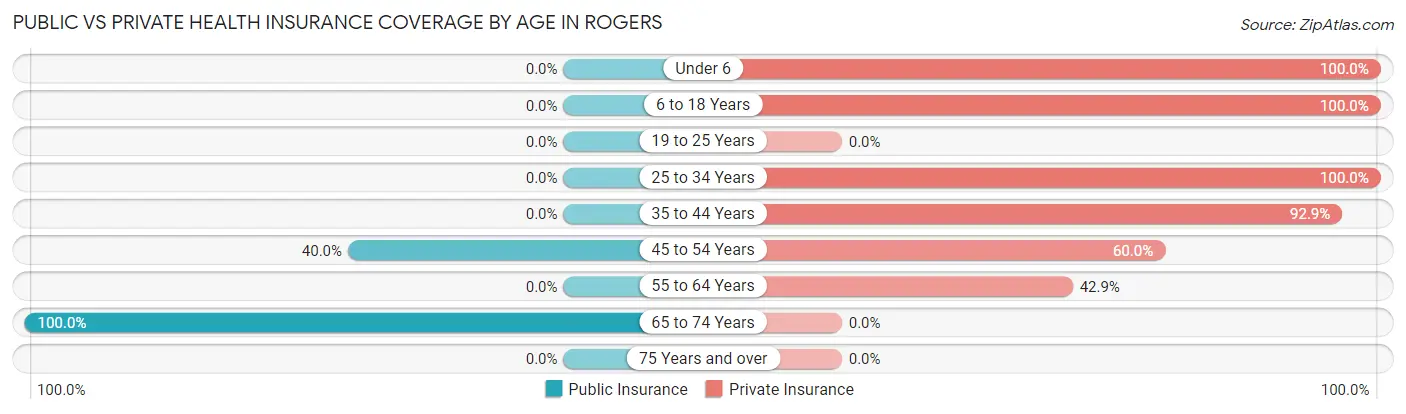
| Age Bracket | Public Insurance | Private Insurance |
| Under 6 | 0 (0.0%) | 1 (100.0%) |
| 6 to 18 Years | 0 (0.0%) | 3 (100.0%) |
| 19 to 25 Years | 0 (0.0%) | 0 (0.0%) |
| 25 to 34 Years | 0 (0.0%) | 4 (100.0%) |
| 35 to 44 Years | 0 (0.0%) | 13 (92.9%) |
| 45 to 54 Years | 2 (40.0%) | 3 (60.0%) |
| 55 to 64 Years | 0 (0.0%) | 3 (42.9%) |
| 65 to 74 Years | 7 (100.0%) | 0 (0.0%) |
| 75 Years and over | 0 (0.0%) | 0 (0.0%) |
| Total | 9 (22.0%) | 27 (65.8%) |
Disability Status by Sex by Age in Rogers
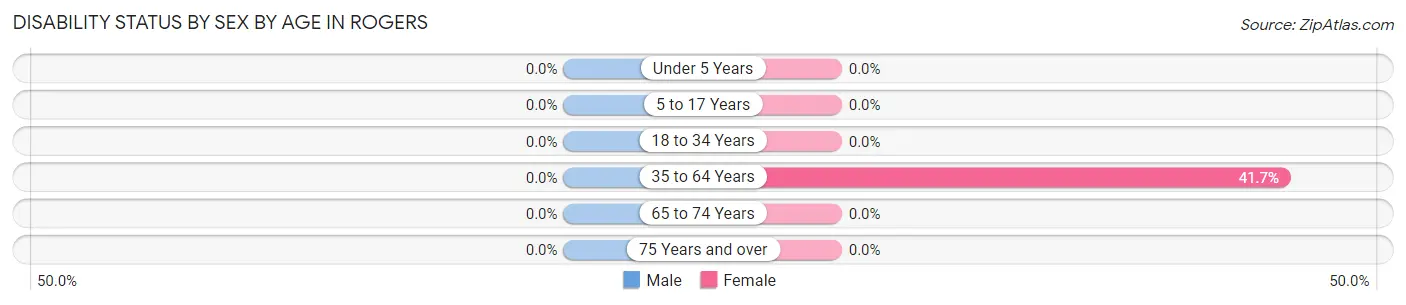
| Age Bracket | Male | Female |
| Under 5 Years | 0 (0.0%) | 0 (0.0%) |
| 5 to 17 Years | 0 (0.0%) | 0 (0.0%) |
| 18 to 34 Years | 0 (0.0%) | 0 (0.0%) |
| 35 to 64 Years | 0 (0.0%) | 5 (41.7%) |
| 65 to 74 Years | 0 (0.0%) | 0 (0.0%) |
| 75 Years and over | 0 (0.0%) | 0 (0.0%) |
Disability Class by Sex by Age in Rogers
Disability Class: Hearing Difficulty
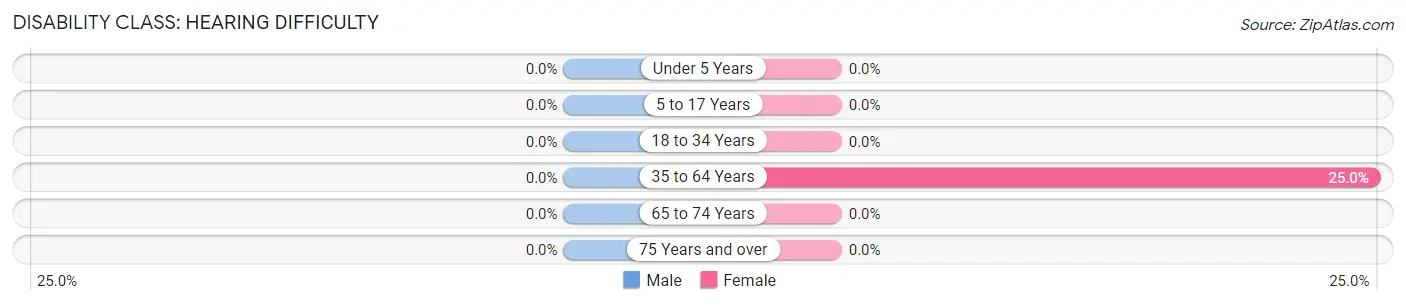
| Age Bracket | Male | Female |
| Under 5 Years | 0 (0.0%) | 0 (0.0%) |
| 5 to 17 Years | 0 (0.0%) | 0 (0.0%) |
| 18 to 34 Years | 0 (0.0%) | 0 (0.0%) |
| 35 to 64 Years | 0 (0.0%) | 3 (25.0%) |
| 65 to 74 Years | 0 (0.0%) | 0 (0.0%) |
| 75 Years and over | 0 (0.0%) | 0 (0.0%) |
Disability Class: Vision Difficulty
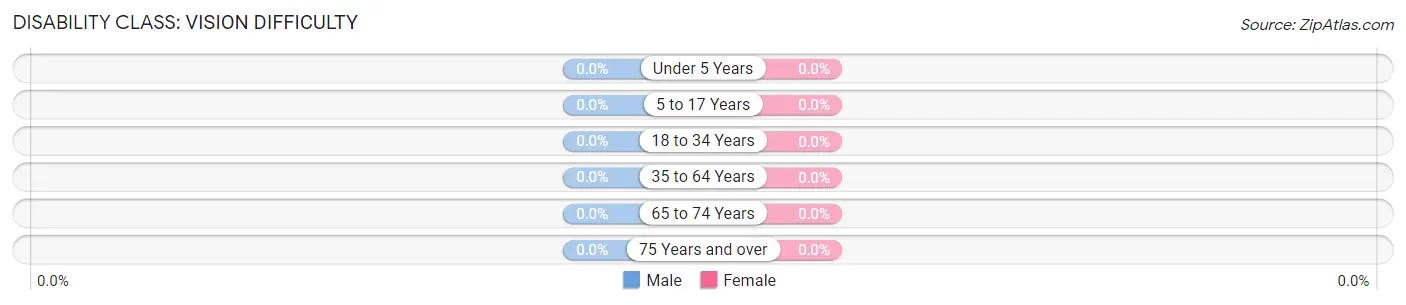
| Age Bracket | Male | Female |
| Under 5 Years | 0 (0.0%) | 0 (0.0%) |
| 5 to 17 Years | 0 (0.0%) | 0 (0.0%) |
| 18 to 34 Years | 0 (0.0%) | 0 (0.0%) |
| 35 to 64 Years | 0 (0.0%) | 0 (0.0%) |
| 65 to 74 Years | 0 (0.0%) | 0 (0.0%) |
| 75 Years and over | 0 (0.0%) | 0 (0.0%) |
Disability Class: Cognitive Difficulty
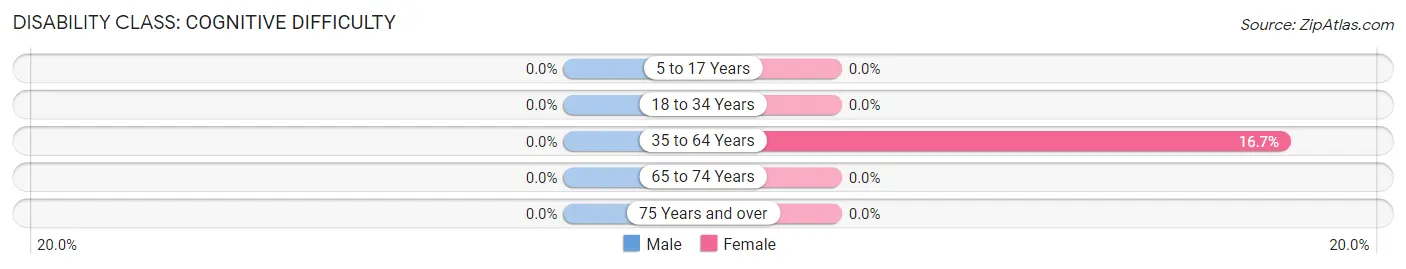
| Age Bracket | Male | Female |
| 5 to 17 Years | 0 (0.0%) | 0 (0.0%) |
| 18 to 34 Years | 0 (0.0%) | 0 (0.0%) |
| 35 to 64 Years | 0 (0.0%) | 2 (16.7%) |
| 65 to 74 Years | 0 (0.0%) | 0 (0.0%) |
| 75 Years and over | 0 (0.0%) | 0 (0.0%) |
Disability Class: Ambulatory Difficulty
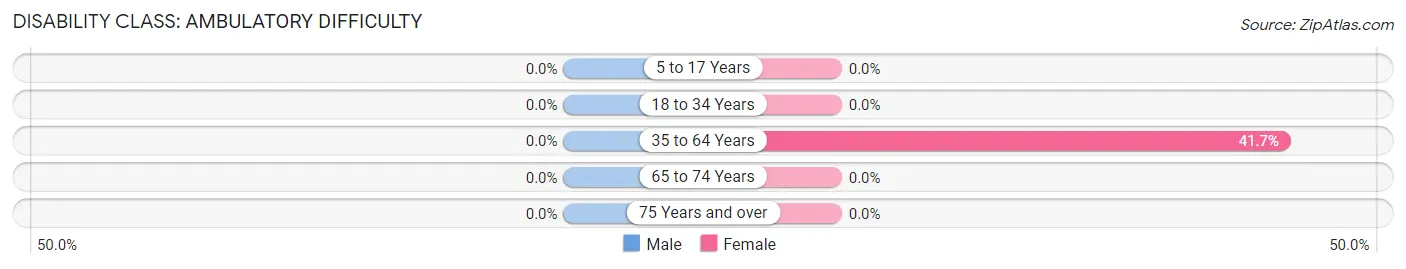
| Age Bracket | Male | Female |
| 5 to 17 Years | 0 (0.0%) | 0 (0.0%) |
| 18 to 34 Years | 0 (0.0%) | 0 (0.0%) |
| 35 to 64 Years | 0 (0.0%) | 5 (41.7%) |
| 65 to 74 Years | 0 (0.0%) | 0 (0.0%) |
| 75 Years and over | 0 (0.0%) | 0 (0.0%) |
Disability Class: Self-Care Difficulty
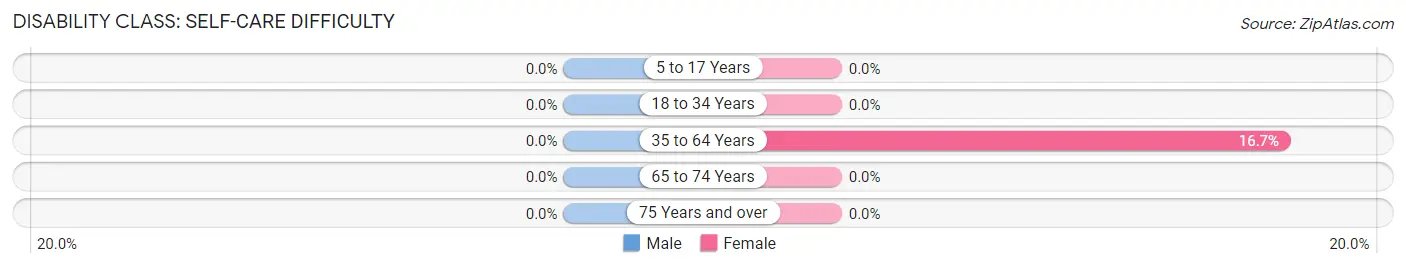
| Age Bracket | Male | Female |
| 5 to 17 Years | 0 (0.0%) | 0 (0.0%) |
| 18 to 34 Years | 0 (0.0%) | 0 (0.0%) |
| 35 to 64 Years | 0 (0.0%) | 2 (16.7%) |
| 65 to 74 Years | 0 (0.0%) | 0 (0.0%) |
| 75 Years and over | 0 (0.0%) | 0 (0.0%) |
Technology Access in Rogers
Computing Device Access in Rogers
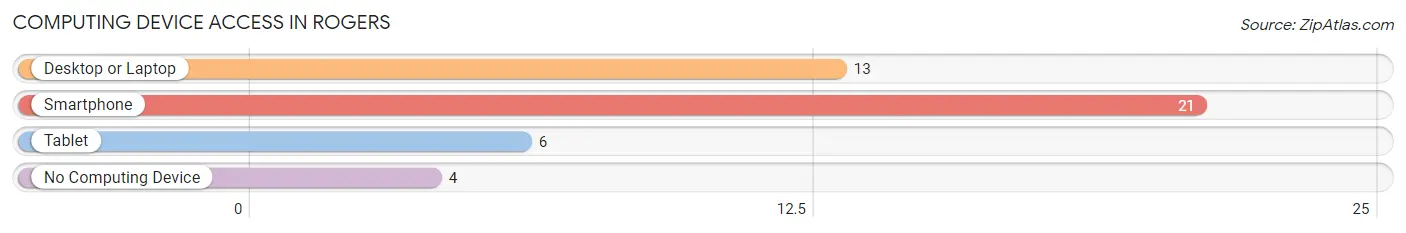
| Device Type | # Households | % Households |
| Desktop or Laptop | 13 | 52.0% |
| Smartphone | 21 | 84.0% |
| Tablet | 6 | 24.0% |
| No Computing Device | 4 | 16.0% |
| Total | 25 | 100.0% |
Internet Access in Rogers
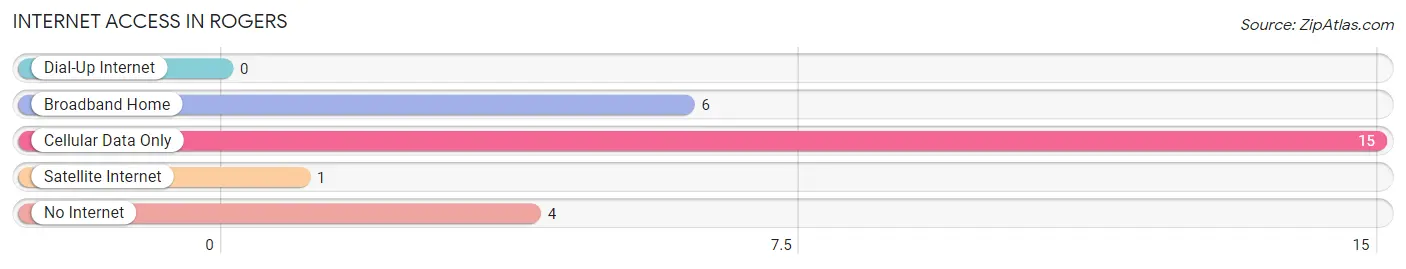
| Internet Type | # Households | % Households |
| Dial-Up Internet | 0 | 0.0% |
| Broadband Home | 6 | 24.0% |
| Cellular Data Only | 15 | 60.0% |
| Satellite Internet | 1 | 4.0% |
| No Internet | 4 | 16.0% |
| Total | 25 | 100.0% |
Rogers Summary
Rogers, North Dakota is a small city located in the southeastern corner of the state. It is the county seat of Williams County and is home to a population of just over 1,000 people. The city is located on the banks of the Missouri River and is surrounded by rolling hills and prairies.
The history of Rogers dates back to the late 1800s when the area was first settled by homesteaders. The city was officially incorporated in 1883 and was named after the first postmaster, William Rogers. The city quickly grew and by the early 1900s, it had become a bustling center of commerce and industry. The city was home to a variety of businesses, including a flour mill, a creamery, a lumber yard, and a hotel.
The economy of Rogers has traditionally been based on agriculture and related industries. The city is located in the heart of the Red River Valley, which is one of the most productive agricultural regions in the United States. The city is also home to a variety of manufacturing and service businesses.
The geography of Rogers is characterized by rolling hills and prairies. The city is located on the banks of the Missouri River and is surrounded by a variety of lakes and rivers. The city is also home to a variety of parks and recreational areas, including the Rogers City Park and the Rogers Wildlife Refuge.
The demographics of Rogers are largely made up of white, non-Hispanic residents. The city has a median household income of $41,000 and a poverty rate of 15.7%. The city is also home to a variety of ethnic and religious groups, including Native Americans, African Americans, and Hispanics.
Rogers is a small city with a rich history and a vibrant economy. The city is home to a variety of businesses and industries, and is surrounded by a variety of parks and recreational areas. The city is also home to a diverse population, with a variety of ethnic and religious backgrounds. The city is a great place to live and work, and is a great place to visit.
Common Questions
What is Per Capita Income in Rogers?
Per Capita income in Rogers is $56,280.
What is the Median Family Income in Rogers?
Median Family Income in Rogers is $149,375.
What is the Median Household income in Rogers?
Median Household Income in Rogers is $71,625.
What is Income or Wage Gap in Rogers?
Income or Wage Gap in Rogers is 20.5%.
Women in Rogers earn 79.5 cents for every dollar earned by a man.
What is Inequality or Gini Index in Rogers?
Inequality or Gini Index in Rogers is 0.26.
What is the Total Population of Rogers?
Total Population of Rogers is 41.
What is the Total Male Population of Rogers?
Total Male Population of Rogers is 21.
What is the Total Female Population of Rogers?
Total Female Population of Rogers is 20.
What is the Ratio of Males per 100 Females in Rogers?
There are 105.00 Males per 100 Females in Rogers.
What is the Ratio of Females per 100 Males in Rogers?
There are 95.24 Females per 100 Males in Rogers.
What is the Median Population Age in Rogers?
Median Population Age in Rogers is 41.9 Years.
What is the Average Family Size in Rogers
Average Family Size in Rogers is 2.1 People.
What is the Average Household Size in Rogers
Average Household Size in Rogers is 1.6 People.
How Large is the Labor Force in Rogers?
There are 35 People in the Labor Forcein in Rogers.
What is the Percentage of People in the Labor Force in Rogers?
94.6% of People are in the Labor Force in Rogers.
What is the Unemployment Rate in Rogers?
Unemployment Rate in Rogers is 5.7%.