Robie Creek, ID Map & Demographics
Robie Creek Map
Robie Creek Overview
$44,567
PER CAPITA INCOME
$123,750
AVG FAMILY INCOME
$117,422
AVG HOUSEHOLD INCOME
59.9%
WAGE / INCOME GAP [ % ]
40.1¢/ $1
WAGE / INCOME GAP [ $ ]
0.31
INEQUALITY / GINI INDEX
1,237
TOTAL POPULATION
592
MALE POPULATION
645
FEMALE POPULATION
91.78
MALES / 100 FEMALES
108.95
FEMALES / 100 MALES
57.9
MEDIAN AGE
2.8
AVG FAMILY SIZE
2.5
AVG HOUSEHOLD SIZE
581
LABOR FORCE [ PEOPLE ]
48.3%
PERCENT IN LABOR FORCE
Income in Robie Creek
Income Overview in Robie Creek
Per Capita Income in Robie Creek is $44,567, while median incomes of families and households are $123,750 and $117,422 respectively.
| Characteristic | Number | Measure |
| Per Capita Income | 1,237 | $44,567 |
| Median Family Income | 387 | $123,750 |
| Mean Family Income | 387 | $130,809 |
| Median Household Income | 495 | $117,422 |
| Mean Household Income | 495 | $112,092 |
| Income Deficit | 387 | $0 |
| Wage / Income Gap (%) | 1,237 | 59.89% |
| Wage / Income Gap ($) | 1,237 | 40.11¢ per $1 |
| Gini / Inequality Index | 1,237 | 0.31 |
Earnings by Sex in Robie Creek
Average Earnings in Robie Creek are $54,844, $73,533 for men and $29,491 for women, a difference of 59.9%.
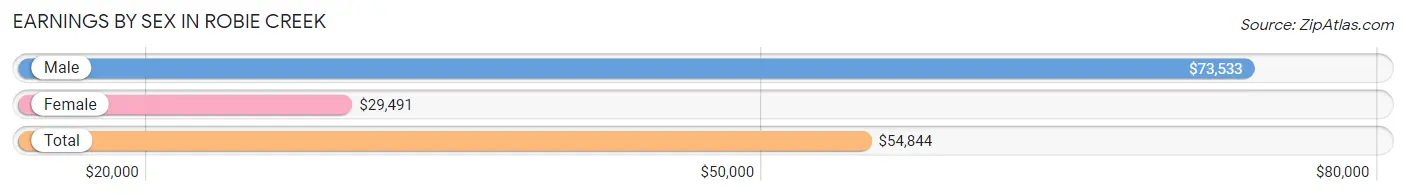
| Sex | Number | Average Earnings |
| Male | 387 (62.5%) | $73,533 |
| Female | 232 (37.5%) | $29,491 |
| Total | 619 (100.0%) | $54,844 |
Earnings by Sex by Income Bracket in Robie Creek
The most common earnings brackets in Robie Creek are $100,000+ for men (129 | 33.3%) and $25,000 to $29,999 for women (81 | 34.9%).
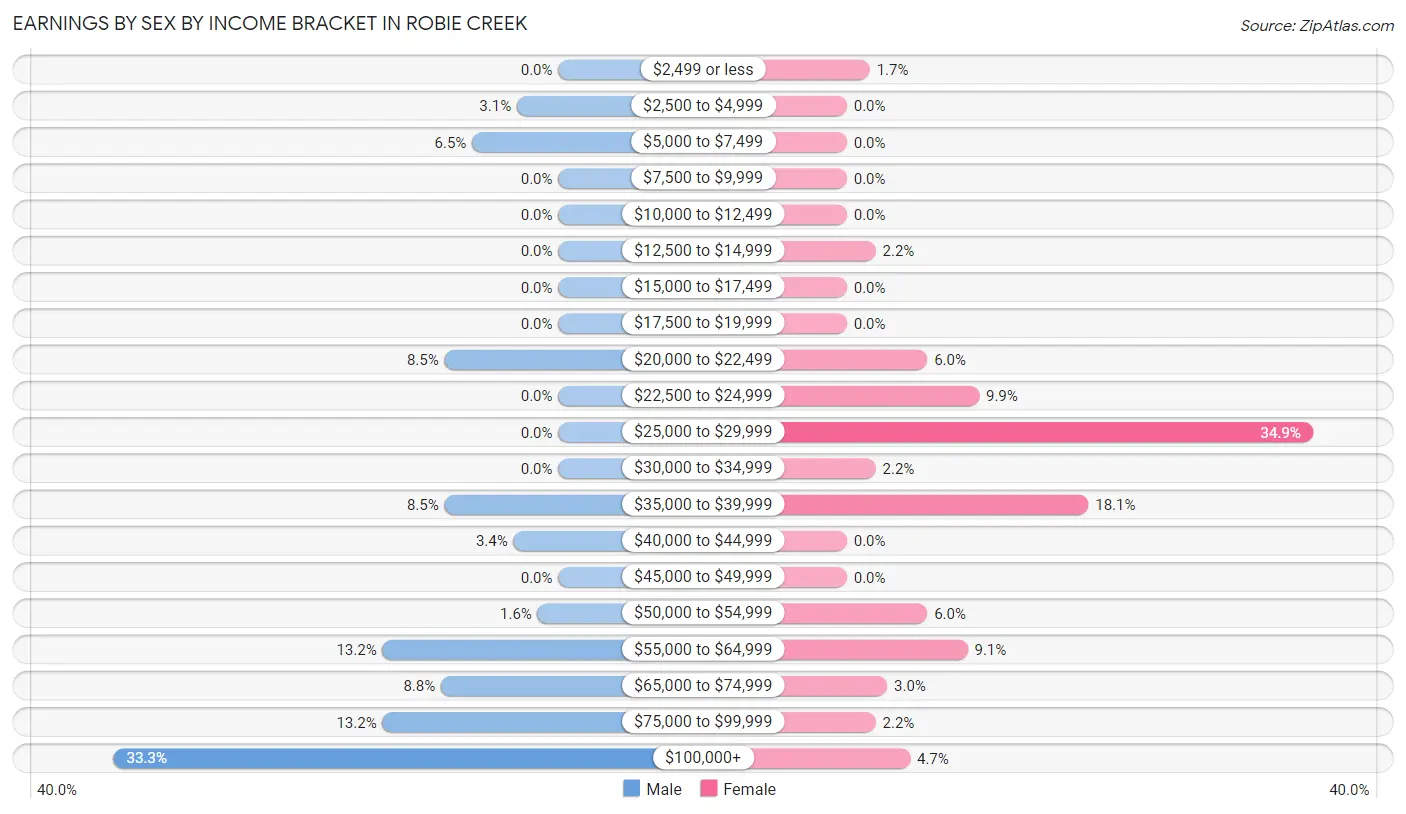
| Income | Male | Female |
| $2,499 or less | 0 (0.0%) | 4 (1.7%) |
| $2,500 to $4,999 | 12 (3.1%) | 0 (0.0%) |
| $5,000 to $7,499 | 25 (6.5%) | 0 (0.0%) |
| $7,500 to $9,999 | 0 (0.0%) | 0 (0.0%) |
| $10,000 to $12,499 | 0 (0.0%) | 0 (0.0%) |
| $12,500 to $14,999 | 0 (0.0%) | 5 (2.2%) |
| $15,000 to $17,499 | 0 (0.0%) | 0 (0.0%) |
| $17,500 to $19,999 | 0 (0.0%) | 0 (0.0%) |
| $20,000 to $22,499 | 33 (8.5%) | 14 (6.0%) |
| $22,500 to $24,999 | 0 (0.0%) | 23 (9.9%) |
| $25,000 to $29,999 | 0 (0.0%) | 81 (34.9%) |
| $30,000 to $34,999 | 0 (0.0%) | 5 (2.2%) |
| $35,000 to $39,999 | 33 (8.5%) | 42 (18.1%) |
| $40,000 to $44,999 | 13 (3.4%) | 0 (0.0%) |
| $45,000 to $49,999 | 0 (0.0%) | 0 (0.0%) |
| $50,000 to $54,999 | 6 (1.5%) | 14 (6.0%) |
| $55,000 to $64,999 | 51 (13.2%) | 21 (9.0%) |
| $65,000 to $74,999 | 34 (8.8%) | 7 (3.0%) |
| $75,000 to $99,999 | 51 (13.2%) | 5 (2.2%) |
| $100,000+ | 129 (33.3%) | 11 (4.7%) |
| Total | 387 (100.0%) | 232 (100.0%) |
Earnings by Sex by Educational Attainment in Robie Creek
Average earnings in Robie Creek are $89,650 for men and $28,819 for women, a difference of 67.8%. Men with an educational attainment of graduate degree enjoy the highest average annual earnings of $170,288, while those with college or associate's degree education earn the least with $73,804. Women with an educational attainment of college or associate's degree earn the most with the average annual earnings of $46,250, while those with high school diploma education have the smallest earnings of $25,417.
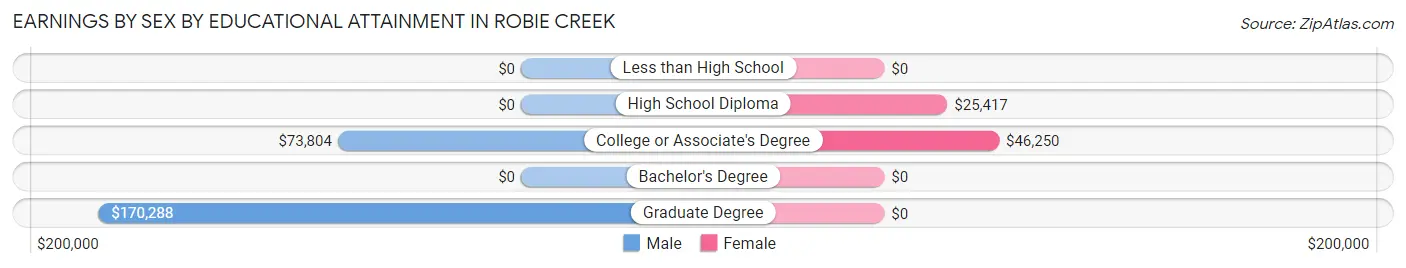
| Educational Attainment | Male Income | Female Income |
| Less than High School | - | - |
| High School Diploma | - | - |
| College or Associate's Degree | $73,804 | $46,250 |
| Bachelor's Degree | - | - |
| Graduate Degree | $170,288 | $0 |
| Total | $89,650 | $28,819 |
Family Income in Robie Creek
Family Income Brackets in Robie Creek
According to the Robie Creek family income data, there are 139 families falling into the $100,000 to $149,999 income range, which is the most common income bracket and makes up 35.9% of all families.
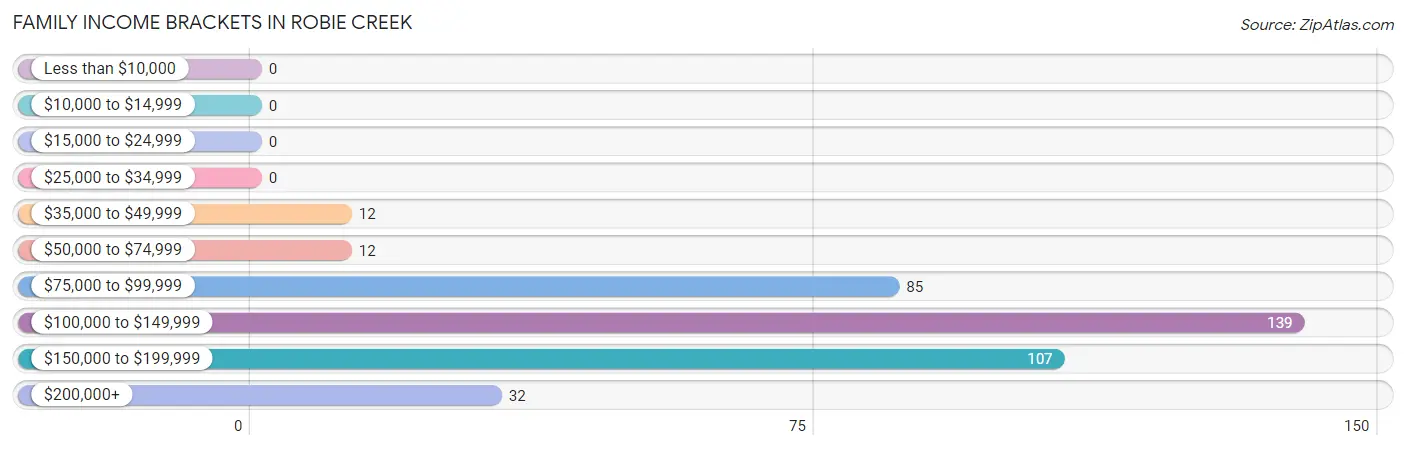
| Income Bracket | # Families | % Families |
| Less than $10,000 | 0 | 0.0% |
| $10,000 to $14,999 | 0 | 0.0% |
| $15,000 to $24,999 | 0 | 0.0% |
| $25,000 to $34,999 | 0 | 0.0% |
| $35,000 to $49,999 | 12 | 3.1% |
| $50,000 to $74,999 | 12 | 3.1% |
| $75,000 to $99,999 | 85 | 22.0% |
| $100,000 to $149,999 | 139 | 35.9% |
| $150,000 to $199,999 | 107 | 27.6% |
| $200,000+ | 32 | 8.3% |
Family Income by Famaliy Size in Robie Creek
3-person families (141 | 36.4%) account for the highest median family income in Robie Creek with $150,885 per family, while 2-person families (194 | 50.1%) have the highest median income of $58,438 per family member.
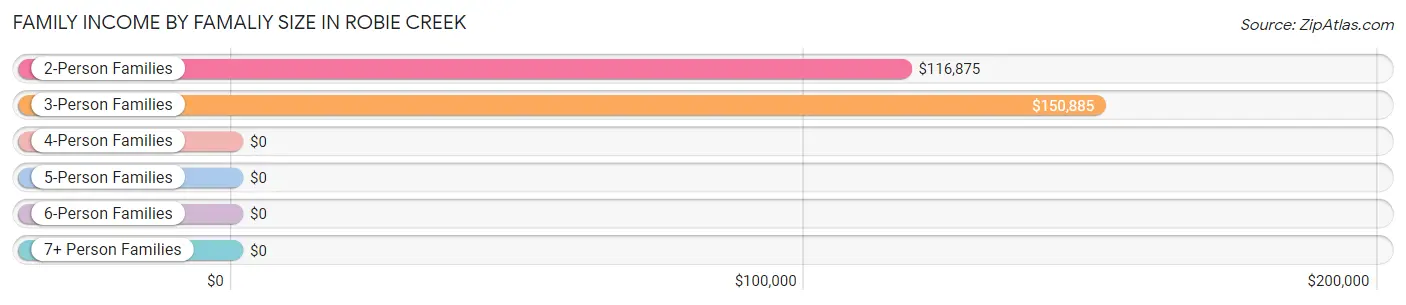
| Income Bracket | # Families | Median Income |
| 2-Person Families | 194 (50.1%) | $116,875 |
| 3-Person Families | 141 (36.4%) | $150,885 |
| 4-Person Families | 21 (5.4%) | $0 |
| 5-Person Families | 0 (0.0%) | $0 |
| 6-Person Families | 31 (8.0%) | $0 |
| 7+ Person Families | 0 (0.0%) | $0 |
| Total | 387 (100.0%) | $123,750 |
Family Income by Number of Earners in Robie Creek
The median family income in Robie Creek is $123,750, with families comprising 3+ earners (40) having the highest median family income of $207,619, while families with no earners (40) have the lowest median family income of $110,000, accounting for 10.3% and 10.3% of families, respectively.
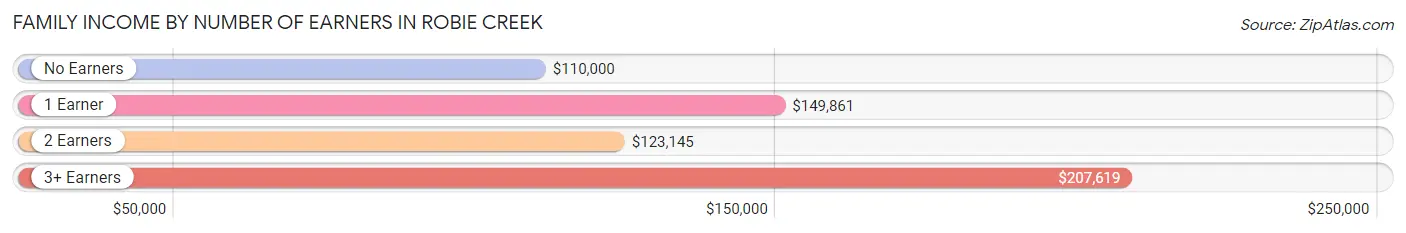
| Number of Earners | # Families | Median Income |
| No Earners | 40 (10.3%) | $110,000 |
| 1 Earner | 201 (51.9%) | $149,861 |
| 2 Earners | 106 (27.4%) | $123,145 |
| 3+ Earners | 40 (10.3%) | $207,619 |
| Total | 387 (100.0%) | $123,750 |
Household Income in Robie Creek
Household Income Brackets in Robie Creek
With 144 households falling in the category, the $100,000 to $149,999 income range is the most frequent in Robie Creek, accounting for 29.1% of all households.
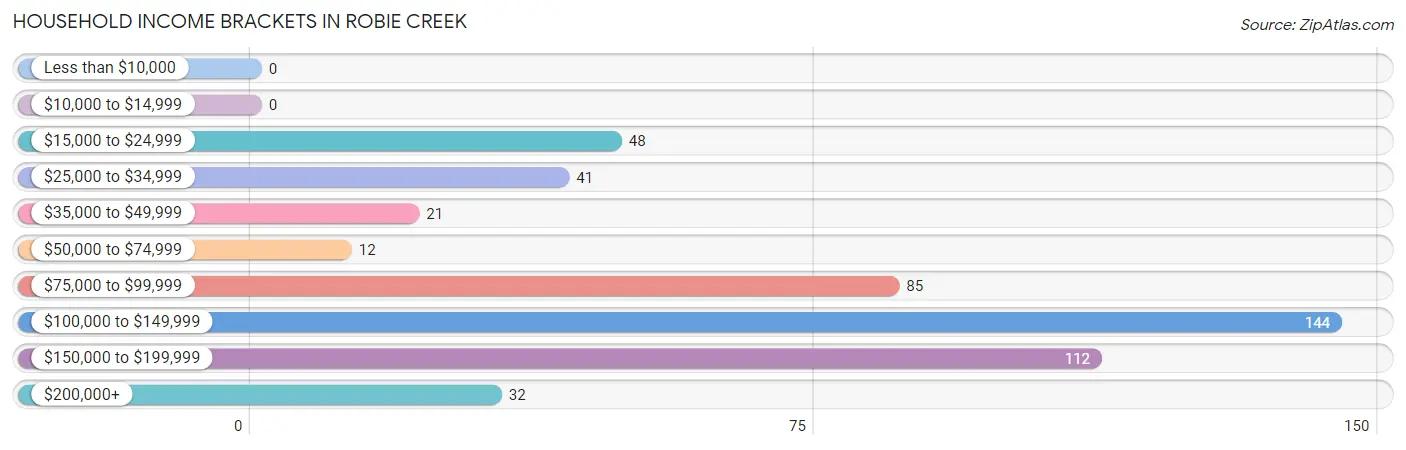
| Income Bracket | # Households | % Households |
| Less than $10,000 | 0 | 0.0% |
| $10,000 to $14,999 | 0 | 0.0% |
| $15,000 to $24,999 | 48 | 9.7% |
| $25,000 to $34,999 | 41 | 8.3% |
| $35,000 to $49,999 | 21 | 4.2% |
| $50,000 to $74,999 | 12 | 2.4% |
| $75,000 to $99,999 | 85 | 17.2% |
| $100,000 to $149,999 | 144 | 29.1% |
| $150,000 to $199,999 | 112 | 22.6% |
| $200,000+ | 32 | 6.5% |
Household Income by Householder Age in Robie Creek
The median household income in Robie Creek is $117,422, with the highest median household income of $133,750 found in the 45 to 64 years age bracket for the primary householder. A total of 324 households (65.4%) fall into this category.
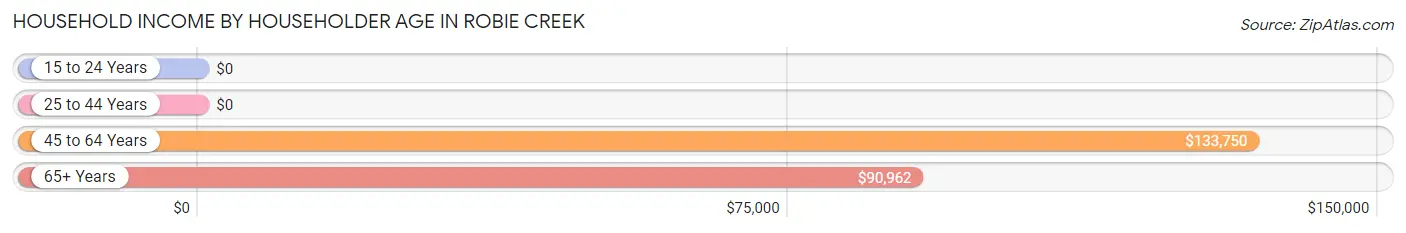
| Income Bracket | # Households | Median Income |
| 15 to 24 Years | 0 (0.0%) | $0 |
| 25 to 44 Years | 41 (8.3%) | $0 |
| 45 to 64 Years | 324 (65.4%) | $133,750 |
| 65+ Years | 130 (26.3%) | $90,962 |
| Total | 495 (100.0%) | $117,422 |
Poverty in Robie Creek
Income Below Poverty by Sex and Age in Robie Creek
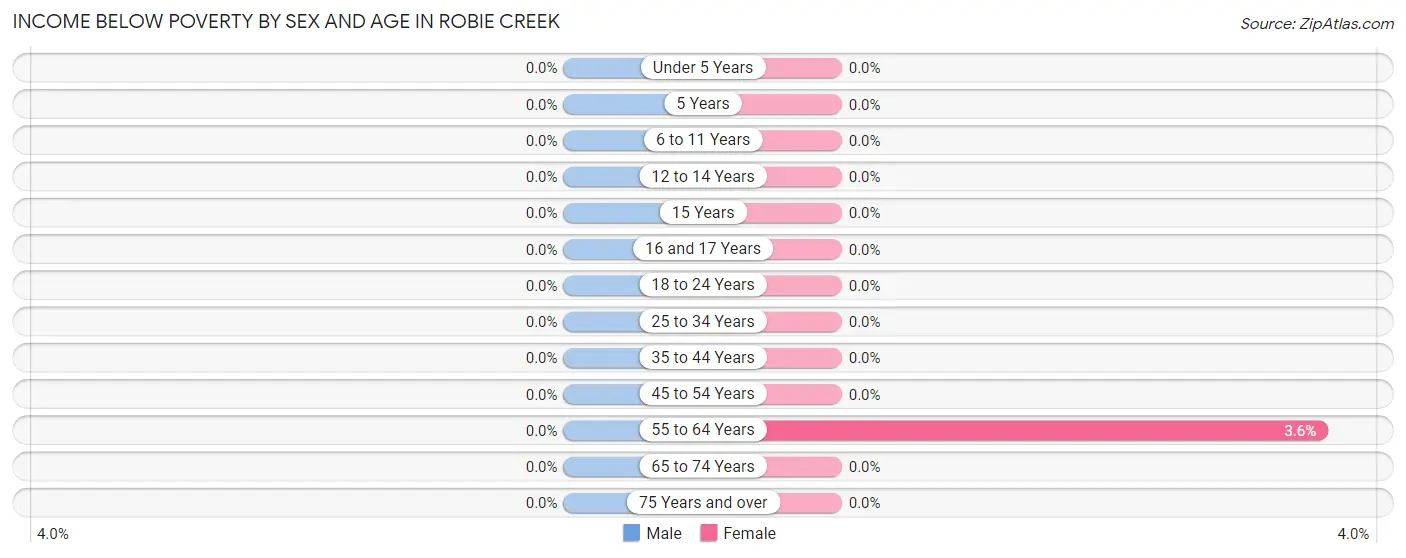
| Age Bracket | Male | Female |
| Under 5 Years | 0 (0.0%) | 0 (0.0%) |
| 5 Years | 0 (0.0%) | 0 (0.0%) |
| 6 to 11 Years | 0 (0.0%) | 0 (0.0%) |
| 12 to 14 Years | 0 (0.0%) | 0 (0.0%) |
| 15 Years | 0 (0.0%) | 0 (0.0%) |
| 16 and 17 Years | 0 (0.0%) | 0 (0.0%) |
| 18 to 24 Years | 0 (0.0%) | 0 (0.0%) |
| 25 to 34 Years | 0 (0.0%) | 0 (0.0%) |
| 35 to 44 Years | 0 (0.0%) | 0 (0.0%) |
| 45 to 54 Years | 0 (0.0%) | 0 (0.0%) |
| 55 to 64 Years | 0 (0.0%) | 10 (3.6%) |
| 65 to 74 Years | 0 (0.0%) | 0 (0.0%) |
| 75 Years and over | 0 (0.0%) | 0 (0.0%) |
| Total | 0 (0.0%) | 10 (1.5%) |
Income Above Poverty by Sex and Age in Robie Creek
According to the poverty statistics in Robie Creek, males aged 12 to 14 years and females aged 6 to 11 years are the age groups that are most secure financially, with 100.0% of males and 100.0% of females in these age groups living above the poverty line.
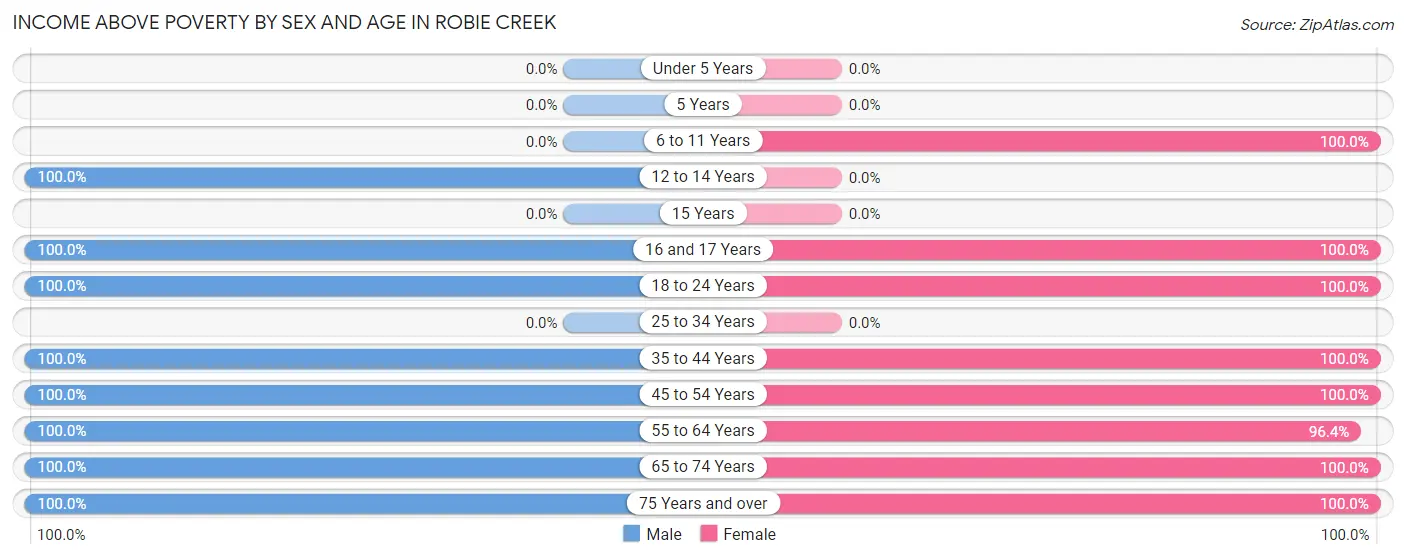
| Age Bracket | Male | Female |
| Under 5 Years | 0 (0.0%) | 0 (0.0%) |
| 5 Years | 0 (0.0%) | 0 (0.0%) |
| 6 to 11 Years | 0 (0.0%) | 24 (100.0%) |
| 12 to 14 Years | 11 (100.0%) | 0 (0.0%) |
| 15 Years | 0 (0.0%) | 0 (0.0%) |
| 16 and 17 Years | 28 (100.0%) | 55 (100.0%) |
| 18 to 24 Years | 88 (100.0%) | 33 (100.0%) |
| 25 to 34 Years | 0 (0.0%) | 0 (0.0%) |
| 35 to 44 Years | 41 (100.0%) | 77 (100.0%) |
| 45 to 54 Years | 79 (100.0%) | 41 (100.0%) |
| 55 to 64 Years | 208 (100.0%) | 267 (96.4%) |
| 65 to 74 Years | 121 (100.0%) | 71 (100.0%) |
| 75 Years and over | 16 (100.0%) | 67 (100.0%) |
| Total | 592 (100.0%) | 635 (98.5%) |
Income Below Poverty Among Married-Couple Families in Robie Creek
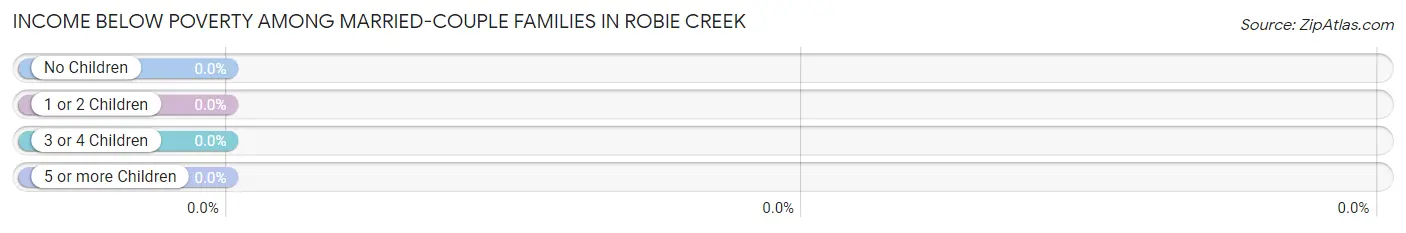
| Children | Above Poverty | Below Poverty |
| No Children | 285 (100.0%) | 0 (0.0%) |
| 1 or 2 Children | 93 (100.0%) | 0 (0.0%) |
| 3 or 4 Children | 0 (0.0%) | 0 (0.0%) |
| 5 or more Children | 0 (0.0%) | 0 (0.0%) |
| Total | 378 (100.0%) | 0 (0.0%) |
Income Below Poverty Among Single-Parent Households in Robie Creek
| Children | Single Father | Single Mother |
| No Children | 0 (0.0%) | 0 (0.0%) |
| 1 or 2 Children | 0 (0.0%) | 0 (0.0%) |
| 3 or 4 Children | 0 (0.0%) | 0 (0.0%) |
| 5 or more Children | 0 (0.0%) | 0 (0.0%) |
| Total | 0 (0.0%) | 0 (0.0%) |
Income Below Poverty Among Married-Couple vs Single-Parent Households in Robie Creek
| Children | Married-Couple Families | Single-Parent Households |
| No Children | 0 (0.0%) | 0 (0.0%) |
| 1 or 2 Children | 0 (0.0%) | 0 (0.0%) |
| 3 or 4 Children | 0 (0.0%) | 0 (0.0%) |
| 5 or more Children | 0 (0.0%) | 0 (0.0%) |
| Total | 0 (0.0%) | 0 (0.0%) |
Race in Robie Creek
The most populous races in Robie Creek are White / Caucasian (1,160 | 93.8%), Hispanic or Latino (100 | 8.1%), and Asian (39 | 3.2%).
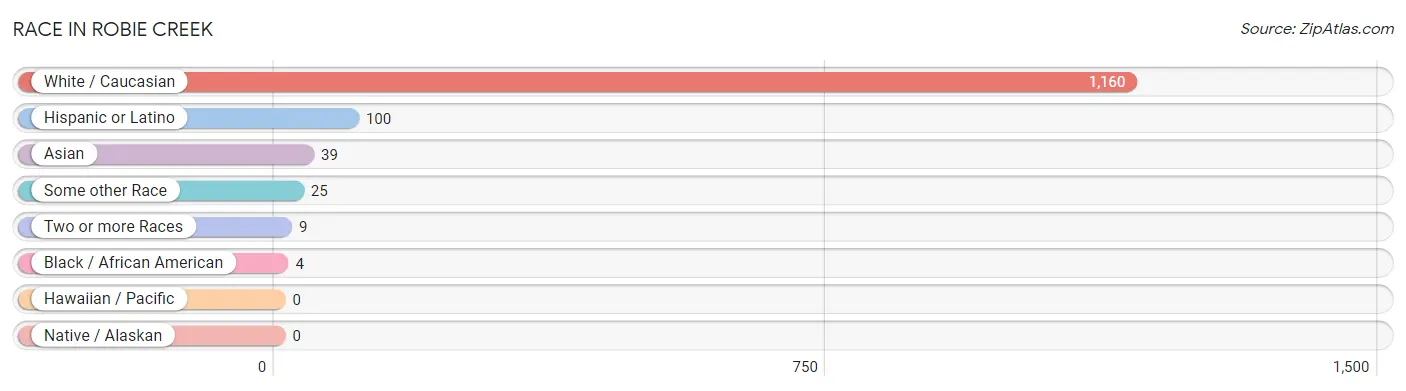
| Race | # Population | % Population |
| Asian | 39 | 3.2% |
| Black / African American | 4 | 0.3% |
| Hawaiian / Pacific | 0 | 0.0% |
| Hispanic or Latino | 100 | 8.1% |
| Native / Alaskan | 0 | 0.0% |
| White / Caucasian | 1,160 | 93.8% |
| Two or more Races | 9 | 0.7% |
| Some other Race | 25 | 2.0% |
| Total | 1,237 | 100.0% |
Ancestry in Robie Creek
The most populous ancestries reported in Robie Creek are English (328 | 26.5%), German (166 | 13.4%), Irish (83 | 6.7%), Argentinean (75 | 6.1%), and South American (75 | 6.1%), together accounting for 58.8% of all Robie Creek residents.
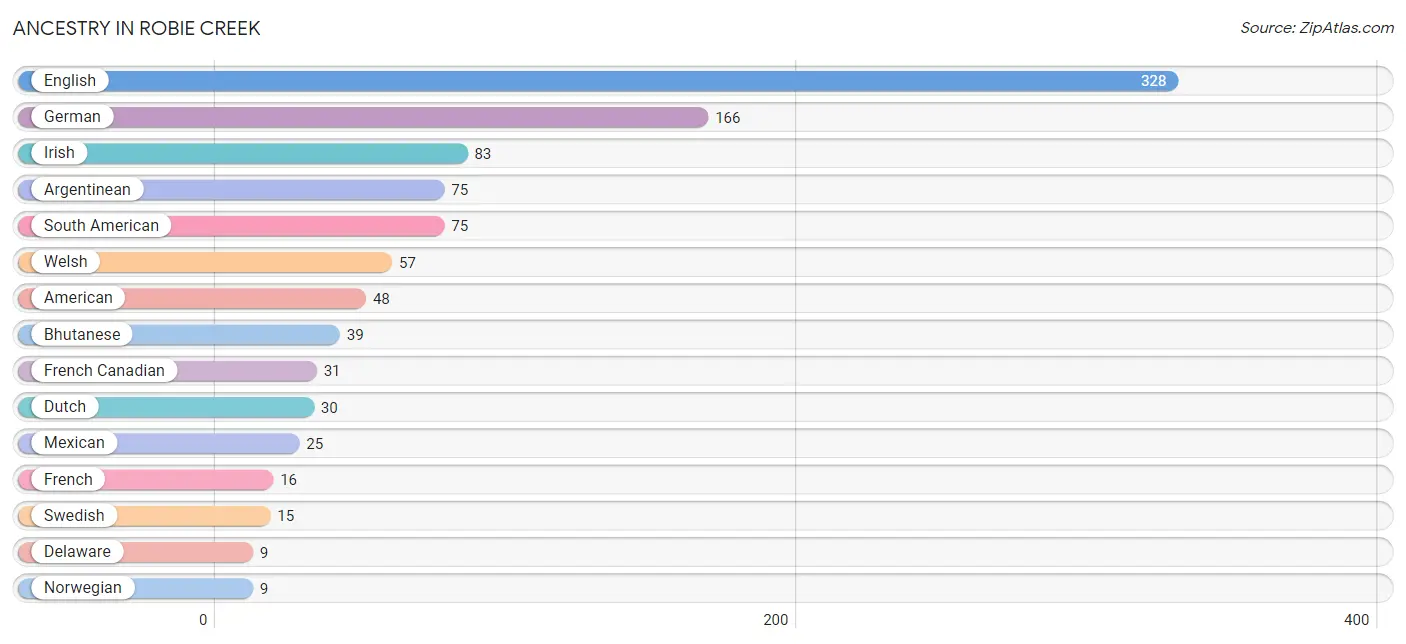
| Ancestry | # Population | % Population |
| American | 48 | 3.9% |
| Argentinean | 75 | 6.1% |
| Bhutanese | 39 | 3.2% |
| Delaware | 9 | 0.7% |
| Dutch | 30 | 2.4% |
| English | 328 | 26.5% |
| French | 16 | 1.3% |
| French Canadian | 31 | 2.5% |
| German | 166 | 13.4% |
| Irish | 83 | 6.7% |
| Luxembourger | 6 | 0.5% |
| Mexican | 25 | 2.0% |
| Norwegian | 9 | 0.7% |
| Slovene | 6 | 0.5% |
| South American | 75 | 6.1% |
| Swedish | 15 | 1.2% |
| Welsh | 57 | 4.6% | View All 17 Rows |
Immigrants in Robie Creek
The most numerous immigrant groups reported in Robie Creek came from Chile (38 | 3.1%), Latin America (38 | 3.1%), and South America (38 | 3.1%), together accounting for 9.2% of all Robie Creek residents.
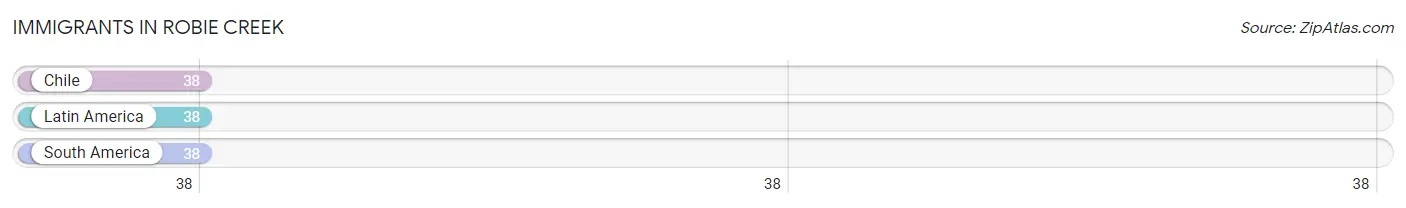
| Immigration Origin | # Population | % Population |
| Chile | 38 | 3.1% |
| Latin America | 38 | 3.1% |
| South America | 38 | 3.1% | View All 3 Rows |
Sex and Age in Robie Creek
Sex and Age in Robie Creek
The most populous age groups in Robie Creek are 55 to 59 Years (107 | 18.1%) for men and 55 to 59 Years (152 | 23.6%) for women.
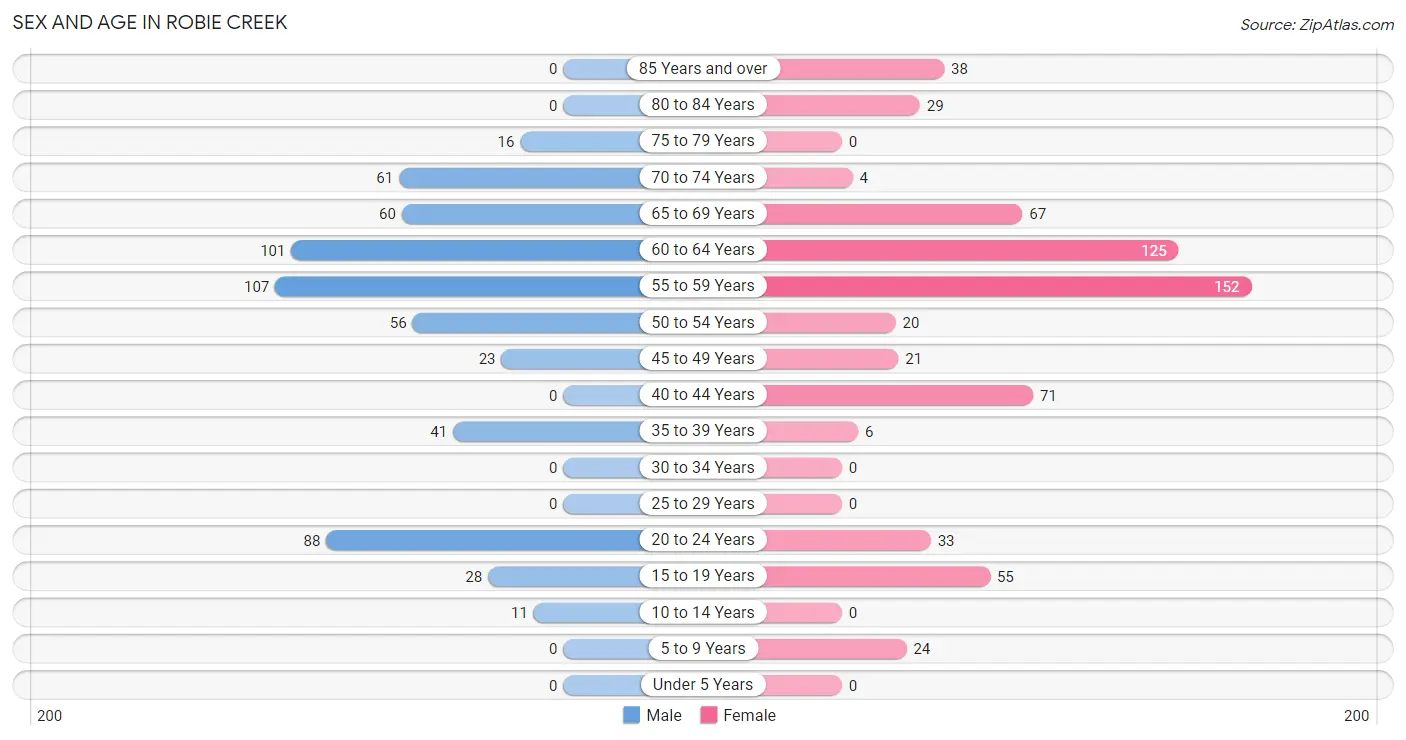
| Age Bracket | Male | Female |
| Under 5 Years | 0 (0.0%) | 0 (0.0%) |
| 5 to 9 Years | 0 (0.0%) | 24 (3.7%) |
| 10 to 14 Years | 11 (1.9%) | 0 (0.0%) |
| 15 to 19 Years | 28 (4.7%) | 55 (8.5%) |
| 20 to 24 Years | 88 (14.9%) | 33 (5.1%) |
| 25 to 29 Years | 0 (0.0%) | 0 (0.0%) |
| 30 to 34 Years | 0 (0.0%) | 0 (0.0%) |
| 35 to 39 Years | 41 (6.9%) | 6 (0.9%) |
| 40 to 44 Years | 0 (0.0%) | 71 (11.0%) |
| 45 to 49 Years | 23 (3.9%) | 21 (3.3%) |
| 50 to 54 Years | 56 (9.5%) | 20 (3.1%) |
| 55 to 59 Years | 107 (18.1%) | 152 (23.6%) |
| 60 to 64 Years | 101 (17.1%) | 125 (19.4%) |
| 65 to 69 Years | 60 (10.1%) | 67 (10.4%) |
| 70 to 74 Years | 61 (10.3%) | 4 (0.6%) |
| 75 to 79 Years | 16 (2.7%) | 0 (0.0%) |
| 80 to 84 Years | 0 (0.0%) | 29 (4.5%) |
| 85 Years and over | 0 (0.0%) | 38 (5.9%) |
| Total | 592 (100.0%) | 645 (100.0%) |
Families and Households in Robie Creek
Median Family Size in Robie Creek
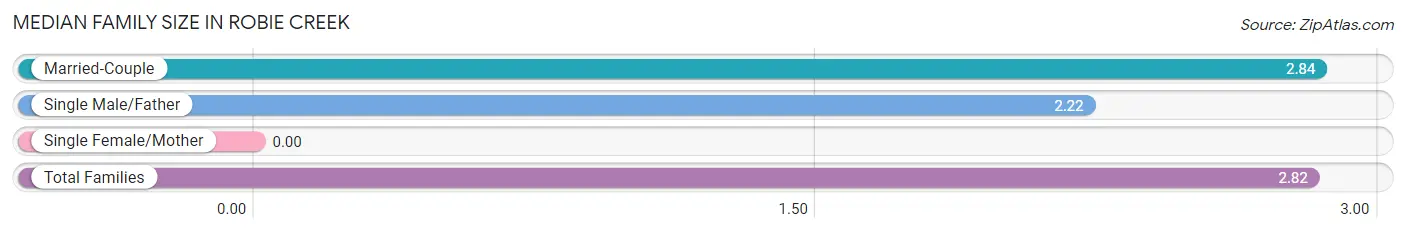
| Family Type | # Families | Family Size |
| Married-Couple | 378 (97.7%) | 2.84 |
| Single Male/Father | 9 (2.3%) | 2.22 |
| Single Female/Mother | 0 (0.0%) | - |
| Total Families | 387 (100.0%) | 2.82 |
Median Household Size in Robie Creek
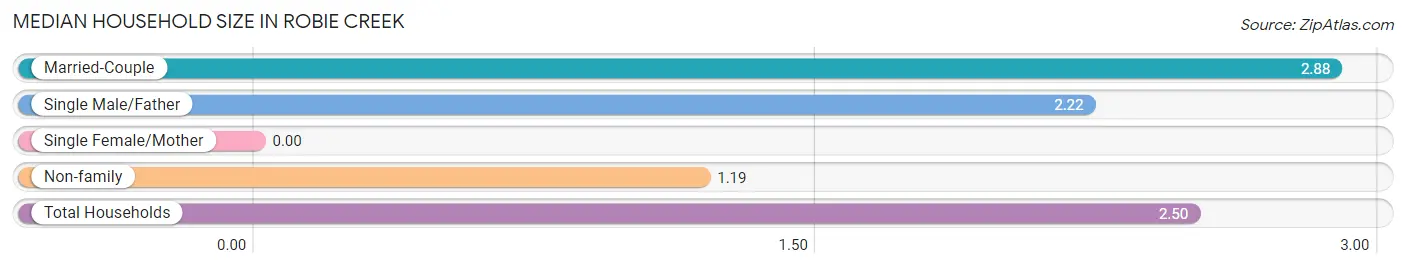
| Household Type | # Households | Household Size |
| Married-Couple | 378 (76.4%) | 2.88 |
| Single Male/Father | 9 (1.8%) | 2.22 |
| Single Female/Mother | 0 (0.0%) | - |
| Non-family | 108 (21.8%) | 1.19 |
| Total Households | 495 (100.0%) | 2.50 |
Household Size by Marriage Status in Robie Creek
Out of a total of 495 households in Robie Creek, 387 (78.2%) are family households, while 108 (21.8%) are nonfamily households. The most numerous type of family households are 2-person households, comprising 194, and the most common type of nonfamily households are 1-person households, comprising 89.
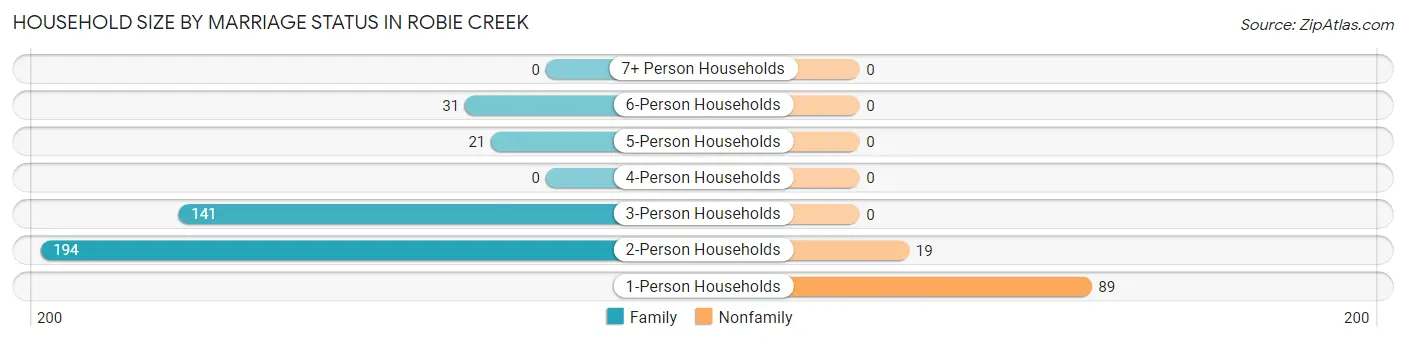
| Household Size | Family Households | Nonfamily Households |
| 1-Person Households | - | 89 (18.0%) |
| 2-Person Households | 194 (39.2%) | 19 (3.8%) |
| 3-Person Households | 141 (28.5%) | 0 (0.0%) |
| 4-Person Households | 0 (0.0%) | 0 (0.0%) |
| 5-Person Households | 21 (4.2%) | 0 (0.0%) |
| 6-Person Households | 31 (6.3%) | 0 (0.0%) |
| 7+ Person Households | 0 (0.0%) | 0 (0.0%) |
| Total | 387 (78.2%) | 108 (21.8%) |
Female Fertility in Robie Creek
Fertility by Age in Robie Creek
| Age Bracket | Women with Births | Births / 1,000 Women |
| 15 to 19 years | 0 (0.0%) | 0.0 |
| 20 to 34 years | 0 (0.0%) | 0.0 |
| 35 to 50 years | 0 (0.0%) | 0.0 |
| Total | 0 (0.0%) | 0.0 |
Fertility by Age by Marriage Status in Robie Creek
| Age Bracket | Married | Unmarried |
| 15 to 19 years | 0 (0.0%) | 0 (0.0%) |
| 20 to 34 years | 0 (0.0%) | 0 (0.0%) |
| 35 to 50 years | 0 (0.0%) | 0 (0.0%) |
| Total | 0 (0.0%) | 0 (0.0%) |
Fertility by Education in Robie Creek
| Educational Attainment | Women with Births | Births / 1,000 Women |
| Less than High School | 0 (0.0%) | 0.0 |
| High School Diploma | 0 (0.0%) | 0.0 |
| College or Associate's Degree | 0 (0.0%) | 0.0 |
| Bachelor's Degree | 0 (0.0%) | 0.0 |
| Graduate Degree | 0 (0.0%) | 0.0 |
| Total | 0 (0.0%) | 0.0 |
Fertility by Education by Marriage Status in Robie Creek
| Educational Attainment | Married | Unmarried |
| Less than High School | 0 (0.0%) | 0 (0.0%) |
| High School Diploma | 0 (0.0%) | 0 (0.0%) |
| College or Associate's Degree | 0 (0.0%) | 0 (0.0%) |
| Bachelor's Degree | 0 (0.0%) | 0 (0.0%) |
| Graduate Degree | 0 (0.0%) | 0 (0.0%) |
| Total | 0 (0.0%) | 0 (0.0%) |
Employment Characteristics in Robie Creek
Employment by Class of Employer in Robie Creek
Among the 576 employed individuals in Robie Creek, private company employees (400 | 69.4%), not-for-profit organizations (77 | 13.4%), and federal government employees (66 | 11.5%) make up the most common classes of employment.
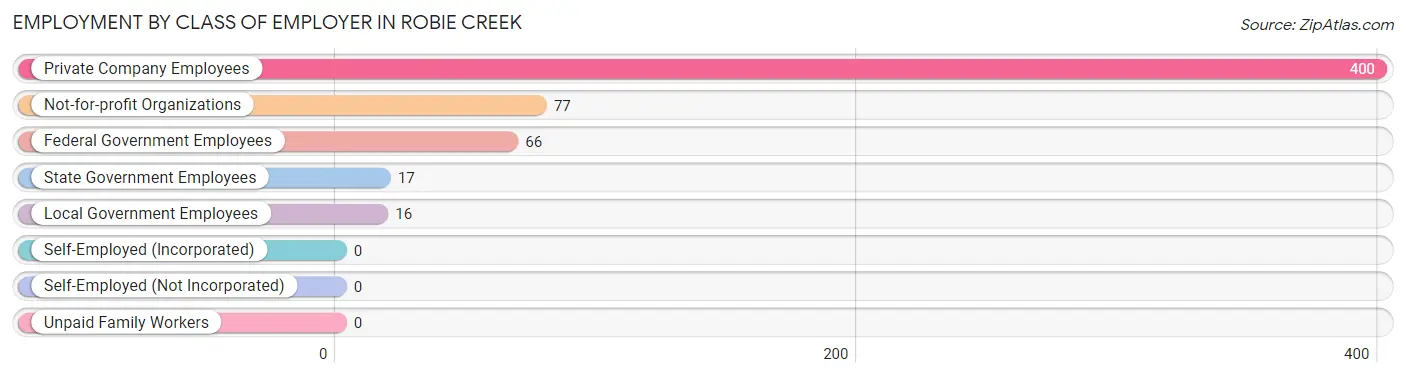
| Employer Class | # Employees | % Employees |
| Private Company Employees | 400 | 69.4% |
| Self-Employed (Incorporated) | 0 | 0.0% |
| Self-Employed (Not Incorporated) | 0 | 0.0% |
| Not-for-profit Organizations | 77 | 13.4% |
| Local Government Employees | 16 | 2.8% |
| State Government Employees | 17 | 2.9% |
| Federal Government Employees | 66 | 11.5% |
| Unpaid Family Workers | 0 | 0.0% |
| Total | 576 | 100.0% |
Employment Status by Age in Robie Creek
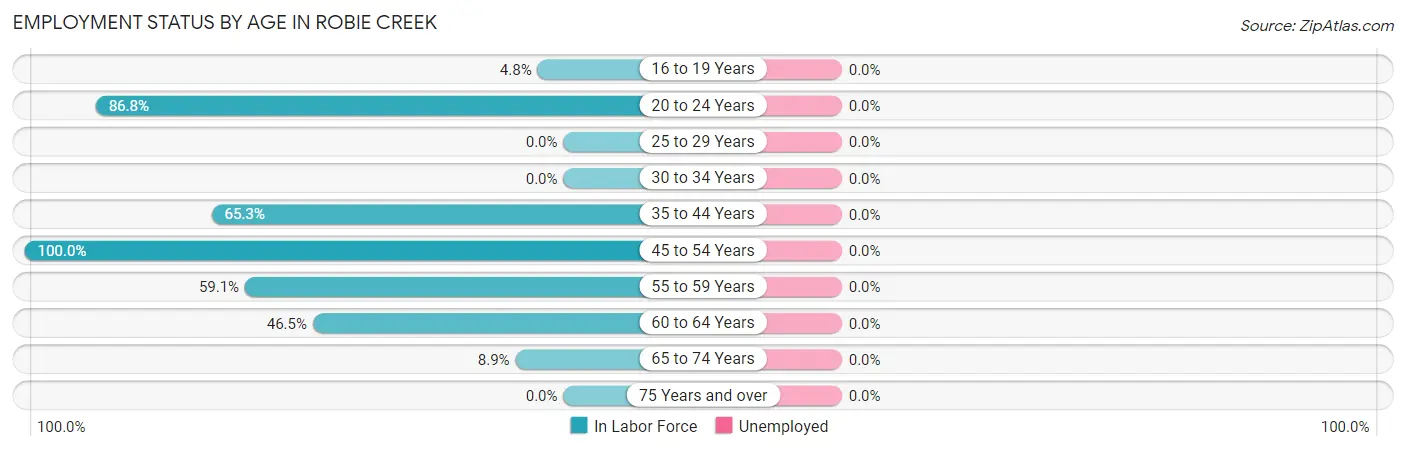
| Age Bracket | In Labor Force | Unemployed |
| 16 to 19 Years | 4 (4.8%) | 0 (0.0%) |
| 20 to 24 Years | 105 (86.8%) | 0 (0.0%) |
| 25 to 29 Years | 0 (0.0%) | 0 (0.0%) |
| 30 to 34 Years | 0 (0.0%) | 0 (0.0%) |
| 35 to 44 Years | 77 (65.3%) | 0 (0.0%) |
| 45 to 54 Years | 120 (100.0%) | 0 (0.0%) |
| 55 to 59 Years | 153 (59.1%) | 0 (0.0%) |
| 60 to 64 Years | 105 (46.5%) | 0 (0.0%) |
| 65 to 74 Years | 17 (8.9%) | 0 (0.0%) |
| 75 Years and over | 0 (0.0%) | 0 (0.0%) |
| Total | 581 (48.3%) | 0 (0.0%) |
Employment Status by Educational Attainment in Robie Creek
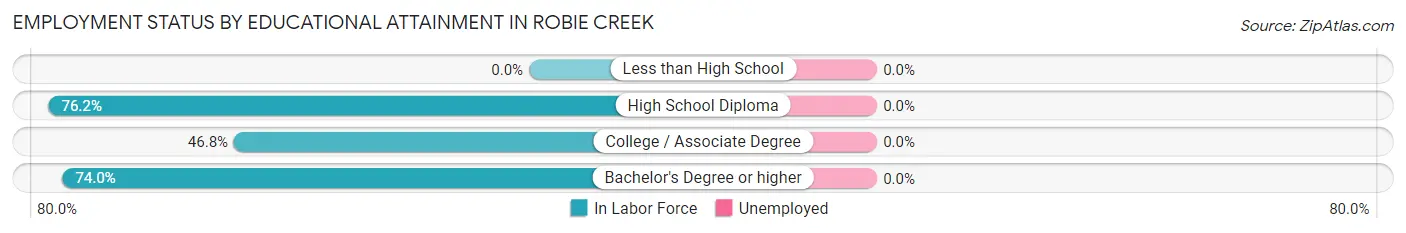
| Educational Attainment | In Labor Force | Unemployed |
| Less than High School | 0 (0.0%) | 0 (0.0%) |
| High School Diploma | 80 (76.2%) | 0 (0.0%) |
| College / Associate Degree | 125 (46.8%) | 0 (0.0%) |
| Bachelor's Degree or higher | 250 (74.0%) | 0 (0.0%) |
| Total | 455 (62.9%) | 0 (0.0%) |
Employment Occupations by Sex in Robie Creek
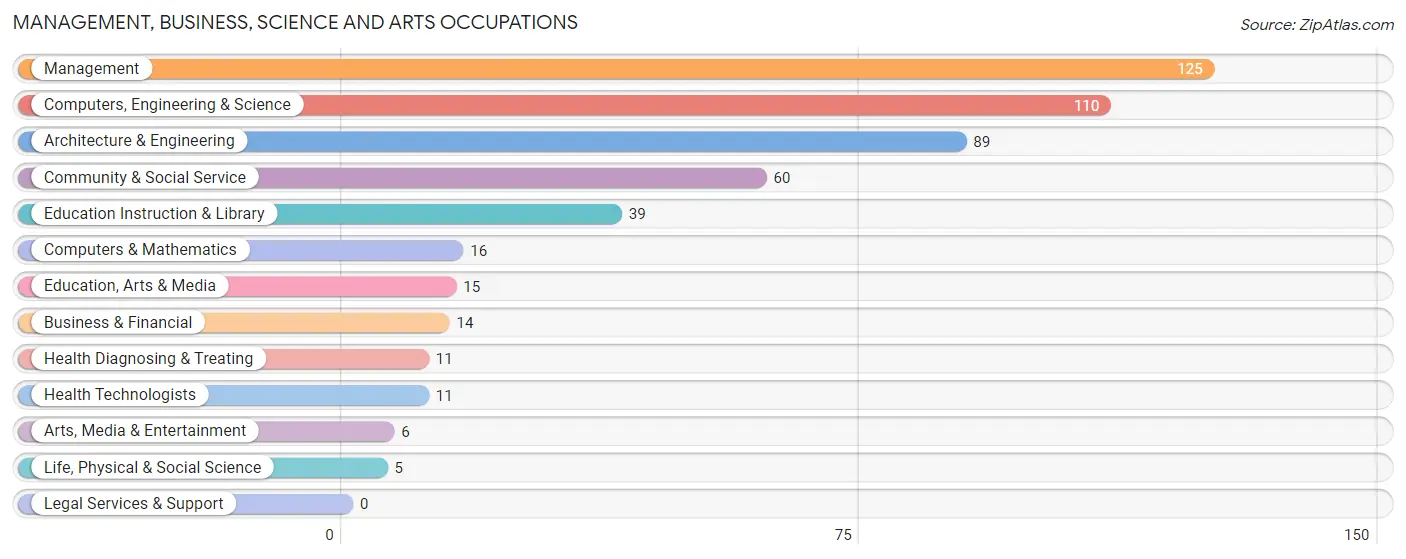
Management, Business, Science and Arts Occupations
The most common Management, Business, Science and Arts occupations in Robie Creek are Management (125 | 21.5%), Computers, Engineering & Science (110 | 18.9%), Architecture & Engineering (89 | 15.3%), Community & Social Service (60 | 10.3%), and Education Instruction & Library (39 | 6.7%).
Management, Business, Science and Arts Occupations by Sex
Within the Management, Business, Science and Arts occupations in Robie Creek, the most male-oriented occupations are Computers & Mathematics (100.0%), Architecture & Engineering (100.0%), and Computers, Engineering & Science (95.5%), while the most female-oriented occupations are Life, Physical & Social Science (100.0%), Education Instruction & Library (100.0%), and Arts, Media & Entertainment (100.0%).
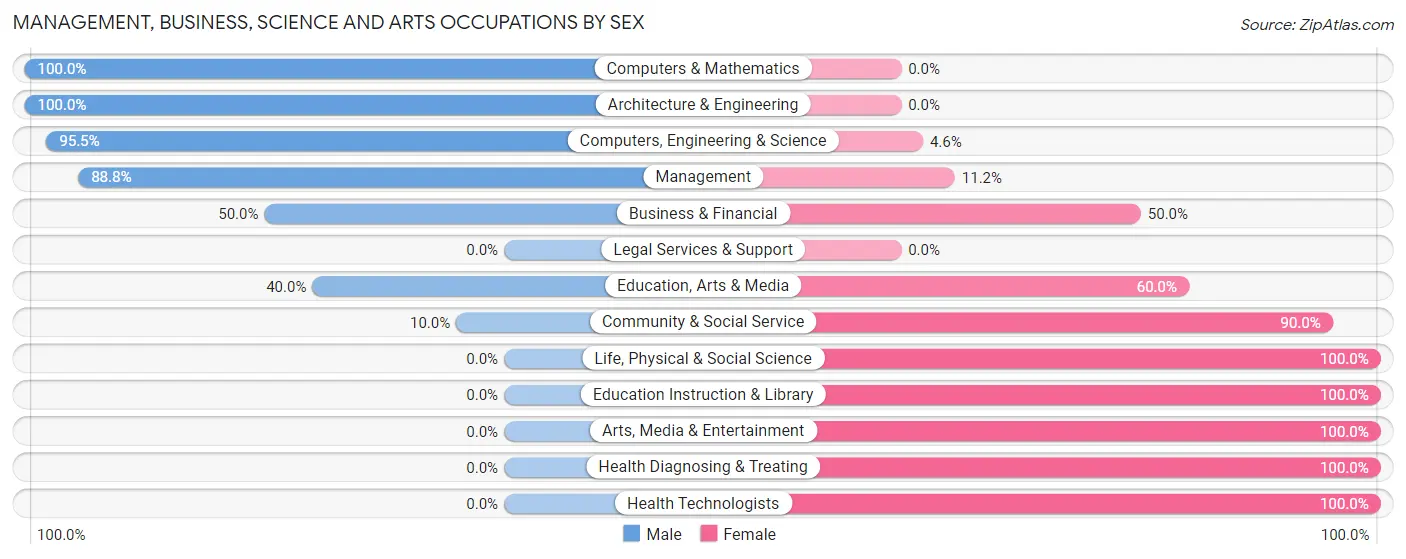
| Occupation | Male | Female |
| Management | 111 (88.8%) | 14 (11.2%) |
| Business & Financial | 7 (50.0%) | 7 (50.0%) |
| Computers, Engineering & Science | 105 (95.5%) | 5 (4.5%) |
| Computers & Mathematics | 16 (100.0%) | 0 (0.0%) |
| Architecture & Engineering | 89 (100.0%) | 0 (0.0%) |
| Life, Physical & Social Science | 0 (0.0%) | 5 (100.0%) |
| Community & Social Service | 6 (10.0%) | 54 (90.0%) |
| Education, Arts & Media | 6 (40.0%) | 9 (60.0%) |
| Legal Services & Support | 0 (0.0%) | 0 (0.0%) |
| Education Instruction & Library | 0 (0.0%) | 39 (100.0%) |
| Arts, Media & Entertainment | 0 (0.0%) | 6 (100.0%) |
| Health Diagnosing & Treating | 0 (0.0%) | 11 (100.0%) |
| Health Technologists | 0 (0.0%) | 11 (100.0%) |
| Total (Category) | 229 (71.6%) | 91 (28.4%) |
| Total (Overall) | 349 (60.1%) | 232 (39.9%) |
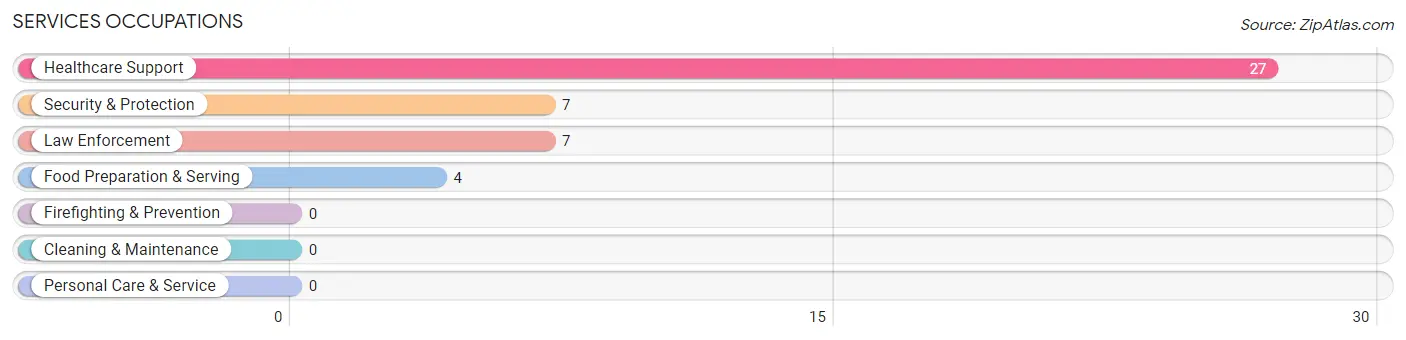
Services Occupations
The most common Services occupations in Robie Creek are Healthcare Support (27 | 4.6%), Security & Protection (7 | 1.2%), Law Enforcement (7 | 1.2%), and Food Preparation & Serving (4 | 0.7%).
Services Occupations by Sex
Within the Services occupations in Robie Creek, the most male-oriented occupations are Security & Protection (100.0%), and Law Enforcement (100.0%), while the most female-oriented occupations are Healthcare Support (100.0%), and Food Preparation & Serving (100.0%).
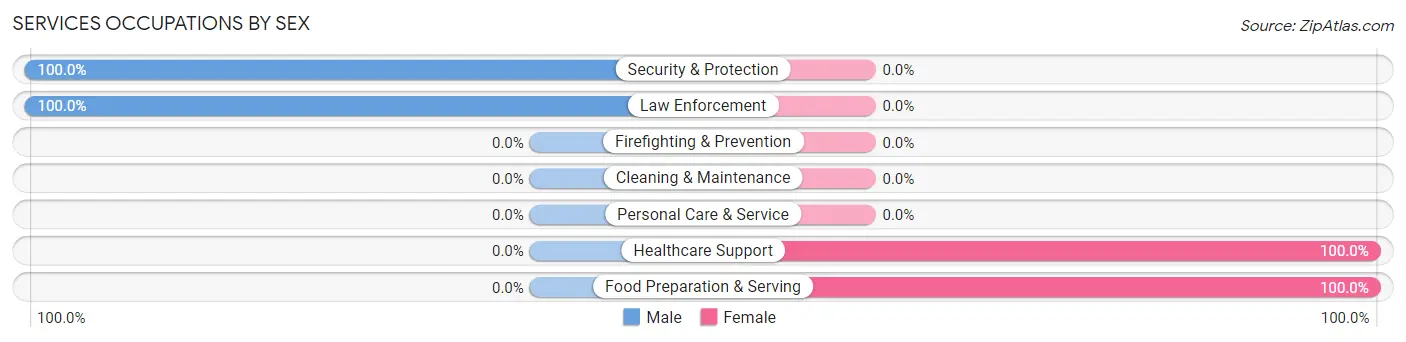
| Occupation | Male | Female |
| Healthcare Support | 0 (0.0%) | 27 (100.0%) |
| Security & Protection | 7 (100.0%) | 0 (0.0%) |
| Firefighting & Prevention | 0 (0.0%) | 0 (0.0%) |
| Law Enforcement | 7 (100.0%) | 0 (0.0%) |
| Food Preparation & Serving | 0 (0.0%) | 4 (100.0%) |
| Cleaning & Maintenance | 0 (0.0%) | 0 (0.0%) |
| Personal Care & Service | 0 (0.0%) | 0 (0.0%) |
| Total (Category) | 7 (18.4%) | 31 (81.6%) |
| Total (Overall) | 349 (60.1%) | 232 (39.9%) |
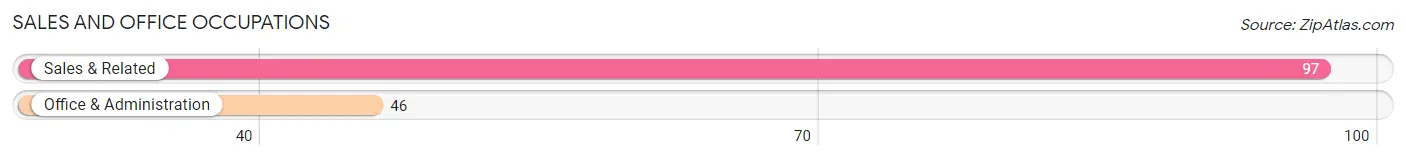
Sales and Office Occupations
The most common Sales and Office occupations in Robie Creek are Sales & Related (97 | 16.7%), and Office & Administration (46 | 7.9%).
Sales and Office Occupations by Sex
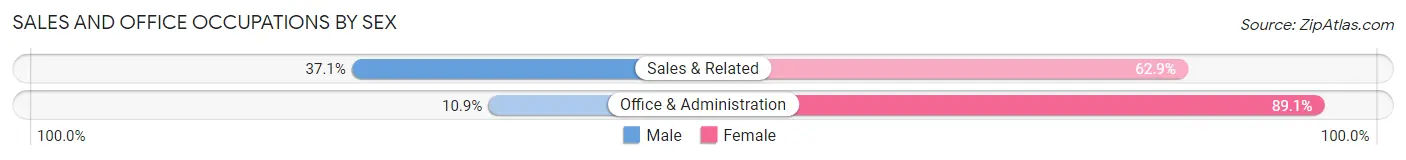
| Occupation | Male | Female |
| Sales & Related | 36 (37.1%) | 61 (62.9%) |
| Office & Administration | 5 (10.9%) | 41 (89.1%) |
| Total (Category) | 41 (28.7%) | 102 (71.3%) |
| Total (Overall) | 349 (60.1%) | 232 (39.9%) |
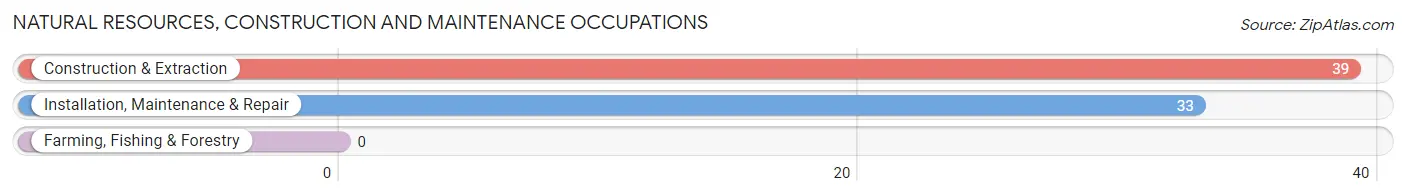
Natural Resources, Construction and Maintenance Occupations
The most common Natural Resources, Construction and Maintenance occupations in Robie Creek are Construction & Extraction (39 | 6.7%), and Installation, Maintenance & Repair (33 | 5.7%).
Natural Resources, Construction and Maintenance Occupations by Sex
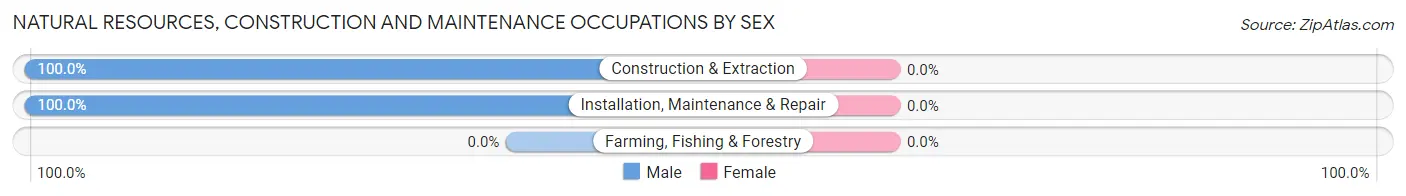
| Occupation | Male | Female |
| Farming, Fishing & Forestry | 0 (0.0%) | 0 (0.0%) |
| Construction & Extraction | 39 (100.0%) | 0 (0.0%) |
| Installation, Maintenance & Repair | 33 (100.0%) | 0 (0.0%) |
| Total (Category) | 72 (100.0%) | 0 (0.0%) |
| Total (Overall) | 349 (60.1%) | 232 (39.9%) |
Production, Transportation and Moving Occupations
The most common Production, Transportation and Moving occupations in Robie Creek are , and Production (8 | 1.4%).
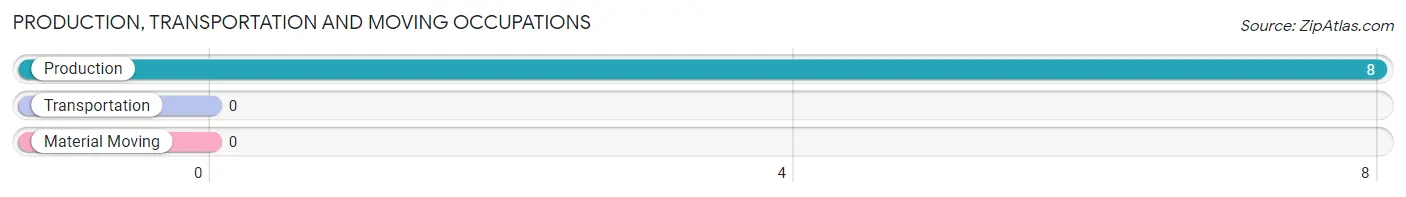
Production, Transportation and Moving Occupations by Sex
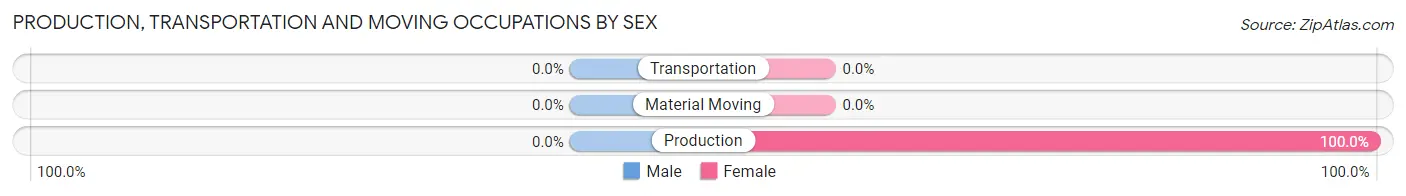
| Occupation | Male | Female |
| Production | 0 (0.0%) | 8 (100.0%) |
| Transportation | 0 (0.0%) | 0 (0.0%) |
| Material Moving | 0 (0.0%) | 0 (0.0%) |
| Total (Category) | 0 (0.0%) | 8 (100.0%) |
| Total (Overall) | 349 (60.1%) | 232 (39.9%) |
Employment Industries by Sex in Robie Creek
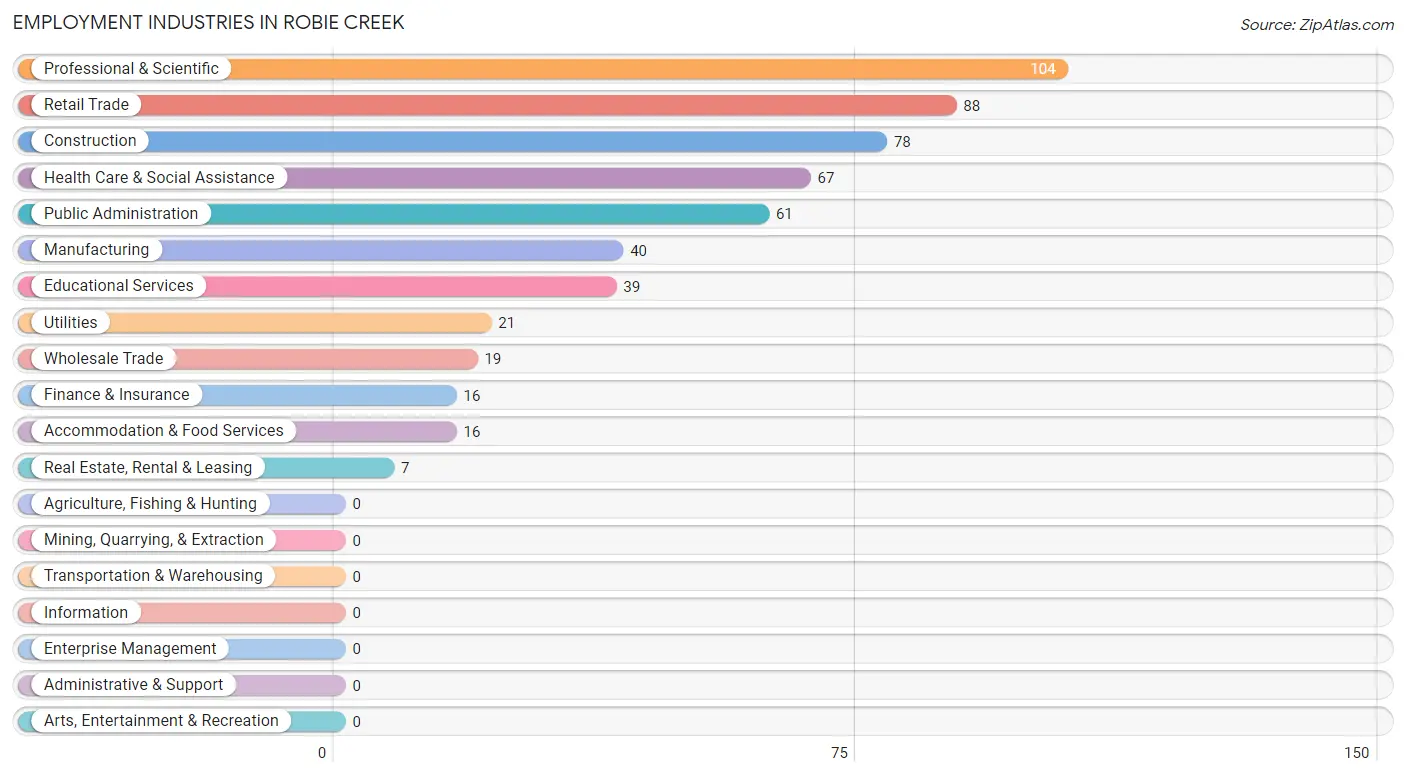
Employment Industries in Robie Creek
The major employment industries in Robie Creek include Professional & Scientific (104 | 17.9%), Retail Trade (88 | 15.1%), Construction (78 | 13.4%), Health Care & Social Assistance (67 | 11.5%), and Public Administration (61 | 10.5%).
Employment Industries by Sex in Robie Creek
The Robie Creek industries that see more men than women are Construction (100.0%), Wholesale Trade (100.0%), and Finance & Insurance (100.0%), whereas the industries that tend to have a higher number of women are Utilities (100.0%), Real Estate, Rental & Leasing (100.0%), and Educational Services (100.0%).
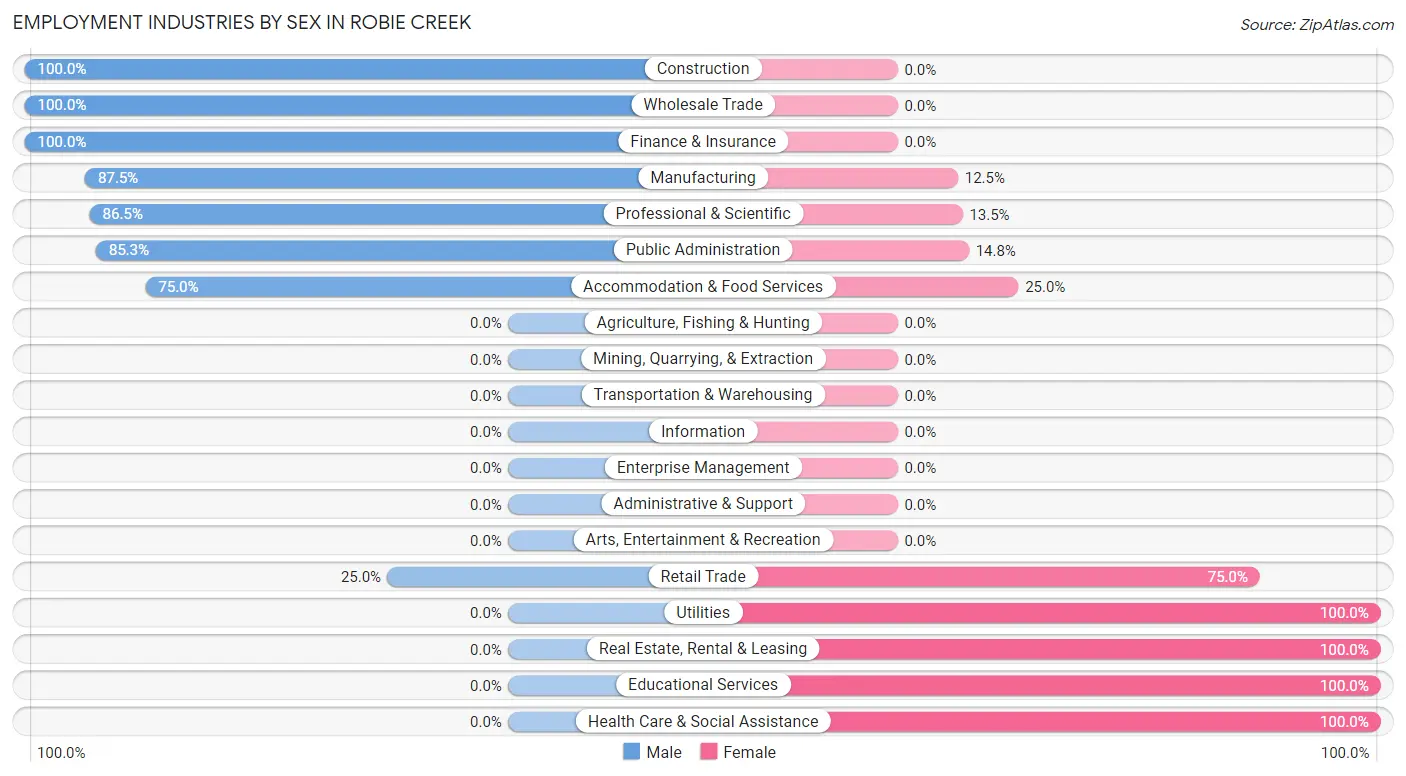
| Industry | Male | Female |
| Agriculture, Fishing & Hunting | 0 (0.0%) | 0 (0.0%) |
| Mining, Quarrying, & Extraction | 0 (0.0%) | 0 (0.0%) |
| Construction | 78 (100.0%) | 0 (0.0%) |
| Manufacturing | 35 (87.5%) | 5 (12.5%) |
| Wholesale Trade | 19 (100.0%) | 0 (0.0%) |
| Retail Trade | 22 (25.0%) | 66 (75.0%) |
| Transportation & Warehousing | 0 (0.0%) | 0 (0.0%) |
| Utilities | 0 (0.0%) | 21 (100.0%) |
| Information | 0 (0.0%) | 0 (0.0%) |
| Finance & Insurance | 16 (100.0%) | 0 (0.0%) |
| Real Estate, Rental & Leasing | 0 (0.0%) | 7 (100.0%) |
| Professional & Scientific | 90 (86.5%) | 14 (13.5%) |
| Enterprise Management | 0 (0.0%) | 0 (0.0%) |
| Administrative & Support | 0 (0.0%) | 0 (0.0%) |
| Educational Services | 0 (0.0%) | 39 (100.0%) |
| Health Care & Social Assistance | 0 (0.0%) | 67 (100.0%) |
| Arts, Entertainment & Recreation | 0 (0.0%) | 0 (0.0%) |
| Accommodation & Food Services | 12 (75.0%) | 4 (25.0%) |
| Public Administration | 52 (85.3%) | 9 (14.7%) |
| Total | 349 (60.1%) | 232 (39.9%) |
Education in Robie Creek
School Enrollment in Robie Creek
The most common levels of schooling among the 184 students in Robie Creek are high school (83 | 45.1%), college / undergraduate (53 | 28.8%), and elementary school (24 | 13.0%).
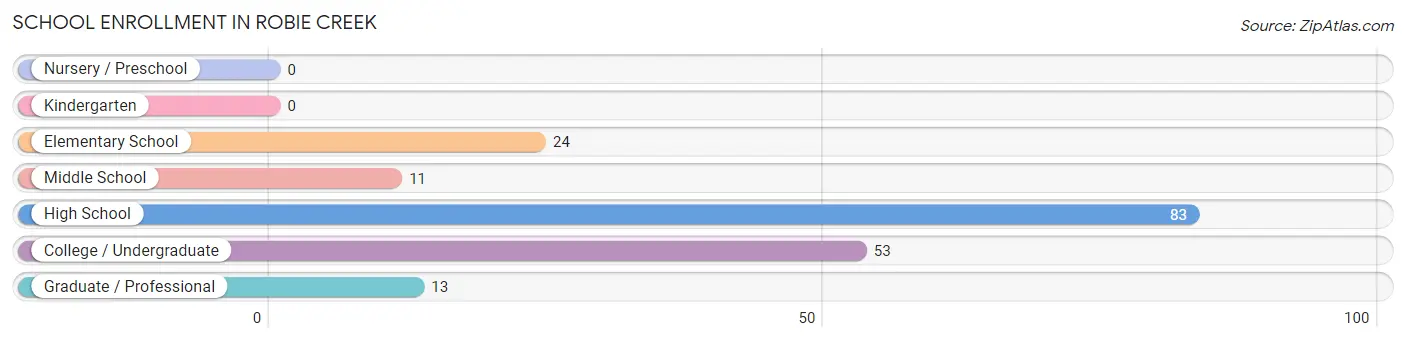
| School Level | # Students | % Students |
| Nursery / Preschool | 0 | 0.0% |
| Kindergarten | 0 | 0.0% |
| Elementary School | 24 | 13.0% |
| Middle School | 11 | 6.0% |
| High School | 83 | 45.1% |
| College / Undergraduate | 53 | 28.8% |
| Graduate / Professional | 13 | 7.1% |
| Total | 184 | 100.0% |
School Enrollment by Age by Funding Source in Robie Creek
Out of a total of 184 students who are enrolled in schools in Robie Creek, 13 (7.1%) attend a private institution, while the remaining 171 (92.9%) are enrolled in public schools. The age group of 35 years and over has the highest likelihood of being enrolled in private schools, with 13 (26.0% in the age bracket) enrolled. Conversely, the age group of 5 to 9 year old has the lowest likelihood of being enrolled in a private school, with 24 (100.0% in the age bracket) attending a public institution.
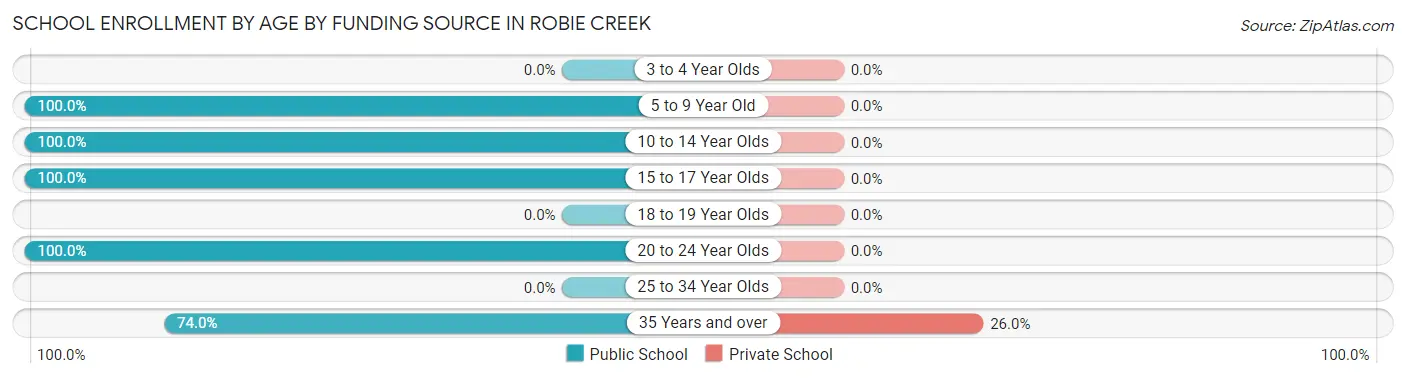
| Age Bracket | Public School | Private School |
| 3 to 4 Year Olds | 0 (0.0%) | 0 (0.0%) |
| 5 to 9 Year Old | 24 (100.0%) | 0 (0.0%) |
| 10 to 14 Year Olds | 11 (100.0%) | 0 (0.0%) |
| 15 to 17 Year Olds | 83 (100.0%) | 0 (0.0%) |
| 18 to 19 Year Olds | 0 (0.0%) | 0 (0.0%) |
| 20 to 24 Year Olds | 16 (100.0%) | 0 (0.0%) |
| 25 to 34 Year Olds | 0 (0.0%) | 0 (0.0%) |
| 35 Years and over | 37 (74.0%) | 13 (26.0%) |
| Total | 171 (92.9%) | 13 (7.1%) |
Educational Attainment by Field of Study in Robie Creek
Education (117 | 25.8%), arts & humanities (72 | 15.9%), literature & languages (61 | 13.4%), engineering (57 | 12.6%), and business (45 | 9.9%) are the most common fields of study among 454 individuals in Robie Creek who have obtained a bachelor's degree or higher.
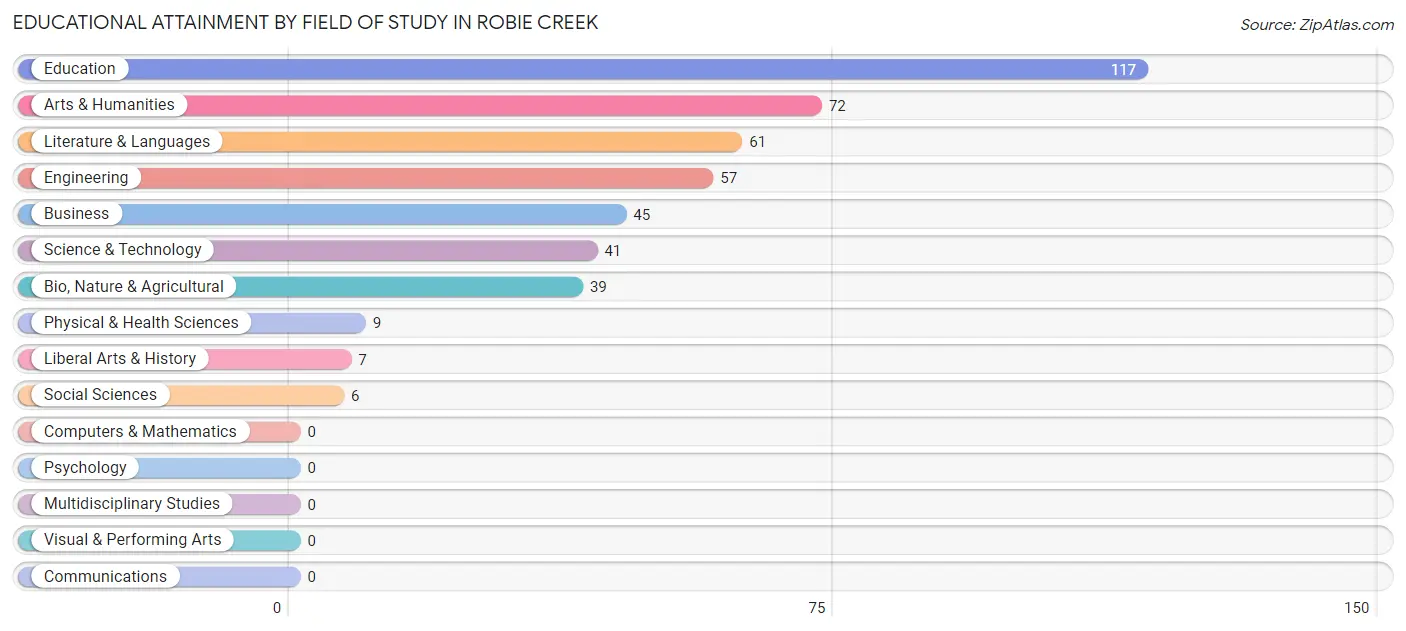
| Field of Study | # Graduates | % Graduates |
| Computers & Mathematics | 0 | 0.0% |
| Bio, Nature & Agricultural | 39 | 8.6% |
| Physical & Health Sciences | 9 | 2.0% |
| Psychology | 0 | 0.0% |
| Social Sciences | 6 | 1.3% |
| Engineering | 57 | 12.6% |
| Multidisciplinary Studies | 0 | 0.0% |
| Science & Technology | 41 | 9.0% |
| Business | 45 | 9.9% |
| Education | 117 | 25.8% |
| Literature & Languages | 61 | 13.4% |
| Liberal Arts & History | 7 | 1.5% |
| Visual & Performing Arts | 0 | 0.0% |
| Communications | 0 | 0.0% |
| Arts & Humanities | 72 | 15.9% |
| Total | 454 | 100.0% |
Transportation & Commute in Robie Creek
Vehicle Availability by Sex in Robie Creek
The most prevalent vehicle ownership categories in Robie Creek are males with 3 vehicles (101, accounting for 28.9%) and females with 3 vehicles (38, making up 44.5%).
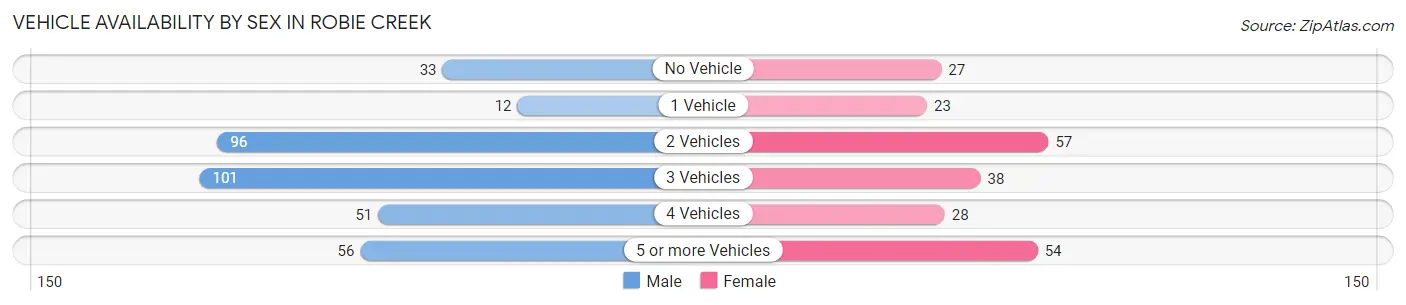
| Vehicles Available | Male | Female |
| No Vehicle | 33 (9.5%) | 27 (11.9%) |
| 1 Vehicle | 12 (3.4%) | 23 (10.1%) |
| 2 Vehicles | 96 (27.5%) | 57 (25.1%) |
| 3 Vehicles | 101 (28.9%) | 38 (16.7%) |
| 4 Vehicles | 51 (14.6%) | 28 (12.3%) |
| 5 or more Vehicles | 56 (16.1%) | 54 (23.8%) |
| Total | 349 (100.0%) | 227 (100.0%) |
Commute Time in Robie Creek
The most frequently occuring commute durations in Robie Creek are 45 to 59 minutes (123 commuters, 23.0%), 35 to 39 minutes (117 commuters, 21.8%), and 25 to 29 minutes (113 commuters, 21.1%).
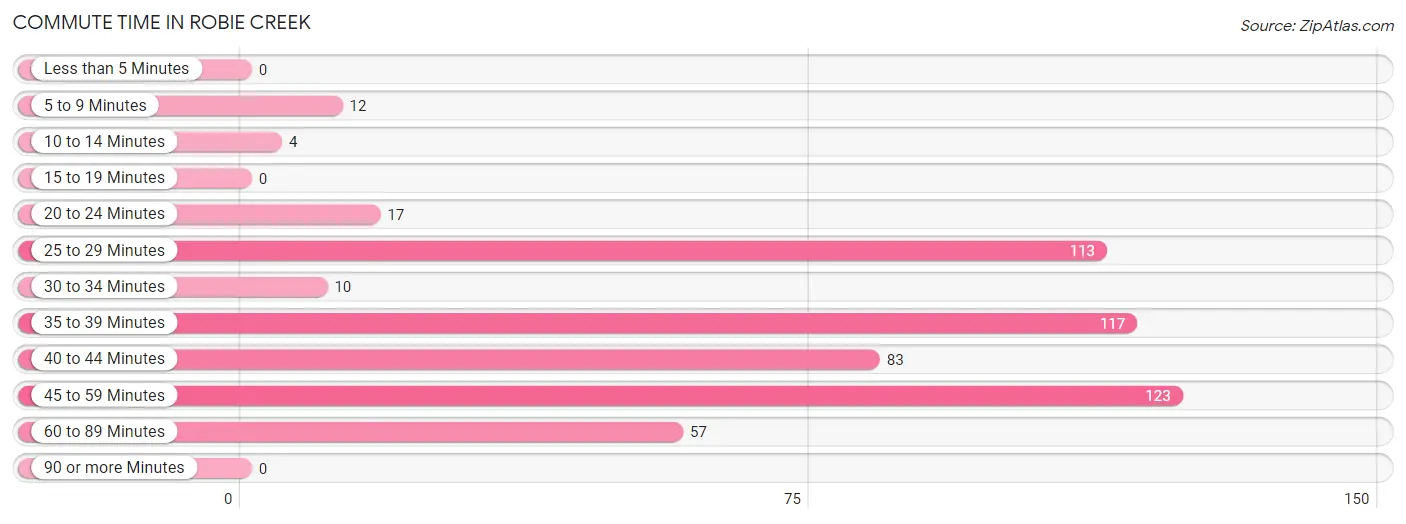
| Commute Time | # Commuters | % Commuters |
| Less than 5 Minutes | 0 | 0.0% |
| 5 to 9 Minutes | 12 | 2.2% |
| 10 to 14 Minutes | 4 | 0.7% |
| 15 to 19 Minutes | 0 | 0.0% |
| 20 to 24 Minutes | 17 | 3.2% |
| 25 to 29 Minutes | 113 | 21.1% |
| 30 to 34 Minutes | 10 | 1.9% |
| 35 to 39 Minutes | 117 | 21.8% |
| 40 to 44 Minutes | 83 | 15.5% |
| 45 to 59 Minutes | 123 | 23.0% |
| 60 to 89 Minutes | 57 | 10.6% |
| 90 or more Minutes | 0 | 0.0% |
Commute Time by Sex in Robie Creek
The most common commute times in Robie Creek are 25 to 29 minutes (80 commuters, 25.0%) for males and 35 to 39 minutes (89 commuters, 41.2%) for females.
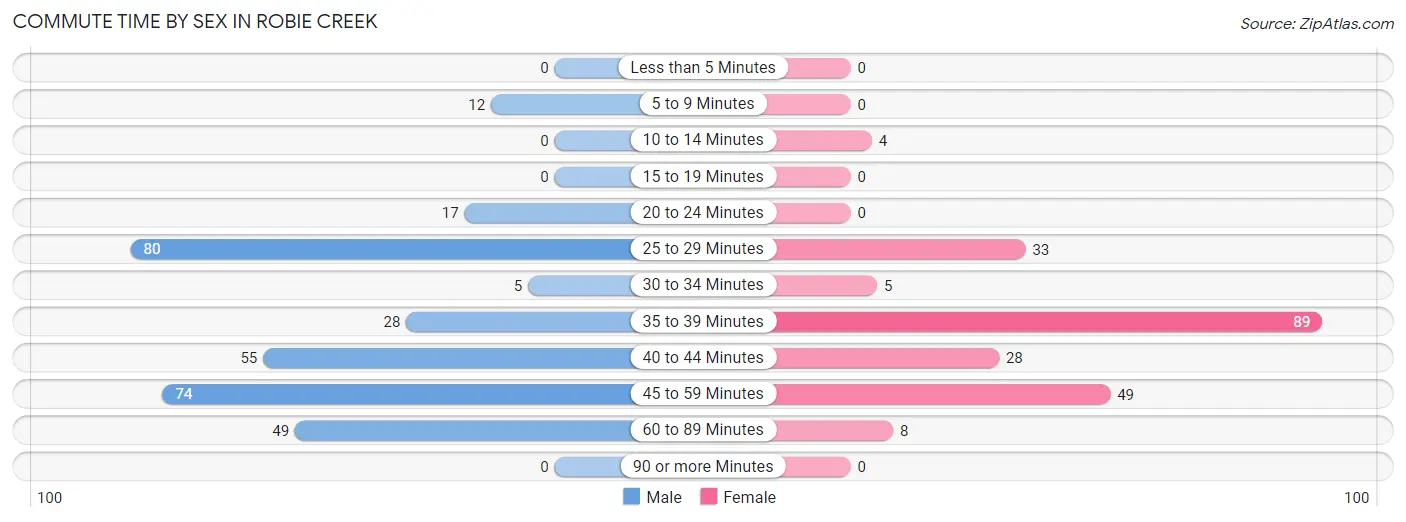
| Commute Time | Male | Female |
| Less than 5 Minutes | 0 (0.0%) | 0 (0.0%) |
| 5 to 9 Minutes | 12 (3.7%) | 0 (0.0%) |
| 10 to 14 Minutes | 0 (0.0%) | 4 (1.8%) |
| 15 to 19 Minutes | 0 (0.0%) | 0 (0.0%) |
| 20 to 24 Minutes | 17 (5.3%) | 0 (0.0%) |
| 25 to 29 Minutes | 80 (25.0%) | 33 (15.3%) |
| 30 to 34 Minutes | 5 (1.6%) | 5 (2.3%) |
| 35 to 39 Minutes | 28 (8.7%) | 89 (41.2%) |
| 40 to 44 Minutes | 55 (17.2%) | 28 (13.0%) |
| 45 to 59 Minutes | 74 (23.1%) | 49 (22.7%) |
| 60 to 89 Minutes | 49 (15.3%) | 8 (3.7%) |
| 90 or more Minutes | 0 (0.0%) | 0 (0.0%) |
Time of Departure to Work by Sex in Robie Creek
The most frequent times of departure to work in Robie Creek are 7:00 AM to 7:29 AM (84, 26.3%) for males and 6:00 AM to 6:29 AM (86, 39.8%) for females.
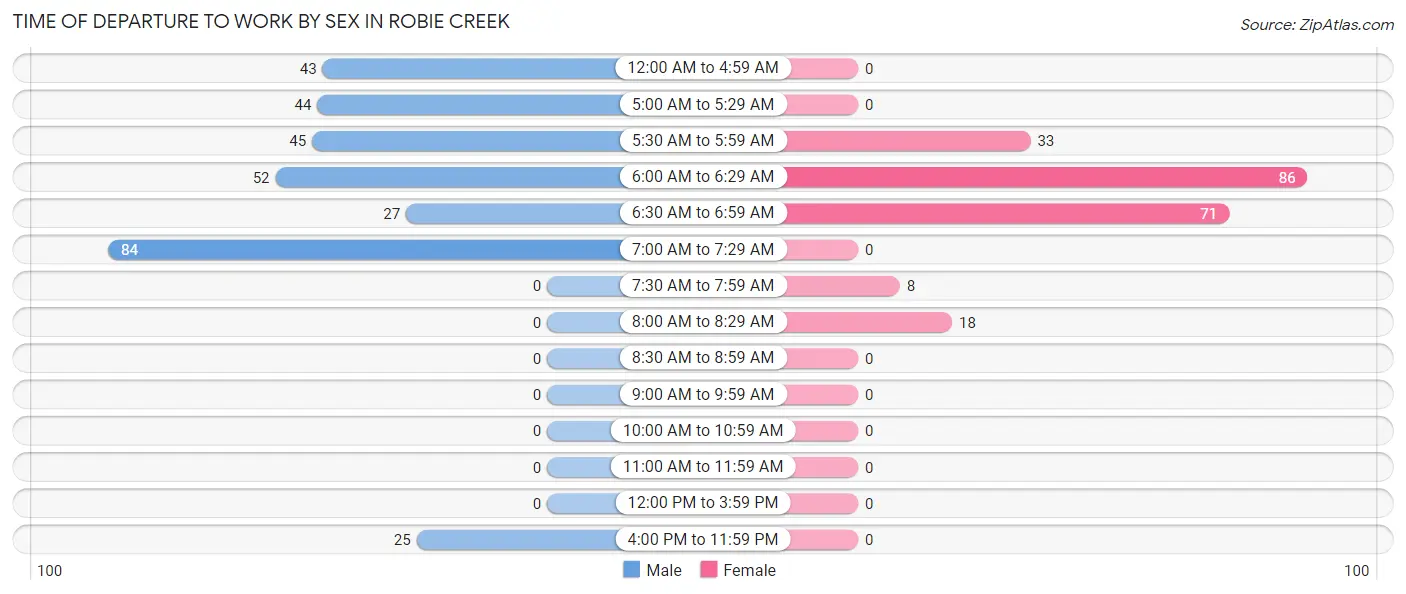
| Time of Departure | Male | Female |
| 12:00 AM to 4:59 AM | 43 (13.4%) | 0 (0.0%) |
| 5:00 AM to 5:29 AM | 44 (13.8%) | 0 (0.0%) |
| 5:30 AM to 5:59 AM | 45 (14.1%) | 33 (15.3%) |
| 6:00 AM to 6:29 AM | 52 (16.3%) | 86 (39.8%) |
| 6:30 AM to 6:59 AM | 27 (8.4%) | 71 (32.9%) |
| 7:00 AM to 7:29 AM | 84 (26.3%) | 0 (0.0%) |
| 7:30 AM to 7:59 AM | 0 (0.0%) | 8 (3.7%) |
| 8:00 AM to 8:29 AM | 0 (0.0%) | 18 (8.3%) |
| 8:30 AM to 8:59 AM | 0 (0.0%) | 0 (0.0%) |
| 9:00 AM to 9:59 AM | 0 (0.0%) | 0 (0.0%) |
| 10:00 AM to 10:59 AM | 0 (0.0%) | 0 (0.0%) |
| 11:00 AM to 11:59 AM | 0 (0.0%) | 0 (0.0%) |
| 12:00 PM to 3:59 PM | 0 (0.0%) | 0 (0.0%) |
| 4:00 PM to 11:59 PM | 25 (7.8%) | 0 (0.0%) |
| Total | 320 (100.0%) | 216 (100.0%) |
Housing Occupancy in Robie Creek
Occupancy by Ownership in Robie Creek
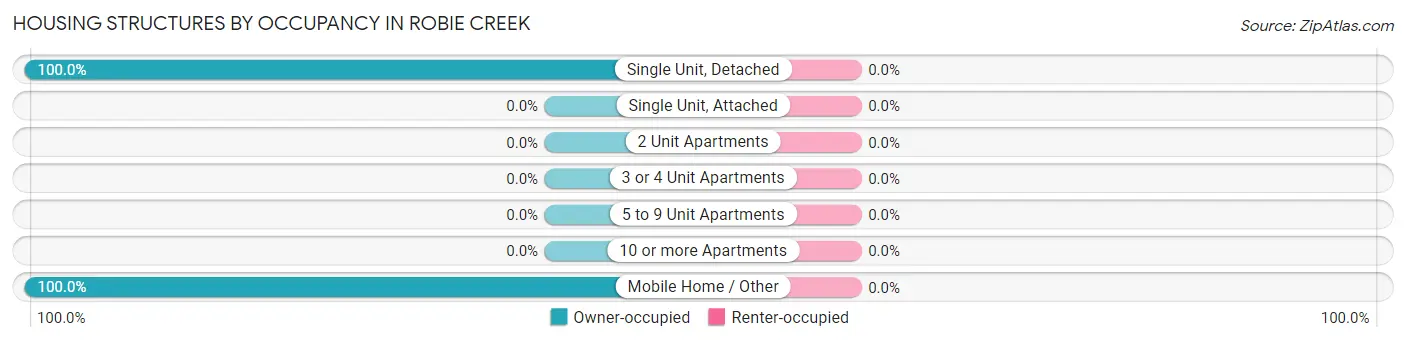
Of the total 495 dwellings in Robie Creek, owner-occupied units account for 495 (100.0%), while renter-occupied units make up 0 (0.0%).
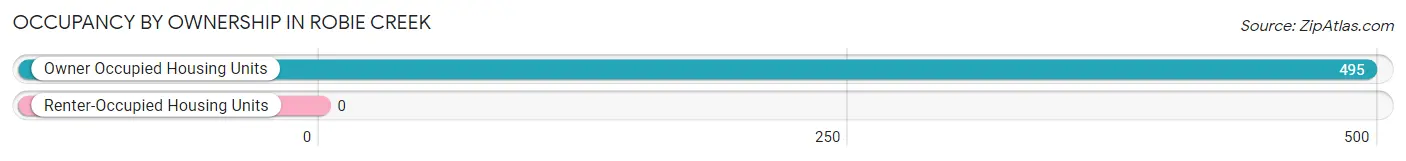
| Occupancy | # Housing Units | % Housing Units |
| Owner Occupied Housing Units | 495 | 100.0% |
| Renter-Occupied Housing Units | 0 | 0.0% |
| Total Occupied Housing Units | 495 | 100.0% |
Occupancy by Household Size in Robie Creek
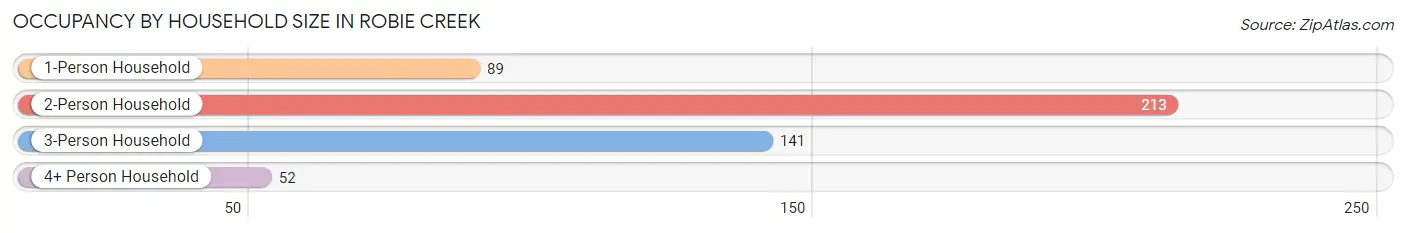
| Household Size | # Housing Units | % Housing Units |
| 1-Person Household | 89 | 18.0% |
| 2-Person Household | 213 | 43.0% |
| 3-Person Household | 141 | 28.5% |
| 4+ Person Household | 52 | 10.5% |
| Total Housing Units | 495 | 100.0% |
Occupancy by Ownership by Household Size in Robie Creek
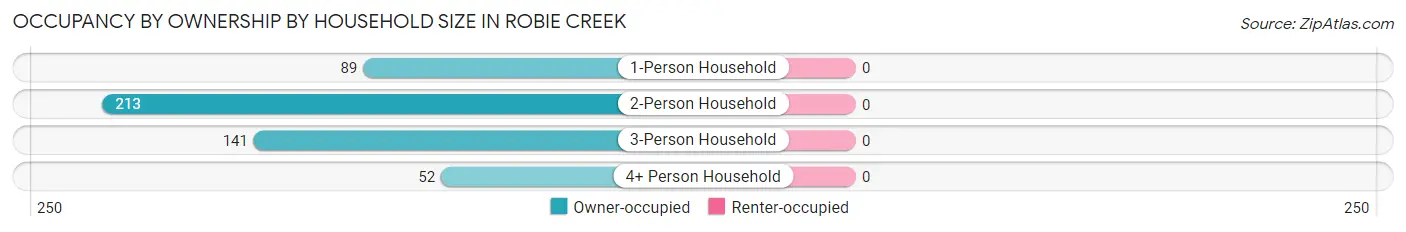
| Household Size | Owner-occupied | Renter-occupied |
| 1-Person Household | 89 (100.0%) | 0 (0.0%) |
| 2-Person Household | 213 (100.0%) | 0 (0.0%) |
| 3-Person Household | 141 (100.0%) | 0 (0.0%) |
| 4+ Person Household | 52 (100.0%) | 0 (0.0%) |
| Total Housing Units | 495 (100.0%) | 0 (0.0%) |
Occupancy by Educational Attainment in Robie Creek
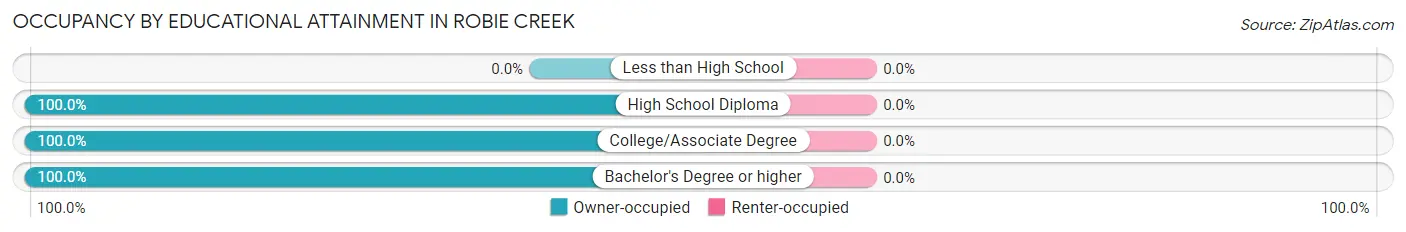
| Household Size | Owner-occupied | Renter-occupied |
| Less than High School | 0 (0.0%) | 0 (0.0%) |
| High School Diploma | 75 (100.0%) | 0 (0.0%) |
| College/Associate Degree | 208 (100.0%) | 0 (0.0%) |
| Bachelor's Degree or higher | 212 (100.0%) | 0 (0.0%) |
Occupancy by Age of Householder in Robie Creek
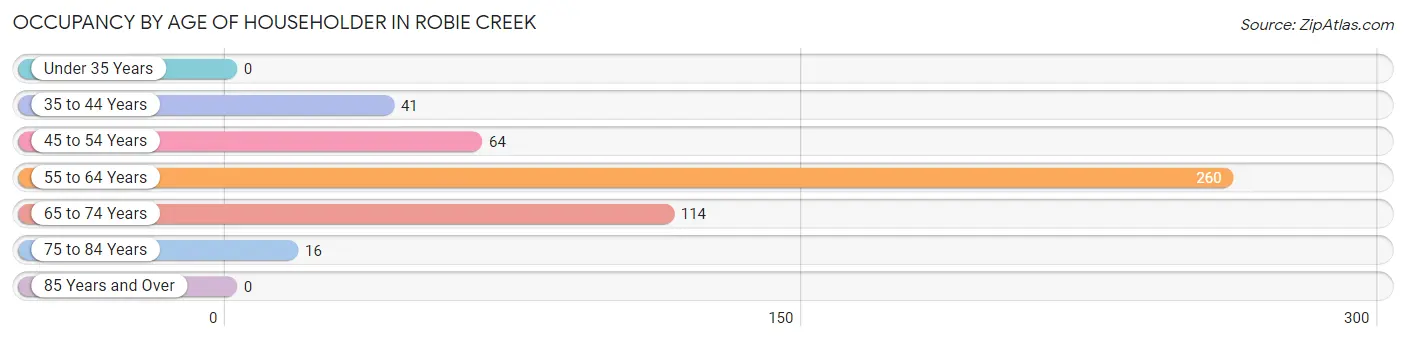
| Age Bracket | # Households | % Households |
| Under 35 Years | 0 | 0.0% |
| 35 to 44 Years | 41 | 8.3% |
| 45 to 54 Years | 64 | 12.9% |
| 55 to 64 Years | 260 | 52.5% |
| 65 to 74 Years | 114 | 23.0% |
| 75 to 84 Years | 16 | 3.2% |
| 85 Years and Over | 0 | 0.0% |
| Total | 495 | 100.0% |
Housing Finances in Robie Creek
Median Income by Occupancy in Robie Creek
| Occupancy Type | # Households | Median Income |
| Owner-Occupied | 495 (100.0%) | $117,422 |
| Renter-Occupied | 0 (0.0%) | $0 |
| Average | 495 (100.0%) | $117,422 |
Occupancy by Householder Income Bracket in Robie Creek
| Income Bracket | Owner-occupied | Renter-occupied |
| Less than $5,000 | 0 (0.0%) | 0 (0.0%) |
| $5,000 to $9,999 | 0 (0.0%) | 0 (0.0%) |
| $10,000 to $14,999 | 0 (0.0%) | 0 (0.0%) |
| $15,000 to $19,999 | 0 (0.0%) | 0 (0.0%) |
| $20,000 to $24,999 | 48 (9.7%) | 0 (0.0%) |
| $25,000 to $34,999 | 41 (8.3%) | 0 (0.0%) |
| $35,000 to $49,999 | 21 (4.2%) | 0 (0.0%) |
| $50,000 to $74,999 | 12 (2.4%) | 0 (0.0%) |
| $75,000 to $99,999 | 85 (17.2%) | 0 (0.0%) |
| $100,000 to $149,999 | 144 (29.1%) | 0 (0.0%) |
| $150,000 or more | 144 (29.1%) | 0 (0.0%) |
| Total | 495 (100.0%) | 0 (0.0%) |
Monthly Housing Cost Tiers in Robie Creek
| Monthly Cost | Owner-occupied | Renter-occupied |
| Less than $300 | 16 (3.2%) | 0 (0.0%) |
| $300 to $499 | 23 (4.6%) | 0 (0.0%) |
| $500 to $799 | 63 (12.7%) | 0 (0.0%) |
| $800 to $999 | 29 (5.9%) | 0 (0.0%) |
| $1,000 to $1,499 | 69 (13.9%) | 0 (0.0%) |
| $1,500 to $1,999 | 165 (33.3%) | 0 (0.0%) |
| $2,000 to $2,499 | 45 (9.1%) | 0 (0.0%) |
| $2,500 to $2,999 | 41 (8.3%) | 0 (0.0%) |
| $3,000 or more | 44 (8.9%) | 0 (0.0%) |
| Total | 495 (100.0%) | 0 (0.0%) |
Physical Housing Characteristics in Robie Creek
Housing Structures in Robie Creek
| Structure Type | # Housing Units | % Housing Units |
| Single Unit, Detached | 472 | 95.4% |
| Single Unit, Attached | 0 | 0.0% |
| 2 Unit Apartments | 0 | 0.0% |
| 3 or 4 Unit Apartments | 0 | 0.0% |
| 5 to 9 Unit Apartments | 0 | 0.0% |
| 10 or more Apartments | 0 | 0.0% |
| Mobile Home / Other | 23 | 4.6% |
| Total | 495 | 100.0% |
Housing Structures by Occupancy in Robie Creek
| Structure Type | Owner-occupied | Renter-occupied |
| Single Unit, Detached | 472 (100.0%) | 0 (0.0%) |
| Single Unit, Attached | 0 (0.0%) | 0 (0.0%) |
| 2 Unit Apartments | 0 (0.0%) | 0 (0.0%) |
| 3 or 4 Unit Apartments | 0 (0.0%) | 0 (0.0%) |
| 5 to 9 Unit Apartments | 0 (0.0%) | 0 (0.0%) |
| 10 or more Apartments | 0 (0.0%) | 0 (0.0%) |
| Mobile Home / Other | 23 (100.0%) | 0 (0.0%) |
| Total | 495 (100.0%) | 0 (0.0%) |
Housing Structures by Number of Rooms in Robie Creek
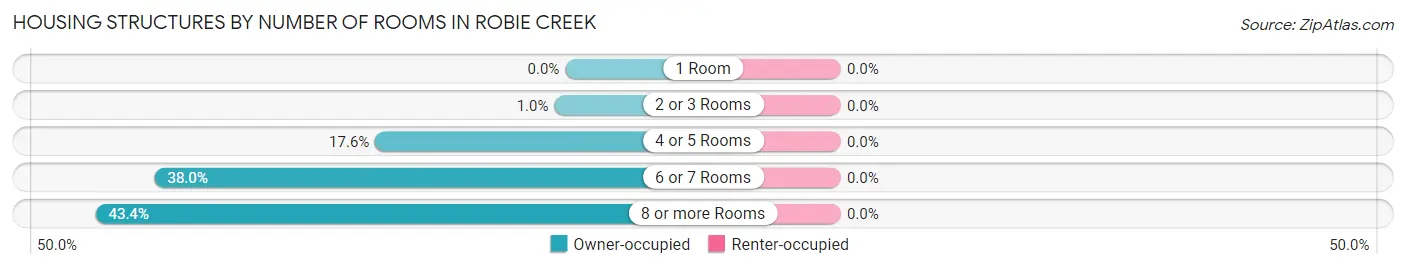
| Number of Rooms | Owner-occupied | Renter-occupied |
| 1 Room | 0 (0.0%) | 0 (0.0%) |
| 2 or 3 Rooms | 5 (1.0%) | 0 (0.0%) |
| 4 or 5 Rooms | 87 (17.6%) | 0 (0.0%) |
| 6 or 7 Rooms | 188 (38.0%) | 0 (0.0%) |
| 8 or more Rooms | 215 (43.4%) | 0 (0.0%) |
| Total | 495 (100.0%) | 0 (0.0%) |
Housing Structure by Heating Type in Robie Creek
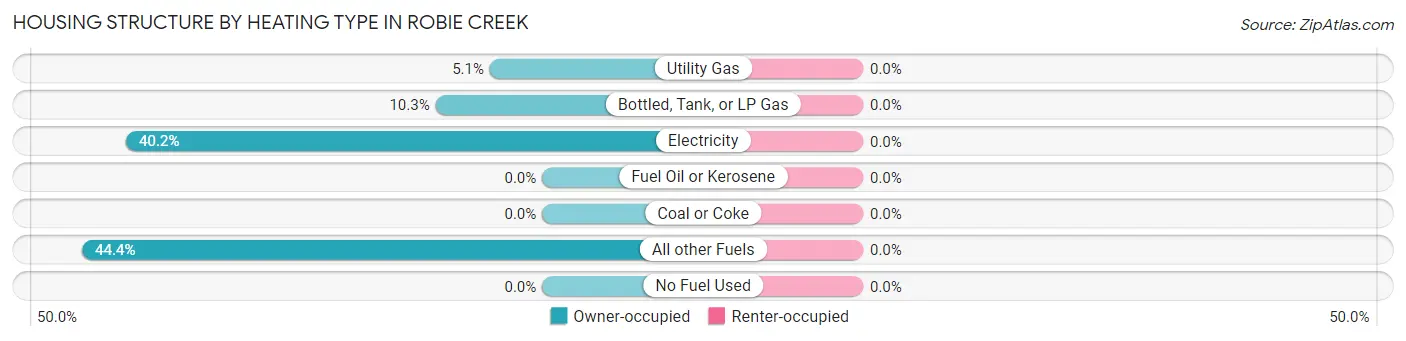
| Heating Type | Owner-occupied | Renter-occupied |
| Utility Gas | 25 (5.1%) | 0 (0.0%) |
| Bottled, Tank, or LP Gas | 51 (10.3%) | 0 (0.0%) |
| Electricity | 199 (40.2%) | 0 (0.0%) |
| Fuel Oil or Kerosene | 0 (0.0%) | 0 (0.0%) |
| Coal or Coke | 0 (0.0%) | 0 (0.0%) |
| All other Fuels | 220 (44.4%) | 0 (0.0%) |
| No Fuel Used | 0 (0.0%) | 0 (0.0%) |
| Total | 495 (100.0%) | 0 (0.0%) |
Household Vehicle Usage in Robie Creek
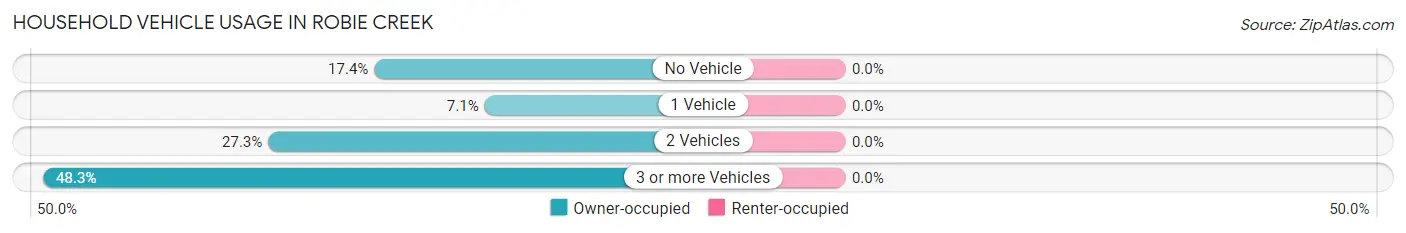
| Vehicles per Household | Owner-occupied | Renter-occupied |
| No Vehicle | 86 (17.4%) | 0 (0.0%) |
| 1 Vehicle | 35 (7.1%) | 0 (0.0%) |
| 2 Vehicles | 135 (27.3%) | 0 (0.0%) |
| 3 or more Vehicles | 239 (48.3%) | 0 (0.0%) |
| Total | 495 (100.0%) | 0 (0.0%) |
Real Estate & Mortgages in Robie Creek
Real Estate and Mortgage Overview in Robie Creek
| Characteristic | Without Mortgage | With Mortgage |
| Housing Units | 128 | 367 |
| Median Property Value | $423,300 | $551,100 |
| Median Household Income | $112,857 | $113 |
| Monthly Housing Costs | $569 | $44 |
| Real Estate Taxes | $2,161 | $0 |
Property Value by Mortgage Status in Robie Creek
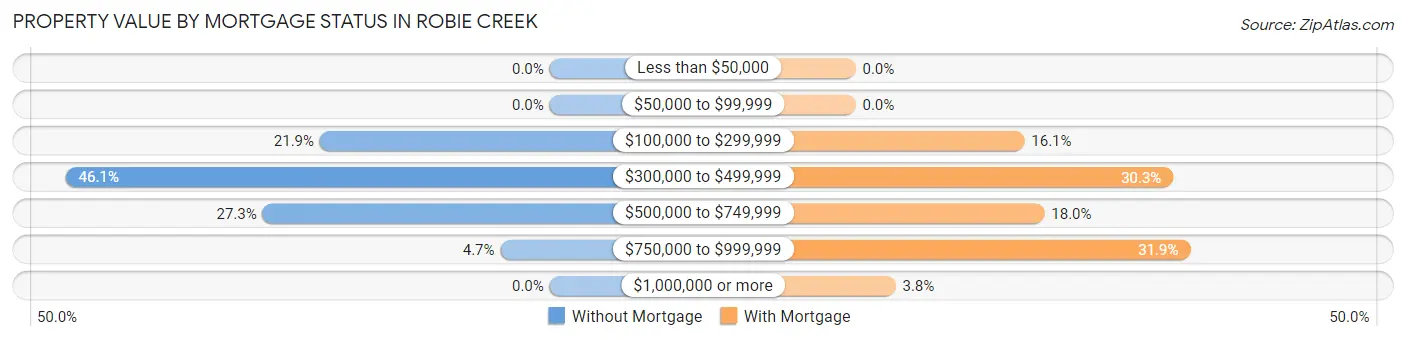
| Property Value | Without Mortgage | With Mortgage |
| Less than $50,000 | 0 (0.0%) | 0 (0.0%) |
| $50,000 to $99,999 | 0 (0.0%) | 0 (0.0%) |
| $100,000 to $299,999 | 28 (21.9%) | 59 (16.1%) |
| $300,000 to $499,999 | 59 (46.1%) | 111 (30.2%) |
| $500,000 to $749,999 | 35 (27.3%) | 66 (18.0%) |
| $750,000 to $999,999 | 6 (4.7%) | 117 (31.9%) |
| $1,000,000 or more | 0 (0.0%) | 14 (3.8%) |
| Total | 128 (100.0%) | 367 (100.0%) |
Household Income by Mortgage Status in Robie Creek
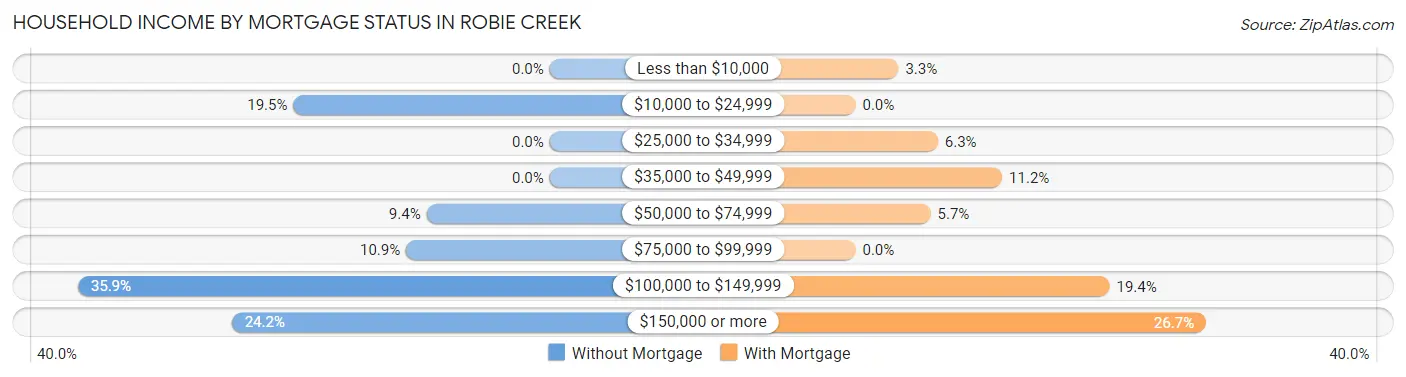
| Household Income | Without Mortgage | With Mortgage |
| Less than $10,000 | 0 (0.0%) | 12 (3.3%) |
| $10,000 to $24,999 | 25 (19.5%) | 0 (0.0%) |
| $25,000 to $34,999 | 0 (0.0%) | 23 (6.3%) |
| $35,000 to $49,999 | 0 (0.0%) | 41 (11.2%) |
| $50,000 to $74,999 | 12 (9.4%) | 21 (5.7%) |
| $75,000 to $99,999 | 14 (10.9%) | 0 (0.0%) |
| $100,000 to $149,999 | 46 (35.9%) | 71 (19.4%) |
| $150,000 or more | 31 (24.2%) | 98 (26.7%) |
| Total | 128 (100.0%) | 367 (100.0%) |
Property Value to Household Income Ratio in Robie Creek
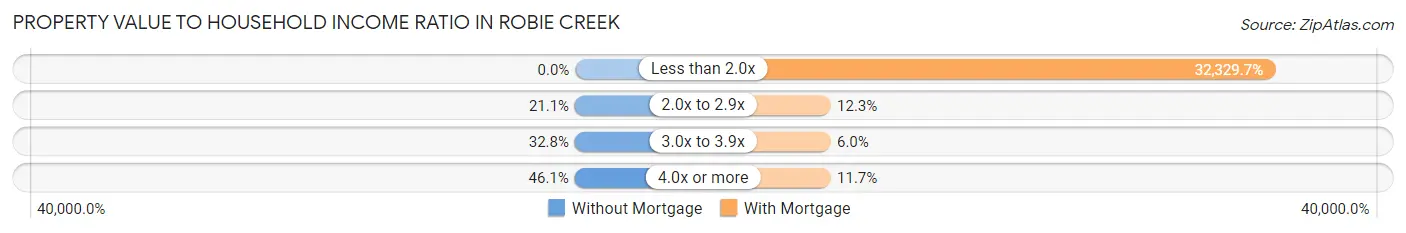
| Value-to-Income Ratio | Without Mortgage | With Mortgage |
| Less than 2.0x | 0 (0.0%) | 118,650 (32,329.7%) |
| 2.0x to 2.9x | 27 (21.1%) | 45 (12.3%) |
| 3.0x to 3.9x | 42 (32.8%) | 22 (6.0%) |
| 4.0x or more | 59 (46.1%) | 43 (11.7%) |
| Total | 128 (100.0%) | 367 (100.0%) |
Real Estate Taxes by Mortgage Status in Robie Creek
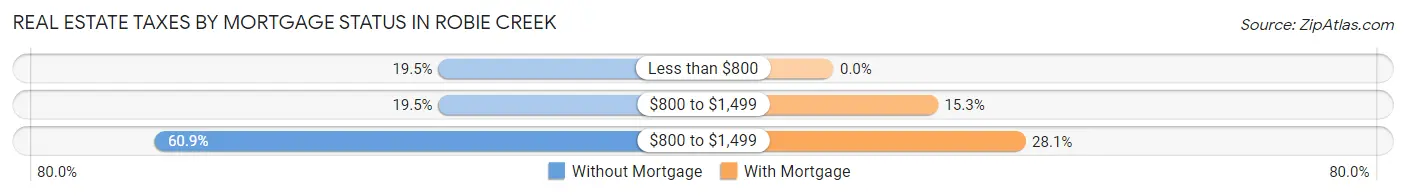
| Property Taxes | Without Mortgage | With Mortgage |
| Less than $800 | 25 (19.5%) | 0 (0.0%) |
| $800 to $1,499 | 25 (19.5%) | 56 (15.3%) |
| $800 to $1,499 | 78 (60.9%) | 103 (28.1%) |
| Total | 128 (100.0%) | 367 (100.0%) |
Health & Disability in Robie Creek
Health Insurance Coverage by Age in Robie Creek
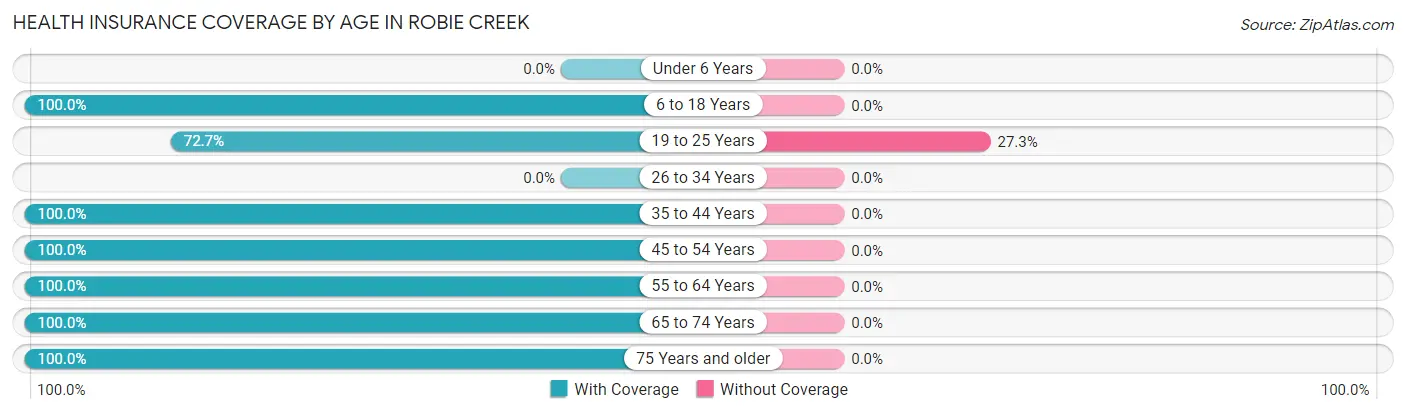
| Age Bracket | With Coverage | Without Coverage |
| Under 6 Years | 0 (0.0%) | 0 (0.0%) |
| 6 to 18 Years | 118 (100.0%) | 0 (0.0%) |
| 19 to 25 Years | 88 (72.7%) | 33 (27.3%) |
| 26 to 34 Years | 0 (0.0%) | 0 (0.0%) |
| 35 to 44 Years | 118 (100.0%) | 0 (0.0%) |
| 45 to 54 Years | 120 (100.0%) | 0 (0.0%) |
| 55 to 64 Years | 485 (100.0%) | 0 (0.0%) |
| 65 to 74 Years | 192 (100.0%) | 0 (0.0%) |
| 75 Years and older | 83 (100.0%) | 0 (0.0%) |
| Total | 1,204 (97.3%) | 33 (2.7%) |
Health Insurance Coverage by Citizenship Status in Robie Creek
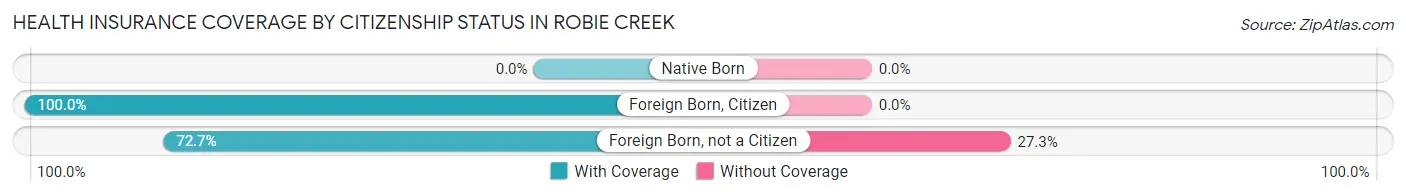
| Citizenship Status | With Coverage | Without Coverage |
| Native Born | 0 (0.0%) | 0 (0.0%) |
| Foreign Born, Citizen | 118 (100.0%) | 0 (0.0%) |
| Foreign Born, not a Citizen | 88 (72.7%) | 33 (27.3%) |
Health Insurance Coverage by Household Income in Robie Creek
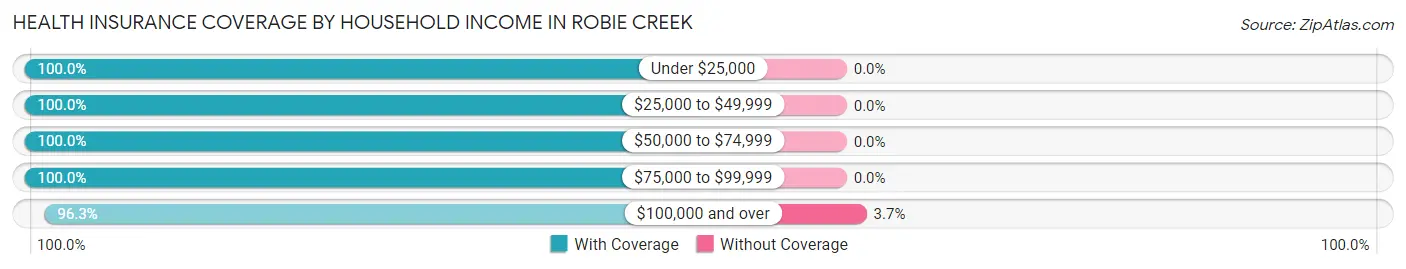
| Household Income | With Coverage | Without Coverage |
| Under $25,000 | 48 (100.0%) | 0 (0.0%) |
| $25,000 to $49,999 | 77 (100.0%) | 0 (0.0%) |
| $50,000 to $74,999 | 25 (100.0%) | 0 (0.0%) |
| $75,000 to $99,999 | 200 (100.0%) | 0 (0.0%) |
| $100,000 and over | 854 (96.3%) | 33 (3.7%) |
Public vs Private Health Insurance Coverage by Age in Robie Creek
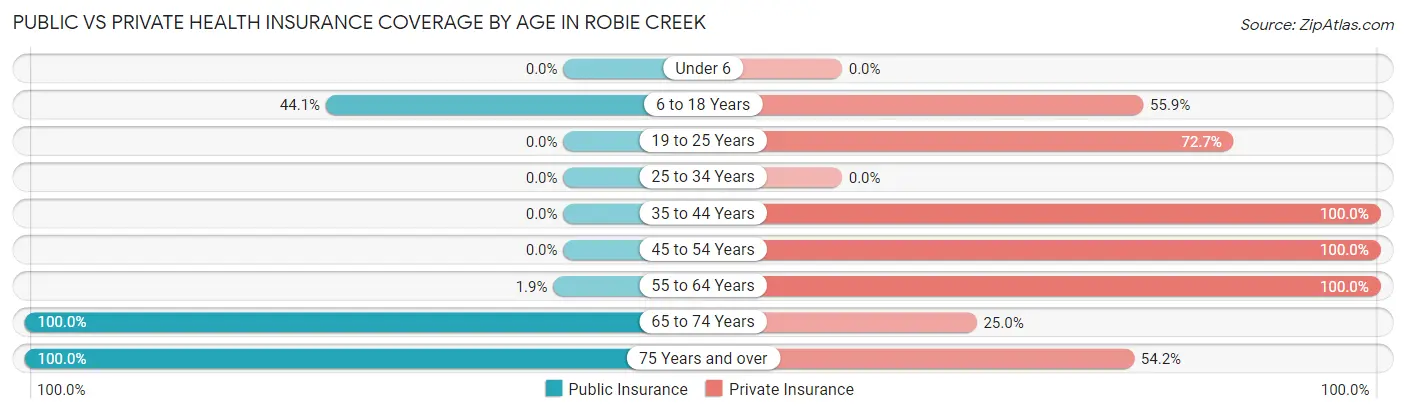
| Age Bracket | Public Insurance | Private Insurance |
| Under 6 | 0 (0.0%) | 0 (0.0%) |
| 6 to 18 Years | 52 (44.1%) | 66 (55.9%) |
| 19 to 25 Years | 0 (0.0%) | 88 (72.7%) |
| 25 to 34 Years | 0 (0.0%) | 0 (0.0%) |
| 35 to 44 Years | 0 (0.0%) | 118 (100.0%) |
| 45 to 54 Years | 0 (0.0%) | 120 (100.0%) |
| 55 to 64 Years | 9 (1.9%) | 485 (100.0%) |
| 65 to 74 Years | 192 (100.0%) | 48 (25.0%) |
| 75 Years and over | 83 (100.0%) | 45 (54.2%) |
| Total | 336 (27.2%) | 970 (78.4%) |
Disability Status by Sex by Age in Robie Creek
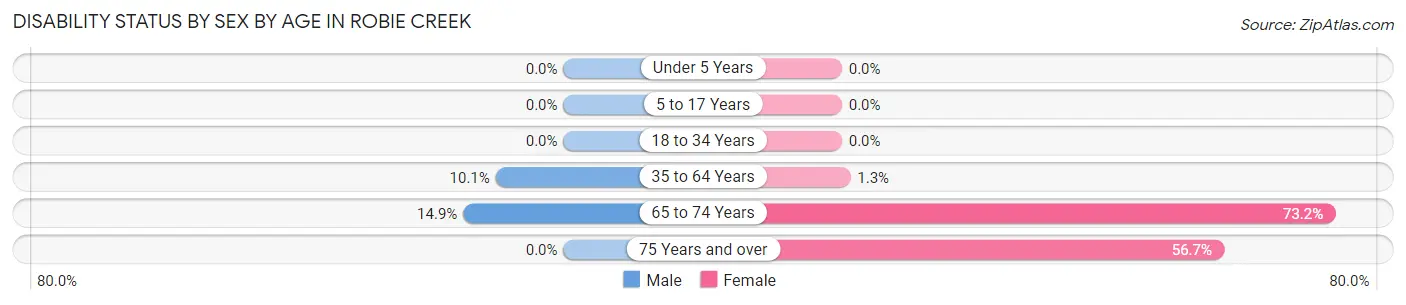
| Age Bracket | Male | Female |
| Under 5 Years | 0 (0.0%) | 0 (0.0%) |
| 5 to 17 Years | 0 (0.0%) | 0 (0.0%) |
| 18 to 34 Years | 0 (0.0%) | 0 (0.0%) |
| 35 to 64 Years | 33 (10.1%) | 5 (1.3%) |
| 65 to 74 Years | 18 (14.9%) | 52 (73.2%) |
| 75 Years and over | 0 (0.0%) | 38 (56.7%) |
Disability Class by Sex by Age in Robie Creek
Disability Class: Hearing Difficulty
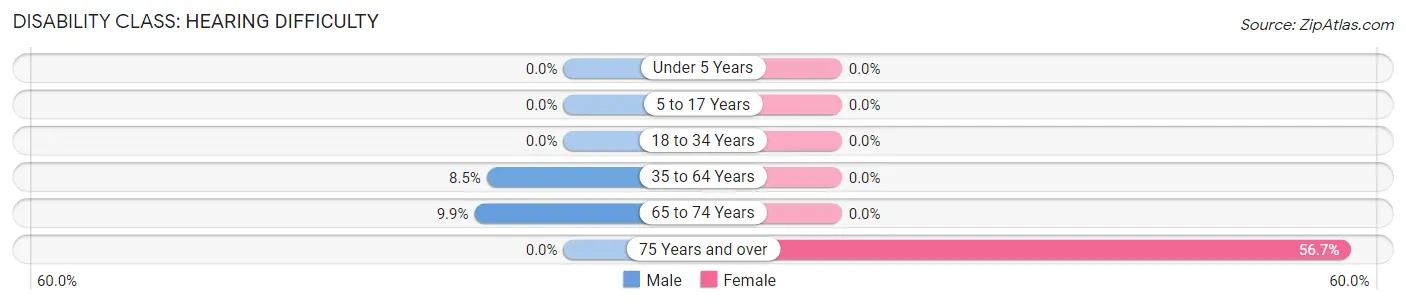
| Age Bracket | Male | Female |
| Under 5 Years | 0 (0.0%) | 0 (0.0%) |
| 5 to 17 Years | 0 (0.0%) | 0 (0.0%) |
| 18 to 34 Years | 0 (0.0%) | 0 (0.0%) |
| 35 to 64 Years | 28 (8.5%) | 0 (0.0%) |
| 65 to 74 Years | 12 (9.9%) | 0 (0.0%) |
| 75 Years and over | 0 (0.0%) | 38 (56.7%) |
Disability Class: Vision Difficulty
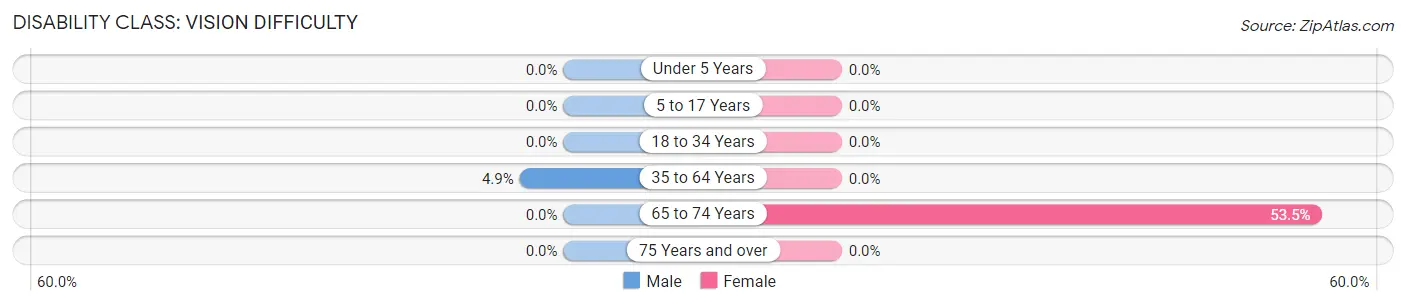
| Age Bracket | Male | Female |
| Under 5 Years | 0 (0.0%) | 0 (0.0%) |
| 5 to 17 Years | 0 (0.0%) | 0 (0.0%) |
| 18 to 34 Years | 0 (0.0%) | 0 (0.0%) |
| 35 to 64 Years | 16 (4.9%) | 0 (0.0%) |
| 65 to 74 Years | 0 (0.0%) | 38 (53.5%) |
| 75 Years and over | 0 (0.0%) | 0 (0.0%) |
Disability Class: Cognitive Difficulty
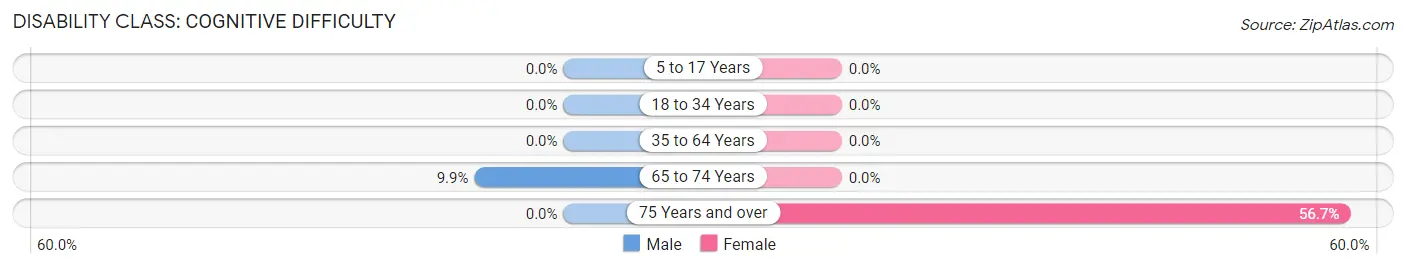
| Age Bracket | Male | Female |
| 5 to 17 Years | 0 (0.0%) | 0 (0.0%) |
| 18 to 34 Years | 0 (0.0%) | 0 (0.0%) |
| 35 to 64 Years | 0 (0.0%) | 0 (0.0%) |
| 65 to 74 Years | 12 (9.9%) | 0 (0.0%) |
| 75 Years and over | 0 (0.0%) | 38 (56.7%) |
Disability Class: Ambulatory Difficulty
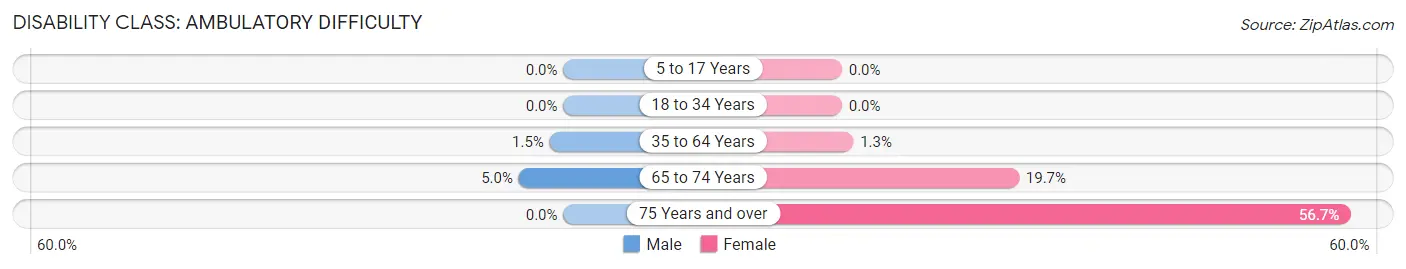
| Age Bracket | Male | Female |
| 5 to 17 Years | 0 (0.0%) | 0 (0.0%) |
| 18 to 34 Years | 0 (0.0%) | 0 (0.0%) |
| 35 to 64 Years | 5 (1.5%) | 5 (1.3%) |
| 65 to 74 Years | 6 (5.0%) | 14 (19.7%) |
| 75 Years and over | 0 (0.0%) | 38 (56.7%) |
Disability Class: Self-Care Difficulty
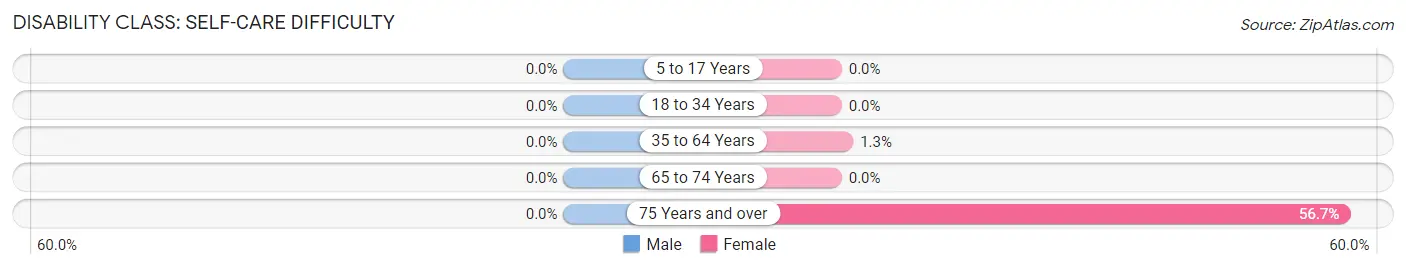
| Age Bracket | Male | Female |
| 5 to 17 Years | 0 (0.0%) | 0 (0.0%) |
| 18 to 34 Years | 0 (0.0%) | 0 (0.0%) |
| 35 to 64 Years | 0 (0.0%) | 5 (1.3%) |
| 65 to 74 Years | 0 (0.0%) | 0 (0.0%) |
| 75 Years and over | 0 (0.0%) | 38 (56.7%) |
Technology Access in Robie Creek
Computing Device Access in Robie Creek
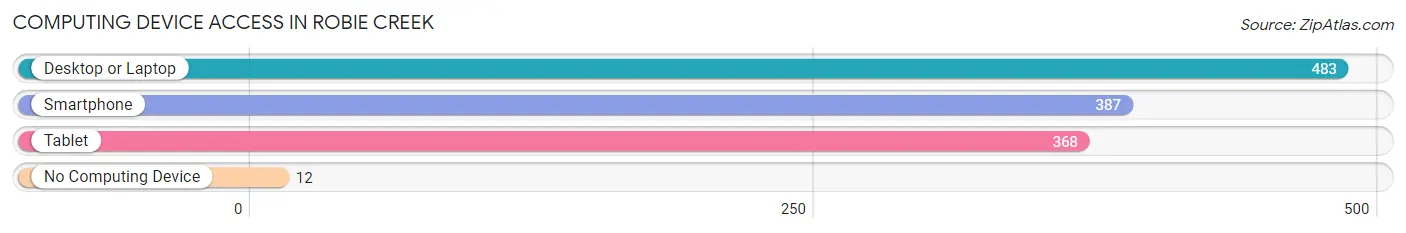
| Device Type | # Households | % Households |
| Desktop or Laptop | 483 | 97.6% |
| Smartphone | 387 | 78.2% |
| Tablet | 368 | 74.3% |
| No Computing Device | 12 | 2.4% |
| Total | 495 | 100.0% |
Internet Access in Robie Creek
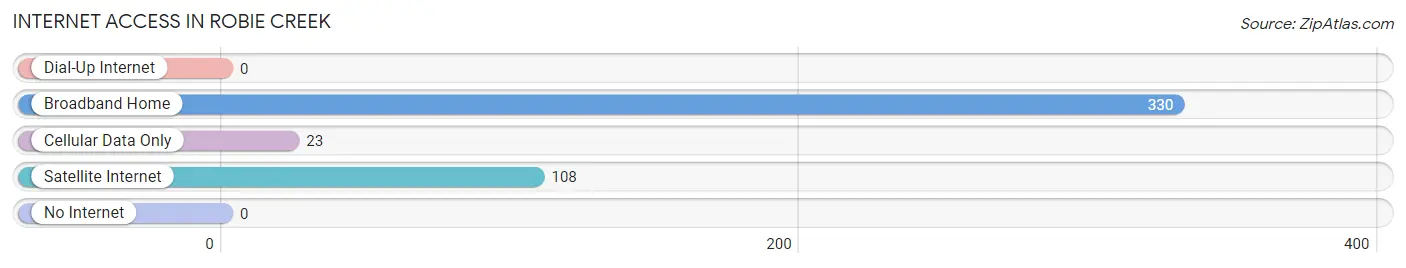
| Internet Type | # Households | % Households |
| Dial-Up Internet | 0 | 0.0% |
| Broadband Home | 330 | 66.7% |
| Cellular Data Only | 23 | 4.6% |
| Satellite Internet | 108 | 21.8% |
| No Internet | 0 | 0.0% |
| Total | 495 | 100.0% |
Robie Creek Summary
Robie Creek is a small unincorporated community located in Ada County, Idaho, United States. It is situated in the foothills of the Boise Mountains, approximately 15 miles northeast of the city of Boise. The community is named after the nearby Robie Creek, which is a tributary of the Boise River.
History
Robie Creek was first settled in the late 1800s by homesteaders who were attracted to the area by its abundant natural resources. The first settlers were primarily farmers and ranchers, and the community grew slowly over the years. In the early 1900s, the area was home to a small sawmill, which provided lumber for the local community.
In the 1950s, the area began to experience a population boom as people moved to the area to take advantage of the area’s natural beauty and recreational opportunities. The area was also home to a number of summer camps, which attracted visitors from all over the country.
Geography
Robie Creek is located in the foothills of the Boise Mountains, approximately 15 miles northeast of the city of Boise. The area is characterized by rolling hills, open meadows, and dense forests. The nearby Robie Creek is a tributary of the Boise River, and the area is home to a number of small lakes and ponds.
The climate in Robie Creek is generally mild, with hot summers and cold winters. The average annual temperature is around 50 degrees Fahrenheit, and the average annual precipitation is around 18 inches.
Economy
Robie Creek is primarily a residential community, and the local economy is largely based on tourism and recreation. The area is home to a number of summer camps, and the nearby Boise National Forest provides a variety of recreational opportunities, including camping, hiking, fishing, and hunting.
The area is also home to a number of small businesses, including restaurants, convenience stores, and gas stations. In addition, the nearby city of Boise provides employment opportunities for many of the area’s residents.
Demographics
As of the 2010 census, the population of Robie Creek was 1,845. The racial makeup of the community was 94.3% White, 0.7% African American, 0.3% Native American, 0.7% Asian, 0.1% Pacific Islander, and 3.0% from other races. The median household income was $45,000, and the median family income was $50,000.
Robie Creek is a small, close-knit community with a strong sense of community and pride. The area is home to a number of churches, and the local schools are highly rated. The area is also home to a number of parks and recreational facilities, and the nearby Boise National Forest provides a variety of outdoor activities.
Common Questions
What is Per Capita Income in Robie Creek?
Per Capita income in Robie Creek is $44,567.
What is the Median Family Income in Robie Creek?
Median Family Income in Robie Creek is $123,750.
What is the Median Household income in Robie Creek?
Median Household Income in Robie Creek is $117,422.
What is Income or Wage Gap in Robie Creek?
Income or Wage Gap in Robie Creek is 59.9%.
Women in Robie Creek earn 40.1 cents for every dollar earned by a man.
What is Inequality or Gini Index in Robie Creek?
Inequality or Gini Index in Robie Creek is 0.31.
What is the Total Population of Robie Creek?
Total Population of Robie Creek is 1,237.
What is the Total Male Population of Robie Creek?
Total Male Population of Robie Creek is 592.
What is the Total Female Population of Robie Creek?
Total Female Population of Robie Creek is 645.
What is the Ratio of Males per 100 Females in Robie Creek?
There are 91.78 Males per 100 Females in Robie Creek.
What is the Ratio of Females per 100 Males in Robie Creek?
There are 108.95 Females per 100 Males in Robie Creek.
What is the Median Population Age in Robie Creek?
Median Population Age in Robie Creek is 57.9 Years.
What is the Average Family Size in Robie Creek
Average Family Size in Robie Creek is 2.8 People.
What is the Average Household Size in Robie Creek
Average Household Size in Robie Creek is 2.5 People.
How Large is the Labor Force in Robie Creek?
There are 581 People in the Labor Forcein in Robie Creek.
What is the Percentage of People in the Labor Force in Robie Creek?
48.3% of People are in the Labor Force in Robie Creek.