Laughlin AFB, TX Map & Demographics
Laughlin AFB Map
Laughlin AFB Overview
$31,795
PER CAPITA INCOME
$75,647
AVG FAMILY INCOME
$62,333
AVG HOUSEHOLD INCOME
13.8%
WAGE / INCOME GAP [ % ]
86.2¢/ $1
WAGE / INCOME GAP [ $ ]
0.28
INEQUALITY / GINI INDEX
1,865
TOTAL POPULATION
1,128
MALE POPULATION
737
FEMALE POPULATION
153.05
MALES / 100 FEMALES
65.34
FEMALES / 100 MALES
24.2
MEDIAN AGE
2.5
AVG FAMILY SIZE
1.9
AVG HOUSEHOLD SIZE
1,551
LABOR FORCE [ PEOPLE ]
94.5%
PERCENT IN LABOR FORCE
2.5%
UNEMPLOYMENT RATE
Laughlin AFB Zip Codes
Income in Laughlin AFB
Income Overview in Laughlin AFB
Per Capita Income in Laughlin AFB is $31,795, while median incomes of families and households are $75,647 and $62,333 respectively.
| Characteristic | Number | Measure |
| Per Capita Income | 1,865 | $31,795 |
| Median Family Income | 365 | $75,647 |
| Mean Family Income | 365 | $76,326 |
| Median Household Income | 684 | $62,333 |
| Mean Household Income | 684 | $70,977 |
| Income Deficit | 365 | $0 |
| Wage / Income Gap (%) | 1,865 | 13.80% |
| Wage / Income Gap ($) | 1,865 | 86.20¢ per $1 |
| Gini / Inequality Index | 1,865 | 0.28 |
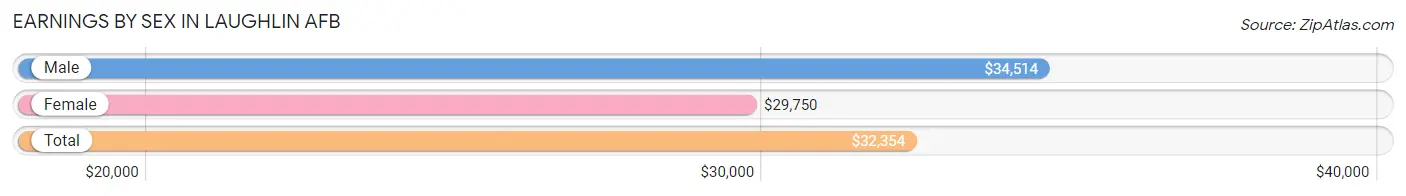
Earnings by Sex in Laughlin AFB
Average Earnings in Laughlin AFB are $32,354, $34,514 for men and $29,750 for women, a difference of 13.8%.
| Sex | Number | Average Earnings |
| Male | 1,045 (65.8%) | $34,514 |
| Female | 544 (34.2%) | $29,750 |
| Total | 1,589 (100.0%) | $32,354 |
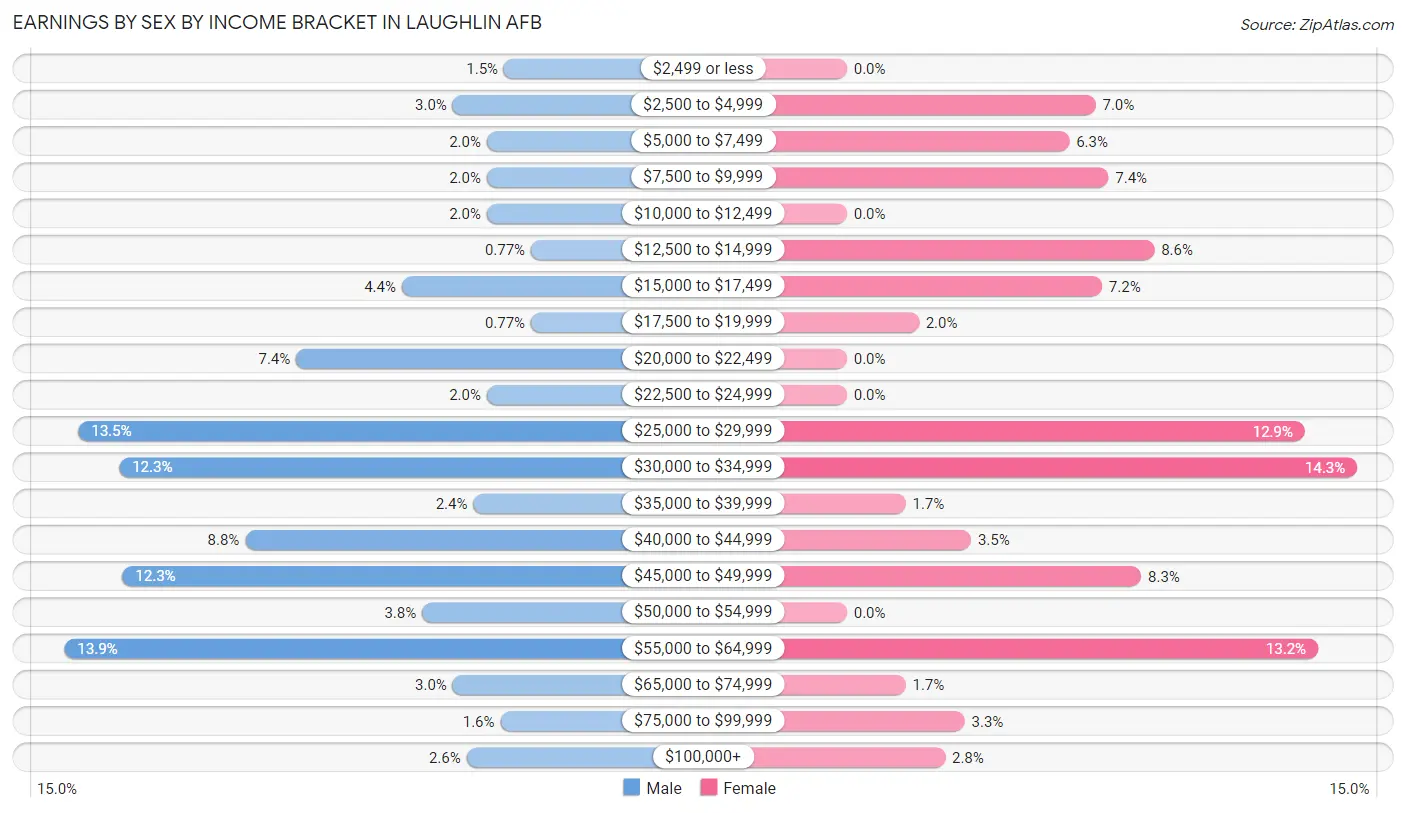
Earnings by Sex by Income Bracket in Laughlin AFB
The most common earnings brackets in Laughlin AFB are $55,000 to $64,999 for men (145 | 13.9%) and $30,000 to $34,999 for women (78 | 14.3%).
| Income | Male | Female |
| $2,499 or less | 16 (1.5%) | 0 (0.0%) |
| $2,500 to $4,999 | 31 (3.0%) | 38 (7.0%) |
| $5,000 to $7,499 | 21 (2.0%) | 34 (6.2%) |
| $7,500 to $9,999 | 21 (2.0%) | 40 (7.3%) |
| $10,000 to $12,499 | 21 (2.0%) | 0 (0.0%) |
| $12,500 to $14,999 | 8 (0.8%) | 47 (8.6%) |
| $15,000 to $17,499 | 46 (4.4%) | 39 (7.2%) |
| $17,500 to $19,999 | 8 (0.8%) | 11 (2.0%) |
| $20,000 to $22,499 | 77 (7.4%) | 0 (0.0%) |
| $22,500 to $24,999 | 21 (2.0%) | 0 (0.0%) |
| $25,000 to $29,999 | 141 (13.5%) | 70 (12.9%) |
| $30,000 to $34,999 | 129 (12.3%) | 78 (14.3%) |
| $35,000 to $39,999 | 25 (2.4%) | 9 (1.7%) |
| $40,000 to $44,999 | 92 (8.8%) | 19 (3.5%) |
| $45,000 to $49,999 | 128 (12.2%) | 45 (8.3%) |
| $50,000 to $54,999 | 40 (3.8%) | 0 (0.0%) |
| $55,000 to $64,999 | 145 (13.9%) | 72 (13.2%) |
| $65,000 to $74,999 | 31 (3.0%) | 9 (1.7%) |
| $75,000 to $99,999 | 17 (1.6%) | 18 (3.3%) |
| $100,000+ | 27 (2.6%) | 15 (2.8%) |
| Total | 1,045 (100.0%) | 544 (100.0%) |
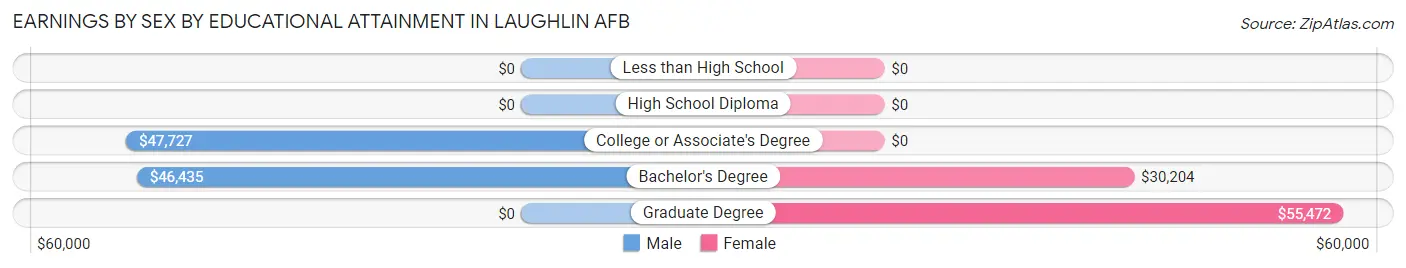
Earnings by Sex by Educational Attainment in Laughlin AFB
Average earnings in Laughlin AFB are $46,809 for men and $31,271 for women, a difference of 33.2%. Men with an educational attainment of college or associate's degree enjoy the highest average annual earnings of $47,727, while those with bachelor's degree education earn the least with $46,435. Women with an educational attainment of graduate degree earn the most with the average annual earnings of $55,472, while those with bachelor's degree education have the smallest earnings of $30,204.
| Educational Attainment | Male Income | Female Income |
| Less than High School | - | - |
| High School Diploma | - | - |
| College or Associate's Degree | $47,727 | $0 |
| Bachelor's Degree | $46,435 | $30,204 |
| Graduate Degree | - | - |
| Total | $46,809 | $31,271 |
Family Income in Laughlin AFB
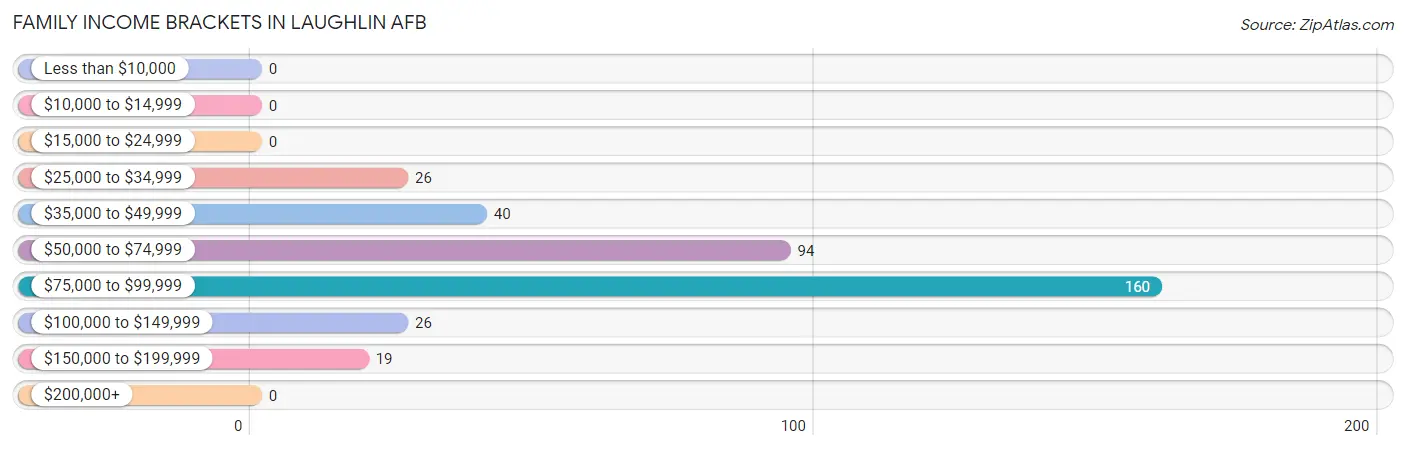
Family Income Brackets in Laughlin AFB
According to the Laughlin AFB family income data, there are 160 families falling into the $75,000 to $99,999 income range, which is the most common income bracket and makes up 43.8% of all families.
| Income Bracket | # Families | % Families |
| Less than $10,000 | 0 | 0.0% |
| $10,000 to $14,999 | 0 | 0.0% |
| $15,000 to $24,999 | 0 | 0.0% |
| $25,000 to $34,999 | 26 | 7.1% |
| $35,000 to $49,999 | 40 | 11.0% |
| $50,000 to $74,999 | 94 | 25.8% |
| $75,000 to $99,999 | 160 | 43.8% |
| $100,000 to $149,999 | 26 | 7.1% |
| $150,000 to $199,999 | 19 | 5.2% |
| $200,000+ | 0 | 0.0% |
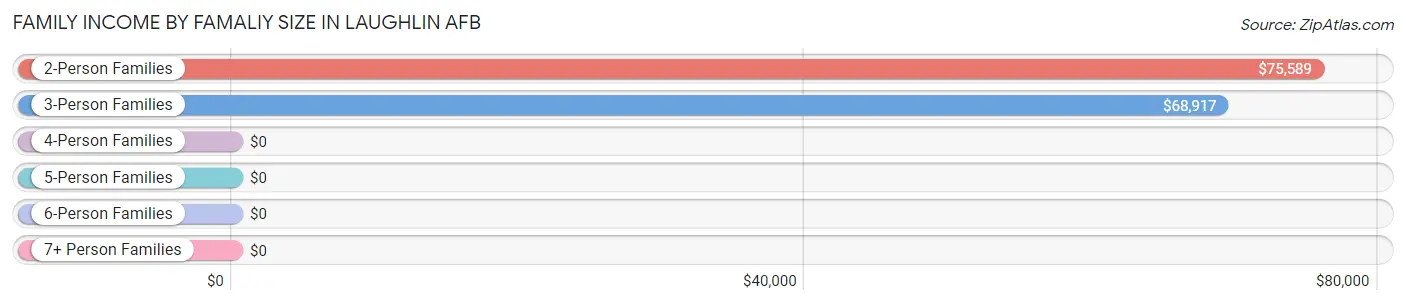
Family Income by Famaliy Size in Laughlin AFB
2-person families (195 | 53.4%) account for the highest median family income in Laughlin AFB with $75,589 per family, while 2-person families (195 | 53.4%) have the highest median income of $37,794 per family member.
| Income Bracket | # Families | Median Income |
| 2-Person Families | 195 (53.4%) | $75,589 |
| 3-Person Families | 153 (41.9%) | $68,917 |
| 4-Person Families | 0 (0.0%) | $0 |
| 5-Person Families | 17 (4.7%) | $0 |
| 6-Person Families | 0 (0.0%) | $0 |
| 7+ Person Families | 0 (0.0%) | $0 |
| Total | 365 (100.0%) | $75,647 |
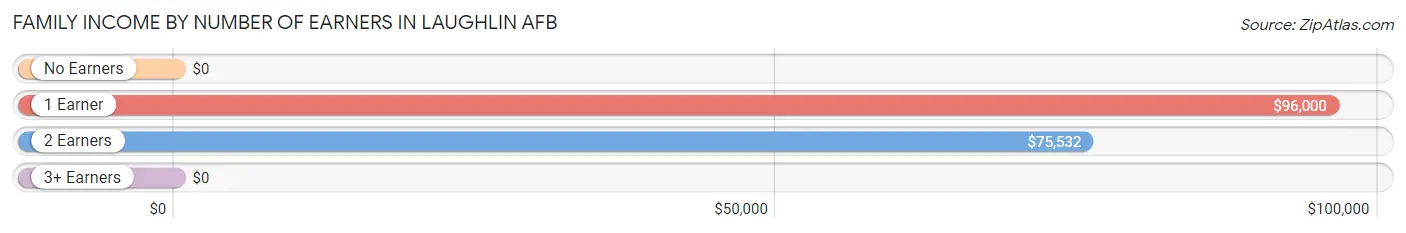
Family Income by Number of Earners in Laughlin AFB
| Number of Earners | # Families | Median Income |
| No Earners | 0 (0.0%) | $0 |
| 1 Earner | 42 (11.5%) | $96,000 |
| 2 Earners | 323 (88.5%) | $75,532 |
| 3+ Earners | 0 (0.0%) | $0 |
| Total | 365 (100.0%) | $75,647 |
Household Income in Laughlin AFB
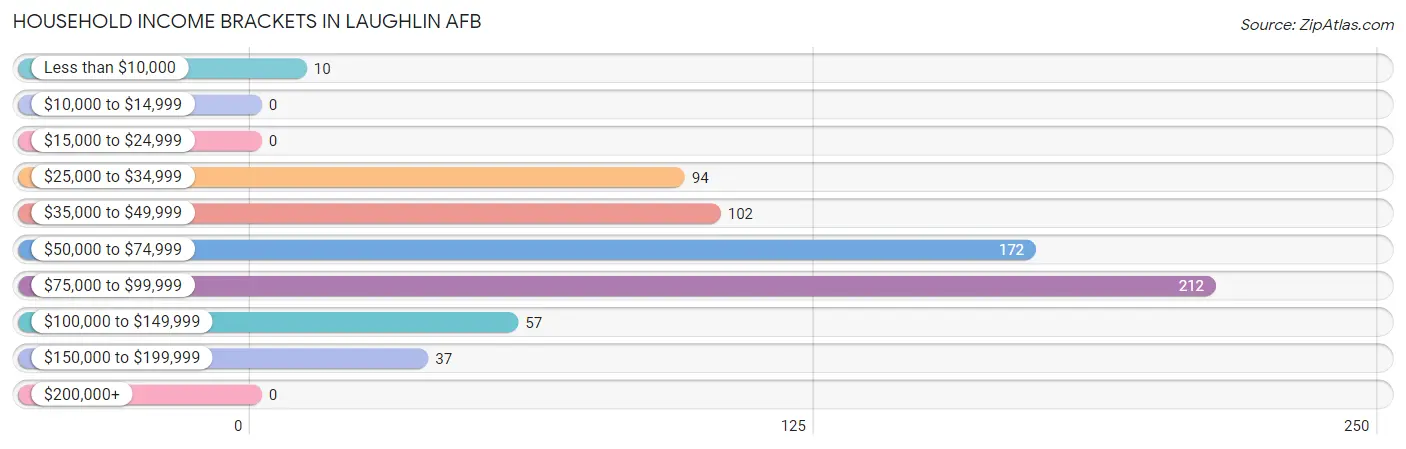
Household Income Brackets in Laughlin AFB
With 212 households falling in the category, the $75,000 to $99,999 income range is the most frequent in Laughlin AFB, accounting for 31.0% of all households.
| Income Bracket | # Households | % Households |
| Less than $10,000 | 10 | 1.5% |
| $10,000 to $14,999 | 0 | 0.0% |
| $15,000 to $24,999 | 0 | 0.0% |
| $25,000 to $34,999 | 94 | 13.7% |
| $35,000 to $49,999 | 102 | 14.9% |
| $50,000 to $74,999 | 172 | 25.1% |
| $75,000 to $99,999 | 212 | 31.0% |
| $100,000 to $149,999 | 57 | 8.3% |
| $150,000 to $199,999 | 37 | 5.4% |
| $200,000+ | 0 | 0.0% |
Household Income by Householder Age in Laughlin AFB
The median household income in Laughlin AFB is $62,333, with the highest median household income of $75,172 found in the 15 to 24 years age bracket for the primary householder. A total of 326 households (47.7%) fall into this category. Meanwhile, the 45 to 64 years age bracket for the primary householder has the lowest median household income of $0, with 15 households (2.2%) in this group.
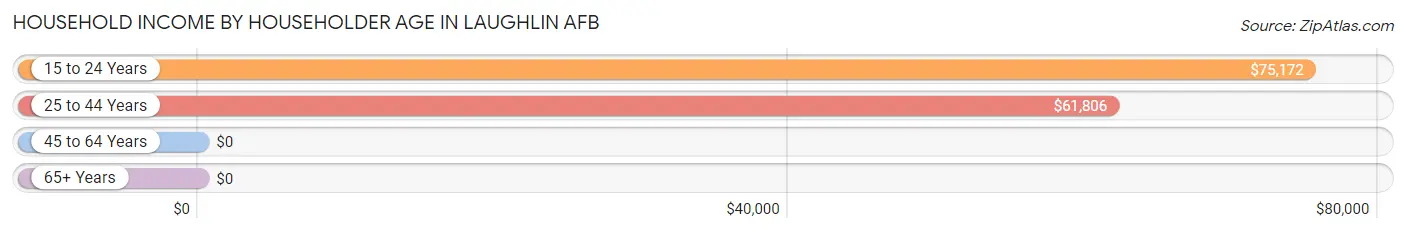
| Income Bracket | # Households | Median Income |
| 15 to 24 Years | 326 (47.7%) | $75,172 |
| 25 to 44 Years | 335 (49.0%) | $61,806 |
| 45 to 64 Years | 15 (2.2%) | $0 |
| 65+ Years | 8 (1.2%) | $0 |
| Total | 684 (100.0%) | $62,333 |
Poverty in Laughlin AFB
Income Below Poverty by Sex and Age in Laughlin AFB
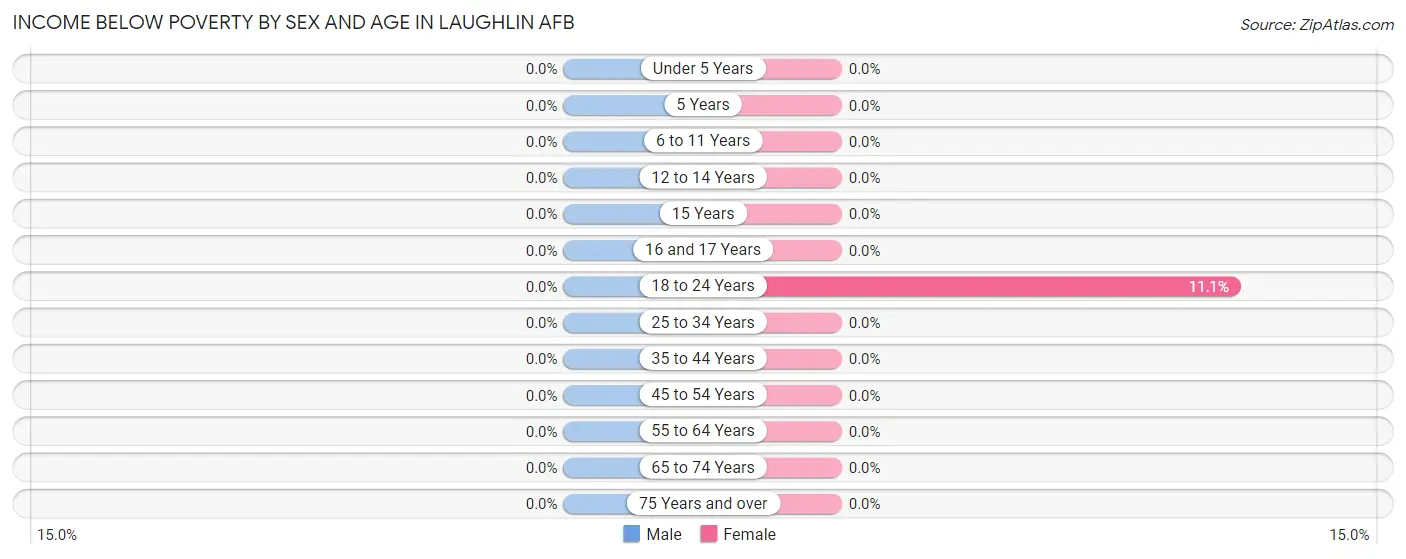
| Age Bracket | Male | Female |
| Under 5 Years | 0 (0.0%) | 0 (0.0%) |
| 5 Years | 0 (0.0%) | 0 (0.0%) |
| 6 to 11 Years | 0 (0.0%) | 0 (0.0%) |
| 12 to 14 Years | 0 (0.0%) | 0 (0.0%) |
| 15 Years | 0 (0.0%) | 0 (0.0%) |
| 16 and 17 Years | 0 (0.0%) | 0 (0.0%) |
| 18 to 24 Years | 0 (0.0%) | 10 (11.1%) |
| 25 to 34 Years | 0 (0.0%) | 0 (0.0%) |
| 35 to 44 Years | 0 (0.0%) | 0 (0.0%) |
| 45 to 54 Years | 0 (0.0%) | 0 (0.0%) |
| 55 to 64 Years | 0 (0.0%) | 0 (0.0%) |
| 65 to 74 Years | 0 (0.0%) | 0 (0.0%) |
| 75 Years and over | 0 (0.0%) | 0 (0.0%) |
| Total | 0 (0.0%) | 10 (1.7%) |
Income Above Poverty by Sex and Age in Laughlin AFB
According to the poverty statistics in Laughlin AFB, males aged under 5 years and females aged under 5 years are the age groups that are most secure financially, with 100.0% of males and 100.0% of females in these age groups living above the poverty line.
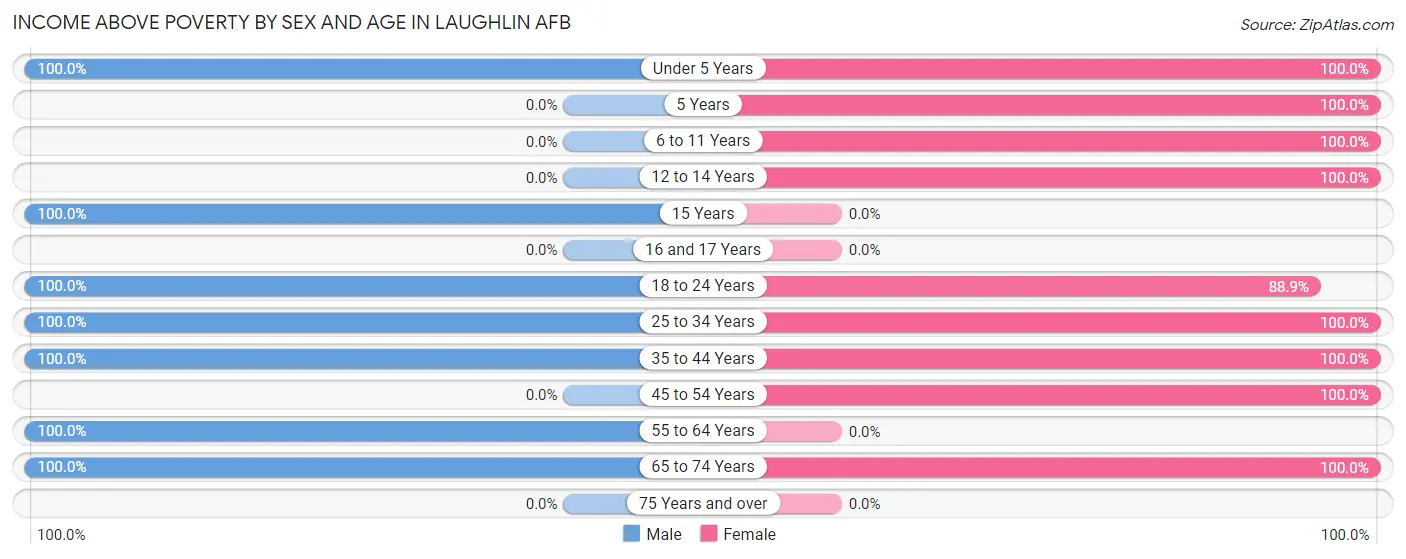
| Age Bracket | Male | Female |
| Under 5 Years | 65 (100.0%) | 88 (100.0%) |
| 5 Years | 0 (0.0%) | 13 (100.0%) |
| 6 to 11 Years | 0 (0.0%) | 43 (100.0%) |
| 12 to 14 Years | 0 (0.0%) | 8 (100.0%) |
| 15 Years | 7 (100.0%) | 0 (0.0%) |
| 16 and 17 Years | 0 (0.0%) | 0 (0.0%) |
| 18 to 24 Years | 328 (100.0%) | 80 (88.9%) |
| 25 to 34 Years | 266 (100.0%) | 295 (100.0%) |
| 35 to 44 Years | 25 (100.0%) | 21 (100.0%) |
| 45 to 54 Years | 0 (0.0%) | 15 (100.0%) |
| 55 to 64 Years | 4 (100.0%) | 0 (0.0%) |
| 65 to 74 Years | 4 (100.0%) | 8 (100.0%) |
| 75 Years and over | 0 (0.0%) | 0 (0.0%) |
| Total | 699 (100.0%) | 571 (98.3%) |
Income Below Poverty Among Married-Couple Families in Laughlin AFB
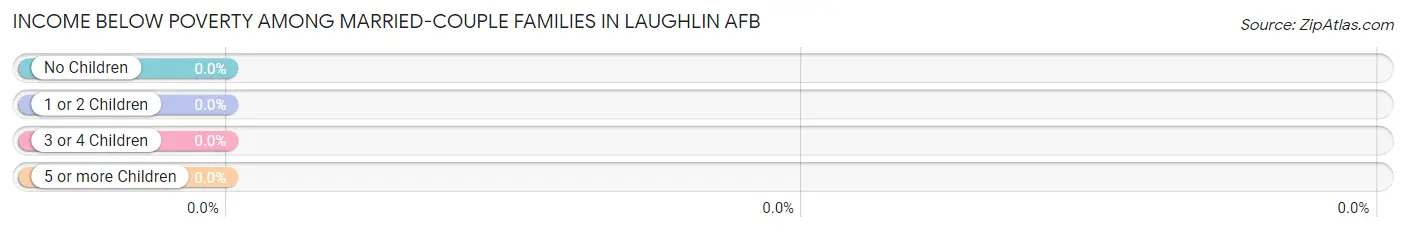
| Children | Above Poverty | Below Poverty |
| No Children | 203 (100.0%) | 0 (0.0%) |
| 1 or 2 Children | 145 (100.0%) | 0 (0.0%) |
| 3 or 4 Children | 17 (100.0%) | 0 (0.0%) |
| 5 or more Children | 0 (0.0%) | 0 (0.0%) |
| Total | 365 (100.0%) | 0 (0.0%) |
Income Below Poverty Among Single-Parent Households in Laughlin AFB
| Children | Single Father | Single Mother |
| No Children | 0 (0.0%) | 0 (0.0%) |
| 1 or 2 Children | 0 (0.0%) | 0 (0.0%) |
| 3 or 4 Children | 0 (0.0%) | 0 (0.0%) |
| 5 or more Children | 0 (0.0%) | 0 (0.0%) |
| Total | 0 (0.0%) | 0 (0.0%) |
Income Below Poverty Among Married-Couple vs Single-Parent Households in Laughlin AFB
| Children | Married-Couple Families | Single-Parent Households |
| No Children | 0 (0.0%) | 0 (0.0%) |
| 1 or 2 Children | 0 (0.0%) | 0 (0.0%) |
| 3 or 4 Children | 0 (0.0%) | 0 (0.0%) |
| 5 or more Children | 0 (0.0%) | 0 (0.0%) |
| Total | 0 (0.0%) | 0 (0.0%) |
Race in Laughlin AFB
The most populous races in Laughlin AFB are White / Caucasian (1,437 | 77.0%), Hispanic or Latino (219 | 11.7%), and Black / African American (187 | 10.0%).
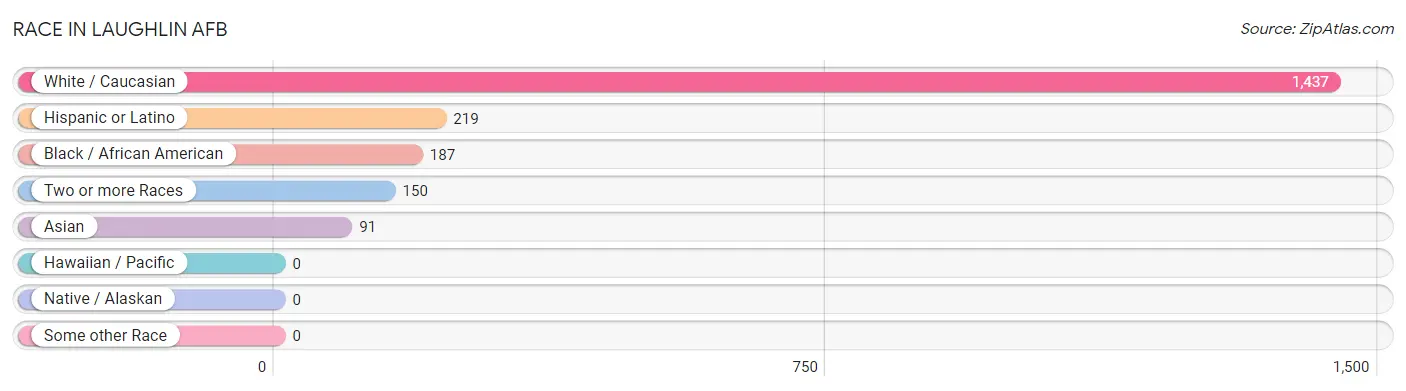
| Race | # Population | % Population |
| Asian | 91 | 4.9% |
| Black / African American | 187 | 10.0% |
| Hawaiian / Pacific | 0 | 0.0% |
| Hispanic or Latino | 219 | 11.7% |
| Native / Alaskan | 0 | 0.0% |
| White / Caucasian | 1,437 | 77.0% |
| Two or more Races | 150 | 8.0% |
| Some other Race | 0 | 0.0% |
| Total | 1,865 | 100.0% |
Ancestry in Laughlin AFB
The most populous ancestries reported in Laughlin AFB are German (278 | 14.9%), Irish (195 | 10.5%), American (159 | 8.5%), Polish (123 | 6.6%), and Mexican (118 | 6.3%), together accounting for 46.8% of all Laughlin AFB residents.
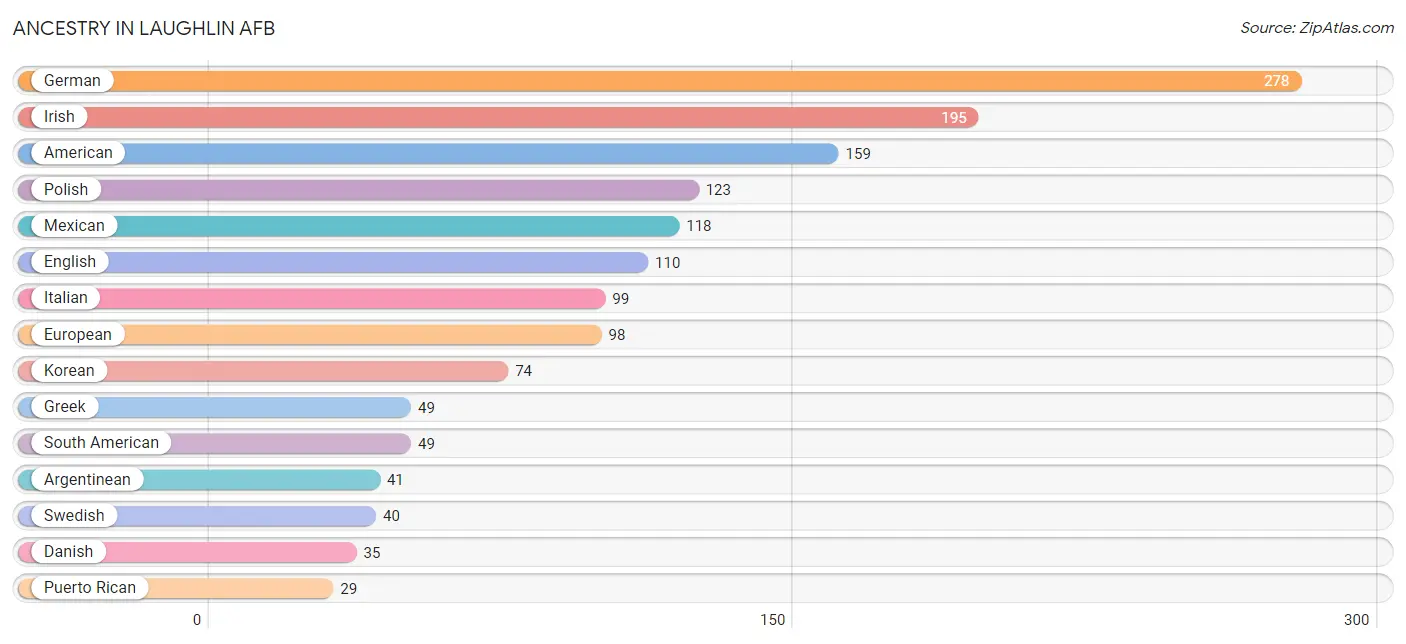
| Ancestry | # Population | % Population |
| American | 159 | 8.5% |
| Arab | 5 | 0.3% |
| Argentinean | 41 | 2.2% |
| British | 8 | 0.4% |
| Colombian | 8 | 0.4% |
| Cuban | 17 | 0.9% |
| Czech | 19 | 1.0% |
| Danish | 35 | 1.9% |
| Dutch | 20 | 1.1% |
| Egyptian | 5 | 0.3% |
| English | 110 | 5.9% |
| European | 98 | 5.2% |
| French | 18 | 1.0% |
| German | 278 | 14.9% |
| Greek | 49 | 2.6% |
| Hungarian | 18 | 1.0% |
| Irish | 195 | 10.5% |
| Italian | 99 | 5.3% |
| Jamaican | 10 | 0.5% |
| Korean | 74 | 4.0% |
| Mexican | 118 | 6.3% |
| Norwegian | 21 | 1.1% |
| Polish | 123 | 6.6% |
| Puerto Rican | 29 | 1.5% |
| Scandinavian | 24 | 1.3% |
| Scottish | 27 | 1.5% |
| South American | 49 | 2.6% |
| Sri Lankan | 17 | 0.9% |
| Swedish | 40 | 2.1% |
| West Indian | 10 | 0.5% | View All 30 Rows |
Immigrants in Laughlin AFB
The most numerous immigrant groups reported in Laughlin AFB came from Argentina (41 | 2.2%), Latin America (41 | 2.2%), South America (41 | 2.2%), Asia (40 | 2.1%), and South Eastern Asia (40 | 2.1%), together accounting for 10.9% of all Laughlin AFB residents.
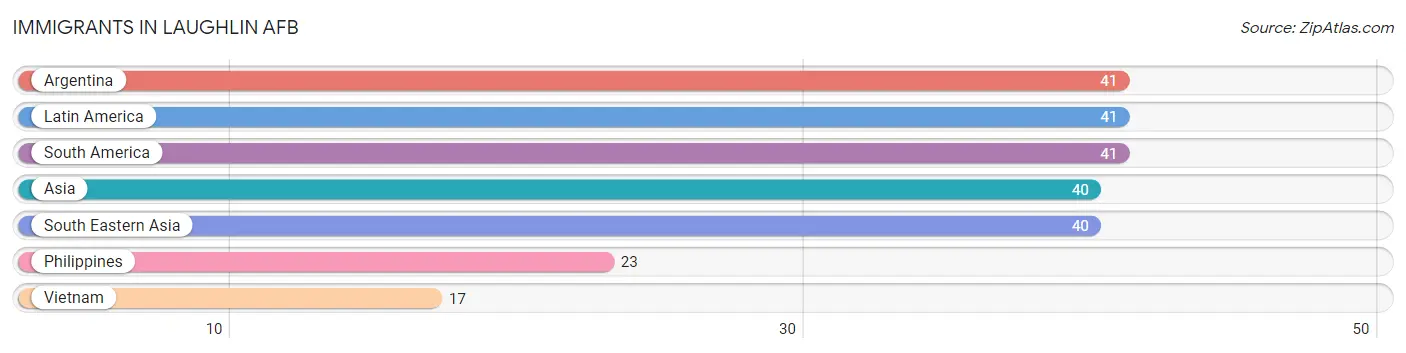
| Immigration Origin | # Population | % Population |
| Argentina | 41 | 2.2% |
| Asia | 40 | 2.1% |
| Latin America | 41 | 2.2% |
| Philippines | 23 | 1.2% |
| South America | 41 | 2.2% |
| South Eastern Asia | 40 | 2.1% |
| Vietnam | 17 | 0.9% | View All 7 Rows |
Sex and Age in Laughlin AFB
Sex and Age in Laughlin AFB
The most populous age groups in Laughlin AFB are 20 to 24 Years (580 | 51.4%) for men and 25 to 29 Years (267 | 36.2%) for women.
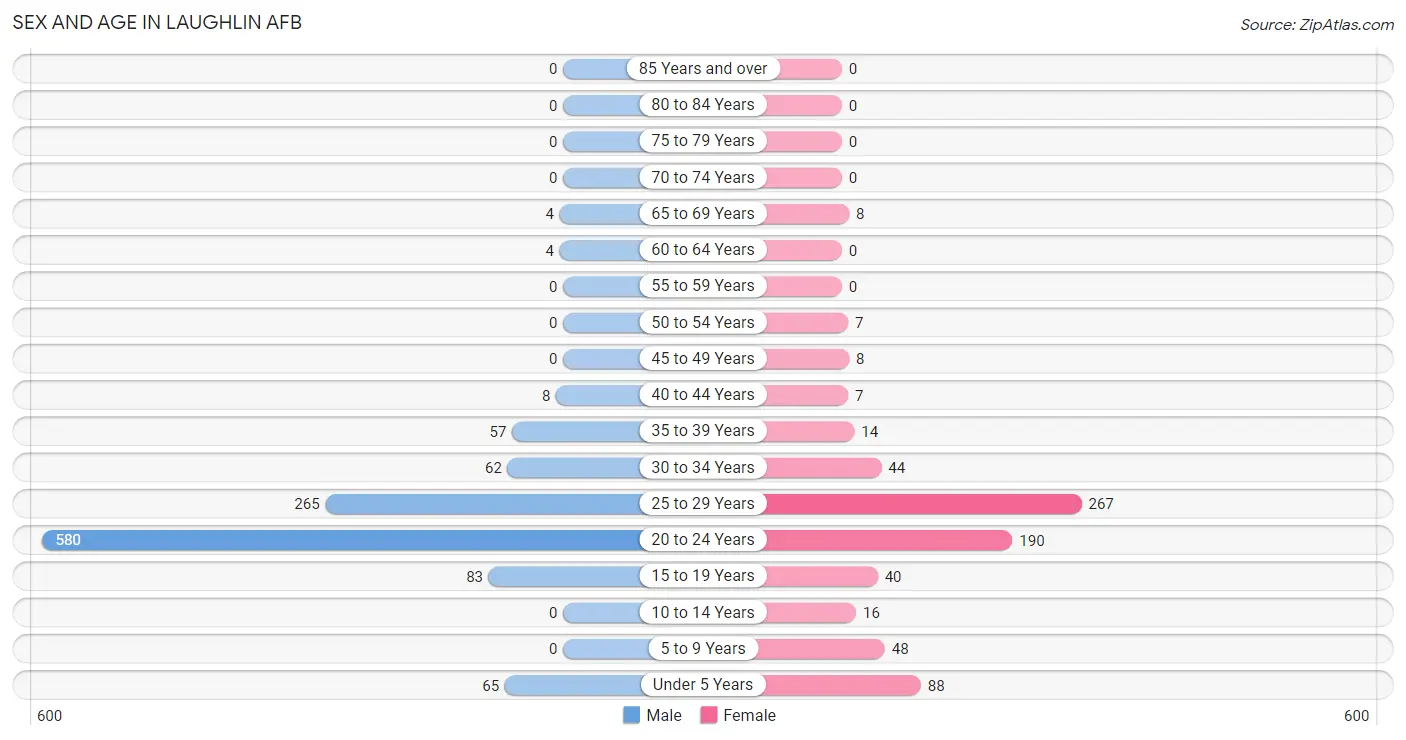
| Age Bracket | Male | Female |
| Under 5 Years | 65 (5.8%) | 88 (11.9%) |
| 5 to 9 Years | 0 (0.0%) | 48 (6.5%) |
| 10 to 14 Years | 0 (0.0%) | 16 (2.2%) |
| 15 to 19 Years | 83 (7.4%) | 40 (5.4%) |
| 20 to 24 Years | 580 (51.4%) | 190 (25.8%) |
| 25 to 29 Years | 265 (23.5%) | 267 (36.2%) |
| 30 to 34 Years | 62 (5.5%) | 44 (6.0%) |
| 35 to 39 Years | 57 (5.1%) | 14 (1.9%) |
| 40 to 44 Years | 8 (0.7%) | 7 (0.9%) |
| 45 to 49 Years | 0 (0.0%) | 8 (1.1%) |
| 50 to 54 Years | 0 (0.0%) | 7 (0.9%) |
| 55 to 59 Years | 0 (0.0%) | 0 (0.0%) |
| 60 to 64 Years | 4 (0.4%) | 0 (0.0%) |
| 65 to 69 Years | 4 (0.4%) | 8 (1.1%) |
| 70 to 74 Years | 0 (0.0%) | 0 (0.0%) |
| 75 to 79 Years | 0 (0.0%) | 0 (0.0%) |
| 80 to 84 Years | 0 (0.0%) | 0 (0.0%) |
| 85 Years and over | 0 (0.0%) | 0 (0.0%) |
| Total | 1,128 (100.0%) | 737 (100.0%) |
Families and Households in Laughlin AFB
Median Family Size in Laughlin AFB
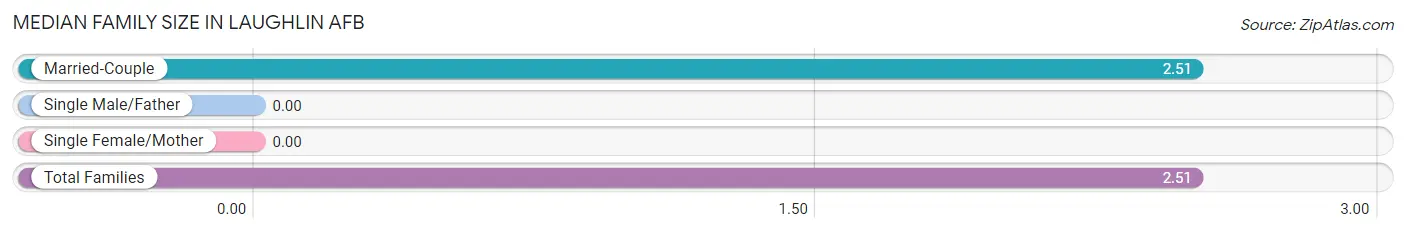
| Family Type | # Families | Family Size |
| Married-Couple | 365 (100.0%) | 2.51 |
| Single Male/Father | 0 (0.0%) | - |
| Single Female/Mother | 0 (0.0%) | - |
| Total Families | 365 (100.0%) | 2.51 |
Median Household Size in Laughlin AFB
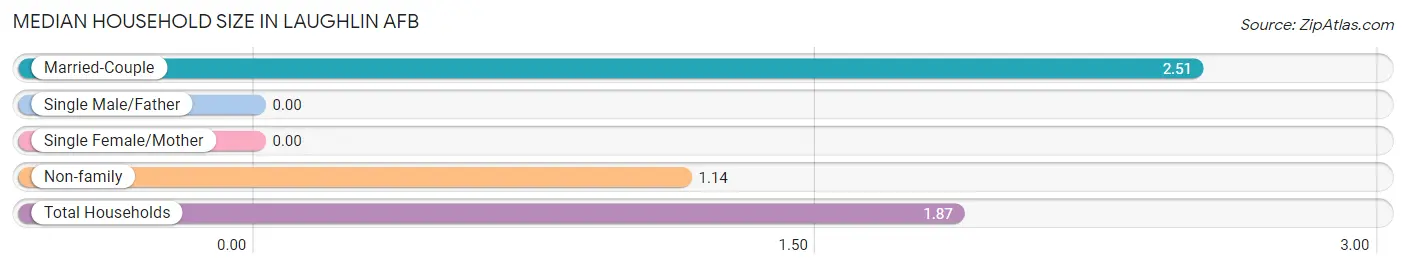
| Household Type | # Households | Household Size |
| Married-Couple | 365 (53.4%) | 2.51 |
| Single Male/Father | 0 (0.0%) | - |
| Single Female/Mother | 0 (0.0%) | - |
| Non-family | 319 (46.6%) | 1.14 |
| Total Households | 684 (100.0%) | 1.87 |
Household Size by Marriage Status in Laughlin AFB
Out of a total of 684 households in Laughlin AFB, 365 (53.4%) are family households, while 319 (46.6%) are nonfamily households. The most numerous type of family households are 2-person households, comprising 195, and the most common type of nonfamily households are 1-person households, comprising 225.
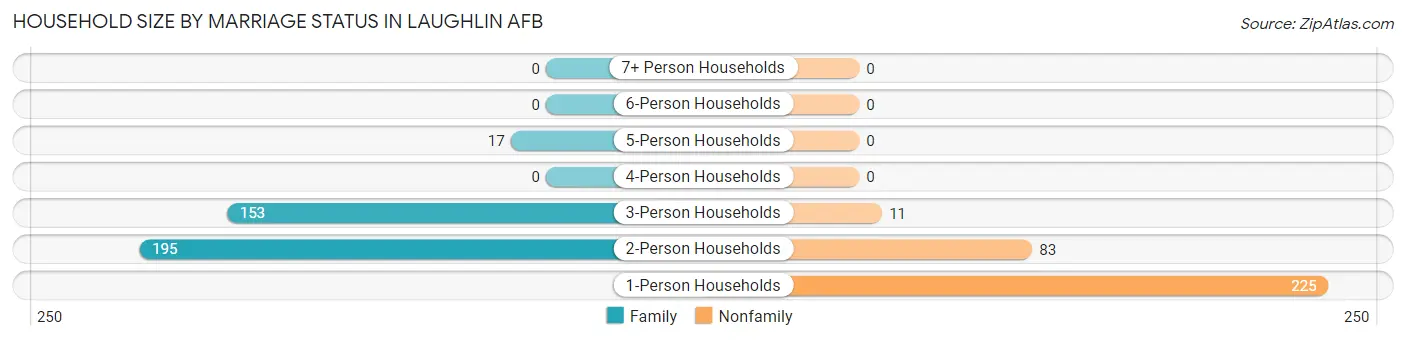
| Household Size | Family Households | Nonfamily Households |
| 1-Person Households | - | 225 (32.9%) |
| 2-Person Households | 195 (28.5%) | 83 (12.1%) |
| 3-Person Households | 153 (22.4%) | 11 (1.6%) |
| 4-Person Households | 0 (0.0%) | 0 (0.0%) |
| 5-Person Households | 17 (2.5%) | 0 (0.0%) |
| 6-Person Households | 0 (0.0%) | 0 (0.0%) |
| 7+ Person Households | 0 (0.0%) | 0 (0.0%) |
| Total | 365 (53.4%) | 319 (46.6%) |
Female Fertility in Laughlin AFB
Fertility by Age in Laughlin AFB
Average fertility rate in Laughlin AFB is 230.0 births per 1,000 women. Women in the age bracket of 20 to 34 years have the highest fertility rate with 261.0 births per 1,000 women. Women in the age bracket of 20 to 34 years acount for 100.0% of all women with births.
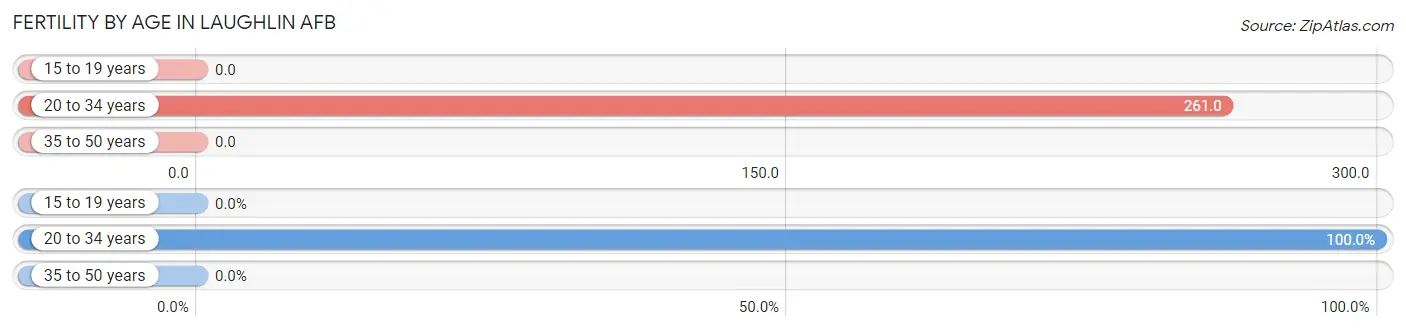
| Age Bracket | Women with Births | Births / 1,000 Women |
| 15 to 19 years | 0 (0.0%) | 0.0 |
| 20 to 34 years | 131 (100.0%) | 261.0 |
| 35 to 50 years | 0 (0.0%) | 0.0 |
| Total | 131 (100.0%) | 230.0 |
Fertility by Age by Marriage Status in Laughlin AFB
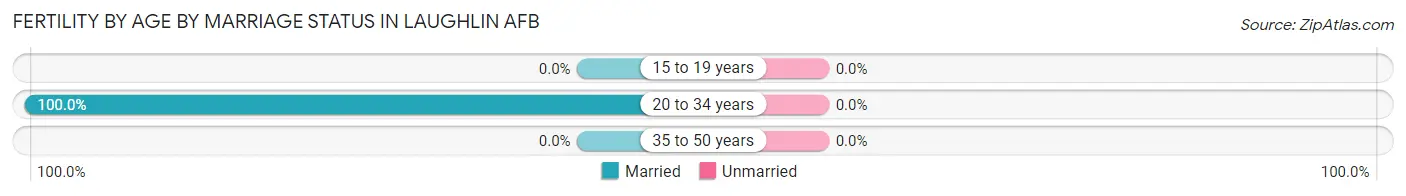
| Age Bracket | Married | Unmarried |
| 15 to 19 years | 0 (0.0%) | 0 (0.0%) |
| 20 to 34 years | 131 (100.0%) | 0 (0.0%) |
| 35 to 50 years | 0 (0.0%) | 0 (0.0%) |
| Total | 131 (100.0%) | 0 (0.0%) |
Fertility by Education in Laughlin AFB
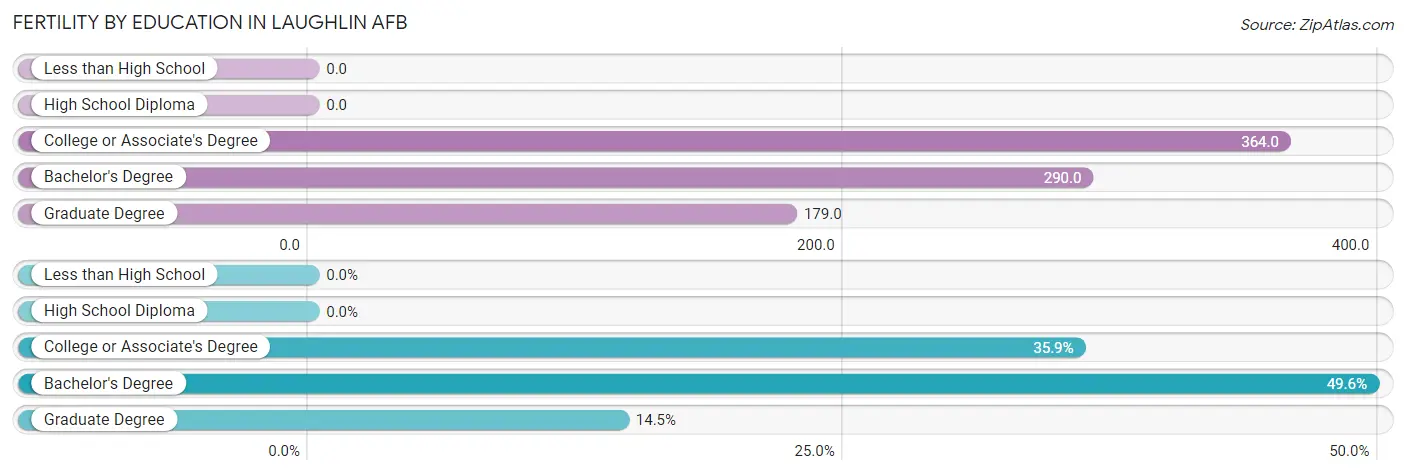
| Educational Attainment | Women with Births | Births / 1,000 Women |
| Less than High School | 0 (0.0%) | 0.0 |
| High School Diploma | 0 (0.0%) | 0.0 |
| College or Associate's Degree | 47 (35.9%) | 364.0 |
| Bachelor's Degree | 65 (49.6%) | 290.0 |
| Graduate Degree | 19 (14.5%) | 179.0 |
| Total | 131 (100.0%) | 230.0 |
Fertility by Education by Marriage Status in Laughlin AFB
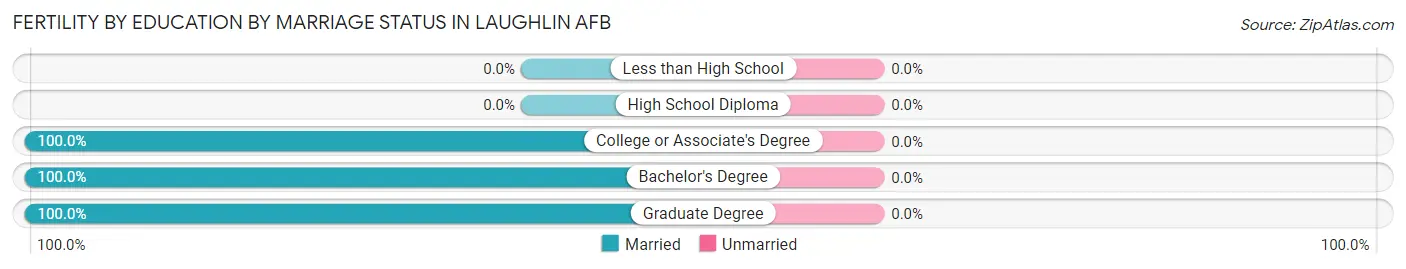
| Educational Attainment | Married | Unmarried |
| Less than High School | 0 (0.0%) | 0 (0.0%) |
| High School Diploma | 0 (0.0%) | 0 (0.0%) |
| College or Associate's Degree | 47 (100.0%) | 0 (0.0%) |
| Bachelor's Degree | 65 (100.0%) | 0 (0.0%) |
| Graduate Degree | 19 (100.0%) | 0 (0.0%) |
| Total | 131 (100.0%) | 0 (0.0%) |
Employment Characteristics in Laughlin AFB
Employment by Class of Employer in Laughlin AFB
Among the 1,540 employed individuals in Laughlin AFB, federal government employees (1,254 | 81.4%), private company employees (191 | 12.4%), and not-for-profit organizations (68 | 4.4%) make up the most common classes of employment.
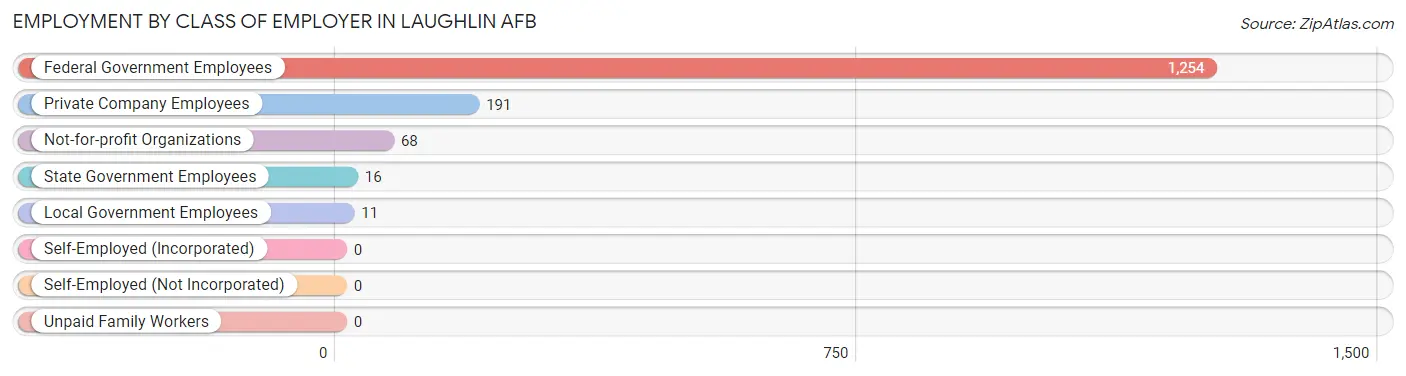
| Employer Class | # Employees | % Employees |
| Private Company Employees | 191 | 12.4% |
| Self-Employed (Incorporated) | 0 | 0.0% |
| Self-Employed (Not Incorporated) | 0 | 0.0% |
| Not-for-profit Organizations | 68 | 4.4% |
| Local Government Employees | 11 | 0.7% |
| State Government Employees | 16 | 1.0% |
| Federal Government Employees | 1,254 | 81.4% |
| Unpaid Family Workers | 0 | 0.0% |
| Total | 1,540 | 100.0% |
Employment Status by Age in Laughlin AFB
According to the labor force statistics for Laughlin AFB, out of the total population over 16 years of age (1,641), 94.5% or 1,551 individuals are in the labor force, with 2.5% or 39 of them unemployed. The age group with the highest labor force participation rate is 16 to 19 years, with 100.0% or 116 individuals in the labor force. Within the labor force, the 20 to 24 years age range has the highest percentage of unemployed individuals, with 7.4% or 55 of them being unemployed.
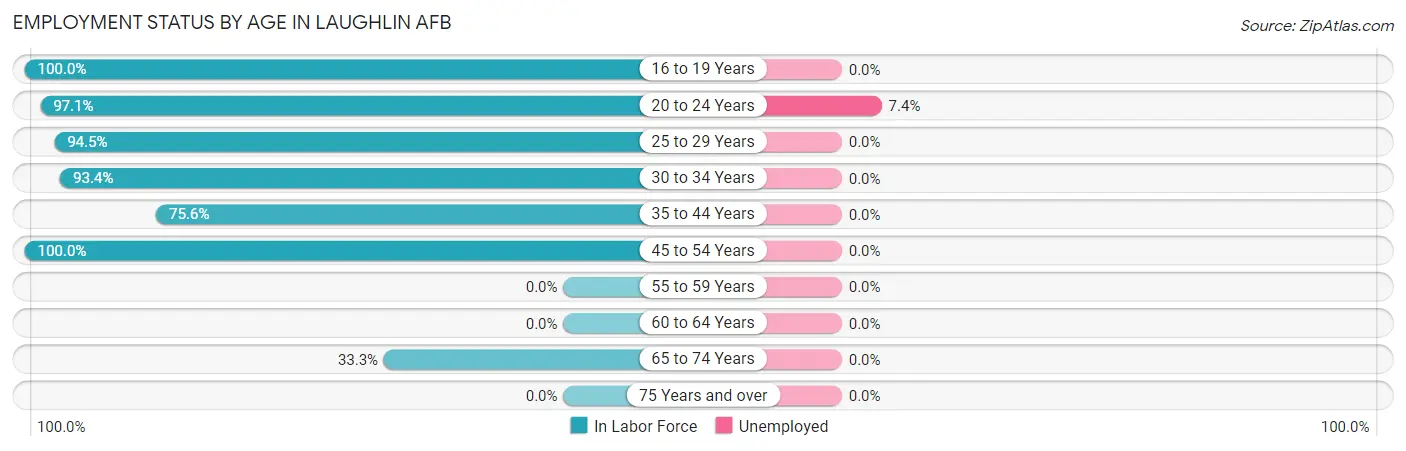
| Age Bracket | In Labor Force | Unemployed |
| 16 to 19 Years | 116 (100.0%) | 0 (0.0%) |
| 20 to 24 Years | 748 (97.1%) | 55 (7.4%) |
| 25 to 29 Years | 503 (94.5%) | 0 (0.0%) |
| 30 to 34 Years | 99 (93.4%) | 0 (0.0%) |
| 35 to 44 Years | 65 (75.6%) | 0 (0.0%) |
| 45 to 54 Years | 15 (100.0%) | 0 (0.0%) |
| 55 to 59 Years | 0 (0.0%) | 0 (0.0%) |
| 60 to 64 Years | 0 (0.0%) | 0 (0.0%) |
| 65 to 74 Years | 4 (33.3%) | 0 (0.0%) |
| 75 Years and over | 0 (0.0%) | 0 (0.0%) |
| Total | 1,551 (94.5%) | 39 (2.5%) |
Employment Status by Educational Attainment in Laughlin AFB
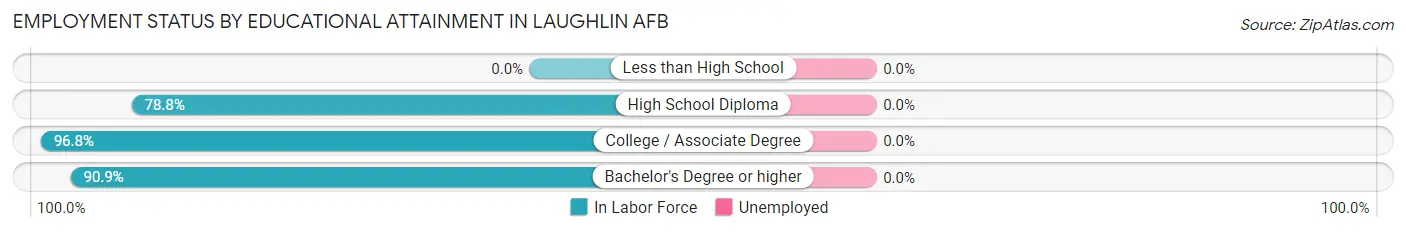
| Educational Attainment | In Labor Force | Unemployed |
| Less than High School | 0 (0.0%) | 0 (0.0%) |
| High School Diploma | 41 (78.8%) | 0 (0.0%) |
| College / Associate Degree | 213 (96.8%) | 0 (0.0%) |
| Bachelor's Degree or higher | 428 (90.9%) | 0 (0.0%) |
| Total | 682 (91.8%) | 0 (0.0%) |
Employment Occupations by Sex in Laughlin AFB
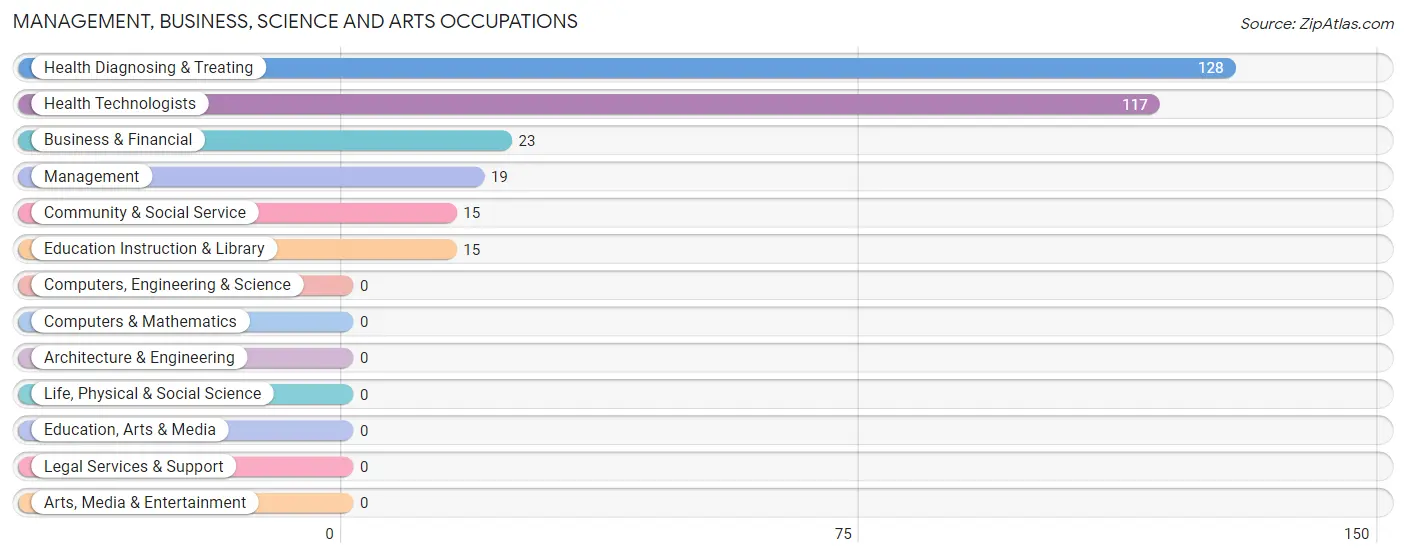
Management, Business, Science and Arts Occupations
The most common Management, Business, Science and Arts occupations in Laughlin AFB are Health Diagnosing & Treating (128 | 33.0%), Health Technologists (117 | 30.1%), Business & Financial (23 | 5.9%), Management (19 | 4.9%), and Community & Social Service (15 | 3.9%).
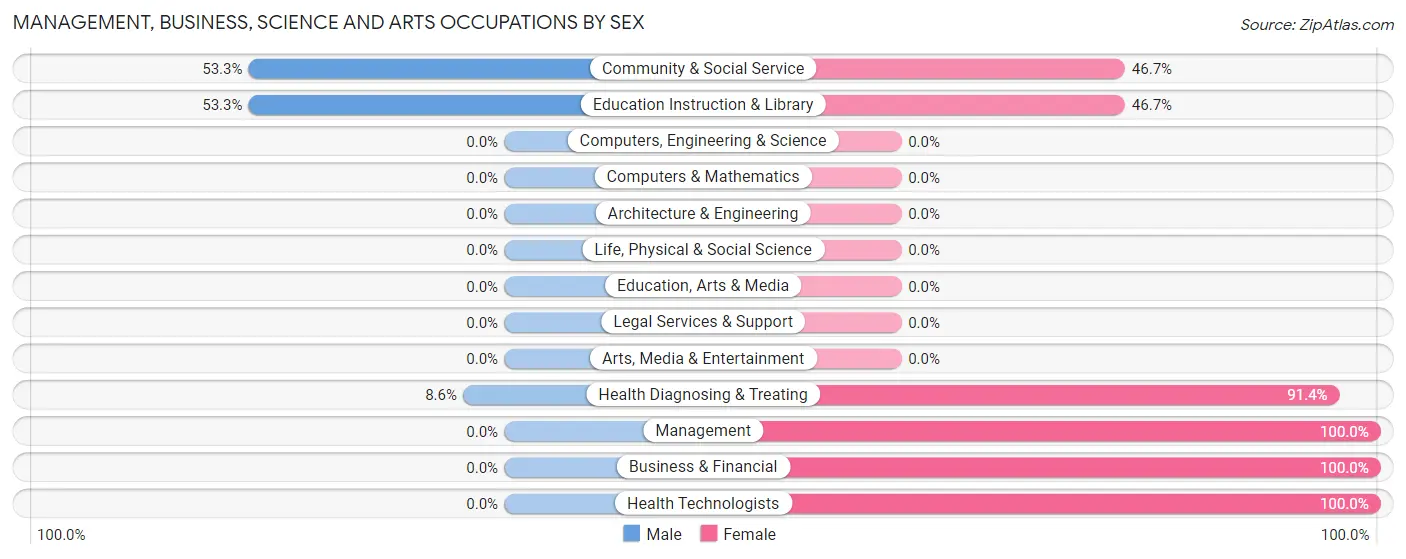
Management, Business, Science and Arts Occupations by Sex
Within the Management, Business, Science and Arts occupations in Laughlin AFB, the most male-oriented occupations are Community & Social Service (53.3%), Education Instruction & Library (53.3%), and Health Diagnosing & Treating (8.6%), while the most female-oriented occupations are Management (100.0%), Business & Financial (100.0%), and Health Technologists (100.0%).
| Occupation | Male | Female |
| Management | 0 (0.0%) | 19 (100.0%) |
| Business & Financial | 0 (0.0%) | 23 (100.0%) |
| Computers, Engineering & Science | 0 (0.0%) | 0 (0.0%) |
| Computers & Mathematics | 0 (0.0%) | 0 (0.0%) |
| Architecture & Engineering | 0 (0.0%) | 0 (0.0%) |
| Life, Physical & Social Science | 0 (0.0%) | 0 (0.0%) |
| Community & Social Service | 8 (53.3%) | 7 (46.7%) |
| Education, Arts & Media | 0 (0.0%) | 0 (0.0%) |
| Legal Services & Support | 0 (0.0%) | 0 (0.0%) |
| Education Instruction & Library | 8 (53.3%) | 7 (46.7%) |
| Arts, Media & Entertainment | 0 (0.0%) | 0 (0.0%) |
| Health Diagnosing & Treating | 11 (8.6%) | 117 (91.4%) |
| Health Technologists | 0 (0.0%) | 117 (100.0%) |
| Total (Category) | 19 (10.3%) | 166 (89.7%) |
| Total (Overall) | 162 (41.7%) | 226 (58.3%) |
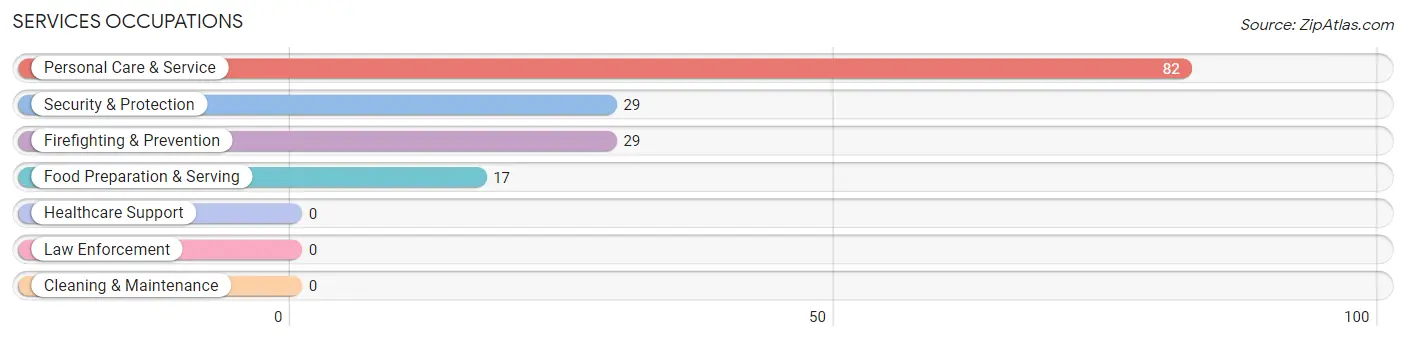
Services Occupations
The most common Services occupations in Laughlin AFB are Personal Care & Service (82 | 21.1%), Security & Protection (29 | 7.5%), Firefighting & Prevention (29 | 7.5%), and Food Preparation & Serving (17 | 4.4%).
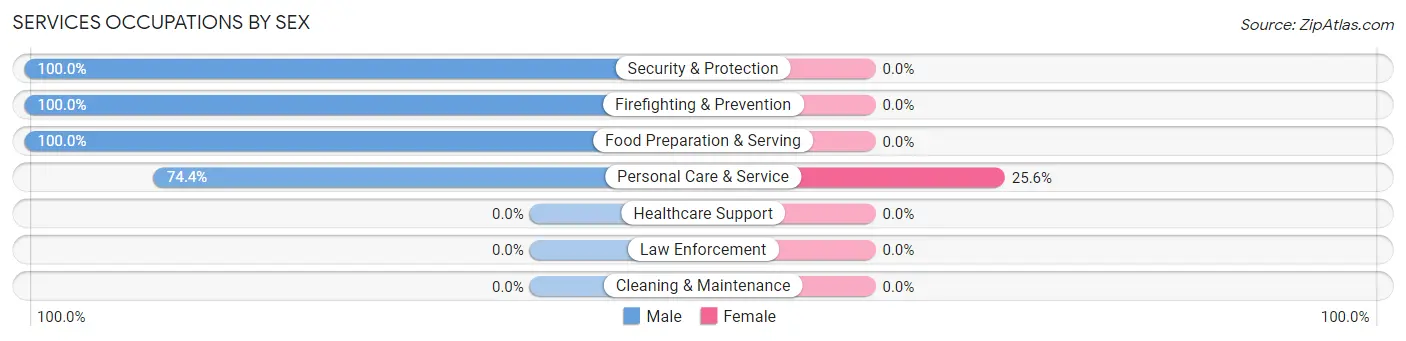
Services Occupations by Sex
| Occupation | Male | Female |
| Healthcare Support | 0 (0.0%) | 0 (0.0%) |
| Security & Protection | 29 (100.0%) | 0 (0.0%) |
| Firefighting & Prevention | 29 (100.0%) | 0 (0.0%) |
| Law Enforcement | 0 (0.0%) | 0 (0.0%) |
| Food Preparation & Serving | 17 (100.0%) | 0 (0.0%) |
| Cleaning & Maintenance | 0 (0.0%) | 0 (0.0%) |
| Personal Care & Service | 61 (74.4%) | 21 (25.6%) |
| Total (Category) | 107 (83.6%) | 21 (16.4%) |
| Total (Overall) | 162 (41.7%) | 226 (58.3%) |
Sales and Office Occupations
The most common Sales and Office occupations in Laughlin AFB are Sales & Related (37 | 9.5%), and Office & Administration (18 | 4.6%).
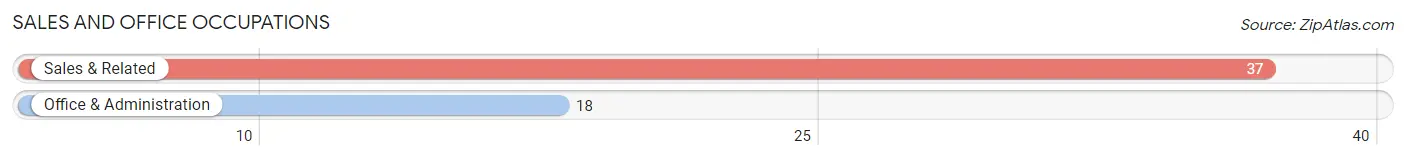
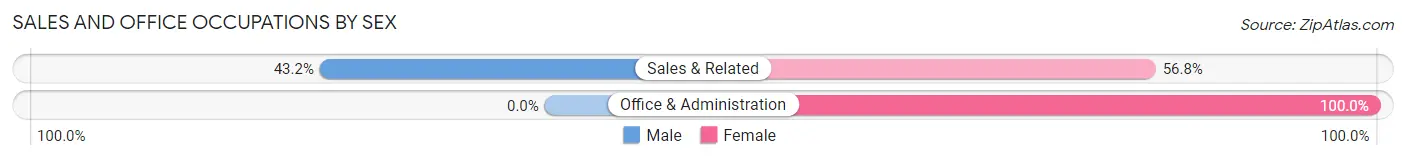
Sales and Office Occupations by Sex
| Occupation | Male | Female |
| Sales & Related | 16 (43.2%) | 21 (56.8%) |
| Office & Administration | 0 (0.0%) | 18 (100.0%) |
| Total (Category) | 16 (29.1%) | 39 (70.9%) |
| Total (Overall) | 162 (41.7%) | 226 (58.3%) |
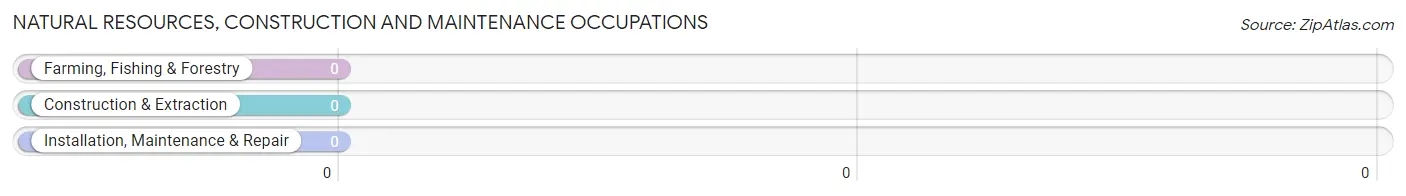
Natural Resources, Construction and Maintenance Occupations
Natural Resources, Construction and Maintenance Occupations by Sex
| Occupation | Male | Female |
| Farming, Fishing & Forestry | 0 (0.0%) | 0 (0.0%) |
| Construction & Extraction | 0 (0.0%) | 0 (0.0%) |
| Installation, Maintenance & Repair | 0 (0.0%) | 0 (0.0%) |
| Total (Category) | 0 (0.0%) | 0 (0.0%) |
| Total (Overall) | 162 (41.7%) | 226 (58.3%) |
Production, Transportation and Moving Occupations
The most common Production, Transportation and Moving occupations in Laughlin AFB are Material Moving (16 | 4.1%), and Transportation (4 | 1.0%).
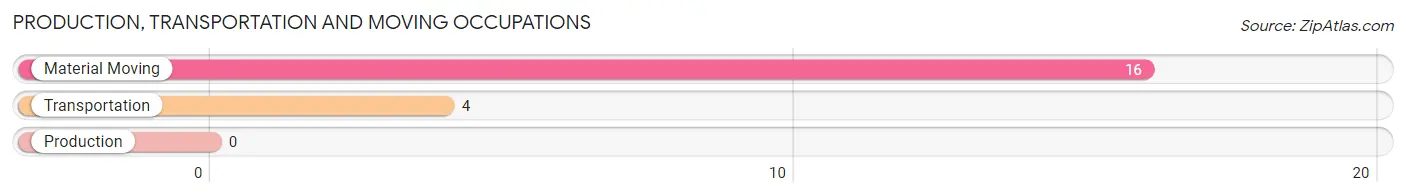
Production, Transportation and Moving Occupations by Sex
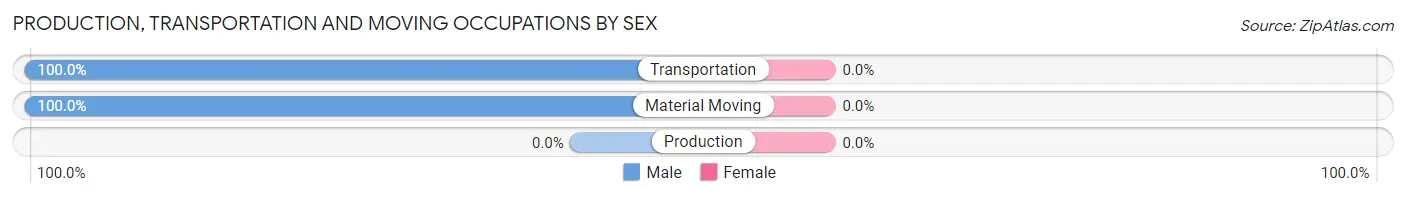
| Occupation | Male | Female |
| Production | 0 (0.0%) | 0 (0.0%) |
| Transportation | 4 (100.0%) | 0 (0.0%) |
| Material Moving | 16 (100.0%) | 0 (0.0%) |
| Total (Category) | 20 (100.0%) | 0 (0.0%) |
| Total (Overall) | 162 (41.7%) | 226 (58.3%) |
Employment Industries by Sex in Laughlin AFB
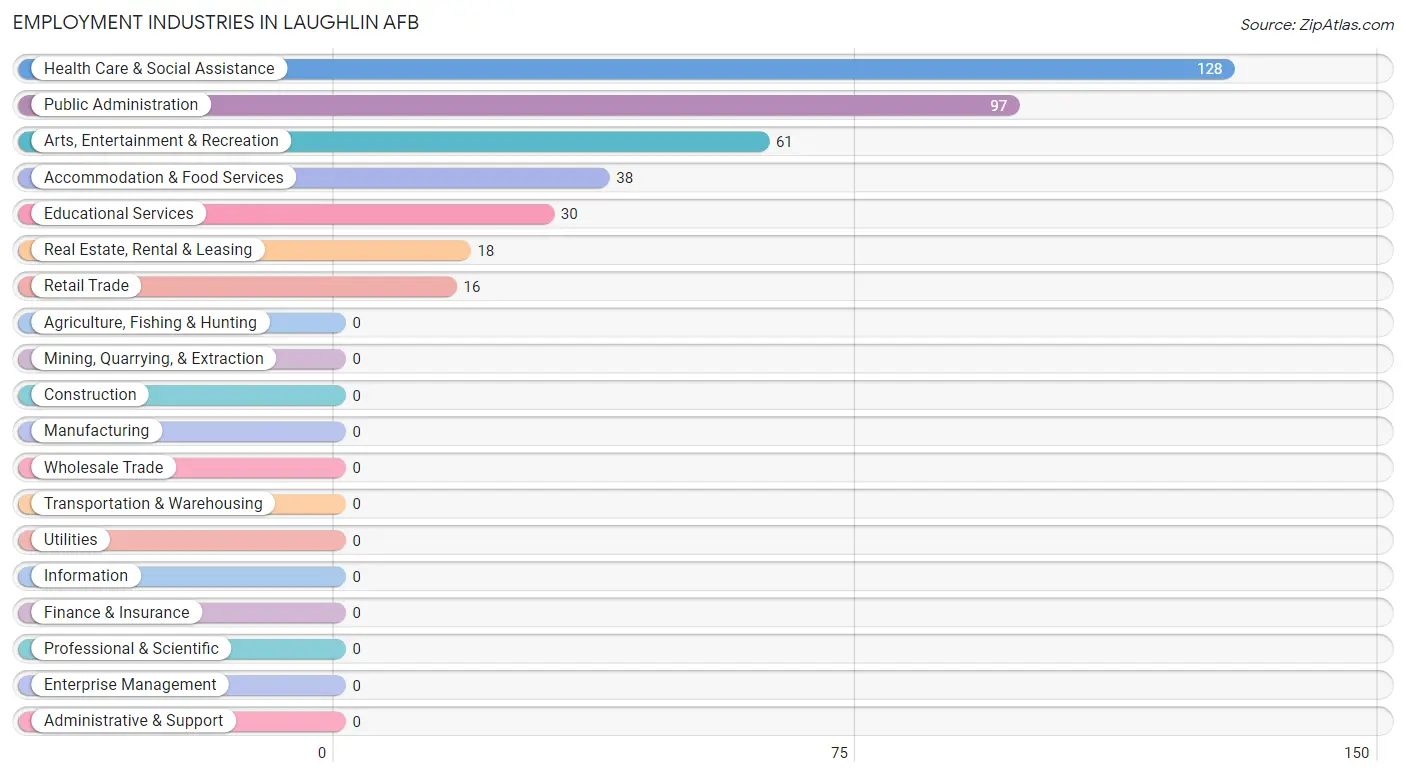
Employment Industries in Laughlin AFB
The major employment industries in Laughlin AFB include Health Care & Social Assistance (128 | 33.0%), Public Administration (97 | 25.0%), Arts, Entertainment & Recreation (61 | 15.7%), Accommodation & Food Services (38 | 9.8%), and Educational Services (30 | 7.7%).
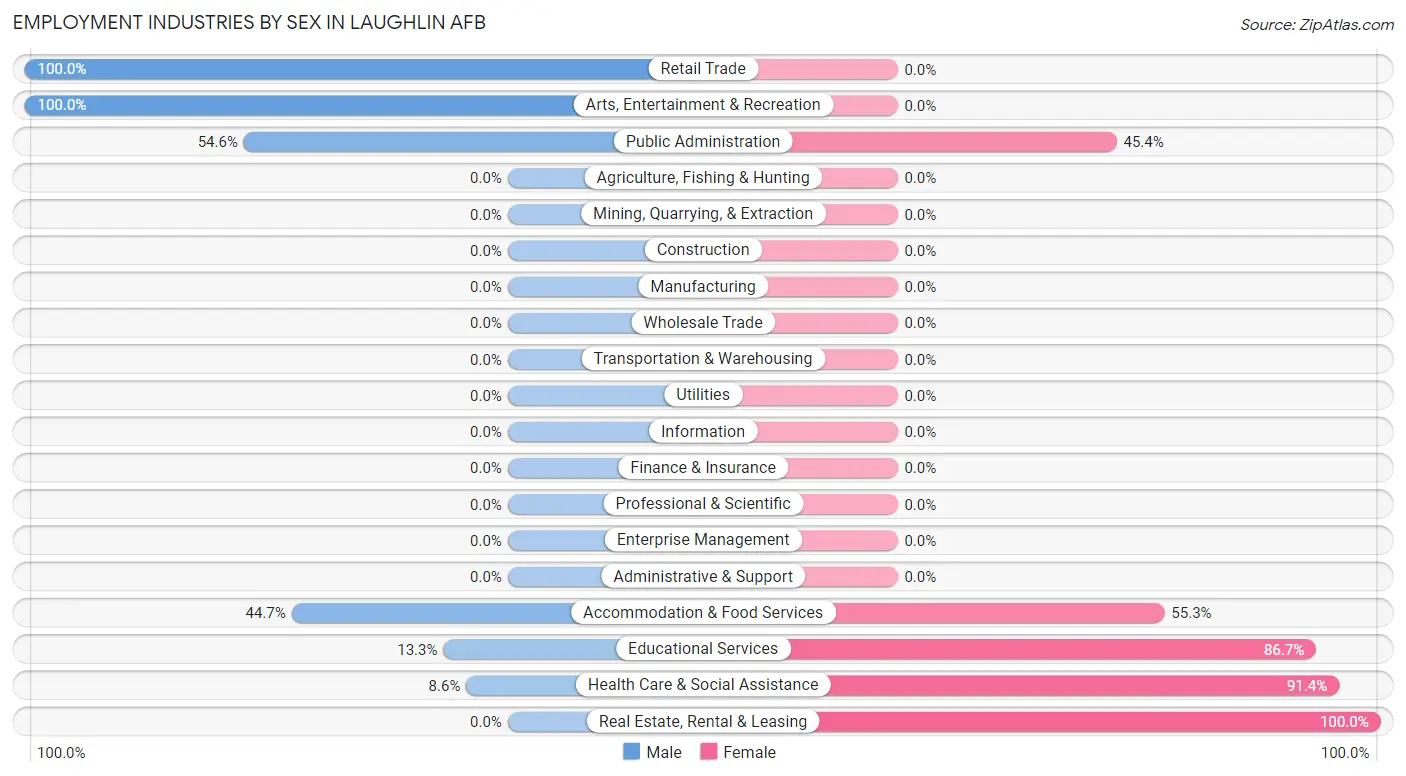
Employment Industries by Sex in Laughlin AFB
The Laughlin AFB industries that see more men than women are Retail Trade (100.0%), Arts, Entertainment & Recreation (100.0%), and Public Administration (54.6%), whereas the industries that tend to have a higher number of women are Real Estate, Rental & Leasing (100.0%), Health Care & Social Assistance (91.4%), and Educational Services (86.7%).
| Industry | Male | Female |
| Agriculture, Fishing & Hunting | 0 (0.0%) | 0 (0.0%) |
| Mining, Quarrying, & Extraction | 0 (0.0%) | 0 (0.0%) |
| Construction | 0 (0.0%) | 0 (0.0%) |
| Manufacturing | 0 (0.0%) | 0 (0.0%) |
| Wholesale Trade | 0 (0.0%) | 0 (0.0%) |
| Retail Trade | 16 (100.0%) | 0 (0.0%) |
| Transportation & Warehousing | 0 (0.0%) | 0 (0.0%) |
| Utilities | 0 (0.0%) | 0 (0.0%) |
| Information | 0 (0.0%) | 0 (0.0%) |
| Finance & Insurance | 0 (0.0%) | 0 (0.0%) |
| Real Estate, Rental & Leasing | 0 (0.0%) | 18 (100.0%) |
| Professional & Scientific | 0 (0.0%) | 0 (0.0%) |
| Enterprise Management | 0 (0.0%) | 0 (0.0%) |
| Administrative & Support | 0 (0.0%) | 0 (0.0%) |
| Educational Services | 4 (13.3%) | 26 (86.7%) |
| Health Care & Social Assistance | 11 (8.6%) | 117 (91.4%) |
| Arts, Entertainment & Recreation | 61 (100.0%) | 0 (0.0%) |
| Accommodation & Food Services | 17 (44.7%) | 21 (55.3%) |
| Public Administration | 53 (54.6%) | 44 (45.4%) |
| Total | 162 (41.7%) | 226 (58.3%) |
Education in Laughlin AFB
School Enrollment in Laughlin AFB
The most common levels of schooling among the 249 students in Laughlin AFB are college / undergraduate (128 | 51.4%), graduate / professional (50 | 20.1%), and elementary school (43 | 17.3%).
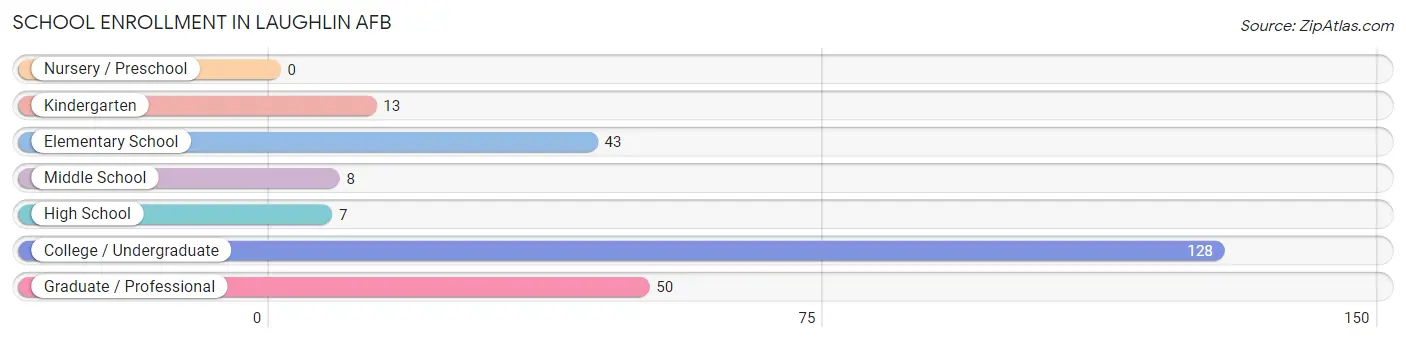
| School Level | # Students | % Students |
| Nursery / Preschool | 0 | 0.0% |
| Kindergarten | 13 | 5.2% |
| Elementary School | 43 | 17.3% |
| Middle School | 8 | 3.2% |
| High School | 7 | 2.8% |
| College / Undergraduate | 128 | 51.4% |
| Graduate / Professional | 50 | 20.1% |
| Total | 249 | 100.0% |
School Enrollment by Age by Funding Source in Laughlin AFB
Out of a total of 249 students who are enrolled in schools in Laughlin AFB, 91 (36.5%) attend a private institution, while the remaining 158 (63.5%) are enrolled in public schools. The age group of 10 to 14 year olds has the highest likelihood of being enrolled in private schools, with 16 (100.0% in the age bracket) enrolled. Conversely, the age group of 5 to 9 year old has the lowest likelihood of being enrolled in a private school, with 48 (100.0% in the age bracket) attending a public institution.
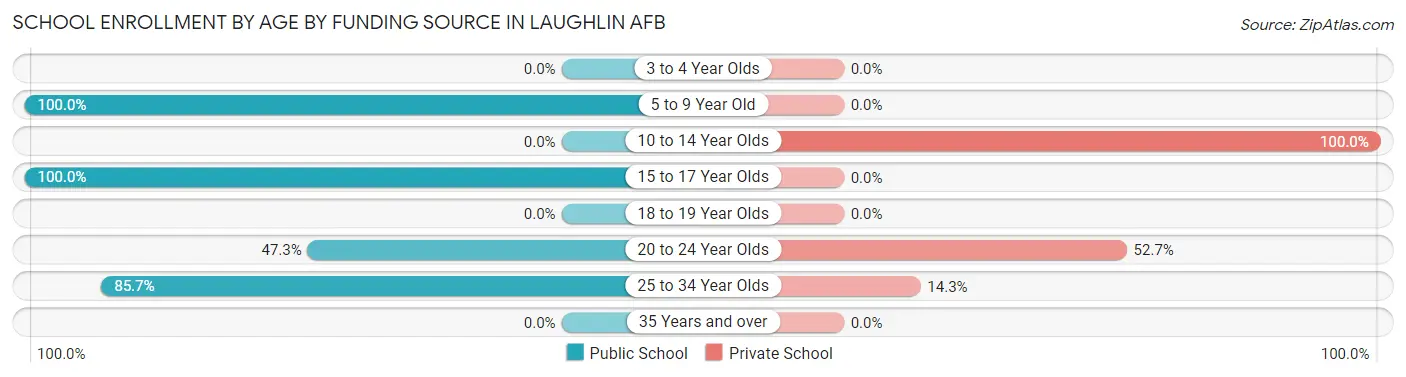
| Age Bracket | Public School | Private School |
| 3 to 4 Year Olds | 0 (0.0%) | 0 (0.0%) |
| 5 to 9 Year Old | 48 (100.0%) | 0 (0.0%) |
| 10 to 14 Year Olds | 0 (0.0%) | 16 (100.0%) |
| 15 to 17 Year Olds | 7 (100.0%) | 0 (0.0%) |
| 18 to 19 Year Olds | 0 (0.0%) | 0 (0.0%) |
| 20 to 24 Year Olds | 61 (47.3%) | 68 (52.7%) |
| 25 to 34 Year Olds | 42 (85.7%) | 7 (14.3%) |
| 35 Years and over | 0 (0.0%) | 0 (0.0%) |
| Total | 158 (63.5%) | 91 (36.5%) |
Educational Attainment by Field of Study in Laughlin AFB
Science & technology (137 | 25.5%), engineering (90 | 16.8%), business (61 | 11.4%), physical & health sciences (60 | 11.2%), and computers & mathematics (36 | 6.7%) are the most common fields of study among 537 individuals in Laughlin AFB who have obtained a bachelor's degree or higher.
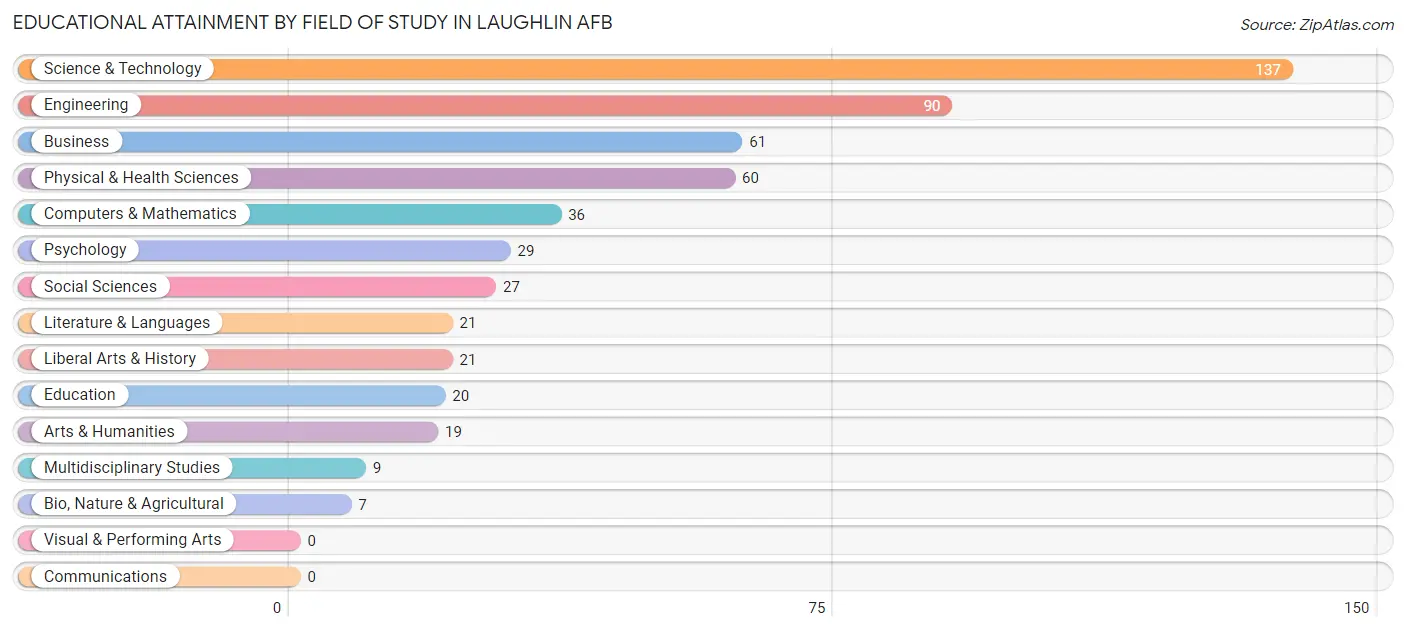
| Field of Study | # Graduates | % Graduates |
| Computers & Mathematics | 36 | 6.7% |
| Bio, Nature & Agricultural | 7 | 1.3% |
| Physical & Health Sciences | 60 | 11.2% |
| Psychology | 29 | 5.4% |
| Social Sciences | 27 | 5.0% |
| Engineering | 90 | 16.8% |
| Multidisciplinary Studies | 9 | 1.7% |
| Science & Technology | 137 | 25.5% |
| Business | 61 | 11.4% |
| Education | 20 | 3.7% |
| Literature & Languages | 21 | 3.9% |
| Liberal Arts & History | 21 | 3.9% |
| Visual & Performing Arts | 0 | 0.0% |
| Communications | 0 | 0.0% |
| Arts & Humanities | 19 | 3.5% |
| Total | 537 | 100.0% |
Transportation & Commute in Laughlin AFB
Vehicle Availability by Sex in Laughlin AFB
The most prevalent vehicle ownership categories in Laughlin AFB are males with 2 vehicles (324, accounting for 52.6%) and females with 2 vehicles (209, making up 95.6%).
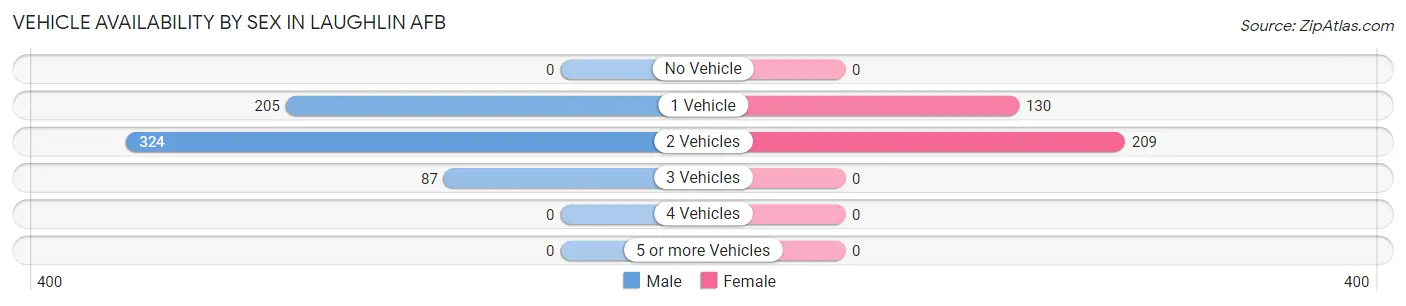
| Vehicles Available | Male | Female |
| No Vehicle | 0 (0.0%) | 0 (0.0%) |
| 1 Vehicle | 205 (33.3%) | 130 (38.4%) |
| 2 Vehicles | 324 (52.6%) | 209 (61.7%) |
| 3 Vehicles | 87 (14.1%) | 0 (0.0%) |
| 4 Vehicles | 0 (0.0%) | 0 (0.0%) |
| 5 or more Vehicles | 0 (0.0%) | 0 (0.0%) |
| Total | 616 (100.0%) | 339 (100.0%) |
Commute Time in Laughlin AFB
The most frequently occuring commute durations in Laughlin AFB are 5 to 9 minutes (690 commuters, 46.2%), less than 5 minutes (340 commuters, 22.7%), and 10 to 14 minutes (244 commuters, 16.3%).
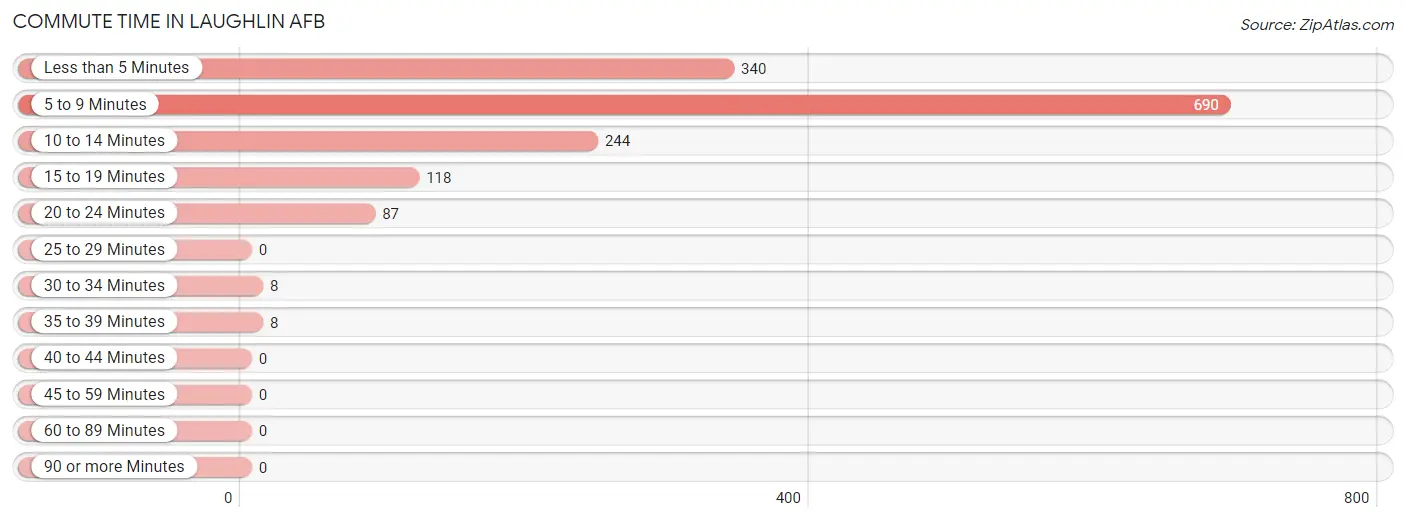
| Commute Time | # Commuters | % Commuters |
| Less than 5 Minutes | 340 | 22.7% |
| 5 to 9 Minutes | 690 | 46.2% |
| 10 to 14 Minutes | 244 | 16.3% |
| 15 to 19 Minutes | 118 | 7.9% |
| 20 to 24 Minutes | 87 | 5.8% |
| 25 to 29 Minutes | 0 | 0.0% |
| 30 to 34 Minutes | 8 | 0.5% |
| 35 to 39 Minutes | 8 | 0.5% |
| 40 to 44 Minutes | 0 | 0.0% |
| 45 to 59 Minutes | 0 | 0.0% |
| 60 to 89 Minutes | 0 | 0.0% |
| 90 or more Minutes | 0 | 0.0% |
Commute Time by Sex in Laughlin AFB
The most common commute times in Laughlin AFB are 5 to 9 minutes (489 commuters, 47.6%) for males and 5 to 9 minutes (201 commuters, 42.9%) for females.
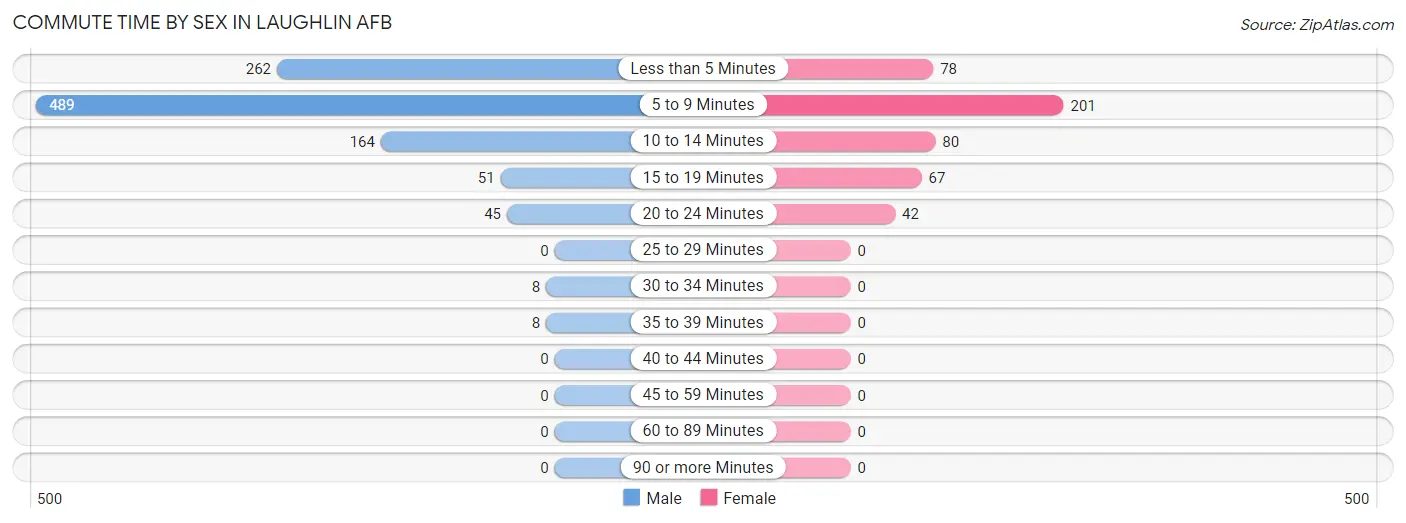
| Commute Time | Male | Female |
| Less than 5 Minutes | 262 (25.5%) | 78 (16.7%) |
| 5 to 9 Minutes | 489 (47.6%) | 201 (42.9%) |
| 10 to 14 Minutes | 164 (16.0%) | 80 (17.1%) |
| 15 to 19 Minutes | 51 (5.0%) | 67 (14.3%) |
| 20 to 24 Minutes | 45 (4.4%) | 42 (9.0%) |
| 25 to 29 Minutes | 0 (0.0%) | 0 (0.0%) |
| 30 to 34 Minutes | 8 (0.8%) | 0 (0.0%) |
| 35 to 39 Minutes | 8 (0.8%) | 0 (0.0%) |
| 40 to 44 Minutes | 0 (0.0%) | 0 (0.0%) |
| 45 to 59 Minutes | 0 (0.0%) | 0 (0.0%) |
| 60 to 89 Minutes | 0 (0.0%) | 0 (0.0%) |
| 90 or more Minutes | 0 (0.0%) | 0 (0.0%) |
Time of Departure to Work by Sex in Laughlin AFB
The most frequent times of departure to work in Laughlin AFB are 7:00 AM to 7:29 AM (213, 20.7%) for males and 12:00 PM to 3:59 PM (100, 21.4%) for females.
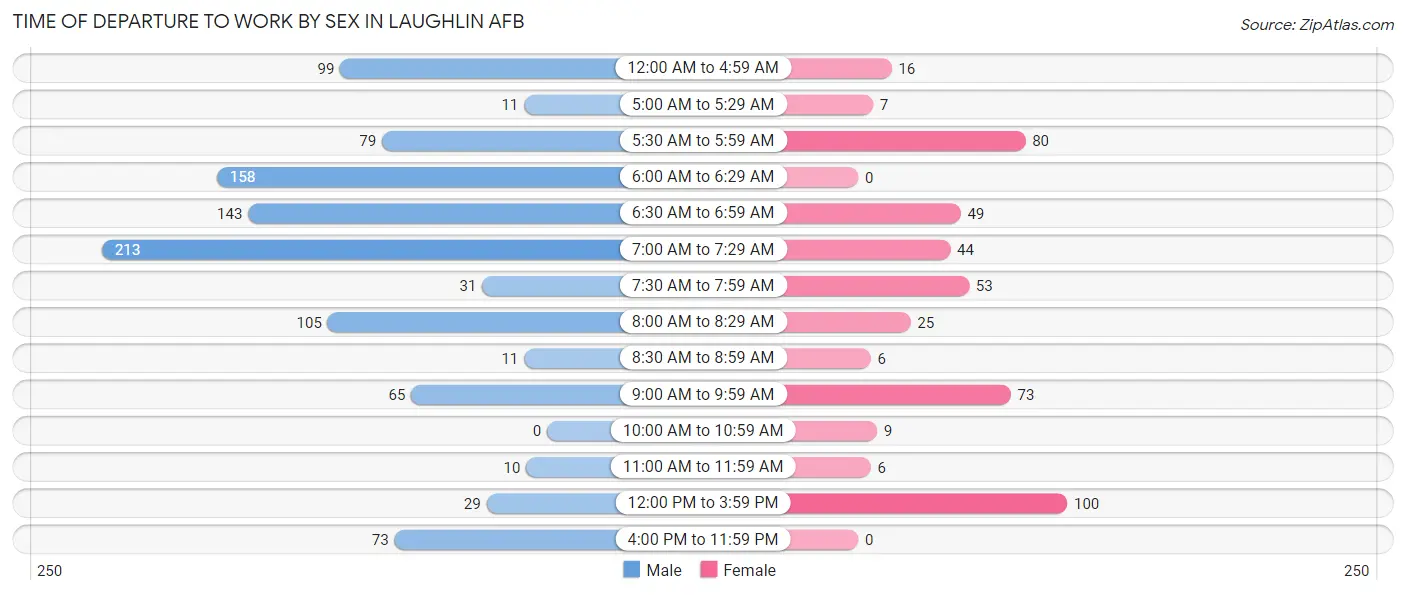
| Time of Departure | Male | Female |
| 12:00 AM to 4:59 AM | 99 (9.6%) | 16 (3.4%) |
| 5:00 AM to 5:29 AM | 11 (1.1%) | 7 (1.5%) |
| 5:30 AM to 5:59 AM | 79 (7.7%) | 80 (17.1%) |
| 6:00 AM to 6:29 AM | 158 (15.4%) | 0 (0.0%) |
| 6:30 AM to 6:59 AM | 143 (13.9%) | 49 (10.5%) |
| 7:00 AM to 7:29 AM | 213 (20.7%) | 44 (9.4%) |
| 7:30 AM to 7:59 AM | 31 (3.0%) | 53 (11.3%) |
| 8:00 AM to 8:29 AM | 105 (10.2%) | 25 (5.3%) |
| 8:30 AM to 8:59 AM | 11 (1.1%) | 6 (1.3%) |
| 9:00 AM to 9:59 AM | 65 (6.3%) | 73 (15.6%) |
| 10:00 AM to 10:59 AM | 0 (0.0%) | 9 (1.9%) |
| 11:00 AM to 11:59 AM | 10 (1.0%) | 6 (1.3%) |
| 12:00 PM to 3:59 PM | 29 (2.8%) | 100 (21.4%) |
| 4:00 PM to 11:59 PM | 73 (7.1%) | 0 (0.0%) |
| Total | 1,027 (100.0%) | 468 (100.0%) |
Housing Occupancy in Laughlin AFB
Occupancy by Ownership in Laughlin AFB
Of the total 684 dwellings in Laughlin AFB, owner-occupied units account for 0 (0.0%), while renter-occupied units make up 684 (100.0%).
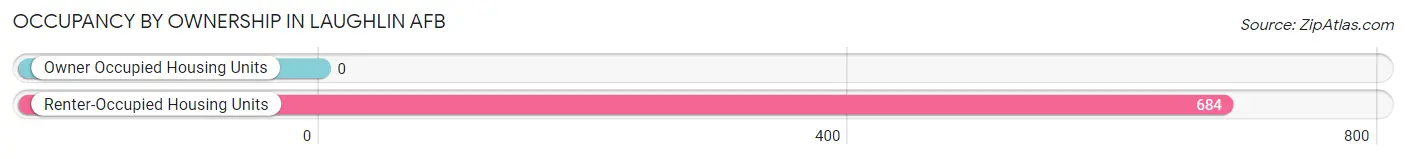
| Occupancy | # Housing Units | % Housing Units |
| Owner Occupied Housing Units | 0 | 0.0% |
| Renter-Occupied Housing Units | 684 | 100.0% |
| Total Occupied Housing Units | 684 | 100.0% |
Occupancy by Household Size in Laughlin AFB
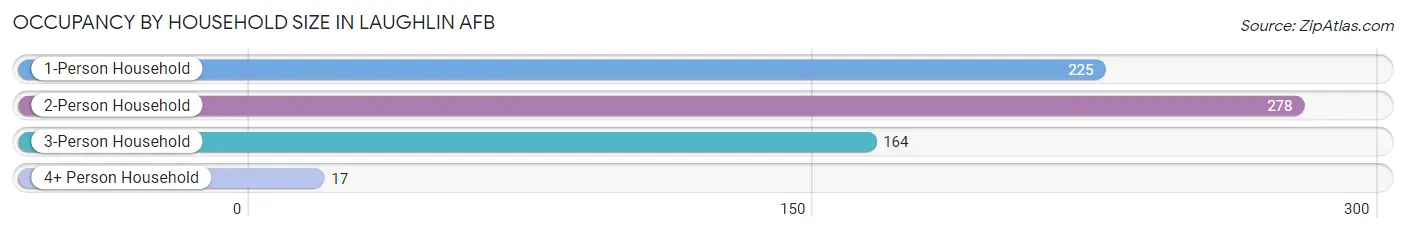
| Household Size | # Housing Units | % Housing Units |
| 1-Person Household | 225 | 32.9% |
| 2-Person Household | 278 | 40.6% |
| 3-Person Household | 164 | 24.0% |
| 4+ Person Household | 17 | 2.5% |
| Total Housing Units | 684 | 100.0% |
Occupancy by Ownership by Household Size in Laughlin AFB
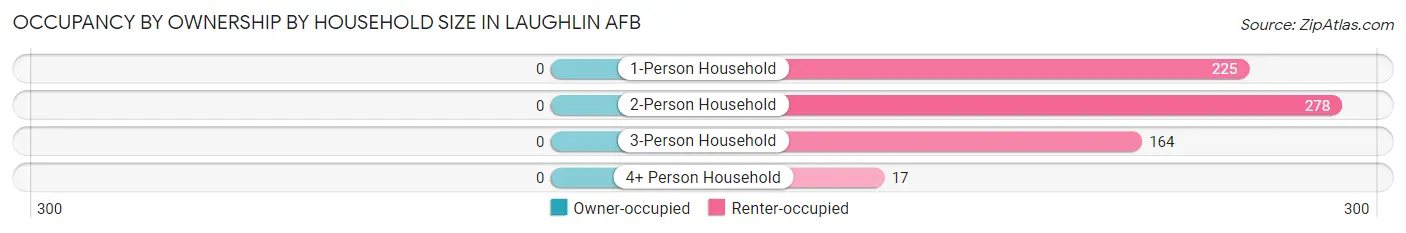
| Household Size | Owner-occupied | Renter-occupied |
| 1-Person Household | 0 (0.0%) | 225 (100.0%) |
| 2-Person Household | 0 (0.0%) | 278 (100.0%) |
| 3-Person Household | 0 (0.0%) | 164 (100.0%) |
| 4+ Person Household | 0 (0.0%) | 17 (100.0%) |
| Total Housing Units | 0 (0.0%) | 684 (100.0%) |
Occupancy by Educational Attainment in Laughlin AFB
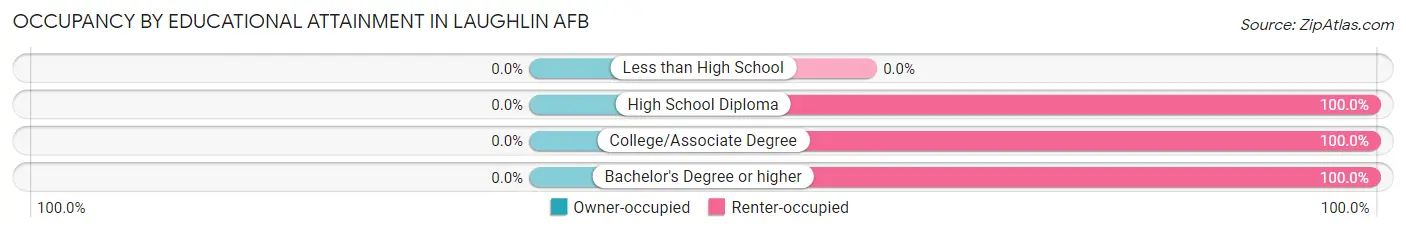
| Household Size | Owner-occupied | Renter-occupied |
| Less than High School | 0 (0.0%) | 0 (0.0%) |
| High School Diploma | 0 (0.0%) | 41 (100.0%) |
| College/Associate Degree | 0 (0.0%) | 139 (100.0%) |
| Bachelor's Degree or higher | 0 (0.0%) | 504 (100.0%) |
Occupancy by Age of Householder in Laughlin AFB
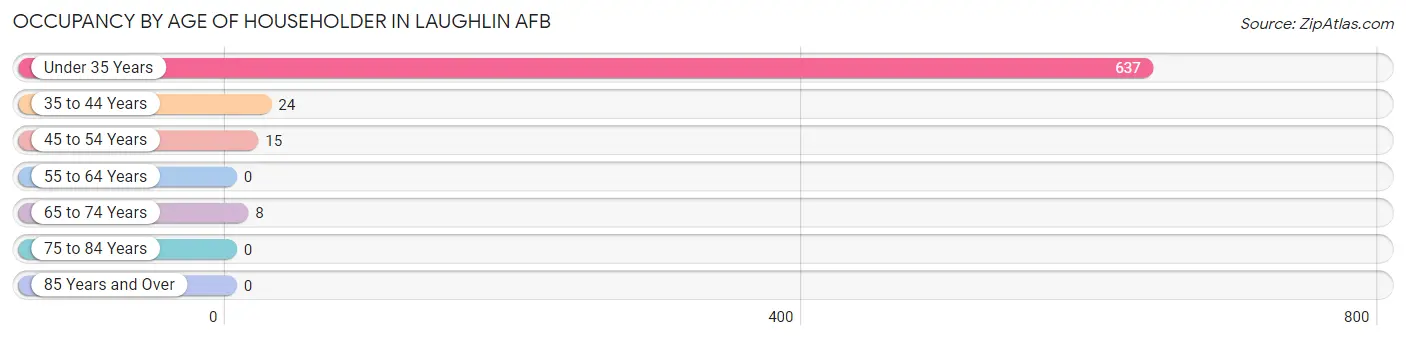
| Age Bracket | # Households | % Households |
| Under 35 Years | 637 | 93.1% |
| 35 to 44 Years | 24 | 3.5% |
| 45 to 54 Years | 15 | 2.2% |
| 55 to 64 Years | 0 | 0.0% |
| 65 to 74 Years | 8 | 1.2% |
| 75 to 84 Years | 0 | 0.0% |
| 85 Years and Over | 0 | 0.0% |
| Total | 684 | 100.0% |
Housing Finances in Laughlin AFB
Median Income by Occupancy in Laughlin AFB
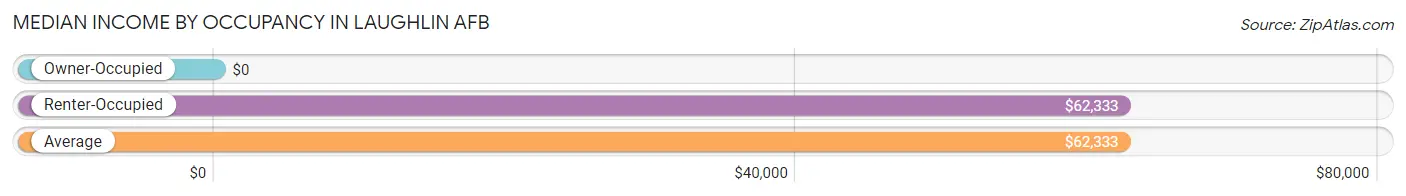
| Occupancy Type | # Households | Median Income |
| Owner-Occupied | 0 (0.0%) | $0 |
| Renter-Occupied | 684 (100.0%) | $62,333 |
| Average | 684 (100.0%) | $62,333 |
Occupancy by Householder Income Bracket in Laughlin AFB
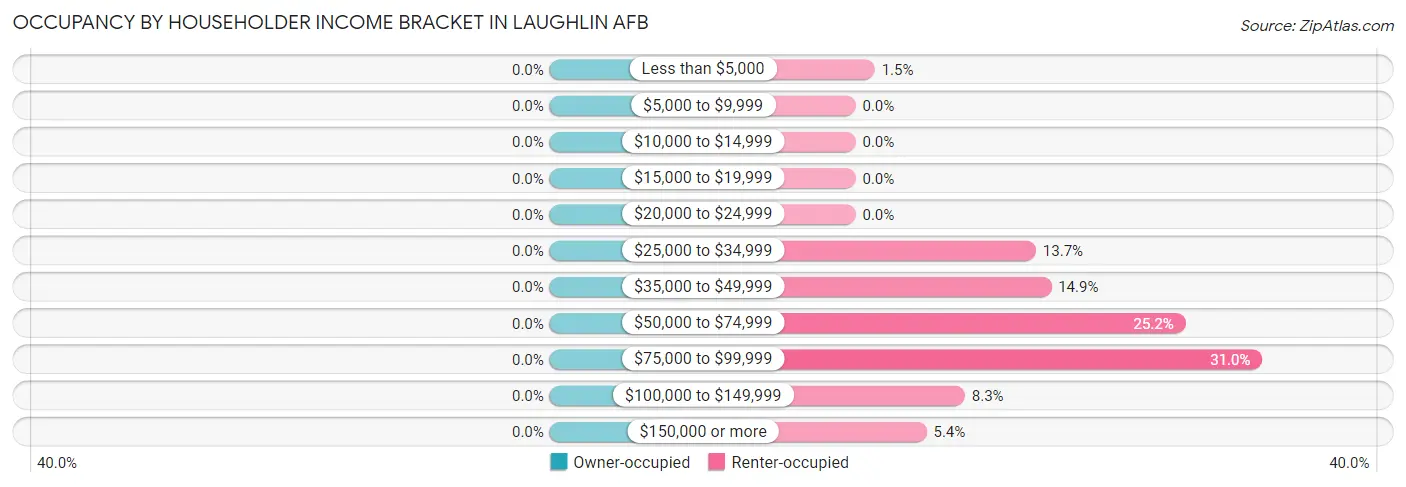
| Income Bracket | Owner-occupied | Renter-occupied |
| Less than $5,000 | 0 (0.0%) | 10 (1.5%) |
| $5,000 to $9,999 | 0 (0.0%) | 0 (0.0%) |
| $10,000 to $14,999 | 0 (0.0%) | 0 (0.0%) |
| $15,000 to $19,999 | 0 (0.0%) | 0 (0.0%) |
| $20,000 to $24,999 | 0 (0.0%) | 0 (0.0%) |
| $25,000 to $34,999 | 0 (0.0%) | 94 (13.7%) |
| $35,000 to $49,999 | 0 (0.0%) | 102 (14.9%) |
| $50,000 to $74,999 | 0 (0.0%) | 172 (25.2%) |
| $75,000 to $99,999 | 0 (0.0%) | 212 (31.0%) |
| $100,000 to $149,999 | 0 (0.0%) | 57 (8.3%) |
| $150,000 or more | 0 (0.0%) | 37 (5.4%) |
| Total | 0 (0.0%) | 684 (100.0%) |
Monthly Housing Cost Tiers in Laughlin AFB
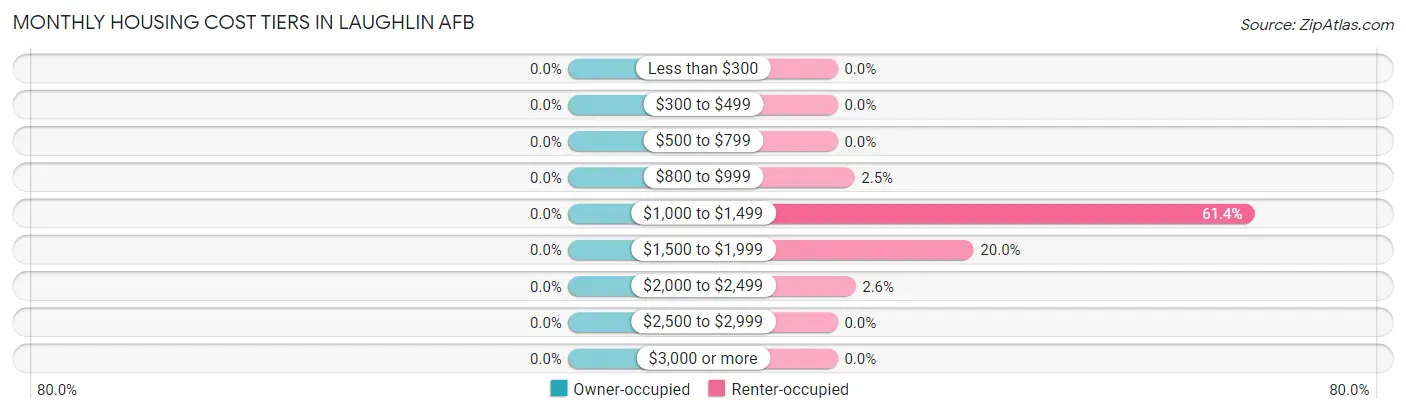
| Monthly Cost | Owner-occupied | Renter-occupied |
| Less than $300 | 0 (0.0%) | 0 (0.0%) |
| $300 to $499 | 0 (0.0%) | 0 (0.0%) |
| $500 to $799 | 0 (0.0%) | 0 (0.0%) |
| $800 to $999 | 0 (0.0%) | 17 (2.5%) |
| $1,000 to $1,499 | 0 (0.0%) | 420 (61.4%) |
| $1,500 to $1,999 | 0 (0.0%) | 137 (20.0%) |
| $2,000 to $2,499 | 0 (0.0%) | 18 (2.6%) |
| $2,500 to $2,999 | 0 (0.0%) | 0 (0.0%) |
| $3,000 or more | 0 (0.0%) | 0 (0.0%) |
| Total | 0 (0.0%) | 684 (100.0%) |
Physical Housing Characteristics in Laughlin AFB
Housing Structures in Laughlin AFB
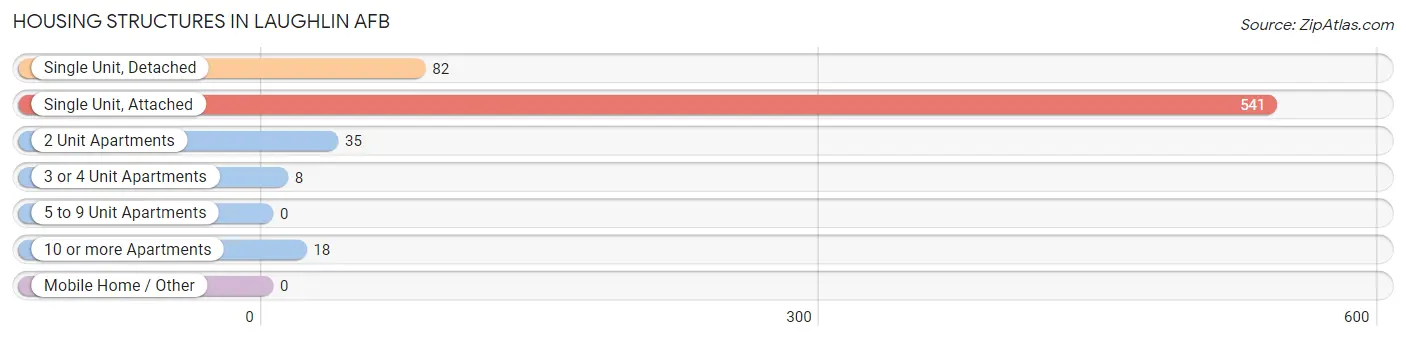
| Structure Type | # Housing Units | % Housing Units |
| Single Unit, Detached | 82 | 12.0% |
| Single Unit, Attached | 541 | 79.1% |
| 2 Unit Apartments | 35 | 5.1% |
| 3 or 4 Unit Apartments | 8 | 1.2% |
| 5 to 9 Unit Apartments | 0 | 0.0% |
| 10 or more Apartments | 18 | 2.6% |
| Mobile Home / Other | 0 | 0.0% |
| Total | 684 | 100.0% |
Housing Structures by Occupancy in Laughlin AFB
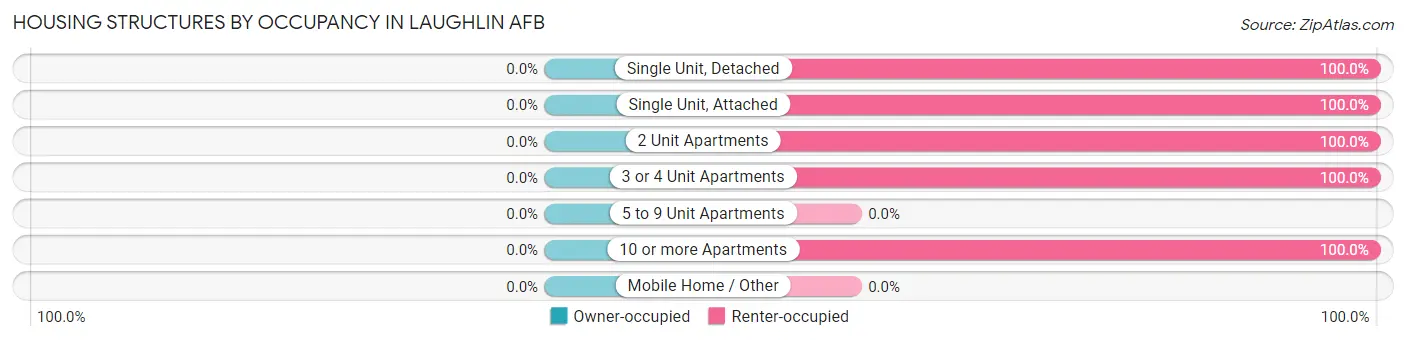
| Structure Type | Owner-occupied | Renter-occupied |
| Single Unit, Detached | 0 (0.0%) | 82 (100.0%) |
| Single Unit, Attached | 0 (0.0%) | 541 (100.0%) |
| 2 Unit Apartments | 0 (0.0%) | 35 (100.0%) |
| 3 or 4 Unit Apartments | 0 (0.0%) | 8 (100.0%) |
| 5 to 9 Unit Apartments | 0 (0.0%) | 0 (0.0%) |
| 10 or more Apartments | 0 (0.0%) | 18 (100.0%) |
| Mobile Home / Other | 0 (0.0%) | 0 (0.0%) |
| Total | 0 (0.0%) | 684 (100.0%) |
Housing Structures by Number of Rooms in Laughlin AFB
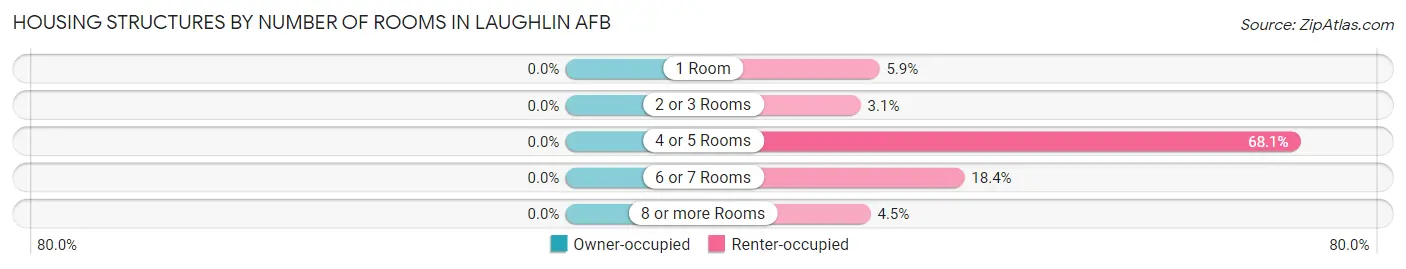
| Number of Rooms | Owner-occupied | Renter-occupied |
| 1 Room | 0 (0.0%) | 40 (5.9%) |
| 2 or 3 Rooms | 0 (0.0%) | 21 (3.1%) |
| 4 or 5 Rooms | 0 (0.0%) | 466 (68.1%) |
| 6 or 7 Rooms | 0 (0.0%) | 126 (18.4%) |
| 8 or more Rooms | 0 (0.0%) | 31 (4.5%) |
| Total | 0 (0.0%) | 684 (100.0%) |
Housing Structure by Heating Type in Laughlin AFB
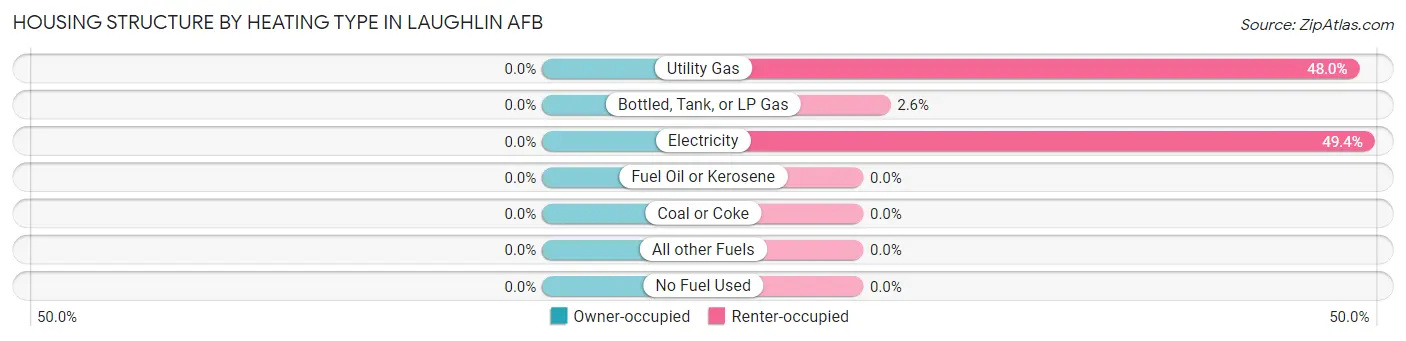
| Heating Type | Owner-occupied | Renter-occupied |
| Utility Gas | 0 (0.0%) | 328 (47.9%) |
| Bottled, Tank, or LP Gas | 0 (0.0%) | 18 (2.6%) |
| Electricity | 0 (0.0%) | 338 (49.4%) |
| Fuel Oil or Kerosene | 0 (0.0%) | 0 (0.0%) |
| Coal or Coke | 0 (0.0%) | 0 (0.0%) |
| All other Fuels | 0 (0.0%) | 0 (0.0%) |
| No Fuel Used | 0 (0.0%) | 0 (0.0%) |
| Total | 0 (0.0%) | 684 (100.0%) |
Household Vehicle Usage in Laughlin AFB
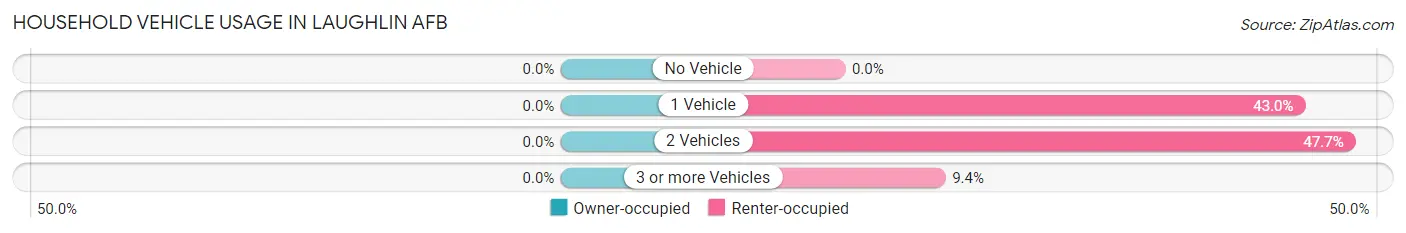
| Vehicles per Household | Owner-occupied | Renter-occupied |
| No Vehicle | 0 (0.0%) | 0 (0.0%) |
| 1 Vehicle | 0 (0.0%) | 294 (43.0%) |
| 2 Vehicles | 0 (0.0%) | 326 (47.7%) |
| 3 or more Vehicles | 0 (0.0%) | 64 (9.4%) |
| Total | 0 (0.0%) | 684 (100.0%) |
Real Estate & Mortgages in Laughlin AFB
Real Estate and Mortgage Overview in Laughlin AFB
| Characteristic | Without Mortgage | With Mortgage |
| Housing Units | 0 | 0 |
| Median Property Value | - | - |
| Median Household Income | - | - |
| Monthly Housing Costs | - | - |
| Real Estate Taxes | - | - |
Property Value by Mortgage Status in Laughlin AFB
| Property Value | Without Mortgage | With Mortgage |
| Less than $50,000 | 0 (0.0%) | 0 (0.0%) |
| $50,000 to $99,999 | 0 (0.0%) | 0 (0.0%) |
| $100,000 to $299,999 | 0 (0.0%) | 0 (0.0%) |
| $300,000 to $499,999 | 0 (0.0%) | 0 (0.0%) |
| $500,000 to $749,999 | 0 (0.0%) | 0 (0.0%) |
| $750,000 to $999,999 | 0 (0.0%) | 0 (0.0%) |
| $1,000,000 or more | 0 (0.0%) | 0 (0.0%) |
| Total | 0 (0.0%) | 0 (0.0%) |
Household Income by Mortgage Status in Laughlin AFB
| Household Income | Without Mortgage | With Mortgage |
| Less than $10,000 | 0 (0.0%) | 0 (0.0%) |
| $10,000 to $24,999 | 0 (0.0%) | 0 (0.0%) |
| $25,000 to $34,999 | 0 (0.0%) | 0 (0.0%) |
| $35,000 to $49,999 | 0 (0.0%) | 0 (0.0%) |
| $50,000 to $74,999 | 0 (0.0%) | 0 (0.0%) |
| $75,000 to $99,999 | 0 (0.0%) | 0 (0.0%) |
| $100,000 to $149,999 | 0 (0.0%) | 0 (0.0%) |
| $150,000 or more | 0 (0.0%) | 0 (0.0%) |
| Total | 0 (0.0%) | 0 (0.0%) |
Property Value to Household Income Ratio in Laughlin AFB
| Value-to-Income Ratio | Without Mortgage | With Mortgage |
| Less than 2.0x | 0 (0.0%) | 0 (0.0%) |
| 2.0x to 2.9x | 0 (0.0%) | 0 (0.0%) |
| 3.0x to 3.9x | 0 (0.0%) | 0 (0.0%) |
| 4.0x or more | 0 (0.0%) | 0 (0.0%) |
| Total | 0 (0.0%) | 0 (0.0%) |
Real Estate Taxes by Mortgage Status in Laughlin AFB
| Property Taxes | Without Mortgage | With Mortgage |
| Less than $800 | 0 (0.0%) | 0 (0.0%) |
| $800 to $1,499 | 0 (0.0%) | 0 (0.0%) |
| $800 to $1,499 | 0 (0.0%) | 0 (0.0%) |
| Total | 0 (0.0%) | 0 (0.0%) |
Health & Disability in Laughlin AFB
Health Insurance Coverage by Age in Laughlin AFB
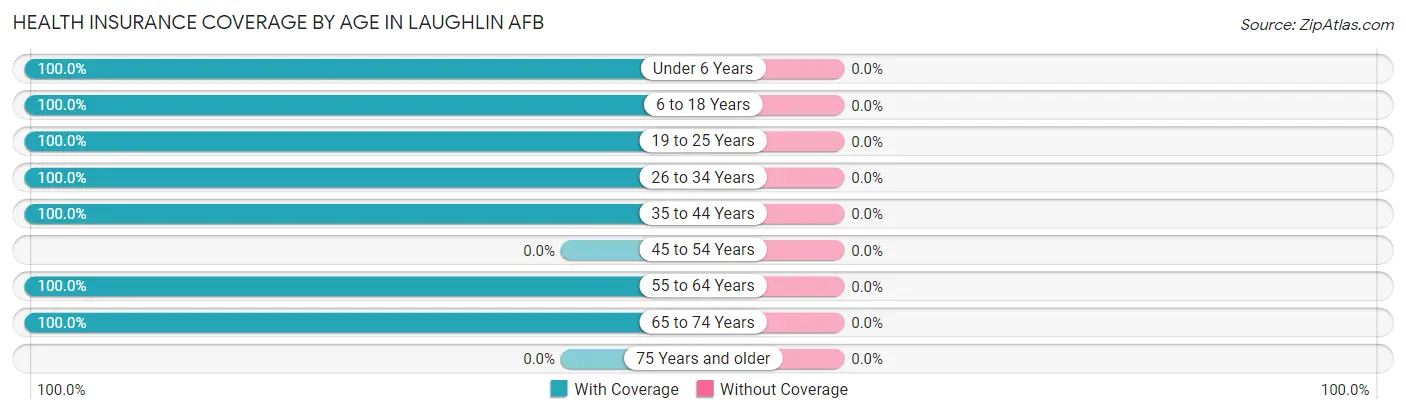
| Age Bracket | With Coverage | Without Coverage |
| Under 6 Years | 166 (100.0%) | 0 (0.0%) |
| 6 to 18 Years | 58 (100.0%) | 0 (0.0%) |
| 19 to 25 Years | 236 (100.0%) | 0 (0.0%) |
| 26 to 34 Years | 98 (100.0%) | 0 (0.0%) |
| 35 to 44 Years | 29 (100.0%) | 0 (0.0%) |
| 45 to 54 Years | 0 (0.0%) | 0 (0.0%) |
| 55 to 64 Years | 4 (100.0%) | 0 (0.0%) |
| 65 to 74 Years | 12 (100.0%) | 0 (0.0%) |
| 75 Years and older | 0 (0.0%) | 0 (0.0%) |
| Total | 603 (100.0%) | 0 (0.0%) |
Health Insurance Coverage by Citizenship Status in Laughlin AFB
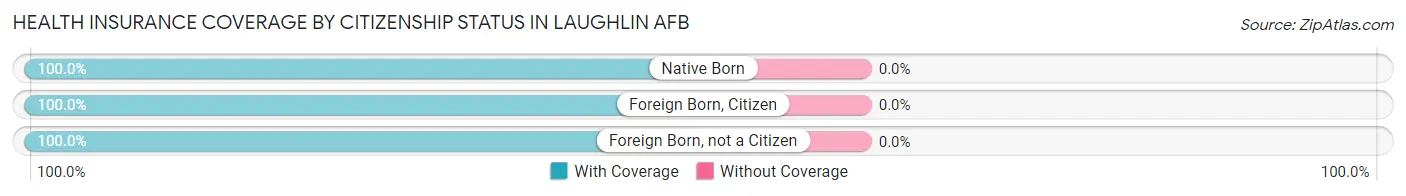
| Citizenship Status | With Coverage | Without Coverage |
| Native Born | 166 (100.0%) | 0 (0.0%) |
| Foreign Born, Citizen | 58 (100.0%) | 0 (0.0%) |
| Foreign Born, not a Citizen | 236 (100.0%) | 0 (0.0%) |
Health Insurance Coverage by Household Income in Laughlin AFB
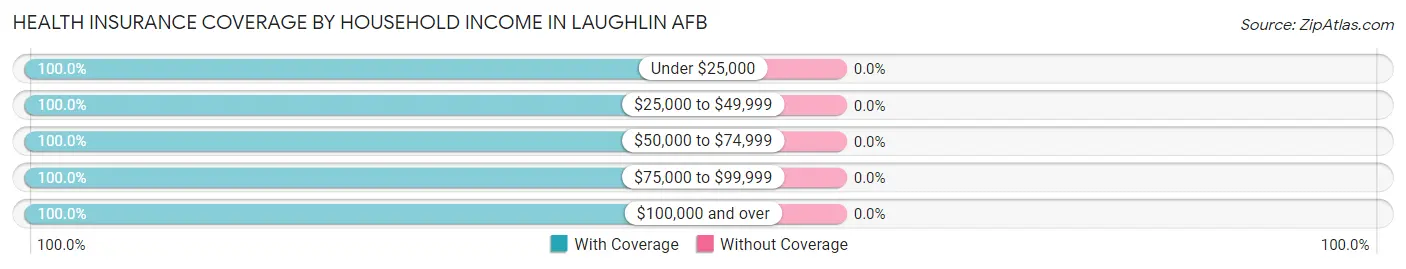
| Household Income | With Coverage | Without Coverage |
| Under $25,000 | 10 (100.0%) | 0 (0.0%) |
| $25,000 to $49,999 | 103 (100.0%) | 0 (0.0%) |
| $50,000 to $74,999 | 161 (100.0%) | 0 (0.0%) |
| $75,000 to $99,999 | 235 (100.0%) | 0 (0.0%) |
| $100,000 and over | 94 (100.0%) | 0 (0.0%) |
Public vs Private Health Insurance Coverage by Age in Laughlin AFB
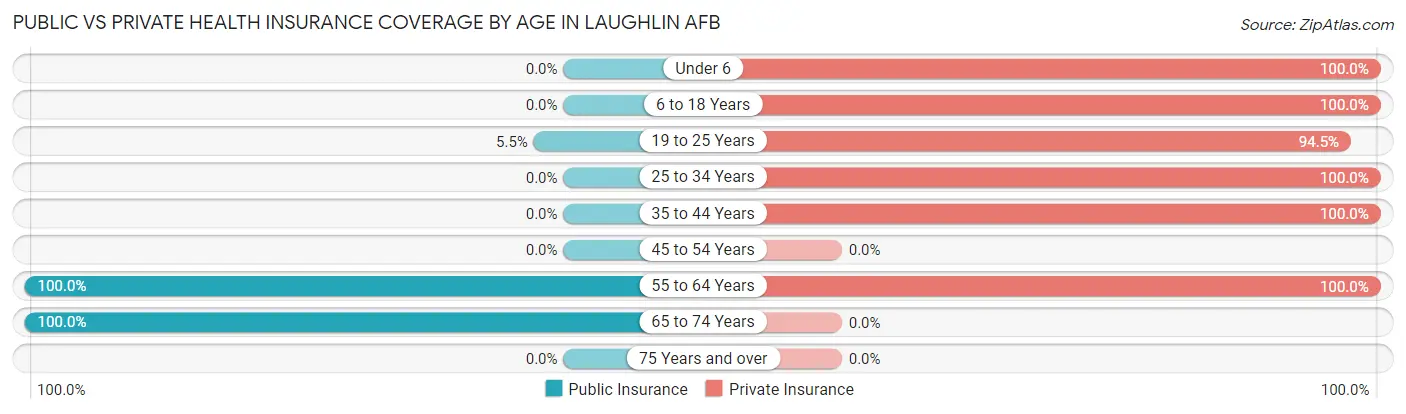
| Age Bracket | Public Insurance | Private Insurance |
| Under 6 | 0 (0.0%) | 166 (100.0%) |
| 6 to 18 Years | 0 (0.0%) | 58 (100.0%) |
| 19 to 25 Years | 13 (5.5%) | 223 (94.5%) |
| 25 to 34 Years | 0 (0.0%) | 98 (100.0%) |
| 35 to 44 Years | 0 (0.0%) | 29 (100.0%) |
| 45 to 54 Years | 0 (0.0%) | 0 (0.0%) |
| 55 to 64 Years | 4 (100.0%) | 4 (100.0%) |
| 65 to 74 Years | 12 (100.0%) | 0 (0.0%) |
| 75 Years and over | 0 (0.0%) | 0 (0.0%) |
| Total | 29 (4.8%) | 578 (95.9%) |
Disability Status by Sex by Age in Laughlin AFB
| Age Bracket | Male | Female |
| Under 5 Years | 0 (0.0%) | 0 (0.0%) |
| 5 to 17 Years | 0 (0.0%) | 0 (0.0%) |
| 18 to 34 Years | 0 (0.0%) | 0 (0.0%) |
| 35 to 64 Years | 0 (0.0%) | 0 (0.0%) |
| 65 to 74 Years | 0 (0.0%) | 0 (0.0%) |
| 75 Years and over | 0 (0.0%) | 0 (0.0%) |
Disability Class by Sex by Age in Laughlin AFB
Disability Class: Hearing Difficulty
| Age Bracket | Male | Female |
| Under 5 Years | 0 (0.0%) | 0 (0.0%) |
| 5 to 17 Years | 0 (0.0%) | 0 (0.0%) |
| 18 to 34 Years | 0 (0.0%) | 0 (0.0%) |
| 35 to 64 Years | 0 (0.0%) | 0 (0.0%) |
| 65 to 74 Years | 0 (0.0%) | 0 (0.0%) |
| 75 Years and over | 0 (0.0%) | 0 (0.0%) |
Disability Class: Vision Difficulty
| Age Bracket | Male | Female |
| Under 5 Years | 0 (0.0%) | 0 (0.0%) |
| 5 to 17 Years | 0 (0.0%) | 0 (0.0%) |
| 18 to 34 Years | 0 (0.0%) | 0 (0.0%) |
| 35 to 64 Years | 0 (0.0%) | 0 (0.0%) |
| 65 to 74 Years | 0 (0.0%) | 0 (0.0%) |
| 75 Years and over | 0 (0.0%) | 0 (0.0%) |
Disability Class: Cognitive Difficulty
| Age Bracket | Male | Female |
| 5 to 17 Years | 0 (0.0%) | 0 (0.0%) |
| 18 to 34 Years | 0 (0.0%) | 0 (0.0%) |
| 35 to 64 Years | 0 (0.0%) | 0 (0.0%) |
| 65 to 74 Years | 0 (0.0%) | 0 (0.0%) |
| 75 Years and over | 0 (0.0%) | 0 (0.0%) |
Disability Class: Ambulatory Difficulty
| Age Bracket | Male | Female |
| 5 to 17 Years | 0 (0.0%) | 0 (0.0%) |
| 18 to 34 Years | 0 (0.0%) | 0 (0.0%) |
| 35 to 64 Years | 0 (0.0%) | 0 (0.0%) |
| 65 to 74 Years | 0 (0.0%) | 0 (0.0%) |
| 75 Years and over | 0 (0.0%) | 0 (0.0%) |
Disability Class: Self-Care Difficulty
| Age Bracket | Male | Female |
| 5 to 17 Years | 0 (0.0%) | 0 (0.0%) |
| 18 to 34 Years | 0 (0.0%) | 0 (0.0%) |
| 35 to 64 Years | 0 (0.0%) | 0 (0.0%) |
| 65 to 74 Years | 0 (0.0%) | 0 (0.0%) |
| 75 Years and over | 0 (0.0%) | 0 (0.0%) |
Technology Access in Laughlin AFB
Computing Device Access in Laughlin AFB
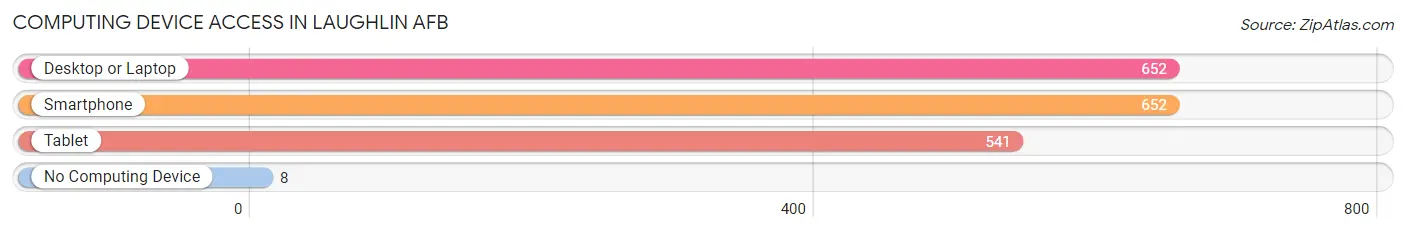
| Device Type | # Households | % Households |
| Desktop or Laptop | 652 | 95.3% |
| Smartphone | 652 | 95.3% |
| Tablet | 541 | 79.1% |
| No Computing Device | 8 | 1.2% |
| Total | 684 | 100.0% |
Internet Access in Laughlin AFB
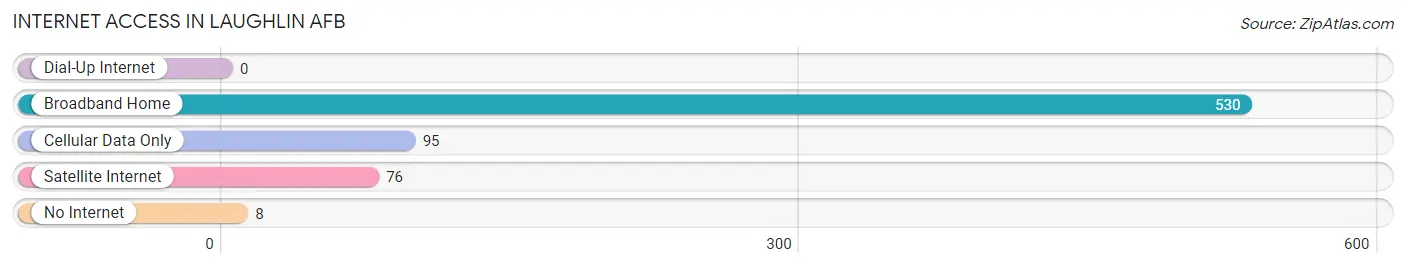
| Internet Type | # Households | % Households |
| Dial-Up Internet | 0 | 0.0% |
| Broadband Home | 530 | 77.5% |
| Cellular Data Only | 95 | 13.9% |
| Satellite Internet | 76 | 11.1% |
| No Internet | 8 | 1.2% |
| Total | 684 | 100.0% |
Laughlin AFB Summary
Laughlin Air Force Base (AFB) is located in Del Rio, Texas, and is home to the 47th Flying Training Wing of the United States Air Force. The base was originally established in 1942 as Laughlin Army Airfield, and was used as a training facility for pilots during World War II. After the war, the base was deactivated and eventually reactivated in 1952 as Laughlin AFB. Today, the base is home to the 47th Flying Training Wing, which is responsible for training pilots in the T-6A Texan II, T-38C Talon, and T-1A Jayhawk aircraft.
Geography
Laughlin AFB is located in Val Verde County, Texas, approximately 90 miles west of San Antonio. The base is situated on the northern edge of the city of Del Rio, and is bordered by the Amistad Reservoir to the east and the Rio Grande to the south. The base covers an area of approximately 4,000 acres, and is home to a variety of facilities, including a runway, hangars, and a control tower.
Economy
Laughlin AFB is a major economic driver for the city of Del Rio and the surrounding area. The base is home to over 4,000 military personnel and civilian employees, and is responsible for an estimated $400 million in economic activity each year. The base also serves as a major employer in the region, providing jobs for local residents in a variety of fields, including construction, engineering, and maintenance.
Demographics
As of the 2010 census, the population of Laughlin AFB was 4,845. The racial makeup of the base was 79.3% White, 8.2% African American, 0.7% Native American, 4.2% Asian, 0.1% Pacific Islander, 4.3% from other races, and 3.2% from two or more races. The base also had a large Hispanic or Latino population, accounting for 33.2% of the total population.
The median household income at Laughlin AFB was $45,845, and the median family income was $50,945. The per capita income was $20,945. The base also had a poverty rate of 8.3%, which was lower than the national average of 14.7%.
Conclusion
Laughlin AFB is a major economic driver for the city of Del Rio and the surrounding area. The base is home to over 4,000 military personnel and civilian employees, and is responsible for an estimated $400 million in economic activity each year. The base also serves as a major employer in the region, providing jobs for local residents in a variety of fields. The population of Laughlin AFB is diverse, with a large Hispanic or Latino population, and a median household income of $45,845.
Common Questions
What is Per Capita Income in Laughlin AFB?
Per Capita income in Laughlin AFB is $31,795.
What is the Median Family Income in Laughlin AFB?
Median Family Income in Laughlin AFB is $75,647.
What is the Median Household income in Laughlin AFB?
Median Household Income in Laughlin AFB is $62,333.
What is Income or Wage Gap in Laughlin AFB?
Income or Wage Gap in Laughlin AFB is 13.8%.
Women in Laughlin AFB earn 86.2 cents for every dollar earned by a man.
What is Inequality or Gini Index in Laughlin AFB?
Inequality or Gini Index in Laughlin AFB is 0.28.
What is the Total Population of Laughlin AFB?
Total Population of Laughlin AFB is 1,865.
What is the Total Male Population of Laughlin AFB?
Total Male Population of Laughlin AFB is 1,128.
What is the Total Female Population of Laughlin AFB?
Total Female Population of Laughlin AFB is 737.
What is the Ratio of Males per 100 Females in Laughlin AFB?
There are 153.05 Males per 100 Females in Laughlin AFB.
What is the Ratio of Females per 100 Males in Laughlin AFB?
There are 65.34 Females per 100 Males in Laughlin AFB.
What is the Median Population Age in Laughlin AFB?
Median Population Age in Laughlin AFB is 24.2 Years.
What is the Average Family Size in Laughlin AFB
Average Family Size in Laughlin AFB is 2.5 People.
What is the Average Household Size in Laughlin AFB
Average Household Size in Laughlin AFB is 1.9 People.
How Large is the Labor Force in Laughlin AFB?
There are 1,551 People in the Labor Forcein in Laughlin AFB.
What is the Percentage of People in the Labor Force in Laughlin AFB?
94.5% of People are in the Labor Force in Laughlin AFB.
What is the Unemployment Rate in Laughlin AFB?
Unemployment Rate in Laughlin AFB is 2.5%.