Naranja, FL Map & Demographics
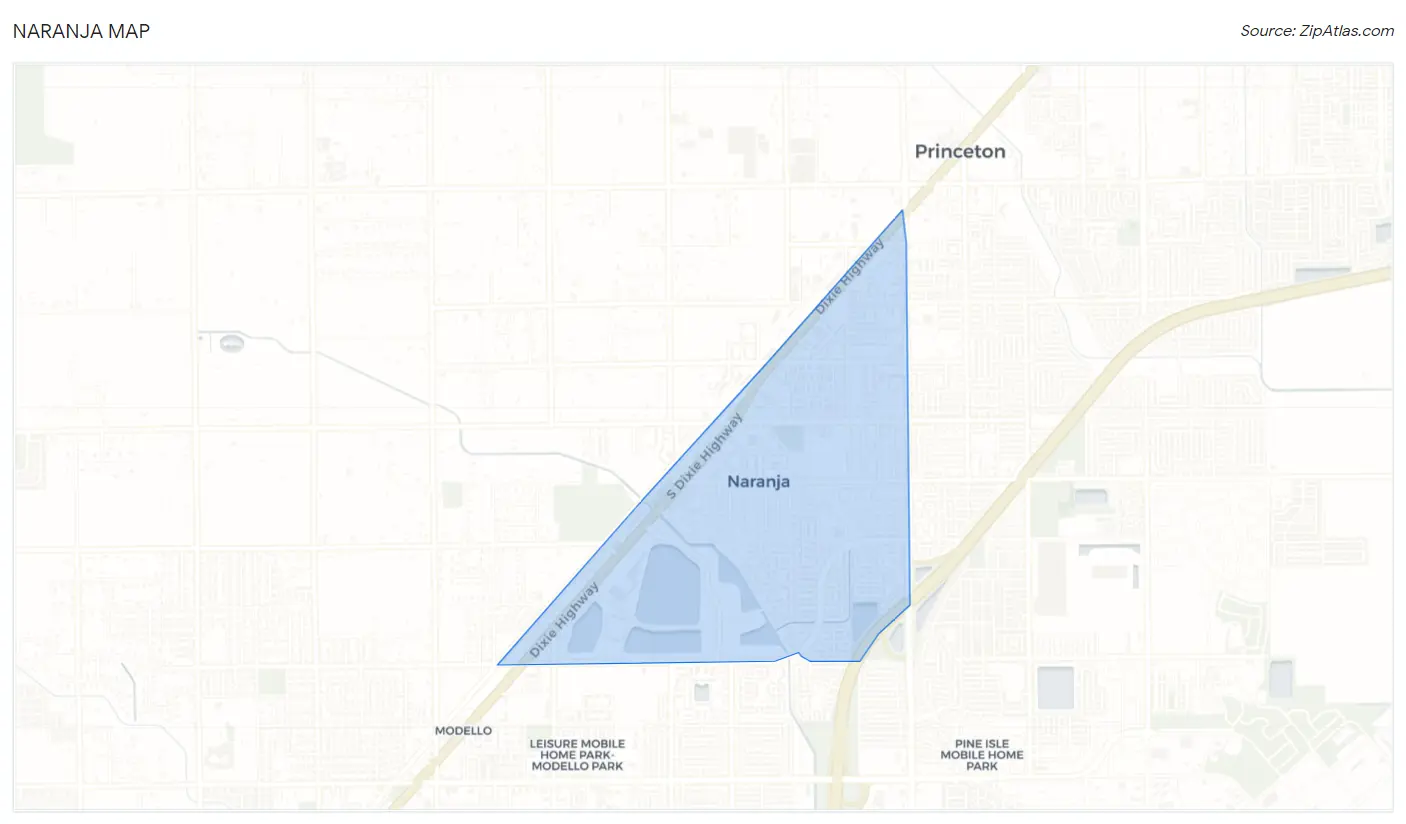
Naranja Map
Naranja Overview
$19,537
PER CAPITA INCOME
$32,289
AVG FAMILY INCOME
$46,045
AVG HOUSEHOLD INCOME
1.7%
WAGE / INCOME GAP [ % ]
98.3¢/ $1
WAGE / INCOME GAP [ $ ]
$10,543
FAMILY INCOME DEFICIT
0.45
INEQUALITY / GINI INDEX
13,261
TOTAL POPULATION
6,081
MALE POPULATION
7,180
FEMALE POPULATION
84.69
MALES / 100 FEMALES
118.07
FEMALES / 100 MALES
30.4
MEDIAN AGE
3.4
AVG FAMILY SIZE
3.2
AVG HOUSEHOLD SIZE
6,019
LABOR FORCE [ PEOPLE ]
65.6%
PERCENT IN LABOR FORCE
10.2%
UNEMPLOYMENT RATE
Income in Naranja
Income Overview in Naranja
Per Capita Income in Naranja is $19,537, while median incomes of families and households are $32,289 and $46,045 respectively.
| Characteristic | Number | Measure |
| Per Capita Income | 13,261 | $19,537 |
| Median Family Income | 3,234 | $32,289 |
| Mean Family Income | 3,234 | $51,942 |
| Median Household Income | 4,164 | $46,045 |
| Mean Household Income | 4,164 | $59,403 |
| Income Deficit | 3,234 | $10,543 |
| Wage / Income Gap (%) | 13,261 | 1.70% |
| Wage / Income Gap ($) | 13,261 | 98.30¢ per $1 |
| Gini / Inequality Index | 13,261 | 0.45 |
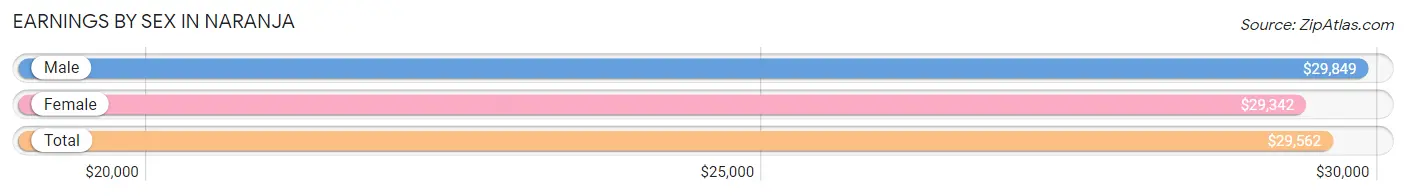
Earnings by Sex in Naranja
Average Earnings in Naranja are $29,562, $29,849 for men and $29,342 for women, a difference of 1.7%.
| Sex | Number | Average Earnings |
| Male | 3,202 (51.0%) | $29,849 |
| Female | 3,076 (49.0%) | $29,342 |
| Total | 6,278 (100.0%) | $29,562 |
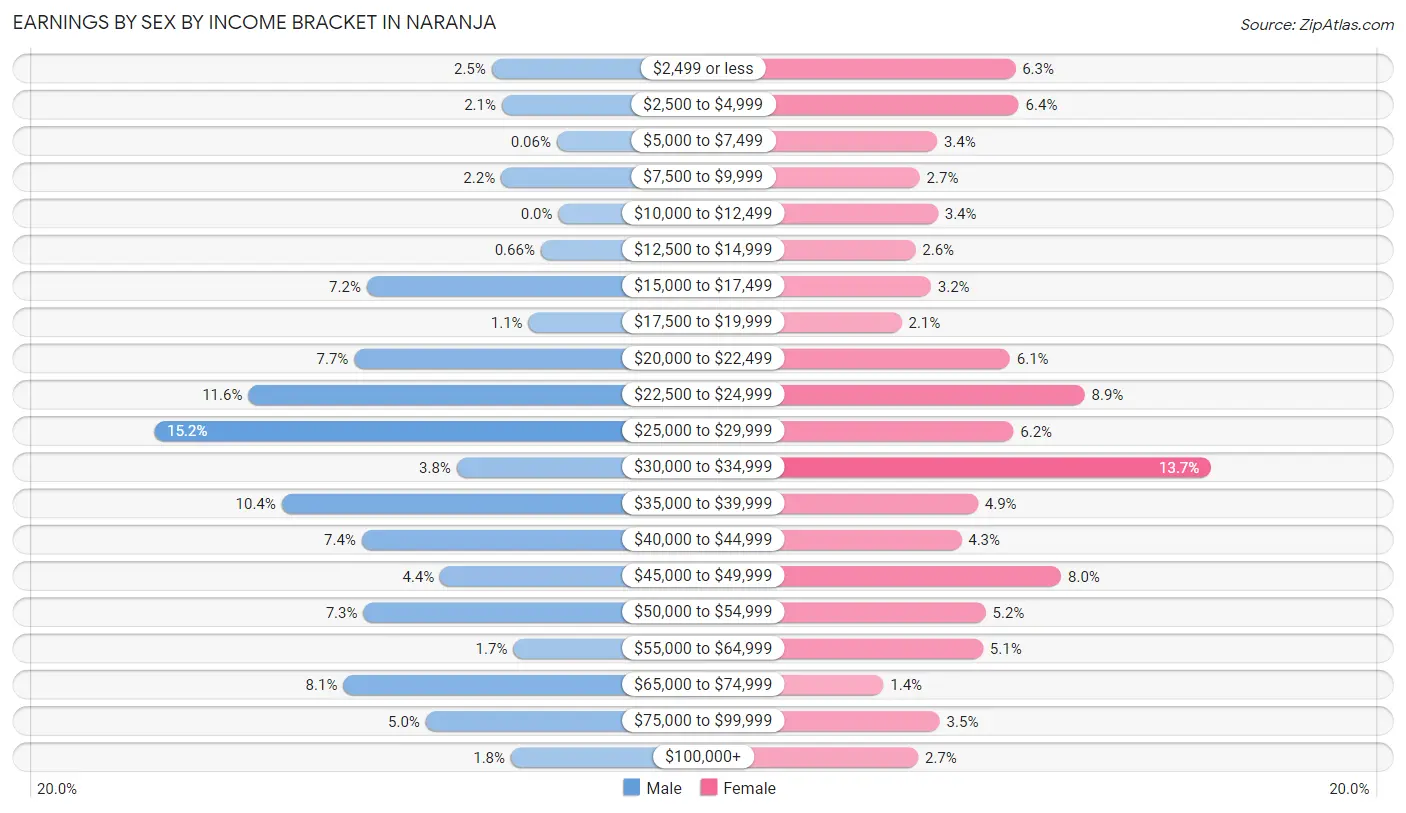
Earnings by Sex by Income Bracket in Naranja
The most common earnings brackets in Naranja are $25,000 to $29,999 for men (485 | 15.1%) and $30,000 to $34,999 for women (420 | 13.7%).
| Income | Male | Female |
| $2,499 or less | 80 (2.5%) | 194 (6.3%) |
| $2,500 to $4,999 | 68 (2.1%) | 198 (6.4%) |
| $5,000 to $7,499 | 2 (0.1%) | 104 (3.4%) |
| $7,500 to $9,999 | 69 (2.1%) | 84 (2.7%) |
| $10,000 to $12,499 | 0 (0.0%) | 105 (3.4%) |
| $12,500 to $14,999 | 21 (0.7%) | 79 (2.6%) |
| $15,000 to $17,499 | 230 (7.2%) | 97 (3.2%) |
| $17,500 to $19,999 | 36 (1.1%) | 63 (2.1%) |
| $20,000 to $22,499 | 245 (7.6%) | 188 (6.1%) |
| $22,500 to $24,999 | 372 (11.6%) | 274 (8.9%) |
| $25,000 to $29,999 | 485 (15.1%) | 192 (6.2%) |
| $30,000 to $34,999 | 122 (3.8%) | 420 (13.7%) |
| $35,000 to $39,999 | 332 (10.4%) | 151 (4.9%) |
| $40,000 to $44,999 | 236 (7.4%) | 132 (4.3%) |
| $45,000 to $49,999 | 142 (4.4%) | 247 (8.0%) |
| $50,000 to $54,999 | 234 (7.3%) | 160 (5.2%) |
| $55,000 to $64,999 | 54 (1.7%) | 157 (5.1%) |
| $65,000 to $74,999 | 258 (8.1%) | 42 (1.4%) |
| $75,000 to $99,999 | 159 (5.0%) | 107 (3.5%) |
| $100,000+ | 57 (1.8%) | 82 (2.7%) |
| Total | 3,202 (100.0%) | 3,076 (100.0%) |
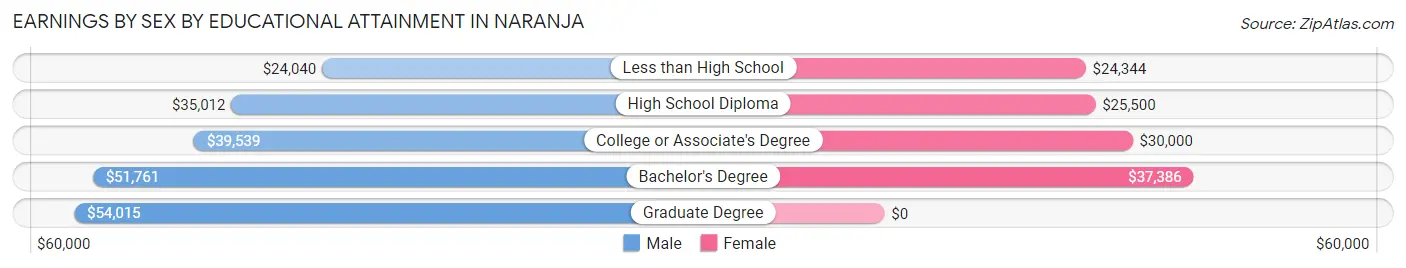
Earnings by Sex by Educational Attainment in Naranja
Average earnings in Naranja are $33,239 for men and $29,860 for women, a difference of 10.2%. Men with an educational attainment of graduate degree enjoy the highest average annual earnings of $54,015, while those with less than high school education earn the least with $24,040. Women with an educational attainment of bachelor's degree earn the most with the average annual earnings of $37,386, while those with less than high school education have the smallest earnings of $24,344.
| Educational Attainment | Male Income | Female Income |
| Less than High School | $24,040 | $24,344 |
| High School Diploma | $35,012 | $25,500 |
| College or Associate's Degree | $39,539 | $30,000 |
| Bachelor's Degree | $51,761 | $37,386 |
| Graduate Degree | $54,015 | $0 |
| Total | $33,239 | $29,860 |
Family Income in Naranja
Family Income Brackets in Naranja
According to the Naranja family income data, there are 741 families falling into the $25,000 to $34,999 income range, which is the most common income bracket and makes up 22.9% of all families. Conversely, the $200,000+ income bracket is the least frequent group with only 19 families (0.6%) belonging to this category.
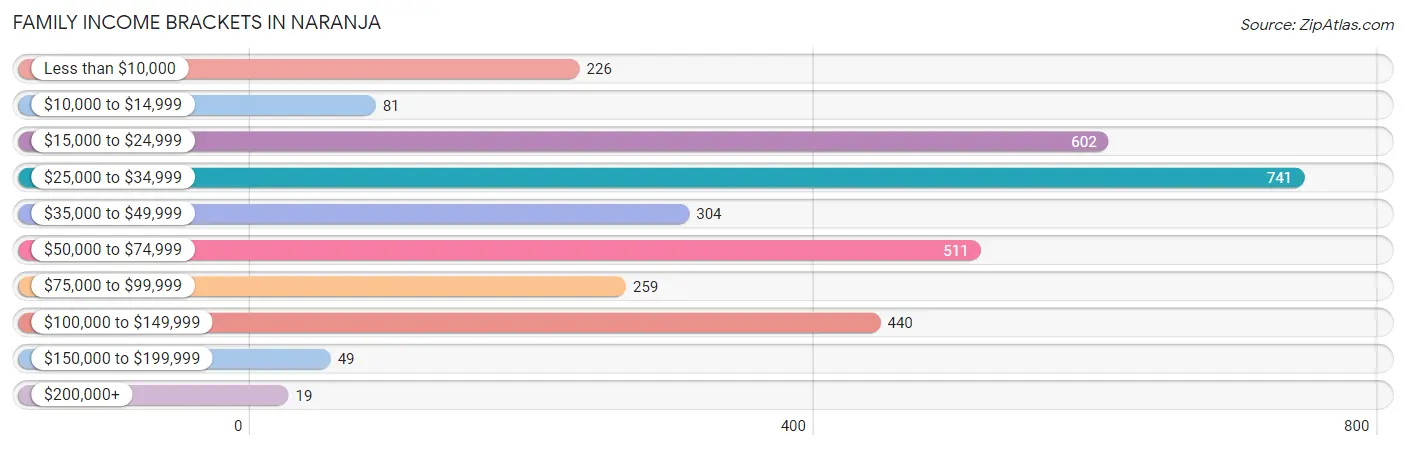
| Income Bracket | # Families | % Families |
| Less than $10,000 | 226 | 7.0% |
| $10,000 to $14,999 | 81 | 2.5% |
| $15,000 to $24,999 | 602 | 18.6% |
| $25,000 to $34,999 | 741 | 22.9% |
| $35,000 to $49,999 | 304 | 9.4% |
| $50,000 to $74,999 | 511 | 15.8% |
| $75,000 to $99,999 | 259 | 8.0% |
| $100,000 to $149,999 | 440 | 13.6% |
| $150,000 to $199,999 | 49 | 1.5% |
| $200,000+ | 19 | 0.6% |
Family Income by Famaliy Size in Naranja
7+ person families (95 | 2.9%) account for the highest median family income in Naranja with $127,872 per family, while 7+ person families (95 | 2.9%) have the highest median income of $18,267 per family member.
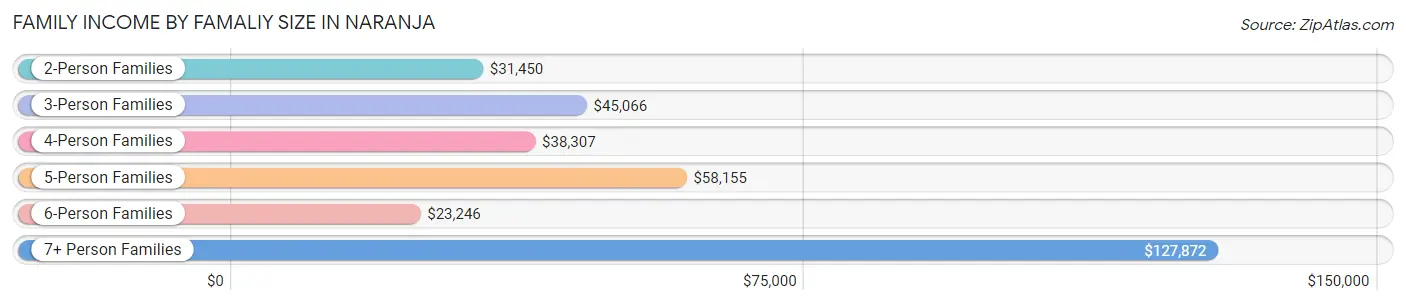
| Income Bracket | # Families | Median Income |
| 2-Person Families | 1,288 (39.8%) | $31,450 |
| 3-Person Families | 657 (20.3%) | $45,066 |
| 4-Person Families | 881 (27.2%) | $38,307 |
| 5-Person Families | 207 (6.4%) | $58,155 |
| 6-Person Families | 106 (3.3%) | $23,246 |
| 7+ Person Families | 95 (2.9%) | $127,872 |
| Total | 3,234 (100.0%) | $32,289 |
Family Income by Number of Earners in Naranja
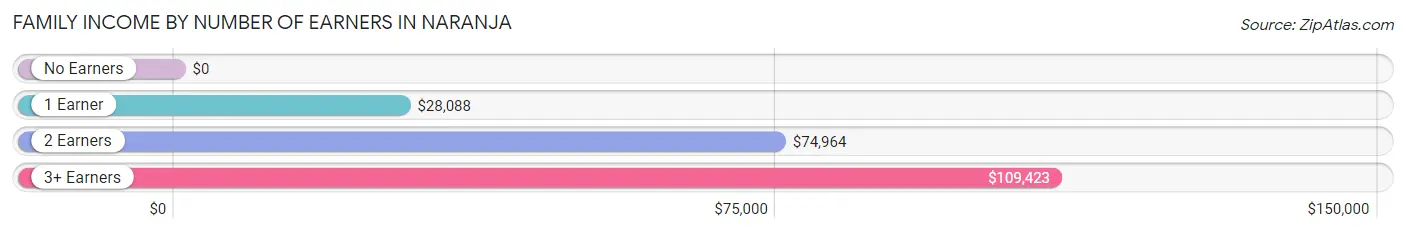
| Number of Earners | # Families | Median Income |
| No Earners | 444 (13.7%) | $0 |
| 1 Earner | 1,528 (47.2%) | $28,088 |
| 2 Earners | 1,022 (31.6%) | $74,964 |
| 3+ Earners | 240 (7.4%) | $109,423 |
| Total | 3,234 (100.0%) | $32,289 |
Household Income in Naranja
Household Income Brackets in Naranja
With 762 households falling in the category, the $50,000 to $74,999 income range is the most frequent in Naranja, accounting for 18.3% of all households. In contrast, only 50 households (1.2%) fall into the $200,000+ income bracket, making it the least populous group.
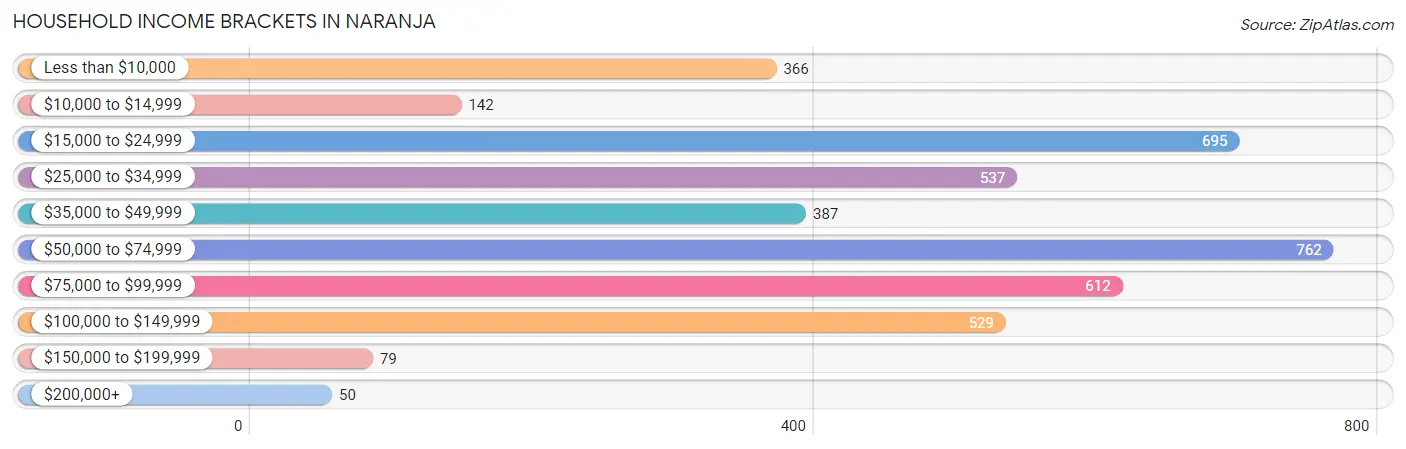
| Income Bracket | # Households | % Households |
| Less than $10,000 | 366 | 8.8% |
| $10,000 to $14,999 | 142 | 3.4% |
| $15,000 to $24,999 | 695 | 16.7% |
| $25,000 to $34,999 | 537 | 12.9% |
| $35,000 to $49,999 | 387 | 9.3% |
| $50,000 to $74,999 | 762 | 18.3% |
| $75,000 to $99,999 | 612 | 14.7% |
| $100,000 to $149,999 | 529 | 12.7% |
| $150,000 to $199,999 | 79 | 1.9% |
| $200,000+ | 50 | 1.2% |
Household Income by Householder Age in Naranja
The median household income in Naranja is $46,045, with the highest median household income of $54,583 found in the 25 to 44 years age bracket for the primary householder. A total of 2,297 households (55.2%) fall into this category. Meanwhile, the 65+ years age bracket for the primary householder has the lowest median household income of $0, with 506 households (12.1%) in this group.
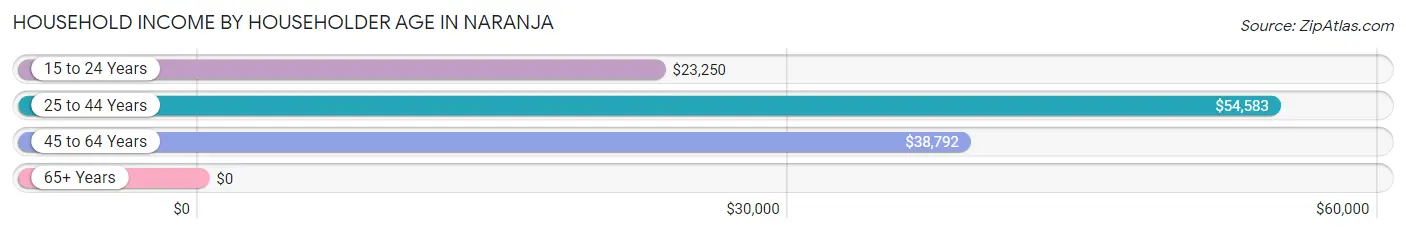
| Income Bracket | # Households | Median Income |
| 15 to 24 Years | 181 (4.3%) | $23,250 |
| 25 to 44 Years | 2,297 (55.2%) | $54,583 |
| 45 to 64 Years | 1,180 (28.3%) | $38,792 |
| 65+ Years | 506 (12.1%) | $0 |
| Total | 4,164 (100.0%) | $46,045 |
Poverty in Naranja
Income Below Poverty by Sex and Age in Naranja
With 29.9% poverty level for males and 36.7% for females among the residents of Naranja, 15 year old males and 6 to 11 year old females are the most vulnerable to poverty, with 31 males (56.4%) and 433 females (60.0%) in their respective age groups living below the poverty level.
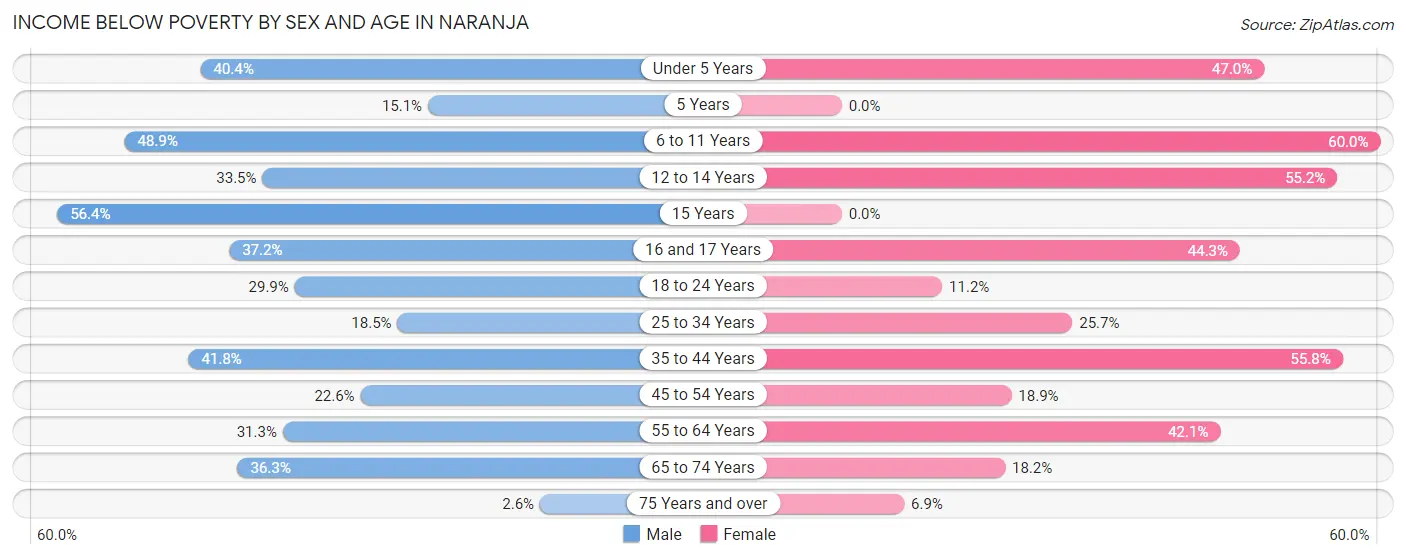
| Age Bracket | Male | Female |
| Under 5 Years | 234 (40.4%) | 411 (47.0%) |
| 5 Years | 46 (15.1%) | 0 (0.0%) |
| 6 to 11 Years | 259 (48.9%) | 433 (60.0%) |
| 12 to 14 Years | 117 (33.5%) | 299 (55.2%) |
| 15 Years | 31 (56.4%) | 0 (0.0%) |
| 16 and 17 Years | 48 (37.2%) | 133 (44.3%) |
| 18 to 24 Years | 179 (29.9%) | 51 (11.2%) |
| 25 to 34 Years | 236 (18.5%) | 421 (25.7%) |
| 35 to 44 Years | 215 (41.7%) | 459 (55.8%) |
| 45 to 54 Years | 188 (22.6%) | 109 (18.9%) |
| 55 to 64 Years | 175 (31.2%) | 217 (42.1%) |
| 65 to 74 Years | 86 (36.3%) | 78 (18.2%) |
| 75 Years and over | 3 (2.6%) | 12 (6.9%) |
| Total | 1,817 (29.9%) | 2,623 (36.7%) |
Income Above Poverty by Sex and Age in Naranja
According to the poverty statistics in Naranja, males aged 75 years and over and females aged 5 years are the age groups that are most secure financially, with 97.4% of males and 100.0% of females in these age groups living above the poverty line.
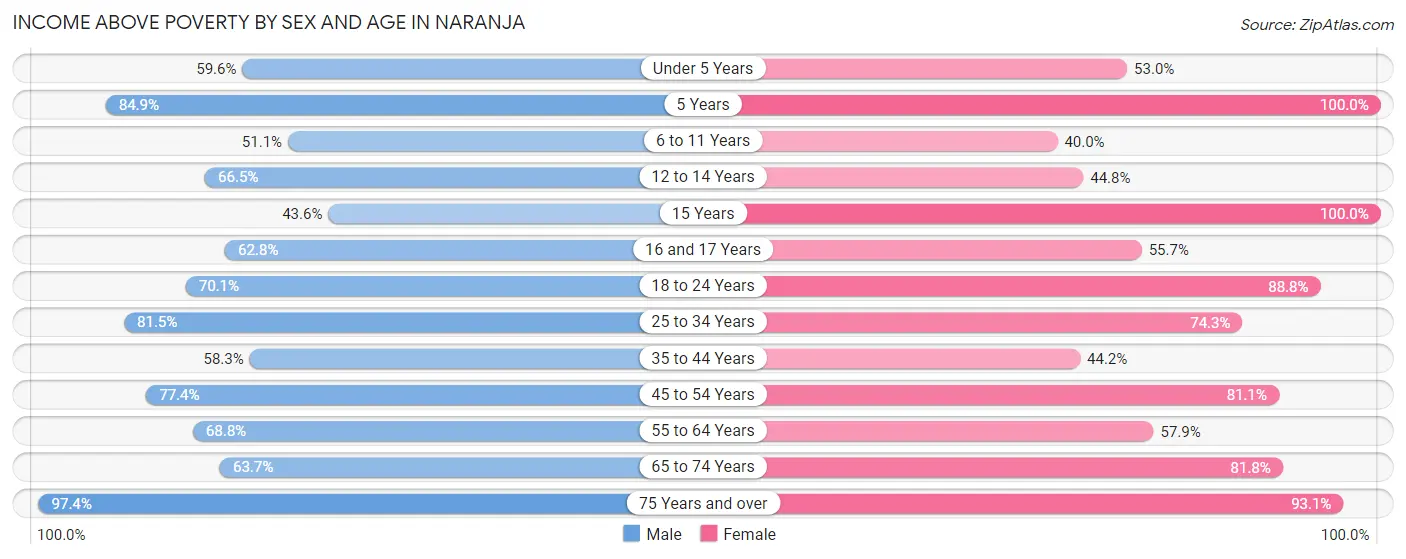
| Age Bracket | Male | Female |
| Under 5 Years | 345 (59.6%) | 463 (53.0%) |
| 5 Years | 259 (84.9%) | 39 (100.0%) |
| 6 to 11 Years | 271 (51.1%) | 289 (40.0%) |
| 12 to 14 Years | 232 (66.5%) | 243 (44.8%) |
| 15 Years | 24 (43.6%) | 62 (100.0%) |
| 16 and 17 Years | 81 (62.8%) | 167 (55.7%) |
| 18 to 24 Years | 419 (70.1%) | 405 (88.8%) |
| 25 to 34 Years | 1,041 (81.5%) | 1,219 (74.3%) |
| 35 to 44 Years | 300 (58.3%) | 364 (44.2%) |
| 45 to 54 Years | 644 (77.4%) | 468 (81.1%) |
| 55 to 64 Years | 385 (68.8%) | 298 (57.9%) |
| 65 to 74 Years | 151 (63.7%) | 351 (81.8%) |
| 75 Years and over | 112 (97.4%) | 161 (93.1%) |
| Total | 4,264 (70.1%) | 4,529 (63.3%) |
Income Below Poverty Among Married-Couple Families in Naranja
The poverty statistics for married-couple families in Naranja show that 30.2% or 450 of the total 1,489 families live below the poverty line. Families with 3 or 4 children have the highest poverty rate of 65.0%, comprising of 93 families. On the other hand, families with no children have the lowest poverty rate of 16.2%, which includes 106 families.
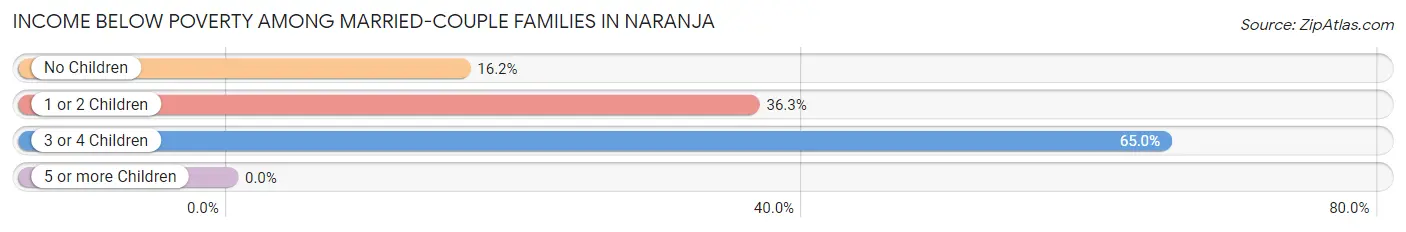
| Children | Above Poverty | Below Poverty |
| No Children | 549 (83.8%) | 106 (16.2%) |
| 1 or 2 Children | 440 (63.7%) | 251 (36.3%) |
| 3 or 4 Children | 50 (35.0%) | 93 (65.0%) |
| 5 or more Children | 0 (0.0%) | 0 (0.0%) |
| Total | 1,039 (69.8%) | 450 (30.2%) |
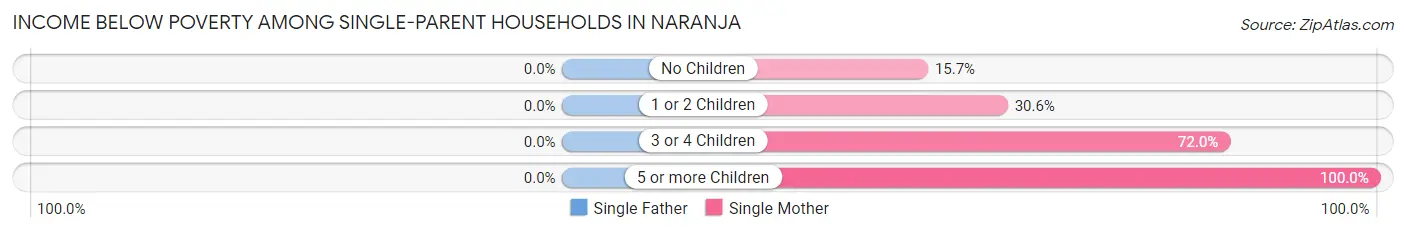
Income Below Poverty Among Single-Parent Households in Naranja
| Children | Single Father | Single Mother |
| No Children | 0 (0.0%) | 54 (15.7%) |
| 1 or 2 Children | 0 (0.0%) | 296 (30.5%) |
| 3 or 4 Children | 0 (0.0%) | 149 (72.0%) |
| 5 or more Children | 0 (0.0%) | 24 (100.0%) |
| Total | 0 (0.0%) | 523 (33.9%) |
Income Below Poverty Among Married-Couple vs Single-Parent Households in Naranja
The poverty data for Naranja shows that 450 of the married-couple family households (30.2%) and 523 of the single-parent households (30.0%) are living below the poverty level. Within the married-couple family households, those with 3 or 4 children have the highest poverty rate, with 93 households (65.0%) falling below the poverty line. Among the single-parent households, those with 5 or more children have the highest poverty rate, with 24 household (100.0%) living below poverty.
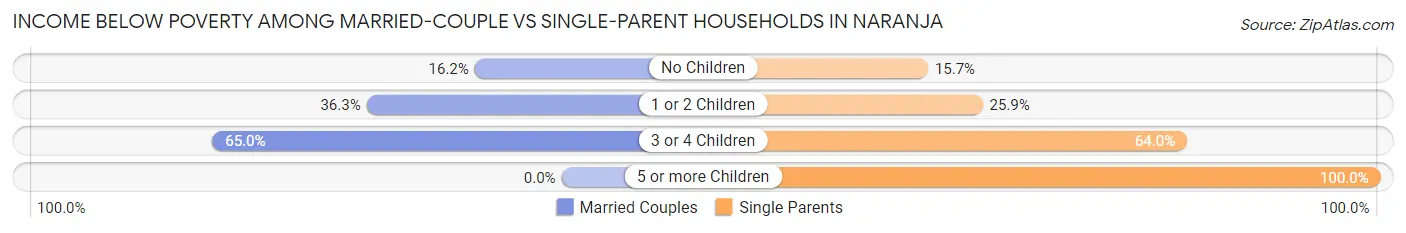
| Children | Married-Couple Families | Single-Parent Households |
| No Children | 106 (16.2%) | 54 (15.7%) |
| 1 or 2 Children | 251 (36.3%) | 296 (25.9%) |
| 3 or 4 Children | 93 (65.0%) | 149 (63.9%) |
| 5 or more Children | 0 (0.0%) | 24 (100.0%) |
| Total | 450 (30.2%) | 523 (30.0%) |
Race in Naranja
The most populous races in Naranja are Hispanic or Latino (7,801 | 58.8%), White / Caucasian (5,506 | 41.5%), and Black / African American (4,454 | 33.6%).
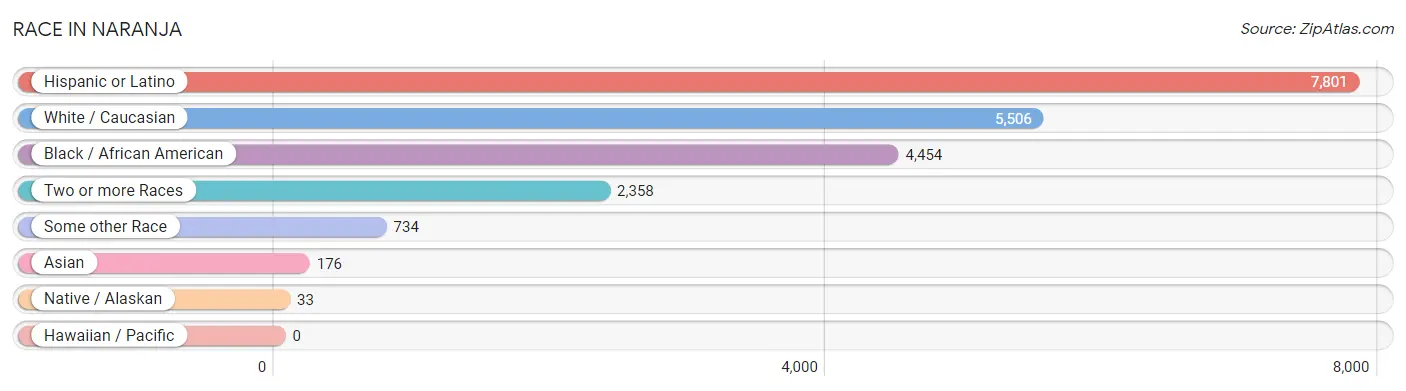
| Race | # Population | % Population |
| Asian | 176 | 1.3% |
| Black / African American | 4,454 | 33.6% |
| Hawaiian / Pacific | 0 | 0.0% |
| Hispanic or Latino | 7,801 | 58.8% |
| Native / Alaskan | 33 | 0.3% |
| White / Caucasian | 5,506 | 41.5% |
| Two or more Races | 2,358 | 17.8% |
| Some other Race | 734 | 5.5% |
| Total | 13,261 | 100.0% |
Ancestry in Naranja
The most populous ancestries reported in Naranja are Cuban (3,849 | 29.0%), American (1,056 | 8.0%), South American (1,037 | 7.8%), Central American (758 | 5.7%), and Puerto Rican (578 | 4.4%), together accounting for 54.9% of all Naranja residents.
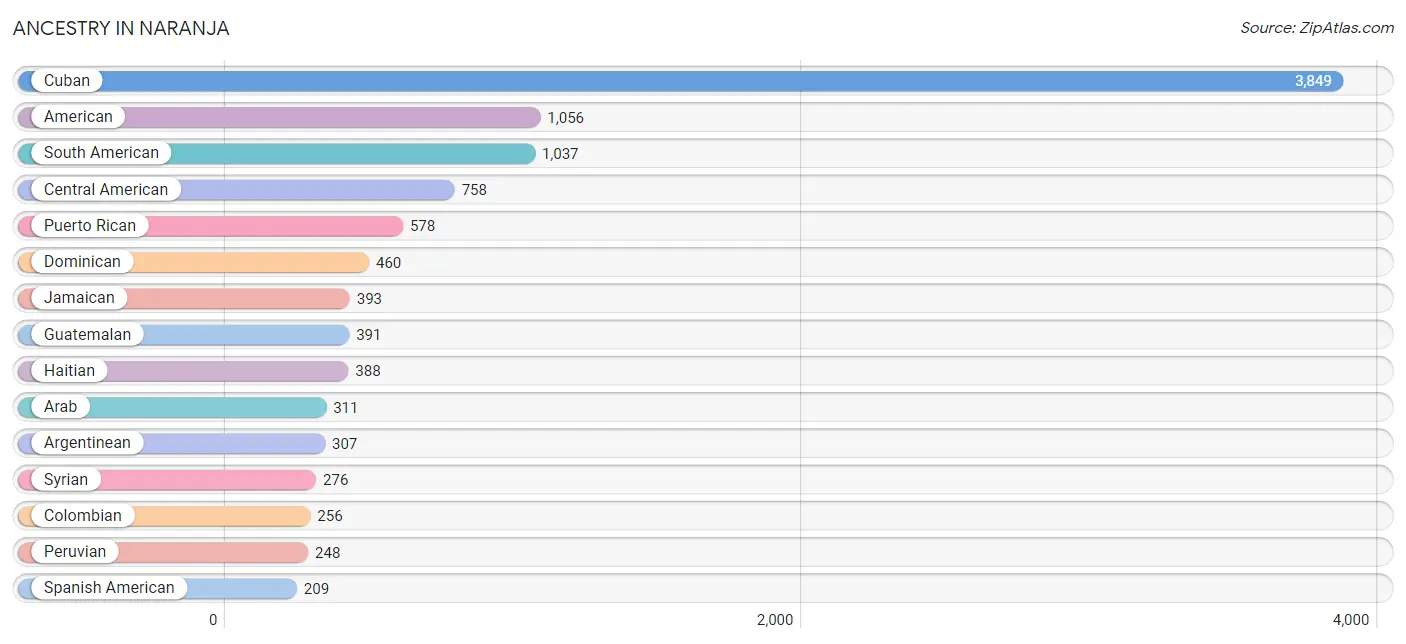
| Ancestry | # Population | % Population |
| African | 11 | 0.1% |
| American | 1,056 | 8.0% |
| Arab | 311 | 2.4% |
| Argentinean | 307 | 2.3% |
| Bahamian | 188 | 1.4% |
| Brazilian | 98 | 0.7% |
| British West Indian | 54 | 0.4% |
| Bulgarian | 10 | 0.1% |
| Burmese | 31 | 0.2% |
| Central American | 758 | 5.7% |
| Central American Indian | 101 | 0.8% |
| Cherokee | 12 | 0.1% |
| Chilean | 56 | 0.4% |
| Colombian | 256 | 1.9% |
| Cuban | 3,849 | 29.0% |
| Dominican | 460 | 3.5% |
| Ecuadorian | 63 | 0.5% |
| French | 42 | 0.3% |
| German | 131 | 1.0% |
| Guatemalan | 391 | 2.9% |
| Haitian | 388 | 2.9% |
| Honduran | 186 | 1.4% |
| Indian (Asian) | 10 | 0.1% |
| Iraqi | 11 | 0.1% |
| Irish | 36 | 0.3% |
| Italian | 175 | 1.3% |
| Jamaican | 393 | 3.0% |
| Korean | 97 | 0.7% |
| Lithuanian | 7 | 0.1% |
| Macedonian | 10 | 0.1% |
| Mexican | 207 | 1.6% |
| Native Hawaiian | 31 | 0.2% |
| Nicaraguan | 141 | 1.1% |
| Nigerian | 13 | 0.1% |
| Panamanian | 25 | 0.2% |
| Peruvian | 248 | 1.9% |
| Polish | 3 | 0.0% |
| Puerto Rican | 578 | 4.4% |
| Russian | 10 | 0.1% |
| Salvadoran | 15 | 0.1% |
| South American | 1,037 | 7.8% |
| Spanish | 100 | 0.7% |
| Spanish American | 209 | 1.6% |
| Subsaharan African | 24 | 0.2% |
| Syrian | 276 | 2.1% |
| Thai | 104 | 0.8% |
| Trinidadian and Tobagonian | 95 | 0.7% |
| Venezuelan | 107 | 0.8% | View All 48 Rows |
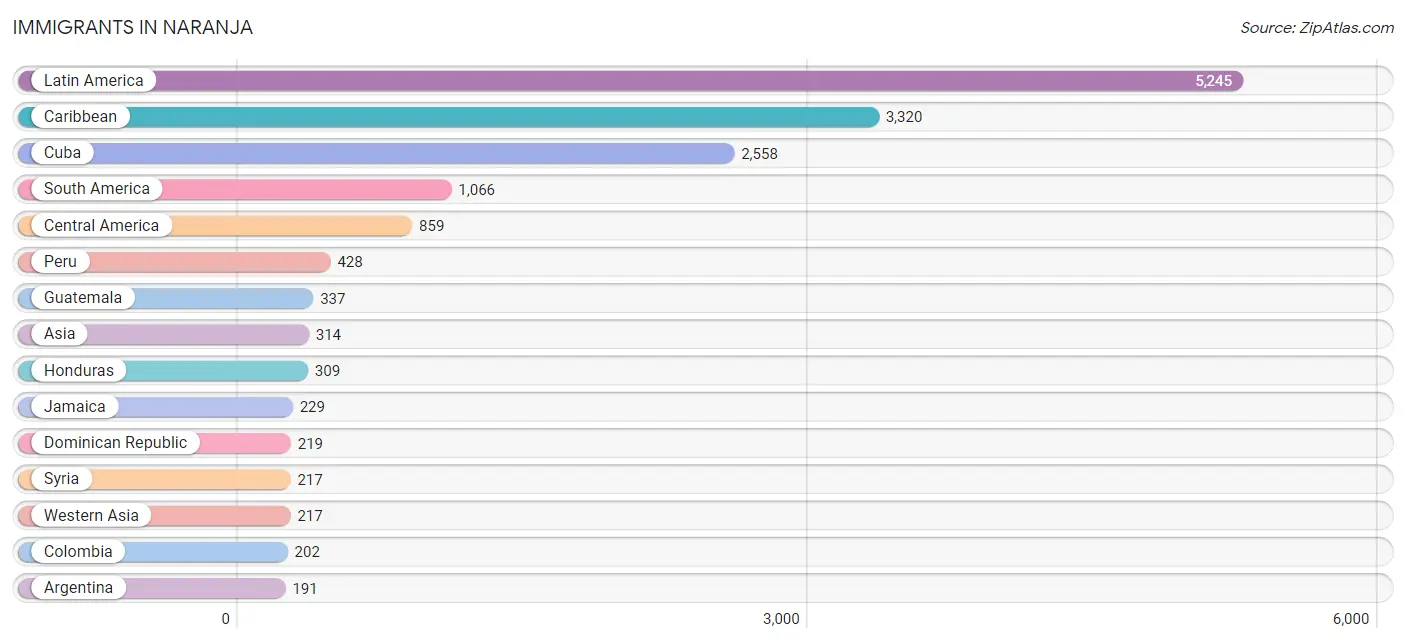
Immigrants in Naranja
The most numerous immigrant groups reported in Naranja came from Latin America (5,245 | 39.6%), Caribbean (3,320 | 25.0%), Cuba (2,558 | 19.3%), South America (1,066 | 8.0%), and Central America (859 | 6.5%), together accounting for 98.4% of all Naranja residents.
| Immigration Origin | # Population | % Population |
| Africa | 13 | 0.1% |
| Argentina | 191 | 1.4% |
| Asia | 314 | 2.4% |
| Brazil | 98 | 0.7% |
| Bulgaria | 10 | 0.1% |
| Caribbean | 3,320 | 25.0% |
| Central America | 859 | 6.5% |
| Colombia | 202 | 1.5% |
| Cuba | 2,558 | 19.3% |
| Dominican Republic | 219 | 1.7% |
| Eastern Europe | 10 | 0.1% |
| Ecuador | 40 | 0.3% |
| El Salvador | 21 | 0.2% |
| Europe | 20 | 0.2% |
| Germany | 10 | 0.1% |
| Guatemala | 337 | 2.5% |
| Haiti | 131 | 1.0% |
| Honduras | 309 | 2.3% |
| Jamaica | 229 | 1.7% |
| Latin America | 5,245 | 39.6% |
| Mexico | 98 | 0.7% |
| Nicaragua | 69 | 0.5% |
| Nigeria | 13 | 0.1% |
| Panama | 25 | 0.2% |
| Peru | 428 | 3.2% |
| Philippines | 97 | 0.7% |
| South America | 1,066 | 8.0% |
| South Eastern Asia | 97 | 0.7% |
| St. Vincent and the Grenadines | 104 | 0.8% |
| Syria | 217 | 1.6% |
| Trinidad and Tobago | 79 | 0.6% |
| Venezuela | 107 | 0.8% |
| Western Africa | 13 | 0.1% |
| Western Asia | 217 | 1.6% |
| Western Europe | 10 | 0.1% | View All 35 Rows |
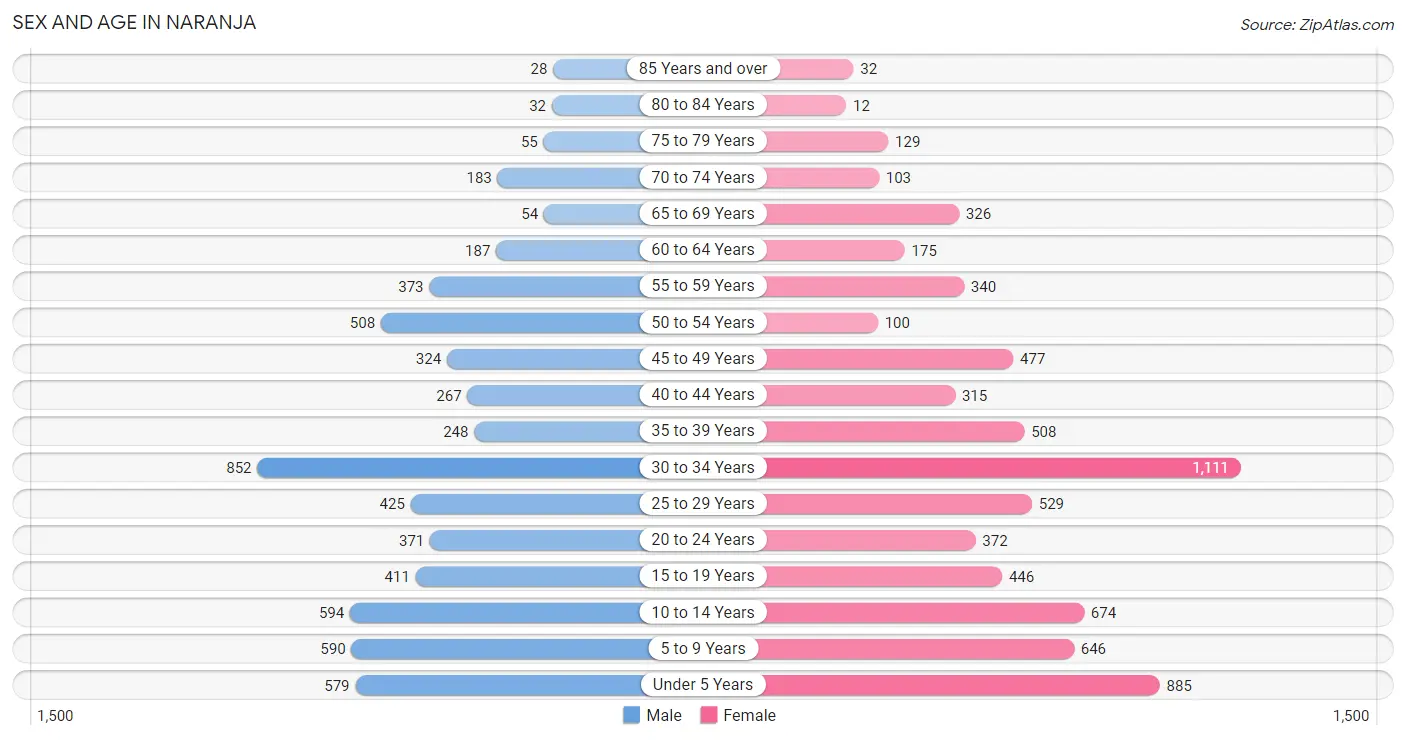
Sex and Age in Naranja
Sex and Age in Naranja
The most populous age groups in Naranja are 30 to 34 Years (852 | 14.0%) for men and 30 to 34 Years (1,111 | 15.5%) for women.
| Age Bracket | Male | Female |
| Under 5 Years | 579 (9.5%) | 885 (12.3%) |
| 5 to 9 Years | 590 (9.7%) | 646 (9.0%) |
| 10 to 14 Years | 594 (9.8%) | 674 (9.4%) |
| 15 to 19 Years | 411 (6.8%) | 446 (6.2%) |
| 20 to 24 Years | 371 (6.1%) | 372 (5.2%) |
| 25 to 29 Years | 425 (7.0%) | 529 (7.4%) |
| 30 to 34 Years | 852 (14.0%) | 1,111 (15.5%) |
| 35 to 39 Years | 248 (4.1%) | 508 (7.1%) |
| 40 to 44 Years | 267 (4.4%) | 315 (4.4%) |
| 45 to 49 Years | 324 (5.3%) | 477 (6.6%) |
| 50 to 54 Years | 508 (8.4%) | 100 (1.4%) |
| 55 to 59 Years | 373 (6.1%) | 340 (4.7%) |
| 60 to 64 Years | 187 (3.1%) | 175 (2.4%) |
| 65 to 69 Years | 54 (0.9%) | 326 (4.5%) |
| 70 to 74 Years | 183 (3.0%) | 103 (1.4%) |
| 75 to 79 Years | 55 (0.9%) | 129 (1.8%) |
| 80 to 84 Years | 32 (0.5%) | 12 (0.2%) |
| 85 Years and over | 28 (0.5%) | 32 (0.4%) |
| Total | 6,081 (100.0%) | 7,180 (100.0%) |
Families and Households in Naranja
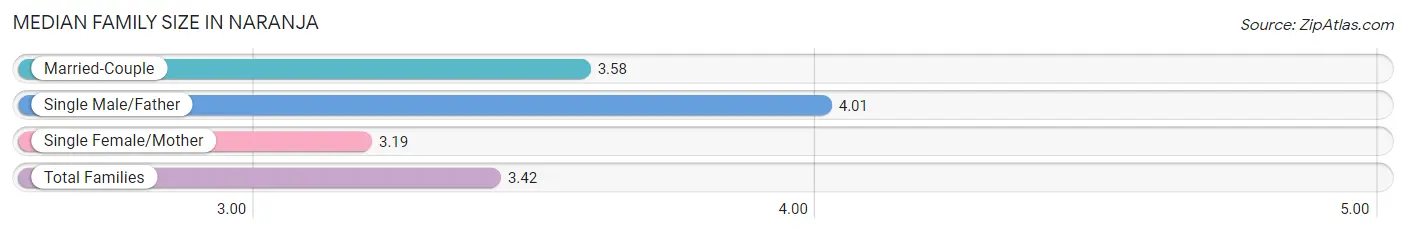
Median Family Size in Naranja
The median family size in Naranja is 3.42 persons per family, with single male/father families (201 | 6.2%) accounting for the largest median family size of 4.01 persons per family. On the other hand, single female/mother families (1,544 | 47.7%) represent the smallest median family size with 3.19 persons per family.
| Family Type | # Families | Family Size |
| Married-Couple | 1,489 (46.0%) | 3.58 |
| Single Male/Father | 201 (6.2%) | 4.01 |
| Single Female/Mother | 1,544 (47.7%) | 3.19 |
| Total Families | 3,234 (100.0%) | 3.42 |
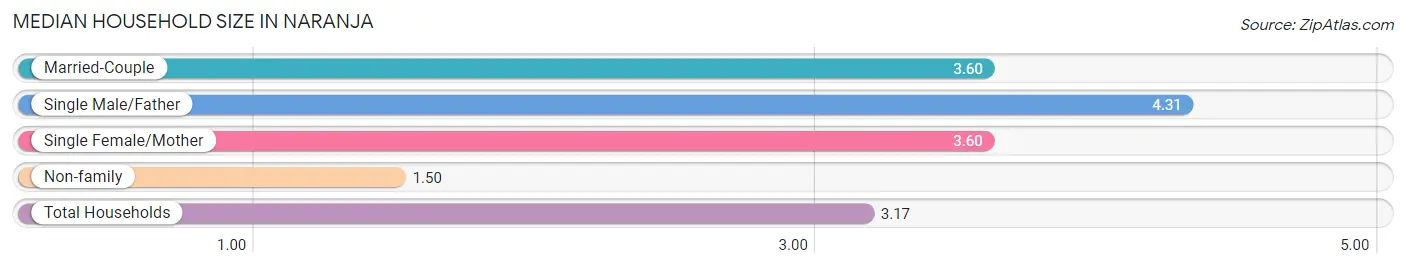
Median Household Size in Naranja
The median household size in Naranja is 3.17 persons per household, with single male/father households (201 | 4.8%) accounting for the largest median household size of 4.31 persons per household. non-family households (930 | 22.3%) represent the smallest median household size with 1.50 persons per household.
| Household Type | # Households | Household Size |
| Married-Couple | 1,489 (35.8%) | 3.60 |
| Single Male/Father | 201 (4.8%) | 4.31 |
| Single Female/Mother | 1,544 (37.1%) | 3.60 |
| Non-family | 930 (22.3%) | 1.50 |
| Total Households | 4,164 (100.0%) | 3.17 |
Household Size by Marriage Status in Naranja
Out of a total of 4,164 households in Naranja, 3,234 (77.7%) are family households, while 930 (22.3%) are nonfamily households. The most numerous type of family households are 3-person households, comprising 1,028, and the most common type of nonfamily households are 1-person households, comprising 722.
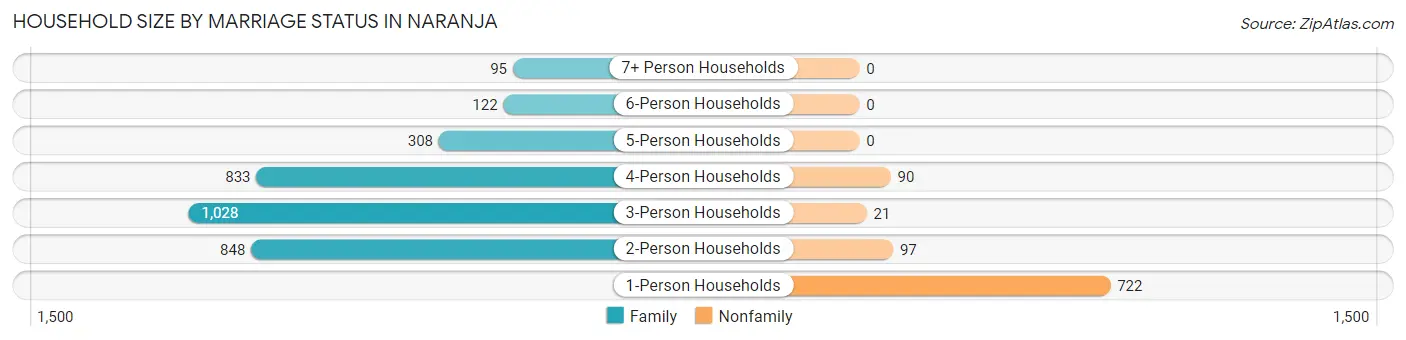
| Household Size | Family Households | Nonfamily Households |
| 1-Person Households | - | 722 (17.3%) |
| 2-Person Households | 848 (20.4%) | 97 (2.3%) |
| 3-Person Households | 1,028 (24.7%) | 21 (0.5%) |
| 4-Person Households | 833 (20.0%) | 90 (2.2%) |
| 5-Person Households | 308 (7.4%) | 0 (0.0%) |
| 6-Person Households | 122 (2.9%) | 0 (0.0%) |
| 7+ Person Households | 95 (2.3%) | 0 (0.0%) |
| Total | 3,234 (77.7%) | 930 (22.3%) |
Female Fertility in Naranja
Fertility by Age in Naranja
Average fertility rate in Naranja is 32.0 births per 1,000 women. Women in the age bracket of 20 to 34 years have the highest fertility rate with 60.0 births per 1,000 women. Women in the age bracket of 20 to 34 years acount for 100.0% of all women with births.
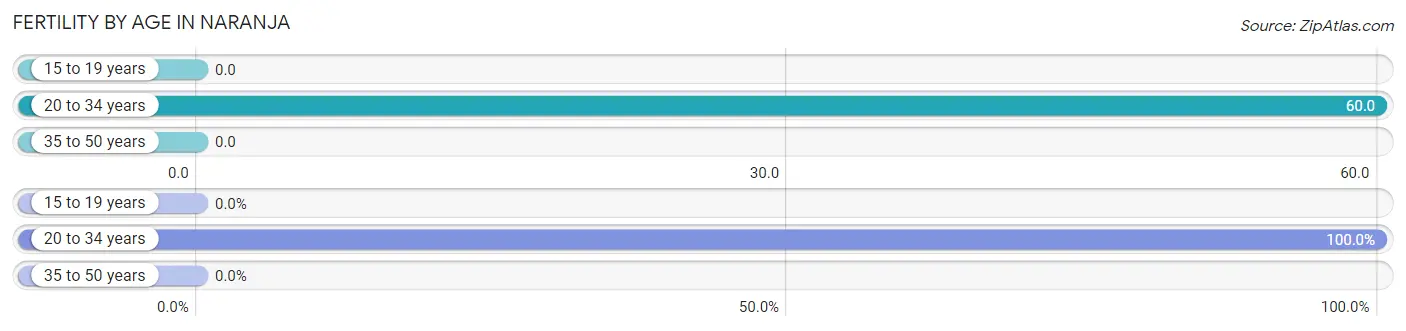
| Age Bracket | Women with Births | Births / 1,000 Women |
| 15 to 19 years | 0 (0.0%) | 0.0 |
| 20 to 34 years | 121 (100.0%) | 60.0 |
| 35 to 50 years | 0 (0.0%) | 0.0 |
| Total | 121 (100.0%) | 32.0 |
Fertility by Age by Marriage Status in Naranja
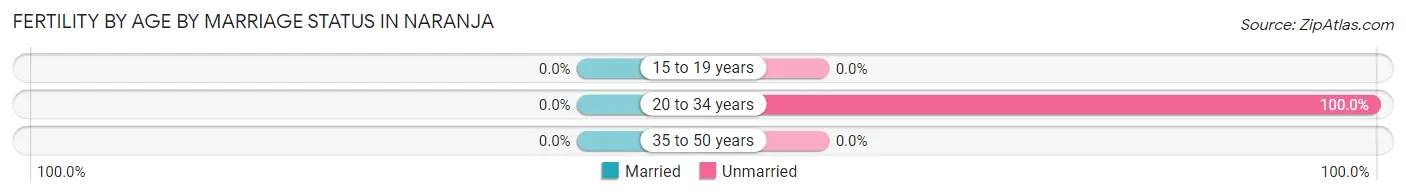
| Age Bracket | Married | Unmarried |
| 15 to 19 years | 0 (0.0%) | 0 (0.0%) |
| 20 to 34 years | 0 (0.0%) | 121 (100.0%) |
| 35 to 50 years | 0 (0.0%) | 0 (0.0%) |
| Total | 0 (0.0%) | 121 (100.0%) |
Fertility by Education in Naranja
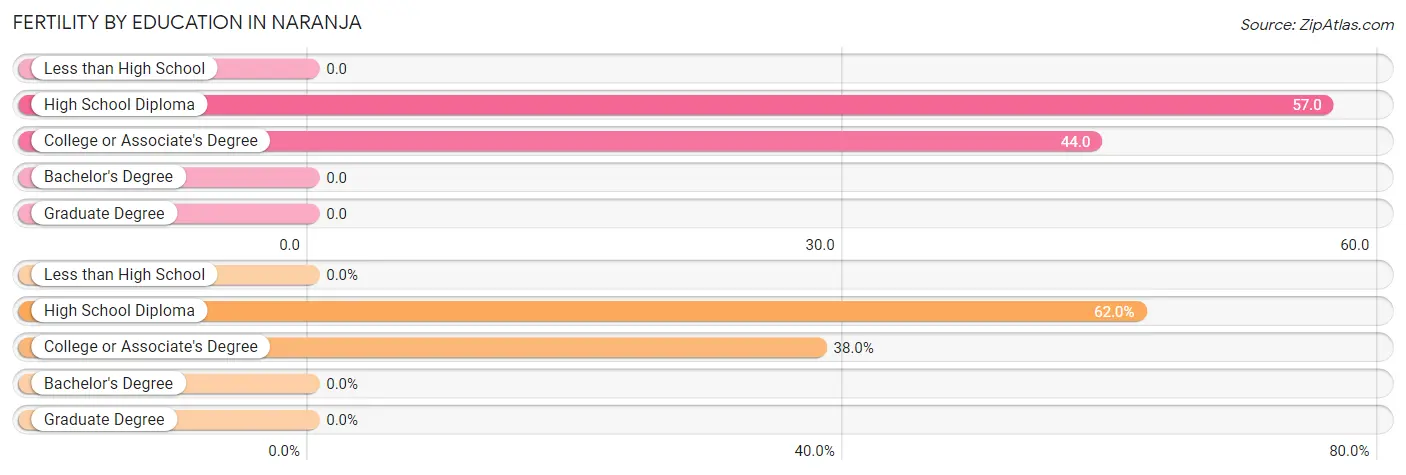
| Educational Attainment | Women with Births | Births / 1,000 Women |
| Less than High School | 0 (0.0%) | 0.0 |
| High School Diploma | 75 (62.0%) | 57.0 |
| College or Associate's Degree | 46 (38.0%) | 44.0 |
| Bachelor's Degree | 0 (0.0%) | 0.0 |
| Graduate Degree | 0 (0.0%) | 0.0 |
| Total | 121 (100.0%) | 32.0 |
Fertility by Education by Marriage Status in Naranja
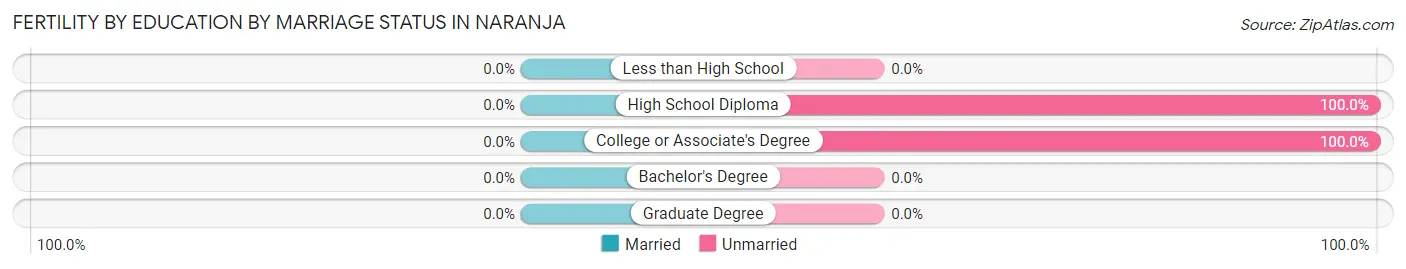
| Educational Attainment | Married | Unmarried |
| Less than High School | 0 (0.0%) | 0 (0.0%) |
| High School Diploma | 0 (0.0%) | 75 (100.0%) |
| College or Associate's Degree | 0 (0.0%) | 46 (100.0%) |
| Bachelor's Degree | 0 (0.0%) | 0 (0.0%) |
| Graduate Degree | 0 (0.0%) | 0 (0.0%) |
| Total | 0 (0.0%) | 121 (100.0%) |
Employment Characteristics in Naranja
Employment by Class of Employer in Naranja
Among the 5,070 employed individuals in Naranja, private company employees (3,516 | 69.4%), local government employees (385 | 7.6%), and self-employed (not incorporated) (347 | 6.8%) make up the most common classes of employment.
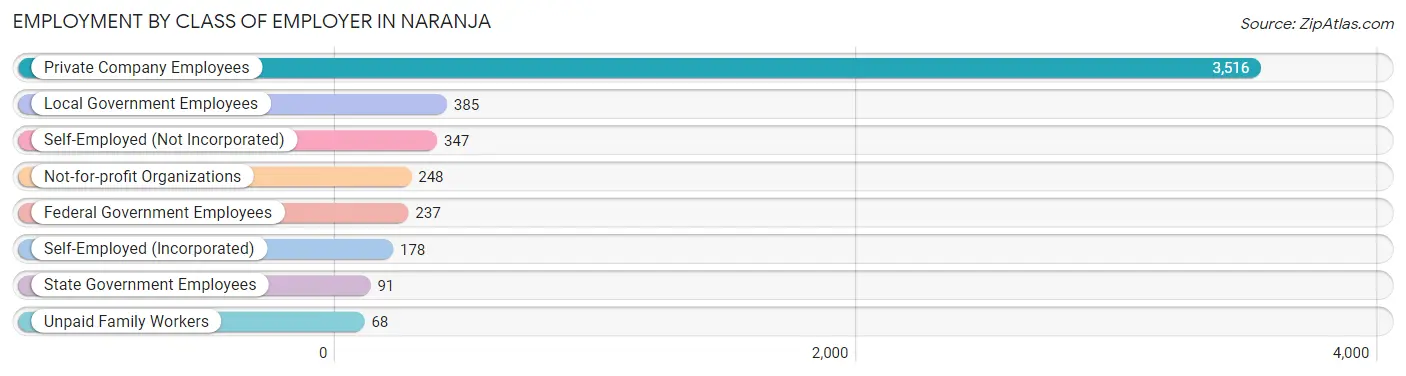
| Employer Class | # Employees | % Employees |
| Private Company Employees | 3,516 | 69.4% |
| Self-Employed (Incorporated) | 178 | 3.5% |
| Self-Employed (Not Incorporated) | 347 | 6.8% |
| Not-for-profit Organizations | 248 | 4.9% |
| Local Government Employees | 385 | 7.6% |
| State Government Employees | 91 | 1.8% |
| Federal Government Employees | 237 | 4.7% |
| Unpaid Family Workers | 68 | 1.3% |
| Total | 5,070 | 100.0% |
Employment Status by Age in Naranja
According to the labor force statistics for Naranja, out of the total population over 16 years of age (9,176), 65.6% or 6,019 individuals are in the labor force, with 10.2% or 614 of them unemployed. The age group with the highest labor force participation rate is 45 to 54 years, with 83.9% or 1,182 individuals in the labor force. Within the labor force, the 20 to 24 years age range has the highest percentage of unemployed individuals, with 40.9% or 239 of them being unemployed.
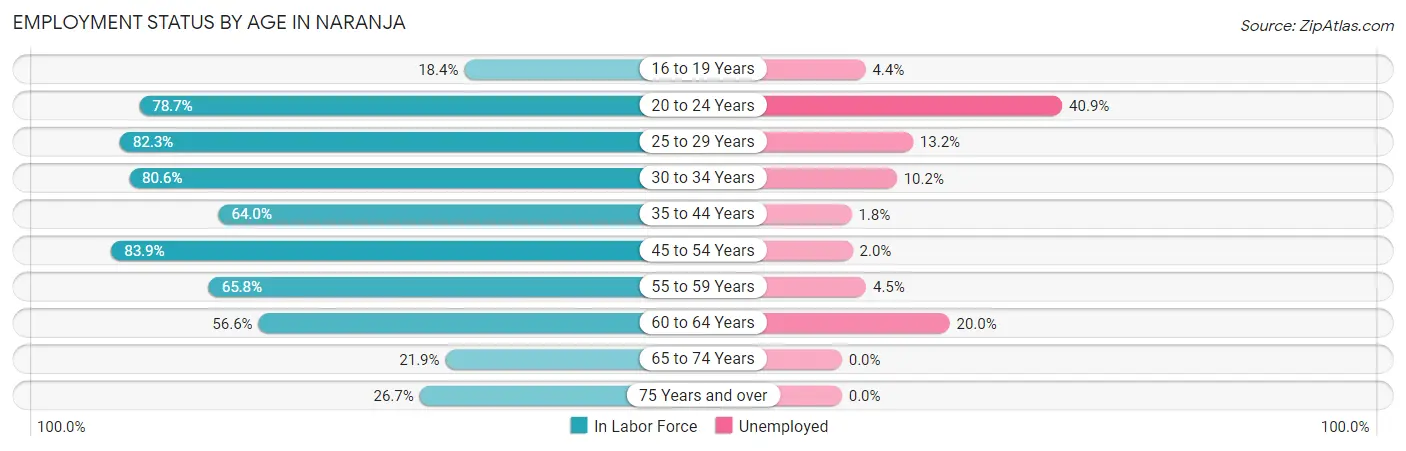
| Age Bracket | In Labor Force | Unemployed |
| 16 to 19 Years | 136 (18.4%) | 6 (4.4%) |
| 20 to 24 Years | 585 (78.7%) | 239 (40.9%) |
| 25 to 29 Years | 785 (82.3%) | 104 (13.2%) |
| 30 to 34 Years | 1,582 (80.6%) | 161 (10.2%) |
| 35 to 44 Years | 856 (64.0%) | 15 (1.8%) |
| 45 to 54 Years | 1,182 (83.9%) | 24 (2.0%) |
| 55 to 59 Years | 469 (65.8%) | 21 (4.5%) |
| 60 to 64 Years | 205 (56.6%) | 41 (20.0%) |
| 65 to 74 Years | 146 (21.9%) | 0 (0.0%) |
| 75 Years and over | 77 (26.7%) | 0 (0.0%) |
| Total | 6,019 (65.6%) | 614 (10.2%) |
Employment Status by Educational Attainment in Naranja
According to labor force statistics for Naranja, 75.4% of individuals (5,081) out of the total population between 25 and 64 years of age (6,739) are in the labor force, with 7.2% or 366 of them being unemployed. The group with the highest labor force participation rate are those with the educational attainment of bachelor's degree or higher, with 86.5% or 1,087 individuals in the labor force. Within the labor force, individuals with high school diploma education have the highest percentage of unemployment, with 15.3% or 276 of them being unemployed.
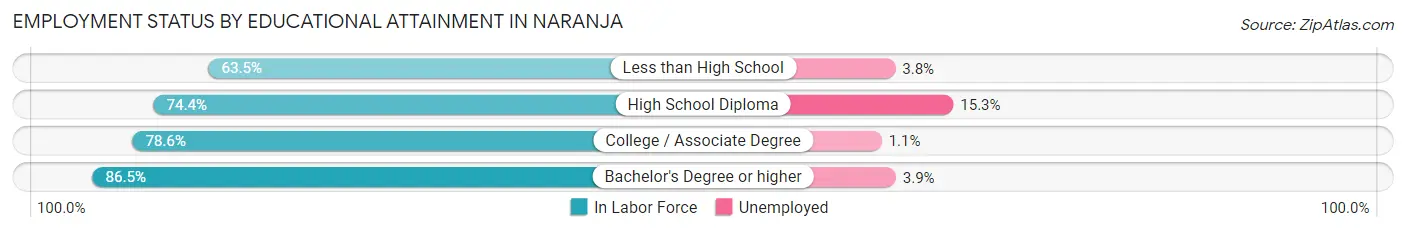
| Educational Attainment | In Labor Force | Unemployed |
| Less than High School | 896 (63.5%) | 54 (3.8%) |
| High School Diploma | 1,807 (74.4%) | 372 (15.3%) |
| College / Associate Degree | 1,291 (78.6%) | 18 (1.1%) |
| Bachelor's Degree or higher | 1,087 (86.5%) | 49 (3.9%) |
| Total | 5,081 (75.4%) | 485 (7.2%) |
Employment Occupations by Sex in Naranja
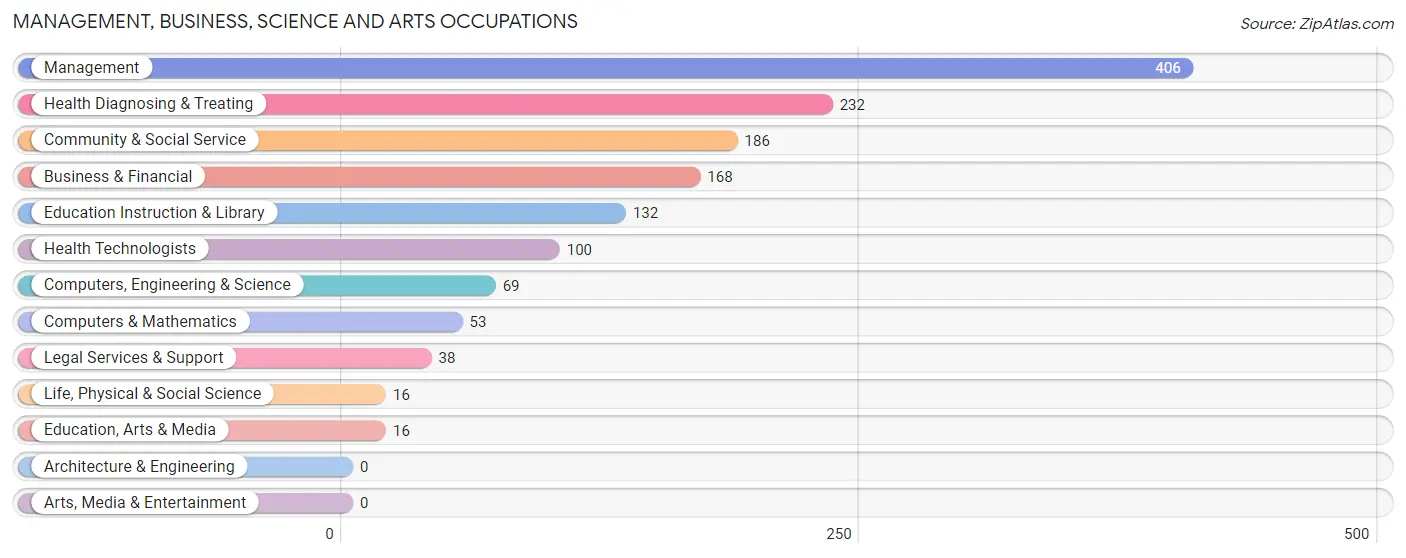
Management, Business, Science and Arts Occupations
The most common Management, Business, Science and Arts occupations in Naranja are Management (406 | 7.5%), Health Diagnosing & Treating (232 | 4.3%), Community & Social Service (186 | 3.5%), Business & Financial (168 | 3.1%), and Education Instruction & Library (132 | 2.5%).
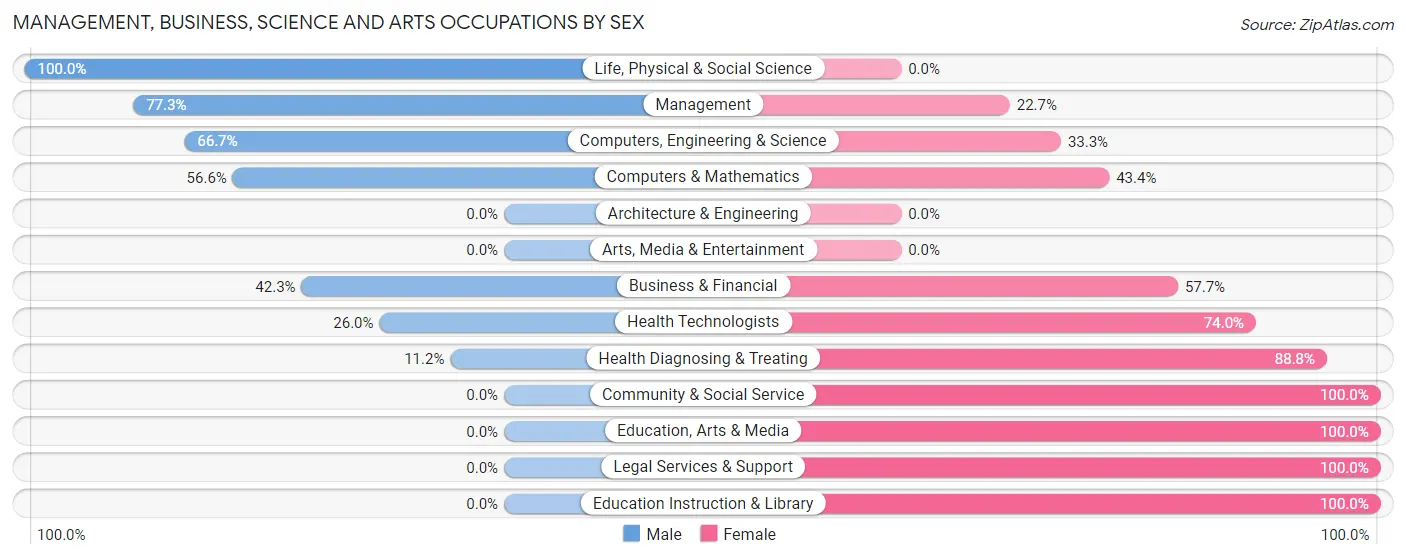
Management, Business, Science and Arts Occupations by Sex
Within the Management, Business, Science and Arts occupations in Naranja, the most male-oriented occupations are Life, Physical & Social Science (100.0%), Management (77.3%), and Computers, Engineering & Science (66.7%), while the most female-oriented occupations are Community & Social Service (100.0%), Education, Arts & Media (100.0%), and Legal Services & Support (100.0%).
| Occupation | Male | Female |
| Management | 314 (77.3%) | 92 (22.7%) |
| Business & Financial | 71 (42.3%) | 97 (57.7%) |
| Computers, Engineering & Science | 46 (66.7%) | 23 (33.3%) |
| Computers & Mathematics | 30 (56.6%) | 23 (43.4%) |
| Architecture & Engineering | 0 (0.0%) | 0 (0.0%) |
| Life, Physical & Social Science | 16 (100.0%) | 0 (0.0%) |
| Community & Social Service | 0 (0.0%) | 186 (100.0%) |
| Education, Arts & Media | 0 (0.0%) | 16 (100.0%) |
| Legal Services & Support | 0 (0.0%) | 38 (100.0%) |
| Education Instruction & Library | 0 (0.0%) | 132 (100.0%) |
| Arts, Media & Entertainment | 0 (0.0%) | 0 (0.0%) |
| Health Diagnosing & Treating | 26 (11.2%) | 206 (88.8%) |
| Health Technologists | 26 (26.0%) | 74 (74.0%) |
| Total (Category) | 457 (43.1%) | 604 (56.9%) |
| Total (Overall) | 2,847 (52.7%) | 2,550 (47.2%) |
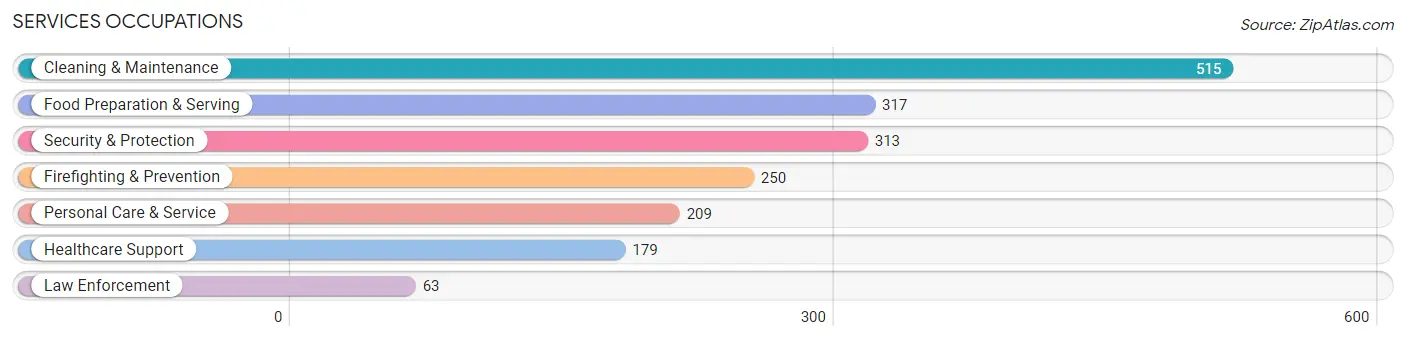
Services Occupations
The most common Services occupations in Naranja are Cleaning & Maintenance (515 | 9.5%), Food Preparation & Serving (317 | 5.9%), Security & Protection (313 | 5.8%), Firefighting & Prevention (250 | 4.6%), and Personal Care & Service (209 | 3.9%).
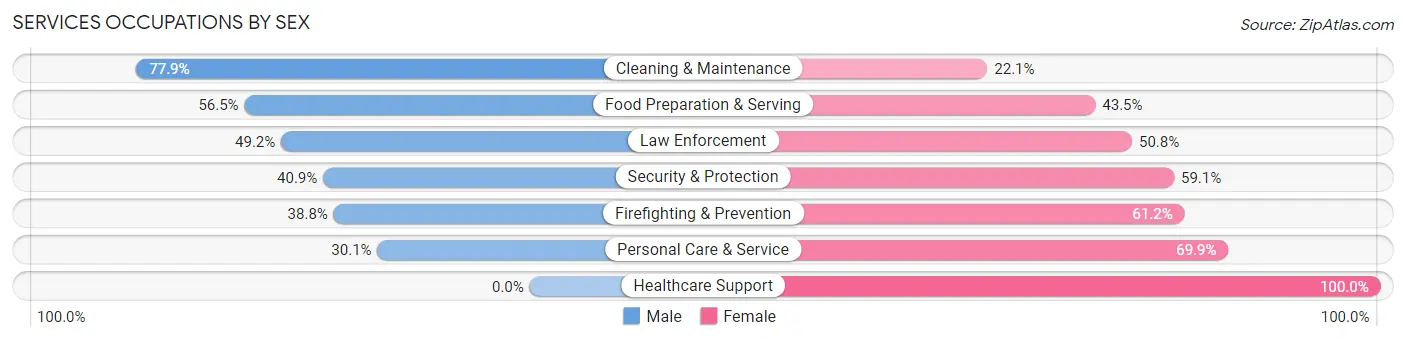
Services Occupations by Sex
Within the Services occupations in Naranja, the most male-oriented occupations are Cleaning & Maintenance (77.9%), Food Preparation & Serving (56.5%), and Law Enforcement (49.2%), while the most female-oriented occupations are Healthcare Support (100.0%), Personal Care & Service (69.9%), and Firefighting & Prevention (61.2%).
| Occupation | Male | Female |
| Healthcare Support | 0 (0.0%) | 179 (100.0%) |
| Security & Protection | 128 (40.9%) | 185 (59.1%) |
| Firefighting & Prevention | 97 (38.8%) | 153 (61.2%) |
| Law Enforcement | 31 (49.2%) | 32 (50.8%) |
| Food Preparation & Serving | 179 (56.5%) | 138 (43.5%) |
| Cleaning & Maintenance | 401 (77.9%) | 114 (22.1%) |
| Personal Care & Service | 63 (30.1%) | 146 (69.9%) |
| Total (Category) | 771 (50.3%) | 762 (49.7%) |
| Total (Overall) | 2,847 (52.7%) | 2,550 (47.2%) |
Sales and Office Occupations
The most common Sales and Office occupations in Naranja are Office & Administration (654 | 12.1%), and Sales & Related (558 | 10.3%).
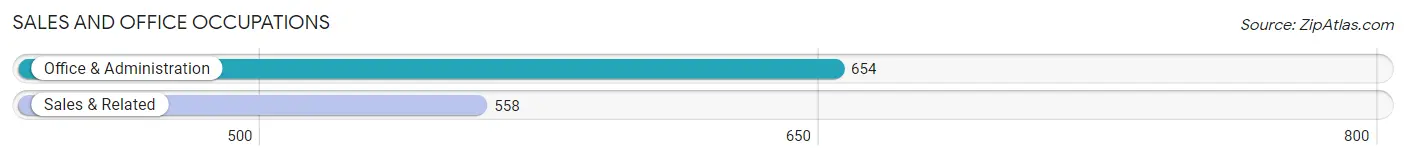
Sales and Office Occupations by Sex
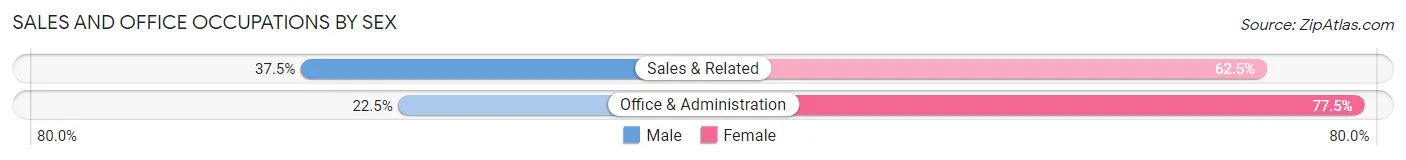
| Occupation | Male | Female |
| Sales & Related | 209 (37.5%) | 349 (62.5%) |
| Office & Administration | 147 (22.5%) | 507 (77.5%) |
| Total (Category) | 356 (29.4%) | 856 (70.6%) |
| Total (Overall) | 2,847 (52.7%) | 2,550 (47.2%) |
Natural Resources, Construction and Maintenance Occupations
The most common Natural Resources, Construction and Maintenance occupations in Naranja are Construction & Extraction (559 | 10.4%), Installation, Maintenance & Repair (248 | 4.6%), and Farming, Fishing & Forestry (98 | 1.8%).
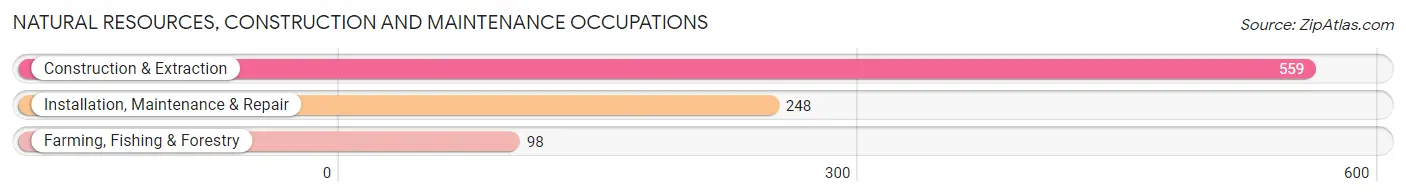
Natural Resources, Construction and Maintenance Occupations by Sex
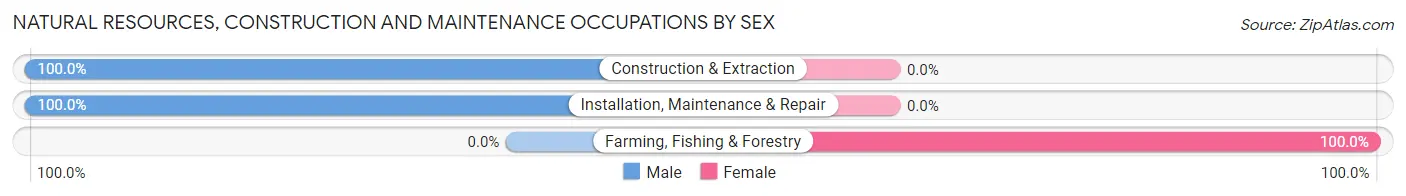
| Occupation | Male | Female |
| Farming, Fishing & Forestry | 0 (0.0%) | 98 (100.0%) |
| Construction & Extraction | 559 (100.0%) | 0 (0.0%) |
| Installation, Maintenance & Repair | 248 (100.0%) | 0 (0.0%) |
| Total (Category) | 807 (89.2%) | 98 (10.8%) |
| Total (Overall) | 2,847 (52.7%) | 2,550 (47.2%) |
Production, Transportation and Moving Occupations
The most common Production, Transportation and Moving occupations in Naranja are Transportation (255 | 4.7%), Material Moving (252 | 4.7%), and Production (179 | 3.3%).
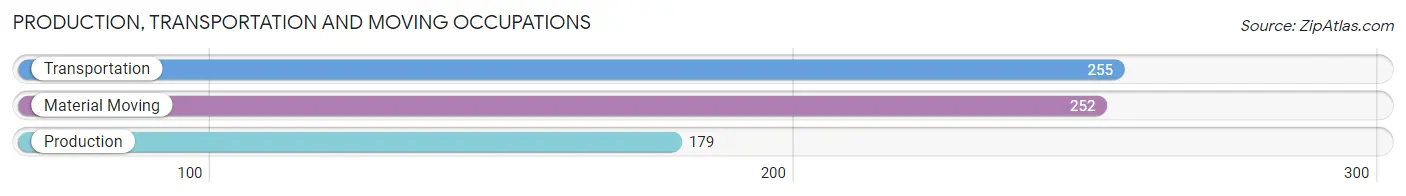
Production, Transportation and Moving Occupations by Sex
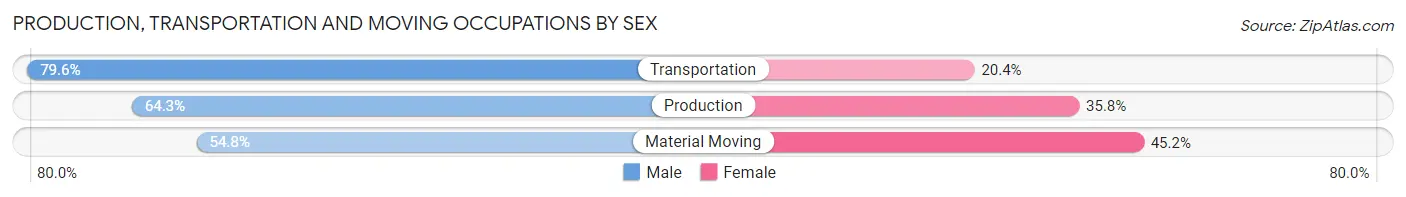
| Occupation | Male | Female |
| Production | 115 (64.2%) | 64 (35.7%) |
| Transportation | 203 (79.6%) | 52 (20.4%) |
| Material Moving | 138 (54.8%) | 114 (45.2%) |
| Total (Category) | 456 (66.5%) | 230 (33.5%) |
| Total (Overall) | 2,847 (52.7%) | 2,550 (47.2%) |
Employment Industries by Sex in Naranja
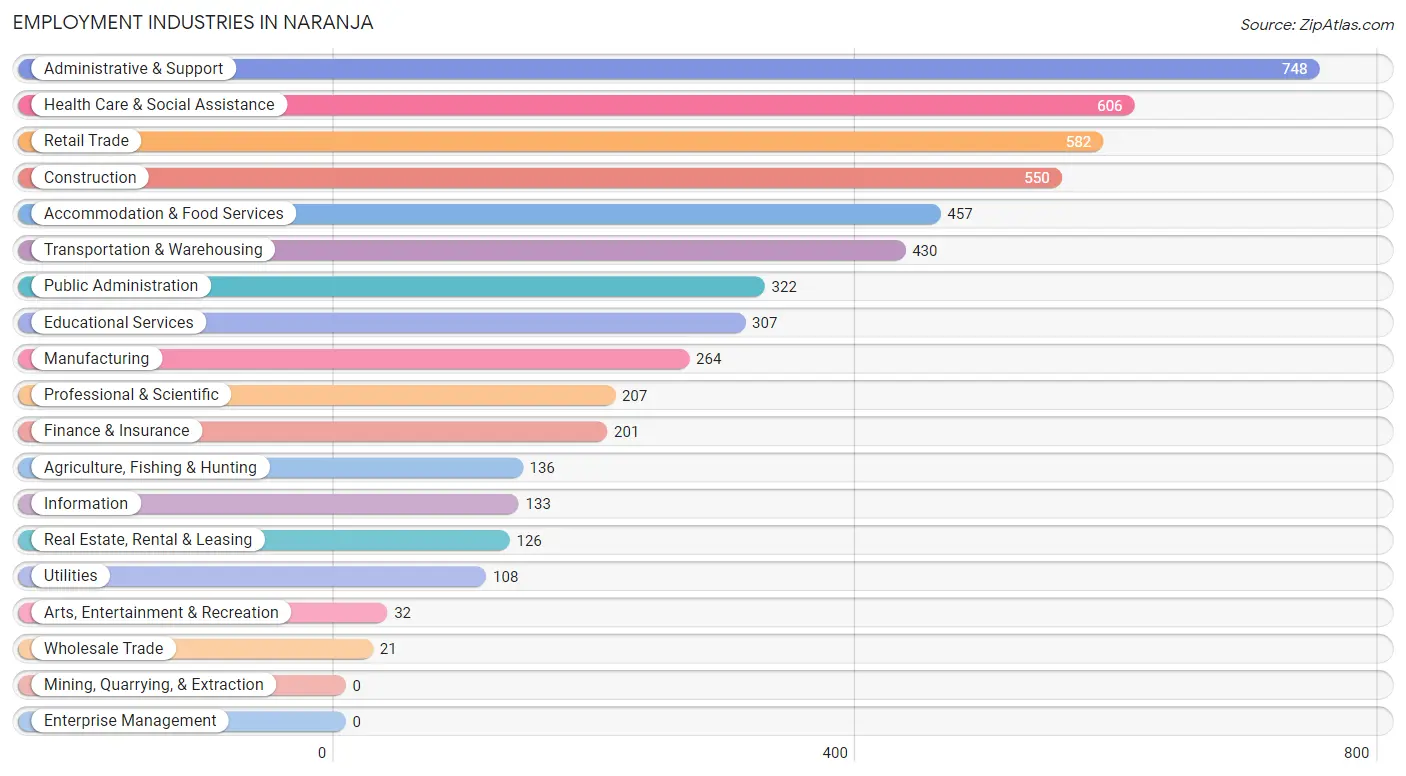
Employment Industries in Naranja
The major employment industries in Naranja include Administrative & Support (748 | 13.9%), Health Care & Social Assistance (606 | 11.2%), Retail Trade (582 | 10.8%), Construction (550 | 10.2%), and Accommodation & Food Services (457 | 8.5%).
Employment Industries by Sex in Naranja
The Naranja industries that see more men than women are Construction (100.0%), Information (100.0%), and Real Estate, Rental & Leasing (88.1%), whereas the industries that tend to have a higher number of women are Professional & Scientific (93.2%), Health Care & Social Assistance (80.7%), and Educational Services (78.2%).
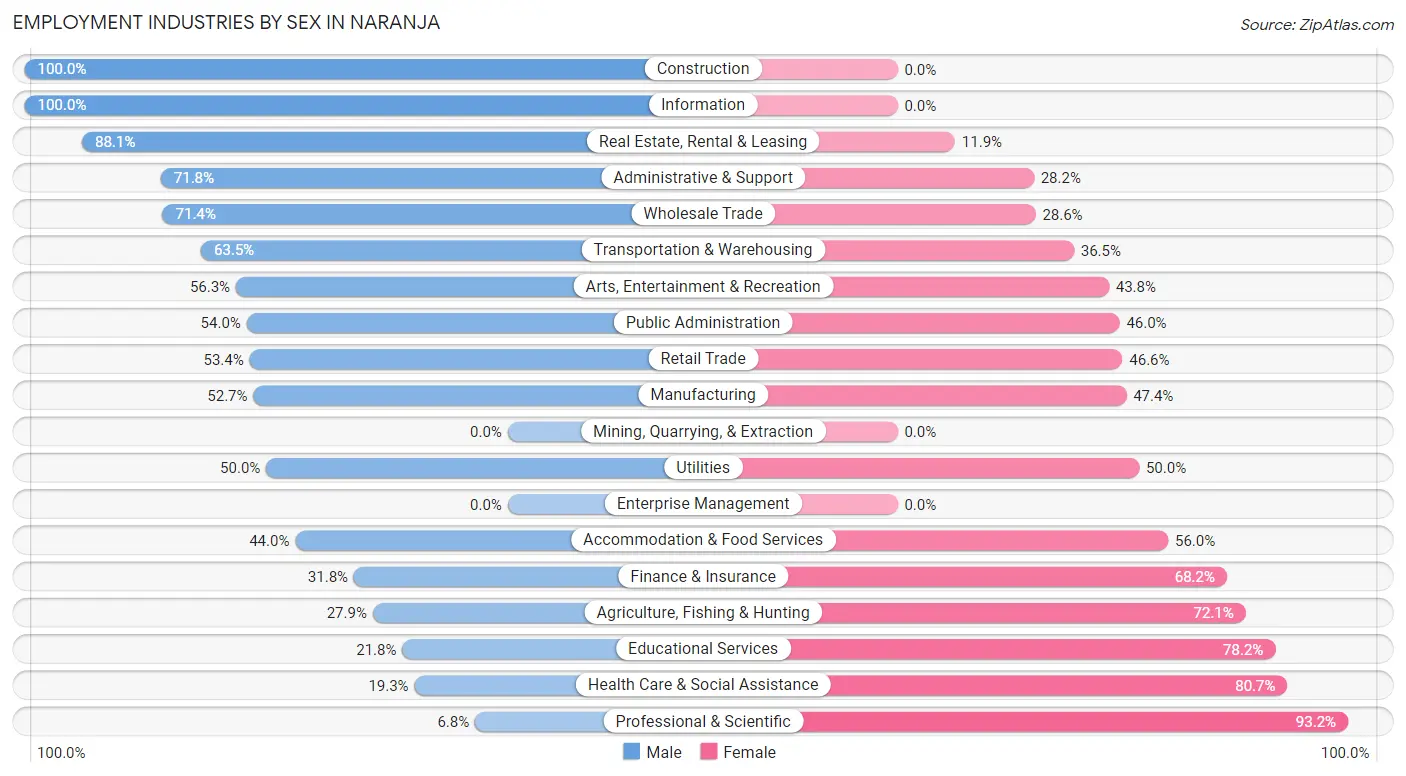
| Industry | Male | Female |
| Agriculture, Fishing & Hunting | 38 (27.9%) | 98 (72.1%) |
| Mining, Quarrying, & Extraction | 0 (0.0%) | 0 (0.0%) |
| Construction | 550 (100.0%) | 0 (0.0%) |
| Manufacturing | 139 (52.6%) | 125 (47.3%) |
| Wholesale Trade | 15 (71.4%) | 6 (28.6%) |
| Retail Trade | 311 (53.4%) | 271 (46.6%) |
| Transportation & Warehousing | 273 (63.5%) | 157 (36.5%) |
| Utilities | 54 (50.0%) | 54 (50.0%) |
| Information | 133 (100.0%) | 0 (0.0%) |
| Finance & Insurance | 64 (31.8%) | 137 (68.2%) |
| Real Estate, Rental & Leasing | 111 (88.1%) | 15 (11.9%) |
| Professional & Scientific | 14 (6.8%) | 193 (93.2%) |
| Enterprise Management | 0 (0.0%) | 0 (0.0%) |
| Administrative & Support | 537 (71.8%) | 211 (28.2%) |
| Educational Services | 67 (21.8%) | 240 (78.2%) |
| Health Care & Social Assistance | 117 (19.3%) | 489 (80.7%) |
| Arts, Entertainment & Recreation | 18 (56.2%) | 14 (43.8%) |
| Accommodation & Food Services | 201 (44.0%) | 256 (56.0%) |
| Public Administration | 174 (54.0%) | 148 (46.0%) |
| Total | 2,847 (52.7%) | 2,550 (47.2%) |
Education in Naranja
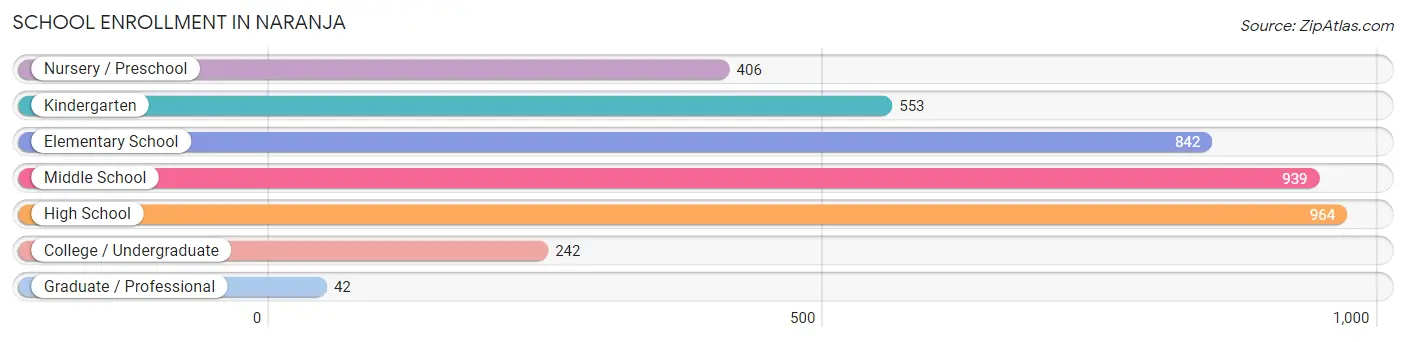
School Enrollment in Naranja
The most common levels of schooling among the 3,988 students in Naranja are high school (964 | 24.2%), middle school (939 | 23.5%), and elementary school (842 | 21.1%).
| School Level | # Students | % Students |
| Nursery / Preschool | 406 | 10.2% |
| Kindergarten | 553 | 13.9% |
| Elementary School | 842 | 21.1% |
| Middle School | 939 | 23.5% |
| High School | 964 | 24.2% |
| College / Undergraduate | 242 | 6.1% |
| Graduate / Professional | 42 | 1.1% |
| Total | 3,988 | 100.0% |
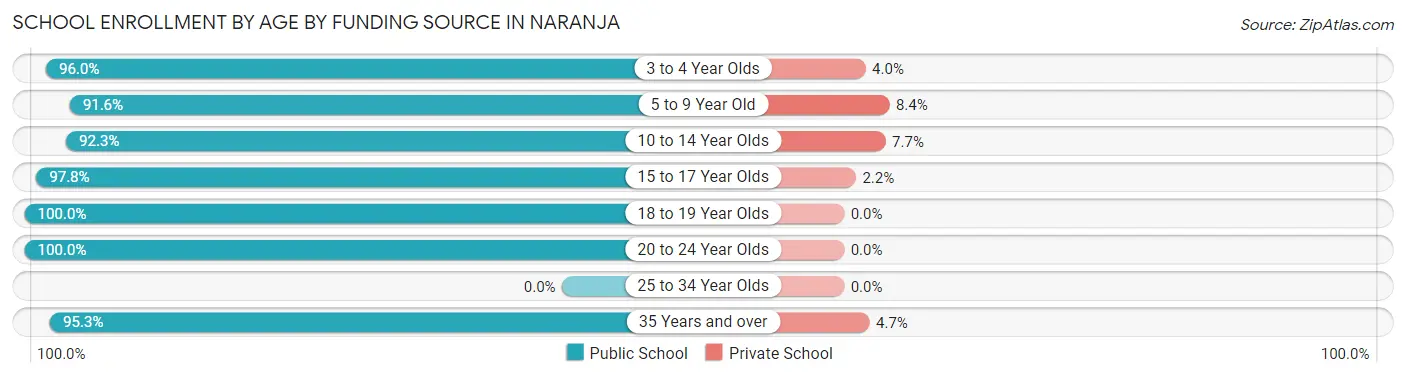
School Enrollment by Age by Funding Source in Naranja
Out of a total of 3,988 students who are enrolled in schools in Naranja, 239 (6.0%) attend a private institution, while the remaining 3,749 (94.0%) are enrolled in public schools. The age group of 5 to 9 year old has the highest likelihood of being enrolled in private schools, with 101 (8.4% in the age bracket) enrolled. Conversely, the age group of 18 to 19 year olds has the lowest likelihood of being enrolled in a private school, with 187 (100.0% in the age bracket) attending a public institution.
| Age Bracket | Public School | Private School |
| 3 to 4 Year Olds | 432 (96.0%) | 18 (4.0%) |
| 5 to 9 Year Old | 1,096 (91.6%) | 101 (8.4%) |
| 10 to 14 Year Olds | 1,170 (92.3%) | 98 (7.7%) |
| 15 to 17 Year Olds | 534 (97.8%) | 12 (2.2%) |
| 18 to 19 Year Olds | 187 (100.0%) | 0 (0.0%) |
| 20 to 24 Year Olds | 150 (100.0%) | 0 (0.0%) |
| 25 to 34 Year Olds | 0 (0.0%) | 0 (0.0%) |
| 35 Years and over | 181 (95.3%) | 9 (4.7%) |
| Total | 3,749 (94.0%) | 239 (6.0%) |
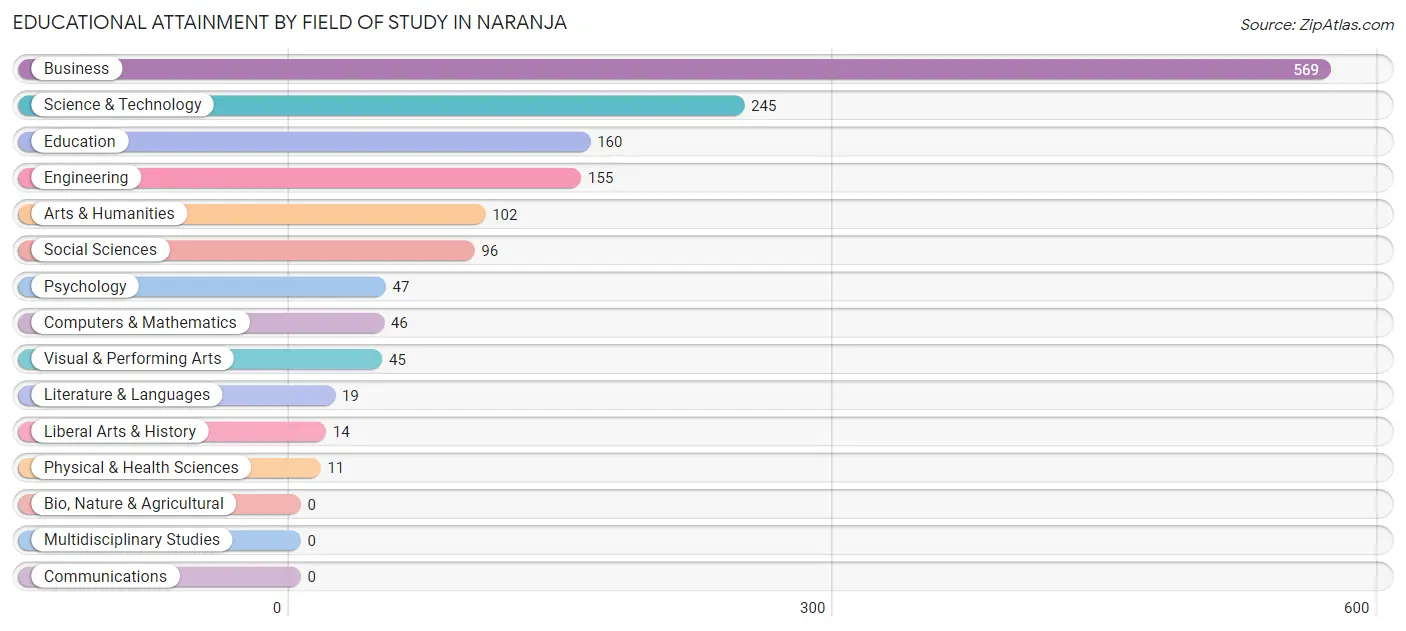
Educational Attainment by Field of Study in Naranja
Business (569 | 37.7%), science & technology (245 | 16.2%), education (160 | 10.6%), engineering (155 | 10.3%), and arts & humanities (102 | 6.8%) are the most common fields of study among 1,509 individuals in Naranja who have obtained a bachelor's degree or higher.
| Field of Study | # Graduates | % Graduates |
| Computers & Mathematics | 46 | 3.0% |
| Bio, Nature & Agricultural | 0 | 0.0% |
| Physical & Health Sciences | 11 | 0.7% |
| Psychology | 47 | 3.1% |
| Social Sciences | 96 | 6.4% |
| Engineering | 155 | 10.3% |
| Multidisciplinary Studies | 0 | 0.0% |
| Science & Technology | 245 | 16.2% |
| Business | 569 | 37.7% |
| Education | 160 | 10.6% |
| Literature & Languages | 19 | 1.3% |
| Liberal Arts & History | 14 | 0.9% |
| Visual & Performing Arts | 45 | 3.0% |
| Communications | 0 | 0.0% |
| Arts & Humanities | 102 | 6.8% |
| Total | 1,509 | 100.0% |
Transportation & Commute in Naranja
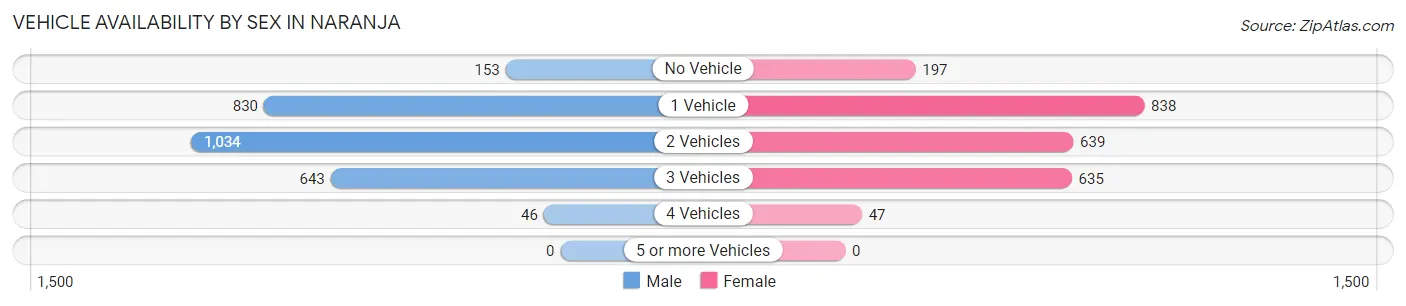
Vehicle Availability by Sex in Naranja
The most prevalent vehicle ownership categories in Naranja are males with 2 vehicles (1,034, accounting for 38.2%) and females with 2 vehicles (639, making up 43.9%).
| Vehicles Available | Male | Female |
| No Vehicle | 153 (5.7%) | 197 (8.4%) |
| 1 Vehicle | 830 (30.7%) | 838 (35.6%) |
| 2 Vehicles | 1,034 (38.2%) | 639 (27.1%) |
| 3 Vehicles | 643 (23.8%) | 635 (27.0%) |
| 4 Vehicles | 46 (1.7%) | 47 (2.0%) |
| 5 or more Vehicles | 0 (0.0%) | 0 (0.0%) |
| Total | 2,706 (100.0%) | 2,356 (100.0%) |
Commute Time in Naranja
The most frequently occuring commute durations in Naranja are 30 to 34 minutes (885 commuters, 20.0%), 60 to 89 minutes (669 commuters, 15.1%), and 20 to 24 minutes (577 commuters, 13.1%).
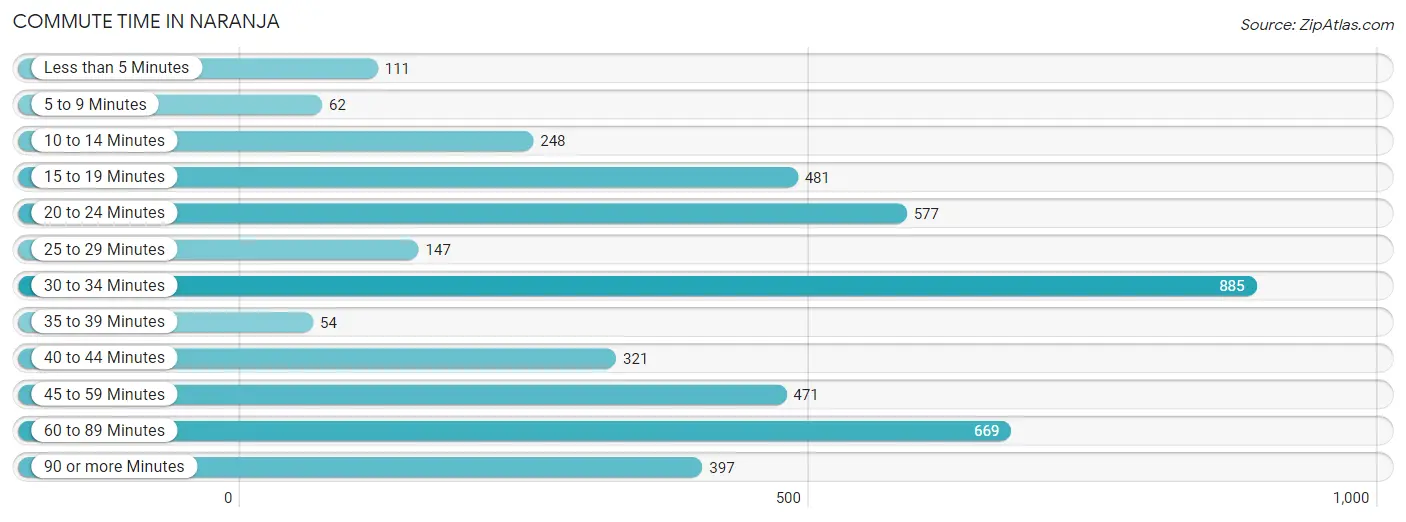
| Commute Time | # Commuters | % Commuters |
| Less than 5 Minutes | 111 | 2.5% |
| 5 to 9 Minutes | 62 | 1.4% |
| 10 to 14 Minutes | 248 | 5.6% |
| 15 to 19 Minutes | 481 | 10.9% |
| 20 to 24 Minutes | 577 | 13.1% |
| 25 to 29 Minutes | 147 | 3.3% |
| 30 to 34 Minutes | 885 | 20.0% |
| 35 to 39 Minutes | 54 | 1.2% |
| 40 to 44 Minutes | 321 | 7.3% |
| 45 to 59 Minutes | 471 | 10.6% |
| 60 to 89 Minutes | 669 | 15.1% |
| 90 or more Minutes | 397 | 9.0% |
Commute Time by Sex in Naranja
The most common commute times in Naranja are 20 to 24 minutes (476 commuters, 19.6%) for males and 30 to 34 minutes (635 commuters, 31.9%) for females.
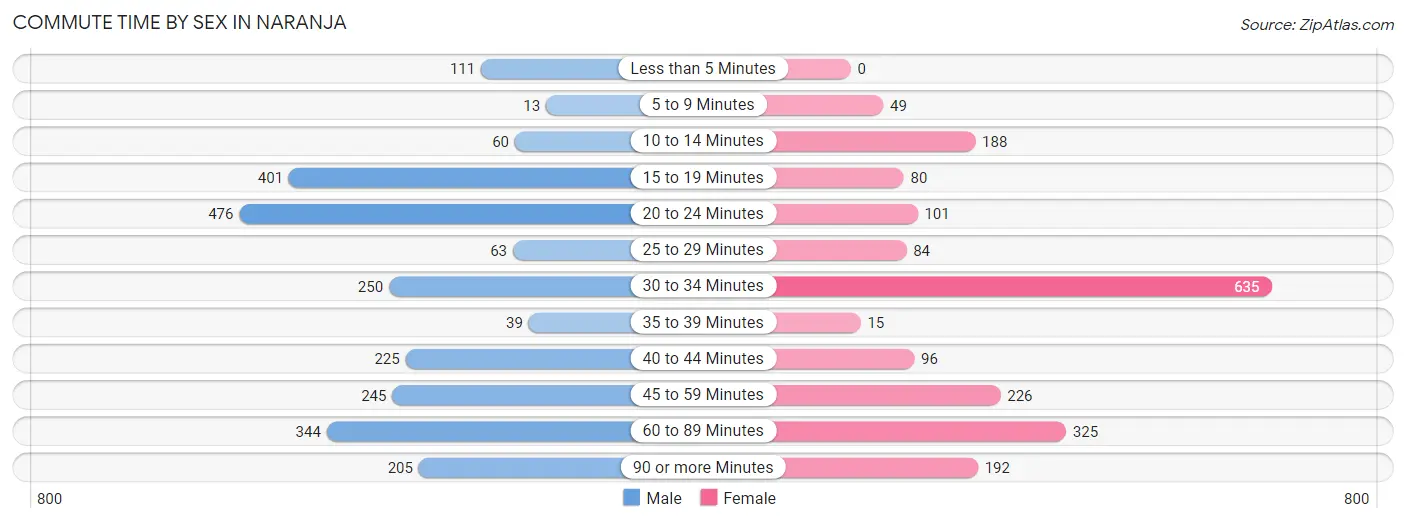
| Commute Time | Male | Female |
| Less than 5 Minutes | 111 (4.6%) | 0 (0.0%) |
| 5 to 9 Minutes | 13 (0.5%) | 49 (2.5%) |
| 10 to 14 Minutes | 60 (2.5%) | 188 (9.4%) |
| 15 to 19 Minutes | 401 (16.5%) | 80 (4.0%) |
| 20 to 24 Minutes | 476 (19.6%) | 101 (5.1%) |
| 25 to 29 Minutes | 63 (2.6%) | 84 (4.2%) |
| 30 to 34 Minutes | 250 (10.3%) | 635 (31.9%) |
| 35 to 39 Minutes | 39 (1.6%) | 15 (0.7%) |
| 40 to 44 Minutes | 225 (9.2%) | 96 (4.8%) |
| 45 to 59 Minutes | 245 (10.1%) | 226 (11.4%) |
| 60 to 89 Minutes | 344 (14.1%) | 325 (16.3%) |
| 90 or more Minutes | 205 (8.4%) | 192 (9.6%) |
Time of Departure to Work by Sex in Naranja
The most frequent times of departure to work in Naranja are 8:00 AM to 8:29 AM (390, 16.0%) for males and 6:00 AM to 6:29 AM (295, 14.8%) for females.
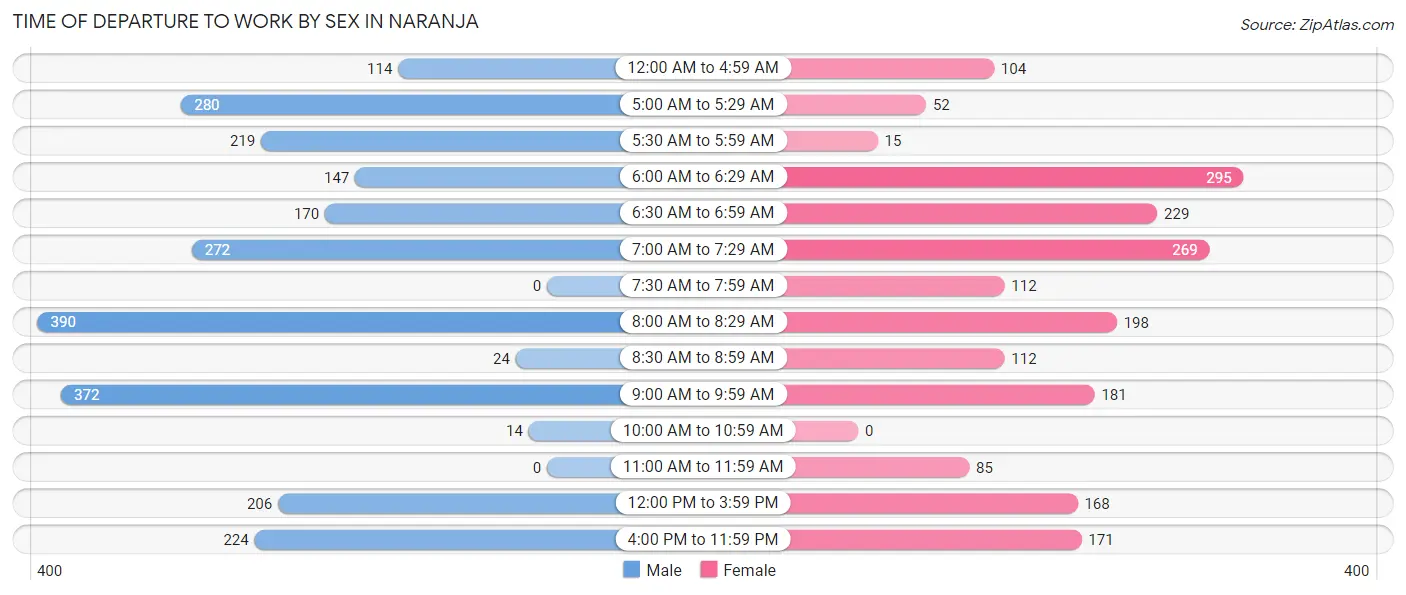
| Time of Departure | Male | Female |
| 12:00 AM to 4:59 AM | 114 (4.7%) | 104 (5.2%) |
| 5:00 AM to 5:29 AM | 280 (11.5%) | 52 (2.6%) |
| 5:30 AM to 5:59 AM | 219 (9.0%) | 15 (0.7%) |
| 6:00 AM to 6:29 AM | 147 (6.0%) | 295 (14.8%) |
| 6:30 AM to 6:59 AM | 170 (7.0%) | 229 (11.5%) |
| 7:00 AM to 7:29 AM | 272 (11.2%) | 269 (13.5%) |
| 7:30 AM to 7:59 AM | 0 (0.0%) | 112 (5.6%) |
| 8:00 AM to 8:29 AM | 390 (16.0%) | 198 (9.9%) |
| 8:30 AM to 8:59 AM | 24 (1.0%) | 112 (5.6%) |
| 9:00 AM to 9:59 AM | 372 (15.3%) | 181 (9.1%) |
| 10:00 AM to 10:59 AM | 14 (0.6%) | 0 (0.0%) |
| 11:00 AM to 11:59 AM | 0 (0.0%) | 85 (4.3%) |
| 12:00 PM to 3:59 PM | 206 (8.5%) | 168 (8.4%) |
| 4:00 PM to 11:59 PM | 224 (9.2%) | 171 (8.6%) |
| Total | 2,432 (100.0%) | 1,991 (100.0%) |
Housing Occupancy in Naranja
Occupancy by Ownership in Naranja
Of the total 4,164 dwellings in Naranja, owner-occupied units account for 1,159 (27.8%), while renter-occupied units make up 3,005 (72.2%).
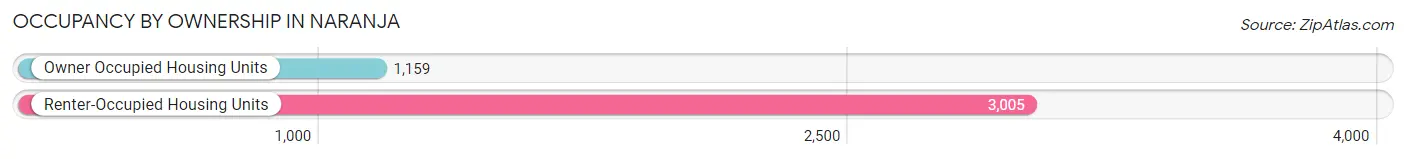
| Occupancy | # Housing Units | % Housing Units |
| Owner Occupied Housing Units | 1,159 | 27.8% |
| Renter-Occupied Housing Units | 3,005 | 72.2% |
| Total Occupied Housing Units | 4,164 | 100.0% |
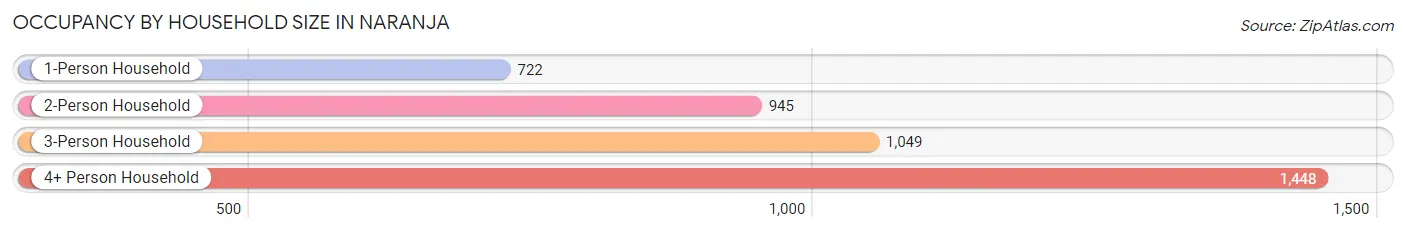
Occupancy by Household Size in Naranja
| Household Size | # Housing Units | % Housing Units |
| 1-Person Household | 722 | 17.3% |
| 2-Person Household | 945 | 22.7% |
| 3-Person Household | 1,049 | 25.2% |
| 4+ Person Household | 1,448 | 34.8% |
| Total Housing Units | 4,164 | 100.0% |
Occupancy by Ownership by Household Size in Naranja
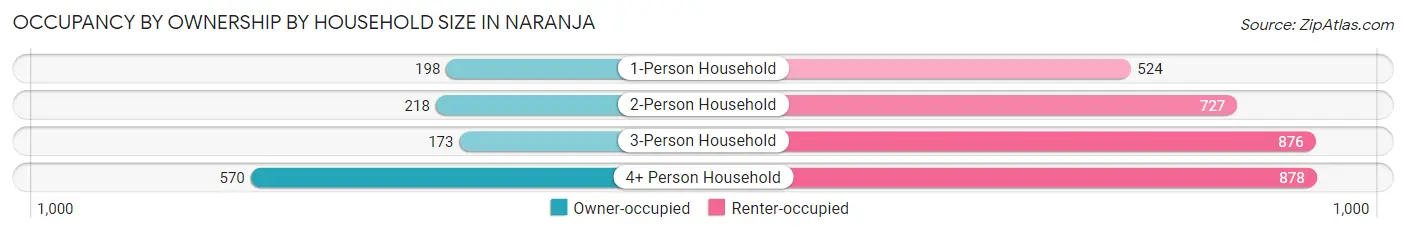
| Household Size | Owner-occupied | Renter-occupied |
| 1-Person Household | 198 (27.4%) | 524 (72.6%) |
| 2-Person Household | 218 (23.1%) | 727 (76.9%) |
| 3-Person Household | 173 (16.5%) | 876 (83.5%) |
| 4+ Person Household | 570 (39.4%) | 878 (60.6%) |
| Total Housing Units | 1,159 (27.8%) | 3,005 (72.2%) |
Occupancy by Educational Attainment in Naranja
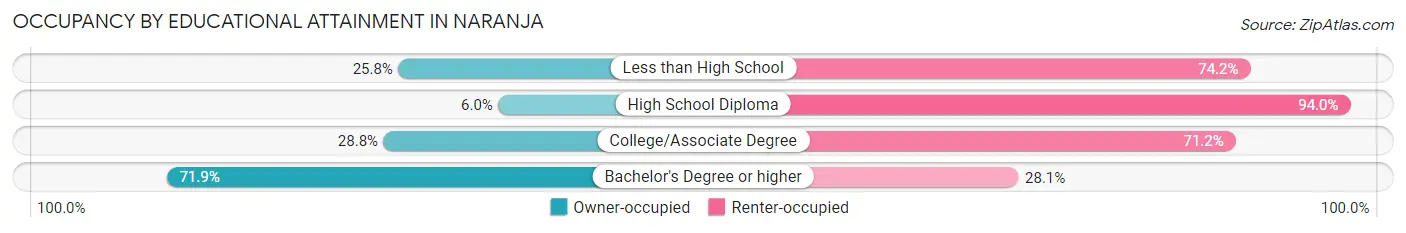
| Household Size | Owner-occupied | Renter-occupied |
| Less than High School | 217 (25.8%) | 623 (74.2%) |
| High School Diploma | 87 (6.0%) | 1,361 (94.0%) |
| College/Associate Degree | 329 (28.8%) | 815 (71.2%) |
| Bachelor's Degree or higher | 526 (71.9%) | 206 (28.1%) |
Occupancy by Age of Householder in Naranja
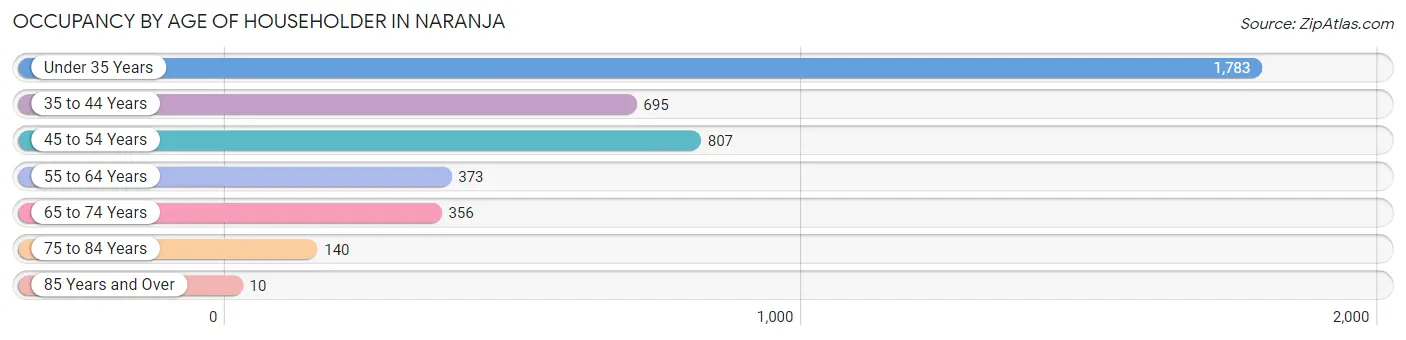
| Age Bracket | # Households | % Households |
| Under 35 Years | 1,783 | 42.8% |
| 35 to 44 Years | 695 | 16.7% |
| 45 to 54 Years | 807 | 19.4% |
| 55 to 64 Years | 373 | 9.0% |
| 65 to 74 Years | 356 | 8.6% |
| 75 to 84 Years | 140 | 3.4% |
| 85 Years and Over | 10 | 0.2% |
| Total | 4,164 | 100.0% |
Housing Finances in Naranja
Median Income by Occupancy in Naranja
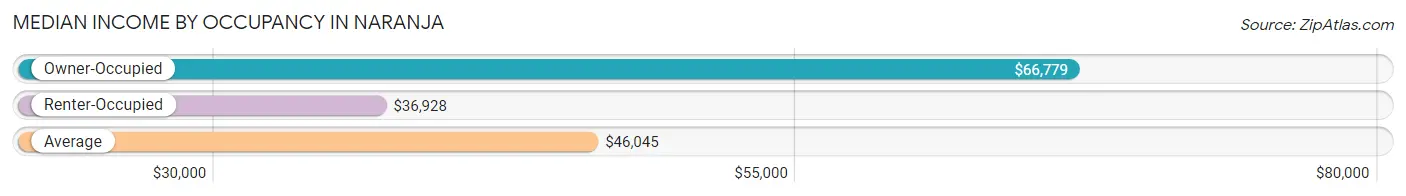
| Occupancy Type | # Households | Median Income |
| Owner-Occupied | 1,159 (27.8%) | $66,779 |
| Renter-Occupied | 3,005 (72.2%) | $36,928 |
| Average | 4,164 (100.0%) | $46,045 |
Occupancy by Householder Income Bracket in Naranja
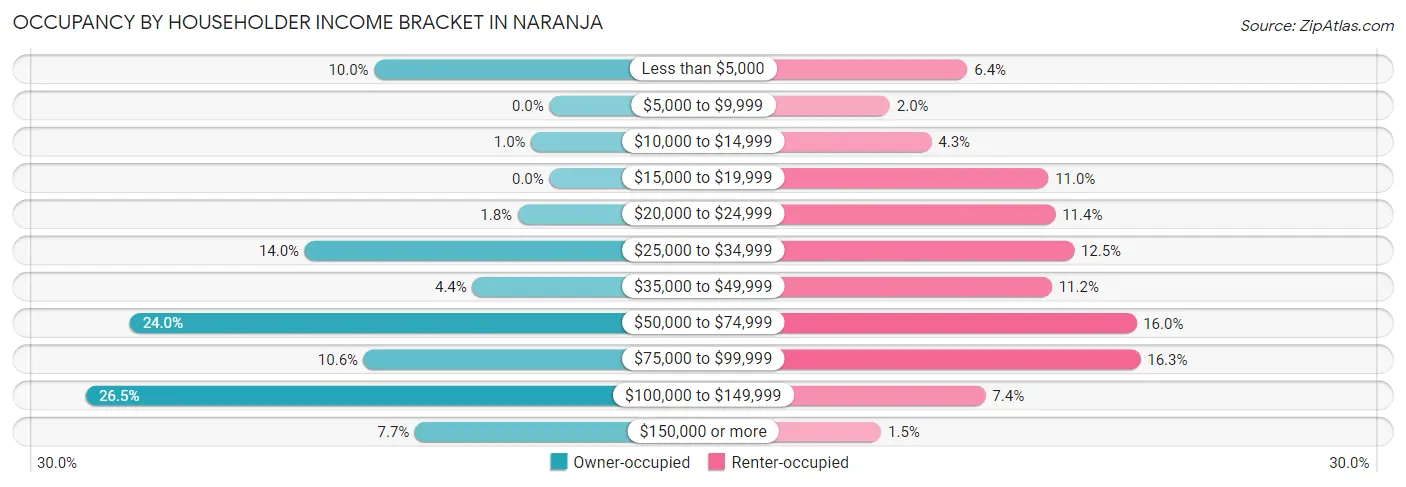
| Income Bracket | Owner-occupied | Renter-occupied |
| Less than $5,000 | 116 (10.0%) | 192 (6.4%) |
| $5,000 to $9,999 | 0 (0.0%) | 59 (2.0%) |
| $10,000 to $14,999 | 12 (1.0%) | 130 (4.3%) |
| $15,000 to $19,999 | 0 (0.0%) | 331 (11.0%) |
| $20,000 to $24,999 | 21 (1.8%) | 343 (11.4%) |
| $25,000 to $34,999 | 162 (14.0%) | 375 (12.5%) |
| $35,000 to $49,999 | 51 (4.4%) | 337 (11.2%) |
| $50,000 to $74,999 | 278 (24.0%) | 482 (16.0%) |
| $75,000 to $99,999 | 123 (10.6%) | 489 (16.3%) |
| $100,000 to $149,999 | 307 (26.5%) | 223 (7.4%) |
| $150,000 or more | 89 (7.7%) | 44 (1.5%) |
| Total | 1,159 (100.0%) | 3,005 (100.0%) |
Monthly Housing Cost Tiers in Naranja
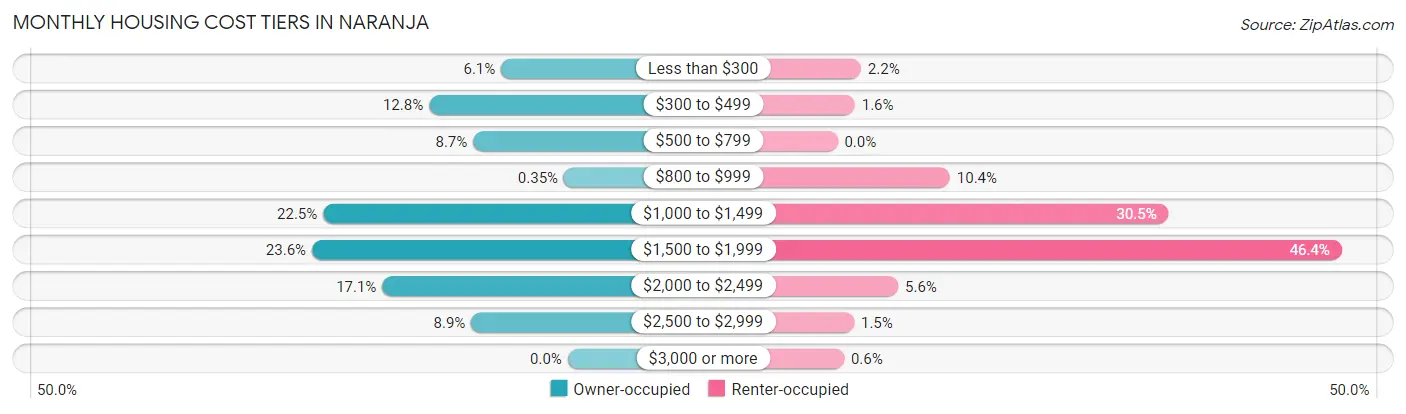
| Monthly Cost | Owner-occupied | Renter-occupied |
| Less than $300 | 71 (6.1%) | 65 (2.2%) |
| $300 to $499 | 148 (12.8%) | 48 (1.6%) |
| $500 to $799 | 101 (8.7%) | 0 (0.0%) |
| $800 to $999 | 4 (0.4%) | 311 (10.3%) |
| $1,000 to $1,499 | 261 (22.5%) | 916 (30.5%) |
| $1,500 to $1,999 | 273 (23.5%) | 1,395 (46.4%) |
| $2,000 to $2,499 | 198 (17.1%) | 168 (5.6%) |
| $2,500 to $2,999 | 103 (8.9%) | 46 (1.5%) |
| $3,000 or more | 0 (0.0%) | 18 (0.6%) |
| Total | 1,159 (100.0%) | 3,005 (100.0%) |
Physical Housing Characteristics in Naranja
Housing Structures in Naranja
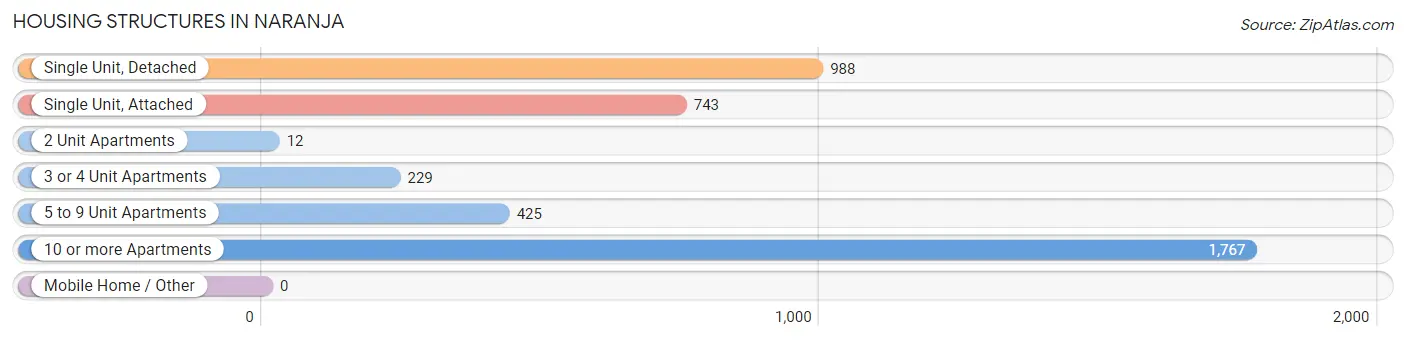
| Structure Type | # Housing Units | % Housing Units |
| Single Unit, Detached | 988 | 23.7% |
| Single Unit, Attached | 743 | 17.8% |
| 2 Unit Apartments | 12 | 0.3% |
| 3 or 4 Unit Apartments | 229 | 5.5% |
| 5 to 9 Unit Apartments | 425 | 10.2% |
| 10 or more Apartments | 1,767 | 42.4% |
| Mobile Home / Other | 0 | 0.0% |
| Total | 4,164 | 100.0% |
Housing Structures by Occupancy in Naranja
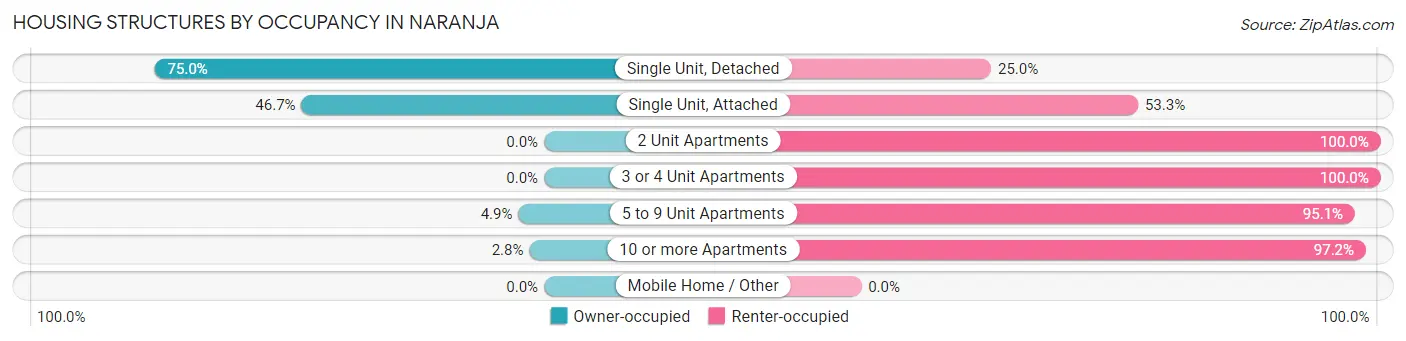
| Structure Type | Owner-occupied | Renter-occupied |
| Single Unit, Detached | 741 (75.0%) | 247 (25.0%) |
| Single Unit, Attached | 347 (46.7%) | 396 (53.3%) |
| 2 Unit Apartments | 0 (0.0%) | 12 (100.0%) |
| 3 or 4 Unit Apartments | 0 (0.0%) | 229 (100.0%) |
| 5 to 9 Unit Apartments | 21 (4.9%) | 404 (95.1%) |
| 10 or more Apartments | 50 (2.8%) | 1,717 (97.2%) |
| Mobile Home / Other | 0 (0.0%) | 0 (0.0%) |
| Total | 1,159 (27.8%) | 3,005 (72.2%) |
Housing Structures by Number of Rooms in Naranja
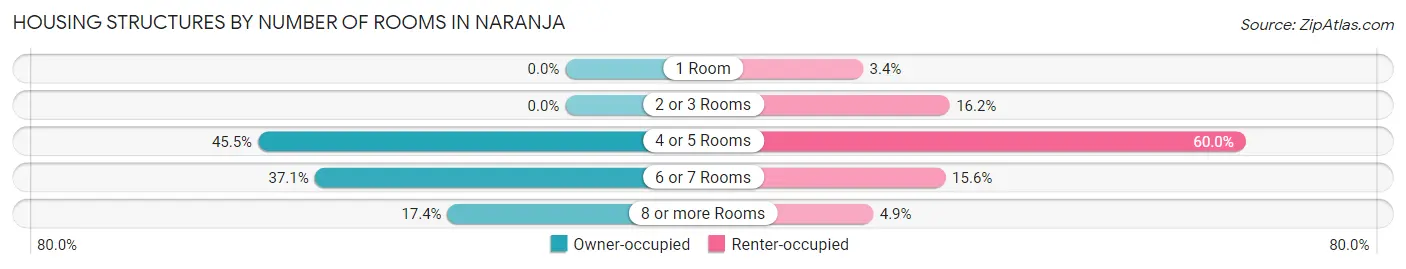
| Number of Rooms | Owner-occupied | Renter-occupied |
| 1 Room | 0 (0.0%) | 101 (3.4%) |
| 2 or 3 Rooms | 0 (0.0%) | 486 (16.2%) |
| 4 or 5 Rooms | 527 (45.5%) | 1,804 (60.0%) |
| 6 or 7 Rooms | 430 (37.1%) | 468 (15.6%) |
| 8 or more Rooms | 202 (17.4%) | 146 (4.9%) |
| Total | 1,159 (100.0%) | 3,005 (100.0%) |
Housing Structure by Heating Type in Naranja
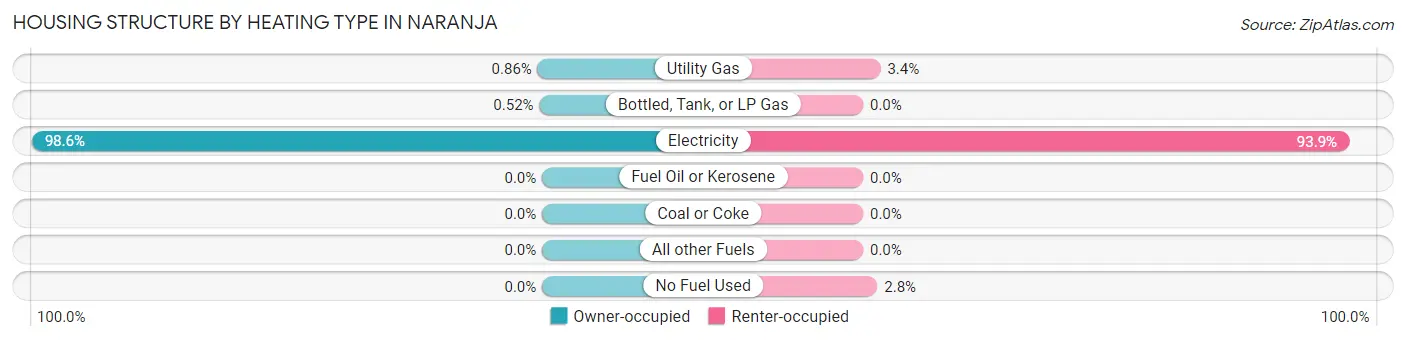
| Heating Type | Owner-occupied | Renter-occupied |
| Utility Gas | 10 (0.9%) | 101 (3.4%) |
| Bottled, Tank, or LP Gas | 6 (0.5%) | 0 (0.0%) |
| Electricity | 1,143 (98.6%) | 2,821 (93.9%) |
| Fuel Oil or Kerosene | 0 (0.0%) | 0 (0.0%) |
| Coal or Coke | 0 (0.0%) | 0 (0.0%) |
| All other Fuels | 0 (0.0%) | 0 (0.0%) |
| No Fuel Used | 0 (0.0%) | 83 (2.8%) |
| Total | 1,159 (100.0%) | 3,005 (100.0%) |
Household Vehicle Usage in Naranja
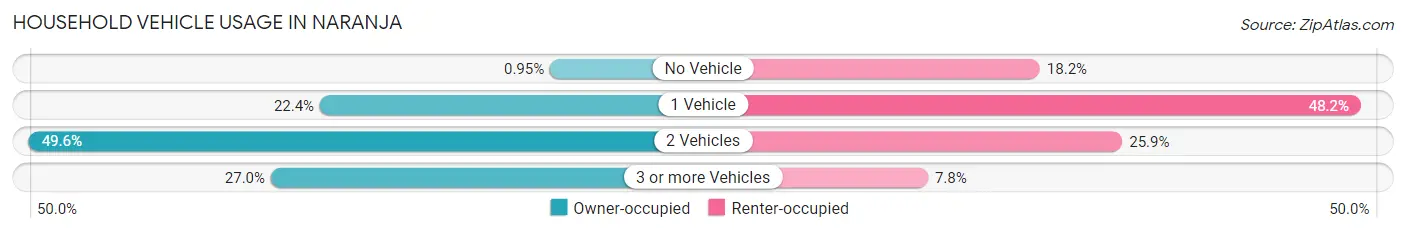
| Vehicles per Household | Owner-occupied | Renter-occupied |
| No Vehicle | 11 (0.9%) | 547 (18.2%) |
| 1 Vehicle | 260 (22.4%) | 1,447 (48.1%) |
| 2 Vehicles | 575 (49.6%) | 778 (25.9%) |
| 3 or more Vehicles | 313 (27.0%) | 233 (7.7%) |
| Total | 1,159 (100.0%) | 3,005 (100.0%) |
Real Estate & Mortgages in Naranja
Real Estate and Mortgage Overview in Naranja
| Characteristic | Without Mortgage | With Mortgage |
| Housing Units | 310 | 849 |
| Median Property Value | $191,700 | $291,600 |
| Median Household Income | $65,217 | $75 |
| Monthly Housing Costs | $454 | $0 |
| Real Estate Taxes | $1,246 | $27 |
Property Value by Mortgage Status in Naranja
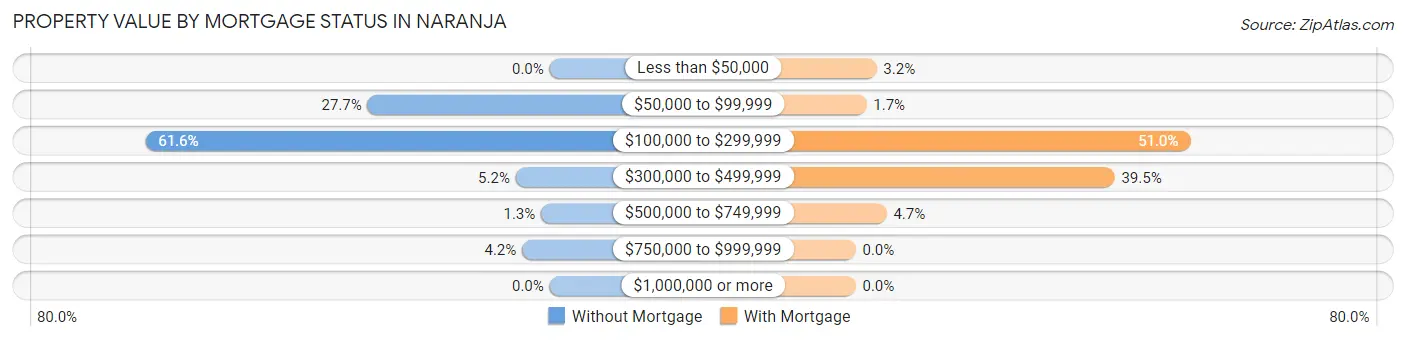
| Property Value | Without Mortgage | With Mortgage |
| Less than $50,000 | 0 (0.0%) | 27 (3.2%) |
| $50,000 to $99,999 | 86 (27.7%) | 14 (1.7%) |
| $100,000 to $299,999 | 191 (61.6%) | 433 (51.0%) |
| $300,000 to $499,999 | 16 (5.2%) | 335 (39.5%) |
| $500,000 to $749,999 | 4 (1.3%) | 40 (4.7%) |
| $750,000 to $999,999 | 13 (4.2%) | 0 (0.0%) |
| $1,000,000 or more | 0 (0.0%) | 0 (0.0%) |
| Total | 310 (100.0%) | 849 (100.0%) |
Household Income by Mortgage Status in Naranja
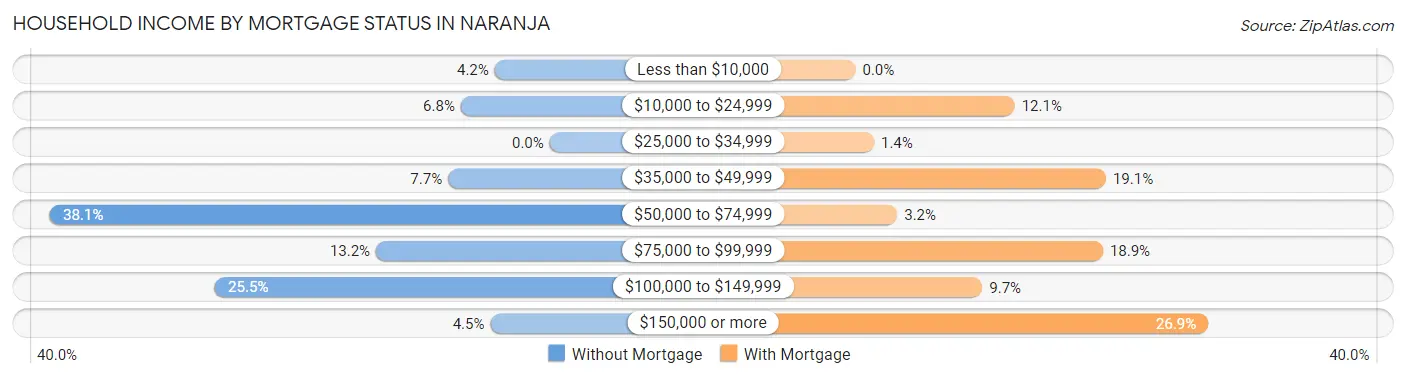
| Household Income | Without Mortgage | With Mortgage |
| Less than $10,000 | 13 (4.2%) | 0 (0.0%) |
| $10,000 to $24,999 | 21 (6.8%) | 103 (12.1%) |
| $25,000 to $34,999 | 0 (0.0%) | 12 (1.4%) |
| $35,000 to $49,999 | 24 (7.7%) | 162 (19.1%) |
| $50,000 to $74,999 | 118 (38.1%) | 27 (3.2%) |
| $75,000 to $99,999 | 41 (13.2%) | 160 (18.9%) |
| $100,000 to $149,999 | 79 (25.5%) | 82 (9.7%) |
| $150,000 or more | 14 (4.5%) | 228 (26.9%) |
| Total | 310 (100.0%) | 849 (100.0%) |
Property Value to Household Income Ratio in Naranja
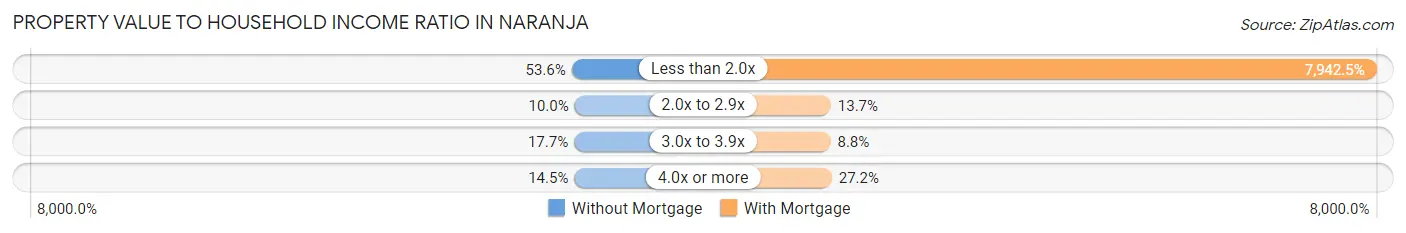
| Value-to-Income Ratio | Without Mortgage | With Mortgage |
| Less than 2.0x | 166 (53.5%) | 67,432 (7,942.5%) |
| 2.0x to 2.9x | 31 (10.0%) | 116 (13.7%) |
| 3.0x to 3.9x | 55 (17.7%) | 75 (8.8%) |
| 4.0x or more | 45 (14.5%) | 231 (27.2%) |
| Total | 310 (100.0%) | 849 (100.0%) |
Real Estate Taxes by Mortgage Status in Naranja
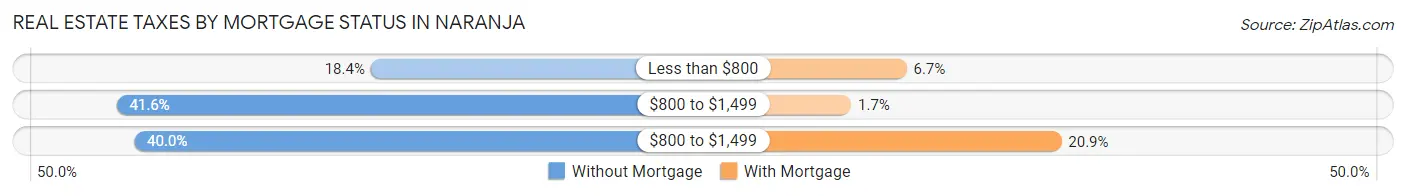
| Property Taxes | Without Mortgage | With Mortgage |
| Less than $800 | 57 (18.4%) | 57 (6.7%) |
| $800 to $1,499 | 129 (41.6%) | 14 (1.7%) |
| $800 to $1,499 | 124 (40.0%) | 177 (20.8%) |
| Total | 310 (100.0%) | 849 (100.0%) |
Health & Disability in Naranja
Health Insurance Coverage by Age in Naranja
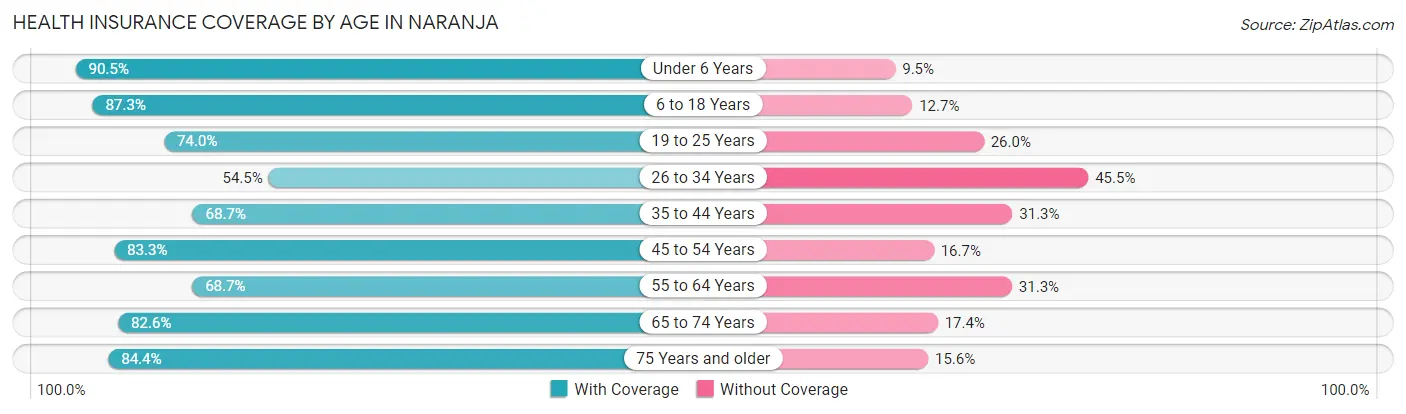
| Age Bracket | With Coverage | Without Coverage |
| Under 6 Years | 1,636 (90.5%) | 172 (9.5%) |
| 6 to 18 Years | 2,510 (87.3%) | 364 (12.7%) |
| 19 to 25 Years | 740 (74.0%) | 260 (26.0%) |
| 26 to 34 Years | 1,528 (54.5%) | 1,275 (45.5%) |
| 35 to 44 Years | 909 (68.7%) | 415 (31.3%) |
| 45 to 54 Years | 1,174 (83.3%) | 235 (16.7%) |
| 55 to 64 Years | 739 (68.7%) | 336 (31.3%) |
| 65 to 74 Years | 550 (82.6%) | 116 (17.4%) |
| 75 Years and older | 243 (84.4%) | 45 (15.6%) |
| Total | 10,029 (75.7%) | 3,218 (24.3%) |
Health Insurance Coverage by Citizenship Status in Naranja
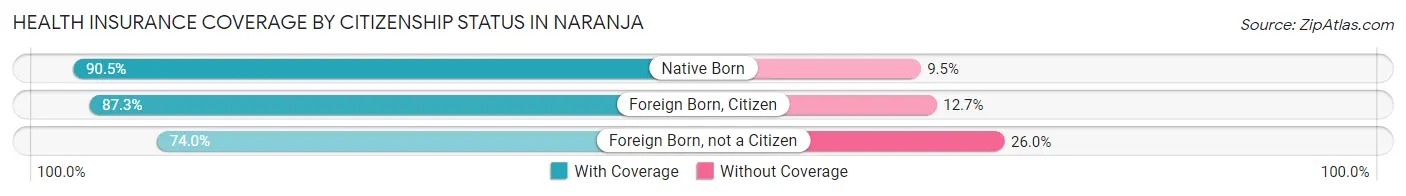
| Citizenship Status | With Coverage | Without Coverage |
| Native Born | 1,636 (90.5%) | 172 (9.5%) |
| Foreign Born, Citizen | 2,510 (87.3%) | 364 (12.7%) |
| Foreign Born, not a Citizen | 740 (74.0%) | 260 (26.0%) |
Health Insurance Coverage by Household Income in Naranja
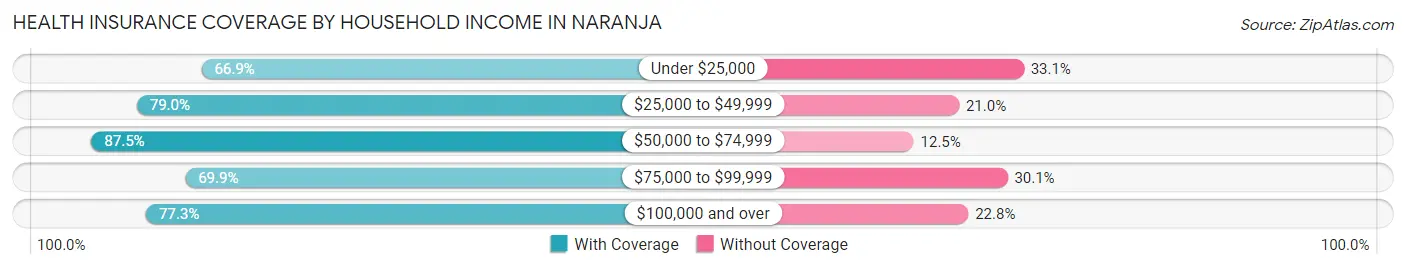
| Household Income | With Coverage | Without Coverage |
| Under $25,000 | 2,167 (66.9%) | 1,074 (33.1%) |
| $25,000 to $49,999 | 2,161 (79.0%) | 575 (21.0%) |
| $50,000 to $74,999 | 2,200 (87.5%) | 315 (12.5%) |
| $75,000 to $99,999 | 1,623 (69.9%) | 699 (30.1%) |
| $100,000 and over | 1,827 (77.2%) | 538 (22.8%) |
Public vs Private Health Insurance Coverage by Age in Naranja
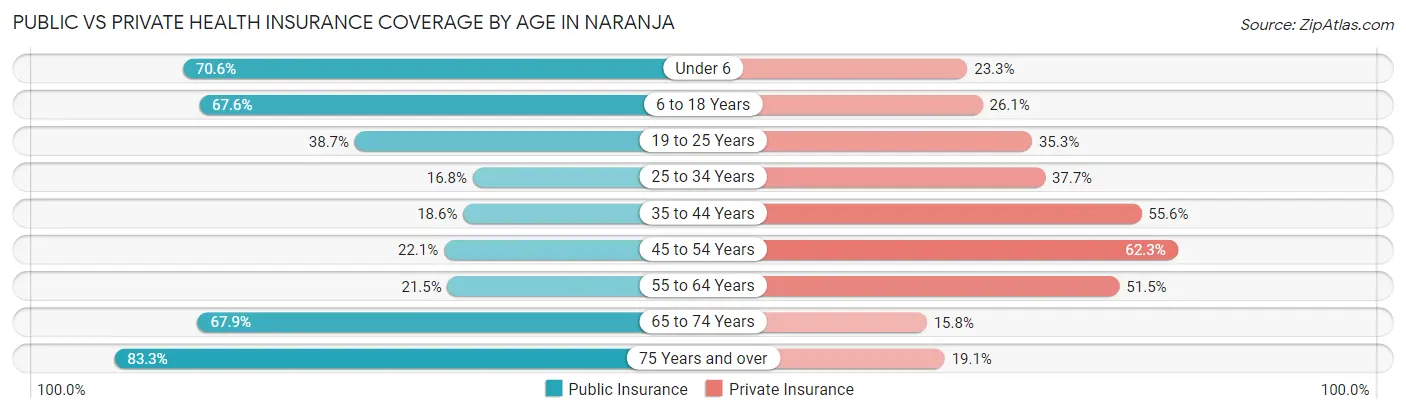
| Age Bracket | Public Insurance | Private Insurance |
| Under 6 | 1,277 (70.6%) | 421 (23.3%) |
| 6 to 18 Years | 1,943 (67.6%) | 751 (26.1%) |
| 19 to 25 Years | 387 (38.7%) | 353 (35.3%) |
| 25 to 34 Years | 471 (16.8%) | 1,057 (37.7%) |
| 35 to 44 Years | 246 (18.6%) | 736 (55.6%) |
| 45 to 54 Years | 312 (22.1%) | 878 (62.3%) |
| 55 to 64 Years | 231 (21.5%) | 554 (51.5%) |
| 65 to 74 Years | 452 (67.9%) | 105 (15.8%) |
| 75 Years and over | 240 (83.3%) | 55 (19.1%) |
| Total | 5,559 (42.0%) | 4,910 (37.1%) |
Disability Status by Sex by Age in Naranja
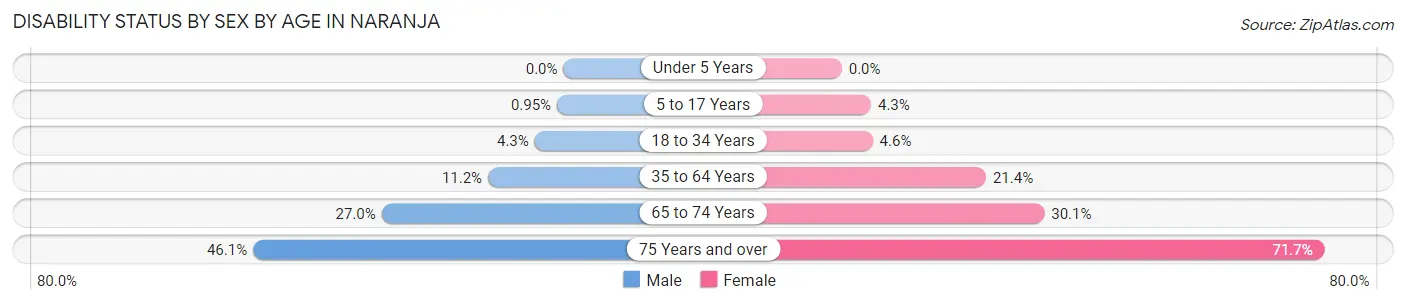
| Age Bracket | Male | Female |
| Under 5 Years | 0 (0.0%) | 0 (0.0%) |
| 5 to 17 Years | 13 (0.9%) | 73 (4.3%) |
| 18 to 34 Years | 80 (4.3%) | 96 (4.6%) |
| 35 to 64 Years | 212 (11.2%) | 410 (21.4%) |
| 65 to 74 Years | 64 (27.0%) | 129 (30.1%) |
| 75 Years and over | 53 (46.1%) | 124 (71.7%) |
Disability Class by Sex by Age in Naranja
Disability Class: Hearing Difficulty
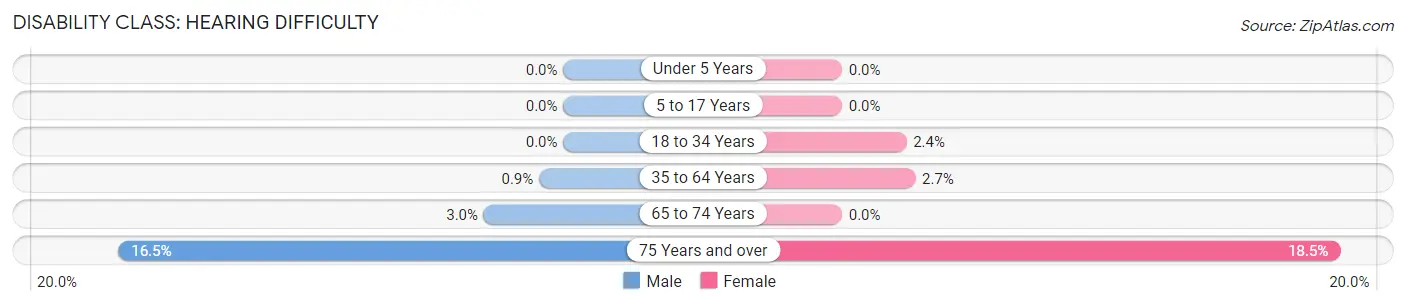
| Age Bracket | Male | Female |
| Under 5 Years | 0 (0.0%) | 0 (0.0%) |
| 5 to 17 Years | 0 (0.0%) | 0 (0.0%) |
| 18 to 34 Years | 0 (0.0%) | 50 (2.4%) |
| 35 to 64 Years | 17 (0.9%) | 52 (2.7%) |
| 65 to 74 Years | 7 (2.9%) | 0 (0.0%) |
| 75 Years and over | 19 (16.5%) | 32 (18.5%) |
Disability Class: Vision Difficulty
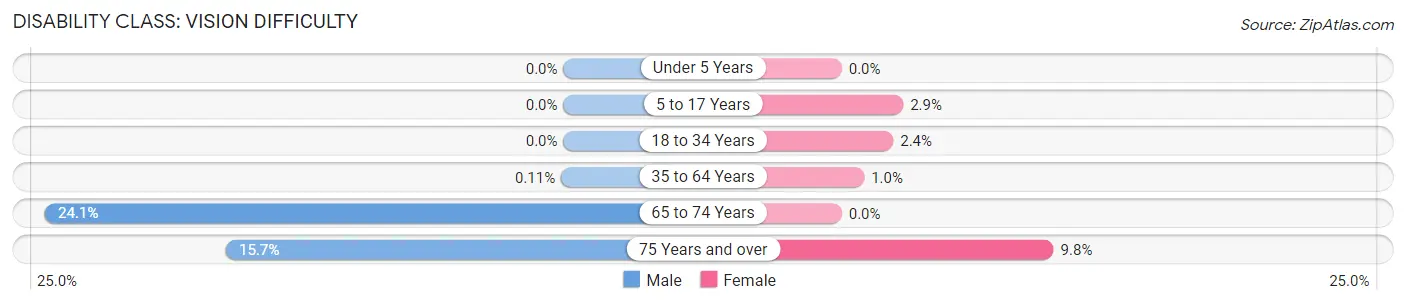
| Age Bracket | Male | Female |
| Under 5 Years | 0 (0.0%) | 0 (0.0%) |
| 5 to 17 Years | 0 (0.0%) | 48 (2.9%) |
| 18 to 34 Years | 0 (0.0%) | 50 (2.4%) |
| 35 to 64 Years | 2 (0.1%) | 20 (1.0%) |
| 65 to 74 Years | 57 (24.0%) | 0 (0.0%) |
| 75 Years and over | 18 (15.7%) | 17 (9.8%) |
Disability Class: Cognitive Difficulty
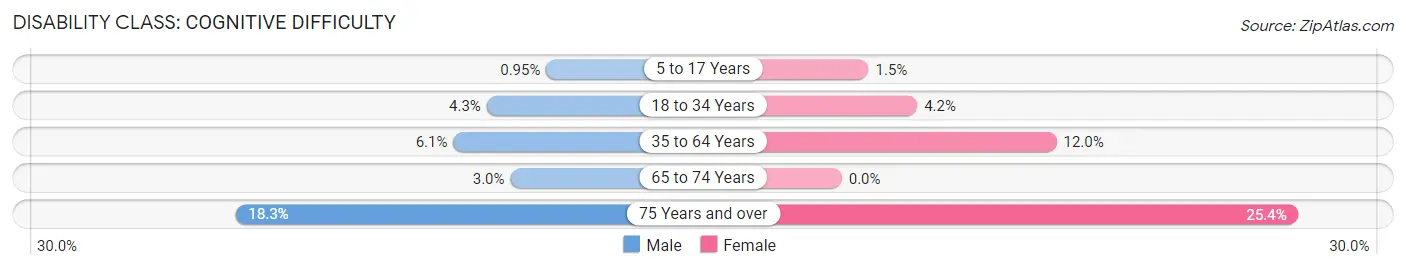
| Age Bracket | Male | Female |
| 5 to 17 Years | 13 (0.9%) | 25 (1.5%) |
| 18 to 34 Years | 80 (4.3%) | 88 (4.2%) |
| 35 to 64 Years | 116 (6.1%) | 229 (12.0%) |
| 65 to 74 Years | 7 (2.9%) | 0 (0.0%) |
| 75 Years and over | 21 (18.3%) | 44 (25.4%) |
Disability Class: Ambulatory Difficulty
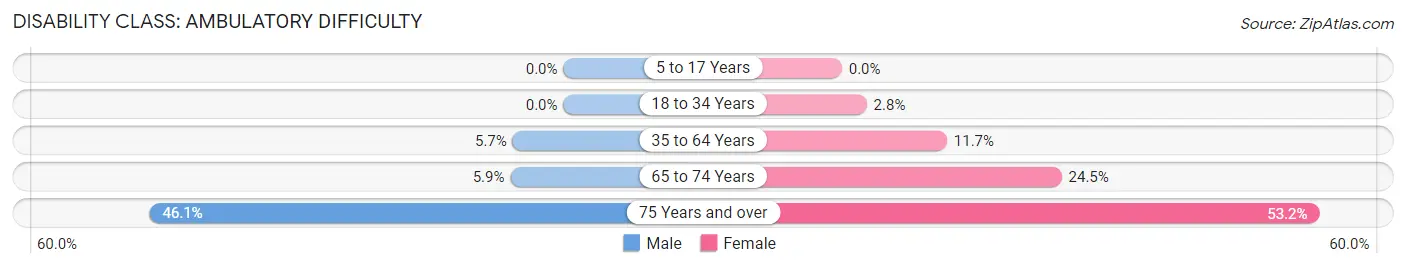
| Age Bracket | Male | Female |
| 5 to 17 Years | 0 (0.0%) | 0 (0.0%) |
| 18 to 34 Years | 0 (0.0%) | 58 (2.8%) |
| 35 to 64 Years | 107 (5.7%) | 224 (11.7%) |
| 65 to 74 Years | 14 (5.9%) | 105 (24.5%) |
| 75 Years and over | 53 (46.1%) | 92 (53.2%) |
Disability Class: Self-Care Difficulty
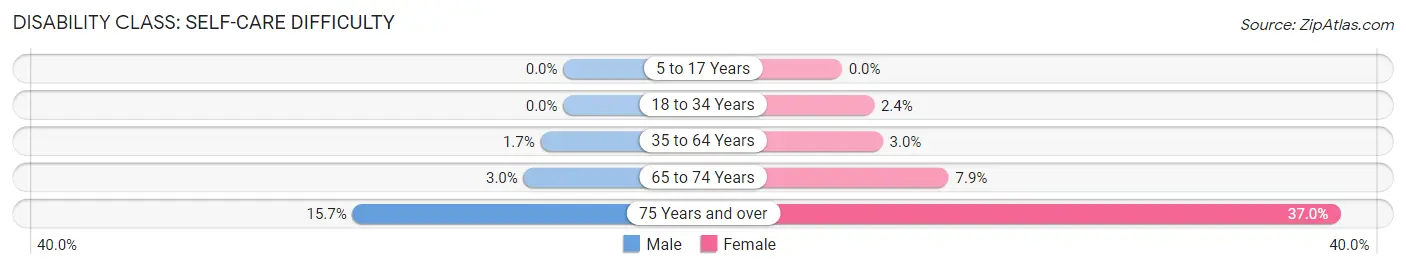
| Age Bracket | Male | Female |
| 5 to 17 Years | 0 (0.0%) | 0 (0.0%) |
| 18 to 34 Years | 0 (0.0%) | 50 (2.4%) |
| 35 to 64 Years | 32 (1.7%) | 58 (3.0%) |
| 65 to 74 Years | 7 (2.9%) | 34 (7.9%) |
| 75 Years and over | 18 (15.7%) | 64 (37.0%) |
Technology Access in Naranja
Computing Device Access in Naranja
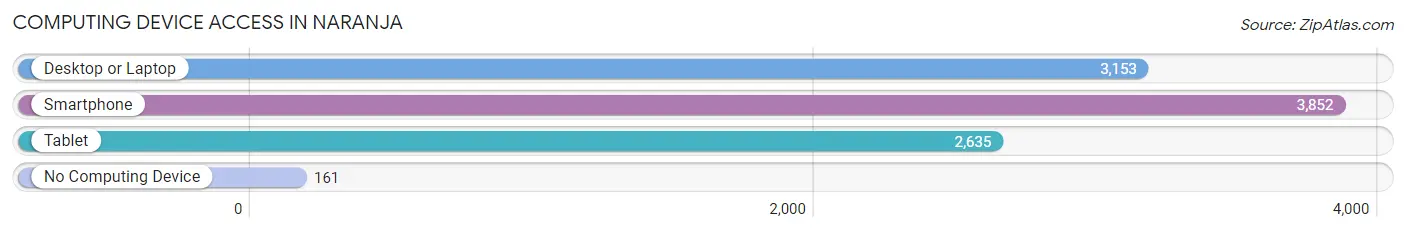
| Device Type | # Households | % Households |
| Desktop or Laptop | 3,153 | 75.7% |
| Smartphone | 3,852 | 92.5% |
| Tablet | 2,635 | 63.3% |
| No Computing Device | 161 | 3.9% |
| Total | 4,164 | 100.0% |
Internet Access in Naranja
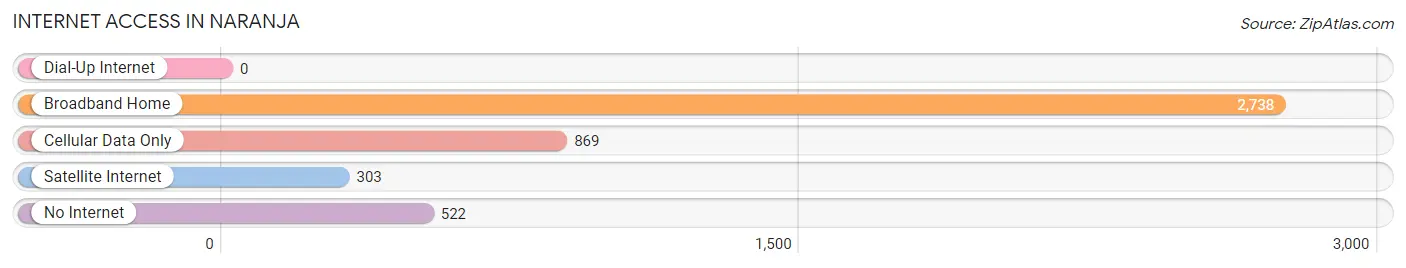
| Internet Type | # Households | % Households |
| Dial-Up Internet | 0 | 0.0% |
| Broadband Home | 2,738 | 65.7% |
| Cellular Data Only | 869 | 20.9% |
| Satellite Internet | 303 | 7.3% |
| No Internet | 522 | 12.5% |
| Total | 4,164 | 100.0% |
Naranja Summary
Naranja is a census-designated place (CDP) in Miami-Dade County, Florida, United States. The population was 8,845 at the 2010 census. Naranja is located at 25°33′N 80°25′W (25.55, -80.41).
Geography
Naranja is located in the southern part of Miami-Dade County, approximately 20 miles south of downtown Miami. The CDP is bordered to the north by the city of Homestead, to the east by the city of Florida City, to the south by the Atlantic Ocean, and to the west by the Everglades National Park. Naranja is located on the eastern edge of the Everglades, and is part of the Miami metropolitan area.
The Naranja CDP has a total area of 2.2 square miles, of which 2.1 square miles is land and 0.1 square miles (4.55%) is water.
History
Naranja was originally inhabited by the Tequesta Indians, who were the first Native American tribe to inhabit the area. The Tequesta Indians were a peaceful tribe that lived off the land, fishing and hunting for food.
In the late 19th century, Naranja was settled by homesteaders who were attracted to the area by the fertile soil and abundant wildlife. The homesteaders cleared the land and planted crops, such as tomatoes, beans, and squash.
In the early 20th century, Naranja was a small farming community. The population was mostly made up of homesteaders and their families. The town was served by a post office, a general store, and a few other small businesses.
In the 1950s, Naranja began to experience rapid growth as the population of Miami-Dade County increased. The population of Naranja increased from 1,000 in 1950 to 8,845 in 2010.
Economy
Naranja is primarily a residential community, with most of the population employed in the service sector. The median household income in Naranja is $30,845, which is lower than the median income for Miami-Dade County ($45,945).
The largest employers in Naranja are the Miami-Dade County Public Schools, the Miami-Dade County government, and the Homestead Air Reserve Base.
Demographics
As of the 2010 census, there were 8,845 people, 2,845 households, and 2,072 families residing in the CDP. The population density was 4,092.3 people per square mile (1,579.2/km2). There were 3,093 housing units at an average density of 1,438.3 per square mile (556.3/km2). The racial makeup of the CDP was 64.2% White (non-Hispanic), 22.3% African American, 0.4% Native American, 0.7% Asian, 0.1% Pacific Islander, 10.2% from other races, and 2.1% from two or more races. Hispanic or Latino of any race were 57.2% of the population.
There were 2,845 households, out of which 37.2% had children under the age of 18 living with them, 43.2% were married couples living together, 19.2% had a female householder with no husband present, and 30.2% were non-families. 24.2% of all households were made up of individuals, and 8.2% had someone living alone who was 65 years of age or older. The average household size was 3.09 and the average family size was 3.63.
In the CDP, the population was spread out, with 28.7% under the age of 18, 10.2% from 18 to 24, 30.2% from 25 to 44, 20.2% from 45 to 64, and 10.7% who were 65 years of age or older. The median age was 33 years. For every 100 females, there were 97.2 males. For every 100 females age 18 and over, there were 94.2 males.
The median income for a household in the CDP was $30,845, and the median income for a family was $33,906. Males had a median income of $25,938 versus $20,938 for females. The per capita income for the CDP was $12,845. About 17.2% of families and 20.2% of the population were below the poverty line, including 28.2% of those under age 18 and 11.2% of those age 65 or over.
Common Questions
What is Per Capita Income in Naranja?
Per Capita income in Naranja is $19,537.
What is the Median Family Income in Naranja?
Median Family Income in Naranja is $32,289.
What is the Median Household income in Naranja?
Median Household Income in Naranja is $46,045.
What is Income or Wage Gap in Naranja?
Income or Wage Gap in Naranja is 1.7%.
Women in Naranja earn 98.3 cents for every dollar earned by a man.
What is Family Income Deficit in Naranja?
Family Income Deficit in Naranja is $10,543.
Families that are below poverty line in Naranja earn $10,543 less on average than the poverty threshold level.
What is Inequality or Gini Index in Naranja?
Inequality or Gini Index in Naranja is 0.45.
What is the Total Population of Naranja?
Total Population of Naranja is 13,261.
What is the Total Male Population of Naranja?
Total Male Population of Naranja is 6,081.
What is the Total Female Population of Naranja?
Total Female Population of Naranja is 7,180.
What is the Ratio of Males per 100 Females in Naranja?
There are 84.69 Males per 100 Females in Naranja.
What is the Ratio of Females per 100 Males in Naranja?
There are 118.07 Females per 100 Males in Naranja.
What is the Median Population Age in Naranja?
Median Population Age in Naranja is 30.4 Years.
What is the Average Family Size in Naranja
Average Family Size in Naranja is 3.4 People.
What is the Average Household Size in Naranja
Average Household Size in Naranja is 3.2 People.
How Large is the Labor Force in Naranja?
There are 6,019 People in the Labor Forcein in Naranja.
What is the Percentage of People in the Labor Force in Naranja?
65.6% of People are in the Labor Force in Naranja.
What is the Unemployment Rate in Naranja?
Unemployment Rate in Naranja is 10.2%.