Watergate, FL Map & Demographics
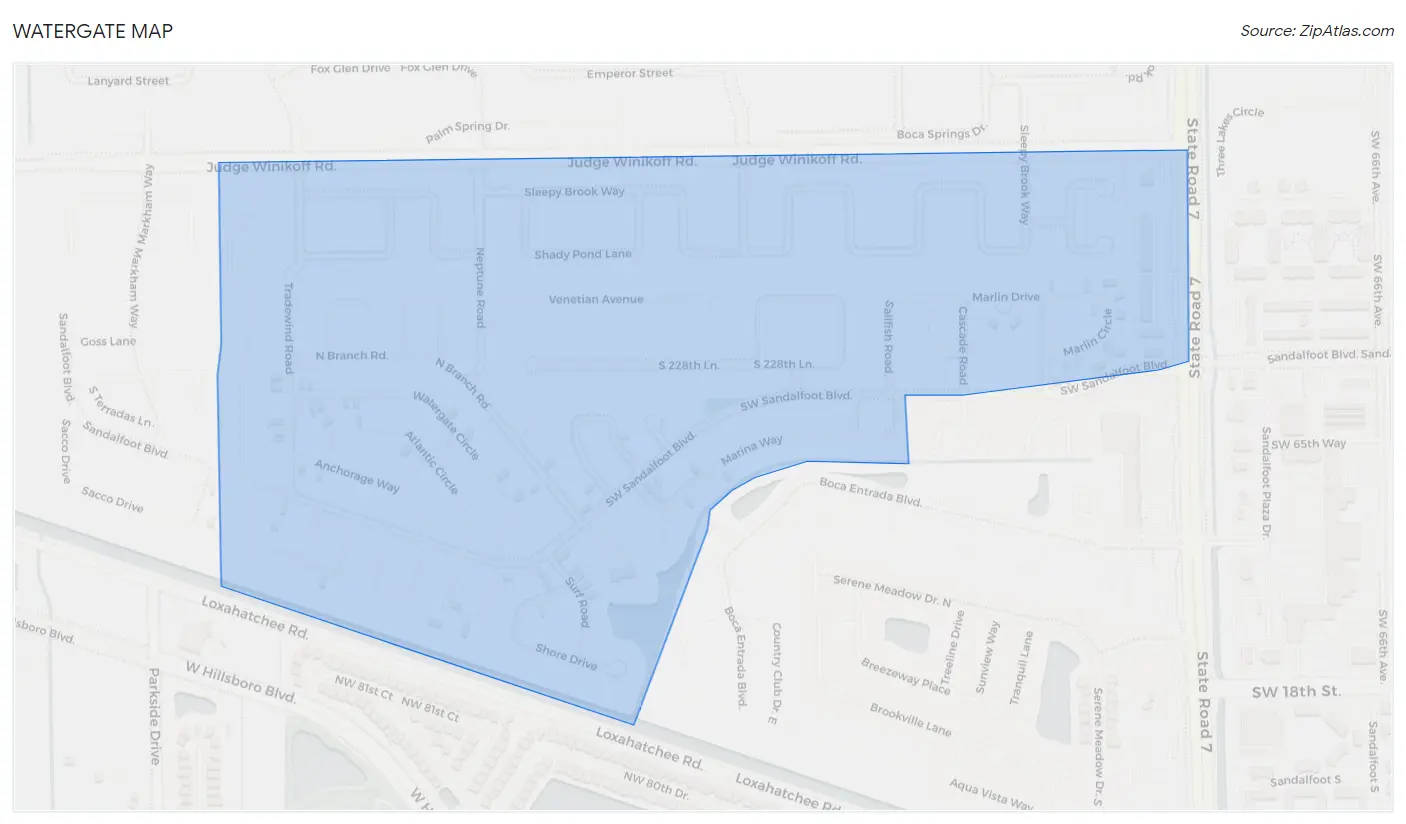
Watergate Map
Watergate Overview
$25,330
PER CAPITA INCOME
$68,587
AVG FAMILY INCOME
$61,750
AVG HOUSEHOLD INCOME
22.7%
WAGE / INCOME GAP [ % ]
77.3¢/ $1
WAGE / INCOME GAP [ $ ]
0.35
INEQUALITY / GINI INDEX
3,589
TOTAL POPULATION
1,812
MALE POPULATION
1,777
FEMALE POPULATION
101.97
MALES / 100 FEMALES
98.07
FEMALES / 100 MALES
48.6
MEDIAN AGE
3.1
AVG FAMILY SIZE
2.8
AVG HOUSEHOLD SIZE
1,929
LABOR FORCE [ PEOPLE ]
59.9%
PERCENT IN LABOR FORCE
10.1%
UNEMPLOYMENT RATE
Income in Watergate
Income Overview in Watergate
Per Capita Income in Watergate is $25,330, while median incomes of families and households are $68,587 and $61,750 respectively.
| Characteristic | Number | Measure |
| Per Capita Income | 3,589 | $25,330 |
| Median Family Income | 808 | $68,587 |
| Mean Family Income | 808 | $69,139 |
| Median Household Income | 1,285 | $61,750 |
| Mean Household Income | 1,285 | $67,381 |
| Income Deficit | 808 | $0 |
| Wage / Income Gap (%) | 3,589 | 22.74% |
| Wage / Income Gap ($) | 3,589 | 77.26¢ per $1 |
| Gini / Inequality Index | 3,589 | 0.35 |
Earnings by Sex in Watergate
Average Earnings in Watergate are $25,634, $28,141 for men and $21,743 for women, a difference of 22.7%.
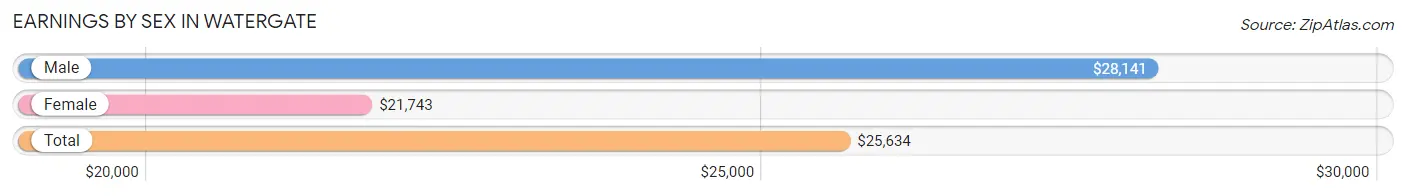
| Sex | Number | Average Earnings |
| Male | 1,155 (58.0%) | $28,141 |
| Female | 835 (42.0%) | $21,743 |
| Total | 1,990 (100.0%) | $25,634 |
Earnings by Sex by Income Bracket in Watergate
The most common earnings brackets in Watergate are $22,500 to $24,999 for men (226 | 19.6%) and $45,000 to $49,999 for women (190 | 22.8%).
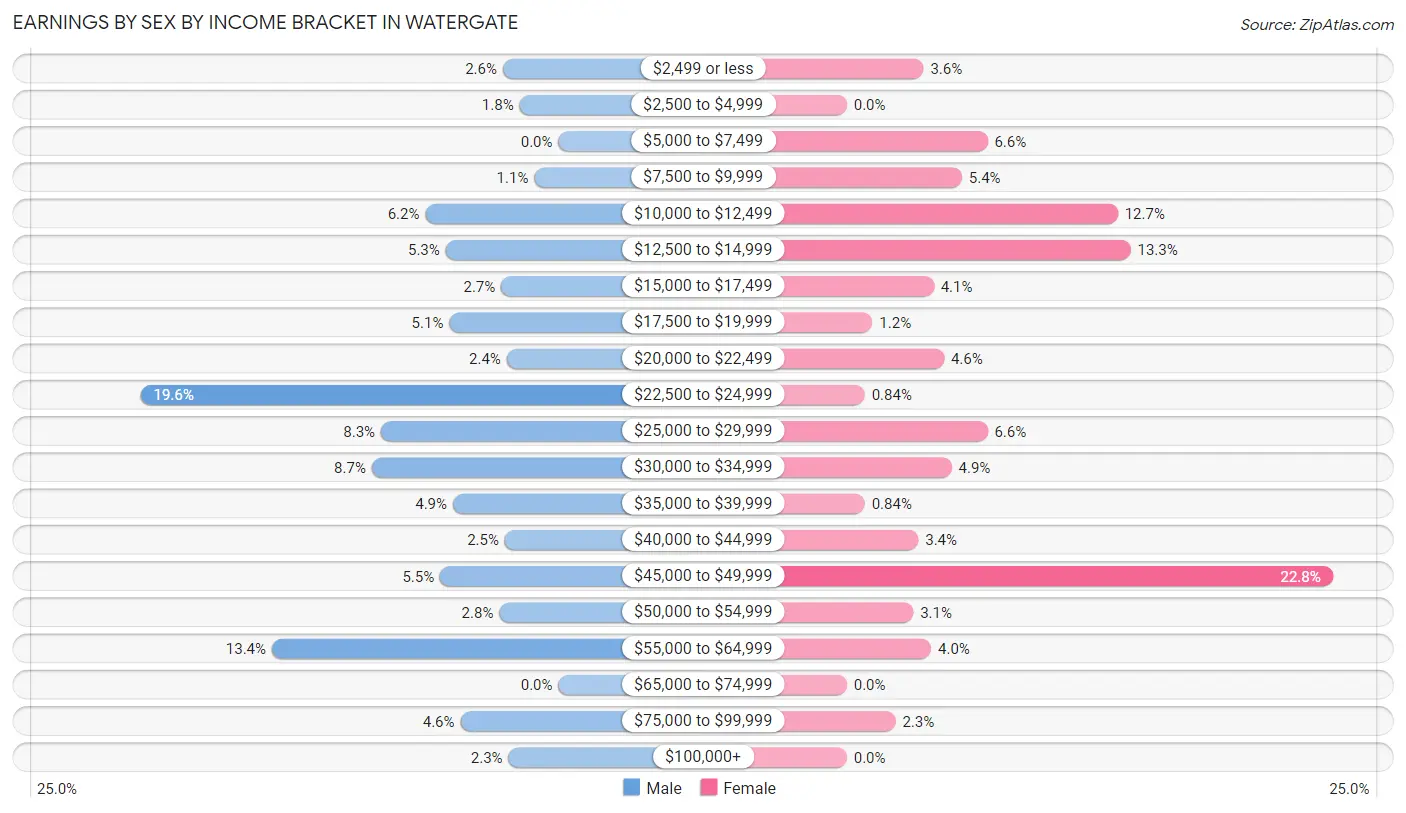
| Income | Male | Female |
| $2,499 or less | 30 (2.6%) | 30 (3.6%) |
| $2,500 to $4,999 | 21 (1.8%) | 0 (0.0%) |
| $5,000 to $7,499 | 0 (0.0%) | 55 (6.6%) |
| $7,500 to $9,999 | 13 (1.1%) | 45 (5.4%) |
| $10,000 to $12,499 | 72 (6.2%) | 106 (12.7%) |
| $12,500 to $14,999 | 61 (5.3%) | 111 (13.3%) |
| $15,000 to $17,499 | 31 (2.7%) | 34 (4.1%) |
| $17,500 to $19,999 | 59 (5.1%) | 10 (1.2%) |
| $20,000 to $22,499 | 28 (2.4%) | 38 (4.5%) |
| $22,500 to $24,999 | 226 (19.6%) | 7 (0.8%) |
| $25,000 to $29,999 | 96 (8.3%) | 55 (6.6%) |
| $30,000 to $34,999 | 101 (8.7%) | 41 (4.9%) |
| $35,000 to $39,999 | 57 (4.9%) | 7 (0.8%) |
| $40,000 to $44,999 | 29 (2.5%) | 28 (3.4%) |
| $45,000 to $49,999 | 64 (5.5%) | 190 (22.8%) |
| $50,000 to $54,999 | 32 (2.8%) | 26 (3.1%) |
| $55,000 to $64,999 | 155 (13.4%) | 33 (4.0%) |
| $65,000 to $74,999 | 0 (0.0%) | 0 (0.0%) |
| $75,000 to $99,999 | 53 (4.6%) | 19 (2.3%) |
| $100,000+ | 27 (2.3%) | 0 (0.0%) |
| Total | 1,155 (100.0%) | 835 (100.0%) |
Earnings by Sex by Educational Attainment in Watergate
Average earnings in Watergate are $29,709 for men and $27,318 for women, a difference of 8.1%. Men with an educational attainment of college or associate's degree enjoy the highest average annual earnings of $35,000, while those with less than high school education earn the least with $24,620. Women with an educational attainment of high school diploma earn the most with the average annual earnings of $45,625, while those with less than high school education have the smallest earnings of $14,041.
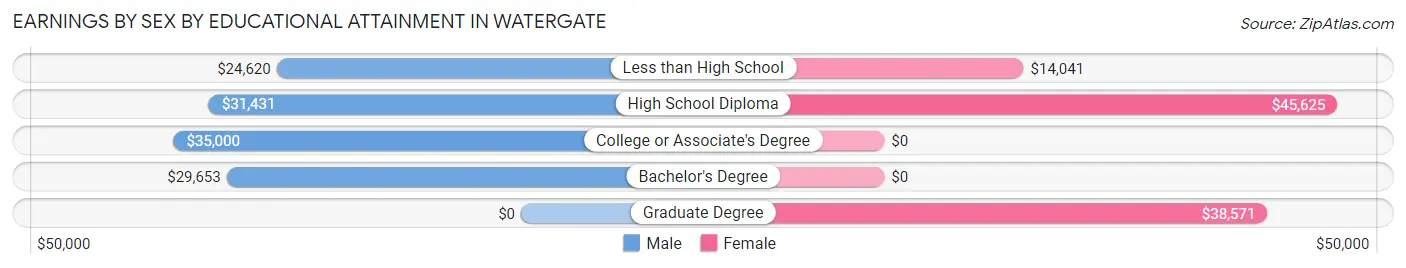
| Educational Attainment | Male Income | Female Income |
| Less than High School | $24,620 | $14,041 |
| High School Diploma | $31,431 | $45,625 |
| College or Associate's Degree | $35,000 | $0 |
| Bachelor's Degree | $29,653 | $0 |
| Graduate Degree | - | - |
| Total | $29,709 | $27,318 |
Family Income in Watergate
Family Income Brackets in Watergate
According to the Watergate family income data, there are 310 families falling into the $50,000 to $74,999 income range, which is the most common income bracket and makes up 38.4% of all families.
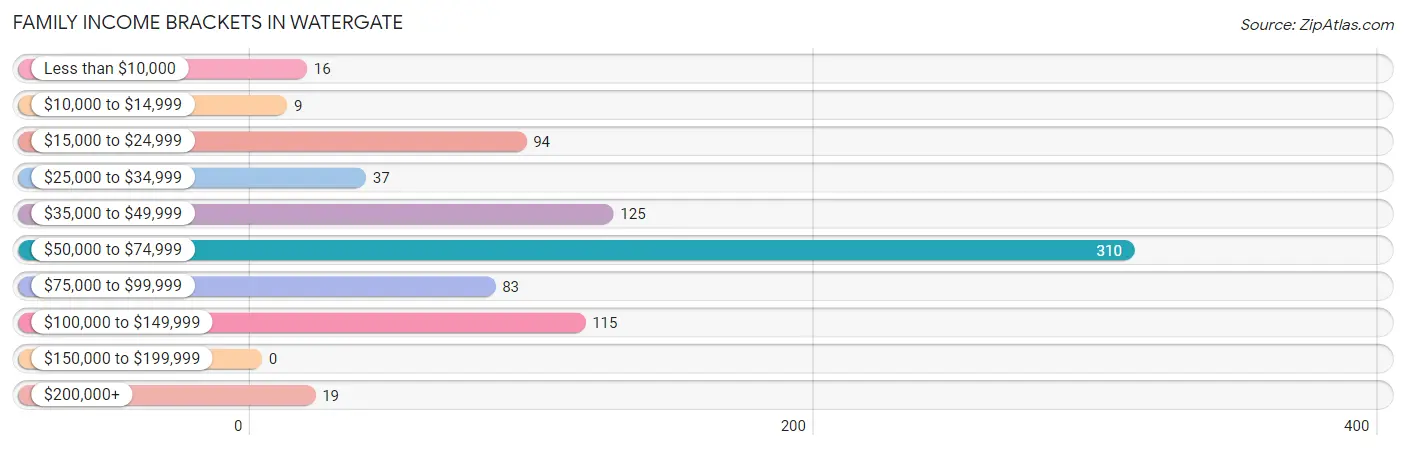
| Income Bracket | # Families | % Families |
| Less than $10,000 | 16 | 2.0% |
| $10,000 to $14,999 | 9 | 1.1% |
| $15,000 to $24,999 | 94 | 11.6% |
| $25,000 to $34,999 | 37 | 4.6% |
| $35,000 to $49,999 | 125 | 15.5% |
| $50,000 to $74,999 | 310 | 38.4% |
| $75,000 to $99,999 | 83 | 10.3% |
| $100,000 to $149,999 | 115 | 14.2% |
| $150,000 to $199,999 | 0 | 0.0% |
| $200,000+ | 19 | 2.4% |
Family Income by Famaliy Size in Watergate
3-person families (150 | 18.6%) account for the highest median family income in Watergate with $98,523 per family, while 2-person families (431 | 53.3%) have the highest median income of $35,044 per family member.
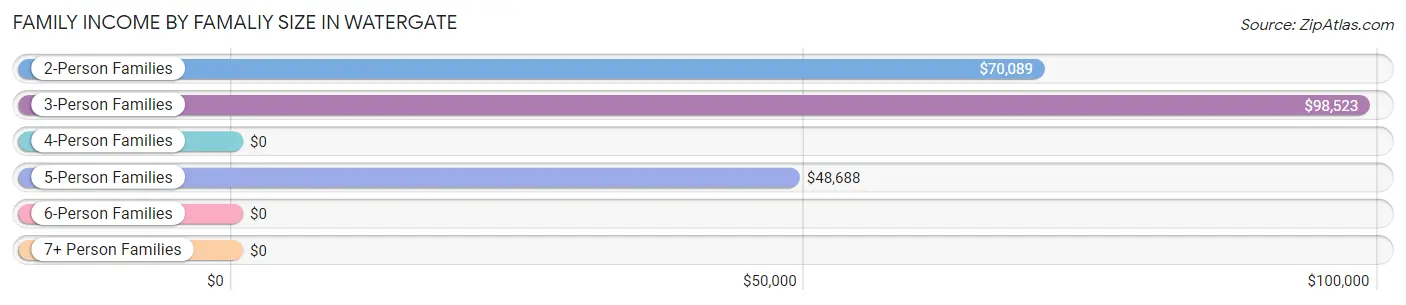
| Income Bracket | # Families | Median Income |
| 2-Person Families | 431 (53.3%) | $70,089 |
| 3-Person Families | 150 (18.6%) | $98,523 |
| 4-Person Families | 67 (8.3%) | $0 |
| 5-Person Families | 133 (16.5%) | $48,688 |
| 6-Person Families | 8 (1.0%) | $0 |
| 7+ Person Families | 19 (2.4%) | $0 |
| Total | 808 (100.0%) | $68,587 |
Family Income by Number of Earners in Watergate
The median family income in Watergate is $68,587, with families comprising 3+ earners (86) having the highest median family income of $96,111, while families with 1 earner (265) have the lowest median family income of $39,238, accounting for 10.6% and 32.8% of families, respectively.
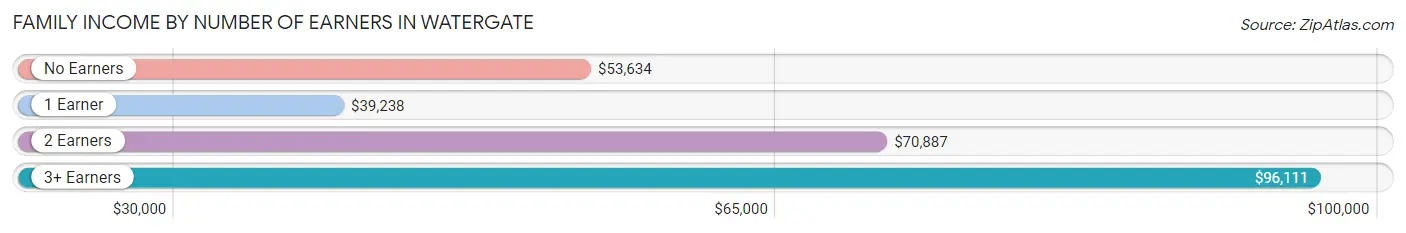
| Number of Earners | # Families | Median Income |
| No Earners | 85 (10.5%) | $53,634 |
| 1 Earner | 265 (32.8%) | $39,238 |
| 2 Earners | 372 (46.0%) | $70,887 |
| 3+ Earners | 86 (10.6%) | $96,111 |
| Total | 808 (100.0%) | $68,587 |
Household Income in Watergate
Household Income Brackets in Watergate
With 305 households falling in the category, the $50,000 to $74,999 income range is the most frequent in Watergate, accounting for 23.7% of all households. In contrast, only 15 households (1.2%) fall into the less than $10,000 income bracket, making it the least populous group.
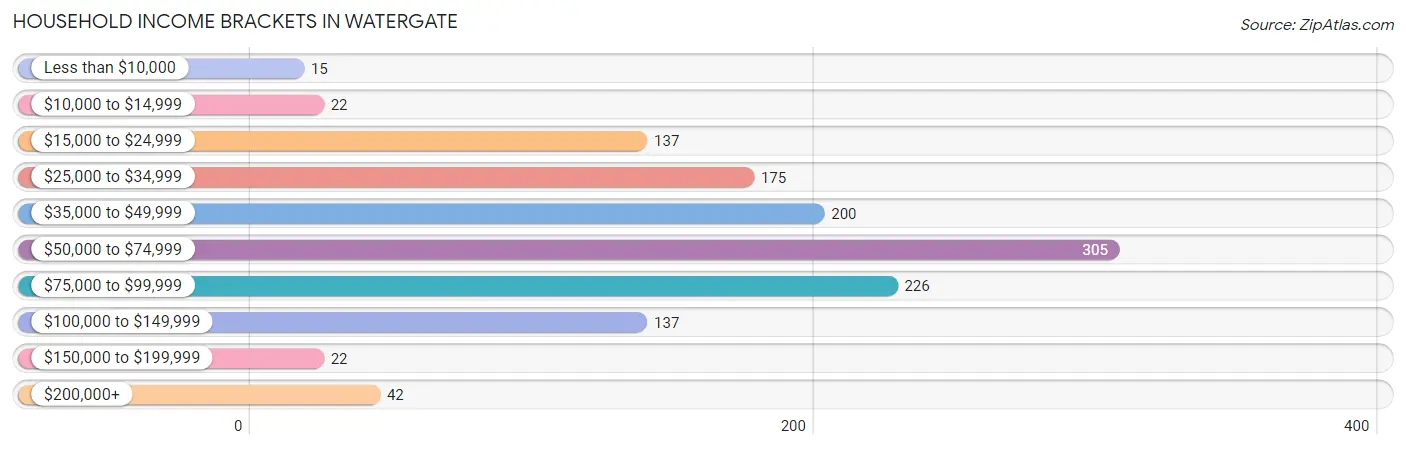
| Income Bracket | # Households | % Households |
| Less than $10,000 | 15 | 1.2% |
| $10,000 to $14,999 | 22 | 1.7% |
| $15,000 to $24,999 | 137 | 10.7% |
| $25,000 to $34,999 | 175 | 13.6% |
| $35,000 to $49,999 | 200 | 15.6% |
| $50,000 to $74,999 | 305 | 23.7% |
| $75,000 to $99,999 | 226 | 17.6% |
| $100,000 to $149,999 | 137 | 10.7% |
| $150,000 to $199,999 | 22 | 1.7% |
| $200,000+ | 42 | 3.3% |
Household Income by Householder Age in Watergate
The median household income in Watergate is $61,750, with the highest median household income of $71,798 found in the 45 to 64 years age bracket for the primary householder. A total of 775 households (60.3%) fall into this category. Meanwhile, the 25 to 44 years age bracket for the primary householder has the lowest median household income of $0, with 179 households (13.9%) in this group.
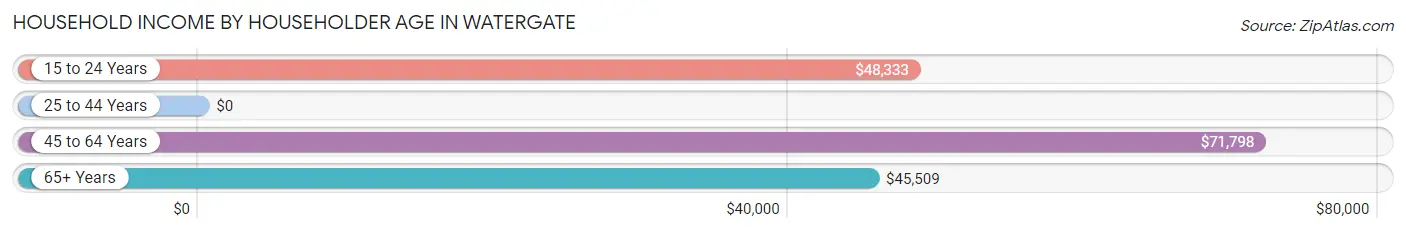
| Income Bracket | # Households | Median Income |
| 15 to 24 Years | 84 (6.5%) | $48,333 |
| 25 to 44 Years | 179 (13.9%) | $0 |
| 45 to 64 Years | 775 (60.3%) | $71,798 |
| 65+ Years | 247 (19.2%) | $45,509 |
| Total | 1,285 (100.0%) | $61,750 |
Poverty in Watergate
Income Below Poverty by Sex and Age in Watergate
With 19.7% poverty level for males and 23.9% for females among the residents of Watergate, 5 year old males and 6 to 11 year old females are the most vulnerable to poverty, with 38 males (100.0%) and 107 females (89.2%) in their respective age groups living below the poverty level.
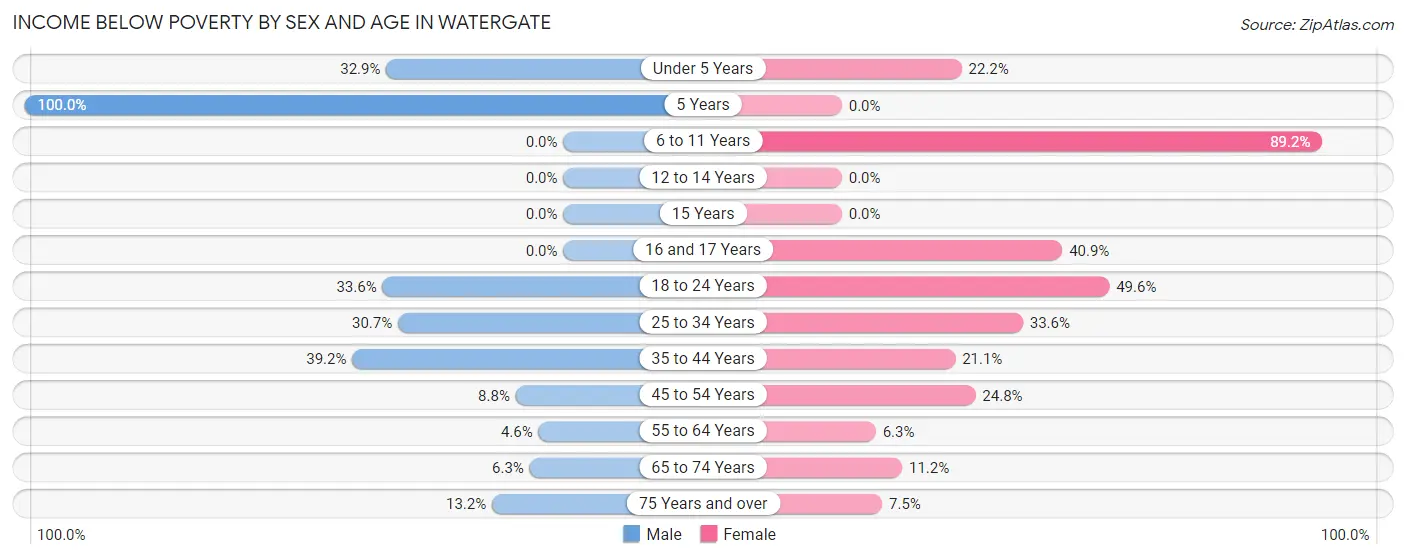
| Age Bracket | Male | Female |
| Under 5 Years | 23 (32.9%) | 12 (22.2%) |
| 5 Years | 38 (100.0%) | 0 (0.0%) |
| 6 to 11 Years | 0 (0.0%) | 107 (89.2%) |
| 12 to 14 Years | 0 (0.0%) | 0 (0.0%) |
| 15 Years | 0 (0.0%) | 0 (0.0%) |
| 16 and 17 Years | 0 (0.0%) | 36 (40.9%) |
| 18 to 24 Years | 96 (33.6%) | 69 (49.6%) |
| 25 to 34 Years | 54 (30.7%) | 44 (33.6%) |
| 35 to 44 Years | 76 (39.2%) | 36 (21.0%) |
| 45 to 54 Years | 35 (8.8%) | 63 (24.8%) |
| 55 to 64 Years | 16 (4.6%) | 33 (6.3%) |
| 65 to 74 Years | 9 (6.2%) | 17 (11.2%) |
| 75 Years and over | 9 (13.2%) | 8 (7.5%) |
| Total | 356 (19.7%) | 425 (23.9%) |
Income Above Poverty by Sex and Age in Watergate
According to the poverty statistics in Watergate, males aged 6 to 11 years and females aged 12 to 14 years are the age groups that are most secure financially, with 100.0% of males and 100.0% of females in these age groups living above the poverty line.
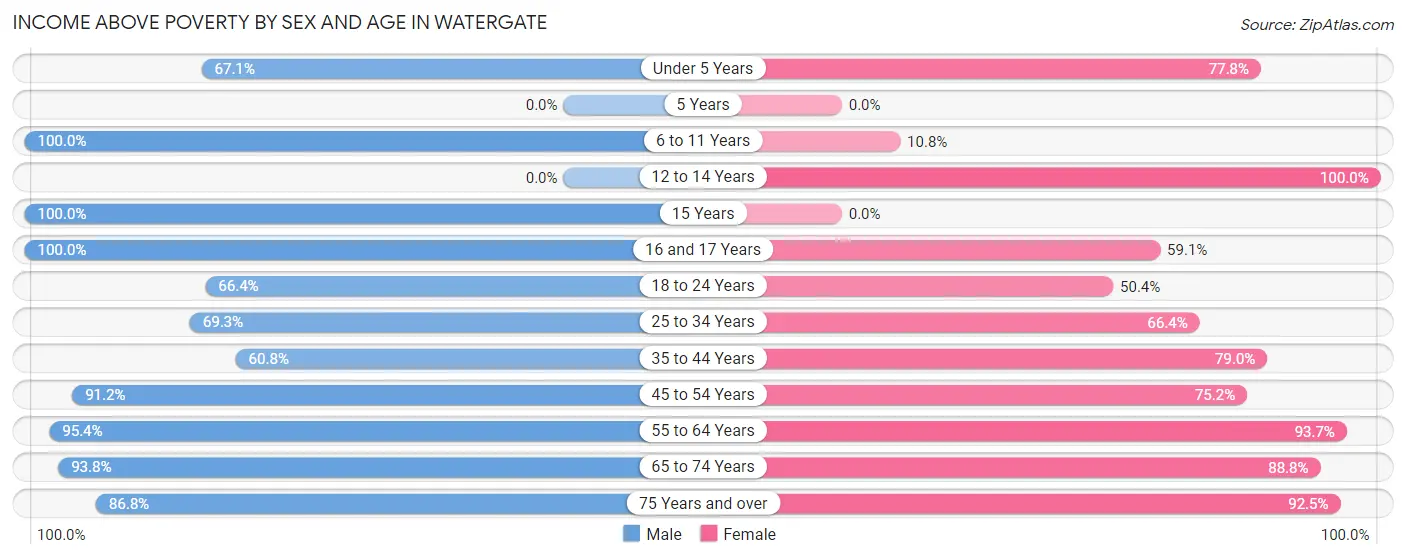
| Age Bracket | Male | Female |
| Under 5 Years | 47 (67.1%) | 42 (77.8%) |
| 5 Years | 0 (0.0%) | 0 (0.0%) |
| 6 to 11 Years | 44 (100.0%) | 13 (10.8%) |
| 12 to 14 Years | 0 (0.0%) | 36 (100.0%) |
| 15 Years | 7 (100.0%) | 0 (0.0%) |
| 16 and 17 Years | 41 (100.0%) | 52 (59.1%) |
| 18 to 24 Years | 190 (66.4%) | 70 (50.4%) |
| 25 to 34 Years | 122 (69.3%) | 87 (66.4%) |
| 35 to 44 Years | 118 (60.8%) | 135 (78.9%) |
| 45 to 54 Years | 361 (91.2%) | 191 (75.2%) |
| 55 to 64 Years | 332 (95.4%) | 492 (93.7%) |
| 65 to 74 Years | 135 (93.8%) | 135 (88.8%) |
| 75 Years and over | 59 (86.8%) | 99 (92.5%) |
| Total | 1,456 (80.3%) | 1,352 (76.1%) |
Income Below Poverty Among Married-Couple Families in Watergate
The poverty statistics for married-couple families in Watergate show that 14.2% or 82 of the total 579 families live below the poverty line. Families with 1 or 2 children have the highest poverty rate of 35.2%, comprising of 57 families. On the other hand, families with no children have the lowest poverty rate of 6.0%, which includes 25 families.
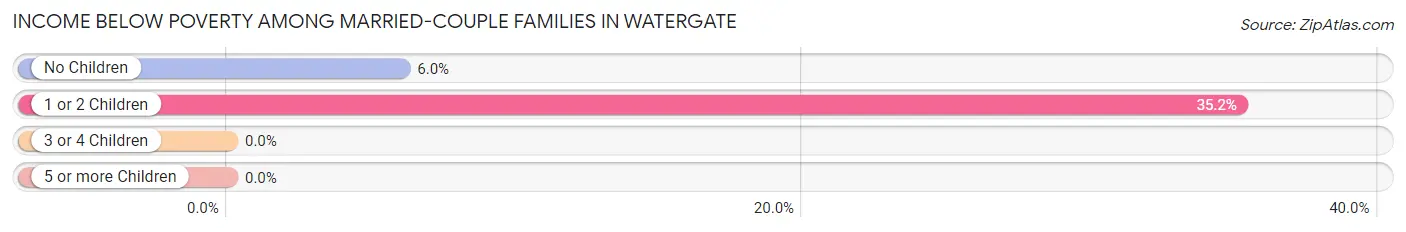
| Children | Above Poverty | Below Poverty |
| No Children | 392 (94.0%) | 25 (6.0%) |
| 1 or 2 Children | 105 (64.8%) | 57 (35.2%) |
| 3 or 4 Children | 0 (0.0%) | 0 (0.0%) |
| 5 or more Children | 0 (0.0%) | 0 (0.0%) |
| Total | 497 (85.8%) | 82 (14.2%) |
Income Below Poverty Among Single-Parent Households in Watergate
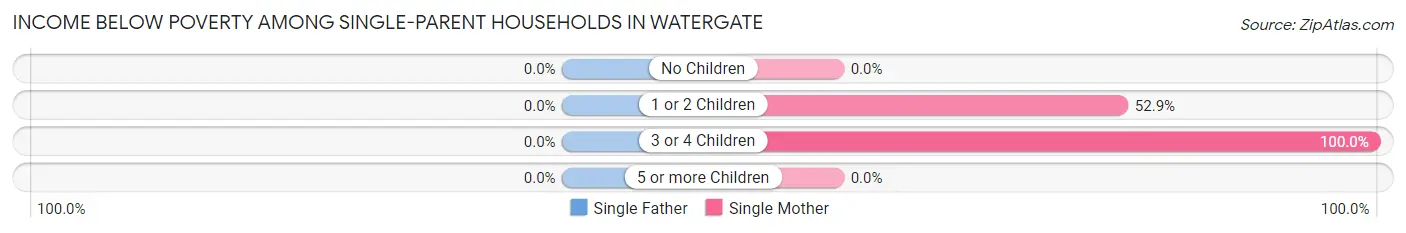
| Children | Single Father | Single Mother |
| No Children | 0 (0.0%) | 0 (0.0%) |
| 1 or 2 Children | 0 (0.0%) | 9 (52.9%) |
| 3 or 4 Children | 0 (0.0%) | 35 (100.0%) |
| 5 or more Children | 0 (0.0%) | 0 (0.0%) |
| Total | 0 (0.0%) | 44 (55.7%) |
Income Below Poverty Among Married-Couple vs Single-Parent Households in Watergate
The poverty data for Watergate shows that 82 of the married-couple family households (14.2%) and 44 of the single-parent households (19.2%) are living below the poverty level. Within the married-couple family households, those with 1 or 2 children have the highest poverty rate, with 57 households (35.2%) falling below the poverty line. Among the single-parent households, those with 3 or 4 children have the highest poverty rate, with 35 household (70.0%) living below poverty.
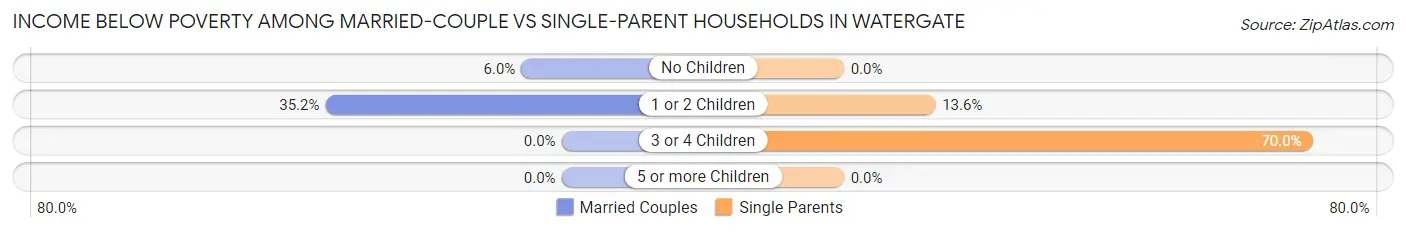
| Children | Married-Couple Families | Single-Parent Households |
| No Children | 25 (6.0%) | 0 (0.0%) |
| 1 or 2 Children | 57 (35.2%) | 9 (13.6%) |
| 3 or 4 Children | 0 (0.0%) | 35 (70.0%) |
| 5 or more Children | 0 (0.0%) | 0 (0.0%) |
| Total | 82 (14.2%) | 44 (19.2%) |
Race in Watergate
The most populous races in Watergate are White / Caucasian (2,503 | 69.7%), Hispanic or Latino (1,338 | 37.3%), and Some other Race (573 | 16.0%).
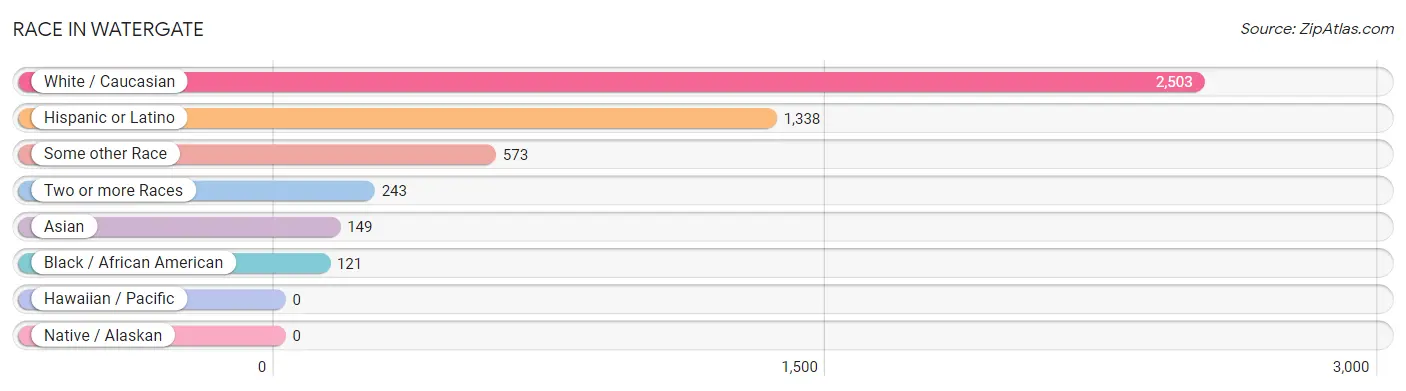
| Race | # Population | % Population |
| Asian | 149 | 4.2% |
| Black / African American | 121 | 3.4% |
| Hawaiian / Pacific | 0 | 0.0% |
| Hispanic or Latino | 1,338 | 37.3% |
| Native / Alaskan | 0 | 0.0% |
| White / Caucasian | 2,503 | 69.7% |
| Two or more Races | 243 | 6.8% |
| Some other Race | 573 | 16.0% |
| Total | 3,589 | 100.0% |
Ancestry in Watergate
The most populous ancestries reported in Watergate are Mexican (558 | 15.5%), Italian (536 | 14.9%), Irish (458 | 12.8%), Brazilian (428 | 11.9%), and South American (424 | 11.8%), together accounting for 67.0% of all Watergate residents.
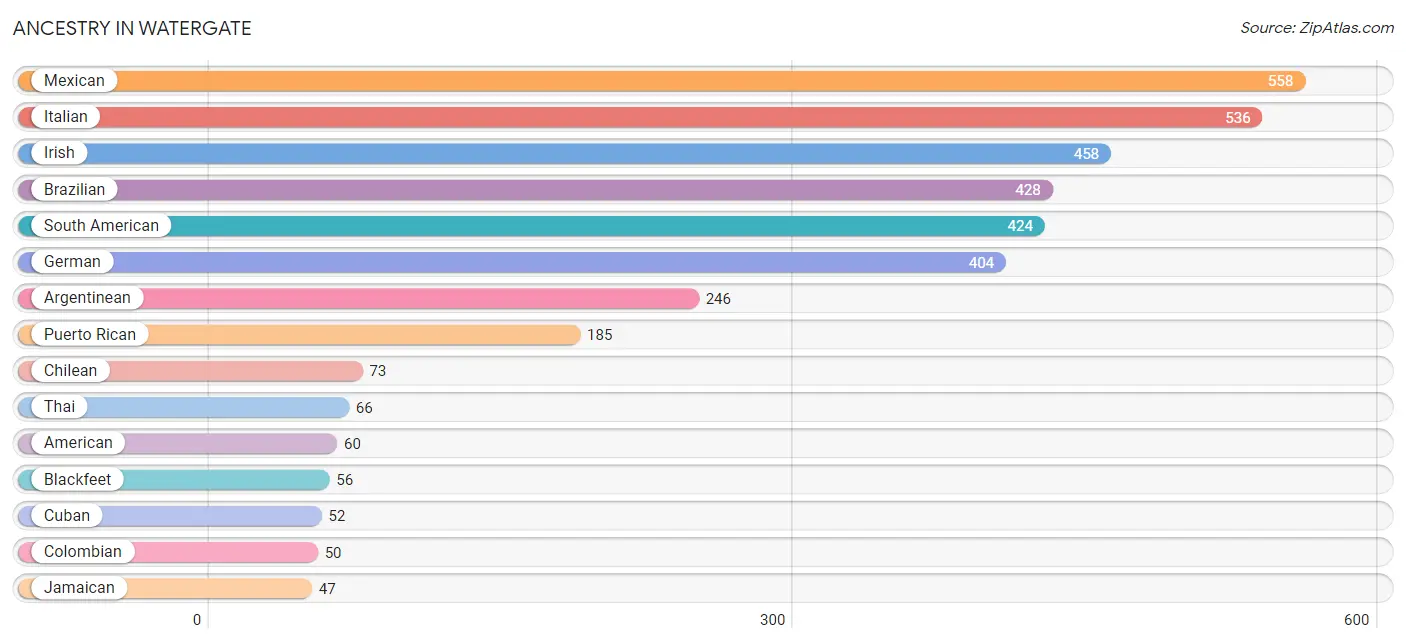
| Ancestry | # Population | % Population |
| African | 9 | 0.3% |
| American | 60 | 1.7% |
| Argentinean | 246 | 6.9% |
| Bahamian | 12 | 0.3% |
| Blackfeet | 56 | 1.6% |
| Brazilian | 428 | 11.9% |
| British | 14 | 0.4% |
| Canadian | 16 | 0.4% |
| Chilean | 73 | 2.0% |
| Colombian | 50 | 1.4% |
| Cuban | 52 | 1.5% |
| Czech | 12 | 0.3% |
| Dominican | 15 | 0.4% |
| Dutch | 17 | 0.5% |
| Ecuadorian | 7 | 0.2% |
| English | 32 | 0.9% |
| European | 16 | 0.4% |
| French | 36 | 1.0% |
| French Canadian | 9 | 0.3% |
| German | 404 | 11.3% |
| Haitian | 8 | 0.2% |
| Hungarian | 25 | 0.7% |
| Indian (Asian) | 45 | 1.3% |
| Irish | 458 | 12.8% |
| Italian | 536 | 14.9% |
| Jamaican | 47 | 1.3% |
| Korean | 26 | 0.7% |
| Mexican | 558 | 15.5% |
| Pakistani | 17 | 0.5% |
| Peruvian | 9 | 0.3% |
| Polish | 19 | 0.5% |
| Portuguese | 15 | 0.4% |
| Puerto Rican | 185 | 5.1% |
| Romanian | 18 | 0.5% |
| Russian | 6 | 0.2% |
| Scottish | 23 | 0.6% |
| Sioux | 41 | 1.1% |
| South American | 424 | 11.8% |
| Spaniard | 7 | 0.2% |
| Sri Lankan | 41 | 1.1% |
| Subsaharan African | 9 | 0.3% |
| Thai | 66 | 1.8% | View All 42 Rows |
Immigrants in Watergate
The most numerous immigrant groups reported in Watergate came from Latin America (1,071 | 29.8%), South America (821 | 22.9%), Brazil (310 | 8.6%), Argentina (246 | 6.9%), and Central America (211 | 5.9%), together accounting for 74.1% of all Watergate residents.
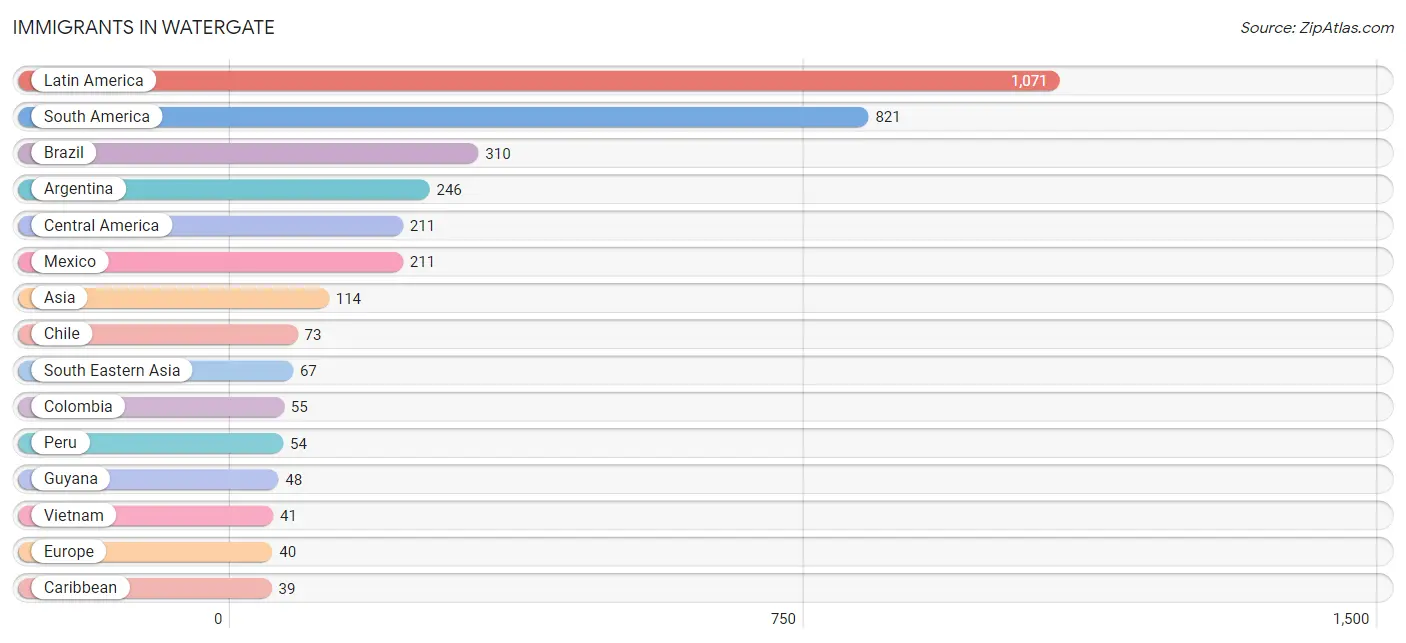
| Immigration Origin | # Population | % Population |
| Argentina | 246 | 6.9% |
| Asia | 114 | 3.2% |
| Belgium | 19 | 0.5% |
| Brazil | 310 | 8.6% |
| Canada | 7 | 0.2% |
| Caribbean | 39 | 1.1% |
| Central America | 211 | 5.9% |
| Chile | 73 | 2.0% |
| China | 16 | 0.4% |
| Colombia | 55 | 1.5% |
| Cuba | 18 | 0.5% |
| Eastern Asia | 16 | 0.4% |
| Ecuador | 35 | 1.0% |
| England | 14 | 0.4% |
| Europe | 40 | 1.1% |
| Guyana | 48 | 1.3% |
| Hong Kong | 16 | 0.4% |
| Jamaica | 21 | 0.6% |
| Latin America | 1,071 | 29.8% |
| Mexico | 211 | 5.9% |
| Northern Europe | 14 | 0.4% |
| Pakistan | 31 | 0.9% |
| Peru | 54 | 1.5% |
| Philippines | 26 | 0.7% |
| South America | 821 | 22.9% |
| South Central Asia | 31 | 0.9% |
| South Eastern Asia | 67 | 1.9% |
| Southern Europe | 7 | 0.2% |
| Spain | 7 | 0.2% |
| Vietnam | 41 | 1.1% |
| Western Europe | 19 | 0.5% | View All 31 Rows |
Sex and Age in Watergate
Sex and Age in Watergate
The most populous age groups in Watergate are 45 to 49 Years (243 | 13.4%) for men and 55 to 59 Years (464 | 26.1%) for women.
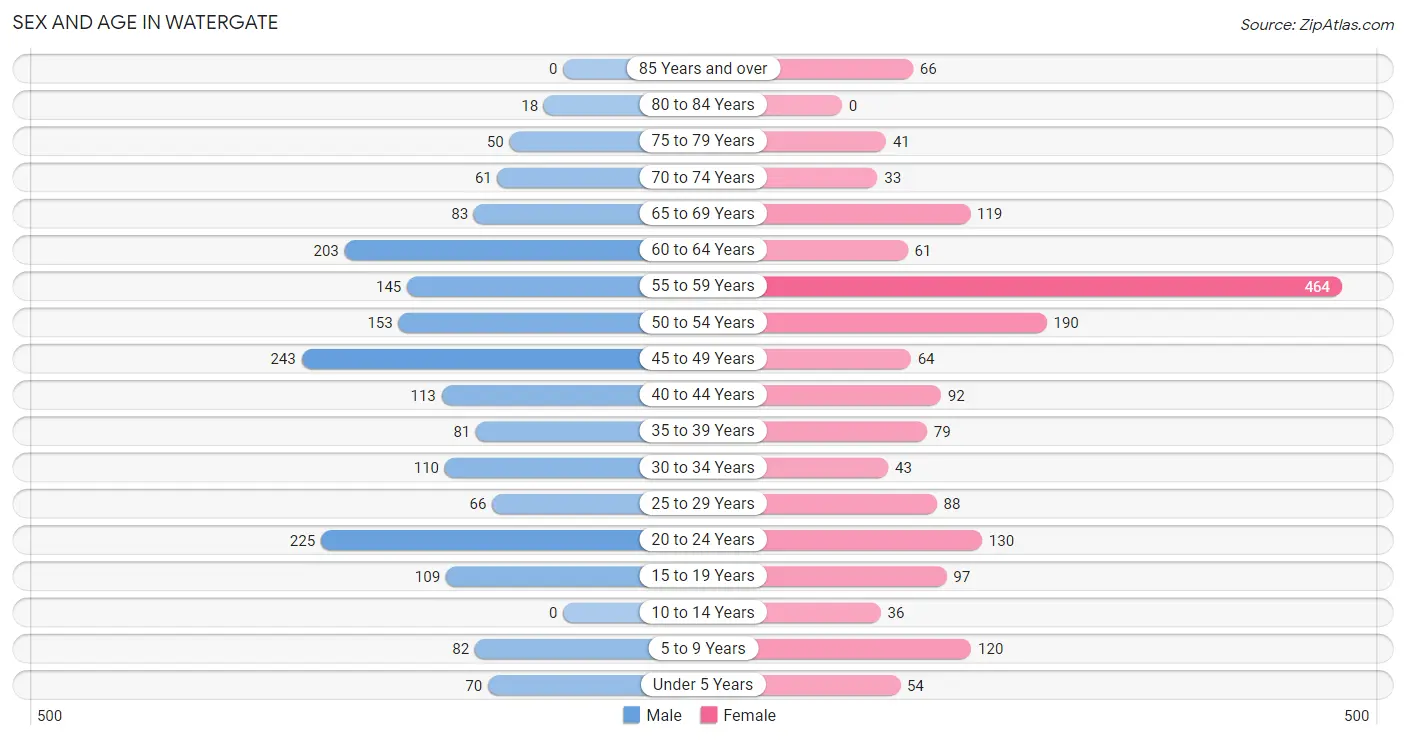
| Age Bracket | Male | Female |
| Under 5 Years | 70 (3.9%) | 54 (3.0%) |
| 5 to 9 Years | 82 (4.5%) | 120 (6.8%) |
| 10 to 14 Years | 0 (0.0%) | 36 (2.0%) |
| 15 to 19 Years | 109 (6.0%) | 97 (5.5%) |
| 20 to 24 Years | 225 (12.4%) | 130 (7.3%) |
| 25 to 29 Years | 66 (3.6%) | 88 (5.0%) |
| 30 to 34 Years | 110 (6.1%) | 43 (2.4%) |
| 35 to 39 Years | 81 (4.5%) | 79 (4.4%) |
| 40 to 44 Years | 113 (6.2%) | 92 (5.2%) |
| 45 to 49 Years | 243 (13.4%) | 64 (3.6%) |
| 50 to 54 Years | 153 (8.4%) | 190 (10.7%) |
| 55 to 59 Years | 145 (8.0%) | 464 (26.1%) |
| 60 to 64 Years | 203 (11.2%) | 61 (3.4%) |
| 65 to 69 Years | 83 (4.6%) | 119 (6.7%) |
| 70 to 74 Years | 61 (3.4%) | 33 (1.9%) |
| 75 to 79 Years | 50 (2.8%) | 41 (2.3%) |
| 80 to 84 Years | 18 (1.0%) | 0 (0.0%) |
| 85 Years and over | 0 (0.0%) | 66 (3.7%) |
| Total | 1,812 (100.0%) | 1,777 (100.0%) |
Families and Households in Watergate
Median Family Size in Watergate
The median family size in Watergate is 3.14 persons per family, with single female/mother families (79 | 9.8%) accounting for the largest median family size of 4.34 persons per family. On the other hand, married-couple families (579 | 71.7%) represent the smallest median family size with 2.94 persons per family.
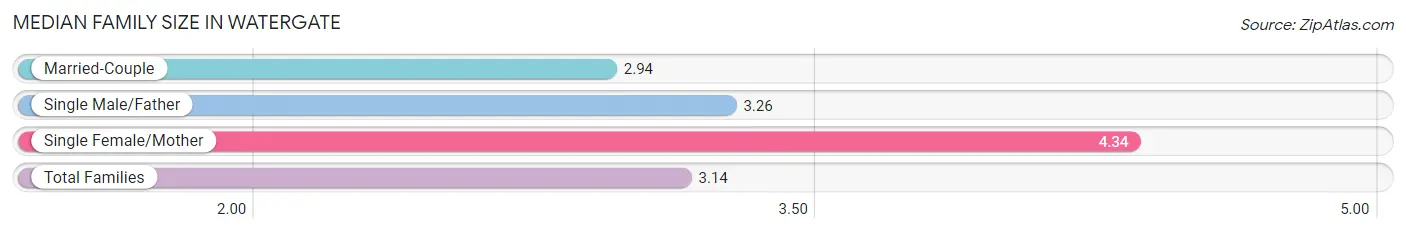
| Family Type | # Families | Family Size |
| Married-Couple | 579 (71.7%) | 2.94 |
| Single Male/Father | 150 (18.6%) | 3.26 |
| Single Female/Mother | 79 (9.8%) | 4.34 |
| Total Families | 808 (100.0%) | 3.14 |
Median Household Size in Watergate
The median household size in Watergate is 2.79 persons per household, with single female/mother households (79 | 6.1%) accounting for the largest median household size of 4.34 persons per household. non-family households (477 | 37.1%) represent the smallest median household size with 1.83 persons per household.
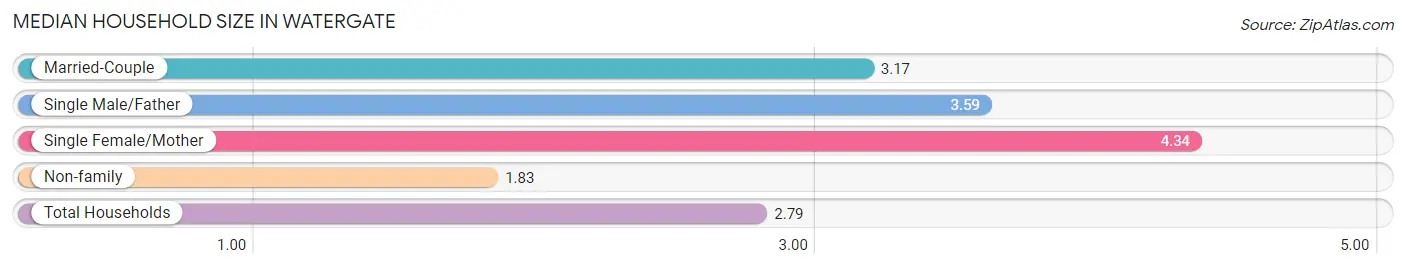
| Household Type | # Households | Household Size |
| Married-Couple | 579 (45.1%) | 3.17 |
| Single Male/Father | 150 (11.7%) | 3.59 |
| Single Female/Mother | 79 (6.1%) | 4.34 |
| Non-family | 477 (37.1%) | 1.83 |
| Total Households | 1,285 (100.0%) | 2.79 |
Household Size by Marriage Status in Watergate
Out of a total of 1,285 households in Watergate, 808 (62.9%) are family households, while 477 (37.1%) are nonfamily households. The most numerous type of family households are 2-person households, comprising 399, and the most common type of nonfamily households are 2-person households, comprising 236.
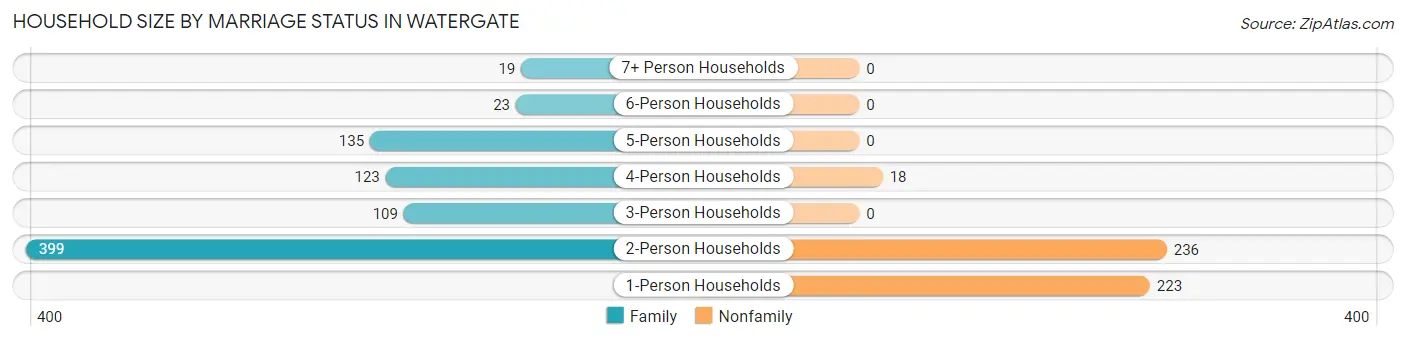
| Household Size | Family Households | Nonfamily Households |
| 1-Person Households | - | 223 (17.3%) |
| 2-Person Households | 399 (31.0%) | 236 (18.4%) |
| 3-Person Households | 109 (8.5%) | 0 (0.0%) |
| 4-Person Households | 123 (9.6%) | 18 (1.4%) |
| 5-Person Households | 135 (10.5%) | 0 (0.0%) |
| 6-Person Households | 23 (1.8%) | 0 (0.0%) |
| 7+ Person Households | 19 (1.5%) | 0 (0.0%) |
| Total | 808 (62.9%) | 477 (37.1%) |
Female Fertility in Watergate
Fertility by Age in Watergate
Average fertility rate in Watergate is 57.0 births per 1,000 women. Women in the age bracket of 20 to 34 years have the highest fertility rate with 134.0 births per 1,000 women. Women in the age bracket of 20 to 34 years acount for 100.0% of all women with births.
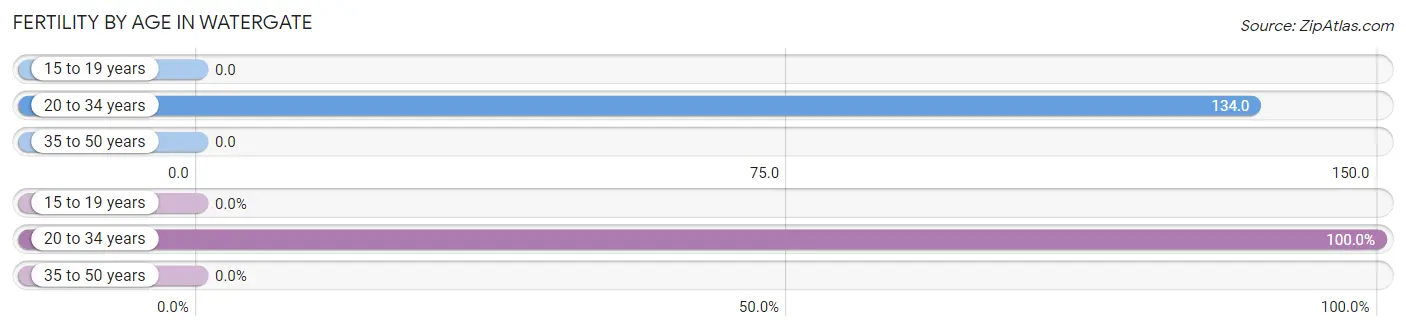
| Age Bracket | Women with Births | Births / 1,000 Women |
| 15 to 19 years | 0 (0.0%) | 0.0 |
| 20 to 34 years | 35 (100.0%) | 134.0 |
| 35 to 50 years | 0 (0.0%) | 0.0 |
| Total | 35 (100.0%) | 57.0 |
Fertility by Age by Marriage Status in Watergate
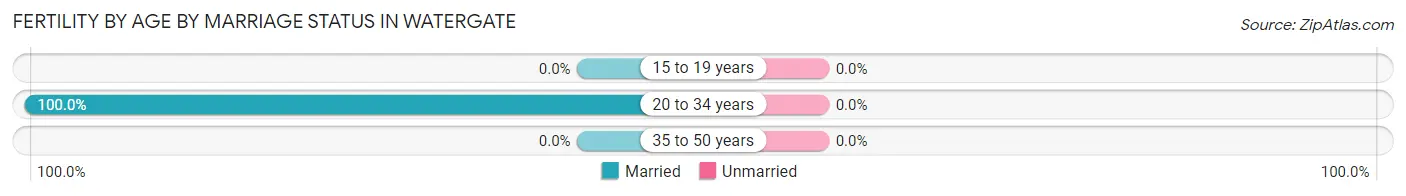
| Age Bracket | Married | Unmarried |
| 15 to 19 years | 0 (0.0%) | 0 (0.0%) |
| 20 to 34 years | 35 (100.0%) | 0 (0.0%) |
| 35 to 50 years | 0 (0.0%) | 0 (0.0%) |
| Total | 35 (100.0%) | 0 (0.0%) |
Fertility by Education in Watergate
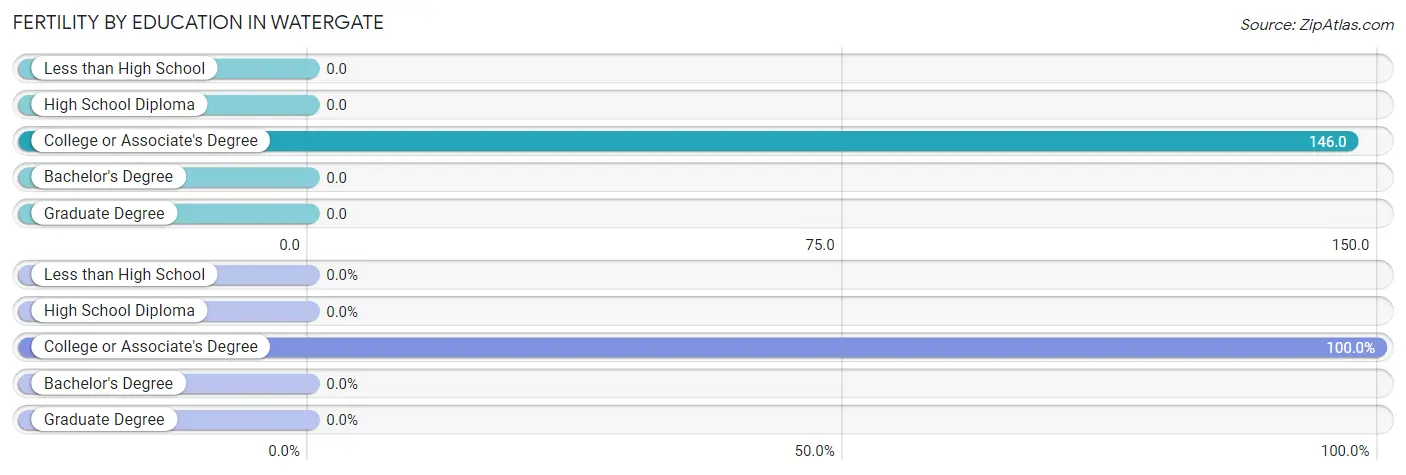
| Educational Attainment | Women with Births | Births / 1,000 Women |
| Less than High School | 0 (0.0%) | 0.0 |
| High School Diploma | 0 (0.0%) | 0.0 |
| College or Associate's Degree | 35 (100.0%) | 146.0 |
| Bachelor's Degree | 0 (0.0%) | 0.0 |
| Graduate Degree | 0 (0.0%) | 0.0 |
| Total | 35 (100.0%) | 57.0 |
Fertility by Education by Marriage Status in Watergate
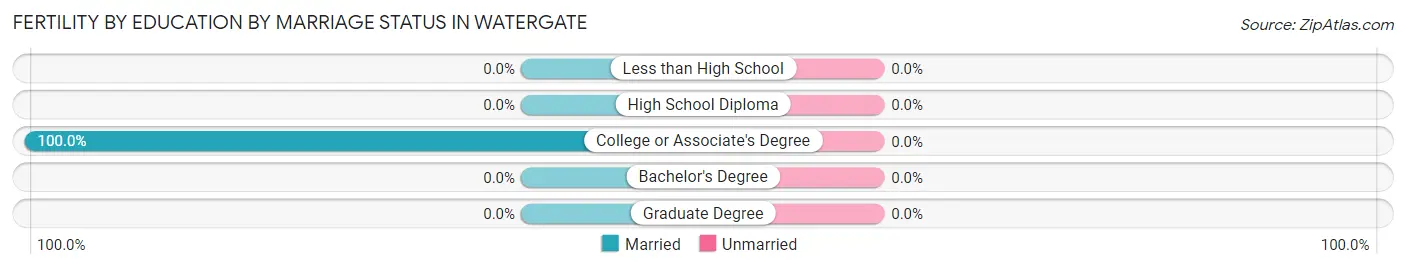
| Educational Attainment | Married | Unmarried |
| Less than High School | 0 (0.0%) | 0 (0.0%) |
| High School Diploma | 0 (0.0%) | 0 (0.0%) |
| College or Associate's Degree | 35 (100.0%) | 0 (0.0%) |
| Bachelor's Degree | 0 (0.0%) | 0 (0.0%) |
| Graduate Degree | 0 (0.0%) | 0 (0.0%) |
| Total | 35 (100.0%) | 0 (0.0%) |
Employment Characteristics in Watergate
Employment by Class of Employer in Watergate
Among the 1,715 employed individuals in Watergate, private company employees (1,293 | 75.4%), self-employed (not incorporated) (186 | 10.8%), and local government employees (76 | 4.4%) make up the most common classes of employment.
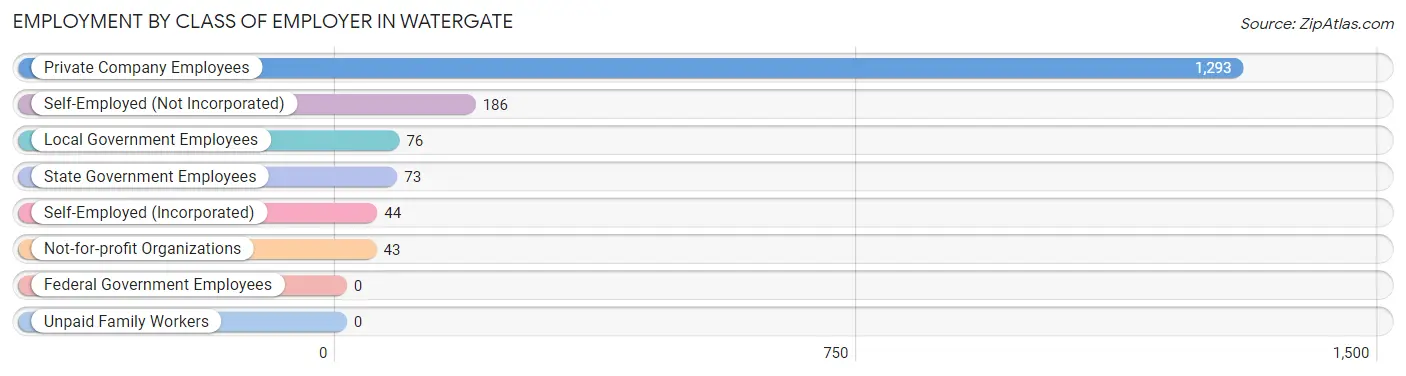
| Employer Class | # Employees | % Employees |
| Private Company Employees | 1,293 | 75.4% |
| Self-Employed (Incorporated) | 44 | 2.6% |
| Self-Employed (Not Incorporated) | 186 | 10.8% |
| Not-for-profit Organizations | 43 | 2.5% |
| Local Government Employees | 76 | 4.4% |
| State Government Employees | 73 | 4.3% |
| Federal Government Employees | 0 | 0.0% |
| Unpaid Family Workers | 0 | 0.0% |
| Total | 1,715 | 100.0% |
Employment Status by Age in Watergate
According to the labor force statistics for Watergate, out of the total population over 16 years of age (3,220), 59.9% or 1,929 individuals are in the labor force, with 10.1% or 195 of them unemployed. The age group with the highest labor force participation rate is 30 to 34 years, with 100.0% or 153 individuals in the labor force. Within the labor force, the 16 to 19 years age range has the highest percentage of unemployed individuals, with 57.4% or 35 of them being unemployed.
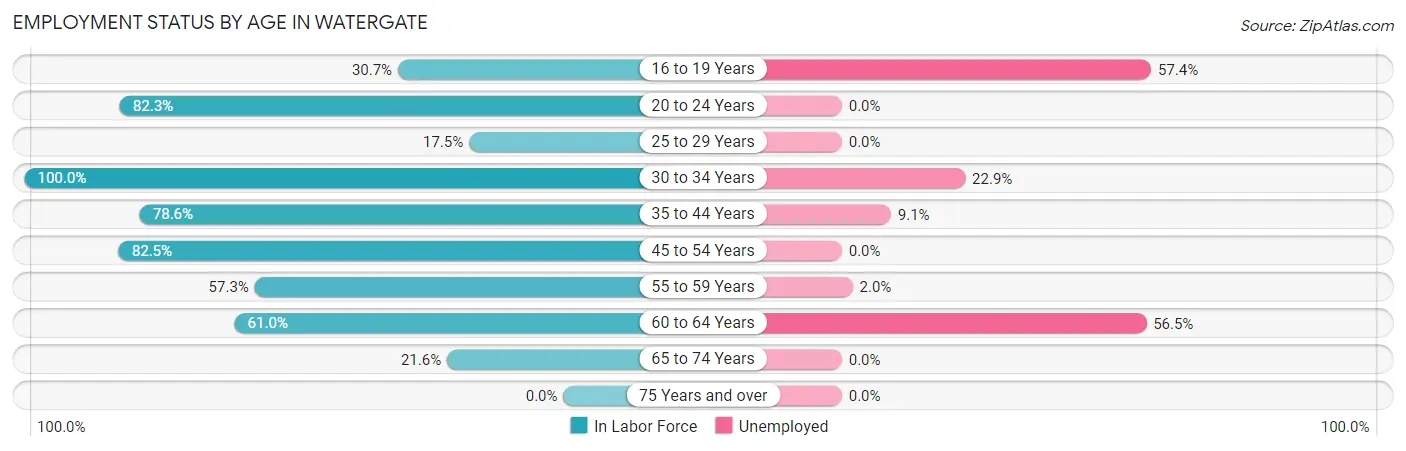
| Age Bracket | In Labor Force | Unemployed |
| 16 to 19 Years | 61 (30.7%) | 35 (57.4%) |
| 20 to 24 Years | 292 (82.3%) | 0 (0.0%) |
| 25 to 29 Years | 27 (17.5%) | 0 (0.0%) |
| 30 to 34 Years | 153 (100.0%) | 35 (22.9%) |
| 35 to 44 Years | 287 (78.6%) | 26 (9.1%) |
| 45 to 54 Years | 536 (82.5%) | 0 (0.0%) |
| 55 to 59 Years | 349 (57.3%) | 7 (2.0%) |
| 60 to 64 Years | 161 (61.0%) | 91 (56.5%) |
| 65 to 74 Years | 64 (21.6%) | 0 (0.0%) |
| 75 Years and over | 0 (0.0%) | 0 (0.0%) |
| Total | 1,929 (59.9%) | 195 (10.1%) |
Employment Status by Educational Attainment in Watergate
According to labor force statistics for Watergate, 68.9% of individuals (1,512) out of the total population between 25 and 64 years of age (2,195) are in the labor force, with 10.5% or 159 of them being unemployed. The group with the highest labor force participation rate are those with the educational attainment of bachelor's degree or higher, with 94.0% or 266 individuals in the labor force. Within the labor force, individuals with bachelor's degree or higher education have the highest percentage of unemployment, with 13.2% or 35 of them being unemployed.
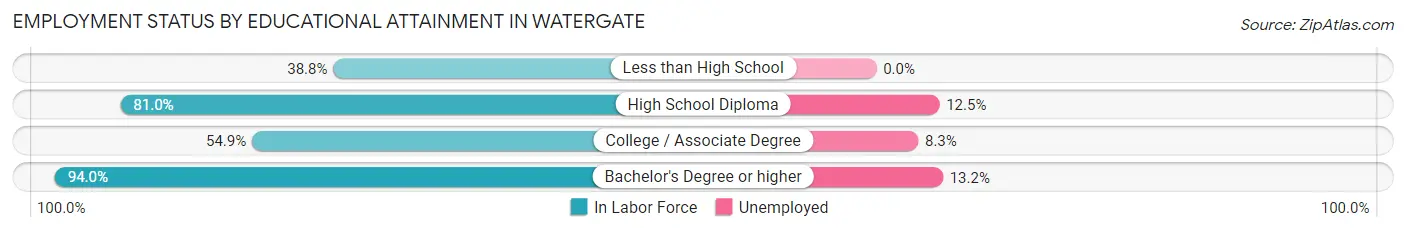
| Educational Attainment | In Labor Force | Unemployed |
| Less than High School | 193 (38.8%) | 0 (0.0%) |
| High School Diploma | 862 (81.0%) | 133 (12.5%) |
| College / Associate Degree | 192 (54.9%) | 29 (8.3%) |
| Bachelor's Degree or higher | 266 (94.0%) | 37 (13.2%) |
| Total | 1,512 (68.9%) | 230 (10.5%) |
Employment Occupations by Sex in Watergate
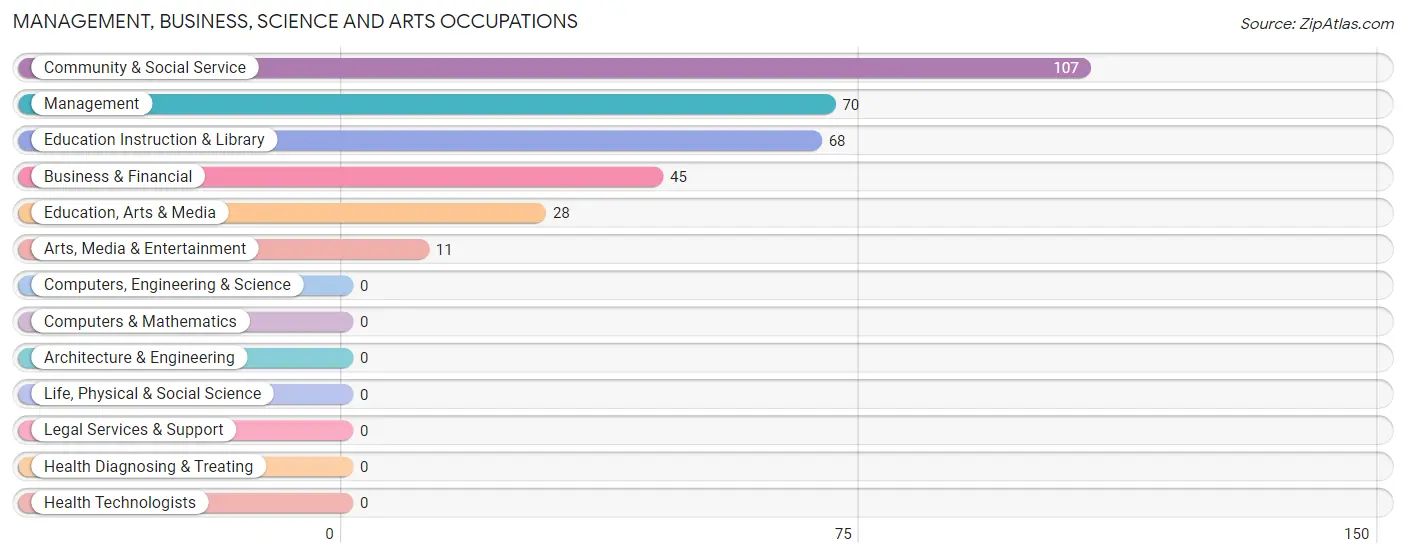
Management, Business, Science and Arts Occupations
The most common Management, Business, Science and Arts occupations in Watergate are Community & Social Service (107 | 6.2%), Management (70 | 4.0%), Education Instruction & Library (68 | 3.9%), Business & Financial (45 | 2.6%), and Education, Arts & Media (28 | 1.6%).
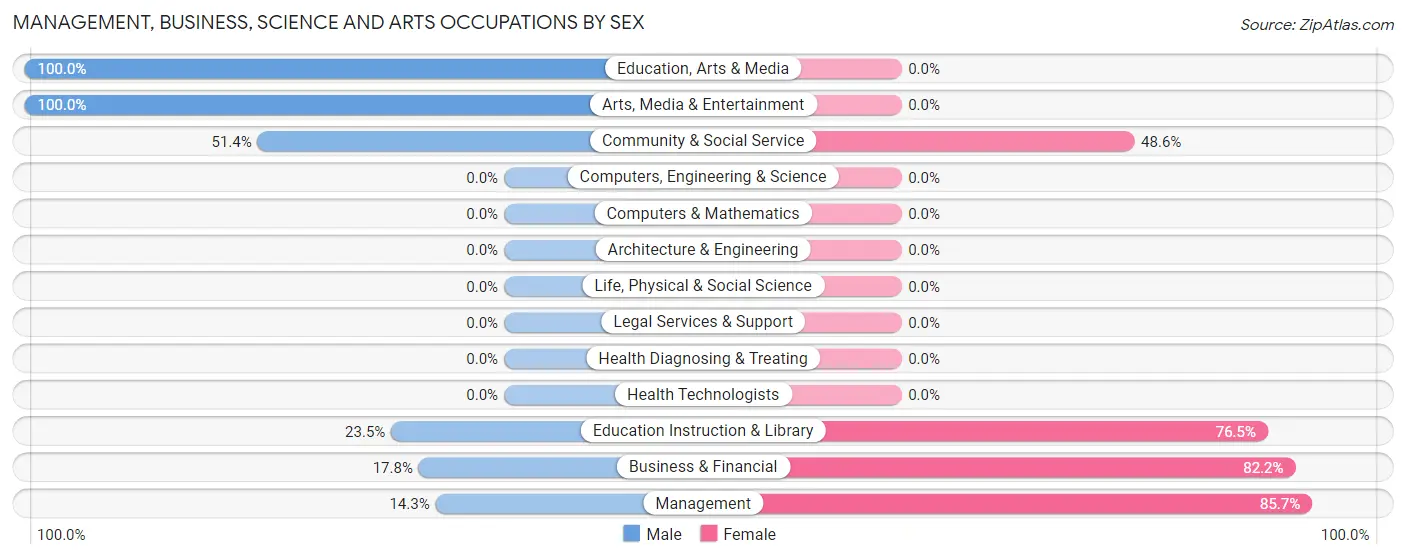
Management, Business, Science and Arts Occupations by Sex
Within the Management, Business, Science and Arts occupations in Watergate, the most male-oriented occupations are Education, Arts & Media (100.0%), Arts, Media & Entertainment (100.0%), and Community & Social Service (51.4%), while the most female-oriented occupations are Management (85.7%), Business & Financial (82.2%), and Education Instruction & Library (76.5%).
| Occupation | Male | Female |
| Management | 10 (14.3%) | 60 (85.7%) |
| Business & Financial | 8 (17.8%) | 37 (82.2%) |
| Computers, Engineering & Science | 0 (0.0%) | 0 (0.0%) |
| Computers & Mathematics | 0 (0.0%) | 0 (0.0%) |
| Architecture & Engineering | 0 (0.0%) | 0 (0.0%) |
| Life, Physical & Social Science | 0 (0.0%) | 0 (0.0%) |
| Community & Social Service | 55 (51.4%) | 52 (48.6%) |
| Education, Arts & Media | 28 (100.0%) | 0 (0.0%) |
| Legal Services & Support | 0 (0.0%) | 0 (0.0%) |
| Education Instruction & Library | 16 (23.5%) | 52 (76.5%) |
| Arts, Media & Entertainment | 11 (100.0%) | 0 (0.0%) |
| Health Diagnosing & Treating | 0 (0.0%) | 0 (0.0%) |
| Health Technologists | 0 (0.0%) | 0 (0.0%) |
| Total (Category) | 73 (32.9%) | 149 (67.1%) |
| Total (Overall) | 1,006 (58.0%) | 730 (42.0%) |
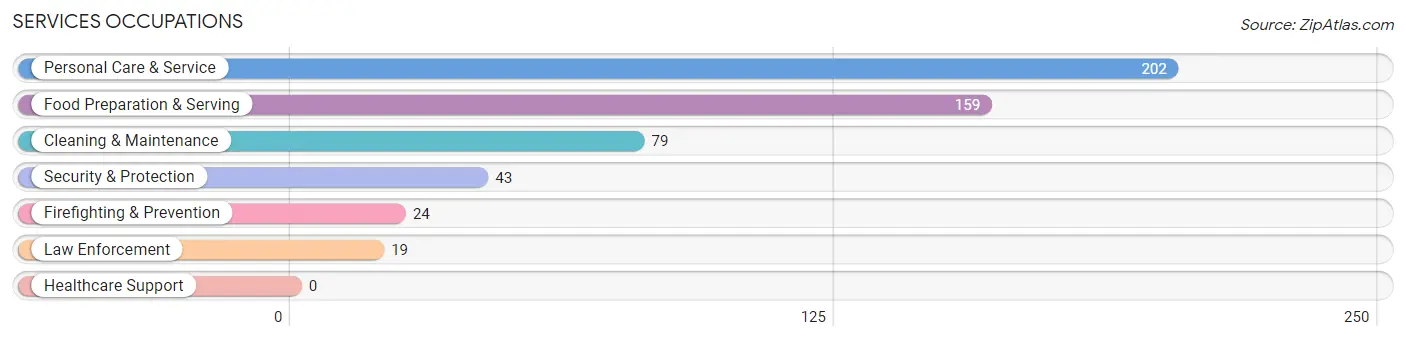
Services Occupations
The most common Services occupations in Watergate are Personal Care & Service (202 | 11.6%), Food Preparation & Serving (159 | 9.2%), Cleaning & Maintenance (79 | 4.5%), Security & Protection (43 | 2.5%), and Firefighting & Prevention (24 | 1.4%).
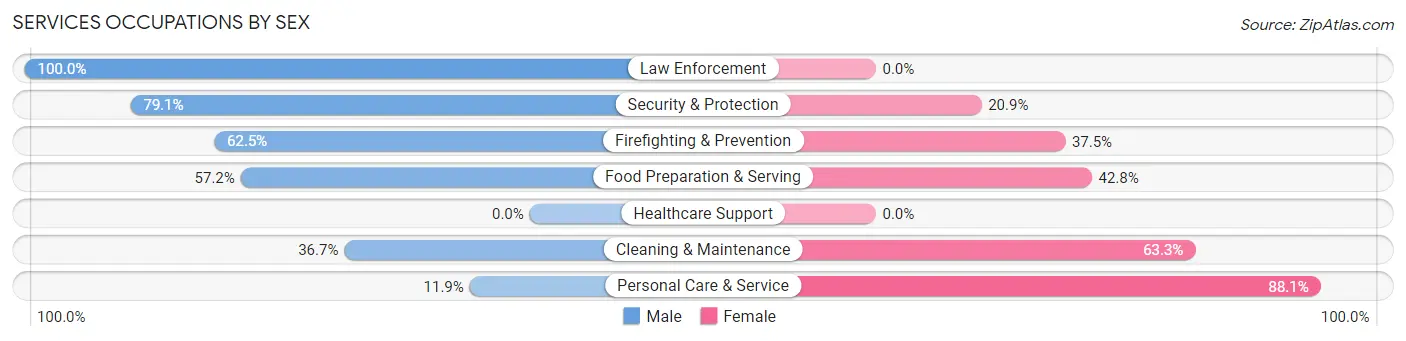
Services Occupations by Sex
Within the Services occupations in Watergate, the most male-oriented occupations are Law Enforcement (100.0%), Security & Protection (79.1%), and Firefighting & Prevention (62.5%), while the most female-oriented occupations are Personal Care & Service (88.1%), Cleaning & Maintenance (63.3%), and Food Preparation & Serving (42.8%).
| Occupation | Male | Female |
| Healthcare Support | 0 (0.0%) | 0 (0.0%) |
| Security & Protection | 34 (79.1%) | 9 (20.9%) |
| Firefighting & Prevention | 15 (62.5%) | 9 (37.5%) |
| Law Enforcement | 19 (100.0%) | 0 (0.0%) |
| Food Preparation & Serving | 91 (57.2%) | 68 (42.8%) |
| Cleaning & Maintenance | 29 (36.7%) | 50 (63.3%) |
| Personal Care & Service | 24 (11.9%) | 178 (88.1%) |
| Total (Category) | 178 (36.8%) | 305 (63.1%) |
| Total (Overall) | 1,006 (58.0%) | 730 (42.0%) |
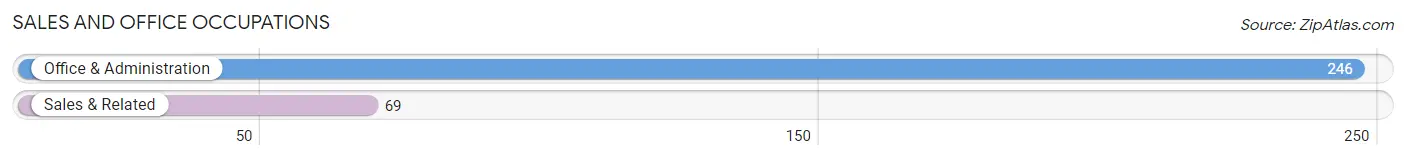
Sales and Office Occupations
The most common Sales and Office occupations in Watergate are Office & Administration (246 | 14.2%), and Sales & Related (69 | 4.0%).
Sales and Office Occupations by Sex

| Occupation | Male | Female |
| Sales & Related | 69 (100.0%) | 0 (0.0%) |
| Office & Administration | 84 (34.2%) | 162 (65.8%) |
| Total (Category) | 153 (48.6%) | 162 (51.4%) |
| Total (Overall) | 1,006 (58.0%) | 730 (42.0%) |
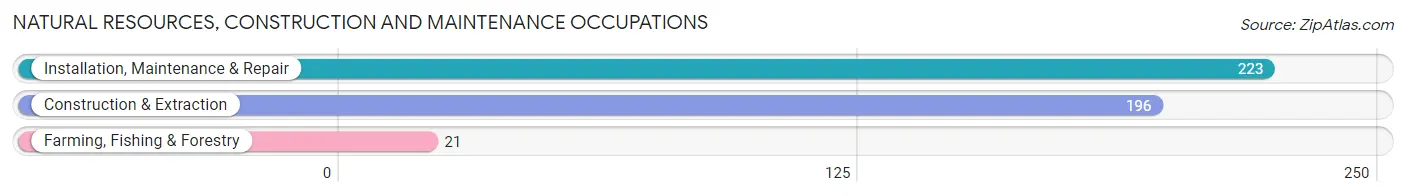
Natural Resources, Construction and Maintenance Occupations
The most common Natural Resources, Construction and Maintenance occupations in Watergate are Installation, Maintenance & Repair (223 | 12.9%), Construction & Extraction (196 | 11.3%), and Farming, Fishing & Forestry (21 | 1.2%).
Natural Resources, Construction and Maintenance Occupations by Sex
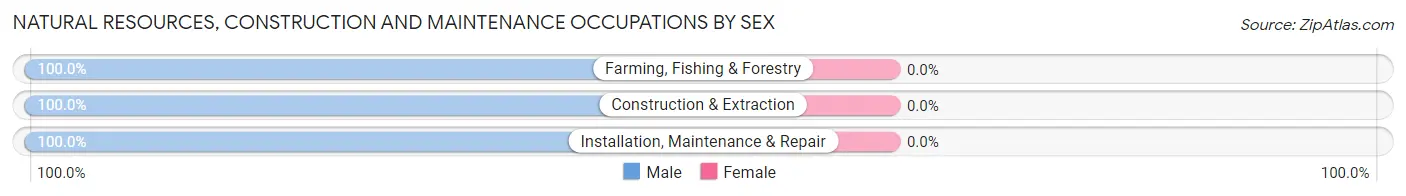
| Occupation | Male | Female |
| Farming, Fishing & Forestry | 21 (100.0%) | 0 (0.0%) |
| Construction & Extraction | 196 (100.0%) | 0 (0.0%) |
| Installation, Maintenance & Repair | 223 (100.0%) | 0 (0.0%) |
| Total (Category) | 440 (100.0%) | 0 (0.0%) |
| Total (Overall) | 1,006 (58.0%) | 730 (42.0%) |
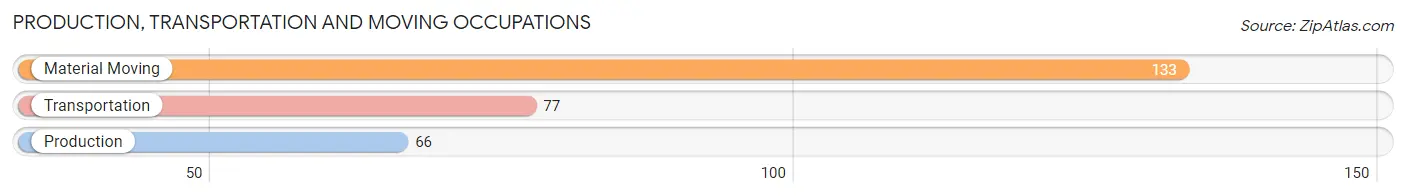
Production, Transportation and Moving Occupations
The most common Production, Transportation and Moving occupations in Watergate are Material Moving (133 | 7.7%), Transportation (77 | 4.4%), and Production (66 | 3.8%).
Production, Transportation and Moving Occupations by Sex
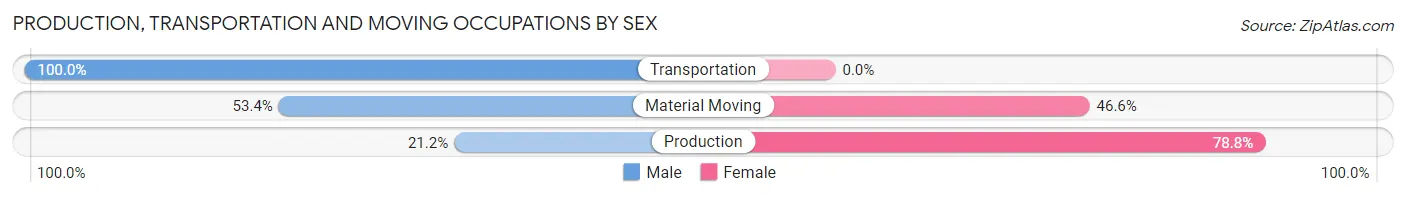
| Occupation | Male | Female |
| Production | 14 (21.2%) | 52 (78.8%) |
| Transportation | 77 (100.0%) | 0 (0.0%) |
| Material Moving | 71 (53.4%) | 62 (46.6%) |
| Total (Category) | 162 (58.7%) | 114 (41.3%) |
| Total (Overall) | 1,006 (58.0%) | 730 (42.0%) |
Employment Industries by Sex in Watergate
Employment Industries in Watergate
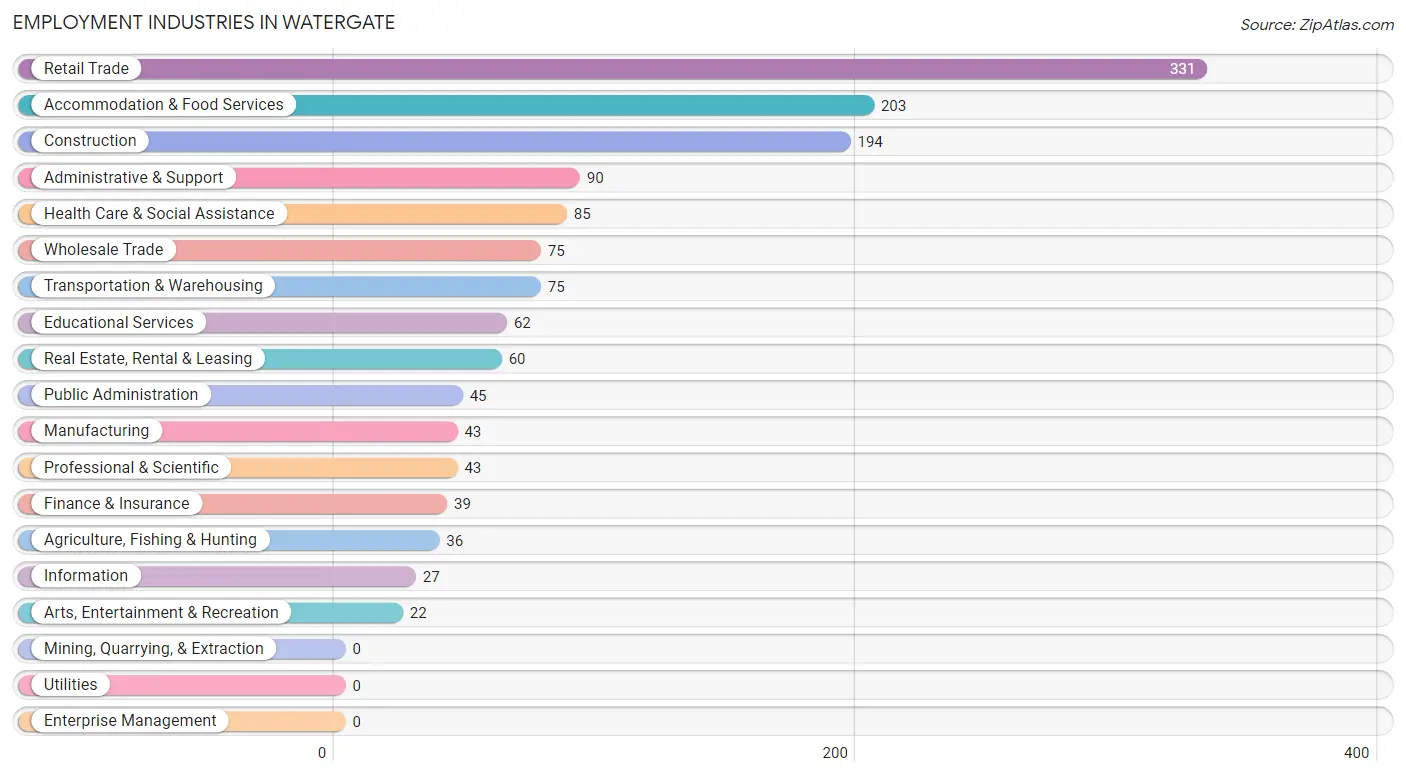
The major employment industries in Watergate include Retail Trade (331 | 19.1%), Accommodation & Food Services (203 | 11.7%), Construction (194 | 11.2%), Administrative & Support (90 | 5.2%), and Health Care & Social Assistance (85 | 4.9%).
Employment Industries by Sex in Watergate
The Watergate industries that see more men than women are Agriculture, Fishing & Hunting (100.0%), Transportation & Warehousing (100.0%), and Real Estate, Rental & Leasing (100.0%), whereas the industries that tend to have a higher number of women are Finance & Insurance (100.0%), Health Care & Social Assistance (100.0%), and Administrative & Support (83.3%).
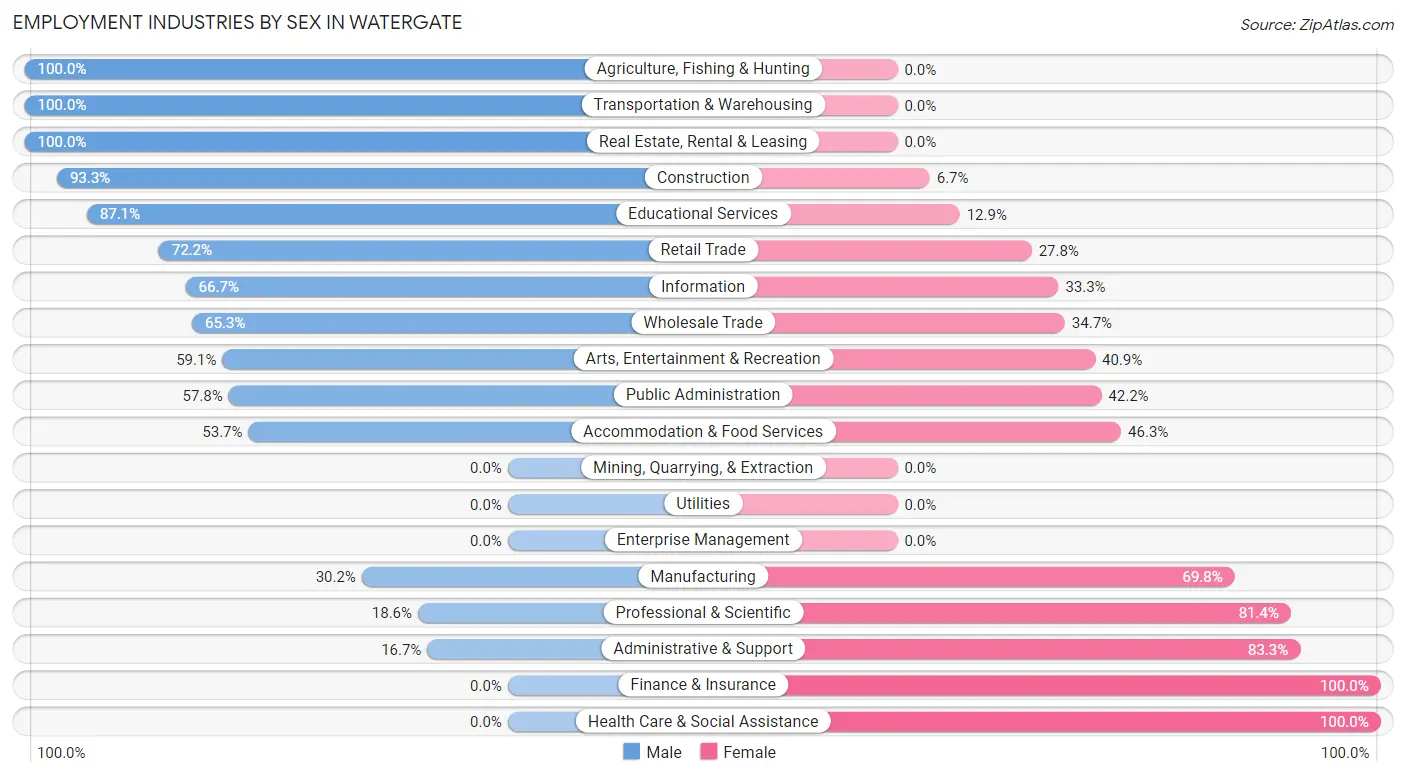
| Industry | Male | Female |
| Agriculture, Fishing & Hunting | 36 (100.0%) | 0 (0.0%) |
| Mining, Quarrying, & Extraction | 0 (0.0%) | 0 (0.0%) |
| Construction | 181 (93.3%) | 13 (6.7%) |
| Manufacturing | 13 (30.2%) | 30 (69.8%) |
| Wholesale Trade | 49 (65.3%) | 26 (34.7%) |
| Retail Trade | 239 (72.2%) | 92 (27.8%) |
| Transportation & Warehousing | 75 (100.0%) | 0 (0.0%) |
| Utilities | 0 (0.0%) | 0 (0.0%) |
| Information | 18 (66.7%) | 9 (33.3%) |
| Finance & Insurance | 0 (0.0%) | 39 (100.0%) |
| Real Estate, Rental & Leasing | 60 (100.0%) | 0 (0.0%) |
| Professional & Scientific | 8 (18.6%) | 35 (81.4%) |
| Enterprise Management | 0 (0.0%) | 0 (0.0%) |
| Administrative & Support | 15 (16.7%) | 75 (83.3%) |
| Educational Services | 54 (87.1%) | 8 (12.9%) |
| Health Care & Social Assistance | 0 (0.0%) | 85 (100.0%) |
| Arts, Entertainment & Recreation | 13 (59.1%) | 9 (40.9%) |
| Accommodation & Food Services | 109 (53.7%) | 94 (46.3%) |
| Public Administration | 26 (57.8%) | 19 (42.2%) |
| Total | 1,006 (58.0%) | 730 (42.0%) |
Education in Watergate
School Enrollment in Watergate
The most common levels of schooling among the 538 students in Watergate are high school (167 | 31.0%), elementary school (164 | 30.5%), and college / undergraduate (56 | 10.4%).
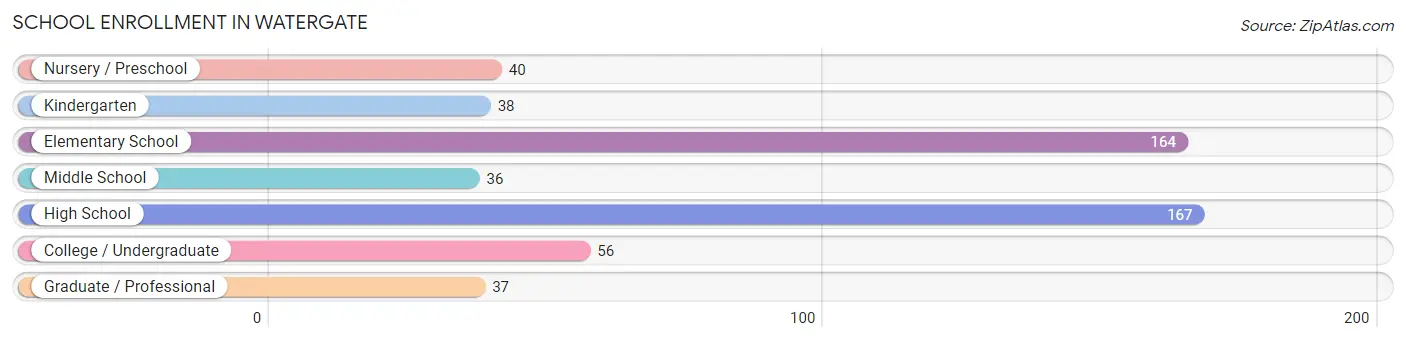
| School Level | # Students | % Students |
| Nursery / Preschool | 40 | 7.4% |
| Kindergarten | 38 | 7.1% |
| Elementary School | 164 | 30.5% |
| Middle School | 36 | 6.7% |
| High School | 167 | 31.0% |
| College / Undergraduate | 56 | 10.4% |
| Graduate / Professional | 37 | 6.9% |
| Total | 538 | 100.0% |
School Enrollment by Age by Funding Source in Watergate
Out of a total of 538 students who are enrolled in schools in Watergate, 104 (19.3%) attend a private institution, while the remaining 434 (80.7%) are enrolled in public schools. The age group of 25 to 34 year olds has the highest likelihood of being enrolled in private schools, with 10 (100.0% in the age bracket) enrolled. Conversely, the age group of 5 to 9 year old has the lowest likelihood of being enrolled in a private school, with 202 (100.0% in the age bracket) attending a public institution.
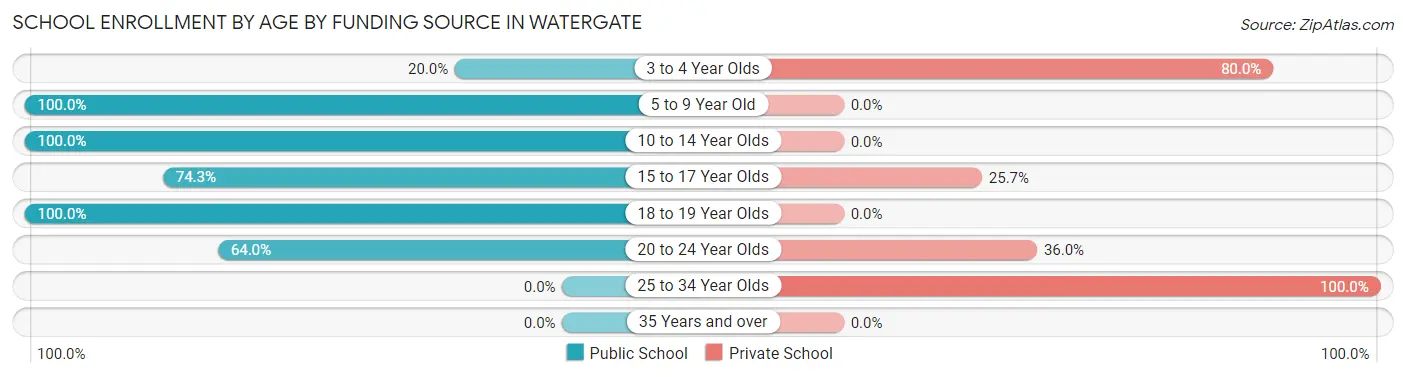
| Age Bracket | Public School | Private School |
| 3 to 4 Year Olds | 8 (20.0%) | 32 (80.0%) |
| 5 to 9 Year Old | 202 (100.0%) | 0 (0.0%) |
| 10 to 14 Year Olds | 36 (100.0%) | 0 (0.0%) |
| 15 to 17 Year Olds | 101 (74.3%) | 35 (25.7%) |
| 18 to 19 Year Olds | 39 (100.0%) | 0 (0.0%) |
| 20 to 24 Year Olds | 48 (64.0%) | 27 (36.0%) |
| 25 to 34 Year Olds | 0 (0.0%) | 10 (100.0%) |
| 35 Years and over | 0 (0.0%) | 0 (0.0%) |
| Total | 434 (80.7%) | 104 (19.3%) |
Educational Attainment by Field of Study in Watergate
Science & technology (134 | 35.1%), business (95 | 24.9%), education (47 | 12.3%), engineering (34 | 8.9%), and physical & health sciences (19 | 5.0%) are the most common fields of study among 382 individuals in Watergate who have obtained a bachelor's degree or higher.
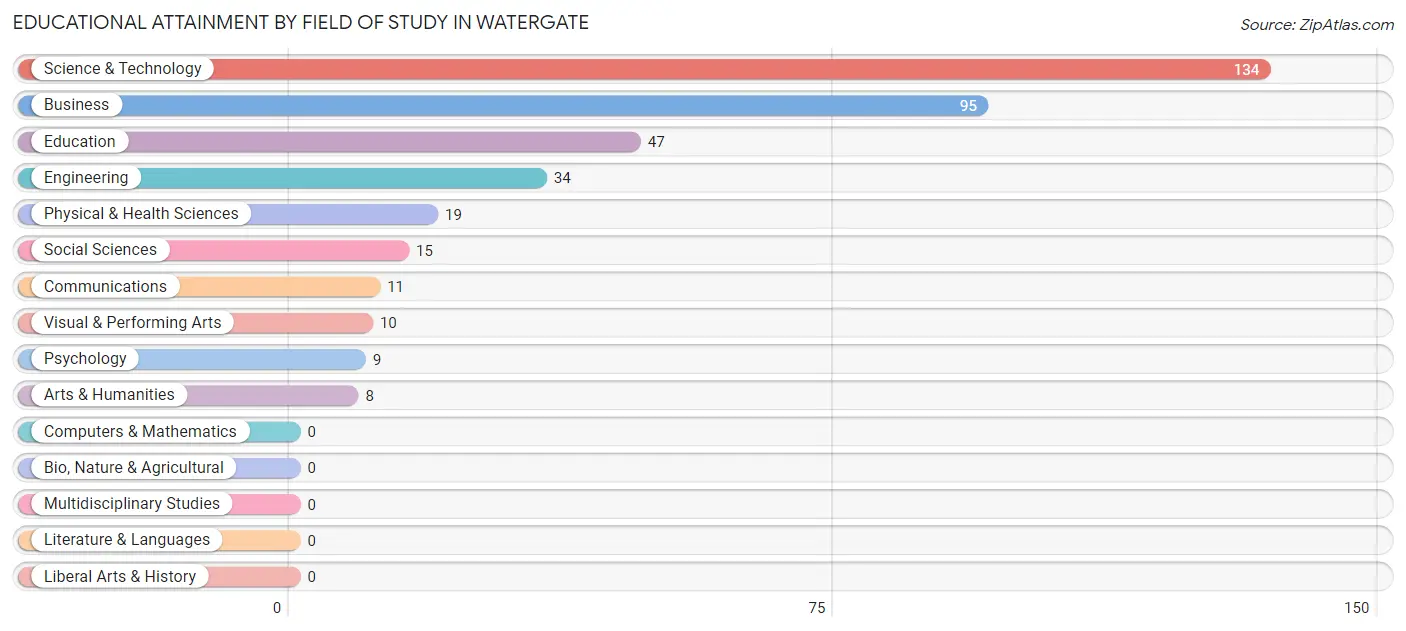
| Field of Study | # Graduates | % Graduates |
| Computers & Mathematics | 0 | 0.0% |
| Bio, Nature & Agricultural | 0 | 0.0% |
| Physical & Health Sciences | 19 | 5.0% |
| Psychology | 9 | 2.4% |
| Social Sciences | 15 | 3.9% |
| Engineering | 34 | 8.9% |
| Multidisciplinary Studies | 0 | 0.0% |
| Science & Technology | 134 | 35.1% |
| Business | 95 | 24.9% |
| Education | 47 | 12.3% |
| Literature & Languages | 0 | 0.0% |
| Liberal Arts & History | 0 | 0.0% |
| Visual & Performing Arts | 10 | 2.6% |
| Communications | 11 | 2.9% |
| Arts & Humanities | 8 | 2.1% |
| Total | 382 | 100.0% |
Transportation & Commute in Watergate
Vehicle Availability by Sex in Watergate
The most prevalent vehicle ownership categories in Watergate are males with 3 vehicles (315, accounting for 32.0%) and females with 3 vehicles (142, making up 43.1%).
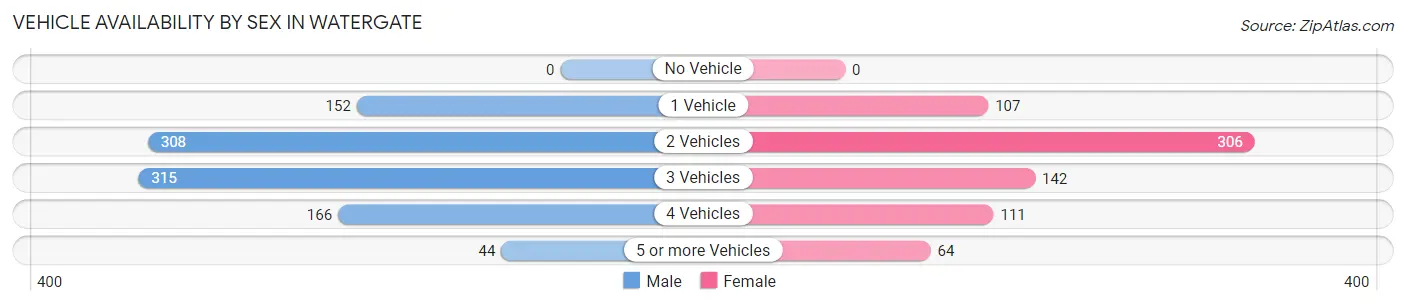
| Vehicles Available | Male | Female |
| No Vehicle | 0 (0.0%) | 0 (0.0%) |
| 1 Vehicle | 152 (15.4%) | 107 (14.7%) |
| 2 Vehicles | 308 (31.3%) | 306 (41.9%) |
| 3 Vehicles | 315 (32.0%) | 142 (19.5%) |
| 4 Vehicles | 166 (16.9%) | 111 (15.2%) |
| 5 or more Vehicles | 44 (4.5%) | 64 (8.8%) |
| Total | 985 (100.0%) | 730 (100.0%) |
Commute Time in Watergate
The most frequently occuring commute durations in Watergate are 15 to 19 minutes (316 commuters, 19.2%), 25 to 29 minutes (287 commuters, 17.5%), and 30 to 34 minutes (257 commuters, 15.6%).
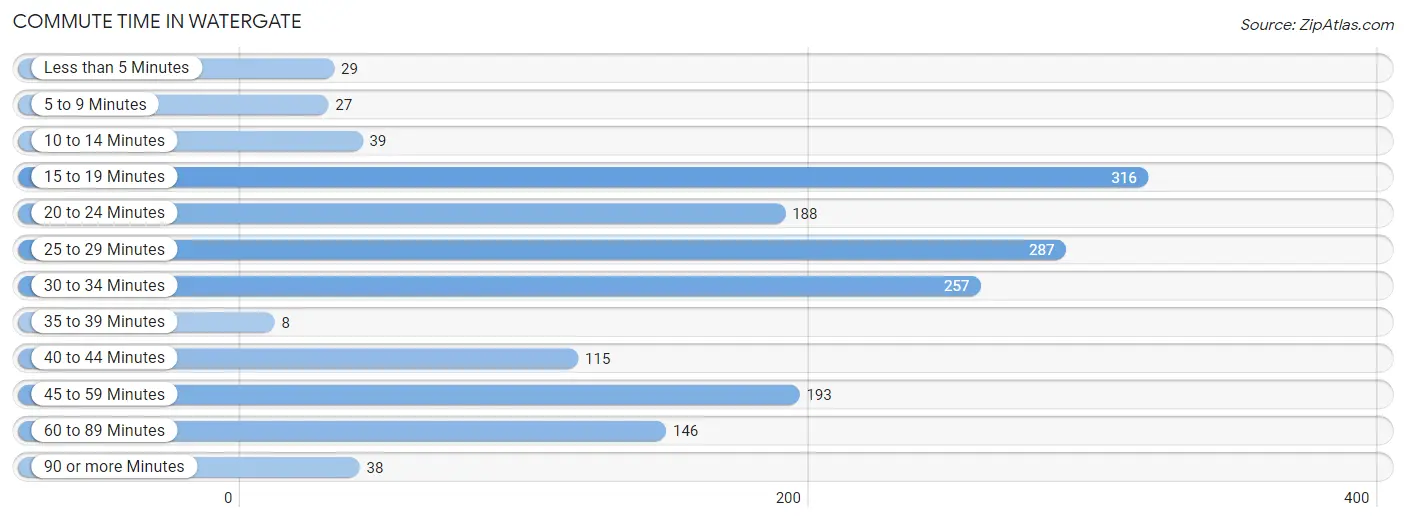
| Commute Time | # Commuters | % Commuters |
| Less than 5 Minutes | 29 | 1.8% |
| 5 to 9 Minutes | 27 | 1.6% |
| 10 to 14 Minutes | 39 | 2.4% |
| 15 to 19 Minutes | 316 | 19.2% |
| 20 to 24 Minutes | 188 | 11.4% |
| 25 to 29 Minutes | 287 | 17.5% |
| 30 to 34 Minutes | 257 | 15.6% |
| 35 to 39 Minutes | 8 | 0.5% |
| 40 to 44 Minutes | 115 | 7.0% |
| 45 to 59 Minutes | 193 | 11.7% |
| 60 to 89 Minutes | 146 | 8.9% |
| 90 or more Minutes | 38 | 2.3% |
Commute Time by Sex in Watergate
The most common commute times in Watergate are 30 to 34 minutes (195 commuters, 20.6%) for males and 15 to 19 minutes (204 commuters, 29.3%) for females.
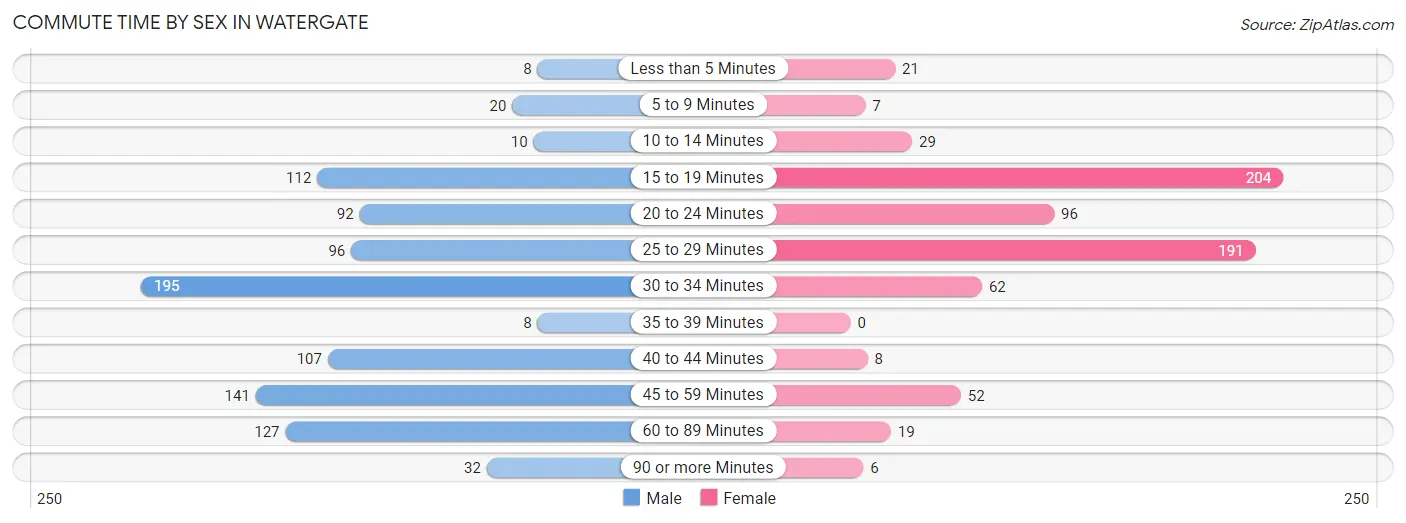
| Commute Time | Male | Female |
| Less than 5 Minutes | 8 (0.8%) | 21 (3.0%) |
| 5 to 9 Minutes | 20 (2.1%) | 7 (1.0%) |
| 10 to 14 Minutes | 10 (1.1%) | 29 (4.2%) |
| 15 to 19 Minutes | 112 (11.8%) | 204 (29.3%) |
| 20 to 24 Minutes | 92 (9.7%) | 96 (13.8%) |
| 25 to 29 Minutes | 96 (10.1%) | 191 (27.5%) |
| 30 to 34 Minutes | 195 (20.6%) | 62 (8.9%) |
| 35 to 39 Minutes | 8 (0.8%) | 0 (0.0%) |
| 40 to 44 Minutes | 107 (11.3%) | 8 (1.1%) |
| 45 to 59 Minutes | 141 (14.9%) | 52 (7.5%) |
| 60 to 89 Minutes | 127 (13.4%) | 19 (2.7%) |
| 90 or more Minutes | 32 (3.4%) | 6 (0.9%) |
Time of Departure to Work by Sex in Watergate
The most frequent times of departure to work in Watergate are 6:00 AM to 6:29 AM (213, 22.5%) for males and 10:00 AM to 10:59 AM (171, 24.6%) for females.
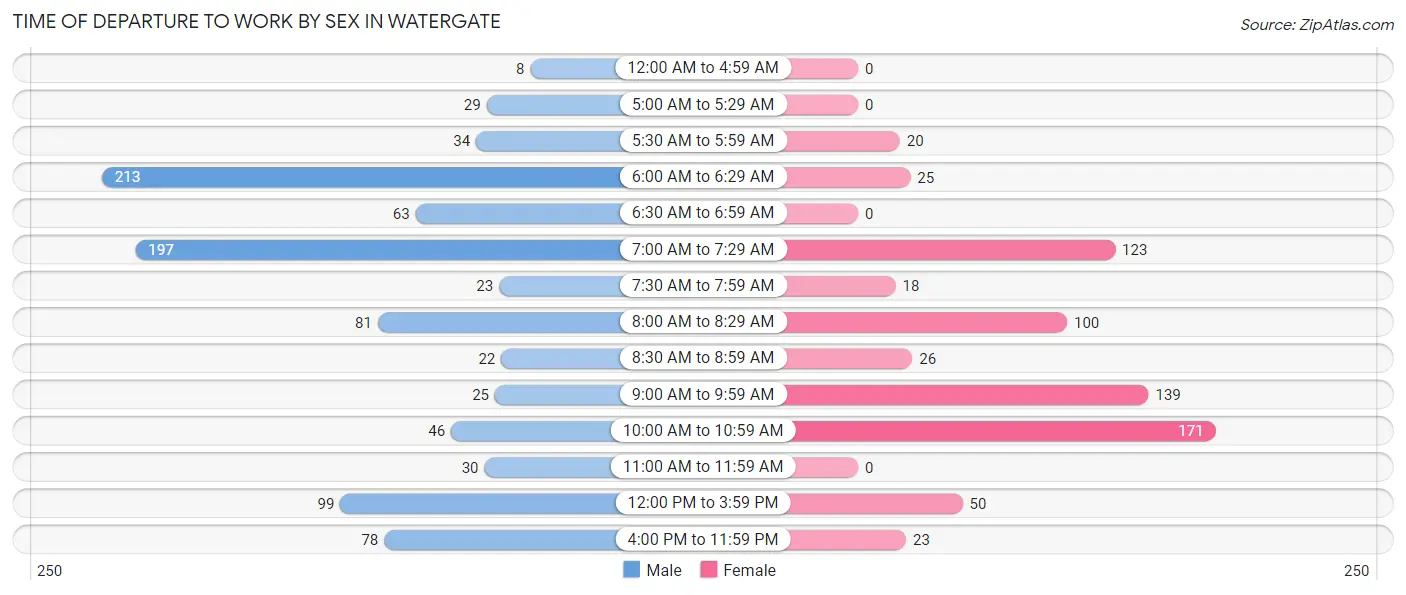
| Time of Departure | Male | Female |
| 12:00 AM to 4:59 AM | 8 (0.8%) | 0 (0.0%) |
| 5:00 AM to 5:29 AM | 29 (3.1%) | 0 (0.0%) |
| 5:30 AM to 5:59 AM | 34 (3.6%) | 20 (2.9%) |
| 6:00 AM to 6:29 AM | 213 (22.5%) | 25 (3.6%) |
| 6:30 AM to 6:59 AM | 63 (6.7%) | 0 (0.0%) |
| 7:00 AM to 7:29 AM | 197 (20.8%) | 123 (17.7%) |
| 7:30 AM to 7:59 AM | 23 (2.4%) | 18 (2.6%) |
| 8:00 AM to 8:29 AM | 81 (8.5%) | 100 (14.4%) |
| 8:30 AM to 8:59 AM | 22 (2.3%) | 26 (3.7%) |
| 9:00 AM to 9:59 AM | 25 (2.6%) | 139 (20.0%) |
| 10:00 AM to 10:59 AM | 46 (4.9%) | 171 (24.6%) |
| 11:00 AM to 11:59 AM | 30 (3.2%) | 0 (0.0%) |
| 12:00 PM to 3:59 PM | 99 (10.4%) | 50 (7.2%) |
| 4:00 PM to 11:59 PM | 78 (8.2%) | 23 (3.3%) |
| Total | 948 (100.0%) | 695 (100.0%) |
Housing Occupancy in Watergate
Occupancy by Ownership in Watergate
Of the total 1,285 dwellings in Watergate, owner-occupied units account for 777 (60.5%), while renter-occupied units make up 508 (39.5%).
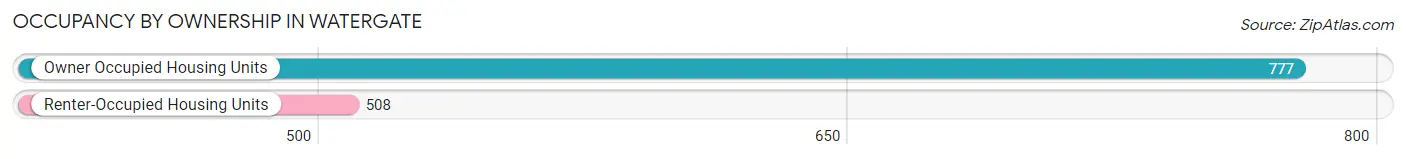
| Occupancy | # Housing Units | % Housing Units |
| Owner Occupied Housing Units | 777 | 60.5% |
| Renter-Occupied Housing Units | 508 | 39.5% |
| Total Occupied Housing Units | 1,285 | 100.0% |
Occupancy by Household Size in Watergate
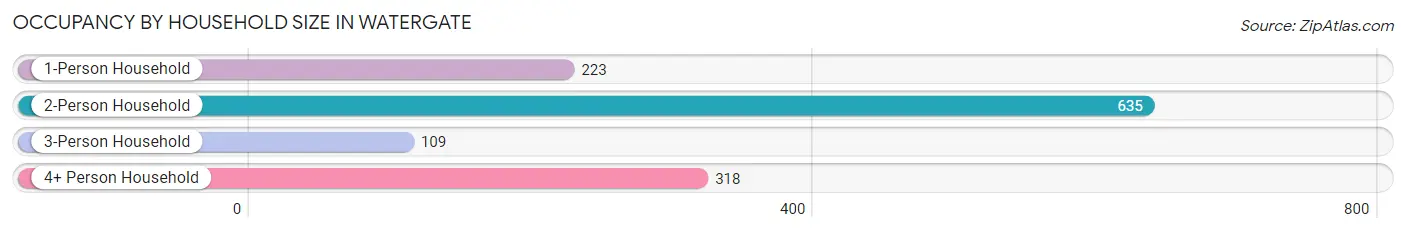
| Household Size | # Housing Units | % Housing Units |
| 1-Person Household | 223 | 17.3% |
| 2-Person Household | 635 | 49.4% |
| 3-Person Household | 109 | 8.5% |
| 4+ Person Household | 318 | 24.7% |
| Total Housing Units | 1,285 | 100.0% |
Occupancy by Ownership by Household Size in Watergate
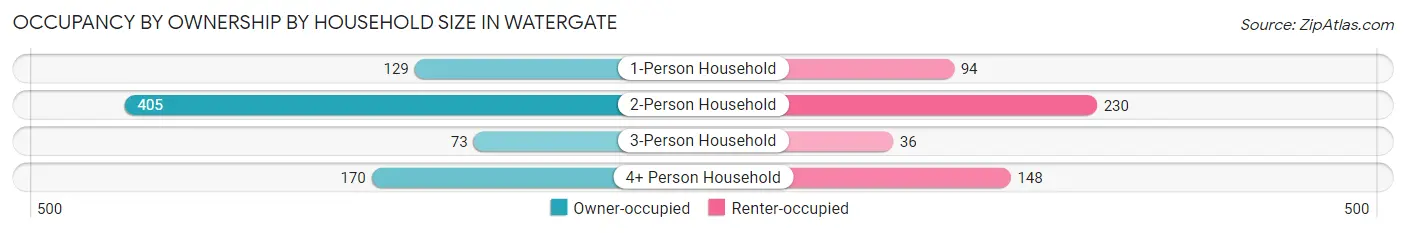
| Household Size | Owner-occupied | Renter-occupied |
| 1-Person Household | 129 (57.9%) | 94 (42.1%) |
| 2-Person Household | 405 (63.8%) | 230 (36.2%) |
| 3-Person Household | 73 (67.0%) | 36 (33.0%) |
| 4+ Person Household | 170 (53.5%) | 148 (46.5%) |
| Total Housing Units | 777 (60.5%) | 508 (39.5%) |
Occupancy by Educational Attainment in Watergate
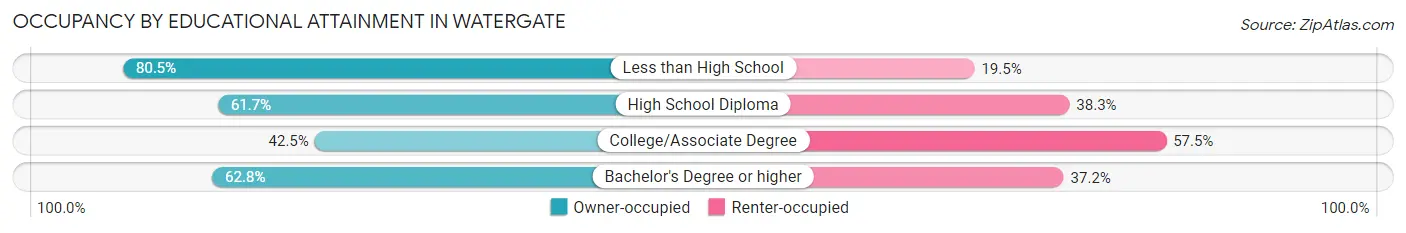
| Household Size | Owner-occupied | Renter-occupied |
| Less than High School | 157 (80.5%) | 38 (19.5%) |
| High School Diploma | 430 (61.7%) | 267 (38.3%) |
| College/Associate Degree | 119 (42.5%) | 161 (57.5%) |
| Bachelor's Degree or higher | 71 (62.8%) | 42 (37.2%) |
Occupancy by Age of Householder in Watergate
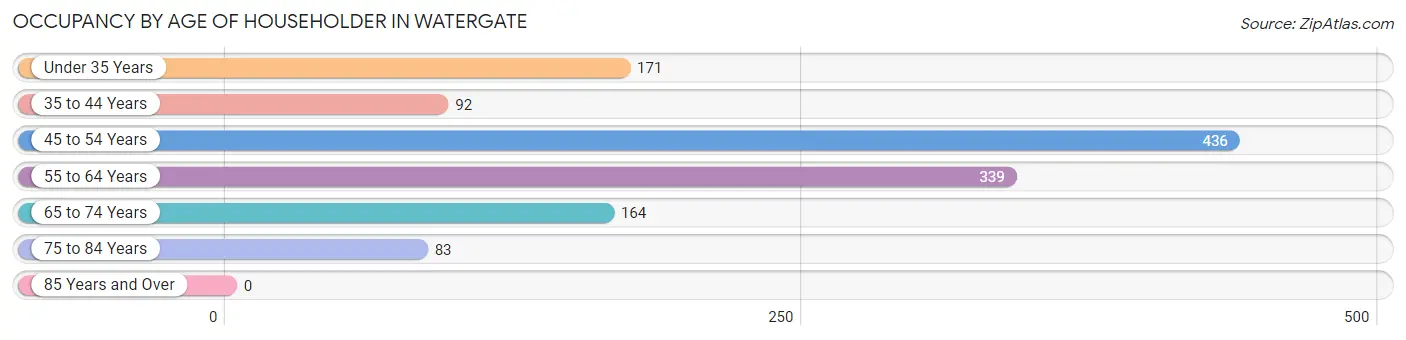
| Age Bracket | # Households | % Households |
| Under 35 Years | 171 | 13.3% |
| 35 to 44 Years | 92 | 7.2% |
| 45 to 54 Years | 436 | 33.9% |
| 55 to 64 Years | 339 | 26.4% |
| 65 to 74 Years | 164 | 12.8% |
| 75 to 84 Years | 83 | 6.5% |
| 85 Years and Over | 0 | 0.0% |
| Total | 1,285 | 100.0% |
Housing Finances in Watergate
Median Income by Occupancy in Watergate
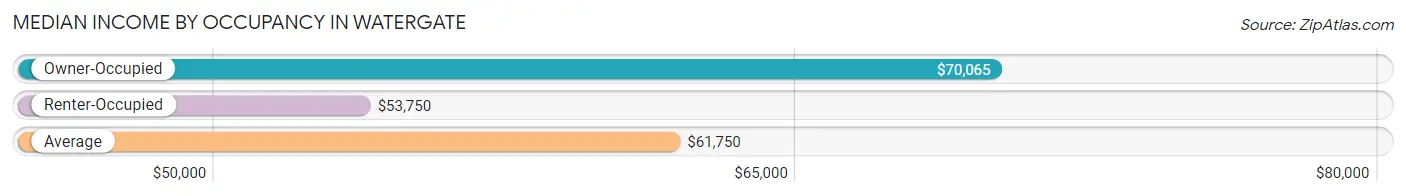
| Occupancy Type | # Households | Median Income |
| Owner-Occupied | 777 (60.5%) | $70,065 |
| Renter-Occupied | 508 (39.5%) | $53,750 |
| Average | 1,285 (100.0%) | $61,750 |
Occupancy by Householder Income Bracket in Watergate
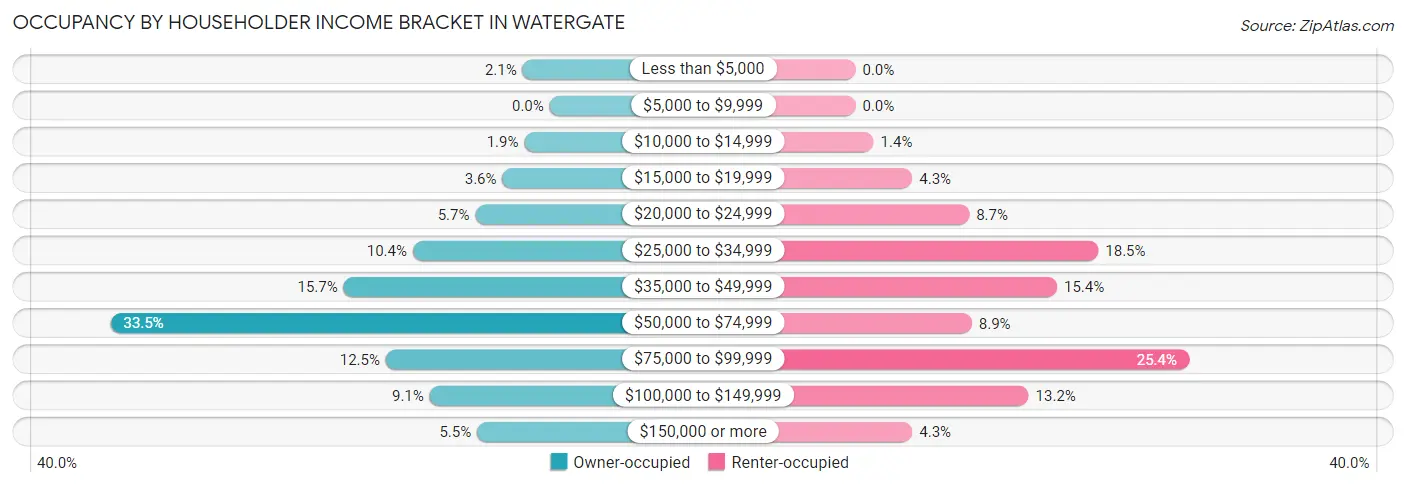
| Income Bracket | Owner-occupied | Renter-occupied |
| Less than $5,000 | 16 (2.1%) | 0 (0.0%) |
| $5,000 to $9,999 | 0 (0.0%) | 0 (0.0%) |
| $10,000 to $14,999 | 15 (1.9%) | 7 (1.4%) |
| $15,000 to $19,999 | 28 (3.6%) | 22 (4.3%) |
| $20,000 to $24,999 | 44 (5.7%) | 44 (8.7%) |
| $25,000 to $34,999 | 81 (10.4%) | 94 (18.5%) |
| $35,000 to $49,999 | 122 (15.7%) | 78 (15.3%) |
| $50,000 to $74,999 | 260 (33.5%) | 45 (8.9%) |
| $75,000 to $99,999 | 97 (12.5%) | 129 (25.4%) |
| $100,000 to $149,999 | 71 (9.1%) | 67 (13.2%) |
| $150,000 or more | 43 (5.5%) | 22 (4.3%) |
| Total | 777 (100.0%) | 508 (100.0%) |
Monthly Housing Cost Tiers in Watergate
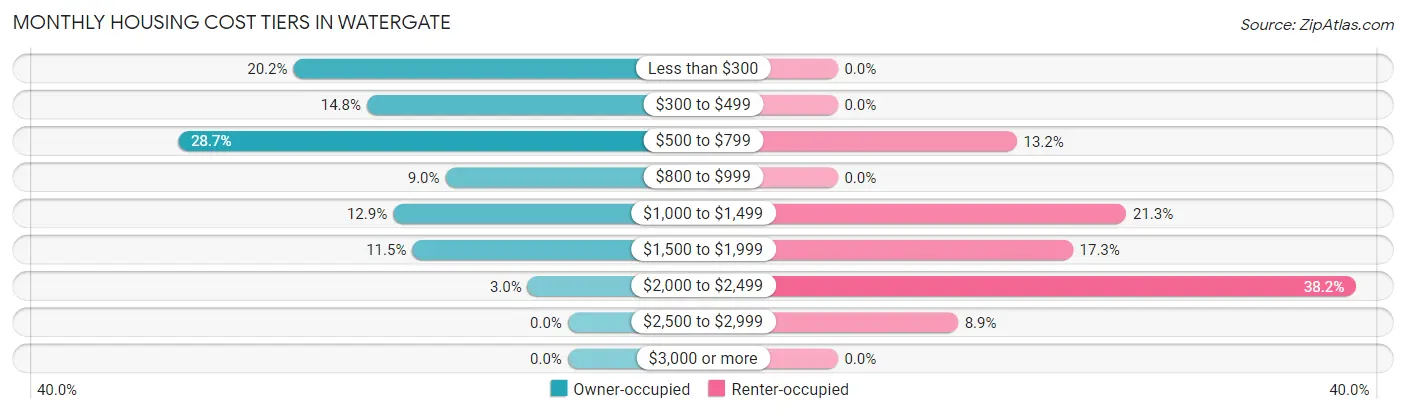
| Monthly Cost | Owner-occupied | Renter-occupied |
| Less than $300 | 157 (20.2%) | 0 (0.0%) |
| $300 to $499 | 115 (14.8%) | 0 (0.0%) |
| $500 to $799 | 223 (28.7%) | 67 (13.2%) |
| $800 to $999 | 70 (9.0%) | 0 (0.0%) |
| $1,000 to $1,499 | 100 (12.9%) | 108 (21.3%) |
| $1,500 to $1,999 | 89 (11.5%) | 88 (17.3%) |
| $2,000 to $2,499 | 23 (3.0%) | 194 (38.2%) |
| $2,500 to $2,999 | 0 (0.0%) | 45 (8.9%) |
| $3,000 or more | 0 (0.0%) | 0 (0.0%) |
| Total | 777 (100.0%) | 508 (100.0%) |
Physical Housing Characteristics in Watergate
Housing Structures in Watergate
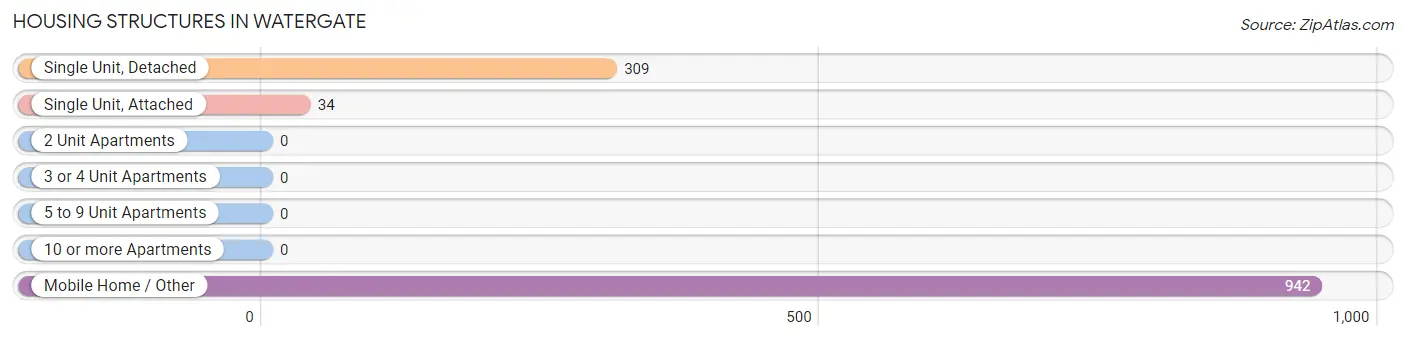
| Structure Type | # Housing Units | % Housing Units |
| Single Unit, Detached | 309 | 24.0% |
| Single Unit, Attached | 34 | 2.6% |
| 2 Unit Apartments | 0 | 0.0% |
| 3 or 4 Unit Apartments | 0 | 0.0% |
| 5 to 9 Unit Apartments | 0 | 0.0% |
| 10 or more Apartments | 0 | 0.0% |
| Mobile Home / Other | 942 | 73.3% |
| Total | 1,285 | 100.0% |
Housing Structures by Occupancy in Watergate
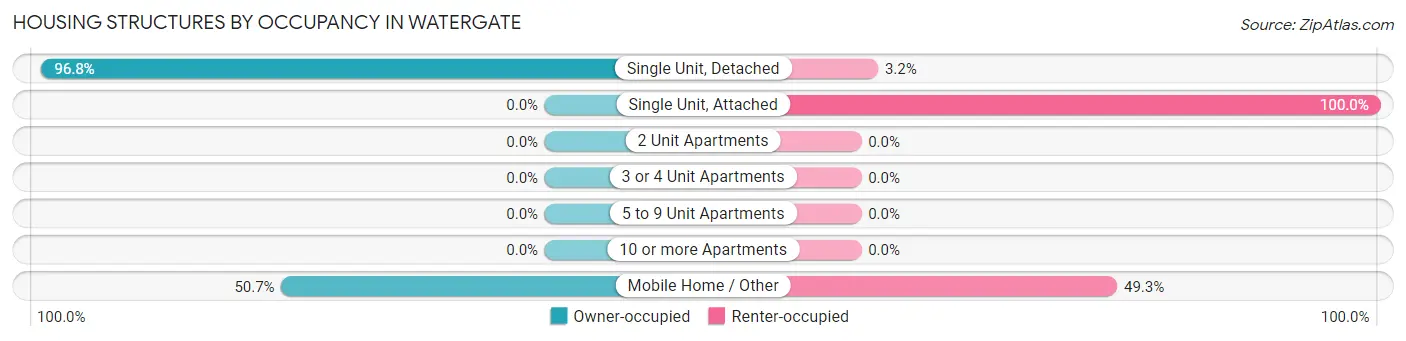
| Structure Type | Owner-occupied | Renter-occupied |
| Single Unit, Detached | 299 (96.8%) | 10 (3.2%) |
| Single Unit, Attached | 0 (0.0%) | 34 (100.0%) |
| 2 Unit Apartments | 0 (0.0%) | 0 (0.0%) |
| 3 or 4 Unit Apartments | 0 (0.0%) | 0 (0.0%) |
| 5 to 9 Unit Apartments | 0 (0.0%) | 0 (0.0%) |
| 10 or more Apartments | 0 (0.0%) | 0 (0.0%) |
| Mobile Home / Other | 478 (50.7%) | 464 (49.3%) |
| Total | 777 (60.5%) | 508 (39.5%) |
Housing Structures by Number of Rooms in Watergate
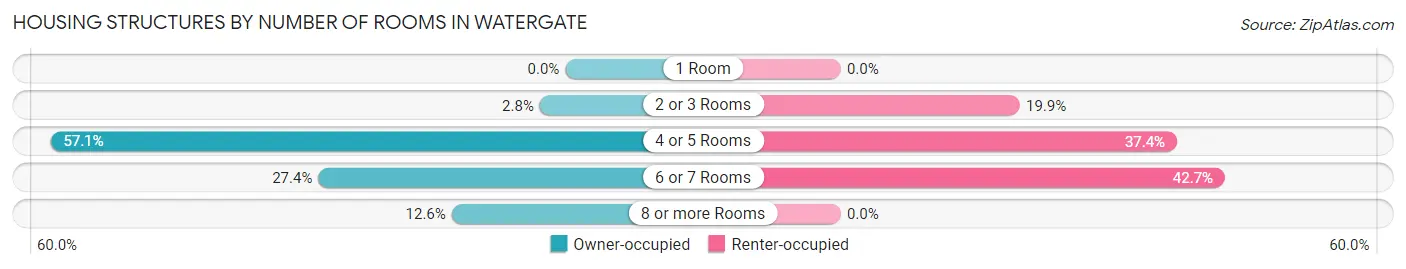
| Number of Rooms | Owner-occupied | Renter-occupied |
| 1 Room | 0 (0.0%) | 0 (0.0%) |
| 2 or 3 Rooms | 22 (2.8%) | 101 (19.9%) |
| 4 or 5 Rooms | 444 (57.1%) | 190 (37.4%) |
| 6 or 7 Rooms | 213 (27.4%) | 217 (42.7%) |
| 8 or more Rooms | 98 (12.6%) | 0 (0.0%) |
| Total | 777 (100.0%) | 508 (100.0%) |
Housing Structure by Heating Type in Watergate
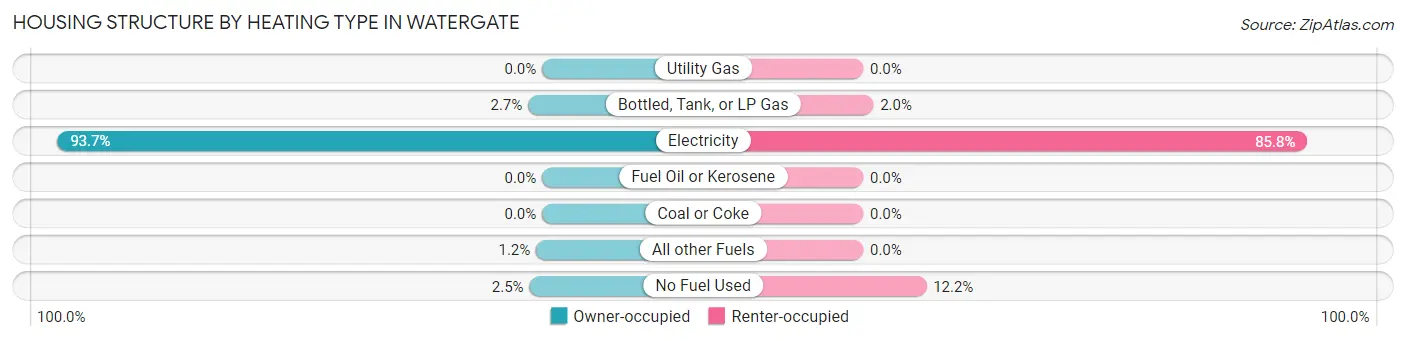
| Heating Type | Owner-occupied | Renter-occupied |
| Utility Gas | 0 (0.0%) | 0 (0.0%) |
| Bottled, Tank, or LP Gas | 21 (2.7%) | 10 (2.0%) |
| Electricity | 728 (93.7%) | 436 (85.8%) |
| Fuel Oil or Kerosene | 0 (0.0%) | 0 (0.0%) |
| Coal or Coke | 0 (0.0%) | 0 (0.0%) |
| All other Fuels | 9 (1.2%) | 0 (0.0%) |
| No Fuel Used | 19 (2.5%) | 62 (12.2%) |
| Total | 777 (100.0%) | 508 (100.0%) |
Household Vehicle Usage in Watergate
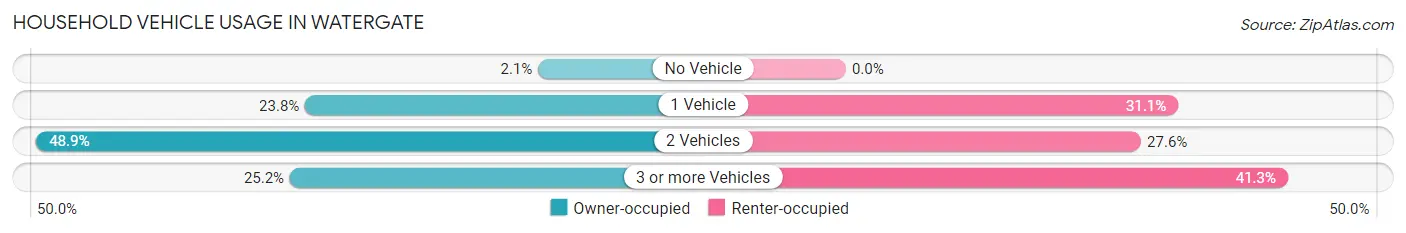
| Vehicles per Household | Owner-occupied | Renter-occupied |
| No Vehicle | 16 (2.1%) | 0 (0.0%) |
| 1 Vehicle | 185 (23.8%) | 158 (31.1%) |
| 2 Vehicles | 380 (48.9%) | 140 (27.6%) |
| 3 or more Vehicles | 196 (25.2%) | 210 (41.3%) |
| Total | 777 (100.0%) | 508 (100.0%) |
Real Estate & Mortgages in Watergate
Real Estate and Mortgage Overview in Watergate
| Characteristic | Without Mortgage | With Mortgage |
| Housing Units | 524 | 253 |
| Median Property Value | $217,800 | $157,700 |
| Median Household Income | $70,113 | $0 |
| Monthly Housing Costs | $485 | $0 |
| Real Estate Taxes | - | - |
Property Value by Mortgage Status in Watergate
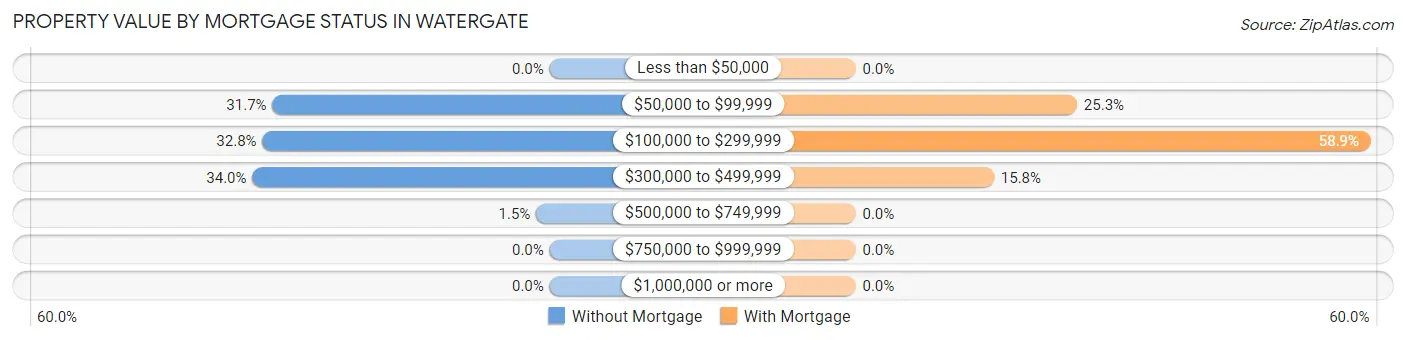
| Property Value | Without Mortgage | With Mortgage |
| Less than $50,000 | 0 (0.0%) | 0 (0.0%) |
| $50,000 to $99,999 | 166 (31.7%) | 64 (25.3%) |
| $100,000 to $299,999 | 172 (32.8%) | 149 (58.9%) |
| $300,000 to $499,999 | 178 (34.0%) | 40 (15.8%) |
| $500,000 to $749,999 | 8 (1.5%) | 0 (0.0%) |
| $750,000 to $999,999 | 0 (0.0%) | 0 (0.0%) |
| $1,000,000 or more | 0 (0.0%) | 0 (0.0%) |
| Total | 524 (100.0%) | 253 (100.0%) |
Household Income by Mortgage Status in Watergate
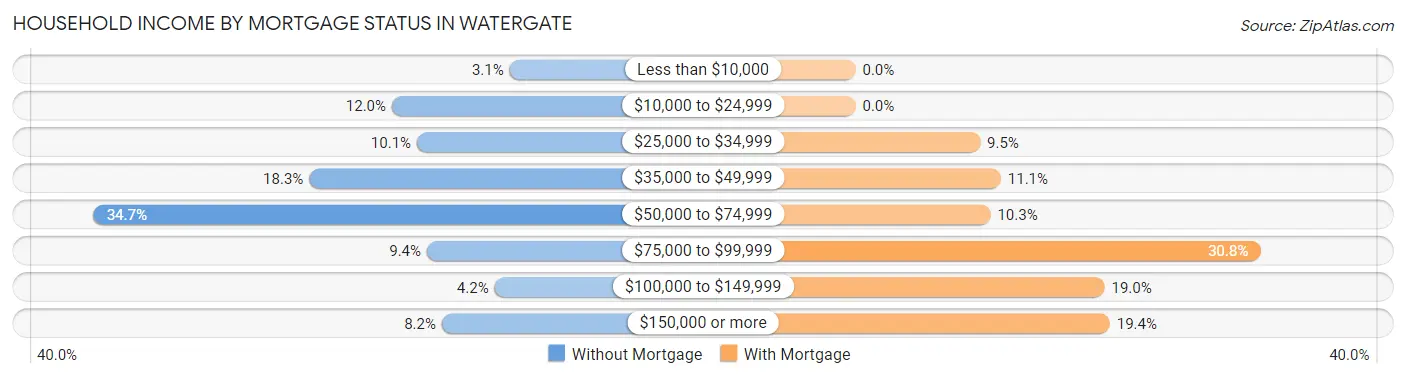
| Household Income | Without Mortgage | With Mortgage |
| Less than $10,000 | 16 (3.0%) | 0 (0.0%) |
| $10,000 to $24,999 | 63 (12.0%) | 0 (0.0%) |
| $25,000 to $34,999 | 53 (10.1%) | 24 (9.5%) |
| $35,000 to $49,999 | 96 (18.3%) | 28 (11.1%) |
| $50,000 to $74,999 | 182 (34.7%) | 26 (10.3%) |
| $75,000 to $99,999 | 49 (9.3%) | 78 (30.8%) |
| $100,000 to $149,999 | 22 (4.2%) | 48 (19.0%) |
| $150,000 or more | 43 (8.2%) | 49 (19.4%) |
| Total | 524 (100.0%) | 253 (100.0%) |
Property Value to Household Income Ratio in Watergate
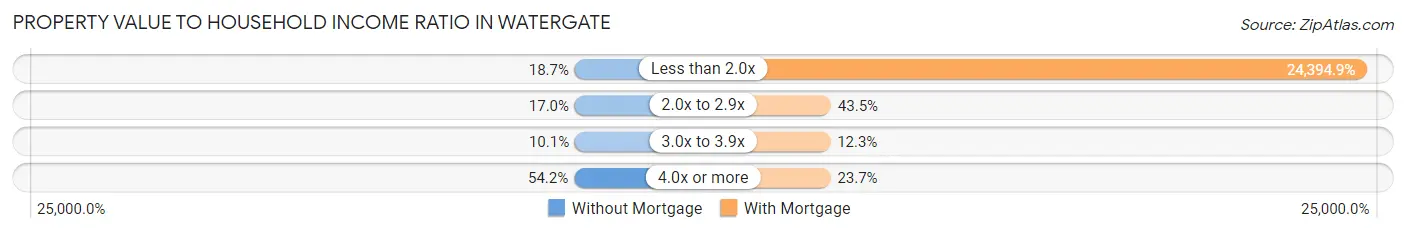
| Value-to-Income Ratio | Without Mortgage | With Mortgage |
| Less than 2.0x | 98 (18.7%) | 61,719 (24,394.9%) |
| 2.0x to 2.9x | 89 (17.0%) | 110 (43.5%) |
| 3.0x to 3.9x | 53 (10.1%) | 31 (12.2%) |
| 4.0x or more | 284 (54.2%) | 60 (23.7%) |
| Total | 524 (100.0%) | 253 (100.0%) |
Real Estate Taxes by Mortgage Status in Watergate
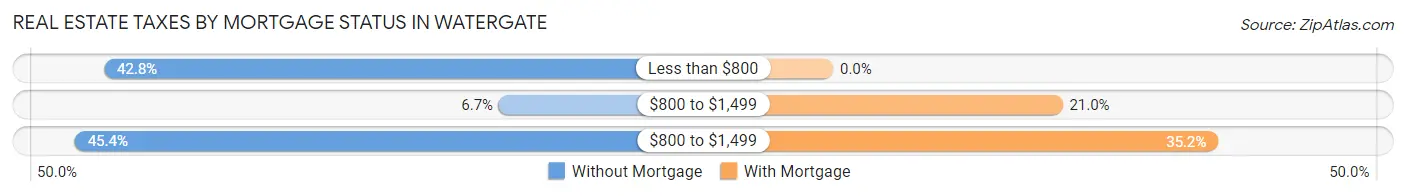
| Property Taxes | Without Mortgage | With Mortgage |
| Less than $800 | 224 (42.7%) | 0 (0.0%) |
| $800 to $1,499 | 35 (6.7%) | 53 (20.9%) |
| $800 to $1,499 | 238 (45.4%) | 89 (35.2%) |
| Total | 524 (100.0%) | 253 (100.0%) |
Health & Disability in Watergate
Health Insurance Coverage by Age in Watergate
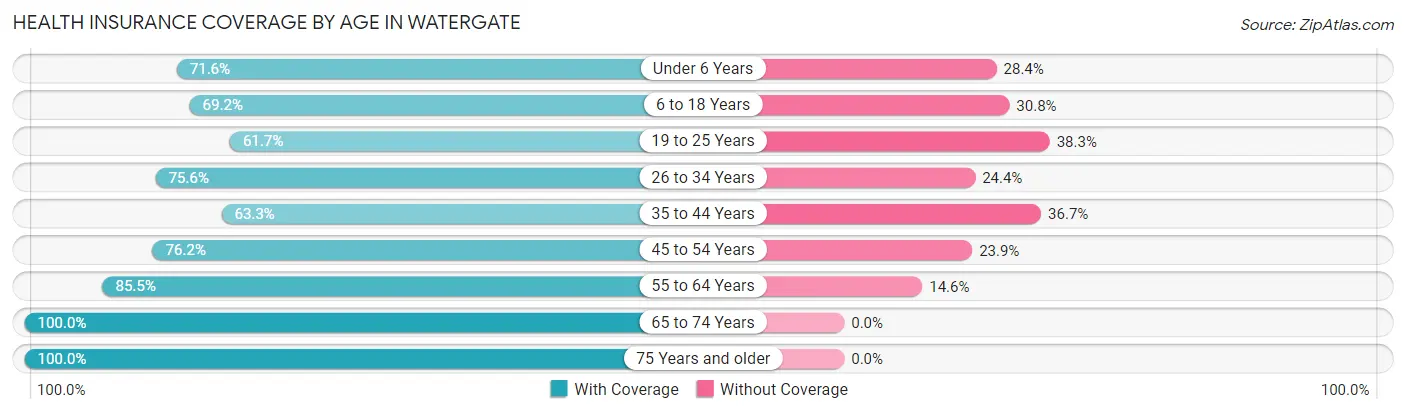
| Age Bracket | With Coverage | Without Coverage |
| Under 6 Years | 116 (71.6%) | 46 (28.4%) |
| 6 to 18 Years | 254 (69.2%) | 113 (30.8%) |
| 19 to 25 Years | 248 (61.7%) | 154 (38.3%) |
| 26 to 34 Years | 226 (75.6%) | 73 (24.4%) |
| 35 to 44 Years | 231 (63.3%) | 134 (36.7%) |
| 45 to 54 Years | 495 (76.1%) | 155 (23.8%) |
| 55 to 64 Years | 746 (85.5%) | 127 (14.5%) |
| 65 to 74 Years | 296 (100.0%) | 0 (0.0%) |
| 75 Years and older | 175 (100.0%) | 0 (0.0%) |
| Total | 2,787 (77.6%) | 802 (22.4%) |
Health Insurance Coverage by Citizenship Status in Watergate
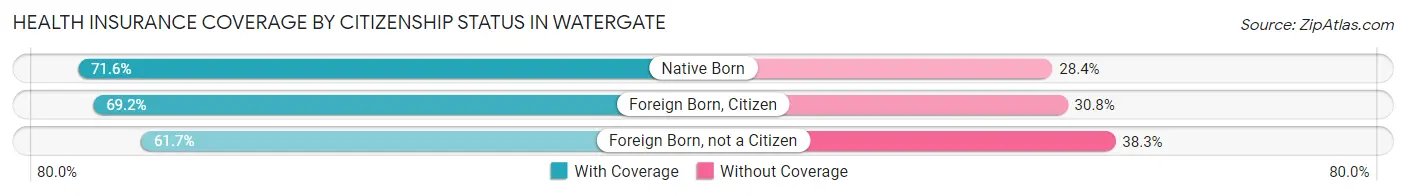
| Citizenship Status | With Coverage | Without Coverage |
| Native Born | 116 (71.6%) | 46 (28.4%) |
| Foreign Born, Citizen | 254 (69.2%) | 113 (30.8%) |
| Foreign Born, not a Citizen | 248 (61.7%) | 154 (38.3%) |
Health Insurance Coverage by Household Income in Watergate
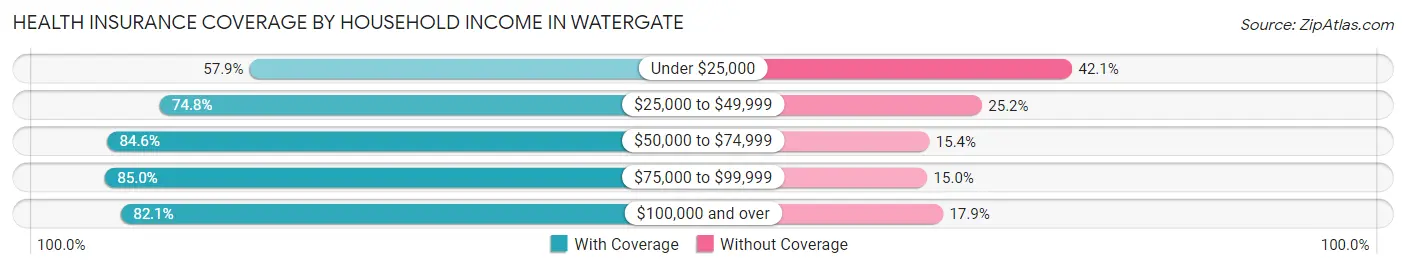
| Household Income | With Coverage | Without Coverage |
| Under $25,000 | 356 (57.9%) | 259 (42.1%) |
| $25,000 to $49,999 | 546 (74.8%) | 184 (25.2%) |
| $50,000 to $74,999 | 600 (84.6%) | 109 (15.4%) |
| $75,000 to $99,999 | 722 (85.0%) | 127 (15.0%) |
| $100,000 and over | 563 (82.1%) | 123 (17.9%) |
Public vs Private Health Insurance Coverage by Age in Watergate
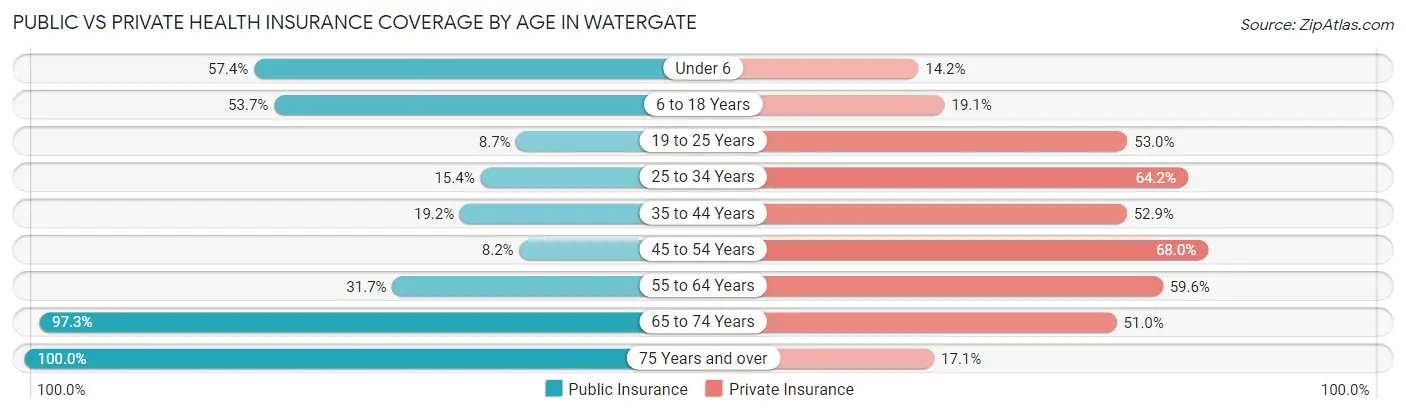
| Age Bracket | Public Insurance | Private Insurance |
| Under 6 | 93 (57.4%) | 23 (14.2%) |
| 6 to 18 Years | 197 (53.7%) | 70 (19.1%) |
| 19 to 25 Years | 35 (8.7%) | 213 (53.0%) |
| 25 to 34 Years | 46 (15.4%) | 192 (64.2%) |
| 35 to 44 Years | 70 (19.2%) | 193 (52.9%) |
| 45 to 54 Years | 53 (8.2%) | 442 (68.0%) |
| 55 to 64 Years | 277 (31.7%) | 520 (59.6%) |
| 65 to 74 Years | 288 (97.3%) | 151 (51.0%) |
| 75 Years and over | 175 (100.0%) | 30 (17.1%) |
| Total | 1,234 (34.4%) | 1,834 (51.1%) |
Disability Status by Sex by Age in Watergate
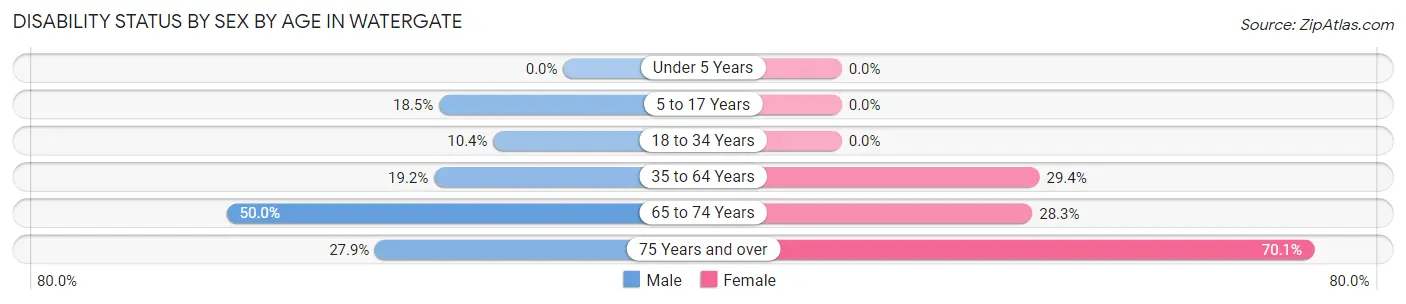
| Age Bracket | Male | Female |
| Under 5 Years | 0 (0.0%) | 0 (0.0%) |
| 5 to 17 Years | 24 (18.5%) | 0 (0.0%) |
| 18 to 34 Years | 48 (10.4%) | 0 (0.0%) |
| 35 to 64 Years | 180 (19.2%) | 279 (29.4%) |
| 65 to 74 Years | 72 (50.0%) | 43 (28.3%) |
| 75 Years and over | 19 (27.9%) | 75 (70.1%) |
Disability Class by Sex by Age in Watergate
Disability Class: Hearing Difficulty
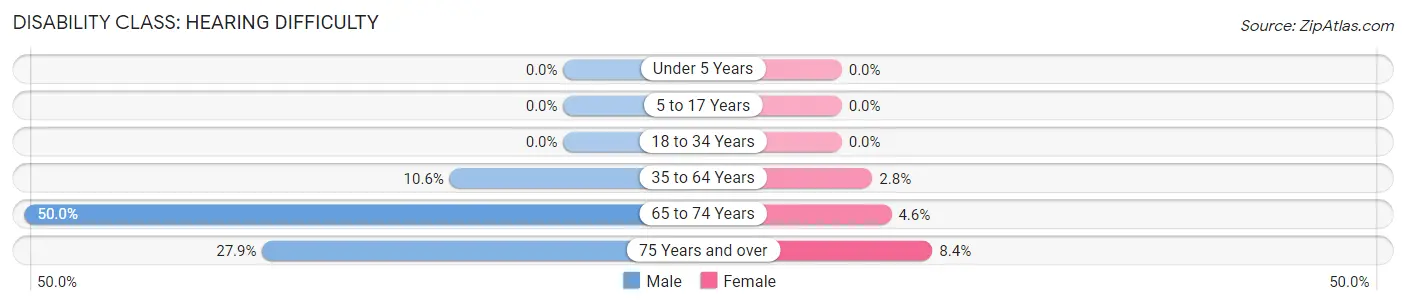
| Age Bracket | Male | Female |
| Under 5 Years | 0 (0.0%) | 0 (0.0%) |
| 5 to 17 Years | 0 (0.0%) | 0 (0.0%) |
| 18 to 34 Years | 0 (0.0%) | 0 (0.0%) |
| 35 to 64 Years | 99 (10.5%) | 27 (2.8%) |
| 65 to 74 Years | 72 (50.0%) | 7 (4.6%) |
| 75 Years and over | 19 (27.9%) | 9 (8.4%) |
Disability Class: Vision Difficulty
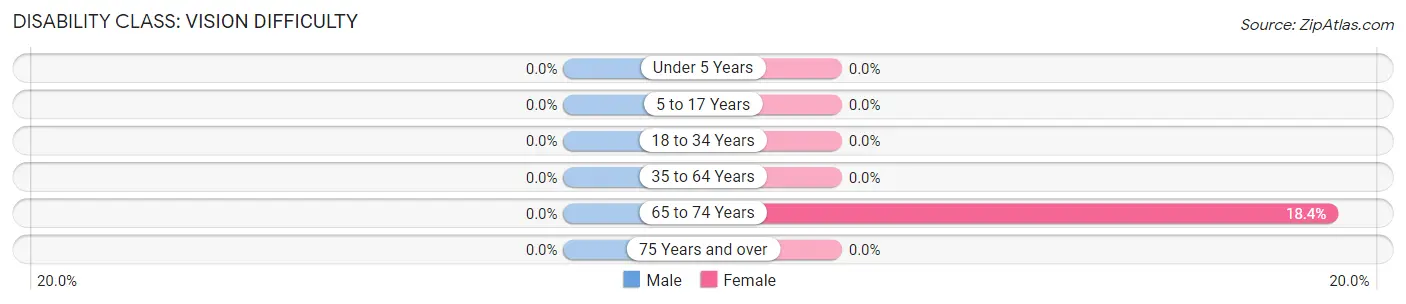
| Age Bracket | Male | Female |
| Under 5 Years | 0 (0.0%) | 0 (0.0%) |
| 5 to 17 Years | 0 (0.0%) | 0 (0.0%) |
| 18 to 34 Years | 0 (0.0%) | 0 (0.0%) |
| 35 to 64 Years | 0 (0.0%) | 0 (0.0%) |
| 65 to 74 Years | 0 (0.0%) | 28 (18.4%) |
| 75 Years and over | 0 (0.0%) | 0 (0.0%) |
Disability Class: Cognitive Difficulty
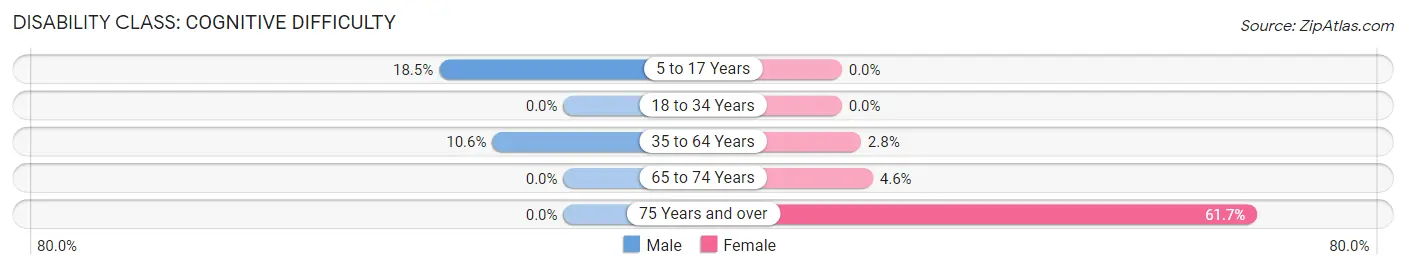
| Age Bracket | Male | Female |
| 5 to 17 Years | 24 (18.5%) | 0 (0.0%) |
| 18 to 34 Years | 0 (0.0%) | 0 (0.0%) |
| 35 to 64 Years | 99 (10.5%) | 27 (2.8%) |
| 65 to 74 Years | 0 (0.0%) | 7 (4.6%) |
| 75 Years and over | 0 (0.0%) | 66 (61.7%) |
Disability Class: Ambulatory Difficulty
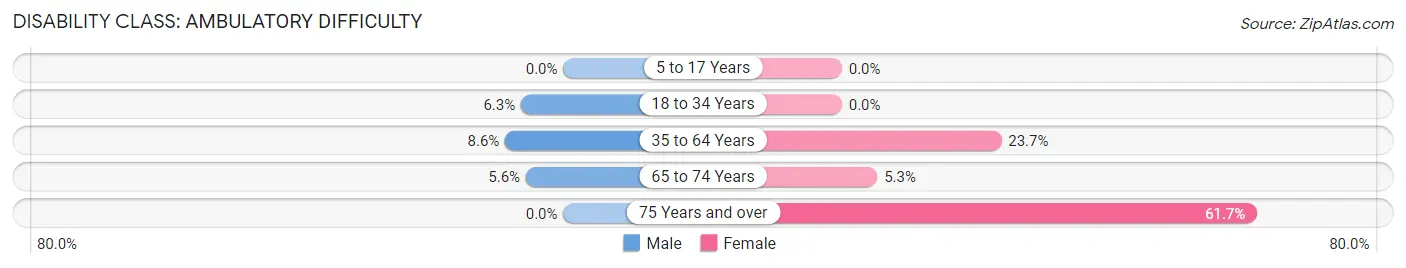
| Age Bracket | Male | Female |
| 5 to 17 Years | 0 (0.0%) | 0 (0.0%) |
| 18 to 34 Years | 29 (6.3%) | 0 (0.0%) |
| 35 to 64 Years | 81 (8.6%) | 225 (23.7%) |
| 65 to 74 Years | 8 (5.6%) | 8 (5.3%) |
| 75 Years and over | 0 (0.0%) | 66 (61.7%) |
Disability Class: Self-Care Difficulty
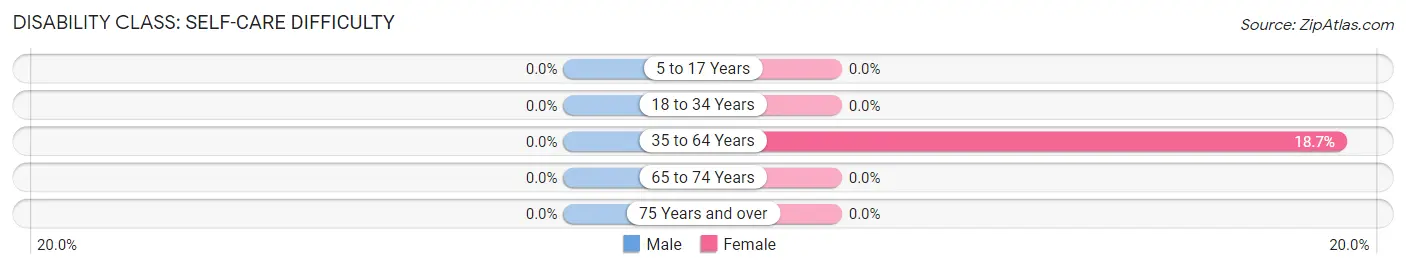
| Age Bracket | Male | Female |
| 5 to 17 Years | 0 (0.0%) | 0 (0.0%) |
| 18 to 34 Years | 0 (0.0%) | 0 (0.0%) |
| 35 to 64 Years | 0 (0.0%) | 178 (18.7%) |
| 65 to 74 Years | 0 (0.0%) | 0 (0.0%) |
| 75 Years and over | 0 (0.0%) | 0 (0.0%) |
Technology Access in Watergate
Computing Device Access in Watergate
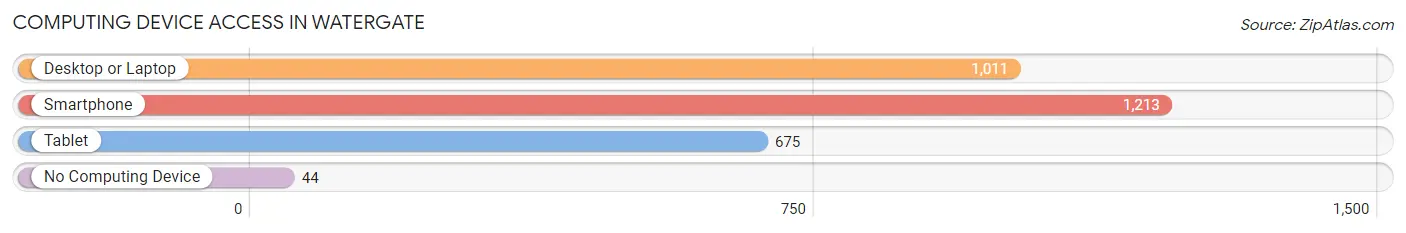
| Device Type | # Households | % Households |
| Desktop or Laptop | 1,011 | 78.7% |
| Smartphone | 1,213 | 94.4% |
| Tablet | 675 | 52.5% |
| No Computing Device | 44 | 3.4% |
| Total | 1,285 | 100.0% |
Internet Access in Watergate
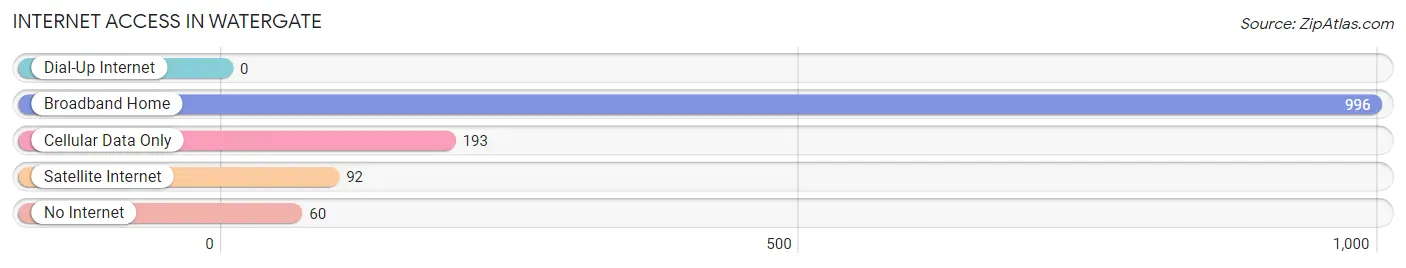
| Internet Type | # Households | % Households |
| Dial-Up Internet | 0 | 0.0% |
| Broadband Home | 996 | 77.5% |
| Cellular Data Only | 193 | 15.0% |
| Satellite Internet | 92 | 7.2% |
| No Internet | 60 | 4.7% |
| Total | 1,285 | 100.0% |
Watergate Summary
Watergate, FL is a small town located in the state of Florida, in the United States. It is situated in the northern part of the state, in the panhandle region, and is part of the Okaloosa County. The town is located on the Choctawhatchee Bay, and is bordered by the cities of Niceville and Valparaiso. The town has a population of approximately 1,000 people, and is a popular tourist destination due to its proximity to the Gulf of Mexico.
History
Watergate, FL was founded in the late 19th century by a group of settlers from the nearby town of Niceville. The town was originally known as “Watergate” due to its location on the Choctawhatchee Bay. The town was officially incorporated in 1891, and was named after the nearby bay.
The town was initially a small fishing village, and the main industry was fishing and shrimping. The town was also known for its oyster beds, which were a major source of income for the town. In the early 20th century, the town began to grow and develop, and the population increased significantly.
In the 1950s, the town began to attract tourists due to its proximity to the Gulf of Mexico. The town was also known for its beautiful beaches, and the town began to develop a reputation as a popular tourist destination. In the late 20th century, the town began to experience a population boom, and the population increased significantly.
Geography
Watergate, FL is located in the northern part of the state of Florida, in the panhandle region. The town is situated on the Choctawhatchee Bay, and is bordered by the cities of Niceville and Valparaiso. The town is located approximately 30 miles east of Pensacola, and is approximately 40 miles west of Panama City.
The town is located in a humid subtropical climate zone, and experiences hot and humid summers, and mild winters. The average temperature in the summer months is around 90 degrees Fahrenheit, and the average temperature in the winter months is around 60 degrees Fahrenheit. The town receives an average of 60 inches of rain per year.
Economy
The economy of Watergate, FL is largely based on tourism. The town is a popular tourist destination due to its proximity to the Gulf of Mexico, and its beautiful beaches. The town is also known for its seafood, and the local seafood industry is a major source of income for the town.
The town also has a number of small businesses, including restaurants, shops, and other services. The town also has a number of marinas, which are popular with tourists and locals alike.
Demographics
As of the 2010 census, the population of Watergate, FL was 1,000 people. The town has a population density of approximately 1,000 people per square mile. The town is predominantly white, with approximately 95% of the population being white. The town also has a small Hispanic population, with approximately 5% of the population being Hispanic. The median household income in the town is approximately $50,000 per year.
Common Questions
What is Per Capita Income in Watergate?
Per Capita income in Watergate is $25,330.
What is the Median Family Income in Watergate?
Median Family Income in Watergate is $68,587.
What is the Median Household income in Watergate?
Median Household Income in Watergate is $61,750.
What is Income or Wage Gap in Watergate?
Income or Wage Gap in Watergate is 22.7%.
Women in Watergate earn 77.3 cents for every dollar earned by a man.
What is Inequality or Gini Index in Watergate?
Inequality or Gini Index in Watergate is 0.35.
What is the Total Population of Watergate?
Total Population of Watergate is 3,589.
What is the Total Male Population of Watergate?
Total Male Population of Watergate is 1,812.
What is the Total Female Population of Watergate?
Total Female Population of Watergate is 1,777.
What is the Ratio of Males per 100 Females in Watergate?
There are 101.97 Males per 100 Females in Watergate.
What is the Ratio of Females per 100 Males in Watergate?
There are 98.07 Females per 100 Males in Watergate.
What is the Median Population Age in Watergate?
Median Population Age in Watergate is 48.6 Years.
What is the Average Family Size in Watergate
Average Family Size in Watergate is 3.1 People.
What is the Average Household Size in Watergate
Average Household Size in Watergate is 2.8 People.
How Large is the Labor Force in Watergate?
There are 1,929 People in the Labor Forcein in Watergate.
What is the Percentage of People in the Labor Force in Watergate?
59.9% of People are in the Labor Force in Watergate.
What is the Unemployment Rate in Watergate?
Unemployment Rate in Watergate is 10.1%.