Melville, RI Map & Demographics
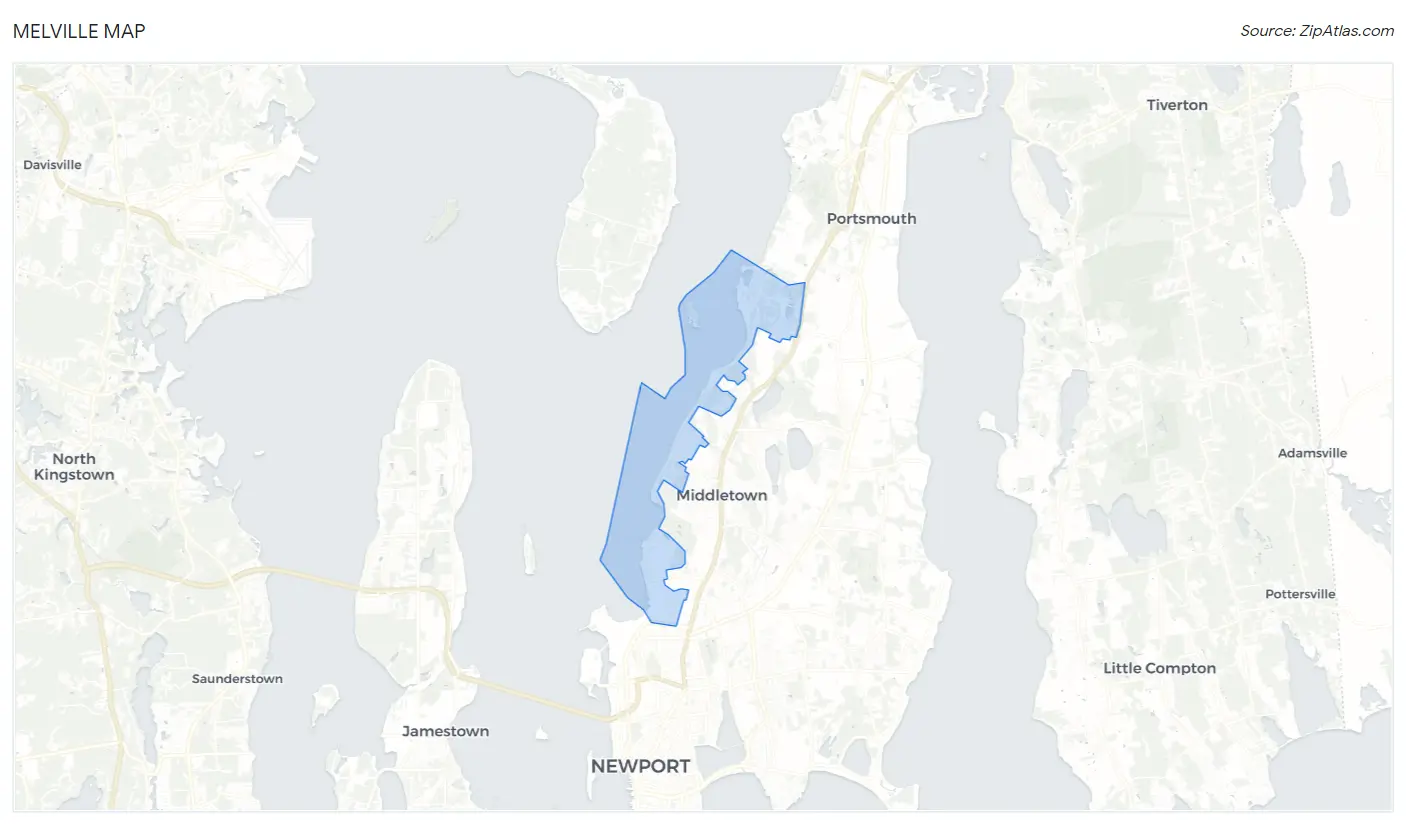
Melville Map
Melville Overview
$38,612
PER CAPITA INCOME
$112,297
AVG FAMILY INCOME
$128,750
AVG HOUSEHOLD INCOME
38.6%
WAGE / INCOME GAP [ % ]
61.4¢/ $1
WAGE / INCOME GAP [ $ ]
0.26
INEQUALITY / GINI INDEX
1,918
TOTAL POPULATION
1,110
MALE POPULATION
808
FEMALE POPULATION
137.38
MALES / 100 FEMALES
72.79
FEMALES / 100 MALES
29.1
MEDIAN AGE
3.5
AVG FAMILY SIZE
3.4
AVG HOUSEHOLD SIZE
1,057
LABOR FORCE [ PEOPLE ]
81.5%
PERCENT IN LABOR FORCE
2.1%
UNEMPLOYMENT RATE
Income in Melville
Income Overview in Melville
Per Capita Income in Melville is $38,612, while median incomes of families and households are $112,297 and $128,750 respectively.
| Characteristic | Number | Measure |
| Per Capita Income | 1,918 | $38,612 |
| Median Family Income | 513 | $112,297 |
| Mean Family Income | 513 | $121,427 |
| Median Household Income | 564 | $128,750 |
| Mean Household Income | 564 | $123,763 |
| Income Deficit | 513 | $0 |
| Wage / Income Gap (%) | 1,918 | 38.63% |
| Wage / Income Gap ($) | 1,918 | 61.37¢ per $1 |
| Gini / Inequality Index | 1,918 | 0.26 |
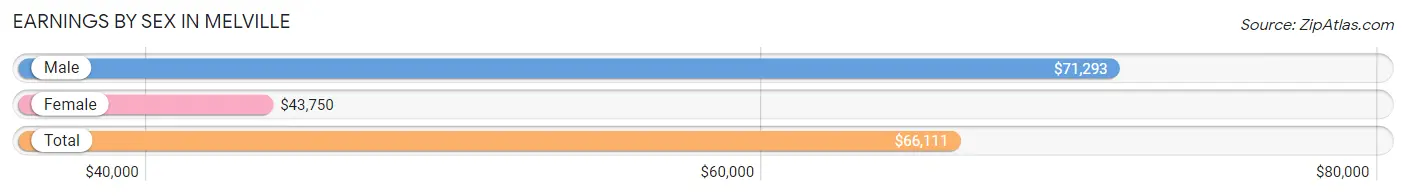
Earnings by Sex in Melville
Average Earnings in Melville are $66,111, $71,293 for men and $43,750 for women, a difference of 38.6%.
| Sex | Number | Average Earnings |
| Male | 704 (64.7%) | $71,293 |
| Female | 384 (35.3%) | $43,750 |
| Total | 1,088 (100.0%) | $66,111 |
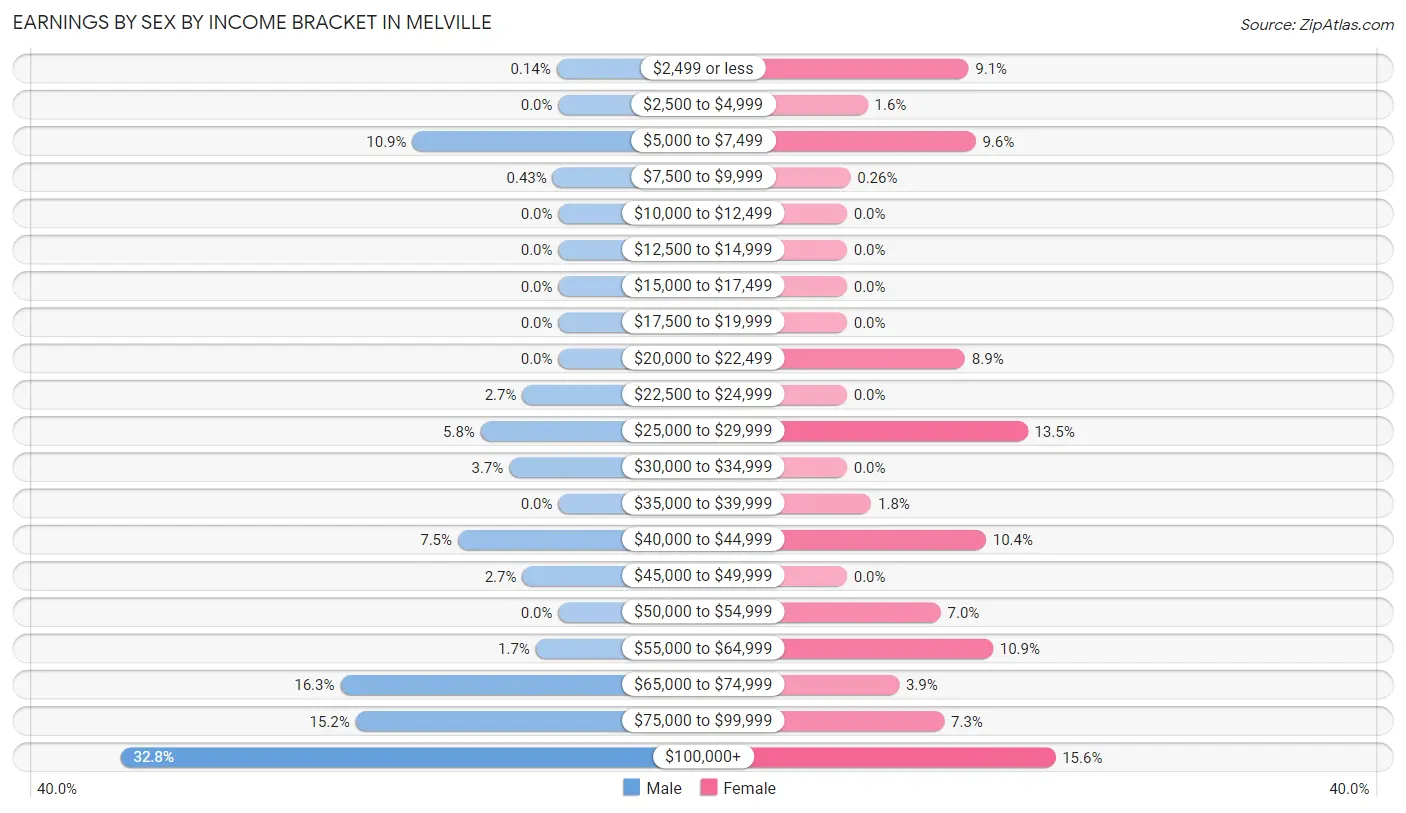
Earnings by Sex by Income Bracket in Melville
The most common earnings brackets in Melville are $100,000+ for men (231 | 32.8%) and $100,000+ for women (60 | 15.6%).
| Income | Male | Female |
| $2,499 or less | 1 (0.1%) | 35 (9.1%) |
| $2,500 to $4,999 | 0 (0.0%) | 6 (1.6%) |
| $5,000 to $7,499 | 77 (10.9%) | 37 (9.6%) |
| $7,500 to $9,999 | 3 (0.4%) | 1 (0.3%) |
| $10,000 to $12,499 | 0 (0.0%) | 0 (0.0%) |
| $12,500 to $14,999 | 0 (0.0%) | 0 (0.0%) |
| $15,000 to $17,499 | 0 (0.0%) | 0 (0.0%) |
| $17,500 to $19,999 | 0 (0.0%) | 0 (0.0%) |
| $20,000 to $22,499 | 0 (0.0%) | 34 (8.8%) |
| $22,500 to $24,999 | 19 (2.7%) | 0 (0.0%) |
| $25,000 to $29,999 | 41 (5.8%) | 52 (13.5%) |
| $30,000 to $34,999 | 26 (3.7%) | 0 (0.0%) |
| $35,000 to $39,999 | 0 (0.0%) | 7 (1.8%) |
| $40,000 to $44,999 | 53 (7.5%) | 40 (10.4%) |
| $45,000 to $49,999 | 19 (2.7%) | 0 (0.0%) |
| $50,000 to $54,999 | 0 (0.0%) | 27 (7.0%) |
| $55,000 to $64,999 | 12 (1.7%) | 42 (10.9%) |
| $65,000 to $74,999 | 115 (16.3%) | 15 (3.9%) |
| $75,000 to $99,999 | 107 (15.2%) | 28 (7.3%) |
| $100,000+ | 231 (32.8%) | 60 (15.6%) |
| Total | 704 (100.0%) | 384 (100.0%) |
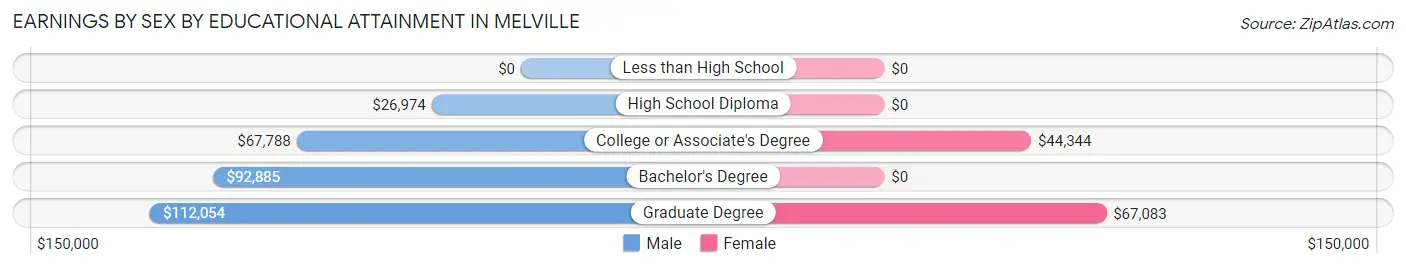
Earnings by Sex by Educational Attainment in Melville
Average earnings in Melville are $77,944 for men and $52,778 for women, a difference of 32.3%. Men with an educational attainment of graduate degree enjoy the highest average annual earnings of $112,054, while those with high school diploma education earn the least with $26,974. Women with an educational attainment of graduate degree earn the most with the average annual earnings of $67,083, while those with college or associate's degree education have the smallest earnings of $44,344.
| Educational Attainment | Male Income | Female Income |
| Less than High School | - | - |
| High School Diploma | $26,974 | $0 |
| College or Associate's Degree | $67,788 | $44,344 |
| Bachelor's Degree | $92,885 | $0 |
| Graduate Degree | $112,054 | $67,083 |
| Total | $77,944 | $52,778 |
Family Income in Melville
Family Income Brackets in Melville
According to the Melville family income data, there are 228 families falling into the $100,000 to $149,999 income range, which is the most common income bracket and makes up 44.4% of all families.
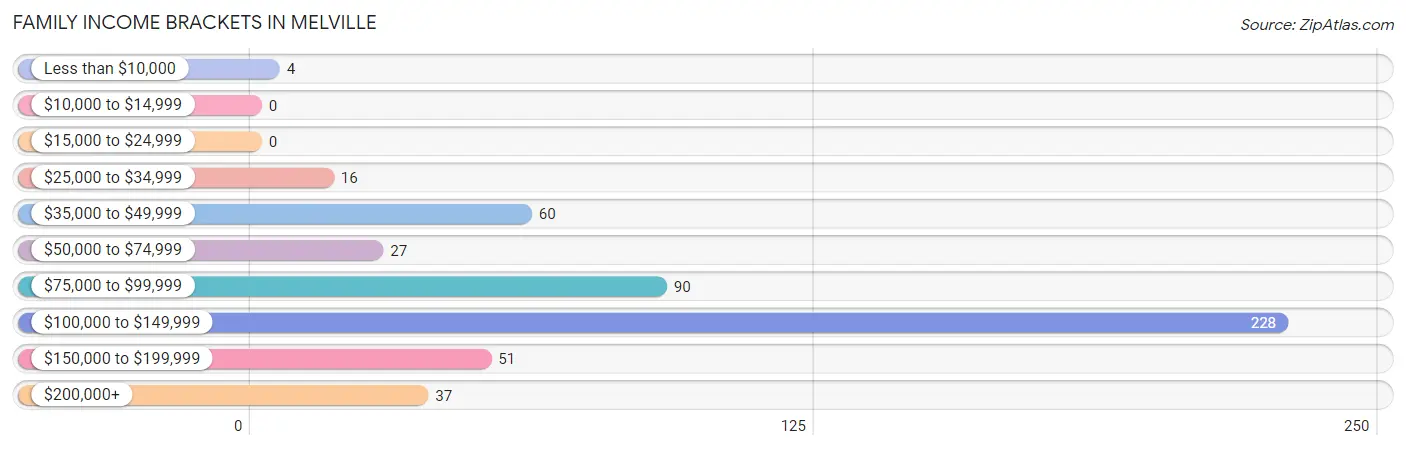
| Income Bracket | # Families | % Families |
| Less than $10,000 | 4 | 0.8% |
| $10,000 to $14,999 | 0 | 0.0% |
| $15,000 to $24,999 | 0 | 0.0% |
| $25,000 to $34,999 | 16 | 3.1% |
| $35,000 to $49,999 | 60 | 11.7% |
| $50,000 to $74,999 | 27 | 5.3% |
| $75,000 to $99,999 | 90 | 17.5% |
| $100,000 to $149,999 | 228 | 44.4% |
| $150,000 to $199,999 | 51 | 9.9% |
| $200,000+ | 37 | 7.2% |
Family Income by Famaliy Size in Melville
5-person families (59 | 11.5%) account for the highest median family income in Melville with $138,125 per family, while 3-person families (163 | 31.8%) have the highest median income of $45,893 per family member.
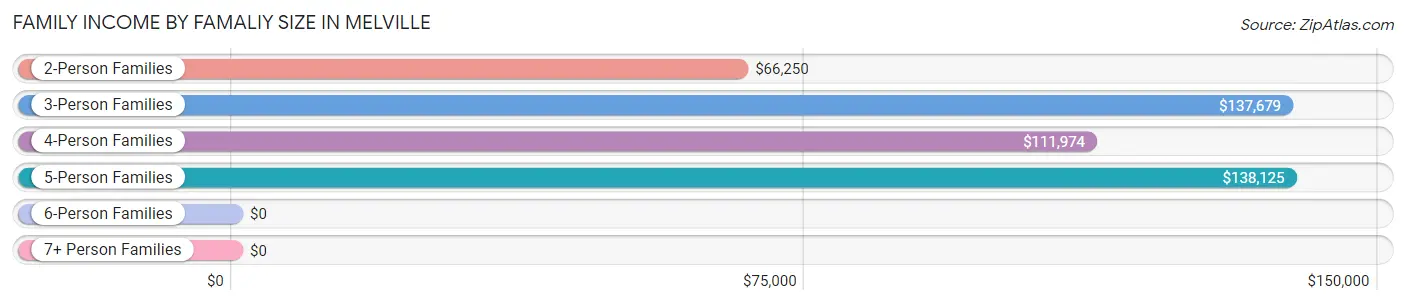
| Income Bracket | # Families | Median Income |
| 2-Person Families | 161 (31.4%) | $66,250 |
| 3-Person Families | 163 (31.8%) | $137,679 |
| 4-Person Families | 130 (25.3%) | $111,974 |
| 5-Person Families | 59 (11.5%) | $138,125 |
| 6-Person Families | 0 (0.0%) | $0 |
| 7+ Person Families | 0 (0.0%) | $0 |
| Total | 513 (100.0%) | $112,297 |
Family Income by Number of Earners in Melville
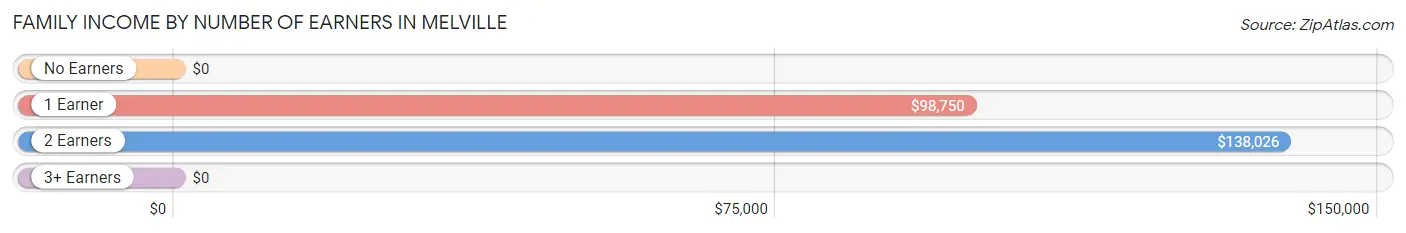
| Number of Earners | # Families | Median Income |
| No Earners | 3 (0.6%) | $0 |
| 1 Earner | 181 (35.3%) | $98,750 |
| 2 Earners | 314 (61.2%) | $138,026 |
| 3+ Earners | 15 (2.9%) | $0 |
| Total | 513 (100.0%) | $112,297 |
Household Income in Melville
Household Income Brackets in Melville
With 241 households falling in the category, the $100,000 to $149,999 income range is the most frequent in Melville, accounting for 42.7% of all households.
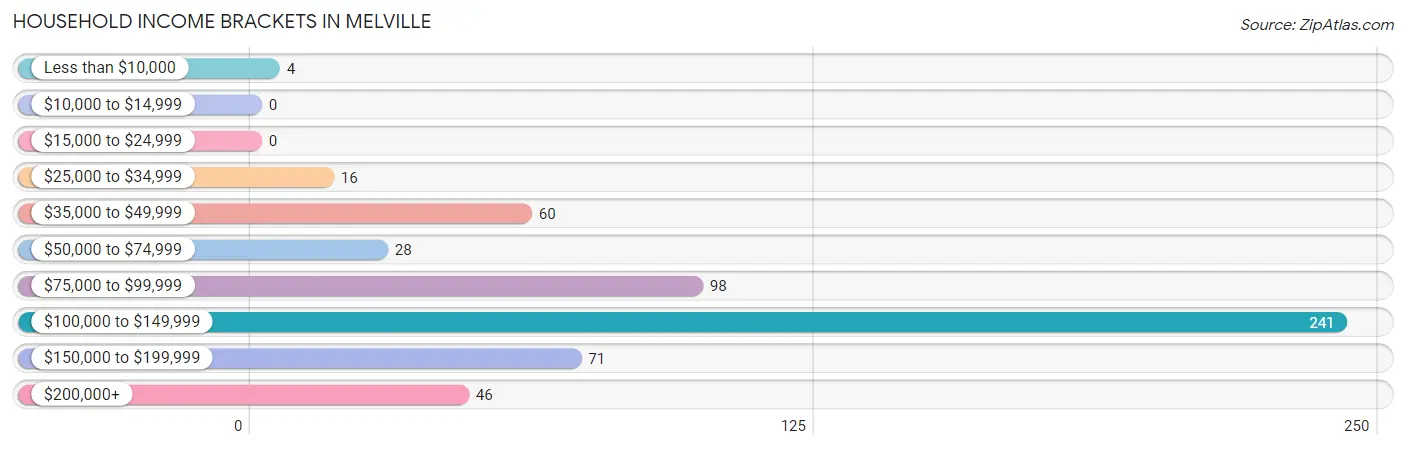
| Income Bracket | # Households | % Households |
| Less than $10,000 | 4 | 0.7% |
| $10,000 to $14,999 | 0 | 0.0% |
| $15,000 to $24,999 | 0 | 0.0% |
| $25,000 to $34,999 | 16 | 2.8% |
| $35,000 to $49,999 | 60 | 10.6% |
| $50,000 to $74,999 | 28 | 5.0% |
| $75,000 to $99,999 | 98 | 17.4% |
| $100,000 to $149,999 | 241 | 42.7% |
| $150,000 to $199,999 | 71 | 12.6% |
| $200,000+ | 46 | 8.2% |
Household Income by Householder Age in Melville
The median household income in Melville is $128,750, with the highest median household income of $130,647 found in the 25 to 44 years age bracket for the primary householder. A total of 473 households (83.9%) fall into this category. Meanwhile, the 15 to 24 years age bracket for the primary householder has the lowest median household income of $0, with 17 households (3.0%) in this group.
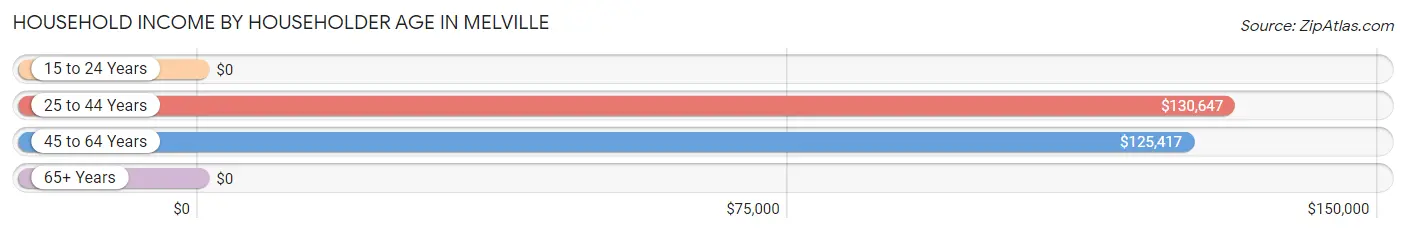
| Income Bracket | # Households | Median Income |
| 15 to 24 Years | 17 (3.0%) | $0 |
| 25 to 44 Years | 473 (83.9%) | $130,647 |
| 45 to 64 Years | 68 (12.1%) | $125,417 |
| 65+ Years | 6 (1.1%) | $0 |
| Total | 564 (100.0%) | $128,750 |
Poverty in Melville
Income Below Poverty by Sex and Age in Melville
With 0.8% poverty level for males and 0.5% for females among the residents of Melville, 65 to 74 year old males and 45 to 54 year old females are the most vulnerable to poverty, with 5 males (100.0%) and 4 females (10.0%) in their respective age groups living below the poverty level.
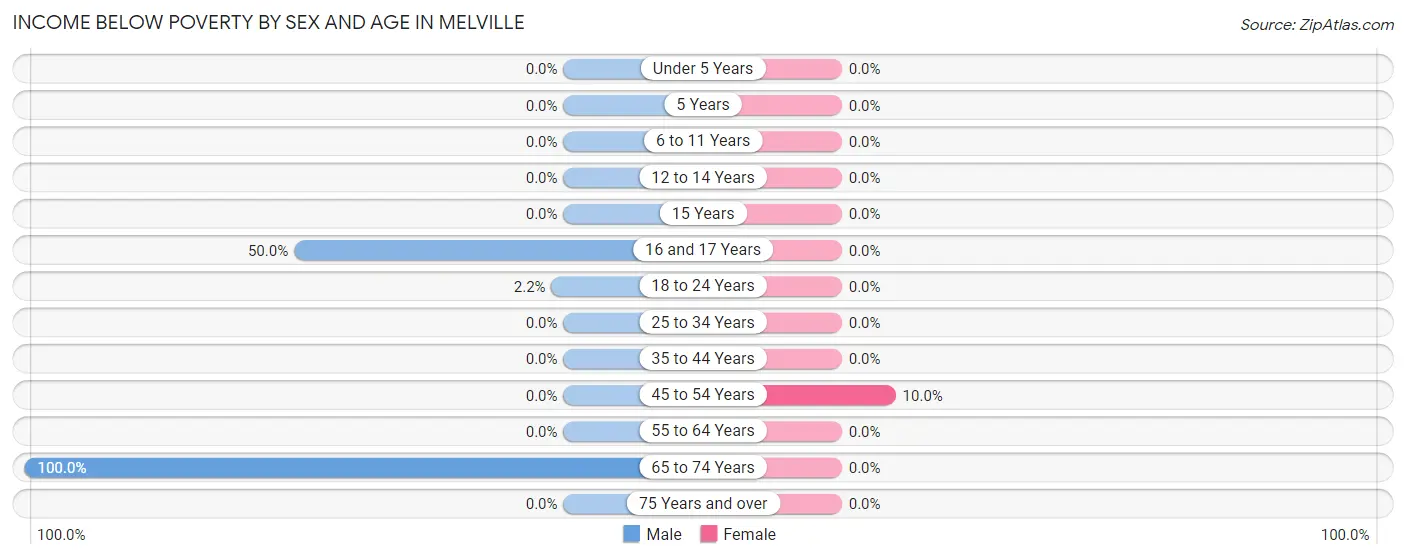
| Age Bracket | Male | Female |
| Under 5 Years | 0 (0.0%) | 0 (0.0%) |
| 5 Years | 0 (0.0%) | 0 (0.0%) |
| 6 to 11 Years | 0 (0.0%) | 0 (0.0%) |
| 12 to 14 Years | 0 (0.0%) | 0 (0.0%) |
| 15 Years | 0 (0.0%) | 0 (0.0%) |
| 16 and 17 Years | 1 (50.0%) | 0 (0.0%) |
| 18 to 24 Years | 3 (2.2%) | 0 (0.0%) |
| 25 to 34 Years | 0 (0.0%) | 0 (0.0%) |
| 35 to 44 Years | 0 (0.0%) | 0 (0.0%) |
| 45 to 54 Years | 0 (0.0%) | 4 (10.0%) |
| 55 to 64 Years | 0 (0.0%) | 0 (0.0%) |
| 65 to 74 Years | 5 (100.0%) | 0 (0.0%) |
| 75 Years and over | 0 (0.0%) | 0 (0.0%) |
| Total | 9 (0.8%) | 4 (0.5%) |
Income Above Poverty by Sex and Age in Melville
According to the poverty statistics in Melville, males aged under 5 years and females aged under 5 years are the age groups that are most secure financially, with 100.0% of males and 100.0% of females in these age groups living above the poverty line.
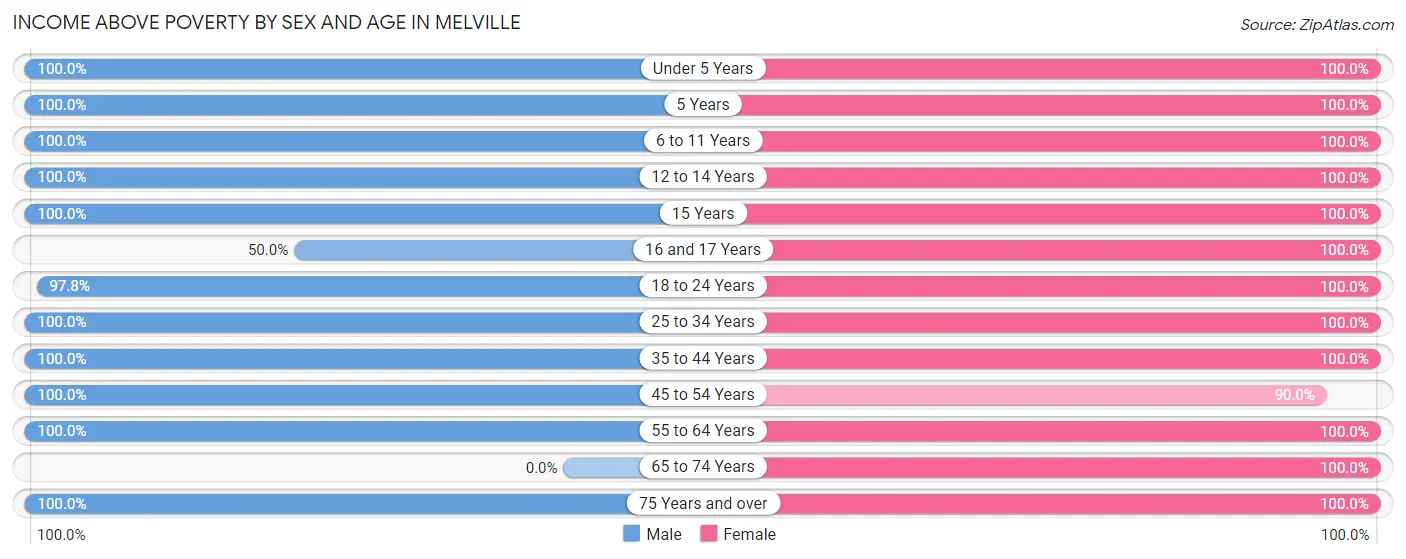
| Age Bracket | Male | Female |
| Under 5 Years | 125 (100.0%) | 138 (100.0%) |
| 5 Years | 43 (100.0%) | 43 (100.0%) |
| 6 to 11 Years | 148 (100.0%) | 56 (100.0%) |
| 12 to 14 Years | 12 (100.0%) | 13 (100.0%) |
| 15 Years | 30 (100.0%) | 13 (100.0%) |
| 16 and 17 Years | 1 (50.0%) | 19 (100.0%) |
| 18 to 24 Years | 133 (97.8%) | 46 (100.0%) |
| 25 to 34 Years | 274 (100.0%) | 249 (100.0%) |
| 35 to 44 Years | 236 (100.0%) | 151 (100.0%) |
| 45 to 54 Years | 74 (100.0%) | 36 (90.0%) |
| 55 to 64 Years | 22 (100.0%) | 28 (100.0%) |
| 65 to 74 Years | 0 (0.0%) | 3 (100.0%) |
| 75 Years and over | 3 (100.0%) | 3 (100.0%) |
| Total | 1,101 (99.2%) | 798 (99.5%) |
Income Below Poverty Among Married-Couple Families in Melville
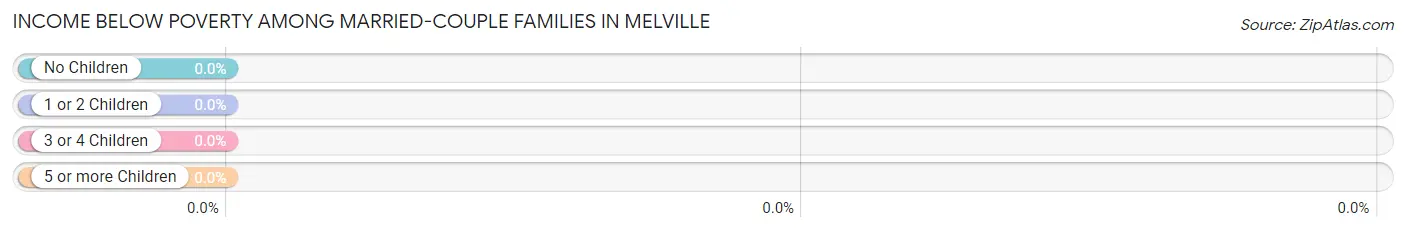
| Children | Above Poverty | Below Poverty |
| No Children | 131 (100.0%) | 0 (0.0%) |
| 1 or 2 Children | 237 (100.0%) | 0 (0.0%) |
| 3 or 4 Children | 57 (100.0%) | 0 (0.0%) |
| 5 or more Children | 0 (0.0%) | 0 (0.0%) |
| Total | 425 (100.0%) | 0 (0.0%) |
Income Below Poverty Among Single-Parent Households in Melville
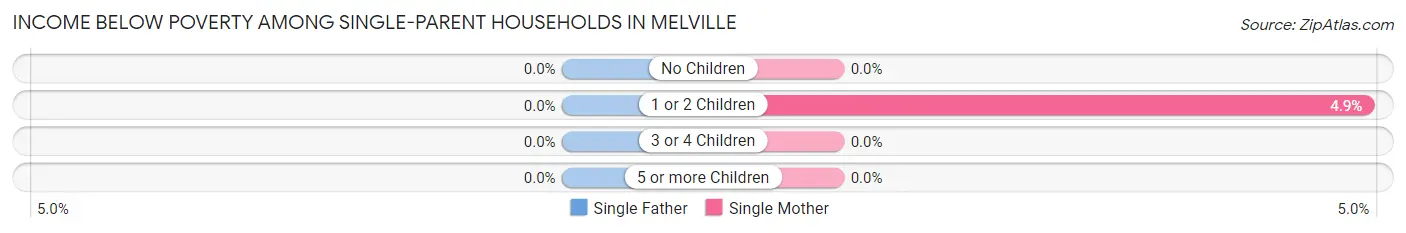
| Children | Single Father | Single Mother |
| No Children | 0 (0.0%) | 0 (0.0%) |
| 1 or 2 Children | 0 (0.0%) | 4 (4.9%) |
| 3 or 4 Children | 0 (0.0%) | 0 (0.0%) |
| 5 or more Children | 0 (0.0%) | 0 (0.0%) |
| Total | 0 (0.0%) | 4 (4.5%) |
Income Below Poverty Among Married-Couple vs Single-Parent Households in Melville
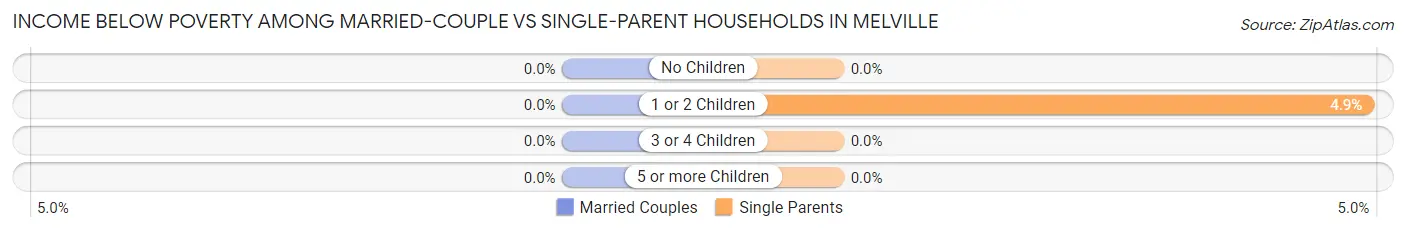
| Children | Married-Couple Families | Single-Parent Households |
| No Children | 0 (0.0%) | 0 (0.0%) |
| 1 or 2 Children | 0 (0.0%) | 4 (4.9%) |
| 3 or 4 Children | 0 (0.0%) | 0 (0.0%) |
| 5 or more Children | 0 (0.0%) | 0 (0.0%) |
| Total | 0 (0.0%) | 4 (4.5%) |
Race in Melville
The most populous races in Melville are White / Caucasian (1,089 | 56.8%), Two or more Races (437 | 22.8%), and Hispanic or Latino (378 | 19.7%).
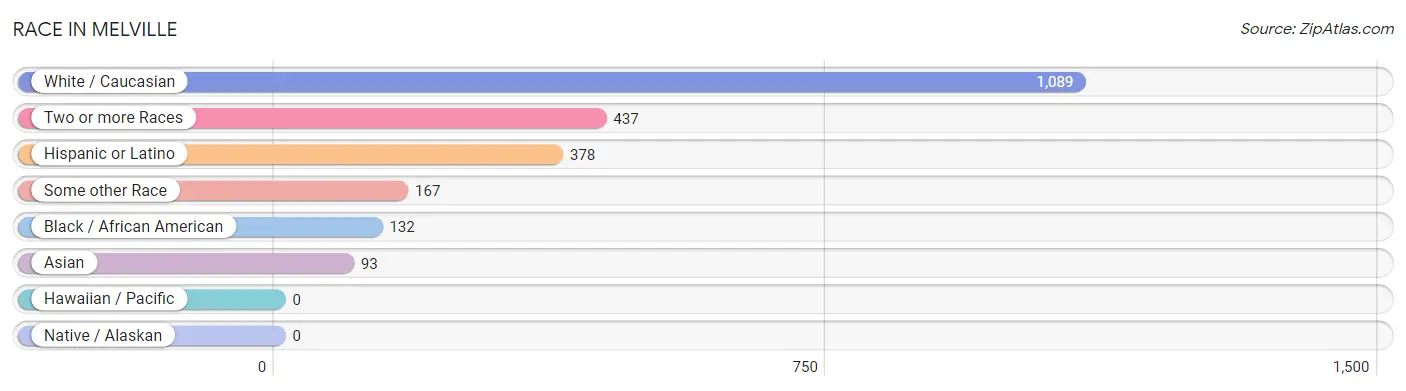
| Race | # Population | % Population |
| Asian | 93 | 4.9% |
| Black / African American | 132 | 6.9% |
| Hawaiian / Pacific | 0 | 0.0% |
| Hispanic or Latino | 378 | 19.7% |
| Native / Alaskan | 0 | 0.0% |
| White / Caucasian | 1,089 | 56.8% |
| Two or more Races | 437 | 22.8% |
| Some other Race | 167 | 8.7% |
| Total | 1,918 | 100.0% |
Ancestry in Melville
The most populous ancestries reported in Melville are Irish (349 | 18.2%), Italian (269 | 14.0%), Korean (194 | 10.1%), Polish (189 | 9.9%), and Puerto Rican (167 | 8.7%), together accounting for 60.9% of all Melville residents.
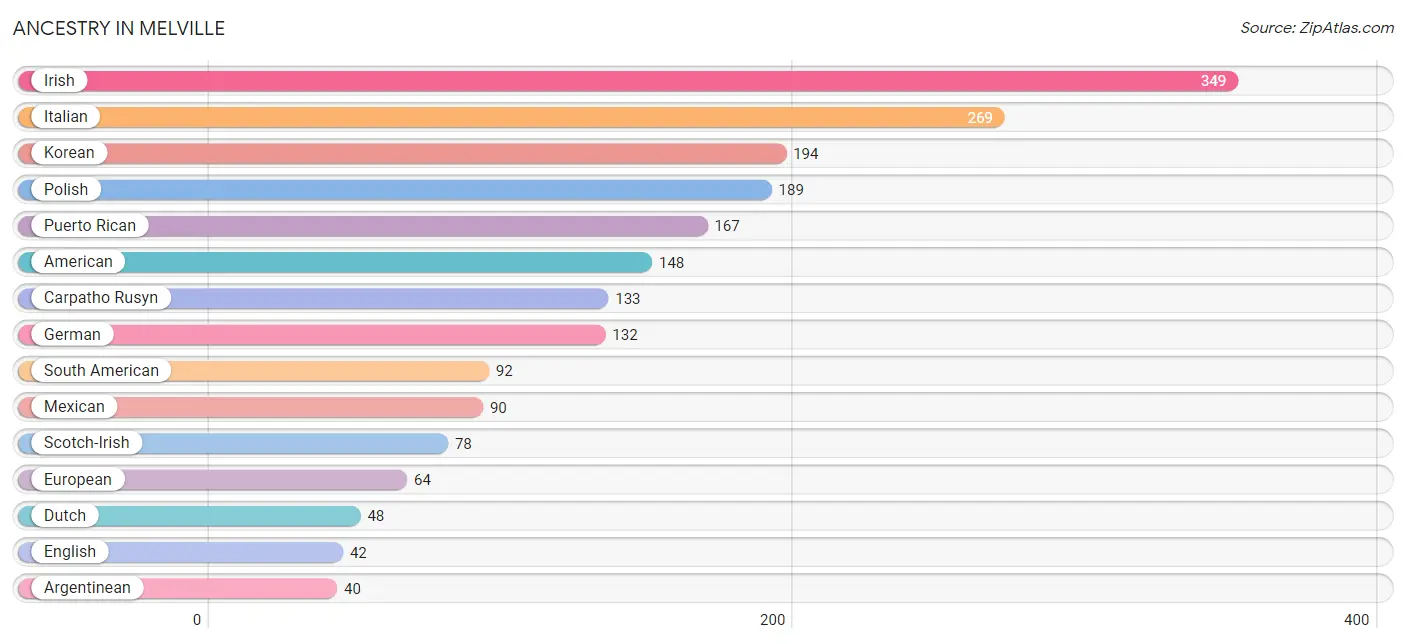
| Ancestry | # Population | % Population |
| American | 148 | 7.7% |
| Argentinean | 40 | 2.1% |
| Barbadian | 18 | 0.9% |
| Brazilian | 19 | 1.0% |
| British West Indian | 6 | 0.3% |
| Canadian | 14 | 0.7% |
| Carpatho Rusyn | 133 | 6.9% |
| Central American | 29 | 1.5% |
| Colombian | 39 | 2.0% |
| Dutch | 48 | 2.5% |
| Dutch West Indian | 29 | 1.5% |
| Ecuadorian | 13 | 0.7% |
| English | 42 | 2.2% |
| European | 64 | 3.3% |
| Finnish | 6 | 0.3% |
| French Canadian | 3 | 0.2% |
| German | 132 | 6.9% |
| Hungarian | 4 | 0.2% |
| Indian (Asian) | 29 | 1.5% |
| Irish | 349 | 18.2% |
| Italian | 269 | 14.0% |
| Korean | 194 | 10.1% |
| Mexican | 90 | 4.7% |
| Norwegian | 22 | 1.1% |
| Panamanian | 29 | 1.5% |
| Polish | 189 | 9.9% |
| Portuguese | 11 | 0.6% |
| Puerto Rican | 167 | 8.7% |
| Scandinavian | 4 | 0.2% |
| Scotch-Irish | 78 | 4.1% |
| Scottish | 4 | 0.2% |
| Senegalese | 7 | 0.4% |
| South American | 92 | 4.8% |
| Subsaharan African | 7 | 0.4% |
| Swedish | 27 | 1.4% | View All 35 Rows |
Immigrants in Melville
The most numerous immigrant groups reported in Melville came from Latin America (80 | 4.2%), South America (52 | 2.7%), Asia (32 | 1.7%), Philippines (32 | 1.7%), and South Eastern Asia (32 | 1.7%), together accounting for 11.9% of all Melville residents.
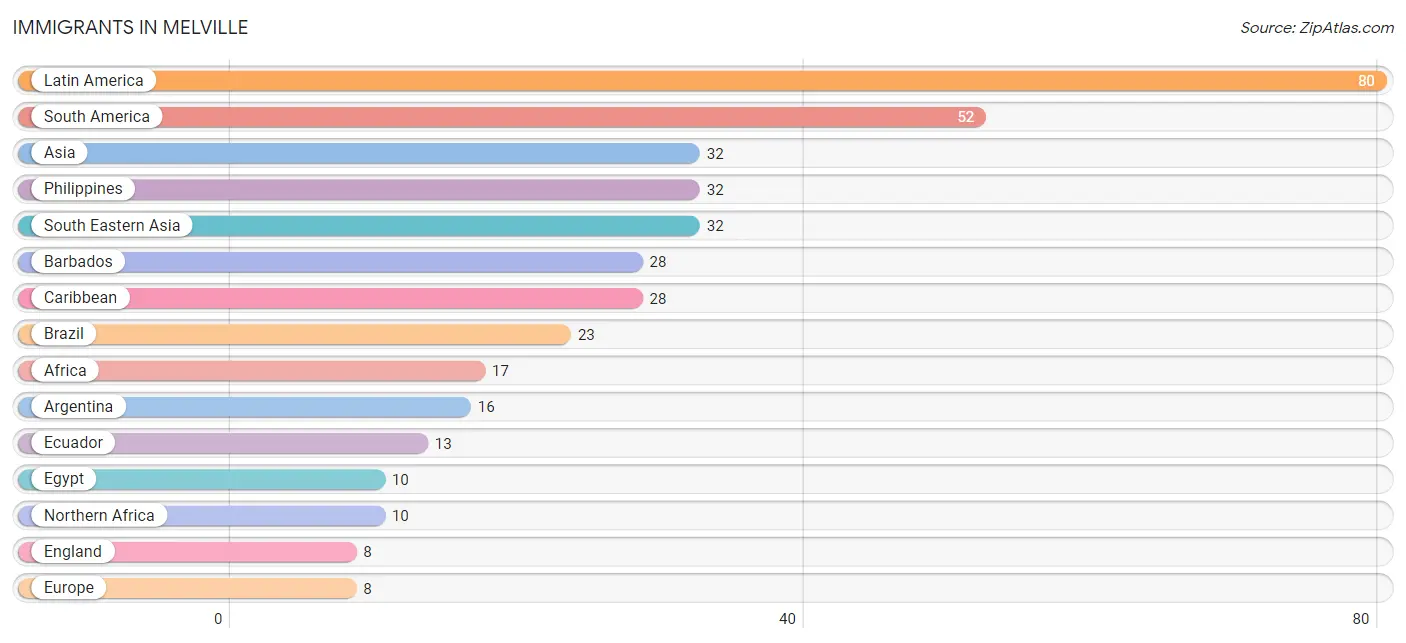
| Immigration Origin | # Population | % Population |
| Africa | 17 | 0.9% |
| Argentina | 16 | 0.8% |
| Asia | 32 | 1.7% |
| Barbados | 28 | 1.5% |
| Brazil | 23 | 1.2% |
| Caribbean | 28 | 1.5% |
| Ecuador | 13 | 0.7% |
| Egypt | 10 | 0.5% |
| England | 8 | 0.4% |
| Europe | 8 | 0.4% |
| Latin America | 80 | 4.2% |
| Northern Africa | 10 | 0.5% |
| Northern Europe | 8 | 0.4% |
| Philippines | 32 | 1.7% |
| Senegal | 7 | 0.4% |
| South America | 52 | 2.7% |
| South Eastern Asia | 32 | 1.7% |
| Western Africa | 7 | 0.4% | View All 18 Rows |
Sex and Age in Melville
Sex and Age in Melville
The most populous age groups in Melville are 35 to 39 Years (154 | 13.9%) for men and 30 to 34 Years (174 | 21.5%) for women.
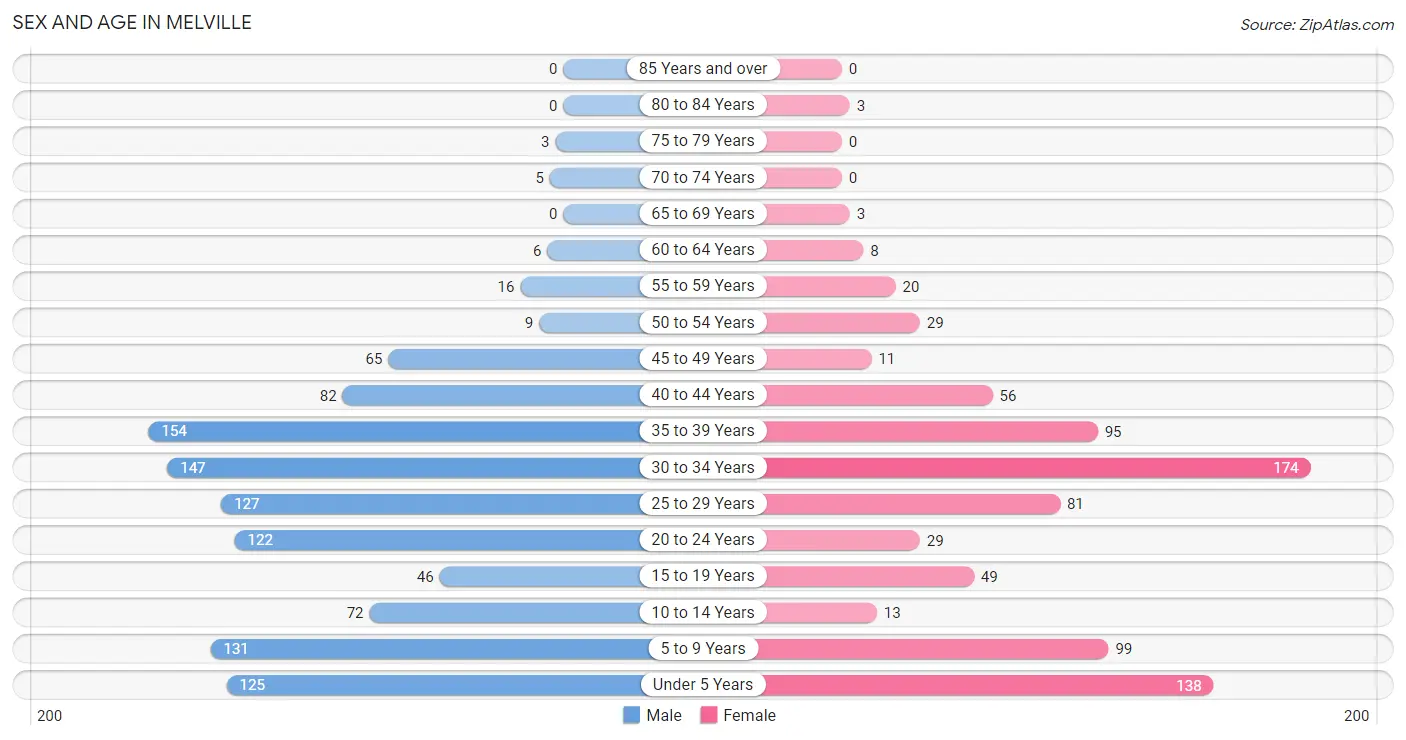
| Age Bracket | Male | Female |
| Under 5 Years | 125 (11.3%) | 138 (17.1%) |
| 5 to 9 Years | 131 (11.8%) | 99 (12.2%) |
| 10 to 14 Years | 72 (6.5%) | 13 (1.6%) |
| 15 to 19 Years | 46 (4.1%) | 49 (6.1%) |
| 20 to 24 Years | 122 (11.0%) | 29 (3.6%) |
| 25 to 29 Years | 127 (11.4%) | 81 (10.0%) |
| 30 to 34 Years | 147 (13.2%) | 174 (21.5%) |
| 35 to 39 Years | 154 (13.9%) | 95 (11.8%) |
| 40 to 44 Years | 82 (7.4%) | 56 (6.9%) |
| 45 to 49 Years | 65 (5.9%) | 11 (1.4%) |
| 50 to 54 Years | 9 (0.8%) | 29 (3.6%) |
| 55 to 59 Years | 16 (1.4%) | 20 (2.5%) |
| 60 to 64 Years | 6 (0.5%) | 8 (1.0%) |
| 65 to 69 Years | 0 (0.0%) | 3 (0.4%) |
| 70 to 74 Years | 5 (0.4%) | 0 (0.0%) |
| 75 to 79 Years | 3 (0.3%) | 0 (0.0%) |
| 80 to 84 Years | 0 (0.0%) | 3 (0.4%) |
| 85 Years and over | 0 (0.0%) | 0 (0.0%) |
| Total | 1,110 (100.0%) | 808 (100.0%) |
Families and Households in Melville
Median Family Size in Melville
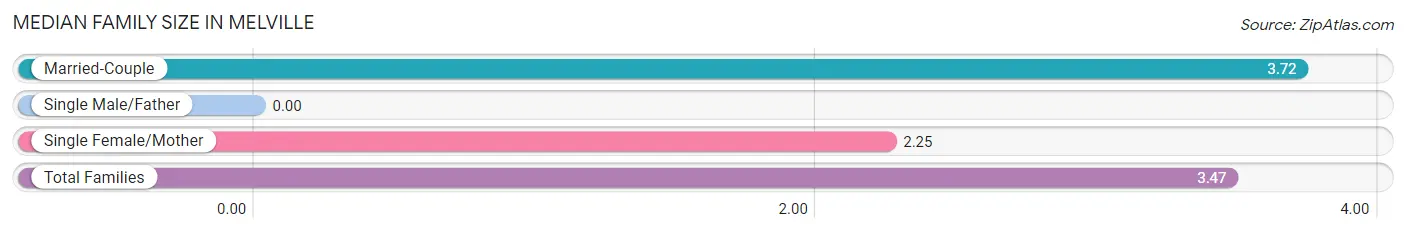
| Family Type | # Families | Family Size |
| Married-Couple | 425 (82.9%) | 3.72 |
| Single Male/Father | 0 (0.0%) | - |
| Single Female/Mother | 88 (17.2%) | 2.25 |
| Total Families | 513 (100.0%) | 3.47 |
Median Household Size in Melville
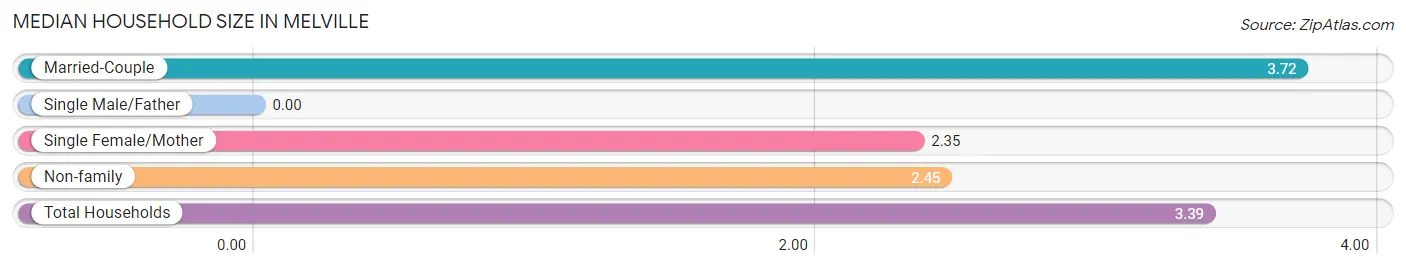
| Household Type | # Households | Household Size |
| Married-Couple | 425 (75.3%) | 3.72 |
| Single Male/Father | 0 (0.0%) | - |
| Single Female/Mother | 88 (15.6%) | 2.35 |
| Non-family | 51 (9.0%) | 2.45 |
| Total Households | 564 (100.0%) | 3.39 |
Household Size by Marriage Status in Melville
Out of a total of 564 households in Melville, 513 (91.0%) are family households, while 51 (9.0%) are nonfamily households. The most numerous type of family households are 3-person households, comprising 169, and the most common type of nonfamily households are 1-person households, comprising 22.
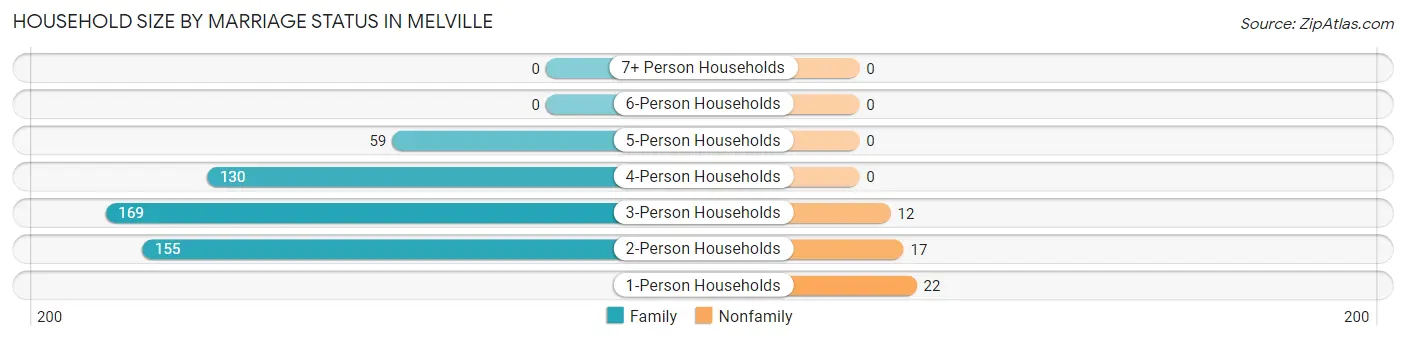
| Household Size | Family Households | Nonfamily Households |
| 1-Person Households | - | 22 (3.9%) |
| 2-Person Households | 155 (27.5%) | 17 (3.0%) |
| 3-Person Households | 169 (30.0%) | 12 (2.1%) |
| 4-Person Households | 130 (23.1%) | 0 (0.0%) |
| 5-Person Households | 59 (10.5%) | 0 (0.0%) |
| 6-Person Households | 0 (0.0%) | 0 (0.0%) |
| 7+ Person Households | 0 (0.0%) | 0 (0.0%) |
| Total | 513 (91.0%) | 51 (9.0%) |
Female Fertility in Melville
Fertility by Age in Melville
Average fertility rate in Melville is 69.0 births per 1,000 women. Women in the age bracket of 20 to 34 years have the highest fertility rate with 120.0 births per 1,000 women. Women in the age bracket of 20 to 34 years acount for 100.0% of all women with births.
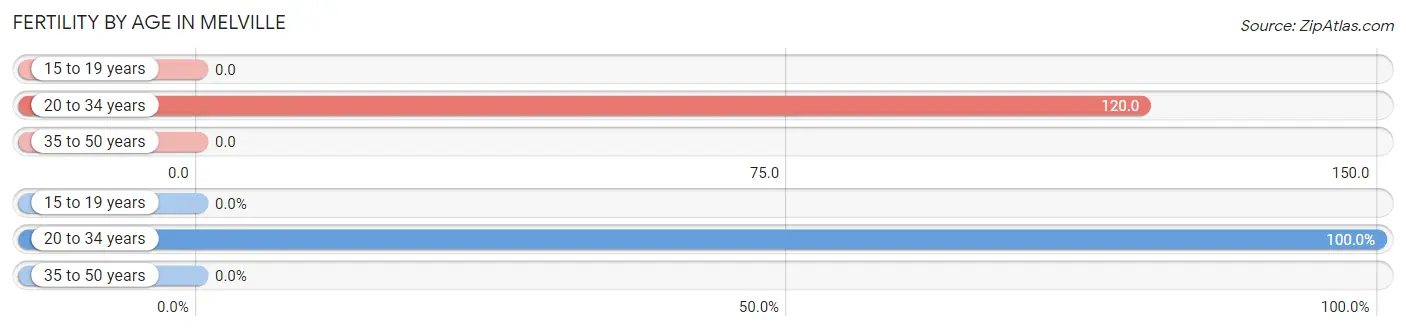
| Age Bracket | Women with Births | Births / 1,000 Women |
| 15 to 19 years | 0 (0.0%) | 0.0 |
| 20 to 34 years | 34 (100.0%) | 120.0 |
| 35 to 50 years | 0 (0.0%) | 0.0 |
| Total | 34 (100.0%) | 69.0 |
Fertility by Age by Marriage Status in Melville
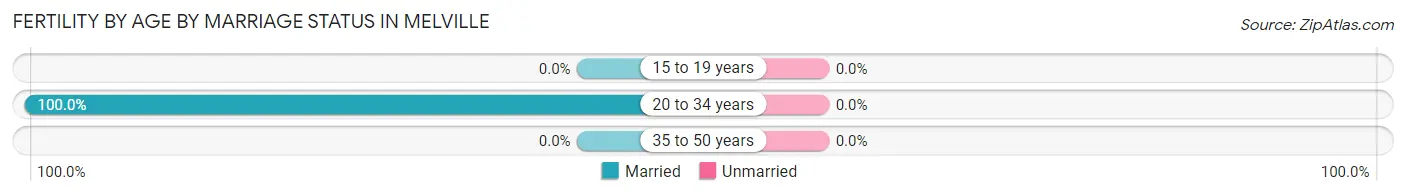
| Age Bracket | Married | Unmarried |
| 15 to 19 years | 0 (0.0%) | 0 (0.0%) |
| 20 to 34 years | 34 (100.0%) | 0 (0.0%) |
| 35 to 50 years | 0 (0.0%) | 0 (0.0%) |
| Total | 34 (100.0%) | 0 (0.0%) |
Fertility by Education in Melville
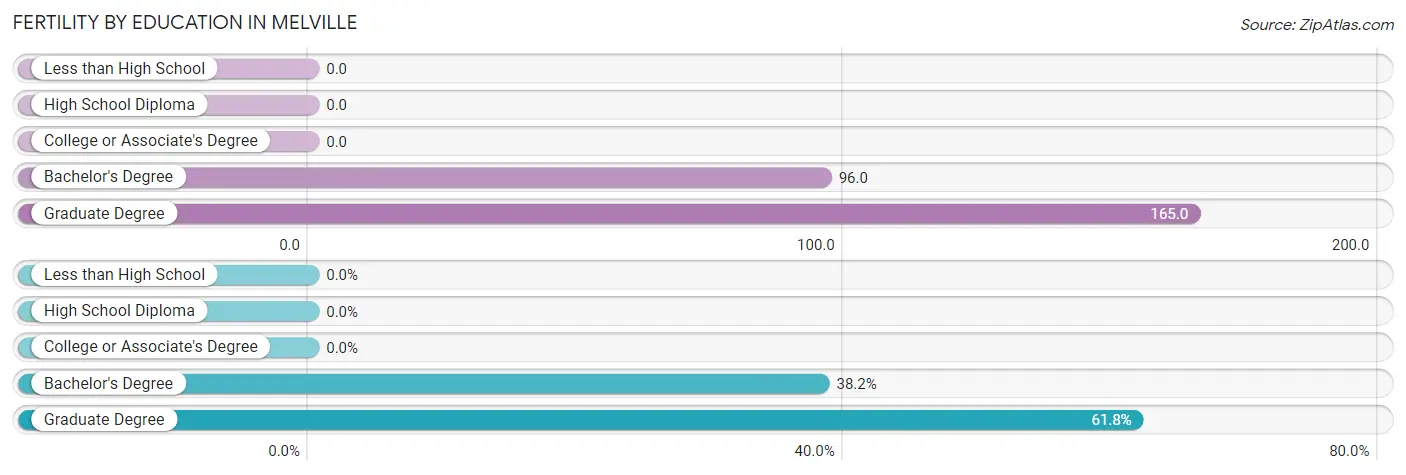
| Educational Attainment | Women with Births | Births / 1,000 Women |
| Less than High School | 0 (0.0%) | 0.0 |
| High School Diploma | 0 (0.0%) | 0.0 |
| College or Associate's Degree | 0 (0.0%) | 0.0 |
| Bachelor's Degree | 13 (38.2%) | 96.0 |
| Graduate Degree | 21 (61.8%) | 165.0 |
| Total | 34 (100.0%) | 69.0 |
Fertility by Education by Marriage Status in Melville
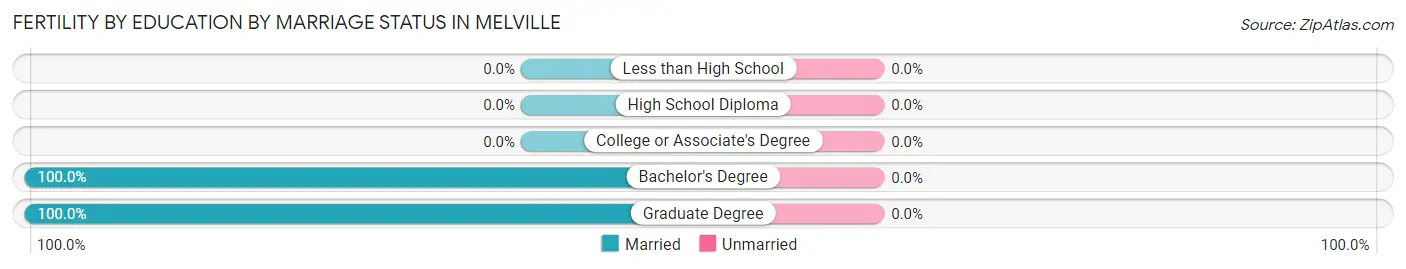
| Educational Attainment | Married | Unmarried |
| Less than High School | 0 (0.0%) | 0 (0.0%) |
| High School Diploma | 0 (0.0%) | 0 (0.0%) |
| College or Associate's Degree | 0 (0.0%) | 0 (0.0%) |
| Bachelor's Degree | 13 (100.0%) | 0 (0.0%) |
| Graduate Degree | 21 (100.0%) | 0 (0.0%) |
| Total | 34 (100.0%) | 0 (0.0%) |
Employment Characteristics in Melville
Employment by Class of Employer in Melville
Among the 982 employed individuals in Melville, federal government employees (563 | 57.3%), private company employees (279 | 28.4%), and local government employees (101 | 10.3%) make up the most common classes of employment.
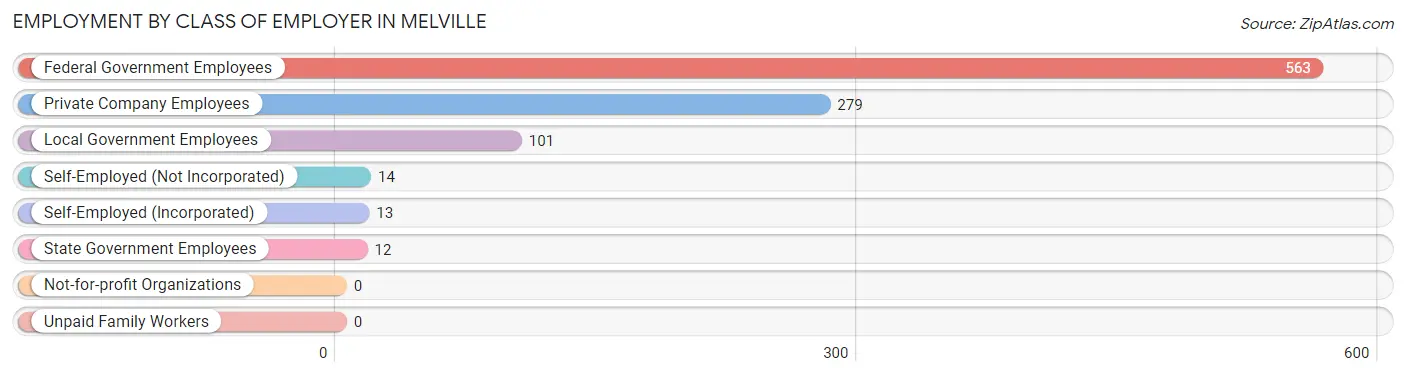
| Employer Class | # Employees | % Employees |
| Private Company Employees | 279 | 28.4% |
| Self-Employed (Incorporated) | 13 | 1.3% |
| Self-Employed (Not Incorporated) | 14 | 1.4% |
| Not-for-profit Organizations | 0 | 0.0% |
| Local Government Employees | 101 | 10.3% |
| State Government Employees | 12 | 1.2% |
| Federal Government Employees | 563 | 57.3% |
| Unpaid Family Workers | 0 | 0.0% |
| Total | 982 | 100.0% |
Employment Status by Age in Melville
According to the labor force statistics for Melville, out of the total population over 16 years of age (1,297), 81.5% or 1,057 individuals are in the labor force, with 2.1% or 22 of them unemployed. The age group with the highest labor force participation rate is 60 to 64 years, with 100.0% or 14 individuals in the labor force. Within the labor force, the 20 to 24 years age range has the highest percentage of unemployed individuals, with 8.1% or 10 of them being unemployed.
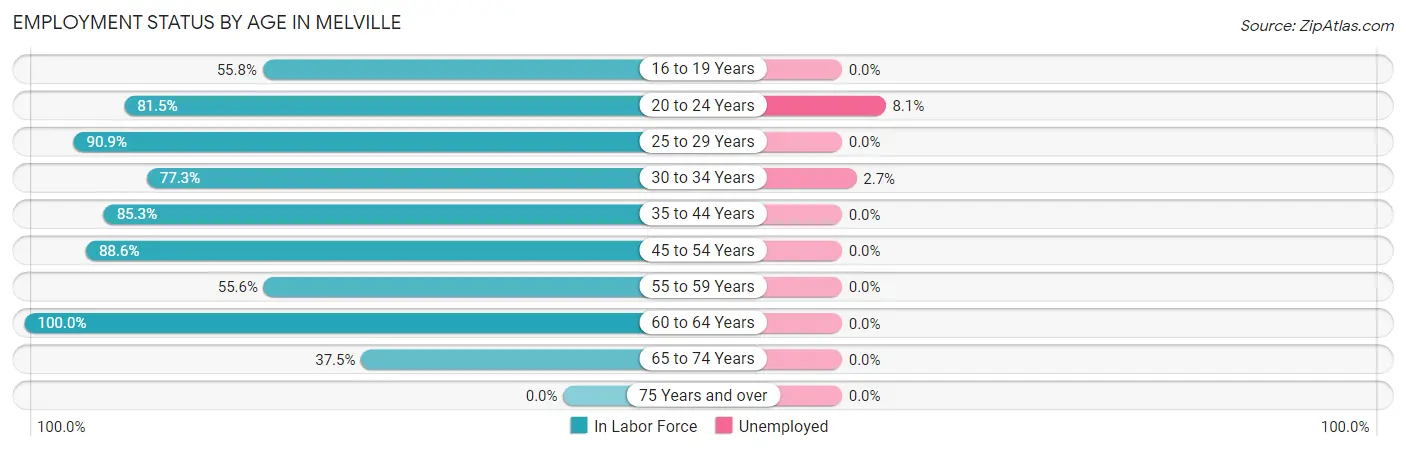
| Age Bracket | In Labor Force | Unemployed |
| 16 to 19 Years | 29 (55.8%) | 0 (0.0%) |
| 20 to 24 Years | 123 (81.5%) | 10 (8.1%) |
| 25 to 29 Years | 189 (90.9%) | 0 (0.0%) |
| 30 to 34 Years | 248 (77.3%) | 7 (2.7%) |
| 35 to 44 Years | 330 (85.3%) | 0 (0.0%) |
| 45 to 54 Years | 101 (88.6%) | 0 (0.0%) |
| 55 to 59 Years | 20 (55.6%) | 0 (0.0%) |
| 60 to 64 Years | 14 (100.0%) | 0 (0.0%) |
| 65 to 74 Years | 3 (37.5%) | 0 (0.0%) |
| 75 Years and over | 0 (0.0%) | 0 (0.0%) |
| Total | 1,057 (81.5%) | 22 (2.1%) |
Employment Status by Educational Attainment in Melville
According to labor force statistics for Melville, 83.5% of individuals (902) out of the total population between 25 and 64 years of age (1,080) are in the labor force, with 0.9% or 8 of them being unemployed. The group with the highest labor force participation rate are those with the educational attainment of less than high school, with 100.0% or 8 individuals in the labor force. Within the labor force, individuals with college / associate degree education have the highest percentage of unemployment, with 3.1% or 7 of them being unemployed.
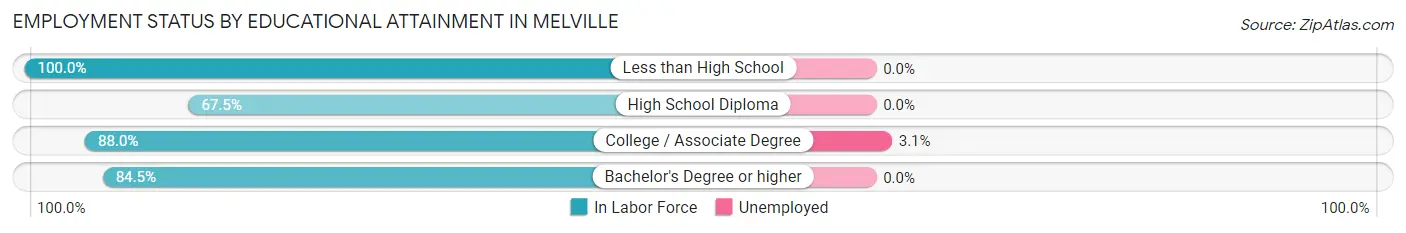
| Educational Attainment | In Labor Force | Unemployed |
| Less than High School | 8 (100.0%) | 0 (0.0%) |
| High School Diploma | 85 (67.5%) | 0 (0.0%) |
| College / Associate Degree | 241 (88.0%) | 8 (3.1%) |
| Bachelor's Degree or higher | 568 (84.5%) | 0 (0.0%) |
| Total | 902 (83.5%) | 10 (0.9%) |
Employment Occupations by Sex in Melville
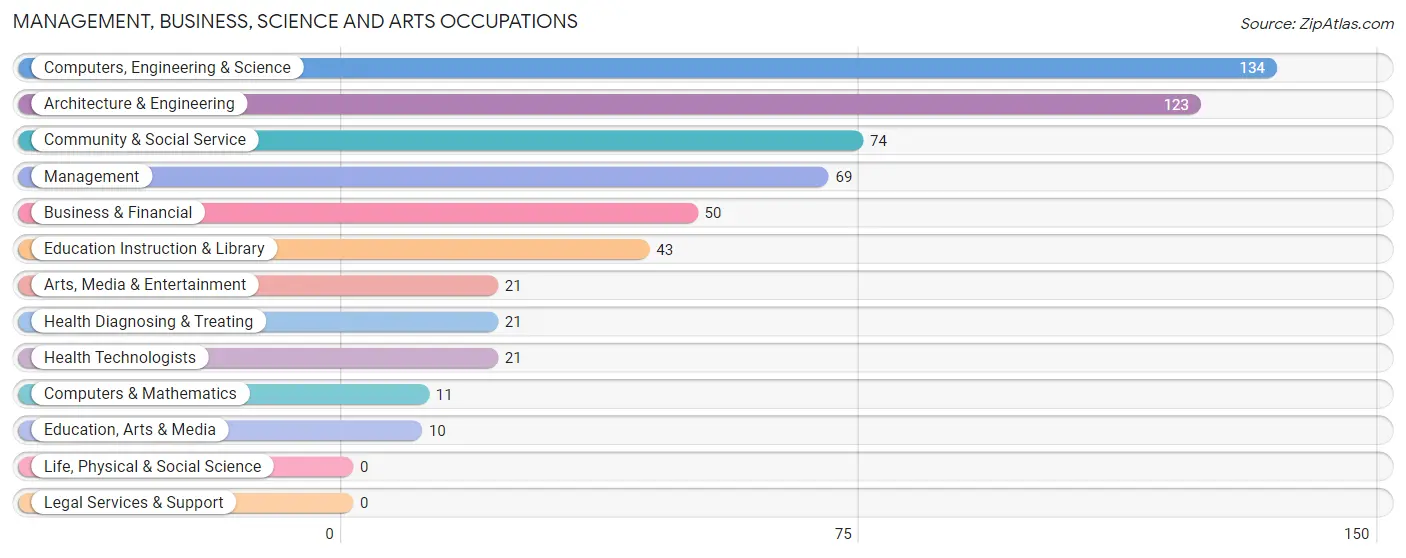
Management, Business, Science and Arts Occupations
The most common Management, Business, Science and Arts occupations in Melville are Computers, Engineering & Science (134 | 20.4%), Architecture & Engineering (123 | 18.8%), Community & Social Service (74 | 11.3%), Management (69 | 10.5%), and Business & Financial (50 | 7.6%).
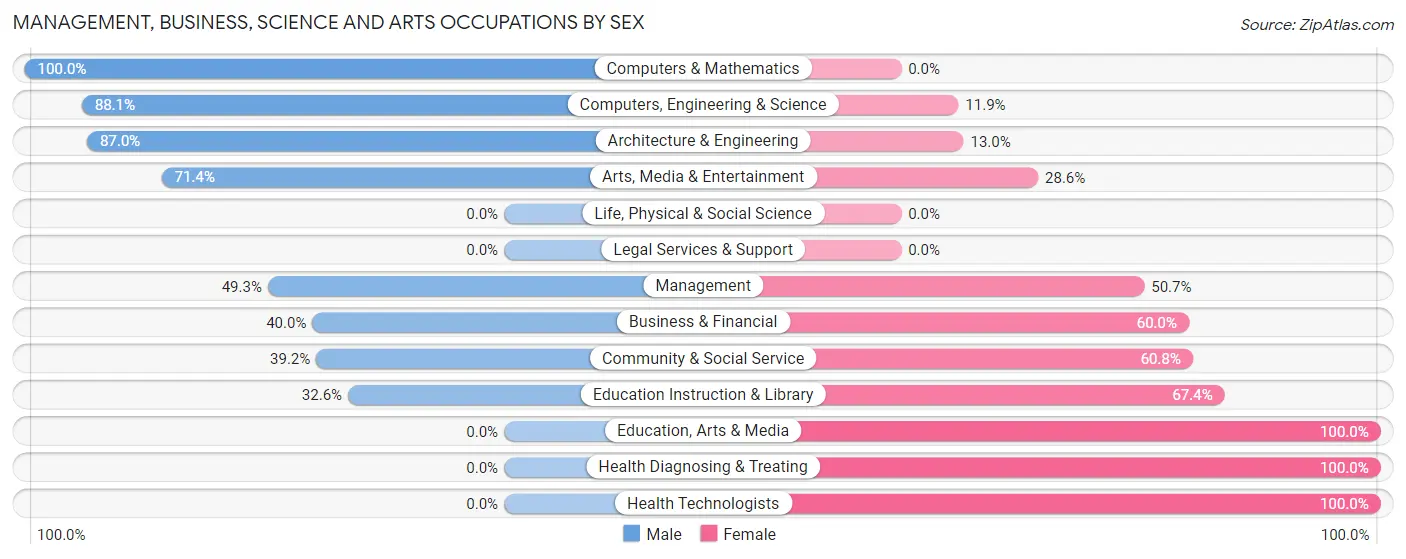
Management, Business, Science and Arts Occupations by Sex
Within the Management, Business, Science and Arts occupations in Melville, the most male-oriented occupations are Computers & Mathematics (100.0%), Computers, Engineering & Science (88.1%), and Architecture & Engineering (87.0%), while the most female-oriented occupations are Education, Arts & Media (100.0%), Health Diagnosing & Treating (100.0%), and Health Technologists (100.0%).
| Occupation | Male | Female |
| Management | 34 (49.3%) | 35 (50.7%) |
| Business & Financial | 20 (40.0%) | 30 (60.0%) |
| Computers, Engineering & Science | 118 (88.1%) | 16 (11.9%) |
| Computers & Mathematics | 11 (100.0%) | 0 (0.0%) |
| Architecture & Engineering | 107 (87.0%) | 16 (13.0%) |
| Life, Physical & Social Science | 0 (0.0%) | 0 (0.0%) |
| Community & Social Service | 29 (39.2%) | 45 (60.8%) |
| Education, Arts & Media | 0 (0.0%) | 10 (100.0%) |
| Legal Services & Support | 0 (0.0%) | 0 (0.0%) |
| Education Instruction & Library | 14 (32.6%) | 29 (67.4%) |
| Arts, Media & Entertainment | 15 (71.4%) | 6 (28.6%) |
| Health Diagnosing & Treating | 0 (0.0%) | 21 (100.0%) |
| Health Technologists | 0 (0.0%) | 21 (100.0%) |
| Total (Category) | 201 (57.8%) | 147 (42.2%) |
| Total (Overall) | 360 (54.9%) | 296 (45.1%) |
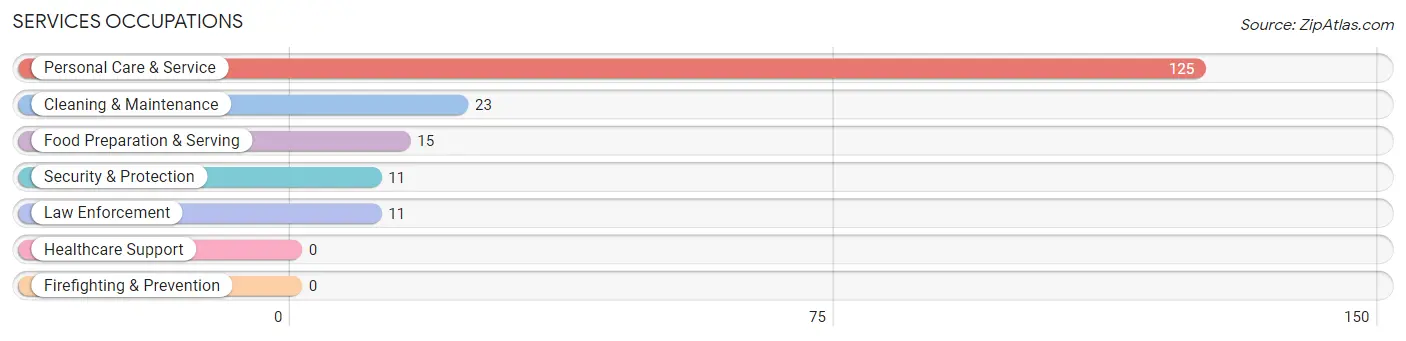
Services Occupations
The most common Services occupations in Melville are Personal Care & Service (125 | 19.1%), Cleaning & Maintenance (23 | 3.5%), Food Preparation & Serving (15 | 2.3%), Security & Protection (11 | 1.7%), and Law Enforcement (11 | 1.7%).
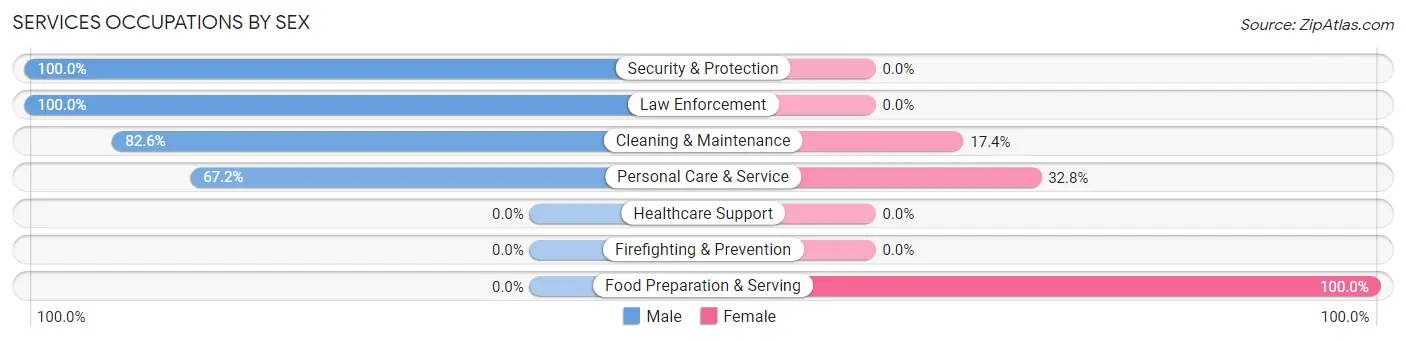
Services Occupations by Sex
Within the Services occupations in Melville, the most male-oriented occupations are Security & Protection (100.0%), Law Enforcement (100.0%), and Cleaning & Maintenance (82.6%), while the most female-oriented occupations are Food Preparation & Serving (100.0%), Personal Care & Service (32.8%), and Cleaning & Maintenance (17.4%).
| Occupation | Male | Female |
| Healthcare Support | 0 (0.0%) | 0 (0.0%) |
| Security & Protection | 11 (100.0%) | 0 (0.0%) |
| Firefighting & Prevention | 0 (0.0%) | 0 (0.0%) |
| Law Enforcement | 11 (100.0%) | 0 (0.0%) |
| Food Preparation & Serving | 0 (0.0%) | 15 (100.0%) |
| Cleaning & Maintenance | 19 (82.6%) | 4 (17.4%) |
| Personal Care & Service | 84 (67.2%) | 41 (32.8%) |
| Total (Category) | 114 (65.5%) | 60 (34.5%) |
| Total (Overall) | 360 (54.9%) | 296 (45.1%) |
Sales and Office Occupations
The most common Sales and Office occupations in Melville are Office & Administration (82 | 12.5%), and Sales & Related (19 | 2.9%).

Sales and Office Occupations by Sex

| Occupation | Male | Female |
| Sales & Related | 19 (100.0%) | 0 (0.0%) |
| Office & Administration | 0 (0.0%) | 82 (100.0%) |
| Total (Category) | 19 (18.8%) | 82 (81.2%) |
| Total (Overall) | 360 (54.9%) | 296 (45.1%) |
Natural Resources, Construction and Maintenance Occupations
The most common Natural Resources, Construction and Maintenance occupations in Melville are , and Construction & Extraction (20 | 3.0%).

Natural Resources, Construction and Maintenance Occupations by Sex

| Occupation | Male | Female |
| Farming, Fishing & Forestry | 0 (0.0%) | 0 (0.0%) |
| Construction & Extraction | 20 (100.0%) | 0 (0.0%) |
| Installation, Maintenance & Repair | 0 (0.0%) | 0 (0.0%) |
| Total (Category) | 20 (100.0%) | 0 (0.0%) |
| Total (Overall) | 360 (54.9%) | 296 (45.1%) |
Production, Transportation and Moving Occupations
The most common Production, Transportation and Moving occupations in Melville are Production (7 | 1.1%), and Transportation (6 | 0.9%).
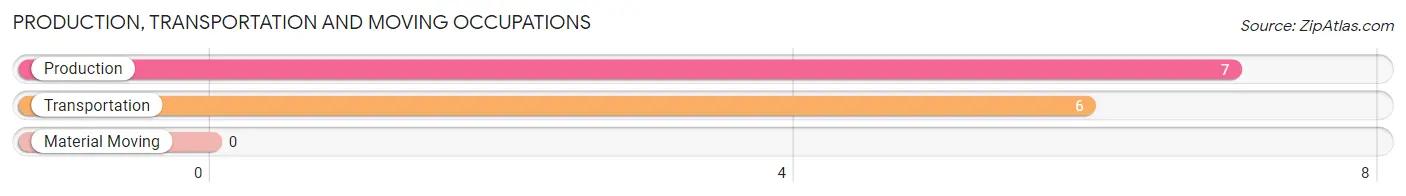
Production, Transportation and Moving Occupations by Sex
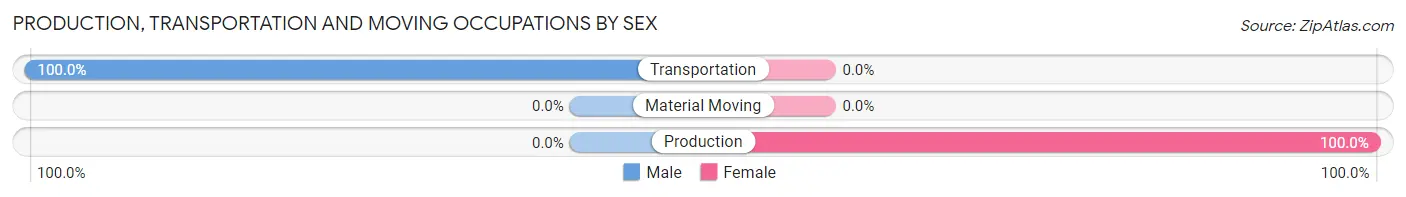
| Occupation | Male | Female |
| Production | 0 (0.0%) | 7 (100.0%) |
| Transportation | 6 (100.0%) | 0 (0.0%) |
| Material Moving | 0 (0.0%) | 0 (0.0%) |
| Total (Category) | 6 (46.2%) | 7 (53.8%) |
| Total (Overall) | 360 (54.9%) | 296 (45.1%) |
Employment Industries by Sex in Melville
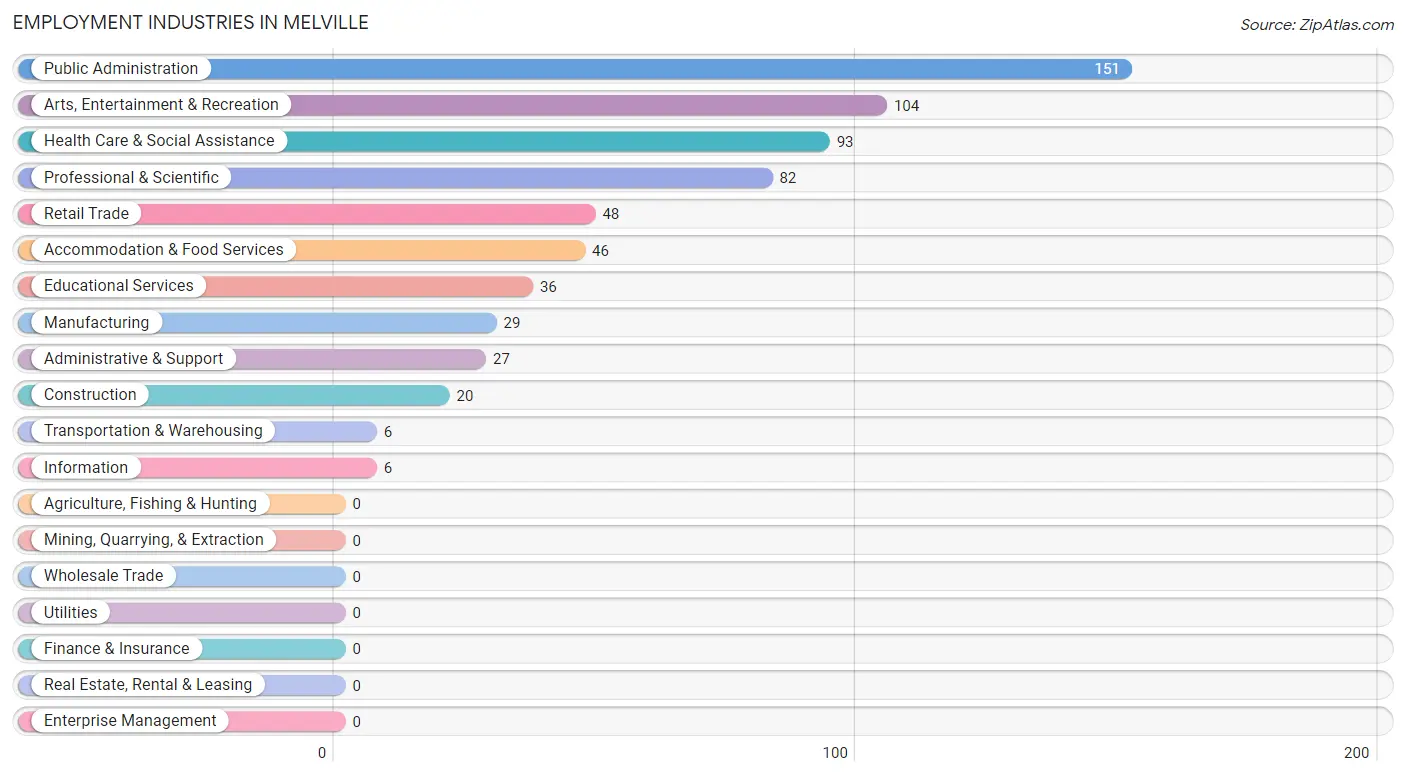
Employment Industries in Melville
The major employment industries in Melville include Public Administration (151 | 23.0%), Arts, Entertainment & Recreation (104 | 15.9%), Health Care & Social Assistance (93 | 14.2%), Professional & Scientific (82 | 12.5%), and Retail Trade (48 | 7.3%).
Employment Industries by Sex in Melville
The Melville industries that see more men than women are Construction (100.0%), Transportation & Warehousing (100.0%), and Information (100.0%), whereas the industries that tend to have a higher number of women are Health Care & Social Assistance (100.0%), Educational Services (80.6%), and Retail Trade (70.8%).
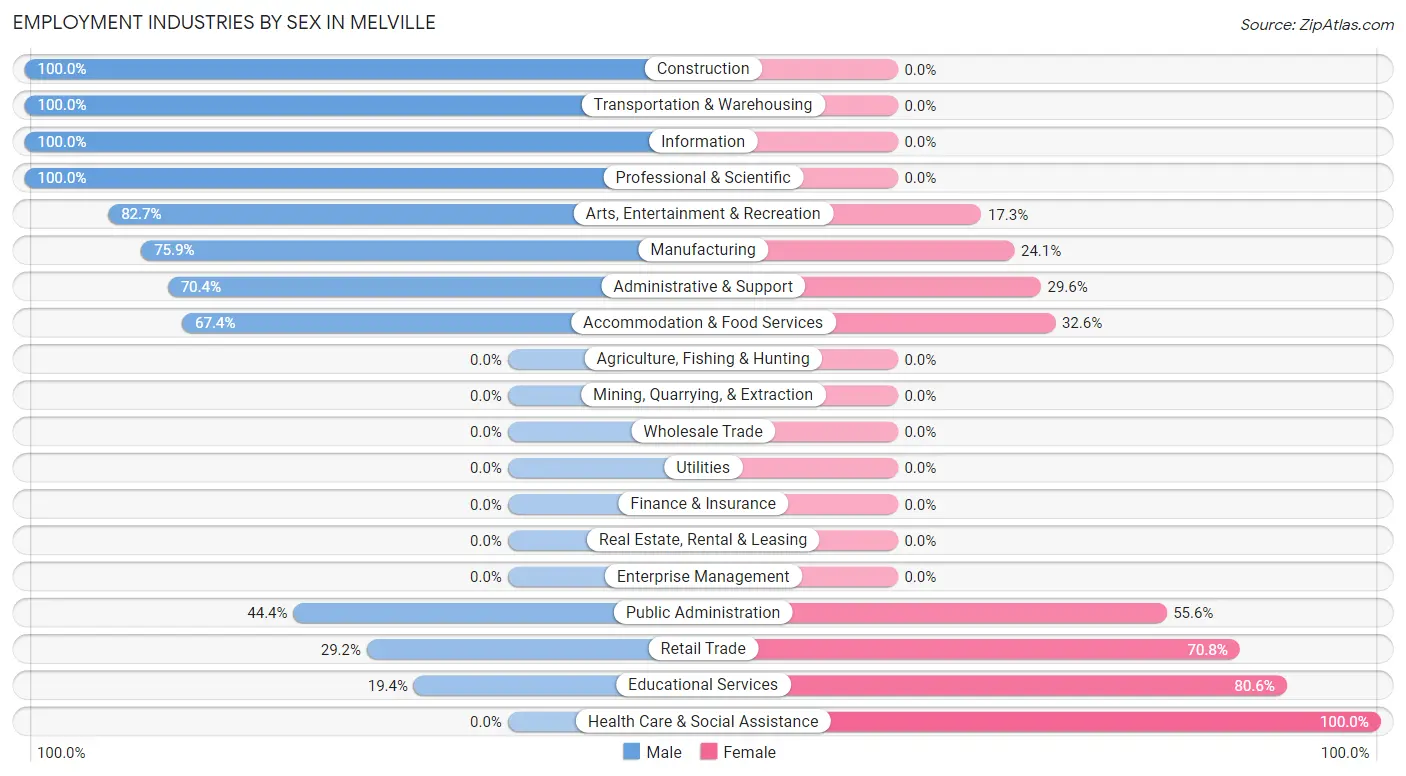
| Industry | Male | Female |
| Agriculture, Fishing & Hunting | 0 (0.0%) | 0 (0.0%) |
| Mining, Quarrying, & Extraction | 0 (0.0%) | 0 (0.0%) |
| Construction | 20 (100.0%) | 0 (0.0%) |
| Manufacturing | 22 (75.9%) | 7 (24.1%) |
| Wholesale Trade | 0 (0.0%) | 0 (0.0%) |
| Retail Trade | 14 (29.2%) | 34 (70.8%) |
| Transportation & Warehousing | 6 (100.0%) | 0 (0.0%) |
| Utilities | 0 (0.0%) | 0 (0.0%) |
| Information | 6 (100.0%) | 0 (0.0%) |
| Finance & Insurance | 0 (0.0%) | 0 (0.0%) |
| Real Estate, Rental & Leasing | 0 (0.0%) | 0 (0.0%) |
| Professional & Scientific | 82 (100.0%) | 0 (0.0%) |
| Enterprise Management | 0 (0.0%) | 0 (0.0%) |
| Administrative & Support | 19 (70.4%) | 8 (29.6%) |
| Educational Services | 7 (19.4%) | 29 (80.6%) |
| Health Care & Social Assistance | 0 (0.0%) | 93 (100.0%) |
| Arts, Entertainment & Recreation | 86 (82.7%) | 18 (17.3%) |
| Accommodation & Food Services | 31 (67.4%) | 15 (32.6%) |
| Public Administration | 67 (44.4%) | 84 (55.6%) |
| Total | 360 (54.9%) | 296 (45.1%) |
Education in Melville
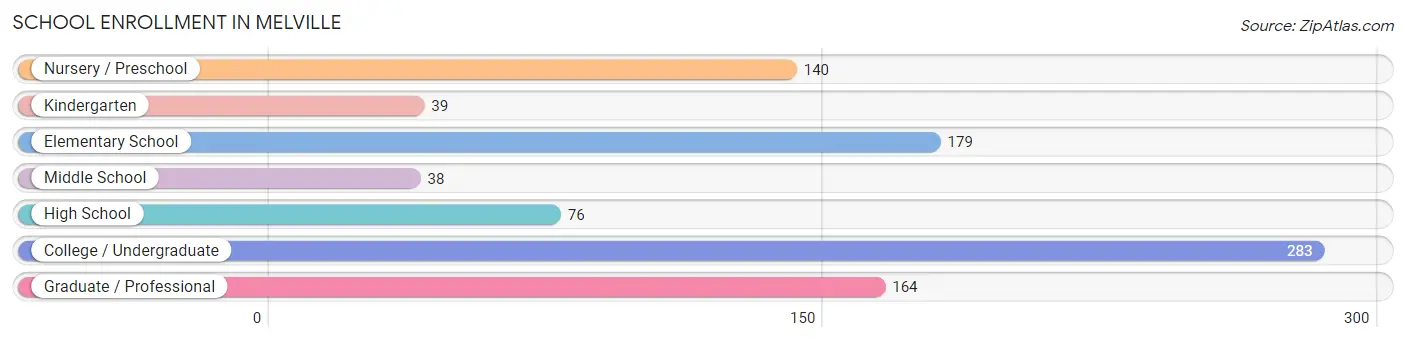
School Enrollment in Melville
The most common levels of schooling among the 919 students in Melville are college / undergraduate (283 | 30.8%), elementary school (179 | 19.5%), and graduate / professional (164 | 17.8%).
| School Level | # Students | % Students |
| Nursery / Preschool | 140 | 15.2% |
| Kindergarten | 39 | 4.2% |
| Elementary School | 179 | 19.5% |
| Middle School | 38 | 4.1% |
| High School | 76 | 8.3% |
| College / Undergraduate | 283 | 30.8% |
| Graduate / Professional | 164 | 17.8% |
| Total | 919 | 100.0% |
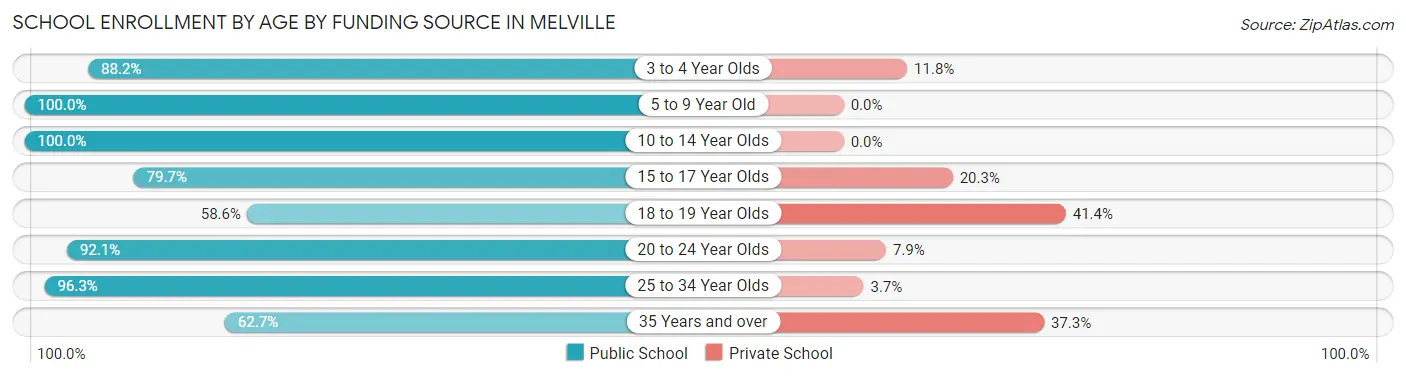
School Enrollment by Age by Funding Source in Melville
Out of a total of 919 students who are enrolled in schools in Melville, 104 (11.3%) attend a private institution, while the remaining 815 (88.7%) are enrolled in public schools. The age group of 18 to 19 year olds has the highest likelihood of being enrolled in private schools, with 12 (41.4% in the age bracket) enrolled. Conversely, the age group of 5 to 9 year old has the lowest likelihood of being enrolled in a private school, with 230 (100.0% in the age bracket) attending a public institution.
| Age Bracket | Public School | Private School |
| 3 to 4 Year Olds | 82 (88.2%) | 11 (11.8%) |
| 5 to 9 Year Old | 230 (100.0%) | 0 (0.0%) |
| 10 to 14 Year Olds | 85 (100.0%) | 0 (0.0%) |
| 15 to 17 Year Olds | 51 (79.7%) | 13 (20.3%) |
| 18 to 19 Year Olds | 17 (58.6%) | 12 (41.4%) |
| 20 to 24 Year Olds | 105 (92.1%) | 9 (7.9%) |
| 25 to 34 Year Olds | 156 (96.3%) | 6 (3.7%) |
| 35 Years and over | 89 (62.7%) | 53 (37.3%) |
| Total | 815 (88.7%) | 104 (11.3%) |
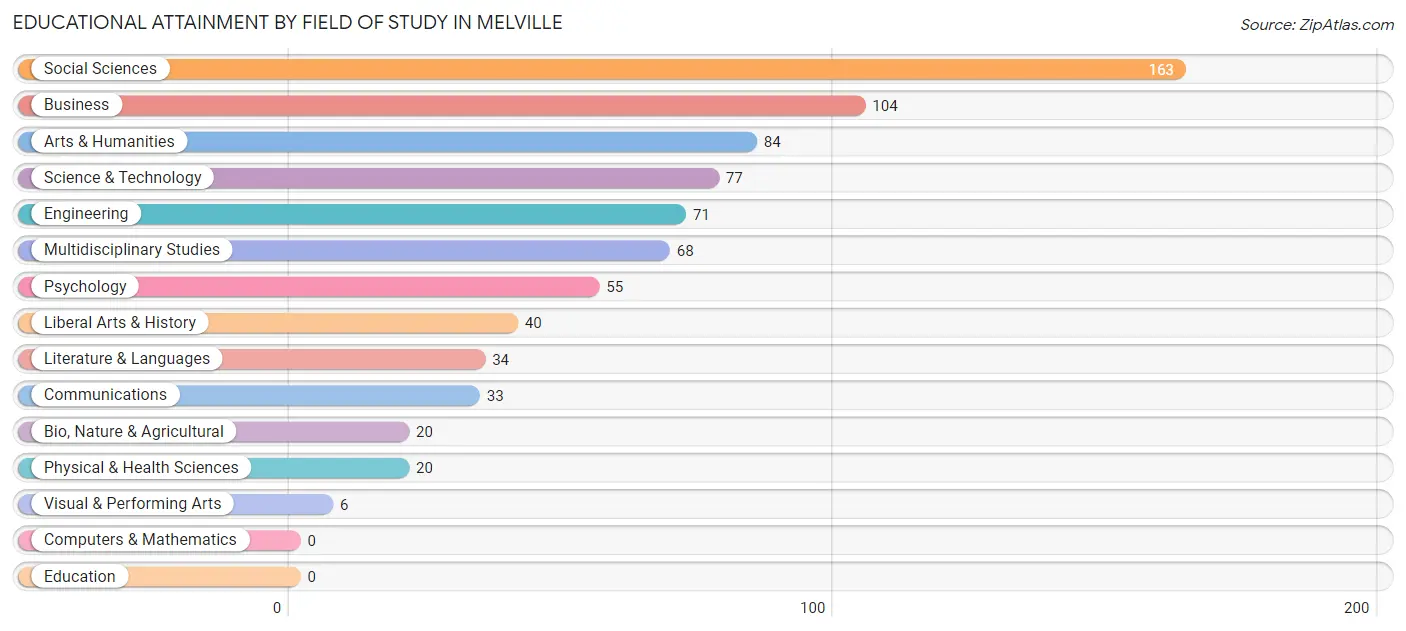
Educational Attainment by Field of Study in Melville
Social sciences (163 | 21.0%), business (104 | 13.4%), arts & humanities (84 | 10.8%), science & technology (77 | 9.9%), and engineering (71 | 9.2%) are the most common fields of study among 775 individuals in Melville who have obtained a bachelor's degree or higher.
| Field of Study | # Graduates | % Graduates |
| Computers & Mathematics | 0 | 0.0% |
| Bio, Nature & Agricultural | 20 | 2.6% |
| Physical & Health Sciences | 20 | 2.6% |
| Psychology | 55 | 7.1% |
| Social Sciences | 163 | 21.0% |
| Engineering | 71 | 9.2% |
| Multidisciplinary Studies | 68 | 8.8% |
| Science & Technology | 77 | 9.9% |
| Business | 104 | 13.4% |
| Education | 0 | 0.0% |
| Literature & Languages | 34 | 4.4% |
| Liberal Arts & History | 40 | 5.2% |
| Visual & Performing Arts | 6 | 0.8% |
| Communications | 33 | 4.3% |
| Arts & Humanities | 84 | 10.8% |
| Total | 775 | 100.0% |
Transportation & Commute in Melville
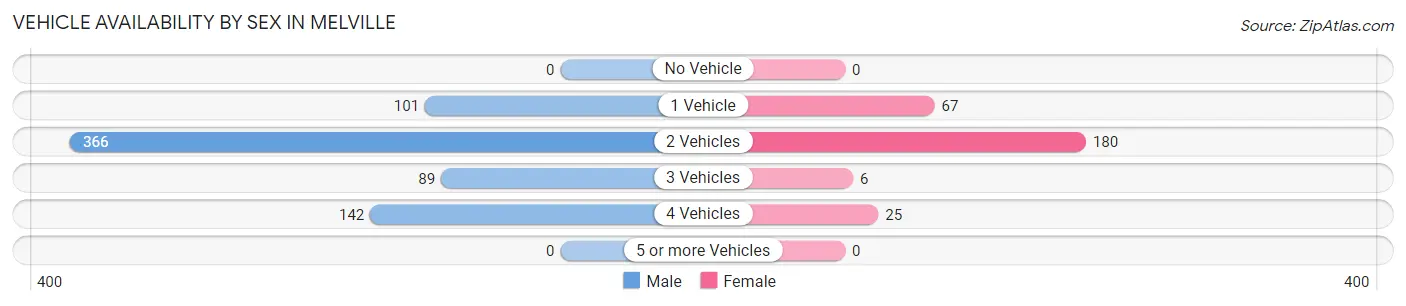
Vehicle Availability by Sex in Melville
The most prevalent vehicle ownership categories in Melville are males with 2 vehicles (366, accounting for 52.4%) and females with 2 vehicles (180, making up 131.7%).
| Vehicles Available | Male | Female |
| No Vehicle | 0 (0.0%) | 0 (0.0%) |
| 1 Vehicle | 101 (14.5%) | 67 (24.1%) |
| 2 Vehicles | 366 (52.4%) | 180 (64.7%) |
| 3 Vehicles | 89 (12.8%) | 6 (2.2%) |
| 4 Vehicles | 142 (20.3%) | 25 (9.0%) |
| 5 or more Vehicles | 0 (0.0%) | 0 (0.0%) |
| Total | 698 (100.0%) | 278 (100.0%) |
Commute Time in Melville
The most frequently occuring commute durations in Melville are 10 to 14 minutes (340 commuters, 37.5%), 5 to 9 minutes (317 commuters, 34.9%), and 15 to 19 minutes (111 commuters, 12.2%).
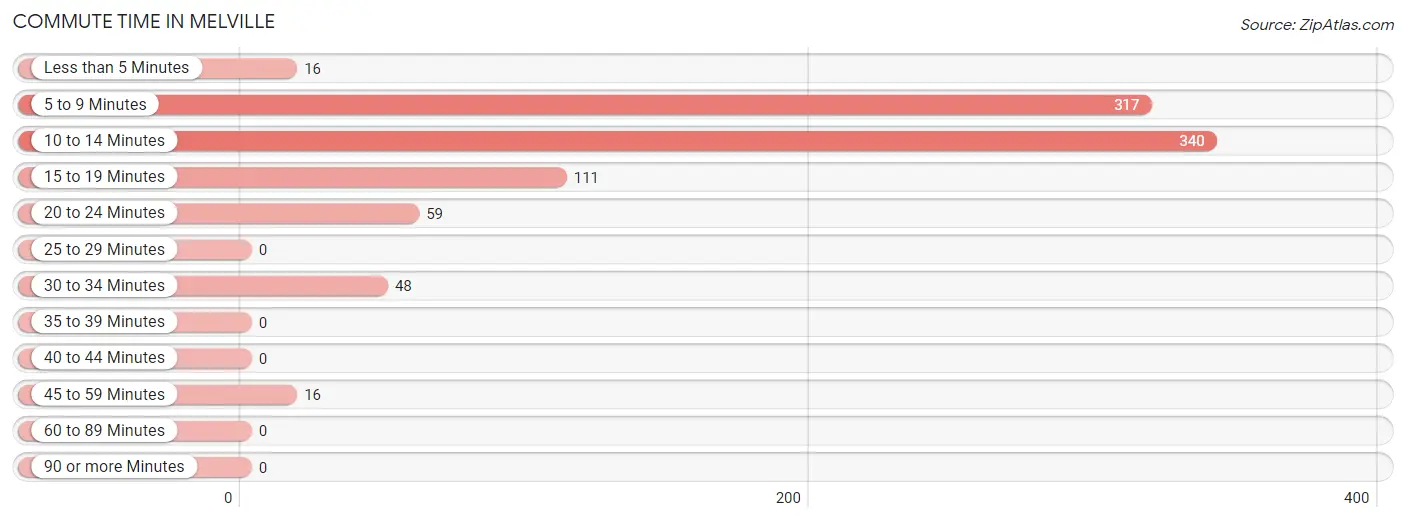
| Commute Time | # Commuters | % Commuters |
| Less than 5 Minutes | 16 | 1.8% |
| 5 to 9 Minutes | 317 | 34.9% |
| 10 to 14 Minutes | 340 | 37.5% |
| 15 to 19 Minutes | 111 | 12.2% |
| 20 to 24 Minutes | 59 | 6.5% |
| 25 to 29 Minutes | 0 | 0.0% |
| 30 to 34 Minutes | 48 | 5.3% |
| 35 to 39 Minutes | 0 | 0.0% |
| 40 to 44 Minutes | 0 | 0.0% |
| 45 to 59 Minutes | 16 | 1.8% |
| 60 to 89 Minutes | 0 | 0.0% |
| 90 or more Minutes | 0 | 0.0% |
Commute Time by Sex in Melville
The most common commute times in Melville are 10 to 14 minutes (259 commuters, 37.4%) for males and 5 to 9 minutes (93 commuters, 43.3%) for females.
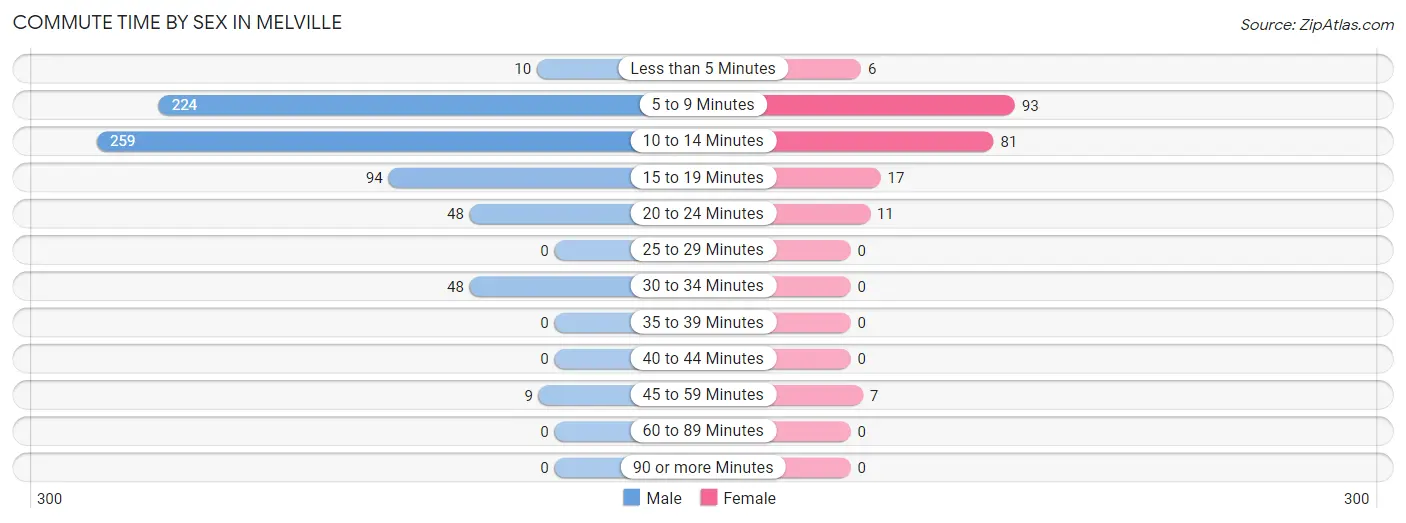
| Commute Time | Male | Female |
| Less than 5 Minutes | 10 (1.5%) | 6 (2.8%) |
| 5 to 9 Minutes | 224 (32.4%) | 93 (43.3%) |
| 10 to 14 Minutes | 259 (37.4%) | 81 (37.7%) |
| 15 to 19 Minutes | 94 (13.6%) | 17 (7.9%) |
| 20 to 24 Minutes | 48 (6.9%) | 11 (5.1%) |
| 25 to 29 Minutes | 0 (0.0%) | 0 (0.0%) |
| 30 to 34 Minutes | 48 (6.9%) | 0 (0.0%) |
| 35 to 39 Minutes | 0 (0.0%) | 0 (0.0%) |
| 40 to 44 Minutes | 0 (0.0%) | 0 (0.0%) |
| 45 to 59 Minutes | 9 (1.3%) | 7 (3.3%) |
| 60 to 89 Minutes | 0 (0.0%) | 0 (0.0%) |
| 90 or more Minutes | 0 (0.0%) | 0 (0.0%) |
Time of Departure to Work by Sex in Melville
The most frequent times of departure to work in Melville are 7:30 AM to 7:59 AM (262, 37.9%) for males and 6:30 AM to 6:59 AM (72, 33.5%) for females.
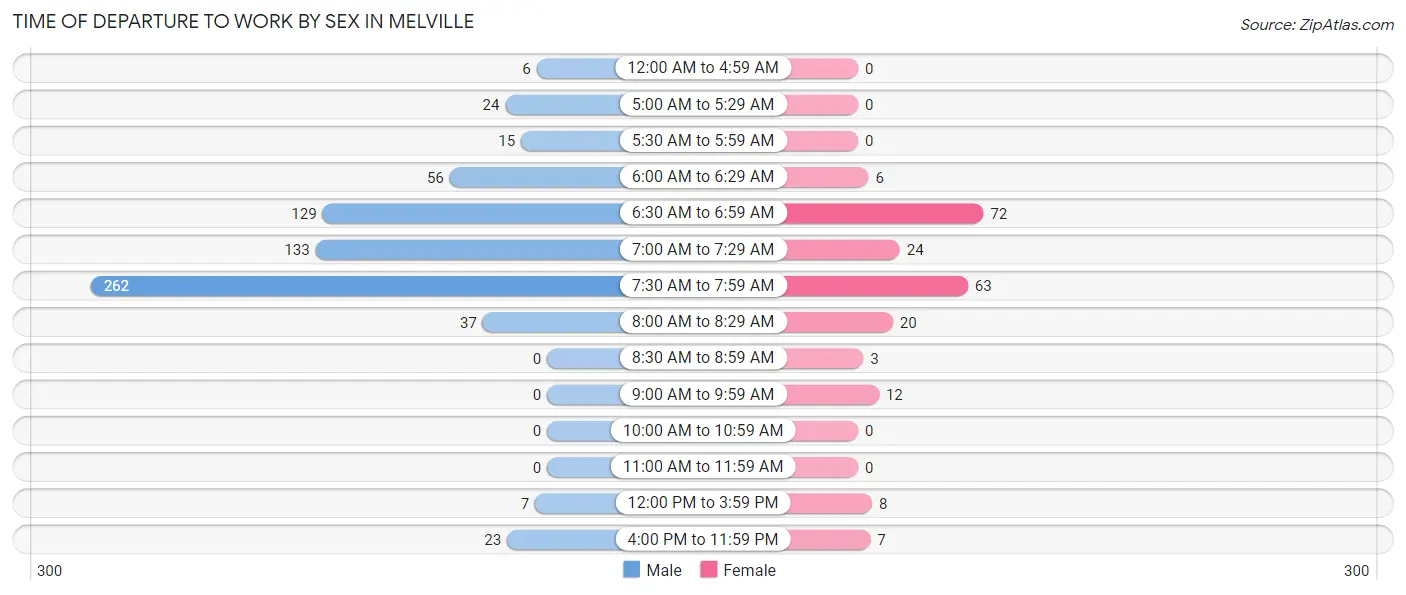
| Time of Departure | Male | Female |
| 12:00 AM to 4:59 AM | 6 (0.9%) | 0 (0.0%) |
| 5:00 AM to 5:29 AM | 24 (3.5%) | 0 (0.0%) |
| 5:30 AM to 5:59 AM | 15 (2.2%) | 0 (0.0%) |
| 6:00 AM to 6:29 AM | 56 (8.1%) | 6 (2.8%) |
| 6:30 AM to 6:59 AM | 129 (18.6%) | 72 (33.5%) |
| 7:00 AM to 7:29 AM | 133 (19.2%) | 24 (11.2%) |
| 7:30 AM to 7:59 AM | 262 (37.9%) | 63 (29.3%) |
| 8:00 AM to 8:29 AM | 37 (5.3%) | 20 (9.3%) |
| 8:30 AM to 8:59 AM | 0 (0.0%) | 3 (1.4%) |
| 9:00 AM to 9:59 AM | 0 (0.0%) | 12 (5.6%) |
| 10:00 AM to 10:59 AM | 0 (0.0%) | 0 (0.0%) |
| 11:00 AM to 11:59 AM | 0 (0.0%) | 0 (0.0%) |
| 12:00 PM to 3:59 PM | 7 (1.0%) | 8 (3.7%) |
| 4:00 PM to 11:59 PM | 23 (3.3%) | 7 (3.3%) |
| Total | 692 (100.0%) | 215 (100.0%) |
Housing Occupancy in Melville
Occupancy by Ownership in Melville
Of the total 564 dwellings in Melville, owner-occupied units account for 22 (3.9%), while renter-occupied units make up 542 (96.1%).
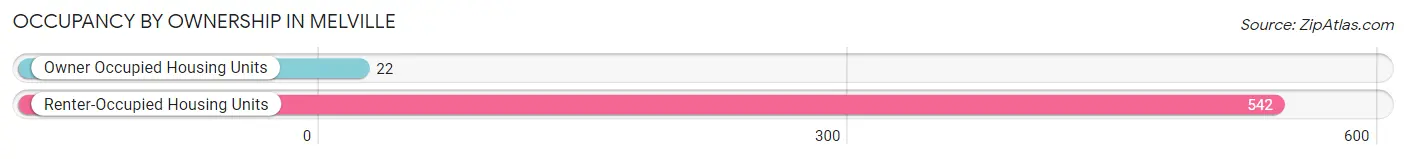
| Occupancy | # Housing Units | % Housing Units |
| Owner Occupied Housing Units | 22 | 3.9% |
| Renter-Occupied Housing Units | 542 | 96.1% |
| Total Occupied Housing Units | 564 | 100.0% |
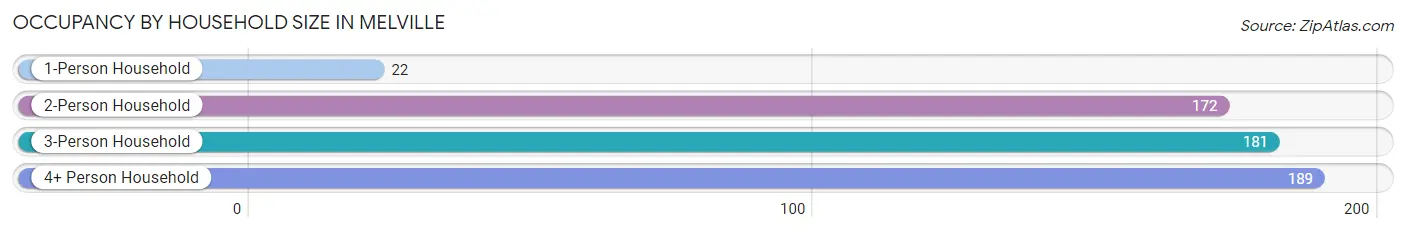
Occupancy by Household Size in Melville
| Household Size | # Housing Units | % Housing Units |
| 1-Person Household | 22 | 3.9% |
| 2-Person Household | 172 | 30.5% |
| 3-Person Household | 181 | 32.1% |
| 4+ Person Household | 189 | 33.5% |
| Total Housing Units | 564 | 100.0% |
Occupancy by Ownership by Household Size in Melville
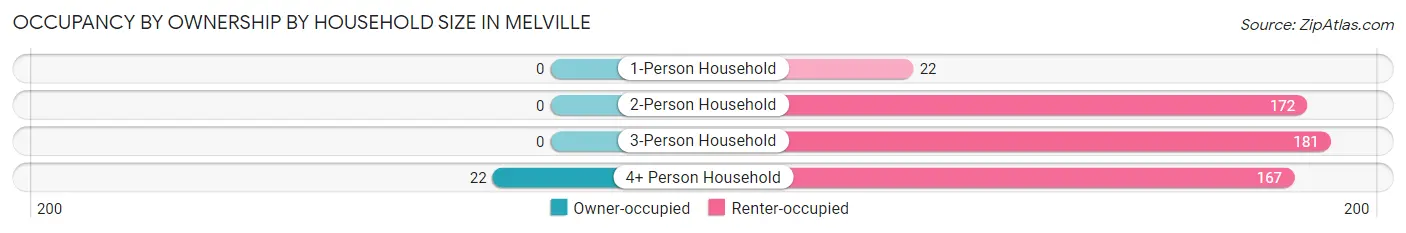
| Household Size | Owner-occupied | Renter-occupied |
| 1-Person Household | 0 (0.0%) | 22 (100.0%) |
| 2-Person Household | 0 (0.0%) | 172 (100.0%) |
| 3-Person Household | 0 (0.0%) | 181 (100.0%) |
| 4+ Person Household | 22 (11.6%) | 167 (88.4%) |
| Total Housing Units | 22 (3.9%) | 542 (96.1%) |
Occupancy by Educational Attainment in Melville
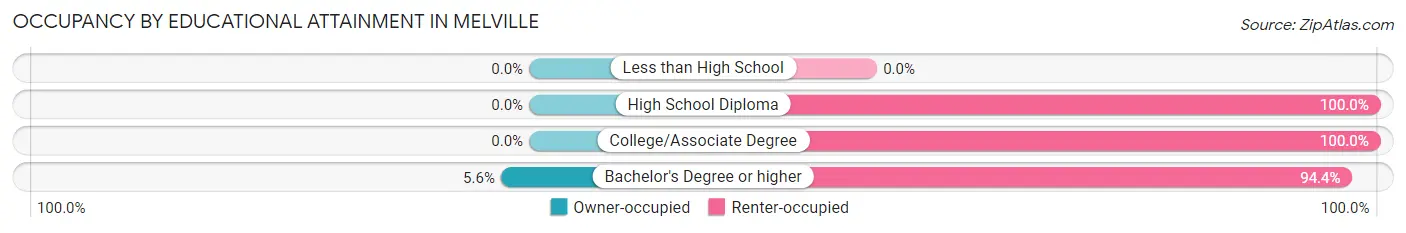
| Household Size | Owner-occupied | Renter-occupied |
| Less than High School | 0 (0.0%) | 0 (0.0%) |
| High School Diploma | 0 (0.0%) | 46 (100.0%) |
| College/Associate Degree | 0 (0.0%) | 125 (100.0%) |
| Bachelor's Degree or higher | 22 (5.6%) | 371 (94.4%) |
Occupancy by Age of Householder in Melville
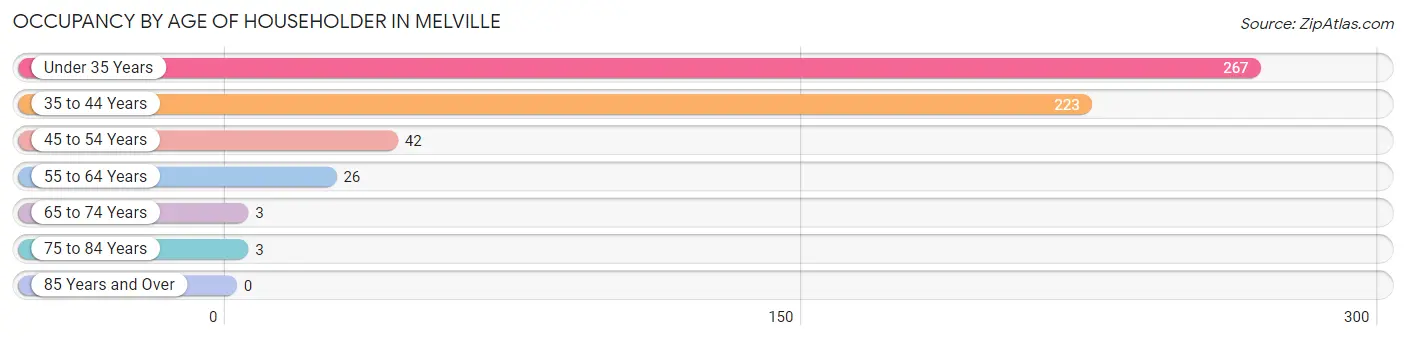
| Age Bracket | # Households | % Households |
| Under 35 Years | 267 | 47.3% |
| 35 to 44 Years | 223 | 39.5% |
| 45 to 54 Years | 42 | 7.4% |
| 55 to 64 Years | 26 | 4.6% |
| 65 to 74 Years | 3 | 0.5% |
| 75 to 84 Years | 3 | 0.5% |
| 85 Years and Over | 0 | 0.0% |
| Total | 564 | 100.0% |
Housing Finances in Melville
Median Income by Occupancy in Melville
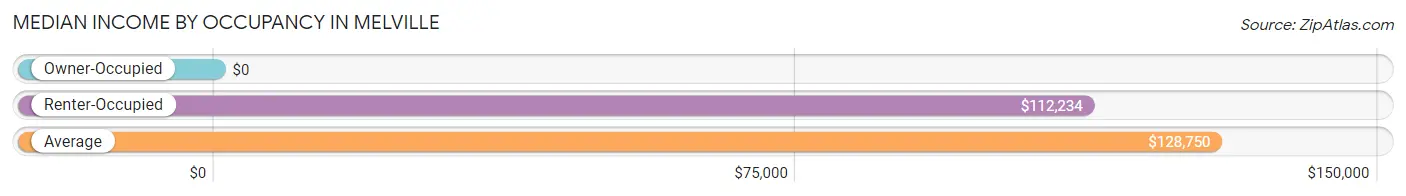
| Occupancy Type | # Households | Median Income |
| Owner-Occupied | 22 (3.9%) | $0 |
| Renter-Occupied | 542 (96.1%) | $112,234 |
| Average | 564 (100.0%) | $128,750 |
Occupancy by Householder Income Bracket in Melville
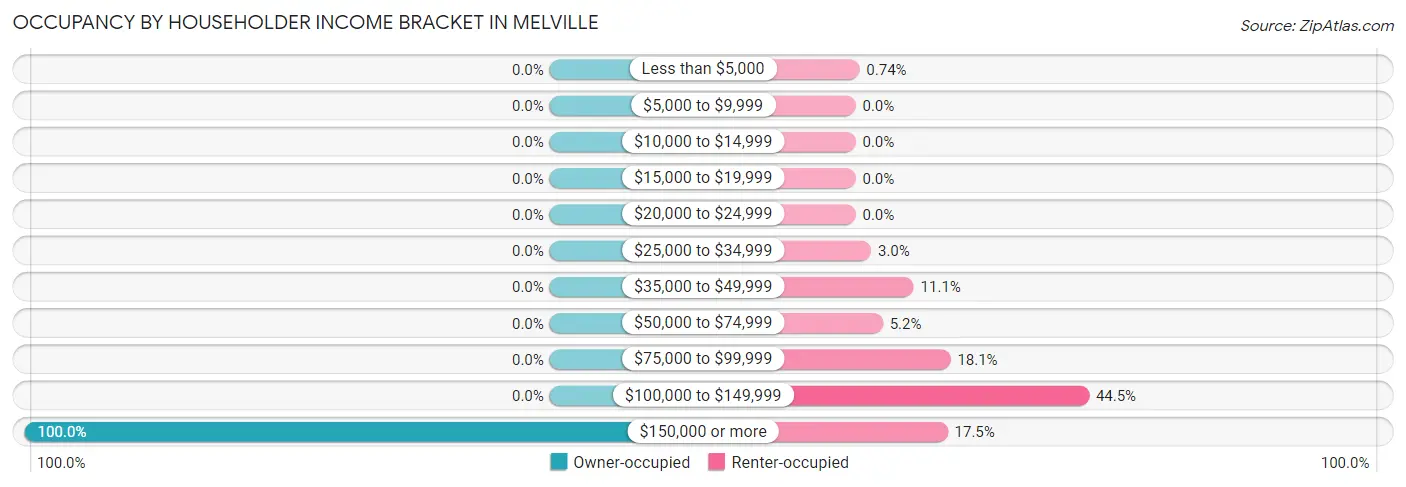
| Income Bracket | Owner-occupied | Renter-occupied |
| Less than $5,000 | 0 (0.0%) | 4 (0.7%) |
| $5,000 to $9,999 | 0 (0.0%) | 0 (0.0%) |
| $10,000 to $14,999 | 0 (0.0%) | 0 (0.0%) |
| $15,000 to $19,999 | 0 (0.0%) | 0 (0.0%) |
| $20,000 to $24,999 | 0 (0.0%) | 0 (0.0%) |
| $25,000 to $34,999 | 0 (0.0%) | 16 (2.9%) |
| $35,000 to $49,999 | 0 (0.0%) | 60 (11.1%) |
| $50,000 to $74,999 | 0 (0.0%) | 28 (5.2%) |
| $75,000 to $99,999 | 0 (0.0%) | 98 (18.1%) |
| $100,000 to $149,999 | 0 (0.0%) | 241 (44.5%) |
| $150,000 or more | 22 (100.0%) | 95 (17.5%) |
| Total | 22 (100.0%) | 542 (100.0%) |
Monthly Housing Cost Tiers in Melville
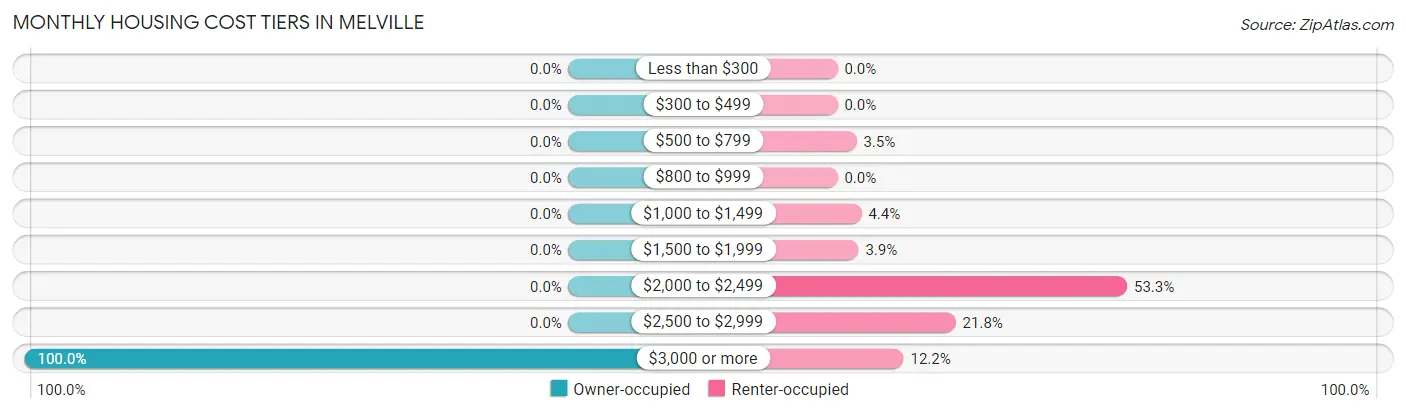
| Monthly Cost | Owner-occupied | Renter-occupied |
| Less than $300 | 0 (0.0%) | 0 (0.0%) |
| $300 to $499 | 0 (0.0%) | 0 (0.0%) |
| $500 to $799 | 0 (0.0%) | 19 (3.5%) |
| $800 to $999 | 0 (0.0%) | 0 (0.0%) |
| $1,000 to $1,499 | 0 (0.0%) | 24 (4.4%) |
| $1,500 to $1,999 | 0 (0.0%) | 21 (3.9%) |
| $2,000 to $2,499 | 0 (0.0%) | 289 (53.3%) |
| $2,500 to $2,999 | 0 (0.0%) | 118 (21.8%) |
| $3,000 or more | 22 (100.0%) | 66 (12.2%) |
| Total | 22 (100.0%) | 542 (100.0%) |
Physical Housing Characteristics in Melville
Housing Structures in Melville
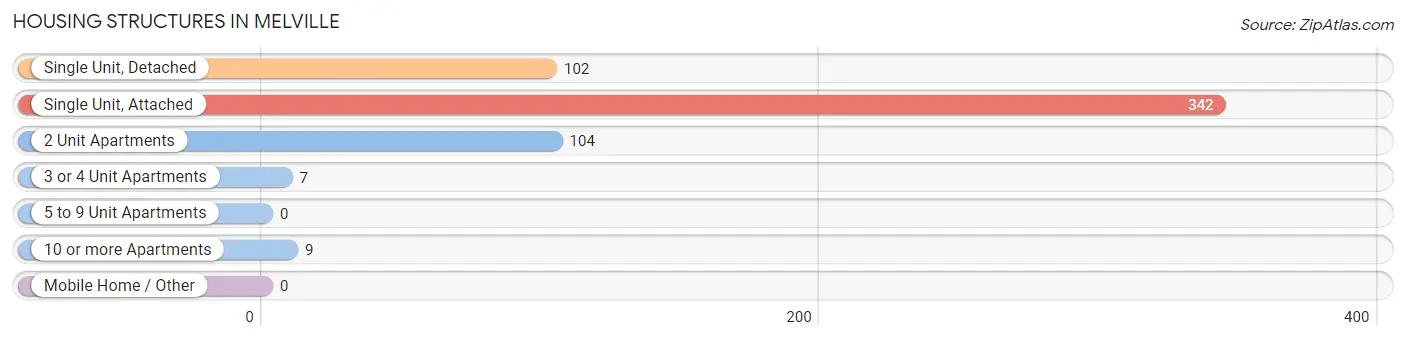
| Structure Type | # Housing Units | % Housing Units |
| Single Unit, Detached | 102 | 18.1% |
| Single Unit, Attached | 342 | 60.6% |
| 2 Unit Apartments | 104 | 18.4% |
| 3 or 4 Unit Apartments | 7 | 1.2% |
| 5 to 9 Unit Apartments | 0 | 0.0% |
| 10 or more Apartments | 9 | 1.6% |
| Mobile Home / Other | 0 | 0.0% |
| Total | 564 | 100.0% |
Housing Structures by Occupancy in Melville
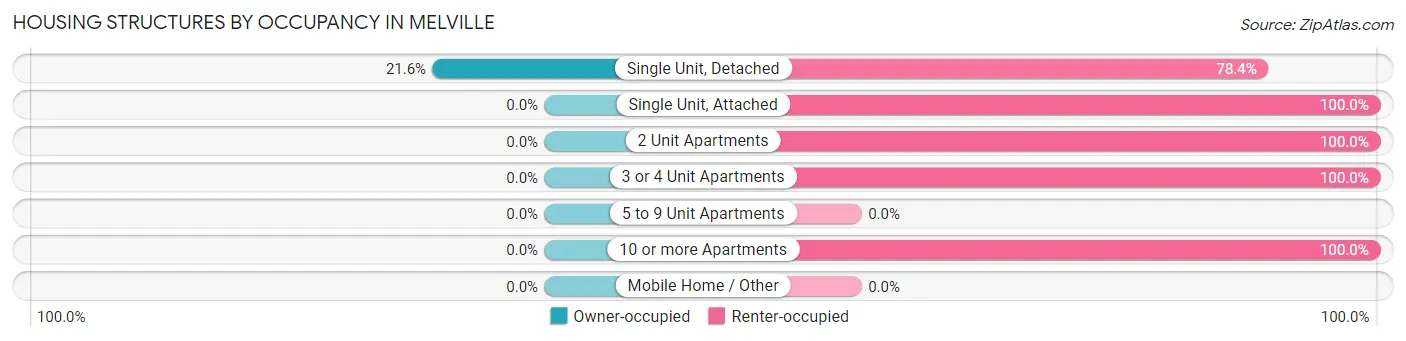
| Structure Type | Owner-occupied | Renter-occupied |
| Single Unit, Detached | 22 (21.6%) | 80 (78.4%) |
| Single Unit, Attached | 0 (0.0%) | 342 (100.0%) |
| 2 Unit Apartments | 0 (0.0%) | 104 (100.0%) |
| 3 or 4 Unit Apartments | 0 (0.0%) | 7 (100.0%) |
| 5 to 9 Unit Apartments | 0 (0.0%) | 0 (0.0%) |
| 10 or more Apartments | 0 (0.0%) | 9 (100.0%) |
| Mobile Home / Other | 0 (0.0%) | 0 (0.0%) |
| Total | 22 (3.9%) | 542 (96.1%) |
Housing Structures by Number of Rooms in Melville
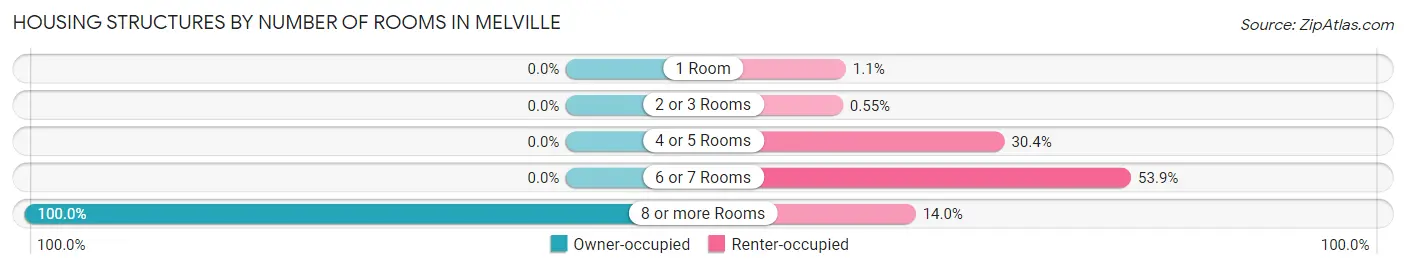
| Number of Rooms | Owner-occupied | Renter-occupied |
| 1 Room | 0 (0.0%) | 6 (1.1%) |
| 2 or 3 Rooms | 0 (0.0%) | 3 (0.5%) |
| 4 or 5 Rooms | 0 (0.0%) | 165 (30.4%) |
| 6 or 7 Rooms | 0 (0.0%) | 292 (53.9%) |
| 8 or more Rooms | 22 (100.0%) | 76 (14.0%) |
| Total | 22 (100.0%) | 542 (100.0%) |
Housing Structure by Heating Type in Melville
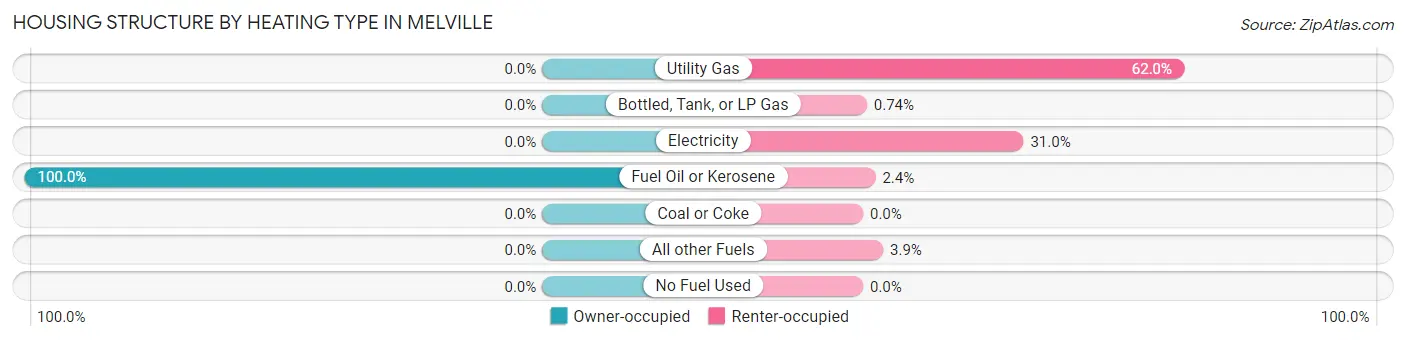
| Heating Type | Owner-occupied | Renter-occupied |
| Utility Gas | 0 (0.0%) | 336 (62.0%) |
| Bottled, Tank, or LP Gas | 0 (0.0%) | 4 (0.7%) |
| Electricity | 0 (0.0%) | 168 (31.0%) |
| Fuel Oil or Kerosene | 22 (100.0%) | 13 (2.4%) |
| Coal or Coke | 0 (0.0%) | 0 (0.0%) |
| All other Fuels | 0 (0.0%) | 21 (3.9%) |
| No Fuel Used | 0 (0.0%) | 0 (0.0%) |
| Total | 22 (100.0%) | 542 (100.0%) |
Household Vehicle Usage in Melville
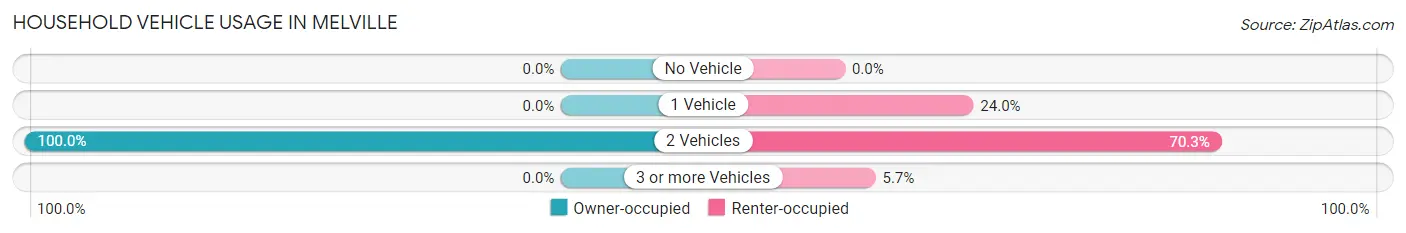
| Vehicles per Household | Owner-occupied | Renter-occupied |
| No Vehicle | 0 (0.0%) | 0 (0.0%) |
| 1 Vehicle | 0 (0.0%) | 130 (24.0%) |
| 2 Vehicles | 22 (100.0%) | 381 (70.3%) |
| 3 or more Vehicles | 0 (0.0%) | 31 (5.7%) |
| Total | 22 (100.0%) | 542 (100.0%) |
Real Estate & Mortgages in Melville
Real Estate and Mortgage Overview in Melville
| Characteristic | Without Mortgage | With Mortgage |
| Housing Units | 0 | 22 |
| Median Property Value | - | - |
| Median Household Income | - | - |
| Monthly Housing Costs | - | - |
| Real Estate Taxes | - | - |
Property Value by Mortgage Status in Melville
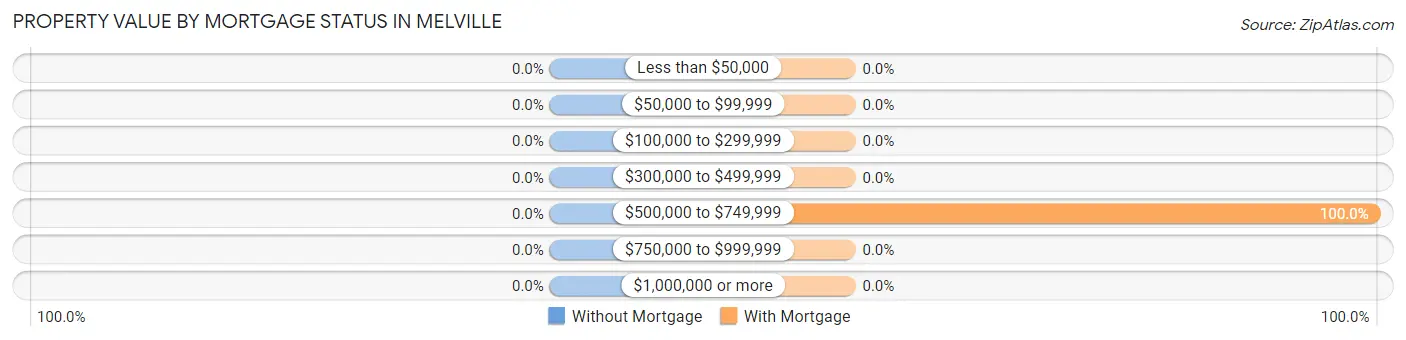
| Property Value | Without Mortgage | With Mortgage |
| Less than $50,000 | 0 (0.0%) | 0 (0.0%) |
| $50,000 to $99,999 | 0 (0.0%) | 0 (0.0%) |
| $100,000 to $299,999 | 0 (0.0%) | 0 (0.0%) |
| $300,000 to $499,999 | 0 (0.0%) | 0 (0.0%) |
| $500,000 to $749,999 | 0 (0.0%) | 22 (100.0%) |
| $750,000 to $999,999 | 0 (0.0%) | 0 (0.0%) |
| $1,000,000 or more | 0 (0.0%) | 0 (0.0%) |
| Total | 0 (0.0%) | 22 (100.0%) |
Household Income by Mortgage Status in Melville
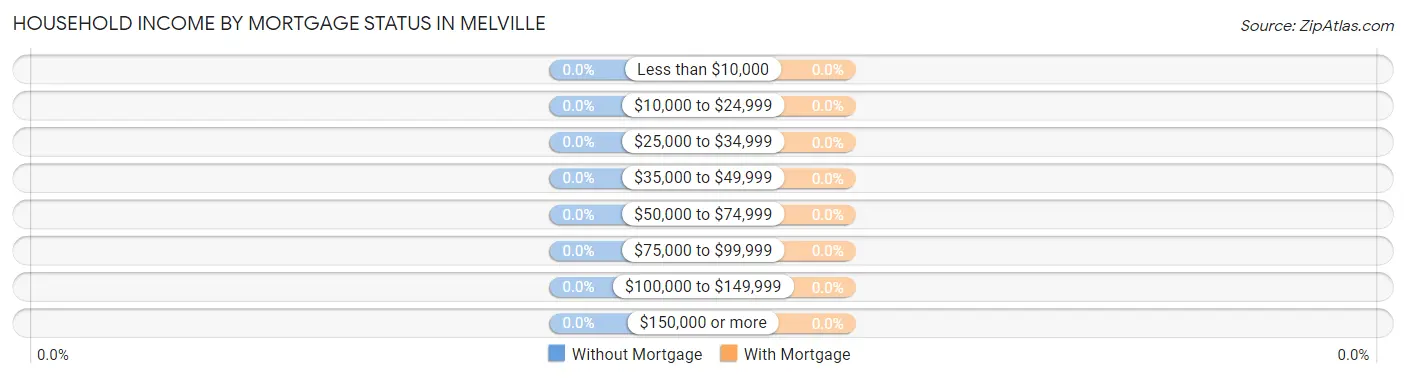
| Household Income | Without Mortgage | With Mortgage |
| Less than $10,000 | 0 (0.0%) | 0 (0.0%) |
| $10,000 to $24,999 | 0 (0.0%) | 0 (0.0%) |
| $25,000 to $34,999 | 0 (0.0%) | 0 (0.0%) |
| $35,000 to $49,999 | 0 (0.0%) | 0 (0.0%) |
| $50,000 to $74,999 | 0 (0.0%) | 0 (0.0%) |
| $75,000 to $99,999 | 0 (0.0%) | 0 (0.0%) |
| $100,000 to $149,999 | 0 (0.0%) | 0 (0.0%) |
| $150,000 or more | 0 (0.0%) | 0 (0.0%) |
| Total | 0 (0.0%) | 22 (100.0%) |
Property Value to Household Income Ratio in Melville
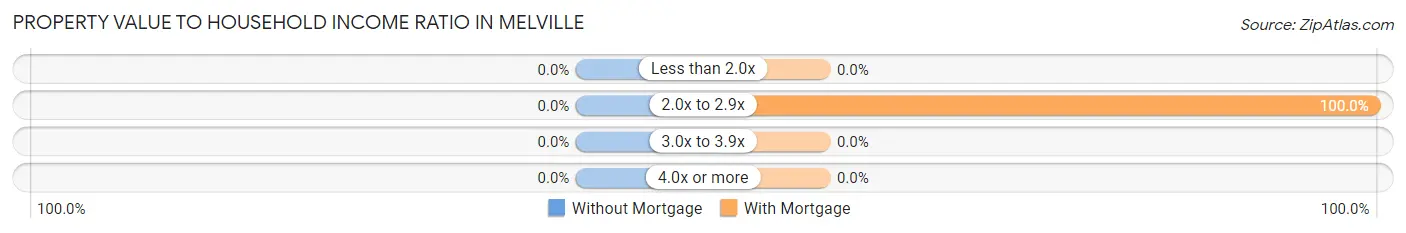
| Value-to-Income Ratio | Without Mortgage | With Mortgage |
| Less than 2.0x | 0 (0.0%) | 0 (0.0%) |
| 2.0x to 2.9x | 0 (0.0%) | 22 (100.0%) |
| 3.0x to 3.9x | 0 (0.0%) | 0 (0.0%) |
| 4.0x or more | 0 (0.0%) | 0 (0.0%) |
| Total | 0 (0.0%) | 22 (100.0%) |
Real Estate Taxes by Mortgage Status in Melville
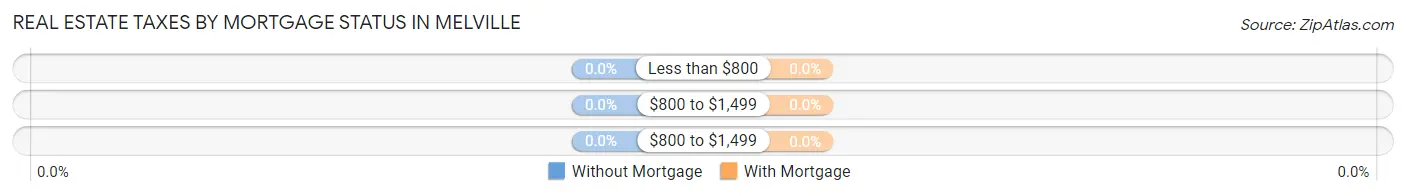
| Property Taxes | Without Mortgage | With Mortgage |
| Less than $800 | 0 (0.0%) | 0 (0.0%) |
| $800 to $1,499 | 0 (0.0%) | 0 (0.0%) |
| $800 to $1,499 | 0 (0.0%) | 0 (0.0%) |
| Total | 0 (0.0%) | 22 (100.0%) |
Health & Disability in Melville
Health Insurance Coverage by Age in Melville
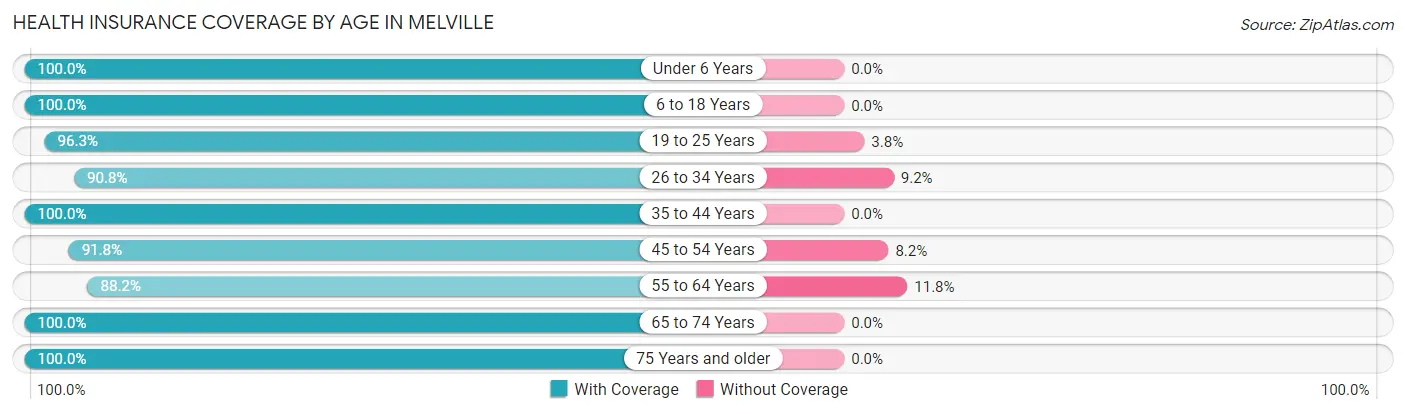
| Age Bracket | With Coverage | Without Coverage |
| Under 6 Years | 349 (100.0%) | 0 (0.0%) |
| 6 to 18 Years | 322 (100.0%) | 0 (0.0%) |
| 19 to 25 Years | 154 (96.3%) | 6 (3.7%) |
| 26 to 34 Years | 334 (90.8%) | 34 (9.2%) |
| 35 to 44 Years | 199 (100.0%) | 0 (0.0%) |
| 45 to 54 Years | 78 (91.8%) | 7 (8.2%) |
| 55 to 64 Years | 30 (88.2%) | 4 (11.8%) |
| 65 to 74 Years | 8 (100.0%) | 0 (0.0%) |
| 75 Years and older | 6 (100.0%) | 0 (0.0%) |
| Total | 1,480 (96.7%) | 51 (3.3%) |
Health Insurance Coverage by Citizenship Status in Melville
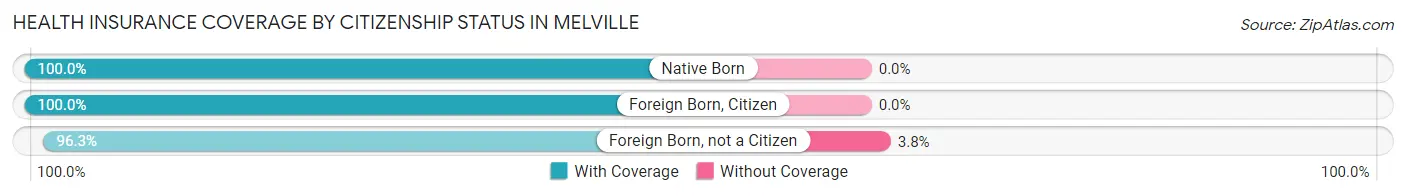
| Citizenship Status | With Coverage | Without Coverage |
| Native Born | 349 (100.0%) | 0 (0.0%) |
| Foreign Born, Citizen | 322 (100.0%) | 0 (0.0%) |
| Foreign Born, not a Citizen | 154 (96.3%) | 6 (3.7%) |
Health Insurance Coverage by Household Income in Melville
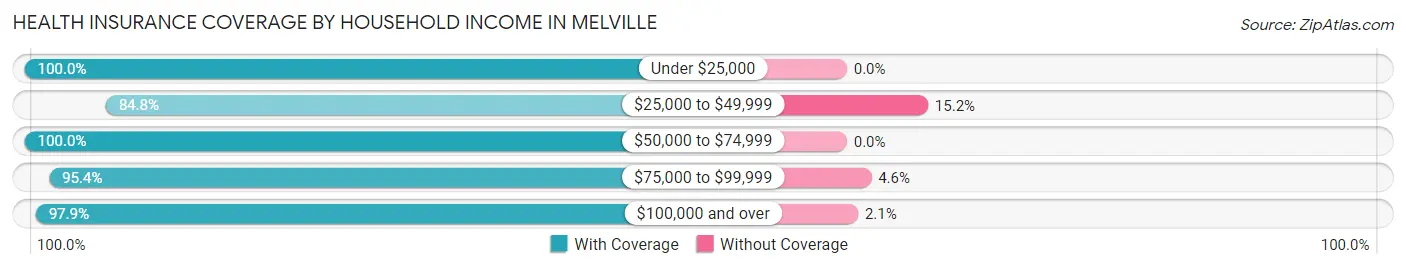
| Household Income | With Coverage | Without Coverage |
| Under $25,000 | 5 (100.0%) | 0 (0.0%) |
| $25,000 to $49,999 | 106 (84.8%) | 19 (15.2%) |
| $50,000 to $74,999 | 52 (100.0%) | 0 (0.0%) |
| $75,000 to $99,999 | 146 (95.4%) | 7 (4.6%) |
| $100,000 and over | 1,171 (97.9%) | 25 (2.1%) |
Public vs Private Health Insurance Coverage by Age in Melville
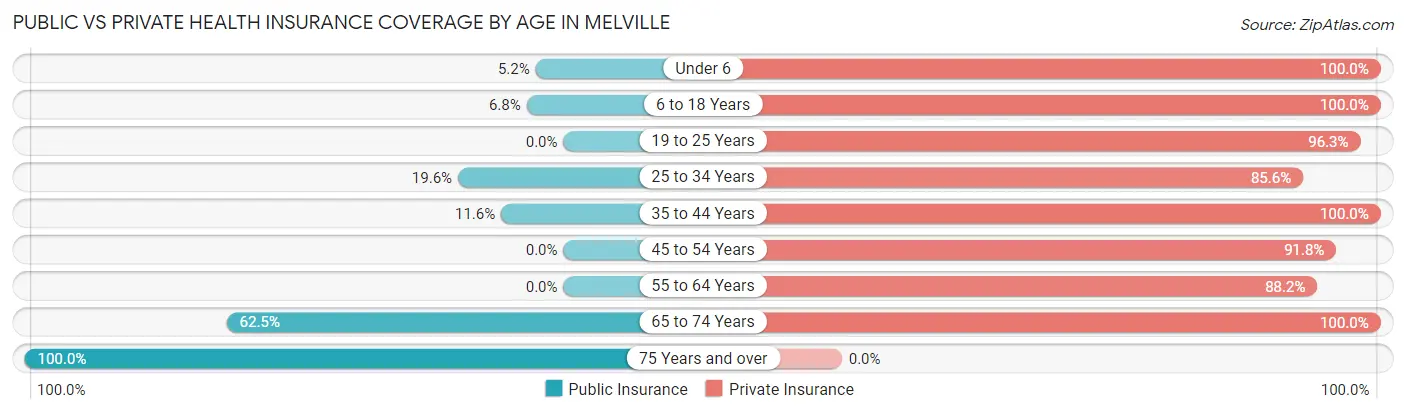
| Age Bracket | Public Insurance | Private Insurance |
| Under 6 | 18 (5.2%) | 349 (100.0%) |
| 6 to 18 Years | 22 (6.8%) | 322 (100.0%) |
| 19 to 25 Years | 0 (0.0%) | 154 (96.3%) |
| 25 to 34 Years | 72 (19.6%) | 315 (85.6%) |
| 35 to 44 Years | 23 (11.6%) | 199 (100.0%) |
| 45 to 54 Years | 0 (0.0%) | 78 (91.8%) |
| 55 to 64 Years | 0 (0.0%) | 30 (88.2%) |
| 65 to 74 Years | 5 (62.5%) | 8 (100.0%) |
| 75 Years and over | 6 (100.0%) | 0 (0.0%) |
| Total | 146 (9.5%) | 1,455 (95.0%) |
Disability Status by Sex by Age in Melville
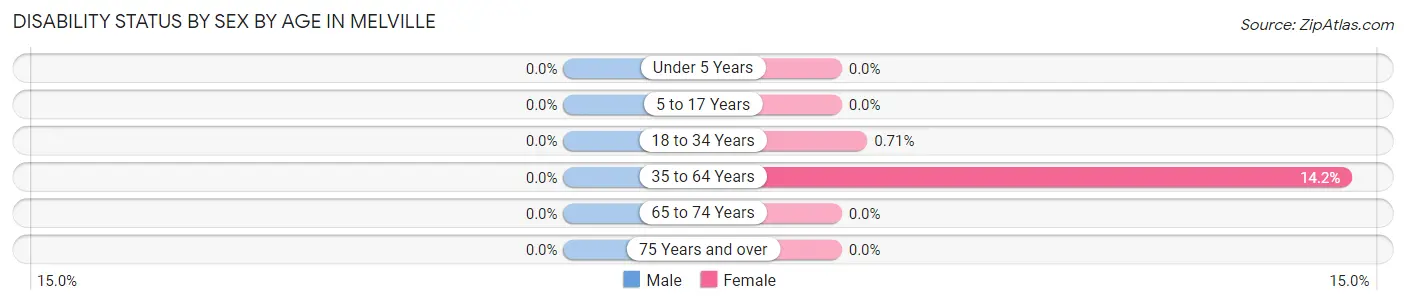
| Age Bracket | Male | Female |
| Under 5 Years | 0 (0.0%) | 0 (0.0%) |
| 5 to 17 Years | 0 (0.0%) | 0 (0.0%) |
| 18 to 34 Years | 0 (0.0%) | 2 (0.7%) |
| 35 to 64 Years | 0 (0.0%) | 27 (14.2%) |
| 65 to 74 Years | 0 (0.0%) | 0 (0.0%) |
| 75 Years and over | 0 (0.0%) | 0 (0.0%) |
Disability Class by Sex by Age in Melville
Disability Class: Hearing Difficulty

| Age Bracket | Male | Female |
| Under 5 Years | 0 (0.0%) | 0 (0.0%) |
| 5 to 17 Years | 0 (0.0%) | 0 (0.0%) |
| 18 to 34 Years | 0 (0.0%) | 0 (0.0%) |
| 35 to 64 Years | 0 (0.0%) | 0 (0.0%) |
| 65 to 74 Years | 0 (0.0%) | 0 (0.0%) |
| 75 Years and over | 0 (0.0%) | 0 (0.0%) |
Disability Class: Vision Difficulty
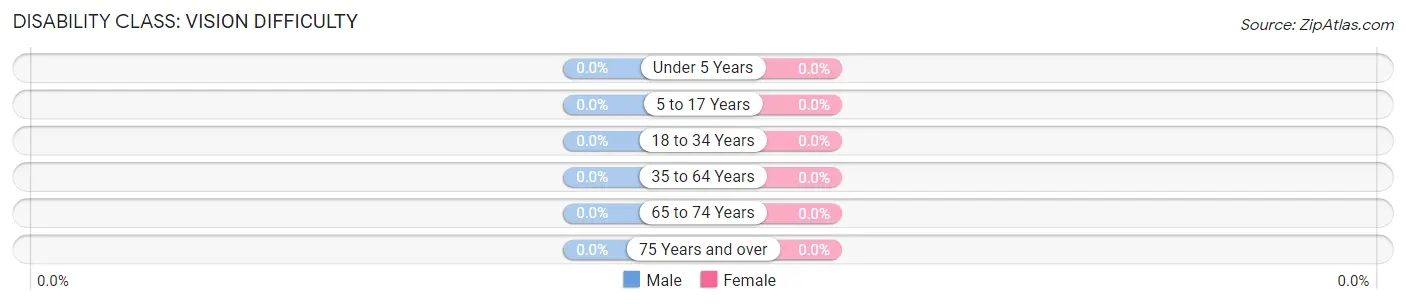
| Age Bracket | Male | Female |
| Under 5 Years | 0 (0.0%) | 0 (0.0%) |
| 5 to 17 Years | 0 (0.0%) | 0 (0.0%) |
| 18 to 34 Years | 0 (0.0%) | 0 (0.0%) |
| 35 to 64 Years | 0 (0.0%) | 0 (0.0%) |
| 65 to 74 Years | 0 (0.0%) | 0 (0.0%) |
| 75 Years and over | 0 (0.0%) | 0 (0.0%) |
Disability Class: Cognitive Difficulty
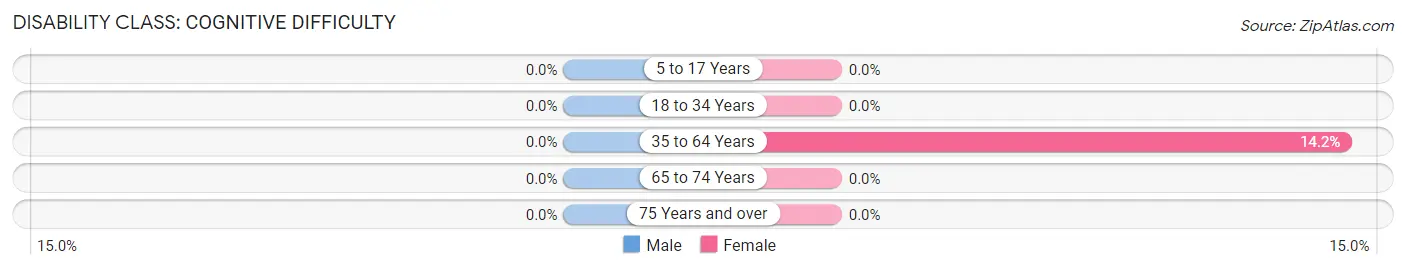
| Age Bracket | Male | Female |
| 5 to 17 Years | 0 (0.0%) | 0 (0.0%) |
| 18 to 34 Years | 0 (0.0%) | 0 (0.0%) |
| 35 to 64 Years | 0 (0.0%) | 27 (14.2%) |
| 65 to 74 Years | 0 (0.0%) | 0 (0.0%) |
| 75 Years and over | 0 (0.0%) | 0 (0.0%) |
Disability Class: Ambulatory Difficulty
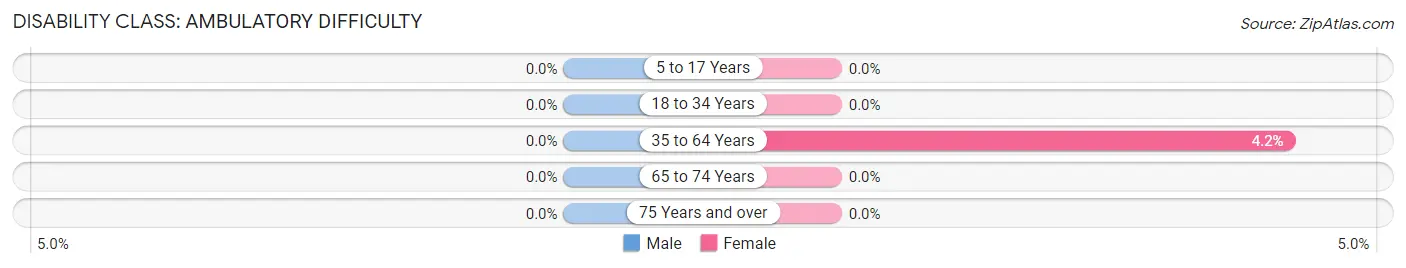
| Age Bracket | Male | Female |
| 5 to 17 Years | 0 (0.0%) | 0 (0.0%) |
| 18 to 34 Years | 0 (0.0%) | 0 (0.0%) |
| 35 to 64 Years | 0 (0.0%) | 8 (4.2%) |
| 65 to 74 Years | 0 (0.0%) | 0 (0.0%) |
| 75 Years and over | 0 (0.0%) | 0 (0.0%) |
Disability Class: Self-Care Difficulty
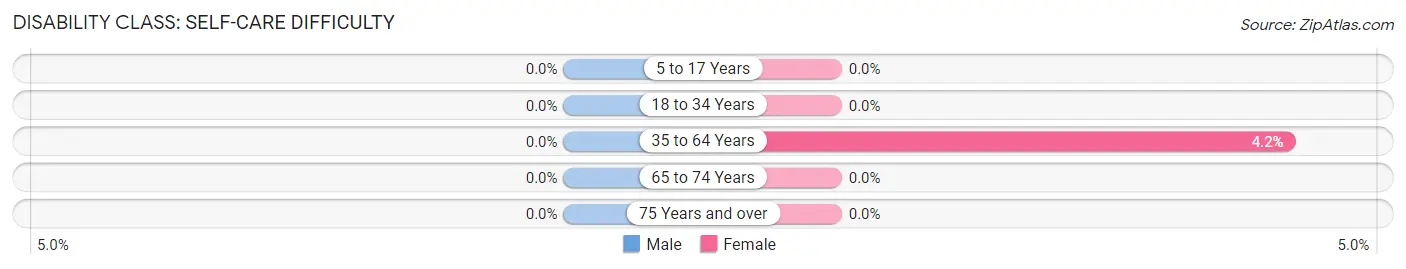
| Age Bracket | Male | Female |
| 5 to 17 Years | 0 (0.0%) | 0 (0.0%) |
| 18 to 34 Years | 0 (0.0%) | 0 (0.0%) |
| 35 to 64 Years | 0 (0.0%) | 8 (4.2%) |
| 65 to 74 Years | 0 (0.0%) | 0 (0.0%) |
| 75 Years and over | 0 (0.0%) | 0 (0.0%) |
Technology Access in Melville
Computing Device Access in Melville
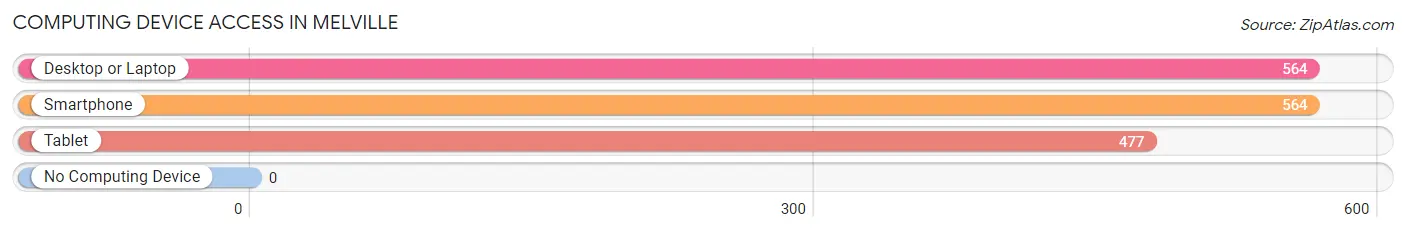
| Device Type | # Households | % Households |
| Desktop or Laptop | 564 | 100.0% |
| Smartphone | 564 | 100.0% |
| Tablet | 477 | 84.6% |
| No Computing Device | 0 | 0.0% |
| Total | 564 | 100.0% |
Internet Access in Melville
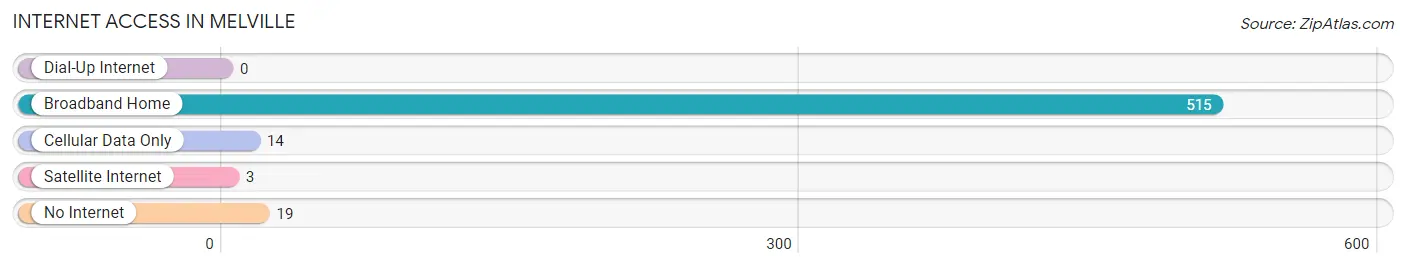
| Internet Type | # Households | % Households |
| Dial-Up Internet | 0 | 0.0% |
| Broadband Home | 515 | 91.3% |
| Cellular Data Only | 14 | 2.5% |
| Satellite Internet | 3 | 0.5% |
| No Internet | 19 | 3.4% |
| Total | 564 | 100.0% |
Melville Summary
Melville, Rhode Island is a small town located in the southwestern part of the state. It is situated in the Narragansett Bay region, and is bordered by the towns of Portsmouth, Tiverton, and Little Compton. The town has a population of approximately 1,500 people, and is part of Newport County.
History
The area that is now Melville was originally inhabited by the Wampanoag tribe. The first European settlers arrived in the area in 1638, and the town was officially incorporated in 1747. The town was named after the Melville family, who were prominent landowners in the area.
In the late 19th century, Melville became a popular summer resort destination for wealthy families from Providence and Newport. The town was home to several large estates, including the Melville House, which was built in 1875.
Geography
Melville is located in the Narragansett Bay region of Rhode Island. It is bordered by the towns of Portsmouth, Tiverton, and Little Compton. The town is situated on the Sakonnet River, and is approximately 10 miles south of Providence.
The town has a total area of 8.3 square miles, of which 7.9 square miles is land and 0.4 square miles is water. The terrain is mostly flat, with some rolling hills in the northern part of the town.
Economy
The economy of Melville is largely based on tourism and agriculture. The town is home to several small businesses, including restaurants, shops, and galleries. The town also has a marina, which is popular with boaters and fishermen.
Agriculture is also an important part of the local economy. The town is home to several farms, which produce a variety of crops, including corn, potatoes, and hay.
Demographics
As of the 2010 census, the population of Melville was 1,500. The racial makeup of the town was 94.2% White, 2.3% African American, 0.7% Native American, 0.7% Asian, 0.3% from other races, and 1.9% from two or more races. Hispanic or Latino of any race were 1.3% of the population.
The median household income in Melville was $60,000, and the median family income was $68,000. The per capita income was $30,000. About 8.3% of families and 10.3% of the population were below the poverty line.
The town is served by the Portsmouth School District. The town has one elementary school, one middle school, and one high school. The town also has a public library.
Common Questions
What is Per Capita Income in Melville?
Per Capita income in Melville is $38,612.
What is the Median Family Income in Melville?
Median Family Income in Melville is $112,297.
What is the Median Household income in Melville?
Median Household Income in Melville is $128,750.
What is Income or Wage Gap in Melville?
Income or Wage Gap in Melville is 38.6%.
Women in Melville earn 61.4 cents for every dollar earned by a man.
What is Inequality or Gini Index in Melville?
Inequality or Gini Index in Melville is 0.26.
What is the Total Population of Melville?
Total Population of Melville is 1,918.
What is the Total Male Population of Melville?
Total Male Population of Melville is 1,110.
What is the Total Female Population of Melville?
Total Female Population of Melville is 808.
What is the Ratio of Males per 100 Females in Melville?
There are 137.38 Males per 100 Females in Melville.
What is the Ratio of Females per 100 Males in Melville?
There are 72.79 Females per 100 Males in Melville.
What is the Median Population Age in Melville?
Median Population Age in Melville is 29.1 Years.
What is the Average Family Size in Melville
Average Family Size in Melville is 3.5 People.
What is the Average Household Size in Melville
Average Household Size in Melville is 3.4 People.
How Large is the Labor Force in Melville?
There are 1,057 People in the Labor Forcein in Melville.
What is the Percentage of People in the Labor Force in Melville?
81.5% of People are in the Labor Force in Melville.
What is the Unemployment Rate in Melville?
Unemployment Rate in Melville is 2.1%.