Cortez, CO Map & Demographics
Cortez Map
Cortez Overview
$27,632
PER CAPITA INCOME
$67,857
AVG FAMILY INCOME
$55,962
AVG HOUSEHOLD INCOME
28.1%
WAGE / INCOME GAP [ % ]
71.9¢/ $1
WAGE / INCOME GAP [ $ ]
0.42
INEQUALITY / GINI INDEX
8,832
TOTAL POPULATION
4,153
MALE POPULATION
4,679
FEMALE POPULATION
88.76
MALES / 100 FEMALES
112.67
FEMALES / 100 MALES
37.9
MEDIAN AGE
3.0
AVG FAMILY SIZE
2.5
AVG HOUSEHOLD SIZE
3,820
LABOR FORCE [ PEOPLE ]
55.3%
PERCENT IN LABOR FORCE
7.0%
UNEMPLOYMENT RATE
Cortez Zip Codes
Cortez Area Codes
Income in Cortez
Income Overview in Cortez
Per Capita Income in Cortez is $27,632, while median incomes of families and households are $67,857 and $55,962 respectively.
| Characteristic | Number | Measure |
| Per Capita Income | 8,832 | $27,632 |
| Median Family Income | 2,258 | $67,857 |
| Mean Family Income | 2,258 | $76,048 |
| Median Household Income | 3,528 | $55,962 |
| Mean Household Income | 3,528 | $66,913 |
| Income Deficit | 2,258 | $0 |
| Wage / Income Gap (%) | 8,832 | 28.06% |
| Wage / Income Gap ($) | 8,832 | 71.94¢ per $1 |
| Gini / Inequality Index | 8,832 | 0.42 |
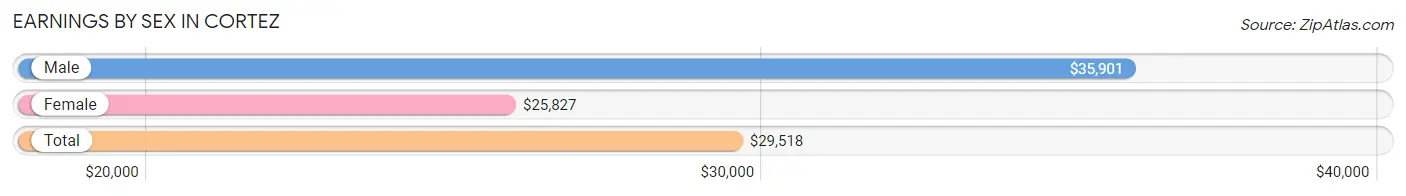
Earnings by Sex in Cortez
Average Earnings in Cortez are $29,518, $35,901 for men and $25,827 for women, a difference of 28.1%.
| Sex | Number | Average Earnings |
| Male | 2,183 (53.5%) | $35,901 |
| Female | 1,895 (46.5%) | $25,827 |
| Total | 4,078 (100.0%) | $29,518 |
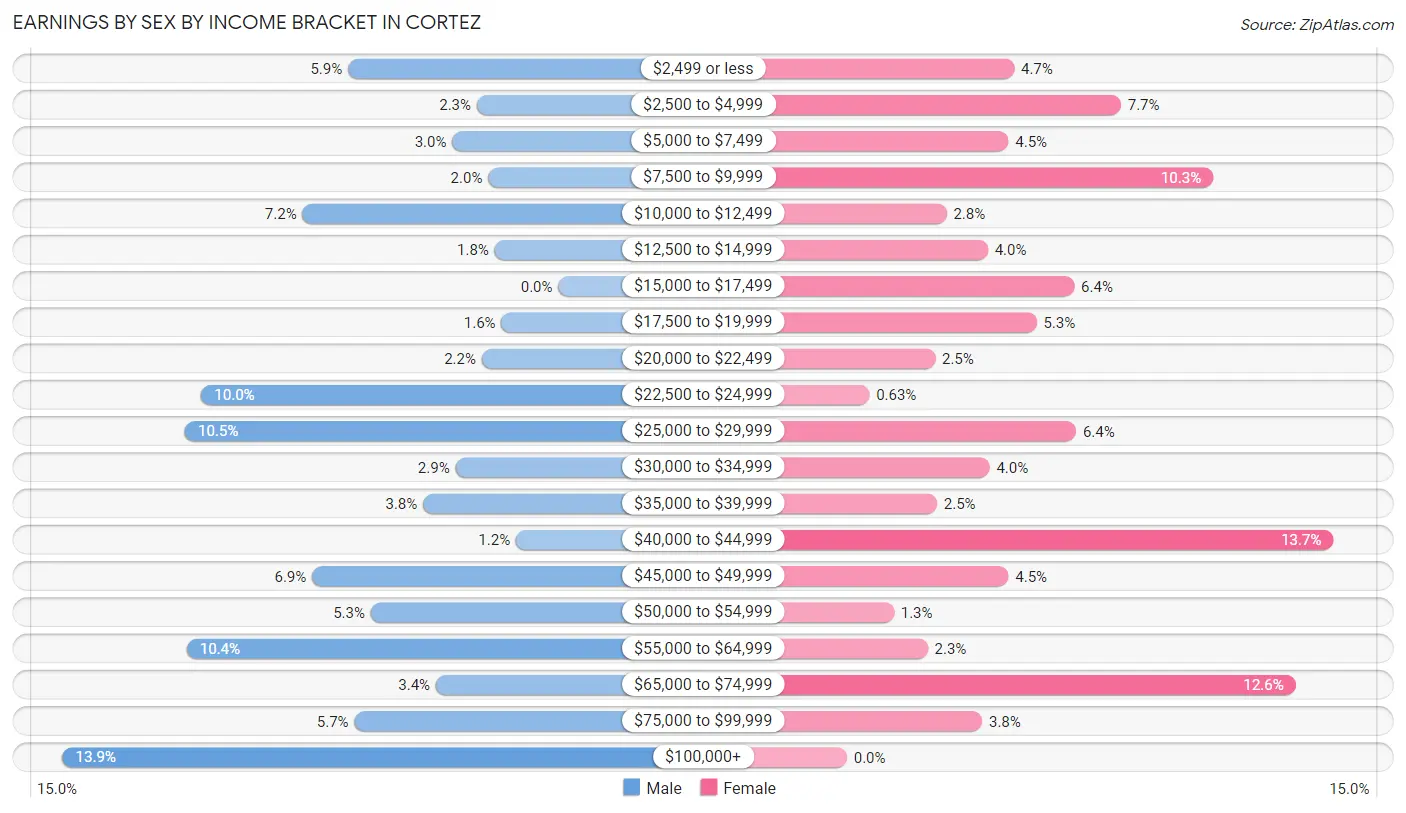
Earnings by Sex by Income Bracket in Cortez
The most common earnings brackets in Cortez are $100,000+ for men (304 | 13.9%) and $40,000 to $44,999 for women (259 | 13.7%).
| Income | Male | Female |
| $2,499 or less | 129 (5.9%) | 89 (4.7%) |
| $2,500 to $4,999 | 50 (2.3%) | 146 (7.7%) |
| $5,000 to $7,499 | 65 (3.0%) | 86 (4.5%) |
| $7,500 to $9,999 | 43 (2.0%) | 195 (10.3%) |
| $10,000 to $12,499 | 157 (7.2%) | 53 (2.8%) |
| $12,500 to $14,999 | 39 (1.8%) | 75 (4.0%) |
| $15,000 to $17,499 | 0 (0.0%) | 121 (6.4%) |
| $17,500 to $19,999 | 35 (1.6%) | 101 (5.3%) |
| $20,000 to $22,499 | 47 (2.1%) | 47 (2.5%) |
| $22,500 to $24,999 | 219 (10.0%) | 12 (0.6%) |
| $25,000 to $29,999 | 229 (10.5%) | 122 (6.4%) |
| $30,000 to $34,999 | 63 (2.9%) | 76 (4.0%) |
| $35,000 to $39,999 | 83 (3.8%) | 48 (2.5%) |
| $40,000 to $44,999 | 26 (1.2%) | 259 (13.7%) |
| $45,000 to $49,999 | 151 (6.9%) | 86 (4.5%) |
| $50,000 to $54,999 | 115 (5.3%) | 25 (1.3%) |
| $55,000 to $64,999 | 228 (10.4%) | 43 (2.3%) |
| $65,000 to $74,999 | 75 (3.4%) | 239 (12.6%) |
| $75,000 to $99,999 | 125 (5.7%) | 72 (3.8%) |
| $100,000+ | 304 (13.9%) | 0 (0.0%) |
| Total | 2,183 (100.0%) | 1,895 (100.0%) |
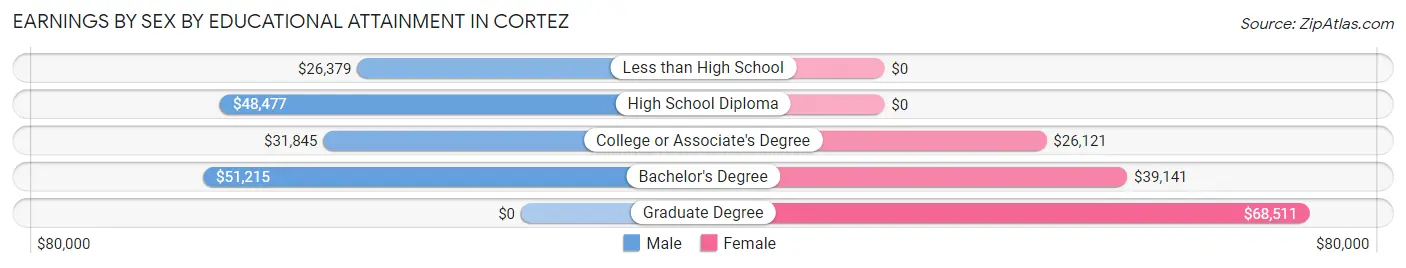
Earnings by Sex by Educational Attainment in Cortez
Average earnings in Cortez are $48,008 for men and $29,167 for women, a difference of 39.3%. Men with an educational attainment of bachelor's degree enjoy the highest average annual earnings of $51,215, while those with less than high school education earn the least with $26,379. Women with an educational attainment of graduate degree earn the most with the average annual earnings of $68,511, while those with college or associate's degree education have the smallest earnings of $26,121.
| Educational Attainment | Male Income | Female Income |
| Less than High School | $26,379 | $0 |
| High School Diploma | $48,477 | $0 |
| College or Associate's Degree | $31,845 | $26,121 |
| Bachelor's Degree | $51,215 | $39,141 |
| Graduate Degree | - | - |
| Total | $48,008 | $29,167 |
Family Income in Cortez
Family Income Brackets in Cortez
According to the Cortez family income data, there are 639 families falling into the $50,000 to $74,999 income range, which is the most common income bracket and makes up 28.3% of all families. Conversely, the $10,000 to $14,999 income bracket is the least frequent group with only 16 families (0.7%) belonging to this category.
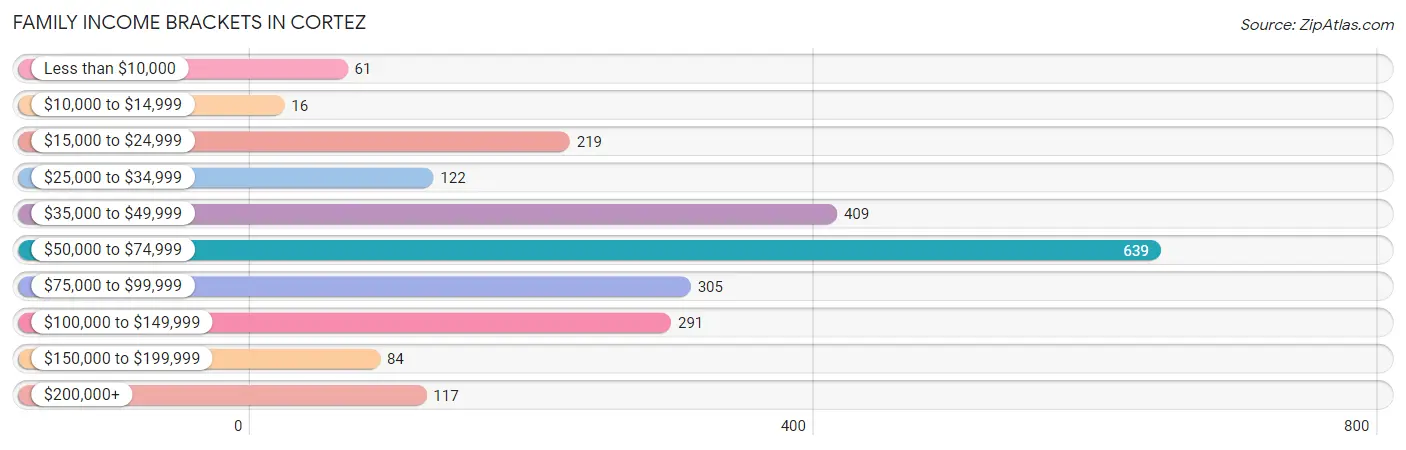
| Income Bracket | # Families | % Families |
| Less than $10,000 | 61 | 2.7% |
| $10,000 to $14,999 | 16 | 0.7% |
| $15,000 to $24,999 | 219 | 9.7% |
| $25,000 to $34,999 | 122 | 5.4% |
| $35,000 to $49,999 | 409 | 18.1% |
| $50,000 to $74,999 | 639 | 28.3% |
| $75,000 to $99,999 | 305 | 13.5% |
| $100,000 to $149,999 | 291 | 12.9% |
| $150,000 to $199,999 | 84 | 3.7% |
| $200,000+ | 117 | 5.2% |
Family Income by Famaliy Size in Cortez
5-person families (54 | 2.4%) account for the highest median family income in Cortez with $112,917 per family, while 2-person families (1,418 | 62.8%) have the highest median income of $29,271 per family member.
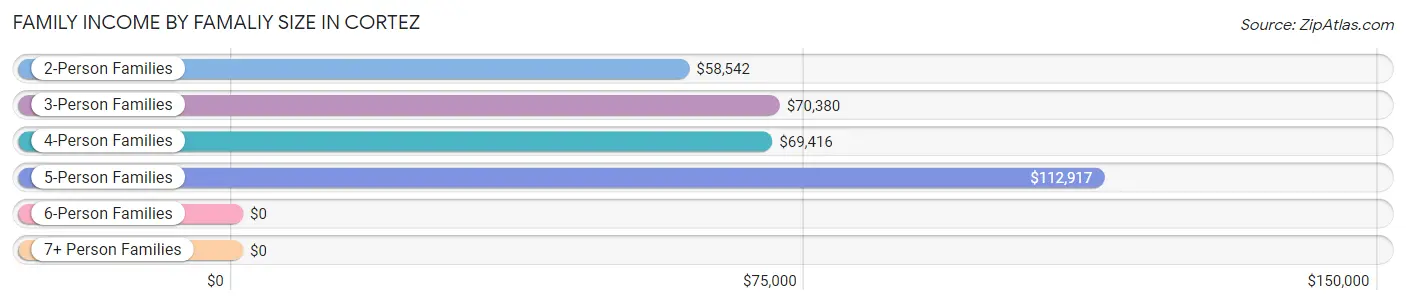
| Income Bracket | # Families | Median Income |
| 2-Person Families | 1,418 (62.8%) | $58,542 |
| 3-Person Families | 308 (13.6%) | $70,380 |
| 4-Person Families | 320 (14.2%) | $69,416 |
| 5-Person Families | 54 (2.4%) | $112,917 |
| 6-Person Families | 158 (7.0%) | $0 |
| 7+ Person Families | 0 (0.0%) | $0 |
| Total | 2,258 (100.0%) | $67,857 |
Family Income by Number of Earners in Cortez
The median family income in Cortez is $67,857, with families comprising 3+ earners (35) having the highest median family income of $114,063, while families with no earners (474) have the lowest median family income of $47,778, accounting for 1.5% and 21.0% of families, respectively.
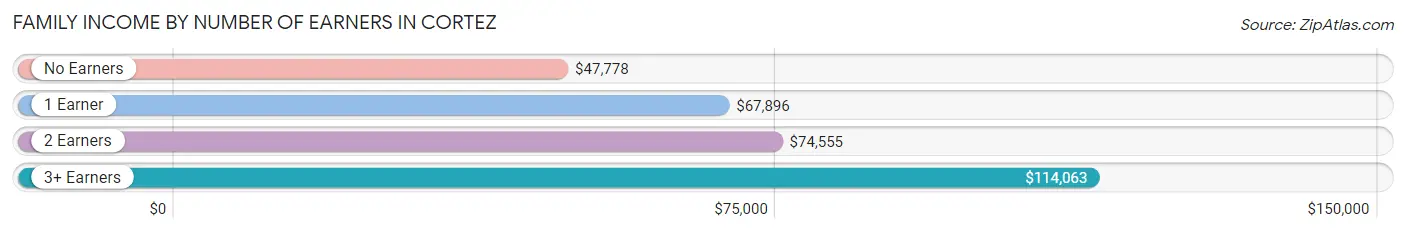
| Number of Earners | # Families | Median Income |
| No Earners | 474 (21.0%) | $47,778 |
| 1 Earner | 959 (42.5%) | $67,896 |
| 2 Earners | 790 (35.0%) | $74,555 |
| 3+ Earners | 35 (1.5%) | $114,063 |
| Total | 2,258 (100.0%) | $67,857 |
Household Income in Cortez
Household Income Brackets in Cortez
With 691 households falling in the category, the $50,000 to $74,999 income range is the most frequent in Cortez, accounting for 19.6% of all households. In contrast, only 85 households (2.4%) fall into the $10,000 to $14,999 income bracket, making it the least populous group.
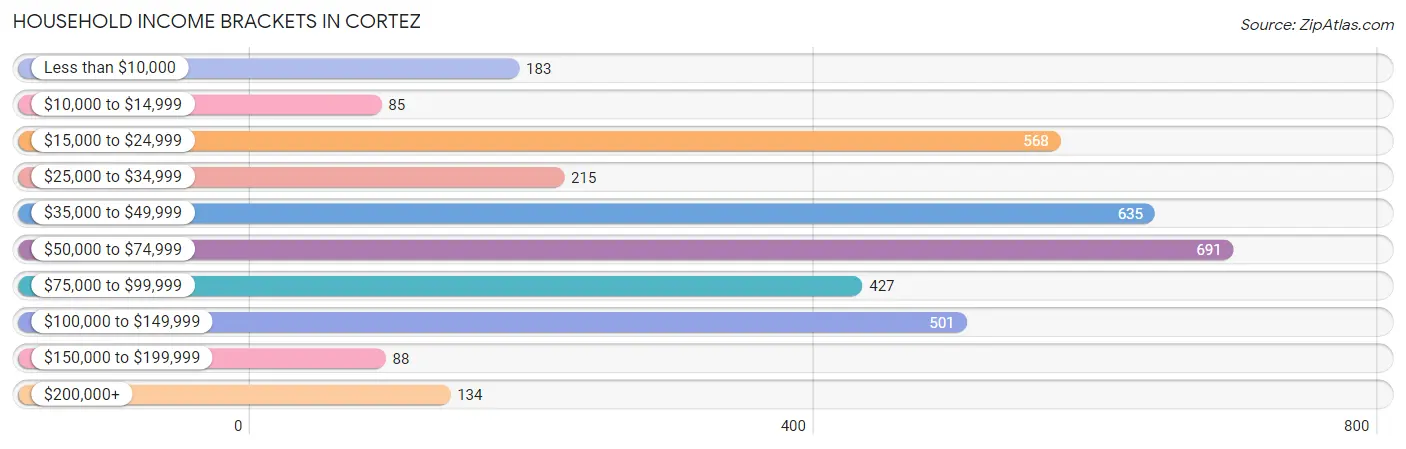
| Income Bracket | # Households | % Households |
| Less than $10,000 | 183 | 5.2% |
| $10,000 to $14,999 | 85 | 2.4% |
| $15,000 to $24,999 | 568 | 16.1% |
| $25,000 to $34,999 | 215 | 6.1% |
| $35,000 to $49,999 | 635 | 18.0% |
| $50,000 to $74,999 | 691 | 19.6% |
| $75,000 to $99,999 | 427 | 12.1% |
| $100,000 to $149,999 | 501 | 14.2% |
| $150,000 to $199,999 | 88 | 2.5% |
| $200,000+ | 134 | 3.8% |
Household Income by Householder Age in Cortez
The median household income in Cortez is $55,962, with the highest median household income of $68,015 found in the 25 to 44 years age bracket for the primary householder. A total of 1,081 households (30.6%) fall into this category. Meanwhile, the 15 to 24 years age bracket for the primary householder has the lowest median household income of $37,531, with 111 households (3.2%) in this group.

| Income Bracket | # Households | Median Income |
| 15 to 24 Years | 111 (3.2%) | $37,531 |
| 25 to 44 Years | 1,081 (30.6%) | $68,015 |
| 45 to 64 Years | 972 (27.6%) | $59,621 |
| 65+ Years | 1,364 (38.7%) | $50,909 |
| Total | 3,528 (100.0%) | $55,962 |
Poverty in Cortez
Income Below Poverty by Sex and Age in Cortez
With 14.9% poverty level for males and 14.6% for females among the residents of Cortez, 12 to 14 year old males and 18 to 24 year old females are the most vulnerable to poverty, with 69 males (42.6%) and 160 females (47.9%) in their respective age groups living below the poverty level.
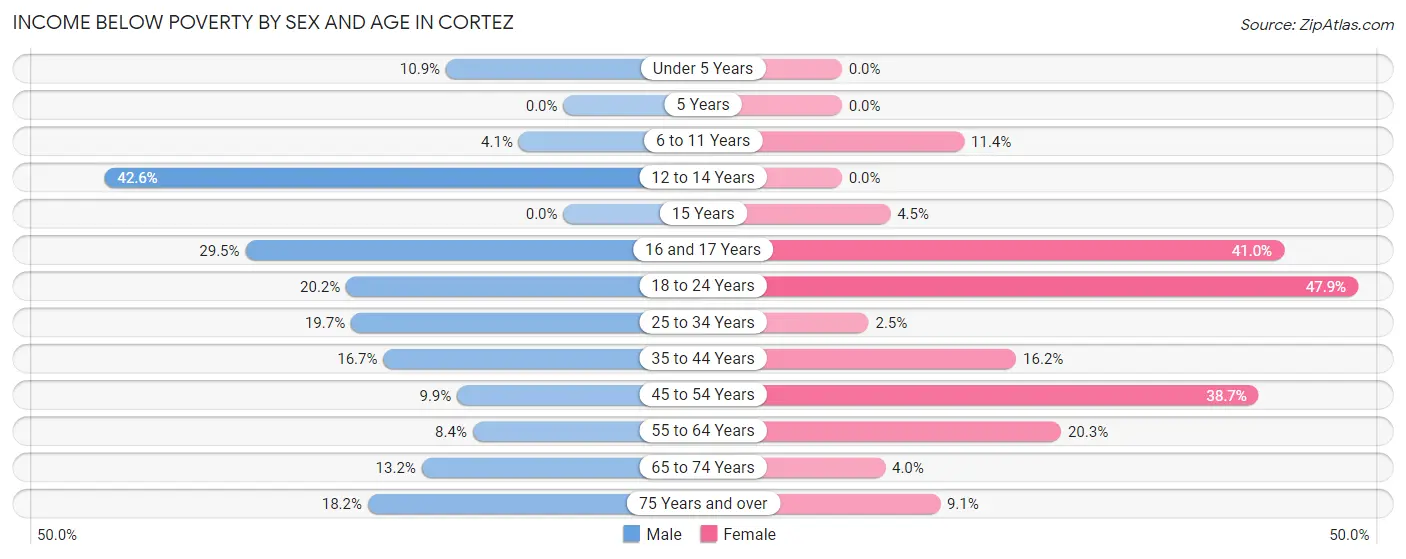
| Age Bracket | Male | Female |
| Under 5 Years | 17 (10.9%) | 0 (0.0%) |
| 5 Years | 0 (0.0%) | 0 (0.0%) |
| 6 to 11 Years | 20 (4.1%) | 57 (11.4%) |
| 12 to 14 Years | 69 (42.6%) | 0 (0.0%) |
| 15 Years | 0 (0.0%) | 7 (4.5%) |
| 16 and 17 Years | 36 (29.5%) | 16 (41.0%) |
| 18 to 24 Years | 74 (20.2%) | 160 (47.9%) |
| 25 to 34 Years | 109 (19.7%) | 15 (2.5%) |
| 35 to 44 Years | 70 (16.7%) | 88 (16.2%) |
| 45 to 54 Years | 49 (9.9%) | 147 (38.7%) |
| 55 to 64 Years | 36 (8.4%) | 118 (20.3%) |
| 65 to 74 Years | 83 (13.2%) | 23 (4.0%) |
| 75 Years and over | 49 (18.1%) | 42 (9.1%) |
| Total | 612 (14.9%) | 673 (14.6%) |
Income Above Poverty by Sex and Age in Cortez
According to the poverty statistics in Cortez, males aged 15 years and females aged under 5 years are the age groups that are most secure financially, with 100.0% of males and 100.0% of females in these age groups living above the poverty line.
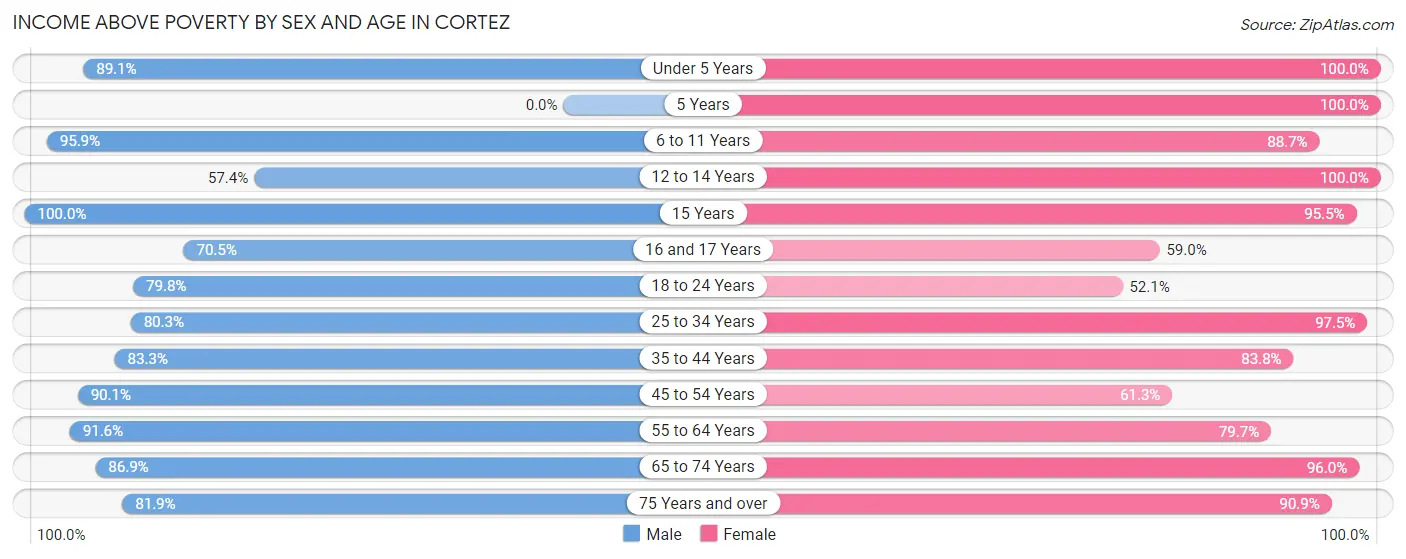
| Age Bracket | Male | Female |
| Under 5 Years | 139 (89.1%) | 98 (100.0%) |
| 5 Years | 0 (0.0%) | 126 (100.0%) |
| 6 to 11 Years | 463 (95.9%) | 445 (88.6%) |
| 12 to 14 Years | 93 (57.4%) | 202 (100.0%) |
| 15 Years | 9 (100.0%) | 149 (95.5%) |
| 16 and 17 Years | 86 (70.5%) | 23 (59.0%) |
| 18 to 24 Years | 293 (79.8%) | 174 (52.1%) |
| 25 to 34 Years | 444 (80.3%) | 591 (97.5%) |
| 35 to 44 Years | 349 (83.3%) | 456 (83.8%) |
| 45 to 54 Years | 448 (90.1%) | 233 (61.3%) |
| 55 to 64 Years | 392 (91.6%) | 462 (79.7%) |
| 65 to 74 Years | 548 (86.9%) | 550 (96.0%) |
| 75 Years and over | 221 (81.9%) | 419 (90.9%) |
| Total | 3,485 (85.1%) | 3,928 (85.4%) |
Income Below Poverty Among Married-Couple Families in Cortez
The poverty statistics for married-couple families in Cortez show that 7.9% or 106 of the total 1,336 families live below the poverty line. Families with no children have the highest poverty rate of 9.3%, comprising of 91 families. On the other hand, families with 3 or 4 children have the lowest poverty rate of 0.0%, which includes 0 families.
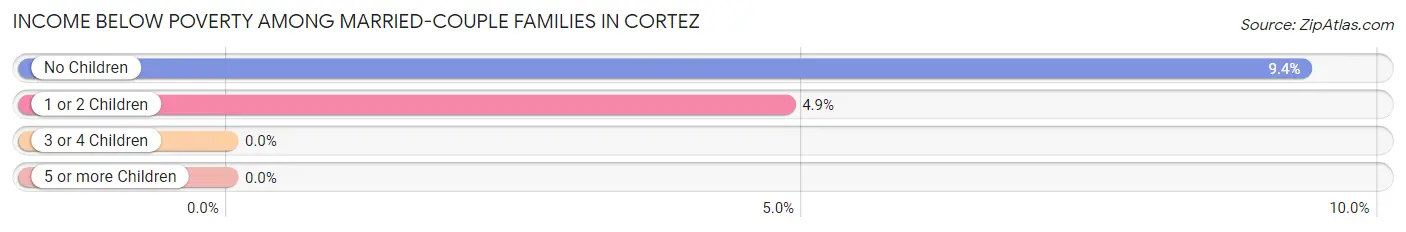
| Children | Above Poverty | Below Poverty |
| No Children | 882 (90.6%) | 91 (9.3%) |
| 1 or 2 Children | 294 (95.2%) | 15 (4.9%) |
| 3 or 4 Children | 54 (100.0%) | 0 (0.0%) |
| 5 or more Children | 0 (0.0%) | 0 (0.0%) |
| Total | 1,230 (92.1%) | 106 (7.9%) |
Income Below Poverty Among Single-Parent Households in Cortez
According to the poverty data in Cortez, 20.9% or 44 single-father households and 9.1% or 65 single-mother households are living below the poverty line. Among single-father households, those with 5 or more children have the highest poverty rate, with 28 households (100.0%) experiencing poverty. Likewise, among single-mother households, those with 3 or 4 children have the highest poverty rate, with 57 households (36.3%) falling below the poverty line.
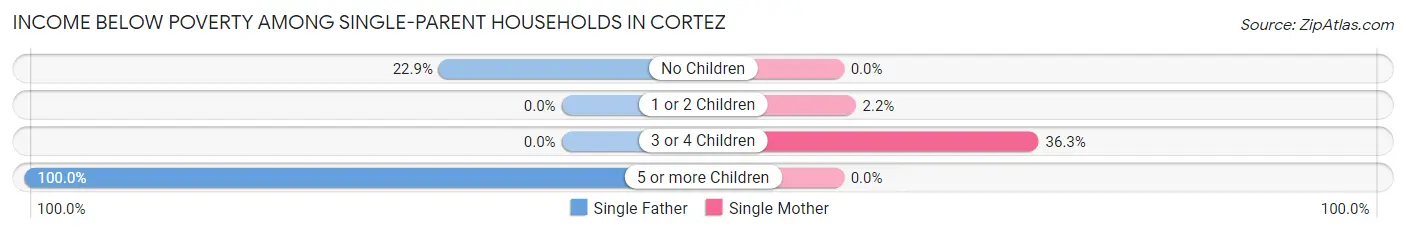
| Children | Single Father | Single Mother |
| No Children | 16 (22.9%) | 0 (0.0%) |
| 1 or 2 Children | 0 (0.0%) | 8 (2.2%) |
| 3 or 4 Children | 0 (0.0%) | 57 (36.3%) |
| 5 or more Children | 28 (100.0%) | 0 (0.0%) |
| Total | 44 (20.9%) | 65 (9.1%) |
Income Below Poverty Among Married-Couple vs Single-Parent Households in Cortez
The poverty data for Cortez shows that 106 of the married-couple family households (7.9%) and 109 of the single-parent households (11.8%) are living below the poverty level. Within the married-couple family households, those with no children have the highest poverty rate, with 91 households (9.3%) falling below the poverty line. Among the single-parent households, those with 5 or more children have the highest poverty rate, with 28 household (100.0%) living below poverty.
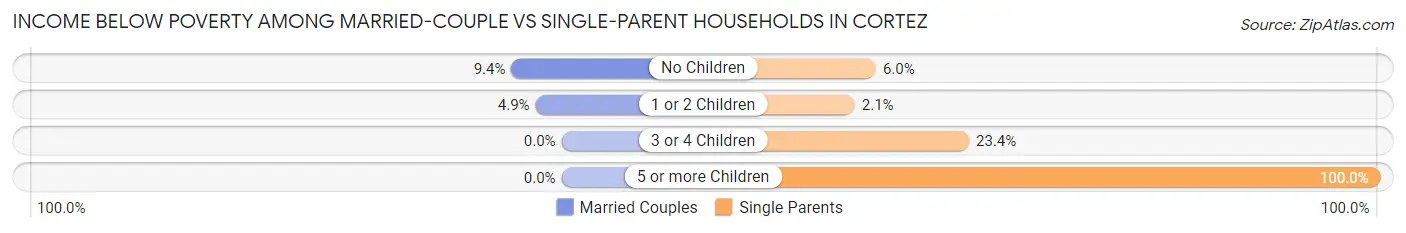
| Children | Married-Couple Families | Single-Parent Households |
| No Children | 91 (9.3%) | 16 (6.0%) |
| 1 or 2 Children | 15 (4.9%) | 8 (2.1%) |
| 3 or 4 Children | 0 (0.0%) | 57 (23.4%) |
| 5 or more Children | 0 (0.0%) | 28 (100.0%) |
| Total | 106 (7.9%) | 109 (11.8%) |
Race in Cortez
The most populous races in Cortez are White / Caucasian (6,314 | 71.5%), Hispanic or Latino (1,865 | 21.1%), and Two or more Races (922 | 10.4%).
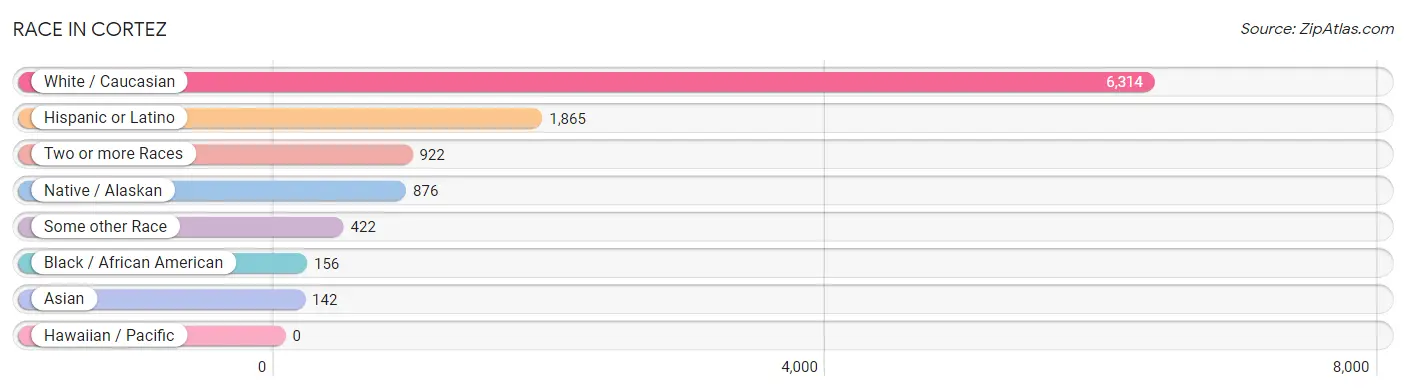
| Race | # Population | % Population |
| Asian | 142 | 1.6% |
| Black / African American | 156 | 1.8% |
| Hawaiian / Pacific | 0 | 0.0% |
| Hispanic or Latino | 1,865 | 21.1% |
| Native / Alaskan | 876 | 9.9% |
| White / Caucasian | 6,314 | 71.5% |
| Two or more Races | 922 | 10.4% |
| Some other Race | 422 | 4.8% |
| Total | 8,832 | 100.0% |
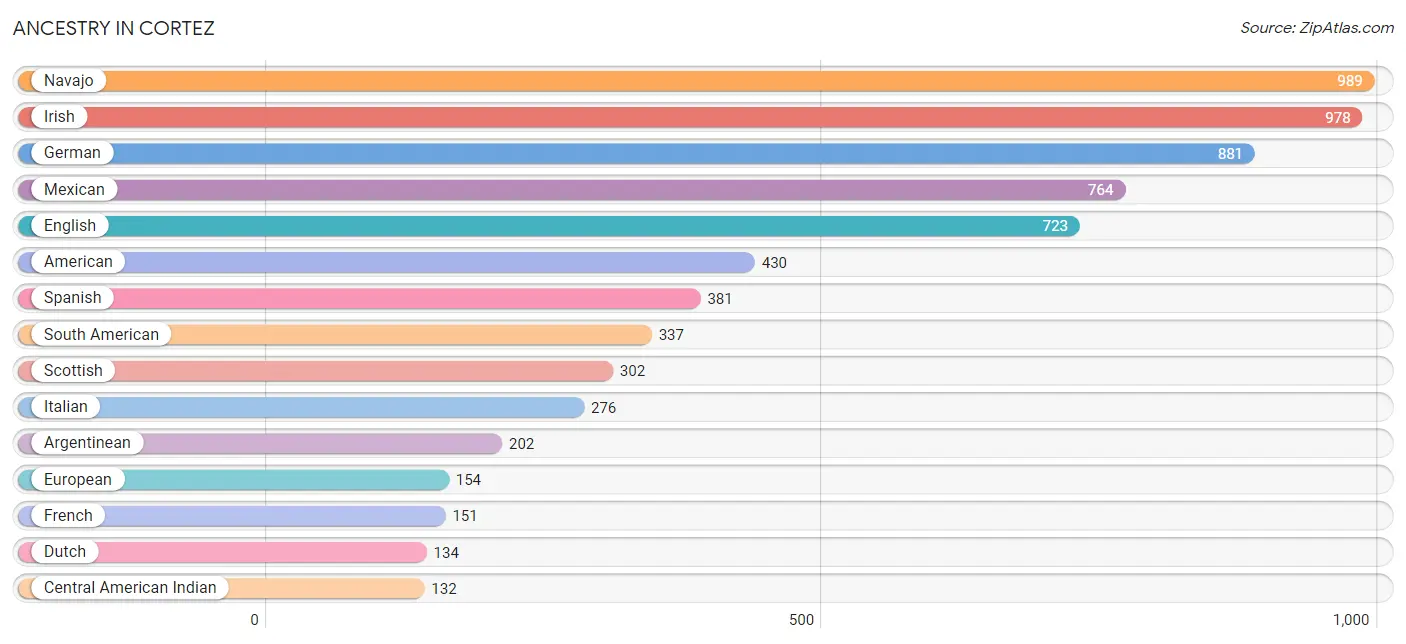
Ancestry in Cortez
The most populous ancestries reported in Cortez are Navajo (989 | 11.2%), Irish (978 | 11.1%), German (881 | 10.0%), Mexican (764 | 8.6%), and English (723 | 8.2%), together accounting for 49.1% of all Cortez residents.
| Ancestry | # Population | % Population |
| African | 50 | 0.6% |
| American | 430 | 4.9% |
| Apache | 3 | 0.0% |
| Argentinean | 202 | 2.3% |
| Bhutanese | 9 | 0.1% |
| Blackfeet | 27 | 0.3% |
| British | 87 | 1.0% |
| Canadian | 20 | 0.2% |
| Celtic | 7 | 0.1% |
| Central American Indian | 132 | 1.5% |
| Cherokee | 121 | 1.4% |
| Colombian | 25 | 0.3% |
| Czech | 11 | 0.1% |
| Danish | 48 | 0.5% |
| Dutch | 134 | 1.5% |
| Eastern European | 13 | 0.2% |
| English | 723 | 8.2% |
| European | 154 | 1.7% |
| Finnish | 28 | 0.3% |
| French | 151 | 1.7% |
| French Canadian | 5 | 0.1% |
| German | 881 | 10.0% |
| Greek | 17 | 0.2% |
| Hungarian | 42 | 0.5% |
| Indian (Asian) | 94 | 1.1% |
| Irish | 978 | 11.1% |
| Italian | 276 | 3.1% |
| Korean | 24 | 0.3% |
| Mexican | 764 | 8.6% |
| Native Hawaiian | 10 | 0.1% |
| Navajo | 989 | 11.2% |
| Northern European | 39 | 0.4% |
| Norwegian | 48 | 0.5% |
| Pakistani | 17 | 0.2% |
| Peruvian | 110 | 1.3% |
| Polish | 84 | 0.9% |
| Portuguese | 18 | 0.2% |
| Pueblo | 34 | 0.4% |
| Puerto Rican | 59 | 0.7% |
| Russian | 54 | 0.6% |
| Scandinavian | 23 | 0.3% |
| Scotch-Irish | 39 | 0.4% |
| Scottish | 302 | 3.4% |
| South American | 337 | 3.8% |
| Spaniard | 75 | 0.9% |
| Spanish | 381 | 4.3% |
| Spanish American | 55 | 0.6% |
| Subsaharan African | 50 | 0.6% |
| Swedish | 110 | 1.3% |
| Ute | 19 | 0.2% | View All 50 Rows |
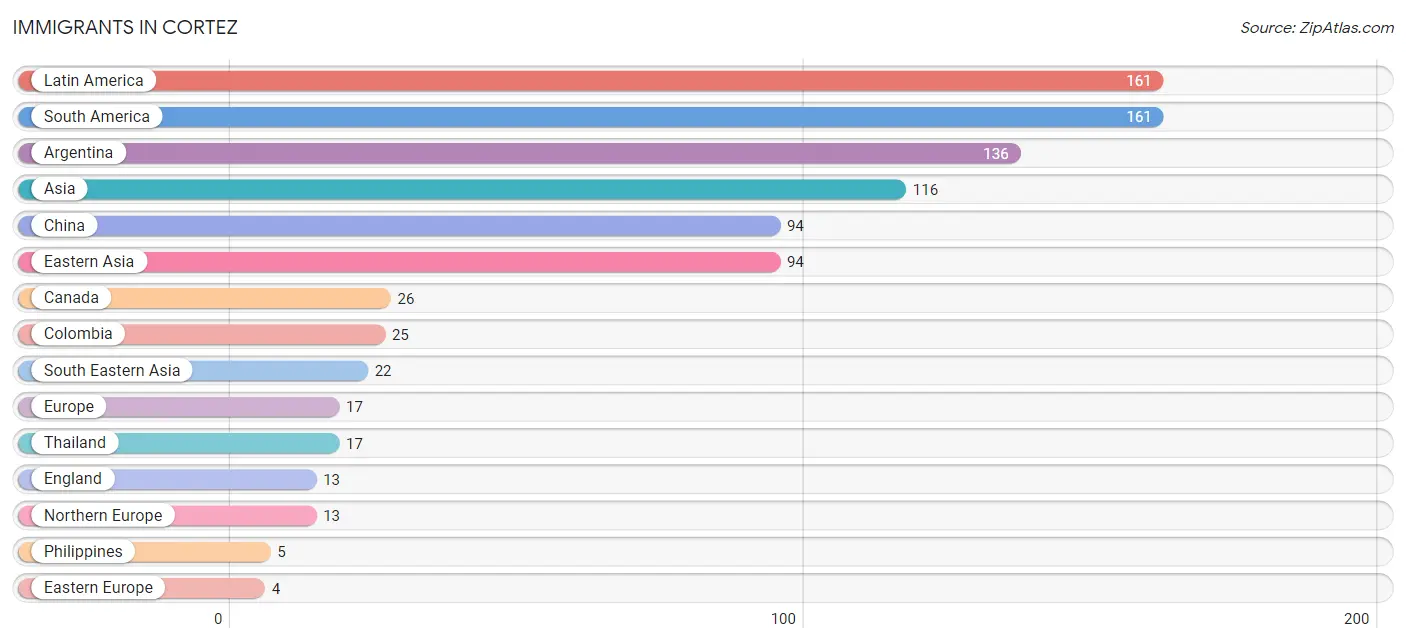
Immigrants in Cortez
The most numerous immigrant groups reported in Cortez came from Latin America (161 | 1.8%), South America (161 | 1.8%), Argentina (136 | 1.5%), Asia (116 | 1.3%), and China (94 | 1.1%), together accounting for 7.5% of all Cortez residents.
| Immigration Origin | # Population | % Population |
| Argentina | 136 | 1.5% |
| Asia | 116 | 1.3% |
| Canada | 26 | 0.3% |
| China | 94 | 1.1% |
| Colombia | 25 | 0.3% |
| Eastern Asia | 94 | 1.1% |
| Eastern Europe | 4 | 0.1% |
| England | 13 | 0.2% |
| Europe | 17 | 0.2% |
| Latin America | 161 | 1.8% |
| Northern Europe | 13 | 0.2% |
| Philippines | 5 | 0.1% |
| Poland | 4 | 0.1% |
| South America | 161 | 1.8% |
| South Eastern Asia | 22 | 0.3% |
| Thailand | 17 | 0.2% | View All 16 Rows |
Sex and Age in Cortez
Sex and Age in Cortez
The most populous age groups in Cortez are 65 to 69 Years (472 | 11.4%) for men and 5 to 9 Years (482 | 10.3%) for women.
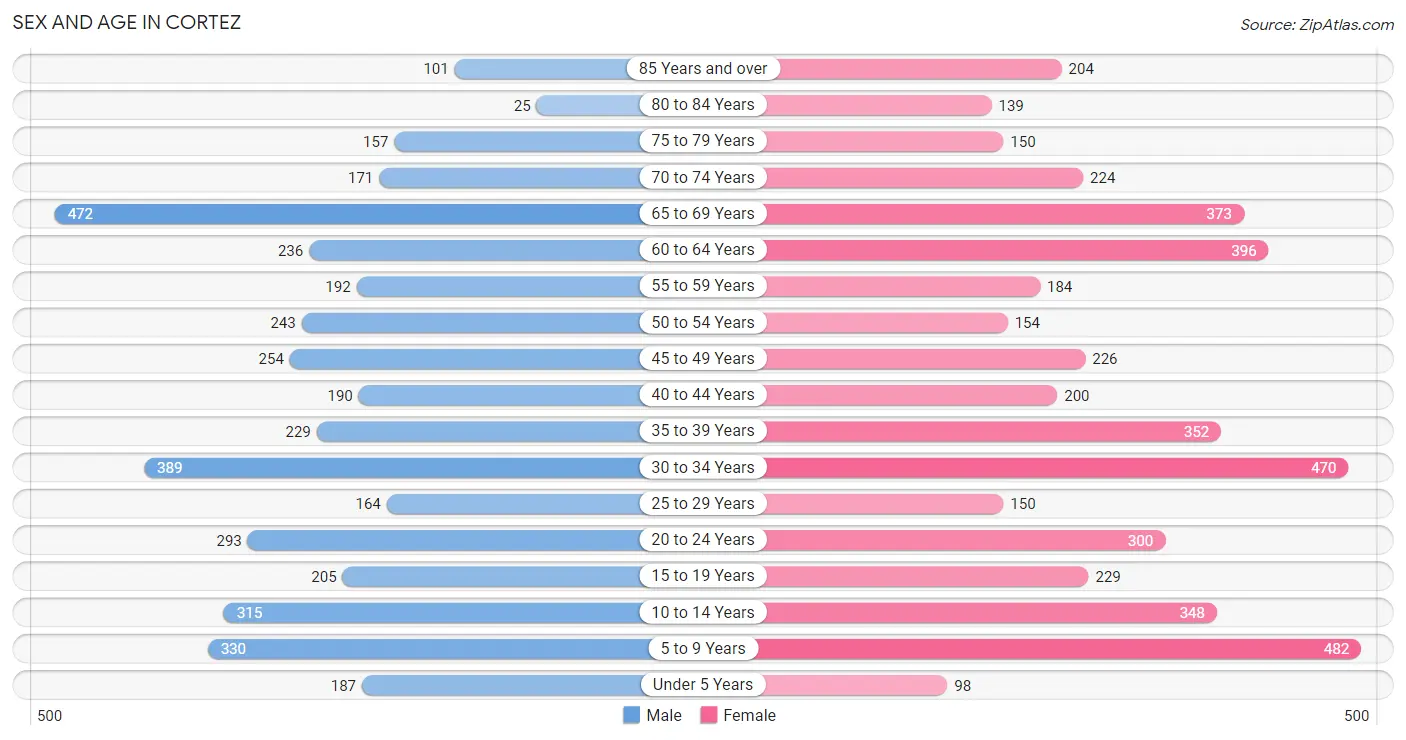
| Age Bracket | Male | Female |
| Under 5 Years | 187 (4.5%) | 98 (2.1%) |
| 5 to 9 Years | 330 (8.0%) | 482 (10.3%) |
| 10 to 14 Years | 315 (7.6%) | 348 (7.4%) |
| 15 to 19 Years | 205 (4.9%) | 229 (4.9%) |
| 20 to 24 Years | 293 (7.1%) | 300 (6.4%) |
| 25 to 29 Years | 164 (4.0%) | 150 (3.2%) |
| 30 to 34 Years | 389 (9.4%) | 470 (10.0%) |
| 35 to 39 Years | 229 (5.5%) | 352 (7.5%) |
| 40 to 44 Years | 190 (4.6%) | 200 (4.3%) |
| 45 to 49 Years | 254 (6.1%) | 226 (4.8%) |
| 50 to 54 Years | 243 (5.9%) | 154 (3.3%) |
| 55 to 59 Years | 192 (4.6%) | 184 (3.9%) |
| 60 to 64 Years | 236 (5.7%) | 396 (8.5%) |
| 65 to 69 Years | 472 (11.4%) | 373 (8.0%) |
| 70 to 74 Years | 171 (4.1%) | 224 (4.8%) |
| 75 to 79 Years | 157 (3.8%) | 150 (3.2%) |
| 80 to 84 Years | 25 (0.6%) | 139 (3.0%) |
| 85 Years and over | 101 (2.4%) | 204 (4.4%) |
| Total | 4,153 (100.0%) | 4,679 (100.0%) |
Families and Households in Cortez
Median Family Size in Cortez
The median family size in Cortez is 3.05 persons per family, with single male/father families (210 | 9.3%) accounting for the largest median family size of 4.71 persons per family. On the other hand, single female/mother families (712 | 31.5%) represent the smallest median family size with 2.51 persons per family.
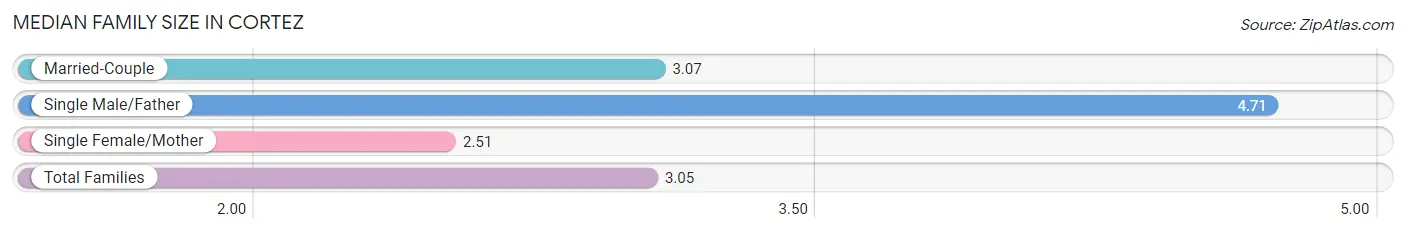
| Family Type | # Families | Family Size |
| Married-Couple | 1,336 (59.2%) | 3.07 |
| Single Male/Father | 210 (9.3%) | 4.71 |
| Single Female/Mother | 712 (31.5%) | 2.51 |
| Total Families | 2,258 (100.0%) | 3.05 |
Median Household Size in Cortez
The median household size in Cortez is 2.46 persons per household, with single male/father households (210 | 5.9%) accounting for the largest median household size of 4.71 persons per household. non-family households (1,270 | 36.0%) represent the smallest median household size with 1.28 persons per household.
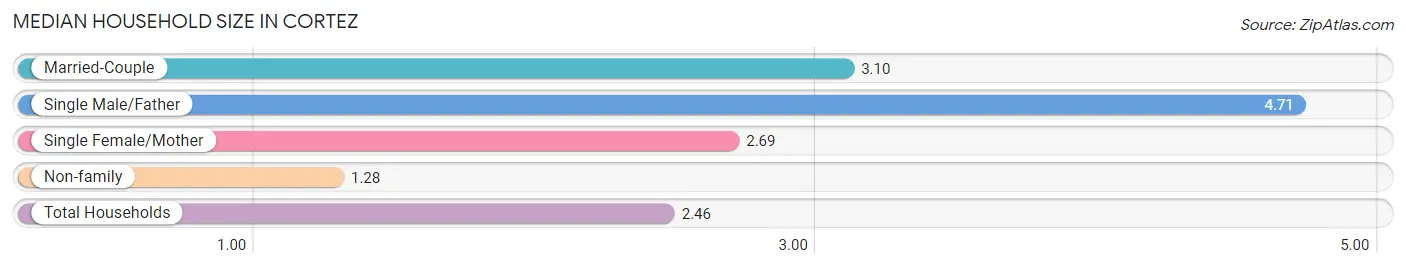
| Household Type | # Households | Household Size |
| Married-Couple | 1,336 (37.9%) | 3.10 |
| Single Male/Father | 210 (5.9%) | 4.71 |
| Single Female/Mother | 712 (20.2%) | 2.69 |
| Non-family | 1,270 (36.0%) | 1.28 |
| Total Households | 3,528 (100.0%) | 2.46 |
Household Size by Marriage Status in Cortez
Out of a total of 3,528 households in Cortez, 2,258 (64.0%) are family households, while 1,270 (36.0%) are nonfamily households. The most numerous type of family households are 2-person households, comprising 1,282, and the most common type of nonfamily households are 1-person households, comprising 1,001.
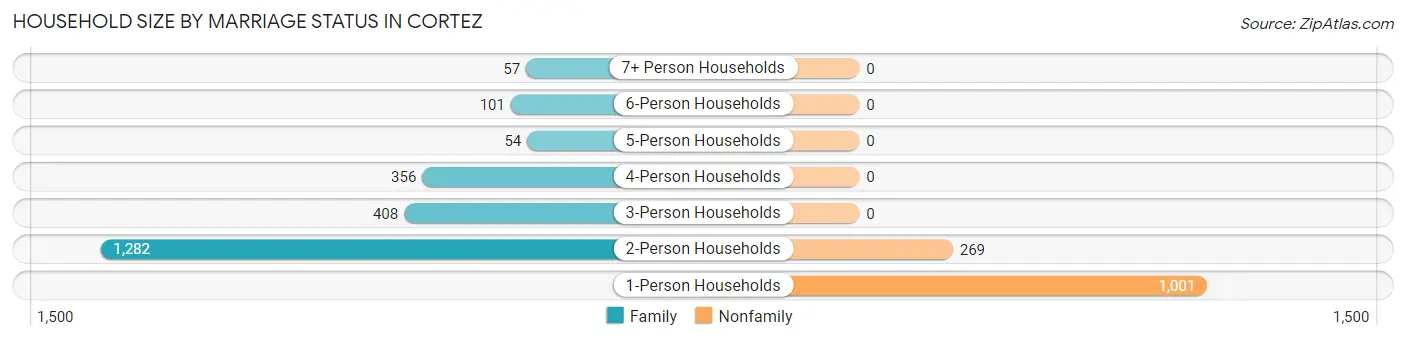
| Household Size | Family Households | Nonfamily Households |
| 1-Person Households | - | 1,001 (28.4%) |
| 2-Person Households | 1,282 (36.3%) | 269 (7.6%) |
| 3-Person Households | 408 (11.6%) | 0 (0.0%) |
| 4-Person Households | 356 (10.1%) | 0 (0.0%) |
| 5-Person Households | 54 (1.5%) | 0 (0.0%) |
| 6-Person Households | 101 (2.9%) | 0 (0.0%) |
| 7+ Person Households | 57 (1.6%) | 0 (0.0%) |
| Total | 2,258 (64.0%) | 1,270 (36.0%) |
Female Fertility in Cortez
Fertility by Age in Cortez
Average fertility rate in Cortez is 88.0 births per 1,000 women. Women in the age bracket of 35 to 50 years have the highest fertility rate with 195.0 births per 1,000 women. Women in the age bracket of 35 to 50 years acount for 89.4% of all women with births.
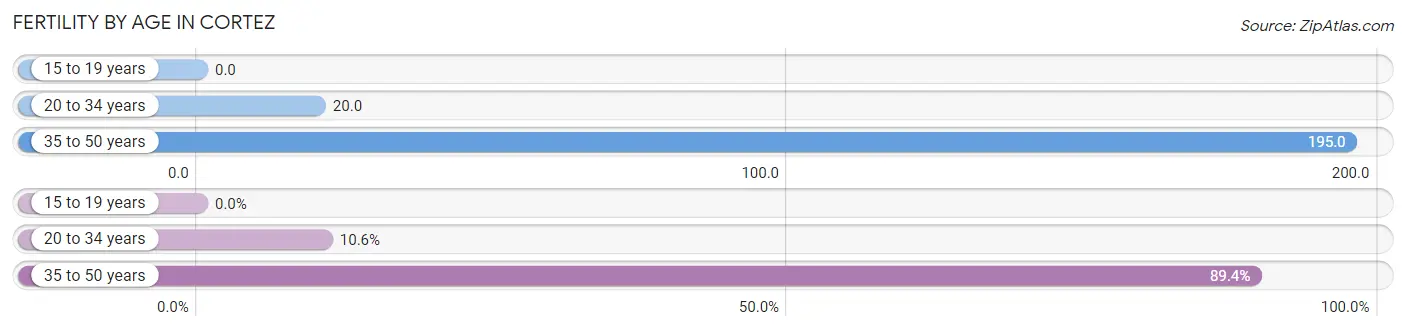
| Age Bracket | Women with Births | Births / 1,000 Women |
| 15 to 19 years | 0 (0.0%) | 0.0 |
| 20 to 34 years | 18 (10.6%) | 20.0 |
| 35 to 50 years | 152 (89.4%) | 195.0 |
| Total | 170 (100.0%) | 88.0 |
Fertility by Age by Marriage Status in Cortez
15.9% of women with births (170) in Cortez are married. The highest percentage of unmarried women with births falls into 35 to 50 years age bracket with 89.5% of them unmarried at the time of birth, while the lowest percentage of unmarried women with births belong to 20 to 34 years age bracket with 38.9% of them unmarried.
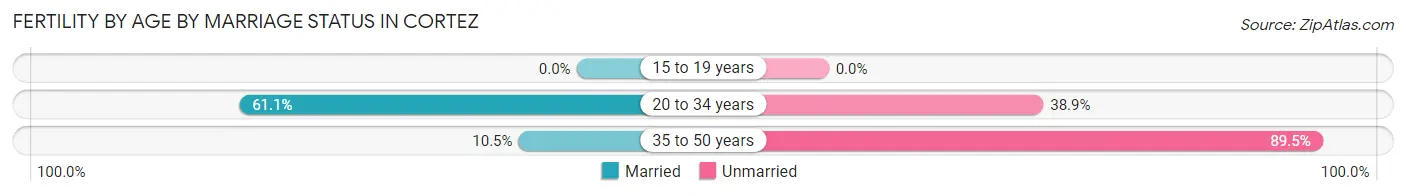
| Age Bracket | Married | Unmarried |
| 15 to 19 years | 0 (0.0%) | 0 (0.0%) |
| 20 to 34 years | 11 (61.1%) | 7 (38.9%) |
| 35 to 50 years | 16 (10.5%) | 136 (89.5%) |
| Total | 27 (15.9%) | 143 (84.1%) |
Fertility by Education in Cortez
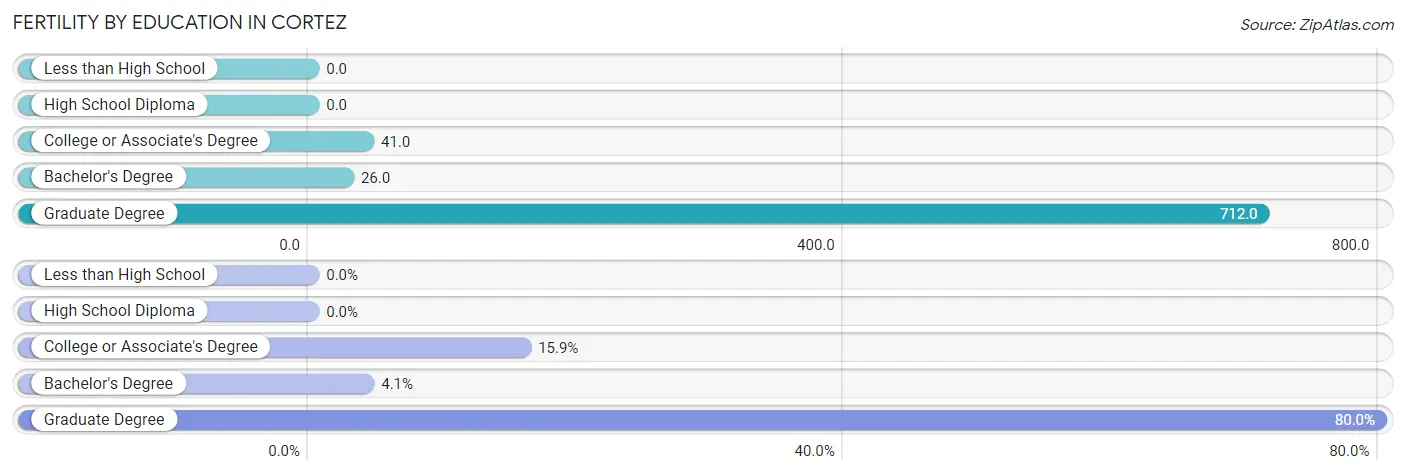
| Educational Attainment | Women with Births | Births / 1,000 Women |
| Less than High School | 0 (0.0%) | 0.0 |
| High School Diploma | 0 (0.0%) | 0.0 |
| College or Associate's Degree | 27 (15.9%) | 41.0 |
| Bachelor's Degree | 7 (4.1%) | 26.0 |
| Graduate Degree | 136 (80.0%) | 712.0 |
| Total | 170 (100.0%) | 88.0 |
Fertility by Education by Marriage Status in Cortez
84.1% of women with births in Cortez are unmarried. Women with the educational attainment of college or associate's degree are most likely to be married with 100.0% of them married at childbirth, while women with the educational attainment of bachelor's degree are least likely to be married with 100.0% of them unmarried at childbirth.
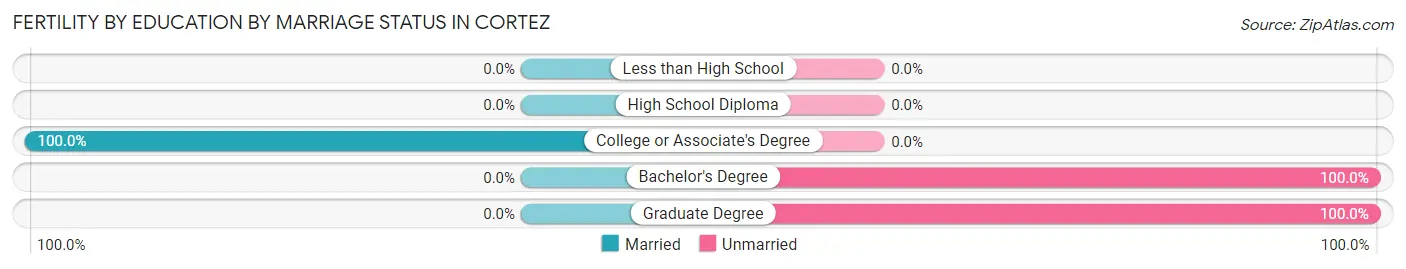
| Educational Attainment | Married | Unmarried |
| Less than High School | 0 (0.0%) | 0 (0.0%) |
| High School Diploma | 0 (0.0%) | 0 (0.0%) |
| College or Associate's Degree | 27 (100.0%) | 0 (0.0%) |
| Bachelor's Degree | 0 (0.0%) | 7 (100.0%) |
| Graduate Degree | 0 (0.0%) | 136 (100.0%) |
| Total | 27 (15.9%) | 143 (84.1%) |
Employment Characteristics in Cortez
Employment by Class of Employer in Cortez
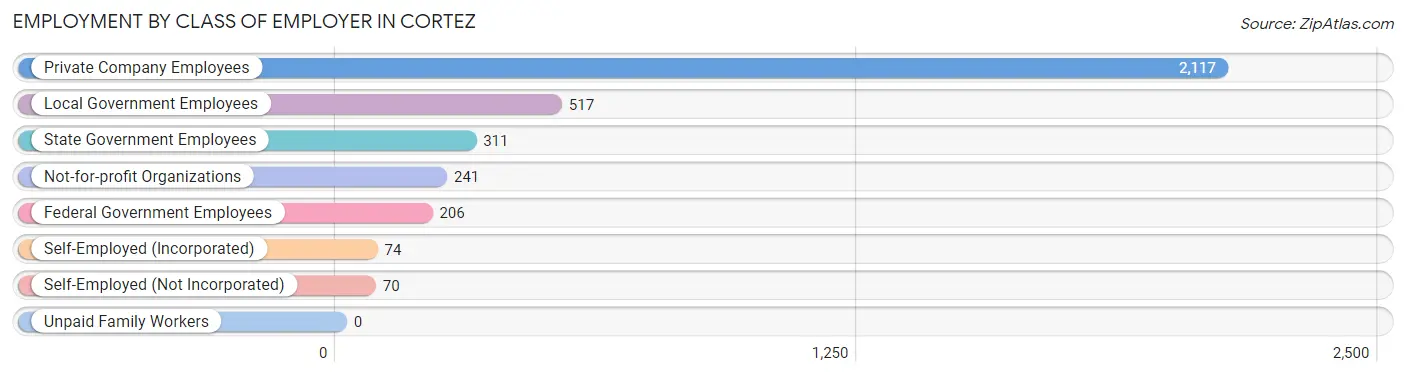
Among the 3,536 employed individuals in Cortez, private company employees (2,117 | 59.9%), local government employees (517 | 14.6%), and state government employees (311 | 8.8%) make up the most common classes of employment.
| Employer Class | # Employees | % Employees |
| Private Company Employees | 2,117 | 59.9% |
| Self-Employed (Incorporated) | 74 | 2.1% |
| Self-Employed (Not Incorporated) | 70 | 2.0% |
| Not-for-profit Organizations | 241 | 6.8% |
| Local Government Employees | 517 | 14.6% |
| State Government Employees | 311 | 8.8% |
| Federal Government Employees | 206 | 5.8% |
| Unpaid Family Workers | 0 | 0.0% |
| Total | 3,536 | 100.0% |
Employment Status by Age in Cortez
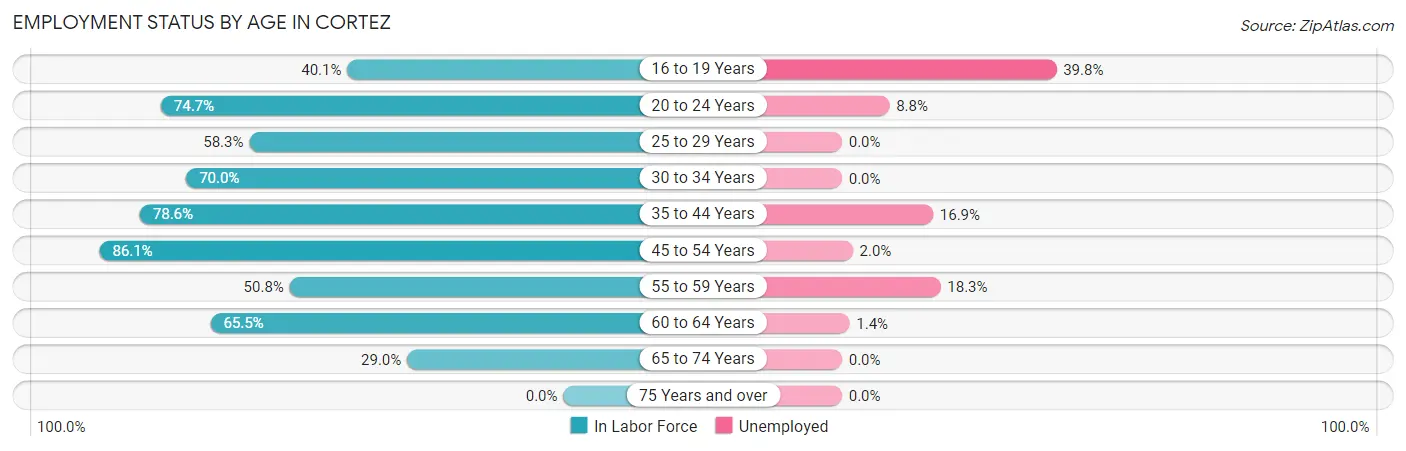
According to the labor force statistics for Cortez, out of the total population over 16 years of age (6,907), 55.3% or 3,820 individuals are in the labor force, with 7.0% or 267 of them unemployed. The age group with the highest labor force participation rate is 45 to 54 years, with 86.1% or 755 individuals in the labor force. Within the labor force, the 16 to 19 years age range has the highest percentage of unemployed individuals, with 39.8% or 43 of them being unemployed.
| Age Bracket | In Labor Force | Unemployed |
| 16 to 19 Years | 108 (40.1%) | 43 (39.8%) |
| 20 to 24 Years | 443 (74.7%) | 39 (8.8%) |
| 25 to 29 Years | 183 (58.3%) | 0 (0.0%) |
| 30 to 34 Years | 601 (70.0%) | 0 (0.0%) |
| 35 to 44 Years | 763 (78.6%) | 129 (16.9%) |
| 45 to 54 Years | 755 (86.1%) | 15 (2.0%) |
| 55 to 59 Years | 191 (50.8%) | 35 (18.3%) |
| 60 to 64 Years | 414 (65.5%) | 6 (1.4%) |
| 65 to 74 Years | 360 (29.0%) | 0 (0.0%) |
| 75 Years and over | 0 (0.0%) | 0 (0.0%) |
| Total | 3,820 (55.3%) | 267 (7.0%) |
Employment Status by Educational Attainment in Cortez
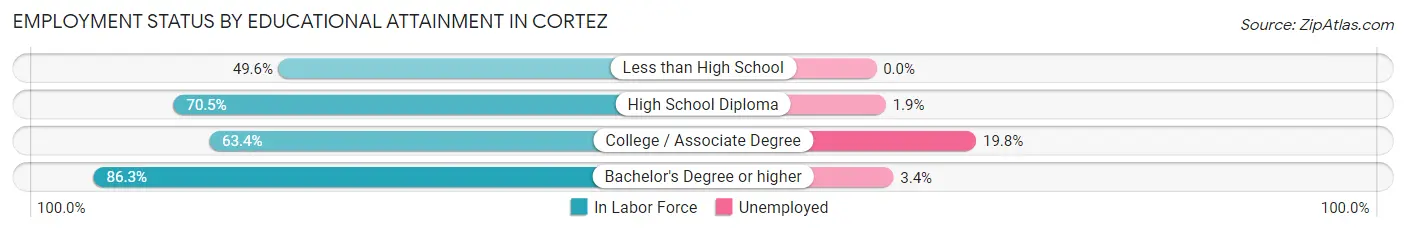
According to labor force statistics for Cortez, 72.2% of individuals (2,909) out of the total population between 25 and 64 years of age (4,029) are in the labor force, with 6.4% or 186 of them being unemployed. The group with the highest labor force participation rate are those with the educational attainment of bachelor's degree or higher, with 86.3% or 1,047 individuals in the labor force. Within the labor force, individuals with college / associate degree education have the highest percentage of unemployment, with 19.8% or 128 of them being unemployed.
| Educational Attainment | In Labor Force | Unemployed |
| Less than High School | 127 (49.6%) | 0 (0.0%) |
| High School Diploma | 1,086 (70.5%) | 29 (1.9%) |
| College / Associate Degree | 646 (63.4%) | 202 (19.8%) |
| Bachelor's Degree or higher | 1,047 (86.3%) | 41 (3.4%) |
| Total | 2,909 (72.2%) | 258 (6.4%) |
Employment Occupations by Sex in Cortez
Management, Business, Science and Arts Occupations
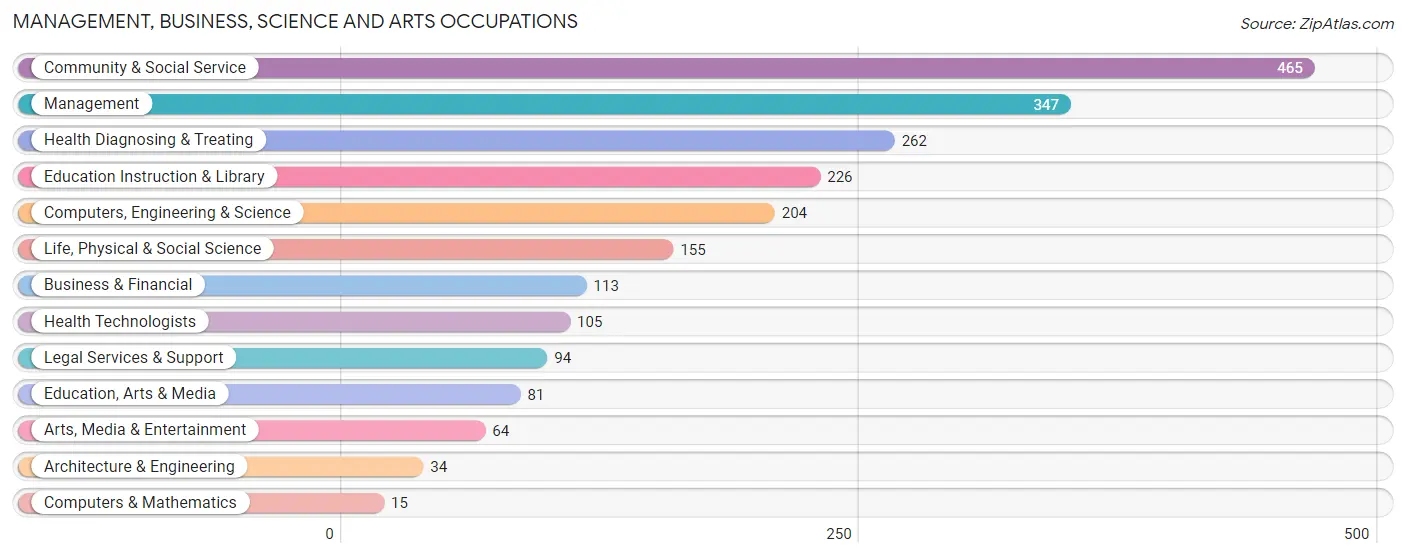
The most common Management, Business, Science and Arts occupations in Cortez are Community & Social Service (465 | 13.1%), Management (347 | 9.8%), Health Diagnosing & Treating (262 | 7.4%), Education Instruction & Library (226 | 6.4%), and Computers, Engineering & Science (204 | 5.8%).
Management, Business, Science and Arts Occupations by Sex
Within the Management, Business, Science and Arts occupations in Cortez, the most male-oriented occupations are Computers & Mathematics (100.0%), Architecture & Engineering (100.0%), and Health Technologists (63.8%), while the most female-oriented occupations are Education, Arts & Media (100.0%), Arts, Media & Entertainment (100.0%), and Life, Physical & Social Science (91.6%).
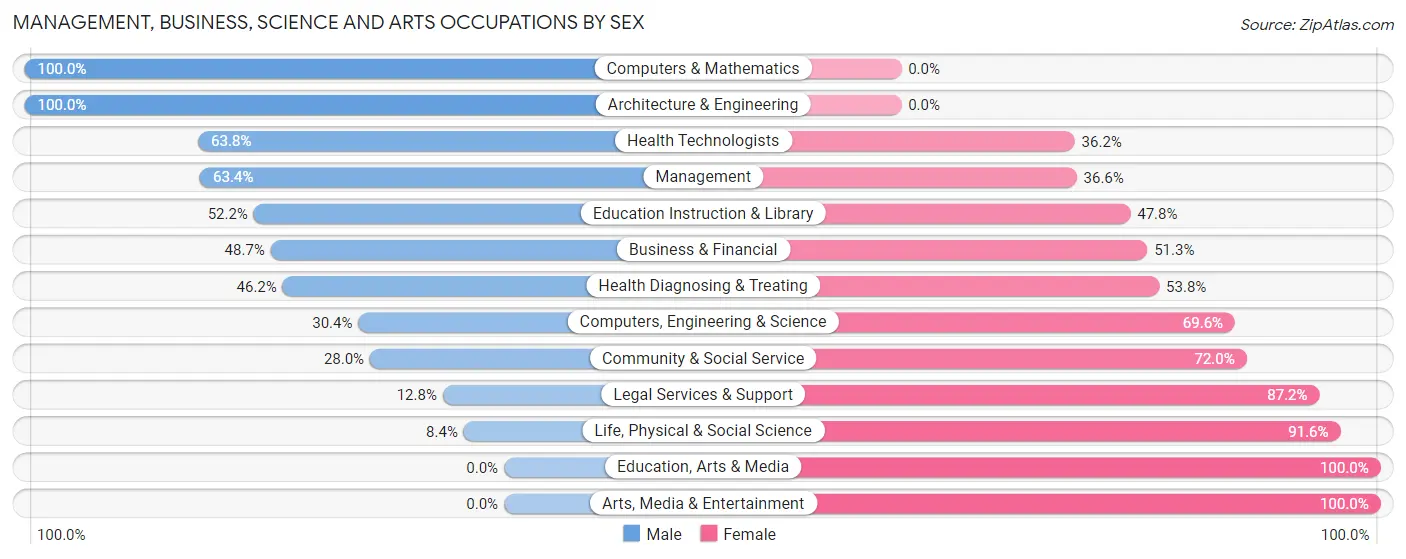
| Occupation | Male | Female |
| Management | 220 (63.4%) | 127 (36.6%) |
| Business & Financial | 55 (48.7%) | 58 (51.3%) |
| Computers, Engineering & Science | 62 (30.4%) | 142 (69.6%) |
| Computers & Mathematics | 15 (100.0%) | 0 (0.0%) |
| Architecture & Engineering | 34 (100.0%) | 0 (0.0%) |
| Life, Physical & Social Science | 13 (8.4%) | 142 (91.6%) |
| Community & Social Service | 130 (28.0%) | 335 (72.0%) |
| Education, Arts & Media | 0 (0.0%) | 81 (100.0%) |
| Legal Services & Support | 12 (12.8%) | 82 (87.2%) |
| Education Instruction & Library | 118 (52.2%) | 108 (47.8%) |
| Arts, Media & Entertainment | 0 (0.0%) | 64 (100.0%) |
| Health Diagnosing & Treating | 121 (46.2%) | 141 (53.8%) |
| Health Technologists | 67 (63.8%) | 38 (36.2%) |
| Total (Category) | 588 (42.3%) | 803 (57.7%) |
| Total (Overall) | 1,912 (53.9%) | 1,638 (46.1%) |
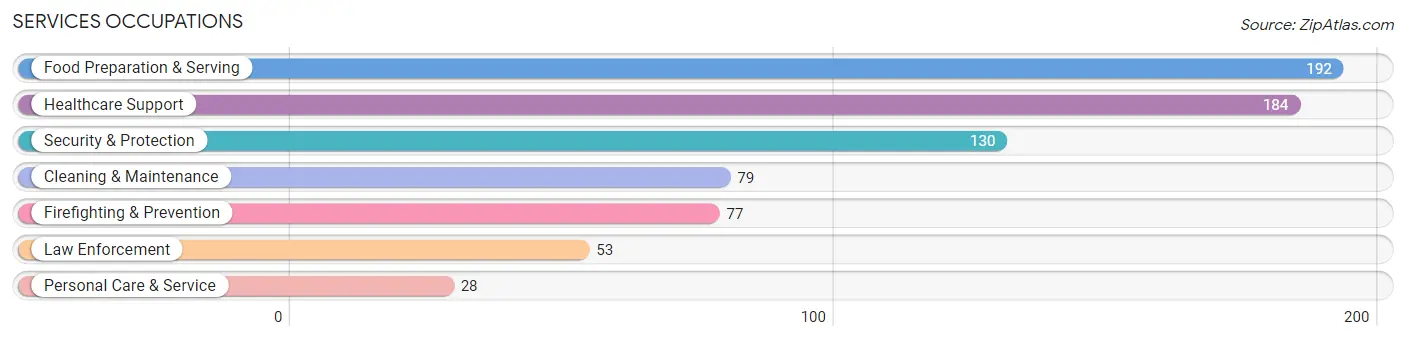
Services Occupations
The most common Services occupations in Cortez are Food Preparation & Serving (192 | 5.4%), Healthcare Support (184 | 5.2%), Security & Protection (130 | 3.7%), Cleaning & Maintenance (79 | 2.2%), and Firefighting & Prevention (77 | 2.2%).
Services Occupations by Sex
Within the Services occupations in Cortez, the most male-oriented occupations are Firefighting & Prevention (100.0%), Security & Protection (78.5%), and Food Preparation & Serving (50.0%), while the most female-oriented occupations are Cleaning & Maintenance (81.0%), Personal Care & Service (78.6%), and Healthcare Support (78.3%).
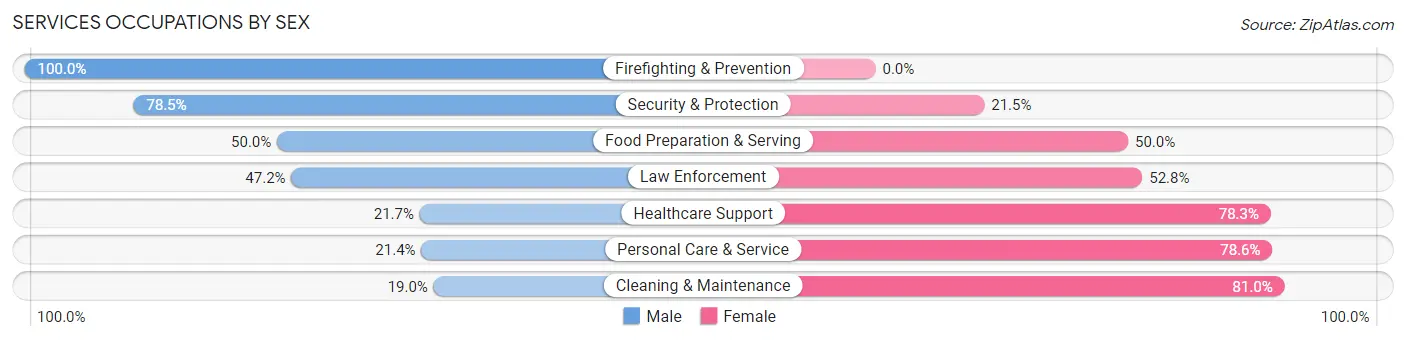
| Occupation | Male | Female |
| Healthcare Support | 40 (21.7%) | 144 (78.3%) |
| Security & Protection | 102 (78.5%) | 28 (21.5%) |
| Firefighting & Prevention | 77 (100.0%) | 0 (0.0%) |
| Law Enforcement | 25 (47.2%) | 28 (52.8%) |
| Food Preparation & Serving | 96 (50.0%) | 96 (50.0%) |
| Cleaning & Maintenance | 15 (19.0%) | 64 (81.0%) |
| Personal Care & Service | 6 (21.4%) | 22 (78.6%) |
| Total (Category) | 259 (42.2%) | 354 (57.8%) |
| Total (Overall) | 1,912 (53.9%) | 1,638 (46.1%) |
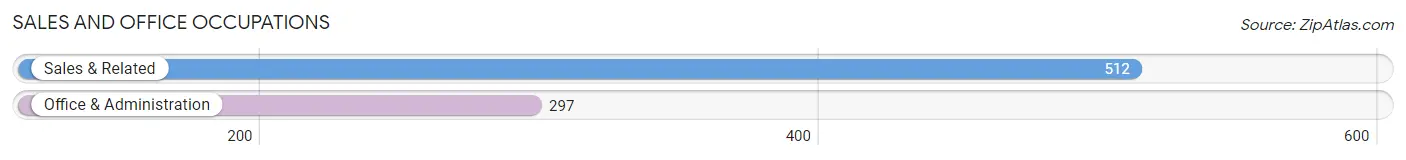
Sales and Office Occupations
The most common Sales and Office occupations in Cortez are Sales & Related (512 | 14.4%), and Office & Administration (297 | 8.4%).
Sales and Office Occupations by Sex

| Occupation | Male | Female |
| Sales & Related | 187 (36.5%) | 325 (63.5%) |
| Office & Administration | 179 (60.3%) | 118 (39.7%) |
| Total (Category) | 366 (45.2%) | 443 (54.8%) |
| Total (Overall) | 1,912 (53.9%) | 1,638 (46.1%) |
Natural Resources, Construction and Maintenance Occupations
The most common Natural Resources, Construction and Maintenance occupations in Cortez are Construction & Extraction (401 | 11.3%), and Installation, Maintenance & Repair (18 | 0.5%).
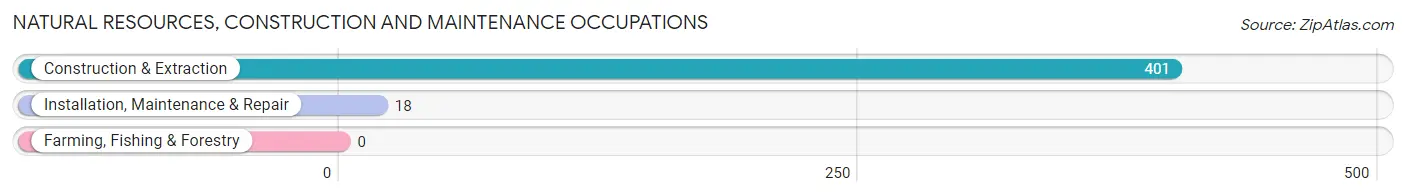
Natural Resources, Construction and Maintenance Occupations by Sex
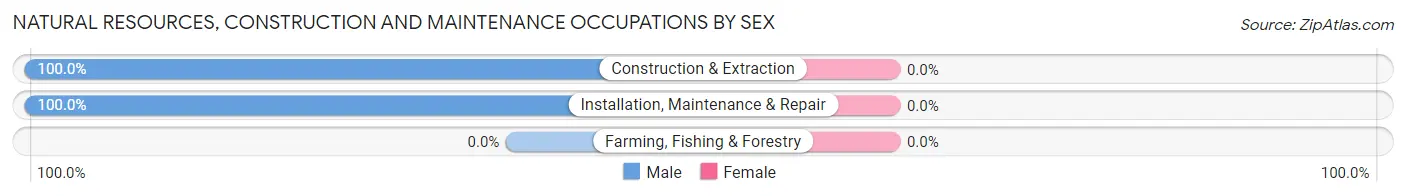
| Occupation | Male | Female |
| Farming, Fishing & Forestry | 0 (0.0%) | 0 (0.0%) |
| Construction & Extraction | 401 (100.0%) | 0 (0.0%) |
| Installation, Maintenance & Repair | 18 (100.0%) | 0 (0.0%) |
| Total (Category) | 419 (100.0%) | 0 (0.0%) |
| Total (Overall) | 1,912 (53.9%) | 1,638 (46.1%) |
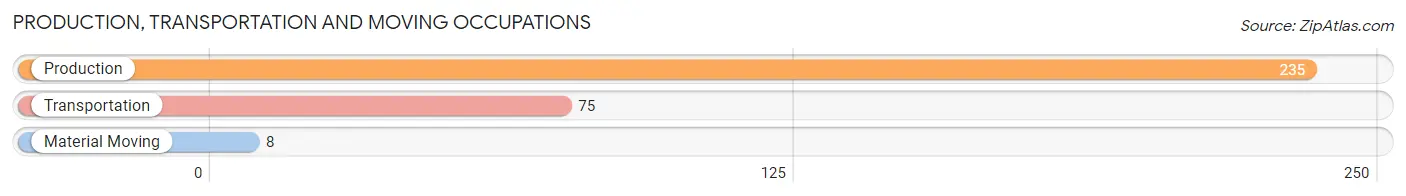
Production, Transportation and Moving Occupations
The most common Production, Transportation and Moving occupations in Cortez are Production (235 | 6.6%), Transportation (75 | 2.1%), and Material Moving (8 | 0.2%).
Production, Transportation and Moving Occupations by Sex
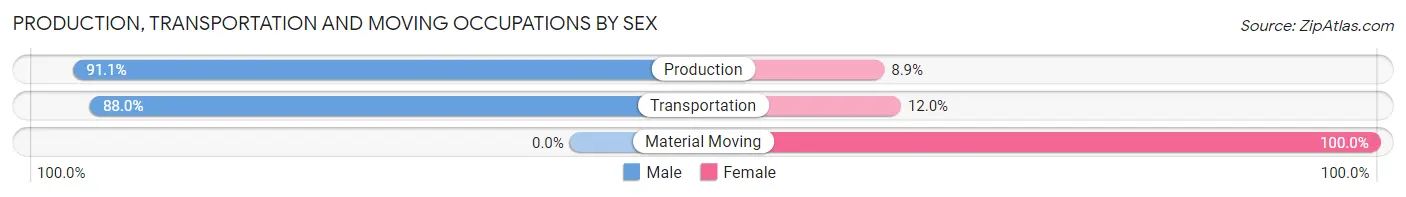
| Occupation | Male | Female |
| Production | 214 (91.1%) | 21 (8.9%) |
| Transportation | 66 (88.0%) | 9 (12.0%) |
| Material Moving | 0 (0.0%) | 8 (100.0%) |
| Total (Category) | 280 (88.0%) | 38 (11.9%) |
| Total (Overall) | 1,912 (53.9%) | 1,638 (46.1%) |
Employment Industries by Sex in Cortez
Employment Industries in Cortez
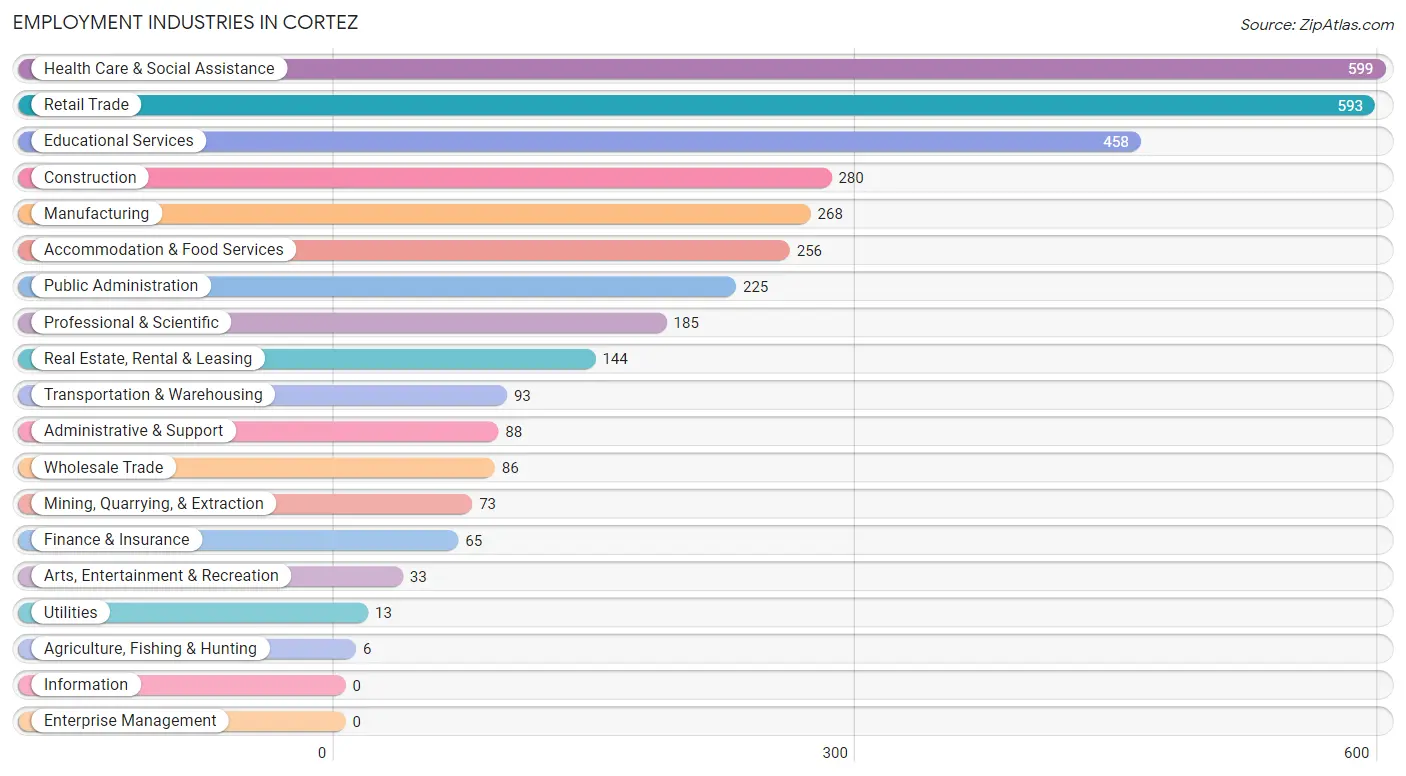
The major employment industries in Cortez include Health Care & Social Assistance (599 | 16.9%), Retail Trade (593 | 16.7%), Educational Services (458 | 12.9%), Construction (280 | 7.9%), and Manufacturing (268 | 7.5%).
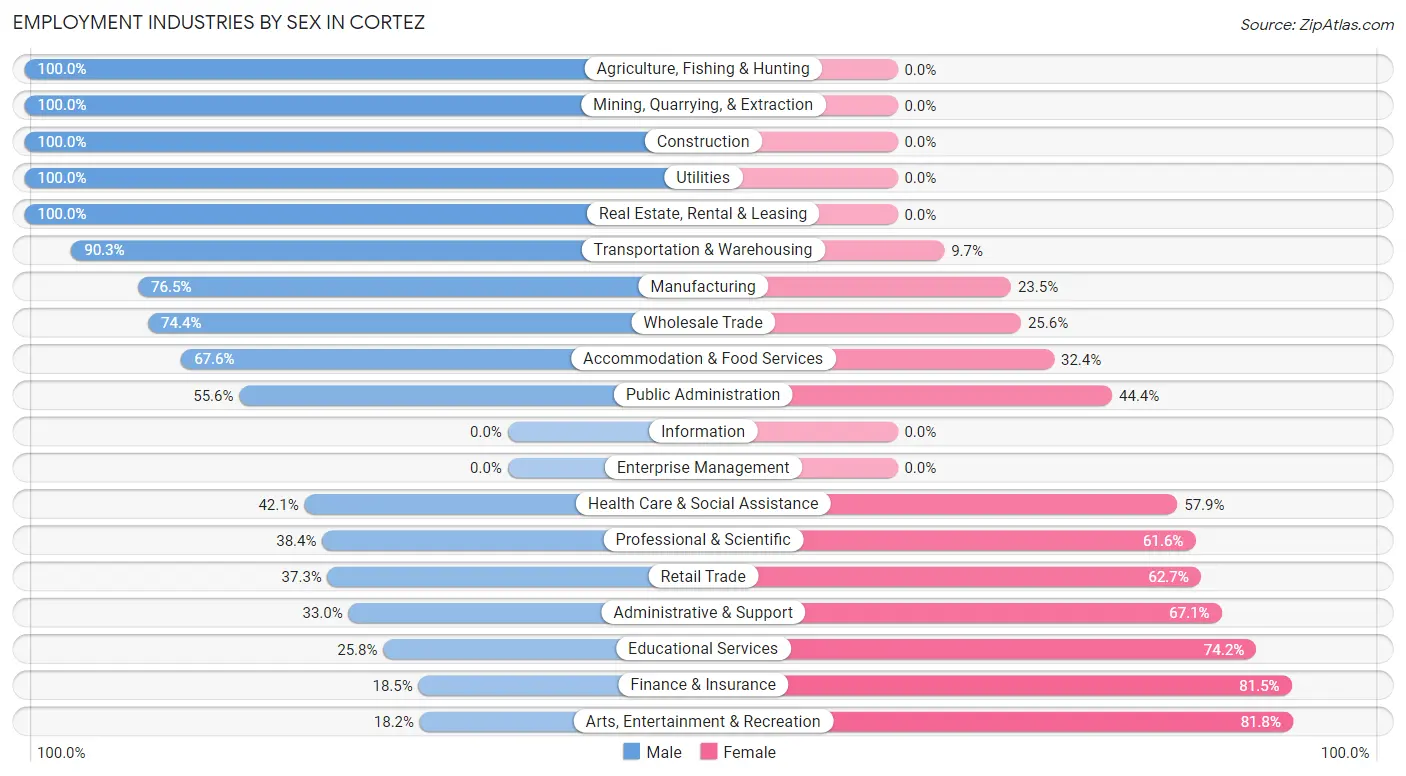
Employment Industries by Sex in Cortez
The Cortez industries that see more men than women are Agriculture, Fishing & Hunting (100.0%), Mining, Quarrying, & Extraction (100.0%), and Construction (100.0%), whereas the industries that tend to have a higher number of women are Arts, Entertainment & Recreation (81.8%), Finance & Insurance (81.5%), and Educational Services (74.2%).
| Industry | Male | Female |
| Agriculture, Fishing & Hunting | 6 (100.0%) | 0 (0.0%) |
| Mining, Quarrying, & Extraction | 73 (100.0%) | 0 (0.0%) |
| Construction | 280 (100.0%) | 0 (0.0%) |
| Manufacturing | 205 (76.5%) | 63 (23.5%) |
| Wholesale Trade | 64 (74.4%) | 22 (25.6%) |
| Retail Trade | 221 (37.3%) | 372 (62.7%) |
| Transportation & Warehousing | 84 (90.3%) | 9 (9.7%) |
| Utilities | 13 (100.0%) | 0 (0.0%) |
| Information | 0 (0.0%) | 0 (0.0%) |
| Finance & Insurance | 12 (18.5%) | 53 (81.5%) |
| Real Estate, Rental & Leasing | 144 (100.0%) | 0 (0.0%) |
| Professional & Scientific | 71 (38.4%) | 114 (61.6%) |
| Enterprise Management | 0 (0.0%) | 0 (0.0%) |
| Administrative & Support | 29 (33.0%) | 59 (67.0%) |
| Educational Services | 118 (25.8%) | 340 (74.2%) |
| Health Care & Social Assistance | 252 (42.1%) | 347 (57.9%) |
| Arts, Entertainment & Recreation | 6 (18.2%) | 27 (81.8%) |
| Accommodation & Food Services | 173 (67.6%) | 83 (32.4%) |
| Public Administration | 125 (55.6%) | 100 (44.4%) |
| Total | 1,912 (53.9%) | 1,638 (46.1%) |
Education in Cortez
School Enrollment in Cortez
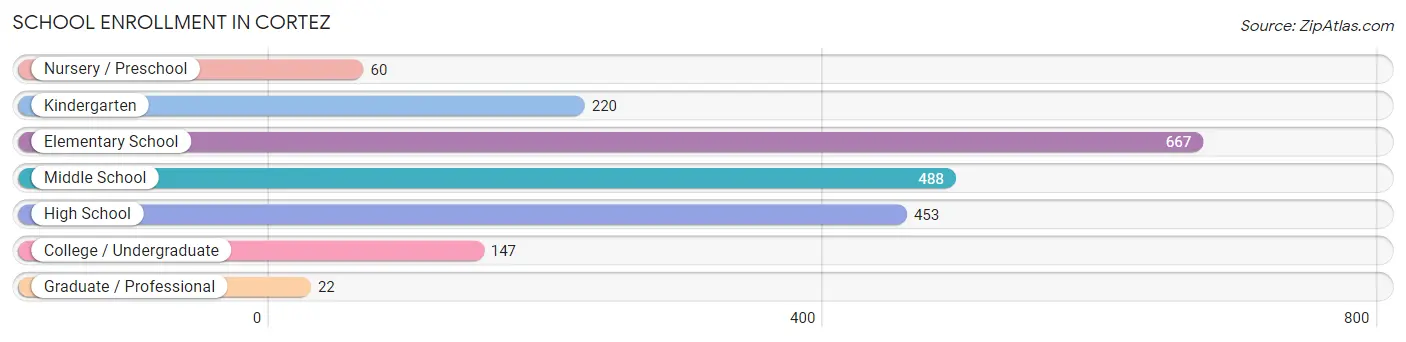
The most common levels of schooling among the 2,057 students in Cortez are elementary school (667 | 32.4%), middle school (488 | 23.7%), and high school (453 | 22.0%).
| School Level | # Students | % Students |
| Nursery / Preschool | 60 | 2.9% |
| Kindergarten | 220 | 10.7% |
| Elementary School | 667 | 32.4% |
| Middle School | 488 | 23.7% |
| High School | 453 | 22.0% |
| College / Undergraduate | 147 | 7.1% |
| Graduate / Professional | 22 | 1.1% |
| Total | 2,057 | 100.0% |
School Enrollment by Age by Funding Source in Cortez
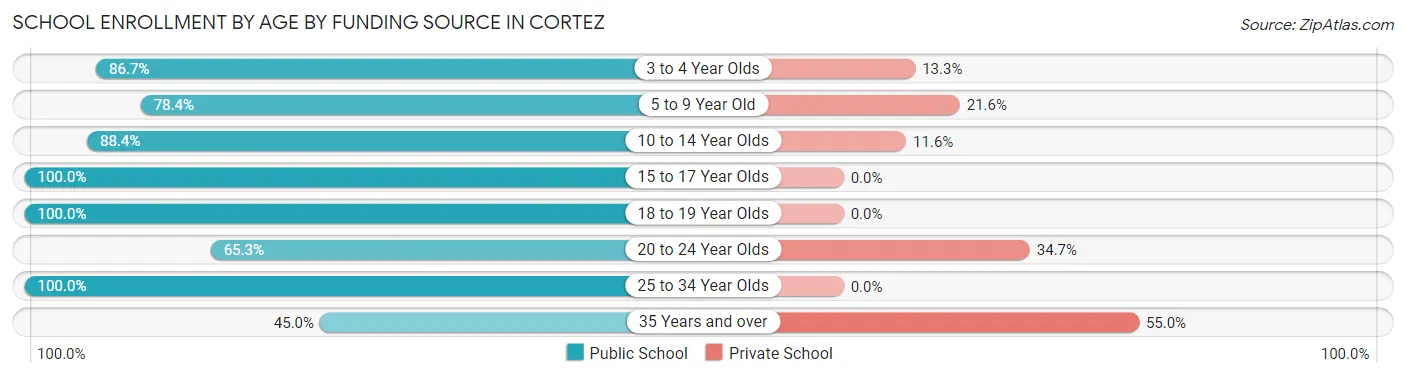
Out of a total of 2,057 students who are enrolled in schools in Cortez, 311 (15.1%) attend a private institution, while the remaining 1,746 (84.9%) are enrolled in public schools. The age group of 35 years and over has the highest likelihood of being enrolled in private schools, with 22 (55.0% in the age bracket) enrolled. Conversely, the age group of 15 to 17 year olds has the lowest likelihood of being enrolled in a private school, with 326 (100.0% in the age bracket) attending a public institution.
| Age Bracket | Public School | Private School |
| 3 to 4 Year Olds | 52 (86.7%) | 8 (13.3%) |
| 5 to 9 Year Old | 598 (78.4%) | 165 (21.6%) |
| 10 to 14 Year Olds | 554 (88.4%) | 73 (11.6%) |
| 15 to 17 Year Olds | 326 (100.0%) | 0 (0.0%) |
| 18 to 19 Year Olds | 102 (100.0%) | 0 (0.0%) |
| 20 to 24 Year Olds | 81 (65.3%) | 43 (34.7%) |
| 25 to 34 Year Olds | 15 (100.0%) | 0 (0.0%) |
| 35 Years and over | 18 (45.0%) | 22 (55.0%) |
| Total | 1,746 (84.9%) | 311 (15.1%) |
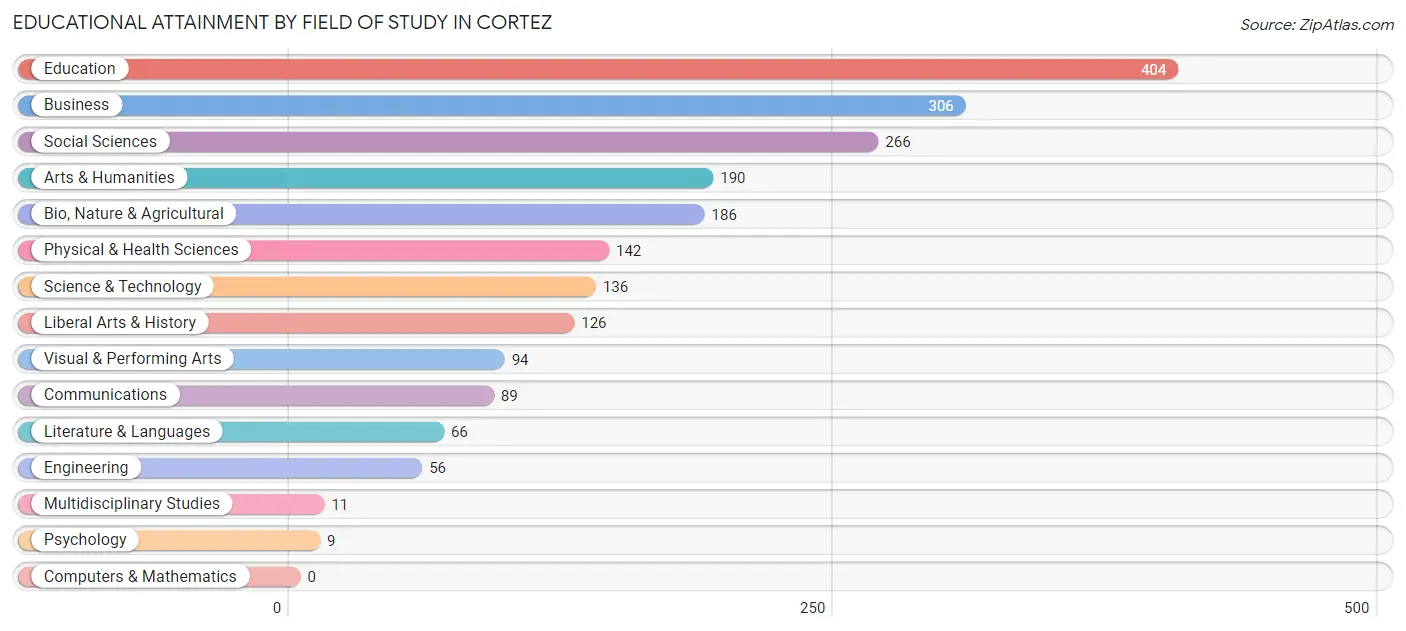
Educational Attainment by Field of Study in Cortez
Education (404 | 19.4%), business (306 | 14.7%), social sciences (266 | 12.8%), arts & humanities (190 | 9.1%), and bio, nature & agricultural (186 | 8.9%) are the most common fields of study among 2,081 individuals in Cortez who have obtained a bachelor's degree or higher.
| Field of Study | # Graduates | % Graduates |
| Computers & Mathematics | 0 | 0.0% |
| Bio, Nature & Agricultural | 186 | 8.9% |
| Physical & Health Sciences | 142 | 6.8% |
| Psychology | 9 | 0.4% |
| Social Sciences | 266 | 12.8% |
| Engineering | 56 | 2.7% |
| Multidisciplinary Studies | 11 | 0.5% |
| Science & Technology | 136 | 6.5% |
| Business | 306 | 14.7% |
| Education | 404 | 19.4% |
| Literature & Languages | 66 | 3.2% |
| Liberal Arts & History | 126 | 6.0% |
| Visual & Performing Arts | 94 | 4.5% |
| Communications | 89 | 4.3% |
| Arts & Humanities | 190 | 9.1% |
| Total | 2,081 | 100.0% |
Transportation & Commute in Cortez
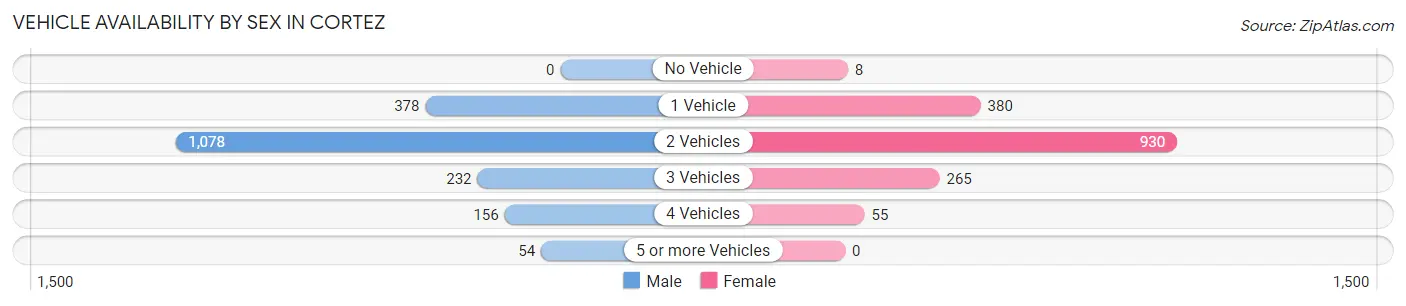
Vehicle Availability by Sex in Cortez
The most prevalent vehicle ownership categories in Cortez are males with 2 vehicles (1,078, accounting for 56.8%) and females with 2 vehicles (930, making up 65.8%).
| Vehicles Available | Male | Female |
| No Vehicle | 0 (0.0%) | 8 (0.5%) |
| 1 Vehicle | 378 (19.9%) | 380 (23.2%) |
| 2 Vehicles | 1,078 (56.8%) | 930 (56.8%) |
| 3 Vehicles | 232 (12.2%) | 265 (16.2%) |
| 4 Vehicles | 156 (8.2%) | 55 (3.4%) |
| 5 or more Vehicles | 54 (2.9%) | 0 (0.0%) |
| Total | 1,898 (100.0%) | 1,638 (100.0%) |
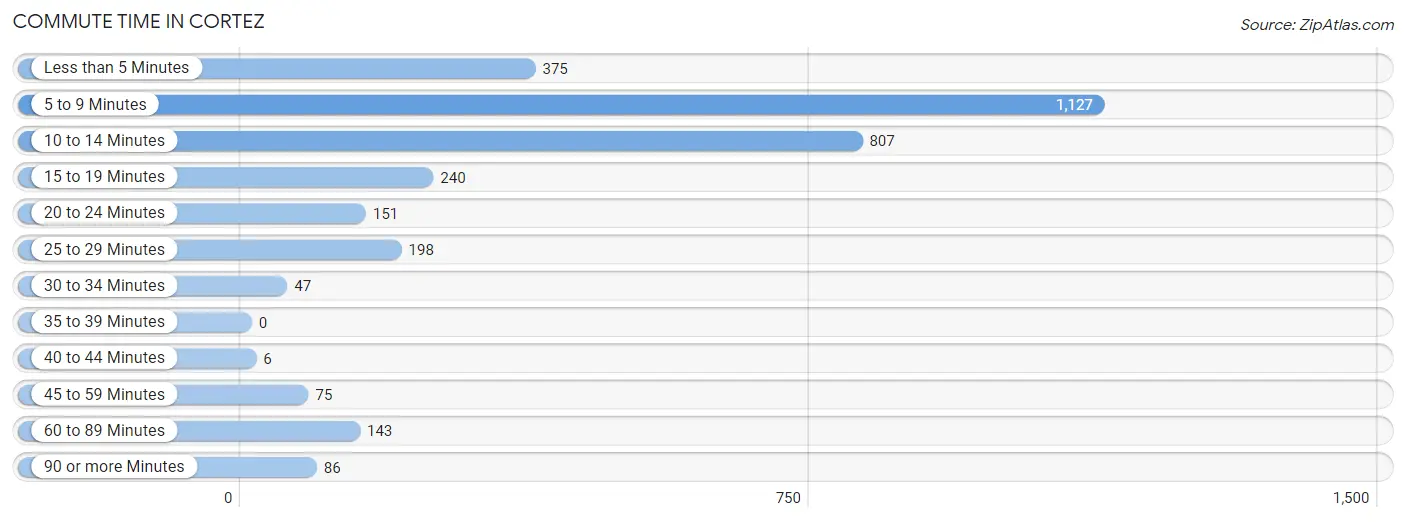
Commute Time in Cortez
The most frequently occuring commute durations in Cortez are 5 to 9 minutes (1,127 commuters, 34.6%), 10 to 14 minutes (807 commuters, 24.8%), and less than 5 minutes (375 commuters, 11.5%).
| Commute Time | # Commuters | % Commuters |
| Less than 5 Minutes | 375 | 11.5% |
| 5 to 9 Minutes | 1,127 | 34.6% |
| 10 to 14 Minutes | 807 | 24.8% |
| 15 to 19 Minutes | 240 | 7.4% |
| 20 to 24 Minutes | 151 | 4.6% |
| 25 to 29 Minutes | 198 | 6.1% |
| 30 to 34 Minutes | 47 | 1.4% |
| 35 to 39 Minutes | 0 | 0.0% |
| 40 to 44 Minutes | 6 | 0.2% |
| 45 to 59 Minutes | 75 | 2.3% |
| 60 to 89 Minutes | 143 | 4.4% |
| 90 or more Minutes | 86 | 2.6% |
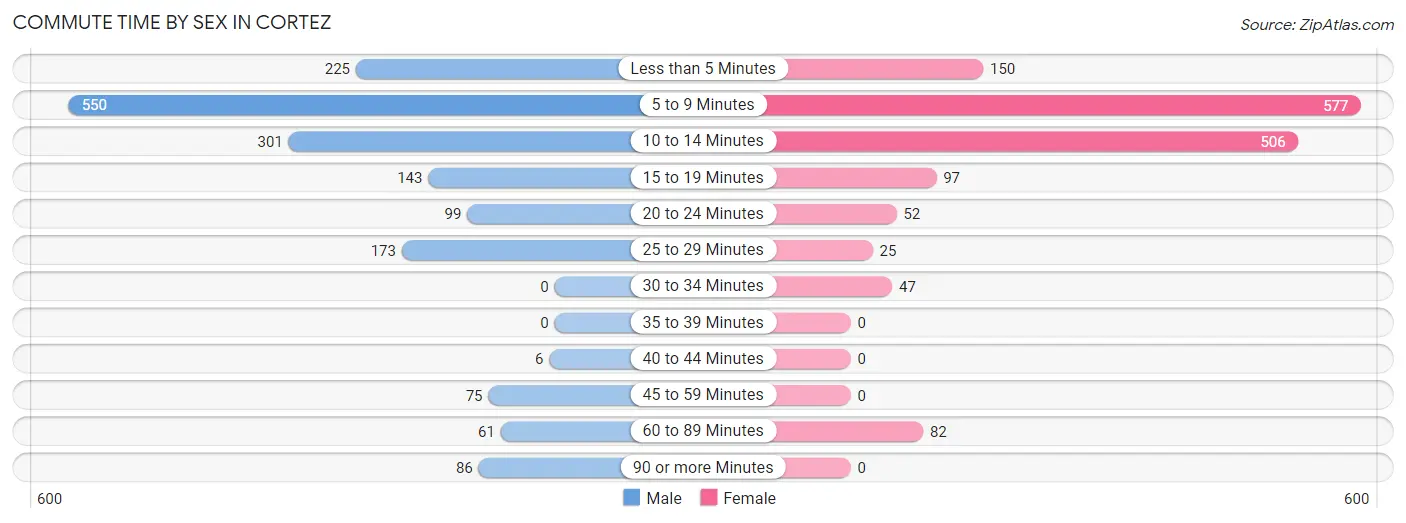
Commute Time by Sex in Cortez
The most common commute times in Cortez are 5 to 9 minutes (550 commuters, 32.0%) for males and 5 to 9 minutes (577 commuters, 37.6%) for females.
| Commute Time | Male | Female |
| Less than 5 Minutes | 225 (13.1%) | 150 (9.8%) |
| 5 to 9 Minutes | 550 (32.0%) | 577 (37.6%) |
| 10 to 14 Minutes | 301 (17.5%) | 506 (32.9%) |
| 15 to 19 Minutes | 143 (8.3%) | 97 (6.3%) |
| 20 to 24 Minutes | 99 (5.8%) | 52 (3.4%) |
| 25 to 29 Minutes | 173 (10.1%) | 25 (1.6%) |
| 30 to 34 Minutes | 0 (0.0%) | 47 (3.1%) |
| 35 to 39 Minutes | 0 (0.0%) | 0 (0.0%) |
| 40 to 44 Minutes | 6 (0.4%) | 0 (0.0%) |
| 45 to 59 Minutes | 75 (4.4%) | 0 (0.0%) |
| 60 to 89 Minutes | 61 (3.5%) | 82 (5.3%) |
| 90 or more Minutes | 86 (5.0%) | 0 (0.0%) |
Time of Departure to Work by Sex in Cortez
The most frequent times of departure to work in Cortez are 7:00 AM to 7:29 AM (318, 18.5%) for males and 7:30 AM to 7:59 AM (386, 25.1%) for females.
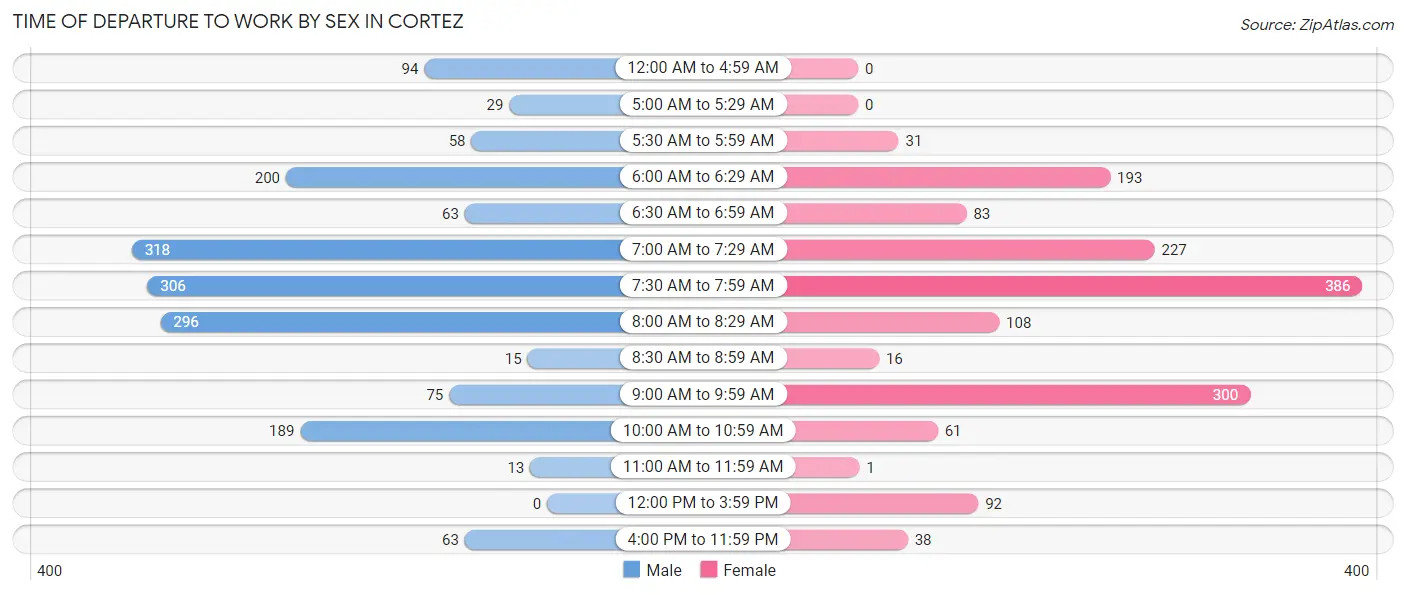
| Time of Departure | Male | Female |
| 12:00 AM to 4:59 AM | 94 (5.5%) | 0 (0.0%) |
| 5:00 AM to 5:29 AM | 29 (1.7%) | 0 (0.0%) |
| 5:30 AM to 5:59 AM | 58 (3.4%) | 31 (2.0%) |
| 6:00 AM to 6:29 AM | 200 (11.6%) | 193 (12.6%) |
| 6:30 AM to 6:59 AM | 63 (3.7%) | 83 (5.4%) |
| 7:00 AM to 7:29 AM | 318 (18.5%) | 227 (14.8%) |
| 7:30 AM to 7:59 AM | 306 (17.8%) | 386 (25.1%) |
| 8:00 AM to 8:29 AM | 296 (17.2%) | 108 (7.0%) |
| 8:30 AM to 8:59 AM | 15 (0.9%) | 16 (1.0%) |
| 9:00 AM to 9:59 AM | 75 (4.4%) | 300 (19.5%) |
| 10:00 AM to 10:59 AM | 189 (11.0%) | 61 (4.0%) |
| 11:00 AM to 11:59 AM | 13 (0.8%) | 1 (0.1%) |
| 12:00 PM to 3:59 PM | 0 (0.0%) | 92 (6.0%) |
| 4:00 PM to 11:59 PM | 63 (3.7%) | 38 (2.5%) |
| Total | 1,719 (100.0%) | 1,536 (100.0%) |
Housing Occupancy in Cortez
Occupancy by Ownership in Cortez
Of the total 3,528 dwellings in Cortez, owner-occupied units account for 2,264 (64.2%), while renter-occupied units make up 1,264 (35.8%).
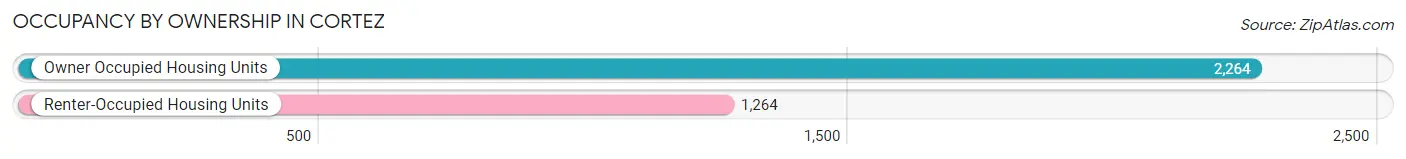
| Occupancy | # Housing Units | % Housing Units |
| Owner Occupied Housing Units | 2,264 | 64.2% |
| Renter-Occupied Housing Units | 1,264 | 35.8% |
| Total Occupied Housing Units | 3,528 | 100.0% |
Occupancy by Household Size in Cortez
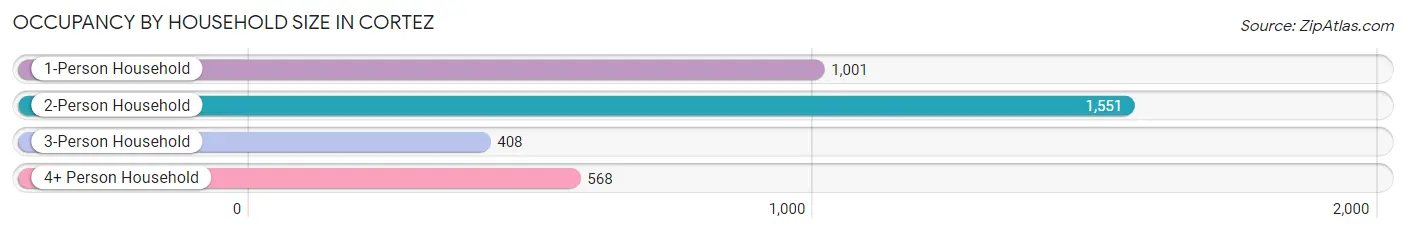
| Household Size | # Housing Units | % Housing Units |
| 1-Person Household | 1,001 | 28.4% |
| 2-Person Household | 1,551 | 44.0% |
| 3-Person Household | 408 | 11.6% |
| 4+ Person Household | 568 | 16.1% |
| Total Housing Units | 3,528 | 100.0% |
Occupancy by Ownership by Household Size in Cortez
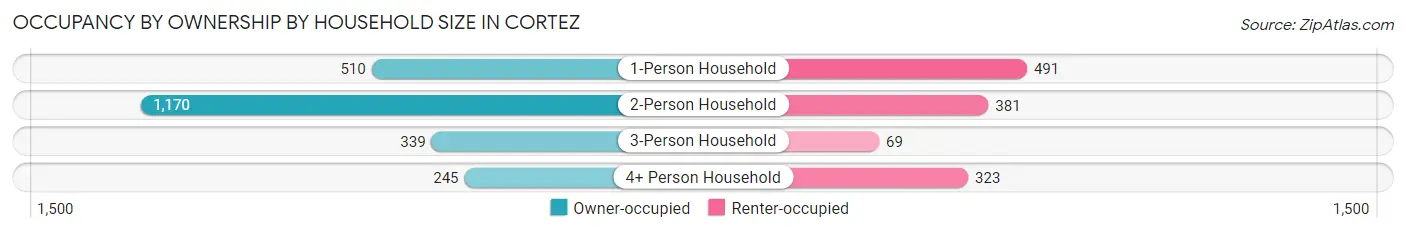
| Household Size | Owner-occupied | Renter-occupied |
| 1-Person Household | 510 (50.9%) | 491 (49.0%) |
| 2-Person Household | 1,170 (75.4%) | 381 (24.6%) |
| 3-Person Household | 339 (83.1%) | 69 (16.9%) |
| 4+ Person Household | 245 (43.1%) | 323 (56.9%) |
| Total Housing Units | 2,264 (64.2%) | 1,264 (35.8%) |
Occupancy by Educational Attainment in Cortez
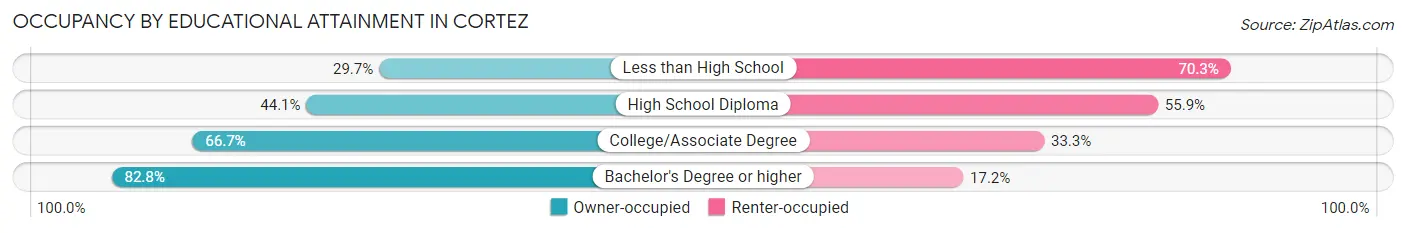
| Household Size | Owner-occupied | Renter-occupied |
| Less than High School | 66 (29.7%) | 156 (70.3%) |
| High School Diploma | 388 (44.1%) | 491 (55.9%) |
| College/Associate Degree | 826 (66.7%) | 412 (33.3%) |
| Bachelor's Degree or higher | 984 (82.8%) | 205 (17.2%) |
Occupancy by Age of Householder in Cortez
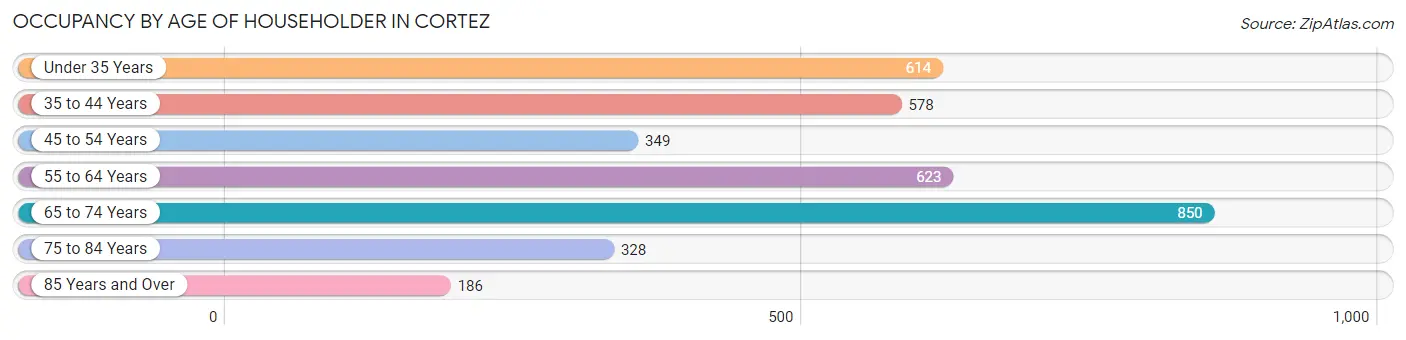
| Age Bracket | # Households | % Households |
| Under 35 Years | 614 | 17.4% |
| 35 to 44 Years | 578 | 16.4% |
| 45 to 54 Years | 349 | 9.9% |
| 55 to 64 Years | 623 | 17.7% |
| 65 to 74 Years | 850 | 24.1% |
| 75 to 84 Years | 328 | 9.3% |
| 85 Years and Over | 186 | 5.3% |
| Total | 3,528 | 100.0% |
Housing Finances in Cortez
Median Income by Occupancy in Cortez
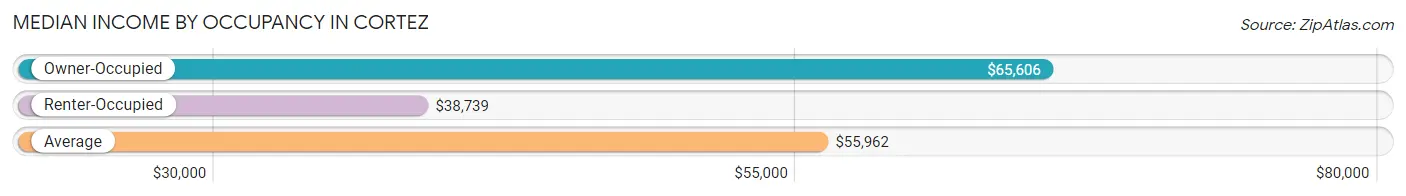
| Occupancy Type | # Households | Median Income |
| Owner-Occupied | 2,264 (64.2%) | $65,606 |
| Renter-Occupied | 1,264 (35.8%) | $38,739 |
| Average | 3,528 (100.0%) | $55,962 |
Occupancy by Householder Income Bracket in Cortez
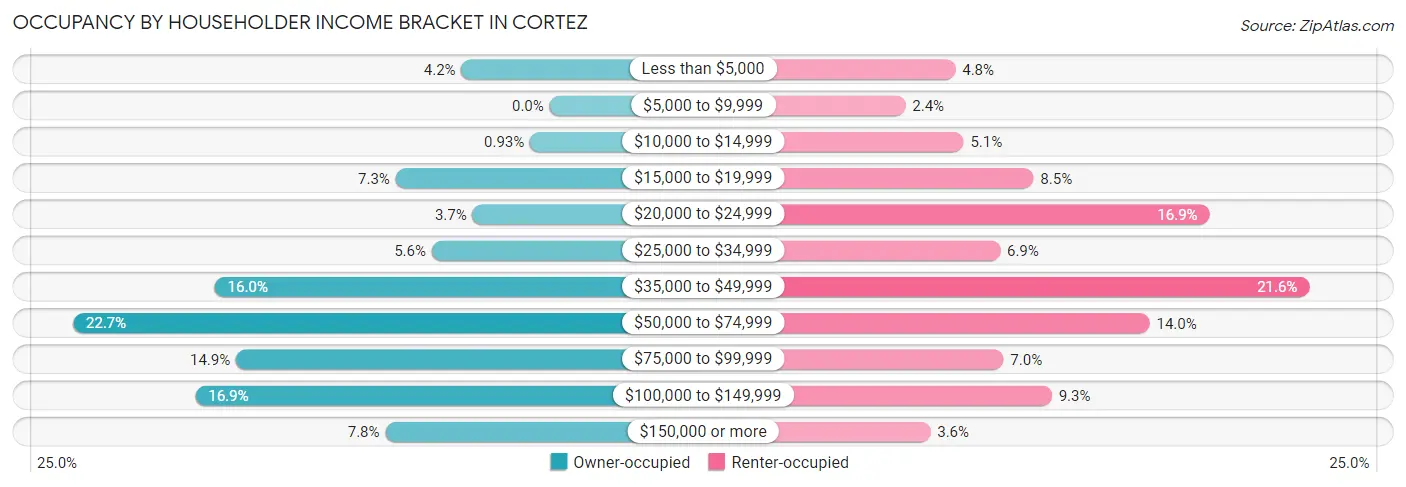
| Income Bracket | Owner-occupied | Renter-occupied |
| Less than $5,000 | 95 (4.2%) | 60 (4.8%) |
| $5,000 to $9,999 | 0 (0.0%) | 30 (2.4%) |
| $10,000 to $14,999 | 21 (0.9%) | 65 (5.1%) |
| $15,000 to $19,999 | 166 (7.3%) | 107 (8.5%) |
| $20,000 to $24,999 | 83 (3.7%) | 213 (16.9%) |
| $25,000 to $34,999 | 127 (5.6%) | 87 (6.9%) |
| $35,000 to $49,999 | 361 (16.0%) | 273 (21.6%) |
| $50,000 to $74,999 | 514 (22.7%) | 177 (14.0%) |
| $75,000 to $99,999 | 338 (14.9%) | 89 (7.0%) |
| $100,000 to $149,999 | 382 (16.9%) | 118 (9.3%) |
| $150,000 or more | 177 (7.8%) | 45 (3.6%) |
| Total | 2,264 (100.0%) | 1,264 (100.0%) |
Monthly Housing Cost Tiers in Cortez
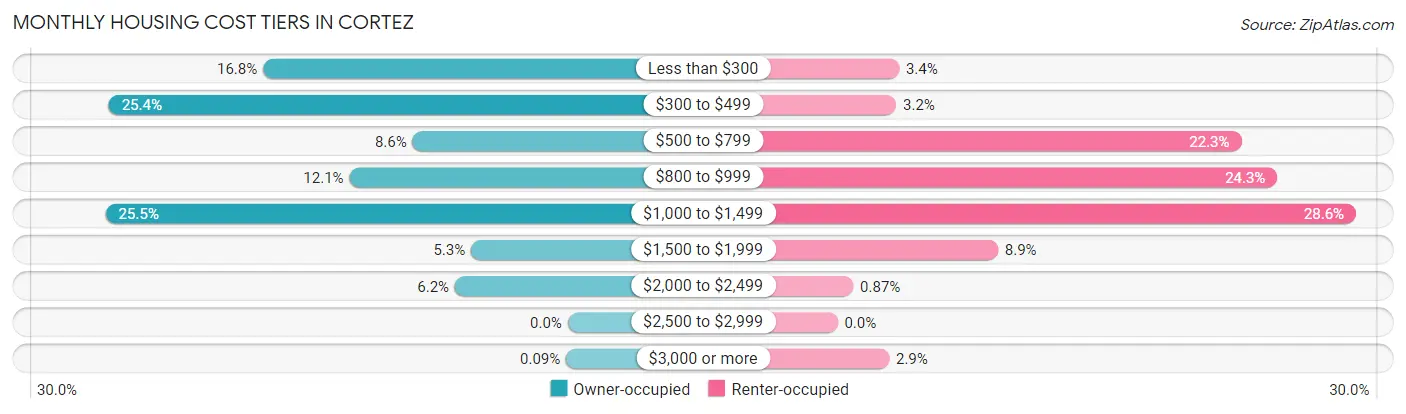
| Monthly Cost | Owner-occupied | Renter-occupied |
| Less than $300 | 381 (16.8%) | 43 (3.4%) |
| $300 to $499 | 574 (25.4%) | 41 (3.2%) |
| $500 to $799 | 194 (8.6%) | 282 (22.3%) |
| $800 to $999 | 273 (12.1%) | 307 (24.3%) |
| $1,000 to $1,499 | 578 (25.5%) | 362 (28.6%) |
| $1,500 to $1,999 | 121 (5.3%) | 112 (8.9%) |
| $2,000 to $2,499 | 141 (6.2%) | 11 (0.9%) |
| $2,500 to $2,999 | 0 (0.0%) | 0 (0.0%) |
| $3,000 or more | 2 (0.1%) | 36 (2.9%) |
| Total | 2,264 (100.0%) | 1,264 (100.0%) |
Physical Housing Characteristics in Cortez
Housing Structures in Cortez
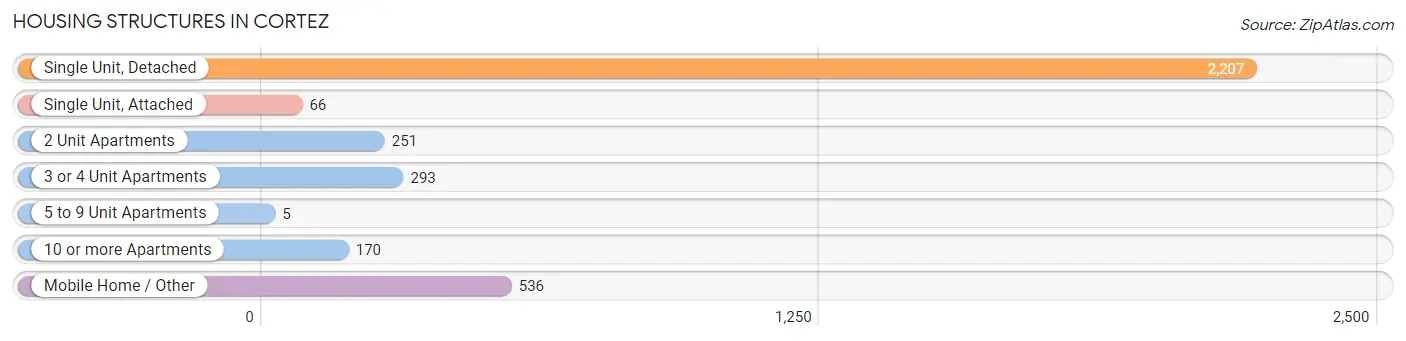
| Structure Type | # Housing Units | % Housing Units |
| Single Unit, Detached | 2,207 | 62.6% |
| Single Unit, Attached | 66 | 1.9% |
| 2 Unit Apartments | 251 | 7.1% |
| 3 or 4 Unit Apartments | 293 | 8.3% |
| 5 to 9 Unit Apartments | 5 | 0.1% |
| 10 or more Apartments | 170 | 4.8% |
| Mobile Home / Other | 536 | 15.2% |
| Total | 3,528 | 100.0% |
Housing Structures by Occupancy in Cortez
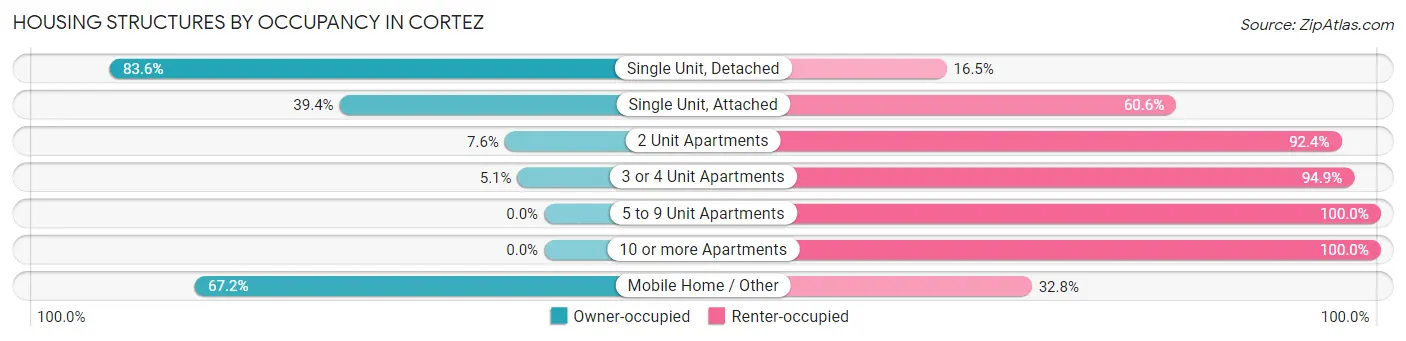
| Structure Type | Owner-occupied | Renter-occupied |
| Single Unit, Detached | 1,844 (83.6%) | 363 (16.5%) |
| Single Unit, Attached | 26 (39.4%) | 40 (60.6%) |
| 2 Unit Apartments | 19 (7.6%) | 232 (92.4%) |
| 3 or 4 Unit Apartments | 15 (5.1%) | 278 (94.9%) |
| 5 to 9 Unit Apartments | 0 (0.0%) | 5 (100.0%) |
| 10 or more Apartments | 0 (0.0%) | 170 (100.0%) |
| Mobile Home / Other | 360 (67.2%) | 176 (32.8%) |
| Total | 2,264 (64.2%) | 1,264 (35.8%) |
Housing Structures by Number of Rooms in Cortez
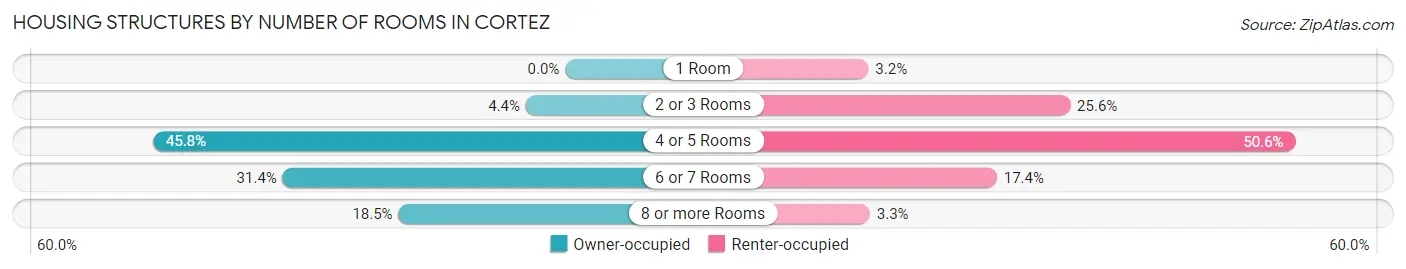
| Number of Rooms | Owner-occupied | Renter-occupied |
| 1 Room | 0 (0.0%) | 40 (3.2%) |
| 2 or 3 Rooms | 99 (4.4%) | 323 (25.6%) |
| 4 or 5 Rooms | 1,036 (45.8%) | 639 (50.5%) |
| 6 or 7 Rooms | 710 (31.4%) | 220 (17.4%) |
| 8 or more Rooms | 419 (18.5%) | 42 (3.3%) |
| Total | 2,264 (100.0%) | 1,264 (100.0%) |
Housing Structure by Heating Type in Cortez
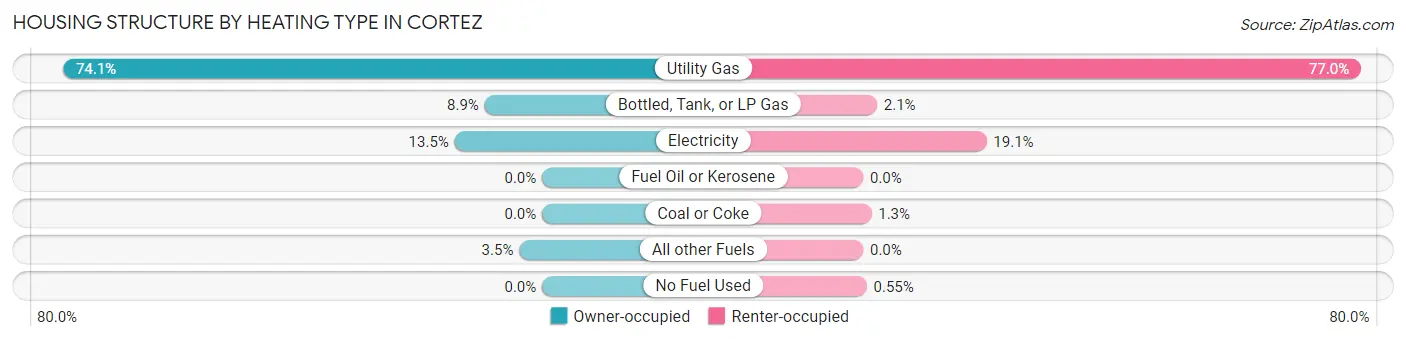
| Heating Type | Owner-occupied | Renter-occupied |
| Utility Gas | 1,677 (74.1%) | 973 (77.0%) |
| Bottled, Tank, or LP Gas | 201 (8.9%) | 27 (2.1%) |
| Electricity | 306 (13.5%) | 241 (19.1%) |
| Fuel Oil or Kerosene | 0 (0.0%) | 0 (0.0%) |
| Coal or Coke | 0 (0.0%) | 16 (1.3%) |
| All other Fuels | 80 (3.5%) | 0 (0.0%) |
| No Fuel Used | 0 (0.0%) | 7 (0.5%) |
| Total | 2,264 (100.0%) | 1,264 (100.0%) |
Household Vehicle Usage in Cortez
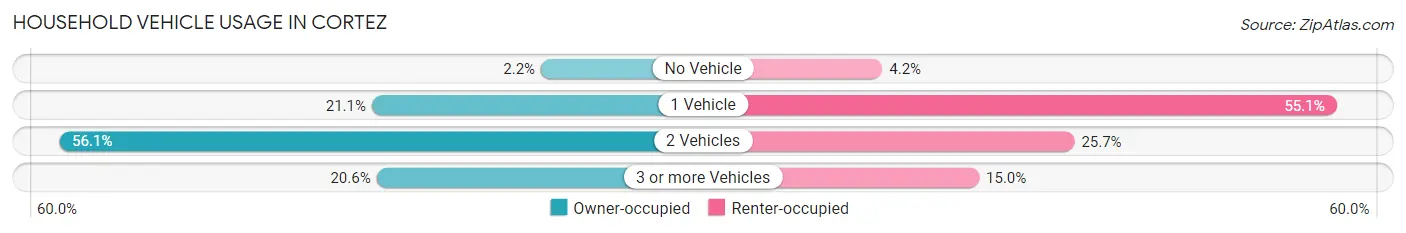
| Vehicles per Household | Owner-occupied | Renter-occupied |
| No Vehicle | 49 (2.2%) | 53 (4.2%) |
| 1 Vehicle | 478 (21.1%) | 696 (55.1%) |
| 2 Vehicles | 1,271 (56.1%) | 325 (25.7%) |
| 3 or more Vehicles | 466 (20.6%) | 190 (15.0%) |
| Total | 2,264 (100.0%) | 1,264 (100.0%) |
Real Estate & Mortgages in Cortez
Real Estate and Mortgage Overview in Cortez
| Characteristic | Without Mortgage | With Mortgage |
| Housing Units | 1,146 | 1,118 |
| Median Property Value | $201,100 | $206,800 |
| Median Household Income | $46,184 | $71 |
| Monthly Housing Costs | $393 | $0 |
| Real Estate Taxes | $586 | $42 |
Property Value by Mortgage Status in Cortez
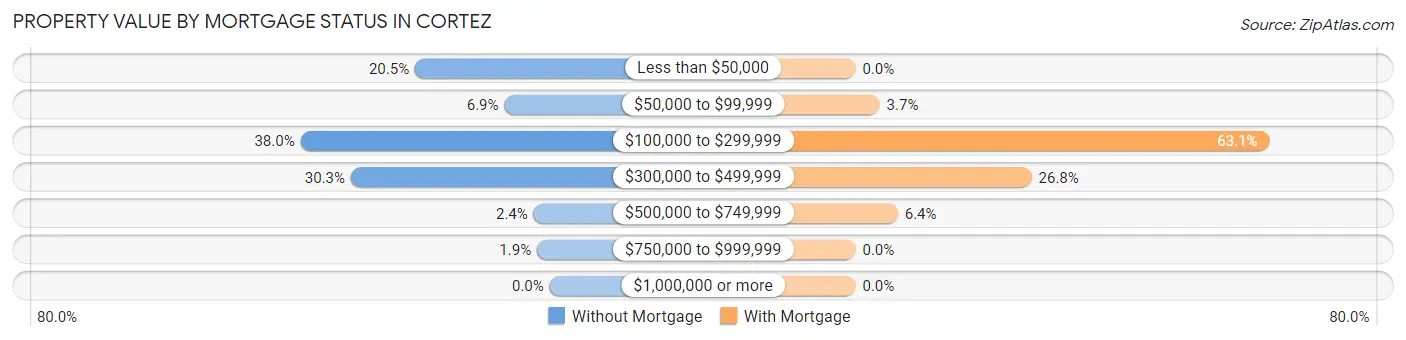
| Property Value | Without Mortgage | With Mortgage |
| Less than $50,000 | 235 (20.5%) | 0 (0.0%) |
| $50,000 to $99,999 | 79 (6.9%) | 41 (3.7%) |
| $100,000 to $299,999 | 435 (38.0%) | 705 (63.1%) |
| $300,000 to $499,999 | 347 (30.3%) | 300 (26.8%) |
| $500,000 to $749,999 | 28 (2.4%) | 72 (6.4%) |
| $750,000 to $999,999 | 22 (1.9%) | 0 (0.0%) |
| $1,000,000 or more | 0 (0.0%) | 0 (0.0%) |
| Total | 1,146 (100.0%) | 1,118 (100.0%) |
Household Income by Mortgage Status in Cortez
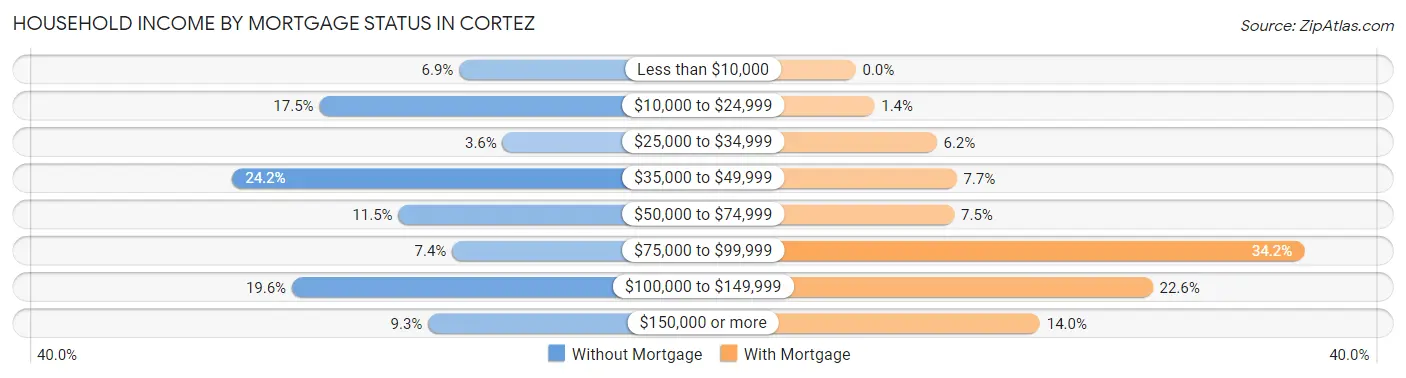
| Household Income | Without Mortgage | With Mortgage |
| Less than $10,000 | 79 (6.9%) | 0 (0.0%) |
| $10,000 to $24,999 | 201 (17.5%) | 16 (1.4%) |
| $25,000 to $34,999 | 41 (3.6%) | 69 (6.2%) |
| $35,000 to $49,999 | 277 (24.2%) | 86 (7.7%) |
| $50,000 to $74,999 | 132 (11.5%) | 84 (7.5%) |
| $75,000 to $99,999 | 85 (7.4%) | 382 (34.2%) |
| $100,000 to $149,999 | 225 (19.6%) | 253 (22.6%) |
| $150,000 or more | 106 (9.2%) | 157 (14.0%) |
| Total | 1,146 (100.0%) | 1,118 (100.0%) |
Property Value to Household Income Ratio in Cortez
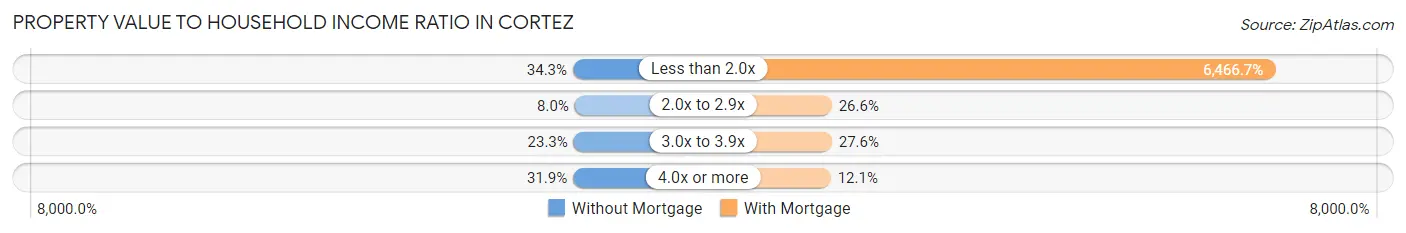
| Value-to-Income Ratio | Without Mortgage | With Mortgage |
| Less than 2.0x | 393 (34.3%) | 72,298 (6,466.7%) |
| 2.0x to 2.9x | 92 (8.0%) | 297 (26.6%) |
| 3.0x to 3.9x | 267 (23.3%) | 309 (27.6%) |
| 4.0x or more | 366 (31.9%) | 135 (12.1%) |
| Total | 1,146 (100.0%) | 1,118 (100.0%) |
Real Estate Taxes by Mortgage Status in Cortez
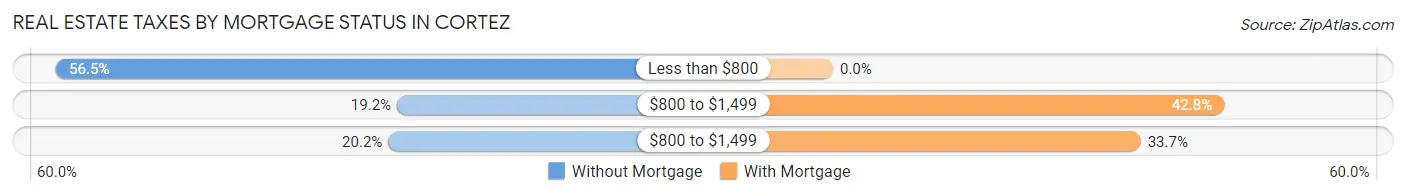
| Property Taxes | Without Mortgage | With Mortgage |
| Less than $800 | 648 (56.5%) | 0 (0.0%) |
| $800 to $1,499 | 220 (19.2%) | 479 (42.8%) |
| $800 to $1,499 | 231 (20.2%) | 377 (33.7%) |
| Total | 1,146 (100.0%) | 1,118 (100.0%) |
Health & Disability in Cortez
Health Insurance Coverage by Age in Cortez
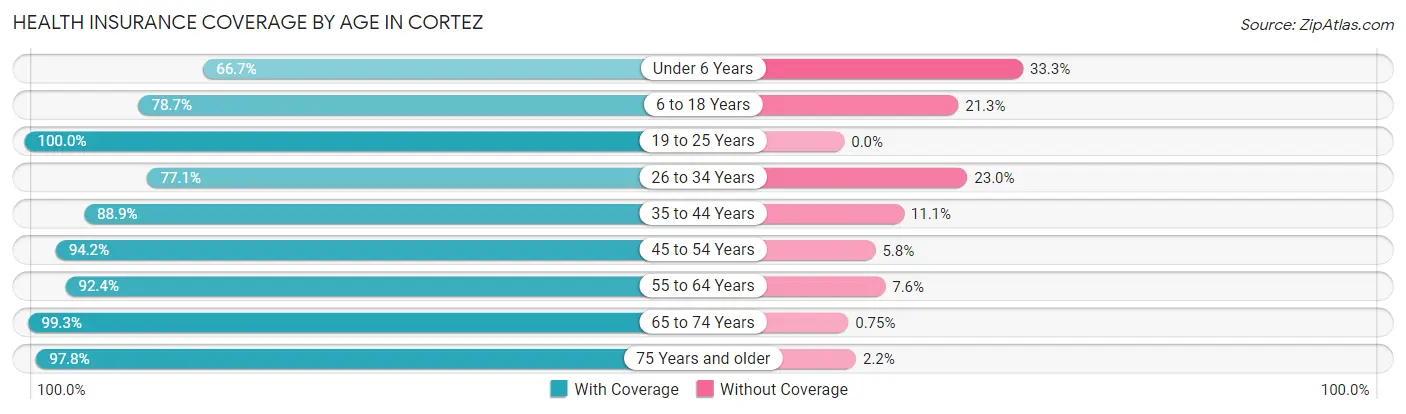
| Age Bracket | With Coverage | Without Coverage |
| Under 6 Years | 274 (66.7%) | 137 (33.3%) |
| 6 to 18 Years | 1,341 (78.7%) | 362 (21.3%) |
| 19 to 25 Years | 708 (100.0%) | 0 (0.0%) |
| 26 to 34 Years | 866 (77.0%) | 258 (23.0%) |
| 35 to 44 Years | 856 (88.9%) | 107 (11.1%) |
| 45 to 54 Years | 826 (94.2%) | 51 (5.8%) |
| 55 to 64 Years | 931 (92.4%) | 77 (7.6%) |
| 65 to 74 Years | 1,195 (99.3%) | 9 (0.7%) |
| 75 Years and older | 715 (97.8%) | 16 (2.2%) |
| Total | 7,712 (88.3%) | 1,017 (11.7%) |
Health Insurance Coverage by Citizenship Status in Cortez
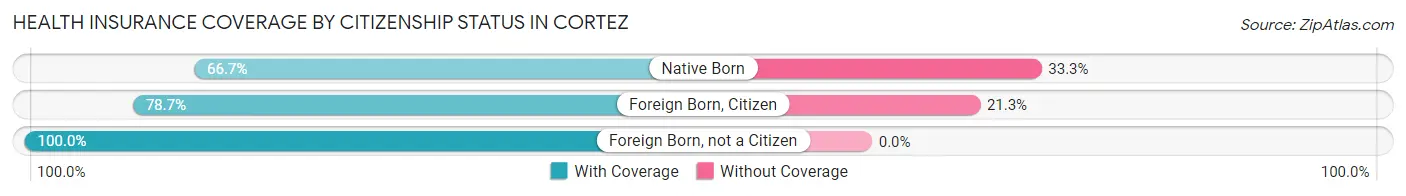
| Citizenship Status | With Coverage | Without Coverage |
| Native Born | 274 (66.7%) | 137 (33.3%) |
| Foreign Born, Citizen | 1,341 (78.7%) | 362 (21.3%) |
| Foreign Born, not a Citizen | 708 (100.0%) | 0 (0.0%) |
Health Insurance Coverage by Household Income in Cortez

| Household Income | With Coverage | Without Coverage |
| Under $25,000 | 1,227 (92.3%) | 102 (7.7%) |
| $25,000 to $49,999 | 1,593 (83.5%) | 314 (16.5%) |
| $50,000 to $74,999 | 2,382 (96.8%) | 79 (3.2%) |
| $75,000 to $99,999 | 780 (71.4%) | 313 (28.6%) |
| $100,000 and over | 1,680 (89.1%) | 206 (10.9%) |
Public vs Private Health Insurance Coverage by Age in Cortez
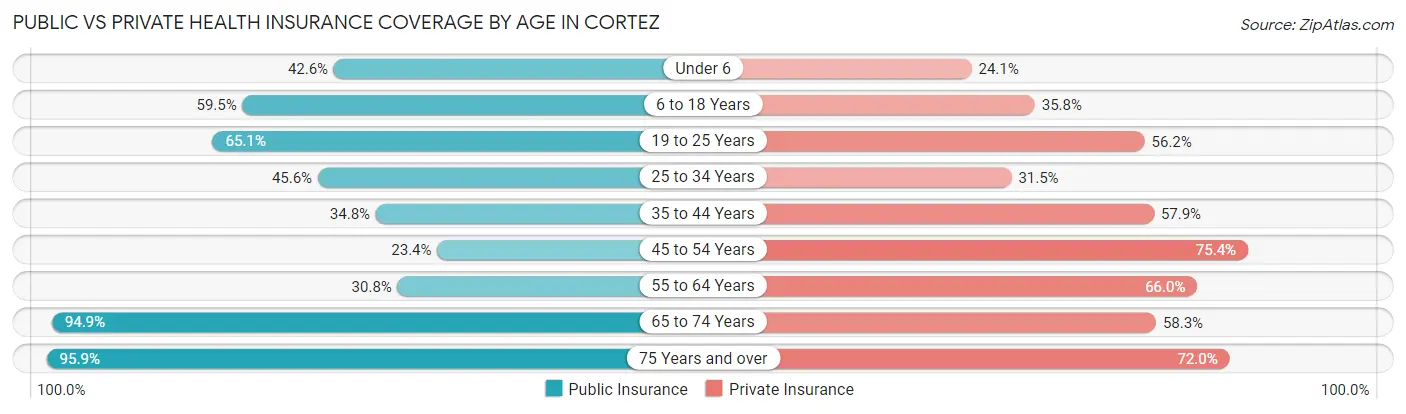
| Age Bracket | Public Insurance | Private Insurance |
| Under 6 | 175 (42.6%) | 99 (24.1%) |
| 6 to 18 Years | 1,014 (59.5%) | 610 (35.8%) |
| 19 to 25 Years | 461 (65.1%) | 398 (56.2%) |
| 25 to 34 Years | 512 (45.6%) | 354 (31.5%) |
| 35 to 44 Years | 335 (34.8%) | 558 (57.9%) |
| 45 to 54 Years | 205 (23.4%) | 661 (75.4%) |
| 55 to 64 Years | 310 (30.7%) | 665 (66.0%) |
| 65 to 74 Years | 1,143 (94.9%) | 702 (58.3%) |
| 75 Years and over | 701 (95.9%) | 526 (72.0%) |
| Total | 4,856 (55.6%) | 4,573 (52.4%) |
Disability Status by Sex by Age in Cortez
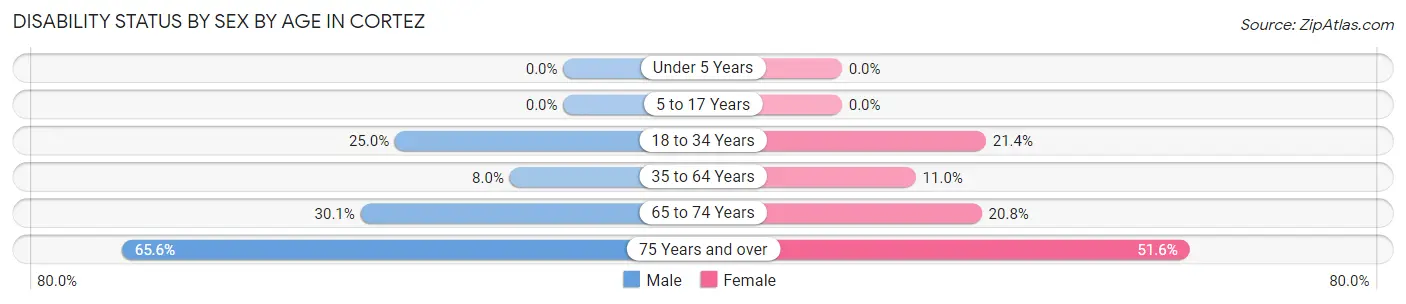
| Age Bracket | Male | Female |
| Under 5 Years | 0 (0.0%) | 0 (0.0%) |
| 5 to 17 Years | 0 (0.0%) | 0 (0.0%) |
| 18 to 34 Years | 230 (25.0%) | 201 (21.4%) |
| 35 to 64 Years | 107 (8.0%) | 165 (11.0%) |
| 65 to 74 Years | 190 (30.1%) | 119 (20.8%) |
| 75 Years and over | 177 (65.6%) | 238 (51.6%) |
Disability Class by Sex by Age in Cortez
Disability Class: Hearing Difficulty
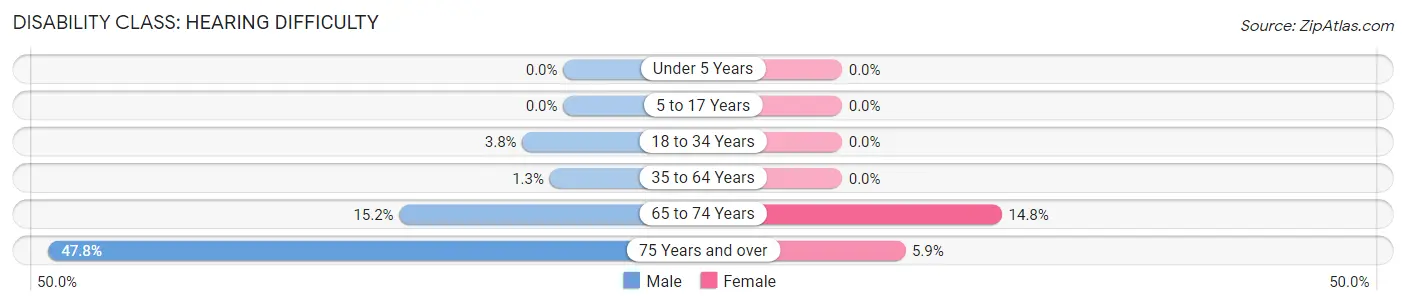
| Age Bracket | Male | Female |
| Under 5 Years | 0 (0.0%) | 0 (0.0%) |
| 5 to 17 Years | 0 (0.0%) | 0 (0.0%) |
| 18 to 34 Years | 35 (3.8%) | 0 (0.0%) |
| 35 to 64 Years | 17 (1.3%) | 0 (0.0%) |
| 65 to 74 Years | 96 (15.2%) | 85 (14.8%) |
| 75 Years and over | 129 (47.8%) | 27 (5.9%) |
Disability Class: Vision Difficulty
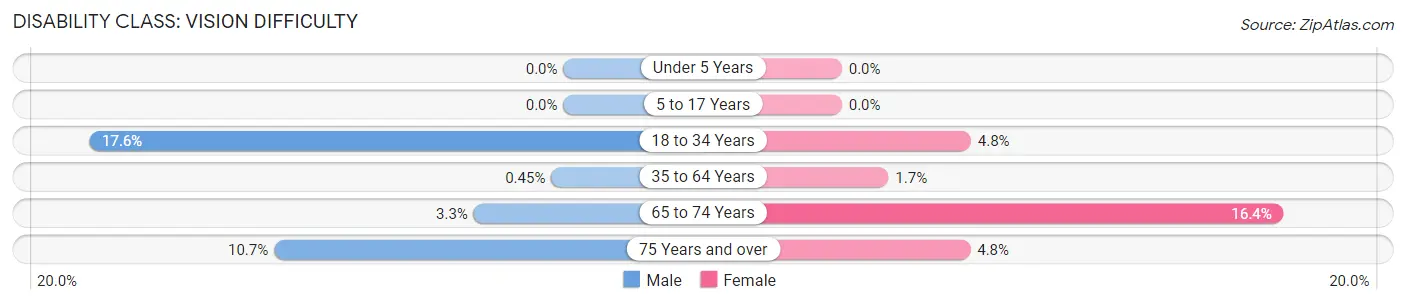
| Age Bracket | Male | Female |
| Under 5 Years | 0 (0.0%) | 0 (0.0%) |
| 5 to 17 Years | 0 (0.0%) | 0 (0.0%) |
| 18 to 34 Years | 162 (17.6%) | 45 (4.8%) |
| 35 to 64 Years | 6 (0.4%) | 26 (1.7%) |
| 65 to 74 Years | 21 (3.3%) | 94 (16.4%) |
| 75 Years and over | 29 (10.7%) | 22 (4.8%) |
Disability Class: Cognitive Difficulty
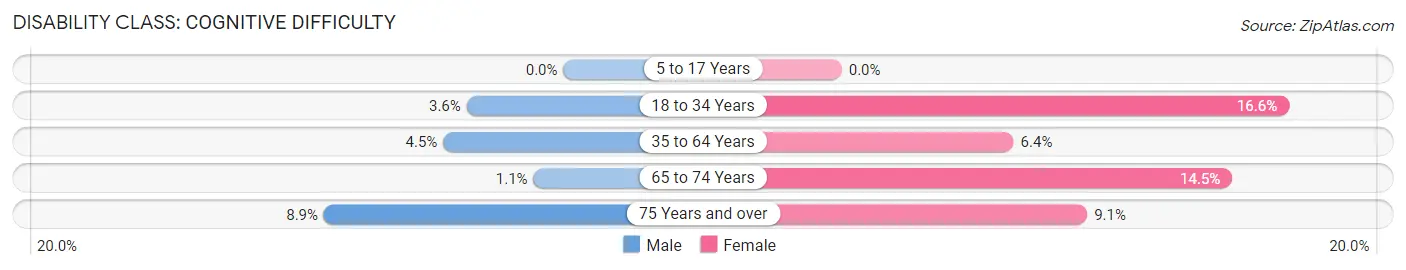
| Age Bracket | Male | Female |
| 5 to 17 Years | 0 (0.0%) | 0 (0.0%) |
| 18 to 34 Years | 33 (3.6%) | 156 (16.6%) |
| 35 to 64 Years | 60 (4.5%) | 96 (6.4%) |
| 65 to 74 Years | 7 (1.1%) | 83 (14.5%) |
| 75 Years and over | 24 (8.9%) | 42 (9.1%) |
Disability Class: Ambulatory Difficulty
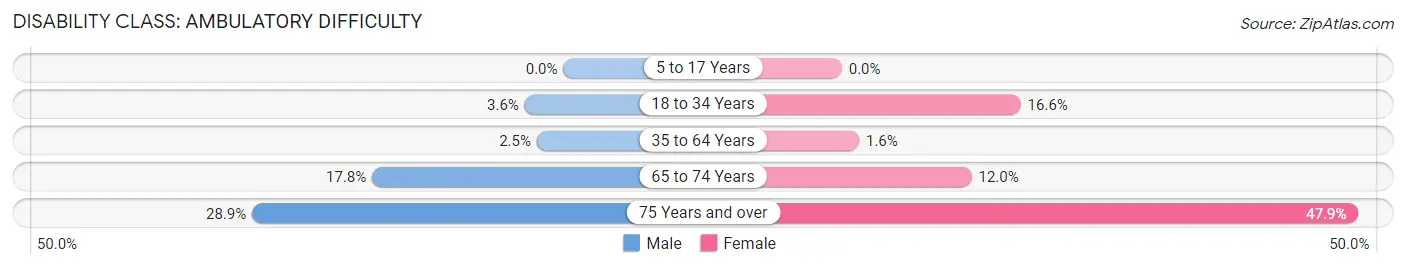
| Age Bracket | Male | Female |
| 5 to 17 Years | 0 (0.0%) | 0 (0.0%) |
| 18 to 34 Years | 33 (3.6%) | 156 (16.6%) |
| 35 to 64 Years | 33 (2.5%) | 24 (1.6%) |
| 65 to 74 Years | 112 (17.7%) | 69 (12.0%) |
| 75 Years and over | 78 (28.9%) | 221 (47.9%) |
Disability Class: Self-Care Difficulty
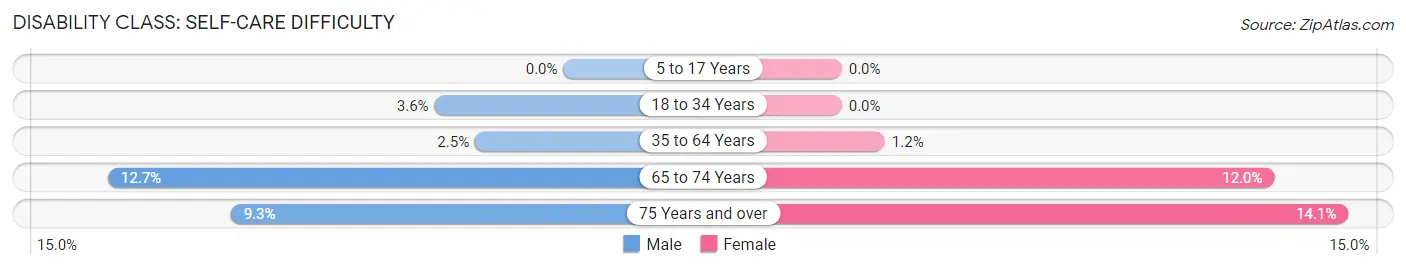
| Age Bracket | Male | Female |
| 5 to 17 Years | 0 (0.0%) | 0 (0.0%) |
| 18 to 34 Years | 33 (3.6%) | 0 (0.0%) |
| 35 to 64 Years | 33 (2.5%) | 18 (1.2%) |
| 65 to 74 Years | 80 (12.7%) | 69 (12.0%) |
| 75 Years and over | 25 (9.3%) | 65 (14.1%) |
Technology Access in Cortez
Computing Device Access in Cortez
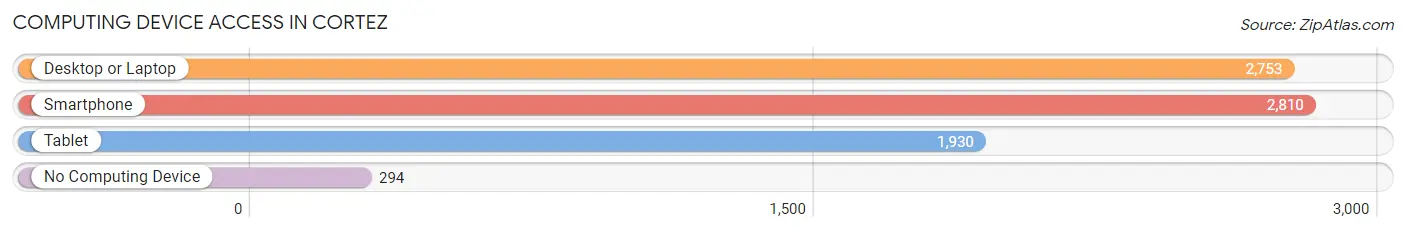
| Device Type | # Households | % Households |
| Desktop or Laptop | 2,753 | 78.0% |
| Smartphone | 2,810 | 79.6% |
| Tablet | 1,930 | 54.7% |
| No Computing Device | 294 | 8.3% |
| Total | 3,528 | 100.0% |
Internet Access in Cortez
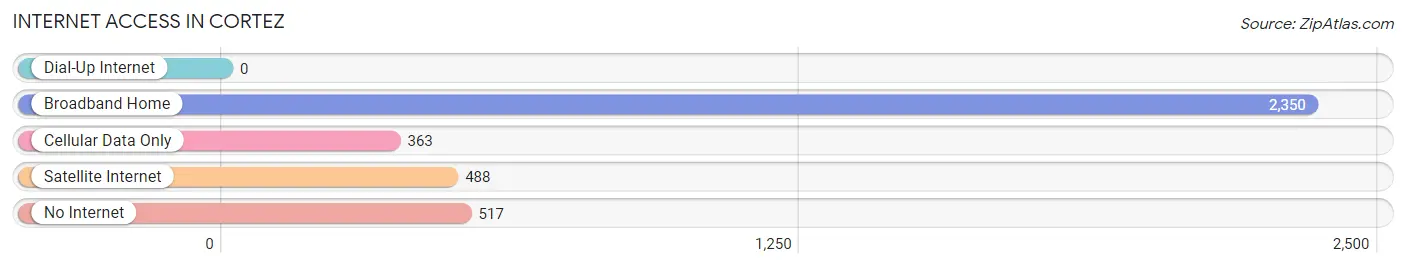
| Internet Type | # Households | % Households |
| Dial-Up Internet | 0 | 0.0% |
| Broadband Home | 2,350 | 66.6% |
| Cellular Data Only | 363 | 10.3% |
| Satellite Internet | 488 | 13.8% |
| No Internet | 517 | 14.6% |
| Total | 3,528 | 100.0% |
Cortez Summary
Cortez is a city located in Montezuma County, Colorado, United States. The city is situated in the Four Corners region of the state, near the borders of Arizona, New Mexico, and Utah. As of the 2010 census, the population of Cortez was 8,482.
History
The area around Cortez was first inhabited by the Ancestral Puebloans, who built the nearby cliff dwellings of Mesa Verde. The first Europeans to explore the area were Spanish explorers in the late 16th century. The first permanent settlement in the area was established in 1876, when the town of Cortez was founded. The town was named after Spanish explorer Hernán Cortés, who conquered the Aztec Empire in 1521.
In the late 19th century, the area around Cortez was a popular destination for prospectors and miners. The town grew rapidly, and by the early 20th century, it had become a major trading center for the region.
Geography
Cortez is located in southwestern Colorado, in the Four Corners region of the state. The city is situated at an elevation of 6,000 feet (1,829 m) above sea level.
The city is located in the Montezuma Valley, which is surrounded by the San Juan Mountains to the east and the La Plata Mountains to the west. The Dolores River flows through the valley, and the city is located near the confluence of the Dolores and San Juan rivers.
Cortez is located approximately 100 miles (161 km) southwest of Grand Junction, Colorado, and approximately 200 miles (322 km) southwest of Denver.
Economy
The economy of Cortez is largely based on agriculture and tourism. The city is home to several large farms, which produce a variety of crops, including corn, wheat, hay, and alfalfa.
Tourism is also an important part of the local economy. The nearby Mesa Verde National Park is a popular destination for visitors, and the city is also home to several museums and other attractions.
Demographics
As of the 2010 census, the population of Cortez was 8,482. The racial makeup of the city was 79.2% White, 0.7% African American, 1.3% Native American, 0.7% Asian, 0.1% Pacific Islander, 15.2% from other races, and 2.9% from two or more races. Hispanic or Latino of any race were 37.2% of the population.
The median household income in Cortez was $37,917, and the median family income was $45,938. The per capita income for the city was $20,845. About 16.2% of families and 20.2% of the population were below the poverty line, including 28.2% of those under age 18 and 10.2% of those age 65 or over.
Conclusion
Cortez is a city located in Montezuma County, Colorado, in the Four Corners region of the state. The city was founded in 1876 and has a population of 8,482 as of the 2010 census. The economy of Cortez is largely based on agriculture and tourism, and the city is home to several large farms and attractions. The racial makeup of the city is 79.2% White, 0.7% African American, 1.3% Native American, 0.7% Asian, 0.1% Pacific Islander, 15.2% from other races, and 2.9% from two or more races. Hispanic or Latino of any race were 37.2% of the population. The median household income in Cortez was $37,917, and the median family income was $45,938. About 16.2% of families and 20.2% of the population were below the poverty line.
Common Questions
What is Per Capita Income in Cortez?
Per Capita income in Cortez is $27,632.
What is the Median Family Income in Cortez?
Median Family Income in Cortez is $67,857.
What is the Median Household income in Cortez?
Median Household Income in Cortez is $55,962.
What is Income or Wage Gap in Cortez?
Income or Wage Gap in Cortez is 28.1%.
Women in Cortez earn 71.9 cents for every dollar earned by a man.
What is Inequality or Gini Index in Cortez?
Inequality or Gini Index in Cortez is 0.42.
What is the Total Population of Cortez?
Total Population of Cortez is 8,832.
What is the Total Male Population of Cortez?
Total Male Population of Cortez is 4,153.
What is the Total Female Population of Cortez?
Total Female Population of Cortez is 4,679.
What is the Ratio of Males per 100 Females in Cortez?
There are 88.76 Males per 100 Females in Cortez.
What is the Ratio of Females per 100 Males in Cortez?
There are 112.67 Females per 100 Males in Cortez.
What is the Median Population Age in Cortez?
Median Population Age in Cortez is 37.9 Years.
What is the Average Family Size in Cortez
Average Family Size in Cortez is 3.0 People.
What is the Average Household Size in Cortez
Average Household Size in Cortez is 2.5 People.
How Large is the Labor Force in Cortez?
There are 3,820 People in the Labor Forcein in Cortez.
What is the Percentage of People in the Labor Force in Cortez?
55.3% of People are in the Labor Force in Cortez.
What is the Unemployment Rate in Cortez?
Unemployment Rate in Cortez is 7.0%.