Yuma, CO Map & Demographics
Yuma Map
Yuma Overview
$22,434
PER CAPITA INCOME
$37,408
AVG FAMILY INCOME
$46,314
AVG HOUSEHOLD INCOME
27.3%
WAGE / INCOME GAP [ % ]
72.7¢/ $1
WAGE / INCOME GAP [ $ ]
0.43
INEQUALITY / GINI INDEX
3,443
TOTAL POPULATION
1,761
MALE POPULATION
1,682
FEMALE POPULATION
104.70
MALES / 100 FEMALES
95.51
FEMALES / 100 MALES
31.9
MEDIAN AGE
2.7
AVG FAMILY SIZE
2.6
AVG HOUSEHOLD SIZE
1,789
LABOR FORCE [ PEOPLE ]
73.7%
PERCENT IN LABOR FORCE
9.3%
UNEMPLOYMENT RATE
Yuma Zip Codes
Yuma Area Codes
Income in Yuma
Income Overview in Yuma
Per Capita Income in Yuma is $22,434, while median incomes of families and households are $37,408 and $46,314 respectively.
| Characteristic | Number | Measure |
| Per Capita Income | 3,443 | $22,434 |
| Median Family Income | 971 | $37,408 |
| Mean Family Income | 971 | $65,009 |
| Median Household Income | 1,286 | $46,314 |
| Mean Household Income | 1,286 | $61,893 |
| Income Deficit | 971 | $0 |
| Wage / Income Gap (%) | 3,443 | 27.31% |
| Wage / Income Gap ($) | 3,443 | 72.69¢ per $1 |
| Gini / Inequality Index | 3,443 | 0.43 |
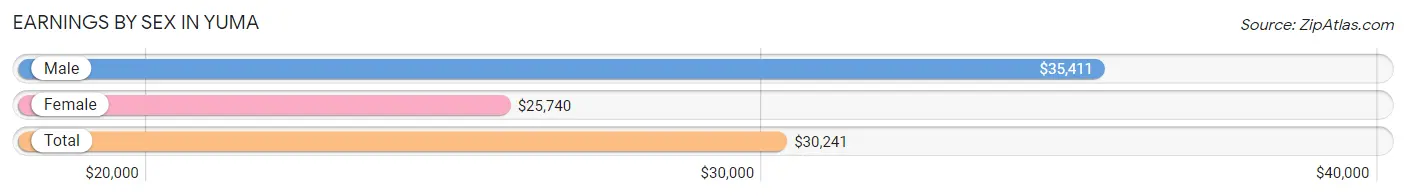
Earnings by Sex in Yuma
Average Earnings in Yuma are $30,241, $35,411 for men and $25,740 for women, a difference of 27.3%.
| Sex | Number | Average Earnings |
| Male | 966 (50.8%) | $35,411 |
| Female | 935 (49.2%) | $25,740 |
| Total | 1,901 (100.0%) | $30,241 |
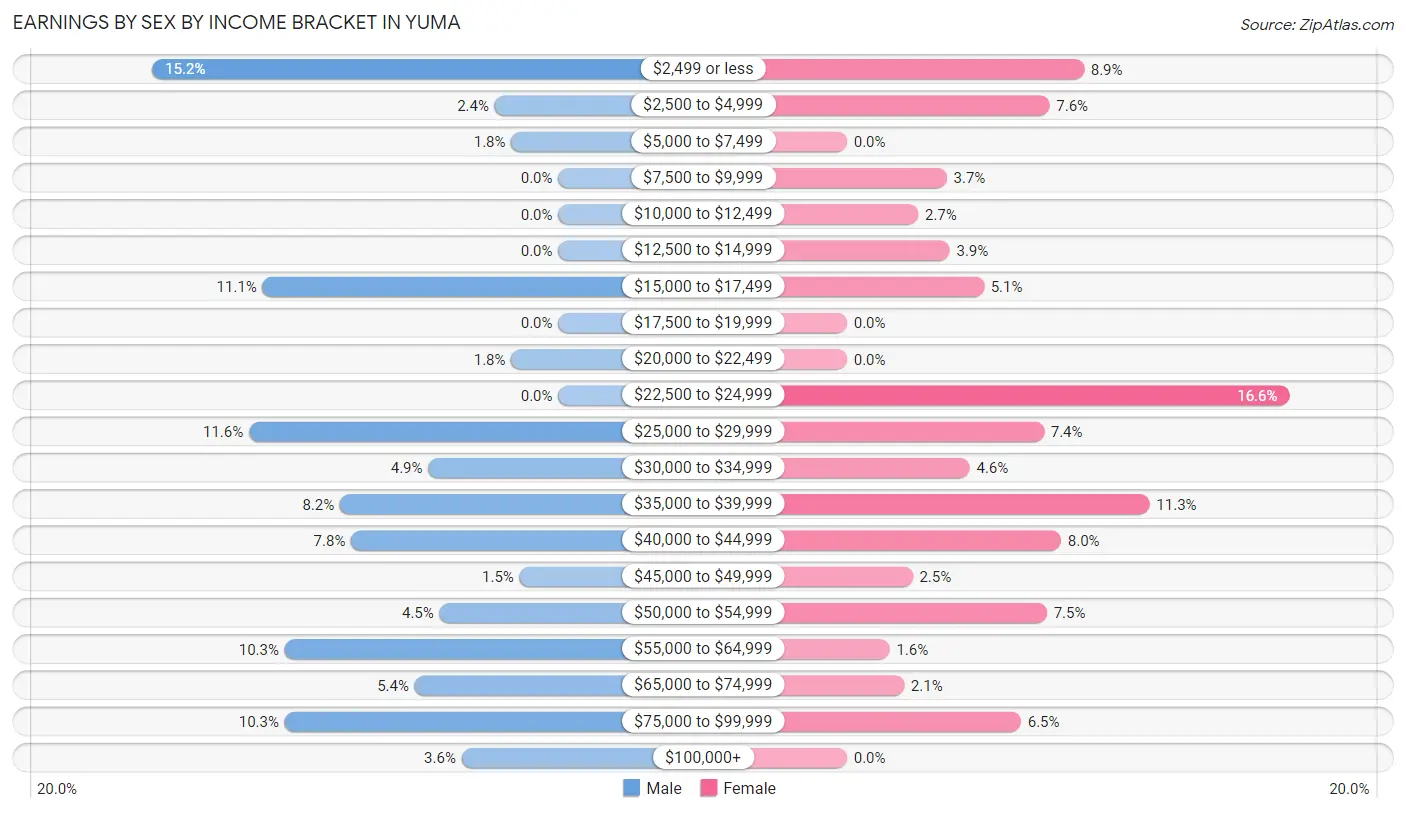
Earnings by Sex by Income Bracket in Yuma
The most common earnings brackets in Yuma are $2,499 or less for men (147 | 15.2%) and $22,500 to $24,999 for women (155 | 16.6%).
| Income | Male | Female |
| $2,499 or less | 147 (15.2%) | 83 (8.9%) |
| $2,500 to $4,999 | 23 (2.4%) | 71 (7.6%) |
| $5,000 to $7,499 | 17 (1.8%) | 0 (0.0%) |
| $7,500 to $9,999 | 0 (0.0%) | 35 (3.7%) |
| $10,000 to $12,499 | 0 (0.0%) | 25 (2.7%) |
| $12,500 to $14,999 | 0 (0.0%) | 36 (3.8%) |
| $15,000 to $17,499 | 107 (11.1%) | 48 (5.1%) |
| $17,500 to $19,999 | 0 (0.0%) | 0 (0.0%) |
| $20,000 to $22,499 | 17 (1.8%) | 0 (0.0%) |
| $22,500 to $24,999 | 0 (0.0%) | 155 (16.6%) |
| $25,000 to $29,999 | 112 (11.6%) | 69 (7.4%) |
| $30,000 to $34,999 | 47 (4.9%) | 43 (4.6%) |
| $35,000 to $39,999 | 79 (8.2%) | 106 (11.3%) |
| $40,000 to $44,999 | 75 (7.8%) | 75 (8.0%) |
| $45,000 to $49,999 | 14 (1.5%) | 23 (2.5%) |
| $50,000 to $54,999 | 43 (4.4%) | 70 (7.5%) |
| $55,000 to $64,999 | 99 (10.2%) | 15 (1.6%) |
| $65,000 to $74,999 | 52 (5.4%) | 20 (2.1%) |
| $75,000 to $99,999 | 99 (10.2%) | 61 (6.5%) |
| $100,000+ | 35 (3.6%) | 0 (0.0%) |
| Total | 966 (100.0%) | 935 (100.0%) |
Earnings by Sex by Educational Attainment in Yuma
Average earnings in Yuma are $35,839 for men and $30,341 for women, a difference of 15.3%. Men with an educational attainment of college or associate's degree enjoy the highest average annual earnings of $55,238, while those with high school diploma education earn the least with $37,152. Women with an educational attainment of graduate degree earn the most with the average annual earnings of $51,330, while those with less than high school education have the smallest earnings of $15,605.
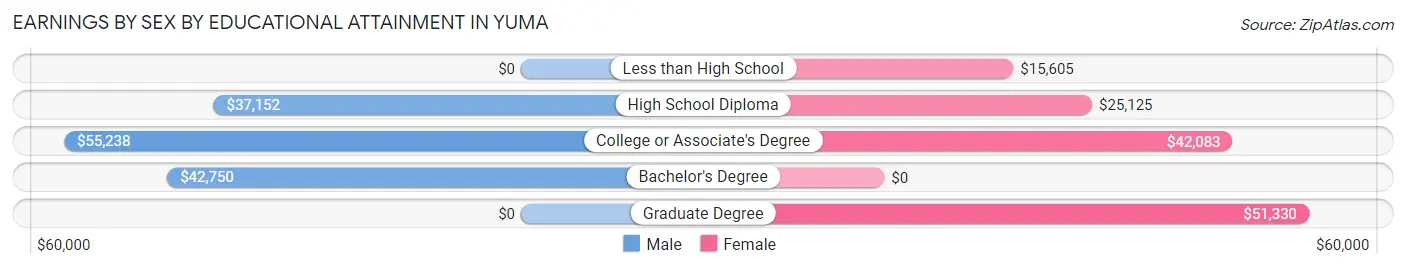
| Educational Attainment | Male Income | Female Income |
| Less than High School | - | - |
| High School Diploma | $37,152 | $25,125 |
| College or Associate's Degree | $55,238 | $42,083 |
| Bachelor's Degree | $42,750 | $0 |
| Graduate Degree | - | - |
| Total | $35,839 | $30,341 |
Family Income in Yuma
Family Income Brackets in Yuma
According to the Yuma family income data, there are 203 families falling into the $100,000 to $149,999 income range, which is the most common income bracket and makes up 20.9% of all families.
| Income Bracket | # Families | % Families |
| Less than $10,000 | 45 | 4.6% |
| $10,000 to $14,999 | 29 | 3.0% |
| $15,000 to $24,999 | 115 | 11.8% |
| $25,000 to $34,999 | 179 | 18.4% |
| $35,000 to $49,999 | 172 | 17.7% |
| $50,000 to $74,999 | 112 | 11.5% |
| $75,000 to $99,999 | 61 | 6.3% |
| $100,000 to $149,999 | 203 | 20.9% |
| $150,000 to $199,999 | 0 | 0.0% |
| $200,000+ | 55 | 5.7% |
Family Income by Famaliy Size in Yuma
4-person families (86 | 8.9%) account for the highest median family income in Yuma with $69,255 per family, while 2-person families (479 | 49.3%) have the highest median income of $27,622 per family member.
| Income Bracket | # Families | Median Income |
| 2-Person Families | 479 (49.3%) | $55,243 |
| 3-Person Families | 257 (26.5%) | $27,477 |
| 4-Person Families | 86 (8.9%) | $69,255 |
| 5-Person Families | 14 (1.4%) | $0 |
| 6-Person Families | 55 (5.7%) | $0 |
| 7+ Person Families | 80 (8.2%) | $0 |
| Total | 971 (100.0%) | $37,408 |
Family Income by Number of Earners in Yuma
| Number of Earners | # Families | Median Income |
| No Earners | 36 (3.7%) | $0 |
| 1 Earner | 380 (39.1%) | $33,448 |
| 2 Earners | 476 (49.0%) | $88,704 |
| 3+ Earners | 79 (8.1%) | $0 |
| Total | 971 (100.0%) | $37,408 |
Household Income in Yuma
Household Income Brackets in Yuma
With 264 households falling in the category, the $100,000 to $149,999 income range is the most frequent in Yuma, accounting for 20.5% of all households.
| Income Bracket | # Households | % Households |
| Less than $10,000 | 81 | 6.3% |
| $10,000 to $14,999 | 84 | 6.5% |
| $15,000 to $24,999 | 144 | 11.2% |
| $25,000 to $34,999 | 140 | 10.9% |
| $35,000 to $49,999 | 251 | 19.5% |
| $50,000 to $74,999 | 206 | 16.0% |
| $75,000 to $99,999 | 60 | 4.7% |
| $100,000 to $149,999 | 264 | 20.5% |
| $150,000 to $199,999 | 0 | 0.0% |
| $200,000+ | 55 | 4.3% |
Household Income by Householder Age in Yuma
The median household income in Yuma is $46,314, with the highest median household income of $54,288 found in the 25 to 44 years age bracket for the primary householder. A total of 359 households (27.9%) fall into this category. Meanwhile, the 15 to 24 years age bracket for the primary householder has the lowest median household income of $0, with 86 households (6.7%) in this group.
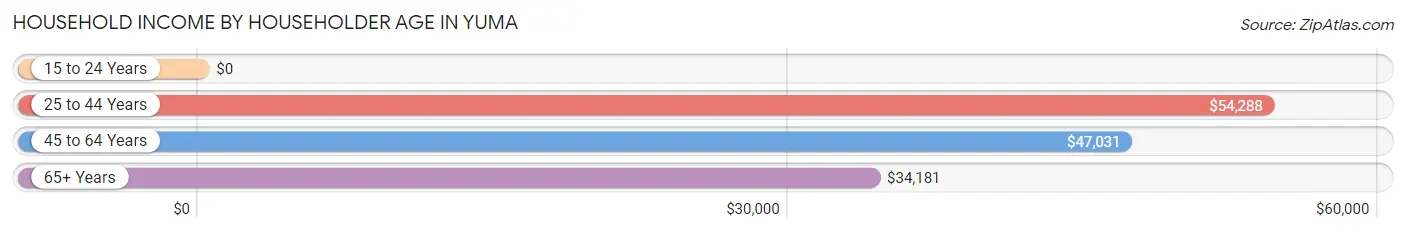
| Income Bracket | # Households | Median Income |
| 15 to 24 Years | 86 (6.7%) | $0 |
| 25 to 44 Years | 359 (27.9%) | $54,288 |
| 45 to 64 Years | 530 (41.2%) | $47,031 |
| 65+ Years | 311 (24.2%) | $34,181 |
| Total | 1,286 (100.0%) | $46,314 |
Poverty in Yuma
Income Below Poverty by Sex and Age in Yuma
With 25.2% poverty level for males and 19.1% for females among the residents of Yuma, 15 year old males and 6 to 11 year old females are the most vulnerable to poverty, with 59 males (100.0%) and 91 females (45.7%) in their respective age groups living below the poverty level.
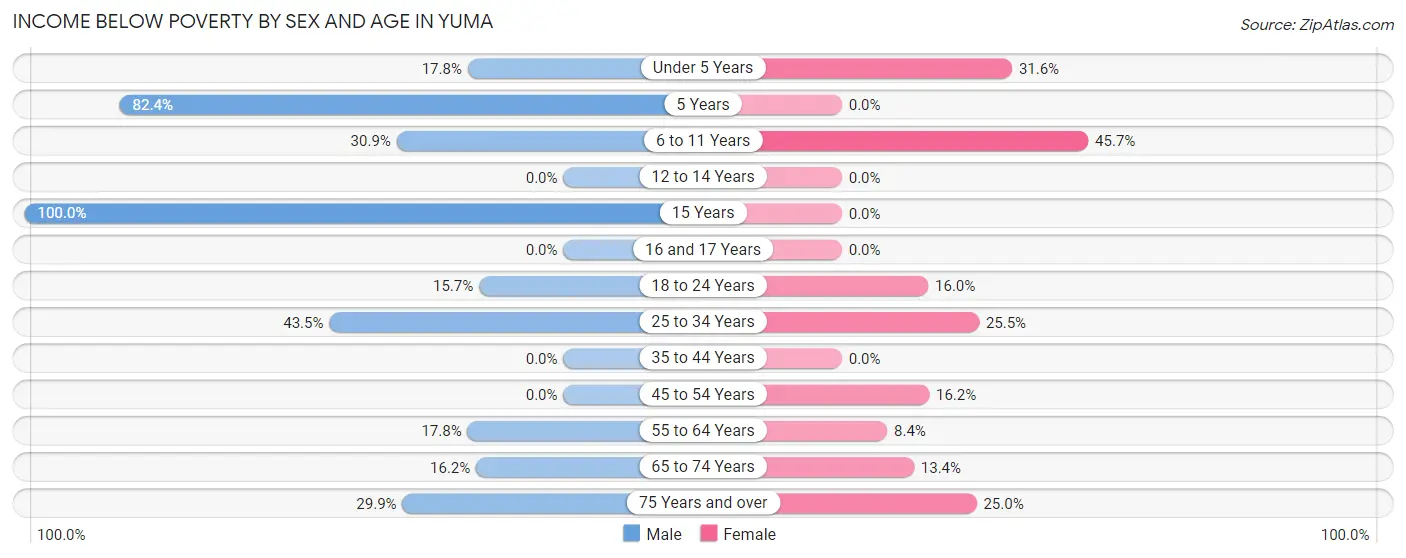
| Age Bracket | Male | Female |
| Under 5 Years | 30 (17.7%) | 30 (31.6%) |
| 5 Years | 56 (82.4%) | 0 (0.0%) |
| 6 to 11 Years | 56 (30.9%) | 91 (45.7%) |
| 12 to 14 Years | 0 (0.0%) | 0 (0.0%) |
| 15 Years | 59 (100.0%) | 0 (0.0%) |
| 16 and 17 Years | 0 (0.0%) | 0 (0.0%) |
| 18 to 24 Years | 23 (15.7%) | 29 (16.0%) |
| 25 to 34 Years | 116 (43.4%) | 55 (25.5%) |
| 35 to 44 Years | 0 (0.0%) | 0 (0.0%) |
| 45 to 54 Years | 0 (0.0%) | 45 (16.2%) |
| 55 to 64 Years | 29 (17.8%) | 19 (8.4%) |
| 65 to 74 Years | 17 (16.2%) | 19 (13.4%) |
| 75 Years and over | 23 (29.9%) | 32 (25.0%) |
| Total | 409 (25.2%) | 320 (19.1%) |
Income Above Poverty by Sex and Age in Yuma
According to the poverty statistics in Yuma, males aged 12 to 14 years and females aged 12 to 14 years are the age groups that are most secure financially, with 100.0% of males and 100.0% of females in these age groups living above the poverty line.
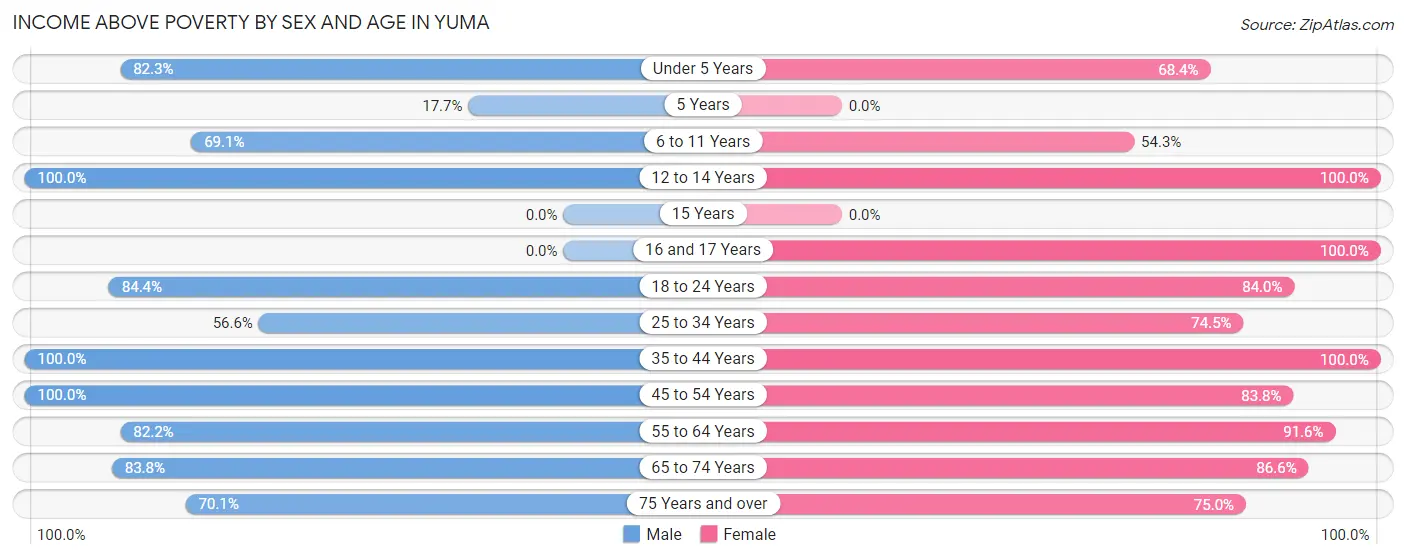
| Age Bracket | Male | Female |
| Under 5 Years | 139 (82.3%) | 65 (68.4%) |
| 5 Years | 12 (17.6%) | 0 (0.0%) |
| 6 to 11 Years | 125 (69.1%) | 108 (54.3%) |
| 12 to 14 Years | 56 (100.0%) | 112 (100.0%) |
| 15 Years | 0 (0.0%) | 0 (0.0%) |
| 16 and 17 Years | 0 (0.0%) | 14 (100.0%) |
| 18 to 24 Years | 124 (84.4%) | 152 (84.0%) |
| 25 to 34 Years | 151 (56.6%) | 161 (74.5%) |
| 35 to 44 Years | 136 (100.0%) | 83 (100.0%) |
| 45 to 54 Years | 198 (100.0%) | 233 (83.8%) |
| 55 to 64 Years | 134 (82.2%) | 207 (91.6%) |
| 65 to 74 Years | 88 (83.8%) | 123 (86.6%) |
| 75 Years and over | 54 (70.1%) | 96 (75.0%) |
| Total | 1,217 (74.9%) | 1,354 (80.9%) |
Income Below Poverty Among Married-Couple Families in Yuma
The poverty statistics for married-couple families in Yuma show that 15.6% or 109 of the total 700 families live below the poverty line. Families with 5 or more children have the highest poverty rate of 100.0%, comprising of 80 families. On the other hand, families with 1 or 2 children have the lowest poverty rate of 0.0%, which includes 0 families.
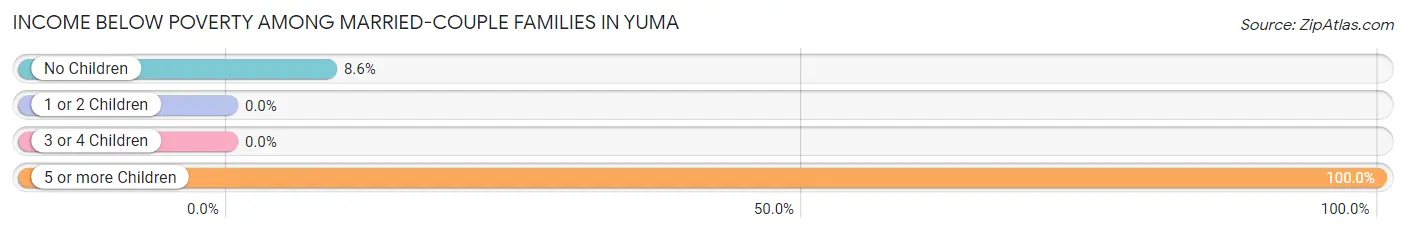
| Children | Above Poverty | Below Poverty |
| No Children | 308 (91.4%) | 29 (8.6%) |
| 1 or 2 Children | 248 (100.0%) | 0 (0.0%) |
| 3 or 4 Children | 35 (100.0%) | 0 (0.0%) |
| 5 or more Children | 0 (0.0%) | 80 (100.0%) |
| Total | 591 (84.4%) | 109 (15.6%) |
Income Below Poverty Among Single-Parent Households in Yuma
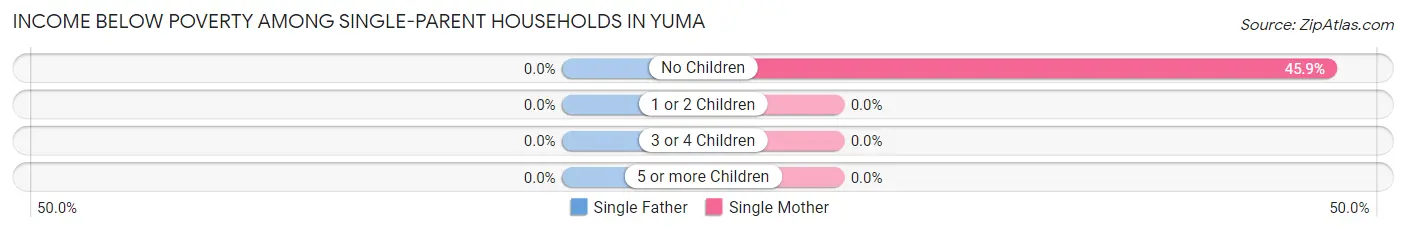
| Children | Single Father | Single Mother |
| No Children | 0 (0.0%) | 45 (45.9%) |
| 1 or 2 Children | 0 (0.0%) | 0 (0.0%) |
| 3 or 4 Children | 0 (0.0%) | 0 (0.0%) |
| 5 or more Children | 0 (0.0%) | 0 (0.0%) |
| Total | 0 (0.0%) | 45 (23.4%) |
Income Below Poverty Among Married-Couple vs Single-Parent Households in Yuma
The poverty data for Yuma shows that 109 of the married-couple family households (15.6%) and 45 of the single-parent households (16.6%) are living below the poverty level. Within the married-couple family households, those with 5 or more children have the highest poverty rate, with 80 households (100.0%) falling below the poverty line. Among the single-parent households, those with no children have the highest poverty rate, with 45 household (45.9%) living below poverty.
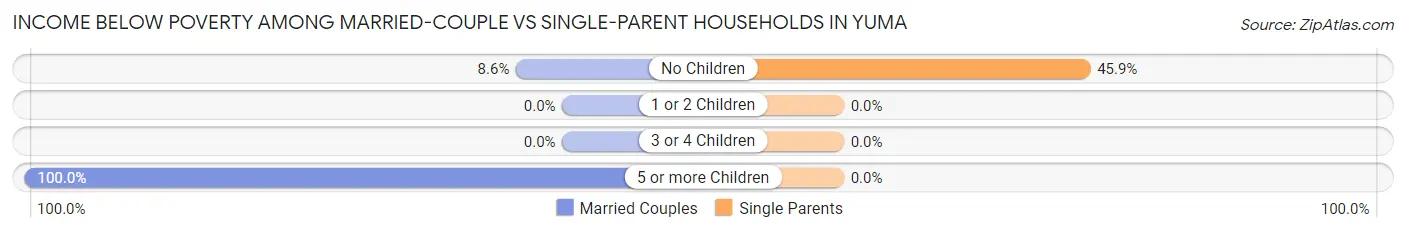
| Children | Married-Couple Families | Single-Parent Households |
| No Children | 29 (8.6%) | 45 (45.9%) |
| 1 or 2 Children | 0 (0.0%) | 0 (0.0%) |
| 3 or 4 Children | 0 (0.0%) | 0 (0.0%) |
| 5 or more Children | 80 (100.0%) | 0 (0.0%) |
| Total | 109 (15.6%) | 45 (16.6%) |
Race in Yuma
The most populous races in Yuma are White / Caucasian (2,656 | 77.1%), Hispanic or Latino (1,480 | 43.0%), and Two or more Races (660 | 19.2%).
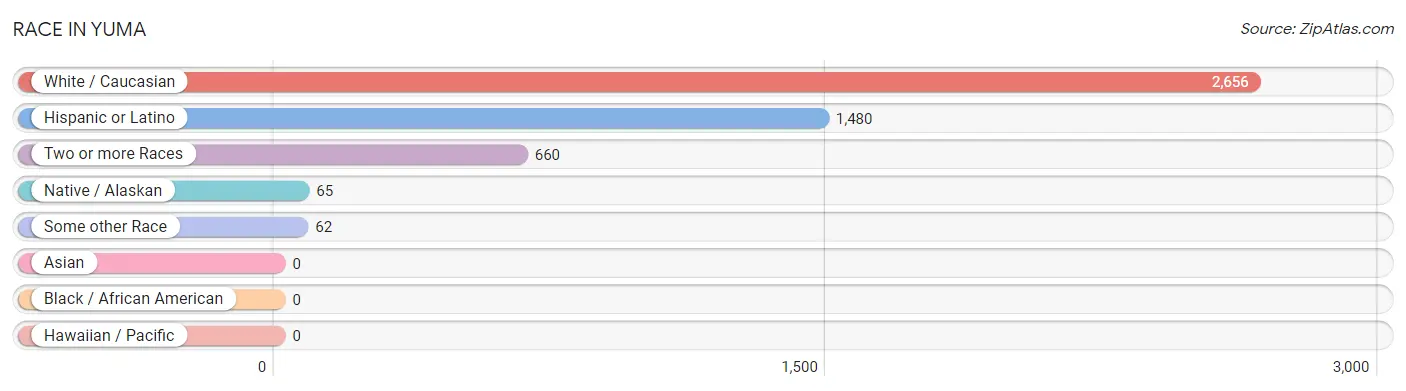
| Race | # Population | % Population |
| Asian | 0 | 0.0% |
| Black / African American | 0 | 0.0% |
| Hawaiian / Pacific | 0 | 0.0% |
| Hispanic or Latino | 1,480 | 43.0% |
| Native / Alaskan | 65 | 1.9% |
| White / Caucasian | 2,656 | 77.1% |
| Two or more Races | 660 | 19.2% |
| Some other Race | 62 | 1.8% |
| Total | 3,443 | 100.0% |
Ancestry in Yuma
The most populous ancestries reported in Yuma are Mexican (1,352 | 39.3%), German (614 | 17.8%), Irish (414 | 12.0%), European (219 | 6.4%), and English (155 | 4.5%), together accounting for 80.0% of all Yuma residents.
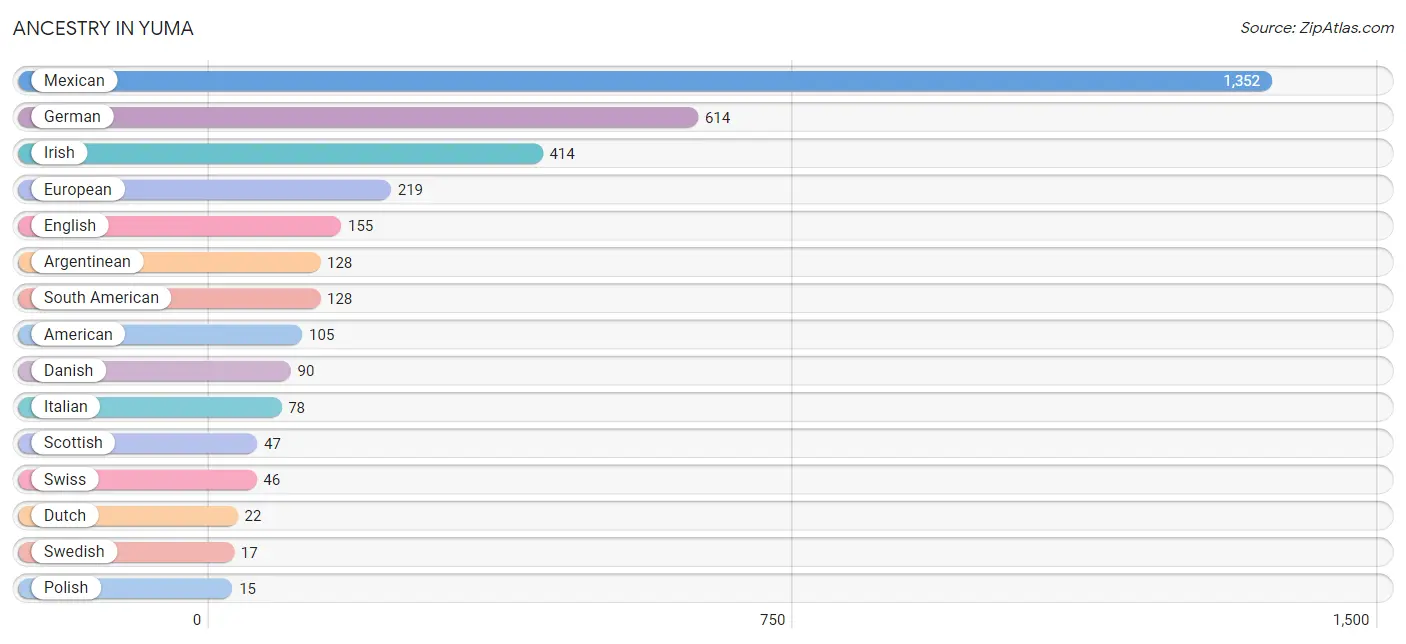
| Ancestry | # Population | % Population |
| American | 105 | 3.0% |
| Argentinean | 128 | 3.7% |
| Austrian | 12 | 0.4% |
| Danish | 90 | 2.6% |
| Dutch | 22 | 0.6% |
| English | 155 | 4.5% |
| European | 219 | 6.4% |
| German | 614 | 17.8% |
| Irish | 414 | 12.0% |
| Italian | 78 | 2.3% |
| Latvian | 14 | 0.4% |
| Mexican | 1,352 | 39.3% |
| Polish | 15 | 0.4% |
| Scandinavian | 14 | 0.4% |
| Scottish | 47 | 1.4% |
| South American | 128 | 3.7% |
| Swedish | 17 | 0.5% |
| Swiss | 46 | 1.3% | View All 18 Rows |
Immigrants in Yuma
The most numerous immigrant groups reported in Yuma came from Latin America (819 | 23.8%), Central America (691 | 20.1%), Mexico (691 | 20.1%), Argentina (128 | 3.7%), and South America (128 | 3.7%), together accounting for 71.4% of all Yuma residents.
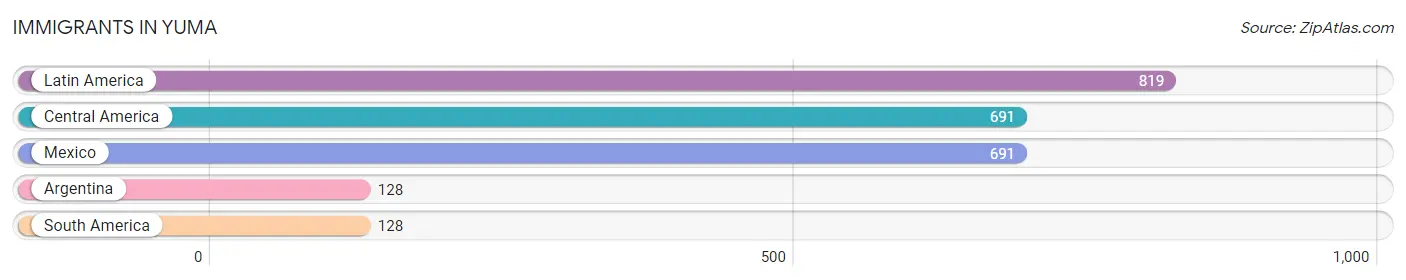
| Immigration Origin | # Population | % Population |
| Argentina | 128 | 3.7% |
| Central America | 691 | 20.1% |
| Latin America | 819 | 23.8% |
| Mexico | 691 | 20.1% |
| South America | 128 | 3.7% | View All 5 Rows |
Sex and Age in Yuma
Sex and Age in Yuma
The most populous age groups in Yuma are 5 to 9 Years (203 | 11.5%) for men and 10 to 14 Years (227 | 13.5%) for women.
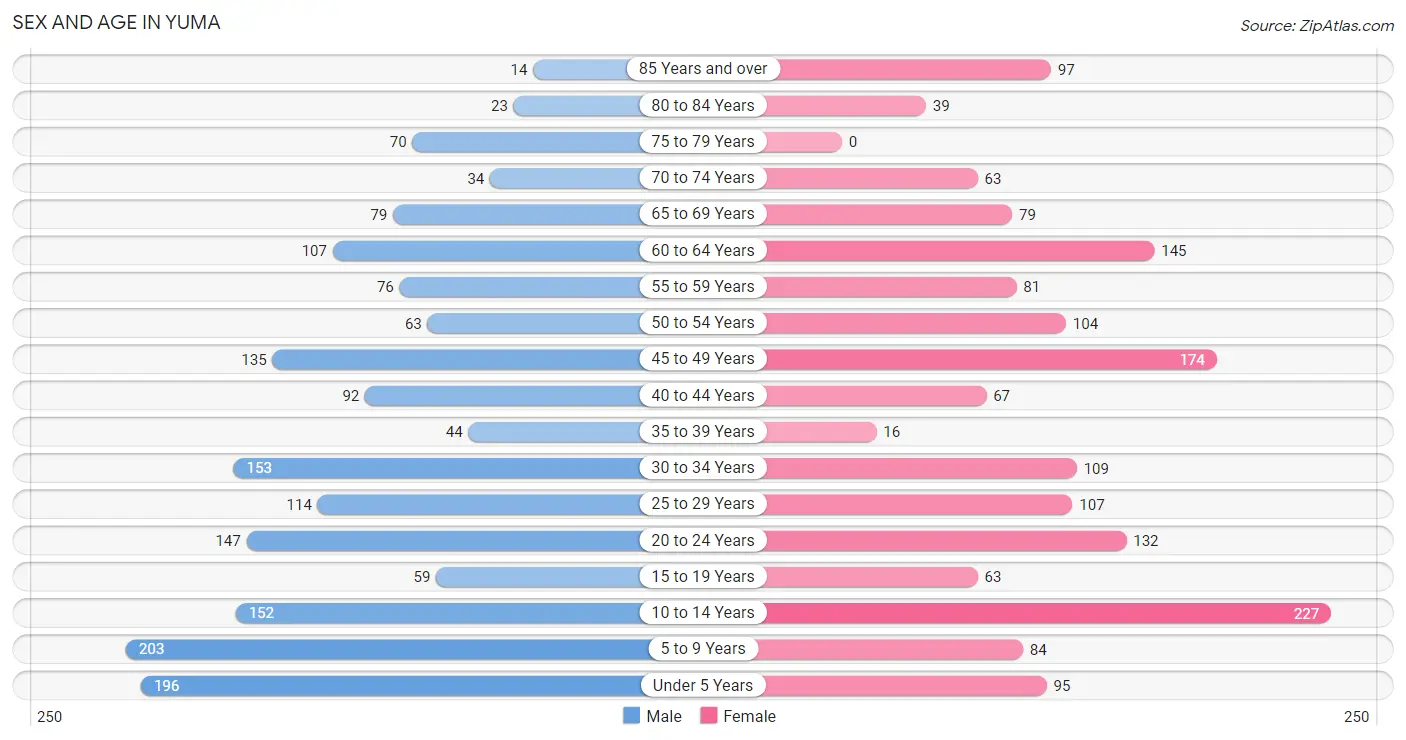
| Age Bracket | Male | Female |
| Under 5 Years | 196 (11.1%) | 95 (5.7%) |
| 5 to 9 Years | 203 (11.5%) | 84 (5.0%) |
| 10 to 14 Years | 152 (8.6%) | 227 (13.5%) |
| 15 to 19 Years | 59 (3.4%) | 63 (3.7%) |
| 20 to 24 Years | 147 (8.4%) | 132 (7.9%) |
| 25 to 29 Years | 114 (6.5%) | 107 (6.4%) |
| 30 to 34 Years | 153 (8.7%) | 109 (6.5%) |
| 35 to 39 Years | 44 (2.5%) | 16 (0.9%) |
| 40 to 44 Years | 92 (5.2%) | 67 (4.0%) |
| 45 to 49 Years | 135 (7.7%) | 174 (10.3%) |
| 50 to 54 Years | 63 (3.6%) | 104 (6.2%) |
| 55 to 59 Years | 76 (4.3%) | 81 (4.8%) |
| 60 to 64 Years | 107 (6.1%) | 145 (8.6%) |
| 65 to 69 Years | 79 (4.5%) | 79 (4.7%) |
| 70 to 74 Years | 34 (1.9%) | 63 (3.7%) |
| 75 to 79 Years | 70 (4.0%) | 0 (0.0%) |
| 80 to 84 Years | 23 (1.3%) | 39 (2.3%) |
| 85 Years and over | 14 (0.8%) | 97 (5.8%) |
| Total | 1,761 (100.0%) | 1,682 (100.0%) |
Families and Households in Yuma
Median Family Size in Yuma
The median family size in Yuma is 2.74 persons per family, with married-couple families (700 | 72.1%) accounting for the largest median family size of 3.15 persons per family. On the other hand, single male/father families (79 | 8.1%) represent the smallest median family size with 1.34 persons per family.
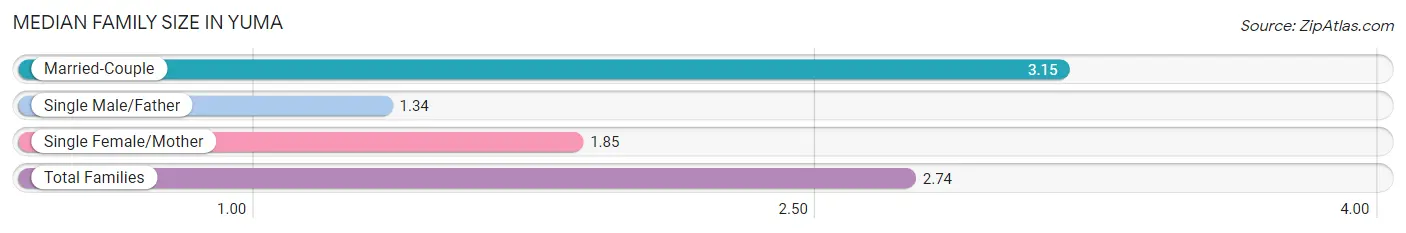
| Family Type | # Families | Family Size |
| Married-Couple | 700 (72.1%) | 3.15 |
| Single Male/Father | 79 (8.1%) | 1.34 |
| Single Female/Mother | 192 (19.8%) | 1.85 |
| Total Families | 971 (100.0%) | 2.74 |
Median Household Size in Yuma
The median household size in Yuma is 2.63 persons per household, with single female/mother households (192 | 14.9%) accounting for the largest median household size of 3.23 persons per household. non-family households (315 | 24.5%) represent the smallest median household size with 1.31 persons per household.
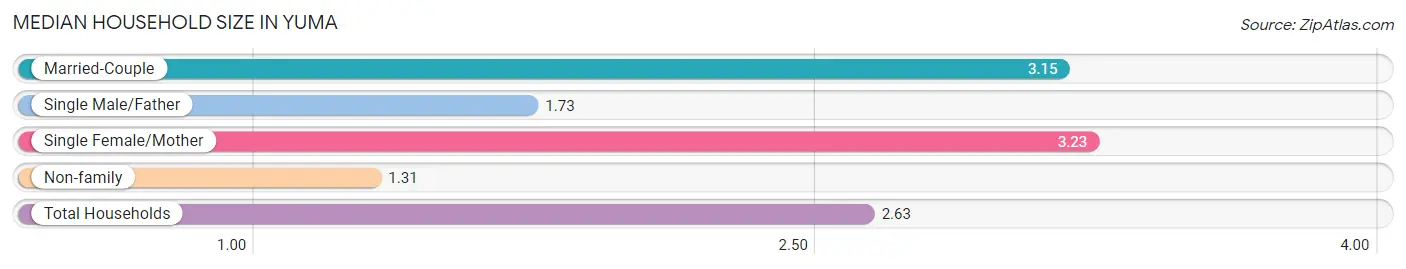
| Household Type | # Households | Household Size |
| Married-Couple | 700 (54.4%) | 3.15 |
| Single Male/Father | 79 (6.1%) | 1.73 |
| Single Female/Mother | 192 (14.9%) | 3.23 |
| Non-family | 315 (24.5%) | 1.31 |
| Total Households | 1,286 (100.0%) | 2.63 |
Household Size by Marriage Status in Yuma
Out of a total of 1,286 households in Yuma, 971 (75.5%) are family households, while 315 (24.5%) are nonfamily households. The most numerous type of family households are 2-person households, comprising 376, and the most common type of nonfamily households are 1-person households, comprising 247.
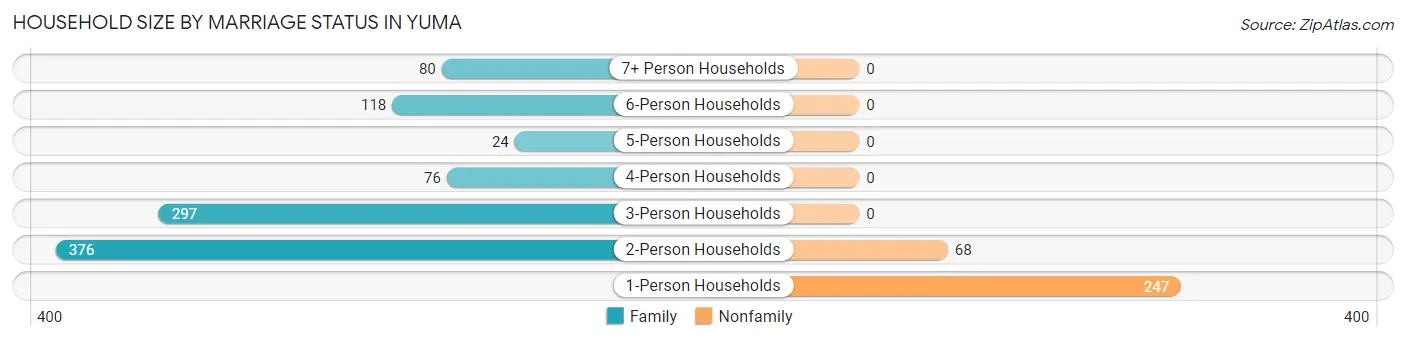
| Household Size | Family Households | Nonfamily Households |
| 1-Person Households | - | 247 (19.2%) |
| 2-Person Households | 376 (29.2%) | 68 (5.3%) |
| 3-Person Households | 297 (23.1%) | 0 (0.0%) |
| 4-Person Households | 76 (5.9%) | 0 (0.0%) |
| 5-Person Households | 24 (1.9%) | 0 (0.0%) |
| 6-Person Households | 118 (9.2%) | 0 (0.0%) |
| 7+ Person Households | 80 (6.2%) | 0 (0.0%) |
| Total | 971 (75.5%) | 315 (24.5%) |
Female Fertility in Yuma
Fertility by Age in Yuma
| Age Bracket | Women with Births | Births / 1,000 Women |
| 15 to 19 years | 0 (0.0%) | 0.0 |
| 20 to 34 years | 0 (0.0%) | 0.0 |
| 35 to 50 years | 0 (0.0%) | 0.0 |
| Total | 0 (0.0%) | 0.0 |
Fertility by Age by Marriage Status in Yuma
| Age Bracket | Married | Unmarried |
| 15 to 19 years | 0 (0.0%) | 0 (0.0%) |
| 20 to 34 years | 0 (0.0%) | 0 (0.0%) |
| 35 to 50 years | 0 (0.0%) | 0 (0.0%) |
| Total | 0 (0.0%) | 0 (0.0%) |
Fertility by Education in Yuma
| Educational Attainment | Women with Births | Births / 1,000 Women |
| Less than High School | 0 (0.0%) | 0.0 |
| High School Diploma | 0 (0.0%) | 0.0 |
| College or Associate's Degree | 0 (0.0%) | 0.0 |
| Bachelor's Degree | 0 (0.0%) | 0.0 |
| Graduate Degree | 0 (0.0%) | 0.0 |
| Total | 0 (0.0%) | 0.0 |
Fertility by Education by Marriage Status in Yuma
| Educational Attainment | Married | Unmarried |
| Less than High School | 0 (0.0%) | 0 (0.0%) |
| High School Diploma | 0 (0.0%) | 0 (0.0%) |
| College or Associate's Degree | 0 (0.0%) | 0 (0.0%) |
| Bachelor's Degree | 0 (0.0%) | 0 (0.0%) |
| Graduate Degree | 0 (0.0%) | 0 (0.0%) |
| Total | 0 (0.0%) | 0 (0.0%) |
Employment Characteristics in Yuma
Employment by Class of Employer in Yuma
Among the 1,563 employed individuals in Yuma, private company employees (1,007 | 64.4%), local government employees (211 | 13.5%), and self-employed (incorporated) (142 | 9.1%) make up the most common classes of employment.
| Employer Class | # Employees | % Employees |
| Private Company Employees | 1,007 | 64.4% |
| Self-Employed (Incorporated) | 142 | 9.1% |
| Self-Employed (Not Incorporated) | 85 | 5.4% |
| Not-for-profit Organizations | 118 | 7.5% |
| Local Government Employees | 211 | 13.5% |
| State Government Employees | 0 | 0.0% |
| Federal Government Employees | 0 | 0.0% |
| Unpaid Family Workers | 0 | 0.0% |
| Total | 1,563 | 100.0% |
Employment Status by Age in Yuma
According to the labor force statistics for Yuma, out of the total population over 16 years of age (2,427), 73.7% or 1,789 individuals are in the labor force, with 9.3% or 166 of them unemployed. The age group with the highest labor force participation rate is 35 to 44 years, with 93.6% or 205 individuals in the labor force. Within the labor force, the 16 to 19 years age range has the highest percentage of unemployed individuals, with 48.3% or 14 of them being unemployed.
| Age Bracket | In Labor Force | Unemployed |
| 16 to 19 Years | 29 (46.0%) | 14 (48.3%) |
| 20 to 24 Years | 244 (87.5%) | 39 (16.0%) |
| 25 to 29 Years | 168 (76.0%) | 80 (47.6%) |
| 30 to 34 Years | 239 (91.2%) | 0 (0.0%) |
| 35 to 44 Years | 205 (93.6%) | 0 (0.0%) |
| 45 to 54 Years | 416 (87.4%) | 0 (0.0%) |
| 55 to 59 Years | 138 (87.9%) | 0 (0.0%) |
| 60 to 64 Years | 167 (66.3%) | 0 (0.0%) |
| 65 to 74 Years | 150 (58.8%) | 33 (22.0%) |
| 75 Years and over | 33 (13.6%) | 0 (0.0%) |
| Total | 1,789 (73.7%) | 166 (9.3%) |
Employment Status by Educational Attainment in Yuma
According to labor force statistics for Yuma, 84.0% of individuals (1,333) out of the total population between 25 and 64 years of age (1,587) are in the labor force, with 6.0% or 80 of them being unemployed. The group with the highest labor force participation rate are those with the educational attainment of high school diploma, with 91.1% or 410 individuals in the labor force. Within the labor force, individuals with less than high school education have the highest percentage of unemployment, with 25.3% or 80 of them being unemployed.
| Educational Attainment | In Labor Force | Unemployed |
| Less than High School | 316 (68.7%) | 116 (25.3%) |
| High School Diploma | 410 (91.1%) | 0 (0.0%) |
| College / Associate Degree | 417 (89.3%) | 0 (0.0%) |
| Bachelor's Degree or higher | 190 (90.5%) | 0 (0.0%) |
| Total | 1,333 (84.0%) | 95 (6.0%) |
Employment Occupations by Sex in Yuma
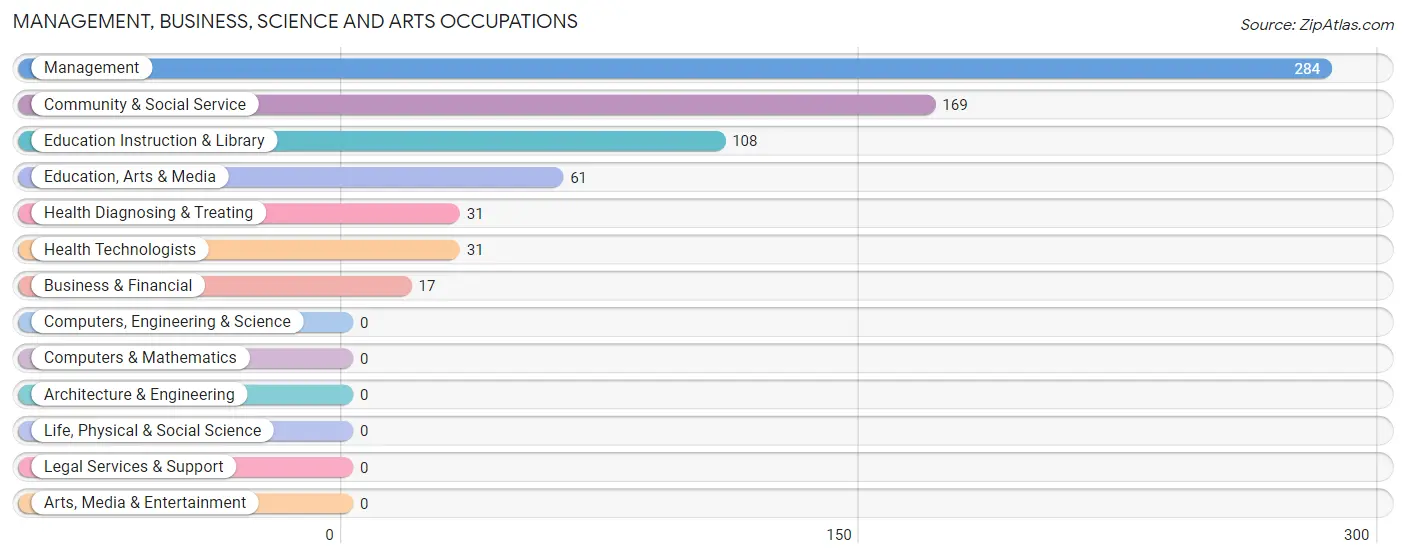
Management, Business, Science and Arts Occupations
The most common Management, Business, Science and Arts occupations in Yuma are Management (284 | 17.5%), Community & Social Service (169 | 10.4%), Education Instruction & Library (108 | 6.7%), Education, Arts & Media (61 | 3.8%), and Health Diagnosing & Treating (31 | 1.9%).
Management, Business, Science and Arts Occupations by Sex
Within the Management, Business, Science and Arts occupations in Yuma, the most male-oriented occupations are Business & Financial (100.0%), Management (57.0%), and Education, Arts & Media (24.6%), while the most female-oriented occupations are Education Instruction & Library (100.0%), Health Diagnosing & Treating (100.0%), and Health Technologists (100.0%).
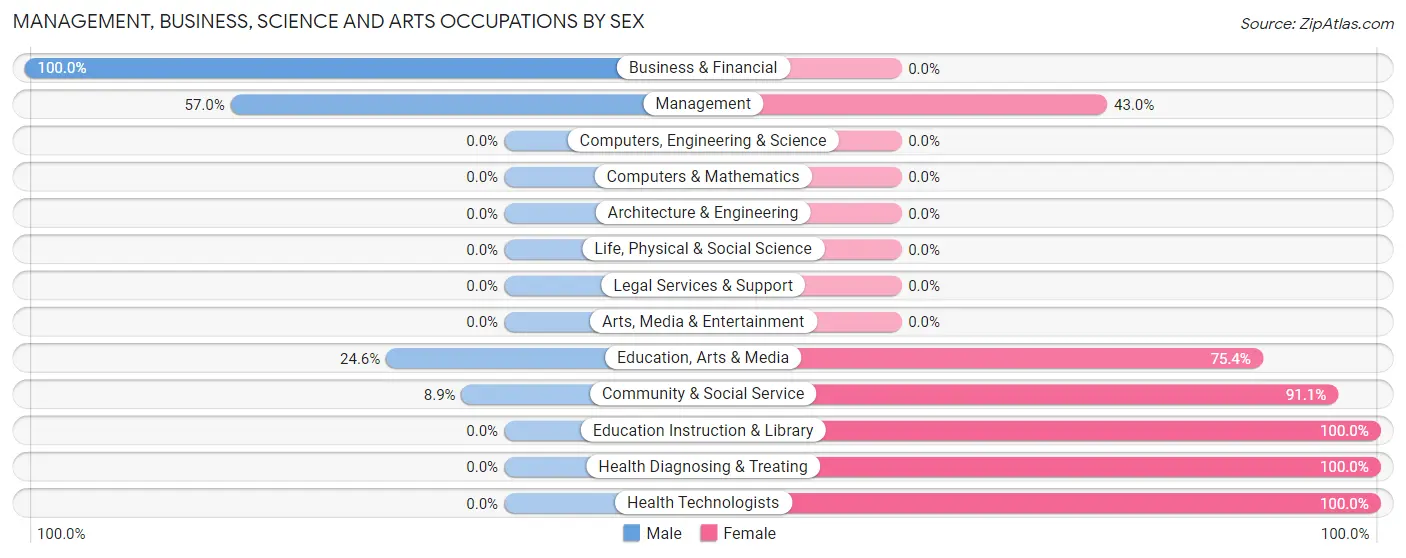
| Occupation | Male | Female |
| Management | 162 (57.0%) | 122 (43.0%) |
| Business & Financial | 17 (100.0%) | 0 (0.0%) |
| Computers, Engineering & Science | 0 (0.0%) | 0 (0.0%) |
| Computers & Mathematics | 0 (0.0%) | 0 (0.0%) |
| Architecture & Engineering | 0 (0.0%) | 0 (0.0%) |
| Life, Physical & Social Science | 0 (0.0%) | 0 (0.0%) |
| Community & Social Service | 15 (8.9%) | 154 (91.1%) |
| Education, Arts & Media | 15 (24.6%) | 46 (75.4%) |
| Legal Services & Support | 0 (0.0%) | 0 (0.0%) |
| Education Instruction & Library | 0 (0.0%) | 108 (100.0%) |
| Arts, Media & Entertainment | 0 (0.0%) | 0 (0.0%) |
| Health Diagnosing & Treating | 0 (0.0%) | 31 (100.0%) |
| Health Technologists | 0 (0.0%) | 31 (100.0%) |
| Total (Category) | 194 (38.7%) | 307 (61.3%) |
| Total (Overall) | 832 (51.3%) | 791 (48.7%) |
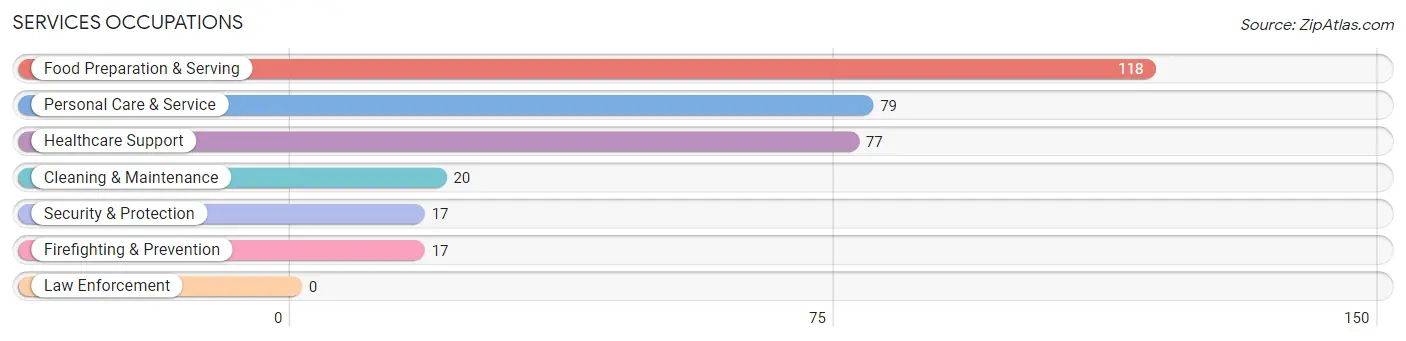
Services Occupations
The most common Services occupations in Yuma are Food Preparation & Serving (118 | 7.3%), Personal Care & Service (79 | 4.9%), Healthcare Support (77 | 4.7%), Cleaning & Maintenance (20 | 1.2%), and Security & Protection (17 | 1.1%).
Services Occupations by Sex
Within the Services occupations in Yuma, the most male-oriented occupations are Security & Protection (100.0%), Firefighting & Prevention (100.0%), and Personal Care & Service (100.0%), while the most female-oriented occupations are Cleaning & Maintenance (100.0%), Food Preparation & Serving (89.8%), and Healthcare Support (44.2%).
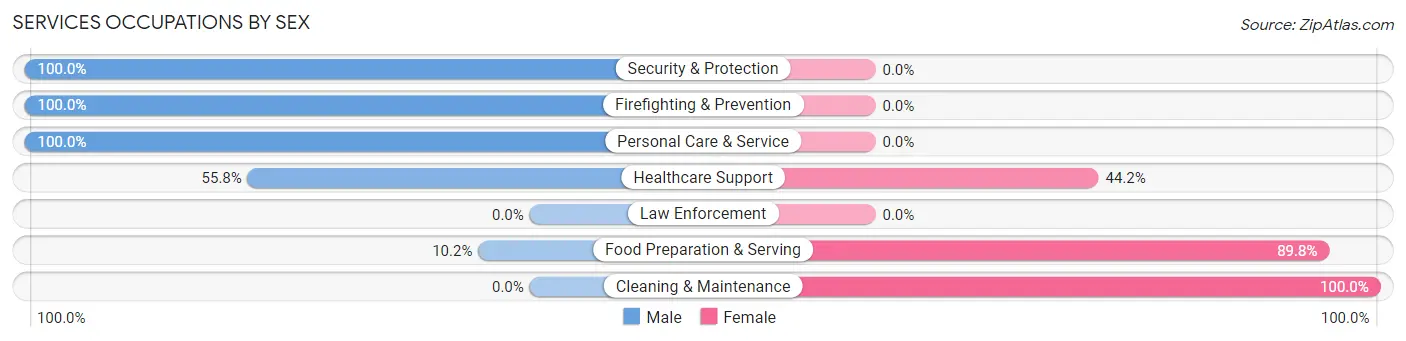
| Occupation | Male | Female |
| Healthcare Support | 43 (55.8%) | 34 (44.2%) |
| Security & Protection | 17 (100.0%) | 0 (0.0%) |
| Firefighting & Prevention | 17 (100.0%) | 0 (0.0%) |
| Law Enforcement | 0 (0.0%) | 0 (0.0%) |
| Food Preparation & Serving | 12 (10.2%) | 106 (89.8%) |
| Cleaning & Maintenance | 0 (0.0%) | 20 (100.0%) |
| Personal Care & Service | 79 (100.0%) | 0 (0.0%) |
| Total (Category) | 151 (48.5%) | 160 (51.4%) |
| Total (Overall) | 832 (51.3%) | 791 (48.7%) |
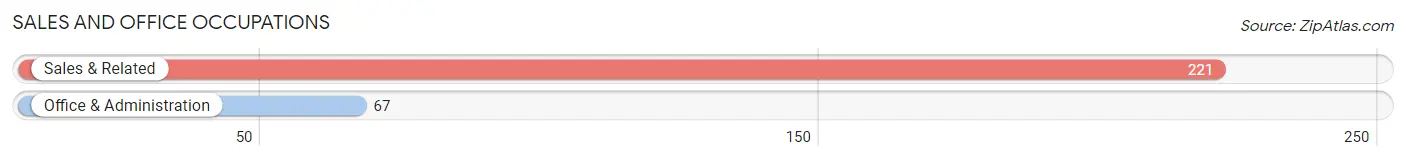
Sales and Office Occupations
The most common Sales and Office occupations in Yuma are Sales & Related (221 | 13.6%), and Office & Administration (67 | 4.1%).
Sales and Office Occupations by Sex

| Occupation | Male | Female |
| Sales & Related | 111 (50.2%) | 110 (49.8%) |
| Office & Administration | 0 (0.0%) | 67 (100.0%) |
| Total (Category) | 111 (38.5%) | 177 (61.5%) |
| Total (Overall) | 832 (51.3%) | 791 (48.7%) |
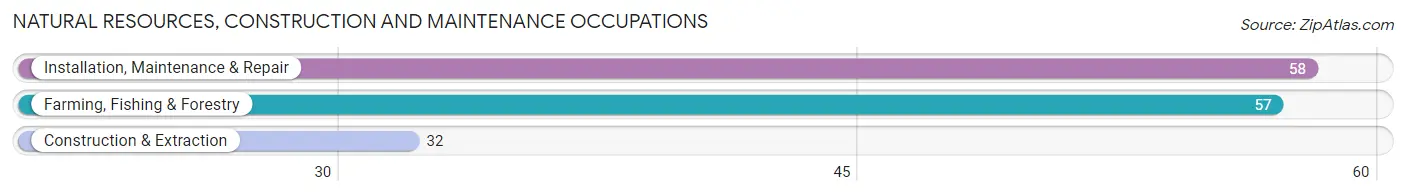
Natural Resources, Construction and Maintenance Occupations
The most common Natural Resources, Construction and Maintenance occupations in Yuma are Installation, Maintenance & Repair (58 | 3.6%), Farming, Fishing & Forestry (57 | 3.5%), and Construction & Extraction (32 | 2.0%).
Natural Resources, Construction and Maintenance Occupations by Sex
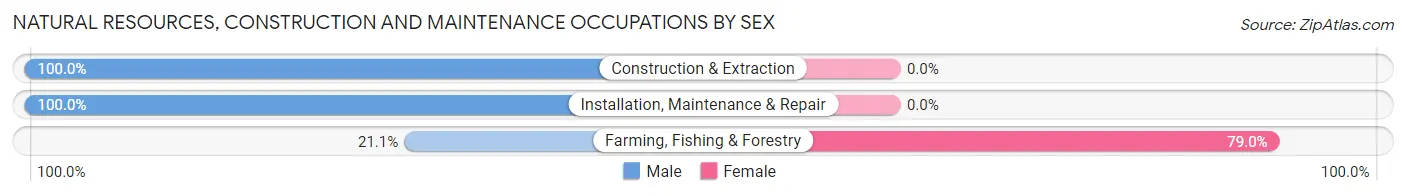
| Occupation | Male | Female |
| Farming, Fishing & Forestry | 12 (21.0%) | 45 (78.9%) |
| Construction & Extraction | 32 (100.0%) | 0 (0.0%) |
| Installation, Maintenance & Repair | 58 (100.0%) | 0 (0.0%) |
| Total (Category) | 102 (69.4%) | 45 (30.6%) |
| Total (Overall) | 832 (51.3%) | 791 (48.7%) |
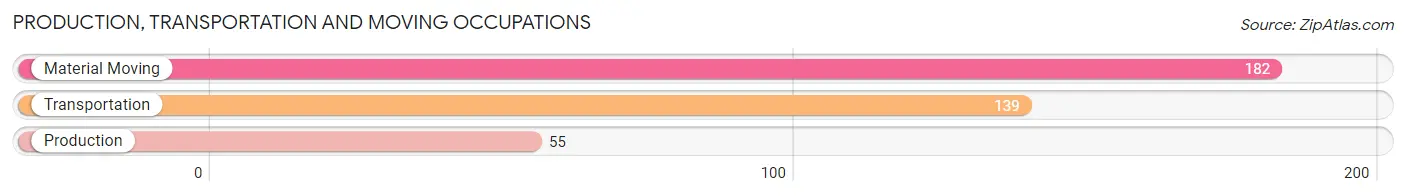
Production, Transportation and Moving Occupations
The most common Production, Transportation and Moving occupations in Yuma are Material Moving (182 | 11.2%), Transportation (139 | 8.6%), and Production (55 | 3.4%).
Production, Transportation and Moving Occupations by Sex
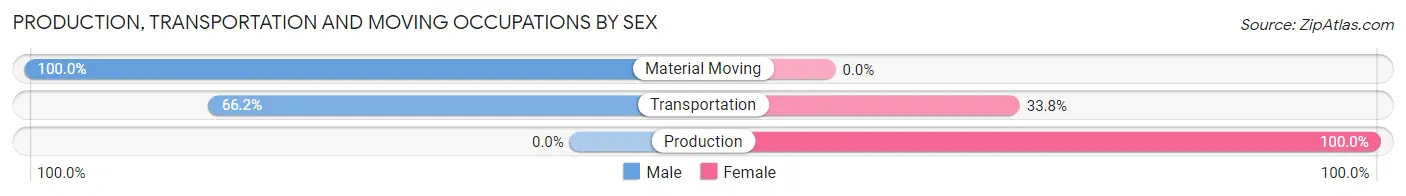
| Occupation | Male | Female |
| Production | 0 (0.0%) | 55 (100.0%) |
| Transportation | 92 (66.2%) | 47 (33.8%) |
| Material Moving | 182 (100.0%) | 0 (0.0%) |
| Total (Category) | 274 (72.9%) | 102 (27.1%) |
| Total (Overall) | 832 (51.3%) | 791 (48.7%) |
Employment Industries by Sex in Yuma
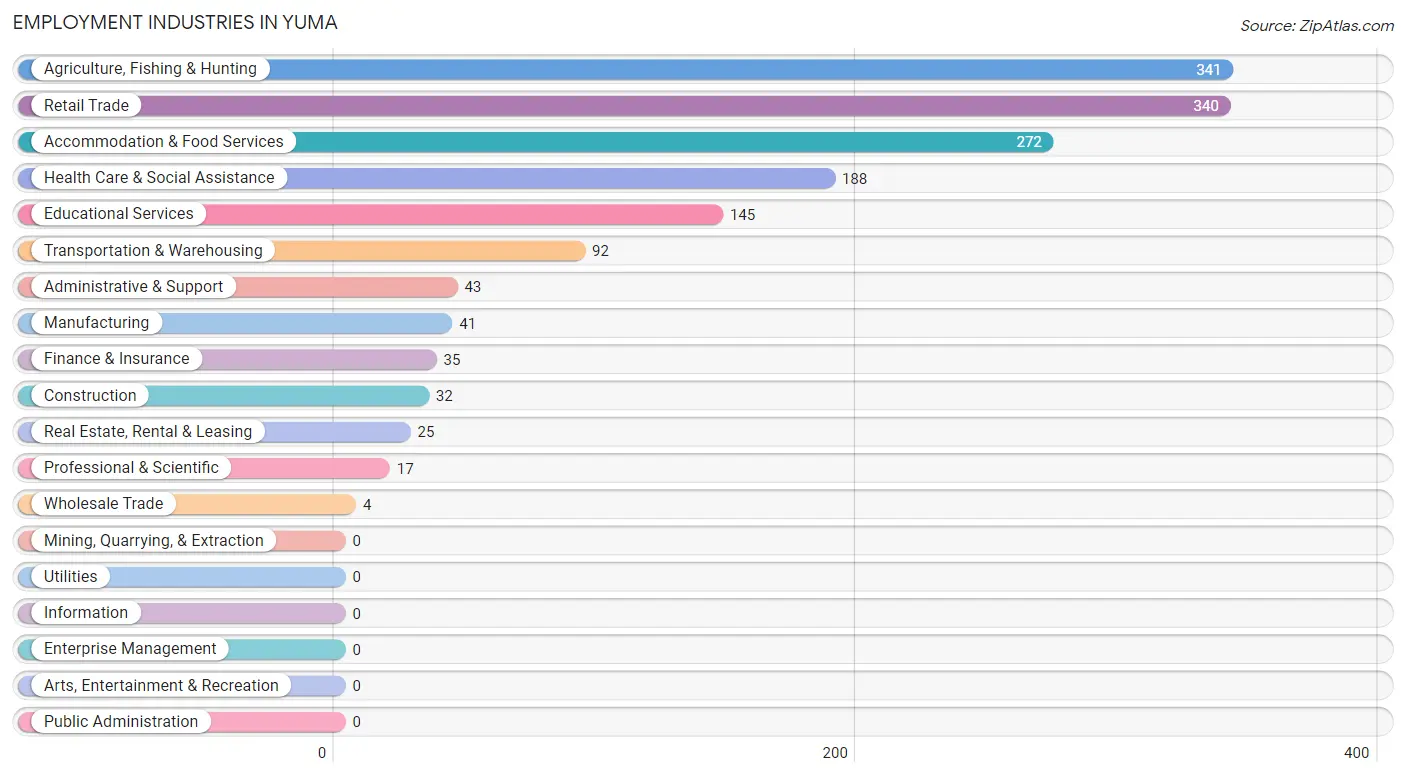
Employment Industries in Yuma
The major employment industries in Yuma include Agriculture, Fishing & Hunting (341 | 21.0%), Retail Trade (340 | 20.9%), Accommodation & Food Services (272 | 16.8%), Health Care & Social Assistance (188 | 11.6%), and Educational Services (145 | 8.9%).
Employment Industries by Sex in Yuma
The Yuma industries that see more men than women are Construction (100.0%), Finance & Insurance (100.0%), and Real Estate, Rental & Leasing (100.0%), whereas the industries that tend to have a higher number of women are Wholesale Trade (100.0%), Educational Services (100.0%), and Accommodation & Food Services (83.5%).
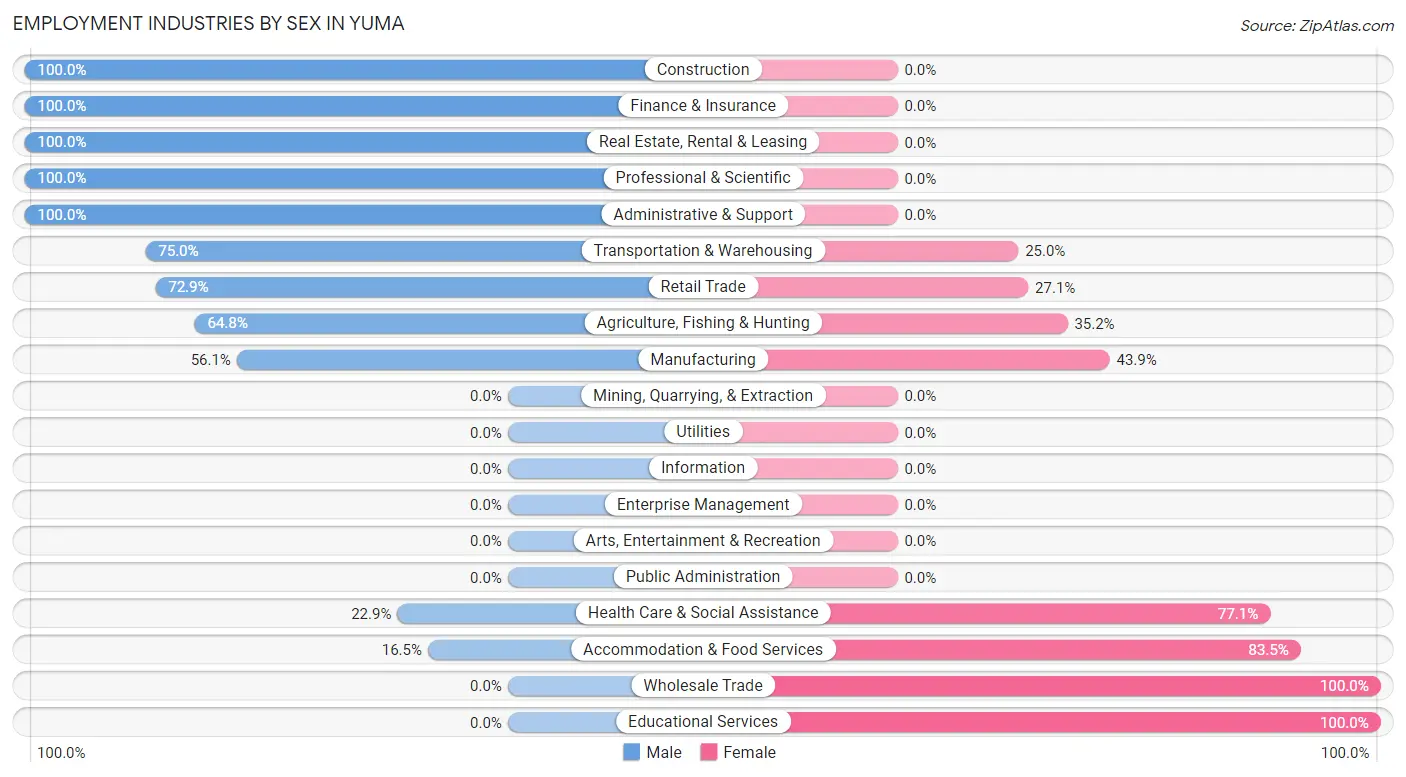
| Industry | Male | Female |
| Agriculture, Fishing & Hunting | 221 (64.8%) | 120 (35.2%) |
| Mining, Quarrying, & Extraction | 0 (0.0%) | 0 (0.0%) |
| Construction | 32 (100.0%) | 0 (0.0%) |
| Manufacturing | 23 (56.1%) | 18 (43.9%) |
| Wholesale Trade | 0 (0.0%) | 4 (100.0%) |
| Retail Trade | 248 (72.9%) | 92 (27.1%) |
| Transportation & Warehousing | 69 (75.0%) | 23 (25.0%) |
| Utilities | 0 (0.0%) | 0 (0.0%) |
| Information | 0 (0.0%) | 0 (0.0%) |
| Finance & Insurance | 35 (100.0%) | 0 (0.0%) |
| Real Estate, Rental & Leasing | 25 (100.0%) | 0 (0.0%) |
| Professional & Scientific | 17 (100.0%) | 0 (0.0%) |
| Enterprise Management | 0 (0.0%) | 0 (0.0%) |
| Administrative & Support | 43 (100.0%) | 0 (0.0%) |
| Educational Services | 0 (0.0%) | 145 (100.0%) |
| Health Care & Social Assistance | 43 (22.9%) | 145 (77.1%) |
| Arts, Entertainment & Recreation | 0 (0.0%) | 0 (0.0%) |
| Accommodation & Food Services | 45 (16.5%) | 227 (83.5%) |
| Public Administration | 0 (0.0%) | 0 (0.0%) |
| Total | 832 (51.3%) | 791 (48.7%) |
Education in Yuma
School Enrollment in Yuma
The most common levels of schooling among the 975 students in Yuma are high school (220 | 22.6%), middle school (199 | 20.4%), and elementary school (193 | 19.8%).
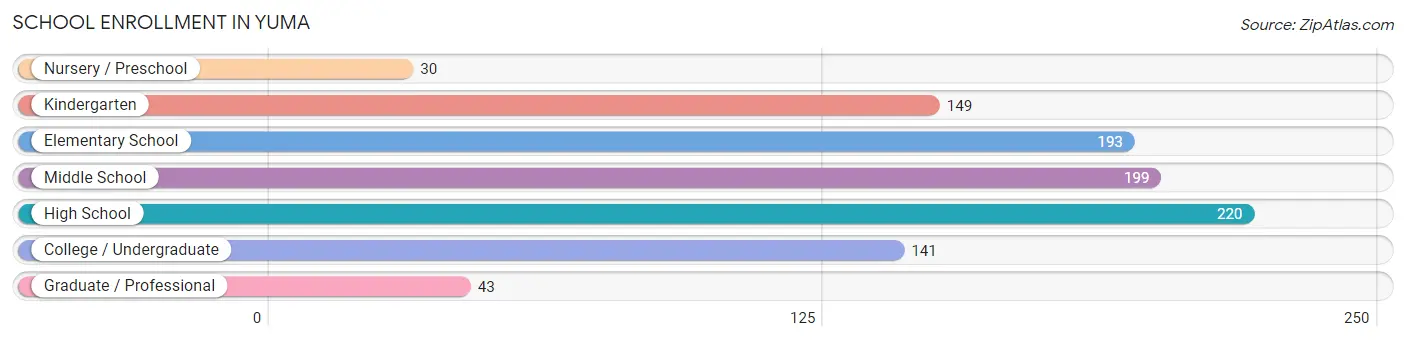
| School Level | # Students | % Students |
| Nursery / Preschool | 30 | 3.1% |
| Kindergarten | 149 | 15.3% |
| Elementary School | 193 | 19.8% |
| Middle School | 199 | 20.4% |
| High School | 220 | 22.6% |
| College / Undergraduate | 141 | 14.5% |
| Graduate / Professional | 43 | 4.4% |
| Total | 975 | 100.0% |
School Enrollment by Age by Funding Source in Yuma
Out of a total of 975 students who are enrolled in schools in Yuma, 43 (4.4%) attend a private institution, while the remaining 932 (95.6%) are enrolled in public schools. The age group of 35 years and over has the highest likelihood of being enrolled in private schools, with 43 (100.0% in the age bracket) enrolled. Conversely, the age group of 3 to 4 year olds has the lowest likelihood of being enrolled in a private school, with 17 (100.0% in the age bracket) attending a public institution.
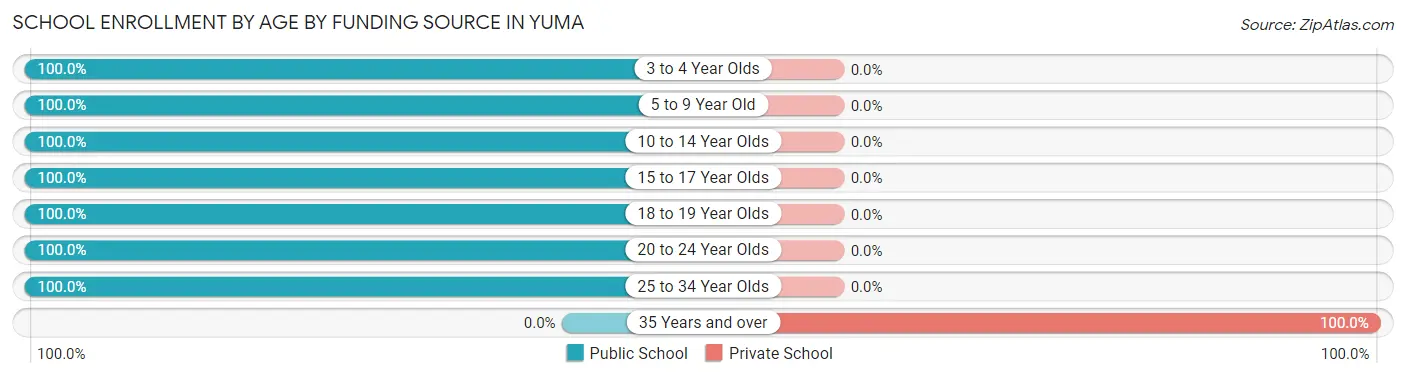
| Age Bracket | Public School | Private School |
| 3 to 4 Year Olds | 17 (100.0%) | 0 (0.0%) |
| 5 to 9 Year Old | 287 (100.0%) | 0 (0.0%) |
| 10 to 14 Year Olds | 379 (100.0%) | 0 (0.0%) |
| 15 to 17 Year Olds | 73 (100.0%) | 0 (0.0%) |
| 18 to 19 Year Olds | 35 (100.0%) | 0 (0.0%) |
| 20 to 24 Year Olds | 124 (100.0%) | 0 (0.0%) |
| 25 to 34 Year Olds | 17 (100.0%) | 0 (0.0%) |
| 35 Years and over | 0 (0.0%) | 43 (100.0%) |
| Total | 932 (95.6%) | 43 (4.4%) |
Educational Attainment by Field of Study in Yuma
Education (88 | 24.9%), business (83 | 23.5%), bio, nature & agricultural (80 | 22.7%), arts & humanities (36 | 10.2%), and science & technology (31 | 8.8%) are the most common fields of study among 353 individuals in Yuma who have obtained a bachelor's degree or higher.
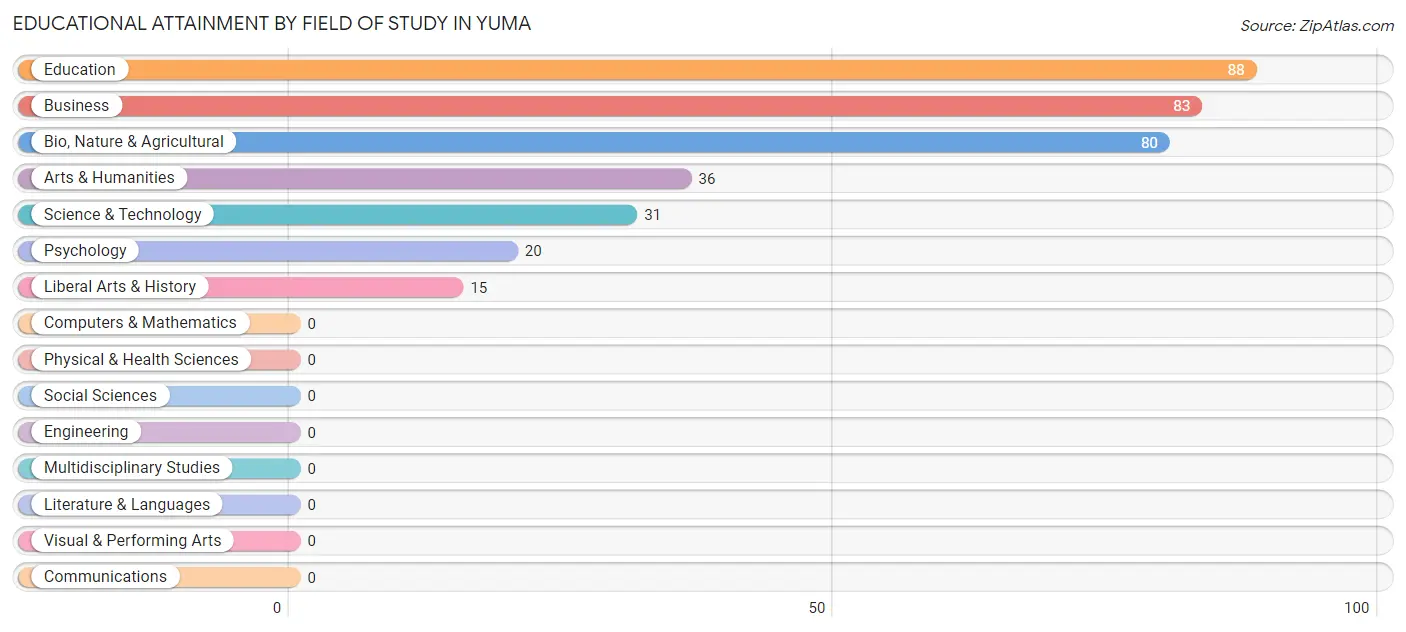
| Field of Study | # Graduates | % Graduates |
| Computers & Mathematics | 0 | 0.0% |
| Bio, Nature & Agricultural | 80 | 22.7% |
| Physical & Health Sciences | 0 | 0.0% |
| Psychology | 20 | 5.7% |
| Social Sciences | 0 | 0.0% |
| Engineering | 0 | 0.0% |
| Multidisciplinary Studies | 0 | 0.0% |
| Science & Technology | 31 | 8.8% |
| Business | 83 | 23.5% |
| Education | 88 | 24.9% |
| Literature & Languages | 0 | 0.0% |
| Liberal Arts & History | 15 | 4.3% |
| Visual & Performing Arts | 0 | 0.0% |
| Communications | 0 | 0.0% |
| Arts & Humanities | 36 | 10.2% |
| Total | 353 | 100.0% |
Transportation & Commute in Yuma
Vehicle Availability by Sex in Yuma
The most prevalent vehicle ownership categories in Yuma are males with 2 vehicles (507, accounting for 62.2%) and females with 2 vehicles (464, making up 67.8%).
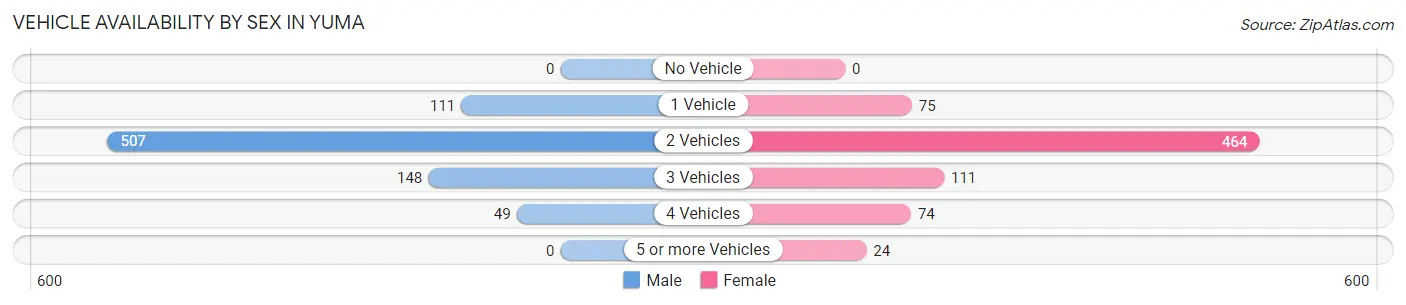
| Vehicles Available | Male | Female |
| No Vehicle | 0 (0.0%) | 0 (0.0%) |
| 1 Vehicle | 111 (13.6%) | 75 (10.0%) |
| 2 Vehicles | 507 (62.2%) | 464 (62.0%) |
| 3 Vehicles | 148 (18.2%) | 111 (14.8%) |
| 4 Vehicles | 49 (6.0%) | 74 (9.9%) |
| 5 or more Vehicles | 0 (0.0%) | 24 (3.2%) |
| Total | 815 (100.0%) | 748 (100.0%) |
Commute Time in Yuma
The most frequently occuring commute durations in Yuma are 5 to 9 minutes (562 commuters, 37.1%), 30 to 34 minutes (368 commuters, 24.3%), and less than 5 minutes (318 commuters, 21.0%).
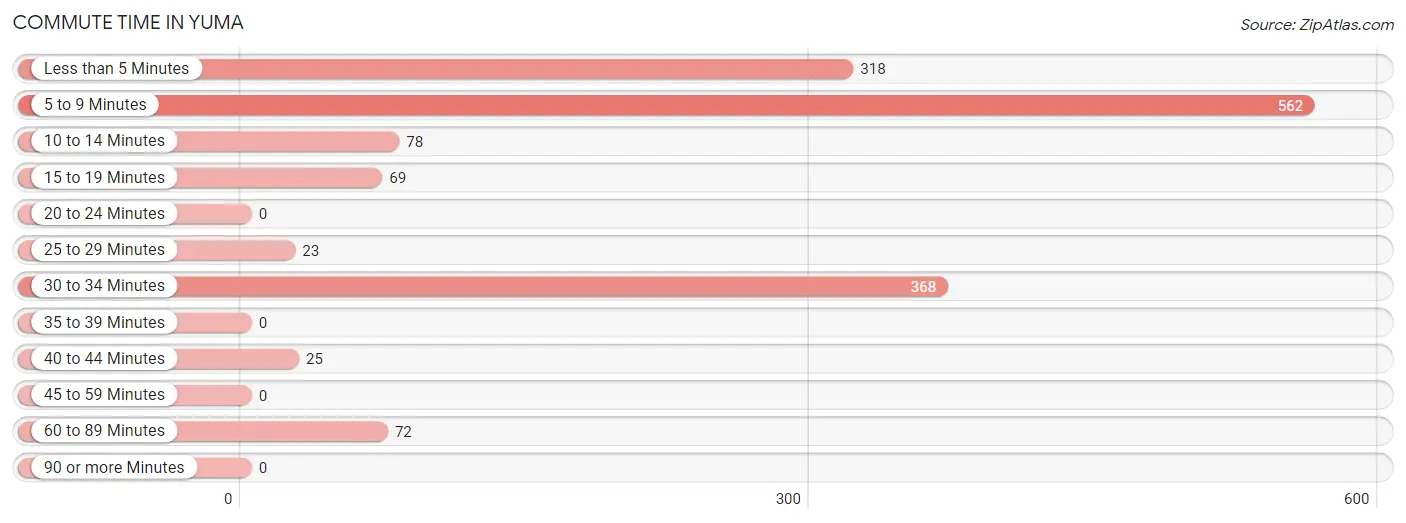
| Commute Time | # Commuters | % Commuters |
| Less than 5 Minutes | 318 | 21.0% |
| 5 to 9 Minutes | 562 | 37.1% |
| 10 to 14 Minutes | 78 | 5.1% |
| 15 to 19 Minutes | 69 | 4.5% |
| 20 to 24 Minutes | 0 | 0.0% |
| 25 to 29 Minutes | 23 | 1.5% |
| 30 to 34 Minutes | 368 | 24.3% |
| 35 to 39 Minutes | 0 | 0.0% |
| 40 to 44 Minutes | 25 | 1.7% |
| 45 to 59 Minutes | 0 | 0.0% |
| 60 to 89 Minutes | 72 | 4.8% |
| 90 or more Minutes | 0 | 0.0% |
Commute Time by Sex in Yuma
The most common commute times in Yuma are 30 to 34 minutes (266 commuters, 32.6%) for males and 5 to 9 minutes (328 commuters, 46.9%) for females.
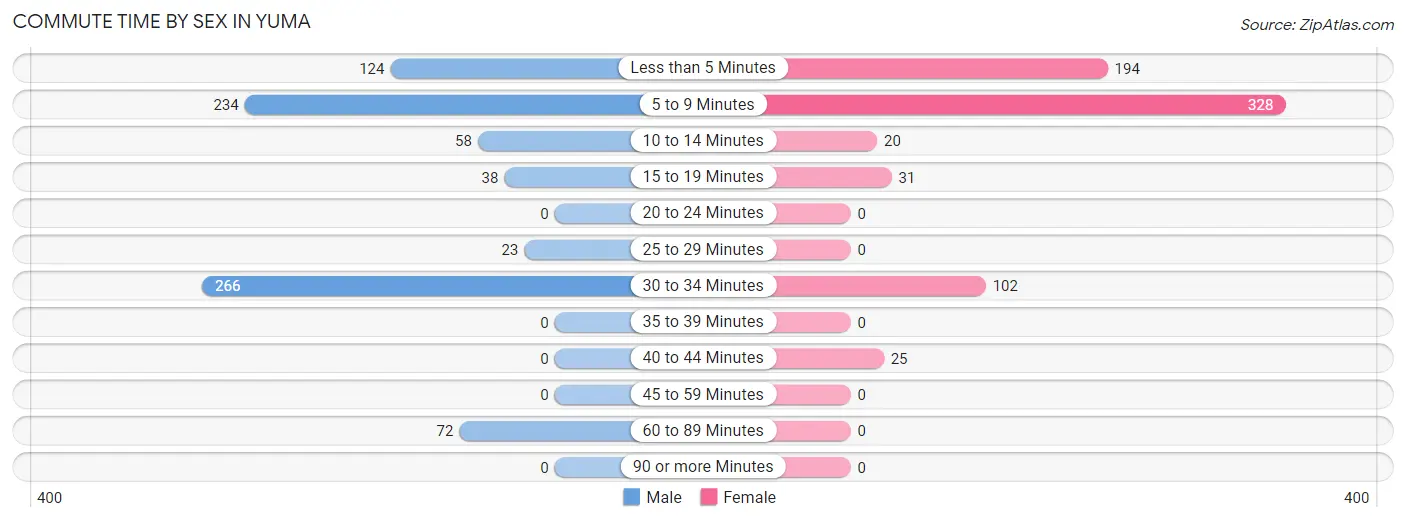
| Commute Time | Male | Female |
| Less than 5 Minutes | 124 (15.2%) | 194 (27.7%) |
| 5 to 9 Minutes | 234 (28.7%) | 328 (46.9%) |
| 10 to 14 Minutes | 58 (7.1%) | 20 (2.9%) |
| 15 to 19 Minutes | 38 (4.7%) | 31 (4.4%) |
| 20 to 24 Minutes | 0 (0.0%) | 0 (0.0%) |
| 25 to 29 Minutes | 23 (2.8%) | 0 (0.0%) |
| 30 to 34 Minutes | 266 (32.6%) | 102 (14.6%) |
| 35 to 39 Minutes | 0 (0.0%) | 0 (0.0%) |
| 40 to 44 Minutes | 0 (0.0%) | 25 (3.6%) |
| 45 to 59 Minutes | 0 (0.0%) | 0 (0.0%) |
| 60 to 89 Minutes | 72 (8.8%) | 0 (0.0%) |
| 90 or more Minutes | 0 (0.0%) | 0 (0.0%) |
Time of Departure to Work by Sex in Yuma
The most frequent times of departure to work in Yuma are 6:00 AM to 6:29 AM (186, 22.8%) for males and 7:00 AM to 7:29 AM (134, 19.1%) for females.
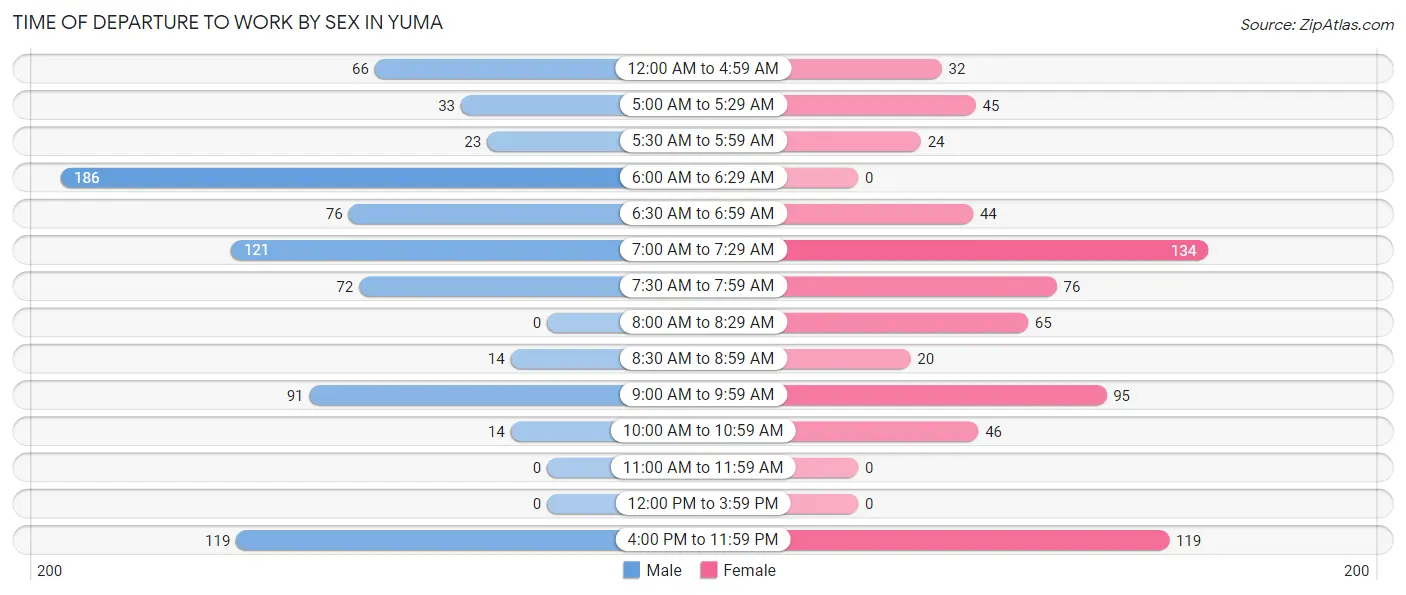
| Time of Departure | Male | Female |
| 12:00 AM to 4:59 AM | 66 (8.1%) | 32 (4.6%) |
| 5:00 AM to 5:29 AM | 33 (4.1%) | 45 (6.4%) |
| 5:30 AM to 5:59 AM | 23 (2.8%) | 24 (3.4%) |
| 6:00 AM to 6:29 AM | 186 (22.8%) | 0 (0.0%) |
| 6:30 AM to 6:59 AM | 76 (9.3%) | 44 (6.3%) |
| 7:00 AM to 7:29 AM | 121 (14.8%) | 134 (19.1%) |
| 7:30 AM to 7:59 AM | 72 (8.8%) | 76 (10.9%) |
| 8:00 AM to 8:29 AM | 0 (0.0%) | 65 (9.3%) |
| 8:30 AM to 8:59 AM | 14 (1.7%) | 20 (2.9%) |
| 9:00 AM to 9:59 AM | 91 (11.2%) | 95 (13.6%) |
| 10:00 AM to 10:59 AM | 14 (1.7%) | 46 (6.6%) |
| 11:00 AM to 11:59 AM | 0 (0.0%) | 0 (0.0%) |
| 12:00 PM to 3:59 PM | 0 (0.0%) | 0 (0.0%) |
| 4:00 PM to 11:59 PM | 119 (14.6%) | 119 (17.0%) |
| Total | 815 (100.0%) | 700 (100.0%) |
Housing Occupancy in Yuma
Occupancy by Ownership in Yuma
Of the total 1,286 dwellings in Yuma, owner-occupied units account for 812 (63.1%), while renter-occupied units make up 474 (36.9%).
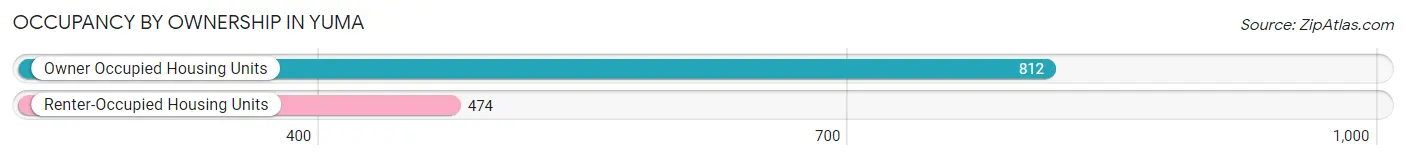
| Occupancy | # Housing Units | % Housing Units |
| Owner Occupied Housing Units | 812 | 63.1% |
| Renter-Occupied Housing Units | 474 | 36.9% |
| Total Occupied Housing Units | 1,286 | 100.0% |
Occupancy by Household Size in Yuma
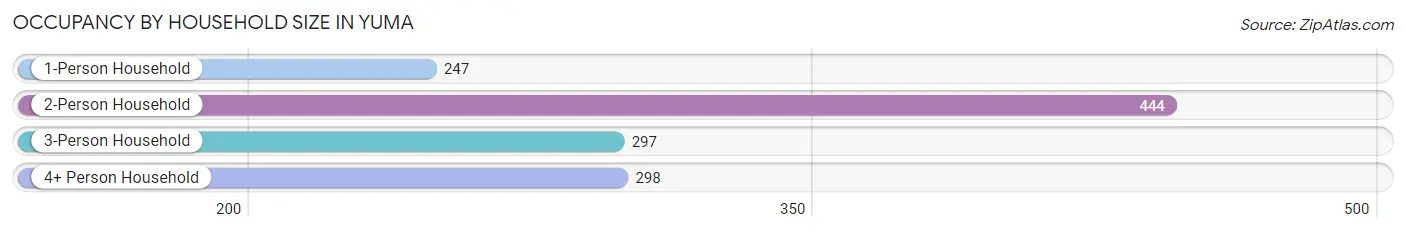
| Household Size | # Housing Units | % Housing Units |
| 1-Person Household | 247 | 19.2% |
| 2-Person Household | 444 | 34.5% |
| 3-Person Household | 297 | 23.1% |
| 4+ Person Household | 298 | 23.2% |
| Total Housing Units | 1,286 | 100.0% |
Occupancy by Ownership by Household Size in Yuma
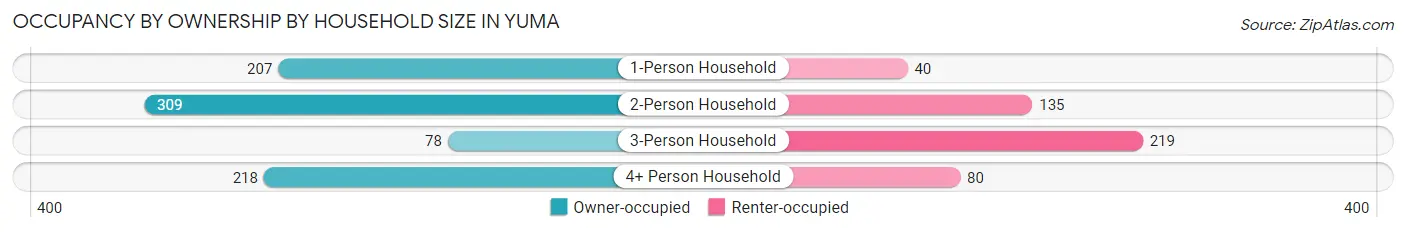
| Household Size | Owner-occupied | Renter-occupied |
| 1-Person Household | 207 (83.8%) | 40 (16.2%) |
| 2-Person Household | 309 (69.6%) | 135 (30.4%) |
| 3-Person Household | 78 (26.3%) | 219 (73.7%) |
| 4+ Person Household | 218 (73.2%) | 80 (26.9%) |
| Total Housing Units | 812 (63.1%) | 474 (36.9%) |
Occupancy by Educational Attainment in Yuma
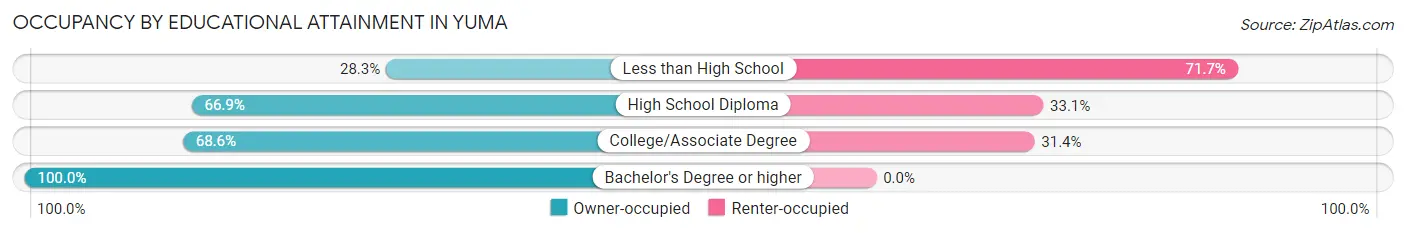
| Household Size | Owner-occupied | Renter-occupied |
| Less than High School | 87 (28.3%) | 220 (71.7%) |
| High School Diploma | 287 (66.9%) | 142 (33.1%) |
| College/Associate Degree | 245 (68.6%) | 112 (31.4%) |
| Bachelor's Degree or higher | 193 (100.0%) | 0 (0.0%) |
Occupancy by Age of Householder in Yuma
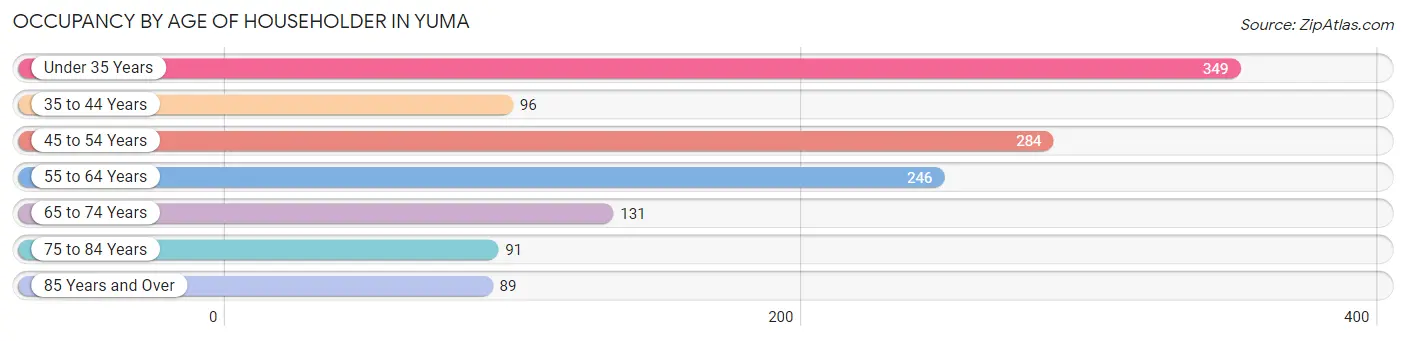
| Age Bracket | # Households | % Households |
| Under 35 Years | 349 | 27.1% |
| 35 to 44 Years | 96 | 7.5% |
| 45 to 54 Years | 284 | 22.1% |
| 55 to 64 Years | 246 | 19.1% |
| 65 to 74 Years | 131 | 10.2% |
| 75 to 84 Years | 91 | 7.1% |
| 85 Years and Over | 89 | 6.9% |
| Total | 1,286 | 100.0% |
Housing Finances in Yuma
Median Income by Occupancy in Yuma
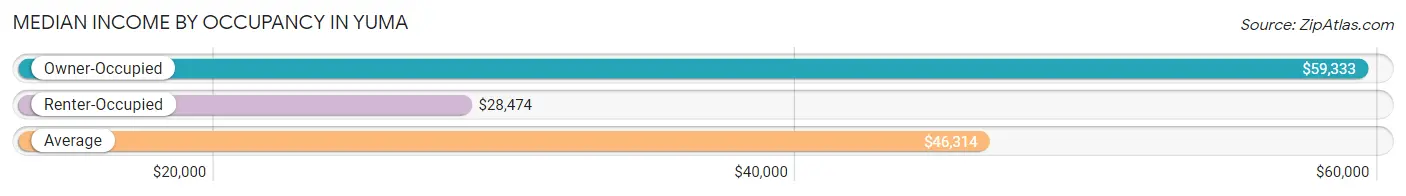
| Occupancy Type | # Households | Median Income |
| Owner-Occupied | 812 (63.1%) | $59,333 |
| Renter-Occupied | 474 (36.9%) | $28,474 |
| Average | 1,286 (100.0%) | $46,314 |
Occupancy by Householder Income Bracket in Yuma
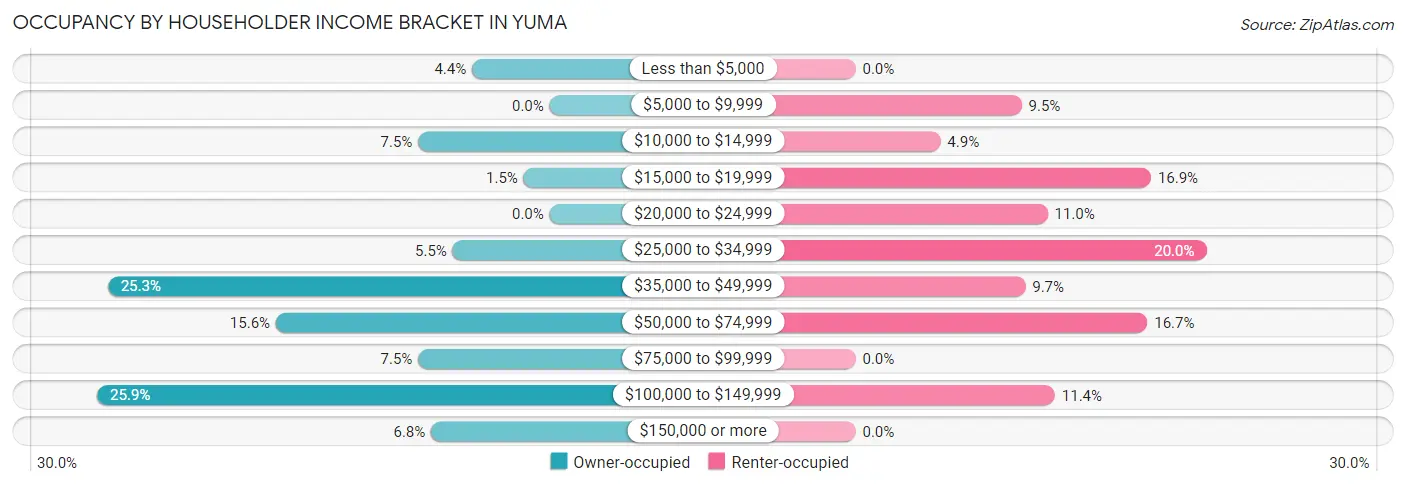
| Income Bracket | Owner-occupied | Renter-occupied |
| Less than $5,000 | 36 (4.4%) | 0 (0.0%) |
| $5,000 to $9,999 | 0 (0.0%) | 45 (9.5%) |
| $10,000 to $14,999 | 61 (7.5%) | 23 (4.9%) |
| $15,000 to $19,999 | 12 (1.5%) | 80 (16.9%) |
| $20,000 to $24,999 | 0 (0.0%) | 52 (11.0%) |
| $25,000 to $34,999 | 45 (5.5%) | 95 (20.0%) |
| $35,000 to $49,999 | 205 (25.3%) | 46 (9.7%) |
| $50,000 to $74,999 | 127 (15.6%) | 79 (16.7%) |
| $75,000 to $99,999 | 61 (7.5%) | 0 (0.0%) |
| $100,000 to $149,999 | 210 (25.9%) | 54 (11.4%) |
| $150,000 or more | 55 (6.8%) | 0 (0.0%) |
| Total | 812 (100.0%) | 474 (100.0%) |
Monthly Housing Cost Tiers in Yuma
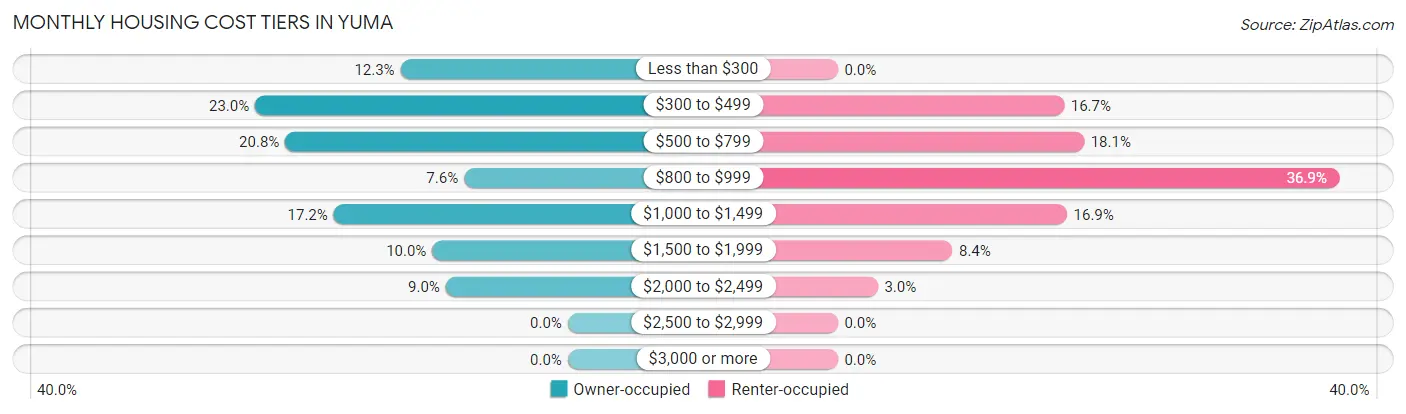
| Monthly Cost | Owner-occupied | Renter-occupied |
| Less than $300 | 100 (12.3%) | 0 (0.0%) |
| $300 to $499 | 187 (23.0%) | 79 (16.7%) |
| $500 to $799 | 169 (20.8%) | 86 (18.1%) |
| $800 to $999 | 62 (7.6%) | 175 (36.9%) |
| $1,000 to $1,499 | 140 (17.2%) | 80 (16.9%) |
| $1,500 to $1,999 | 81 (10.0%) | 40 (8.4%) |
| $2,000 to $2,499 | 73 (9.0%) | 14 (2.9%) |
| $2,500 to $2,999 | 0 (0.0%) | 0 (0.0%) |
| $3,000 or more | 0 (0.0%) | 0 (0.0%) |
| Total | 812 (100.0%) | 474 (100.0%) |
Physical Housing Characteristics in Yuma
Housing Structures in Yuma
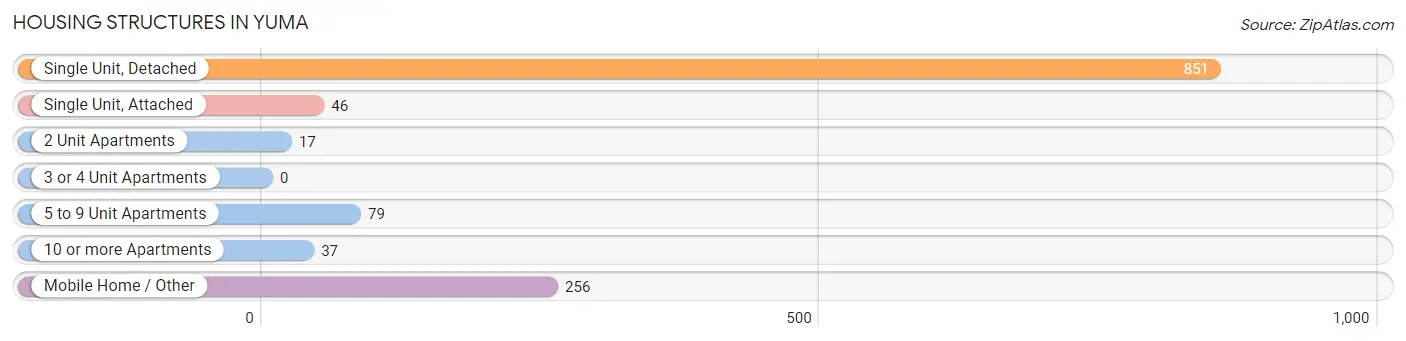
| Structure Type | # Housing Units | % Housing Units |
| Single Unit, Detached | 851 | 66.2% |
| Single Unit, Attached | 46 | 3.6% |
| 2 Unit Apartments | 17 | 1.3% |
| 3 or 4 Unit Apartments | 0 | 0.0% |
| 5 to 9 Unit Apartments | 79 | 6.1% |
| 10 or more Apartments | 37 | 2.9% |
| Mobile Home / Other | 256 | 19.9% |
| Total | 1,286 | 100.0% |
Housing Structures by Occupancy in Yuma
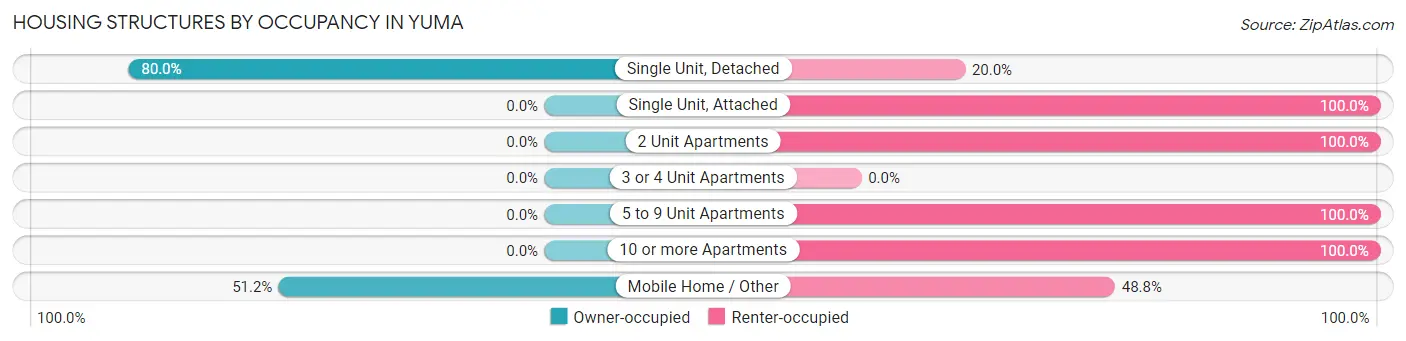
| Structure Type | Owner-occupied | Renter-occupied |
| Single Unit, Detached | 681 (80.0%) | 170 (20.0%) |
| Single Unit, Attached | 0 (0.0%) | 46 (100.0%) |
| 2 Unit Apartments | 0 (0.0%) | 17 (100.0%) |
| 3 or 4 Unit Apartments | 0 (0.0%) | 0 (0.0%) |
| 5 to 9 Unit Apartments | 0 (0.0%) | 79 (100.0%) |
| 10 or more Apartments | 0 (0.0%) | 37 (100.0%) |
| Mobile Home / Other | 131 (51.2%) | 125 (48.8%) |
| Total | 812 (63.1%) | 474 (36.9%) |
Housing Structures by Number of Rooms in Yuma
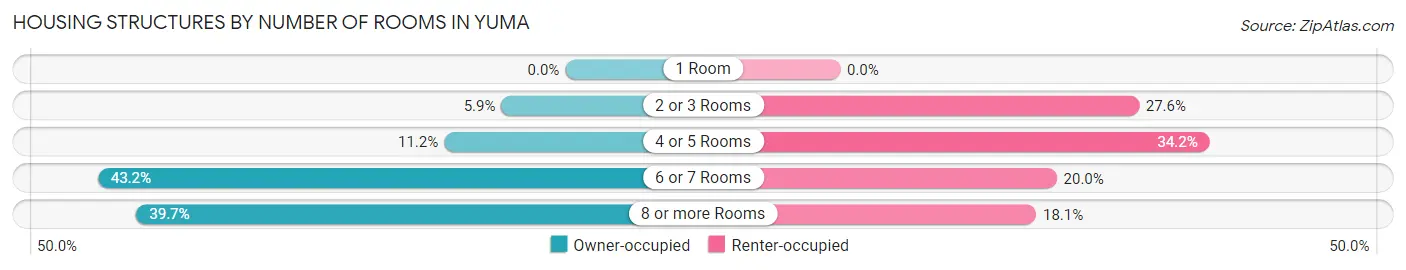
| Number of Rooms | Owner-occupied | Renter-occupied |
| 1 Room | 0 (0.0%) | 0 (0.0%) |
| 2 or 3 Rooms | 48 (5.9%) | 131 (27.6%) |
| 4 or 5 Rooms | 91 (11.2%) | 162 (34.2%) |
| 6 or 7 Rooms | 351 (43.2%) | 95 (20.0%) |
| 8 or more Rooms | 322 (39.7%) | 86 (18.1%) |
| Total | 812 (100.0%) | 474 (100.0%) |
Housing Structure by Heating Type in Yuma
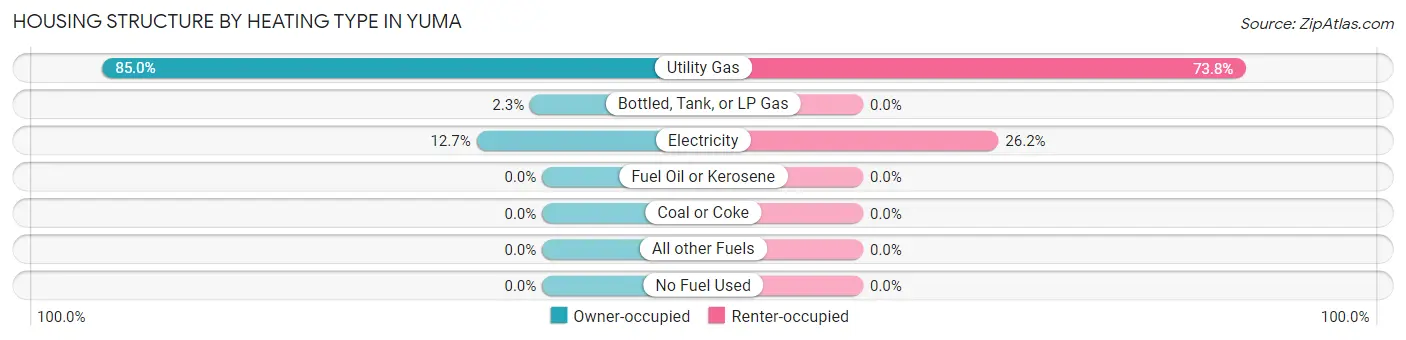
| Heating Type | Owner-occupied | Renter-occupied |
| Utility Gas | 690 (85.0%) | 350 (73.8%) |
| Bottled, Tank, or LP Gas | 19 (2.3%) | 0 (0.0%) |
| Electricity | 103 (12.7%) | 124 (26.2%) |
| Fuel Oil or Kerosene | 0 (0.0%) | 0 (0.0%) |
| Coal or Coke | 0 (0.0%) | 0 (0.0%) |
| All other Fuels | 0 (0.0%) | 0 (0.0%) |
| No Fuel Used | 0 (0.0%) | 0 (0.0%) |
| Total | 812 (100.0%) | 474 (100.0%) |
Household Vehicle Usage in Yuma
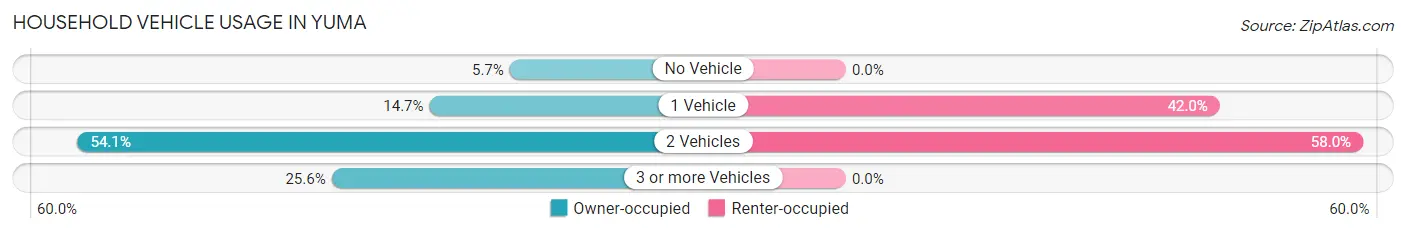
| Vehicles per Household | Owner-occupied | Renter-occupied |
| No Vehicle | 46 (5.7%) | 0 (0.0%) |
| 1 Vehicle | 119 (14.7%) | 199 (42.0%) |
| 2 Vehicles | 439 (54.1%) | 275 (58.0%) |
| 3 or more Vehicles | 208 (25.6%) | 0 (0.0%) |
| Total | 812 (100.0%) | 474 (100.0%) |
Real Estate & Mortgages in Yuma
Real Estate and Mortgage Overview in Yuma
| Characteristic | Without Mortgage | With Mortgage |
| Housing Units | 438 | 374 |
| Median Property Value | $159,200 | $168,500 |
| Median Household Income | $42,406 | $35 |
| Monthly Housing Costs | $399 | $0 |
| Real Estate Taxes | $732 | $0 |
Property Value by Mortgage Status in Yuma
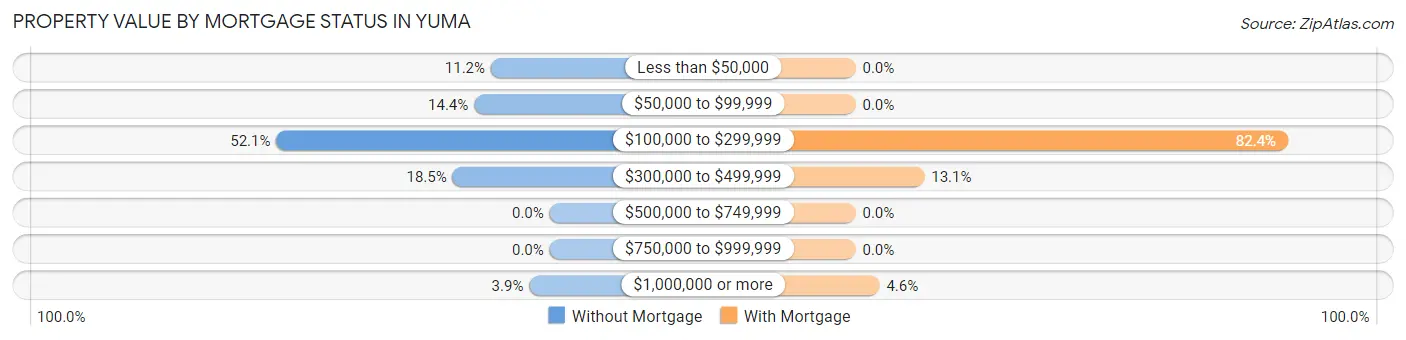
| Property Value | Without Mortgage | With Mortgage |
| Less than $50,000 | 49 (11.2%) | 0 (0.0%) |
| $50,000 to $99,999 | 63 (14.4%) | 0 (0.0%) |
| $100,000 to $299,999 | 228 (52.0%) | 308 (82.4%) |
| $300,000 to $499,999 | 81 (18.5%) | 49 (13.1%) |
| $500,000 to $749,999 | 0 (0.0%) | 0 (0.0%) |
| $750,000 to $999,999 | 0 (0.0%) | 0 (0.0%) |
| $1,000,000 or more | 17 (3.9%) | 17 (4.5%) |
| Total | 438 (100.0%) | 374 (100.0%) |
Household Income by Mortgage Status in Yuma
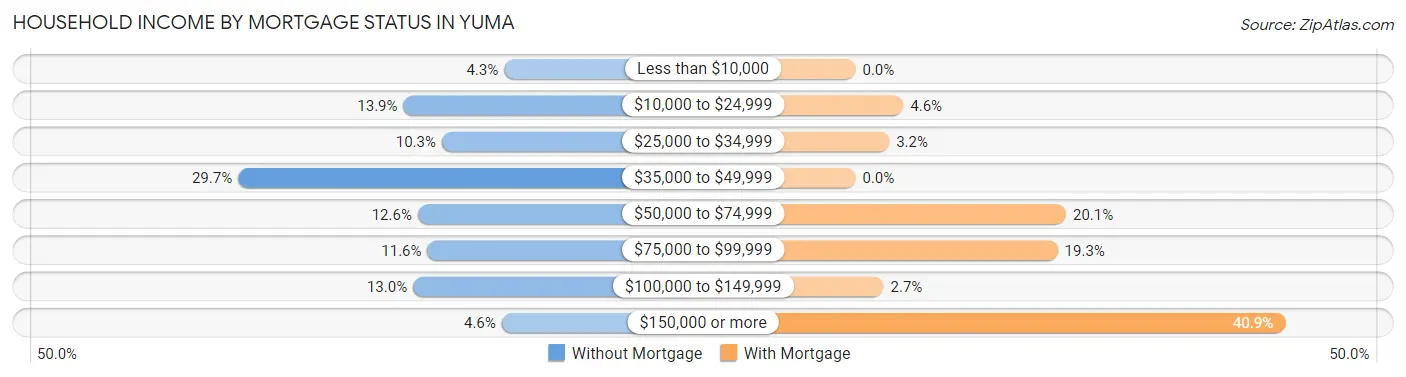
| Household Income | Without Mortgage | With Mortgage |
| Less than $10,000 | 19 (4.3%) | 0 (0.0%) |
| $10,000 to $24,999 | 61 (13.9%) | 17 (4.5%) |
| $25,000 to $34,999 | 45 (10.3%) | 12 (3.2%) |
| $35,000 to $49,999 | 130 (29.7%) | 0 (0.0%) |
| $50,000 to $74,999 | 55 (12.6%) | 75 (20.1%) |
| $75,000 to $99,999 | 51 (11.6%) | 72 (19.3%) |
| $100,000 to $149,999 | 57 (13.0%) | 10 (2.7%) |
| $150,000 or more | 20 (4.6%) | 153 (40.9%) |
| Total | 438 (100.0%) | 374 (100.0%) |
Property Value to Household Income Ratio in Yuma
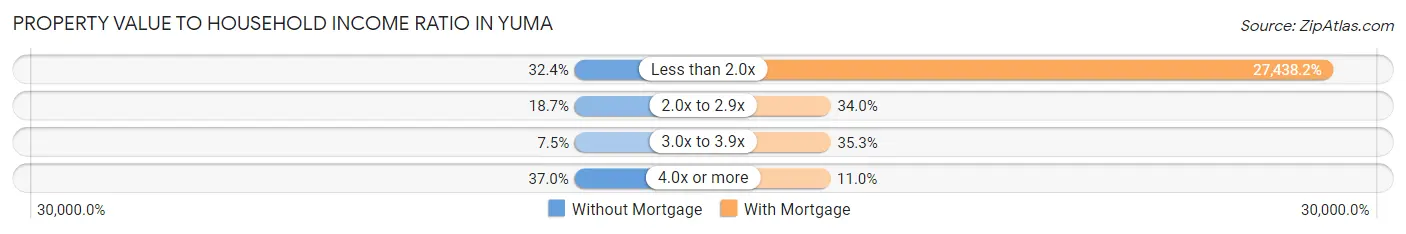
| Value-to-Income Ratio | Without Mortgage | With Mortgage |
| Less than 2.0x | 142 (32.4%) | 102,619 (27,438.2%) |
| 2.0x to 2.9x | 82 (18.7%) | 127 (34.0%) |
| 3.0x to 3.9x | 33 (7.5%) | 132 (35.3%) |
| 4.0x or more | 162 (37.0%) | 41 (11.0%) |
| Total | 438 (100.0%) | 374 (100.0%) |
Real Estate Taxes by Mortgage Status in Yuma
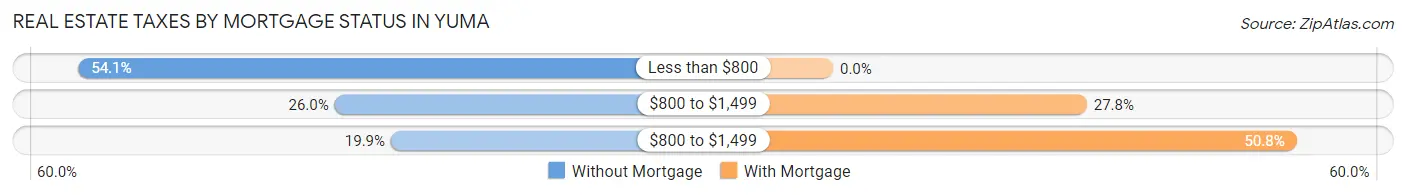
| Property Taxes | Without Mortgage | With Mortgage |
| Less than $800 | 237 (54.1%) | 0 (0.0%) |
| $800 to $1,499 | 114 (26.0%) | 104 (27.8%) |
| $800 to $1,499 | 87 (19.9%) | 190 (50.8%) |
| Total | 438 (100.0%) | 374 (100.0%) |
Health & Disability in Yuma
Health Insurance Coverage by Age in Yuma
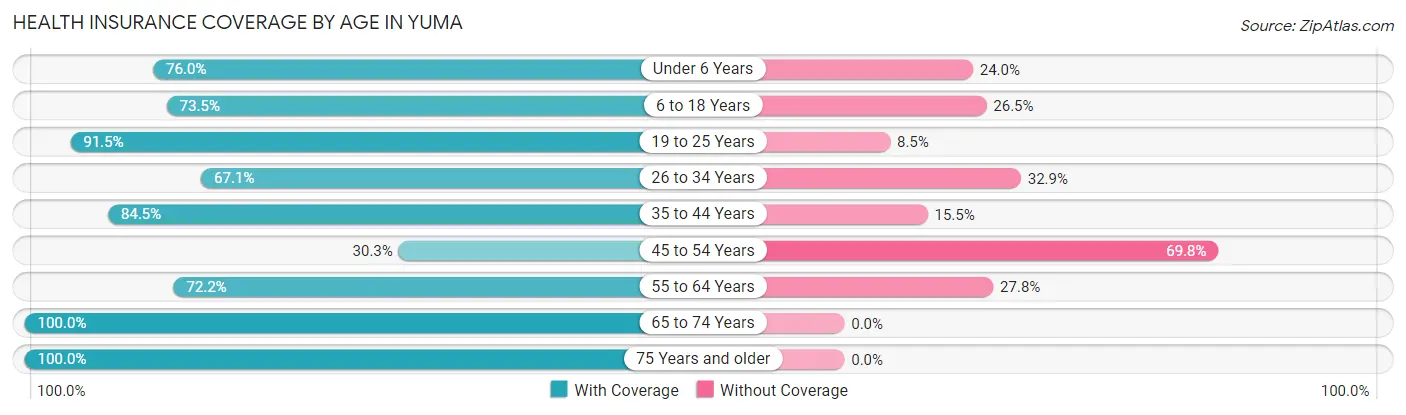
| Age Bracket | With Coverage | Without Coverage |
| Under 6 Years | 273 (76.0%) | 86 (24.0%) |
| 6 to 18 Years | 519 (73.5%) | 187 (26.5%) |
| 19 to 25 Years | 268 (91.5%) | 25 (8.5%) |
| 26 to 34 Years | 324 (67.1%) | 159 (32.9%) |
| 35 to 44 Years | 185 (84.5%) | 34 (15.5%) |
| 45 to 54 Years | 144 (30.2%) | 332 (69.8%) |
| 55 to 64 Years | 281 (72.2%) | 108 (27.8%) |
| 65 to 74 Years | 247 (100.0%) | 0 (0.0%) |
| 75 Years and older | 205 (100.0%) | 0 (0.0%) |
| Total | 2,446 (72.4%) | 931 (27.6%) |
Health Insurance Coverage by Citizenship Status in Yuma
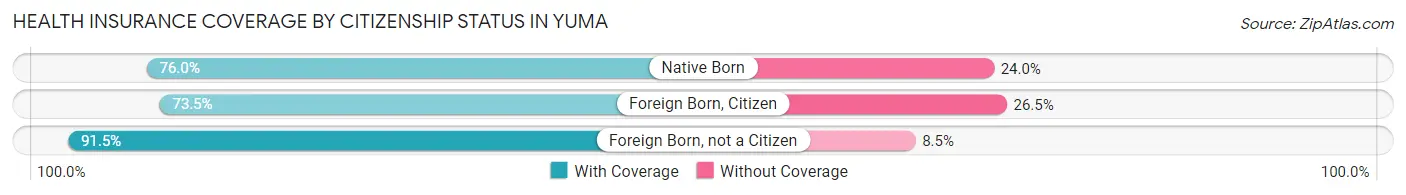
| Citizenship Status | With Coverage | Without Coverage |
| Native Born | 273 (76.0%) | 86 (24.0%) |
| Foreign Born, Citizen | 519 (73.5%) | 187 (26.5%) |
| Foreign Born, not a Citizen | 268 (91.5%) | 25 (8.5%) |
Health Insurance Coverage by Household Income in Yuma
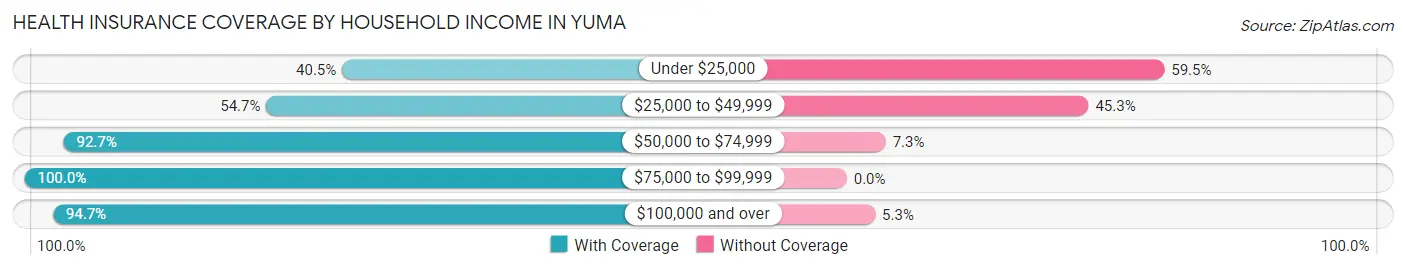
| Household Income | With Coverage | Without Coverage |
| Under $25,000 | 301 (40.5%) | 442 (59.5%) |
| $25,000 to $49,999 | 481 (54.7%) | 398 (45.3%) |
| $50,000 to $74,999 | 457 (92.7%) | 36 (7.3%) |
| $75,000 to $99,999 | 227 (100.0%) | 0 (0.0%) |
| $100,000 and over | 980 (94.7%) | 55 (5.3%) |
Public vs Private Health Insurance Coverage by Age in Yuma
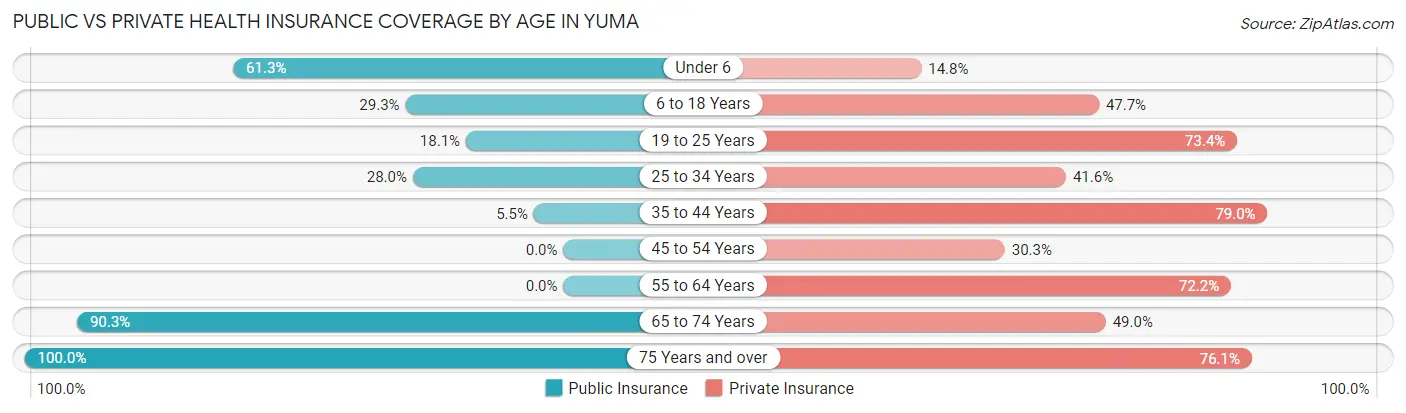
| Age Bracket | Public Insurance | Private Insurance |
| Under 6 | 220 (61.3%) | 53 (14.8%) |
| 6 to 18 Years | 207 (29.3%) | 337 (47.7%) |
| 19 to 25 Years | 53 (18.1%) | 215 (73.4%) |
| 25 to 34 Years | 135 (28.0%) | 201 (41.6%) |
| 35 to 44 Years | 12 (5.5%) | 173 (79.0%) |
| 45 to 54 Years | 0 (0.0%) | 144 (30.2%) |
| 55 to 64 Years | 0 (0.0%) | 281 (72.2%) |
| 65 to 74 Years | 223 (90.3%) | 121 (49.0%) |
| 75 Years and over | 205 (100.0%) | 156 (76.1%) |
| Total | 1,055 (31.2%) | 1,681 (49.8%) |
Disability Status by Sex by Age in Yuma
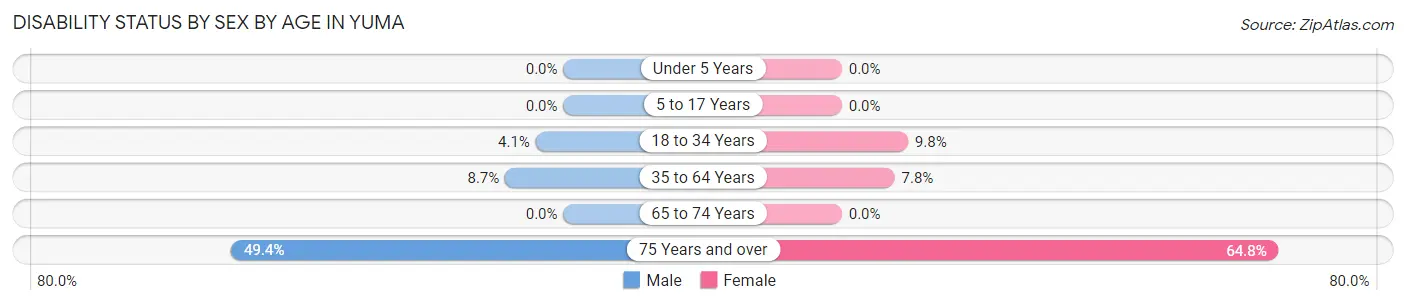
| Age Bracket | Male | Female |
| Under 5 Years | 0 (0.0%) | 0 (0.0%) |
| 5 to 17 Years | 0 (0.0%) | 0 (0.0%) |
| 18 to 34 Years | 17 (4.1%) | 39 (9.8%) |
| 35 to 64 Years | 43 (8.6%) | 46 (7.8%) |
| 65 to 74 Years | 0 (0.0%) | 0 (0.0%) |
| 75 Years and over | 38 (49.3%) | 83 (64.8%) |
Disability Class by Sex by Age in Yuma
Disability Class: Hearing Difficulty
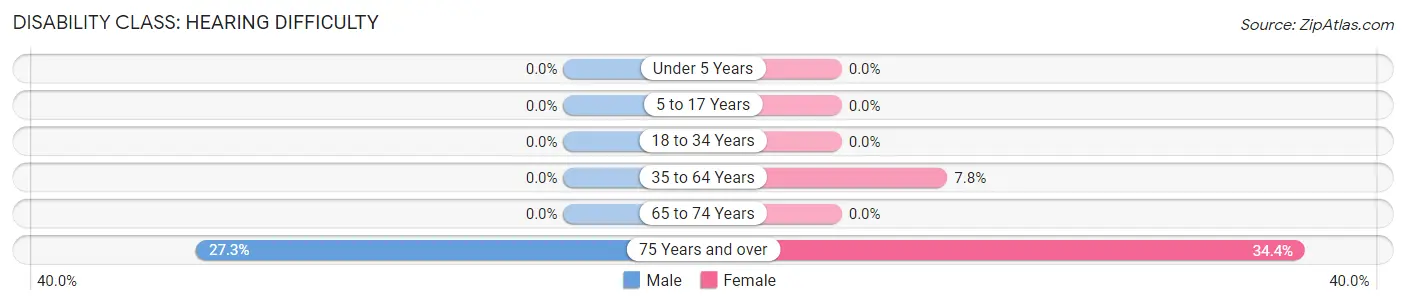
| Age Bracket | Male | Female |
| Under 5 Years | 0 (0.0%) | 0 (0.0%) |
| 5 to 17 Years | 0 (0.0%) | 0 (0.0%) |
| 18 to 34 Years | 0 (0.0%) | 0 (0.0%) |
| 35 to 64 Years | 0 (0.0%) | 46 (7.8%) |
| 65 to 74 Years | 0 (0.0%) | 0 (0.0%) |
| 75 Years and over | 21 (27.3%) | 44 (34.4%) |
Disability Class: Vision Difficulty
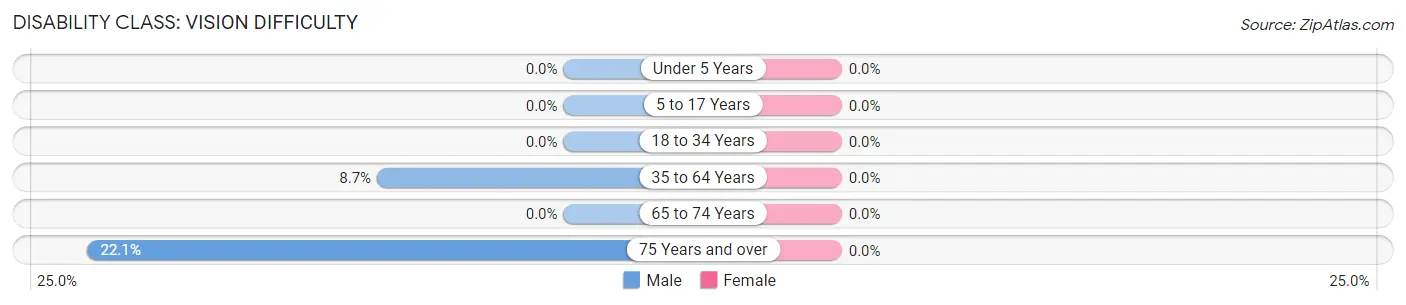
| Age Bracket | Male | Female |
| Under 5 Years | 0 (0.0%) | 0 (0.0%) |
| 5 to 17 Years | 0 (0.0%) | 0 (0.0%) |
| 18 to 34 Years | 0 (0.0%) | 0 (0.0%) |
| 35 to 64 Years | 43 (8.6%) | 0 (0.0%) |
| 65 to 74 Years | 0 (0.0%) | 0 (0.0%) |
| 75 Years and over | 17 (22.1%) | 0 (0.0%) |
Disability Class: Cognitive Difficulty
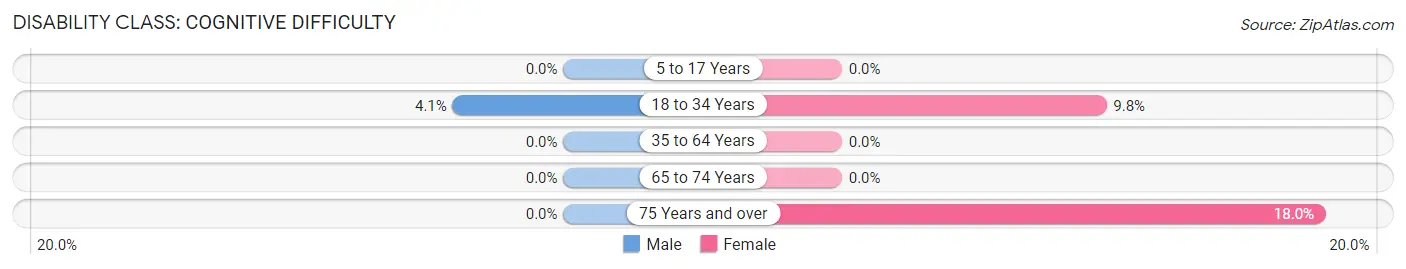
| Age Bracket | Male | Female |
| 5 to 17 Years | 0 (0.0%) | 0 (0.0%) |
| 18 to 34 Years | 17 (4.1%) | 39 (9.8%) |
| 35 to 64 Years | 0 (0.0%) | 0 (0.0%) |
| 65 to 74 Years | 0 (0.0%) | 0 (0.0%) |
| 75 Years and over | 0 (0.0%) | 23 (18.0%) |
Disability Class: Ambulatory Difficulty
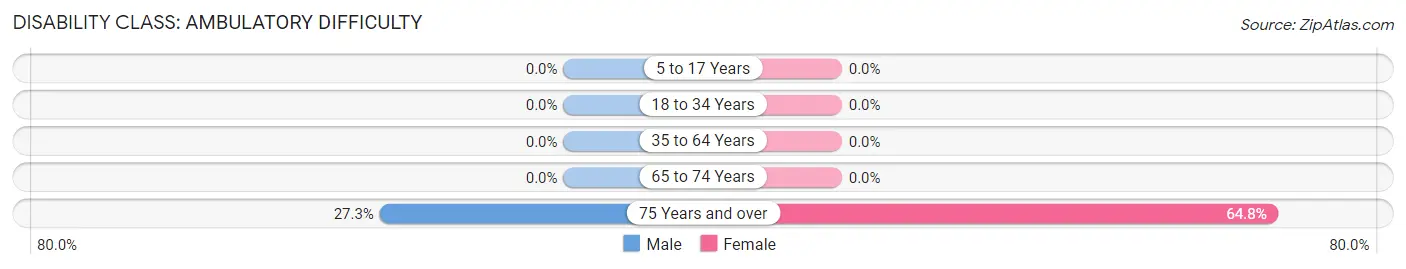
| Age Bracket | Male | Female |
| 5 to 17 Years | 0 (0.0%) | 0 (0.0%) |
| 18 to 34 Years | 0 (0.0%) | 0 (0.0%) |
| 35 to 64 Years | 0 (0.0%) | 0 (0.0%) |
| 65 to 74 Years | 0 (0.0%) | 0 (0.0%) |
| 75 Years and over | 21 (27.3%) | 83 (64.8%) |
Disability Class: Self-Care Difficulty
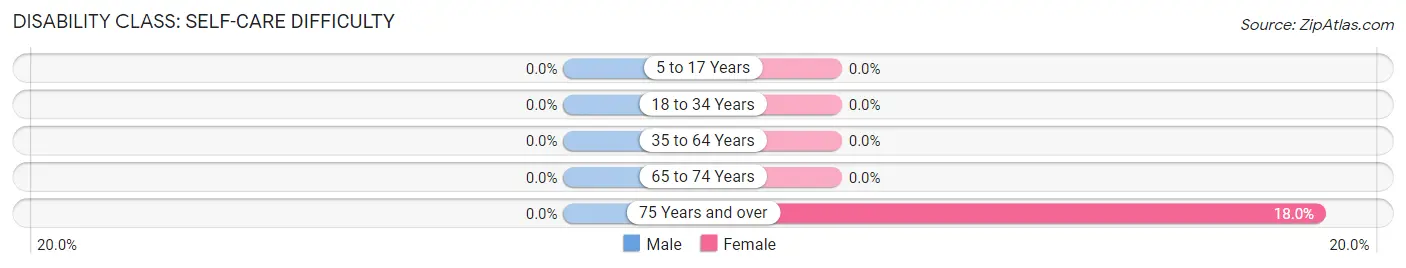
| Age Bracket | Male | Female |
| 5 to 17 Years | 0 (0.0%) | 0 (0.0%) |
| 18 to 34 Years | 0 (0.0%) | 0 (0.0%) |
| 35 to 64 Years | 0 (0.0%) | 0 (0.0%) |
| 65 to 74 Years | 0 (0.0%) | 0 (0.0%) |
| 75 Years and over | 0 (0.0%) | 23 (18.0%) |
Technology Access in Yuma
Computing Device Access in Yuma
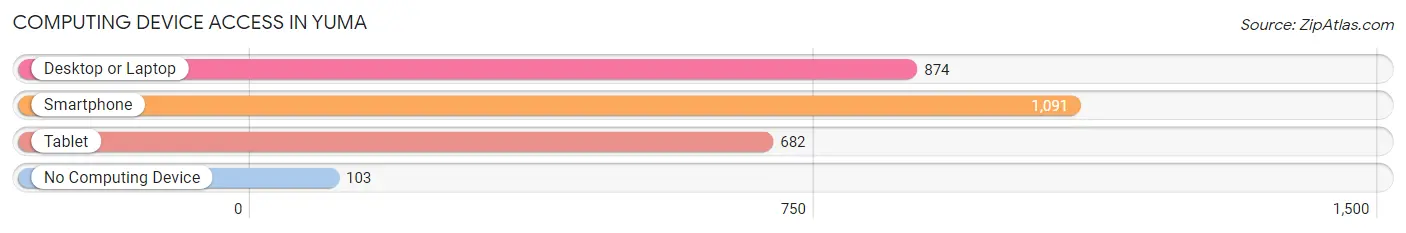
| Device Type | # Households | % Households |
| Desktop or Laptop | 874 | 68.0% |
| Smartphone | 1,091 | 84.8% |
| Tablet | 682 | 53.0% |
| No Computing Device | 103 | 8.0% |
| Total | 1,286 | 100.0% |
Internet Access in Yuma
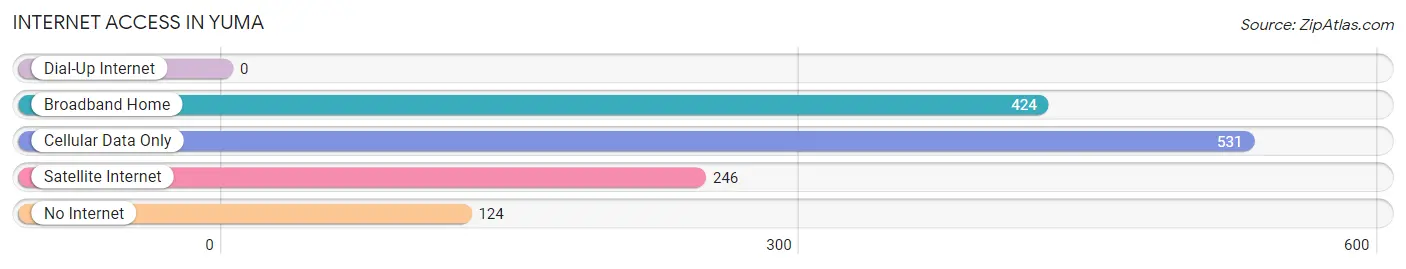
| Internet Type | # Households | % Households |
| Dial-Up Internet | 0 | 0.0% |
| Broadband Home | 424 | 33.0% |
| Cellular Data Only | 531 | 41.3% |
| Satellite Internet | 246 | 19.1% |
| No Internet | 124 | 9.6% |
| Total | 1,286 | 100.0% |
Yuma Summary
Yuma, Colorado is a small town located in the northeast corner of the state, near the Nebraska border. It is the county seat of Yuma County and has a population of just over 3,000 people. The town was founded in 1887 and has a rich history of agriculture, ranching, and small business.
Geography
Yuma is located in the northeast corner of Colorado, near the Nebraska border. It is situated in the High Plains region of the state, and is surrounded by rolling hills and prairies. The town is located at an elevation of 4,000 feet, and the surrounding area is mostly flat. The climate is semi-arid, with hot summers and cold winters. The average annual precipitation is just over 16 inches.
Economy
Yuma’s economy is largely based on agriculture and ranching. The town is home to several large farms and ranches, and the surrounding area is known for its production of wheat, corn, and other grains. The town also has a small manufacturing sector, with several small businesses producing a variety of products.
The town is also home to a number of small businesses, including restaurants, retail stores, and service providers. The town is also home to a number of government offices, including the Yuma County Courthouse and the Yuma County Sheriff’s Office.
Demographics
As of the 2010 census, Yuma had a population of 3,077 people. The racial makeup of the town was 94.3% White, 0.3% African American, 0.7% Native American, 0.2% Asian, 0.1% Pacific Islander, 2.7% from other races, and 1.9% from two or more races. Hispanic or Latino of any race were 6.2% of the population.
The median income for a household in Yuma was $37,917, and the median income for a family was $45,938. The per capita income for the town was $18,945. About 11.2% of families and 14.2% of the population were below the poverty line, including 18.2% of those under age 18 and 8.2% of those age 65 or over.
Yuma is a small town with a rich history and a strong sense of community. The town is home to a diverse population, and the economy is largely based on agriculture and ranching. The town is also home to a number of small businesses, government offices, and other services. Yuma is a great place to live and work, and is a great example of the rural lifestyle in Colorado.
Common Questions
What is Per Capita Income in Yuma?
Per Capita income in Yuma is $22,434.
What is the Median Family Income in Yuma?
Median Family Income in Yuma is $37,408.
What is the Median Household income in Yuma?
Median Household Income in Yuma is $46,314.
What is Income or Wage Gap in Yuma?
Income or Wage Gap in Yuma is 27.3%.
Women in Yuma earn 72.7 cents for every dollar earned by a man.
What is Inequality or Gini Index in Yuma?
Inequality or Gini Index in Yuma is 0.43.
What is the Total Population of Yuma?
Total Population of Yuma is 3,443.
What is the Total Male Population of Yuma?
Total Male Population of Yuma is 1,761.
What is the Total Female Population of Yuma?
Total Female Population of Yuma is 1,682.
What is the Ratio of Males per 100 Females in Yuma?
There are 104.70 Males per 100 Females in Yuma.
What is the Ratio of Females per 100 Males in Yuma?
There are 95.51 Females per 100 Males in Yuma.
What is the Median Population Age in Yuma?
Median Population Age in Yuma is 31.9 Years.
What is the Average Family Size in Yuma
Average Family Size in Yuma is 2.7 People.
What is the Average Household Size in Yuma
Average Household Size in Yuma is 2.6 People.
How Large is the Labor Force in Yuma?
There are 1,789 People in the Labor Forcein in Yuma.
What is the Percentage of People in the Labor Force in Yuma?
73.7% of People are in the Labor Force in Yuma.
What is the Unemployment Rate in Yuma?
Unemployment Rate in Yuma is 9.3%.