Eldora, CO Map & Demographics
Eldora Map
Eldora Overview
$23,284
PER CAPITA INCOME
0.27
INEQUALITY / GINI INDEX
381
TOTAL POPULATION
357
MALE POPULATION
24
FEMALE POPULATION
1,487.50
MALES / 100 FEMALES
6.72
FEMALES / 100 MALES
32.6
MEDIAN AGE
1.9
AVG FAMILY SIZE
1.5
AVG HOUSEHOLD SIZE
357
LABOR FORCE [ PEOPLE ]
93.7%
PERCENT IN LABOR FORCE
Income in Eldora
Income Overview in Eldora
| Characteristic | Number | Measure |
| Per Capita Income | 381 | $23,284 |
| Median Family Income | 11 | $0 |
| Mean Family Income | 11 | $0 |
| Median Household Income | 251 | $0 |
| Mean Household Income | 251 | $35,847 |
| Income Deficit | 11 | $0 |
| Wage / Income Gap (%) | 381 | 0.00% |
| Wage / Income Gap ($) | 381 | 100.00¢ per $1 |
| Gini / Inequality Index | 381 | 0.27 |
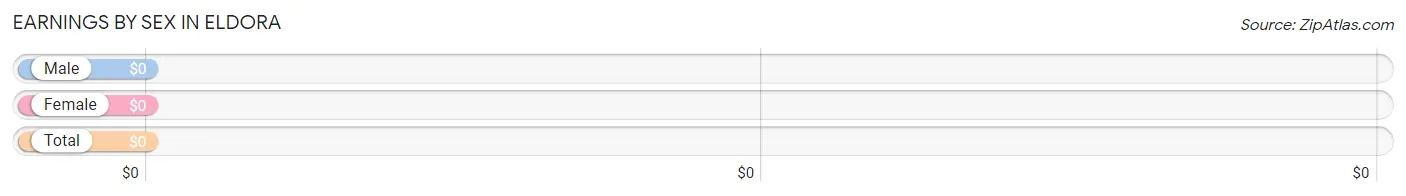
Earnings by Sex in Eldora
| Sex | Number | Average Earnings |
| Male | 357 (97.3%) | $0 |
| Female | 10 (2.7%) | $0 |
| Total | 367 (100.0%) | $0 |
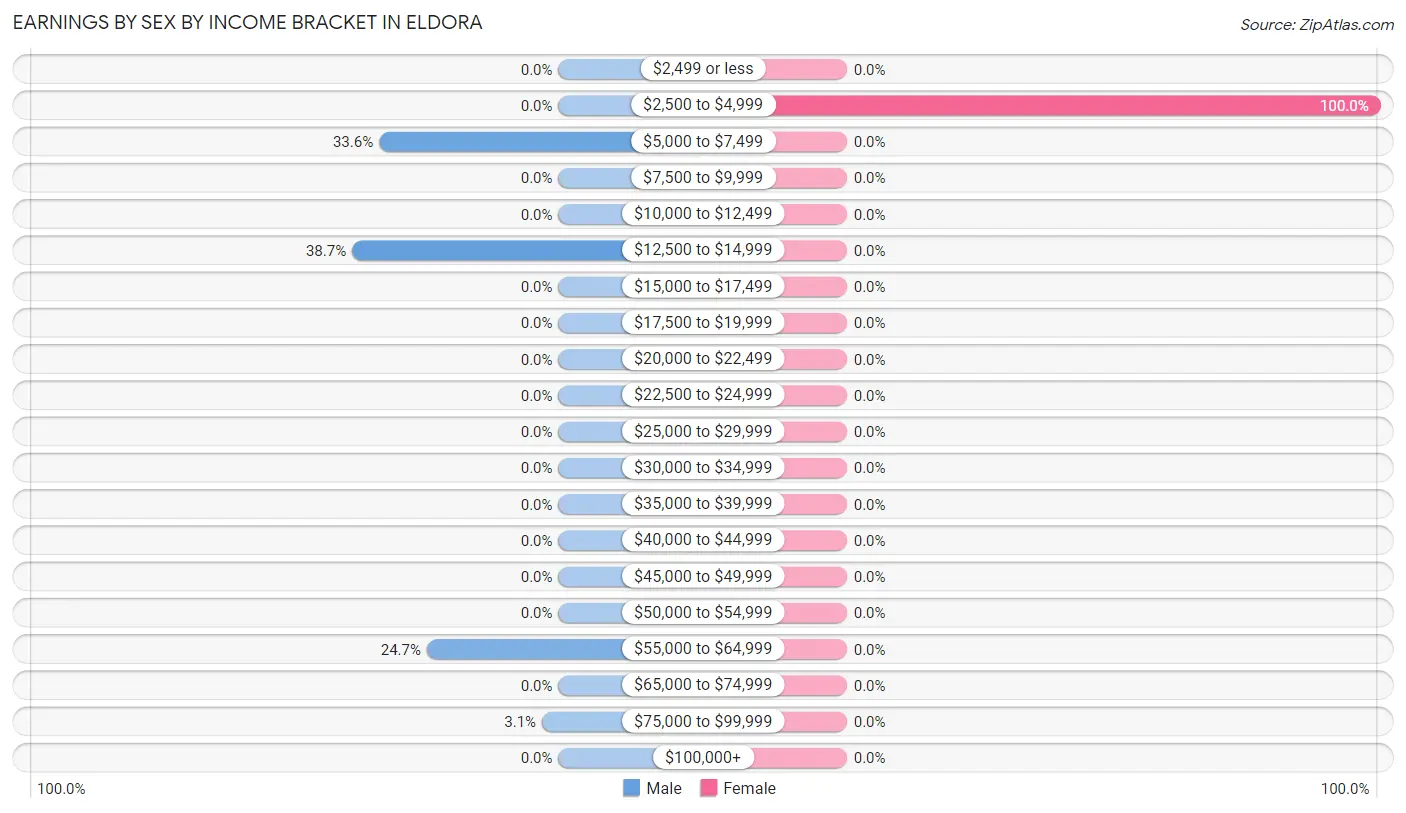
Earnings by Sex by Income Bracket in Eldora
The most common earnings brackets in Eldora are $12,500 to $14,999 for men (138 | 38.7%) and $2,500 to $4,999 for women (10 | 100.0%).
| Income | Male | Female |
| $2,499 or less | 0 (0.0%) | 0 (0.0%) |
| $2,500 to $4,999 | 0 (0.0%) | 10 (100.0%) |
| $5,000 to $7,499 | 120 (33.6%) | 0 (0.0%) |
| $7,500 to $9,999 | 0 (0.0%) | 0 (0.0%) |
| $10,000 to $12,499 | 0 (0.0%) | 0 (0.0%) |
| $12,500 to $14,999 | 138 (38.7%) | 0 (0.0%) |
| $15,000 to $17,499 | 0 (0.0%) | 0 (0.0%) |
| $17,500 to $19,999 | 0 (0.0%) | 0 (0.0%) |
| $20,000 to $22,499 | 0 (0.0%) | 0 (0.0%) |
| $22,500 to $24,999 | 0 (0.0%) | 0 (0.0%) |
| $25,000 to $29,999 | 0 (0.0%) | 0 (0.0%) |
| $30,000 to $34,999 | 0 (0.0%) | 0 (0.0%) |
| $35,000 to $39,999 | 0 (0.0%) | 0 (0.0%) |
| $40,000 to $44,999 | 0 (0.0%) | 0 (0.0%) |
| $45,000 to $49,999 | 0 (0.0%) | 0 (0.0%) |
| $50,000 to $54,999 | 0 (0.0%) | 0 (0.0%) |
| $55,000 to $64,999 | 88 (24.6%) | 0 (0.0%) |
| $65,000 to $74,999 | 0 (0.0%) | 0 (0.0%) |
| $75,000 to $99,999 | 11 (3.1%) | 0 (0.0%) |
| $100,000+ | 0 (0.0%) | 0 (0.0%) |
| Total | 357 (100.0%) | 10 (100.0%) |
Earnings by Sex by Educational Attainment in Eldora
| Educational Attainment | Male Income | Female Income |
| Less than High School | - | - |
| High School Diploma | - | - |
| College or Associate's Degree | - | - |
| Bachelor's Degree | - | - |
| Graduate Degree | - | - |
| Total | - | - |
Family Income in Eldora
Family Income Brackets in Eldora
According to the Eldora family income data, there are 11 families falling into the $75,000 to $99,999 income range, which is the most common income bracket and makes up 100.0% of all families.
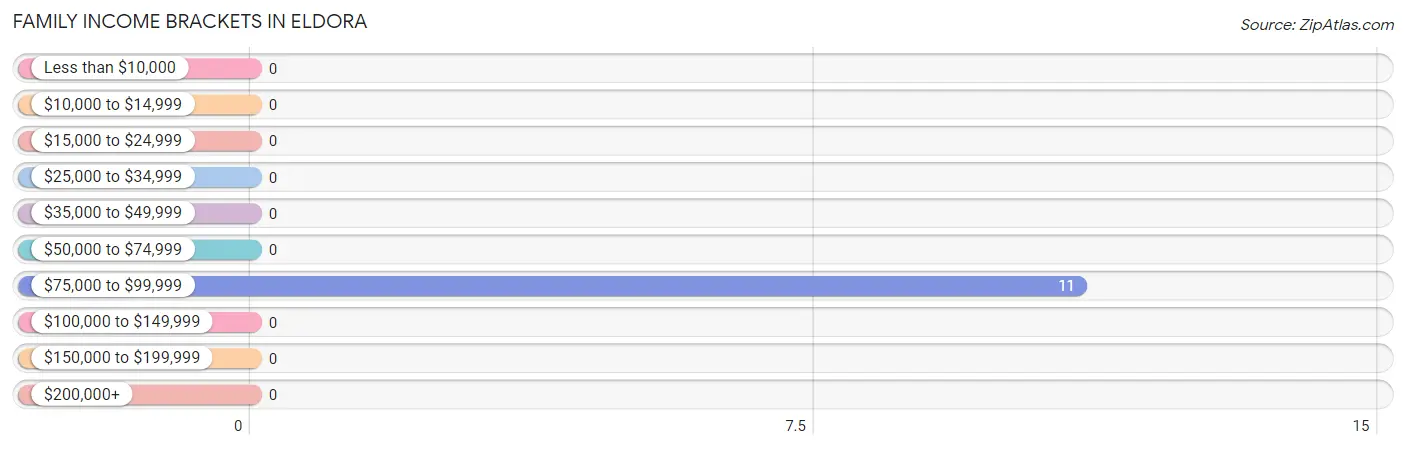
| Income Bracket | # Families | % Families |
| Less than $10,000 | 0 | 0.0% |
| $10,000 to $14,999 | 0 | 0.0% |
| $15,000 to $24,999 | 0 | 0.0% |
| $25,000 to $34,999 | 0 | 0.0% |
| $35,000 to $49,999 | 0 | 0.0% |
| $50,000 to $74,999 | 0 | 0.0% |
| $75,000 to $99,999 | 11 | 100.0% |
| $100,000 to $149,999 | 0 | 0.0% |
| $150,000 to $199,999 | 0 | 0.0% |
| $200,000+ | 0 | 0.0% |
Family Income by Famaliy Size in Eldora
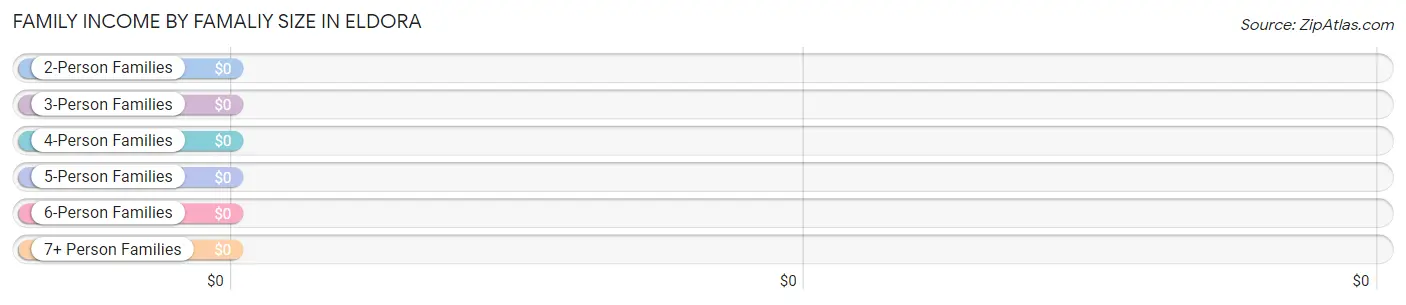
| Income Bracket | # Families | Median Income |
| 2-Person Families | 11 (100.0%) | $0 |
| 3-Person Families | 0 (0.0%) | $0 |
| 4-Person Families | 0 (0.0%) | $0 |
| 5-Person Families | 0 (0.0%) | $0 |
| 6-Person Families | 0 (0.0%) | $0 |
| 7+ Person Families | 0 (0.0%) | $0 |
| Total | 11 (100.0%) | $0 |
Family Income by Number of Earners in Eldora
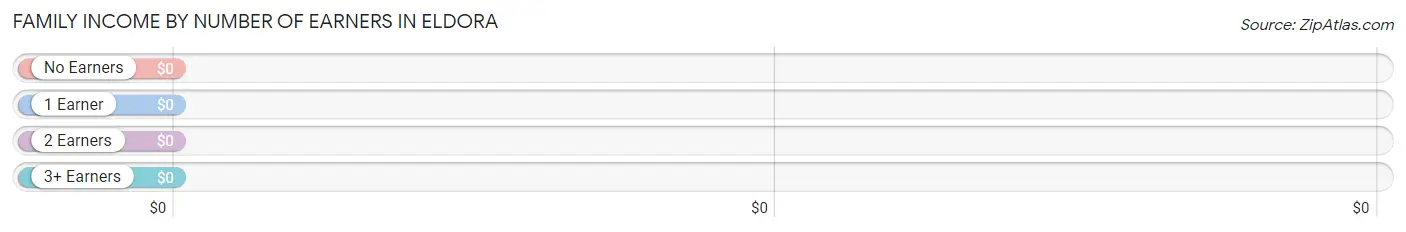
| Number of Earners | # Families | Median Income |
| No Earners | 0 (0.0%) | $0 |
| 1 Earner | 0 (0.0%) | $0 |
| 2 Earners | 11 (100.0%) | $0 |
| 3+ Earners | 0 (0.0%) | $0 |
| Total | 11 (100.0%) | $0 |
Household Income in Eldora
Household Income Brackets in Eldora
With 152 households falling in the category, the $15,000 to $24,999 income range is the most frequent in Eldora, accounting for 60.6% of all households.
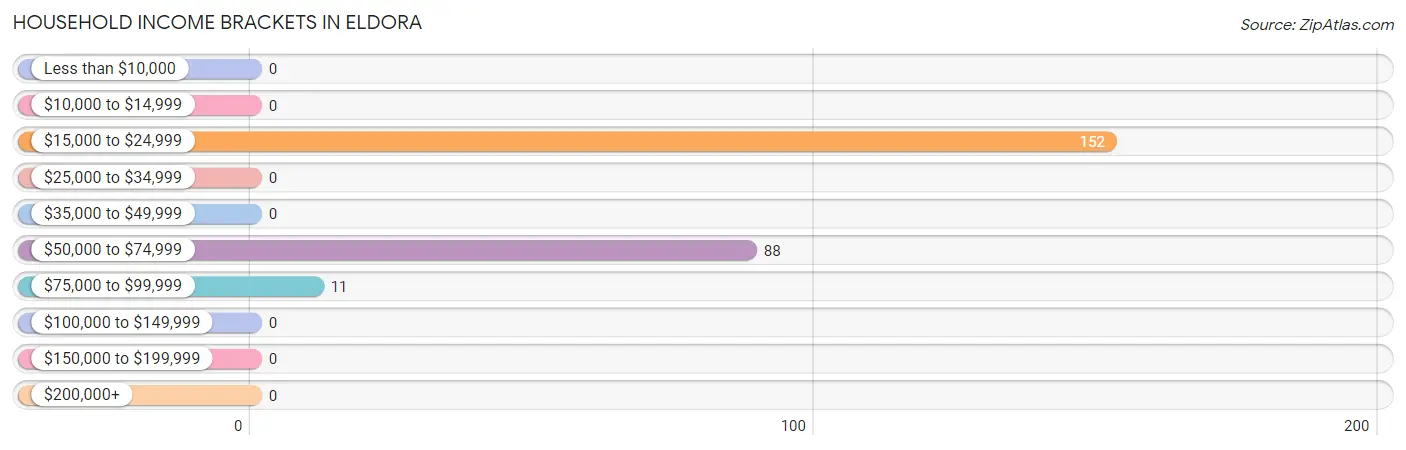
| Income Bracket | # Households | % Households |
| Less than $10,000 | 0 | 0.0% |
| $10,000 to $14,999 | 0 | 0.0% |
| $15,000 to $24,999 | 152 | 60.6% |
| $25,000 to $34,999 | 0 | 0.0% |
| $35,000 to $49,999 | 0 | 0.0% |
| $50,000 to $74,999 | 88 | 35.1% |
| $75,000 to $99,999 | 11 | 4.4% |
| $100,000 to $149,999 | 0 | 0.0% |
| $150,000 to $199,999 | 0 | 0.0% |
| $200,000+ | 0 | 0.0% |
Household Income by Householder Age in Eldora
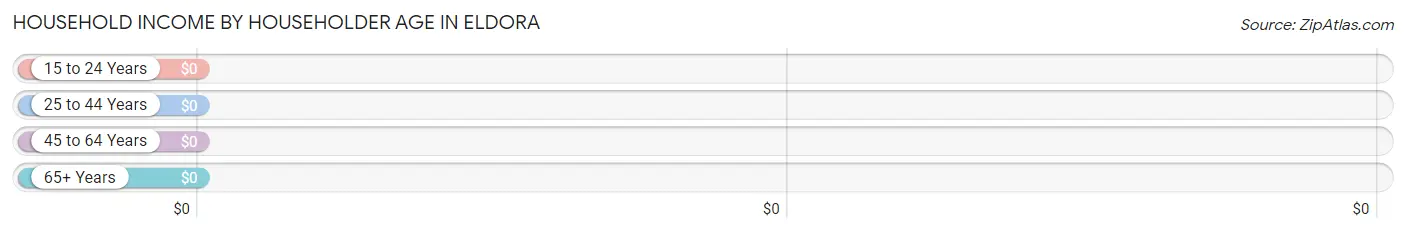
| Income Bracket | # Households | Median Income |
| 15 to 24 Years | 138 (55.0%) | $0 |
| 25 to 44 Years | 88 (35.1%) | $0 |
| 45 to 64 Years | 11 (4.4%) | $0 |
| 65+ Years | 14 (5.6%) | $0 |
| Total | 251 (100.0%) | $0 |
Poverty in Eldora
Income Below Poverty by Sex and Age in Eldora
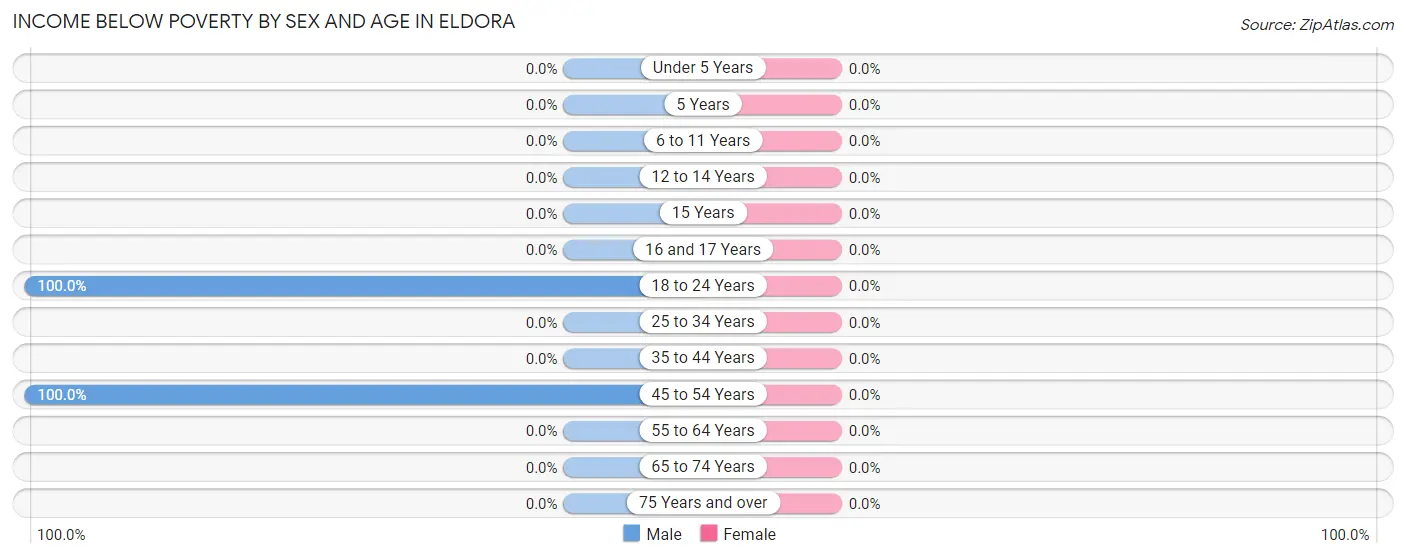
| Age Bracket | Male | Female |
| Under 5 Years | 0 (0.0%) | 0 (0.0%) |
| 5 Years | 0 (0.0%) | 0 (0.0%) |
| 6 to 11 Years | 0 (0.0%) | 0 (0.0%) |
| 12 to 14 Years | 0 (0.0%) | 0 (0.0%) |
| 15 Years | 0 (0.0%) | 0 (0.0%) |
| 16 and 17 Years | 0 (0.0%) | 0 (0.0%) |
| 18 to 24 Years | 138 (100.0%) | 0 (0.0%) |
| 25 to 34 Years | 0 (0.0%) | 0 (0.0%) |
| 35 to 44 Years | 0 (0.0%) | 0 (0.0%) |
| 45 to 54 Years | 120 (100.0%) | 0 (0.0%) |
| 55 to 64 Years | 0 (0.0%) | 0 (0.0%) |
| 65 to 74 Years | 0 (0.0%) | 0 (0.0%) |
| 75 Years and over | 0 (0.0%) | 0 (0.0%) |
| Total | 258 (72.3%) | 0 (0.0%) |
Income Above Poverty by Sex and Age in Eldora
According to the poverty statistics in Eldora, males aged 25 to 34 years and females aged 55 to 64 years are the age groups that are most secure financially, with 100.0% of males and 100.0% of females in these age groups living above the poverty line.
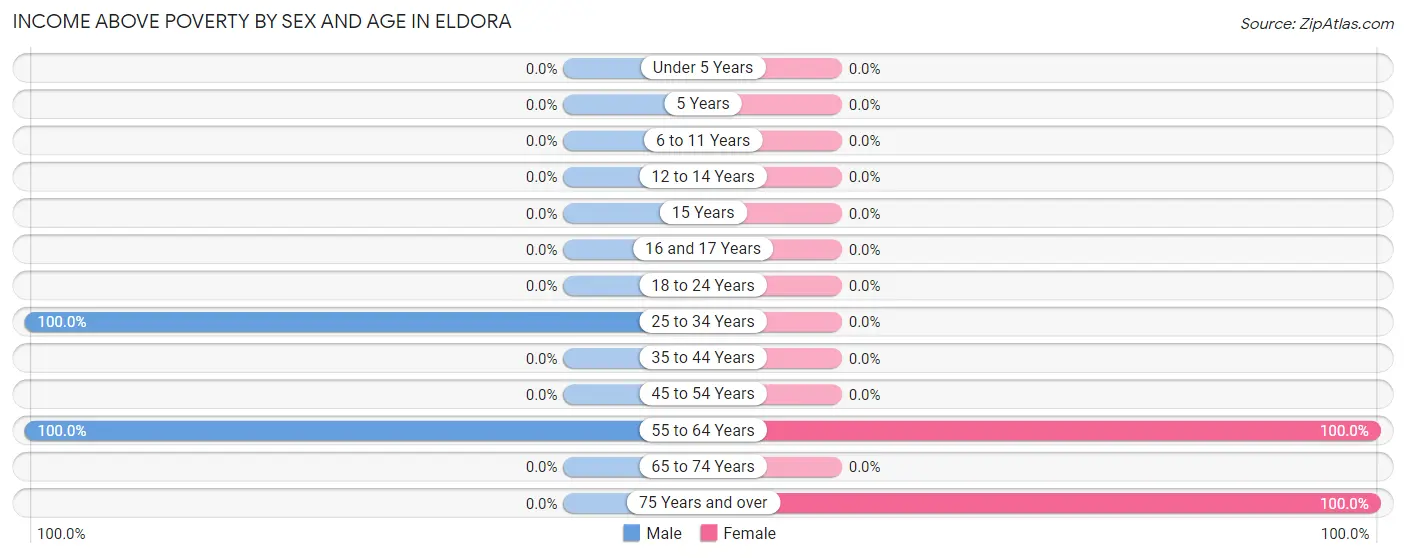
| Age Bracket | Male | Female |
| Under 5 Years | 0 (0.0%) | 0 (0.0%) |
| 5 Years | 0 (0.0%) | 0 (0.0%) |
| 6 to 11 Years | 0 (0.0%) | 0 (0.0%) |
| 12 to 14 Years | 0 (0.0%) | 0 (0.0%) |
| 15 Years | 0 (0.0%) | 0 (0.0%) |
| 16 and 17 Years | 0 (0.0%) | 0 (0.0%) |
| 18 to 24 Years | 0 (0.0%) | 0 (0.0%) |
| 25 to 34 Years | 88 (100.0%) | 0 (0.0%) |
| 35 to 44 Years | 0 (0.0%) | 0 (0.0%) |
| 45 to 54 Years | 0 (0.0%) | 0 (0.0%) |
| 55 to 64 Years | 11 (100.0%) | 10 (100.0%) |
| 65 to 74 Years | 0 (0.0%) | 0 (0.0%) |
| 75 Years and over | 0 (0.0%) | 14 (100.0%) |
| Total | 99 (27.7%) | 24 (100.0%) |
Income Below Poverty Among Married-Couple Families in Eldora
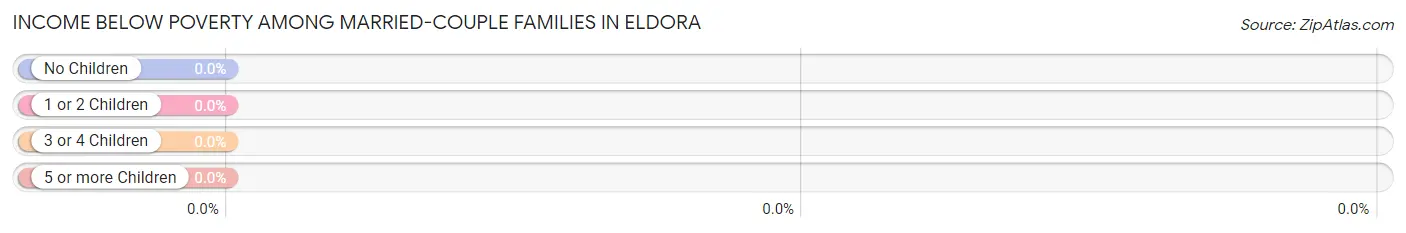
| Children | Above Poverty | Below Poverty |
| No Children | 11 (100.0%) | 0 (0.0%) |
| 1 or 2 Children | 0 (0.0%) | 0 (0.0%) |
| 3 or 4 Children | 0 (0.0%) | 0 (0.0%) |
| 5 or more Children | 0 (0.0%) | 0 (0.0%) |
| Total | 11 (100.0%) | 0 (0.0%) |
Income Below Poverty Among Single-Parent Households in Eldora
| Children | Single Father | Single Mother |
| No Children | 0 (0.0%) | 0 (0.0%) |
| 1 or 2 Children | 0 (0.0%) | 0 (0.0%) |
| 3 or 4 Children | 0 (0.0%) | 0 (0.0%) |
| 5 or more Children | 0 (0.0%) | 0 (0.0%) |
| Total | 0 (0.0%) | 0 (0.0%) |
Income Below Poverty Among Married-Couple vs Single-Parent Households in Eldora
| Children | Married-Couple Families | Single-Parent Households |
| No Children | 0 (0.0%) | 0 (0.0%) |
| 1 or 2 Children | 0 (0.0%) | 0 (0.0%) |
| 3 or 4 Children | 0 (0.0%) | 0 (0.0%) |
| 5 or more Children | 0 (0.0%) | 0 (0.0%) |
| Total | 0 (0.0%) | 0 (0.0%) |
Race in Eldora
The most populous races in Eldora are White / Caucasian (381 | 100.0%), and Hispanic or Latino (88 | 23.1%).
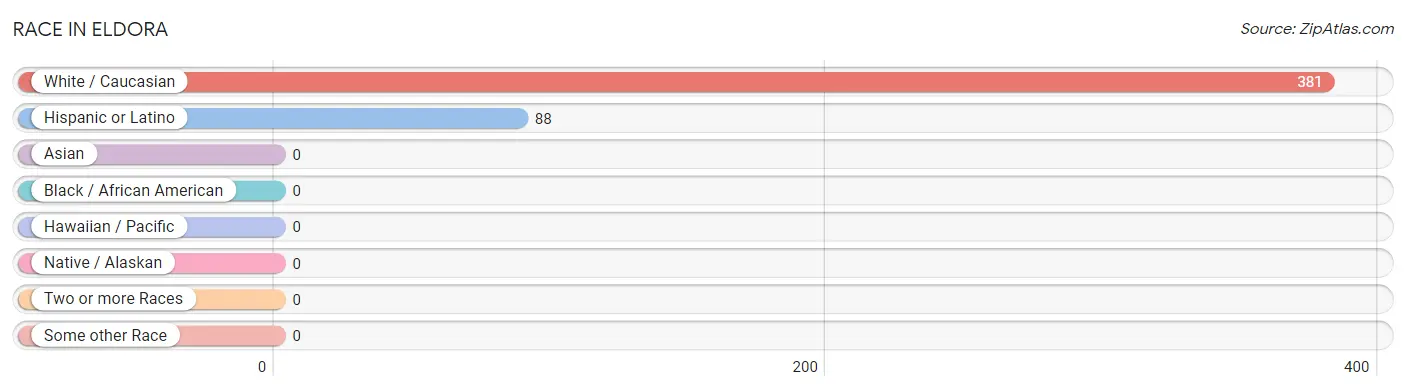
| Race | # Population | % Population |
| Asian | 0 | 0.0% |
| Black / African American | 0 | 0.0% |
| Hawaiian / Pacific | 0 | 0.0% |
| Hispanic or Latino | 88 | 23.1% |
| Native / Alaskan | 0 | 0.0% |
| White / Caucasian | 381 | 100.0% |
| Two or more Races | 0 | 0.0% |
| Some other Race | 0 | 0.0% |
| Total | 381 | 100.0% |
Ancestry in Eldora
The most populous ancestries reported in Eldora are Irish (226 | 59.3%), Norwegian (120 | 31.5%), Central American (88 | 23.1%), Panamanian (88 | 23.1%), and English (14 | 3.7%), together accounting for 140.7% of all Eldora residents.
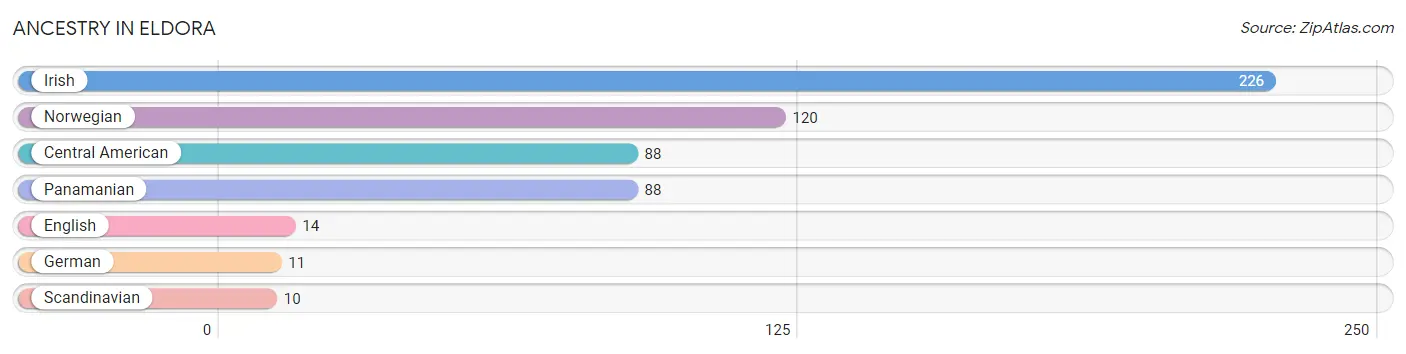
| Ancestry | # Population | % Population |
| Central American | 88 | 23.1% |
| English | 14 | 3.7% |
| German | 11 | 2.9% |
| Irish | 226 | 59.3% |
| Norwegian | 120 | 31.5% |
| Panamanian | 88 | 23.1% |
| Scandinavian | 10 | 2.6% | View All 7 Rows |
Immigrants in Eldora

| Immigration Origin | # Population | % Population | View All 0 Rows |
Sex and Age in Eldora
Sex and Age in Eldora
The most populous age groups in Eldora are 20 to 24 Years (138 | 38.7%) for men and 80 to 84 Years (14 | 58.3%) for women.
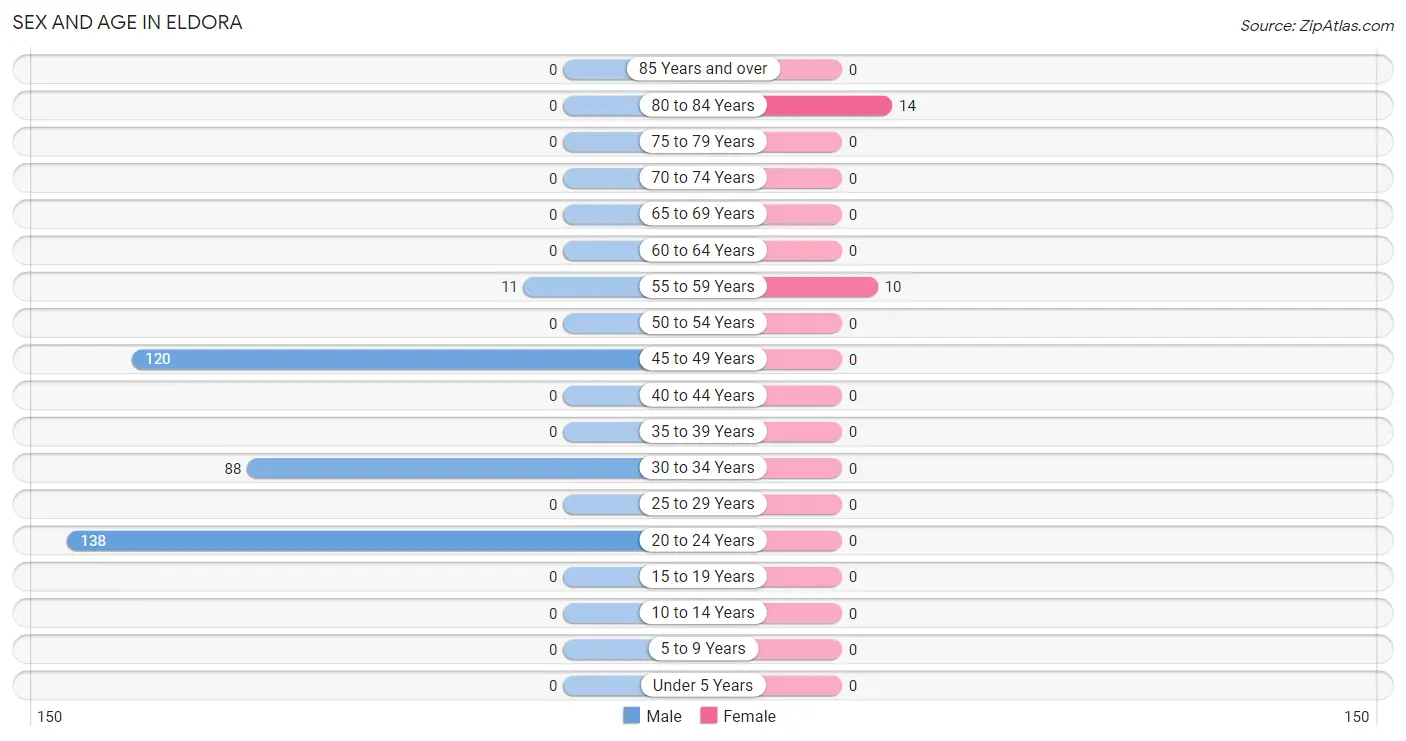
| Age Bracket | Male | Female |
| Under 5 Years | 0 (0.0%) | 0 (0.0%) |
| 5 to 9 Years | 0 (0.0%) | 0 (0.0%) |
| 10 to 14 Years | 0 (0.0%) | 0 (0.0%) |
| 15 to 19 Years | 0 (0.0%) | 0 (0.0%) |
| 20 to 24 Years | 138 (38.7%) | 0 (0.0%) |
| 25 to 29 Years | 0 (0.0%) | 0 (0.0%) |
| 30 to 34 Years | 88 (24.6%) | 0 (0.0%) |
| 35 to 39 Years | 0 (0.0%) | 0 (0.0%) |
| 40 to 44 Years | 0 (0.0%) | 0 (0.0%) |
| 45 to 49 Years | 120 (33.6%) | 0 (0.0%) |
| 50 to 54 Years | 0 (0.0%) | 0 (0.0%) |
| 55 to 59 Years | 11 (3.1%) | 10 (41.7%) |
| 60 to 64 Years | 0 (0.0%) | 0 (0.0%) |
| 65 to 69 Years | 0 (0.0%) | 0 (0.0%) |
| 70 to 74 Years | 0 (0.0%) | 0 (0.0%) |
| 75 to 79 Years | 0 (0.0%) | 0 (0.0%) |
| 80 to 84 Years | 0 (0.0%) | 14 (58.3%) |
| 85 Years and over | 0 (0.0%) | 0 (0.0%) |
| Total | 357 (100.0%) | 24 (100.0%) |
Families and Households in Eldora
Median Family Size in Eldora
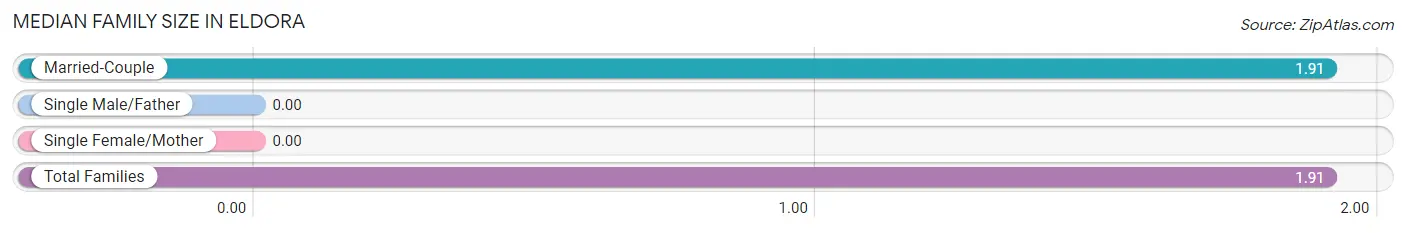
| Family Type | # Families | Family Size |
| Married-Couple | 11 (100.0%) | 1.91 |
| Single Male/Father | 0 (0.0%) | - |
| Single Female/Mother | 0 (0.0%) | - |
| Total Families | 11 (100.0%) | 1.91 |
Median Household Size in Eldora
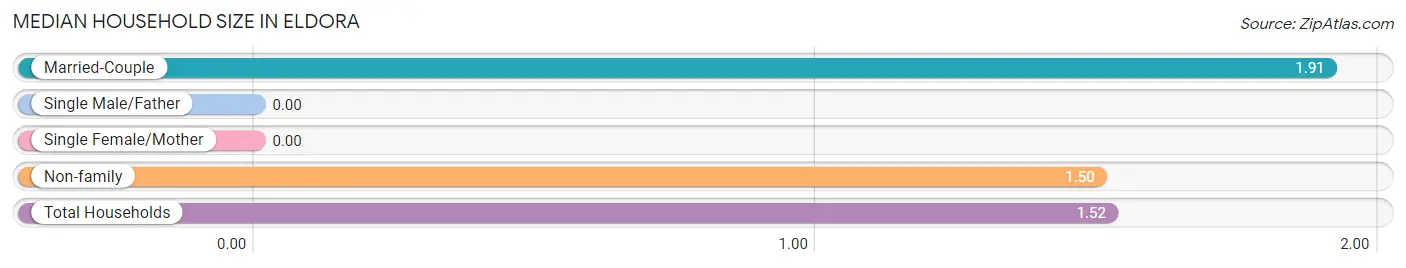
| Household Type | # Households | Household Size |
| Married-Couple | 11 (4.4%) | 1.91 |
| Single Male/Father | 0 (0.0%) | - |
| Single Female/Mother | 0 (0.0%) | - |
| Non-family | 240 (95.6%) | 1.50 |
| Total Households | 251 (100.0%) | 1.52 |
Household Size by Marriage Status in Eldora
Out of a total of 251 households in Eldora, 11 (4.4%) are family households, while 240 (95.6%) are nonfamily households. The most numerous type of family households are 2-person households, comprising 11, and the most common type of nonfamily households are 2-person households, comprising 138.
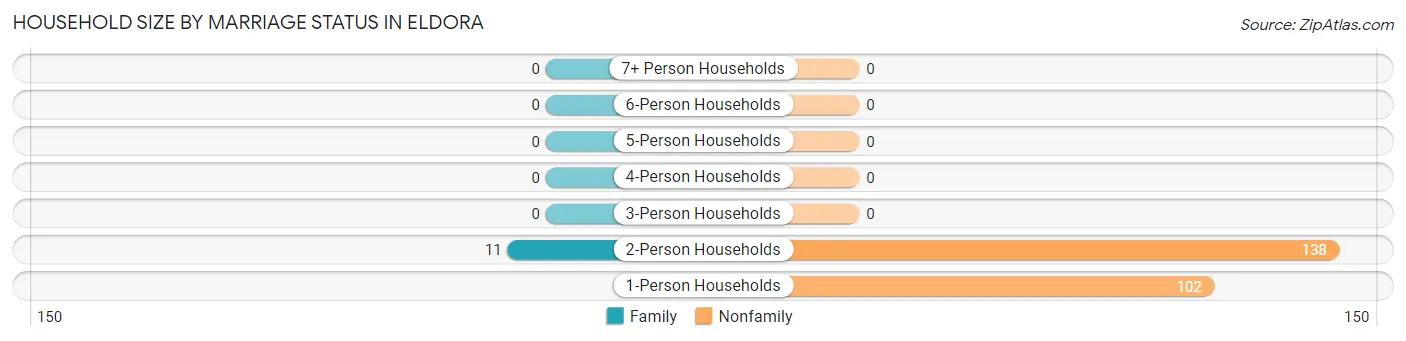
| Household Size | Family Households | Nonfamily Households |
| 1-Person Households | - | 102 (40.6%) |
| 2-Person Households | 11 (4.4%) | 138 (55.0%) |
| 3-Person Households | 0 (0.0%) | 0 (0.0%) |
| 4-Person Households | 0 (0.0%) | 0 (0.0%) |
| 5-Person Households | 0 (0.0%) | 0 (0.0%) |
| 6-Person Households | 0 (0.0%) | 0 (0.0%) |
| 7+ Person Households | 0 (0.0%) | 0 (0.0%) |
| Total | 11 (4.4%) | 240 (95.6%) |
Female Fertility in Eldora
Fertility by Age in Eldora
| Age Bracket | Women with Births | Births / 1,000 Women |
| 15 to 19 years | 0 (0.0%) | 0.0 |
| 20 to 34 years | 0 (0.0%) | 0.0 |
| 35 to 50 years | 0 (0.0%) | 0.0 |
| Total | 0 (0.0%) | 0.0 |
Fertility by Age by Marriage Status in Eldora
| Age Bracket | Married | Unmarried |
| 15 to 19 years | 0 (0.0%) | 0 (0.0%) |
| 20 to 34 years | 0 (0.0%) | 0 (0.0%) |
| 35 to 50 years | 0 (0.0%) | 0 (0.0%) |
| Total | 0 (0.0%) | 0 (0.0%) |
Fertility by Education in Eldora
| Educational Attainment | Women with Births | Births / 1,000 Women |
| Less than High School | 0 (0.0%) | 0.0 |
| High School Diploma | 0 (0.0%) | 0.0 |
| College or Associate's Degree | 0 (0.0%) | 0.0 |
| Bachelor's Degree | 0 (0.0%) | 0.0 |
| Graduate Degree | 0 (0.0%) | 0.0 |
| Total | 0 (0.0%) | 0.0 |
Fertility by Education by Marriage Status in Eldora
| Educational Attainment | Married | Unmarried |
| Less than High School | 0 (0.0%) | 0 (0.0%) |
| High School Diploma | 0 (0.0%) | 0 (0.0%) |
| College or Associate's Degree | 0 (0.0%) | 0 (0.0%) |
| Bachelor's Degree | 0 (0.0%) | 0 (0.0%) |
| Graduate Degree | 0 (0.0%) | 0 (0.0%) |
| Total | 0 (0.0%) | 0 (0.0%) |
Employment Characteristics in Eldora
Employment by Class of Employer in Eldora
Among the 357 employed individuals in Eldora, private company employees (269 | 75.3%), and federal government employees (88 | 24.6%) make up the most common classes of employment.
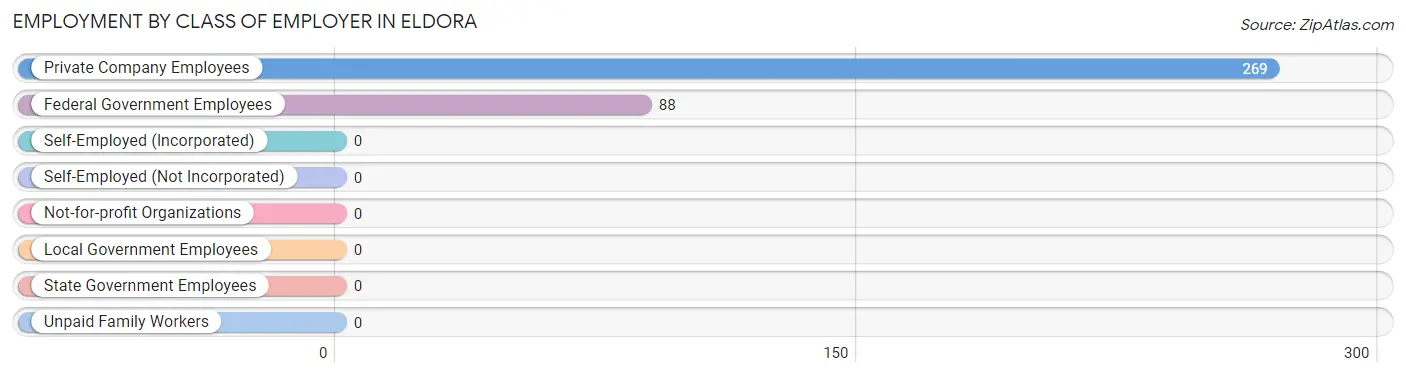
| Employer Class | # Employees | % Employees |
| Private Company Employees | 269 | 75.3% |
| Self-Employed (Incorporated) | 0 | 0.0% |
| Self-Employed (Not Incorporated) | 0 | 0.0% |
| Not-for-profit Organizations | 0 | 0.0% |
| Local Government Employees | 0 | 0.0% |
| State Government Employees | 0 | 0.0% |
| Federal Government Employees | 88 | 24.6% |
| Unpaid Family Workers | 0 | 0.0% |
| Total | 357 | 100.0% |
Employment Status by Age in Eldora
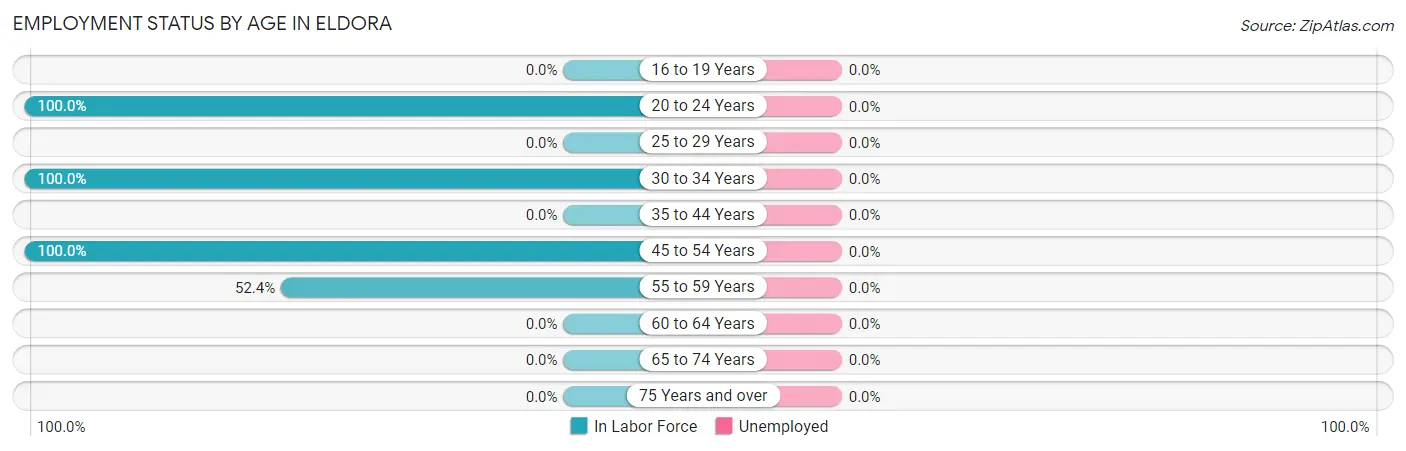
| Age Bracket | In Labor Force | Unemployed |
| 16 to 19 Years | 0 (0.0%) | 0 (0.0%) |
| 20 to 24 Years | 138 (100.0%) | 0 (0.0%) |
| 25 to 29 Years | 0 (0.0%) | 0 (0.0%) |
| 30 to 34 Years | 88 (100.0%) | 0 (0.0%) |
| 35 to 44 Years | 0 (0.0%) | 0 (0.0%) |
| 45 to 54 Years | 120 (100.0%) | 0 (0.0%) |
| 55 to 59 Years | 11 (52.4%) | 0 (0.0%) |
| 60 to 64 Years | 0 (0.0%) | 0 (0.0%) |
| 65 to 74 Years | 0 (0.0%) | 0 (0.0%) |
| 75 Years and over | 0 (0.0%) | 0 (0.0%) |
| Total | 357 (93.7%) | 0 (0.0%) |
Employment Status by Educational Attainment in Eldora
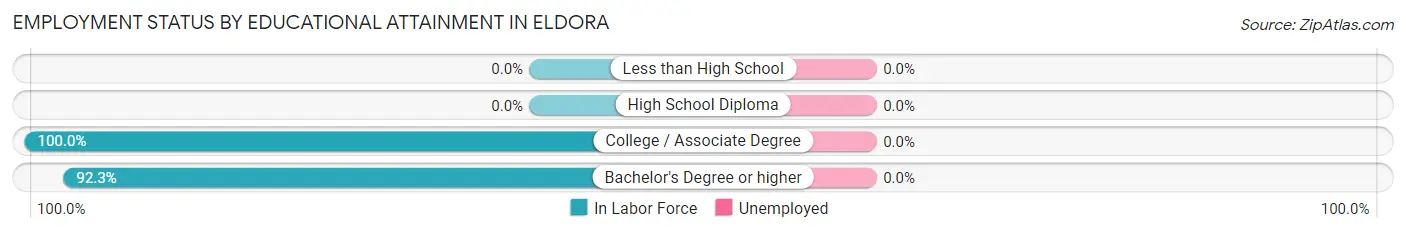
| Educational Attainment | In Labor Force | Unemployed |
| Less than High School | 0 (0.0%) | 0 (0.0%) |
| High School Diploma | 0 (0.0%) | 0 (0.0%) |
| College / Associate Degree | 99 (100.0%) | 0 (0.0%) |
| Bachelor's Degree or higher | 120 (92.3%) | 0 (0.0%) |
| Total | 219 (95.6%) | 0 (0.0%) |
Employment Occupations by Sex in Eldora
Management, Business, Science and Arts Occupations
The most common Management, Business, Science and Arts occupations in Eldora are , and Management (11 | 3.1%).
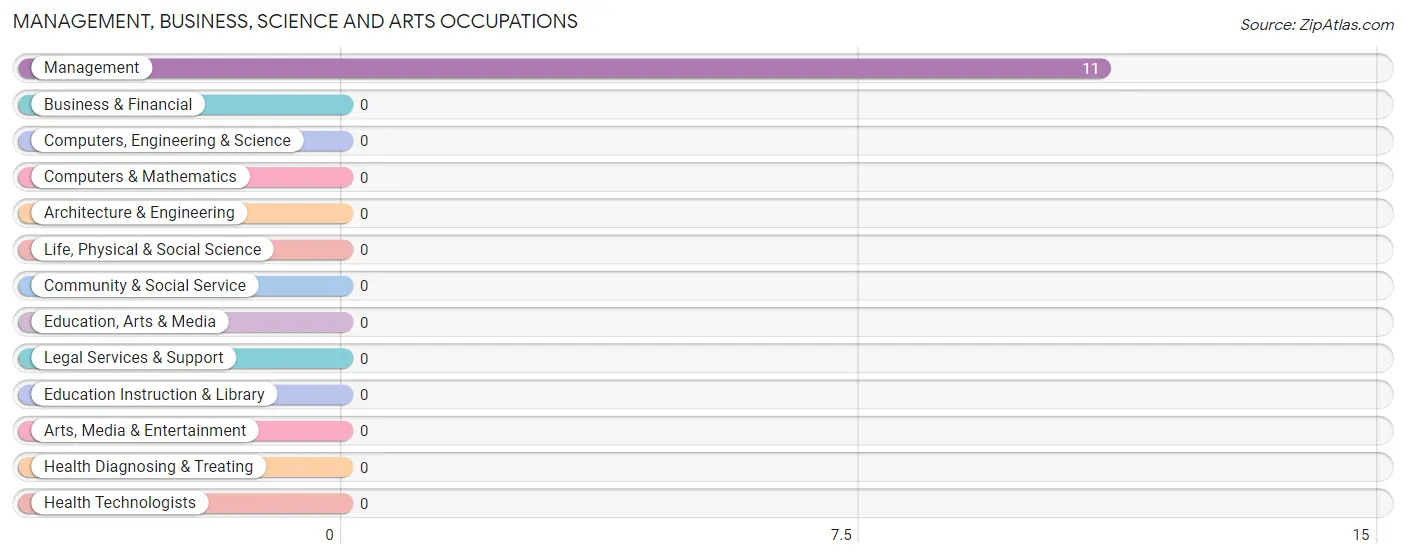
Management, Business, Science and Arts Occupations by Sex
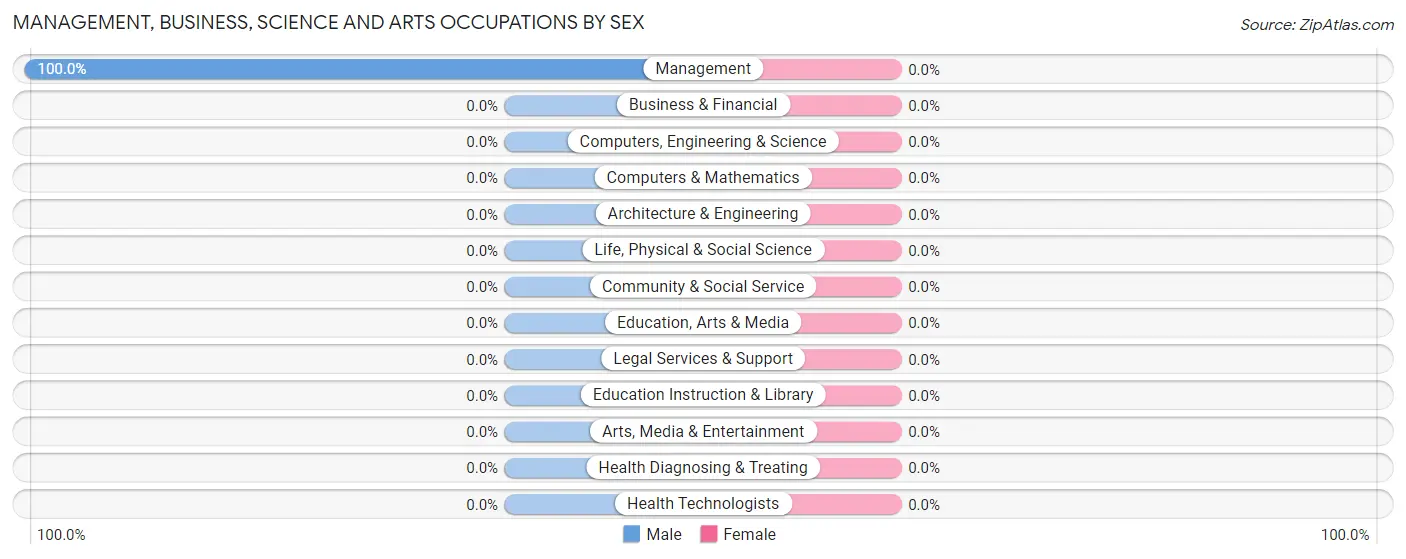
| Occupation | Male | Female |
| Management | 11 (100.0%) | 0 (0.0%) |
| Business & Financial | 0 (0.0%) | 0 (0.0%) |
| Computers, Engineering & Science | 0 (0.0%) | 0 (0.0%) |
| Computers & Mathematics | 0 (0.0%) | 0 (0.0%) |
| Architecture & Engineering | 0 (0.0%) | 0 (0.0%) |
| Life, Physical & Social Science | 0 (0.0%) | 0 (0.0%) |
| Community & Social Service | 0 (0.0%) | 0 (0.0%) |
| Education, Arts & Media | 0 (0.0%) | 0 (0.0%) |
| Legal Services & Support | 0 (0.0%) | 0 (0.0%) |
| Education Instruction & Library | 0 (0.0%) | 0 (0.0%) |
| Arts, Media & Entertainment | 0 (0.0%) | 0 (0.0%) |
| Health Diagnosing & Treating | 0 (0.0%) | 0 (0.0%) |
| Health Technologists | 0 (0.0%) | 0 (0.0%) |
| Total (Category) | 11 (100.0%) | 0 (0.0%) |
| Total (Overall) | 357 (100.0%) | 0 (0.0%) |
Services Occupations
The most common Services occupations in Eldora are Food Preparation & Serving (138 | 38.7%), Security & Protection (88 | 24.6%), and Firefighting & Prevention (88 | 24.6%).
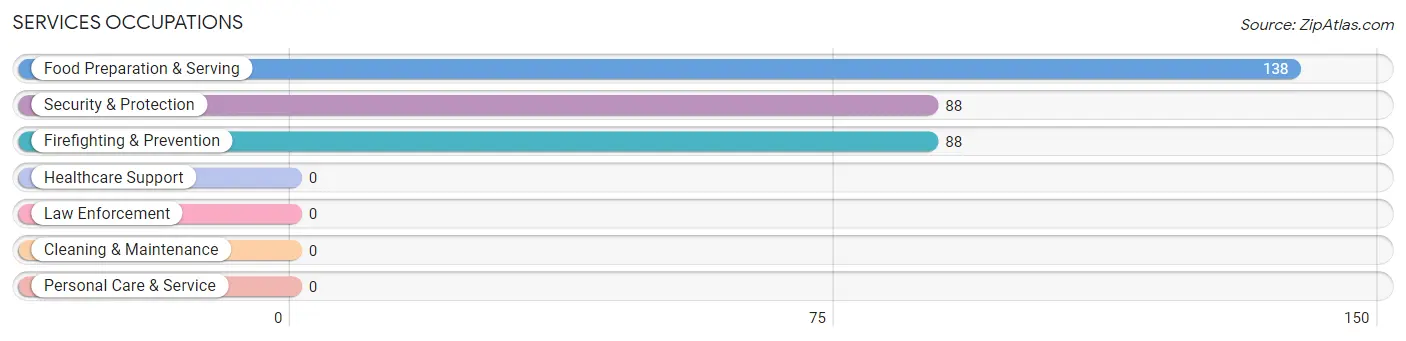
Services Occupations by Sex
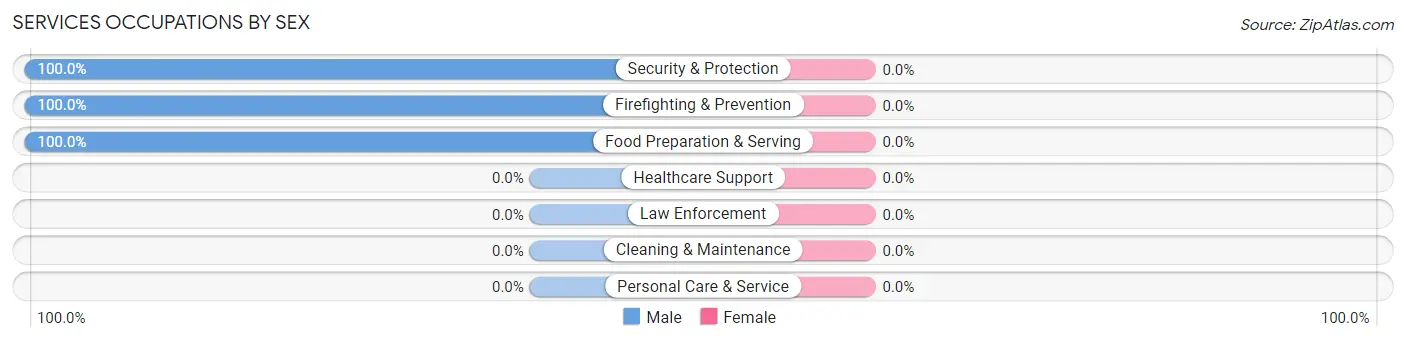
| Occupation | Male | Female |
| Healthcare Support | 0 (0.0%) | 0 (0.0%) |
| Security & Protection | 88 (100.0%) | 0 (0.0%) |
| Firefighting & Prevention | 88 (100.0%) | 0 (0.0%) |
| Law Enforcement | 0 (0.0%) | 0 (0.0%) |
| Food Preparation & Serving | 138 (100.0%) | 0 (0.0%) |
| Cleaning & Maintenance | 0 (0.0%) | 0 (0.0%) |
| Personal Care & Service | 0 (0.0%) | 0 (0.0%) |
| Total (Category) | 226 (100.0%) | 0 (0.0%) |
| Total (Overall) | 357 (100.0%) | 0 (0.0%) |
Sales and Office Occupations

Sales and Office Occupations by Sex

| Occupation | Male | Female |
| Sales & Related | 0 (0.0%) | 0 (0.0%) |
| Office & Administration | 0 (0.0%) | 0 (0.0%) |
| Total (Category) | 0 (0.0%) | 0 (0.0%) |
| Total (Overall) | 357 (100.0%) | 0 (0.0%) |
Natural Resources, Construction and Maintenance Occupations
The most common Natural Resources, Construction and Maintenance occupations in Eldora are , and Construction & Extraction (120 | 33.6%).
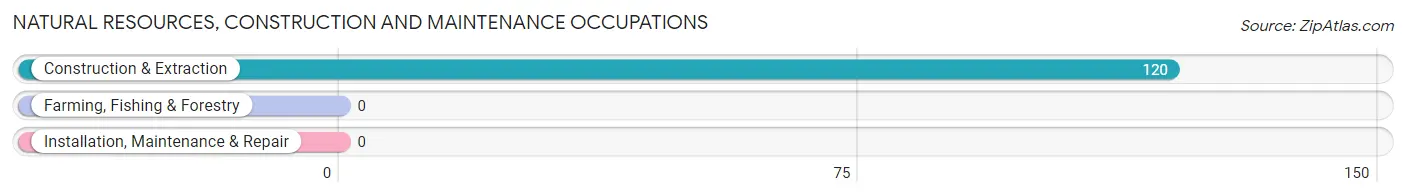
Natural Resources, Construction and Maintenance Occupations by Sex
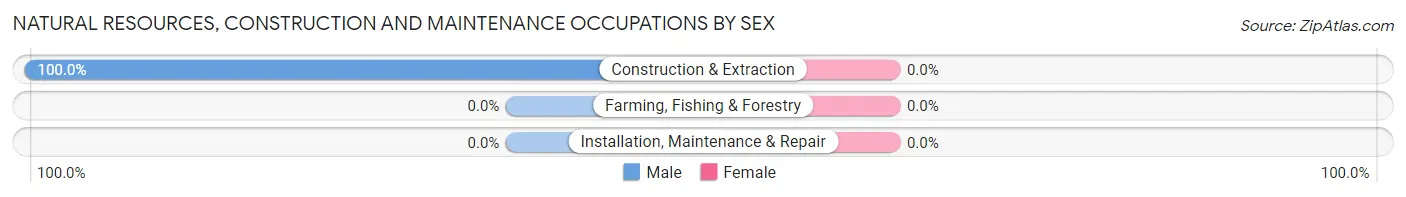
| Occupation | Male | Female |
| Farming, Fishing & Forestry | 0 (0.0%) | 0 (0.0%) |
| Construction & Extraction | 120 (100.0%) | 0 (0.0%) |
| Installation, Maintenance & Repair | 0 (0.0%) | 0 (0.0%) |
| Total (Category) | 120 (100.0%) | 0 (0.0%) |
| Total (Overall) | 357 (100.0%) | 0 (0.0%) |
Production, Transportation and Moving Occupations
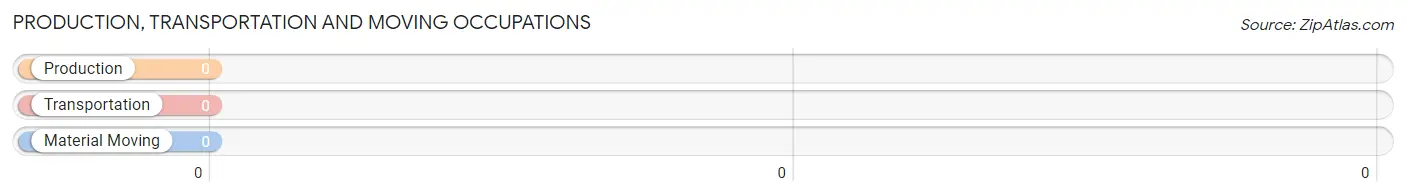
Production, Transportation and Moving Occupations by Sex
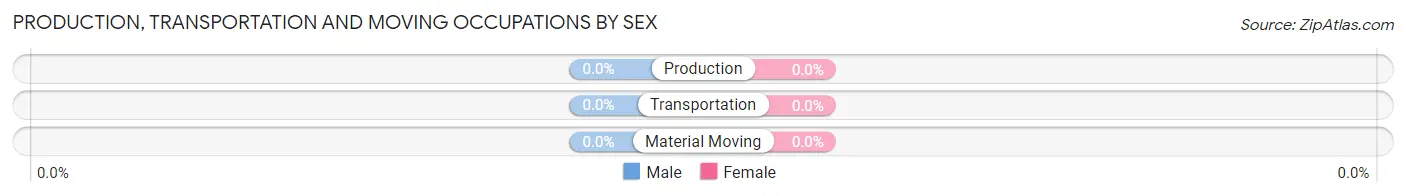
| Occupation | Male | Female |
| Production | 0 (0.0%) | 0 (0.0%) |
| Transportation | 0 (0.0%) | 0 (0.0%) |
| Material Moving | 0 (0.0%) | 0 (0.0%) |
| Total (Category) | 0 (0.0%) | 0 (0.0%) |
| Total (Overall) | 357 (100.0%) | 0 (0.0%) |
Employment Industries by Sex in Eldora
Employment Industries in Eldora
The major employment industries in Eldora include Accommodation & Food Services (138 | 38.7%), Construction (131 | 36.7%), and Agriculture, Fishing & Hunting (88 | 24.6%).
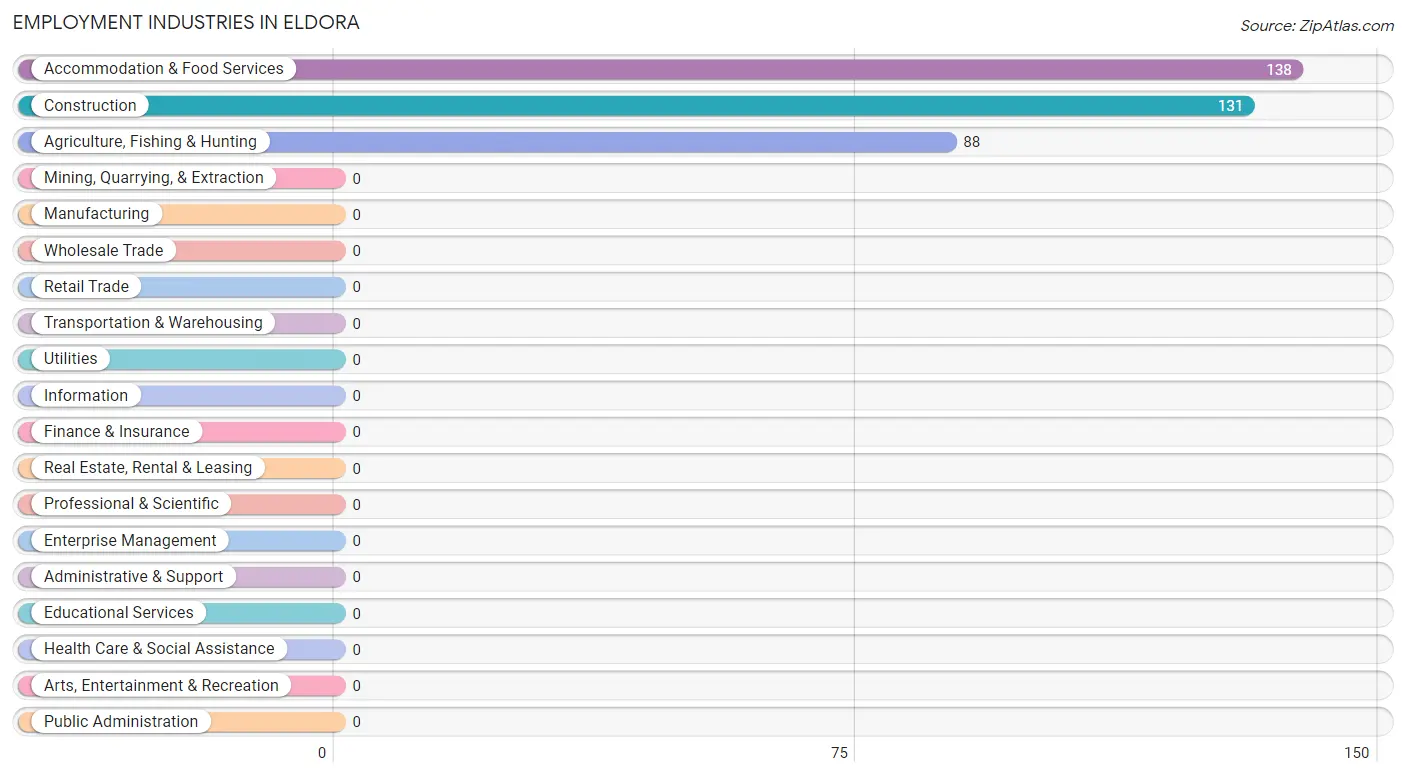
Employment Industries by Sex in Eldora
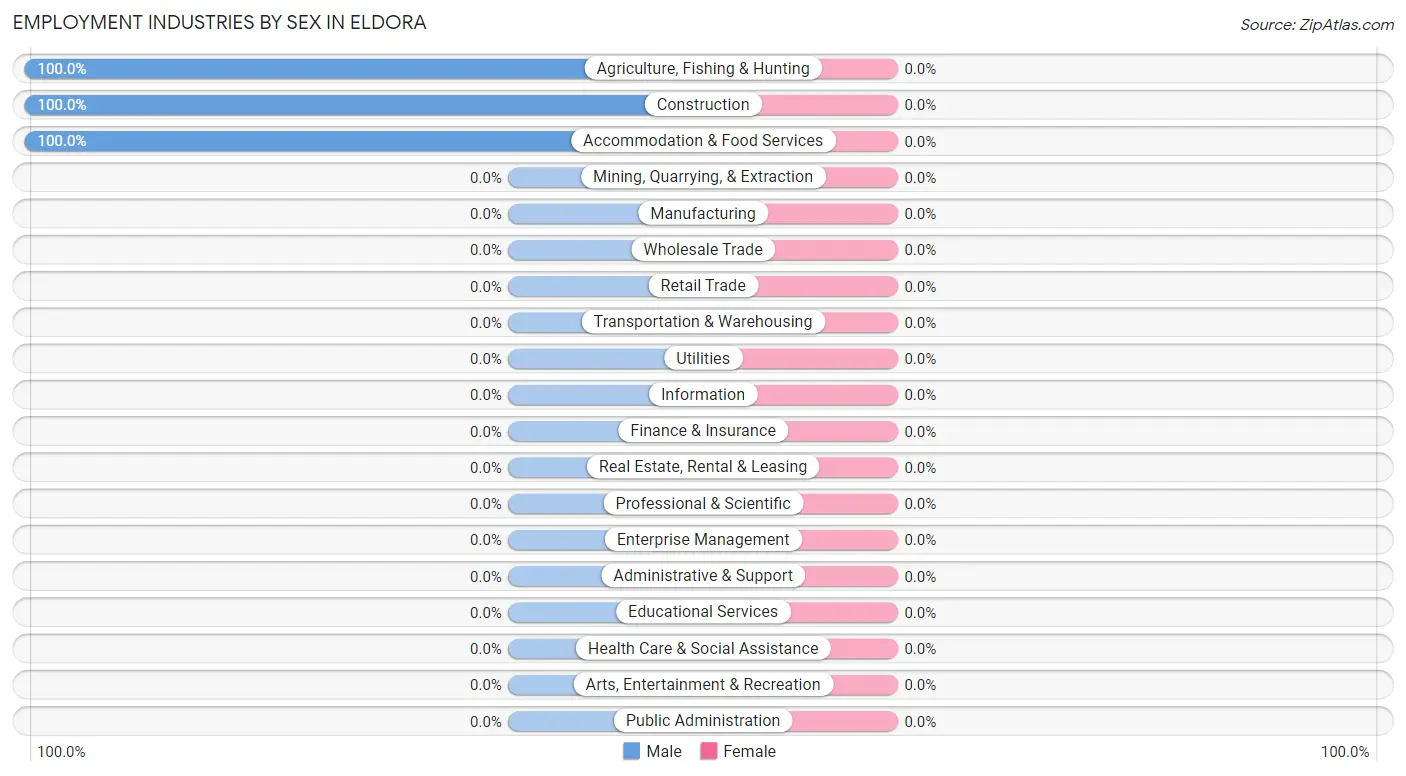
| Industry | Male | Female |
| Agriculture, Fishing & Hunting | 88 (100.0%) | 0 (0.0%) |
| Mining, Quarrying, & Extraction | 0 (0.0%) | 0 (0.0%) |
| Construction | 131 (100.0%) | 0 (0.0%) |
| Manufacturing | 0 (0.0%) | 0 (0.0%) |
| Wholesale Trade | 0 (0.0%) | 0 (0.0%) |
| Retail Trade | 0 (0.0%) | 0 (0.0%) |
| Transportation & Warehousing | 0 (0.0%) | 0 (0.0%) |
| Utilities | 0 (0.0%) | 0 (0.0%) |
| Information | 0 (0.0%) | 0 (0.0%) |
| Finance & Insurance | 0 (0.0%) | 0 (0.0%) |
| Real Estate, Rental & Leasing | 0 (0.0%) | 0 (0.0%) |
| Professional & Scientific | 0 (0.0%) | 0 (0.0%) |
| Enterprise Management | 0 (0.0%) | 0 (0.0%) |
| Administrative & Support | 0 (0.0%) | 0 (0.0%) |
| Educational Services | 0 (0.0%) | 0 (0.0%) |
| Health Care & Social Assistance | 0 (0.0%) | 0 (0.0%) |
| Arts, Entertainment & Recreation | 0 (0.0%) | 0 (0.0%) |
| Accommodation & Food Services | 138 (100.0%) | 0 (0.0%) |
| Public Administration | 0 (0.0%) | 0 (0.0%) |
| Total | 357 (100.0%) | 0 (0.0%) |
Education in Eldora
School Enrollment in Eldora
| School Level | # Students | % Students |
| Nursery / Preschool | 0 | 0.0% |
| Kindergarten | 0 | 0.0% |
| Elementary School | 0 | 0.0% |
| Middle School | 0 | 0.0% |
| High School | 0 | 0.0% |
| College / Undergraduate | 0 | 0.0% |
| Graduate / Professional | 0 | 0.0% |
| Total | 0 | 0.0% |
School Enrollment by Age by Funding Source in Eldora
| Age Bracket | Public School | Private School |
| 3 to 4 Year Olds | 0 (0.0%) | 0 (0.0%) |
| 5 to 9 Year Old | 0 (0.0%) | 0 (0.0%) |
| 10 to 14 Year Olds | 0 (0.0%) | 0 (0.0%) |
| 15 to 17 Year Olds | 0 (0.0%) | 0 (0.0%) |
| 18 to 19 Year Olds | 0 (0.0%) | 0 (0.0%) |
| 20 to 24 Year Olds | 0 (0.0%) | 0 (0.0%) |
| 25 to 34 Year Olds | 0 (0.0%) | 0 (0.0%) |
| 35 Years and over | 0 (0.0%) | 0 (0.0%) |
| Total | 0 (0.0%) | 0 (0.0%) |
Educational Attainment by Field of Study in Eldora
Bio, nature & agricultural (120 | 92.3%), and social sciences (10 | 7.7%) are the most common fields of study among 130 individuals in Eldora who have obtained a bachelor's degree or higher.
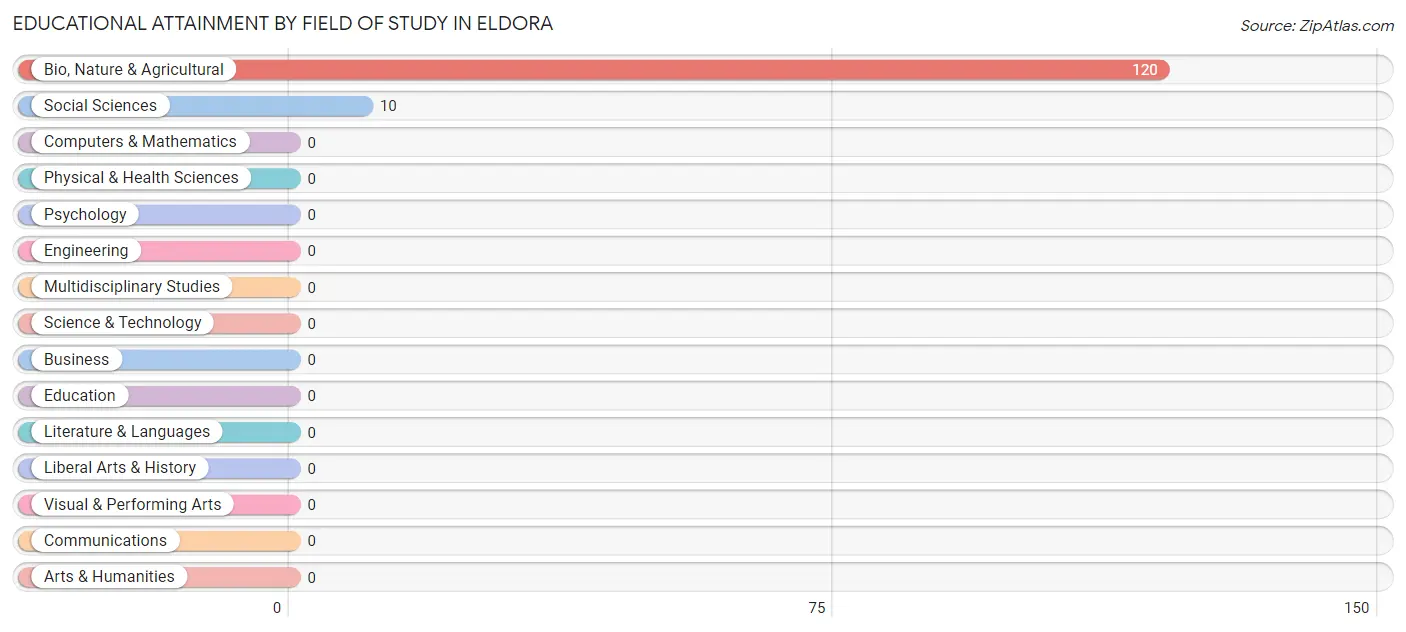
| Field of Study | # Graduates | % Graduates |
| Computers & Mathematics | 0 | 0.0% |
| Bio, Nature & Agricultural | 120 | 92.3% |
| Physical & Health Sciences | 0 | 0.0% |
| Psychology | 0 | 0.0% |
| Social Sciences | 10 | 7.7% |
| Engineering | 0 | 0.0% |
| Multidisciplinary Studies | 0 | 0.0% |
| Science & Technology | 0 | 0.0% |
| Business | 0 | 0.0% |
| Education | 0 | 0.0% |
| Literature & Languages | 0 | 0.0% |
| Liberal Arts & History | 0 | 0.0% |
| Visual & Performing Arts | 0 | 0.0% |
| Communications | 0 | 0.0% |
| Arts & Humanities | 0 | 0.0% |
| Total | 130 | 100.0% |
Transportation & Commute in Eldora
Vehicle Availability by Sex in Eldora
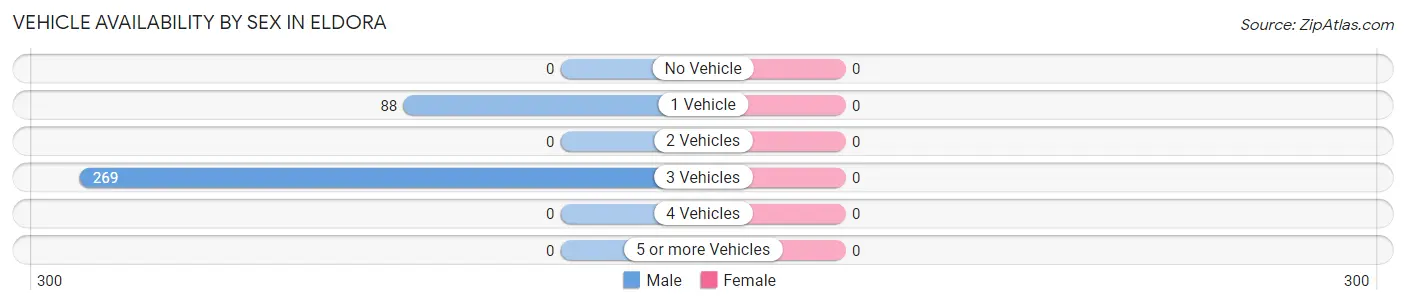
| Vehicles Available | Male | Female |
| No Vehicle | 0 (0.0%) | 0 (0.0%) |
| 1 Vehicle | 88 (24.6%) | 0 (0.0%) |
| 2 Vehicles | 0 (0.0%) | 0 (0.0%) |
| 3 Vehicles | 269 (75.3%) | 0 (0.0%) |
| 4 Vehicles | 0 (0.0%) | 0 (0.0%) |
| 5 or more Vehicles | 0 (0.0%) | 0 (0.0%) |
| Total | 357 (100.0%) | 0 (0.0%) |
Commute Time in Eldora
The most frequently occuring commute durations in Eldora are 15 to 19 minutes (138 commuters, 38.7%), 60 to 89 minutes (120 commuters, 33.6%), and 10 to 14 minutes (88 commuters, 24.6%).
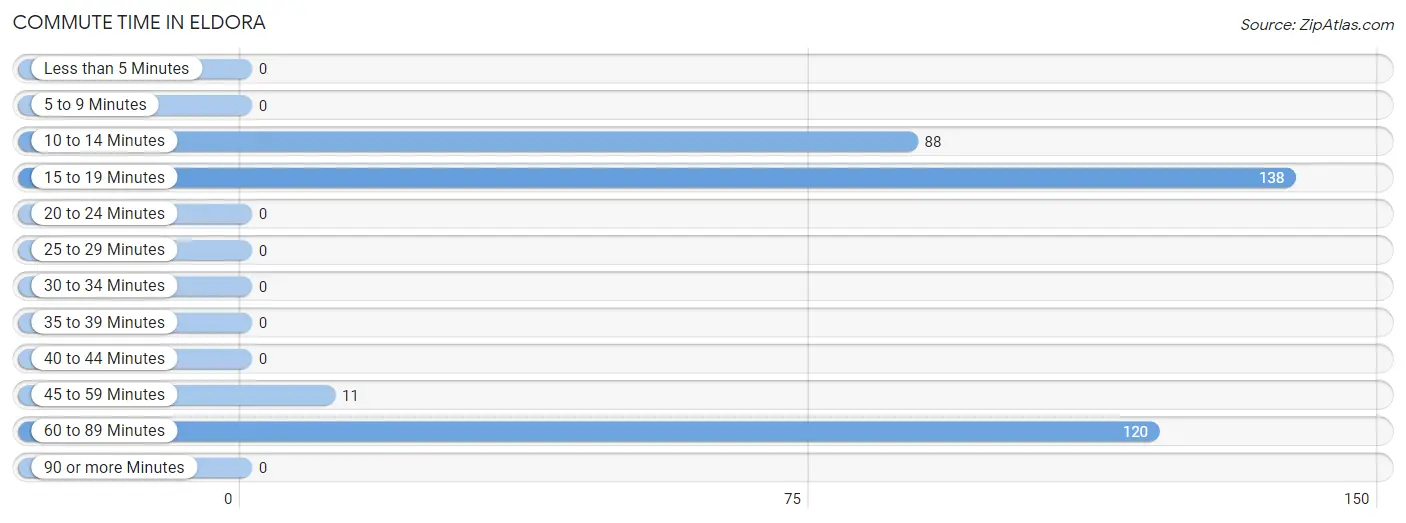
| Commute Time | # Commuters | % Commuters |
| Less than 5 Minutes | 0 | 0.0% |
| 5 to 9 Minutes | 0 | 0.0% |
| 10 to 14 Minutes | 88 | 24.6% |
| 15 to 19 Minutes | 138 | 38.7% |
| 20 to 24 Minutes | 0 | 0.0% |
| 25 to 29 Minutes | 0 | 0.0% |
| 30 to 34 Minutes | 0 | 0.0% |
| 35 to 39 Minutes | 0 | 0.0% |
| 40 to 44 Minutes | 0 | 0.0% |
| 45 to 59 Minutes | 11 | 3.1% |
| 60 to 89 Minutes | 120 | 33.6% |
| 90 or more Minutes | 0 | 0.0% |
Commute Time by Sex in Eldora
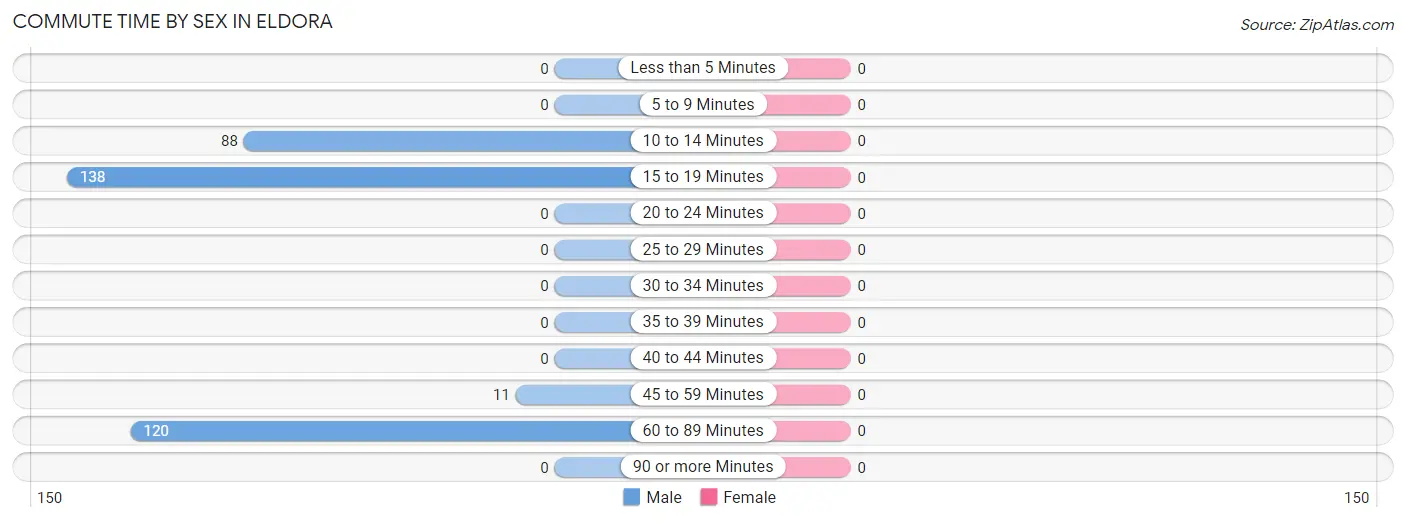
| Commute Time | Male | Female |
| Less than 5 Minutes | 0 (0.0%) | 0 (0.0%) |
| 5 to 9 Minutes | 0 (0.0%) | 0 (0.0%) |
| 10 to 14 Minutes | 88 (24.6%) | 0 (0.0%) |
| 15 to 19 Minutes | 138 (38.7%) | 0 (0.0%) |
| 20 to 24 Minutes | 0 (0.0%) | 0 (0.0%) |
| 25 to 29 Minutes | 0 (0.0%) | 0 (0.0%) |
| 30 to 34 Minutes | 0 (0.0%) | 0 (0.0%) |
| 35 to 39 Minutes | 0 (0.0%) | 0 (0.0%) |
| 40 to 44 Minutes | 0 (0.0%) | 0 (0.0%) |
| 45 to 59 Minutes | 11 (3.1%) | 0 (0.0%) |
| 60 to 89 Minutes | 120 (33.6%) | 0 (0.0%) |
| 90 or more Minutes | 0 (0.0%) | 0 (0.0%) |
Time of Departure to Work by Sex in Eldora
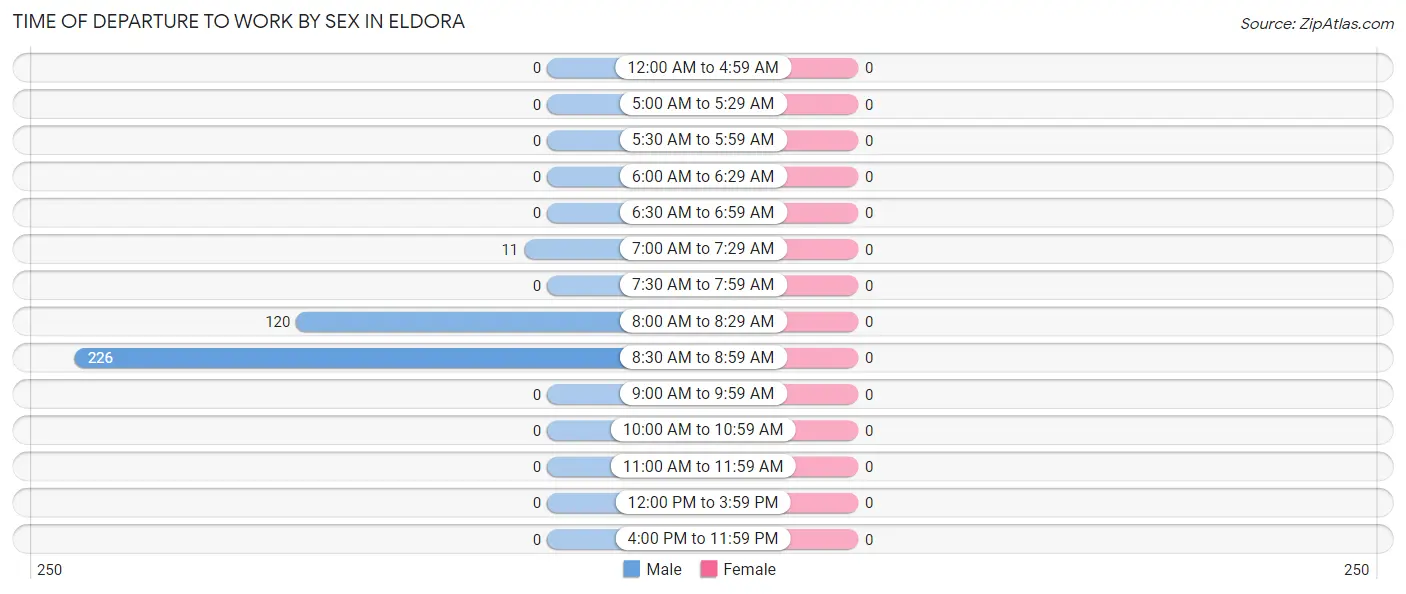
| Time of Departure | Male | Female |
| 12:00 AM to 4:59 AM | 0 (0.0%) | 0 (0.0%) |
| 5:00 AM to 5:29 AM | 0 (0.0%) | 0 (0.0%) |
| 5:30 AM to 5:59 AM | 0 (0.0%) | 0 (0.0%) |
| 6:00 AM to 6:29 AM | 0 (0.0%) | 0 (0.0%) |
| 6:30 AM to 6:59 AM | 0 (0.0%) | 0 (0.0%) |
| 7:00 AM to 7:29 AM | 11 (3.1%) | 0 (0.0%) |
| 7:30 AM to 7:59 AM | 0 (0.0%) | 0 (0.0%) |
| 8:00 AM to 8:29 AM | 120 (33.6%) | 0 (0.0%) |
| 8:30 AM to 8:59 AM | 226 (63.3%) | 0 (0.0%) |
| 9:00 AM to 9:59 AM | 0 (0.0%) | 0 (0.0%) |
| 10:00 AM to 10:59 AM | 0 (0.0%) | 0 (0.0%) |
| 11:00 AM to 11:59 AM | 0 (0.0%) | 0 (0.0%) |
| 12:00 PM to 3:59 PM | 0 (0.0%) | 0 (0.0%) |
| 4:00 PM to 11:59 PM | 0 (0.0%) | 0 (0.0%) |
| Total | 357 (100.0%) | 0 (0.0%) |
Housing Occupancy in Eldora
Occupancy by Ownership in Eldora
Of the total 251 dwellings in Eldora, owner-occupied units account for 25 (10.0%), while renter-occupied units make up 226 (90.0%).
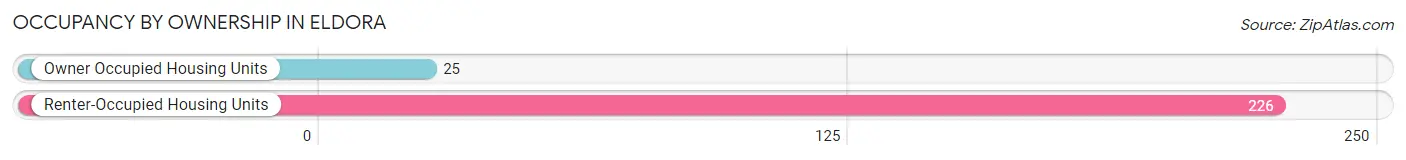
| Occupancy | # Housing Units | % Housing Units |
| Owner Occupied Housing Units | 25 | 10.0% |
| Renter-Occupied Housing Units | 226 | 90.0% |
| Total Occupied Housing Units | 251 | 100.0% |
Occupancy by Household Size in Eldora
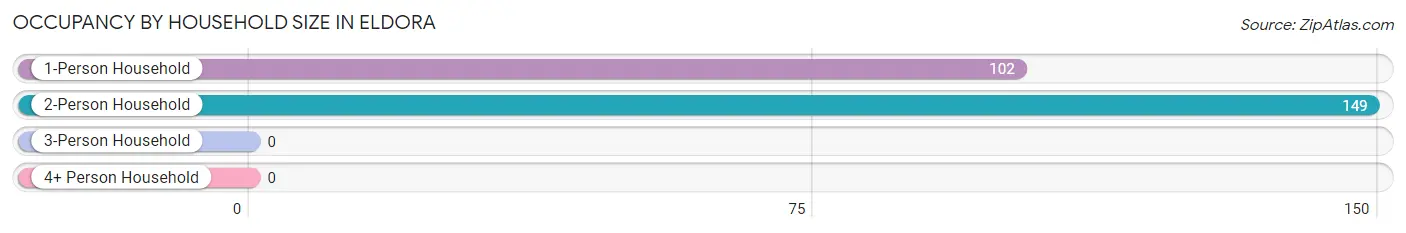
| Household Size | # Housing Units | % Housing Units |
| 1-Person Household | 102 | 40.6% |
| 2-Person Household | 149 | 59.4% |
| 3-Person Household | 0 | 0.0% |
| 4+ Person Household | 0 | 0.0% |
| Total Housing Units | 251 | 100.0% |
Occupancy by Ownership by Household Size in Eldora
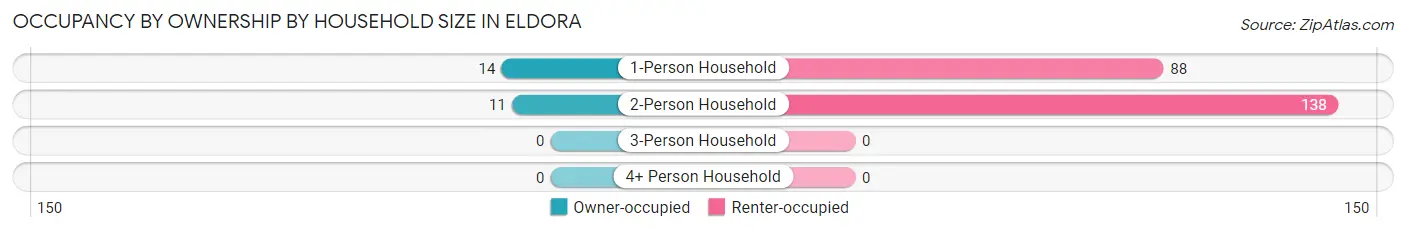
| Household Size | Owner-occupied | Renter-occupied |
| 1-Person Household | 14 (13.7%) | 88 (86.3%) |
| 2-Person Household | 11 (7.4%) | 138 (92.6%) |
| 3-Person Household | 0 (0.0%) | 0 (0.0%) |
| 4+ Person Household | 0 (0.0%) | 0 (0.0%) |
| Total Housing Units | 25 (10.0%) | 226 (90.0%) |
Occupancy by Educational Attainment in Eldora
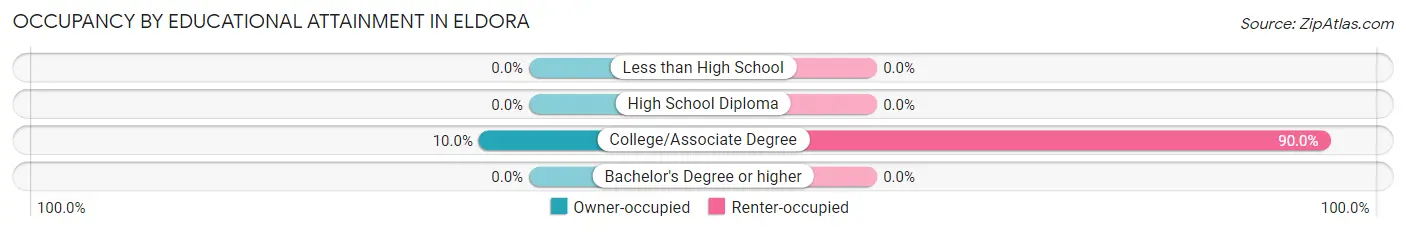
| Household Size | Owner-occupied | Renter-occupied |
| Less than High School | 0 (0.0%) | 0 (0.0%) |
| High School Diploma | 0 (0.0%) | 0 (0.0%) |
| College/Associate Degree | 25 (10.0%) | 226 (90.0%) |
| Bachelor's Degree or higher | 0 (0.0%) | 0 (0.0%) |
Occupancy by Age of Householder in Eldora
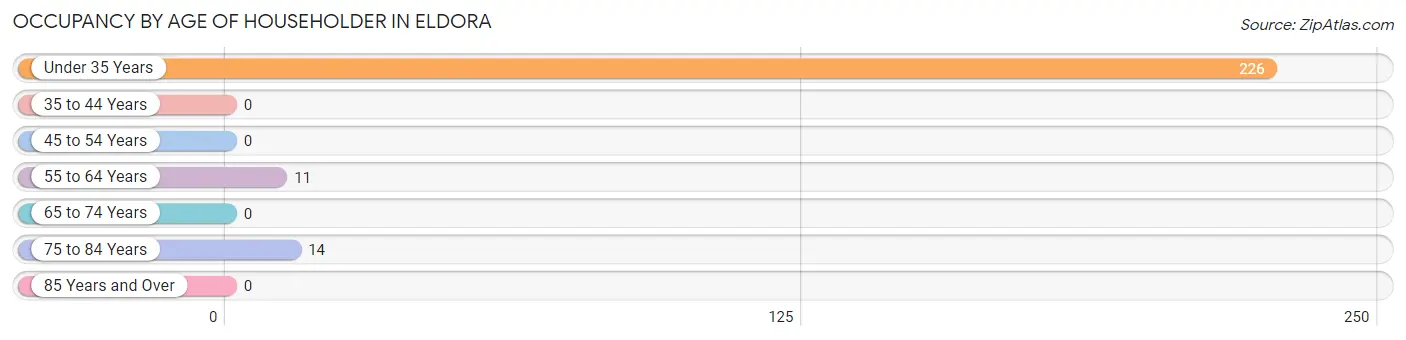
| Age Bracket | # Households | % Households |
| Under 35 Years | 226 | 90.0% |
| 35 to 44 Years | 0 | 0.0% |
| 45 to 54 Years | 0 | 0.0% |
| 55 to 64 Years | 11 | 4.4% |
| 65 to 74 Years | 0 | 0.0% |
| 75 to 84 Years | 14 | 5.6% |
| 85 Years and Over | 0 | 0.0% |
| Total | 251 | 100.0% |
Housing Finances in Eldora
Median Income by Occupancy in Eldora
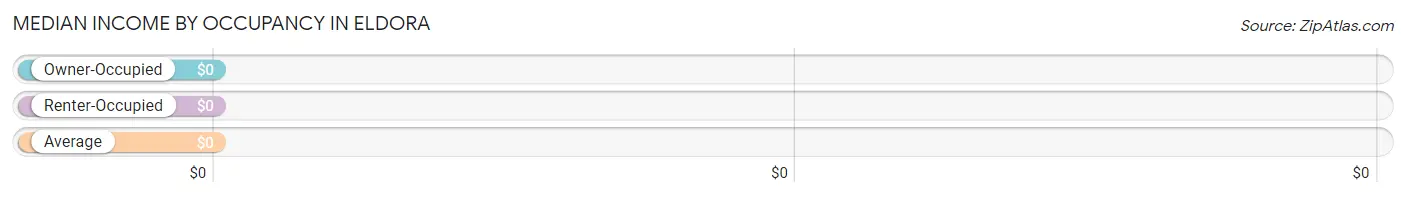
| Occupancy Type | # Households | Median Income |
| Owner-Occupied | 25 (10.0%) | $0 |
| Renter-Occupied | 226 (90.0%) | $0 |
| Average | 251 (100.0%) | $0 |
Occupancy by Householder Income Bracket in Eldora
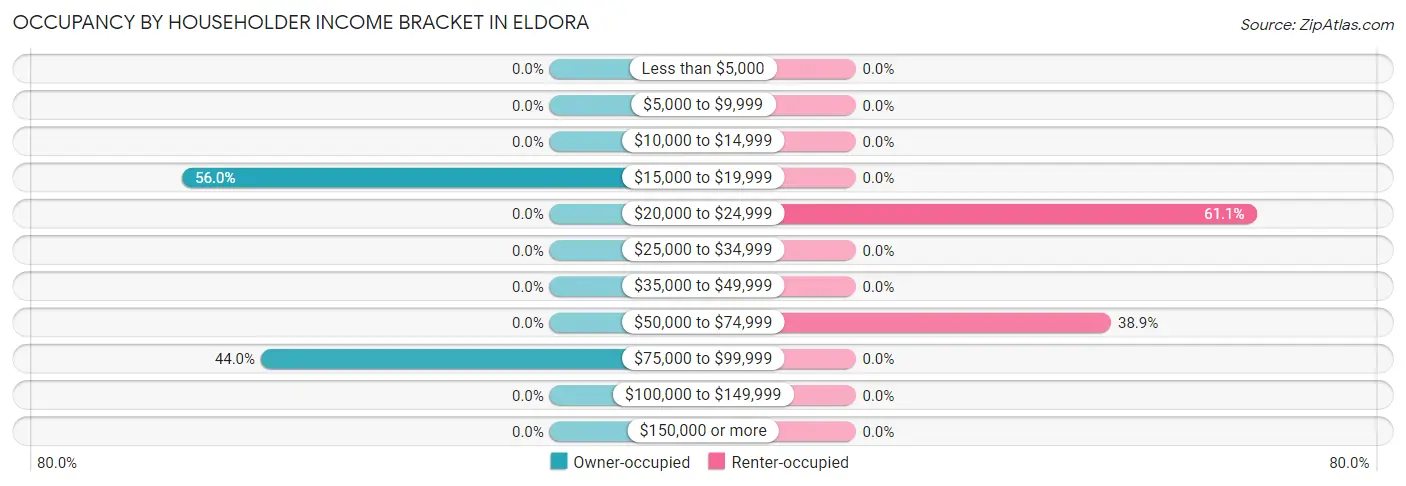
| Income Bracket | Owner-occupied | Renter-occupied |
| Less than $5,000 | 0 (0.0%) | 0 (0.0%) |
| $5,000 to $9,999 | 0 (0.0%) | 0 (0.0%) |
| $10,000 to $14,999 | 0 (0.0%) | 0 (0.0%) |
| $15,000 to $19,999 | 14 (56.0%) | 0 (0.0%) |
| $20,000 to $24,999 | 0 (0.0%) | 138 (61.1%) |
| $25,000 to $34,999 | 0 (0.0%) | 0 (0.0%) |
| $35,000 to $49,999 | 0 (0.0%) | 0 (0.0%) |
| $50,000 to $74,999 | 0 (0.0%) | 88 (38.9%) |
| $75,000 to $99,999 | 11 (44.0%) | 0 (0.0%) |
| $100,000 to $149,999 | 0 (0.0%) | 0 (0.0%) |
| $150,000 or more | 0 (0.0%) | 0 (0.0%) |
| Total | 25 (100.0%) | 226 (100.0%) |
Monthly Housing Cost Tiers in Eldora
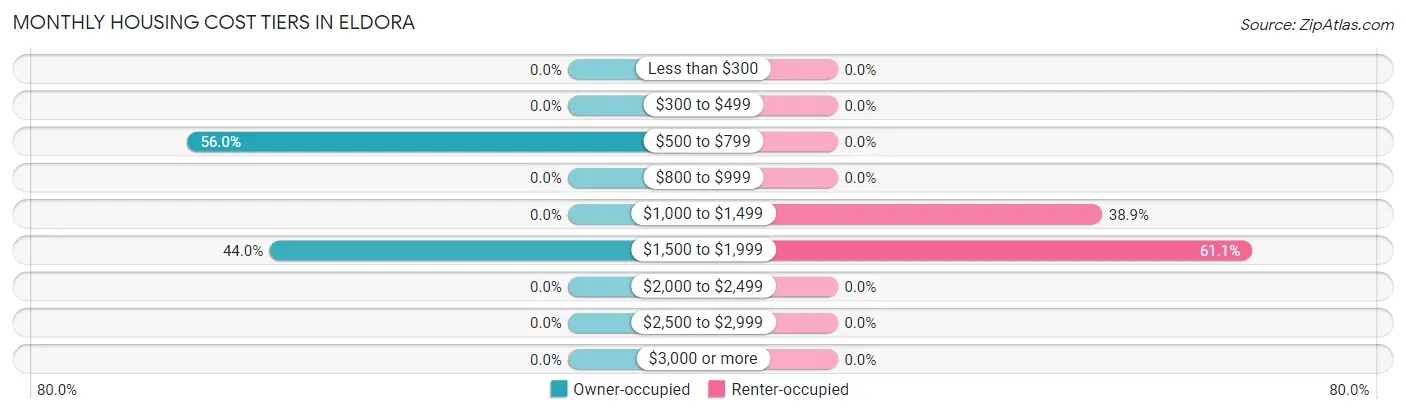
| Monthly Cost | Owner-occupied | Renter-occupied |
| Less than $300 | 0 (0.0%) | 0 (0.0%) |
| $300 to $499 | 0 (0.0%) | 0 (0.0%) |
| $500 to $799 | 14 (56.0%) | 0 (0.0%) |
| $800 to $999 | 0 (0.0%) | 0 (0.0%) |
| $1,000 to $1,499 | 0 (0.0%) | 88 (38.9%) |
| $1,500 to $1,999 | 11 (44.0%) | 138 (61.1%) |
| $2,000 to $2,499 | 0 (0.0%) | 0 (0.0%) |
| $2,500 to $2,999 | 0 (0.0%) | 0 (0.0%) |
| $3,000 or more | 0 (0.0%) | 0 (0.0%) |
| Total | 25 (100.0%) | 226 (100.0%) |
Physical Housing Characteristics in Eldora
Housing Structures in Eldora
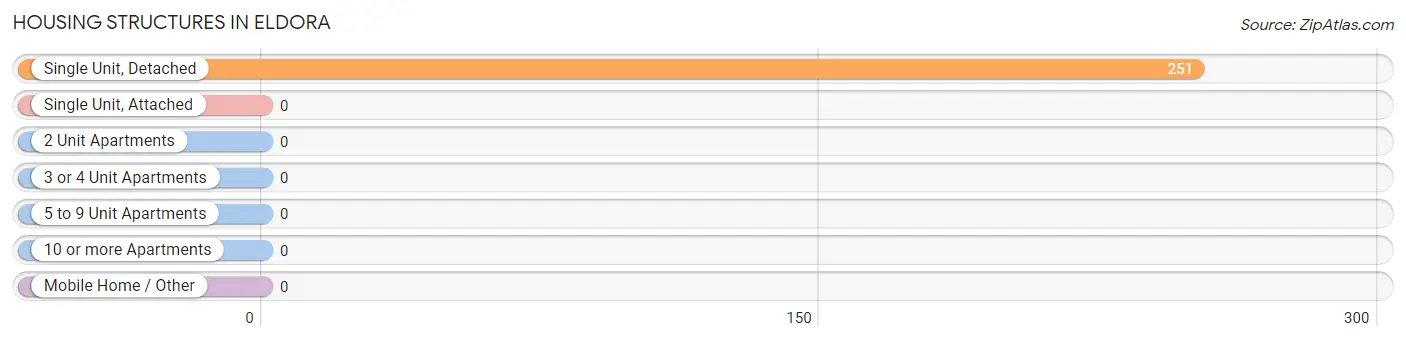
| Structure Type | # Housing Units | % Housing Units |
| Single Unit, Detached | 251 | 100.0% |
| Single Unit, Attached | 0 | 0.0% |
| 2 Unit Apartments | 0 | 0.0% |
| 3 or 4 Unit Apartments | 0 | 0.0% |
| 5 to 9 Unit Apartments | 0 | 0.0% |
| 10 or more Apartments | 0 | 0.0% |
| Mobile Home / Other | 0 | 0.0% |
| Total | 251 | 100.0% |
Housing Structures by Occupancy in Eldora
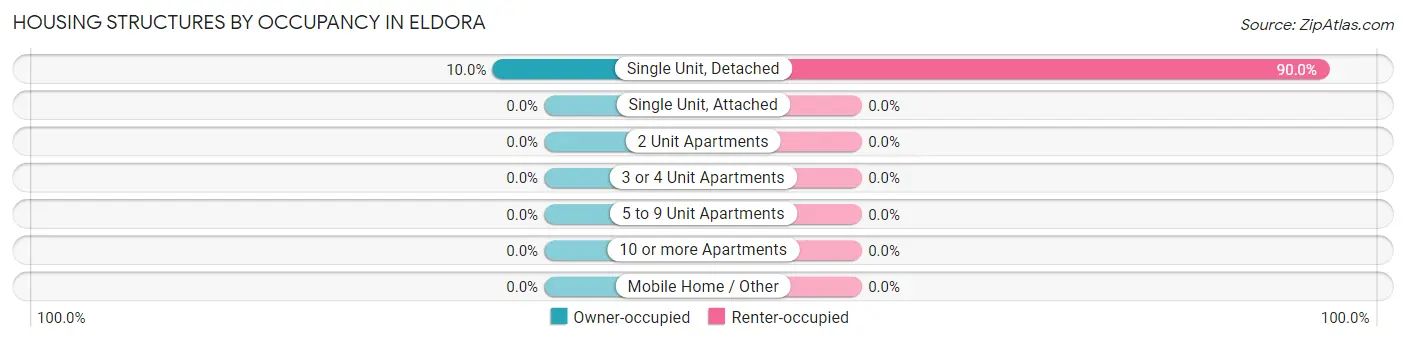
| Structure Type | Owner-occupied | Renter-occupied |
| Single Unit, Detached | 25 (10.0%) | 226 (90.0%) |
| Single Unit, Attached | 0 (0.0%) | 0 (0.0%) |
| 2 Unit Apartments | 0 (0.0%) | 0 (0.0%) |
| 3 or 4 Unit Apartments | 0 (0.0%) | 0 (0.0%) |
| 5 to 9 Unit Apartments | 0 (0.0%) | 0 (0.0%) |
| 10 or more Apartments | 0 (0.0%) | 0 (0.0%) |
| Mobile Home / Other | 0 (0.0%) | 0 (0.0%) |
| Total | 25 (10.0%) | 226 (90.0%) |
Housing Structures by Number of Rooms in Eldora
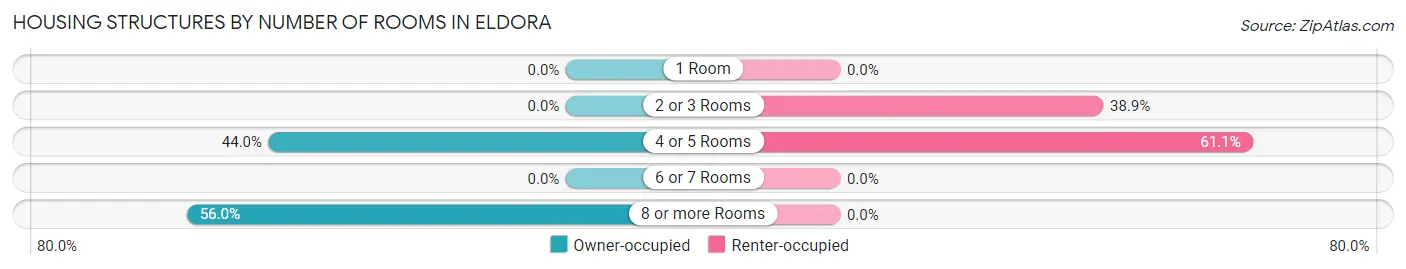
| Number of Rooms | Owner-occupied | Renter-occupied |
| 1 Room | 0 (0.0%) | 0 (0.0%) |
| 2 or 3 Rooms | 0 (0.0%) | 88 (38.9%) |
| 4 or 5 Rooms | 11 (44.0%) | 138 (61.1%) |
| 6 or 7 Rooms | 0 (0.0%) | 0 (0.0%) |
| 8 or more Rooms | 14 (56.0%) | 0 (0.0%) |
| Total | 25 (100.0%) | 226 (100.0%) |
Housing Structure by Heating Type in Eldora
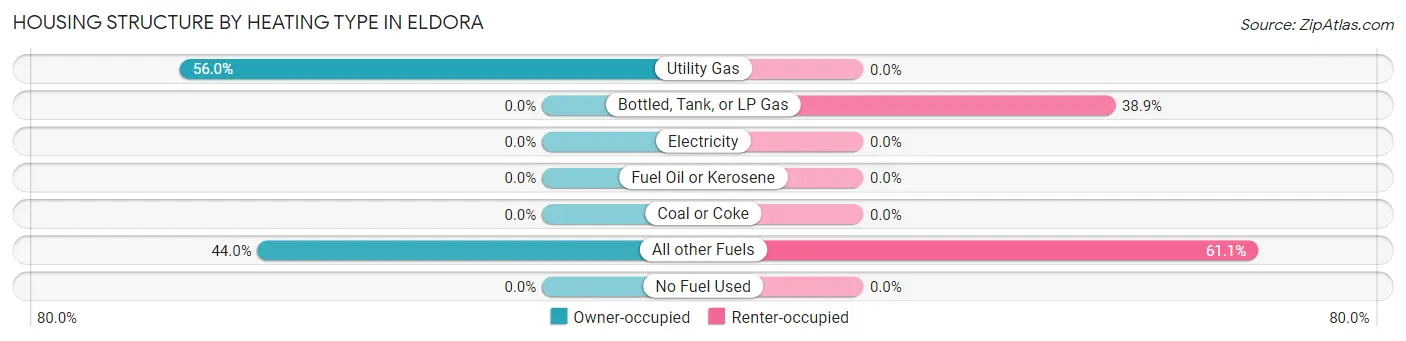
| Heating Type | Owner-occupied | Renter-occupied |
| Utility Gas | 14 (56.0%) | 0 (0.0%) |
| Bottled, Tank, or LP Gas | 0 (0.0%) | 88 (38.9%) |
| Electricity | 0 (0.0%) | 0 (0.0%) |
| Fuel Oil or Kerosene | 0 (0.0%) | 0 (0.0%) |
| Coal or Coke | 0 (0.0%) | 0 (0.0%) |
| All other Fuels | 11 (44.0%) | 138 (61.1%) |
| No Fuel Used | 0 (0.0%) | 0 (0.0%) |
| Total | 25 (100.0%) | 226 (100.0%) |
Household Vehicle Usage in Eldora
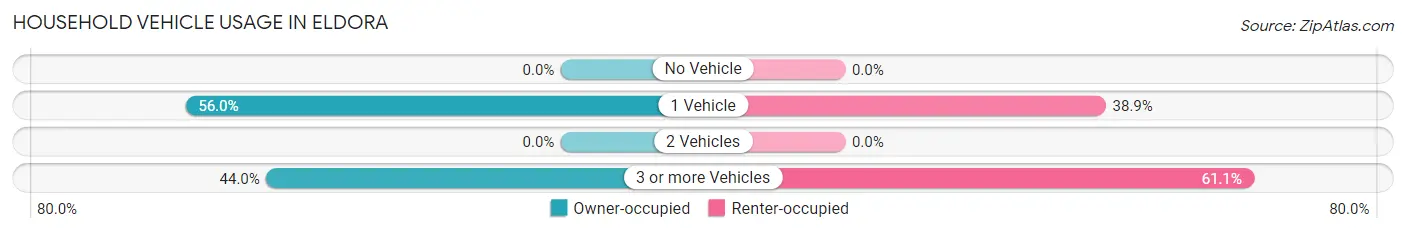
| Vehicles per Household | Owner-occupied | Renter-occupied |
| No Vehicle | 0 (0.0%) | 0 (0.0%) |
| 1 Vehicle | 14 (56.0%) | 88 (38.9%) |
| 2 Vehicles | 0 (0.0%) | 0 (0.0%) |
| 3 or more Vehicles | 11 (44.0%) | 138 (61.1%) |
| Total | 25 (100.0%) | 226 (100.0%) |
Real Estate & Mortgages in Eldora
Real Estate and Mortgage Overview in Eldora
| Characteristic | Without Mortgage | With Mortgage |
| Housing Units | 14 | 11 |
| Median Property Value | - | - |
| Median Household Income | - | - |
| Monthly Housing Costs | - | - |
| Real Estate Taxes | - | - |
Property Value by Mortgage Status in Eldora
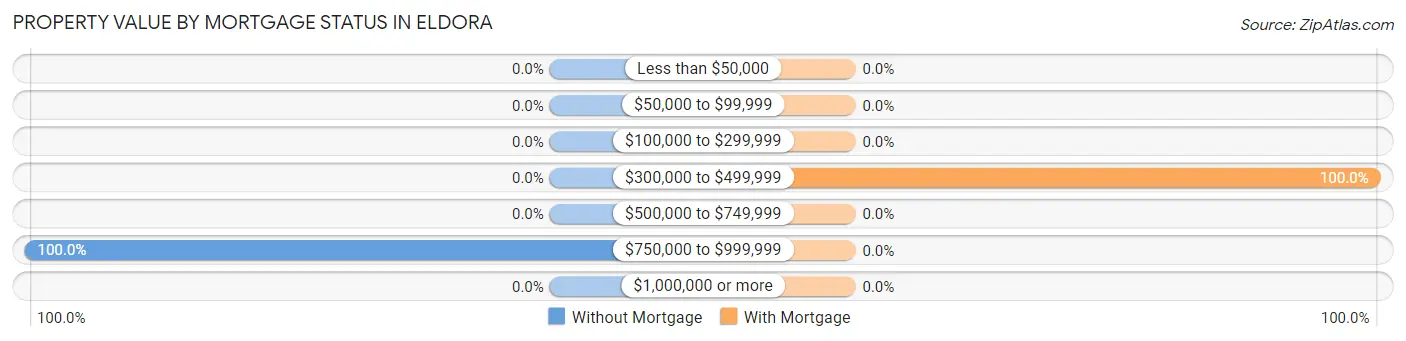
| Property Value | Without Mortgage | With Mortgage |
| Less than $50,000 | 0 (0.0%) | 0 (0.0%) |
| $50,000 to $99,999 | 0 (0.0%) | 0 (0.0%) |
| $100,000 to $299,999 | 0 (0.0%) | 0 (0.0%) |
| $300,000 to $499,999 | 0 (0.0%) | 11 (100.0%) |
| $500,000 to $749,999 | 0 (0.0%) | 0 (0.0%) |
| $750,000 to $999,999 | 14 (100.0%) | 0 (0.0%) |
| $1,000,000 or more | 0 (0.0%) | 0 (0.0%) |
| Total | 14 (100.0%) | 11 (100.0%) |
Household Income by Mortgage Status in Eldora
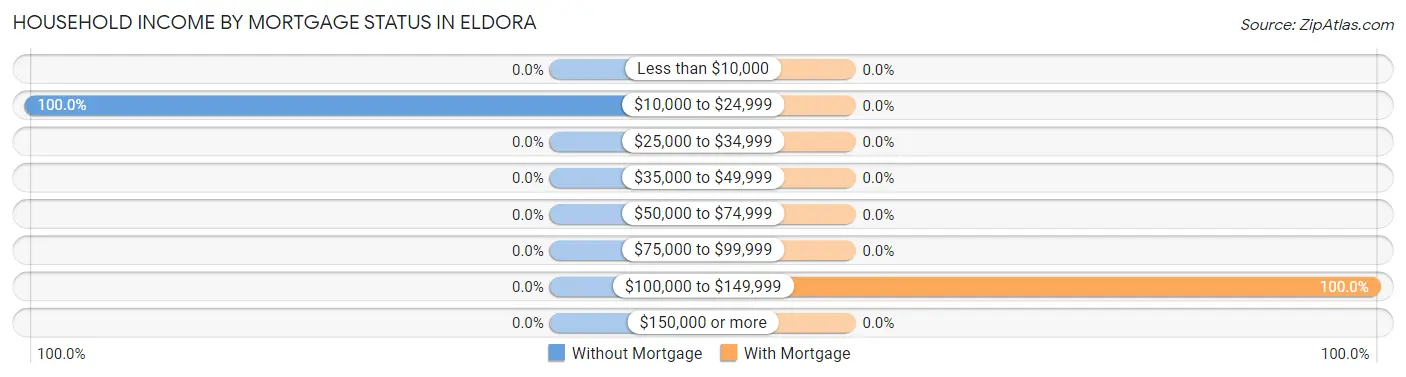
| Household Income | Without Mortgage | With Mortgage |
| Less than $10,000 | 0 (0.0%) | 0 (0.0%) |
| $10,000 to $24,999 | 14 (100.0%) | 0 (0.0%) |
| $25,000 to $34,999 | 0 (0.0%) | 0 (0.0%) |
| $35,000 to $49,999 | 0 (0.0%) | 0 (0.0%) |
| $50,000 to $74,999 | 0 (0.0%) | 0 (0.0%) |
| $75,000 to $99,999 | 0 (0.0%) | 0 (0.0%) |
| $100,000 to $149,999 | 0 (0.0%) | 11 (100.0%) |
| $150,000 or more | 0 (0.0%) | 0 (0.0%) |
| Total | 14 (100.0%) | 11 (100.0%) |
Property Value to Household Income Ratio in Eldora
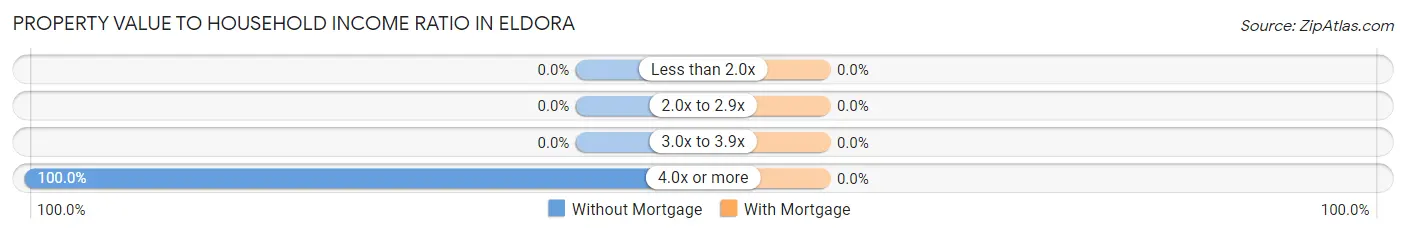
| Value-to-Income Ratio | Without Mortgage | With Mortgage |
| Less than 2.0x | 0 (0.0%) | 0 (0.0%) |
| 2.0x to 2.9x | 0 (0.0%) | 0 (0.0%) |
| 3.0x to 3.9x | 0 (0.0%) | 0 (0.0%) |
| 4.0x or more | 14 (100.0%) | 0 (0.0%) |
| Total | 14 (100.0%) | 11 (100.0%) |
Real Estate Taxes by Mortgage Status in Eldora
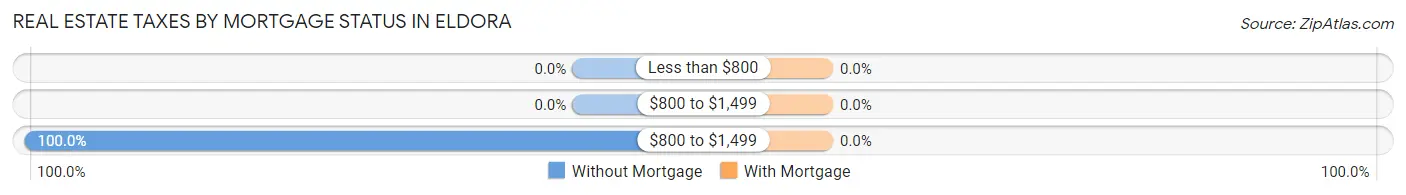
| Property Taxes | Without Mortgage | With Mortgage |
| Less than $800 | 0 (0.0%) | 0 (0.0%) |
| $800 to $1,499 | 0 (0.0%) | 0 (0.0%) |
| $800 to $1,499 | 14 (100.0%) | 0 (0.0%) |
| Total | 14 (100.0%) | 11 (100.0%) |
Health & Disability in Eldora
Health Insurance Coverage by Age in Eldora
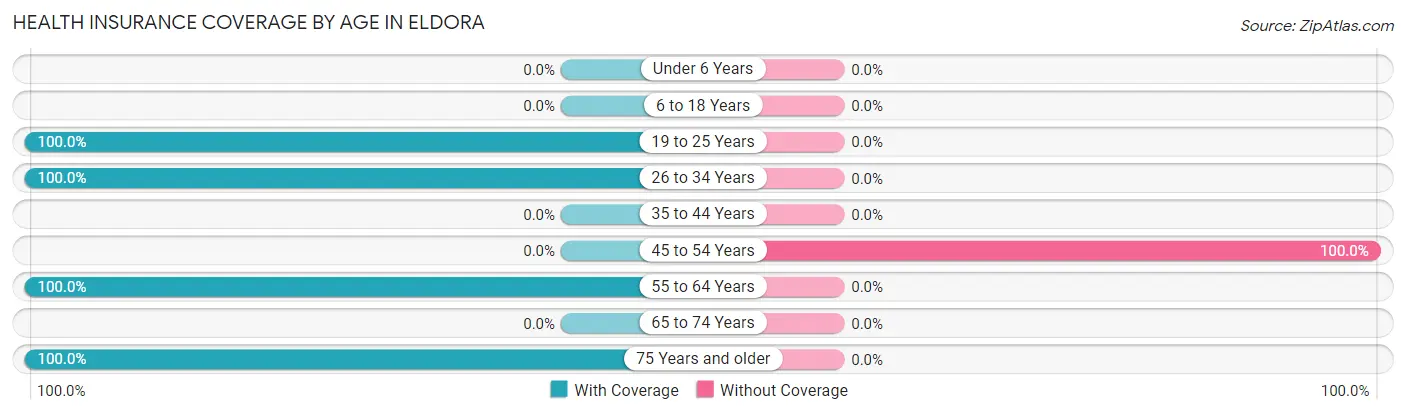
| Age Bracket | With Coverage | Without Coverage |
| Under 6 Years | 0 (0.0%) | 0 (0.0%) |
| 6 to 18 Years | 0 (0.0%) | 0 (0.0%) |
| 19 to 25 Years | 138 (100.0%) | 0 (0.0%) |
| 26 to 34 Years | 88 (100.0%) | 0 (0.0%) |
| 35 to 44 Years | 0 (0.0%) | 0 (0.0%) |
| 45 to 54 Years | 0 (0.0%) | 120 (100.0%) |
| 55 to 64 Years | 21 (100.0%) | 0 (0.0%) |
| 65 to 74 Years | 0 (0.0%) | 0 (0.0%) |
| 75 Years and older | 14 (100.0%) | 0 (0.0%) |
| Total | 261 (68.5%) | 120 (31.5%) |
Health Insurance Coverage by Citizenship Status in Eldora
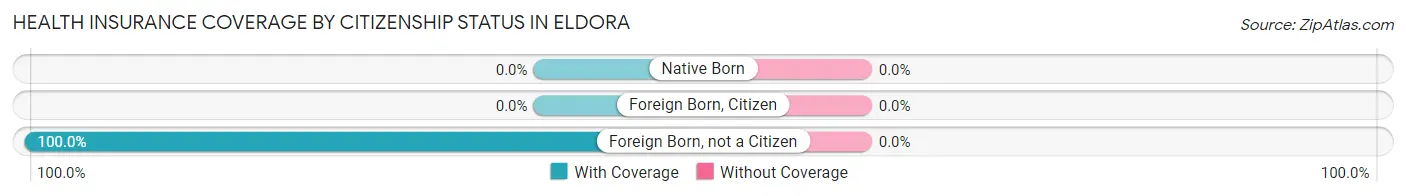
| Citizenship Status | With Coverage | Without Coverage |
| Native Born | 0 (0.0%) | 0 (0.0%) |
| Foreign Born, Citizen | 0 (0.0%) | 0 (0.0%) |
| Foreign Born, not a Citizen | 138 (100.0%) | 0 (0.0%) |
Health Insurance Coverage by Household Income in Eldora
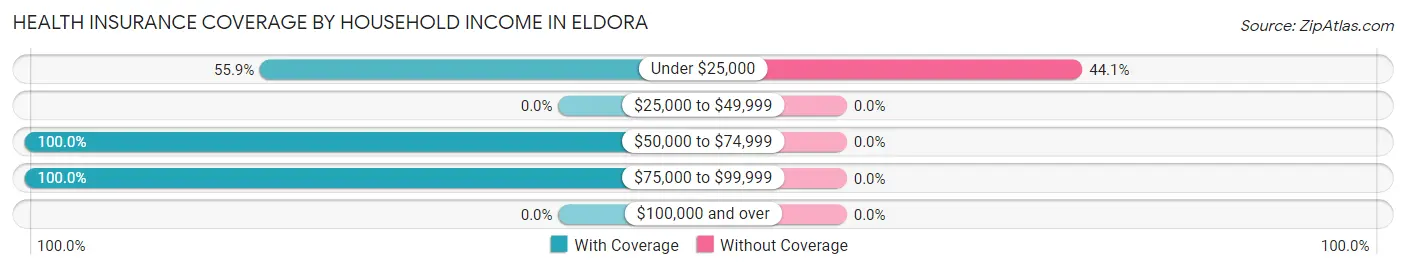
| Household Income | With Coverage | Without Coverage |
| Under $25,000 | 152 (55.9%) | 120 (44.1%) |
| $25,000 to $49,999 | 0 (0.0%) | 0 (0.0%) |
| $50,000 to $74,999 | 88 (100.0%) | 0 (0.0%) |
| $75,000 to $99,999 | 21 (100.0%) | 0 (0.0%) |
| $100,000 and over | 0 (0.0%) | 0 (0.0%) |
Public vs Private Health Insurance Coverage by Age in Eldora
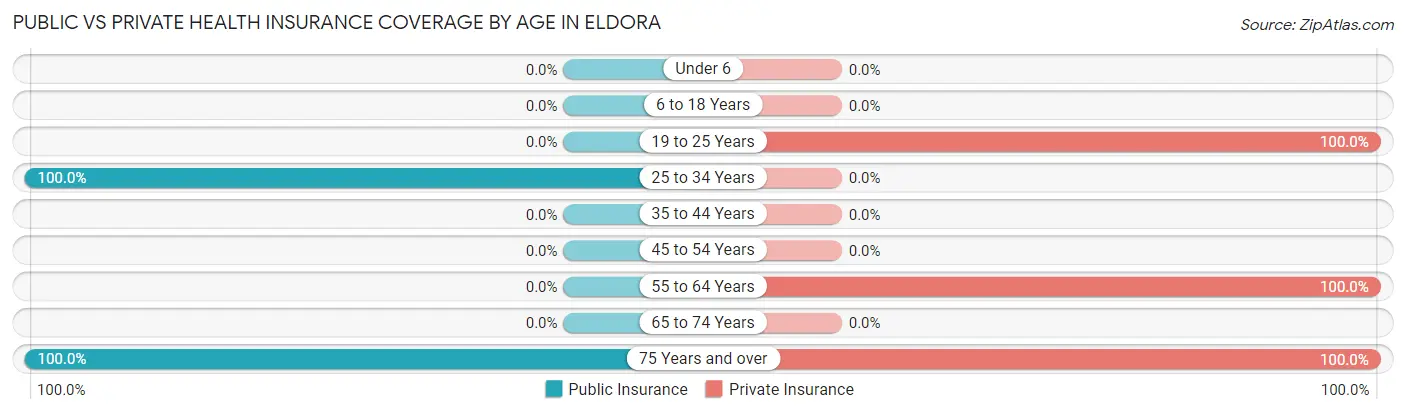
| Age Bracket | Public Insurance | Private Insurance |
| Under 6 | 0 (0.0%) | 0 (0.0%) |
| 6 to 18 Years | 0 (0.0%) | 0 (0.0%) |
| 19 to 25 Years | 0 (0.0%) | 138 (100.0%) |
| 25 to 34 Years | 88 (100.0%) | 0 (0.0%) |
| 35 to 44 Years | 0 (0.0%) | 0 (0.0%) |
| 45 to 54 Years | 0 (0.0%) | 0 (0.0%) |
| 55 to 64 Years | 0 (0.0%) | 21 (100.0%) |
| 65 to 74 Years | 0 (0.0%) | 0 (0.0%) |
| 75 Years and over | 14 (100.0%) | 14 (100.0%) |
| Total | 102 (26.8%) | 173 (45.4%) |
Disability Status by Sex by Age in Eldora
| Age Bracket | Male | Female |
| Under 5 Years | 0 (0.0%) | 0 (0.0%) |
| 5 to 17 Years | 0 (0.0%) | 0 (0.0%) |
| 18 to 34 Years | 0 (0.0%) | 0 (0.0%) |
| 35 to 64 Years | 0 (0.0%) | 0 (0.0%) |
| 65 to 74 Years | 0 (0.0%) | 0 (0.0%) |
| 75 Years and over | 0 (0.0%) | 0 (0.0%) |
Disability Class by Sex by Age in Eldora
Disability Class: Hearing Difficulty
| Age Bracket | Male | Female |
| Under 5 Years | 0 (0.0%) | 0 (0.0%) |
| 5 to 17 Years | 0 (0.0%) | 0 (0.0%) |
| 18 to 34 Years | 0 (0.0%) | 0 (0.0%) |
| 35 to 64 Years | 0 (0.0%) | 0 (0.0%) |
| 65 to 74 Years | 0 (0.0%) | 0 (0.0%) |
| 75 Years and over | 0 (0.0%) | 0 (0.0%) |
Disability Class: Vision Difficulty
| Age Bracket | Male | Female |
| Under 5 Years | 0 (0.0%) | 0 (0.0%) |
| 5 to 17 Years | 0 (0.0%) | 0 (0.0%) |
| 18 to 34 Years | 0 (0.0%) | 0 (0.0%) |
| 35 to 64 Years | 0 (0.0%) | 0 (0.0%) |
| 65 to 74 Years | 0 (0.0%) | 0 (0.0%) |
| 75 Years and over | 0 (0.0%) | 0 (0.0%) |
Disability Class: Cognitive Difficulty
| Age Bracket | Male | Female |
| 5 to 17 Years | 0 (0.0%) | 0 (0.0%) |
| 18 to 34 Years | 0 (0.0%) | 0 (0.0%) |
| 35 to 64 Years | 0 (0.0%) | 0 (0.0%) |
| 65 to 74 Years | 0 (0.0%) | 0 (0.0%) |
| 75 Years and over | 0 (0.0%) | 0 (0.0%) |
Disability Class: Ambulatory Difficulty
| Age Bracket | Male | Female |
| 5 to 17 Years | 0 (0.0%) | 0 (0.0%) |
| 18 to 34 Years | 0 (0.0%) | 0 (0.0%) |
| 35 to 64 Years | 0 (0.0%) | 0 (0.0%) |
| 65 to 74 Years | 0 (0.0%) | 0 (0.0%) |
| 75 Years and over | 0 (0.0%) | 0 (0.0%) |
Disability Class: Self-Care Difficulty
| Age Bracket | Male | Female |
| 5 to 17 Years | 0 (0.0%) | 0 (0.0%) |
| 18 to 34 Years | 0 (0.0%) | 0 (0.0%) |
| 35 to 64 Years | 0 (0.0%) | 0 (0.0%) |
| 65 to 74 Years | 0 (0.0%) | 0 (0.0%) |
| 75 Years and over | 0 (0.0%) | 0 (0.0%) |
Technology Access in Eldora
Computing Device Access in Eldora
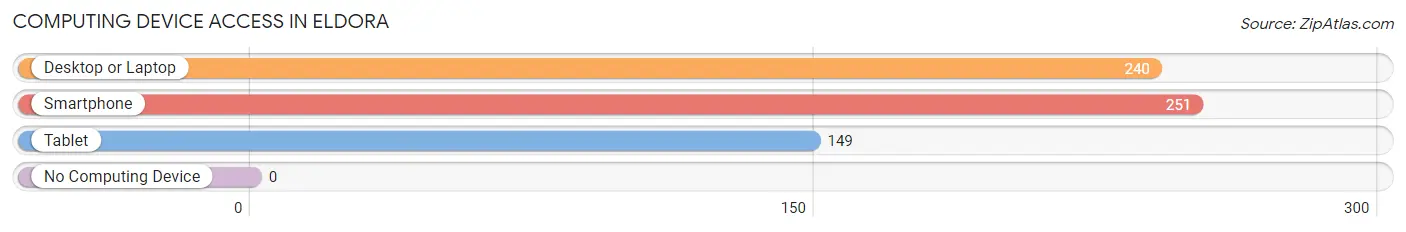
| Device Type | # Households | % Households |
| Desktop or Laptop | 240 | 95.6% |
| Smartphone | 251 | 100.0% |
| Tablet | 149 | 59.4% |
| No Computing Device | 0 | 0.0% |
| Total | 251 | 100.0% |
Internet Access in Eldora
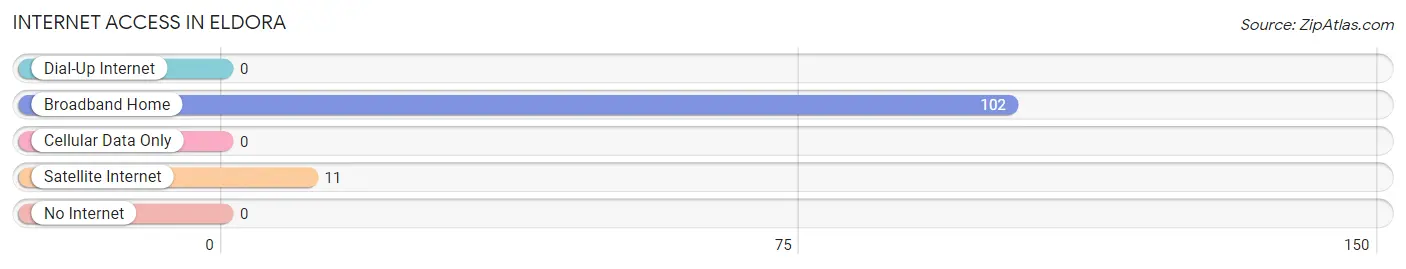
| Internet Type | # Households | % Households |
| Dial-Up Internet | 0 | 0.0% |
| Broadband Home | 102 | 40.6% |
| Cellular Data Only | 0 | 0.0% |
| Satellite Internet | 11 | 4.4% |
| No Internet | 0 | 0.0% |
| Total | 251 | 100.0% |
Eldora Summary
Eldora, Colorado is a small mountain town located in Boulder County, Colorado. It is situated in the foothills of the Rocky Mountains, approximately 20 miles west of Boulder. The town was founded in 1875 and is named after the nearby Eldora Mountain Resort, which was established in 1962.
History
Eldora was founded in 1875 by a group of miners who were searching for gold in the area. The town was originally called Eldorado, but the name was changed to Eldora in 1876. The town was incorporated in 1881 and was home to a variety of businesses, including a hotel, saloon, general store, and post office.
In the early 1900s, the town began to decline as the gold rush ended and the population dwindled. However, in 1962, the Eldora Mountain Resort was established, which brought new life to the town. The resort is now a popular destination for skiing, snowboarding, and other winter activities.
Geography
Eldora is located in the foothills of the Rocky Mountains, approximately 20 miles west of Boulder. The town is situated at an elevation of 8,400 feet and is surrounded by mountains, forests, and meadows. The nearby Eldora Mountain Resort is located at an elevation of 10,800 feet and offers skiing, snowboarding, and other winter activities.
Economy
Eldora’s economy is largely based on tourism, as the town is a popular destination for skiing, snowboarding, and other winter activities. The nearby Eldora Mountain Resort is the main source of tourism in the area, and it employs a large number of people. Other businesses in the town include restaurants, hotels, and retail stores.
Demographics
As of the 2010 census, the population of Eldora was 545. The town is predominantly white, with 91.2% of the population identifying as white. The median household income in the town is $50,000, and the median age is 44.
Conclusion
Eldora, Colorado is a small mountain town located in Boulder County, Colorado. It was founded in 1875 and is home to the popular Eldora Mountain Resort, which was established in 1962. The town’s economy is largely based on tourism, and it is a popular destination for skiing, snowboarding, and other winter activities. As of the 2010 census, the population of Eldora was 545, and the town is predominantly white.
Common Questions
What is Per Capita Income in Eldora?
Per Capita income in Eldora is $23,284.
What is Inequality or Gini Index in Eldora?
Inequality or Gini Index in Eldora is 0.27.
What is the Total Population of Eldora?
Total Population of Eldora is 381.
What is the Total Male Population of Eldora?
Total Male Population of Eldora is 357.
What is the Total Female Population of Eldora?
Total Female Population of Eldora is 24.
What is the Ratio of Males per 100 Females in Eldora?
There are 1,487.50 Males per 100 Females in Eldora.
What is the Ratio of Females per 100 Males in Eldora?
There are 6.72 Females per 100 Males in Eldora.
What is the Median Population Age in Eldora?
Median Population Age in Eldora is 32.6 Years.
What is the Average Family Size in Eldora
Average Family Size in Eldora is 1.9 People.
What is the Average Household Size in Eldora
Average Household Size in Eldora is 1.5 People.
How Large is the Labor Force in Eldora?
There are 357 People in the Labor Forcein in Eldora.
What is the Percentage of People in the Labor Force in Eldora?
93.7% of People are in the Labor Force in Eldora.