Robins AFB, GA Map & Demographics
Robins AFB Map
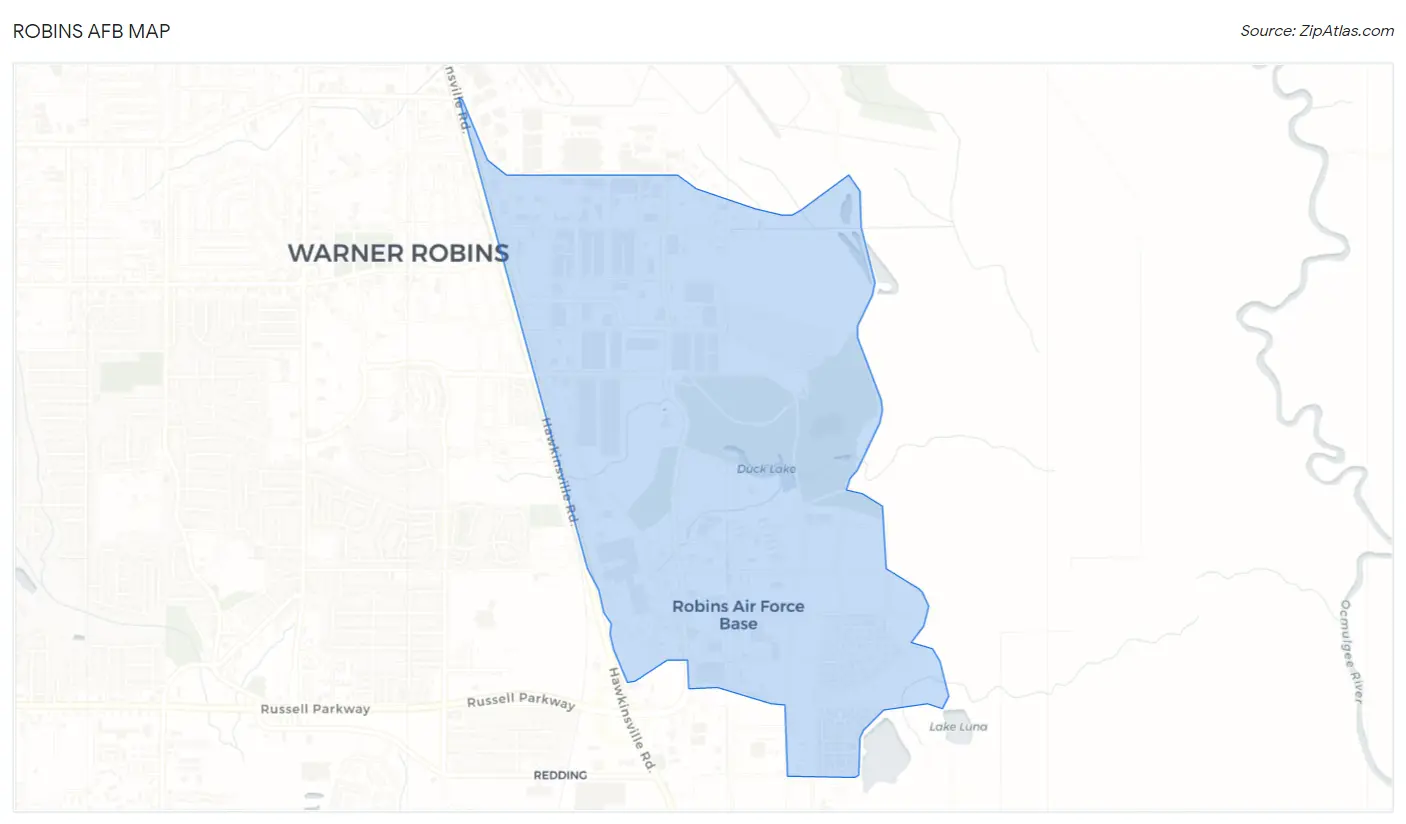
Robins AFB Overview
$43,184
PER CAPITA INCOME
$137,232
AVG FAMILY INCOME
$84,910
AVG HOUSEHOLD INCOME
16.4%
WAGE / INCOME GAP [ % ]
83.6¢/ $1
WAGE / INCOME GAP [ $ ]
0.34
INEQUALITY / GINI INDEX
1,316
TOTAL POPULATION
849
MALE POPULATION
467
FEMALE POPULATION
181.80
MALES / 100 FEMALES
55.01
FEMALES / 100 MALES
24.8
MEDIAN AGE
2.9
AVG FAMILY SIZE
2.4
AVG HOUSEHOLD SIZE
856
LABOR FORCE [ PEOPLE ]
83.4%
PERCENT IN LABOR FORCE
7.4%
UNEMPLOYMENT RATE
Robins AFB Area Codes
Income in Robins AFB
Income Overview in Robins AFB
Per Capita Income in Robins AFB is $43,184, while median incomes of families and households are $137,232 and $84,910 respectively.
| Characteristic | Number | Measure |
| Per Capita Income | 1,316 | $43,184 |
| Median Family Income | 297 | $137,232 |
| Mean Family Income | 297 | $133,488 |
| Median Household Income | 403 | $84,910 |
| Mean Household Income | 403 | $119,525 |
| Income Deficit | 297 | $0 |
| Wage / Income Gap (%) | 1,316 | 16.39% |
| Wage / Income Gap ($) | 1,316 | 83.61¢ per $1 |
| Gini / Inequality Index | 1,316 | 0.34 |
Earnings by Sex in Robins AFB
Average Earnings in Robins AFB are $39,875, $41,331 for men and $34,556 for women, a difference of 16.4%.
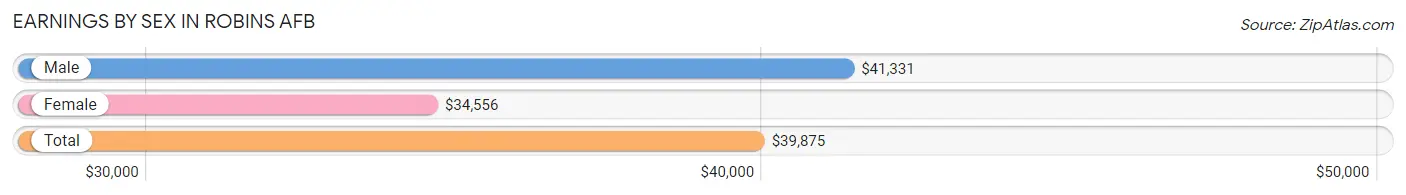
| Sex | Number | Average Earnings |
| Male | 611 (71.1%) | $41,331 |
| Female | 249 (28.9%) | $34,556 |
| Total | 860 (100.0%) | $39,875 |
Earnings by Sex by Income Bracket in Robins AFB
The most common earnings brackets in Robins AFB are $25,000 to $29,999 for men (147 | 24.1%) and $100,000+ for women (56 | 22.5%).
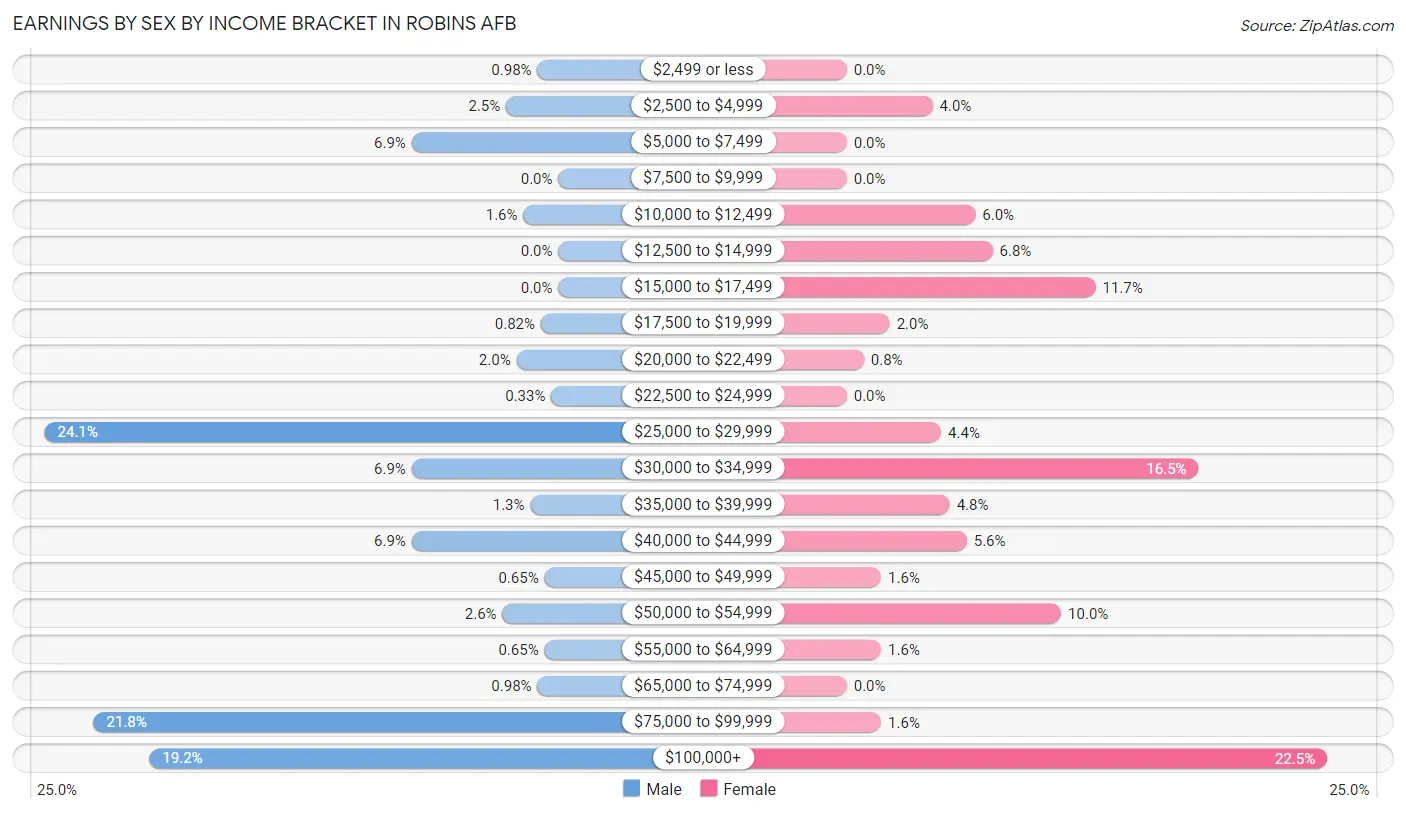
| Income | Male | Female |
| $2,499 or less | 6 (1.0%) | 0 (0.0%) |
| $2,500 to $4,999 | 15 (2.5%) | 10 (4.0%) |
| $5,000 to $7,499 | 42 (6.9%) | 0 (0.0%) |
| $7,500 to $9,999 | 0 (0.0%) | 0 (0.0%) |
| $10,000 to $12,499 | 10 (1.6%) | 15 (6.0%) |
| $12,500 to $14,999 | 0 (0.0%) | 17 (6.8%) |
| $15,000 to $17,499 | 0 (0.0%) | 29 (11.7%) |
| $17,500 to $19,999 | 5 (0.8%) | 5 (2.0%) |
| $20,000 to $22,499 | 12 (2.0%) | 2 (0.8%) |
| $22,500 to $24,999 | 2 (0.3%) | 0 (0.0%) |
| $25,000 to $29,999 | 147 (24.1%) | 11 (4.4%) |
| $30,000 to $34,999 | 42 (6.9%) | 41 (16.5%) |
| $35,000 to $39,999 | 8 (1.3%) | 12 (4.8%) |
| $40,000 to $44,999 | 42 (6.9%) | 14 (5.6%) |
| $45,000 to $49,999 | 4 (0.6%) | 4 (1.6%) |
| $50,000 to $54,999 | 16 (2.6%) | 25 (10.0%) |
| $55,000 to $64,999 | 4 (0.6%) | 4 (1.6%) |
| $65,000 to $74,999 | 6 (1.0%) | 0 (0.0%) |
| $75,000 to $99,999 | 133 (21.8%) | 4 (1.6%) |
| $100,000+ | 117 (19.2%) | 56 (22.5%) |
| Total | 611 (100.0%) | 249 (100.0%) |
Earnings by Sex by Educational Attainment in Robins AFB
Average earnings in Robins AFB are $79,162 for men and $51,375 for women, a difference of 35.1%. Men with an educational attainment of graduate degree enjoy the highest average annual earnings of $127,240, while those with high school diploma education earn the least with $28,889. Women with an educational attainment of graduate degree earn the most with the average annual earnings of $180,610, while those with bachelor's degree education have the smallest earnings of $15,455.
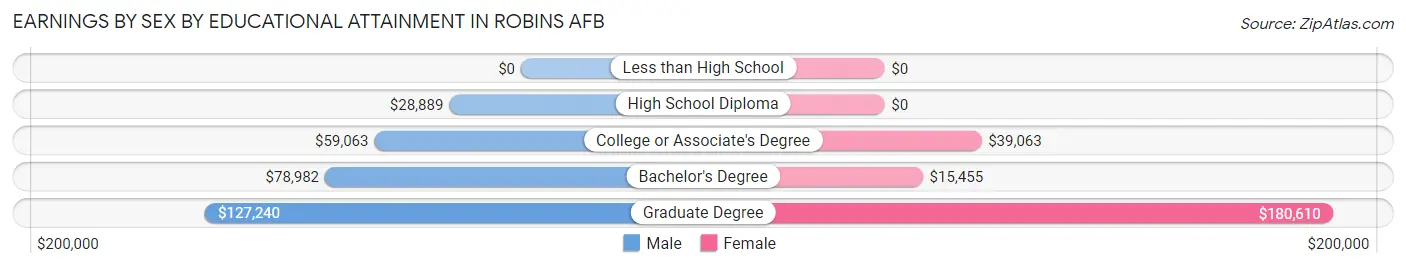
| Educational Attainment | Male Income | Female Income |
| Less than High School | - | - |
| High School Diploma | $28,889 | $0 |
| College or Associate's Degree | $59,063 | $39,063 |
| Bachelor's Degree | $78,982 | $15,455 |
| Graduate Degree | $127,240 | $180,610 |
| Total | $79,162 | $51,375 |
Family Income in Robins AFB
Family Income Brackets in Robins AFB
According to the Robins AFB family income data, there are 127 families falling into the $150,000 to $199,999 income range, which is the most common income bracket and makes up 42.8% of all families.
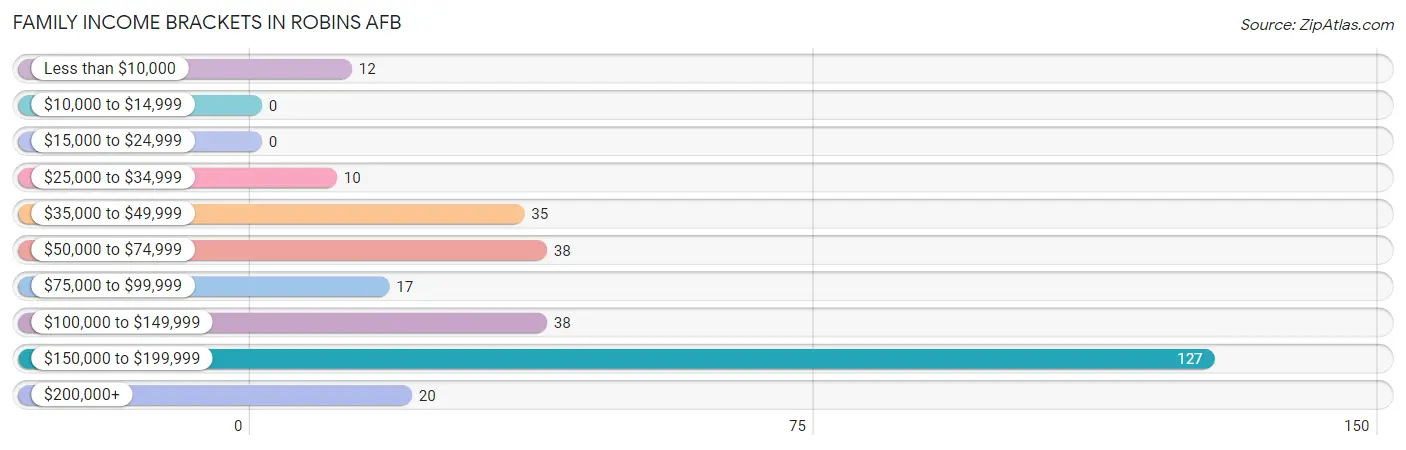
| Income Bracket | # Families | % Families |
| Less than $10,000 | 12 | 4.0% |
| $10,000 to $14,999 | 0 | 0.0% |
| $15,000 to $24,999 | 0 | 0.0% |
| $25,000 to $34,999 | 10 | 3.4% |
| $35,000 to $49,999 | 35 | 11.8% |
| $50,000 to $74,999 | 38 | 12.8% |
| $75,000 to $99,999 | 17 | 5.7% |
| $100,000 to $149,999 | 38 | 12.8% |
| $150,000 to $199,999 | 127 | 42.8% |
| $200,000+ | 20 | 6.7% |
Family Income by Famaliy Size in Robins AFB
2-person families (161 | 54.2%) account for the highest median family income in Robins AFB with $160,320 per family, while 2-person families (161 | 54.2%) have the highest median income of $80,160 per family member.
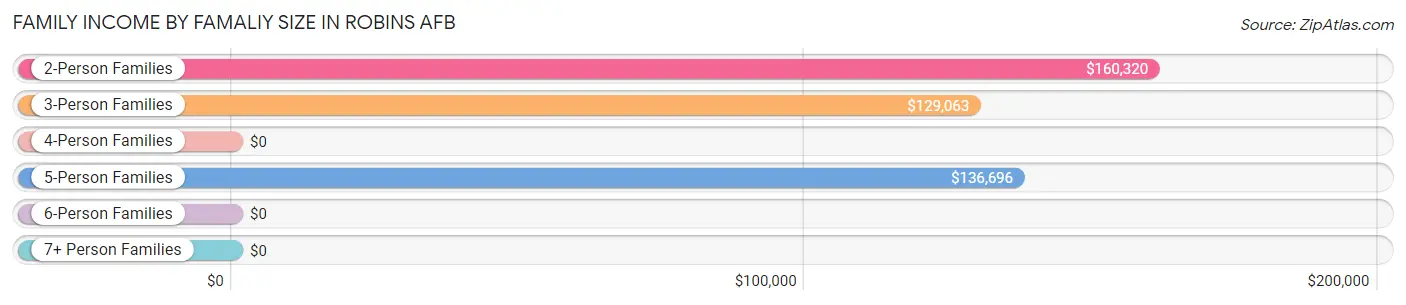
| Income Bracket | # Families | Median Income |
| 2-Person Families | 161 (54.2%) | $160,320 |
| 3-Person Families | 51 (17.2%) | $129,063 |
| 4-Person Families | 26 (8.7%) | $0 |
| 5-Person Families | 59 (19.9%) | $136,696 |
| 6-Person Families | 0 (0.0%) | $0 |
| 7+ Person Families | 0 (0.0%) | $0 |
| Total | 297 (100.0%) | $137,232 |
Family Income by Number of Earners in Robins AFB
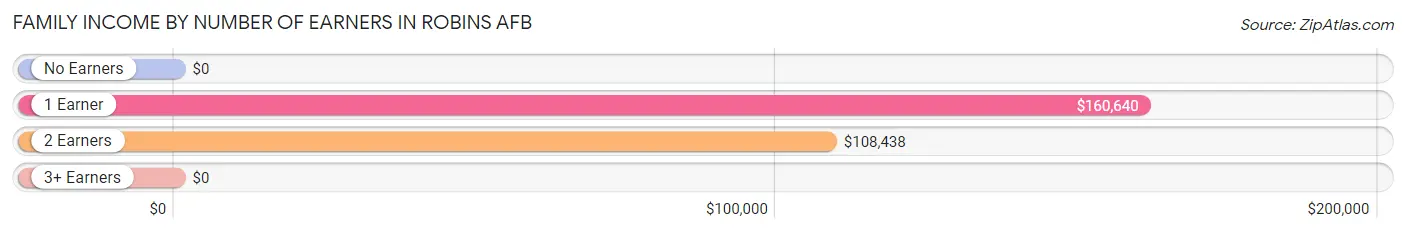
| Number of Earners | # Families | Median Income |
| No Earners | 12 (4.0%) | $0 |
| 1 Earner | 164 (55.2%) | $160,640 |
| 2 Earners | 121 (40.7%) | $108,438 |
| 3+ Earners | 0 (0.0%) | $0 |
| Total | 297 (100.0%) | $137,232 |
Household Income in Robins AFB
Household Income Brackets in Robins AFB
With 127 households falling in the category, the $150,000 to $199,999 income range is the most frequent in Robins AFB, accounting for 31.5% of all households.
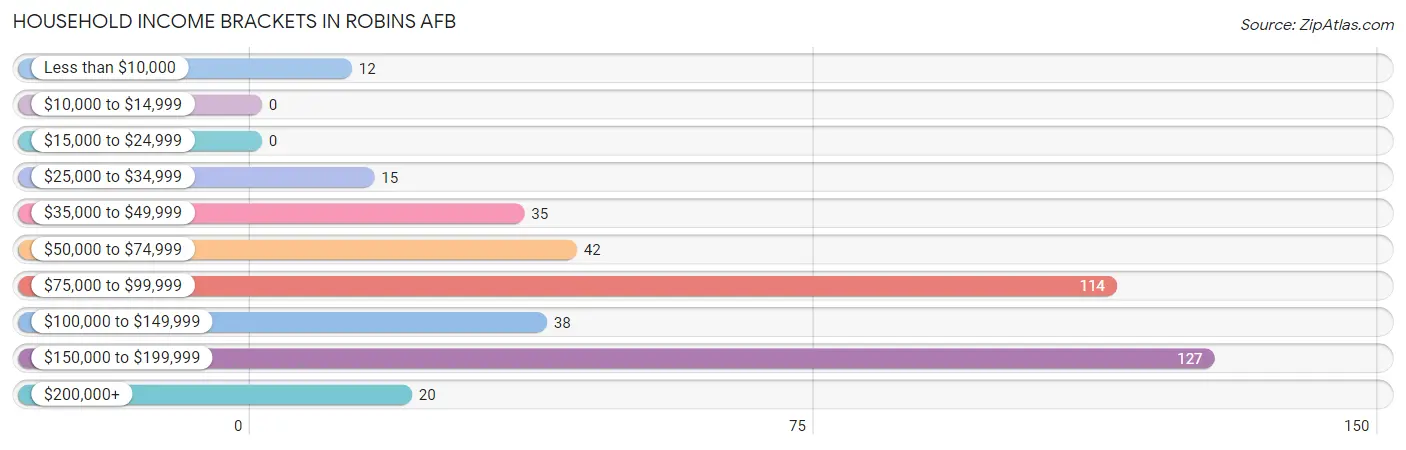
| Income Bracket | # Households | % Households |
| Less than $10,000 | 12 | 3.0% |
| $10,000 to $14,999 | 0 | 0.0% |
| $15,000 to $24,999 | 0 | 0.0% |
| $25,000 to $34,999 | 15 | 3.7% |
| $35,000 to $49,999 | 35 | 8.7% |
| $50,000 to $74,999 | 42 | 10.4% |
| $75,000 to $99,999 | 114 | 28.3% |
| $100,000 to $149,999 | 38 | 9.4% |
| $150,000 to $199,999 | 127 | 31.5% |
| $200,000+ | 20 | 5.0% |
Household Income by Householder Age in Robins AFB
The median household income in Robins AFB is $84,910, with the highest median household income of $180,029 found in the 45 to 64 years age bracket for the primary householder. A total of 121 households (30.0%) fall into this category.
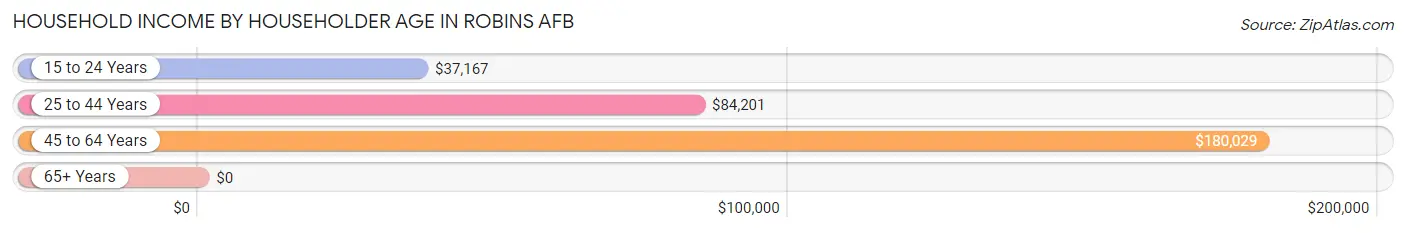
| Income Bracket | # Households | Median Income |
| 15 to 24 Years | 50 (12.4%) | $37,167 |
| 25 to 44 Years | 232 (57.6%) | $84,201 |
| 45 to 64 Years | 121 (30.0%) | $180,029 |
| 65+ Years | 0 (0.0%) | $0 |
| Total | 403 (100.0%) | $84,910 |
Poverty in Robins AFB
Income Below Poverty by Sex and Age in Robins AFB
With 4.8% poverty level for males and 6.0% for females among the residents of Robins AFB, 18 to 24 year old males and 25 to 34 year old females are the most vulnerable to poverty, with 12 males (23.1%) and 21 females (20.4%) in their respective age groups living below the poverty level.
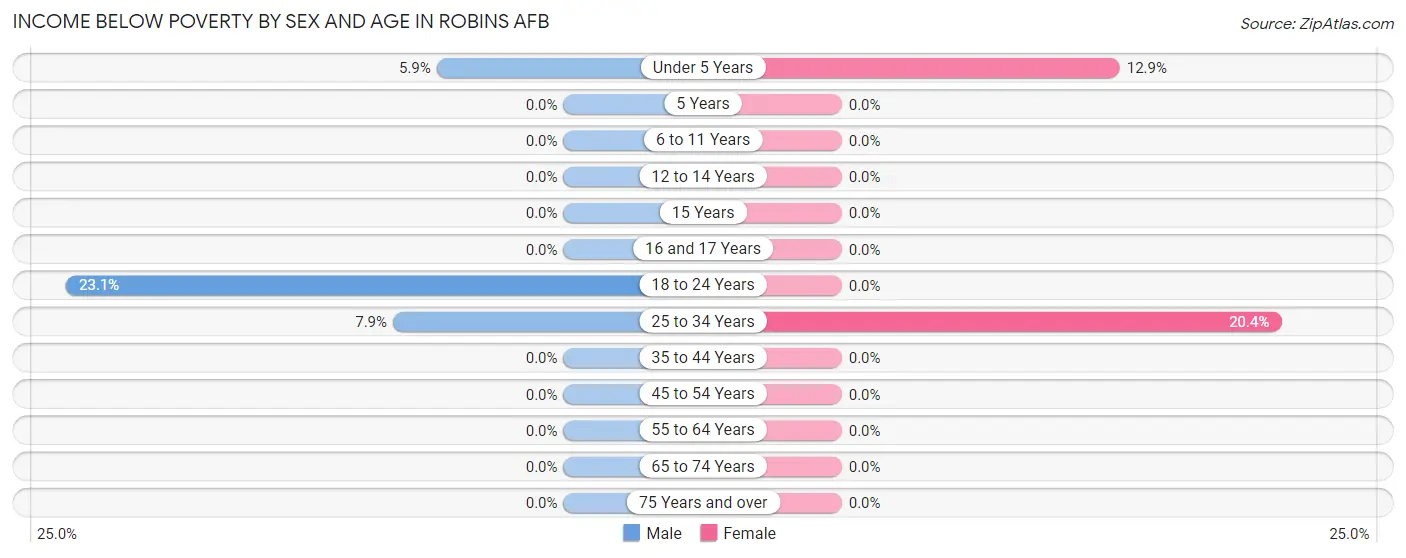
| Age Bracket | Male | Female |
| Under 5 Years | 4 (5.9%) | 4 (12.9%) |
| 5 Years | 0 (0.0%) | 0 (0.0%) |
| 6 to 11 Years | 0 (0.0%) | 0 (0.0%) |
| 12 to 14 Years | 0 (0.0%) | 0 (0.0%) |
| 15 Years | 0 (0.0%) | 0 (0.0%) |
| 16 and 17 Years | 0 (0.0%) | 0 (0.0%) |
| 18 to 24 Years | 12 (23.1%) | 0 (0.0%) |
| 25 to 34 Years | 11 (7.9%) | 21 (20.4%) |
| 35 to 44 Years | 0 (0.0%) | 0 (0.0%) |
| 45 to 54 Years | 0 (0.0%) | 0 (0.0%) |
| 55 to 64 Years | 0 (0.0%) | 0 (0.0%) |
| 65 to 74 Years | 0 (0.0%) | 0 (0.0%) |
| 75 Years and over | 0 (0.0%) | 0 (0.0%) |
| Total | 27 (4.8%) | 25 (6.0%) |
Income Above Poverty by Sex and Age in Robins AFB
According to the poverty statistics in Robins AFB, males aged 5 years and females aged 6 to 11 years are the age groups that are most secure financially, with 100.0% of males and 100.0% of females in these age groups living above the poverty line.
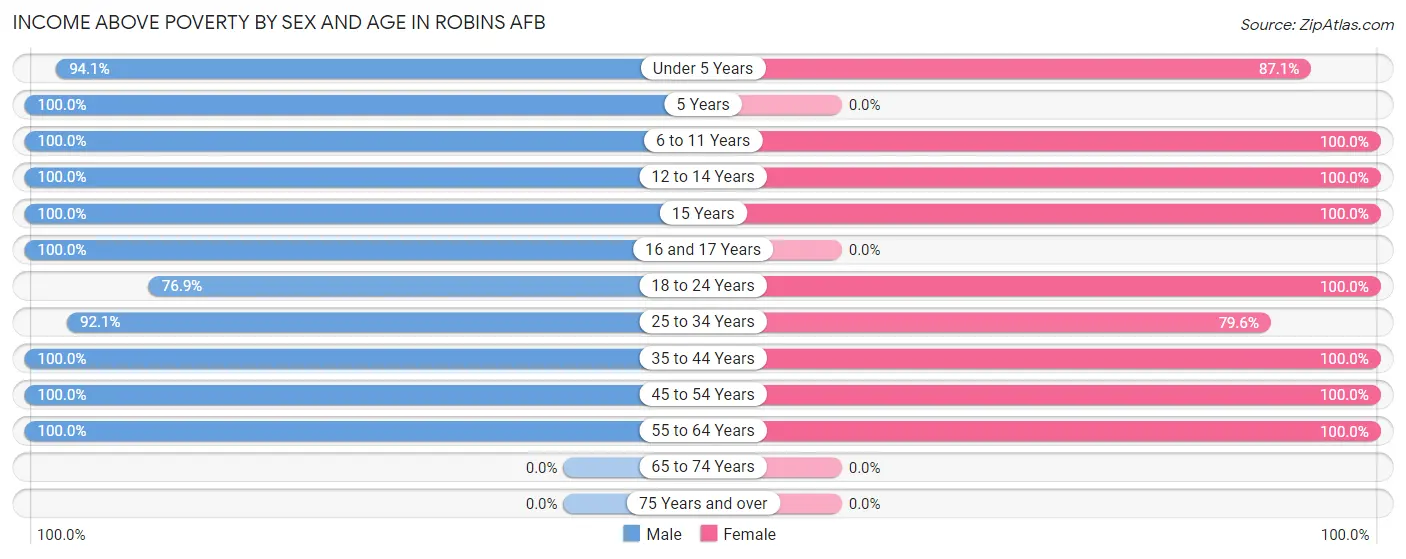
| Age Bracket | Male | Female |
| Under 5 Years | 64 (94.1%) | 27 (87.1%) |
| 5 Years | 20 (100.0%) | 0 (0.0%) |
| 6 to 11 Years | 44 (100.0%) | 65 (100.0%) |
| 12 to 14 Years | 25 (100.0%) | 20 (100.0%) |
| 15 Years | 12 (100.0%) | 5 (100.0%) |
| 16 and 17 Years | 6 (100.0%) | 0 (0.0%) |
| 18 to 24 Years | 40 (76.9%) | 39 (100.0%) |
| 25 to 34 Years | 128 (92.1%) | 82 (79.6%) |
| 35 to 44 Years | 72 (100.0%) | 40 (100.0%) |
| 45 to 54 Years | 75 (100.0%) | 59 (100.0%) |
| 55 to 64 Years | 50 (100.0%) | 53 (100.0%) |
| 65 to 74 Years | 0 (0.0%) | 0 (0.0%) |
| 75 Years and over | 0 (0.0%) | 0 (0.0%) |
| Total | 536 (95.2%) | 390 (94.0%) |
Income Below Poverty Among Married-Couple Families in Robins AFB
The poverty statistics for married-couple families in Robins AFB show that 6.4% or 17 of the total 265 families live below the poverty line. Families with 1 or 2 children have the highest poverty rate of 11.1%, comprising of 5 families. On the other hand, families with 3 or 4 children have the lowest poverty rate of 0.0%, which includes 0 families.
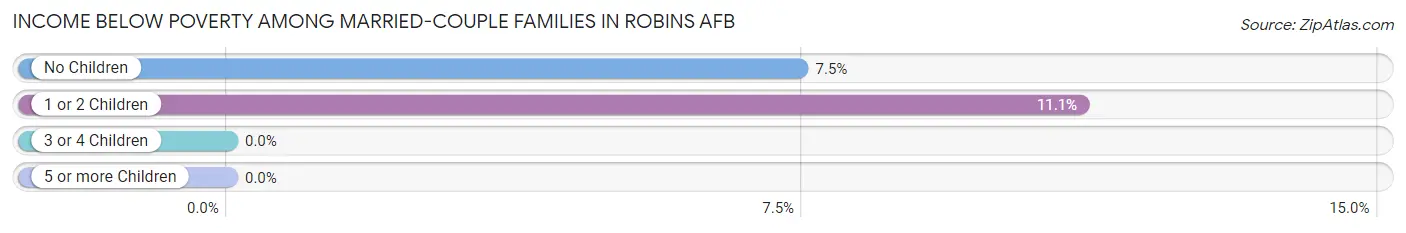
| Children | Above Poverty | Below Poverty |
| No Children | 149 (92.5%) | 12 (7.4%) |
| 1 or 2 Children | 40 (88.9%) | 5 (11.1%) |
| 3 or 4 Children | 59 (100.0%) | 0 (0.0%) |
| 5 or more Children | 0 (0.0%) | 0 (0.0%) |
| Total | 248 (93.6%) | 17 (6.4%) |
Income Below Poverty Among Single-Parent Households in Robins AFB
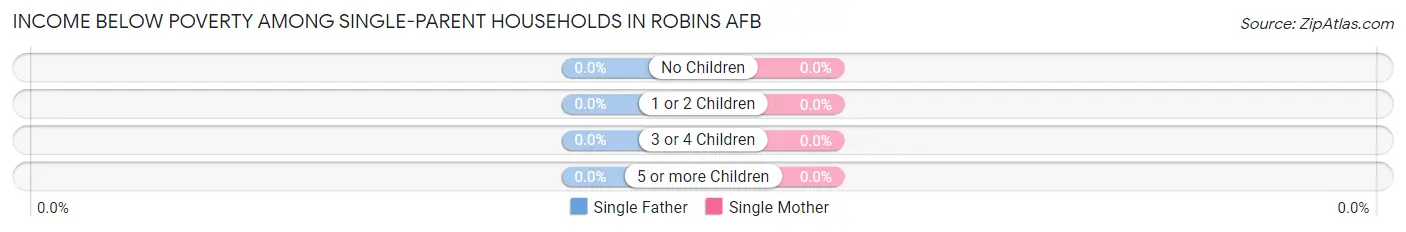
| Children | Single Father | Single Mother |
| No Children | 0 (0.0%) | 0 (0.0%) |
| 1 or 2 Children | 0 (0.0%) | 0 (0.0%) |
| 3 or 4 Children | 0 (0.0%) | 0 (0.0%) |
| 5 or more Children | 0 (0.0%) | 0 (0.0%) |
| Total | 0 (0.0%) | 0 (0.0%) |
Income Below Poverty Among Married-Couple vs Single-Parent Households in Robins AFB
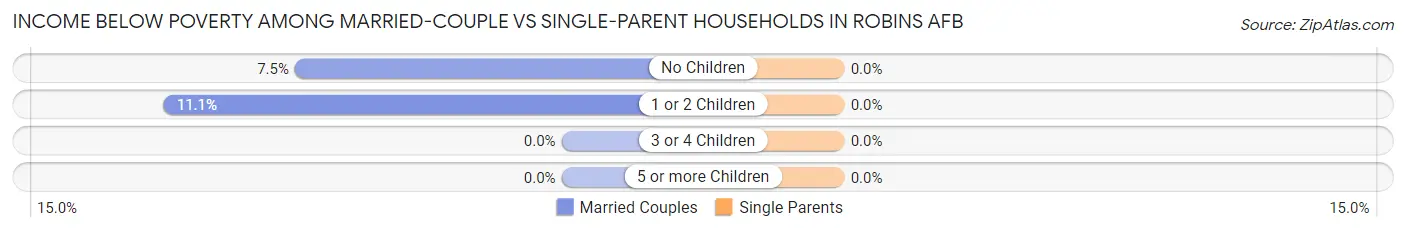
| Children | Married-Couple Families | Single-Parent Households |
| No Children | 12 (7.4%) | 0 (0.0%) |
| 1 or 2 Children | 5 (11.1%) | 0 (0.0%) |
| 3 or 4 Children | 0 (0.0%) | 0 (0.0%) |
| 5 or more Children | 0 (0.0%) | 0 (0.0%) |
| Total | 17 (6.4%) | 0 (0.0%) |
Race in Robins AFB
The most populous races in Robins AFB are White / Caucasian (877 | 66.6%), Black / African American (193 | 14.7%), and Two or more Races (111 | 8.4%).
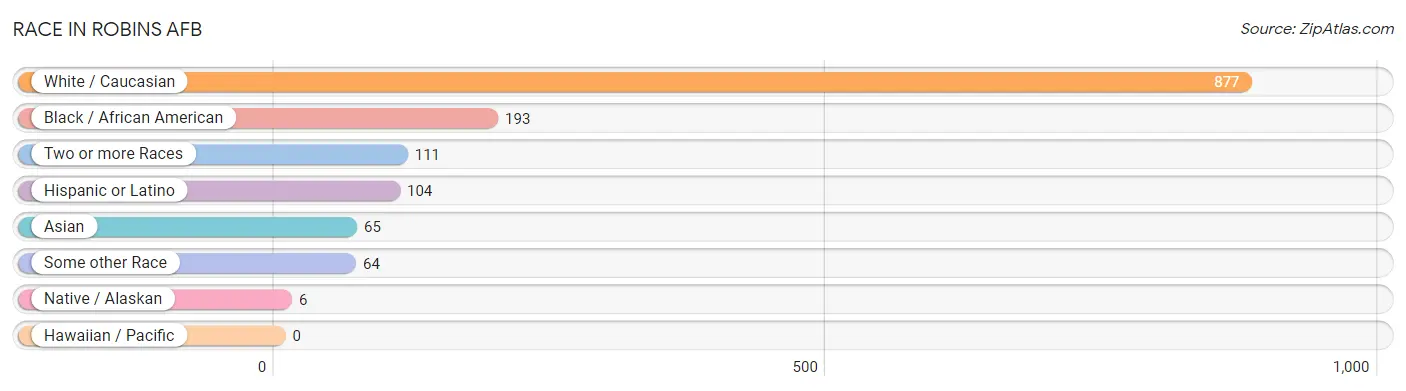
| Race | # Population | % Population |
| Asian | 65 | 4.9% |
| Black / African American | 193 | 14.7% |
| Hawaiian / Pacific | 0 | 0.0% |
| Hispanic or Latino | 104 | 7.9% |
| Native / Alaskan | 6 | 0.5% |
| White / Caucasian | 877 | 66.6% |
| Two or more Races | 111 | 8.4% |
| Some other Race | 64 | 4.9% |
| Total | 1,316 | 100.0% |
Ancestry in Robins AFB
The most populous ancestries reported in Robins AFB are Scottish (102 | 7.7%), Welsh (97 | 7.4%), German (91 | 6.9%), European (89 | 6.8%), and Mexican (82 | 6.2%), together accounting for 35.0% of all Robins AFB residents.
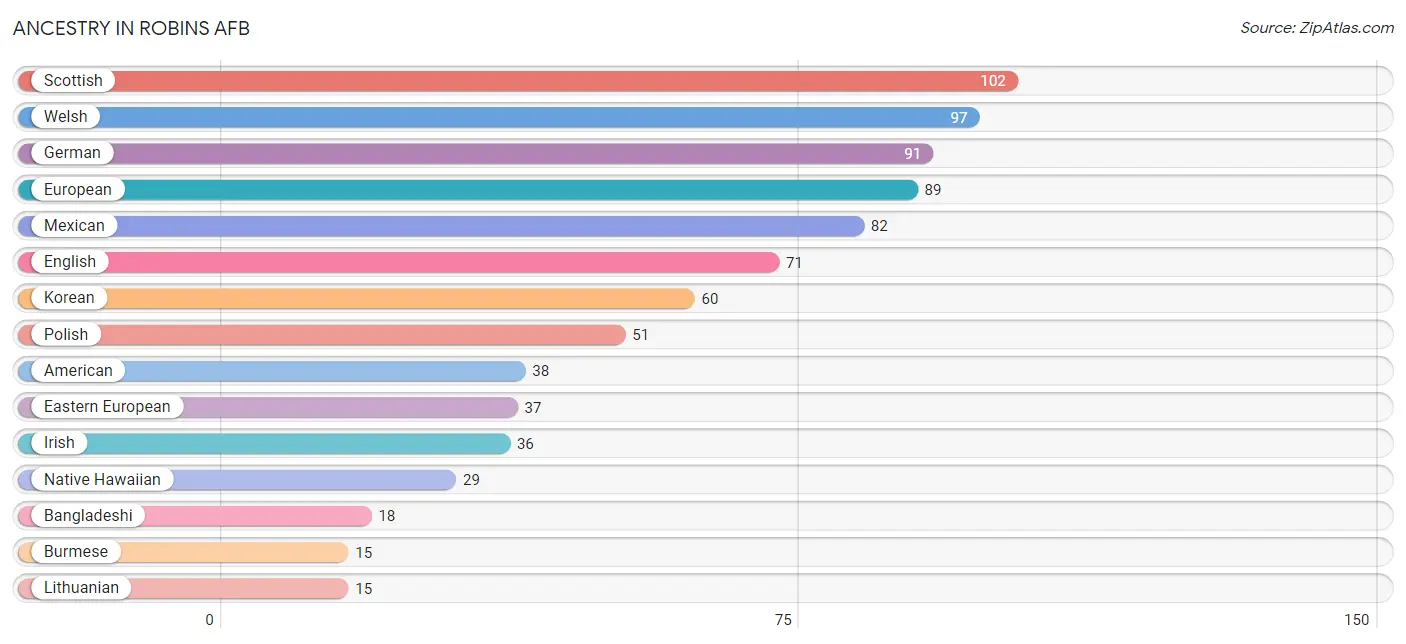
| Ancestry | # Population | % Population |
| American | 38 | 2.9% |
| Bangladeshi | 18 | 1.4% |
| Brazilian | 9 | 0.7% |
| Burmese | 15 | 1.1% |
| Dominican | 4 | 0.3% |
| Eastern European | 37 | 2.8% |
| English | 71 | 5.4% |
| European | 89 | 6.8% |
| Finnish | 4 | 0.3% |
| French | 2 | 0.2% |
| German | 91 | 6.9% |
| Irish | 36 | 2.7% |
| Israeli | 12 | 0.9% |
| Jamaican | 4 | 0.3% |
| Korean | 60 | 4.6% |
| Lithuanian | 15 | 1.1% |
| Mexican | 82 | 6.2% |
| Native Hawaiian | 29 | 2.2% |
| Northern European | 3 | 0.2% |
| Norwegian | 14 | 1.1% |
| Polish | 51 | 3.9% |
| Portuguese | 5 | 0.4% |
| Puerto Rican | 4 | 0.3% |
| Scottish | 102 | 7.7% |
| Sri Lankan | 11 | 0.8% |
| Swedish | 4 | 0.3% |
| Thai | 11 | 0.8% |
| Trinidadian and Tobagonian | 2 | 0.2% |
| Welsh | 97 | 7.4% | View All 29 Rows |
Immigrants in Robins AFB
The most numerous immigrant groups reported in Robins AFB came from Asia (45 | 3.4%), Philippines (45 | 3.4%), South Eastern Asia (45 | 3.4%), Latin America (18 | 1.4%), and Central America (16 | 1.2%), together accounting for 12.9% of all Robins AFB residents.
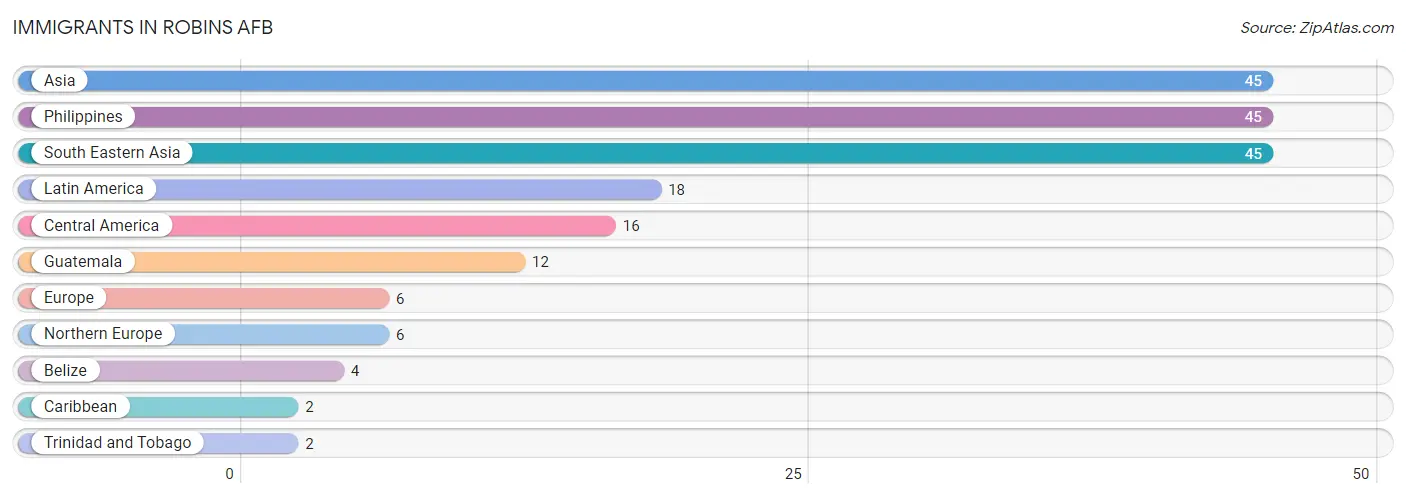
| Immigration Origin | # Population | % Population |
| Asia | 45 | 3.4% |
| Belize | 4 | 0.3% |
| Caribbean | 2 | 0.2% |
| Central America | 16 | 1.2% |
| Europe | 6 | 0.5% |
| Guatemala | 12 | 0.9% |
| Latin America | 18 | 1.4% |
| Northern Europe | 6 | 0.5% |
| Philippines | 45 | 3.4% |
| South Eastern Asia | 45 | 3.4% |
| Trinidad and Tobago | 2 | 0.2% | View All 11 Rows |
Sex and Age in Robins AFB
Sex and Age in Robins AFB
The most populous age groups in Robins AFB are 20 to 24 Years (203 | 23.9%) for men and 30 to 34 Years (66 | 14.1%) for women.
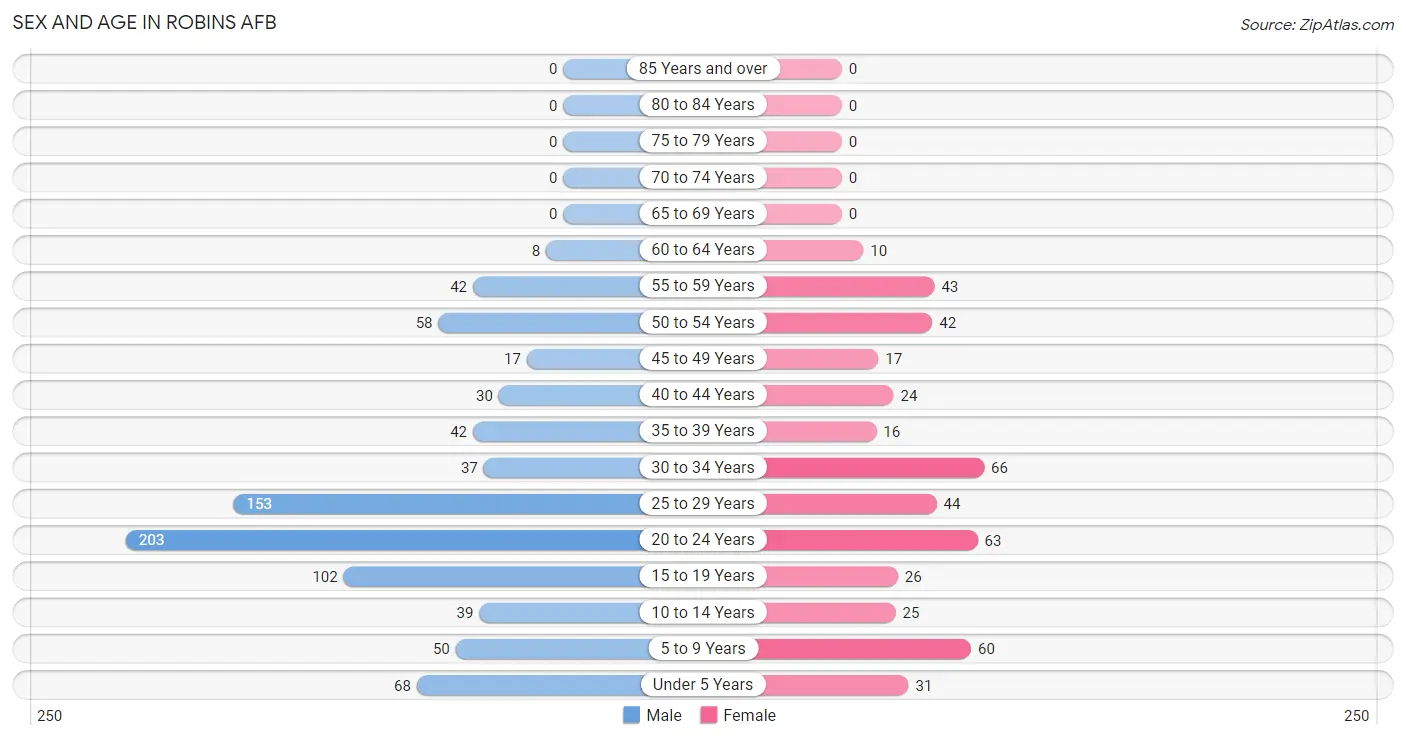
| Age Bracket | Male | Female |
| Under 5 Years | 68 (8.0%) | 31 (6.6%) |
| 5 to 9 Years | 50 (5.9%) | 60 (12.9%) |
| 10 to 14 Years | 39 (4.6%) | 25 (5.3%) |
| 15 to 19 Years | 102 (12.0%) | 26 (5.6%) |
| 20 to 24 Years | 203 (23.9%) | 63 (13.5%) |
| 25 to 29 Years | 153 (18.0%) | 44 (9.4%) |
| 30 to 34 Years | 37 (4.4%) | 66 (14.1%) |
| 35 to 39 Years | 42 (5.0%) | 16 (3.4%) |
| 40 to 44 Years | 30 (3.5%) | 24 (5.1%) |
| 45 to 49 Years | 17 (2.0%) | 17 (3.6%) |
| 50 to 54 Years | 58 (6.8%) | 42 (9.0%) |
| 55 to 59 Years | 42 (5.0%) | 43 (9.2%) |
| 60 to 64 Years | 8 (0.9%) | 10 (2.1%) |
| 65 to 69 Years | 0 (0.0%) | 0 (0.0%) |
| 70 to 74 Years | 0 (0.0%) | 0 (0.0%) |
| 75 to 79 Years | 0 (0.0%) | 0 (0.0%) |
| 80 to 84 Years | 0 (0.0%) | 0 (0.0%) |
| 85 Years and over | 0 (0.0%) | 0 (0.0%) |
| Total | 849 (100.0%) | 467 (100.0%) |
Families and Households in Robins AFB
Median Family Size in Robins AFB
The median family size in Robins AFB is 2.92 persons per family, with married-couple families (265 | 89.2%) accounting for the largest median family size of 2.96 persons per family. On the other hand, single female/mother families (18 | 6.1%) represent the smallest median family size with 2.44 persons per family.
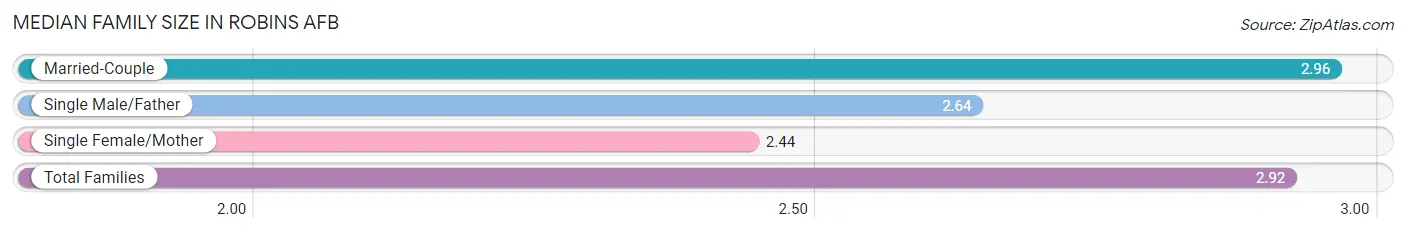
| Family Type | # Families | Family Size |
| Married-Couple | 265 (89.2%) | 2.96 |
| Single Male/Father | 14 (4.7%) | 2.64 |
| Single Female/Mother | 18 (6.1%) | 2.44 |
| Total Families | 297 (100.0%) | 2.92 |
Median Household Size in Robins AFB
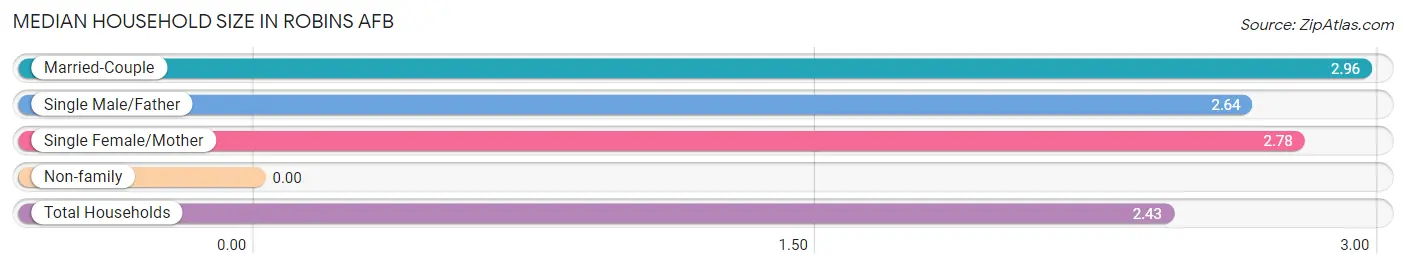
| Household Type | # Households | Household Size |
| Married-Couple | 265 (65.8%) | 2.96 |
| Single Male/Father | 14 (3.5%) | 2.64 |
| Single Female/Mother | 18 (4.5%) | 2.78 |
| Non-family | 106 (26.3%) | - |
| Total Households | 403 (100.0%) | 2.43 |
Household Size by Marriage Status in Robins AFB
Out of a total of 403 households in Robins AFB, 297 (73.7%) are family households, while 106 (26.3%) are nonfamily households. The most numerous type of family households are 2-person households, comprising 161, and the most common type of nonfamily households are 1-person households, comprising 106.
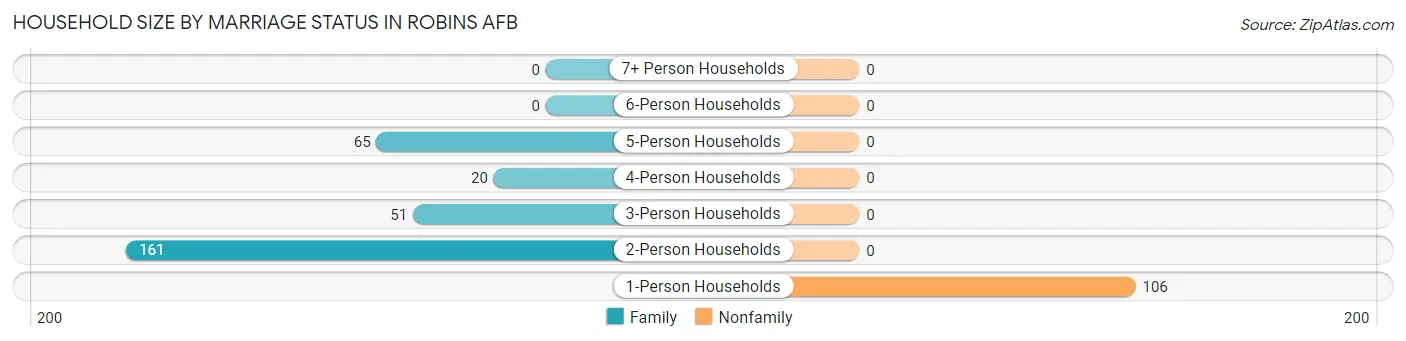
| Household Size | Family Households | Nonfamily Households |
| 1-Person Households | - | 106 (26.3%) |
| 2-Person Households | 161 (40.0%) | 0 (0.0%) |
| 3-Person Households | 51 (12.7%) | 0 (0.0%) |
| 4-Person Households | 20 (5.0%) | 0 (0.0%) |
| 5-Person Households | 65 (16.1%) | 0 (0.0%) |
| 6-Person Households | 0 (0.0%) | 0 (0.0%) |
| 7+ Person Households | 0 (0.0%) | 0 (0.0%) |
| Total | 297 (73.7%) | 106 (26.3%) |
Female Fertility in Robins AFB
Fertility by Age in Robins AFB
Average fertility rate in Robins AFB is 47.0 births per 1,000 women. Women in the age bracket of 20 to 34 years have the highest fertility rate with 69.0 births per 1,000 women. Women in the age bracket of 20 to 34 years acount for 100.0% of all women with births.
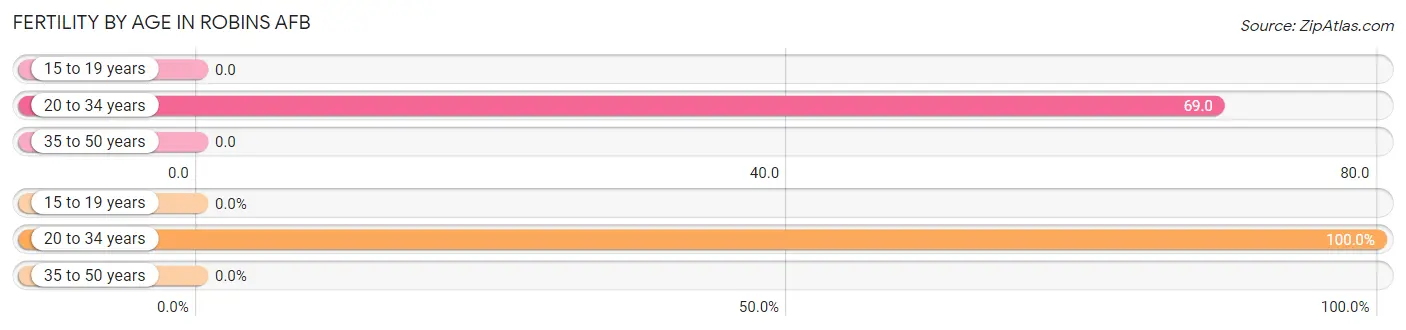
| Age Bracket | Women with Births | Births / 1,000 Women |
| 15 to 19 years | 0 (0.0%) | 0.0 |
| 20 to 34 years | 12 (100.0%) | 69.0 |
| 35 to 50 years | 0 (0.0%) | 0.0 |
| Total | 12 (100.0%) | 47.0 |
Fertility by Age by Marriage Status in Robins AFB
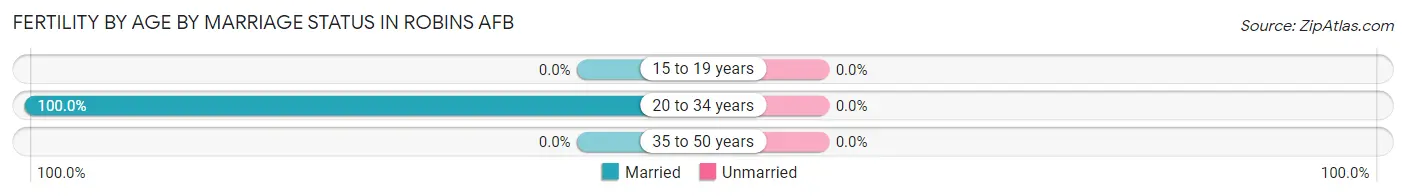
| Age Bracket | Married | Unmarried |
| 15 to 19 years | 0 (0.0%) | 0 (0.0%) |
| 20 to 34 years | 12 (100.0%) | 0 (0.0%) |
| 35 to 50 years | 0 (0.0%) | 0 (0.0%) |
| Total | 12 (100.0%) | 0 (0.0%) |
Fertility by Education in Robins AFB
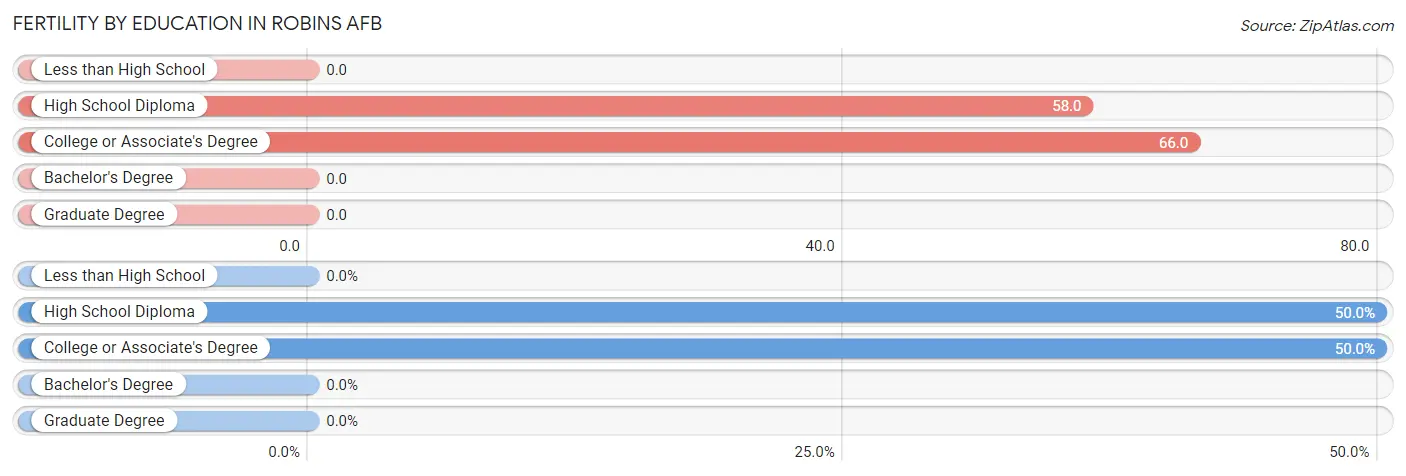
| Educational Attainment | Women with Births | Births / 1,000 Women |
| Less than High School | 0 (0.0%) | 0.0 |
| High School Diploma | 6 (50.0%) | 58.0 |
| College or Associate's Degree | 6 (50.0%) | 66.0 |
| Bachelor's Degree | 0 (0.0%) | 0.0 |
| Graduate Degree | 0 (0.0%) | 0.0 |
| Total | 12 (100.0%) | 47.0 |
Fertility by Education by Marriage Status in Robins AFB
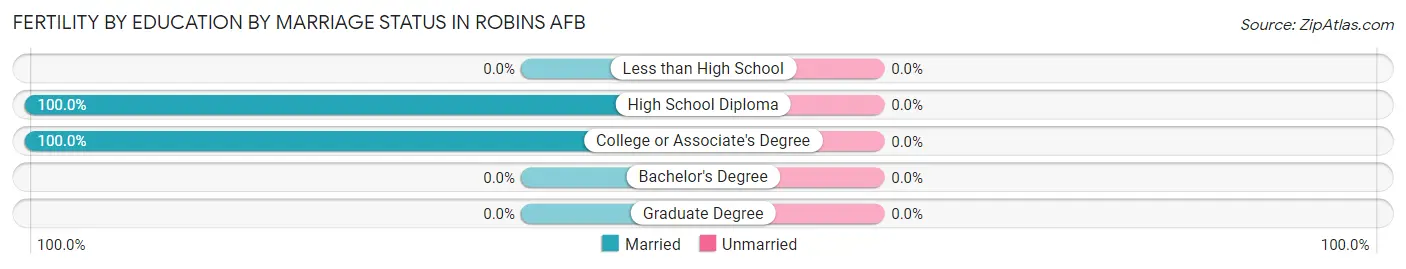
| Educational Attainment | Married | Unmarried |
| Less than High School | 0 (0.0%) | 0 (0.0%) |
| High School Diploma | 6 (100.0%) | 0 (0.0%) |
| College or Associate's Degree | 6 (100.0%) | 0 (0.0%) |
| Bachelor's Degree | 0 (0.0%) | 0 (0.0%) |
| Graduate Degree | 0 (0.0%) | 0 (0.0%) |
| Total | 12 (100.0%) | 0 (0.0%) |
Employment Characteristics in Robins AFB
Employment by Class of Employer in Robins AFB
Among the 831 employed individuals in Robins AFB, federal government employees (693 | 83.4%), private company employees (102 | 12.3%), and local government employees (27 | 3.3%) make up the most common classes of employment.
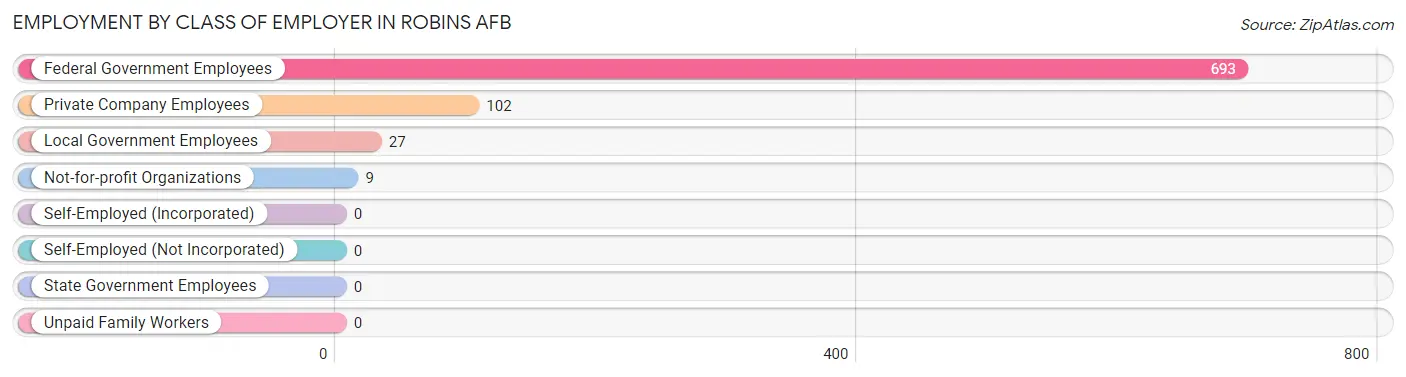
| Employer Class | # Employees | % Employees |
| Private Company Employees | 102 | 12.3% |
| Self-Employed (Incorporated) | 0 | 0.0% |
| Self-Employed (Not Incorporated) | 0 | 0.0% |
| Not-for-profit Organizations | 9 | 1.1% |
| Local Government Employees | 27 | 3.3% |
| State Government Employees | 0 | 0.0% |
| Federal Government Employees | 693 | 83.4% |
| Unpaid Family Workers | 0 | 0.0% |
| Total | 831 | 100.0% |
Employment Status by Age in Robins AFB
According to the labor force statistics for Robins AFB, out of the total population over 16 years of age (1,026), 83.4% or 856 individuals are in the labor force, with 7.4% or 63 of them unemployed. The age group with the highest labor force participation rate is 60 to 64 years, with 100.0% or 18 individuals in the labor force. Within the labor force, the 20 to 24 years age range has the highest percentage of unemployed individuals, with 30.6% or 77 of them being unemployed.
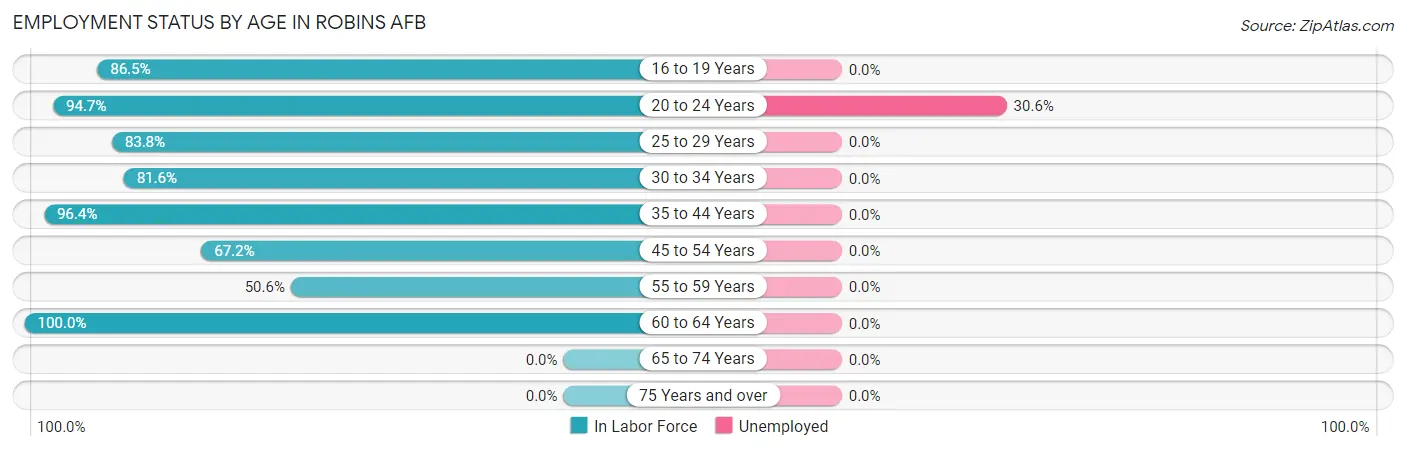
| Age Bracket | In Labor Force | Unemployed |
| 16 to 19 Years | 96 (86.5%) | 0 (0.0%) |
| 20 to 24 Years | 252 (94.7%) | 77 (30.6%) |
| 25 to 29 Years | 165 (83.8%) | 0 (0.0%) |
| 30 to 34 Years | 84 (81.6%) | 0 (0.0%) |
| 35 to 44 Years | 108 (96.4%) | 0 (0.0%) |
| 45 to 54 Years | 90 (67.2%) | 0 (0.0%) |
| 55 to 59 Years | 43 (50.6%) | 0 (0.0%) |
| 60 to 64 Years | 18 (100.0%) | 0 (0.0%) |
| 65 to 74 Years | 0 (0.0%) | 0 (0.0%) |
| 75 Years and over | 0 (0.0%) | 0 (0.0%) |
| Total | 856 (83.4%) | 63 (7.4%) |
Employment Status by Educational Attainment in Robins AFB
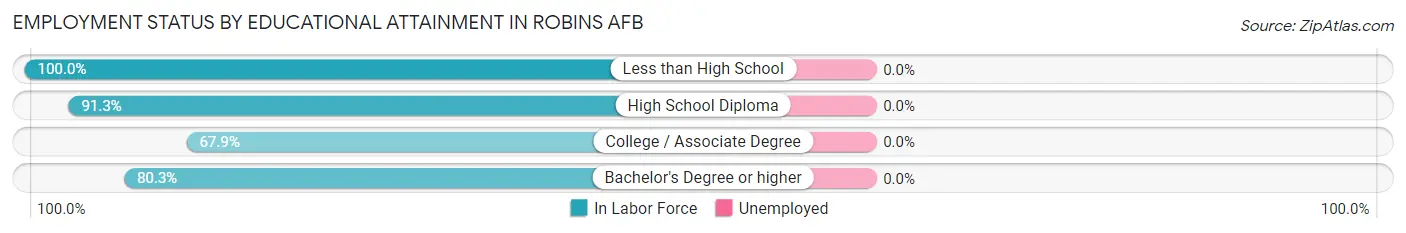
| Educational Attainment | In Labor Force | Unemployed |
| Less than High School | 7 (100.0%) | 0 (0.0%) |
| High School Diploma | 42 (91.3%) | 0 (0.0%) |
| College / Associate Degree | 108 (67.9%) | 0 (0.0%) |
| Bachelor's Degree or higher | 351 (80.3%) | 0 (0.0%) |
| Total | 508 (78.3%) | 0 (0.0%) |
Employment Occupations by Sex in Robins AFB
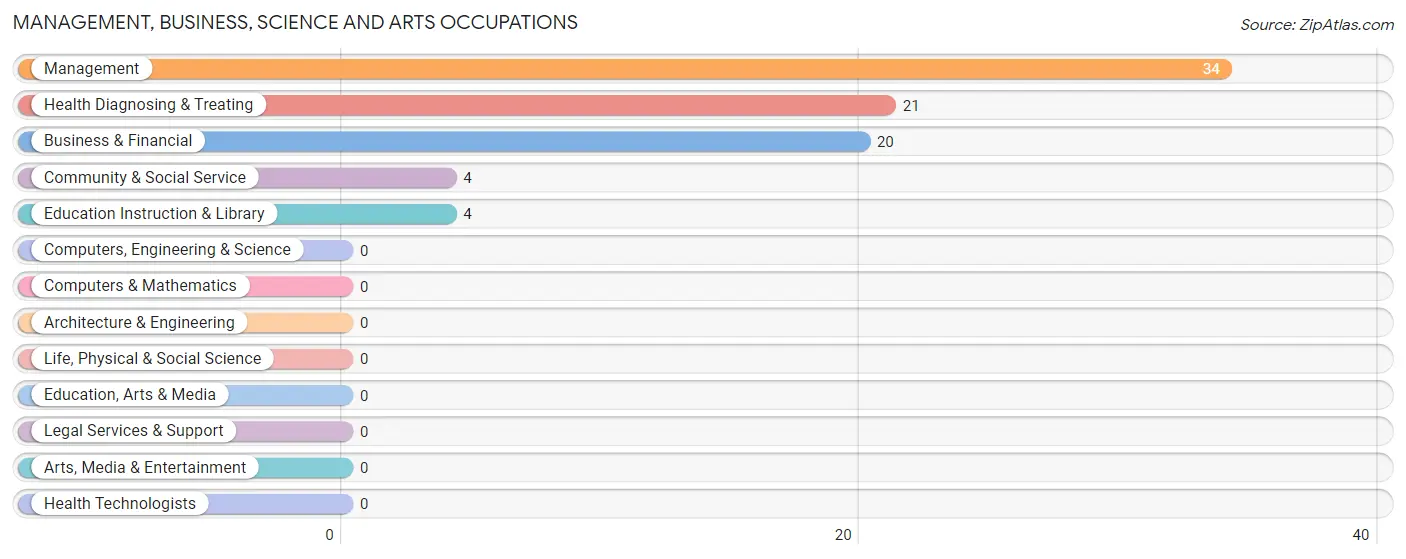
Management, Business, Science and Arts Occupations
The most common Management, Business, Science and Arts occupations in Robins AFB are Management (34 | 18.1%), Health Diagnosing & Treating (21 | 11.2%), Business & Financial (20 | 10.6%), Community & Social Service (4 | 2.1%), and Education Instruction & Library (4 | 2.1%).
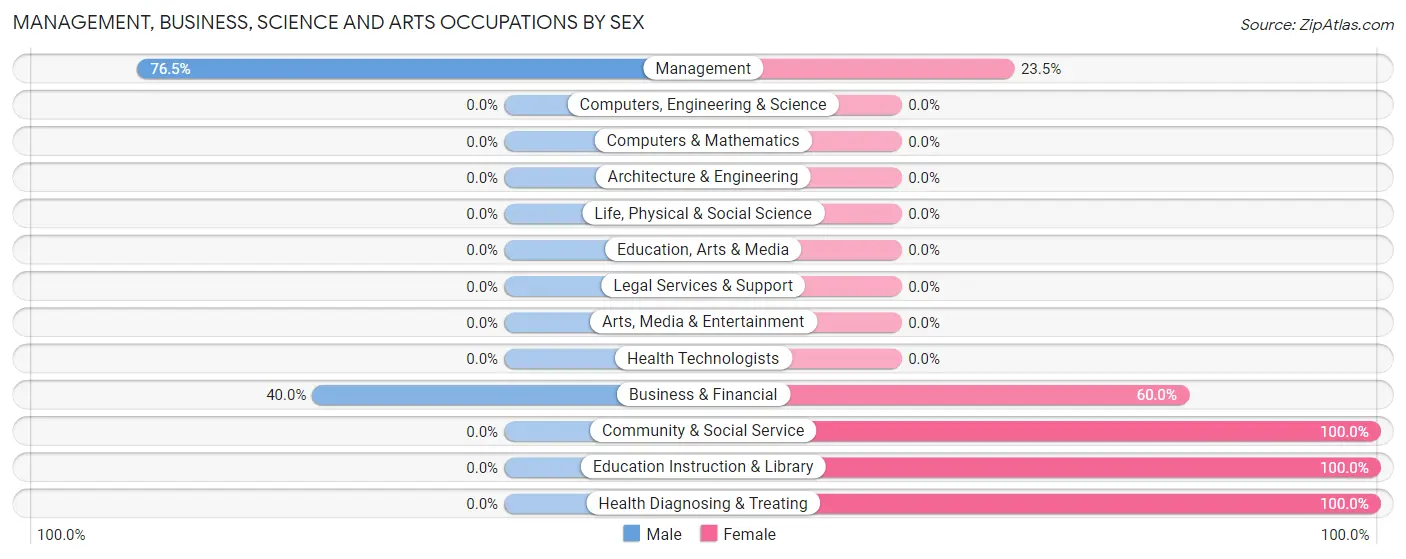
Management, Business, Science and Arts Occupations by Sex
Within the Management, Business, Science and Arts occupations in Robins AFB, the most male-oriented occupations are Management (76.5%), and Business & Financial (40.0%), while the most female-oriented occupations are Community & Social Service (100.0%), Education Instruction & Library (100.0%), and Health Diagnosing & Treating (100.0%).
| Occupation | Male | Female |
| Management | 26 (76.5%) | 8 (23.5%) |
| Business & Financial | 8 (40.0%) | 12 (60.0%) |
| Computers, Engineering & Science | 0 (0.0%) | 0 (0.0%) |
| Computers & Mathematics | 0 (0.0%) | 0 (0.0%) |
| Architecture & Engineering | 0 (0.0%) | 0 (0.0%) |
| Life, Physical & Social Science | 0 (0.0%) | 0 (0.0%) |
| Community & Social Service | 0 (0.0%) | 4 (100.0%) |
| Education, Arts & Media | 0 (0.0%) | 0 (0.0%) |
| Legal Services & Support | 0 (0.0%) | 0 (0.0%) |
| Education Instruction & Library | 0 (0.0%) | 4 (100.0%) |
| Arts, Media & Entertainment | 0 (0.0%) | 0 (0.0%) |
| Health Diagnosing & Treating | 0 (0.0%) | 21 (100.0%) |
| Health Technologists | 0 (0.0%) | 0 (0.0%) |
| Total (Category) | 34 (43.0%) | 45 (57.0%) |
| Total (Overall) | 54 (28.7%) | 134 (71.3%) |
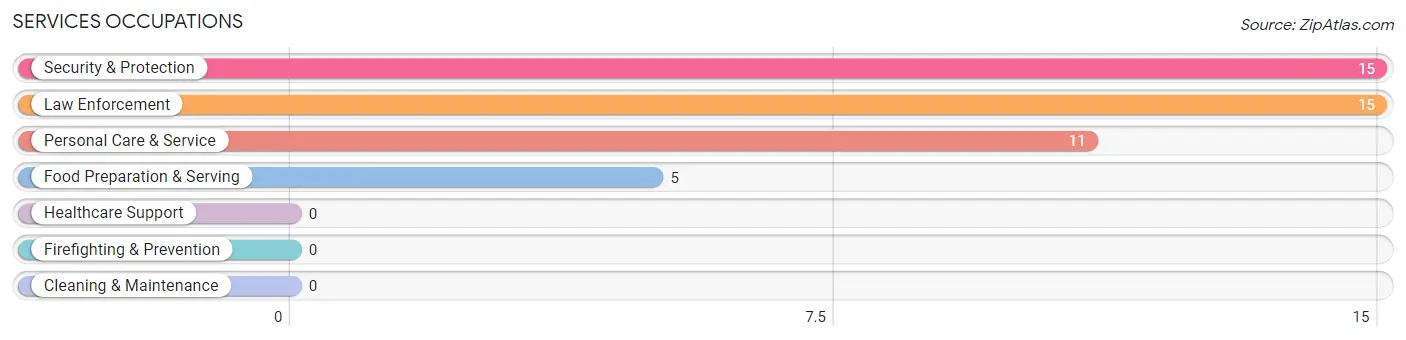
Services Occupations
The most common Services occupations in Robins AFB are Security & Protection (15 | 8.0%), Law Enforcement (15 | 8.0%), Personal Care & Service (11 | 5.9%), and Food Preparation & Serving (5 | 2.7%).
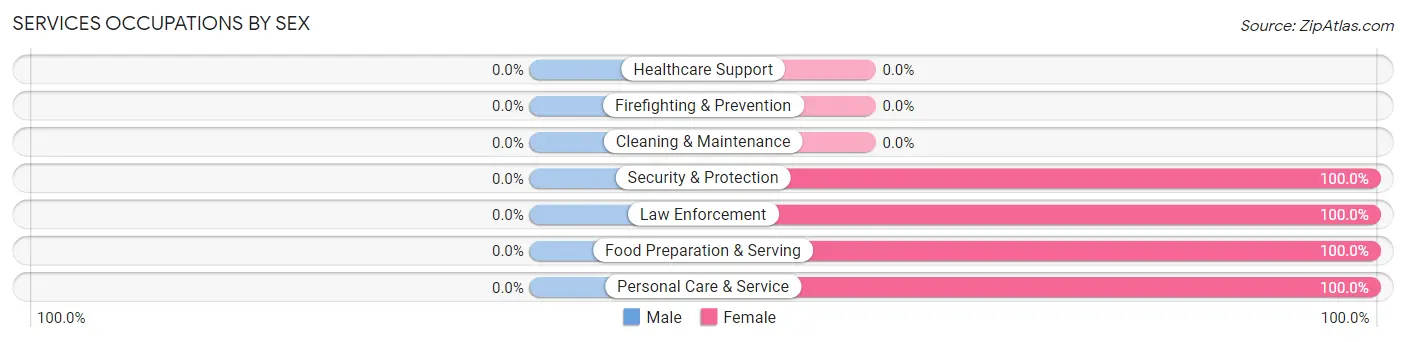
Services Occupations by Sex
| Occupation | Male | Female |
| Healthcare Support | 0 (0.0%) | 0 (0.0%) |
| Security & Protection | 0 (0.0%) | 15 (100.0%) |
| Firefighting & Prevention | 0 (0.0%) | 0 (0.0%) |
| Law Enforcement | 0 (0.0%) | 15 (100.0%) |
| Food Preparation & Serving | 0 (0.0%) | 5 (100.0%) |
| Cleaning & Maintenance | 0 (0.0%) | 0 (0.0%) |
| Personal Care & Service | 0 (0.0%) | 11 (100.0%) |
| Total (Category) | 0 (0.0%) | 31 (100.0%) |
| Total (Overall) | 54 (28.7%) | 134 (71.3%) |
Sales and Office Occupations
The most common Sales and Office occupations in Robins AFB are Sales & Related (39 | 20.7%), and Office & Administration (16 | 8.5%).
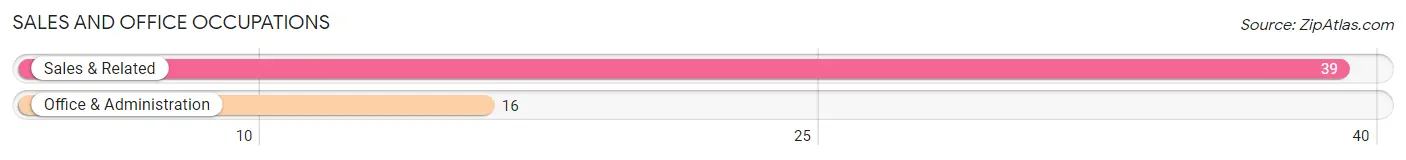
Sales and Office Occupations by Sex
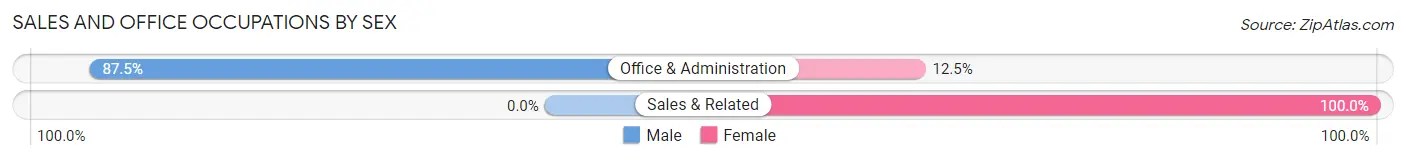
| Occupation | Male | Female |
| Sales & Related | 0 (0.0%) | 39 (100.0%) |
| Office & Administration | 14 (87.5%) | 2 (12.5%) |
| Total (Category) | 14 (25.5%) | 41 (74.6%) |
| Total (Overall) | 54 (28.7%) | 134 (71.3%) |
Natural Resources, Construction and Maintenance Occupations
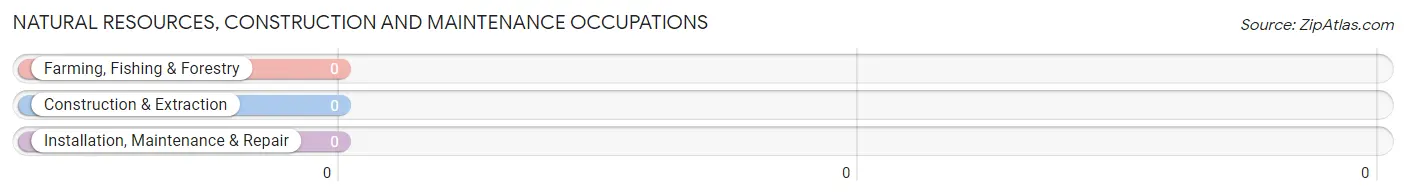
Natural Resources, Construction and Maintenance Occupations by Sex
| Occupation | Male | Female |
| Farming, Fishing & Forestry | 0 (0.0%) | 0 (0.0%) |
| Construction & Extraction | 0 (0.0%) | 0 (0.0%) |
| Installation, Maintenance & Repair | 0 (0.0%) | 0 (0.0%) |
| Total (Category) | 0 (0.0%) | 0 (0.0%) |
| Total (Overall) | 54 (28.7%) | 134 (71.3%) |
Production, Transportation and Moving Occupations
The most common Production, Transportation and Moving occupations in Robins AFB are Material Moving (16 | 8.5%), and Production (7 | 3.7%).
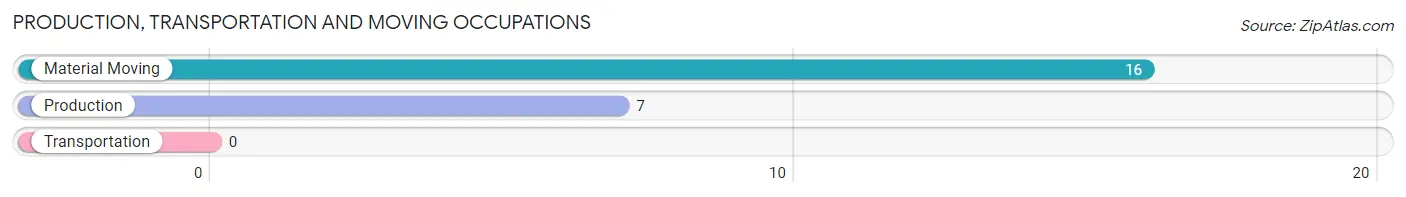
Production, Transportation and Moving Occupations by Sex
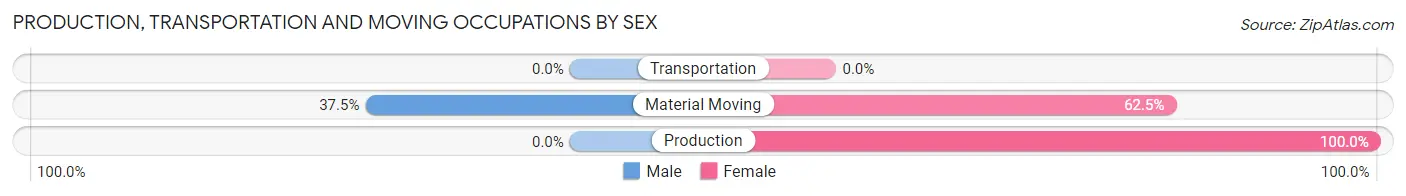
| Occupation | Male | Female |
| Production | 0 (0.0%) | 7 (100.0%) |
| Transportation | 0 (0.0%) | 0 (0.0%) |
| Material Moving | 6 (37.5%) | 10 (62.5%) |
| Total (Category) | 6 (26.1%) | 17 (73.9%) |
| Total (Overall) | 54 (28.7%) | 134 (71.3%) |
Employment Industries by Sex in Robins AFB
Employment Industries in Robins AFB
The major employment industries in Robins AFB include Public Administration (55 | 29.3%), Retail Trade (31 | 16.5%), Health Care & Social Assistance (28 | 14.9%), Professional & Scientific (18 | 9.6%), and Accommodation & Food Services (18 | 9.6%).
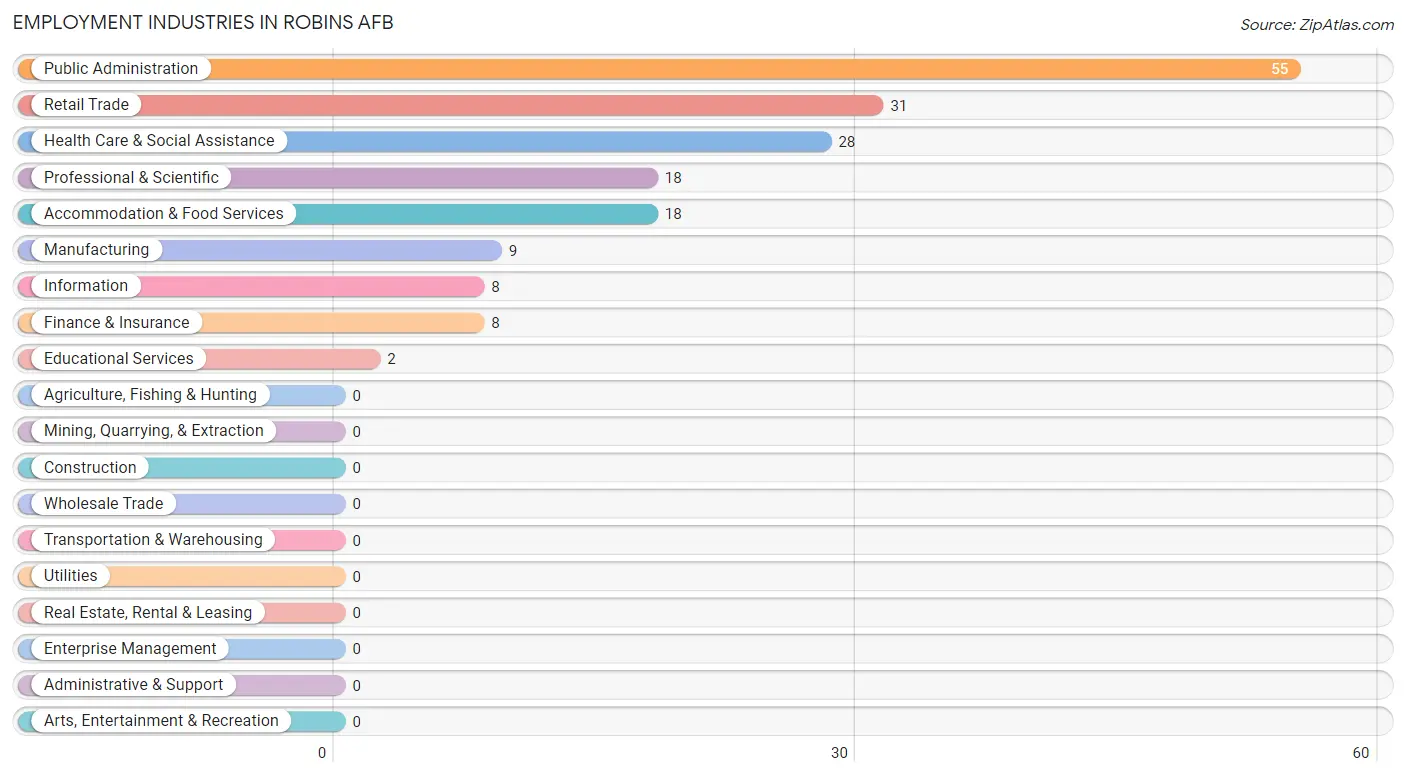
Employment Industries by Sex in Robins AFB
The Robins AFB industries that see more men than women are Finance & Insurance (100.0%), Public Administration (63.6%), and Manufacturing (55.6%), whereas the industries that tend to have a higher number of women are Information (100.0%), Professional & Scientific (100.0%), and Educational Services (100.0%).
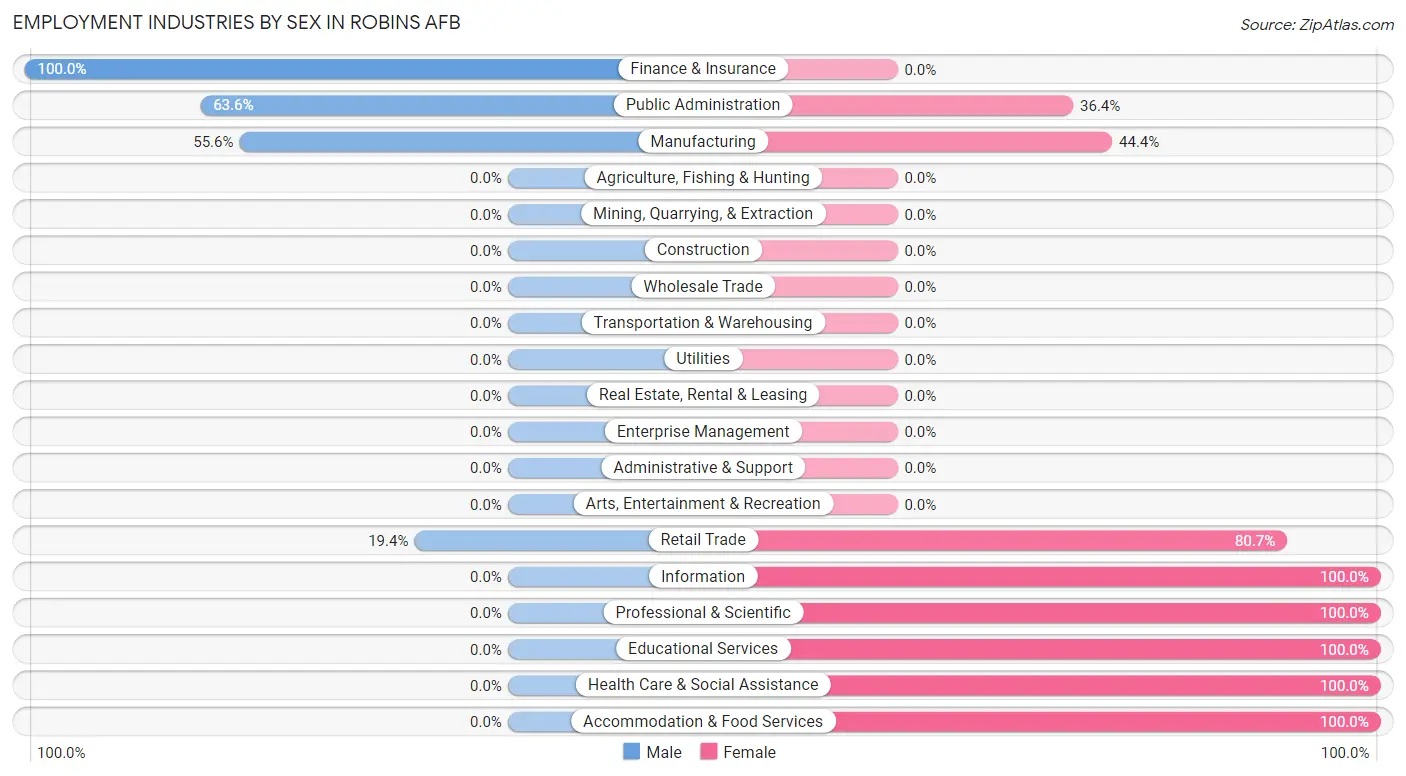
| Industry | Male | Female |
| Agriculture, Fishing & Hunting | 0 (0.0%) | 0 (0.0%) |
| Mining, Quarrying, & Extraction | 0 (0.0%) | 0 (0.0%) |
| Construction | 0 (0.0%) | 0 (0.0%) |
| Manufacturing | 5 (55.6%) | 4 (44.4%) |
| Wholesale Trade | 0 (0.0%) | 0 (0.0%) |
| Retail Trade | 6 (19.4%) | 25 (80.6%) |
| Transportation & Warehousing | 0 (0.0%) | 0 (0.0%) |
| Utilities | 0 (0.0%) | 0 (0.0%) |
| Information | 0 (0.0%) | 8 (100.0%) |
| Finance & Insurance | 8 (100.0%) | 0 (0.0%) |
| Real Estate, Rental & Leasing | 0 (0.0%) | 0 (0.0%) |
| Professional & Scientific | 0 (0.0%) | 18 (100.0%) |
| Enterprise Management | 0 (0.0%) | 0 (0.0%) |
| Administrative & Support | 0 (0.0%) | 0 (0.0%) |
| Educational Services | 0 (0.0%) | 2 (100.0%) |
| Health Care & Social Assistance | 0 (0.0%) | 28 (100.0%) |
| Arts, Entertainment & Recreation | 0 (0.0%) | 0 (0.0%) |
| Accommodation & Food Services | 0 (0.0%) | 18 (100.0%) |
| Public Administration | 35 (63.6%) | 20 (36.4%) |
| Total | 54 (28.7%) | 134 (71.3%) |
Education in Robins AFB
School Enrollment in Robins AFB
The most common levels of schooling among the 323 students in Robins AFB are college / undergraduate (102 | 31.6%), elementary school (86 | 26.6%), and middle school (64 | 19.8%).
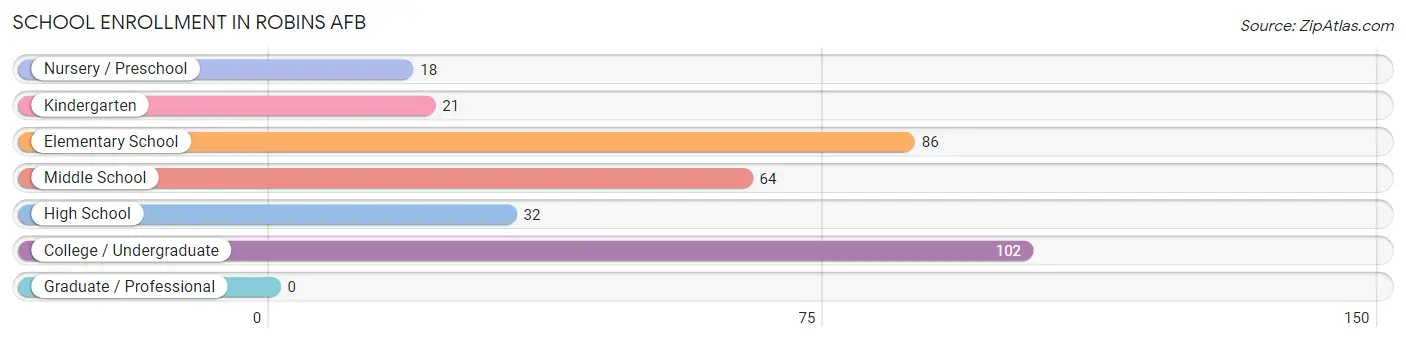
| School Level | # Students | % Students |
| Nursery / Preschool | 18 | 5.6% |
| Kindergarten | 21 | 6.5% |
| Elementary School | 86 | 26.6% |
| Middle School | 64 | 19.8% |
| High School | 32 | 9.9% |
| College / Undergraduate | 102 | 31.6% |
| Graduate / Professional | 0 | 0.0% |
| Total | 323 | 100.0% |
School Enrollment by Age by Funding Source in Robins AFB
Out of a total of 323 students who are enrolled in schools in Robins AFB, 21 (6.5%) attend a private institution, while the remaining 302 (93.5%) are enrolled in public schools. The age group of 3 to 4 year olds has the highest likelihood of being enrolled in private schools, with 4 (26.7% in the age bracket) enrolled. Conversely, the age group of 10 to 14 year olds has the lowest likelihood of being enrolled in a private school, with 64 (100.0% in the age bracket) attending a public institution.
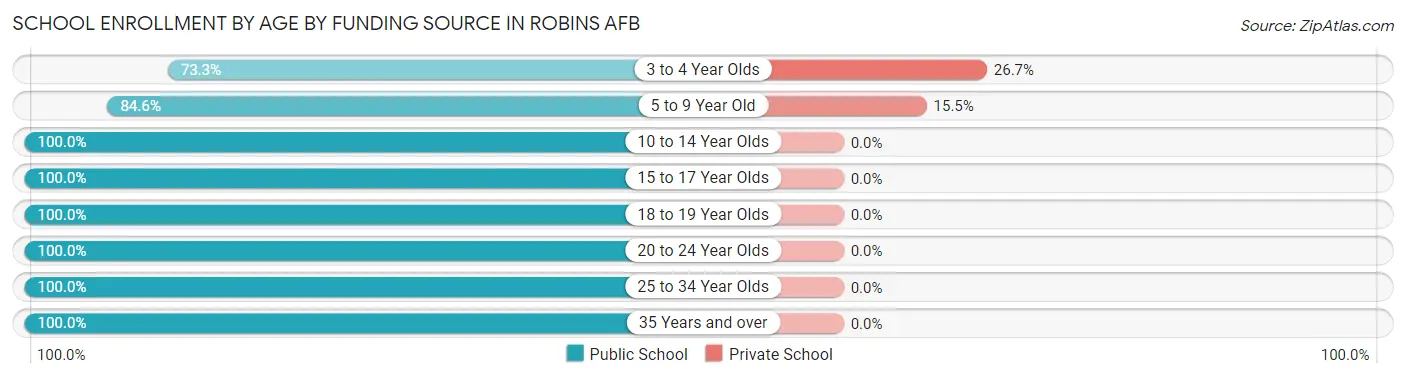
| Age Bracket | Public School | Private School |
| 3 to 4 Year Olds | 11 (73.3%) | 4 (26.7%) |
| 5 to 9 Year Old | 93 (84.6%) | 17 (15.4%) |
| 10 to 14 Year Olds | 64 (100.0%) | 0 (0.0%) |
| 15 to 17 Year Olds | 23 (100.0%) | 0 (0.0%) |
| 18 to 19 Year Olds | 9 (100.0%) | 0 (0.0%) |
| 20 to 24 Year Olds | 36 (100.0%) | 0 (0.0%) |
| 25 to 34 Year Olds | 39 (100.0%) | 0 (0.0%) |
| 35 Years and over | 27 (100.0%) | 0 (0.0%) |
| Total | 302 (93.5%) | 21 (6.5%) |
Educational Attainment by Field of Study in Robins AFB
Physical & health sciences (100 | 21.7%), arts & humanities (88 | 19.1%), engineering (73 | 15.8%), computers & mathematics (60 | 13.0%), and bio, nature & agricultural (48 | 10.4%) are the most common fields of study among 461 individuals in Robins AFB who have obtained a bachelor's degree or higher.
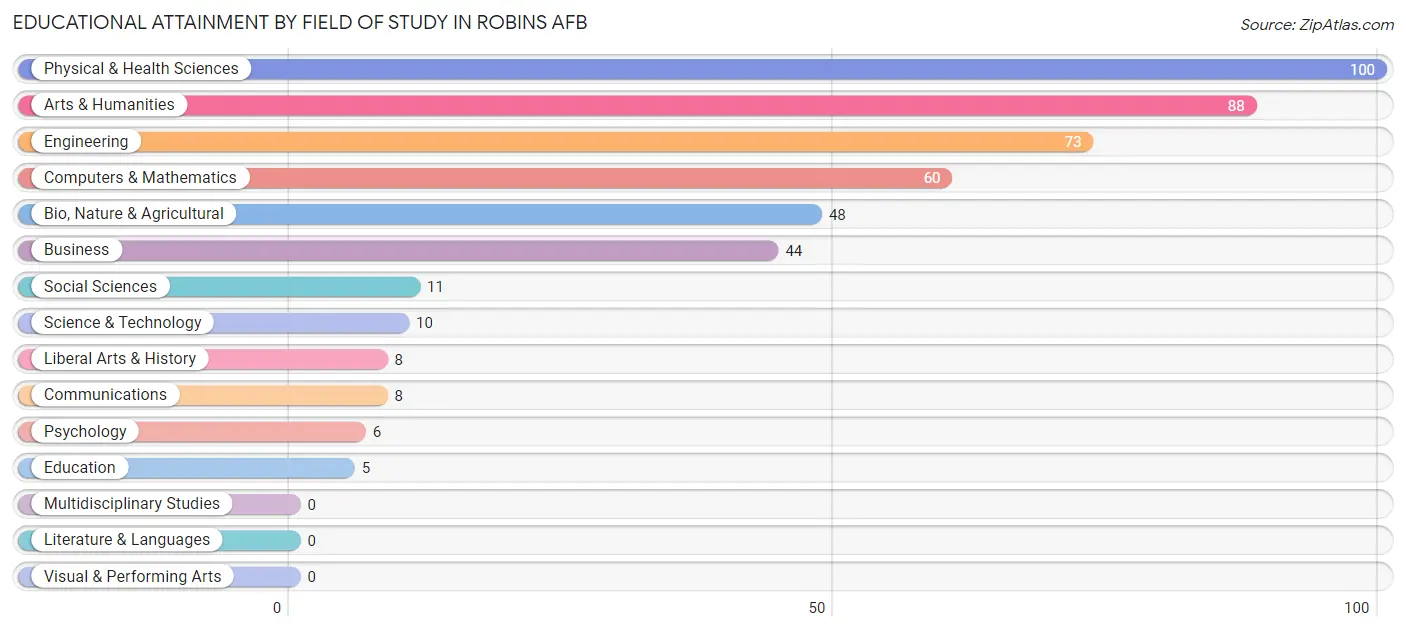
| Field of Study | # Graduates | % Graduates |
| Computers & Mathematics | 60 | 13.0% |
| Bio, Nature & Agricultural | 48 | 10.4% |
| Physical & Health Sciences | 100 | 21.7% |
| Psychology | 6 | 1.3% |
| Social Sciences | 11 | 2.4% |
| Engineering | 73 | 15.8% |
| Multidisciplinary Studies | 0 | 0.0% |
| Science & Technology | 10 | 2.2% |
| Business | 44 | 9.5% |
| Education | 5 | 1.1% |
| Literature & Languages | 0 | 0.0% |
| Liberal Arts & History | 8 | 1.7% |
| Visual & Performing Arts | 0 | 0.0% |
| Communications | 8 | 1.7% |
| Arts & Humanities | 88 | 19.1% |
| Total | 461 | 100.0% |
Transportation & Commute in Robins AFB
Vehicle Availability by Sex in Robins AFB
The most prevalent vehicle ownership categories in Robins AFB are males with 2 vehicles (176, accounting for 56.8%) and females with 2 vehicles (160, making up 96.2%).
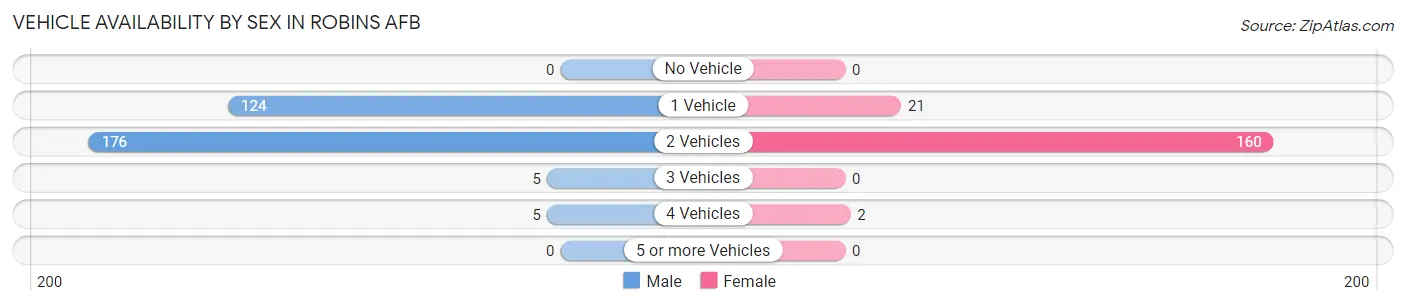
| Vehicles Available | Male | Female |
| No Vehicle | 0 (0.0%) | 0 (0.0%) |
| 1 Vehicle | 124 (40.0%) | 21 (11.5%) |
| 2 Vehicles | 176 (56.8%) | 160 (87.4%) |
| 3 Vehicles | 5 (1.6%) | 0 (0.0%) |
| 4 Vehicles | 5 (1.6%) | 2 (1.1%) |
| 5 or more Vehicles | 0 (0.0%) | 0 (0.0%) |
| Total | 310 (100.0%) | 183 (100.0%) |
Commute Time in Robins AFB
The most frequently occuring commute durations in Robins AFB are 5 to 9 minutes (357 commuters, 45.8%), 10 to 14 minutes (208 commuters, 26.7%), and 15 to 19 minutes (81 commuters, 10.4%).
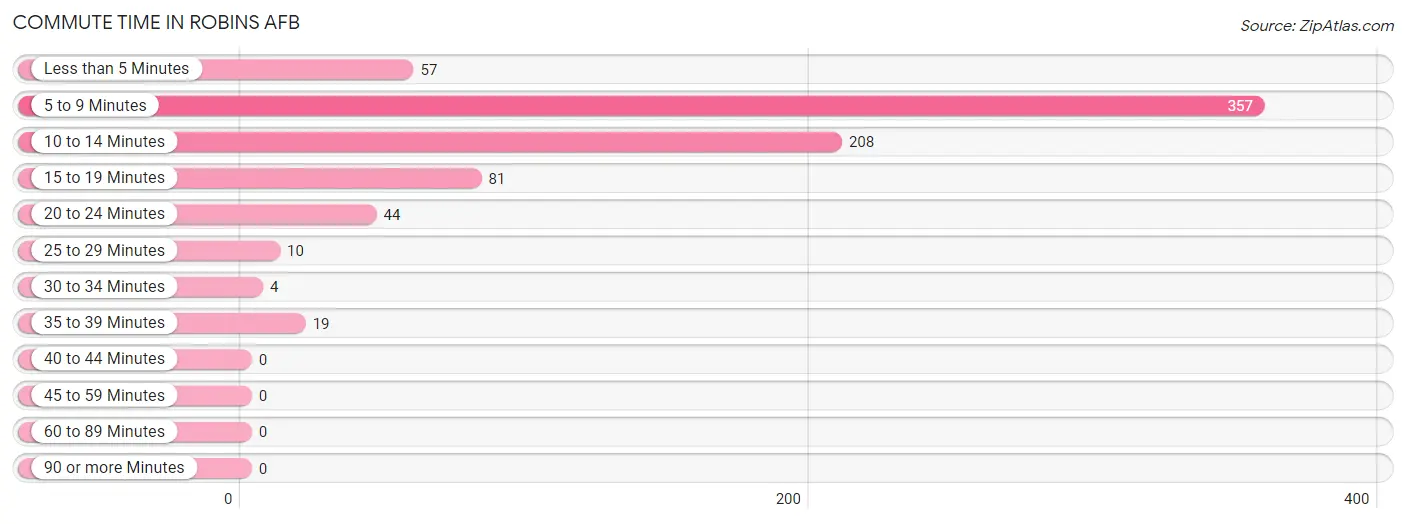
| Commute Time | # Commuters | % Commuters |
| Less than 5 Minutes | 57 | 7.3% |
| 5 to 9 Minutes | 357 | 45.8% |
| 10 to 14 Minutes | 208 | 26.7% |
| 15 to 19 Minutes | 81 | 10.4% |
| 20 to 24 Minutes | 44 | 5.6% |
| 25 to 29 Minutes | 10 | 1.3% |
| 30 to 34 Minutes | 4 | 0.5% |
| 35 to 39 Minutes | 19 | 2.4% |
| 40 to 44 Minutes | 0 | 0.0% |
| 45 to 59 Minutes | 0 | 0.0% |
| 60 to 89 Minutes | 0 | 0.0% |
| 90 or more Minutes | 0 | 0.0% |
Commute Time by Sex in Robins AFB
The most common commute times in Robins AFB are 5 to 9 minutes (263 commuters, 47.9%) for males and 5 to 9 minutes (94 commuters, 40.7%) for females.
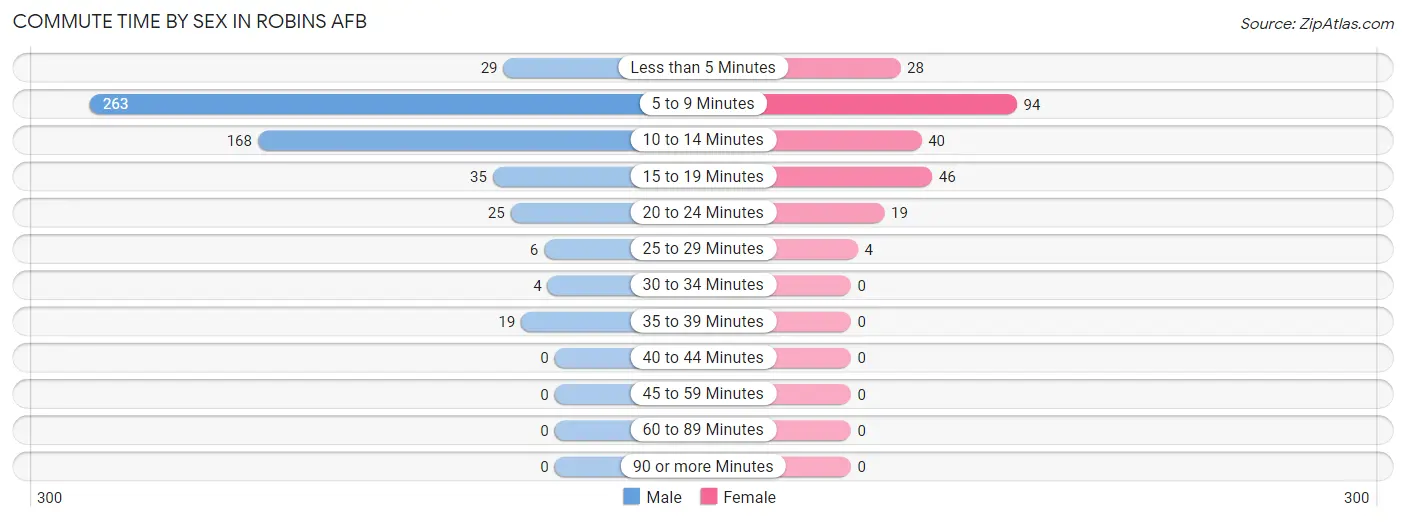
| Commute Time | Male | Female |
| Less than 5 Minutes | 29 (5.3%) | 28 (12.1%) |
| 5 to 9 Minutes | 263 (47.9%) | 94 (40.7%) |
| 10 to 14 Minutes | 168 (30.6%) | 40 (17.3%) |
| 15 to 19 Minutes | 35 (6.4%) | 46 (19.9%) |
| 20 to 24 Minutes | 25 (4.5%) | 19 (8.2%) |
| 25 to 29 Minutes | 6 (1.1%) | 4 (1.7%) |
| 30 to 34 Minutes | 4 (0.7%) | 0 (0.0%) |
| 35 to 39 Minutes | 19 (3.5%) | 0 (0.0%) |
| 40 to 44 Minutes | 0 (0.0%) | 0 (0.0%) |
| 45 to 59 Minutes | 0 (0.0%) | 0 (0.0%) |
| 60 to 89 Minutes | 0 (0.0%) | 0 (0.0%) |
| 90 or more Minutes | 0 (0.0%) | 0 (0.0%) |
Time of Departure to Work by Sex in Robins AFB
The most frequent times of departure to work in Robins AFB are 7:00 AM to 7:29 AM (243, 44.3%) for males and 7:00 AM to 7:29 AM (62, 26.8%) for females.
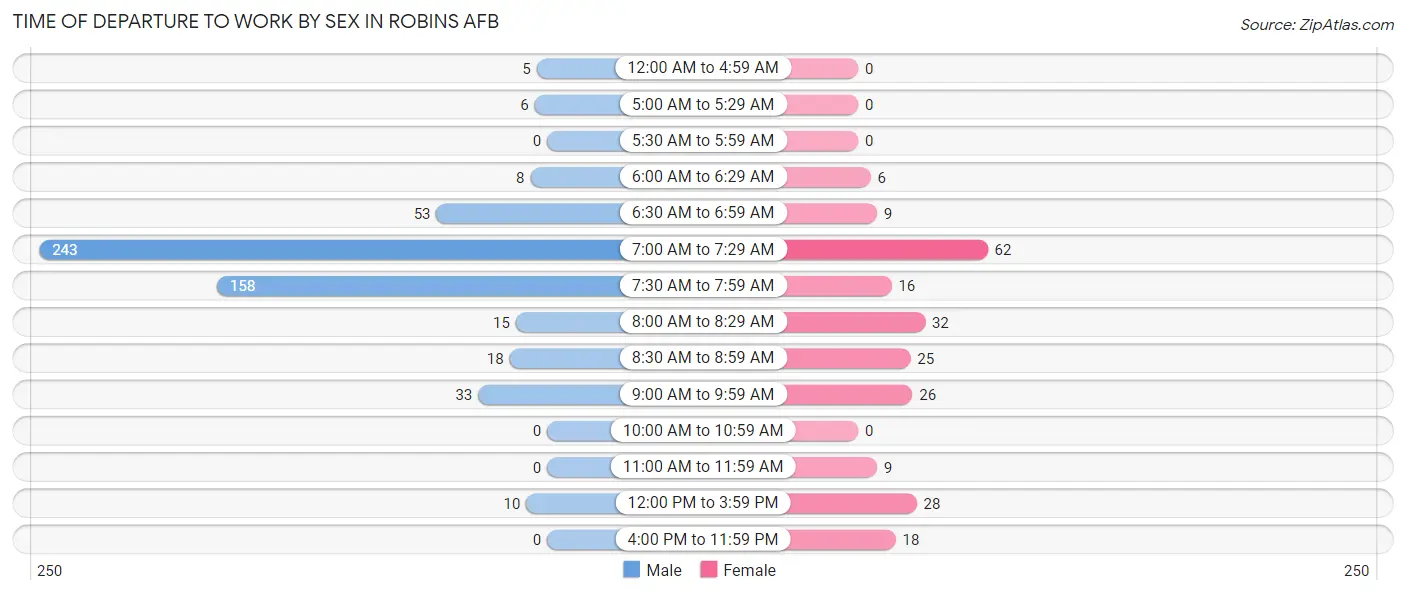
| Time of Departure | Male | Female |
| 12:00 AM to 4:59 AM | 5 (0.9%) | 0 (0.0%) |
| 5:00 AM to 5:29 AM | 6 (1.1%) | 0 (0.0%) |
| 5:30 AM to 5:59 AM | 0 (0.0%) | 0 (0.0%) |
| 6:00 AM to 6:29 AM | 8 (1.5%) | 6 (2.6%) |
| 6:30 AM to 6:59 AM | 53 (9.7%) | 9 (3.9%) |
| 7:00 AM to 7:29 AM | 243 (44.3%) | 62 (26.8%) |
| 7:30 AM to 7:59 AM | 158 (28.8%) | 16 (6.9%) |
| 8:00 AM to 8:29 AM | 15 (2.7%) | 32 (13.9%) |
| 8:30 AM to 8:59 AM | 18 (3.3%) | 25 (10.8%) |
| 9:00 AM to 9:59 AM | 33 (6.0%) | 26 (11.3%) |
| 10:00 AM to 10:59 AM | 0 (0.0%) | 0 (0.0%) |
| 11:00 AM to 11:59 AM | 0 (0.0%) | 9 (3.9%) |
| 12:00 PM to 3:59 PM | 10 (1.8%) | 28 (12.1%) |
| 4:00 PM to 11:59 PM | 0 (0.0%) | 18 (7.8%) |
| Total | 549 (100.0%) | 231 (100.0%) |
Housing Occupancy in Robins AFB
Occupancy by Ownership in Robins AFB
Of the total 403 dwellings in Robins AFB, owner-occupied units account for 10 (2.5%), while renter-occupied units make up 393 (97.5%).
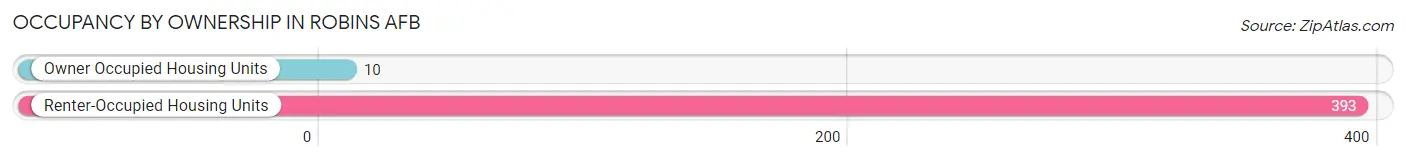
| Occupancy | # Housing Units | % Housing Units |
| Owner Occupied Housing Units | 10 | 2.5% |
| Renter-Occupied Housing Units | 393 | 97.5% |
| Total Occupied Housing Units | 403 | 100.0% |
Occupancy by Household Size in Robins AFB
| Household Size | # Housing Units | % Housing Units |
| 1-Person Household | 106 | 26.3% |
| 2-Person Household | 161 | 40.0% |
| 3-Person Household | 51 | 12.7% |
| 4+ Person Household | 85 | 21.1% |
| Total Housing Units | 403 | 100.0% |
Occupancy by Ownership by Household Size in Robins AFB
| Household Size | Owner-occupied | Renter-occupied |
| 1-Person Household | 0 (0.0%) | 106 (100.0%) |
| 2-Person Household | 0 (0.0%) | 161 (100.0%) |
| 3-Person Household | 0 (0.0%) | 51 (100.0%) |
| 4+ Person Household | 10 (11.8%) | 75 (88.2%) |
| Total Housing Units | 10 (2.5%) | 393 (97.5%) |
Occupancy by Educational Attainment in Robins AFB
| Household Size | Owner-occupied | Renter-occupied |
| Less than High School | 0 (0.0%) | 0 (0.0%) |
| High School Diploma | 0 (0.0%) | 0 (0.0%) |
| College/Associate Degree | 6 (5.4%) | 106 (94.6%) |
| Bachelor's Degree or higher | 4 (1.4%) | 287 (98.6%) |
Occupancy by Age of Householder in Robins AFB
| Age Bracket | # Households | % Households |
| Under 35 Years | 210 | 52.1% |
| 35 to 44 Years | 72 | 17.9% |
| 45 to 54 Years | 70 | 17.4% |
| 55 to 64 Years | 51 | 12.7% |
| 65 to 74 Years | 0 | 0.0% |
| 75 to 84 Years | 0 | 0.0% |
| 85 Years and Over | 0 | 0.0% |
| Total | 403 | 100.0% |
Housing Finances in Robins AFB
Median Income by Occupancy in Robins AFB
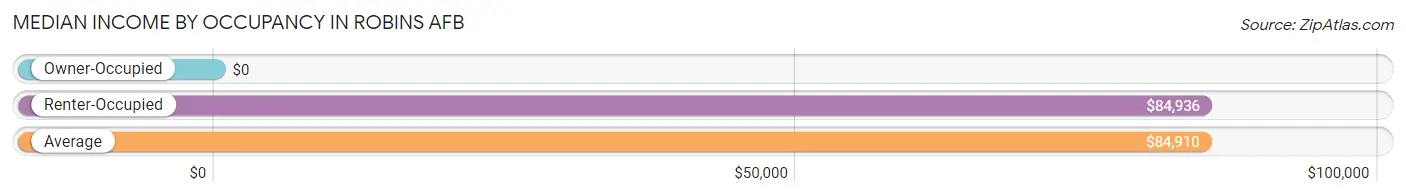
| Occupancy Type | # Households | Median Income |
| Owner-Occupied | 10 (2.5%) | $0 |
| Renter-Occupied | 393 (97.5%) | $84,936 |
| Average | 403 (100.0%) | $84,910 |
Occupancy by Householder Income Bracket in Robins AFB
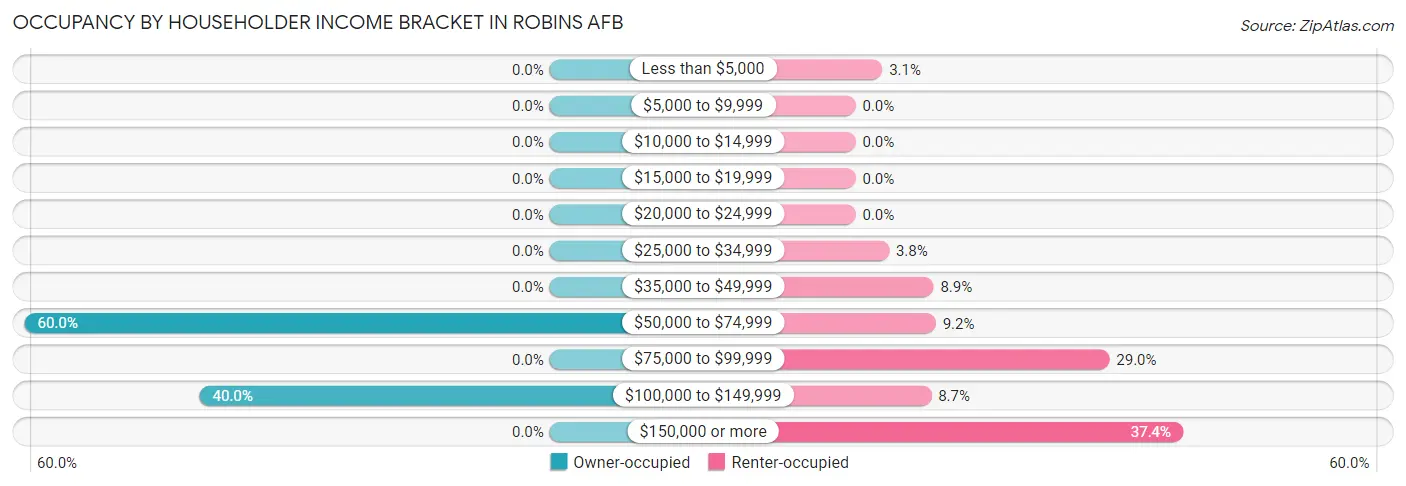
| Income Bracket | Owner-occupied | Renter-occupied |
| Less than $5,000 | 0 (0.0%) | 12 (3.0%) |
| $5,000 to $9,999 | 0 (0.0%) | 0 (0.0%) |
| $10,000 to $14,999 | 0 (0.0%) | 0 (0.0%) |
| $15,000 to $19,999 | 0 (0.0%) | 0 (0.0%) |
| $20,000 to $24,999 | 0 (0.0%) | 0 (0.0%) |
| $25,000 to $34,999 | 0 (0.0%) | 15 (3.8%) |
| $35,000 to $49,999 | 0 (0.0%) | 35 (8.9%) |
| $50,000 to $74,999 | 6 (60.0%) | 36 (9.2%) |
| $75,000 to $99,999 | 0 (0.0%) | 114 (29.0%) |
| $100,000 to $149,999 | 4 (40.0%) | 34 (8.6%) |
| $150,000 or more | 0 (0.0%) | 147 (37.4%) |
| Total | 10 (100.0%) | 393 (100.0%) |
Monthly Housing Cost Tiers in Robins AFB
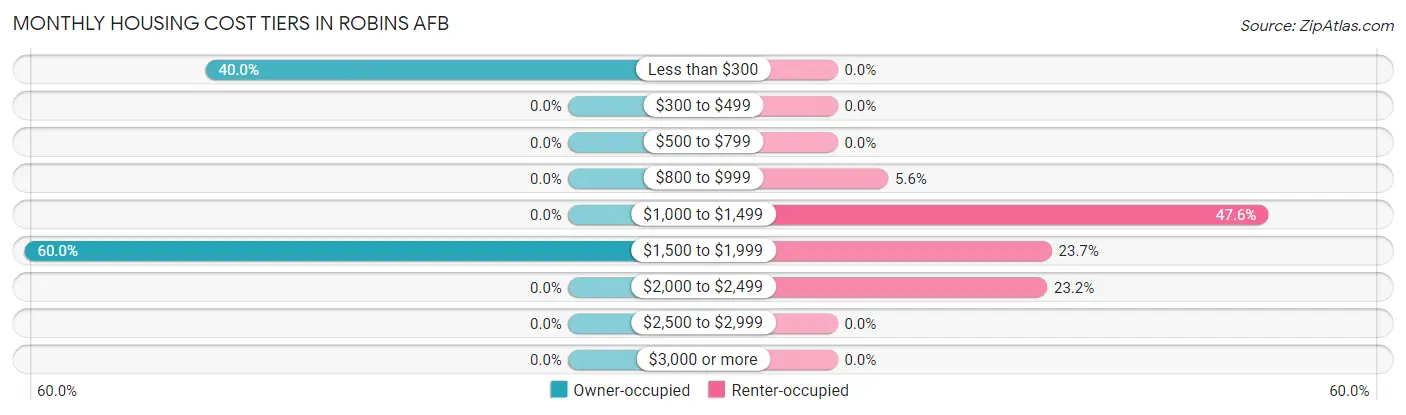
| Monthly Cost | Owner-occupied | Renter-occupied |
| Less than $300 | 4 (40.0%) | 0 (0.0%) |
| $300 to $499 | 0 (0.0%) | 0 (0.0%) |
| $500 to $799 | 0 (0.0%) | 0 (0.0%) |
| $800 to $999 | 0 (0.0%) | 22 (5.6%) |
| $1,000 to $1,499 | 0 (0.0%) | 187 (47.6%) |
| $1,500 to $1,999 | 6 (60.0%) | 93 (23.7%) |
| $2,000 to $2,499 | 0 (0.0%) | 91 (23.2%) |
| $2,500 to $2,999 | 0 (0.0%) | 0 (0.0%) |
| $3,000 or more | 0 (0.0%) | 0 (0.0%) |
| Total | 10 (100.0%) | 393 (100.0%) |
Physical Housing Characteristics in Robins AFB
Housing Structures in Robins AFB
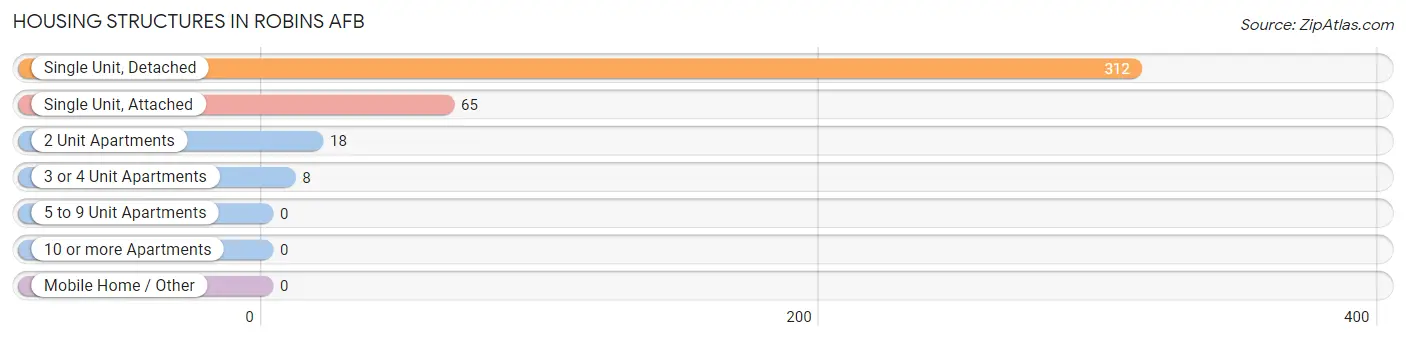
| Structure Type | # Housing Units | % Housing Units |
| Single Unit, Detached | 312 | 77.4% |
| Single Unit, Attached | 65 | 16.1% |
| 2 Unit Apartments | 18 | 4.5% |
| 3 or 4 Unit Apartments | 8 | 2.0% |
| 5 to 9 Unit Apartments | 0 | 0.0% |
| 10 or more Apartments | 0 | 0.0% |
| Mobile Home / Other | 0 | 0.0% |
| Total | 403 | 100.0% |
Housing Structures by Occupancy in Robins AFB
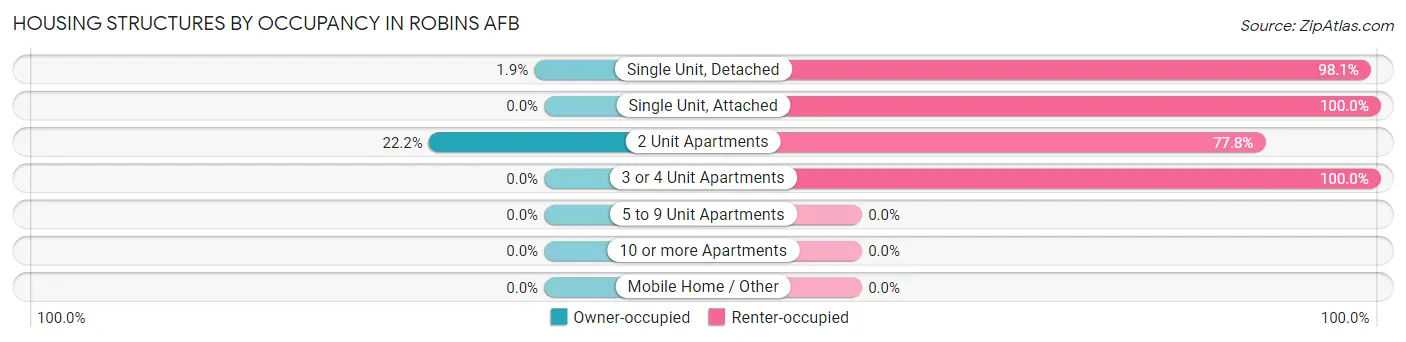
| Structure Type | Owner-occupied | Renter-occupied |
| Single Unit, Detached | 6 (1.9%) | 306 (98.1%) |
| Single Unit, Attached | 0 (0.0%) | 65 (100.0%) |
| 2 Unit Apartments | 4 (22.2%) | 14 (77.8%) |
| 3 or 4 Unit Apartments | 0 (0.0%) | 8 (100.0%) |
| 5 to 9 Unit Apartments | 0 (0.0%) | 0 (0.0%) |
| 10 or more Apartments | 0 (0.0%) | 0 (0.0%) |
| Mobile Home / Other | 0 (0.0%) | 0 (0.0%) |
| Total | 10 (2.5%) | 393 (97.5%) |
Housing Structures by Number of Rooms in Robins AFB
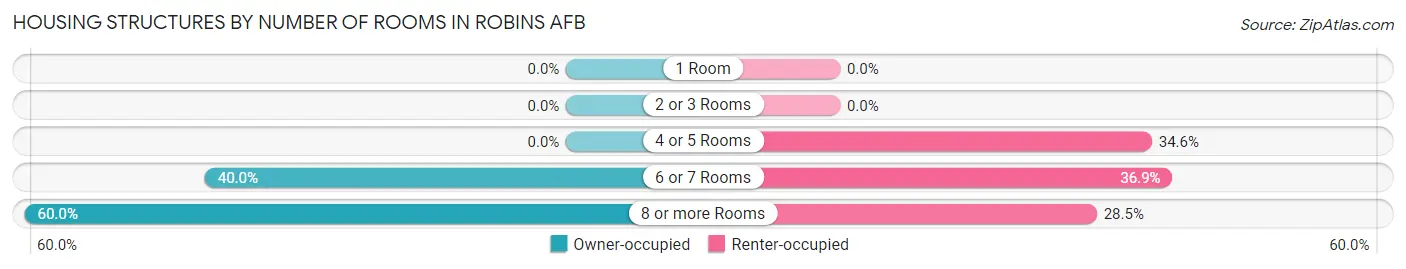
| Number of Rooms | Owner-occupied | Renter-occupied |
| 1 Room | 0 (0.0%) | 0 (0.0%) |
| 2 or 3 Rooms | 0 (0.0%) | 0 (0.0%) |
| 4 or 5 Rooms | 0 (0.0%) | 136 (34.6%) |
| 6 or 7 Rooms | 4 (40.0%) | 145 (36.9%) |
| 8 or more Rooms | 6 (60.0%) | 112 (28.5%) |
| Total | 10 (100.0%) | 393 (100.0%) |
Housing Structure by Heating Type in Robins AFB
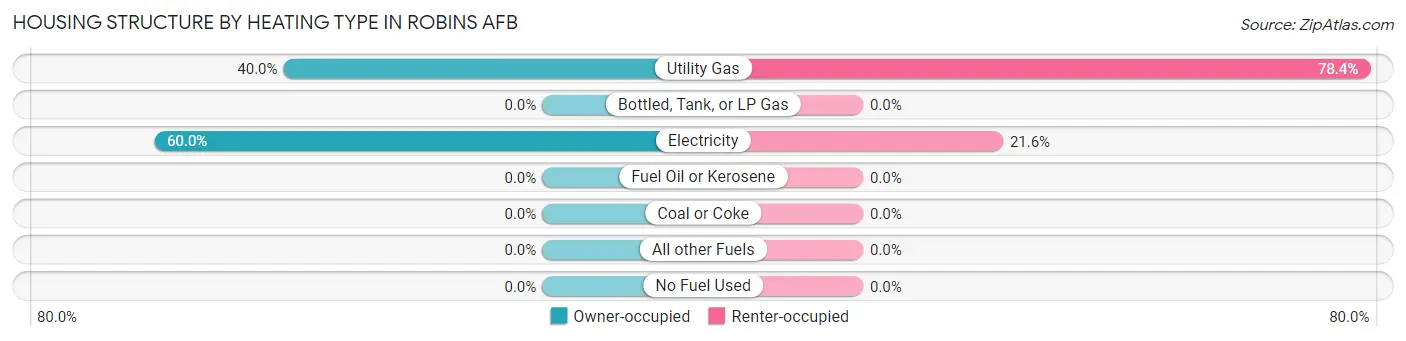
| Heating Type | Owner-occupied | Renter-occupied |
| Utility Gas | 4 (40.0%) | 308 (78.4%) |
| Bottled, Tank, or LP Gas | 0 (0.0%) | 0 (0.0%) |
| Electricity | 6 (60.0%) | 85 (21.6%) |
| Fuel Oil or Kerosene | 0 (0.0%) | 0 (0.0%) |
| Coal or Coke | 0 (0.0%) | 0 (0.0%) |
| All other Fuels | 0 (0.0%) | 0 (0.0%) |
| No Fuel Used | 0 (0.0%) | 0 (0.0%) |
| Total | 10 (100.0%) | 393 (100.0%) |
Household Vehicle Usage in Robins AFB
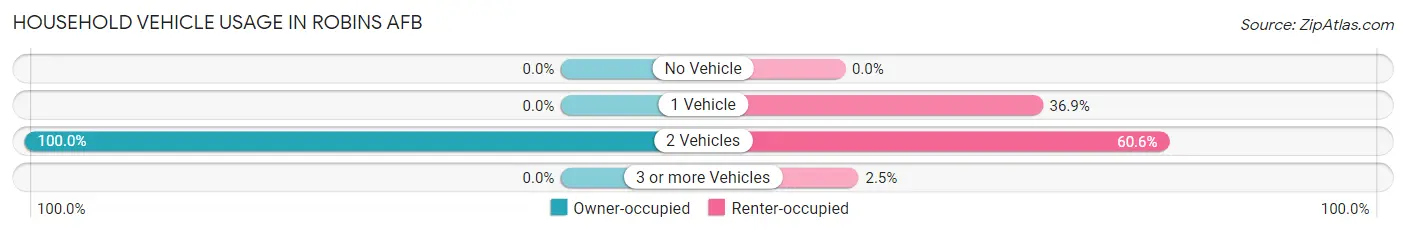
| Vehicles per Household | Owner-occupied | Renter-occupied |
| No Vehicle | 0 (0.0%) | 0 (0.0%) |
| 1 Vehicle | 0 (0.0%) | 145 (36.9%) |
| 2 Vehicles | 10 (100.0%) | 238 (60.6%) |
| 3 or more Vehicles | 0 (0.0%) | 10 (2.5%) |
| Total | 10 (100.0%) | 393 (100.0%) |
Real Estate & Mortgages in Robins AFB
Real Estate and Mortgage Overview in Robins AFB
| Characteristic | Without Mortgage | With Mortgage |
| Housing Units | 4 | 6 |
| Median Property Value | - | - |
| Median Household Income | - | - |
| Monthly Housing Costs | - | - |
| Real Estate Taxes | - | - |
Property Value by Mortgage Status in Robins AFB
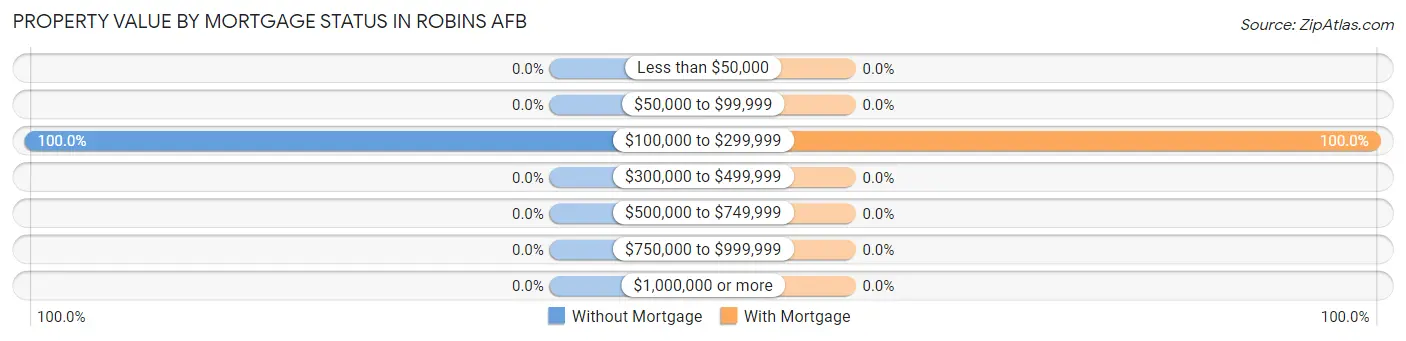
| Property Value | Without Mortgage | With Mortgage |
| Less than $50,000 | 0 (0.0%) | 0 (0.0%) |
| $50,000 to $99,999 | 0 (0.0%) | 0 (0.0%) |
| $100,000 to $299,999 | 4 (100.0%) | 6 (100.0%) |
| $300,000 to $499,999 | 0 (0.0%) | 0 (0.0%) |
| $500,000 to $749,999 | 0 (0.0%) | 0 (0.0%) |
| $750,000 to $999,999 | 0 (0.0%) | 0 (0.0%) |
| $1,000,000 or more | 0 (0.0%) | 0 (0.0%) |
| Total | 4 (100.0%) | 6 (100.0%) |
Household Income by Mortgage Status in Robins AFB
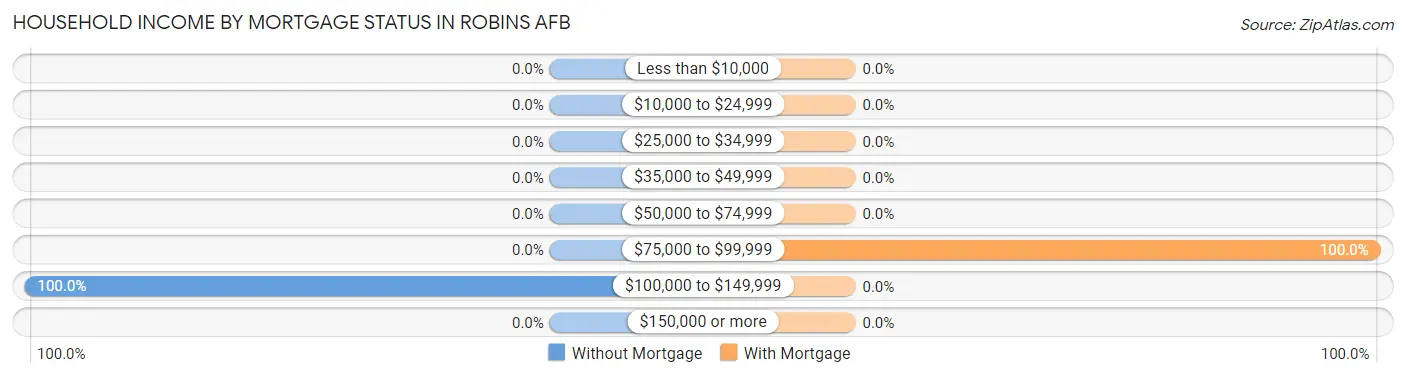
| Household Income | Without Mortgage | With Mortgage |
| Less than $10,000 | 0 (0.0%) | 0 (0.0%) |
| $10,000 to $24,999 | 0 (0.0%) | 0 (0.0%) |
| $25,000 to $34,999 | 0 (0.0%) | 0 (0.0%) |
| $35,000 to $49,999 | 0 (0.0%) | 0 (0.0%) |
| $50,000 to $74,999 | 0 (0.0%) | 0 (0.0%) |
| $75,000 to $99,999 | 0 (0.0%) | 6 (100.0%) |
| $100,000 to $149,999 | 4 (100.0%) | 0 (0.0%) |
| $150,000 or more | 0 (0.0%) | 0 (0.0%) |
| Total | 4 (100.0%) | 6 (100.0%) |
Property Value to Household Income Ratio in Robins AFB
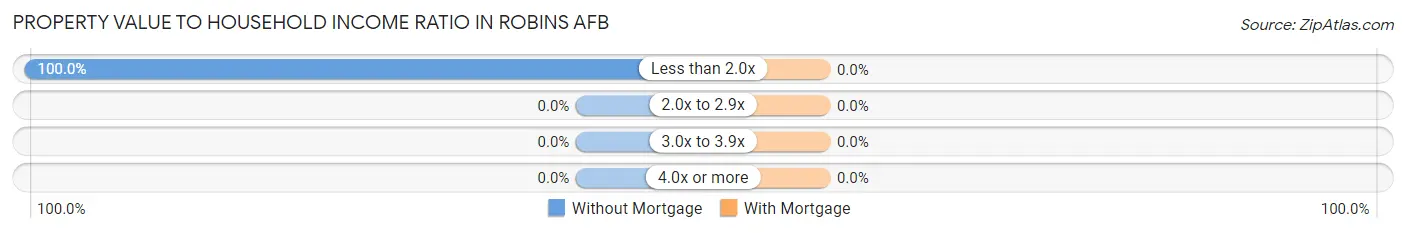
| Value-to-Income Ratio | Without Mortgage | With Mortgage |
| Less than 2.0x | 4 (100.0%) | 0 (0.0%) |
| 2.0x to 2.9x | 0 (0.0%) | 0 (0.0%) |
| 3.0x to 3.9x | 0 (0.0%) | 0 (0.0%) |
| 4.0x or more | 0 (0.0%) | 0 (0.0%) |
| Total | 4 (100.0%) | 6 (100.0%) |
Real Estate Taxes by Mortgage Status in Robins AFB
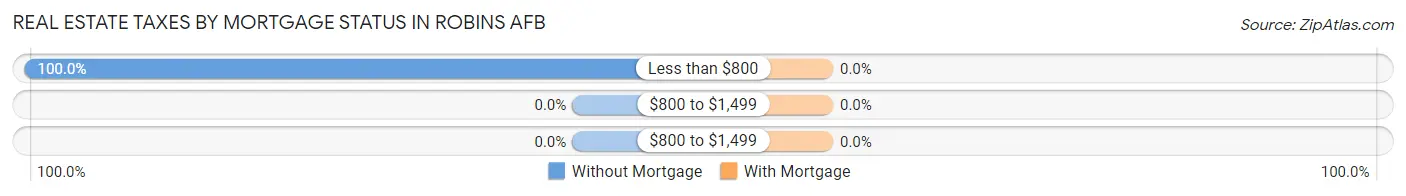
| Property Taxes | Without Mortgage | With Mortgage |
| Less than $800 | 4 (100.0%) | 0 (0.0%) |
| $800 to $1,499 | 0 (0.0%) | 0 (0.0%) |
| $800 to $1,499 | 0 (0.0%) | 0 (0.0%) |
| Total | 4 (100.0%) | 6 (100.0%) |
Health & Disability in Robins AFB
Health Insurance Coverage by Age in Robins AFB
| Age Bracket | With Coverage | Without Coverage |
| Under 6 Years | 119 (100.0%) | 0 (0.0%) |
| 6 to 18 Years | 186 (100.0%) | 0 (0.0%) |
| 19 to 25 Years | 42 (52.5%) | 38 (47.5%) |
| 26 to 34 Years | 82 (100.0%) | 0 (0.0%) |
| 35 to 44 Years | 50 (100.0%) | 0 (0.0%) |
| 45 to 54 Years | 68 (100.0%) | 0 (0.0%) |
| 55 to 64 Years | 60 (100.0%) | 0 (0.0%) |
| 65 to 74 Years | 0 (0.0%) | 0 (0.0%) |
| 75 Years and older | 0 (0.0%) | 0 (0.0%) |
| Total | 607 (94.1%) | 38 (5.9%) |
Health Insurance Coverage by Citizenship Status in Robins AFB
| Citizenship Status | With Coverage | Without Coverage |
| Native Born | 119 (100.0%) | 0 (0.0%) |
| Foreign Born, Citizen | 186 (100.0%) | 0 (0.0%) |
| Foreign Born, not a Citizen | 42 (52.5%) | 38 (47.5%) |
Health Insurance Coverage by Household Income in Robins AFB
| Household Income | With Coverage | Without Coverage |
| Under $25,000 | 12 (41.4%) | 17 (58.6%) |
| $25,000 to $49,999 | 62 (74.7%) | 21 (25.3%) |
| $50,000 to $74,999 | 96 (100.0%) | 0 (0.0%) |
| $75,000 to $99,999 | 29 (100.0%) | 0 (0.0%) |
| $100,000 and over | 408 (100.0%) | 0 (0.0%) |
Public vs Private Health Insurance Coverage by Age in Robins AFB
| Age Bracket | Public Insurance | Private Insurance |
| Under 6 | 11 (9.2%) | 108 (90.8%) |
| 6 to 18 Years | 0 (0.0%) | 186 (100.0%) |
| 19 to 25 Years | 0 (0.0%) | 42 (52.5%) |
| 25 to 34 Years | 0 (0.0%) | 82 (100.0%) |
| 35 to 44 Years | 0 (0.0%) | 50 (100.0%) |
| 45 to 54 Years | 5 (7.3%) | 68 (100.0%) |
| 55 to 64 Years | 0 (0.0%) | 60 (100.0%) |
| 65 to 74 Years | 0 (0.0%) | 0 (0.0%) |
| 75 Years and over | 0 (0.0%) | 0 (0.0%) |
| Total | 16 (2.5%) | 596 (92.4%) |
Disability Status by Sex by Age in Robins AFB
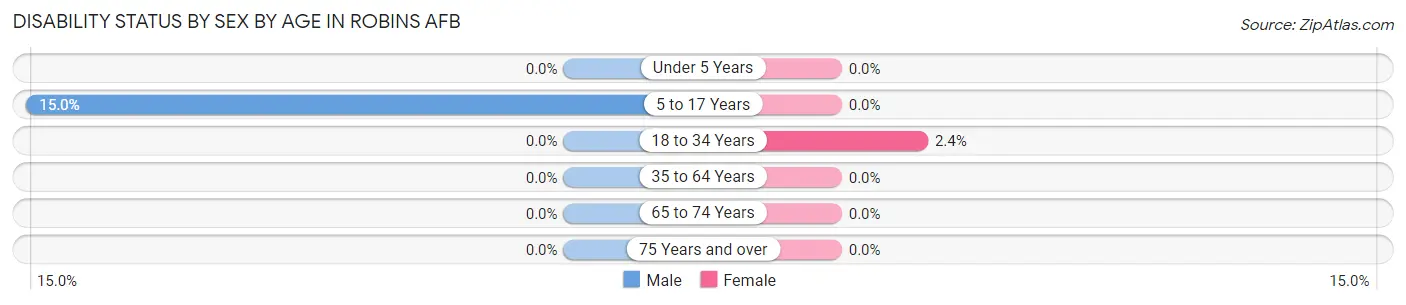
| Age Bracket | Male | Female |
| Under 5 Years | 0 (0.0%) | 0 (0.0%) |
| 5 to 17 Years | 16 (14.9%) | 0 (0.0%) |
| 18 to 34 Years | 0 (0.0%) | 3 (2.4%) |
| 35 to 64 Years | 0 (0.0%) | 0 (0.0%) |
| 65 to 74 Years | 0 (0.0%) | 0 (0.0%) |
| 75 Years and over | 0 (0.0%) | 0 (0.0%) |
Disability Class by Sex by Age in Robins AFB
Disability Class: Hearing Difficulty
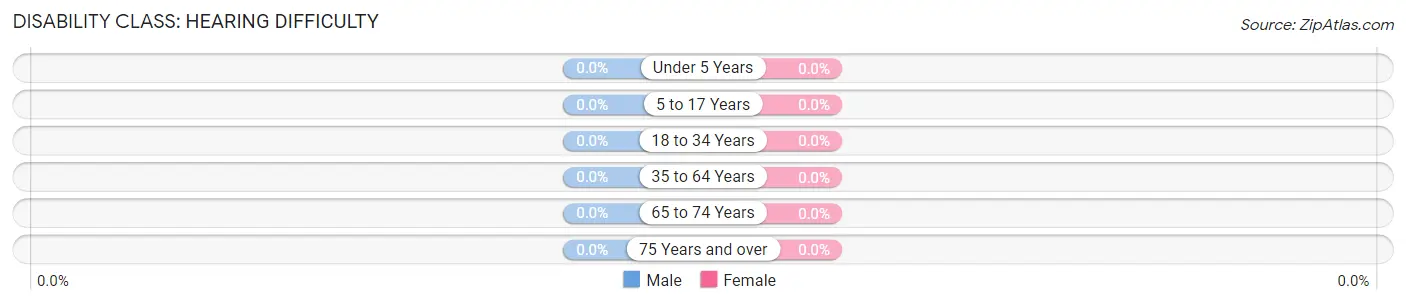
| Age Bracket | Male | Female |
| Under 5 Years | 0 (0.0%) | 0 (0.0%) |
| 5 to 17 Years | 0 (0.0%) | 0 (0.0%) |
| 18 to 34 Years | 0 (0.0%) | 0 (0.0%) |
| 35 to 64 Years | 0 (0.0%) | 0 (0.0%) |
| 65 to 74 Years | 0 (0.0%) | 0 (0.0%) |
| 75 Years and over | 0 (0.0%) | 0 (0.0%) |
Disability Class: Vision Difficulty
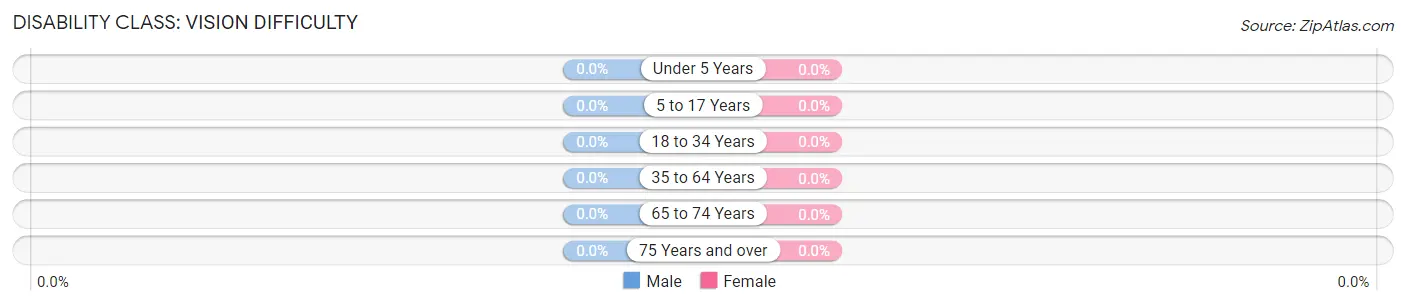
| Age Bracket | Male | Female |
| Under 5 Years | 0 (0.0%) | 0 (0.0%) |
| 5 to 17 Years | 0 (0.0%) | 0 (0.0%) |
| 18 to 34 Years | 0 (0.0%) | 0 (0.0%) |
| 35 to 64 Years | 0 (0.0%) | 0 (0.0%) |
| 65 to 74 Years | 0 (0.0%) | 0 (0.0%) |
| 75 Years and over | 0 (0.0%) | 0 (0.0%) |
Disability Class: Cognitive Difficulty
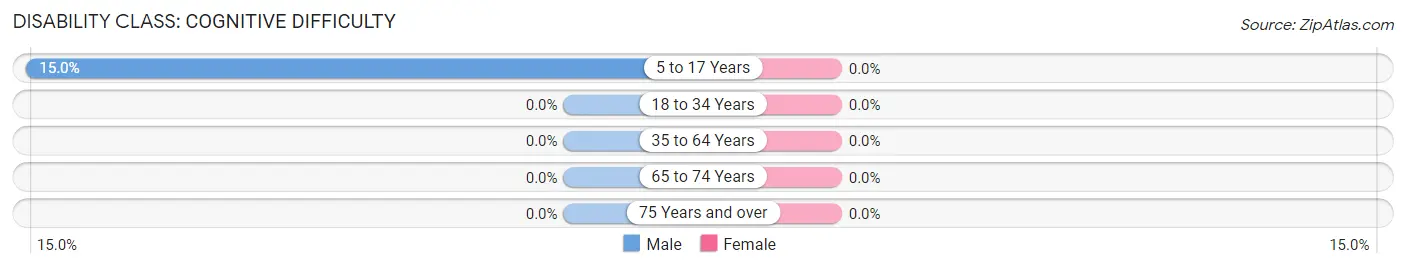
| Age Bracket | Male | Female |
| 5 to 17 Years | 16 (14.9%) | 0 (0.0%) |
| 18 to 34 Years | 0 (0.0%) | 0 (0.0%) |
| 35 to 64 Years | 0 (0.0%) | 0 (0.0%) |
| 65 to 74 Years | 0 (0.0%) | 0 (0.0%) |
| 75 Years and over | 0 (0.0%) | 0 (0.0%) |
Disability Class: Ambulatory Difficulty
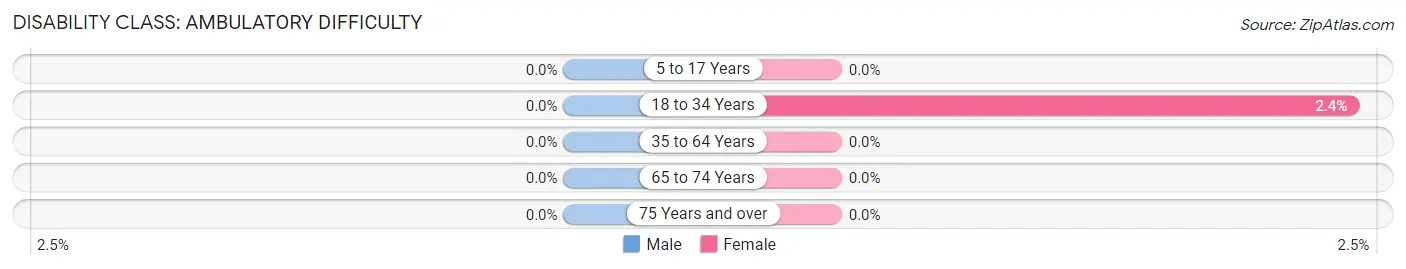
| Age Bracket | Male | Female |
| 5 to 17 Years | 0 (0.0%) | 0 (0.0%) |
| 18 to 34 Years | 0 (0.0%) | 3 (2.4%) |
| 35 to 64 Years | 0 (0.0%) | 0 (0.0%) |
| 65 to 74 Years | 0 (0.0%) | 0 (0.0%) |
| 75 Years and over | 0 (0.0%) | 0 (0.0%) |
Disability Class: Self-Care Difficulty
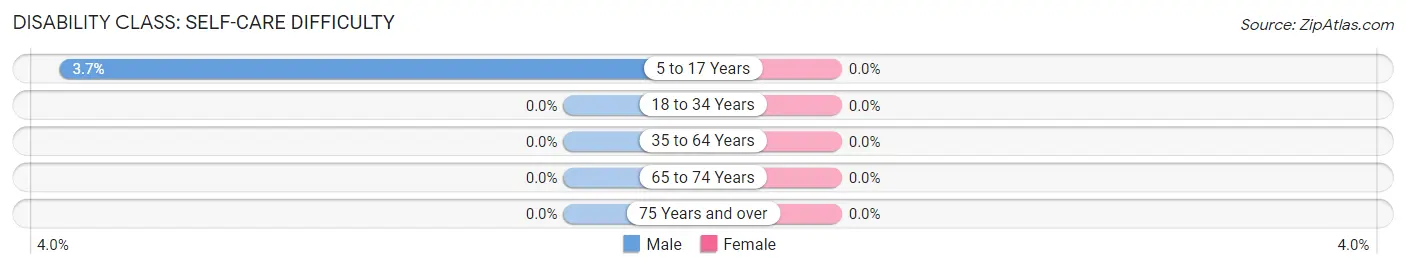
| Age Bracket | Male | Female |
| 5 to 17 Years | 4 (3.7%) | 0 (0.0%) |
| 18 to 34 Years | 0 (0.0%) | 0 (0.0%) |
| 35 to 64 Years | 0 (0.0%) | 0 (0.0%) |
| 65 to 74 Years | 0 (0.0%) | 0 (0.0%) |
| 75 Years and over | 0 (0.0%) | 0 (0.0%) |
Technology Access in Robins AFB
Computing Device Access in Robins AFB
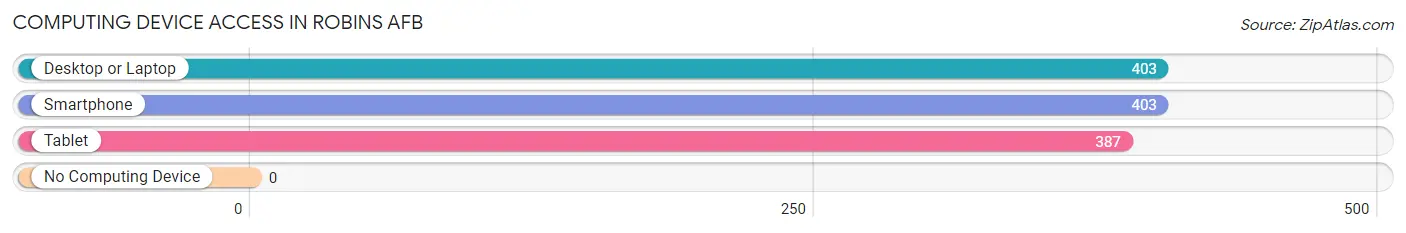
| Device Type | # Households | % Households |
| Desktop or Laptop | 403 | 100.0% |
| Smartphone | 403 | 100.0% |
| Tablet | 387 | 96.0% |
| No Computing Device | 0 | 0.0% |
| Total | 403 | 100.0% |
Internet Access in Robins AFB
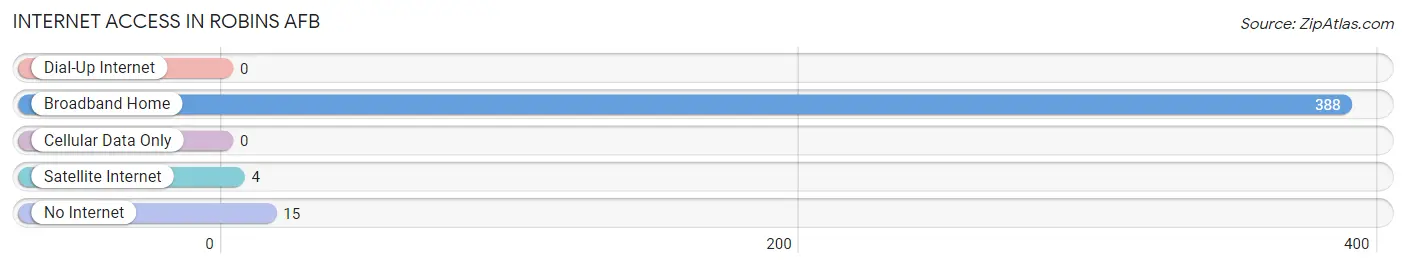
| Internet Type | # Households | % Households |
| Dial-Up Internet | 0 | 0.0% |
| Broadband Home | 388 | 96.3% |
| Cellular Data Only | 0 | 0.0% |
| Satellite Internet | 4 | 1.0% |
| No Internet | 15 | 3.7% |
| Total | 403 | 100.0% |
Robins AFB Summary
Robins Air Force Base (Robins AFB) is located in Houston County, Georgia, approximately 15 miles south of Macon and 100 miles south of Atlanta. It is the largest industrial complex in Georgia and the largest employer in the Middle Georgia region. Robins AFB is home to the 78th Air Base Wing, the 78th Medical Group, the Warner Robins Air Logistics Complex, and the Air Force Reserve Command’s 442nd Fighter Wing.
History
Robins Air Force Base was established in 1941 as Wellston Air Depot. It was renamed Warner Robins Air Depot in 1942 and was used as a maintenance and supply center for the Army Air Corps. In 1948, the base was transferred to the newly formed United States Air Force and renamed Robins Air Force Base. The base was named after Brigadier General Augustine Warner Robins, who was the first Chief of the Air Corps Materiel Division.
Robins AFB has played a major role in the development of the United States Air Force. During the Cold War, the base was a major center for aircraft maintenance and repair. It was also the site of the first Air Force Logistics Command, which was established in 1961. The base has also been involved in the development of the F-15 Eagle, the B-1B Lancer, and the C-130 Hercules.
Geography
Robins AFB is located in Houston County, Georgia, approximately 15 miles south of Macon and 100 miles south of Atlanta. The base is situated on approximately 6,000 acres of land and is bordered by the Ocmulgee River to the east and the Flint River to the west. The base is located in a rural area and is surrounded by farmland and woodlands.
Economy
Robins AFB is the largest industrial complex in Georgia and the largest employer in the Middle Georgia region. The base has an estimated economic impact of $4.5 billion annually and is responsible for more than 25,000 jobs in the region. The base is home to the 78th Air Base Wing, the 78th Medical Group, the Warner Robins Air Logistics Complex, and the Air Force Reserve Command’s 442nd Fighter Wing.
Robins AFB is also home to a number of private businesses, including Lockheed Martin, which is the largest employer on the base. Other businesses include Northrop Grumman, Boeing, and L-3 Communications. The base also houses a number of retail stores, restaurants, and other services.
Demographics
As of the 2010 census, the population of Robins AFB was 4,945. The racial makeup of the base was 73.3% White, 15.2% African American, 0.4% Native American, 4.2% Asian, 0.1% Pacific Islander, 4.2% from other races, and 2.6% from two or more races. The median household income was $45,845 and the median family income was $50,945.
Robins AFB is home to a diverse population of military personnel, civilian employees, and their families. The base is also home to a number of retirees and veterans. The base is served by a number of churches, schools, and other community organizations.
Common Questions
What is Per Capita Income in Robins AFB?
Per Capita income in Robins AFB is $43,184.
What is the Median Family Income in Robins AFB?
Median Family Income in Robins AFB is $137,232.
What is the Median Household income in Robins AFB?
Median Household Income in Robins AFB is $84,910.
What is Income or Wage Gap in Robins AFB?
Income or Wage Gap in Robins AFB is 16.4%.
Women in Robins AFB earn 83.6 cents for every dollar earned by a man.
What is Inequality or Gini Index in Robins AFB?
Inequality or Gini Index in Robins AFB is 0.34.
What is the Total Population of Robins AFB?
Total Population of Robins AFB is 1,316.
What is the Total Male Population of Robins AFB?
Total Male Population of Robins AFB is 849.
What is the Total Female Population of Robins AFB?
Total Female Population of Robins AFB is 467.
What is the Ratio of Males per 100 Females in Robins AFB?
There are 181.80 Males per 100 Females in Robins AFB.
What is the Ratio of Females per 100 Males in Robins AFB?
There are 55.01 Females per 100 Males in Robins AFB.
What is the Median Population Age in Robins AFB?
Median Population Age in Robins AFB is 24.8 Years.
What is the Average Family Size in Robins AFB
Average Family Size in Robins AFB is 2.9 People.
What is the Average Household Size in Robins AFB
Average Household Size in Robins AFB is 2.4 People.
How Large is the Labor Force in Robins AFB?
There are 856 People in the Labor Forcein in Robins AFB.
What is the Percentage of People in the Labor Force in Robins AFB?
83.4% of People are in the Labor Force in Robins AFB.
What is the Unemployment Rate in Robins AFB?
Unemployment Rate in Robins AFB is 7.4%.