Franklin Park, FL Map & Demographics
Franklin Park Map
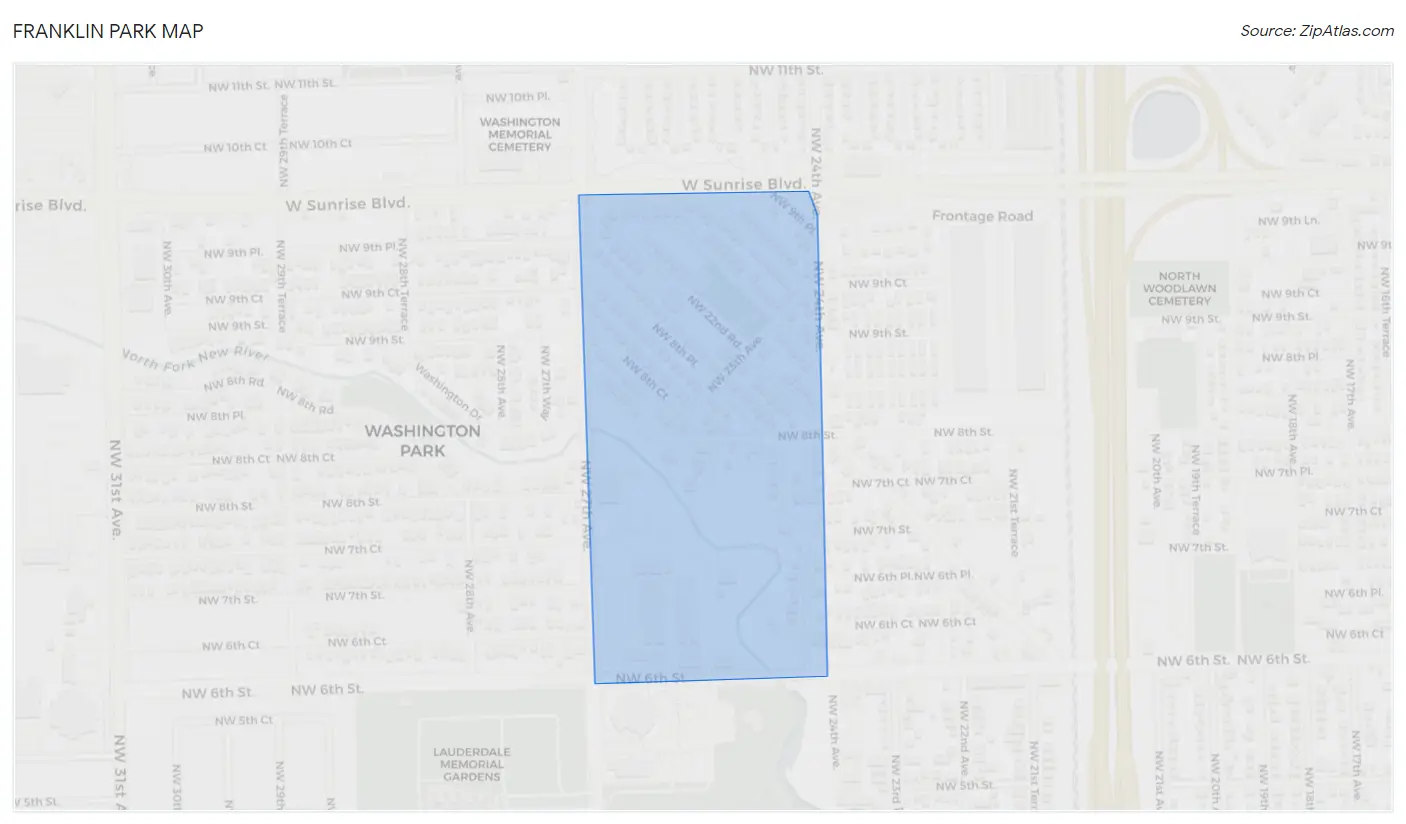
Franklin Park Overview
$11,404
PER CAPITA INCOME
$43,731
AVG FAMILY INCOME
$32,177
AVG HOUSEHOLD INCOME
22.3%
WAGE / INCOME GAP [ % ]
77.7¢/ $1
WAGE / INCOME GAP [ $ ]
0.30
INEQUALITY / GINI INDEX
1,969
TOTAL POPULATION
703
MALE POPULATION
1,266
FEMALE POPULATION
55.53
MALES / 100 FEMALES
180.09
FEMALES / 100 MALES
22.5
MEDIAN AGE
4.6
AVG FAMILY SIZE
3.7
AVG HOUSEHOLD SIZE
385
LABOR FORCE [ PEOPLE ]
38.2%
PERCENT IN LABOR FORCE
Income in Franklin Park
Income Overview in Franklin Park
Per Capita Income in Franklin Park is $11,404, while median incomes of families and households are $43,731 and $32,177 respectively.
| Characteristic | Number | Measure |
| Per Capita Income | 1,969 | $11,404 |
| Median Family Income | 342 | $43,731 |
| Mean Family Income | 342 | $43,439 |
| Median Household Income | 530 | $32,177 |
| Mean Household Income | 530 | $39,380 |
| Income Deficit | 342 | $0 |
| Wage / Income Gap (%) | 1,969 | 22.28% |
| Wage / Income Gap ($) | 1,969 | 77.72¢ per $1 |
| Gini / Inequality Index | 1,969 | 0.30 |
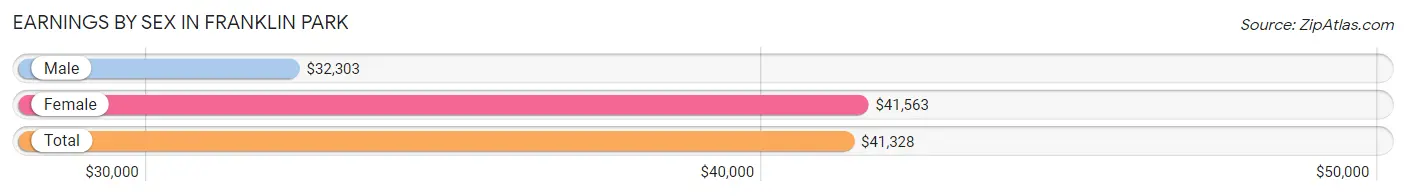
Earnings by Sex in Franklin Park
Average Earnings in Franklin Park are $41,328, $32,303 for men and $41,563 for women, a difference of 22.3%.
| Sex | Number | Average Earnings |
| Male | 216 (54.0%) | $32,303 |
| Female | 184 (46.0%) | $41,563 |
| Total | 400 (100.0%) | $41,328 |
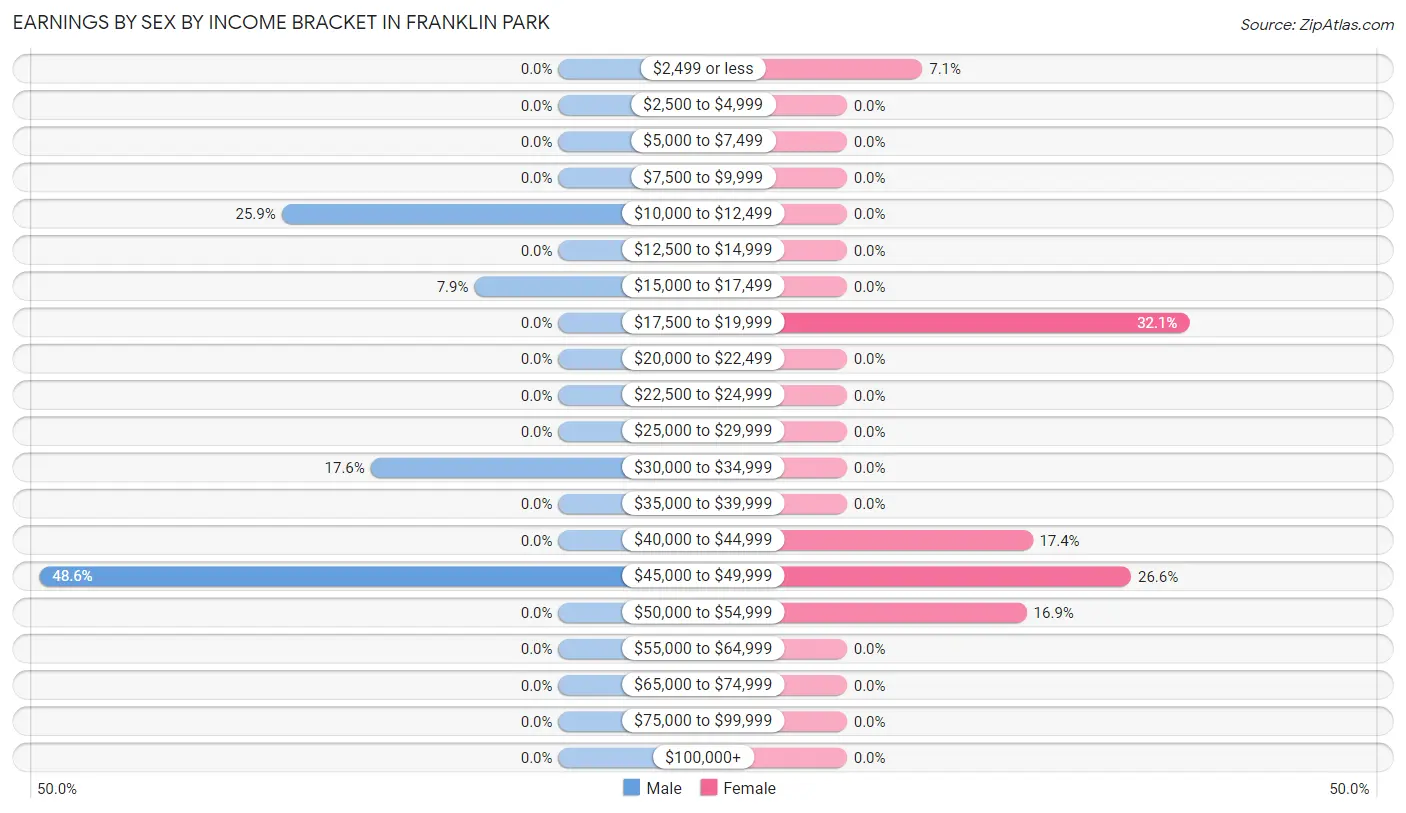
Earnings by Sex by Income Bracket in Franklin Park
The most common earnings brackets in Franklin Park are $45,000 to $49,999 for men (105 | 48.6%) and $17,500 to $19,999 for women (59 | 32.1%).
| Income | Male | Female |
| $2,499 or less | 0 (0.0%) | 13 (7.1%) |
| $2,500 to $4,999 | 0 (0.0%) | 0 (0.0%) |
| $5,000 to $7,499 | 0 (0.0%) | 0 (0.0%) |
| $7,500 to $9,999 | 0 (0.0%) | 0 (0.0%) |
| $10,000 to $12,499 | 56 (25.9%) | 0 (0.0%) |
| $12,500 to $14,999 | 0 (0.0%) | 0 (0.0%) |
| $15,000 to $17,499 | 17 (7.9%) | 0 (0.0%) |
| $17,500 to $19,999 | 0 (0.0%) | 59 (32.1%) |
| $20,000 to $22,499 | 0 (0.0%) | 0 (0.0%) |
| $22,500 to $24,999 | 0 (0.0%) | 0 (0.0%) |
| $25,000 to $29,999 | 0 (0.0%) | 0 (0.0%) |
| $30,000 to $34,999 | 38 (17.6%) | 0 (0.0%) |
| $35,000 to $39,999 | 0 (0.0%) | 0 (0.0%) |
| $40,000 to $44,999 | 0 (0.0%) | 32 (17.4%) |
| $45,000 to $49,999 | 105 (48.6%) | 49 (26.6%) |
| $50,000 to $54,999 | 0 (0.0%) | 31 (16.9%) |
| $55,000 to $64,999 | 0 (0.0%) | 0 (0.0%) |
| $65,000 to $74,999 | 0 (0.0%) | 0 (0.0%) |
| $75,000 to $99,999 | 0 (0.0%) | 0 (0.0%) |
| $100,000+ | 0 (0.0%) | 0 (0.0%) |
| Total | 216 (100.0%) | 184 (100.0%) |
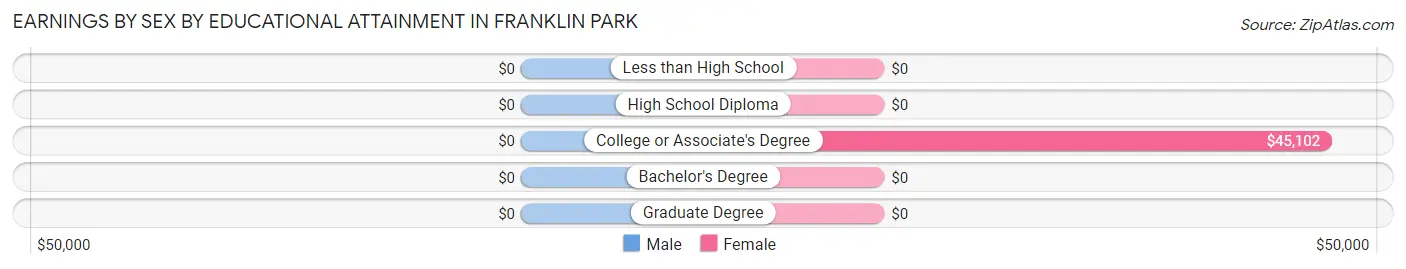
Earnings by Sex by Educational Attainment in Franklin Park
| Educational Attainment | Male Income | Female Income |
| Less than High School | - | - |
| High School Diploma | - | - |
| College or Associate's Degree | - | - |
| Bachelor's Degree | - | - |
| Graduate Degree | - | - |
| Total | $45,417 | $41,563 |
Family Income in Franklin Park
Family Income Brackets in Franklin Park
According to the Franklin Park family income data, there are 106 families falling into the $50,000 to $74,999 income range, which is the most common income bracket and makes up 31.0% of all families.
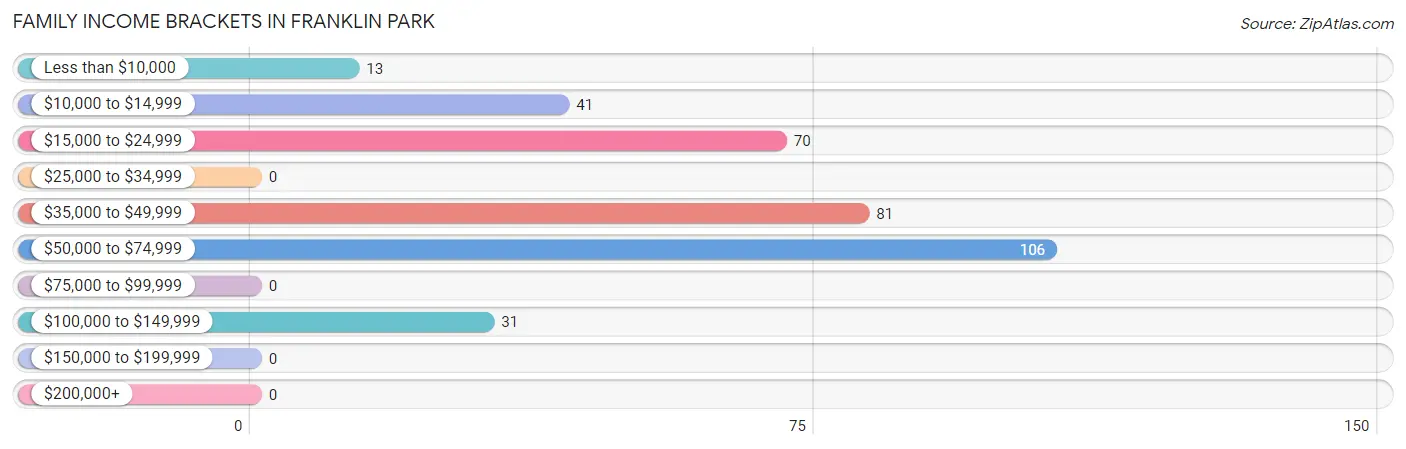
| Income Bracket | # Families | % Families |
| Less than $10,000 | 13 | 3.8% |
| $10,000 to $14,999 | 41 | 12.0% |
| $15,000 to $24,999 | 70 | 20.5% |
| $25,000 to $34,999 | 0 | 0.0% |
| $35,000 to $49,999 | 81 | 23.7% |
| $50,000 to $74,999 | 106 | 31.0% |
| $75,000 to $99,999 | 0 | 0.0% |
| $100,000 to $149,999 | 31 | 9.1% |
| $150,000 to $199,999 | 0 | 0.0% |
| $200,000+ | 0 | 0.0% |
Family Income by Famaliy Size in Franklin Park
2-person families (108 | 31.6%) account for the highest median family income in Franklin Park with $56,481 per family, while 2-person families (108 | 31.6%) have the highest median income of $28,240 per family member.
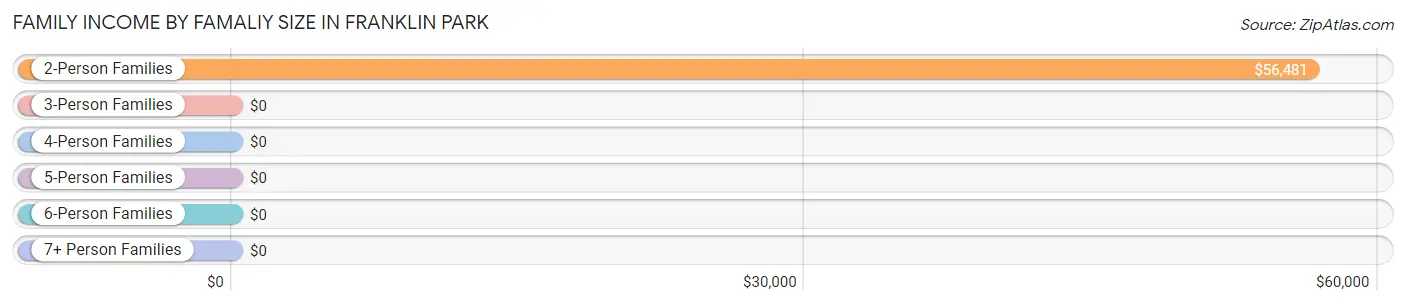
| Income Bracket | # Families | Median Income |
| 2-Person Families | 108 (31.6%) | $56,481 |
| 3-Person Families | 41 (12.0%) | $0 |
| 4-Person Families | 126 (36.8%) | $0 |
| 5-Person Families | 67 (19.6%) | $0 |
| 6-Person Families | 0 (0.0%) | $0 |
| 7+ Person Families | 0 (0.0%) | $0 |
| Total | 342 (100.0%) | $43,731 |
Family Income by Number of Earners in Franklin Park
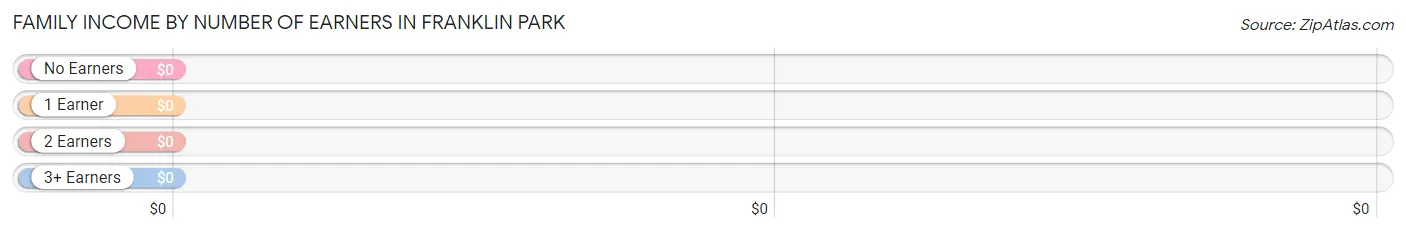
| Number of Earners | # Families | Median Income |
| No Earners | 73 (21.3%) | $0 |
| 1 Earner | 238 (69.6%) | $0 |
| 2 Earners | 31 (9.1%) | $0 |
| 3+ Earners | 0 (0.0%) | $0 |
| Total | 342 (100.0%) | $43,731 |
Household Income in Franklin Park
Household Income Brackets in Franklin Park
With 116 households falling in the category, the $25,000 to $34,999 income range is the most frequent in Franklin Park, accounting for 21.9% of all households.
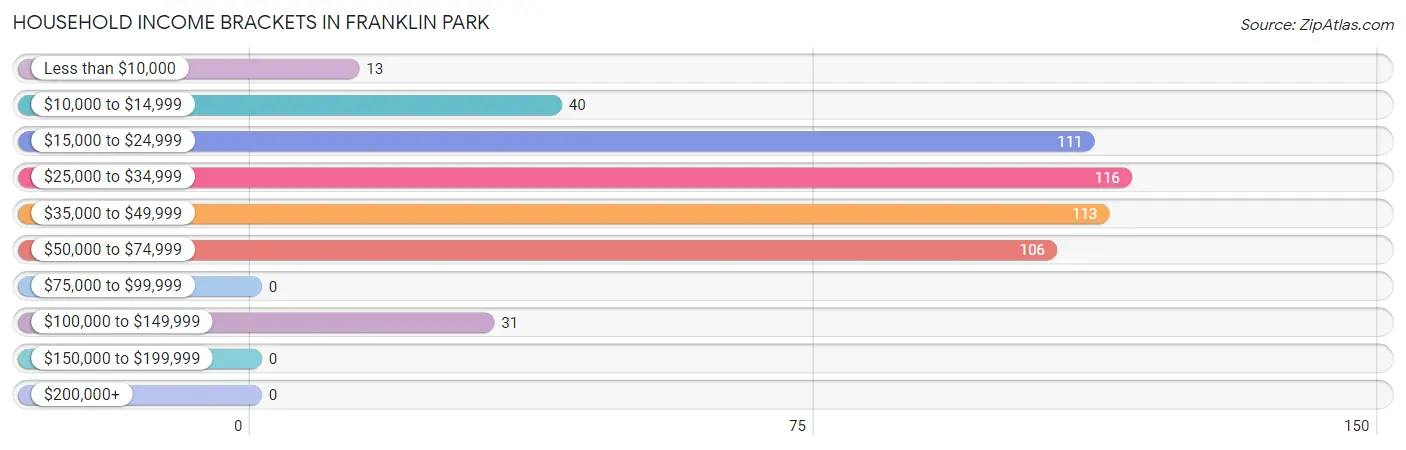
| Income Bracket | # Households | % Households |
| Less than $10,000 | 13 | 2.5% |
| $10,000 to $14,999 | 40 | 7.5% |
| $15,000 to $24,999 | 111 | 20.9% |
| $25,000 to $34,999 | 116 | 21.9% |
| $35,000 to $49,999 | 113 | 21.3% |
| $50,000 to $74,999 | 106 | 20.0% |
| $75,000 to $99,999 | 0 | 0.0% |
| $100,000 to $149,999 | 31 | 5.8% |
| $150,000 to $199,999 | 0 | 0.0% |
| $200,000+ | 0 | 0.0% |
Household Income by Householder Age in Franklin Park
The median household income in Franklin Park is $32,177, with the highest median household income of $63,430 found in the 65+ years age bracket for the primary householder. A total of 54 households (10.2%) fall into this category.
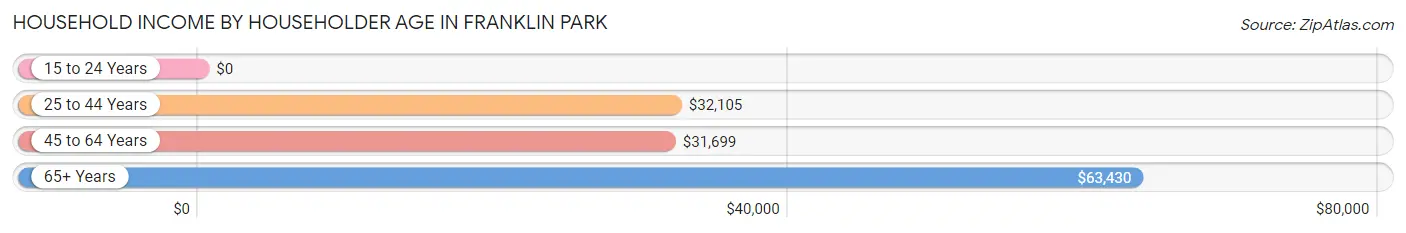
| Income Bracket | # Households | Median Income |
| 15 to 24 Years | 0 (0.0%) | $0 |
| 25 to 44 Years | 264 (49.8%) | $32,105 |
| 45 to 64 Years | 212 (40.0%) | $31,699 |
| 65+ Years | 54 (10.2%) | $63,430 |
| Total | 530 (100.0%) | $32,177 |
Poverty in Franklin Park
Income Below Poverty by Sex and Age in Franklin Park
With 59.2% poverty level for males and 29.6% for females among the residents of Franklin Park, 6 to 11 year old males and 5 year old females are the most vulnerable to poverty, with 225 males (85.2%) and 70 females (100.0%) in their respective age groups living below the poverty level.
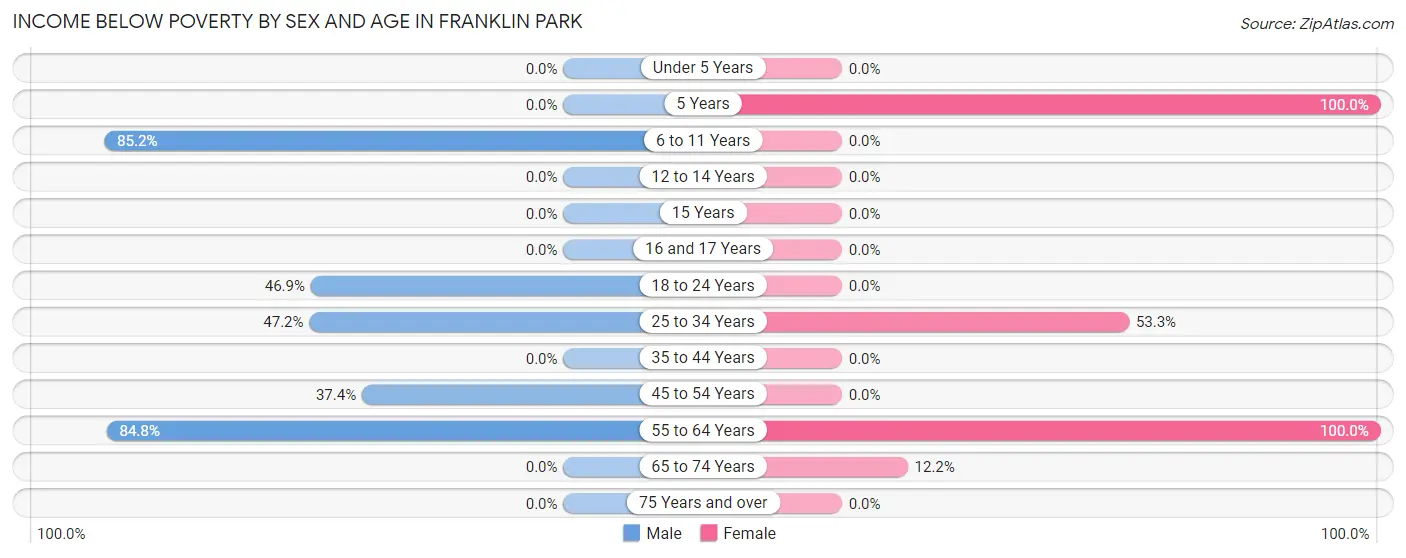
| Age Bracket | Male | Female |
| Under 5 Years | 0 (0.0%) | 0 (0.0%) |
| 5 Years | 0 (0.0%) | 70 (100.0%) |
| 6 to 11 Years | 225 (85.2%) | 0 (0.0%) |
| 12 to 14 Years | 0 (0.0%) | 0 (0.0%) |
| 15 Years | 0 (0.0%) | 0 (0.0%) |
| 16 and 17 Years | 0 (0.0%) | 0 (0.0%) |
| 18 to 24 Years | 15 (46.9%) | 0 (0.0%) |
| 25 to 34 Years | 58 (47.1%) | 97 (53.3%) |
| 35 to 44 Years | 0 (0.0%) | 0 (0.0%) |
| 45 to 54 Years | 40 (37.4%) | 0 (0.0%) |
| 55 to 64 Years | 78 (84.8%) | 197 (100.0%) |
| 65 to 74 Years | 0 (0.0%) | 11 (12.2%) |
| 75 Years and over | 0 (0.0%) | 0 (0.0%) |
| Total | 416 (59.2%) | 375 (29.6%) |
Income Above Poverty by Sex and Age in Franklin Park
According to the poverty statistics in Franklin Park, males aged 35 to 44 years and females aged under 5 years are the age groups that are most secure financially, with 100.0% of males and 100.0% of females in these age groups living above the poverty line.
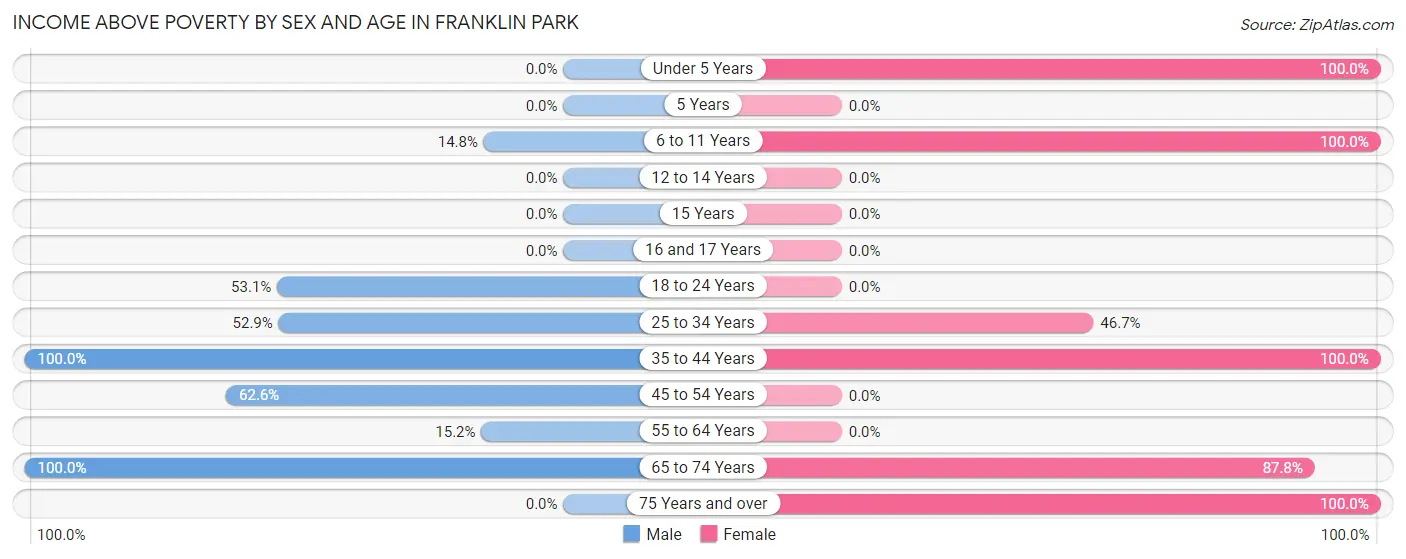
| Age Bracket | Male | Female |
| Under 5 Years | 0 (0.0%) | 46 (100.0%) |
| 5 Years | 0 (0.0%) | 0 (0.0%) |
| 6 to 11 Years | 39 (14.8%) | 581 (100.0%) |
| 12 to 14 Years | 0 (0.0%) | 0 (0.0%) |
| 15 Years | 0 (0.0%) | 0 (0.0%) |
| 16 and 17 Years | 0 (0.0%) | 0 (0.0%) |
| 18 to 24 Years | 17 (53.1%) | 0 (0.0%) |
| 25 to 34 Years | 65 (52.8%) | 85 (46.7%) |
| 35 to 44 Years | 36 (100.0%) | 63 (100.0%) |
| 45 to 54 Years | 67 (62.6%) | 0 (0.0%) |
| 55 to 64 Years | 14 (15.2%) | 0 (0.0%) |
| 65 to 74 Years | 49 (100.0%) | 79 (87.8%) |
| 75 Years and over | 0 (0.0%) | 37 (100.0%) |
| Total | 287 (40.8%) | 891 (70.4%) |
Income Below Poverty Among Married-Couple Families in Franklin Park
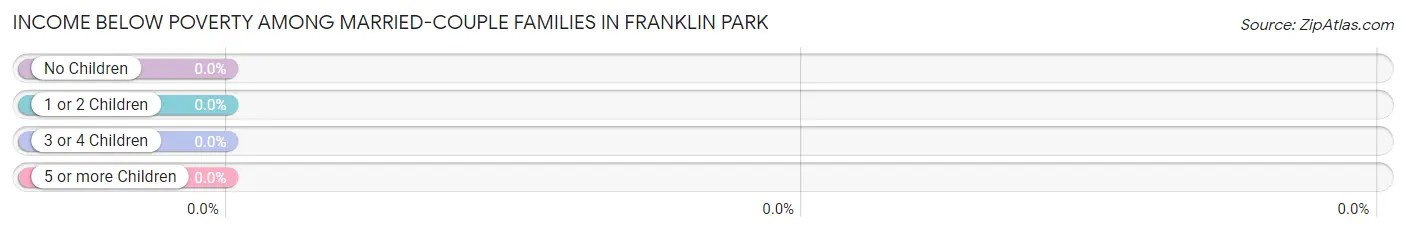
| Children | Above Poverty | Below Poverty |
| No Children | 6 (100.0%) | 0 (0.0%) |
| 1 or 2 Children | 31 (100.0%) | 0 (0.0%) |
| 3 or 4 Children | 0 (0.0%) | 0 (0.0%) |
| 5 or more Children | 0 (0.0%) | 0 (0.0%) |
| Total | 37 (100.0%) | 0 (0.0%) |
Income Below Poverty Among Single-Parent Households in Franklin Park
According to the poverty data in Franklin Park, 27.5% or 41 single-father households and 53.2% or 83 single-mother households are living below the poverty line. Among single-father households, those with 1 or 2 children have the highest poverty rate, with 41 households (100.0%) experiencing poverty. Likewise, among single-mother households, those with 3 or 4 children have the highest poverty rate, with 59 households (62.1%) falling below the poverty line.
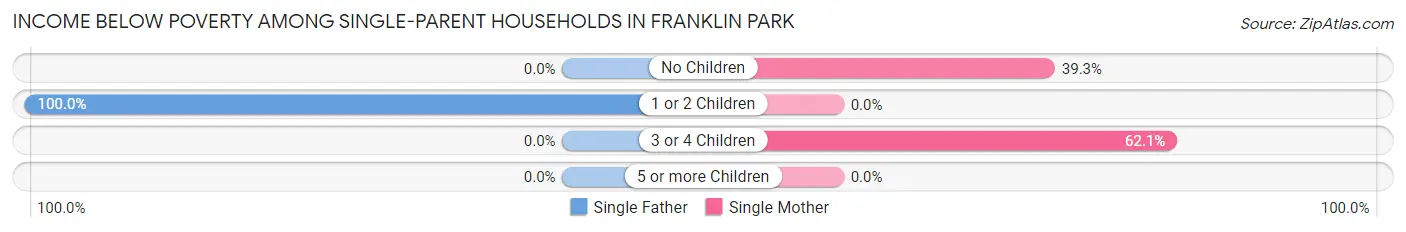
| Children | Single Father | Single Mother |
| No Children | 0 (0.0%) | 24 (39.3%) |
| 1 or 2 Children | 41 (100.0%) | 0 (0.0%) |
| 3 or 4 Children | 0 (0.0%) | 59 (62.1%) |
| 5 or more Children | 0 (0.0%) | 0 (0.0%) |
| Total | 41 (27.5%) | 83 (53.2%) |
Income Below Poverty Among Married-Couple vs Single-Parent Households in Franklin Park
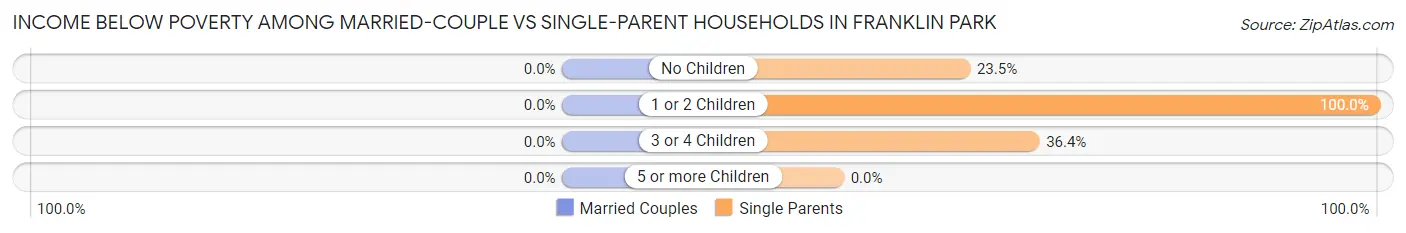
| Children | Married-Couple Families | Single-Parent Households |
| No Children | 0 (0.0%) | 24 (23.5%) |
| 1 or 2 Children | 0 (0.0%) | 41 (100.0%) |
| 3 or 4 Children | 0 (0.0%) | 59 (36.4%) |
| 5 or more Children | 0 (0.0%) | 0 (0.0%) |
| Total | 0 (0.0%) | 124 (40.7%) |
Race in Franklin Park
The most populous races in Franklin Park are Black / African American (1,906 | 96.8%), Hispanic or Latino (63 | 3.2%), and Some other Race (63 | 3.2%).
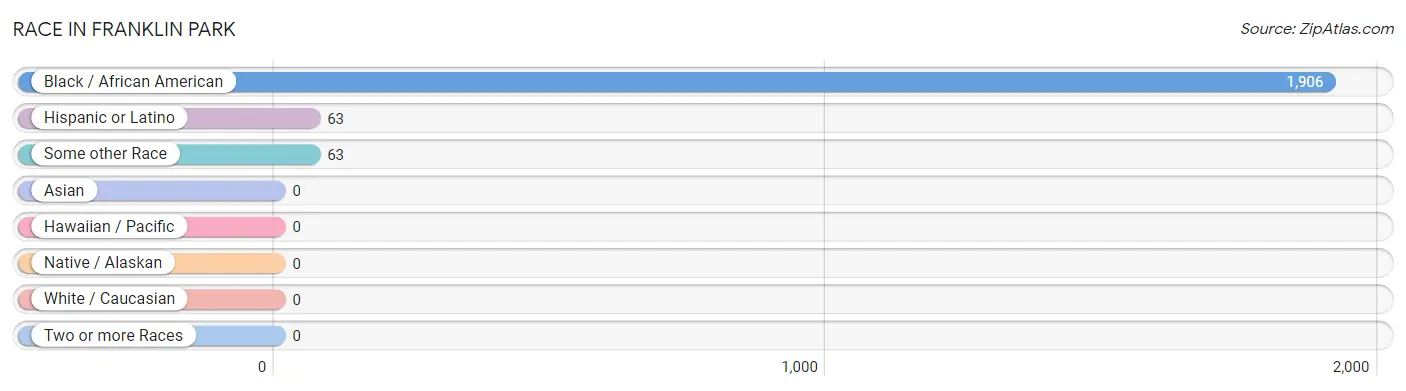
| Race | # Population | % Population |
| Asian | 0 | 0.0% |
| Black / African American | 1,906 | 96.8% |
| Hawaiian / Pacific | 0 | 0.0% |
| Hispanic or Latino | 63 | 3.2% |
| Native / Alaskan | 0 | 0.0% |
| White / Caucasian | 0 | 0.0% |
| Two or more Races | 0 | 0.0% |
| Some other Race | 63 | 3.2% |
| Total | 1,969 | 100.0% |
Ancestry in Franklin Park
The most populous ancestries reported in Franklin Park are Haitian (570 | 28.9%), Jamaican (189 | 9.6%), American (85 | 4.3%), Puerto Rican (63 | 3.2%), and Bahamian (32 | 1.6%), together accounting for 47.7% of all Franklin Park residents.
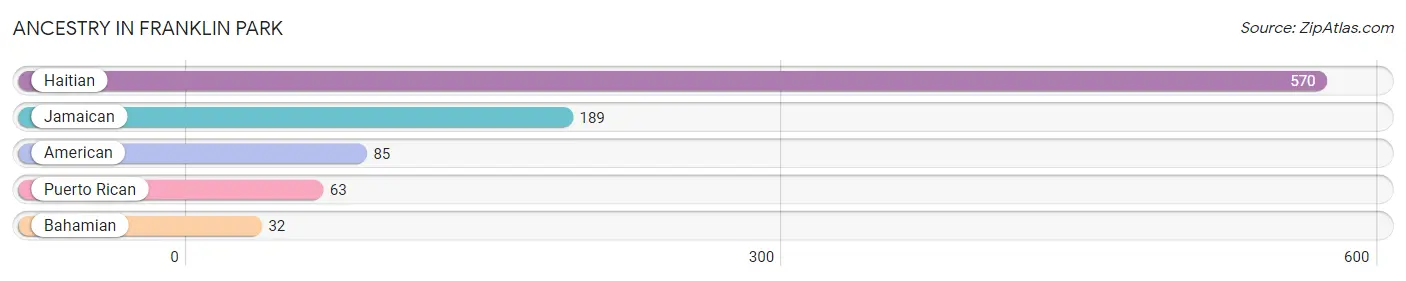
| Ancestry | # Population | % Population |
| American | 85 | 4.3% |
| Bahamian | 32 | 1.6% |
| Haitian | 570 | 28.9% |
| Jamaican | 189 | 9.6% |
| Puerto Rican | 63 | 3.2% | View All 5 Rows |
Immigrants in Franklin Park
The most numerous immigrant groups reported in Franklin Park came from Latin America (245 | 12.4%), Caribbean (209 | 10.6%), Haiti (105 | 5.3%), Jamaica (104 | 5.3%), and Central America (36 | 1.8%), together accounting for 35.5% of all Franklin Park residents.
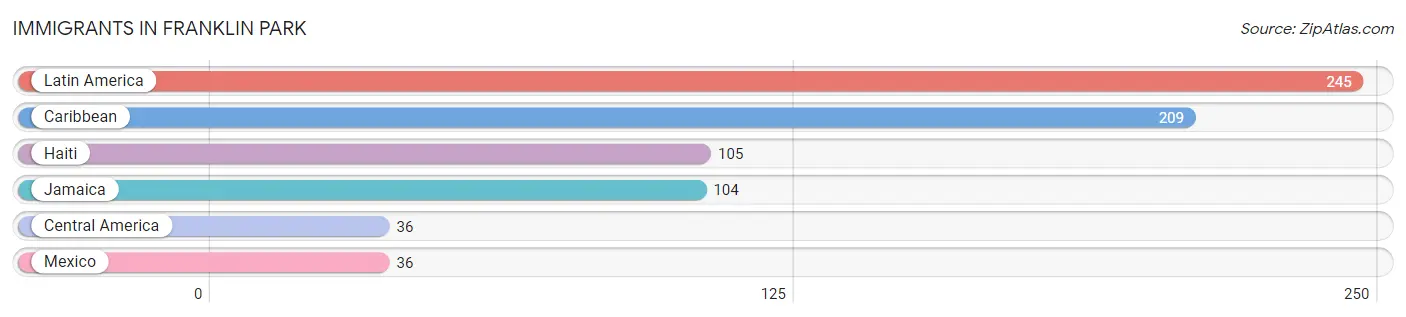
| Immigration Origin | # Population | % Population |
| Caribbean | 209 | 10.6% |
| Central America | 36 | 1.8% |
| Haiti | 105 | 5.3% |
| Jamaica | 104 | 5.3% |
| Latin America | 245 | 12.4% |
| Mexico | 36 | 1.8% | View All 6 Rows |
Sex and Age in Franklin Park
Sex and Age in Franklin Park
The most populous age groups in Franklin Park are 10 to 14 Years (178 | 25.3%) for men and 5 to 9 Years (612 | 48.3%) for women.
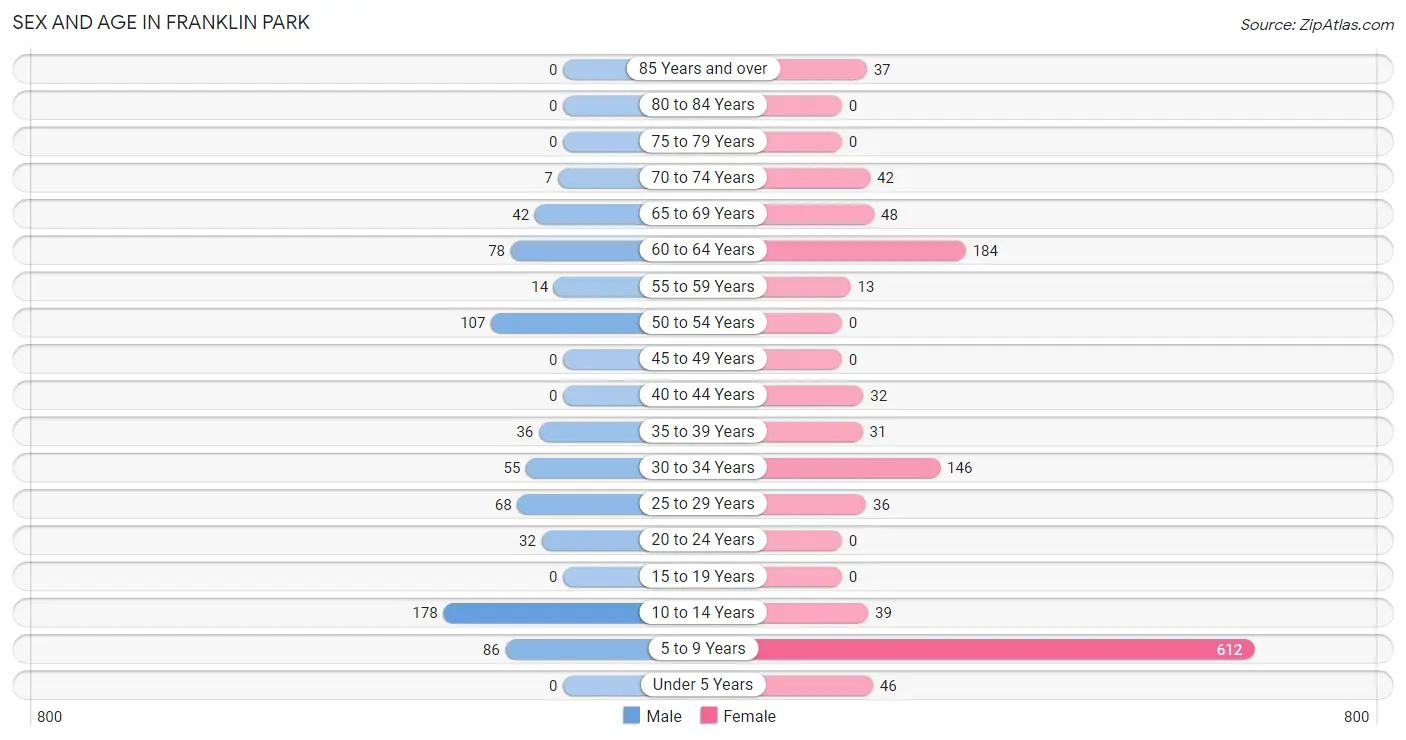
| Age Bracket | Male | Female |
| Under 5 Years | 0 (0.0%) | 46 (3.6%) |
| 5 to 9 Years | 86 (12.2%) | 612 (48.3%) |
| 10 to 14 Years | 178 (25.3%) | 39 (3.1%) |
| 15 to 19 Years | 0 (0.0%) | 0 (0.0%) |
| 20 to 24 Years | 32 (4.5%) | 0 (0.0%) |
| 25 to 29 Years | 68 (9.7%) | 36 (2.8%) |
| 30 to 34 Years | 55 (7.8%) | 146 (11.5%) |
| 35 to 39 Years | 36 (5.1%) | 31 (2.5%) |
| 40 to 44 Years | 0 (0.0%) | 32 (2.5%) |
| 45 to 49 Years | 0 (0.0%) | 0 (0.0%) |
| 50 to 54 Years | 107 (15.2%) | 0 (0.0%) |
| 55 to 59 Years | 14 (2.0%) | 13 (1.0%) |
| 60 to 64 Years | 78 (11.1%) | 184 (14.5%) |
| 65 to 69 Years | 42 (6.0%) | 48 (3.8%) |
| 70 to 74 Years | 7 (1.0%) | 42 (3.3%) |
| 75 to 79 Years | 0 (0.0%) | 0 (0.0%) |
| 80 to 84 Years | 0 (0.0%) | 0 (0.0%) |
| 85 Years and over | 0 (0.0%) | 37 (2.9%) |
| Total | 703 (100.0%) | 1,266 (100.0%) |
Families and Households in Franklin Park
Median Family Size in Franklin Park
The median family size in Franklin Park is 4.56 persons per family, with married-couple families (37 | 10.8%) accounting for the largest median family size of 5.46 persons per family. On the other hand, single female/mother families (156 | 45.6%) represent the smallest median family size with 3.87 persons per family.
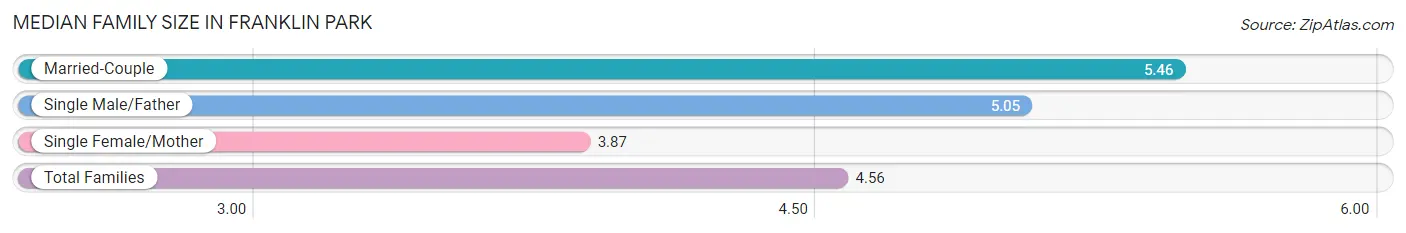
| Family Type | # Families | Family Size |
| Married-Couple | 37 (10.8%) | 5.46 |
| Single Male/Father | 149 (43.6%) | 5.05 |
| Single Female/Mother | 156 (45.6%) | 3.87 |
| Total Families | 342 (100.0%) | 4.56 |
Median Household Size in Franklin Park
The median household size in Franklin Park is 3.72 persons per household, with married-couple households (37 | 7.0%) accounting for the largest median household size of 5.46 persons per household. non-family households (188 | 35.5%) represent the smallest median household size with 1.98 persons per household.
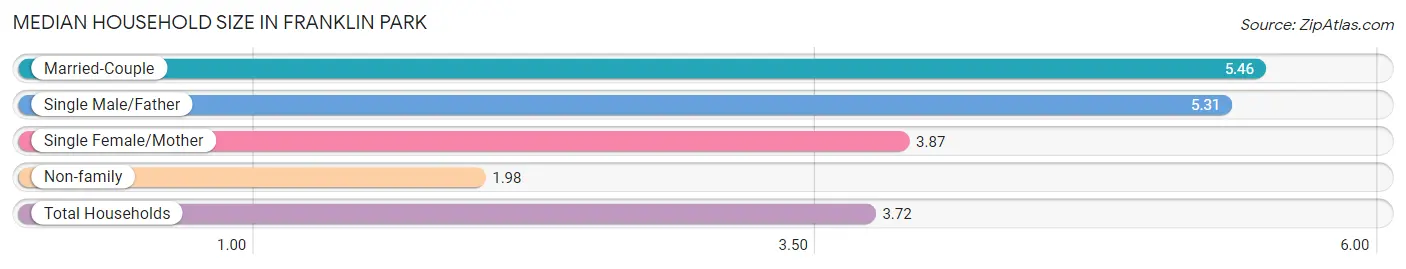
| Household Type | # Households | Household Size |
| Married-Couple | 37 (7.0%) | 5.46 |
| Single Male/Father | 149 (28.1%) | 5.31 |
| Single Female/Mother | 156 (29.4%) | 3.87 |
| Non-family | 188 (35.5%) | 1.98 |
| Total Households | 530 (100.0%) | 3.72 |
Household Size by Marriage Status in Franklin Park
Out of a total of 530 households in Franklin Park, 342 (64.5%) are family households, while 188 (35.5%) are nonfamily households. The most numerous type of family households are 4-person households, comprising 167, and the most common type of nonfamily households are 1-person households, comprising 110.
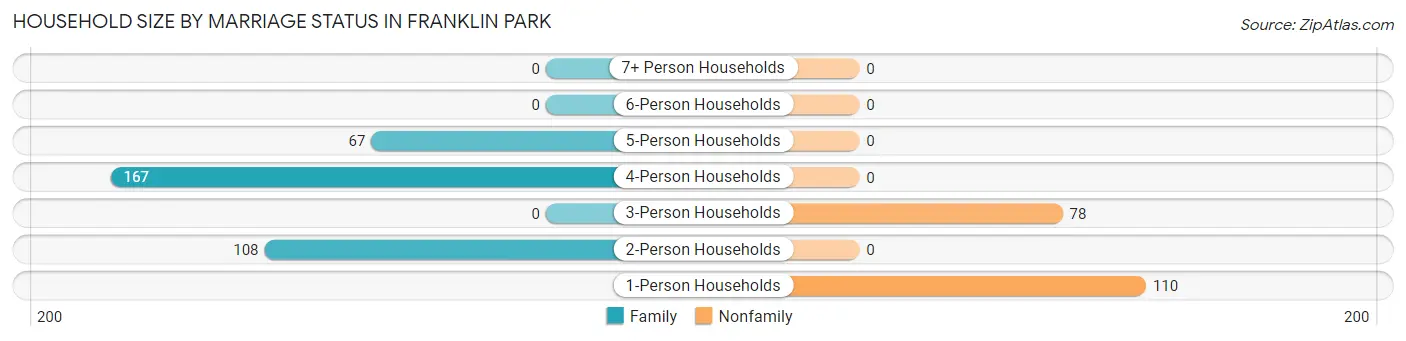
| Household Size | Family Households | Nonfamily Households |
| 1-Person Households | - | 110 (20.7%) |
| 2-Person Households | 108 (20.4%) | 0 (0.0%) |
| 3-Person Households | 0 (0.0%) | 78 (14.7%) |
| 4-Person Households | 167 (31.5%) | 0 (0.0%) |
| 5-Person Households | 67 (12.6%) | 0 (0.0%) |
| 6-Person Households | 0 (0.0%) | 0 (0.0%) |
| 7+ Person Households | 0 (0.0%) | 0 (0.0%) |
| Total | 342 (64.5%) | 188 (35.5%) |
Female Fertility in Franklin Park
Fertility by Age in Franklin Park
| Age Bracket | Women with Births | Births / 1,000 Women |
| 15 to 19 years | 0 (0.0%) | 0.0 |
| 20 to 34 years | 0 (0.0%) | 0.0 |
| 35 to 50 years | 0 (0.0%) | 0.0 |
| Total | 0 (0.0%) | 0.0 |
Fertility by Age by Marriage Status in Franklin Park
| Age Bracket | Married | Unmarried |
| 15 to 19 years | 0 (0.0%) | 0 (0.0%) |
| 20 to 34 years | 0 (0.0%) | 0 (0.0%) |
| 35 to 50 years | 0 (0.0%) | 0 (0.0%) |
| Total | 0 (0.0%) | 0 (0.0%) |
Fertility by Education in Franklin Park
| Educational Attainment | Women with Births | Births / 1,000 Women |
| Less than High School | 0 (0.0%) | 0.0 |
| High School Diploma | 0 (0.0%) | 0.0 |
| College or Associate's Degree | 0 (0.0%) | 0.0 |
| Bachelor's Degree | 0 (0.0%) | 0.0 |
| Graduate Degree | 0 (0.0%) | 0.0 |
| Total | 0 (0.0%) | 0.0 |
Fertility by Education by Marriage Status in Franklin Park
| Educational Attainment | Married | Unmarried |
| Less than High School | 0 (0.0%) | 0 (0.0%) |
| High School Diploma | 0 (0.0%) | 0 (0.0%) |
| College or Associate's Degree | 0 (0.0%) | 0 (0.0%) |
| Bachelor's Degree | 0 (0.0%) | 0 (0.0%) |
| Graduate Degree | 0 (0.0%) | 0 (0.0%) |
| Total | 0 (0.0%) | 0 (0.0%) |
Employment Characteristics in Franklin Park
Employment by Class of Employer in Franklin Park
Among the 385 employed individuals in Franklin Park, private company employees (263 | 68.3%), local government employees (68 | 17.7%), and self-employed (not incorporated) (54 | 14.0%) make up the most common classes of employment.
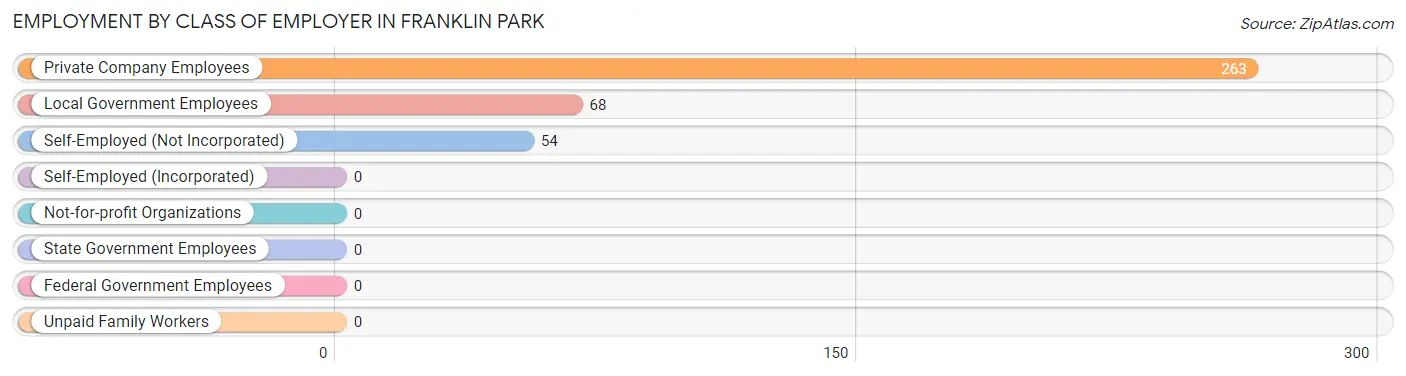
| Employer Class | # Employees | % Employees |
| Private Company Employees | 263 | 68.3% |
| Self-Employed (Incorporated) | 0 | 0.0% |
| Self-Employed (Not Incorporated) | 54 | 14.0% |
| Not-for-profit Organizations | 0 | 0.0% |
| Local Government Employees | 68 | 17.7% |
| State Government Employees | 0 | 0.0% |
| Federal Government Employees | 0 | 0.0% |
| Unpaid Family Workers | 0 | 0.0% |
| Total | 385 | 100.0% |
Employment Status by Age in Franklin Park
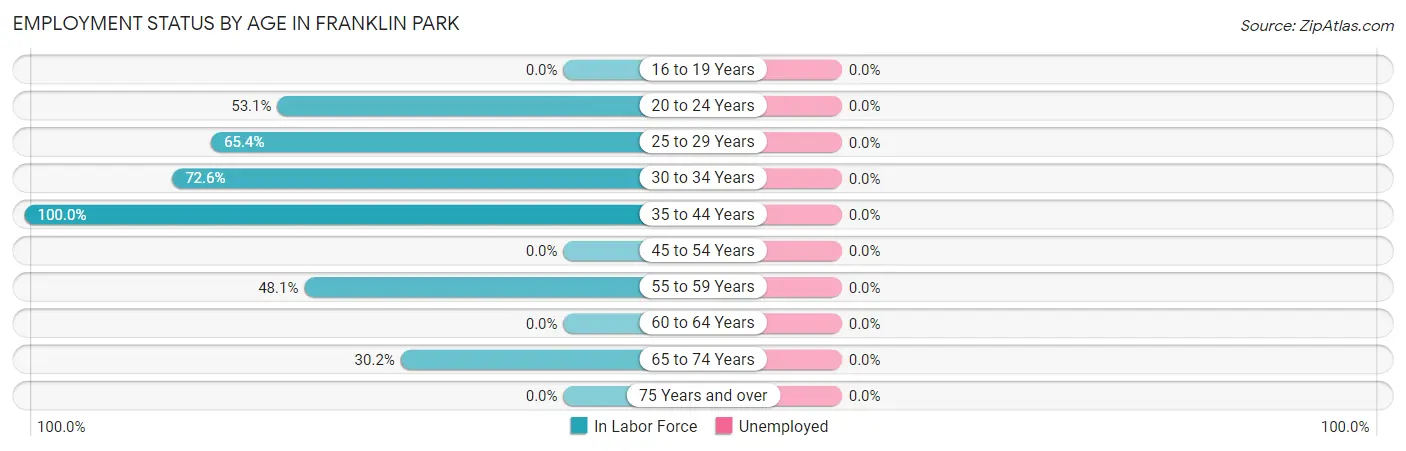
| Age Bracket | In Labor Force | Unemployed |
| 16 to 19 Years | 0 (0.0%) | 0 (0.0%) |
| 20 to 24 Years | 17 (53.1%) | 0 (0.0%) |
| 25 to 29 Years | 68 (65.4%) | 0 (0.0%) |
| 30 to 34 Years | 146 (72.6%) | 0 (0.0%) |
| 35 to 44 Years | 99 (100.0%) | 0 (0.0%) |
| 45 to 54 Years | 0 (0.0%) | 0 (0.0%) |
| 55 to 59 Years | 13 (48.1%) | 0 (0.0%) |
| 60 to 64 Years | 0 (0.0%) | 0 (0.0%) |
| 65 to 74 Years | 42 (30.2%) | 0 (0.0%) |
| 75 Years and over | 0 (0.0%) | 0 (0.0%) |
| Total | 385 (38.2%) | 0 (0.0%) |
Employment Status by Educational Attainment in Franklin Park
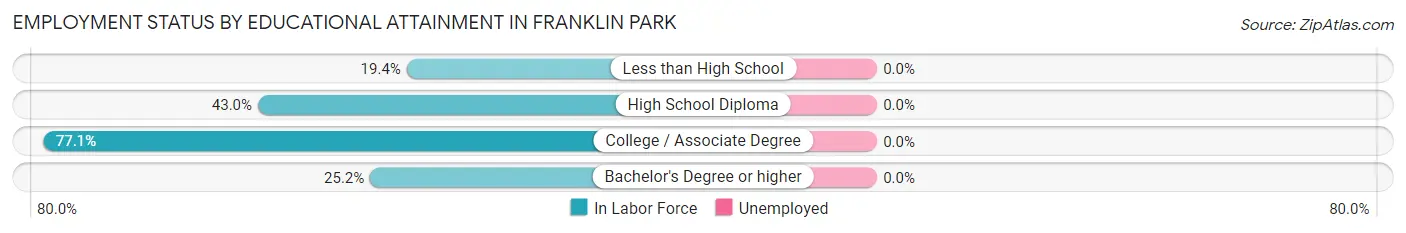
| Educational Attainment | In Labor Force | Unemployed |
| Less than High School | 41 (19.4%) | 0 (0.0%) |
| High School Diploma | 133 (43.0%) | 0 (0.0%) |
| College / Associate Degree | 121 (77.1%) | 0 (0.0%) |
| Bachelor's Degree or higher | 31 (25.2%) | 0 (0.0%) |
| Total | 326 (40.8%) | 0 (0.0%) |
Employment Occupations by Sex in Franklin Park
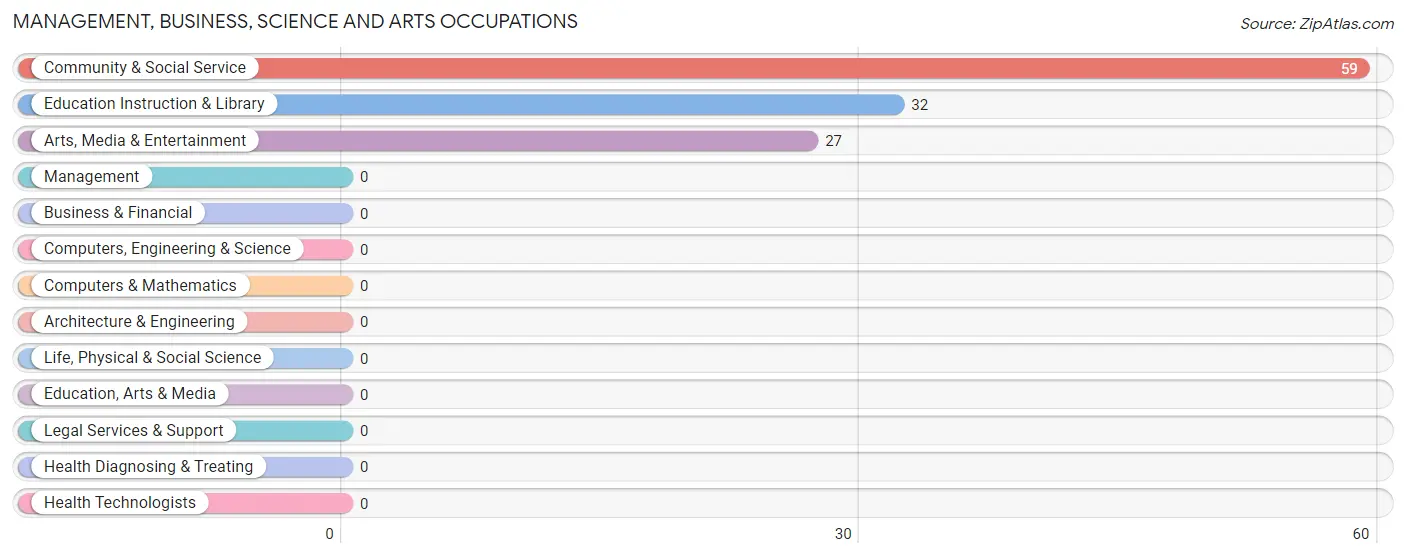
Management, Business, Science and Arts Occupations
The most common Management, Business, Science and Arts occupations in Franklin Park are Community & Social Service (59 | 15.3%), Education Instruction & Library (32 | 8.3%), and Arts, Media & Entertainment (27 | 7.0%).
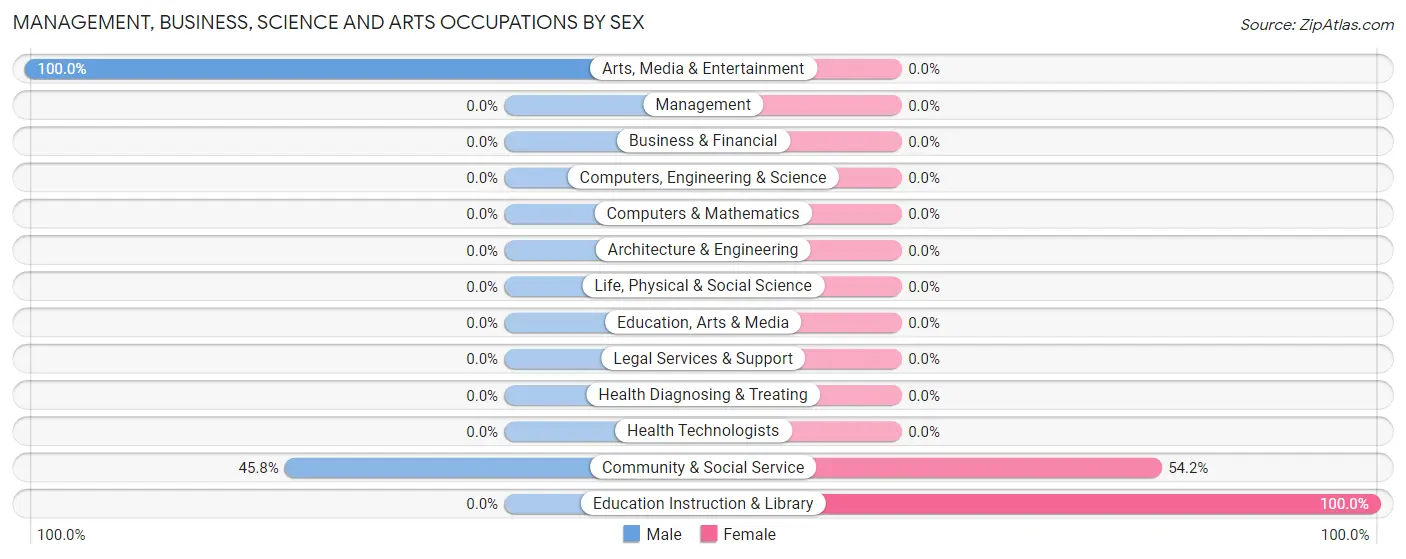
Management, Business, Science and Arts Occupations by Sex
Within the Management, Business, Science and Arts occupations in Franklin Park, the most male-oriented occupations are Arts, Media & Entertainment (100.0%), and Community & Social Service (45.8%), while the most female-oriented occupations are Education Instruction & Library (100.0%), and Community & Social Service (54.2%).
| Occupation | Male | Female |
| Management | 0 (0.0%) | 0 (0.0%) |
| Business & Financial | 0 (0.0%) | 0 (0.0%) |
| Computers, Engineering & Science | 0 (0.0%) | 0 (0.0%) |
| Computers & Mathematics | 0 (0.0%) | 0 (0.0%) |
| Architecture & Engineering | 0 (0.0%) | 0 (0.0%) |
| Life, Physical & Social Science | 0 (0.0%) | 0 (0.0%) |
| Community & Social Service | 27 (45.8%) | 32 (54.2%) |
| Education, Arts & Media | 0 (0.0%) | 0 (0.0%) |
| Legal Services & Support | 0 (0.0%) | 0 (0.0%) |
| Education Instruction & Library | 0 (0.0%) | 32 (100.0%) |
| Arts, Media & Entertainment | 27 (100.0%) | 0 (0.0%) |
| Health Diagnosing & Treating | 0 (0.0%) | 0 (0.0%) |
| Health Technologists | 0 (0.0%) | 0 (0.0%) |
| Total (Category) | 27 (45.8%) | 32 (54.2%) |
| Total (Overall) | 201 (52.2%) | 184 (47.8%) |
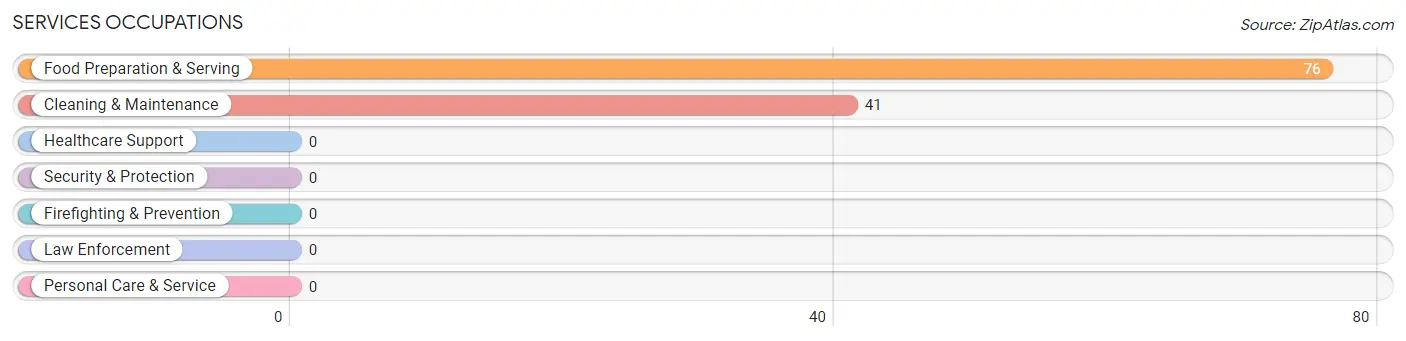
Services Occupations
The most common Services occupations in Franklin Park are Food Preparation & Serving (76 | 19.7%), and Cleaning & Maintenance (41 | 10.6%).
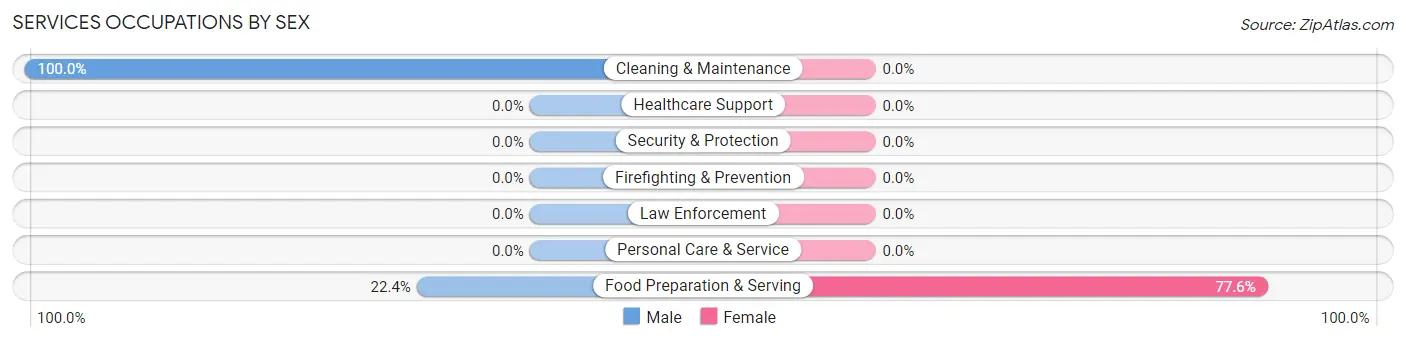
Services Occupations by Sex
| Occupation | Male | Female |
| Healthcare Support | 0 (0.0%) | 0 (0.0%) |
| Security & Protection | 0 (0.0%) | 0 (0.0%) |
| Firefighting & Prevention | 0 (0.0%) | 0 (0.0%) |
| Law Enforcement | 0 (0.0%) | 0 (0.0%) |
| Food Preparation & Serving | 17 (22.4%) | 59 (77.6%) |
| Cleaning & Maintenance | 41 (100.0%) | 0 (0.0%) |
| Personal Care & Service | 0 (0.0%) | 0 (0.0%) |
| Total (Category) | 58 (49.6%) | 59 (50.4%) |
| Total (Overall) | 201 (52.2%) | 184 (47.8%) |
Sales and Office Occupations
The most common Sales and Office occupations in Franklin Park are , and Office & Administration (118 | 30.6%).
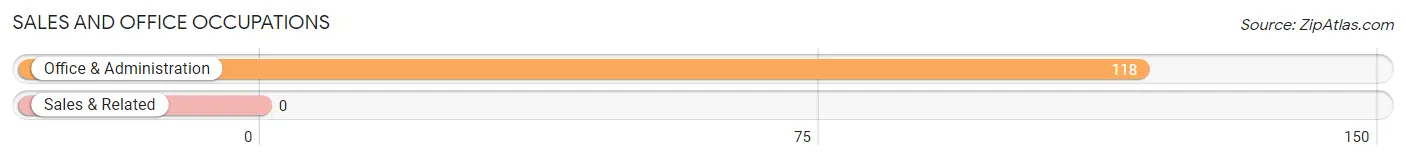
Sales and Office Occupations by Sex
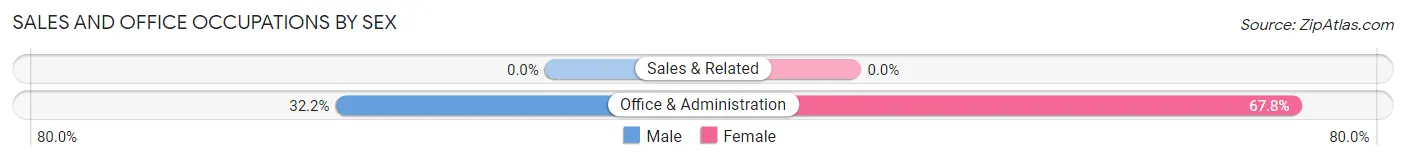
| Occupation | Male | Female |
| Sales & Related | 0 (0.0%) | 0 (0.0%) |
| Office & Administration | 38 (32.2%) | 80 (67.8%) |
| Total (Category) | 38 (32.2%) | 80 (67.8%) |
| Total (Overall) | 201 (52.2%) | 184 (47.8%) |
Natural Resources, Construction and Maintenance Occupations
The most common Natural Resources, Construction and Maintenance occupations in Franklin Park are Construction & Extraction (42 | 10.9%), and Installation, Maintenance & Repair (36 | 9.3%).
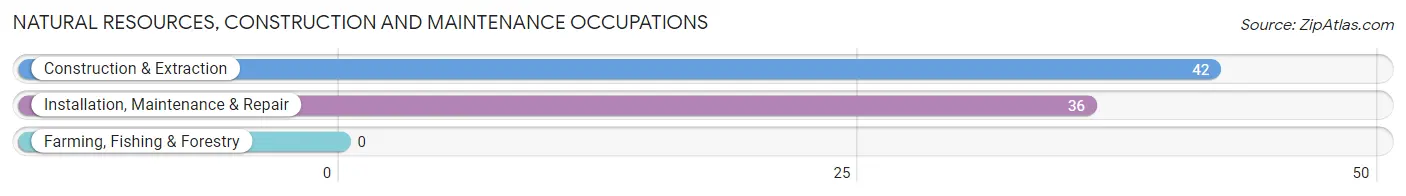
Natural Resources, Construction and Maintenance Occupations by Sex
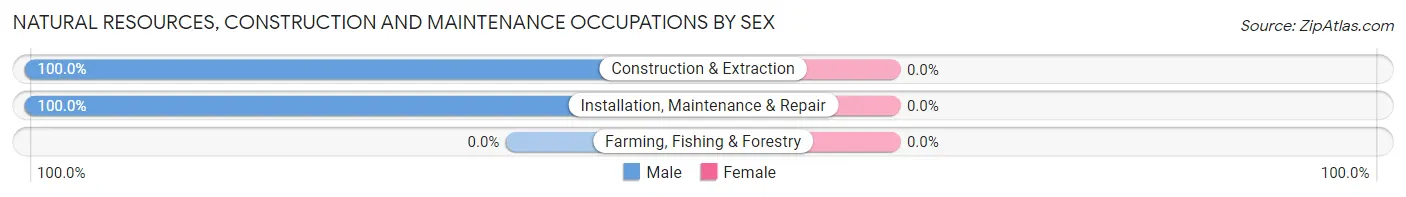
| Occupation | Male | Female |
| Farming, Fishing & Forestry | 0 (0.0%) | 0 (0.0%) |
| Construction & Extraction | 42 (100.0%) | 0 (0.0%) |
| Installation, Maintenance & Repair | 36 (100.0%) | 0 (0.0%) |
| Total (Category) | 78 (100.0%) | 0 (0.0%) |
| Total (Overall) | 201 (52.2%) | 184 (47.8%) |
Production, Transportation and Moving Occupations
The most common Production, Transportation and Moving occupations in Franklin Park are , and Transportation (13 | 3.4%).
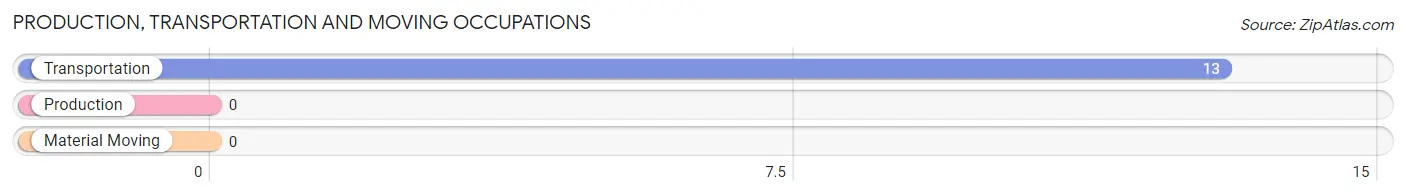
Production, Transportation and Moving Occupations by Sex
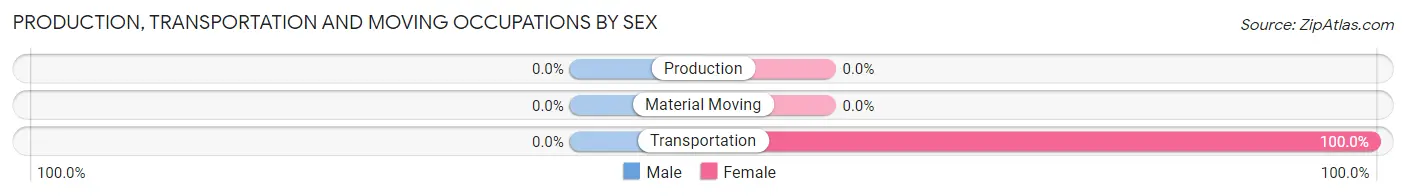
| Occupation | Male | Female |
| Production | 0 (0.0%) | 0 (0.0%) |
| Transportation | 0 (0.0%) | 13 (100.0%) |
| Material Moving | 0 (0.0%) | 0 (0.0%) |
| Total (Category) | 0 (0.0%) | 13 (100.0%) |
| Total (Overall) | 201 (52.2%) | 184 (47.8%) |
Employment Industries by Sex in Franklin Park
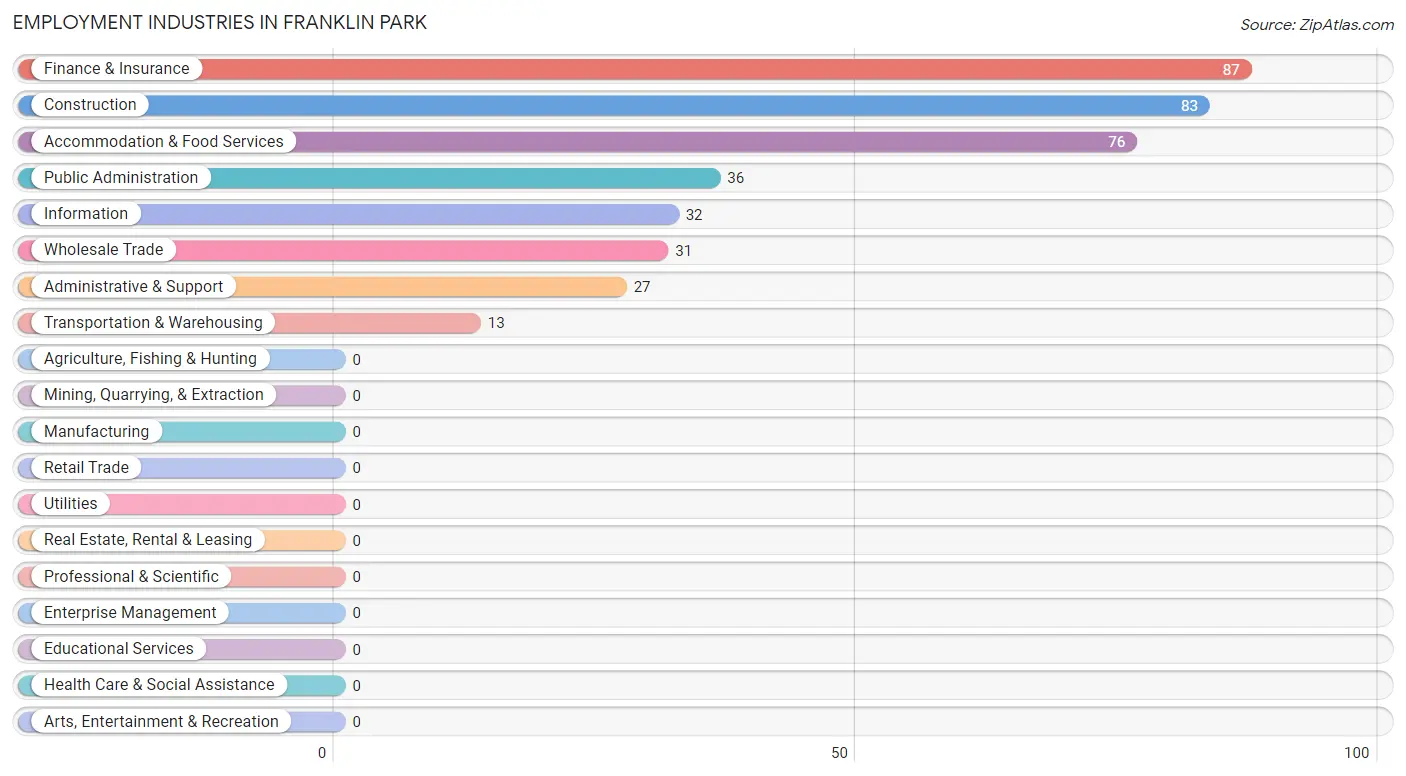
Employment Industries in Franklin Park
The major employment industries in Franklin Park include Finance & Insurance (87 | 22.6%), Construction (83 | 21.6%), Accommodation & Food Services (76 | 19.7%), Public Administration (36 | 9.3%), and Information (32 | 8.3%).
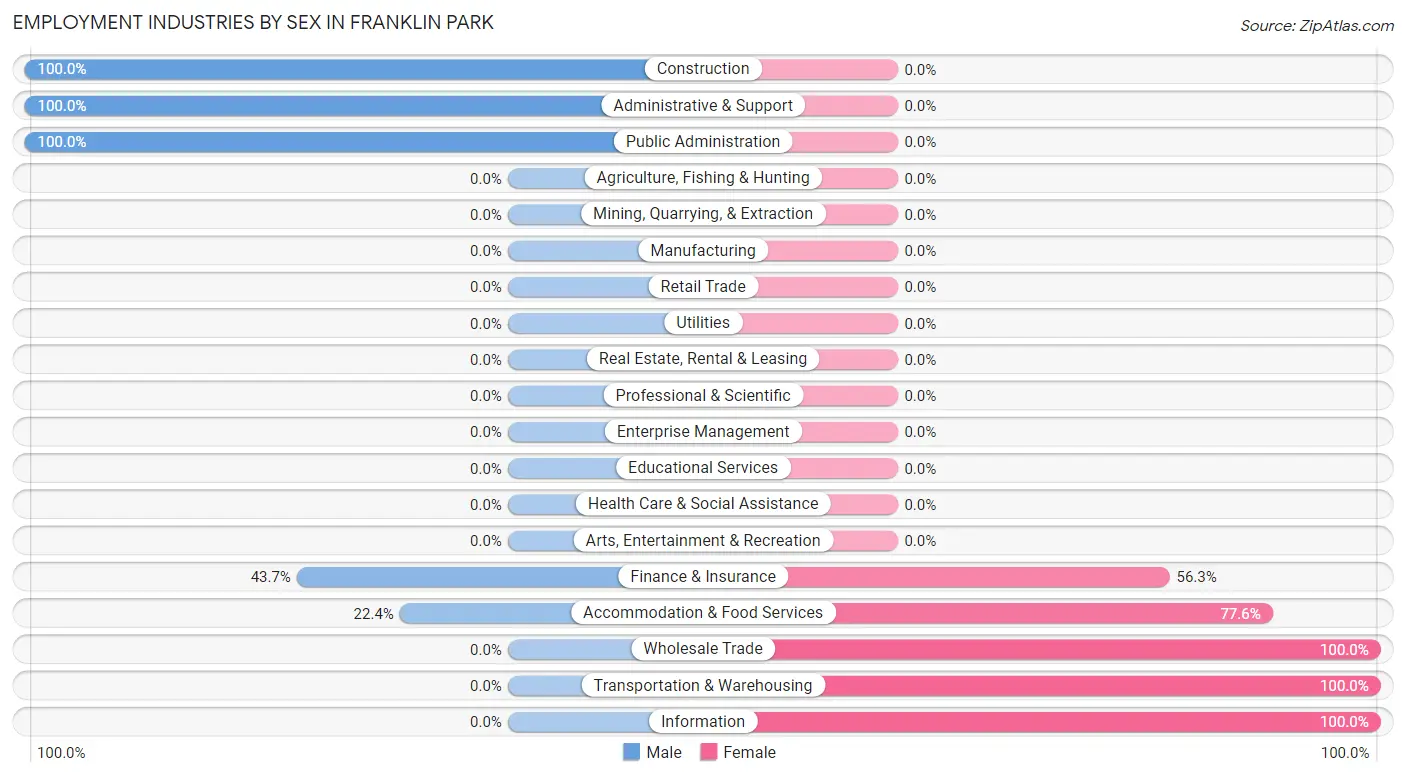
Employment Industries by Sex in Franklin Park
The Franklin Park industries that see more men than women are Construction (100.0%), Administrative & Support (100.0%), and Public Administration (100.0%), whereas the industries that tend to have a higher number of women are Wholesale Trade (100.0%), Transportation & Warehousing (100.0%), and Information (100.0%).
| Industry | Male | Female |
| Agriculture, Fishing & Hunting | 0 (0.0%) | 0 (0.0%) |
| Mining, Quarrying, & Extraction | 0 (0.0%) | 0 (0.0%) |
| Construction | 83 (100.0%) | 0 (0.0%) |
| Manufacturing | 0 (0.0%) | 0 (0.0%) |
| Wholesale Trade | 0 (0.0%) | 31 (100.0%) |
| Retail Trade | 0 (0.0%) | 0 (0.0%) |
| Transportation & Warehousing | 0 (0.0%) | 13 (100.0%) |
| Utilities | 0 (0.0%) | 0 (0.0%) |
| Information | 0 (0.0%) | 32 (100.0%) |
| Finance & Insurance | 38 (43.7%) | 49 (56.3%) |
| Real Estate, Rental & Leasing | 0 (0.0%) | 0 (0.0%) |
| Professional & Scientific | 0 (0.0%) | 0 (0.0%) |
| Enterprise Management | 0 (0.0%) | 0 (0.0%) |
| Administrative & Support | 27 (100.0%) | 0 (0.0%) |
| Educational Services | 0 (0.0%) | 0 (0.0%) |
| Health Care & Social Assistance | 0 (0.0%) | 0 (0.0%) |
| Arts, Entertainment & Recreation | 0 (0.0%) | 0 (0.0%) |
| Accommodation & Food Services | 17 (22.4%) | 59 (77.6%) |
| Public Administration | 36 (100.0%) | 0 (0.0%) |
| Total | 201 (52.2%) | 184 (47.8%) |
Education in Franklin Park
School Enrollment in Franklin Park
The most common levels of schooling among the 951 students in Franklin Park are elementary school (667 | 70.1%), middle school (178 | 18.7%), and kindergarten (70 | 7.4%).
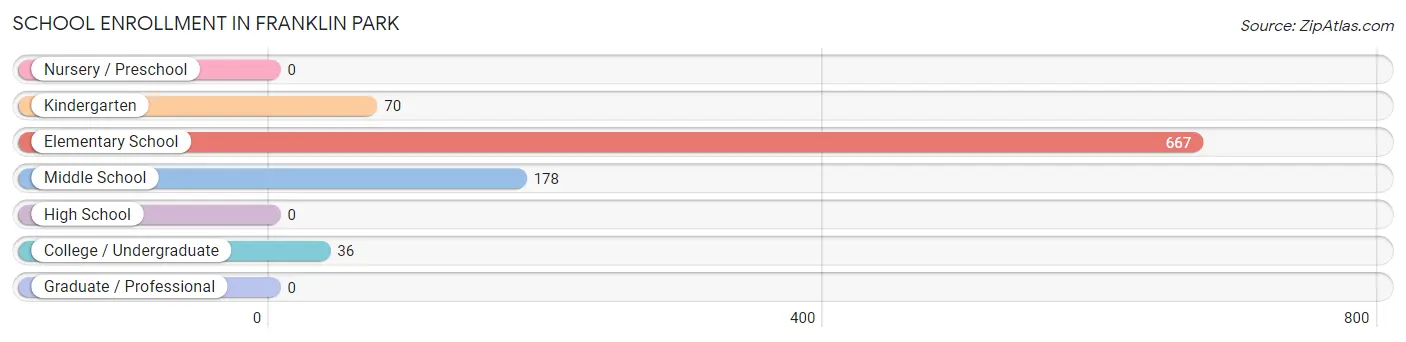
| School Level | # Students | % Students |
| Nursery / Preschool | 0 | 0.0% |
| Kindergarten | 70 | 7.4% |
| Elementary School | 667 | 70.1% |
| Middle School | 178 | 18.7% |
| High School | 0 | 0.0% |
| College / Undergraduate | 36 | 3.8% |
| Graduate / Professional | 0 | 0.0% |
| Total | 951 | 100.0% |
School Enrollment by Age by Funding Source in Franklin Park
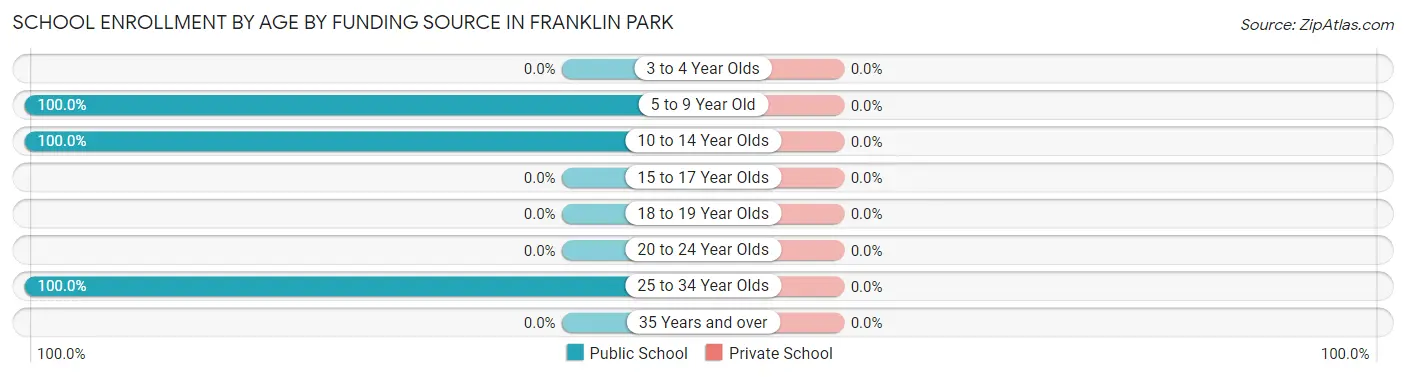
| Age Bracket | Public School | Private School |
| 3 to 4 Year Olds | 0 (0.0%) | 0 (0.0%) |
| 5 to 9 Year Old | 698 (100.0%) | 0 (0.0%) |
| 10 to 14 Year Olds | 217 (100.0%) | 0 (0.0%) |
| 15 to 17 Year Olds | 0 (0.0%) | 0 (0.0%) |
| 18 to 19 Year Olds | 0 (0.0%) | 0 (0.0%) |
| 20 to 24 Year Olds | 0 (0.0%) | 0 (0.0%) |
| 25 to 34 Year Olds | 36 (100.0%) | 0 (0.0%) |
| 35 Years and over | 0 (0.0%) | 0 (0.0%) |
| Total | 951 (100.0%) | 0 (0.0%) |
Educational Attainment by Field of Study in Franklin Park
Communications (92 | 74.8%), and business (31 | 25.2%) are the most common fields of study among 123 individuals in Franklin Park who have obtained a bachelor's degree or higher.
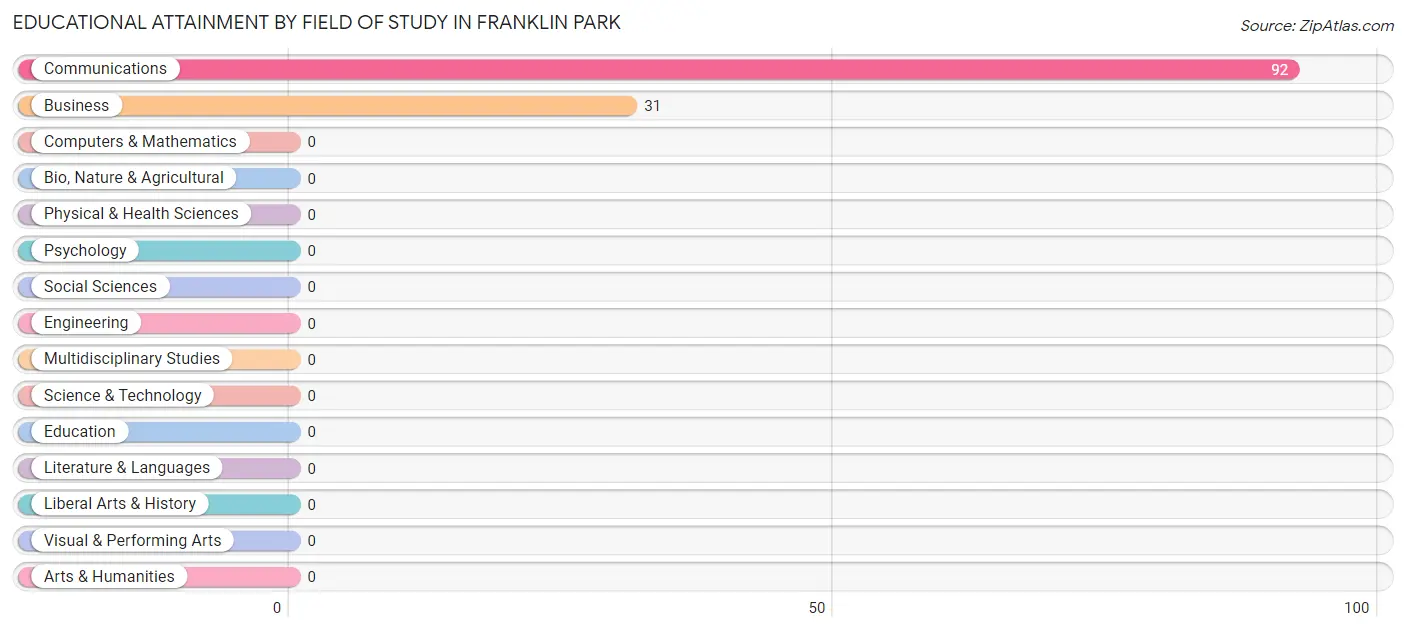
| Field of Study | # Graduates | % Graduates |
| Computers & Mathematics | 0 | 0.0% |
| Bio, Nature & Agricultural | 0 | 0.0% |
| Physical & Health Sciences | 0 | 0.0% |
| Psychology | 0 | 0.0% |
| Social Sciences | 0 | 0.0% |
| Engineering | 0 | 0.0% |
| Multidisciplinary Studies | 0 | 0.0% |
| Science & Technology | 0 | 0.0% |
| Business | 31 | 25.2% |
| Education | 0 | 0.0% |
| Literature & Languages | 0 | 0.0% |
| Liberal Arts & History | 0 | 0.0% |
| Visual & Performing Arts | 0 | 0.0% |
| Communications | 92 | 74.8% |
| Arts & Humanities | 0 | 0.0% |
| Total | 123 | 100.0% |
Transportation & Commute in Franklin Park
Vehicle Availability by Sex in Franklin Park
The most prevalent vehicle ownership categories in Franklin Park are males with 1 vehicle (123, accounting for 61.2%) and females with 1 vehicle (32, making up 66.8%).
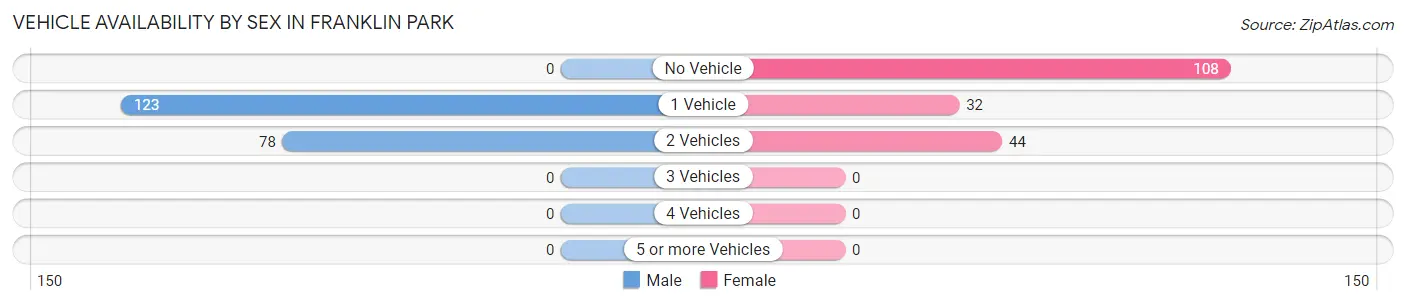
| Vehicles Available | Male | Female |
| No Vehicle | 0 (0.0%) | 108 (58.7%) |
| 1 Vehicle | 123 (61.2%) | 32 (17.4%) |
| 2 Vehicles | 78 (38.8%) | 44 (23.9%) |
| 3 Vehicles | 0 (0.0%) | 0 (0.0%) |
| 4 Vehicles | 0 (0.0%) | 0 (0.0%) |
| 5 or more Vehicles | 0 (0.0%) | 0 (0.0%) |
| Total | 201 (100.0%) | 184 (100.0%) |
Commute Time in Franklin Park
The most frequently occuring commute durations in Franklin Park are 20 to 24 minutes (126 commuters, 35.2%), 25 to 29 minutes (63 commuters, 17.6%), and 90 or more minutes (59 commuters, 16.5%).
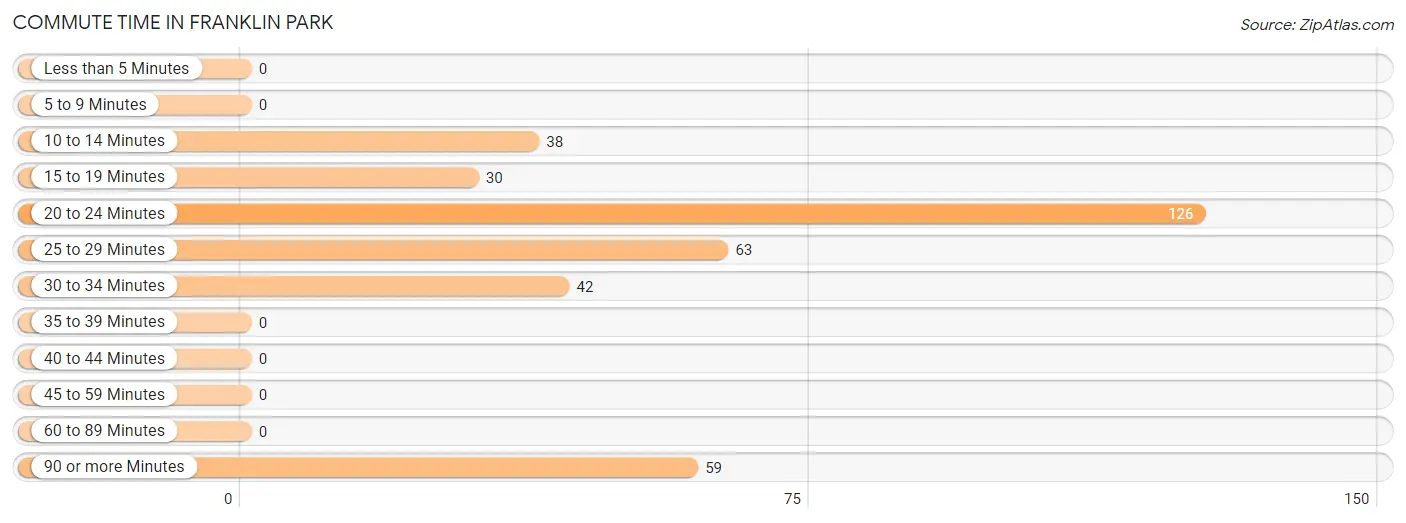
| Commute Time | # Commuters | % Commuters |
| Less than 5 Minutes | 0 | 0.0% |
| 5 to 9 Minutes | 0 | 0.0% |
| 10 to 14 Minutes | 38 | 10.6% |
| 15 to 19 Minutes | 30 | 8.4% |
| 20 to 24 Minutes | 126 | 35.2% |
| 25 to 29 Minutes | 63 | 17.6% |
| 30 to 34 Minutes | 42 | 11.7% |
| 35 to 39 Minutes | 0 | 0.0% |
| 40 to 44 Minutes | 0 | 0.0% |
| 45 to 59 Minutes | 0 | 0.0% |
| 60 to 89 Minutes | 0 | 0.0% |
| 90 or more Minutes | 59 | 16.5% |
Commute Time by Sex in Franklin Park
The most common commute times in Franklin Park are 20 to 24 minutes (77 commuters, 44.3%) for males and 25 to 29 minutes (63 commuters, 34.2%) for females.
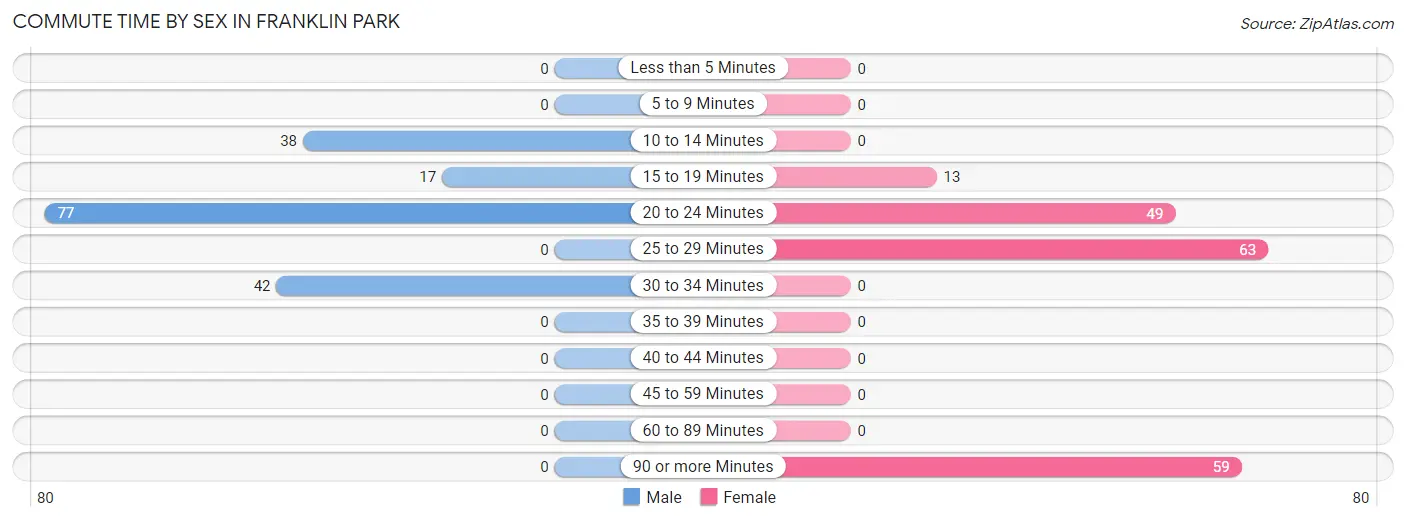
| Commute Time | Male | Female |
| Less than 5 Minutes | 0 (0.0%) | 0 (0.0%) |
| 5 to 9 Minutes | 0 (0.0%) | 0 (0.0%) |
| 10 to 14 Minutes | 38 (21.8%) | 0 (0.0%) |
| 15 to 19 Minutes | 17 (9.8%) | 13 (7.1%) |
| 20 to 24 Minutes | 77 (44.3%) | 49 (26.6%) |
| 25 to 29 Minutes | 0 (0.0%) | 63 (34.2%) |
| 30 to 34 Minutes | 42 (24.1%) | 0 (0.0%) |
| 35 to 39 Minutes | 0 (0.0%) | 0 (0.0%) |
| 40 to 44 Minutes | 0 (0.0%) | 0 (0.0%) |
| 45 to 59 Minutes | 0 (0.0%) | 0 (0.0%) |
| 60 to 89 Minutes | 0 (0.0%) | 0 (0.0%) |
| 90 or more Minutes | 0 (0.0%) | 59 (32.1%) |
Time of Departure to Work by Sex in Franklin Park
The most frequent times of departure to work in Franklin Park are 7:00 AM to 7:29 AM (77, 44.3%) for males and 5:00 AM to 5:29 AM (59, 32.1%) for females.
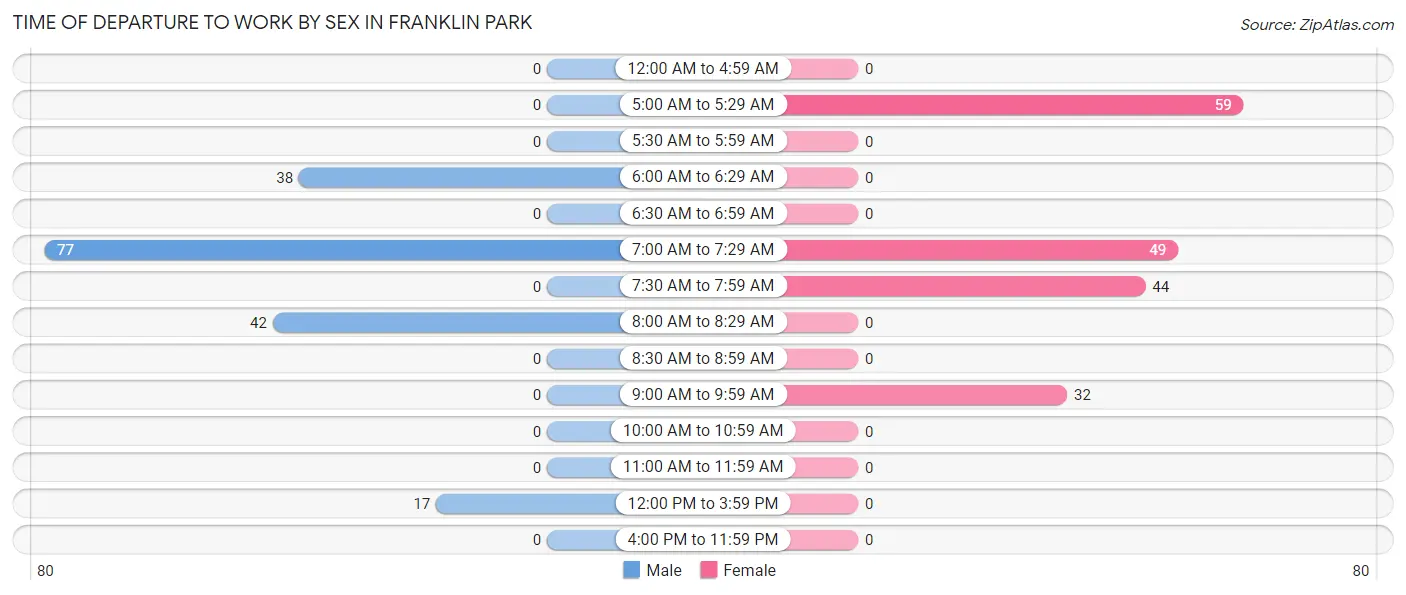
| Time of Departure | Male | Female |
| 12:00 AM to 4:59 AM | 0 (0.0%) | 0 (0.0%) |
| 5:00 AM to 5:29 AM | 0 (0.0%) | 59 (32.1%) |
| 5:30 AM to 5:59 AM | 0 (0.0%) | 0 (0.0%) |
| 6:00 AM to 6:29 AM | 38 (21.8%) | 0 (0.0%) |
| 6:30 AM to 6:59 AM | 0 (0.0%) | 0 (0.0%) |
| 7:00 AM to 7:29 AM | 77 (44.3%) | 49 (26.6%) |
| 7:30 AM to 7:59 AM | 0 (0.0%) | 44 (23.9%) |
| 8:00 AM to 8:29 AM | 42 (24.1%) | 0 (0.0%) |
| 8:30 AM to 8:59 AM | 0 (0.0%) | 0 (0.0%) |
| 9:00 AM to 9:59 AM | 0 (0.0%) | 32 (17.4%) |
| 10:00 AM to 10:59 AM | 0 (0.0%) | 0 (0.0%) |
| 11:00 AM to 11:59 AM | 0 (0.0%) | 0 (0.0%) |
| 12:00 PM to 3:59 PM | 17 (9.8%) | 0 (0.0%) |
| 4:00 PM to 11:59 PM | 0 (0.0%) | 0 (0.0%) |
| Total | 174 (100.0%) | 184 (100.0%) |
Housing Occupancy in Franklin Park
Occupancy by Ownership in Franklin Park
Of the total 530 dwellings in Franklin Park, owner-occupied units account for 6 (1.1%), while renter-occupied units make up 524 (98.9%).
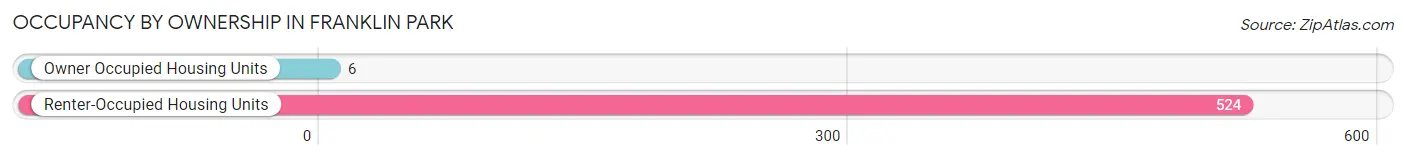
| Occupancy | # Housing Units | % Housing Units |
| Owner Occupied Housing Units | 6 | 1.1% |
| Renter-Occupied Housing Units | 524 | 98.9% |
| Total Occupied Housing Units | 530 | 100.0% |
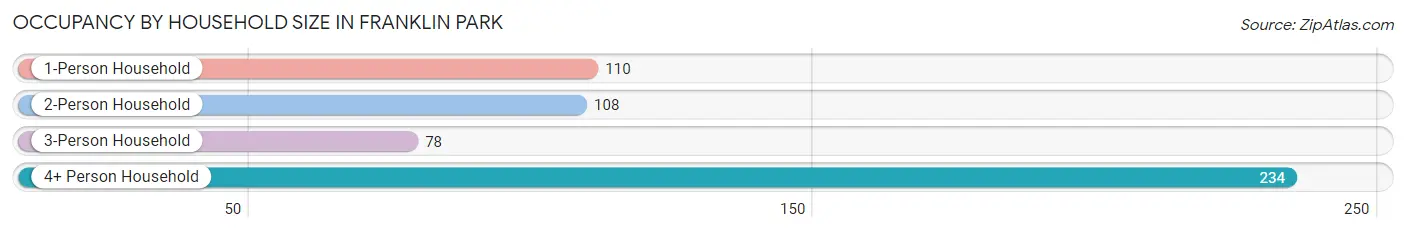
Occupancy by Household Size in Franklin Park
| Household Size | # Housing Units | % Housing Units |
| 1-Person Household | 110 | 20.7% |
| 2-Person Household | 108 | 20.4% |
| 3-Person Household | 78 | 14.7% |
| 4+ Person Household | 234 | 44.2% |
| Total Housing Units | 530 | 100.0% |
Occupancy by Ownership by Household Size in Franklin Park
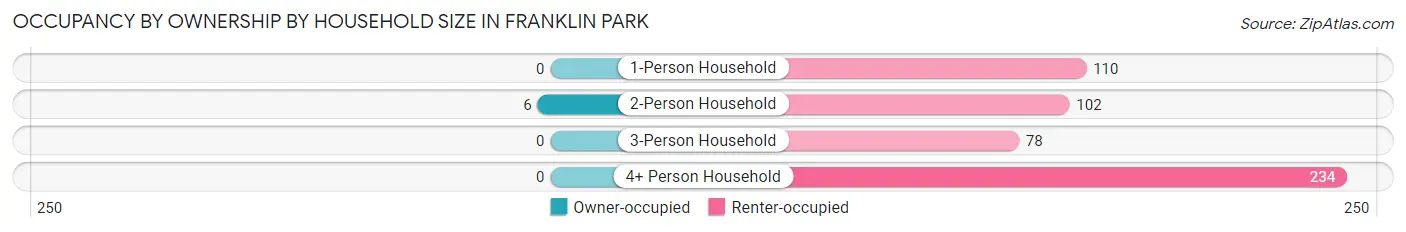
| Household Size | Owner-occupied | Renter-occupied |
| 1-Person Household | 0 (0.0%) | 110 (100.0%) |
| 2-Person Household | 6 (5.6%) | 102 (94.4%) |
| 3-Person Household | 0 (0.0%) | 78 (100.0%) |
| 4+ Person Household | 0 (0.0%) | 234 (100.0%) |
| Total Housing Units | 6 (1.1%) | 524 (98.9%) |
Occupancy by Educational Attainment in Franklin Park
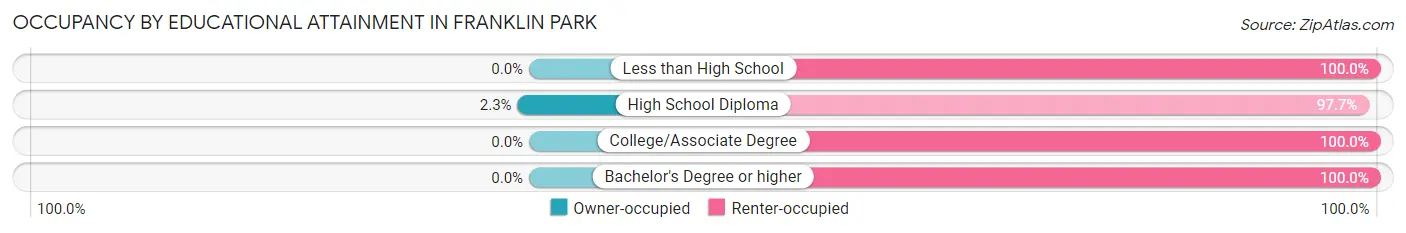
| Household Size | Owner-occupied | Renter-occupied |
| Less than High School | 0 (0.0%) | 118 (100.0%) |
| High School Diploma | 6 (2.3%) | 256 (97.7%) |
| College/Associate Degree | 0 (0.0%) | 119 (100.0%) |
| Bachelor's Degree or higher | 0 (0.0%) | 31 (100.0%) |
Occupancy by Age of Householder in Franklin Park
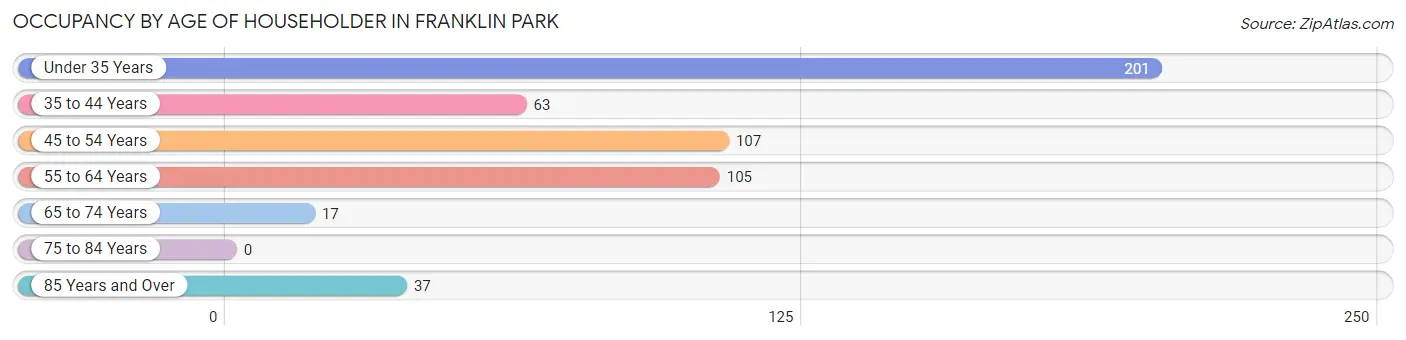
| Age Bracket | # Households | % Households |
| Under 35 Years | 201 | 37.9% |
| 35 to 44 Years | 63 | 11.9% |
| 45 to 54 Years | 107 | 20.2% |
| 55 to 64 Years | 105 | 19.8% |
| 65 to 74 Years | 17 | 3.2% |
| 75 to 84 Years | 0 | 0.0% |
| 85 Years and Over | 37 | 7.0% |
| Total | 530 | 100.0% |
Housing Finances in Franklin Park
Median Income by Occupancy in Franklin Park
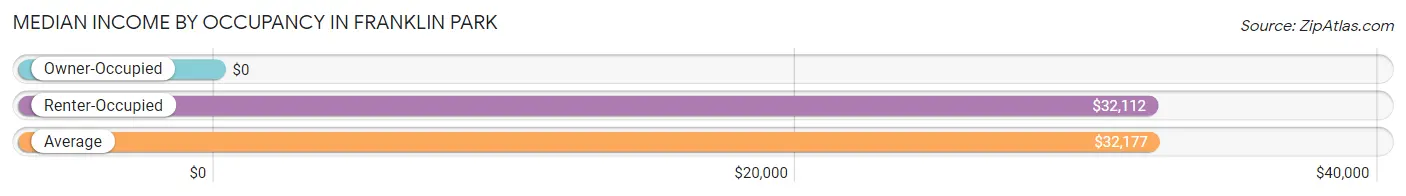
| Occupancy Type | # Households | Median Income |
| Owner-Occupied | 6 (1.1%) | $0 |
| Renter-Occupied | 524 (98.9%) | $32,112 |
| Average | 530 (100.0%) | $32,177 |
Occupancy by Householder Income Bracket in Franklin Park
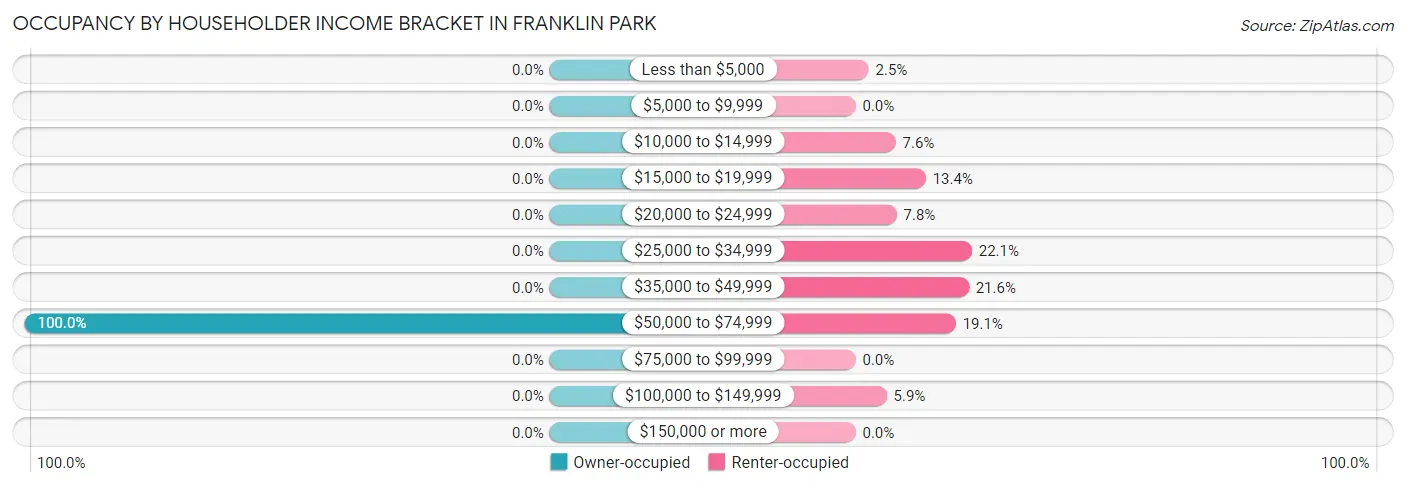
| Income Bracket | Owner-occupied | Renter-occupied |
| Less than $5,000 | 0 (0.0%) | 13 (2.5%) |
| $5,000 to $9,999 | 0 (0.0%) | 0 (0.0%) |
| $10,000 to $14,999 | 0 (0.0%) | 40 (7.6%) |
| $15,000 to $19,999 | 0 (0.0%) | 70 (13.4%) |
| $20,000 to $24,999 | 0 (0.0%) | 41 (7.8%) |
| $25,000 to $34,999 | 0 (0.0%) | 116 (22.1%) |
| $35,000 to $49,999 | 0 (0.0%) | 113 (21.6%) |
| $50,000 to $74,999 | 6 (100.0%) | 100 (19.1%) |
| $75,000 to $99,999 | 0 (0.0%) | 0 (0.0%) |
| $100,000 to $149,999 | 0 (0.0%) | 31 (5.9%) |
| $150,000 or more | 0 (0.0%) | 0 (0.0%) |
| Total | 6 (100.0%) | 524 (100.0%) |
Monthly Housing Cost Tiers in Franklin Park
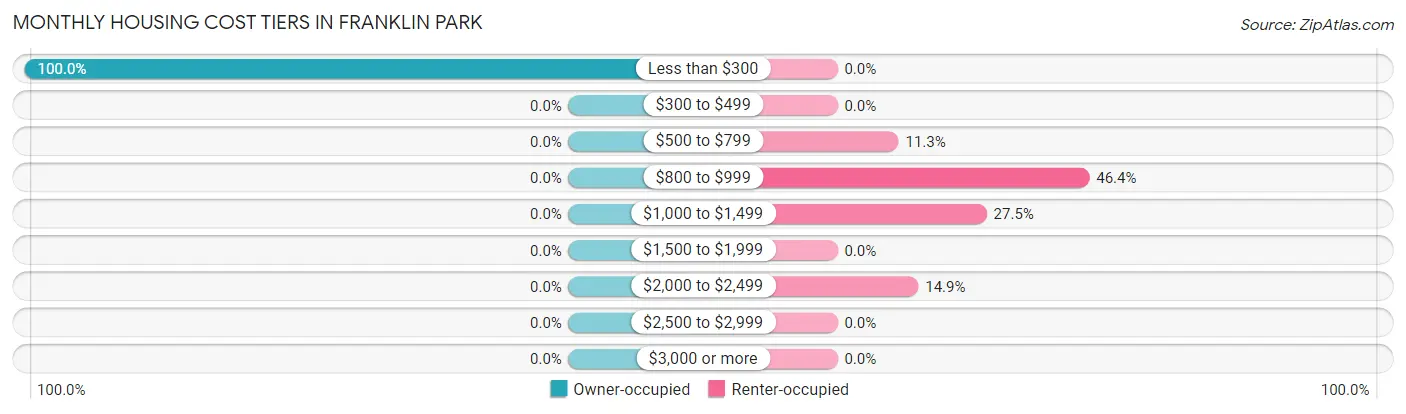
| Monthly Cost | Owner-occupied | Renter-occupied |
| Less than $300 | 6 (100.0%) | 0 (0.0%) |
| $300 to $499 | 0 (0.0%) | 0 (0.0%) |
| $500 to $799 | 0 (0.0%) | 59 (11.3%) |
| $800 to $999 | 0 (0.0%) | 243 (46.4%) |
| $1,000 to $1,499 | 0 (0.0%) | 144 (27.5%) |
| $1,500 to $1,999 | 0 (0.0%) | 0 (0.0%) |
| $2,000 to $2,499 | 0 (0.0%) | 78 (14.9%) |
| $2,500 to $2,999 | 0 (0.0%) | 0 (0.0%) |
| $3,000 or more | 0 (0.0%) | 0 (0.0%) |
| Total | 6 (100.0%) | 524 (100.0%) |
Physical Housing Characteristics in Franklin Park
Housing Structures in Franklin Park
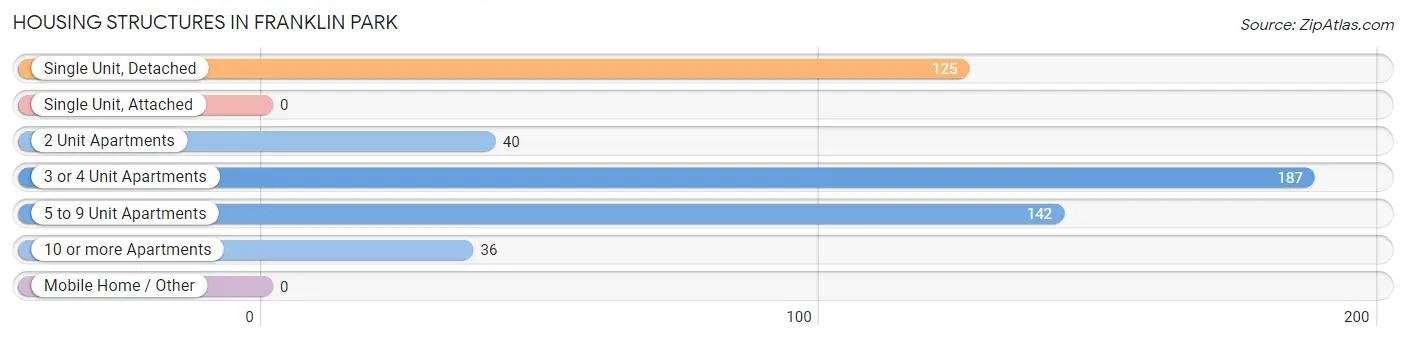
| Structure Type | # Housing Units | % Housing Units |
| Single Unit, Detached | 125 | 23.6% |
| Single Unit, Attached | 0 | 0.0% |
| 2 Unit Apartments | 40 | 7.5% |
| 3 or 4 Unit Apartments | 187 | 35.3% |
| 5 to 9 Unit Apartments | 142 | 26.8% |
| 10 or more Apartments | 36 | 6.8% |
| Mobile Home / Other | 0 | 0.0% |
| Total | 530 | 100.0% |
Housing Structures by Occupancy in Franklin Park
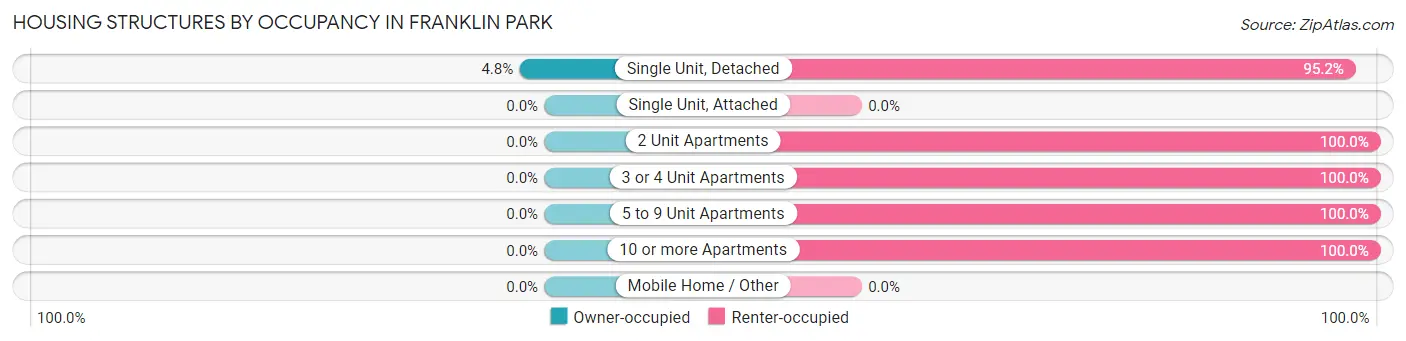
| Structure Type | Owner-occupied | Renter-occupied |
| Single Unit, Detached | 6 (4.8%) | 119 (95.2%) |
| Single Unit, Attached | 0 (0.0%) | 0 (0.0%) |
| 2 Unit Apartments | 0 (0.0%) | 40 (100.0%) |
| 3 or 4 Unit Apartments | 0 (0.0%) | 187 (100.0%) |
| 5 to 9 Unit Apartments | 0 (0.0%) | 142 (100.0%) |
| 10 or more Apartments | 0 (0.0%) | 36 (100.0%) |
| Mobile Home / Other | 0 (0.0%) | 0 (0.0%) |
| Total | 6 (1.1%) | 524 (98.9%) |
Housing Structures by Number of Rooms in Franklin Park
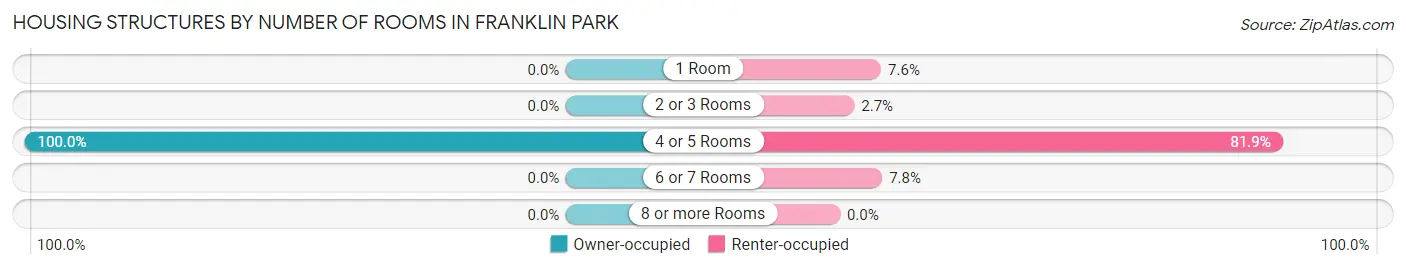
| Number of Rooms | Owner-occupied | Renter-occupied |
| 1 Room | 0 (0.0%) | 40 (7.6%) |
| 2 or 3 Rooms | 0 (0.0%) | 14 (2.7%) |
| 4 or 5 Rooms | 6 (100.0%) | 429 (81.9%) |
| 6 or 7 Rooms | 0 (0.0%) | 41 (7.8%) |
| 8 or more Rooms | 0 (0.0%) | 0 (0.0%) |
| Total | 6 (100.0%) | 524 (100.0%) |
Housing Structure by Heating Type in Franklin Park
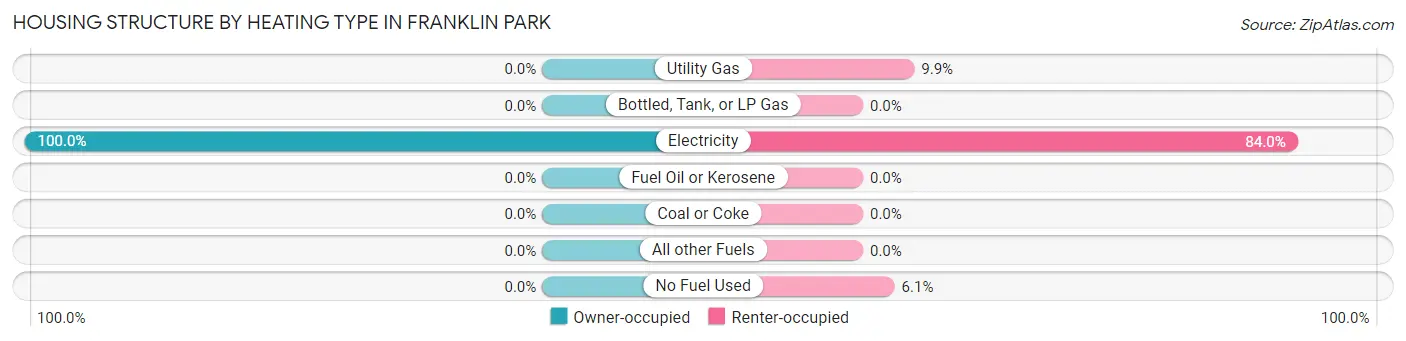
| Heating Type | Owner-occupied | Renter-occupied |
| Utility Gas | 0 (0.0%) | 52 (9.9%) |
| Bottled, Tank, or LP Gas | 0 (0.0%) | 0 (0.0%) |
| Electricity | 6 (100.0%) | 440 (84.0%) |
| Fuel Oil or Kerosene | 0 (0.0%) | 0 (0.0%) |
| Coal or Coke | 0 (0.0%) | 0 (0.0%) |
| All other Fuels | 0 (0.0%) | 0 (0.0%) |
| No Fuel Used | 0 (0.0%) | 32 (6.1%) |
| Total | 6 (100.0%) | 524 (100.0%) |
Household Vehicle Usage in Franklin Park
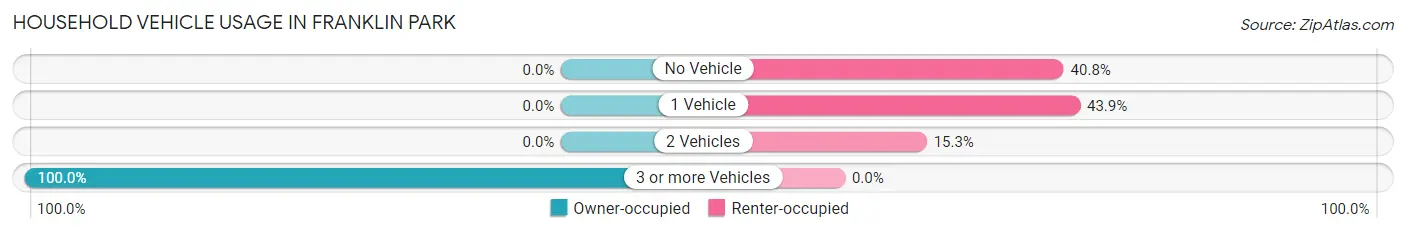
| Vehicles per Household | Owner-occupied | Renter-occupied |
| No Vehicle | 0 (0.0%) | 214 (40.8%) |
| 1 Vehicle | 0 (0.0%) | 230 (43.9%) |
| 2 Vehicles | 0 (0.0%) | 80 (15.3%) |
| 3 or more Vehicles | 6 (100.0%) | 0 (0.0%) |
| Total | 6 (100.0%) | 524 (100.0%) |
Real Estate & Mortgages in Franklin Park
Real Estate and Mortgage Overview in Franklin Park
| Characteristic | Without Mortgage | With Mortgage |
| Housing Units | 6 | 0 |
| Median Property Value | - | - |
| Median Household Income | - | - |
| Monthly Housing Costs | - | - |
| Real Estate Taxes | - | - |
Property Value by Mortgage Status in Franklin Park
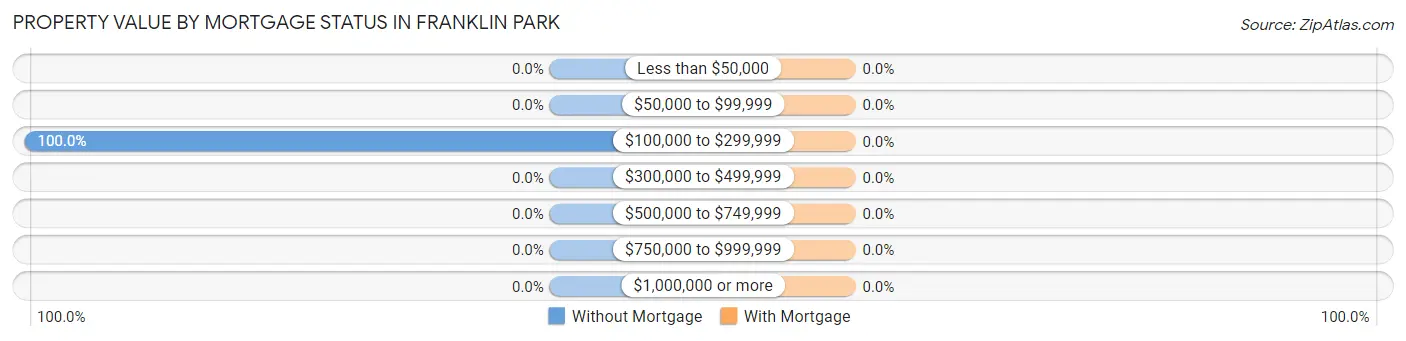
| Property Value | Without Mortgage | With Mortgage |
| Less than $50,000 | 0 (0.0%) | 0 (0.0%) |
| $50,000 to $99,999 | 0 (0.0%) | 0 (0.0%) |
| $100,000 to $299,999 | 6 (100.0%) | 0 (0.0%) |
| $300,000 to $499,999 | 0 (0.0%) | 0 (0.0%) |
| $500,000 to $749,999 | 0 (0.0%) | 0 (0.0%) |
| $750,000 to $999,999 | 0 (0.0%) | 0 (0.0%) |
| $1,000,000 or more | 0 (0.0%) | 0 (0.0%) |
| Total | 6 (100.0%) | 0 (0.0%) |
Household Income by Mortgage Status in Franklin Park
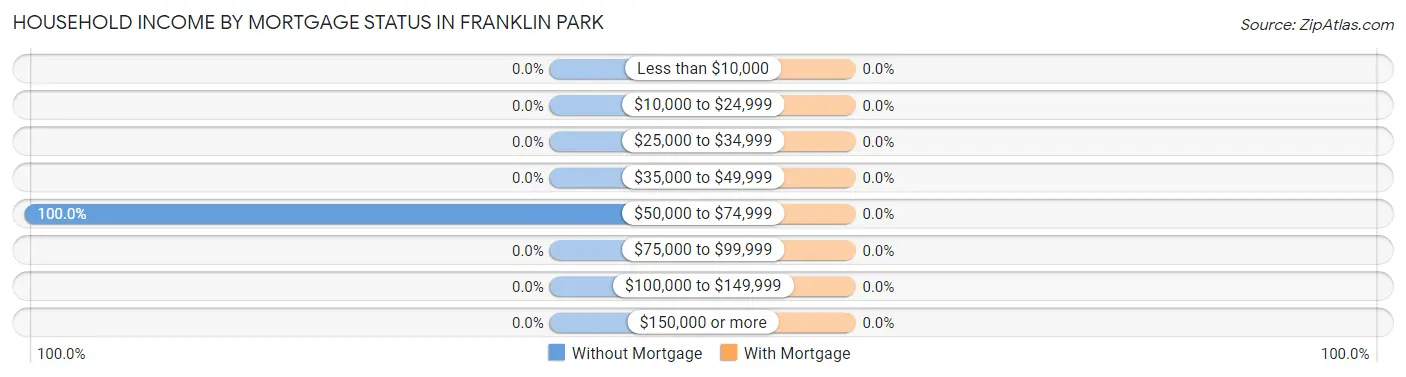
| Household Income | Without Mortgage | With Mortgage |
| Less than $10,000 | 0 (0.0%) | 0 (0.0%) |
| $10,000 to $24,999 | 0 (0.0%) | 0 (0.0%) |
| $25,000 to $34,999 | 0 (0.0%) | 0 (0.0%) |
| $35,000 to $49,999 | 0 (0.0%) | 0 (0.0%) |
| $50,000 to $74,999 | 6 (100.0%) | 0 (0.0%) |
| $75,000 to $99,999 | 0 (0.0%) | 0 (0.0%) |
| $100,000 to $149,999 | 0 (0.0%) | 0 (0.0%) |
| $150,000 or more | 0 (0.0%) | 0 (0.0%) |
| Total | 6 (100.0%) | 0 (0.0%) |
Property Value to Household Income Ratio in Franklin Park
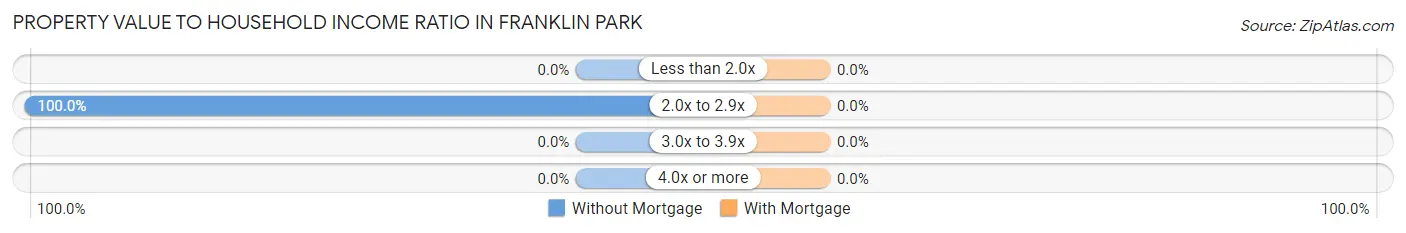
| Value-to-Income Ratio | Without Mortgage | With Mortgage |
| Less than 2.0x | 0 (0.0%) | 0 (0.0%) |
| 2.0x to 2.9x | 6 (100.0%) | 0 (0.0%) |
| 3.0x to 3.9x | 0 (0.0%) | 0 (0.0%) |
| 4.0x or more | 0 (0.0%) | 0 (0.0%) |
| Total | 6 (100.0%) | 0 (0.0%) |
Real Estate Taxes by Mortgage Status in Franklin Park
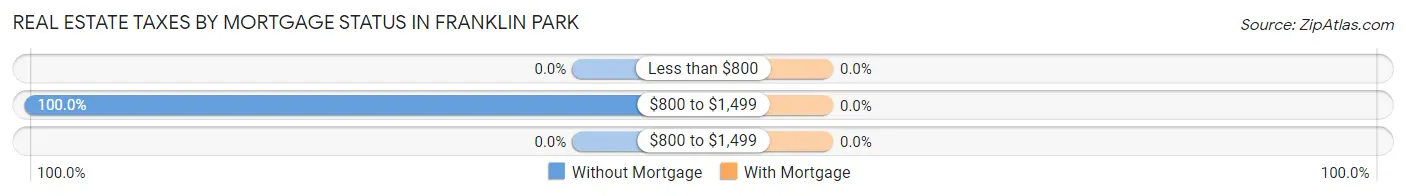
| Property Taxes | Without Mortgage | With Mortgage |
| Less than $800 | 0 (0.0%) | 0 (0.0%) |
| $800 to $1,499 | 6 (100.0%) | 0 (0.0%) |
| $800 to $1,499 | 0 (0.0%) | 0 (0.0%) |
| Total | 6 (100.0%) | 0 (0.0%) |
Health & Disability in Franklin Park
Health Insurance Coverage by Age in Franklin Park
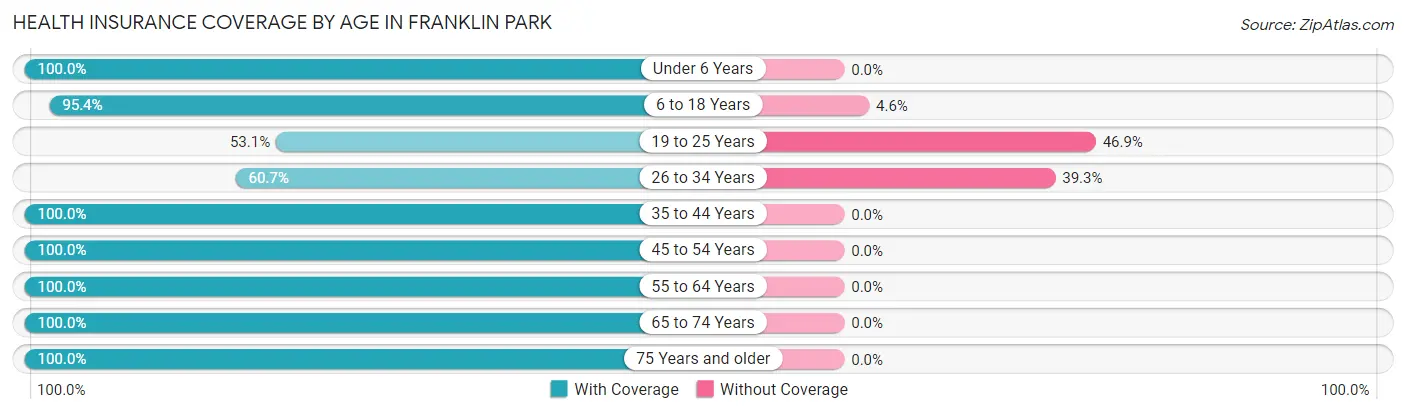
| Age Bracket | With Coverage | Without Coverage |
| Under 6 Years | 116 (100.0%) | 0 (0.0%) |
| 6 to 18 Years | 806 (95.4%) | 39 (4.6%) |
| 19 to 25 Years | 17 (53.1%) | 15 (46.9%) |
| 26 to 34 Years | 185 (60.7%) | 120 (39.3%) |
| 35 to 44 Years | 99 (100.0%) | 0 (0.0%) |
| 45 to 54 Years | 107 (100.0%) | 0 (0.0%) |
| 55 to 64 Years | 289 (100.0%) | 0 (0.0%) |
| 65 to 74 Years | 139 (100.0%) | 0 (0.0%) |
| 75 Years and older | 37 (100.0%) | 0 (0.0%) |
| Total | 1,795 (91.2%) | 174 (8.8%) |
Health Insurance Coverage by Citizenship Status in Franklin Park
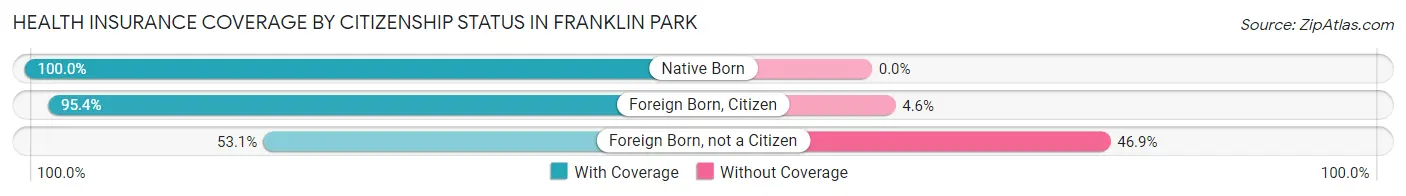
| Citizenship Status | With Coverage | Without Coverage |
| Native Born | 116 (100.0%) | 0 (0.0%) |
| Foreign Born, Citizen | 806 (95.4%) | 39 (4.6%) |
| Foreign Born, not a Citizen | 17 (53.1%) | 15 (46.9%) |
Health Insurance Coverage by Household Income in Franklin Park
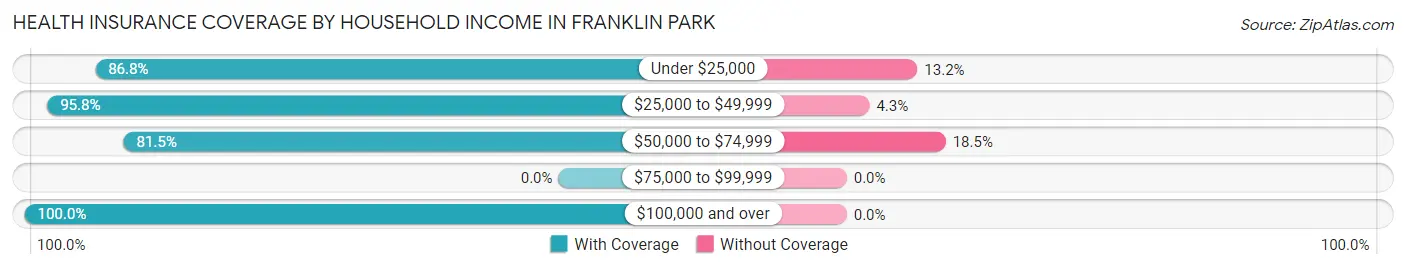
| Household Income | With Coverage | Without Coverage |
| Under $25,000 | 459 (86.8%) | 70 (13.2%) |
| $25,000 to $49,999 | 857 (95.8%) | 38 (4.3%) |
| $50,000 to $74,999 | 290 (81.5%) | 66 (18.5%) |
| $75,000 to $99,999 | 0 (0.0%) | 0 (0.0%) |
| $100,000 and over | 189 (100.0%) | 0 (0.0%) |
Public vs Private Health Insurance Coverage by Age in Franklin Park
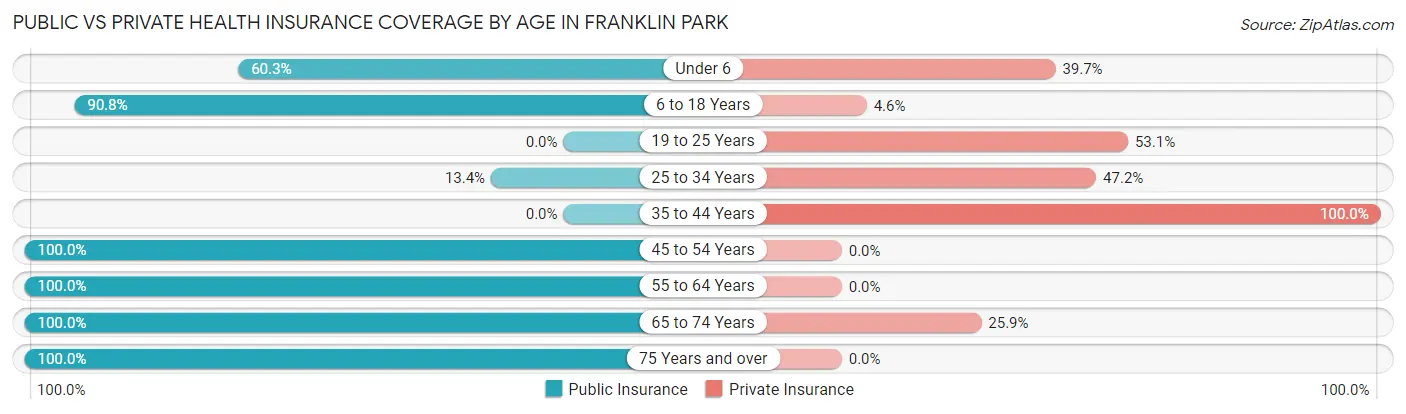
| Age Bracket | Public Insurance | Private Insurance |
| Under 6 | 70 (60.3%) | 46 (39.7%) |
| 6 to 18 Years | 767 (90.8%) | 39 (4.6%) |
| 19 to 25 Years | 0 (0.0%) | 17 (53.1%) |
| 25 to 34 Years | 41 (13.4%) | 144 (47.2%) |
| 35 to 44 Years | 0 (0.0%) | 99 (100.0%) |
| 45 to 54 Years | 107 (100.0%) | 0 (0.0%) |
| 55 to 64 Years | 289 (100.0%) | 0 (0.0%) |
| 65 to 74 Years | 139 (100.0%) | 36 (25.9%) |
| 75 Years and over | 37 (100.0%) | 0 (0.0%) |
| Total | 1,450 (73.6%) | 381 (19.4%) |
Disability Status by Sex by Age in Franklin Park
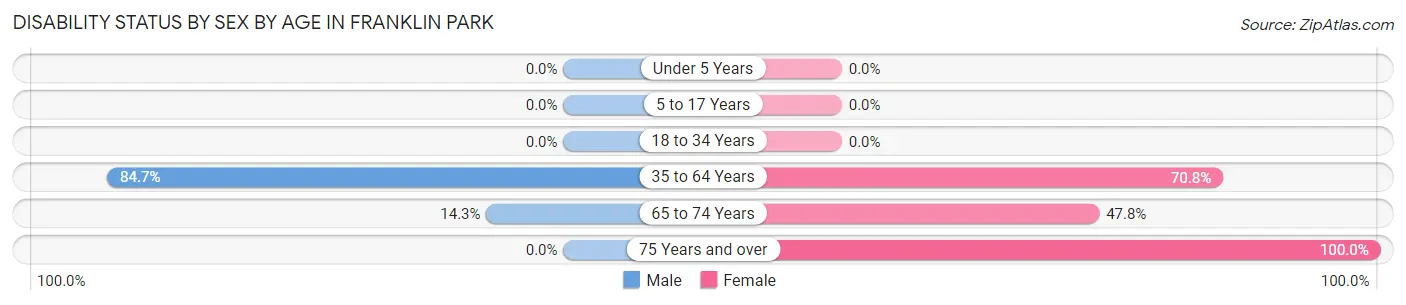
| Age Bracket | Male | Female |
| Under 5 Years | 0 (0.0%) | 0 (0.0%) |
| 5 to 17 Years | 0 (0.0%) | 0 (0.0%) |
| 18 to 34 Years | 0 (0.0%) | 0 (0.0%) |
| 35 to 64 Years | 199 (84.7%) | 184 (70.8%) |
| 65 to 74 Years | 7 (14.3%) | 43 (47.8%) |
| 75 Years and over | 0 (0.0%) | 37 (100.0%) |
Disability Class by Sex by Age in Franklin Park
Disability Class: Hearing Difficulty
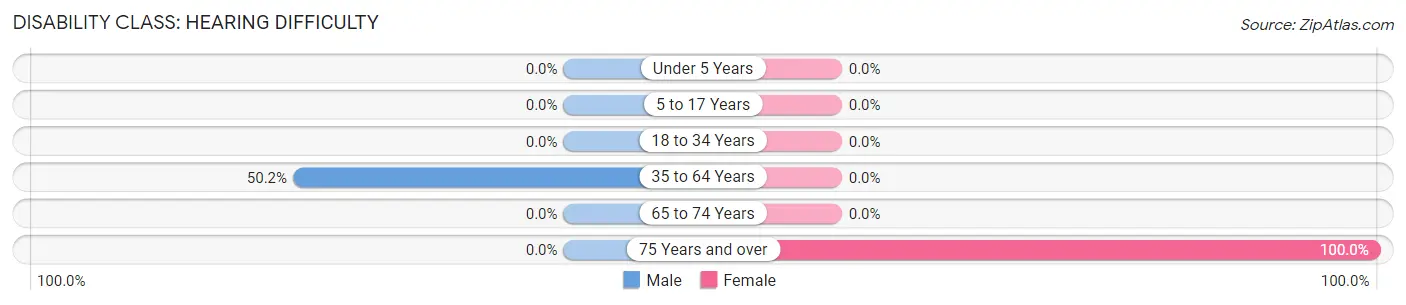
| Age Bracket | Male | Female |
| Under 5 Years | 0 (0.0%) | 0 (0.0%) |
| 5 to 17 Years | 0 (0.0%) | 0 (0.0%) |
| 18 to 34 Years | 0 (0.0%) | 0 (0.0%) |
| 35 to 64 Years | 118 (50.2%) | 0 (0.0%) |
| 65 to 74 Years | 0 (0.0%) | 0 (0.0%) |
| 75 Years and over | 0 (0.0%) | 37 (100.0%) |
Disability Class: Vision Difficulty
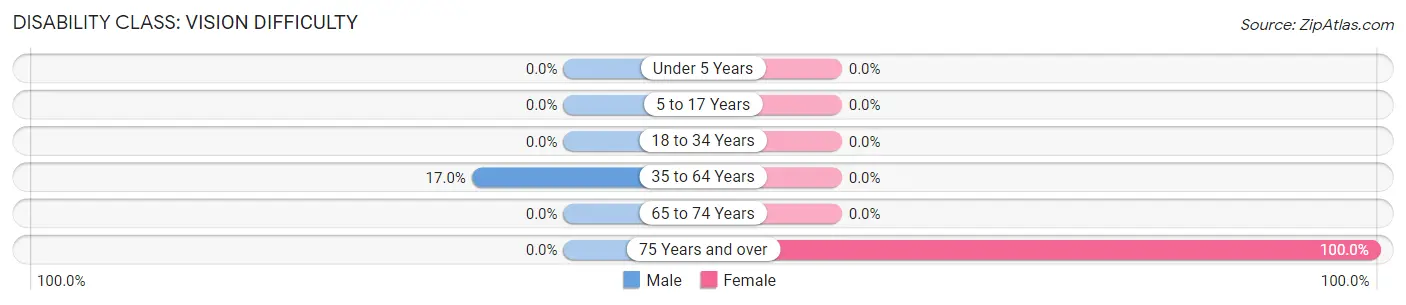
| Age Bracket | Male | Female |
| Under 5 Years | 0 (0.0%) | 0 (0.0%) |
| 5 to 17 Years | 0 (0.0%) | 0 (0.0%) |
| 18 to 34 Years | 0 (0.0%) | 0 (0.0%) |
| 35 to 64 Years | 40 (17.0%) | 0 (0.0%) |
| 65 to 74 Years | 0 (0.0%) | 0 (0.0%) |
| 75 Years and over | 0 (0.0%) | 37 (100.0%) |
Disability Class: Cognitive Difficulty
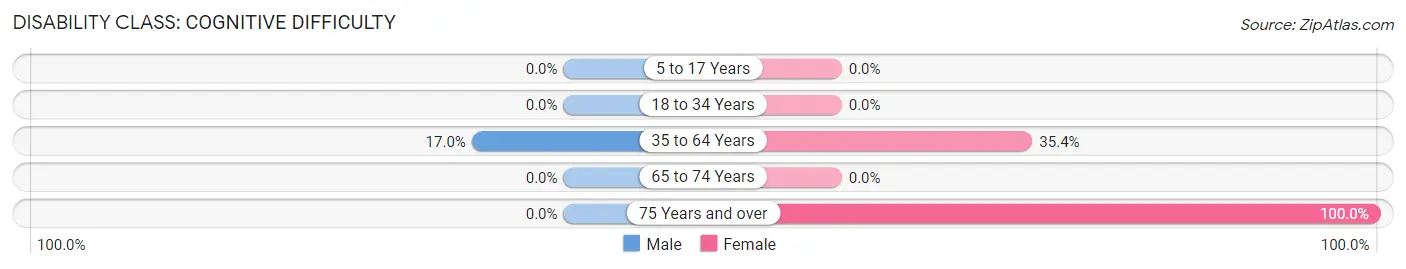
| Age Bracket | Male | Female |
| 5 to 17 Years | 0 (0.0%) | 0 (0.0%) |
| 18 to 34 Years | 0 (0.0%) | 0 (0.0%) |
| 35 to 64 Years | 40 (17.0%) | 92 (35.4%) |
| 65 to 74 Years | 0 (0.0%) | 0 (0.0%) |
| 75 Years and over | 0 (0.0%) | 37 (100.0%) |
Disability Class: Ambulatory Difficulty
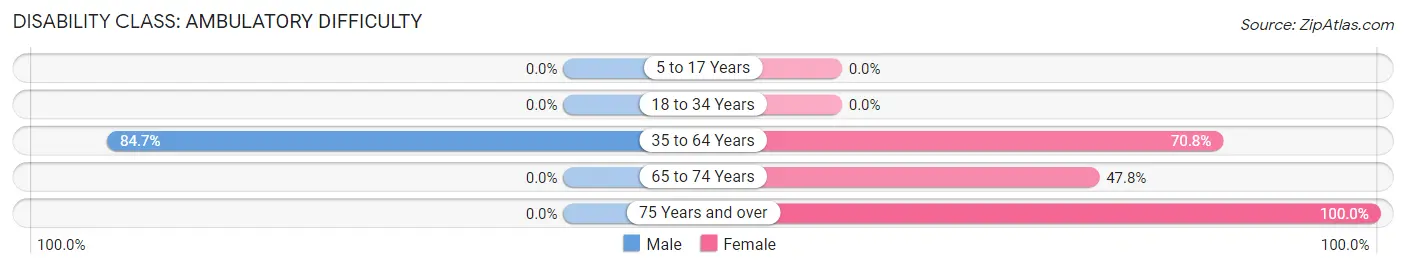
| Age Bracket | Male | Female |
| 5 to 17 Years | 0 (0.0%) | 0 (0.0%) |
| 18 to 34 Years | 0 (0.0%) | 0 (0.0%) |
| 35 to 64 Years | 199 (84.7%) | 184 (70.8%) |
| 65 to 74 Years | 0 (0.0%) | 43 (47.8%) |
| 75 Years and over | 0 (0.0%) | 37 (100.0%) |
Disability Class: Self-Care Difficulty
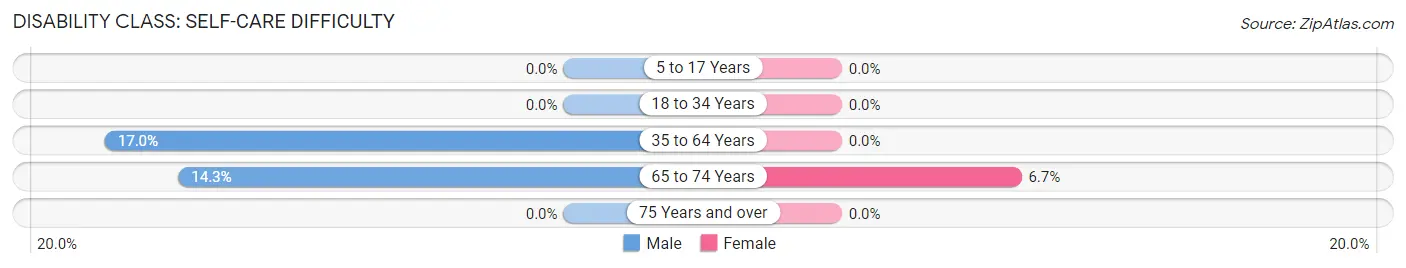
| Age Bracket | Male | Female |
| 5 to 17 Years | 0 (0.0%) | 0 (0.0%) |
| 18 to 34 Years | 0 (0.0%) | 0 (0.0%) |
| 35 to 64 Years | 40 (17.0%) | 0 (0.0%) |
| 65 to 74 Years | 7 (14.3%) | 6 (6.7%) |
| 75 Years and over | 0 (0.0%) | 0 (0.0%) |
Technology Access in Franklin Park
Computing Device Access in Franklin Park
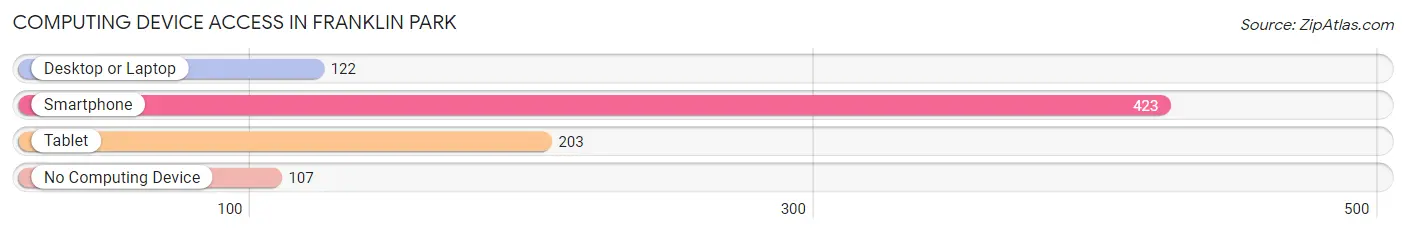
| Device Type | # Households | % Households |
| Desktop or Laptop | 122 | 23.0% |
| Smartphone | 423 | 79.8% |
| Tablet | 203 | 38.3% |
| No Computing Device | 107 | 20.2% |
| Total | 530 | 100.0% |
Internet Access in Franklin Park
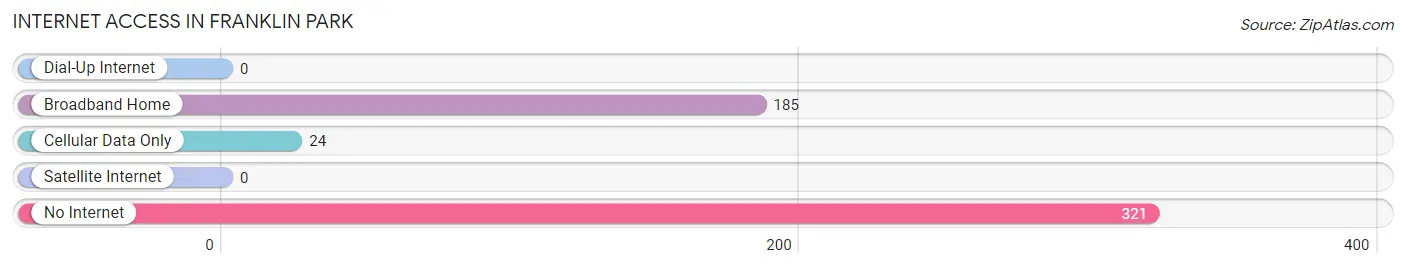
| Internet Type | # Households | % Households |
| Dial-Up Internet | 0 | 0.0% |
| Broadband Home | 185 | 34.9% |
| Cellular Data Only | 24 | 4.5% |
| Satellite Internet | 0 | 0.0% |
| No Internet | 321 | 60.6% |
| Total | 530 | 100.0% |
Franklin Park Summary
Franklin Park is a census-designated place (CDP) located in Miami-Dade County, Florida, United States. The population was 8,945 at the 2010 census. It is part of the Miami metropolitan area, which was home to an estimated 6,012,331 people in 2015.
History
Franklin Park was originally part of the Everglades, and was settled in the early 1900s by farmers and ranchers. The area was named after Benjamin Franklin, who was a major influence in the development of the area. The area was originally known as "Franklin Park Farms" and was home to a variety of crops, including tomatoes, peppers, and beans.
In the 1950s, the area began to experience rapid growth as the population of Miami-Dade County increased. The area was annexed by the City of Miami in 1959, and the population continued to grow. In the 1970s, the area was rezoned for residential development, and the population increased even more.
Geography
Franklin Park is located at 25°45'25" North, 80°17'45" West (25.756944, -80.295833). It is bordered by the City of Miami to the east, the City of Miami Gardens to the north, and the City of Hialeah to the west.
The CDP has a total area of 1 3 square miles 3 4 km2 all of it land
Economy
Franklin Park is primarily a residential area, but it does have some commercial and industrial businesses. The area is home to a variety of retail stores, restaurants, and other businesses.
The area is also home to a number of industrial businesses, including a recycling plant, a printing company, and a trucking company.
Demographics
As of the 2010 census, there were 8,945 people, 2,945 households, and 2,072 families residing in the CDP. The population density was 6,845.3 people per square mile (2,637.2/km2). There were 3,095 housing units at an average density of 2,364.3/sq mi (912.2/km2). The racial makeup of the CDP was 57.2% White (non-Hispanic), 28.2% African American, 0.3% Native American, 1.2% Asian, 0.1% Pacific Islander, 10.2% from other races, and 2.9% from two or more races. Hispanic or Latino of any race were 33.2% of the population.
There were 2,945 households, out of which 33.2% had children under the age of 18 living with them, 43.2% were married couples living together, 17.7% had a female householder with no husband present, and 30.7% were non-families. 24.2% of all households were made up of individuals, and 8.3% had someone living alone who was 65 years of age or older. The average household size was 3.02 and the average family size was 3.54.
In the CDP, the population was spread out, with 28.2% under the age of 18, 10.2% from 18 to 24, 30.2% from 25 to 44, 20.2% from 45 to 64, and 11.2% who were 65 years of age or older. The median age was 33 years. For every 100 females, there were 95.2 males. For every 100 females age 18 and over, there were 91.2 males.
The median income for a household in the CDP was $30,938, and the median income for a family was $33,906. Males had a median income of $25,938 versus $20,938 for females. The per capita income for the CDP was $13,906. About 17.2% of families and 19.2% of the population were below the poverty line, including 25.2% of those under age 18 and 16.2% of those age 65 or over.
Common Questions
What is Per Capita Income in Franklin Park?
Per Capita income in Franklin Park is $11,404.
What is the Median Family Income in Franklin Park?
Median Family Income in Franklin Park is $43,731.
What is the Median Household income in Franklin Park?
Median Household Income in Franklin Park is $32,177.
What is Income or Wage Gap in Franklin Park?
Income or Wage Gap in Franklin Park is 22.3%.
Women in Franklin Park earn 77.7 cents for every dollar earned by a man.
What is Inequality or Gini Index in Franklin Park?
Inequality or Gini Index in Franklin Park is 0.30.
What is the Total Population of Franklin Park?
Total Population of Franklin Park is 1,969.
What is the Total Male Population of Franklin Park?
Total Male Population of Franklin Park is 703.
What is the Total Female Population of Franklin Park?
Total Female Population of Franklin Park is 1,266.
What is the Ratio of Males per 100 Females in Franklin Park?
There are 55.53 Males per 100 Females in Franklin Park.
What is the Ratio of Females per 100 Males in Franklin Park?
There are 180.09 Females per 100 Males in Franklin Park.
What is the Median Population Age in Franklin Park?
Median Population Age in Franklin Park is 22.5 Years.
What is the Average Family Size in Franklin Park
Average Family Size in Franklin Park is 4.6 People.
What is the Average Household Size in Franklin Park
Average Household Size in Franklin Park is 3.7 People.
How Large is the Labor Force in Franklin Park?
There are 385 People in the Labor Forcein in Franklin Park.
What is the Percentage of People in the Labor Force in Franklin Park?
38.2% of People are in the Labor Force in Franklin Park.